Attached files
| file | filename |
|---|---|
| EX-32.2 - EXHIBIT 32.2 - Fortress Transportation & Infrastructure Investors LLC | ftai12312017exhibit322.htm |
| EX-32.1 - EXHIBIT 32.1 - Fortress Transportation & Infrastructure Investors LLC | ftai12312017exhibit321.htm |
| EX-31.2 - EXHIBIT 31.2 - Fortress Transportation & Infrastructure Investors LLC | ftai12312017exhibit312.htm |
| EX-31.1 - EXHIBIT 31.1 - Fortress Transportation & Infrastructure Investors LLC | ftai12312017exhibit311.htm |
| EX-23.2 - EXHIBIT 23.2 - Fortress Transportation & Infrastructure Investors LLC | ftai12312017exhibit232.htm |
| EX-23.1 - EXHIBIT 23.1 - Fortress Transportation & Infrastructure Investors LLC | ftai12312017exhibit231.htm |
| EX-21.1 - EXHIBIT 21.1 - Fortress Transportation & Infrastructure Investors LLC | ftai12312017exhibit211.htm |
| EX-12.1 - EXHIBIT 12.1 - Fortress Transportation & Infrastructure Investors LLC | ftai12312017exhibit121.htm |
| EX-4.3 - EXHIBIT 4.3 - Fortress Transportation & Infrastructure Investors LLC | ftai12312017exhibit43.htm |
UNITED STATES SECURITIES AND EXCHANGE COMMISSION
WASHINGTON, D.C. 20549
FORM 10-K
(Mark One) þ ANNUAL REPORT PURSUANT TO SECTION 13 OR 15(d) OF THE SECURITIES EXCHANGE ACT OF 1934 For the fiscal year ended December 31, 2017 OR |
¨ TRANSITION REPORT PURSUANT TO SECTION 13 OR 15(d) OF THE SECURITIES EXCHANGE ACT OF 1934 |
For the transition period from ____ to ____ |
Commission file number 001-37386 |
 |
FORTRESS TRANSPORTATION AND INFRASTRUCTURE INVESTORS LLC (Exact name of registrant as specified in its charter) |
Delaware | 32-0434238 | |
(State or other jurisdiction of incorporation or organization) | (I.R.S. Employer Identification No.) | |
1345 Avenue of the Americas, New York, NY | 10105 | |
(Address of principal executive offices) | (Zip Code) | |
(Registrant’s telephone number, including area code) (212) 798-6100 | ||
Securities registered pursuant to Section 12(b) of the Act:
Title of each class: | Name of exchange on which registered: | |
Class A common shares | New York Stock Exchange (NYSE) | |
Securities registered pursuant to Section 12(g) of the Act: None
Indicate by check mark if the registrant is a well-known seasoned issuer, as defined in Rule 405 of the Securities Act. Yes þ No ¨
Indicate by check mark if the registrant is not required to file reports pursuant to Section 13 or Section 15(d) of the Act. Yes ¨ No þ
Indicate by check mark whether the registrant (1) has filed all reports required to be filed by Section 13 or 15(d) of the Securities Exchange Act of 1934 during the preceding 12 months (or for such shorter period that the registrant was required to file such reports), and (2) has been subject to such filing requirements for the past 90 days. Yes þ No ¨
Indicate by check mark whether the registrant has submitted electronically and posted on its corporate Web site, if any, every Interactive Data File required to be submitted and posted pursuant to Rule 405 of Regulation S-T (§232.405 of this chapter) during the preceding 12 months (or for such shorter period that the registrant was required to submit and post such files). Yes þ No ¨
Indicate by check mark if disclosure of delinquent filers pursuant to Item 405 of Regulation S-K is not contained herein, and will not be contained, to the best of the registrant's knowledge, in definitive proxy or information statements incorporated by reference in Part III of this Form 10-K or any amendment to this Form 10-K. ¨
Indicate by check mark whether the registrant is a large accelerated filer, an accelerated filer, a non-accelerated filer, a smaller reporting company, or an emerging growth company. See the definitions of “large accelerated filer,” “accelerated filer,” “smaller reporting company,” and “emerging growth company” in Rule 12b-2 of the Exchange Act. (Check one):
Large accelerated filer þ | Accelerated filer ¨ |
Non-accelerated filer ¨ | Smaller reporting company ¨ |
Emerging Growth Company ¨ | |
If an emerging growth company, indicate by check mark if the registrant has elected not to use the extended transition period for complying with any new or revised financial accounting standards provided pursuant to Section 13(a) of the Exchange Act. ¨
Indicate by check mark whether the registrant is a shell company (as defined in Rule 12b-2 of the Exchange Act). Yes ¨ No þ
The aggregate market value of the voting and non-voting common equity of Fortress Transportation and Infrastructure Investors LLC held by non-affiliates as of the close of business as of June 30, 2017 was $1.2 billion.
There were 82,779,232 common shares representing limited liability company interests outstanding at March 1, 2018.
DOCUMENTS INCORPORATED BY REFERENCE
Portions of the registrant's definitive proxy statement for the registrant's 2018 annual meeting, to be filed within 120 days after the close of the registrant's fiscal year, are incorporated by reference into Part III of this Annual Report on Form 10-K.
FORTRESS TRANSPORTATION AND INFRASTRUCTURE INVESTORS LLC
INDEX TO FORM 10-K
PART I | ||
Item 1. | ||
Item 1A. | ||
Item 1B. | ||
Item 2. | ||
Item 3. | ||
Item 4. | ||
PART II | ||
Item 5. | ||
Item 6. | ||
Item 7. | ||
Item 7A. | ||
Item 8. | ||
Item 9. | ||
Item 9A. | ||
Item 9B. | ||
PART III | ||
Item 10. | ||
Item 11. | ||
Item 12. | ||
Item 13. | ||
Item 14. | ||
PART IV | ||
Item 15. | ||
Item 16. | ||
2
FORWARD-LOOKING STATEMENTS
This report contains “forward-looking statements” within the meaning of the Private Securities Litigation Reform Act of 1995. Forward-looking statements are not statements of historical fact but instead are based on our present beliefs and assumptions and on information currently available to the Company. You can identify these forward-looking statements by the use of forward-looking words such as “outlook,” “believes,” “expects,” “potential,” “continues,” “may,” “will,” “should,” “could,” “seeks,” “approximately,” “predicts,” “intends,” “plans,” “estimates,” “anticipates,” “target,” “projects,” “contemplates” or the negative version of those words or other comparable words. Any forward-looking statements contained in this report are based upon our historical performance and on our current plans, estimates and expectations in light of information currently available to us. The inclusion of this forward-looking information should not be regarded as a representation by us, that the future plans, estimates or expectations contemplated by us will be achieved. Such forward-looking statements are subject to various risks and uncertainties and assumptions relating to our operations, financial results, financial condition, business, prospects, growth strategy and liquidity. Accordingly, there are or will be important factors that could cause our actual results to differ materially from those indicated in these statements. We believe that these factors include, but are not limited to:
• | changes in economic conditions generally and specifically in our industry sectors, and other risks relating to the global economy; |
• | reductions in cash flows received from our assets, as well as contractual limitations on the use of our aviation assets to secure debt for borrowed money; |
• | our ability to take advantage of acquisition opportunities at favorable prices; |
• | a lack of liquidity surrounding our assets, which could impede our ability to vary our portfolio in an appropriate manner; |
• | the relative spreads between the yield on the assets we acquire and the cost of financing; |
• | adverse changes in the financing markets we access affecting our ability to finance our acquisitions; |
• | customer defaults on their obligations; |
• | our ability to renew existing contracts and win additional contracts with existing or potential customers; |
• | the availability and cost of capital for future acquisitions; |
• | concentration of a particular type of asset or in a particular sector; |
• | competition within the aviation, energy, intermodal transport and rail sectors; |
• | the competitive market for acquisition opportunities; |
• | risks related to operating through joint ventures or partnerships or through consortium arrangements; |
• | obsolescence of our assets or our ability to sell, re-lease or re-charter our assets; |
• | exposure to uninsurable losses and force majeure events; |
• | infrastructure operations may require substantial capital expenditures; |
• | the legislative/regulatory environment and exposure to increased economic regulation; |
• | exposure to the oil and gas industry’s volatile oil and gas prices; |
• | difficulties in obtaining effective legal redress in jurisdictions in which we operate with less developed legal systems; |
• | our ability to maintain our exemption from registration under the Investment Company Act of 1940 and the fact that maintaining such exemption imposes limits on our operations; |
• | our ability to successfully utilize leverage in connection with our investments; |
• | foreign currency risk and risk management activities; |
• | effectiveness of our internal control over financial reporting; |
• | exposure to environmental risks, including increasing environmental legislation and the broader impacts of climate change; |
• | changes in interest rates and/or credit spreads, as well as the success of any hedging strategy we may undertake in relation to such changes; |
• | actions taken by national, state, or provincial governments, including nationalization, or the imposition of new taxes, could materially impact the financial performance or value of our assets; |
• | our dependence on our Manager and its professionals and actual, potential or perceived conflicts of interest in our relationship with our Manager; |
3
• | effects of the recently completed merger of Fortress Investment Group LLC with affiliates of SoftBank Group Corp.; |
• | volatility in the market price of our common shares; |
• | the inability to pay dividends to our shareholders in the future; and |
• | other risks described in the “Risk Factors” section of this report. |
These factors should not be construed as exhaustive and should be read in conjunction with the other cautionary statements that are included in this report. The forward-looking statements made in this report relate only to events as of the date on which the statements are made. We do not undertake any obligation to publicly update or review any forward-looking statement except as required by law, whether as a result of new information, future developments or otherwise.
If one or more of these or other risks or uncertainties materialize, or if our underlying assumptions prove to be incorrect, our actual results may vary materially from what we may have expressed or implied by these forward-looking statements. We caution that you should not place undue reliance on any of our forward-looking statements. Furthermore, new risks and uncertainties arise from time to time, and it is impossible for us to predict those events or how they may affect us.
PART I
Item 1. Business
Our Company
Fortress Transportation and Infrastructure Investors LLC, a Delaware limited liability company (the “Company”), was formed on February 19, 2014. Except as otherwise specified, “FTAI”, “we”, “us”, “our”, and “the Company” refer to the Company and its consolidated subsidiaries, including Fortress Worldwide Transportation and Infrastructure General Partnership (“Holdco”). Our business has been, and will continue to be, conducted through Holdco for the purpose of acquiring, managing and disposing of transportation and transportation-related infrastructure and equipment assets. Fortress Worldwide Transportation and Infrastructure Master GP LLC (the “Master GP”), owns 0.05% of Holdco and is the general partner of Holdco, which was formed on May 9, 2011 and commenced operations on June 23, 2011.
Pursuant to a management agreement, we are externally managed and advised by FIG LLC (the “Manager”), an affiliate of Fortress Investment Group LLC (“Fortress”). Fortress is a leading global investment management firm with approximately $70 billion of assets under management as of December 31, 2017, which has a dedicated team of experienced professionals focused on the acquisition of transportation and infrastructure assets since 2002. On December 27, 2017, SoftBank Group Corp. (“SoftBank”) announced that it completed its previously announced acquisition of Fortress (the “SoftBank Merger”). In connection with the Merger, Fortress will operate within SoftBank as an independent business headquartered in New York. Fortress’s senior investment professionals will remain in place, including those individuals who perform services for us.
We own and acquire high quality infrastructure and equipment that is essential for the transportation of goods and people globally. We currently invest across four market sectors: aviation, energy, intermodal transport and rail. We target assets that, on a combined basis, generate strong and stable cash flows with the potential for earnings growth and asset appreciation. Our existing mix of assets provides significant cash flows as well as organic growth potential through identified projects. In addition, we believe that there are a large number of acquisition opportunities in our target sectors and that our Manager’s expertise and business and financing relationships, together with our access to capital, will allow us to take advantage of these opportunities. As of December 31, 2017, we had total consolidated assets of $2.0 billion and total equity of $1.0 billion.
Our operations consist of two primary strategic business units - Infrastructure and Equipment Leasing. Our Infrastructure Business acquires long-lived assets that provide mission-critical services or functions to transportation networks and typically have high barriers to entry. The Company targets or develops operating businesses with strong margins, stable cash flows and upside from earnings growth and asset appreciation driven by increased use and inflation. Our Equipment Leasing Business acquires assets that are designed to carry cargo or people or provide functionality to transportation infrastructure. Transportation equipment assets are typically long-lived, moveable and leased by us on either operating leases or finance leases to companies that provide transportation services. Our leases generally provide for long-term contractual cash flow with high cash-on-cash yields and include structural protections to mitigate credit risk.
4
The charts below illustrate our existing assets, and our equity deployed in acquiring these assets separated by reporting segment as of December 31, 2017:
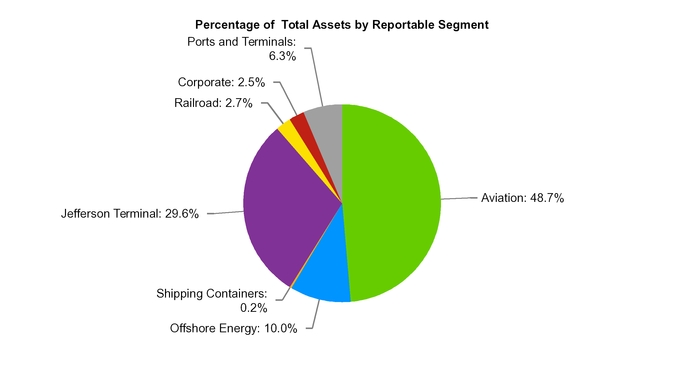
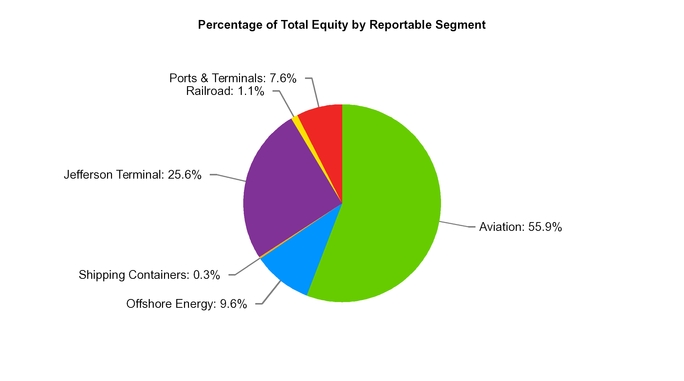
Note:
• | Jefferson Terminal, Railroad and Ports and Terminals are included in our Infrastructure Business; Aviation Leasing, Offshore Energy and Shipping Containers are included in our Equipment Leasing Business. |
5
Our Strategy
We invest across a number of major sectors within the transportation industry, including aviation, energy, intermodal transport and rail, and we may pursue acquisitions in other areas as and when they arise in the future. In general, we seek to own a diverse mix of high quality infrastructure and equipment within our target sectors that generate predictable cash flows, in markets that we believe provide the potential for strong long-term growth and attractive returns on deployed capital. We believe that by investing in a diverse mix of assets across sectors, we can select from among the best risk-adjusted investment opportunities, while avoiding overconcentration in any one segment, further adding to the stability of our business.
We take a proactive investment approach by identifying key secular trends as they emerge within our target sectors and then pursuing what we believe are the most compelling opportunities within those sectors. We look for unique investments, including assets that are distressed or undervalued, or where we believe that we can add value through active management. We consider investments across the size spectrum, including smaller opportunities often overlooked by other investors, particularly where we believe we may be able to grow the investment over time. We believe one of our strengths is our ability to create attractive follow-on investment opportunities and deploy incremental capital within our existing portfolio.
Within each sector, we consider investments in operating infrastructure as well as in equipment that we lease to operators. Within the rail sector, for example, we target rail lines and rail terminals (which we classify as infrastructure), as well as railcars (which on a stand-alone basis we classify as leasing equipment). We believe that as owners of both infrastructure and equipment assets, we have access to more opportunities and can be a more attractive counterparty to the users of our assets. Our Manager has significant prior experience in all of our target sectors, as well as a network of industry relationships, that we believe positions us well to make successful acquisitions and to actively manage and improve operations and cash flow of our existing and newly-acquired assets. These relationships include senior executives at lessors and operators, end users of transportation and infrastructure assets, as well as banks, lenders and other asset owners.
Asset Acquisition Process
Our strategy is to acquire assets that are essential to the transportation of goods and people globally. We acquire assets that are used by major operators of transportation and infrastructure networks. We seek to acquire assets and businesses that we believe operate in sectors with long-term macroeconomic growth opportunities and that have significant cash flow and upside potential from earnings growth and asset appreciation.
We approach markets and opportunities by first developing an asset acquisition strategy with our Manager and then pursuing optimal opportunities within that strategy. In addition to relying on our own experience, we source new opportunities through our Manager’s network of industry relationships in order to find, structure and execute attractive acquisitions. These relationships include senior executives at industry leading operators, end users of the assets as well as banks, lenders and other asset owners. We believe that sourcing assets both globally and through multiple channels will enable us to find the most attractive opportunities. We are selective in the assets we pursue and efficient in the manner in which we pursue them.
Once attractive opportunities are identified, our Manager performs detailed due diligence on each of our potential acquisitions. Due diligence on each of our assets always includes a comprehensive review of the asset itself as well as the industry and market dynamics, competitive positioning, and financial and operational performance. Where appropriate, our Manager conducts physical inspections, a review of the credit quality of each of our counterparties, the regulatory environment, and a review of all material documentation. In some cases, third-party specialists are hired to physically inspect and/or value the target assets.
We and our Manager also spend a significant amount of time on structuring our acquisitions to minimize risks while also optimizing expected returns. We employ what we believe to be reasonable amounts of leverage in connection with our acquisitions. In determining the amount of leverage for each acquisition, we consider a number of characteristics, including, but not limited to, the existing cash flow, the length of the lease or contract term, and the specific counterparty. While leverage on any individual asset may vary, we target overall leverage for our assets on a consolidated basis of no greater than 50% of total capital.
Management Agreement
In May 2015, in connection with the Company’s initial public offering (“IPO”), the Company entered into a new management agreement with the Manager (the “Management Agreement”), an affiliate of Fortress, pursuant to which the Manager is paid annual fees in exchange for advising the Company on various aspects of its business, formulating its investment strategies, arranging for the acquisition and disposition of assets, arranging for financing, monitoring performance, and managing its day-to-day operations, inclusive of all costs incidental thereto.
Under the Management Agreement, the Manager is entitled to a management fee, incentive allocations (comprised of income incentive allocation and capital gains incentive allocation, defined below) and reimbursement of certain expenses. The management fee is determined by taking the average value of total equity (excluding non-controlling interests) determined on a consolidated basis in accordance with GAAP at the end of the two most recently completed months multiplied by an annual rate of 1.50%, and is payable monthly in arrears in cash.
The income incentive allocation is calculated and distributable quarterly in arrears based on the pre-incentive allocation net income for the immediately preceding calendar quarter (the “Income Incentive Allocation”). For this purpose, pre-incentive allocation net income means, with respect to a calendar quarter, net income attributable to shareholders during such quarter calculated in accordance with GAAP excluding the Company’s pro rata share of (1) realized or unrealized gains and losses, and (2) certain non-cash or one-time items, and (3) any other adjustments as may be approved by the Company’s independent directors. Pre-incentive
6
allocation net income does not include any Income Incentive Allocation or Capital Gains Incentive Allocation (described below) paid to the Master GP during the relevant quarter.
A subsidiary of the Company allocates and distributes to the Master GP an Income Incentive Allocation with respect to its pre-incentive allocation net income in each calendar quarter as follows: (1) no Income Incentive Allocation in any calendar quarter in which pre-incentive allocation net income, expressed as a rate of return on the average value of the Company’s net equity capital (excluding non-controlling interests) at the end of the two most recently completed calendar quarters, does not exceed 2.0% for such quarter (8.0% annualized); (2) 100% of pre-incentive allocation net income with respect to that portion of such pre-incentive allocation net income, if any, that is equal to or exceeds 2.00% but does not exceed 2.2223% for such quarter; and (3) 10.0% of the amount of pre-incentive allocation net income, if any, that exceeds 2.2223% for such quarter.
"Capital Gains Incentive Allocation" is calculated and distributable in arrears as of the end of each calendar year and is equal to 10% of the Company’s pro rata share of cumulative realized gains from the date of the Company's initial public offering through the end of the applicable calendar year, net of the Company’s pro rata share of cumulative realized or unrealized losses, the cumulative non-cash portion of equity-based compensation expenses and all realized gains upon which prior performance-based Capital Gains Incentive Allocation payments were made to the Master GP.
The Company pays all of its operating expenses, except those specifically required to be borne by the Manager under the Management Agreement. The Company will pay or reimburse the Manager and its affiliates for performing certain legal, accounting, due diligence tasks and other services that outside professionals or outside consultants otherwise would perform, provided that such costs and reimbursements are no greater than those which would be paid to outside professionals or consultants. The Manager is responsible for all of its other costs incident to the performance of its duties under the Management Agreement, including compensation of the Manager’s employees, rent for facilities and other “overhead” expenses; the Company will not reimburse the Manager for these expenses.
If the Company terminates the Management Agreement, it will generally be required to pay the Manager a termination fee, as defined by the Management Agreement. Upon the successful completion of an offering of the Company’s common shares or other equity securities (including securities issued as consideration in an acquisition), the Company will grant the Manager options to purchase common shares, as defined by the Management Agreement.
Please refer to Note 13 of our consolidated financial statements included in Item 8 in this Annual Report on Form 10-K for further details regarding our Management Agreement.
7
Our Portfolio
We own and acquire high quality infrastructure and equipment that is essential for the transportation of goods and people globally. We currently invest across four market sectors: aviation, energy, intermodal transport and rail. We target assets that, on a combined basis, generate strong and stable cash flows with the potential for earnings growth and asset appreciation.
Leasing Equipment
Aviation
In our Aviation Leasing segment, we own and manage 158 aviation assets, including 48 aircraft and 110 commercial jet engines.
As of December 31, 2017, 46 of our commercial aircraft and 76 of our jet engines were leased to operators or other third parties. Aviation assets currently off lease are either undergoing repair and/or maintenance, being prepared to go on lease or held in short term storage awaiting a future lease. Our aviation equipment was approximately 86% utilized as of December 31, 2017, based on the equity value of our on-hire leasing equipment as a percentage of the total equity value of our aviation leasing equipment. Our aircraft currently have a weighted average remaining lease term of 32 months, and our jet engines currently on-lease have an average remaining lease term of 11 months. The table below provides additional information on the assets in our Aviation Leasing segment:
Aviation Assets | Widebody | Narrowbody | Total | |||||
Aircraft | ||||||||
Assets at January 1, 2017 | 7 | 19 | 26 | |||||
Purchases | 3 | 22 | 25 | |||||
Sales | (1 | ) | (2 | ) | (3 | ) | ||
Assets at December 31, 2017 | 9 | 39 | 48 | |||||
Engines | ||||||||
Assets at January 1, 2017 | 38 | 28 | 66 | |||||
Purchases | 28 | 30 | 58 | |||||
Sales | (9 | ) | (5 | ) | (14 | ) | ||
Assets at December 31, 2017 | 57 | 53 | 110 | |||||
Offshore Energy
We own one Anchor Handling Towing Supply ("AHTS") vessel, one construction support vessel, and one Remote Operated Vehicle ("ROV") support vessel. We seek to lease our assets in our Offshore Energy segment on medium to long-term charters. Depending upon the charter, the charterer may assume the operating expense and utilization risk. The AHTS vessel is a 2010-built DP-1, 5,150 bhp vessel used in the offshore oil and gas industry. The AHTS vessel was built by Guangzhou Panyu Lingshan Shipyard Ltd. in China and is designed to provide support services to offshore platforms, rigs and larger construction vessels. The AHTS vessel has accommodation for 30 personnel and is equipped with an advanced firefighting system and rescue boat to provide standby / emergency rescue services and a winch with total bollard pull of 68.5 tons. The AHTS vessel is subject to a 10-year direct finance lease with a local Mexican operator. We own 100% of the AHTS vessel and our finance lease will expire in November 2023. The AHTS vessel is currently unlevered.
The construction support vessel is a 2014-built subsea construction support vessel for the SURF (subsea, umbilicals, risers, and flowlines), IMR, and pipelay markets. The construction support vessel was built at Davie Shipyard in Quebec, Canada and is designed to provide a range of services including flexible and small-diameter rigid pipelay, cable lay, saturation diving, ROV support, well intervention, top hole drilling and subsea installation. Our construction support vessel has advanced dynamic positioning (DP-3) systems, a 250-ton subsea crane, a moon pool, 2,000 square meters of open deck space and 100-person accommodation. The construction support vessel is approximately 40% levered as of December 31, 2017.
Our ROV support vessel is a 2011-built DP-2, 6,000 bhp ROV support vessel that is used in the offshore oil and gas industry. The ROV support vessel was built by Jaya Holdings at their yard in Batam, Indonesia and is designed to provide construction support services including ROV support, dive support, accommodation and subsea and platform lifts. The ROV support vessel has accommodation for 120 personnel, a moon pool, a 50-ton crane, and can carry up to three ROVs. The ROV support vessel was on hire with a long-term lease arrangement during 2017. We own 100% of the vessel. The ROV support vessel is currently unlevered.
8
The chart below describes the assets in our Offshore Energy segment as of December 31, 2017:
Offshore Energy Assets | |||
Asset Type | Year Built | Description | Economic Interest (%) |
AHTS Vessel | 2010 | Anchor handling tug supply vessel with accommodation for 30 personnel and a total bollard pull of 68.5 tons | 100% |
Construction Support Vessel | 2014 | DP-3 construction support and well intervention vessel with 250-ton main crane, 2,000 square meter open deck space, moon pool and accommodation for 100 personnel | 100% |
ROV Support Vessel | 2011 | DP-2 dive and ROV support vessel with 50-ton crane, moon pool and accommodation for 120 personnel | 100%(1) |
_____________________________________________________
(1) The economic interest increased in the third quarter of 2017 for the ROV support vessel reflecting the transfer of the non-controlling interest to the Company as part of the settlement arrangement as more fully discussed in the Notes to the consolidated financial statements.
Intermodal Transport
We own, through a joint venture, a 51% interest in a portfolio of approximately 34,000 maritime shipping containers, including both dry and refrigerated units. The containers in this portfolio are subject to operating leases with a large Asian shipping line and finance leases with four other container shipping lines. As of December 31, 2017, approximately 29,000 containers were on lease with the remaining average lease term of approximately one year.
The chart below describes the assets in our Shipping Containers segment as of December 31, 2017:
Shipping Containers Assets | |||||
Number of Containers | Type | Average Age | Lease Type | Customer Mix | Economic Interest (%) |
34,000 | 20’ Dry 20’ Reefer 40’ Dry 40’ HC Dry 40’ HC Reefer | ~10 Years | Direct Finance Lease/Operating Lease | 5 Customers | 51% |
Infrastructure
Jefferson Terminal
In August 2014, we and certain other Fortress affiliates purchased substantially all of the assets and assumed certain liabilities of Jefferson Terminal, a Texas-based group of companies developing crude oil and refined products logistics assets. As of December 31, 2017, our equity interest in Jefferson is approximately 60%, and other affiliates of Fortress own an additional approximately 20%.
Jefferson Terminal is located on approximately 250 acres of land at the Port of Beaumont, Texas (the “Port”). Today, Jefferson leases 196 acres from the Port under three separate leases. The three leases have 50 year terms that expire in June 2062 (20 acres), August 2063 (31 acres), and January 2065 (145 acres). As part of the leases, Jefferson has been granted the concession to operate as the sole handler of liquid hydrocarbons at the Port. Jefferson does not own any land at Jefferson Terminal, but does own the equipment and leasehold improvements carried out as part of the Jefferson Terminal build-out.
Jefferson is developing a large multi-modal crude oil and refined products handling terminal at the Port and also owns several other assets for the transportation and processing of crude oil and related products. Jefferson Terminal has a unique combination of direct rail service from three Class I railroads, barge docks and deep water ship loading capacity, capabilities to handle multiple types of products including ethanol, refined products and both free-flowing crude oil and bitumen, and a prime location close to Port Arthur and Lake Charles, which are home to refineries with over 2.2 million barrels(1) per day of capacity. Today, Jefferson Terminal has approximately 2.05 million barrels of storage tanks in operation or under construction, the majority of which are committed under customer contracts. As the Company secures new storage/handling contracts, we expect to expand storage capacity and/or develop new assets. The timing of the ultimate development of Jefferson Terminal will be dependent, in part, on the pace at which contracts are executed as well as the amount of volume subject to such contracts.
(1) All capacities refer to shell-tank capacity
9
Jefferson Terminal’s prime location and excellent transportation connectivity make it well suited to provide logistics solutions to local refineries, including blending, storage and delivery of crude oil, ethanol and refined products. Heavy and extra heavy crude from western Canada (extra heavy crude is predominantly known as “bitumen”) is in high demand on the Gulf Coast because most refineries in the area are configured to handle heavier crudes (previously sourced predominately from Mexico and Venezuela) than those in other parts of the U.S. Canadian bitumen is well suited for transport by rail rather than pipeline because of its high viscosity. Jefferson Terminal is one of only a few terminals in the Gulf that has the heated system capabilities to handle this type of heavy crude. As the production of Western Canadian crude oil grows in excess of existing pipeline capacity, demand for crude-by-rail to the U.S. Gulf Coast is expected to increase. Growing ethanol production is expected to lead to more storage and logistics opportunities including domestic distribution and exports and demand for services to export ethanol is expected to increase as countries establish mandates on ethanol use or raise the required ethanol percentages in gasoline blends. Refined products opportunities for storage and logistics are expected to be positively impacted from Mexico deregulating its imports of both gasoline and diesel. Mexico’s imported supply of both gasoline and diesel increased from 23% in 2006 to 54% in 2016 as output from Mexican refineries has fallen.
Jefferson Terminal operates a light crude oil unloading system (the “Light System”), which has the capacity to discharge a unit train of up to 120 cars and the heavy crude oil unloading system (the “Heavy System”), which has the capacity to unload a unit train of up to 128 cars of heavy crude or bitumen requiring heating. Jefferson Terminal has two crude truck unloading bays. Jefferson Terminal has storage tanks with capacity to hold approximately 1.16 million barrels configured for crude oil in service. Additionally, the Company plans to construct approximately 800,000 barrels of additional crude storage in three tanks which are expected to be in service in the first half of 2019. We are planning on developing pipeline connections to some local refineries, which would allow for a lower cost of transportation to and from Jefferson Terminal. To date, we have completed engineering plans for all such construction. Once we execute formal contracts with a customer, the pipeline construction is estimated to take between 15 and 18 months depending on the final specifications of each project. Completion of construction is subject to a number of factors, certain of which are beyond our control, and there can be no assurance that we will not experience a delay.
In 2016, Jefferson Ethanol Holdings LLC a subsidiary of the Company, formed a joint venture to construct and operate an ethanol distribution hub at Jefferson Terminal. The ethanol hub has direct access to multiple transportation options including up to Aframax class vessels, inland coastwise barges, trucks, and unit trains with direct mainline service from three Class I railroads. The ethanol hub leverages some existing infrastructure at Jefferson Terminal. The initial system including unit train offloading, 610,000 barrels of storage, marine loading and offloading, and truck loading was placed into operation in the fourth quarter of 2017. The ethanol hub’s initial capacity of approximately 610,000 barrels of dedicated ethanol storage could be expanded to approximately 1 million barrels to meet additional needs of the market for ethanol distribution services.
Refined products opportunities for storage and logistics are expected to be positively impacted from Mexico deregulating its imports of both gasoline and diesel. Mexico’s imported supply of both gasoline and diesel increased from 23% in 2006 to 54% in 2016 as output from Mexican refineries has fallen. To meet this need, Jefferson built and placed into service in late 2017 a refined products system which receives three grades of products by inland tank barge via the barge dock, stores the cargo in three tanks with a combined capacity of approximately 282,000 barrels, and a rail car loading system with the capacity to load a unit train. This system could be expanded to meet additional needs of the market.
In addition to the Jefferson Terminal, Jefferson owns several other energy and transportation-related assets, including 300 tank railcars which may be deployed; a gas processing and condensate stabilization plant; pipeline rights-of-way; and a private inland marine terminal property all of which can be developed. These assets can be deployed or developed in the future to meet market demands for transportation and hydrocarbon processing, and if successfully deployed or developed, may represent additional opportunities to generate stable, recurring cash flow. As we secure customer contracts, we expect to invest equity capital to fund working capital needs and future construction, which may be required.
CMQR
Central Maine and Québec Railway (“CMQR”) is a 480-mile Class III railroad that runs from Montreal to the east coast of Maine, primarily transporting pulp and paper, construction products and chemicals. The CMQR offers the most direct route from ports in Montreal and on the east coast of the United States to manufacturers and other customers in Maine and Quebec. We believe that CMQR represents an investment in critical infrastructure with a captive customer base at an attractive valuation and significant growth potential.
Long Ridge Energy Terminal
On June 16, 2017, the Company, through Ohio River Partners LLC (“ORP”), a consolidated subsidiary, purchased the assets of Long Ridge Energy Terminal (“Long Ridge”), formally known as Hannibal, which consisted primarily of land, buildings, railroad track, docks, water rights, site improvements and other rights. The Company purchased 100% of the interest in these assets. ORP is solely reliant on the Company to finance its activities and therefore is a variable interest entity (“VIE”). The Company concluded it was the primary beneficiary; accordingly, ORP has been presented on a consolidated basis in the accompanying financial statements.
10
Repauno
On July 1, 2016, the Company, through Delaware River Partners LLC (“DRP”), a consolidated subsidiary, purchased the assets of a deep-water port located along the Delaware River with multiple industrial development opportunities (“Repauno”), which consisted primarily of land, a storage cavern, and riparian rights for the acquired land, site improvements and rights. Upon acquisition, there were no operational processes that could be applied to these assets that would result in outputs without significant green field development. The Company currently holds a 90% economic interest and a 100% voting interest in DRP. DRP is solely reliant on the Company to finance activities and therefore is a VIE. The Company concluded it was the primary beneficiary; and accordingly, DRP has been presented on a consolidated basis in the accompanying financial statements. The Company has the right to purchase an additional 8% economic interest from the non-controlling party after the second anniversary but prior to the fifth year anniversary of the acquisition of Repauno. At the time of the purchase, the Company concluded that 8% of the 10% interest held by the non-controlling party does not share in the risks or rewards of true equity; and therefore $5,321 was recorded in other liabilities on the Company’s Consolidated Balance Sheet. The remaining 2% economic non-controlling interest was valued at $641 at the acquisition date.
Asset Management
Our Manager actively manages and monitors our portfolios of assets on an ongoing basis, and in some cases engages third parties to assist with the management of those assets. Invoices from each of our customers are typically issued and collected on a monthly basis. Our Manager frequently reviews the status of all of our assets, and in the case that any are returning from lease or undergoing repair, outlines our options, which may include the re-lease or sale of that asset. In the case of operating infrastructure, our Manager plays a central role in developing and executing operational, finance and business development strategies. On a periodic basis, our Manager discusses the status of our acquired assets with our board of directors.
In some situations, we may acquire assets through a joint venture entity or own a minority position in an investment entity. In such circumstances, we will seek to protect our interests through appropriate levels of board representation, minority protections and other structural enhancements.
We and our Manager maintain relationships with operators worldwide and, through these relationships, hold direct conversations as to leasing needs and opportunities. Where helpful, we reach out to third parties who assist in leasing our assets. As an example, we often partner with MRO facilities in the aviation sector to lease these engines and support airlines’ fleet management needs.
While we expect to hold our assets for extended periods of time, we and our Manager continually review our assets to assess whether we should sell or otherwise monetize them. Aspects that will factor into this process include relevant market conditions, the asset’s age, lease profile, relative concentration or remaining expected useful life.
Credit Process
We and our Manager monitor the credit quality of our various lessees on an ongoing basis. This monitoring includes interacting with our customers regularly to monitor collections, review period financial statements and discuss their operating performance. Most of our lease agreements are written with conditions that require reporting on the part of our lessees, and we actively reach out to our lessees to maintain contact and monitor their liquidity positions. Furthermore, many of our leases and contractual arrangements include credit enhancement elements that provide us with additional collateral or credit support to strengthen our credit position.
We are subject to concentrations of credit risk with respect to amounts due from customers on our direct finance leases and operating leases. We attempt to limit credit risk by performing ongoing credit evaluations. See “-Customers.”
Customers
Our customers consist of global operators of transportation and infrastructure networks, including airlines, offshore energy service providers and major shipping lines. We maintain ongoing relationships and discussions with our customers and seek to have consistent dialogue. In addition to helping us monitor the needs and quality of our customers, we believe these relationships help source additional opportunities and gain insight into attractive opportunities in the transportation and infrastructure sector. Given our limited operating history, a substantial portion of our revenue has historically been derived from a small number of customers. For each of the years ended December 31, 2017 and 2016, we earned approximately 10% of our revenue from our largest customers. We derive a significant percentage of our revenue within specific sectors from a limited number of customers. However, we do not think that we are dependent upon any particular customer, or that the loss of one or more of them would have a material adverse effect on our business or the relevant segment, because of our ability to release assets at similar terms following the loss of any such customer. See “Risk Factors-Contractual defaults may adversely affect our business, prospects, financial condition, results of operations and cash flows by decreasing revenues and increasing storage, positioning, collection, recovery and lost equipment expenses.”
Competition
The business of acquiring, managing and marketing transportation and transportation-related infrastructure assets is highly competitive. Market competition for acquisition opportunities includes traditional transportation and infrastructure companies, commercial and investment banks, as well as a growing number of non-traditional participants, such as hedge funds, private equity funds, and other private investors.
11
Additionally, the markets for our products and services are competitive, and we face competition from a number of sources. These competitors include engine and aircraft parts manufacturers, aircraft and aircraft engine lessors, airline and aircraft services and repair companies, aircraft spare parts distributors, offshore services providers, maritime equipment lessors, shipping container lessors, container shipping lines, and other transportation and infrastructure equipment lessors and operators.
We compete with other market participants on the basis of industry knowledge, availability of capital, and deal structuring experience and flexibility, among other things. We believe our Manager’s experience in the transportation and the transportation-related infrastructure industry and our access to capital, in addition to our focus on diverse asset classes and customers, provides a competitive advantage versus competitors that maintain a single sector focus.
Environmental Regulations
We are subject to federal, state, local and foreign laws and regulations relating to the protection of the environment, including those governing the discharge of pollutants to air and water, the management and disposal of hazardous substances and wastes, the cleanup of contaminated sites and noise and emission levels. Under some environmental laws in the United States and certain other countries, strict liability may be imposed on the owners or operators of assets, which could render us liable for environmental and natural resource damages without regard to negligence or fault on our part. We could incur substantial costs, including cleanup costs, fines and third-party claims for property or natural resource damage and personal injury, as a result of violations of or liabilities under environmental laws and regulations in connection with our or our lessee’s or charterer’s current or historical operations. While we typically maintain liability insurance coverage and typically require our lessees to provide us with indemnity against certain losses, the insurance coverage is subject to large deductibles, limits on maximum coverage and significant exclusions and may not be sufficient or available to protect against any or all liabilities and such indemnities may not cover or be sufficient to protect us against losses arising from environmental damage. In addition, changes to environmental standards or regulations in the industries in which we operate could limit the economic life of the assets we acquire or reduce their value, and also require us to make significant additional investments in order to maintain compliance.
Employees
Our Manager provides a management team and other professionals who are responsible for implementing our business strategy and performing certain services for us, subject to oversight by our board of directors, and as a result, we have no employees other than 30 individuals employed by Jefferson, 133 individuals employed by CMQR, of which 93 CMQR employees are covered under a collective bargaining agreement, one individual employed by the Offshore Energy segment, six individuals employed by Repauno and eight employees employed by Long Ridge. From time to time, certain of our officers may enter into written agreements with us that memorialize the provision of certain services; these agreements do not provide for the payment of any cash compensation to such officers from us. The employees of our Manager are not a party to any collective bargaining agreement. In addition, our Manager expects to utilize third party contractors to perform services and functions related to the operation and leasing of our assets such as aircraft, jet engines and shipping containers. These functions may include billing, collections, recovery and asset monitoring.
Insurance
Our leases generally require that our customers carry physical damage and liability insurance providing primary insurance coverage for loss and damage to our assets as well as for related cargo and third parties while the assets are on lease. In addition, in certain cases, we maintain contingent liability coverage for any claims or losses on our assets while they are on hire or otherwise in the possession of a third-party. Finally, we procure insurance for our assets when they are not on hire or are otherwise under our control.
Conflicts of Interest
Although we have established certain policies and procedures designed to mitigate conflicts of interest, there can be no assurance that these policies and procedures will be effective in doing so. It is possible that actual, potential or perceived conflicts of interest could give rise to investor dissatisfaction, litigation or regulatory enforcement actions.
One or more of our officers and directors have responsibilities and commitments to entities other than us. In addition, we do not have a policy that expressly prohibits our directors, officers, security holders or affiliates from engaging in business activities of the types conducted by us for their own account. However, our code of business conduct and ethics prohibits, subject to the terms of our organizational documents, the directors, officers and employees of our Manager from engaging in any transaction that involves an actual conflict of interest with us. In other words, this means that our Manager and its members, managers, officers and employees may pursue acquisition opportunities in transportation and transportation-related infrastructure assets, and that we may acquire or dispose of transportation or transportation-related infrastructure assets in which such persons have a personal interest, subject to pre-approval by the independent members of our board of directors in certain circumstances. In the event of a violation of this code of business of conduct and ethics that does not constitute bad faith, willful misconduct, gross negligence or reckless disregard of our Manager’s duties, neither or Manager nor its members, managers, officers or employees will be liable to us. See “Risk Factors-Risks Related to Our Manager-There are conflicts of interest in our relationship with our Manager.”
Our key agreements, including our Management Agreement, the Partnership Agreement, and our operating agreement were negotiated among related parties, and their respective terms, including fees and other amounts payable, may not be as favorable to us as terms negotiated on an arm’s-length basis with unaffiliated parties. Our independent directors may not vigorously enforce the provisions of our Management Agreement against our Manager. For example, our independent directors may refrain from terminating our Manager because doing so could result in the loss of key personnel.
12
We may compete with entities affiliated with our Manager or Fortress for certain target assets. From time to time, affiliates of Fortress may focus on investments in assets with a similar profile as our target assets that we may seek to acquire. These affiliates may have meaningful purchasing capacity, which may change over time depending upon a variety of factors, including, but not limited to, available equity capital and debt financing, market conditions and cash on hand. Fortress has multiple existing and planned funds focused on investing in one or more of the sectors in which we acquire assets, each with significant current or expected capital commitments. We may co-invest with these funds in certain target assets. Fortress funds generally have a fee structure similar to ours, but the fees actually paid will vary depending on the size, terms and performance of each fund.
Our Manager may determine, in its discretion, to make a particular acquisition through an investment vehicle other than us. Investment allocation decisions will reflect a variety of factors, such as a particular vehicle’s availability of capital (including financing), investment objectives and concentration limits, legal, regulatory, tax and other similar considerations, the source of the opportunity and other factors that the Manager, in its discretion, deems appropriate. Our Manager does not have an obligation to offer us the opportunity to participate in any particular investment, even if it meets our asset acquisition objectives. In addition, employees of Fortress or certain of its affiliates-including personnel providing services to or on behalf of our Manager-may perform services for Fortress affiliates that may acquire or seek to acquire transportation and infrastructure-related assets.
Geographic Information
Please refer to Note 14 of our consolidated financial statements included in Item 8 in this Annual Report on Form 10-K for a report, by geographic area for each segment, of revenues from our external customers, for the years ended December 31, 2017 and 2016, as well as a report, by geographic area for each segment, of our total property, plant and equipment and equipment held for lease as of December 31, 2017 and 2016.
Where Readers Can Find Additional Information
Fortress Transportation and Infrastructure Investors LLC is a Delaware limited liability company. Our principal executive offices are located at 1345 Avenue of the Americas, New York, New York 10105. Fortress Transportation and Infrastructure Investors LLC files annual, quarterly and current reports, proxy statements and other information required by the Exchange Act, with the SEC. Readers may read and copy any document that Fortress files at the SEC’s Public Reference Room located at 100 F Street, N.E., Washington, D.C. 20549, U.S.A. Please call the SEC at 1-800-SEC-0330 for further information on the Public Reference Room. Our SEC filings are also available to the public from the SEC’s internet site at http://www.sec.gov.
Our Internet site is http://www.ftandi.com. We will make available free of charge through our internet site our annual reports on Form 10-K, quarterly reports on Form 10-Q, current reports on Form 8-K, proxy statements and Forms 3, 4 and 5 filed on behalf of directors and executive officers and any amendments to those reports filed or furnished pursuant to the Exchange Act as soon as reasonably practicable after we electronically file such material with, or furnish it to, the SEC. Also posted on our website in the ‘‘Investor Center - Corporate Governance’’ section are charters for the company’s Audit Committee, Compensation Committee, Nominating Committee, as well as our Corporate Governance Guidelines, Code of Ethics for our officers, and our Code of Business Conduct and Ethics governing our directors, officers and employees. Information on, or accessible through, our website is not a part of, and is not incorporated into, this report.
Item 1A. Risk Factors
You should carefully consider the following risks and other information in this Form 10-K in evaluating us and our common shares. Any of the following risks, as well as additional risks and uncertainties not currently known to us or that we currently deem immaterial, could materially and adversely affect our results of operations or financial condition. The risk factors generally have been separated into the following categories: risks related to our business, risks related to our Manager, risks related to taxation and risks related to our common shares. However, these categories do overlap and should not be considered exclusive.
Risks Related to Our Business
Uncertainty relating to macroeconomic conditions may reduce the demand for our assets, result in non-performance of contracts by our lessees or charterers, limit our ability to obtain additional capital to finance new investments, or have other unforeseen negative effects.
Uncertainty and negative trends in general economic conditions in the United States and abroad, including significant tightening of credit markets and commodity price volatility, historically have created difficult operating environments for owners and operators in the transportation industry. Many factors, including factors that are beyond our control, may impact our operating results or financial condition and/or affect the lessees and charterers that form our customer base. For some years, the world has experienced weakened economic conditions and volatility following adverse changes in global capital markets. More recently, excess supply in oil and gas markets has put significant downward pressure on prices for these commodities, and may affect demand for assets used in production, refining and transportation of oil and gas. In particular, the significant decline in oil prices since 2015 has resulted in lower offshore exploration and production budgets worldwide, with industry experts predicting that offshore exploration and production spending will decrease by approximately 5% in 2018, as compared to 2017. These conditions have resulted in significant contraction, de-leveraging and reduced liquidity in the credit markets. A number of governments have implemented, or are considering implementing, a broad variety of governmental actions or new regulations for the financial markets. In addition, limitations on the availability of capital, higher costs of capital for financing expenditures or the desire to preserve liquidity, may cause our current or prospective customers to make reductions in future capital budgets and spending.
13
Further, demand for our assets is related to passenger and cargo traffic growth, which in turn is dependent on general business and economic conditions. Global economic downturns could have an adverse impact on passenger and cargo traffic levels and consequently our lessees’ and charterers’ business, which may in turn result in a significant reduction in revenues, earnings and cash flows, difficulties accessing capital and a deterioration in the value of our assets. We may also become exposed to increased credit risk from our customers and third parties who have obligations to us, which could result in increased non-performance of contracts by our lessees or charterers and adversely impact our business, prospects, financial condition, results of operations and cash flows.
The industries in which we operate have experienced periods of oversupply during which lease rates and asset values have declined, particularly during the recent economic downturn, and any future oversupply could materially adversely affect our results of operations and cash flows.
The oversupply of a specific asset is likely to depress the lease or charter rates for and the value of that type of asset and result in decreased utilization of our assets, and the industries in which we operate have experienced periods of oversupply during which rates and asset values have declined, particularly during the recent economic downturn. Factors that could lead to such oversupply include, without limitation:
• | general demand for the type of assets that we purchase; |
• | general macroeconomic conditions, including market prices for commodities that our assets may serve; |
• | geopolitical events, including war, prolonged armed conflict and acts of terrorism; |
• | outbreaks of communicable diseases and natural disasters; |
• | governmental regulation; |
• | interest rates; |
• | the availability of credit; |
• | restructurings and bankruptcies of companies in the industries in which we operate, including our customers; |
• | manufacturer production levels and technological innovation; |
• | manufacturers merging or exiting the industry or ceasing to produce certain asset types; |
• | retirement and obsolescence of the assets that we own; |
• | our railroad infrastructure may be damaged, including by flooding and railroad derailments; |
• | increases in supply levels of assets in the market due to the sale or merging of operating lessors; and |
• | reintroduction of previously unused or dormant assets into the industries in which we operate. |
These and other related factors are generally outside of our control and could lead to persistence of, or increase in, the oversupply of the types of assets that we acquire or decreased utilization of our assets, either of which could materially adversely affect our results of operations and cash flow. In addition, lessees may redeliver our assets to locations where there is oversupply, which may lead to additional repositioning costs for us if we move them to areas with higher demand. Positioning expenses vary depending on geographic location, distance, freight rates and other factors, and may not be fully covered by drop-off charges collected from the last lessees of the equipment or pick-up charges paid by the new lessees. Positioning expenses can be significant if a large portion of our assets are returned to locations with weak demand, which could materially adversely affect our business, prospects, financial condition, results of operations and cash flow.
There can be no assurance that any target returns will be achieved.
Our target returns for assets are targets only and are not forecasts of future profits. We develop target returns based on our Manager’s assessment of appropriate expectations for returns on assets and the ability of our Manager to enhance the return generated by those assets through active management. There can be no assurance that these assessments and expectations will be achieved and failure to achieve any or all of them may materially adversely impact our ability to achieve any target return with respect to any or all of our assets.
In addition, our target returns are based on estimates and assumptions regarding a number of other factors, including, without limitation, holding periods, the absence of material adverse events affecting specific investments (which could include, without limitation, natural disasters, terrorism, social unrest or civil disturbances), general and local economic and market conditions, changes in law, taxation, regulation or governmental policies and changes in the political approach to transportation investment, either generally or in specific countries in which we may invest or seek to invest. Many of these factors, as well as the other risks described elsewhere in this report, are beyond our control and all could adversely affect our ability to achieve a target return with respect to an asset. Further, target returns are targets for the return generated by specific assets and not by us. Numerous factors could prevent us from achieving similar returns, notwithstanding the performance of individual assets, including, without limitation, taxation and fees payable by us or our operating subsidiaries, including fees and incentive allocation payable to our Manager.
14
There can be no assurance that the returns generated by any of our assets will meet our target returns, or any other level of return, or that we will achieve or successfully implement our asset acquisition objectives, and failure to achieve the target return in respect of any of our assets could, among other things, have a material adverse effect on our business, prospects, financial condition, results of operations and cash flow. Further, even if the returns generated by individual assets meet target returns, there can be no assurance that the returns generated by other existing or future assets would do so, and the historical performance of the assets in our existing portfolio should not be considered as indicative of future results with respect to any assets.
Contractual defaults may adversely affect our business, prospects, financial condition, results of operations and cash flows by decreasing revenues and increasing storage, positioning, collection, recovery and lost equipment expenses.
The success of our business depends in large part on the success of the operators in the sectors in which we participate. Cash flows from our assets are substantially impacted by our ability to collect compensation and other amounts to be paid in respect of such assets from the customers with which we enter into leases, charters or other contractual arrangements. Inherent in the nature of the leases, charters and other arrangements for the use of such assets is the risk that we may not receive, or may experience delay in realizing, such amounts to be paid. While we target the entry into contracts with credit-worthy counterparties, no assurance can be given that such counterparties will perform their obligations during the term of the leases, charters or other contractual arrangements. In addition, when counterparties default, we may fail to recover all of our assets, and the assets we do recover may be returned in damaged condition or to locations where we will not be able to efficiently lease, charter or sell them. In most cases, we maintain, or require our lessees to maintain, certain insurances to cover the risk of damages or loss of our assets. However, these insurance policies may not be sufficient to protect us against a loss.
Depending on the specific sector, the risk of contractual defaults may be elevated due to excess capacity as a result of oversupply during the recent economic downturn. We lease assets to our customers pursuant to fixed-price contracts, and our customers then seek to utilize those assets to transport goods and provide services. If the price at which our customers receive for their transportation services decreases as a result of an oversupply in the marketplace, then our customers may be forced to reduce their prices in order to attract business (which may have an adverse effect on their ability to meet their contractual lease obligations to us), or may seek to renegotiate or terminate their contractual lease arrangements with us to pursue a lower-priced opportunity with another lessor, which may have a direct, adverse effect on us. See “-The industries in which we operate have experienced periods of oversupply during which lease rates and asset values have declined, particularly during the financial crisis, and any future oversupply could materially adversely affect our results of operations and cash flows.” Any default by a material customer would have a significant impact on our profitability at the time the customer defaulted, which could materially adversely affect our operating results and growth prospects. In addition, some of our counterparties may reside in jurisdictions with legal and regulatory regimes that make it difficult and costly to enforce such counterparties’ obligations.
We may not be able to renew or obtain new or favorable charters or leases, which could adversely affect our business, prospects, financial condition, results of operations and cash flows.
Our operating leases are subject to greater residual risk than direct finance leases because we will own the assets at the expiration of an operating lease term and we may be unable to renew existing charters or leases at favorable rates, or at all, or sell the leased or chartered assets, and the residual value of the asset may be lower than anticipated. In addition, our ability to renew existing charters or leases or obtain new charters or leases will also depend on prevailing market conditions, and upon expiration of the contracts governing the leasing or charter of the applicable assets, we may be exposed to increased volatility in terms of rates and contract provisions. For example, we do not currently have long-term charters for our construction support vessel and our ROV support vessel. Likewise, our customers may reduce their activity levels or seek to terminate or renegotiate their charters or leases with us. If we are not able to renew or obtain new charters or leases in direct continuation, or if new charters or leases are entered into at rates substantially below the existing rates or on terms otherwise less favorable compared to existing contractual terms, or if we are unable to sell assets for which we are unable to obtain new contracts or leases, our business, prospects, financial condition, results of operations and cash flows could be materially adversely affected.
If we acquire a high concentration of a particular type of asset, or concentrate our investments in a particular sector, our business, prospects, financial condition, results of operations and cash flows could be adversely affected by changes in market demand or problems specific to that asset or sector.
If we acquire a high concentration of a particular asset, or concentrate our investments in a particular sector, our business and financial results could be adversely affected by sector-specific or asset-specific factors. For example, if a particular sector experiences difficulties such as increased competition or oversupply, the operators we rely on as a lessor may be adversely affected and consequently our business and financial results may be similarly affected. If we acquire a high concentration of a particular asset and the market demand for a particular asset declines, it is redesigned or replaced by its manufacturer or it experiences design or technical problems, the value and rates relating to such asset may decline, and we may be unable to lease or charter such asset on favorable terms, if at all. Any decrease in the value and rates of our assets may have a material adverse effect on our business, prospects, financial condition, results of operations and cash flows.
We operate in highly competitive markets.
The business of acquiring transportation and transportation-related infrastructure assets is highly competitive. Market competition for opportunities includes traditional transportation and infrastructure companies, commercial and investment banks, as well as a growing number of non-traditional participants, such as hedge funds, private equity funds and other private investors, including Fortress-related entities. Some of these competitors may have access to greater amounts of capital and/or to capital that may be committed for longer periods of time or may have different return thresholds than us, and thus these competitors may have
15
certain advantages not shared by us. In addition, competitors may have incurred, or may in the future incur, leverage to finance their debt investments at levels or on terms more favorable than those available to us. Strong competition for investment opportunities could result in fewer such opportunities for us, as certain of these competitors have established and are establishing investment vehicles that target the same types of assets that we intend to purchase.
In addition, some of our competitors may have longer operating histories, greater financial resources and lower costs of capital than us, and consequently, may be able to compete more effectively in one or more of our target markets. We likely will not always be able to compete successfully with our competitors and competitive pressures or other factors may also result in significant price competition, particularly during industry downturns, which could have a material adverse effect on our business, prospects, financial condition, results of operations and cash flows.
Litigation to enforce our contracts and recover our assets has inherent uncertainties that are increased by the location of our assets in jurisdictions that have less developed legal systems.
While some of our contractual arrangements are governed by New York law and provide for the non-exclusive jurisdiction of the courts located in the state of New York, our ability to enforce our counterparties’ obligations under such contractual arrangements is subject to applicable laws in the jurisdiction in which enforcement is sought. While some of our existing assets are used in specific jurisdictions, transportation and transportation-related infrastructure assets by their nature generally move throughout multiple jurisdictions in the ordinary course of business. As a result, it is not possible to predict, with any degree of certainty, the jurisdictions in which enforcement proceedings may be commenced. Litigation and enforcement proceedings have inherent uncertainties in any jurisdiction and are expensive. These uncertainties are enhanced in countries that have less developed legal systems where the interpretation of laws and regulations is not consistent, may be influenced by factors other than legal merits and may be cumbersome, time-consuming and even more expensive. For example, repossession from defaulting lessees may be difficult and more expensive in jurisdictions whose laws do not confer the same security interests and rights to creditors and lessors as those in the United States and where the legal system is not as well developed. As a result, the remedies available and the relative success and expedience of collection and enforcement proceedings with respect to the owned assets in various jurisdictions cannot be predicted. To the extent more of our business shifts to areas outside of the United States and Europe, such as China and Malaysia, it may become more difficult and expensive to enforce our rights and recover our assets.
Certain liens may arise on our assets.
Certain of our assets are currently subject to liens under separate financing arrangements entered into by certain subsidiaries in connection with acquisitions of assets. In the event of a default under such arrangements by the applicable subsidiary, the lenders thereunder would be permitted to take possession of or sell such assets. See “Management’s Discussion and Analysis of Financial Condition and Results of Operations-Liquidity and Capital Resources.” In addition, our currently owned assets and assets that we purchase in the future may be subject to other liens based on the industry practices relating to such assets. Until they are discharged, these liens could impair our ability to repossess, re-lease or sell our assets, and to the extent our lessees or charterers do not comply with their obligations to discharge any liens on the applicable assets, we may find it necessary to pay the claims secured by such liens in order to repossess such assets. Such payments could materially adversely affect our operating results and growth prospects.
The values of the assets that we purchase may fluctuate due to various factors.
The fair market values of our assets may decrease or increase depending on a number of factors, including the prevailing level of charter or lease rates from time to time, general economic and market conditions affecting our target markets, type and age of assets, supply and demand for assets, competition, new governmental or other regulations and technological advances, all of which could impact our profitability and our ability to lease, charter, develop, operate, or sell such assets. In addition, our assets depreciate as they age and may generate lower revenues and cash flows. We must be able to replace such older, depreciated assets with newer assets, or our ability to maintain or increase our revenues and cash flows will decline. In addition, if we dispose of an asset for a price that is less than the depreciated book value of the asset on our balance sheet or if we determine that an asset’s value has been impaired, we will recognize a related charge in our consolidated statement of operations and such charge could be material.
Our use of joint ventures or partnerships, and our Manager’s outsourcing of certain functions, may present unforeseen obstacles or costs.
We have acquired and may in the future acquire interests in certain assets in cooperation with third-party partners or co-investors through jointly-owned acquisition vehicles, joint ventures or other structures. In these co-investment situations, our ability to control the management of such assets depends upon the nature and terms of the joint arrangements with such partners and our relative ownership stake in the asset, each of which will be determined by negotiation at the time of the investment and the determination of which is subject to the discretion of our Manager. Depending on our Manager’s perception of the relative risks and rewards of a particular asset, our Manager may elect to acquire interests in structures that afford relatively little or no operational and/or management control to us. Such arrangements present risks not present with wholly-owned assets, such as the possibility that a co-investor becomes bankrupt, develops business interests or goals that conflict with our interests and goals in respect of the assets, all of which could materially adversely affect our business, prospects, financial condition, results of operations and cash flows.
In addition, our Manager expects to utilize third party contractors to perform services and functions related to the operation and leasing of our assets. These functions may include billing, collections, recovery and asset monitoring. Because we and our
16
Manager do not directly control these third parties, there can be no assurance that the services they provide will be delivered at a level commensurate with our expectations, or at all. The failure of any such third party contractors to perform in accordance with our expectations could materially adversely affect our business, prospects, financial condition, results of operations and cash flows.
We are subject to the risks and costs of obsolescence of our assets.
Technological and other improvements expose us to the risk that certain of our assets may become technologically or commercially obsolete. For example, in our Aviation Leasing segment, as manufacturers introduce technological innovations and new types of aircraft, some of our assets could become less desirable to potential lessees. Such technological innovations may increase the rate of obsolescence of existing aircraft faster than currently anticipated by us. In addition, the imposition of increased regulation regarding stringent noise or emissions restrictions may make some of our aircraft less desirable and less valuable in the marketplace. In our Offshore Energy segment, development and construction of new, sophisticated, high-specification assets could cause our assets to become less desirable to potential charterers, and insurance rates may also increase with the age of a vessel, making older vessels less desirable to potential charterers. Any of these risks may adversely affect our ability to lease, charter or sell our assets on favorable terms, if at all, which could materially adversely affect our operating results and growth prospects.
The North American rail sector is a highly regulated industry and increased costs of compliance with, or liability for violation of, existing or future laws, regulations and other requirements could significantly increase our costs of doing business, thereby adversely affecting our profitability.
The rail sector is subject to extensive laws, regulations and other requirements including, but not limited to, those relating to the environment, safety, rates and charges, service obligations, employment, labor, immigration, minimum wages and overtime pay, health care and benefits, working conditions, public accessibility and other requirements. These laws and regulations are enforced by U.S. and Canadian federal agencies including the U.S. and Canadian Environmental Protection Agencies, the U.S. and Canadian Departments of Transportation (USDOT or Transport Canada), the Occupational Safety and Health Act (OSHA or Canadian provincial equivalents), the U.S. Federal Railroad Administration, or FRA, and the U.S. Surface Transportation Board, or STB, as well as numerous other state, provincial, local and federal agencies. Ongoing compliance with, or a violation of, these laws, regulations and other requirements could have a material adverse effect on our business, financial condition and results of operations.
We believe that our rail operations are in substantial compliance with applicable laws and regulations. However, these laws and regulations, and the interpretation or enforcement thereof, are subject to frequent change and varying interpretation by regulatory authorities, and we are unable to predict the ongoing cost to us of complying with these laws and regulations or the future impact of these laws and regulations on our operations. In addition, from time to time we are subject to inspections and investigations by various regulators. Violation of environmental or other laws, regulations and permits can result in the imposition of significant administrative, civil and criminal penalties, injunctions and construction bans or delays.
Legislation passed by the U.S. Congress or Canadian Parliament or new regulations issued by federal agencies can significantly affect the revenues, costs and profitability of our business. For instance, proposed bills such as the “Rail Shipper Fairness Act of 2015,” if adopted, could increase government involvement in railroad pricing, service and operations and significantly change the federal regulatory framework of the railroad industry. Several of the changes under consideration could have a significant negative impact on FTAI’s ability to determine prices for rail services, meet service standards and could force a reduction in capital spending. Statutes imposing price constraints or affecting rail-to-rail competition could adversely affect FTAI’s profitability.
Under various U.S. and Canadian federal, state, provincial and local environmental requirements, as the owner or operator of terminals or other facilities, we may be liable for the costs of removal or remediation of contamination at or from our existing locations, whether we knew of, or were responsible for, the presence of such contamination. The failure to timely report and properly remediate contamination may subject us to liability to third parties and may adversely affect our ability to sell or rent our property or to borrow money using our property as collateral. Additionally, we may be liable for the costs of remediating third-party sites where hazardous substances from our operations have been transported for treatment or disposal, regardless of whether we own or operate that site. In the future, we may incur substantial expenditures for investigation or remediation of contamination that has not yet been discovered at our current or former locations or locations that we may acquire.
A discharge of hydrocarbons or hazardous substances into the environment associated with operating our rail assets could subject us to substantial expense, including the cost to recover the materials spilled, restore the affected natural resources, pay fines and penalties, and natural resource damages and claims made by employees, neighboring landowners, government authorities and other third parties, including for personal injury and property damage. We may experience future catastrophic sudden or gradual releases into the environment from our facilities or discover historical releases that were previously unidentified or not assessed. Although our inspection and testing programs are designed to prevent, detect and address any such releases promptly, the liabilities incurred due to any future releases into the environment from our assets, have the potential to substantially affect our business. Such events could also subject us to media and public scrutiny that could have a negative effect on our operations and also on the value of our common shares.
Our business could be adversely affected if service on the railroads is interrupted or if more stringent regulations are adopted regarding railcar design or the transportation of crude oil by rail.
As a result of hydraulic fracturing and other improvements in extraction technologies, there has been a substantial increase in the volume of crude oil and liquid hydrocarbons produced and transported in North America, and a geographic shift in that production versus historical production. The increase in volume and shift in geography has resulted in a growing percentage of crude oil being transported by rail. High-profile accidents involving crude-oil-carrying trains in Quebec, North Dakota and Virginia,
17
and more recently in West Virginia and Illinois, have raised concerns about the environmental and safety risks associated with crude oil transport by rail and the associated risks arising from railcar design.
In May 2015, the DOT issued new production standards and operational controls for rail tank cars used in “High-Hazard Flammable Trains” (i.e., trains carrying commodities such as ethanol, crude oil and other flammable liquids). Similar standards have been adopted in Canada. The new standard applies for all cars manufactured after October 1, 2015, and existing tank cars must be retrofitted within the next three to eight years. The applicable operational controls include reduced speed restrictions, and maximum lengths on trains carrying these materials. Retrofitting our tank cars will be required under these new standards. While we may be able to pass some of these costs on to our customers, there may be costs that we cannot pass on to them. We continue to monitor the railcar regulatory landscape and remain in close contact with railcar suppliers and other industry stakeholders to stay informed of railcar regulation rulemaking developments. It is unclear how these regulations will impact the crude-by-rail industry, and any such impact would depend on a number of factors that are outside of our control. If, for example, overall volume of crude-by-rail decreases, or if we do not have access to a sufficient number of compliant cars to transport required volumes under our existing contracts, our operations may be negatively affected. This may lead to a decrease in revenues and other consequences.
The adoption of additional federal, state, provincial or local laws or regulations, including any voluntary measures by the rail industry regarding railcar design or crude oil and liquid hydrocarbon rail transport activities, or efforts by local communities to restrict or limit rail traffic involving crude oil, could affect our business by increasing compliance costs and decreasing demand for our services, which could adversely affect our financial position and cash flows. Moreover, any disruptions in the operations of railroads, including those due to shortages of railcars, weather-related problems, flooding, drought, accidents, mechanical difficulties, strikes, lockouts or bottlenecks, could adversely impact our customers’ ability to move their product and, as a result, could affect our business.
Our assets are exposed to unplanned interruptions caused by catastrophic events outside of our control which may disrupt our business and cause damage or losses that may not be adequately covered by insurance.
The operations of transportation and infrastructure projects are exposed to unplanned interruptions caused by significant catastrophic events, such as hurricanes, cyclones, earthquakes, landslides, floods, explosions, fires, major plant breakdowns, pipeline or electricity line ruptures or other disasters. Operational disruption, as well as supply disruption, could adversely impact the cash flows available from these assets. In addition, the cost of repairing or replacing damaged assets could be considerable. Repeated or prolonged interruption may result in temporary or permanent loss of customers, substantial litigation or penalties for regulatory or contractual non-compliance, and any loss from such events may not be recoverable under relevant insurance policies. Although we believe that we are adequately insured against these types of events, either indirectly through our lessees or charterers or through our own insurance policies, no assurance can be given that the occurrence of any such event will not materially adversely affect us. In addition, if a lessee or charterer is not obligated to maintain sufficient insurance, we may incur the costs of additional insurance coverage during the related lease or charter. We can give no assurance that such insurance will be available at commercially reasonable rates, if at all.
Our assets generally require routine maintenance, and we may be exposed to unforeseen maintenance costs.
We may be exposed to unforeseen maintenance costs for our assets associated with a lessee’s or charterer’s failure to properly maintain the asset. We enter into leases and charters with respect to some of our assets pursuant to which the lessees are primarily responsible for many obligations, which generally include complying with all governmental requirements applicable to the lessee or charterer, including operational, maintenance, government agency oversight, registration requirements and other applicable directives. Failure of a lessee or charterer to perform required maintenance during the term of a lease or charter could result in a decrease in value of an asset, an inability to re-lease or charter an asset at favorable rates, if at all, or a potential inability to utilize an asset. Maintenance failures would also likely require us to incur maintenance and modification costs upon the termination of the applicable lease or charter; such costs to restore the asset to an acceptable condition prior to re-leasing, charter or sale could be substantial. Any failure by our lessees or charterers to meet their obligations to perform required scheduled maintenance or our inability to maintain our assets could materially adversely affect our business, prospects, financial condition, results of operations and cash flows.
Some of our customers operate in highly regulated industries and changes in laws or regulations, including laws with respect to international trade, may adversely affect our ability to lease, charter or sell our assets.
Some of our customers operate in highly regulated industries such as aviation and offshore energy. A number of our contractual arrangements-for example, our leasing aircraft engines or offshore energy equipment to third-party operators-require the operator (our customer) to obtain specific governmental or regulatory licenses, consents or approvals. These include consents for certain payments under such arrangements and for the export, import or re-export of the related assets. Failure by our customers or, in certain circumstances, by us, to obtain certain licenses and approvals could negatively affect our ability to conduct our business. In addition, the shipment of goods, services and technology across international borders subjects the operation of our assets to international trade laws and regulations. Moreover, many countries, including the United States, control the export and re-export of certain goods, services and technology and impose related export recordkeeping and reporting obligations. Governments also may impose economic sanctions against certain countries, persons and other entities that may restrict or prohibit transactions involving such countries, persons and entities. If any such regulations or sanctions affect the asset operators that are our customers, our business, prospects, financial condition, results of operations and cash flows may be materially adversely affected.
18
It is impossible to predict whether third parties will allege liability related to our purchase of the Montreal, Maine and Atlantic Railway (“MM&A”) assets out of bankruptcy, including possible claims related to the July 6, 2013 train derailment near Lac-Mégantic, Quebec.
On July 6, 2013, prior to our ownership, a train carrying crude oil on the MM&A line derailed near Lac-Mégantic, Quebec which resulted in fires that claimed the lives of 47 individuals (the “Incident”). Approximately two million gallons of crude oil were either burned or released into the environment, including into the nearby Chaudière River. Prior to our acquisition of the MM&A assets in May and June 2014, we received written assurance from the Quebec Ministry of Sustainable Development, Environment, Wildlife and Parks that it would take full responsibility for the environmental clean-up and that it would not hold CMQR liable for any environmental damages or costs relating to clean-up or restoration of the affected area as a result of the Incident. While we don’t anticipate any liability relating to the Incident, including liability for claims alleging personal injury, property damage or natural resource damages, there can be no assurance that such claims relating to the Incident will not arise in the future. No claims have been made or threatened against us as of December 31, 2017 and we do not anticipate any expenditures relating to environmental clean-up (including impacts to the Chaudière River) as a result of the Incident.
Certain of our assets are subject to purchase options held by the charterer or lessee of the asset which, if exercised, could reduce the size of our asset base and our future revenues.
We have granted purchase options to the charterers and lessees of certain of our assets. The market values of these assets may change from time to time depending on a number of factors, such as general economic and market conditions affecting the industries in which we operate, competition, cost of construction, governmental or other regulations, technological changes and prevailing levels of charter or lease rates from time to time. The purchase price under a purchase option may be less than the asset’s market value at the time the option may be exercised. In addition, we may not be able to obtain a replacement asset for the price at which the asset is sold. In such cases, our business, prospects, financial condition, results of operations and cash flows may be materially adversely affected.
The profitability of our Offshore Energy segment may be impacted by the profitability of the offshore oil and gas industry generally, which is significantly affected by, among other things, volatile oil and gas prices.
Demand for assets in the Offshore Energy segment and our ability to secure charter contracts for our assets at favorable charter rates following expiry or termination of existing charters will depend, among other things, on the level of activity in the offshore oil and gas industry. The offshore oil and gas industry is cyclical and volatile, and demand for oil-service assets depends on, among other things, the level of development and activity in oil and gas exploration, as well as the identification and development of oil and gas reserves and production in offshore areas worldwide. The availability of high quality oil and gas prospects, exploration success, relative production costs, the stage of reservoir development, political concerns and regulatory requirements all affect the level of activity for charterers of oil-service vessels. Accordingly, oil and gas prices and market expectations of potential changes in these prices significantly affect the level of activity and demand for oil-service assets. Oil and gas prices can be extremely volatile and are affected by numerous factors beyond the Company’s control, such as: worldwide demand for oil and gas; costs of exploring, developing, producing and delivering oil and gas; expectations regarding future energy prices; the ability of the Organization of Petroleum Exporting Countries (“OPEC”) to set and maintain production levels and impact pricing; the level of production in non-OPEC countries; governmental regulations and policies regarding development of oil and gas reserves; local and international political, economic and weather conditions; domestic and foreign tax policies; political and military conflicts in oil-producing and other countries; and the development and exploration of alternative fuels. Any reduction in the demand for our assets due to these or other factors could materially adversely affect our operating results and growth prospects.
Our Shipping Containers segment is affected by the lack of an international title registry for containers, which increases the risk of ownership disputes.
Although the Bureau International des Containers registers and allocates a unique four letter prefix to every container in accordance with International Standardization Organization (“ISO”) standard 6346 (Freight container coding, identification and marking) there is no internationally recognized system of recordation or filing to evidence our title to containers nor is there an internationally recognized system for filing security interest in containers. While this has not historically had a material impact on our intermodal assets, the lack of a title recordation system with respect to containers could result in disputes with lessees, end-users, or third parties, such as creditors of end-users, who may improperly claim ownership of the containers, especially in countries with less developed legal systems.
Our international operations involve additional risks, which could adversely affect our business, prospects, financial condition, results of operations and cash flows.
We and our customers operate in various regions throughout the world. As a result, we may, directly or indirectly, be exposed to political and other uncertainties, including risks of:
• | terrorist acts, armed hostilities, war and civil disturbances; |
• | acts of piracy; |
• | significant governmental influence over many aspects of local economies; |
• | seizure, nationalization or expropriation of property or equipment; |
• | repudiation, nullification, modification or renegotiation of contracts; |
19
• | limitations on insurance coverage, such as war risk coverage, in certain areas; |
• | political unrest; |
• | foreign and U.S. monetary policy and foreign currency fluctuations and devaluations; |
• | the inability to repatriate income or capital; |
• | complications associated with repairing and replacing equipment in remote locations; |
• | import-export quotas, wage and price controls, imposition of trade barriers; |
• | U.S. and foreign sanctions or trade embargoes; |
• | restrictions on the transfer of funds into or out of countries in which we operate; |
• | compliance with U.S. Treasury sanctions regulations restricting doing business with certain nations or specially designated nationals; |
• | regulatory or financial requirements to comply with foreign bureaucratic actions; |
• | compliance with applicable anti-corruption laws and regulations; |
• | changing taxation policies, including confiscatory taxation; |
• | other forms of government regulation and economic conditions that are beyond our control; and |
• | governmental corruption. |
Any of these or other risks could adversely impact our customers’ international operations which could materially adversely impact our operating results and growth opportunities.
We may make acquisitions in emerging markets throughout the world, and investments in emerging markets are subject to greater risks than developed markets and could adversely affect our business, prospects, financial condition, results of operations and cash flows.
To the extent that we acquire assets in emerging markets-which we may do throughout the world-additional risks may be encountered that could adversely affect our business. Emerging market countries have less developed economies and infrastructure and are often more vulnerable to economic and geopolitical challenges and may experience significant fluctuations in gross domestic product, interest rates and currency exchange rates, as well as civil disturbances, government instability, nationalization and expropriation of private assets and the imposition of taxes or other charges by government authorities. In addition, the currencies in which investments are denominated may be unstable, may be subject to significant depreciation and may not be freely convertible or may be subject to the imposition of other monetary or fiscal controls and restrictions.
Emerging markets are still in relatively early stages of their development and accordingly may not be highly or efficiently regulated. Moreover, emerging markets tend to be shallower and less liquid than more established markets which may adversely affect our ability to realize profits from our assets in emerging markets when we desire to do so or receive what we perceive to be their fair value in the event of a realization. In some cases, a market for realizing profits from an investment may not exist locally. In addition, issuers based in emerging markets are not generally subject to uniform accounting and financial reporting standards, practices and requirements comparable to those applicable to issuers based in more developed countries, thereby potentially increasing the risk of fraud and other deceptive practices. Settlement of transactions may be subject to greater delay and administrative uncertainties than in developed markets and less complete and reliable financial and other information may be available to investors in emerging markets than in developed markets. In addition, economic instability in emerging markets could adversely affect the value of our assets subject to leases or charters in such countries, or the ability of our lessees or charters, which operate in these markets, to meet their contractual obligations. As a result, lessees or charterers that operate in emerging market countries may be more likely to default under their contractual obligations than those that operate in developed countries. Liquidity and volatility limitations in these markets may also adversely affect our ability to dispose of our assets at the best price available or in a timely manner.
As we have and may continue to acquire assets located in emerging markets throughout the world, we may be exposed to any one or a combination of these risks, which could adversely affect our operating results.
We are actively evaluating acquisitions of assets and operating companies in other transportation and infrastructure sectors which could result in additional risks and uncertainties for our business and unexpected regulatory compliance costs.
While our existing portfolio consists of assets in the aviation, energy, intermodal transport and rail sectors, we are actively evaluating acquisitions of assets and operating companies in other sectors of the transportation and transportation-related infrastructure and equipment markets and we plan to be flexible as other attractive opportunities arise over time. To the extent we make acquisitions in other sectors, we will face numerous risks and uncertainties, including risks associated with the required investment of capital and other resources and with combining or integrating operational and management systems and controls. Entry into certain lines of business may subject us to new laws and regulations and may lead to increased litigation and regulatory risk. Many types of transportation assets, including certain rail, airport and seaport assets, are subject to registration requirements by U.S. governmental agencies, as well as foreign governments if such assets are to be used outside of the United States. Failing
20
to register the assets, or losing such registration, could result in substantial penalties, forced liquidation of the assets and/or the inability to operate and, if applicable, lease the assets. We may need to incur significant costs to comply with the laws and regulations applicable to any such new acquisition. The failure to comply with these laws and regulations could cause us to incur significant costs, fines or penalties or require the assets to be removed from service for a period of time resulting in reduced income from these assets. In addition, if our acquisitions in other sectors produce insufficient revenues, or produce investment losses, or if we are unable to efficiently manage our expanded operations, our results of operations will be adversely affected, and our reputation and business may be harmed.
We may acquire operating businesses, including businesses whose operations are not fully matured and stabilized. These businesses may be subject to significant operating and development risks, including increased competition, cost overruns and delays, and difficulties in obtaining approvals or financing. These factors could materially affect our business, financial condition, liquidity and results of operations.
We have acquired, and may in the future acquire, operating businesses including businesses whose operations are not fully matured and stabilized (such as Jefferson Terminal). While we have deep experience in the construction and operation of these companies, we are nevertheless subject to significant risks and contingencies of an operating business, and these risks are greater where the operations of such businesses are not fully matured and stabilized. Key factors that may affect our operating businesses include, but are not limited to:
• | competition from market participants; |
• | general economic and/or industry trends, including pricing for the products or services offered by our operating businesses; |
• | the issuance and/or continued availability of necessary permits, licenses, approvals and agreements from governmental agencies and third parties as are required to construct and operate such businesses; |
• | changes or deficiencies in the design or construction of development projects; |
• | unforeseen engineering, environmental or geological problems; |
• | potential increases in construction and operating costs due to changes in the cost and availability of fuel, power, materials and supplies; |
• | the availability and cost of skilled labor and equipment; |
• | our ability to enter into additional satisfactory agreements with contractors and to maintain good relationships with these contractors in order to construct development projects within our expected cost parameters and time frame, and the ability of those contractors to perform their obligations under the contracts and to maintain their creditworthiness; |
• | potential liability for injury or casualty losses which are not covered by insurance; |
• | potential opposition from non-governmental organizations, environmental groups, local or other groups which may delay or prevent development activities; |
• | local and economic conditions; |
• | changes in legal requirements; and |
• | force majeure events, including catastrophes and adverse weather conditions. |
Any of these factors could materially affect our business, financial condition, liquidity and results of operations.
The agreements governing our indebtedness place restrictions on us and our subsidiaries, reducing operational flexibility and creating default risks.
The agreements governing our indebtedness, including the indenture governing our Senior Notes, contain covenants that place restrictions on us and our subsidiaries. The indenture governing our Senior Notes restricts, among other things, our and certain of our subsidiaries’ ability to:
• | merge, consolidate or transfer all, or substantially all, of our assets; |
• | incur additional debt or issue preferred shares; |
• | make certain investments or acquisitions; |
• | create liens on our or our subsidiaries’ assets; |
• | sell assets; |
• | make distributions on or repurchase our shares; |
• | enter into transactions with affiliates; and |
• | create dividend restrictions and other payment restrictions that affect our subsidiaries. |
21
These covenants could impair our ability to grow our business, take advantage of attractive business opportunities or successfully compete. A breach of any of these covenants could result in an event of default. Cross-default provisions in our debt agreements could cause an event of default under one debt agreement to trigger an event of default under our other debt agreements. Upon the occurrence of an event of default under any of our debt agreements, the lenders or holders thereof could elect to declare all outstanding debt under such agreements to be immediately due and payable.
Terrorist attacks could negatively impact our operations and our profitability and may expose us to liability and reputational damage.
Terrorist attacks may negatively affect our operations. Such attacks have contributed to economic instability in the United States and elsewhere, and further acts of terrorism, violence or war could similarly affect world trade and the industries in which we and our customers operate. In addition, terrorist attacks or hostilities may directly impact airports or aircraft, ports where our containers and vessels travel, or our physical facilities or those of our customers. In addition, it is also possible that our assets could be involved in a terrorist attack. The consequences of any terrorist attacks or hostilities are unpredictable, and we may not be able to foresee events that could have a material adverse effect on our operations. Although our lease and charter agreements generally require the counterparties to indemnify us against all damages arising out of the use of our assets, and we carry insurance to potentially offset any costs in the event that our customer indemnifications prove to be insufficient, our insurance does not cover certain types of terrorist attacks, and we may not be fully protected from liability or the reputational damage that could arise from a terrorist attack which utilizes our assets.
Because we are a recently formed company with a limited operating history, our historical financial and operating data may not be representative of our future results.
We are a recently formed limited liability company with a limited operating history. Our results of operations, financial condition and cash flows reflected in our consolidated financial statements may not be indicative of the results we would have achieved if we were a public company or results that may be achieved in future periods. Consequently, there can be no assurance that we will be able to generate sufficient income to pay our operating expenses and make satisfactory distributions to our shareholders, or any distributions at all. Further, we only make acquisitions identified by our Manager. As a result of this concentration of assets, our financial performance depends on the performance of our Manager in identifying target assets, the availability of opportunities falling within our asset acquisition strategy and the performance of those underlying assets.
Our leases and charters require payments in U.S. dollars, but many of our customers operate in other currencies; if foreign currencies devalue against the U.S. dollar, our lessees or charterers may be unable to meet their payment obligations to us in a timely manner.
Our current leases and charters require that payments be made in U.S. dollars. If the currency that our lessees or charterers typically use in operating their businesses devalues against the U.S. dollar, our lessees or charterers could encounter difficulties in making payments to us in U.S. dollars. Furthermore, many foreign countries have currency and exchange laws regulating international payments that may impede or prevent payments from being paid to us in U.S. dollars. Future leases or charters may provide for payments to be made in euros or other foreign currencies. Any change in the currency exchange rate that reduces the amount of U.S. dollars obtained by us upon conversion of future lease payments denominated in euros or other foreign currencies, may, if not appropriately hedged by us, have a material adverse effect on us and increase the volatility of our earnings.
Our inability to obtain sufficient capital would constrain our ability to grow our portfolio and to increase our revenues.
Our business is capital intensive, and we have used and may continue to employ leverage to finance our operations. Accordingly, our ability to successfully execute our business strategy and maintain our operations depends on the availability and cost of debt and equity capital. Additionally, our ability to borrow against our assets is dependent, in part, on the appraised value of such assets. If the appraised value of such assets declines, we may be required to reduce the principal outstanding under our debt facilities or otherwise be unable to incur new borrowings.
We can give no assurance that the capital we need will be available to us on favorable terms, or at all. Our inability to obtain sufficient capital, or to renew or expand our credit facilities, could result in increased funding costs and would limit our ability to:
• | meet the terms and maturities of our existing and future debt facilities; |
• | purchase new assets or refinance existing assets; |
• | fund our working capital needs and maintain adequate liquidity; and |
• | finance other growth initiatives. |
In addition, we conduct our operations so that neither we nor any of our subsidiaries are required to register as an investment company under the Investment Company Act of 1940 (the “Investment Company Act”). As such, certain forms of financing such as finance leases may not be available to us. Please see “- If we are deemed an investment company under the Investment Company Act, it could have a material adverse effect on our business, prospects, financial condition, results of operations and cash flows.”
22
We may not generate a sufficient amount of cash or generate sufficient free cash flow to fund our operations or repay our indebtedness.
Our ability to make payments on our indebtedness as required depends on our ability to generate cash flow in the future. This ability, to a certain extent, is subject to general economic, financial, competitive, legislative, regulatory and other factors that are beyond our control. If we do not generate sufficient free cash flow to satisfy our debt obligations, including interest payments and the payment of principal at maturity, we may have to undertake alternative financing plans, such as refinancing or restructuring our debt, selling assets, reducing or delaying capital investments or seeking to raise additional capital. We cannot provide assurance that any refinancing would be possible, that any assets could be sold, or, if sold, of the timeliness and amount of proceeds realized from those sales, that additional financing could be obtained on acceptable terms, if at all, or that additional financing would be permitted under the terms of our various debt instruments then in effect. Furthermore, our ability to refinance would depend upon the condition of the finance and credit markets. Our inability to generate sufficient free cash flow to satisfy our debt obligations, or to refinance our obligations on commercially reasonable terms or on a timely basis, would materially affect our business, financial condition and results of operations.
The effects of various environmental regulations may negatively affect the industries in which we operate which could have a material adverse effect on our financial condition, results of operations and cash flows.
We are subject to federal, state, local and foreign laws and regulations relating to the protection of the environment, including those governing the discharge of pollutants to air and water, the management and disposal of hazardous substances and wastes, the cleanup of contaminated sites and noise and emission levels. Under some environmental laws in the United States and certain other countries, strict liability may be imposed on the owners or operators of assets, which could render us liable for environmental and natural resource damages without regard to negligence or fault on our part. We could incur substantial costs, including cleanup costs, fines and third-party claims for property or natural resource damage and personal injury, as a result of violations of or liabilities under environmental laws and regulations in connection with our or our lessee’s or charterer’s current or historical operations, any of which could have a material adverse effect on our results of operations and financial condition. While we typically maintain liability insurance coverage and typically require our lessees to provide us with indemnity against certain losses, the insurance coverage is subject to large deductibles, limits on maximum coverage and significant exclusions and may not be sufficient or available to protect against any or all liabilities and such indemnities may not cover or be sufficient to protect us against losses arising from environmental damage. In addition, changes to environmental standards or regulations in the industries in which we operate could limit the economic life of the assets we acquire or reduce their value, and also require us to make significant additional investments in order to maintain compliance, which would negatively impact our cash flows and results of operations.
Our Repauno site and Long Ridge property are subject to environmental laws and regulations that may expose us to significant costs and liabilities.
Our Repauno site is subject to on-going environmental investigation and remediation by the former owner of the property related to historic industrial operations. The former owner is responsible for completion of this work, and we benefit from a related indemnity and insurance policy. If the former owner fails to fulfill its investigation and remediation, or indemnity obligations and the related insurance, which are subject to limits and conditions, fail to cover our costs, we could incur losses. Redevelopment of the property in those areas undergoing investigation and remediation must await state environmental agency confirmation that no further investigation or remediation is required before redevelopment activities can occur in such areas of the property. Therefore, any delay in the former owner’s completion of the environmental work or receipt of related approvals in an area of the property could delay our redevelopment activities. In addition, once received, permits and approvals may be subject to litigation, and projects may be delayed or approvals reversed or modified in litigation. If there is a delay in obtaining any required regulatory approval, it could delay projects and cause us to incur costs.
In connection with our acquisition of Long Ridge, the former owner of the property is obligated to perform certain post-closing demolition activities, remove specified containers, equipment and structures and conduct investigation, removal, cleanup and decontamination related thereto. In addition, the former owner is responsible for on-going environmental remediation related to historic industrial operations on and off Long Ridge. Pursuant to an order issued by the Ohio Environmental Protection Agency (“Ohio EPA”), the former owner is responsible for completing the removal and off-site disposal of electrolytic pots associated with the former use of Long Ridge as an aluminum reduction plant. In addition, Long Ridge is located adjacent to the former Ormet Corporation Superfund site (the “Ormet site”), which is owned and operated by the former owner of Long Ridge. Pursuant to an order with the United States Environmental Protection Agency (“US EPA”), the former owner is obligated to pump groundwater that has been impacted by the adjacent Ormet site beneath our site and discharge it to the Ohio River and monitor the groundwater annually. Long Ridge is also subject to an environmental covenant related to the adjacent Ormet site that, inter alia, restricts the use of groundwater beneath our site and requires US EPA consent for activities on Long Ridge that could disrupt the groundwater monitoring or pumping. The former owner is contractually obligated to complete its regulatory obligations on Long Ridge and we benefit from a related indemnity and insurance policy. If the former owner fails to fulfill its demolition, removal, investigation, remediation or monitoring obligations, or indemnity obligations and the related insurance, which are subject to limits and conditions, fail to cover our costs, we could incur losses. Redevelopment of the property in those areas undergoing investigation and remediation pursuant to the Ohio EPA order must await state environmental agency confirmation that no further investigation or remediation is required before redevelopment activities can occur in such area of the property. Therefore, any delay in the former owner’s completion of the environmental work or receipt of related approvals or consents from Ohio EPA or US EPA could delay our redevelopment activities.
23
In addition, a portion of Long Ridge is proposed for redevelopment as a combined cycle gas-fired electric generating facility. Although environmental investigations in that portion of the property have not identified material impacts to soils or groundwater that reasonably would be expected to prevent or delay redevelopment, impacted materials could be encountered during construction that require special handling and/or result in delays to the project. In addition, the construction of an electric generating plant will require environmental permits and approvals from federal, state and local environmental agencies. Once received, permits and approvals may be subject to litigation, and projects may be delayed or approvals reversed or modified in litigation. If there is a delay in obtaining any required regulatory approval, it could delay projects and cause us to incur costs.
Moreover, new, stricter environmental laws, regulations or enforcement policies, including those imposed in response to climate change, could be implemented that significantly increase our compliance costs, or require us to adopt more costly methods of operation. If we are not able to transform Repauno or Long Ridge into hubs for industrial and energy development in a timely manner, their future prospects could be materially and adversely affected, which may have a material adverse effect on our business, operating results and financial condition.
If we are deemed an “investment company” under the Investment Company Act, it could have a material adverse effect on our business, prospects, financial condition, results of operations and cash flows.
We conduct our operations so that neither we nor any of our subsidiaries are required to register as an investment company under the Investment Company Act. Section 3(a)(1)(A) of the Investment Company Act defines an investment company as any issuer that is or holds itself out as being engaged primarily, or proposes to engage primarily, in the business of investing, reinvesting or trading in securities. Section 3(a)(1)(C) of the Investment Company Act defines an investment company as any issuer that is engaged or proposes to engage in the business of investing, reinvesting, owning, holding or trading in securities and owns or proposes to acquire investment securities having a value exceeding 40% of the value of the issuer’s total assets (exclusive of U.S. government securities and cash items) on an unconsolidated basis. Excluded from the term “investment securities,” among other things, are U.S. government securities and securities issued by majority-owned subsidiaries that are not themselves investment companies and are not relying on the exception from the definition of investment company for certain privately-offered investment vehicles set forth in Section 3(c)(1) or Section 3(c)(7) of the Investment Company Act.
We are a holding company that is not an investment company because we are engaged in the business of holding securities of our wholly-owned and majority-owned subsidiaries, which are engaged in transportation and related businesses which lease assets pursuant to operating leases and finance leases. The Investment Company Act may limit our and our subsidiaries’ ability to enter into financing leases and engage in other types of financial activity because less than 40% of the value of our and our subsidiaries’ total assets (exclusive of U.S. government securities and cash items) on an unconsolidated basis can consist of “investment securities.”
If we or any of our subsidiaries were required to register as an investment company under the Investment Company Act, the registered entity would become subject to substantial regulation that would significantly change our operations, and we would not be able to conduct our business as described in this report. We have not obtained a formal determination from the SEC as to our status under the Investment Company Act and, consequently, any violation of the Investment Company Act would subject us to material adverse consequences.
Risks Related to Our Manager
We are dependent on our Manager and other key personnel at Fortress and may not find suitable replacements if our Manager terminates the Management Agreement or if other key personnel depart.
Our officers and other individuals who perform services for us (other than Jefferson and CMQR employees) are employees of our Manager or other Fortress entities. We are completely reliant on our Manager, which has significant discretion as to the implementation of our operating policies and strategies, to conduct our business. We are subject to the risk that our Manager will terminate the Management Agreement and that we will not be able to find a suitable replacement for our Manager in a timely manner, at a reasonable cost, or at all. Furthermore, we are dependent on the services of certain key employees of our Manager and certain key employees of Fortress entities whose compensation is partially or entirely dependent upon the amount of management fees earned by our Manager or the incentive allocations distributed to the General Partner and whose continued service is not guaranteed, and the loss of such personnel or services could materially adversely affect our operations. We do not have key man insurance for any of the personnel of the Manager or other Fortress entities that are key to us. An inability to find a suitable replacement for any departing employee of our Manager or Fortress entities on a timely basis could materially adversely affect our ability to operate and grow our business.
In addition, our Manager may assign our Management Agreement to an entity whose business and operations are managed or supervised by Mr. Wesley R. Edens, who is a principal and a Co-Chairman of the board of directors of Fortress, an affiliate of our Manager, and a member of the management committee of Fortress since co-founding Fortress in May 1998. In the event of any such assignment to a non-affiliate of Fortress, the functions currently performed by our Manager’s current personnel may be performed by others. We can give you no assurance that such personnel would manage our operations in the same manner as our Manager currently does, and the failure by the personnel of any such entity to acquire assets generating attractive risk-adjusted returns could have a material adverse effect on our business, financial condition, results of operations and cash flows.
On December 27, 2017, SoftBank announced that it completed the SoftBank Merger. In connection with the SoftBank Merger, Fortress will operate within SoftBank as an independent business headquartered in New York. While Fortress’s senior
24
investment professionals are expected to remain in place, including those individuals who perform services for us, there can be no assurance that the SoftBank Merger will not have an impact on us or our relationship with the Manager.
There are conflicts of interest in our relationship with our Manager.
Our Management Agreement, the Partnership Agreement and our operating agreement were negotiated prior to our IPO and among affiliated parties, and their terms, including fees payable, may not be as favorable to us as if they had been negotiated after our IPO with an unaffiliated third-party.
There are conflicts of interest inherent in our relationship with our Manager insofar as our Manager and its affiliates - including investment funds, private investment funds, or businesses managed by our Manager, including Seacastle Ships Holdings Inc., Trac Intermodal and Florida East Coast Railway, L.L.C. - invest in transportation and transportation-related infrastructure assets and whose investment objectives overlap with our asset acquisition objectives. Certain opportunities appropriate for us may also be appropriate for one or more of these other investment vehicles. Certain members of our board of directors and employees of our Manager who are our officers also serve as officers and/or directors of these other entities. For example, we have some of the same directors and officers as Seacastle Ships Holdings Inc. and Trac Intermodal. Although we have the same Manager, we may compete with entities affiliated with our Manager or Fortress, including Seacastle Ships Holdings Inc. and Trac Intermodal, for certain target assets. From time to time, affiliates of Fortress focus on investments in assets with a similar profile as our target assets that we may seek to acquire. These affiliates may have meaningful purchasing capacity, which may change over time depending upon a variety of factors, including, but not limited to, available equity capital and debt financing, market conditions and cash on hand. Fortress has multiple existing and planned funds focused on investing in one or more of our target sectors, each with significant current or expected capital commitments. We may co-invest with these funds in transportation and transportation-related infrastructure assets. Fortress funds generally have a fee structure similar to ours, but the fees actually paid will vary depending on the size, terms and performance of each fund.
Our Management Agreement generally does not limit or restrict our Manager or its affiliates from engaging in any business or managing other pooled investment vehicles that invest in assets that meet our asset acquisition objectives. Our Manager intends to engage in additional transportation and infrastructure related management and transportation, infrastructure and other investment opportunities in the future, which may compete with us for investments or result in a change in our current investment strategy. In addition, our operating agreement provides that if Fortress or an affiliate or any of their officers, directors or employees acquire knowledge of a potential transaction that could be a corporate opportunity, they have no duty, to the fullest extent permitted by law, to offer such corporate opportunity to us, our shareholders or our affiliates. In the event that any of our directors and officers who is also a director, officer or employee of Fortress or its affiliates acquires knowledge of a corporate opportunity or is offered a corporate opportunity, provided that this knowledge was not acquired solely in such person’s capacity as a director or officer of FTAI and such person acts in good faith, then to the fullest extent permitted by law such person is deemed to have fully satisfied such person’s fiduciary duties owed to us and is not liable to us if Fortress or its affiliates pursues or acquires the corporate opportunity or if such person did not present the corporate opportunity to us.
The ability of our Manager and its officers and employees to engage in other business activities, subject to the terms of our Management Agreement, may reduce the amount of time our Manager, its officers or other employees spend managing us. In addition, we may engage (subject to our strategy) in material transactions with our Manager or another entity managed by our Manager or one of its affiliates, including Seacastle Ships Holdings Inc., Trac Intermodal and Florida East Coast Railway, L.L.C., which may include, but are not limited to, certain acquisitions, financing arrangements, purchases of debt, co-investments, consumer loans, servicing advances and other assets that present an actual, potential or perceived conflict of interest. Our board of directors adopted a policy regarding the approval of any “related person transactions” pursuant to which certain of the material transactions described above may require disclosure to, and approval by, the independent members of our board of directors. Actual, potential or perceived conflicts have given, and may in the future give, rise to investor dissatisfaction, litigation or regulatory inquiries or enforcement actions. Appropriately dealing with conflicts of interest is complex and difficult, and our reputation could be damaged if we fail, or appear to fail, to deal appropriately with one or more potential, actual or perceived conflicts of interest. Regulatory scrutiny of, or litigation in connection with, conflicts of interest could have a material adverse effect on our reputation, which could materially adversely affect our business in a number of ways, including causing an inability to raise additional funds, a reluctance of counterparties to do business with us, a decrease in the prices of our equity securities and a resulting increased risk of litigation and regulatory enforcement actions.
The structure of our Manager’s and the General Partner’s compensation arrangements may have unintended consequences for us. We have agreed to pay our Manager a management fee and the General Partner is entitled to receive incentive allocations from Holdco that are each based on different measures of performance. Consequently, there may be conflicts in the incentives of our Manager to generate attractive risk-adjusted returns for us. In addition, because the General Partner and our Manager are both affiliates of Fortress, the Income Incentive Allocation paid to the General Partner may cause our Manager to place undue emphasis on the maximization of earnings, including through the use of leverage, at the expense of other objectives, such as preservation of capital, to achieve higher incentive allocations. Investments with higher yield potential are generally riskier or more speculative than investments with lower yield potential. This could result in increased risk to the value of our portfolio of assets and our common shares.
25
Our directors have approved a broad asset acquisition strategy for our Manager and do not approve each acquisition we make at the direction of our Manager. In addition, we may change our strategy without a shareholder vote, which may result in our acquiring assets that are different, riskier or less profitable than our current assets.
Our Manager is authorized to follow a broad asset acquisition strategy. We may pursue other types of acquisitions as market conditions evolve. Our Manager makes decisions about our investments in accordance with broad investment guidelines adopted by our board of directors. Accordingly, we may, without a shareholder vote, change our target sectors and acquire a variety of assets that differ from, and are possibly riskier than, our current asset portfolio. Consequently, our Manager has great latitude in determining the types and categories of assets it may decide are proper investments for us, including the latitude to invest in types and categories of assets that may differ from those in our existing portfolio. Our directors will periodically review our strategy and our portfolio of assets. However, our board does not review or pre-approve each proposed acquisition or our related financing arrangements. In addition, in conducting periodic reviews, the directors rely primarily on information provided to them by our Manager. Furthermore, transactions entered into by our Manager may be difficult or impossible to reverse by the time they are reviewed by the directors even if the transactions contravene the terms of the Management Agreement. In addition, we may change our asset acquisition strategy, including our target asset classes, without a shareholder vote.
Our asset acquisition strategy may evolve in light of existing market conditions and investment opportunities, and this evolution may involve additional risks depending upon the nature of the assets we target and our ability to finance such assets on a short or long-term basis. Opportunities that present unattractive risk-return profiles relative to other available opportunities under particular market conditions may become relatively attractive under changed market conditions and changes in market conditions may therefore result in changes in the assets we target. Decisions to make acquisitions in new asset categories present risks that may be difficult for us to adequately assess and could therefore reduce or eliminate our ability to pay dividends on our common shares or have adverse effects on our liquidity or financial condition. A change in our asset acquisition strategy may also increase our exposure to interest rate, foreign currency or credit market fluctuations. In addition, a change in our asset acquisition strategy may increase our use of non-match-funded financing, increase the guarantee obligations we agree to incur or increase the number of transactions we enter into with affiliates. Our failure to accurately assess the risks inherent in new asset categories or the financing risks associated with such assets could adversely affect our results of operations and our financial condition.
Our Manager will not be liable to us for any acts or omissions performed in accordance with the Management Agreement, including with respect to the performance of our assets.
Pursuant to our Management Agreement, our Manager will not assume any responsibility other than to render the services called for thereunder in good faith and will not be responsible for any action of our board of directors in following or declining to follow its advice or recommendations. Our Manager, its members, managers, officers, employees, sub-advisers and any other person controlling or Manager, will not be liable to us or any of our subsidiaries, to our board of directors, or our or any subsidiary’s shareholders or partners for any acts or omissions by our Manager, its members, managers, officers, employees, sub-advisers and any other person controlling or Manager, except liability to the Company, our shareholders, directors, officers and employees and persons controlling us, by reason of acts constituting bad faith, willful misconduct, gross negligence or reckless disregard of our Manager’s duties under our Management Agreement. We will, to the full extent lawful, reimburse, indemnify and hold our Manager, its members, managers, officers and employees, sub-advisers and each other person, if any, controlling our Manager harmless of and from any and all expenses, losses, damages, liabilities, demands, charges and claims of any nature whatsoever (including attorneys’ fees) in respect of or arising from any acts or omissions of an indemnified party made in good faith in the performance of our Manager’s duties under our Management Agreement and not constituting such indemnified party’s bad faith, willful misconduct, gross negligence or reckless disregard of our Manager’s duties under our Management Agreement.
Our Manager’s due diligence of potential asset acquisitions or other transactions may not identify all pertinent risks, which could materially affect our business, financial condition, liquidity and results of operations.
Our Manager intends to conduct due diligence with respect to each asset acquisition opportunity or other transaction it pursues. It is possible, however, that our Manager’s due diligence processes will not uncover all relevant facts, particularly with respect to any assets we acquire from third parties. In these cases, our Manager may be given limited access to information about the asset and will rely on information provided by the seller of the asset. In addition, if asset acquisition opportunities are scarce, the process for selecting bidders is competitive, or the timeframe in which we are required to complete diligence is short, our ability to conduct a due diligence investigation may be limited, and we would be required to make decisions based upon a less thorough diligence process than would otherwise be the case. Accordingly, transactions that initially appear to be viable may prove not to be over time, due to the limitations of the due diligence process or other factors.
Risks Related to Taxation
Shareholders may be subject to U.S. federal income tax on their share of our taxable income, regardless of whether they receive any cash dividends from us.
So long as we would not be required to register as an investment company under the Investment Company Act of 1940 if we were a U.S. Corporation and 90% of our gross income for each taxable year constitutes “qualifying income” within the meaning of the Internal Revenue Code of 1986, as amended (the “Code”), on a continuing basis, FTAI will be treated, for U.S. federal income tax purposes, as a partnership and not as an association or publicly traded partnership taxable as a corporation. Shareholders may be subject to U.S. federal, state, local and possibly, in some cases, non-U.S. income taxation on their allocable share of our items of income, gain, loss, deduction and credit (including our allocable share of those items of Holdco or any other entity in which we invest that is treated as a partnership or is otherwise subject to tax on a flow through basis) for each of our taxable years ending
26
with or within their taxable year, regardless of whether they receive cash dividends from us. Shareholders may not receive cash dividends equal to their allocable share of our net taxable income or even the tax liability that results from that income.
In addition, certain of our holdings, including holdings, if any, in a Controlled Foreign Corporation (“CFC”) or a Passive Foreign Investment Company (“PFIC”), may produce taxable income prior to our receipt of cash relating to such income, and shareholders subject to U.S. federal income tax will be required to take such income into account in determining their taxable income.
New U.S. tax legislation could adversely affect us and our shareholders.
On December 22, 2017, legislation referred to as the “Tax Cuts and Jobs Act” (the “TCJA”) was signed into law. The TCJA is generally effective for taxable years beginning after December 31, 2017. The TCJA includes significant amendments to the Code, including amendments that significantly change the taxation of individuals and business entities, including the taxation of offshore earnings and the deductibility of interest. Some of the amendments could adversely affect our business and financial condition and the value of our common shares.
Although we are currently evaluating the impact of the TCJA on our business, significant uncertainty exists with respect to how the TCJA will affect our business. Some of this uncertainty will not be resolved until clarifying Treasury regulations are promulgated or other relevant authoritative guidance is published.
Prospective investors should consult their tax advisors about the TCJA and its potential impact before investing in our common shares.
Under the TCJA, shareholders that are Non-U.S. Holders (defined below) could be subject to U.S. federal income tax, including a 10% withholding tax, on the disposition of our common shares.
If the Internal Revenue Service (the “IRS”) were to determine that we, Holdco, or any other entity in which we invest that is subject to tax on a flow-through basis, is engaged in a U.S. trade or business for U.S. federal income tax purposes, any gain recognized by a foreign transferor on the sale, exchange or other disposition of our common shares would generally be treated as “effectively connected” with such trade or business to the extent it does not exceed the effectively connected gain that would be allocable to the transferor if we sold all of our assets at their fair market value as of the date of the transferor’s disposition. Under the TCJA, any such gain that is treated as effectively connected will generally be subject to U.S. federal income tax. In addition, the transferee of the common shares or the applicable withholding agent would be required to deduct and withhold a tax equal to 10% of the amount realized by the transferor on the disposition, which would include an allocable portion of our liabilities and would therefore generally exceed the amount of transferred cash received by transferor in the disposition, unless the transferor provides an IRS Form W-9 or an affidavit stating the transferor’s taxpayer identification number and that the transferor is not a foreign person. If the transferee fails to properly withhold such tax, we would be required to deduct and withhold from distributions to the transferee a tax in an amount equal to the amount the transferee failed to withhold, plus interest. Although we do not believe that we are currently engaged in a U.S. trade or business, we are not required to manage our operations in a manner that is intended to avoid the conduct of a U.S. trade or business.
The withholding requirements with respect to the disposition of an interest in a publicly traded partnership are currently suspended and will remain suspended until Treasury regulations are promulgated or other relevant authoritative guidance is issued. Future guidance on the implementation of these requirements will be applicable on a prospective basis.
Tax gain or loss on a sale or other disposition of our common shares could be more or less than expected.
If a sale of our common shares by a shareholder is taxable in the United States, the shareholder will recognize gain or loss equal to the difference between the amount realized by such shareholder on such sale and such shareholder’s adjusted tax basis in those shares. Prior distributions to such shareholder in excess of the total net taxable income allocated to such shareholder, which will have decreased such shareholder’s adjusted tax basis in its shares, will effectively increase any gain recognized by such shareholder if the shares are sold at a price greater than such shareholder’s adjusted tax basis in those shares, even if the price is less than their original cost to such shareholder. A portion of the amount realized, whether or not representing gain, may be treated as ordinary income to such shareholder.
Our ability to make distributions depends on our receiving sufficient cash distributions from our subsidiaries, and we cannot assure our shareholders that we will be able to make cash distributions to them in amounts that are sufficient to fund their tax liabilities.
Our subsidiaries may be subject to local taxes in each of the relevant territories and jurisdictions in which they operate, including taxes on income, profits or gains and withholding taxes. As a result, our funds available for distribution are indirectly reduced by such taxes, and the post-tax return to our shareholders is similarly reduced by such taxes.
In general, a shareholder that is subject to U.S. federal income tax must include in income its allocable share of FTAI’s items of income, gain, loss, deduction, and credit (including, so long as FTAI is treated as a partnership for U.S. federal income tax purposes, FTAI’s allocable share of those items of Holdco and any pass-through subsidiaries of Holdco) for each of our taxable years ending with or within such shareholder’s taxable year. However, the cash distributed to a shareholder may not be sufficient to pay the full amount of such shareholder’s tax liability in respect of its investment in us, because each shareholder’s tax liability depends on such shareholder’s particular tax situation and the tax treatment of our underlying activities or assets.
27
If we are treated as a corporation for U.S. federal income tax purposes, the value of the shares could be adversely affected.
We have not requested, and do not plan to request, a ruling from the IRS on our treatment as a partnership for U.S. federal income tax purposes, or on any other matter affecting us. As of the date of the consummation of our initial public offering, under then current law and assuming full compliance with the terms of our operating agreement (and other relevant documents) and based upon factual statements and representations made by us, our outside counsel opined that we will be treated as a partnership, and not as an association or a publicly traded partnership taxable as a corporation for U.S. federal income tax purposes. However, opinions of counsel are not binding upon the IRS or any court, and the IRS may challenge this conclusion and a court may sustain such a challenge. The factual representations made by us upon which our outside counsel relied relate to our organization, operation, assets, activities, income, and present and future conduct of our operations. In general, if an entity that would otherwise be classified as a partnership for U.S. federal income tax purposes is a “publicly traded partnership” (as defined in the Code) it will be nonetheless treated as a corporation for U.S. federal income tax purposes, unless the exception described below, and upon which we intend to rely, applies. A publicly traded partnership will, however, be treated as a partnership, and not as a corporation for U.S. federal income tax purposes, so long as 90% or more of its gross income for each taxable year constitutes “qualifying income” within the meaning of the Code and it is not required to register as an investment company under the Investment Company Act of 1940. We refer to this exception as the “Qualifying Income Exception.”
Qualifying income generally includes dividends, interest, capital gains from the sale or other disposition of stocks and securities and certain other forms of investment income. We currently expect that a substantial portion of our income will constitute either “Subpart F” income (defined below) derived from CFCs or QEF Inclusions (as defined below). While we believe that such income constitutes qualifying income, no assurance can be given that the IRS will agree with such position. We also believe that our return from investments will include interest, dividends, capital gains and other types of qualifying income, but no assurance can be given as to the types of income that will be earned in any given year.
If we fail to satisfy the Qualifying Income Exception, we would be required to pay U.S. federal income tax at regular corporate rates on our worldwide income. Although the TCJA reduced regular corporate rates from 35% to 21%, our failure to qualify as a partnership for U.S. federal income tax purposes could nevertheless adversely affect our business, operating results and financial condition. In addition, we would likely be liable for state and local income and/or franchise taxes on such income. Dividends to shareholders would constitute qualified dividend income taxable to such shareholders to the extent of our earnings and profits, and the payment of these dividends would not be deductible by us. Taxation of us as a publicly traded partnership taxable as a corporation could result in a material adverse effect on our cash flow and the after-tax returns for shareholders and thus could result in a substantial reduction in the value of our common shares.
Shareholders that are not U.S. persons should also anticipate being required to file U.S. tax returns and may be required to pay U.S. tax solely on account of owning our common shares.
In light of our intended investment activities, we may be, or may become, engaged in a U.S. trade or business for U.S. federal income tax purposes, in which case some portion of our income would be treated as effectively connected income with respect to non-U.S. persons. Moreover, we anticipate that, in the future, we will sell interests in U.S. real holding property corporations (each a “USRPHC”) and therefore be deemed to be engaged in a U.S. trade or business for that reason at such time. If we were to realize gain from the sale or other disposition of a U.S. real property interest (including a USRPHC) or were otherwise engaged in a U.S. trade or business, non-U.S. persons generally would be required to file U.S. federal income tax returns and would be subject to U.S. federal withholding tax on their allocable share of the effectively connected income on gain at the highest marginal U.S. federal income tax rates applicable to ordinary income. Non-U.S. persons that are corporations may also be subject to a branch profits tax on their allocable share of such income. Non-U.S. persons should anticipate being required to file U.S. tax returns and may be required to pay U.S. tax solely on account of owning our common shares.
Non-U.S. persons that hold (or are deemed to hold) more than 5% of our common shares (or held, or were deemed to hold, more than 5% of our common shares) may be subject to U.S. federal income tax upon the disposition of some or all their common shares.
If non-U.S. persons held more than 5% of our common shares at any time during the 5 year period preceding such non-U.S. person’s disposition of our common shares, and we were considered a USRPHC (determined as if we were a U.S. corporation) at any time during such 5 year period because of our current or previous ownership of U.S. real property interests above a certain threshold, such non-U.S. persons may be subject to U.S. tax on such disposition of our common shares (and may have a U.S. tax return filing obligation).
Tax-exempt shareholders may face certain adverse U.S. tax consequences from owning our common shares.
We are not required to manage our operations in a manner that would minimize the likelihood of generating income that would constitute “unrelated business taxable income” (“UBTI”) to the extent allocated to a tax-exempt shareholder. Although we expect to invest through subsidiaries that are treated as corporations for U.S. federal income tax purposes and such corporate investments would generally not result in an allocation of UBTI to a shareholder on account of the activities of those subsidiaries, we may not invest through corporate subsidiaries in all cases. Moreover, UBTI includes income attributable to debt-financed property and we are not prohibited from debt financing our investments (and we have incurred such indebtedness), including investments in subsidiaries. Furthermore, we are not prohibited from being (or causing a subsidiary to be) a guarantor of loans made to a subsidiary. If we (or certain of our subsidiaries) were treated as the borrower for U.S. tax purposes on account of those guarantees, some or all of our investments could be considered debt-financed property. The potential for income to be characterized as UBTI
28
could make our common shares an unsuitable investment for a tax-exempt entity. Tax-exempt shareholders are urged to consult their tax advisors regarding the tax consequences of an investment in common shares.
We may hold or acquire certain investments through an entity classified as a PFIC or CFC for U.S. federal income tax purposes.
Certain of our investments may be in non-U.S. corporations or may be acquired through a non-U.S. subsidiary that would be classified as a corporation for U.S. federal income tax purposes. Such an entity may be a PFIC or a CFC for U.S. federal income tax purposes. U.S. Holders indirectly owning an interest in a PFIC or a CFC may experience adverse U.S. tax consequences.
If substantially all of the U.S. source rental income derived from aircraft or ships used to transport passengers or cargo in international traffic (“U.S. source international transport rental income”) of any of our non-U.S. corporate subsidiaries is attributable to activities of personnel based in the United States, such subsidiary could be subject to U.S. federal income tax on a net income basis at regular tax rates, rather than at a rate of 4% on gross income, which would adversely affect our business and result in decreased funds available for distribution to our shareholders.
We expect that the U.S. source international transport rental income of our non-U.S. subsidiaries generally will be subject to U.S. federal income tax, on a gross income basis, at a rate of not in excess of 4% as provided in Section 887 of the Code. If, contrary to expectations, any of our non-U.S. subsidiaries that is treated as a corporation for U.S. federal income tax purposes did not comply with certain administrative guidelines of the IRS, such that 90% or more of such subsidiary’s U.S. source international transport rental income were attributable to the activities of personnel based in the United States (in the case of bareboat leases) or from “regularly scheduled transportation” as defined in such administrative guidelines (in the case of time-charter leases), such subsidiary’s U.S. source rental income would be treated as income effectively connected with a trade or business in the United States. In such case, such subsidiary’s U.S. source international transport rental income would be subject to U.S. federal income tax at a maximum rate of 21% for taxable years beginning after December 31, 2017. In addition, such subsidiary would be subject to the U.S. federal branch profits tax on its effectively connected earnings and profits at a rate of 30%. The imposition of such taxes would adversely affect our business and would result in decreased funds available for distribution to our shareholders.
Our subsidiaries may become subject to unanticipated tax liabilities that may have a material adverse effect on our results of operations.
Our subsidiaries may be subject to income, withholding or other taxes in certain non-U.S. jurisdictions by reason of their activities and operations, where their assets are used, or where the lessees of their assets (or others in possession of their assets) are located, and it is also possible that taxing authorities in any such jurisdictions could assert that our subsidiaries are subject to greater taxation than we currently anticipate. For example, a portion of certain of our non-U.S. corporate subsidiaries’ income is treated as effectively connected with a U.S. trade or business, and is accordingly subject to U.S. federal income tax. It is possible that the IRS could assert that a greater portion of any such non-U.S. subsidiaries’ income is effectively connected income that should be subject to U.S. federal income tax.
Our structure involves complex provisions of U.S. federal income tax law for which no clear precedent or authority may be available. Our structure is also subject to potential legislative, judicial or administrative change and differing interpretations, possibly on a retroactive basis.
The U.S. federal income tax treatment of our shareholders depends in some instances on determinations of fact and interpretations of complex provisions of U.S. federal income tax law for which no clear precedent or authority may be available. Prospective investors should be aware that the U.S. federal income tax rules are constantly under review by persons involved in the legislative process, the IRS, and the U.S. Treasury Department, frequently resulting in revised interpretations of established concepts, statutory changes, revisions to regulations and other modifications and interpretations. The IRS pays close attention to the proper application of tax laws to partnerships. The present U.S. federal income tax treatment of an investment in our common shares may be modified by administrative, legislative or judicial interpretation at any time, possibly on a retroactive basis, and any such action may affect our investments and commitments that were previously made, and could adversely affect the value of our shares or cause us to change the way we conduct our business.
Our organizational documents and agreements permit the board of directors to modify our operating agreement from time to time, without the consent of shareholders, in order to address certain changes in Treasury regulations, legislation or interpretation. In some circumstances, such revisions could have a material adverse impact on some or all shareholders. Moreover, we will apply certain assumptions and conventions in an attempt to comply with applicable rules and to report income, gain, deduction, loss and credit to shareholders in a manner that reflects such shareholders’ beneficial ownership of partnership items, taking into account variation in ownership interests during each taxable year because of trading activity. However, these assumptions and conventions may not be in compliance with all aspects of applicable tax requirements. It is possible that the IRS will assert successfully that the conventions and assumptions used by us do not satisfy the technical requirements of the Code and/or Treasury regulations and could require that items of income, gain, deduction, loss or credit, including interest deductions, be adjusted, reallocated, or disallowed, in a manner that adversely affects shareholders.
29
We could incur a significant tax liability if the IRS successfully asserts that the “anti-stapling” rules apply to our investments in our non-U.S. and U.S. subsidiaries, which would adversely affect our business and result in decreased funds available for distribution to our shareholders.
If we were subject to the “anti-stapling” rules of Section 269B of the Code, we would incur a significant tax liability as a result of owning more than 50% of the value of both U.S. and non-U.S. corporate subsidiaries, whose equity interests constitute “stapled interests” that may only be transferred together. If the “anti-stapling” rules applied, our non-U.S. corporate subsidiaries that are treated as corporations for U.S. federal income tax purposes would be treated as U.S. corporations, which would cause those entities to be subject to U.S. federal corporate income tax on their worldwide income. Because we intend to separately manage and operate our non-U.S. and U.S. corporate subsidiaries and structure their business activities in a manner that would allow us to dispose of such subsidiaries separately, we do not expect that the “anti-stapling” rules will apply. However, there can be no assurance that the IRS would not successfully assert a contrary position, which would adversely affect our business and result in decreased funds available for distribution to our shareholders.
We cannot match transferors and transferees of our shares, and we have therefore adopted certain income tax accounting positions that may not conform with all aspects of applicable tax requirements. The IRS may challenge this treatment, which could adversely affect the value of our shares.
Because we cannot match transferors and transferees of our shares, we have adopted depreciation, amortization and other tax accounting positions that may not conform with all aspects of existing Treasury regulations. A successful IRS challenge to those positions could adversely affect the amount of tax benefits available to our shareholders. It also could affect the timing of these tax benefits or the amount of gain on the sale of our common shares and could have a negative impact on the value of our common shares or result in audits of and adjustments to our shareholders’ tax returns.
We generally allocate items of income, gain, loss, and deduction using a monthly or other convention, whereby any such items we recognize in a given month are allocated to our shareholders as of a specified date of such month. As a result, if a shareholder transfers its common shares, it might be allocated income, gain, loss, and deduction realized by us after the date of the transfer. Similarly, if a shareholder acquires additional common shares, it might be allocated income, gain, loss, and deduction realized by us prior to its ownership of such common shares. Consequently, our shareholders may recognize income in excess of cash distributions received from us, and any income so included by a shareholder would increase the basis such shareholder has in its common shares and would offset any gain (or increase the amount of loss) realized by such shareholder on a subsequent disposition of its common shares.
Recently enacted legislation regarding U.S. federal income tax liability arising from IRS audits could adversely affect our shareholders.
For taxable years beginning on or after January 1, 2018, we will be liable for U.S. federal income tax liability arising from an IRS audit, unless certain alternative methods are available and we elect to use them. Under the new rules, it is possible that certain shareholders or we may be liable for taxes attributable to adjustments to our taxable income with respect to tax years that closed before such shareholders owned our shares. Accordingly, this new legislation may adversely affect certain shareholders in certain cases. This differs from the prior rules, which generally provided that tax adjustments only affect the persons who were shareholders in the tax year in which the item was reported on our tax return. The changes created by the new legislation are uncertain and in many respects depend on the promulgation of future regulations or other guidance by the U.S. Treasury Department or the IRS.
Risks Related to Our Common Shares
The market price and trading volume of our common shares may be volatile, which could result in rapid and substantial losses for our shareholders.
The market price of our common shares may be highly volatile and could be subject to wide fluctuations. In addition, the trading volume in our common shares may fluctuate and cause significant price variations to occur. If the market price of our common shares declines significantly, you may be unable to resell your shares at or above your purchase price, if at all. The market price of our common shares may fluctuate or decline significantly in the future. Some of the factors that could negatively affect our share price or result in fluctuations in the price or trading volume of our common shares include:
• | a shift in our investor base; |
• | our quarterly or annual earnings, or those of other comparable companies; |
• | actual or anticipated fluctuations in our operating results; |
• | changes in accounting standards, policies, guidance, interpretations or principles; |
• | announcements by us or our competitors of significant investments, acquisitions or dispositions; |
• | the failure of securities analysts to cover our common shares; |
• | changes in earnings estimates by securities analysts or our ability to meet those estimates; |
• | the operating and share price performance of other comparable companies; |
• | overall market fluctuations; |
30
• | general economic conditions; and |
• | developments in the markets and market sectors in which we participate. |
Stock markets in the United States have experienced extreme price and volume fluctuations. Market fluctuations, as well as general political and economic conditions such as acts of terrorism, prolonged economic uncertainty, a recession or interest rate or currency rate fluctuations, could adversely affect the market price of our common shares.
Failure to maintain effective internal control over financial reporting in accordance with Section 404 of the Sarbanes-Oxley Act of 2002 could have a material adverse effect on our business and stock price.
As a public company, we are required to maintain effective internal control over financial reporting in accordance with Section 404 of the Sarbanes-Oxley Act of 2002. Internal control over financial reporting is complex and may be revised over time to adapt to changes in our business, or changes in applicable accounting rules. We have made investments through joint ventures, such as our investment in consumer loans, and accounting for such investments can increase the complexity of maintaining effective internal control over financial reporting. We cannot assure you that our internal control over financial reporting will be effective in the future or that a material weakness will not be discovered with respect to a prior period for which we had previously believed that our internal control over financial reporting was effective. If we are not able to maintain or document effective internal control over financial reporting, our independent registered public accounting firm will not be able to certify as to the effectiveness of our internal control over financial reporting. Matters impacting our internal control over financial reporting may cause us to be unable to report our financial information on a timely basis, or may cause us to restate previously issued financial information, and thereby subject us to adverse regulatory consequences, including sanctions or investigations by the SEC, or violations of applicable stock exchange listing rules. There could also be a negative reaction in the financial markets due to a loss of investor confidence in us and the reliability of our financial statements. Confidence in the reliability of our financial statements is also likely to suffer if we or our independent registered public accounting firm reports a material weakness in the effectiveness of our internal control over financial reporting. This could materially adversely affect us by, for example, leading to a decline in our share price and impairing our ability to raise capital.
Your percentage ownership in us may be diluted in the future.
Your percentage ownership in FTAI may be diluted in the future because of equity awards that may be granted to our Manager pursuant to our Management Agreement. Upon the successful completion of an offering of our common shares or other equity securities (including securities issued as consideration in an acquisition), we will grant our Manager options to purchase common shares in an amount equal to 10% of the number of common shares being sold in such offering (or if the issuance relates to equity securities other than our common shares, options to purchase a number of common shares equal to 10% of the gross capital raised in the equity issuance divided by the fair market value of a common share as of the date of the issuance), with an exercise price equal to the offering price per share paid by the public or other ultimate purchaser or attributed to such securities in connection with an acquisition (or the fair market value of a common share as of the date of the equity issuance if it relates to equity securities other than our common shares), and any such offering or the exercise of the option in connection with such offering would cause dilution.
Our board of directors has adopted the Fortress Transportation and Infrastructure Investors Nonqualified Stock Option and Incentive Award Plan (the “Incentive Plan”) which provides for the grant of equity-based awards, including restricted stock, stock options, stock appreciation rights, performance awards, restricted stock units, tandem awards and other equity-based and non-equity based awards, in each case to our Manager, to the directors, officers, employees, service providers, consultants and advisors of our Manager who perform services for us, and to our directors, officers, employees, service providers, consultants and advisors. We have initially reserved 30,000,000 common shares for issuance under the Incentive Plan; on the date of any equity issuance by the Company during the ten-year term of the Incentive Plan (including in respect of securities issued as consideration in an acquisition), the maximum number of shares available for issuance under the Plan will be increased to include an additional number of common shares equal to ten percent (10%) of either (i) the total number of common shares newly issued by the Company in such equity issuance or (ii) if such equity issuance relates to equity securities other than our common shares, a number of our common shares equal to 10% of (i) the gross capital raised in an equity issuance of equity securities other than common shares during the ten-year term of the Incentive Plan, divided by (ii) the fair market value of a common share as of the date of such equity issuance.
Sales or issuances of shares of our common shares could adversely affect the market price of our common shares.
Sales of substantial amounts of shares of our common shares in the public market, or the perception that such sales might occur, could adversely affect the market price of our common shares. The issuance of our common shares in connection with property, portfolio or business acquisitions or the exercise of outstanding options or otherwise could also have an adverse effect on the market price of our common shares.
The incurrence or issuance of debt, which ranks senior to our common shares upon our liquidation, and future issuances of equity or equity-related securities, which would dilute the holdings of our existing common shareholders and may be senior to our common shares for the purposes of making distributions, periodically or upon liquidation, may negatively affect the market price of our common shares.
We have incurred and may in the future incur or issue debt or issue equity or equity-related securities to finance our operations. Upon our liquidation, lenders and holders of our debt and holders of our preferred shares (if any) would receive a distribution of our available assets before common shareholders. Any future incurrence or issuance of debt would increase our interest cost and could
31
adversely affect our results of operations and cash flows. We are not required to offer any additional equity securities to existing common shareholders on a preemptive basis. Therefore, additional issuances of common shares, directly or through convertible or exchangeable securities (including limited partnership interests in our operating partnership), warrants or options, will dilute the holdings of our existing common shareholders and such issuances, or the perception of such issuances, may reduce the market price of our common shares. Any preferred shares issued by us would likely have a preference on distribution payments, periodically or upon liquidation, which could eliminate or otherwise limit our ability to make distributions to common shareholders. Because our decision to incur or issue debt or issue equity or equity-related securities in the future will depend on market conditions and other factors beyond our control, we cannot predict or estimate the amount, timing, nature or success of our future capital raising efforts. Thus, common shareholders bear the risk that our future incurrence or issuance of debt or issuance of equity or equity-related securities will adversely affect the market price of our common shares.
Our determination of how much leverage to use to finance our acquisitions may adversely affect our return on our assets and may reduce funds available for distribution.
We utilize leverage to finance many of our asset acquisitions, which entitles certain lenders to cash flows prior to retaining a return on our assets. While our Manager targets using only what we believe to be reasonable leverage, our strategy does not limit the amount of leverage we may incur with respect to any specific asset. The return we are able to earn on our assets and funds available for distribution to our shareholders may be significantly reduced due to changes in market conditions, which may cause the cost of our financing to increase relative to the income that can be derived from our assets.
While we currently intend to pay regular quarterly dividends to our shareholders, we may change our dividend policy at any time.
Although we currently intend to pay regular quarterly dividends to holders of our common shares, we may change our dividend policy at any time. Our net cash provided by operating activities has been less than the amount of distributions to our shareholders. The declaration and payment of dividends to holders of our common shares will be at the discretion of our board of directors in accordance with applicable law after taking into account various factors, including actual results of operations, liquidity and financial condition, net cash provided by operating activities, restrictions imposed by applicable law, our taxable income, our operating expenses and other factors our board of directors deem relevant. Our long term goal is to maintain a payout ratio of between 50-60% of funds available for distribution, with remaining amounts used primarily to fund our future acquisitions and opportunities. There can be no assurance that we will continue to pay dividends in amounts or on a basis consistent with prior distributions to our investors, if at all. Because we are a holding company and have no direct operations, we will only be able to pay dividends from our available cash on hand and any funds we receive from our subsidiaries and our ability to receive distributions from our subsidiaries may be limited by the financing agreements to which they are subject. In addition, pursuant to the Partnership Agreement, the General Partner will be entitled to receive incentive allocations before any amounts are distributed by the Company based both on our consolidated net income and capital gains income in each fiscal quarter and for each fiscal year, respectively.
Anti-takeover provisions in our operating agreement and Delaware law could delay or prevent a change in control.
Provisions in our operating agreement may make it more difficult and expensive for a third party to acquire control of us even if a change of control would be beneficial to the interests of our shareholders. For example, our operating agreement provides for a staggered board, requires advance notice for proposals by shareholders and nominations, places limitations on convening shareholder meetings, and authorizes the issuance of preferred shares that could be issued by our board of directors to thwart a takeover attempt. In addition, certain provisions of Delaware law may delay or prevent a transaction that could cause a change in our control. The market price of our shares could be adversely affected to the extent that provisions of our operating agreement discourage potential takeover attempts that our shareholders may favor.
There are certain provisions in our operating agreement regarding exculpation and indemnification of our officers and directors that differ from the Delaware General Corporation Law (the “DGCL”) in a manner that may be less protective of the interests of our shareholders.
Our operating agreement provides that to the fullest extent permitted by applicable law our directors or officers will not be liable to us. Under the DGCL, a director or officer would be liable to us for (i) breach of duty of loyalty to us or our shareholders, (ii) intentional misconduct or knowing violations of the law that are not done in good faith, (iii) improper redemption of shares or declaration of dividend, or (iv) a transaction from which the director derived an improper personal benefit. In addition, our operating agreement provides that we indemnify our directors and officers for acts or omissions to the fullest extent provided by law. Under the DGCL, a corporation can only indemnify directors and officers for acts or omissions if the director or officer acted in good faith, in a manner he reasonably believed to be in the best interests of the corporation, and, in criminal action, if the officer or director had no reasonable cause to believe his conduct was unlawful. Accordingly, our operating agreement may be less protective of the interests of our shareholders, when compared to the DGCL, insofar as it relates to the exculpation and indemnification of our officers and directors.
32
As a public company, we incur costs and face increased demands on our management.
As a relatively new public company with shares listed on the NYSE, we need to comply with an extensive body of regulations, including certain provisions of the Sarbanes-Oxley Act, the Dodd-Frank Wall Street Reform and Consumer Protection Act, regulations of the SEC and requirements of the NYSE. These rules and regulations increase our legal and financial compliance costs and make some activities to our board of directors more time-consuming and costly. For example, as a result of becoming a public company, we have independent directors and board committees. In addition, we may incur additional costs associated with our public company reporting requirements and maintaining directors’ and officers’ liability insurance. Such additional costs may have a material adverse effect on our business, prospects, financial condition, results of operations and cash flows.
If securities or industry analysts do not publish research or reports about our business, or if they downgrade their recommendations regarding our common shares, our share price and trading volume could decline.
The trading market for our common shares are influenced by the research and reports that industry or securities analysts publish about us or our business. If any of the analysts who cover us downgrades our common units or publishes inaccurate or unfavorable research about our business, our common share price may decline. If analysts cease coverage of us or fail to regularly publish reports on us, we could lose visibility in the financial markets, which in turn could cause our common share price or trading volume to decline and our common shares to be less liquid.
Item 1B. Unresolved Staff Comments
We have no unresolved staff comments.
Item 2. Properties
An affiliate of our Manager leases principal executive offices at 1345 Avenue of the Americas, New York, NY 10105. We also lease office space from an affiliate of our Manager in Florida, Ireland, and Dubai. Our Railroad operating segment owns approximately 480 miles of rail lines, related corridor, and railyards in Maine, Vermont, Quebec, Canada, as well as leases 56 miles of rail lines, approximately 8,500 square feet of office space and approximately 20 acres of railroad facilities in Maine. Our Jefferson Terminal operating segment leases approximately 200 acres of property for its terminal facilities and leases approximately 9,300 square feet of office space in Texas and 300 square feet in Canada. In 2016, we acquired Repauno, located in New Jersey, which includes over 1,600 acres of land, riparian rights, rail tracks and a 186,000 barrel underground storage cavern. We are redeveloping the asset to be a multi-purpose, multi-modal deepwater port. In 2017, we acquired Long Ridge, located in Ohio, which is a 1,660 acre multi-modal port. Our Offshore operating segment leases a small office in Singapore. We believe that our office facilities and properties are suitable and adequate for our business as it is contemplated to be conducted.
Item 3. Legal Proceedings
We are and may become involved in legal proceedings, including but not limited to regulatory investigations and inquiries, in the ordinary course of our business. Although we are unable to predict with certainty the eventual outcome of any litigation, regulatory investigation or inquiry, in the opinion of management, we do not expect our current and any threatened legal proceedings to have a material adverse effect on our business, financial position or results of operations. Given the inherent unpredictability of these types of proceedings, however, it is possible that future adverse outcomes could have a material adverse effect on our financial results.
Item 4. Mine Safety Disclosures
Not applicable.
33
PART II
Item 5. Market for Registrant's Common Equity, Related Stockholder Matters and Issuer Purchases of Equity Securities
Our common shares began trading on the NYSE under the symbol “FTAI” on May 15, 2015, the date of the IPO. The following table sets forth, for the periods indicated during the years ended 2017 and 2016, the high and low sale price per common share as reported by the NYSE and the dividends per share we declared with respect to the periods indicated.
2017 | 2016 | ||||||||||||||||||||||
High | Low | Dividends Declared (1) | High | Low | Dividends Declared (1) | ||||||||||||||||||
First Quarter | $ | 15.91 | $ | 13.31 | $ | 0.33 | $ | 11.54 | $ | 8.65 | $ | 0.33 | |||||||||||
Second Quarter | $ | 16.70 | $ | 14.25 | $ | 0.33 | $ | 11.00 | $ | 8.92 | $ | 0.33 | |||||||||||
Third Quarter | $ | 18.41 | $ | 15.61 | $ | 0.33 | $ | 12.69 | $ | 8.95 | $ | 0.33 | |||||||||||
Fourth Quarter | $ | 20.08 | $ | 17.42 | $ | 0.33 | $ | 13.95 | $ | 11.35 | $ | 0.33 | |||||||||||
______________________________________________________________________________________
(1) Represents amounts our board of directors declared as dividends based on earnings and liquidity with respect to the specified periods. The actual declaration dates occurred in the following quarter.
Although we currently intend to continue to pay regular quarterly dividends to holders of our common shares, we may change our dividend policy at any time and no assurances can be given that any future dividends will be paid or, if paid, as to the amounts or timing. The declaration and payment of dividends to holders of our common shares will be at the discretion of our board of directors in accordance with applicable law after taking into account various factors, including actual results of operations, liquidity and financial condition, net cash provided by operating activities, restrictions imposed by applicable law, our taxable income, our operating expenses and other factors our board of directors deem relevant.
On February 27, 2018, our Board of Directors declared a cash dividend on our common shares of $0.33 per share for the quarter ended December 31, 2017, payable on March 20, 2018 to the holders of record on March 10, 2018.
On December 29, 2017, the closing sale price for our common shares, as reported on the NYSE, was $19.93. As of February 28, 2018, there were approximately eight record holders of our common shares. This figure does not reflect the beneficial ownership of shares held in nominee name.
Nonqualified Stock Option and Incentive Award Plan
In 2015, in connection with the IPO, the Company established a Nonqualified Stock Option and Incentive Award Plan (“Incentive Plan”) which provides for the ability to award equity compensation awards in the form of stock options, stock appreciation rights, restricted stock, and performance awards to eligible employees, consultants, directors, and other individuals who provide services to the Company, each as determined by the Compensation Committee of the Board of Directors. As of December 31, 2017, the Incentive Plan provides for the issuance of up to 30,000,000 shares.
The following table summarizes the total number of outstanding securities in the Plan and the number of securities remaining for future issuance, as well as the weighted average strike price of all outstanding securities as of December 31, 2017.
Equity Compensation Plan Information | ||||||||||
Plan category | Number of securities to be issued upon exercise of outstanding options, warrants, and rights | Weighted-average exercise price of outstanding options, warrants, and rights | Number of securities remaining available for future issuance under equity compensation plans (1) | |||||||
Equity compensation plans approved by security holders | 15,000 | $ | 16.98 | 29,985,000 | ||||||
Equity compensation plans not approved by security holders | — | — | — | |||||||
Total | 15,000 | 29,985,000 | ||||||||
______________________________________________________________________________________
(1) Excludes securities reflected in column “Number of securities to be issued upon exercise of outstanding options, warrants, and rights.”
34
Performance Graph
The following graph compares the cumulative total return for our shares (stock price change plus reinvested dividends) with the comparable return of three indices: S&P Mid Cap 400, Dow Jones US Transportation Services, and Alerian Index. The graph assumes an investment of $100 in the Company's shares on May 14, 2015 and in each of the indices on April 30, 2015, and that all dividends were reinvested. The past performance of our shares is not an indication of future performance.
COMPARISON OF 41 MONTH CUMULATIVE TOTAL RETURN*
Among Fortress Transportation & Infrastructure Investors LLC, the S&P Midcap 400 Index, the Dow Jones US Transportation Services Index and the Alerian Index
*$100 invested on 5/14/15 in stock or 4/30/15 in index, including reinvestment of dividends.
Fiscal year ending December 31.
Fiscal year ending December 31.
(in whole dollars) | ||||||||||||||||
Index | May 15, 2015 | December 31, 2015 | December 31, 2016 | December 31, 2017 | ||||||||||||
Fortress Transportation & Infrastructure Investors LLC | $ | 100.00 | $ | 68.91 | $ | 91.78 | $ | 148.90 | ||||||||
S&P Midcap 400 | $ | 100.00 | $ | 94.29 | $ | 113.85 | $ | 132.34 | ||||||||
Dow Jones US Transportation Services | $ | 100.00 | $ | 74.79 | $ | 94.62 | $ | 122.87 | ||||||||
Alerian Index | $ | 100.00 | $ | 72.09 | $ | 86.59 | $ | 83.21 | ||||||||
Item 6. Selected Financial Data
The selected historical financial information set forth below as of and for the years ended December 31, 2017, 2016, 2015, 2014 and 2013 has been derived from our audited historical consolidated financial statements.
35
The Company completed an IPO on May 20, 2015 in which Fortress Worldwide Transportation and Infrastructure Investors LP, Fortress Worldwide Transportation and Infrastructure Offshore LP, and Fortress Worldwide Transportation and Infrastructure Master GP LLP (collectively the "Initial Shareholders"), immediately prior to the consummation of the IPO, received shares in proportion to their respective ownership percentages. As a result, the Company has retrospectively presented the shares outstanding for all prior periods presented.
The information below should be read in conjunction with “Management's Discussion and Analysis of Financial Condition and Results of Operations,” included in Item 7 and the consolidated financial statements and notes thereto included in Item 8 in this Annual Report on Form 10-K.
Year Ended December 31, | |||||||||||||||||||
2017 | 2016 | 2015 | 2014 | 2013 | |||||||||||||||
(in thousands except share and per share data) | |||||||||||||||||||
Revenues | |||||||||||||||||||
Equipment leasing revenues | |||||||||||||||||||
Lease income | $ | 99,536 | $ | 69,736 | $ | 64,883 | $ | 27,681 | $ | 9,284 | |||||||||
Maintenance revenue | 65,651 | 28,697 | 17,286 | 5,964 | 2,242 | ||||||||||||||
Finance lease income | 1,536 | 2,723 | 8,747 | 10,013 | 7,781 | ||||||||||||||
Other revenue | 3,277 | 793 | 1,827 | 326 | 223 | ||||||||||||||
Total equipment leasing revenues | 170,000 | 101,949 | 92,743 | 43,984 | 19,530 | ||||||||||||||
Infrastructure revenues | |||||||||||||||||||
Lease income | 1,111 | 32 | 4,620 | 1,325 | — | ||||||||||||||
Rail revenues | 32,607 | 30,837 | 25,550 | 9,969 | — | ||||||||||||||
Terminal services revenues | 10,229 | 15,902 | 13,655 | 2,652 | — | ||||||||||||||
Other revenue | 3,712 | — | — | — | — | ||||||||||||||
Total infrastructure revenues | 47,659 | 46,771 | 43,825 | 13,946 | — | ||||||||||||||
Total revenues | 217,659 | 148,720 | 136,568 | 57,930 | 19,530 | ||||||||||||||
Expenses | |||||||||||||||||||
Operating expenses | 92,385 | 66,169 | 68,793 | 27,223 | 3,157 | ||||||||||||||
General and administrative | 14,570 | 12,314 | 7,568 | 2,007 | 805 | ||||||||||||||
Acquisition and transaction expenses | 7,306 | 6,316 | 5,683 | 11,450 | 260 | ||||||||||||||
Management fees and incentive allocation to affiliate | 15,732 | 16,742 | 15,018 | 5,463 | 2,211 | ||||||||||||||
Depreciation and amortization | 88,110 | 60,210 | 45,308 | 15,998 | 3,909 | ||||||||||||||
Interest expense | 38,827 | 18,957 | 19,311 | 5,872 | 2,816 | ||||||||||||||
Total expenses | 256,930 | 180,708 | 161,681 | 68,013 | 13,158 | ||||||||||||||
Other income (expense) | |||||||||||||||||||
Equity in (loss) earnings of unconsolidated entities | (1,601 | ) | (5,992 | ) | (6,956 | ) | 6,093 | 10,325 | |||||||||||
Gain on sale of assets, net | 18,281 | 5,941 | 3,419 | 7,576 | 8,559 | ||||||||||||||
Loss on extinguishment of debt | (2,456 | ) | (1,579 | ) | — | — | — | ||||||||||||
Asset impairment | — | (7,450 | ) | — | — | — | |||||||||||||
Interest income | 688 | 136 | 579 | 186 | 23 | ||||||||||||||
Other income | 3,073 | 602 | 26 | 20 | — | ||||||||||||||
Total other income (expense) | 17,985 | (8,342 | ) | (2,932 | ) | 13,875 | 18,907 | ||||||||||||
(Loss) income before income taxes | (21,286 | ) | (40,330 | ) | (28,045 | ) | 3,792 | 25,279 | |||||||||||
Provision for income taxes | 1,954 | 268 | 586 | 874 | — | ||||||||||||||
Net (loss) income | (23,240 | ) | (40,598 | ) | (28,631 | ) | 2,918 | 25,279 | |||||||||||
Less: Net (loss) income attributable to non-controlling interest in consolidated subsidiaries | (23,374 | ) | (20,534 | ) | (16,805 | ) | (4,862 | ) | 458 | ||||||||||
Net income (loss) attributable to shareholders | $ | 134 | $ | (20,064 | ) | $ | (11,826 | ) | $ | 7,780 | $ | 24,821 | |||||||
Earnings (Loss) per Share: | |||||||||||||||||||
Basic | $ | — | $ | (0.26 | ) | $ | (0.18 | ) | $ | 0.15 | $ | 0.46 | |||||||
Diluted | $ | — | $ | (0.26 | ) | $ | (0.18 | ) | $ | 0.15 | $ | 0.46 | |||||||
36
Year Ended December 31, | |||||||||||||||||||
2017 | 2016 | 2015 | 2014 | 2013 | |||||||||||||||
(in thousands except share and per share data) | |||||||||||||||||||
Weighted Average Shares Outstanding: | |||||||||||||||||||
Basic | 75,766,811 | 75,738,698 | 67,039,439 | 53,502,873 | 53,502,873 | ||||||||||||||
Diluted | 75,766,811 | 75,738,698 | 67,039,439 | 53,502,873 | 53,502,873 | ||||||||||||||
Dividends declared per share of common stock | $ | 1.32 | $ | 1.32 | $ | 0.48 | $ | — | $ | — | |||||||||
Balance Sheet data: | |||||||||||||||||||
Total Assets | $ | 1,955,806 | $ | 1,547,312 | $ | 1,644,805 | $ | 1,399,821 | $ | 278,031 | |||||||||
Debt, net | $ | 703,264 | $ | 259,512 | $ | 266,221 | $ | 587,948 | $ | 72,772 | |||||||||
Total Liabilities | $ | 920,731 | $ | 381,632 | $ | 354,119 | $ | 686,324 | $ | 82,147 | |||||||||
Total Equity | $ | 1,035,075 | $ | 1,165,680 | $ | 1,290,686 | $ | 713,497 | $ | 195,884 | |||||||||
Cash Flow data: | |||||||||||||||||||
Net cash provided by (used in): | |||||||||||||||||||
Operating activities | $ | 68,497 | $ | 30,903 | $ | 23,528 | $ | (31,551 | ) | $ | 11,913 | ||||||||
Investing activities | $ | (440,230 | ) | $ | (213,098 | ) | $ | (239,921 | ) | $ | (571,416 | ) | $ | (87,765 | ) | ||||
Financing activities | $ | 363,078 | $ | (131,453 | ) | $ | 575,971 | $ | 617,856 | $ | 78,964 | ||||||||
Item 7. Management’s Discussion and Analysis of Financial Condition and Results of Operations
The following Management’s Discussion and Analysis of Financial Condition and Results of Operations (“MD&A”) is intended to help you understand Fortress Transportation and Infrastructure Investors LLC (the “Company”). The Company’s MD&A should be read in conjunction with its consolidated financial statements and the accompanying notes, and with Part I, Item 1A, “Risk Factors” and “Forward-Looking Statements” included elsewhere in this Annual Report on Form 10-K.
Overview
We own and acquire high quality infrastructure and related equipment that is essential for the transportation of goods and people globally. We target assets that, on a combined basis, generate strong cash flows with potential for earnings growth and asset appreciation. We believe that there are a large number of acquisition opportunities in our markets, and that our Manager’s expertise and business and financing relationships, together with our access to capital, will allow us to take advantage of these opportunities. We are externally managed by FIG LLC (the “Manager”), an affiliate of Fortress Investment Group LLC (“Fortress”), which has a dedicated team of experienced professionals focused on the acquisition of transportation and infrastructure assets since 2002. As of December 31, 2017, we had total consolidated assets of $2.0 billion and total equity of $1.0 billion.
At December 31, 2014, through their investment in the Company, the beneficial owners of the Fortress Worldwide Transportation and Infrastructure General Partnership were Fortress Worldwide Transportation and Infrastructure Investors LP (the “Onshore Fund”), with an 89.97% interest and Fortress Worldwide Transportation and Infrastructure Offshore LP (the “Offshore Fund”) with a 9.98% interest; in addition, Fortress Worldwide Transportation and Infrastructure Master GP LLP (the “Master GP”) held a 0.05% interest. The Master GP is owned by an affiliate of Fortress. The Onshore Fund and the Offshore Fund (collectively, the “Initial Shareholders”) were investment vehicles which were sponsored by Fortress. The general partner of the Onshore Fund and the Offshore Fund was an affiliate of Fortress.
In May 2015, the remaining capital commitments of the investors of the Onshore Fund, Offshore Fund and Master GP were called. Through a series of transactions, the Master GP contributed its rights to previously undistributed incentive allocations pursuant to the Partnership Agreement in exchange for the limited partnership interests in the Onshore Fund and the Offshore Fund equal to the amount of any such undistributed incentive allocations and 53,502,873 common shares were issued to the Onshore Fund and Offshore Fund based on their relative interests in the Company. In November 2015, the Onshore Fund and the Offshore Fund each distributed to their respective limited partners the common shares allocated to their limited partners in accordance with their respective limited partnership agreements.
On May 20, 2015, we completed an IPO of 20 million common shares at a price to the public of $17.00 per share. On June 15, 2015, the underwriters exercised their overallotment option, pursuant to which we issued an additional 2.2 million shares to such underwriters at the IPO price.
While our strategy permits us to acquire a broad array of transportation-related assets, we are currently active in five sectors where we believe there are meaningful opportunities to deploy capital to achieve attractive risk adjusted returns: aviation, energy, intermodal transport, rail and ports and terminals.
• | Commercial air travel and air freight activity have historically been long-term growth sectors and are tied to the underlying demand for passenger and freight movement. We continue to see strong demand for aviation related assets. |
37
• | Offshore energy service equipment refers to vessels supporting the extraction, processing and transportation of oil and natural gas from deposits located beneath the sea floor. The recent oil price decline has led to oil and gas companies reducing and deferring spending decisions, creating an oversupply of offshore energy assets, and in turn, lower day-rates, utilization and earnings for offshore service companies. |
• | The intermodal transport market includes the efficient movement of goods throughout multiple modes of transportation, making it possible to move cargo from a point of origin to a final destination without repeated unpacking and repacking. Over the last year, new container prices have increased substantially, which has led to a rebound in lease rates and residual values from the lows of 2015 and 2016. |
• | Rail refers to the railroad industry, which has increased its share of freight ton-miles compared to other forms of freight transportation over the past quarter century. This infrastructure, most of which was originally established over 100 years ago, represents a limited supply of assets and a difficult-to-replicate network. We continue to see increased volumes and efficiencies on our network since our investment in CMQR in 2014. |
• | Land-based infrastructure refers to facilities that enable the storage, unloading, loading and movement of crude oil and refined products from producers to end users, such as refineries. Customers of land-based infrastructure typically purchase capacity on a take-or-pay basis, and the economics of these assets directly relate to the volume of throughput. |
Operating Segments
Our operations consist of two primary strategic business units – Infrastructure and Equipment Leasing. Our Infrastructure Business acquires long-lived assets that provide mission-critical services or functions to transportation networks and typically have high barriers to entry. The Company targets or develops operating businesses with strong margins, stable cash flows and upside from earnings growth and asset appreciation driven by increased use and inflation. Our Equipment Leasing Business acquires assets that are designed to carry cargo or people or provide functionality to transportation infrastructure. Transportation equipment assets are typically long-lived, moveable and leased by us on either operating leases or finance leases to companies that provide transportation services. Our leases generally provide for long-term contractual cash flow with high cash-on-cash yields and include structural protections to mitigate credit risk.
Our reportable segments are comprised of interests in different types of infrastructure and equipment leasing assets. We currently conduct our business through our corporate operating segment and the following six reportable segments: i) Aviation Leasing, ii) Offshore Energy, iii) Shipping Containers, all of which are within Equipment Leasing Business, and iv) Jefferson Terminal, v) Railroad, and vi) Ports and Terminals which together comprise our Infrastructure Business. The Aviation Leasing segment consists of aircraft and aircraft engines held for lease and are typically held long-term. The Offshore Energy segment consists of vessels and equipment that support offshore oil and gas activities and are typically subject to long-term operating leases. The Shipping Containers segment consists of an investment in an unconsolidated entity engaged in the leasing of shipping containers on both an operating lease and finance lease basis. The Jefferson Terminal segment consists of a multi-modal crude and refined products terminal and other related assets which were acquired in 2014. The Railroad segment consists of our Central Maine and Quebec Railway (“CMQR”) short line railroad operations also acquired in 2014. Ports and Terminals consists of Repauno, acquired in 2016, a 1,630 acre deep-water port located along the Delaware River with an underground storage cavern and multiple industrial development opportunities, and Long Ridge, acquired in June 2017, a 1,660 acre multi-modal port located along the Ohio River with rail, dock, and multiple industrial development opportunities. The Corporate operating segment primarily consists of unallocated corporate general and administrative expenses and management fees.
The Company’s reportable segments are comprised of investments in different types of transportation infrastructure and equipment. Each segment requires different investment strategies. The accounting policies of the segments are the same as those described in the summary of significant accounting policies; however, financial information presented by segment includes the impact of intercompany eliminations.
Results of Operations
Adjusted Net Income (Loss) (Non-GAAP)
The Chief Operating Decision Maker (“CODM”) utilizes Adjusted Net Income (Loss) as the key performance measure. This performance measure provides the CODM with the information necessary to assess operational performance, as well as make resource and allocation decisions.
Adjusted Net Income (Loss) is defined as net income (loss) attributable to shareholders, adjusted (a) to exclude the impact of provision for income taxes, equity-based compensation expense, acquisition and transaction expenses, losses on the modification or extinguishment of debt and capital lease obligations, changes in fair value of non-hedge derivative instruments, asset impairment charges, incentive allocations, and equity in earnings of unconsolidated entities, (b) to include the impact of cash income tax payments, and our pro-rata share of the Adjusted Net Income from unconsolidated entities, and (c) to exclude the impact of the non-controlling share of Adjusted Net Income. We evaluate investment performance for each reportable segment primarily based on Adjusted Net Income. We believe that net income attributable to shareholders, as defined by GAAP, is the most comparable earnings measurement with which to reconcile Adjusted Net Income.
Adjusted EBITDA (Non-GAAP)
We view Adjusted EBITDA as a secondary measurement to Adjusted Net Income, which we believe serves as a useful supplement to investors, analysts and management to measure economic performance of deployed revenue generating assets between periods on a consistent basis, and which we believe measures our financial performance and helps identify operational
38
factors that management can impact in the short-term, namely our cost structure and expenses. Adjusted EBITDA may not be comparable to similarly titled measures of other companies because other entities may not calculate Adjusted EBITDA in the same manner.
Adjusted EBITDA is defined as net income attributable to shareholders, adjusted (a) to exclude the impact of provision for income taxes, equity-based compensation expense, acquisition and transaction expenses, losses on the modification or extinguishment of debt and capital lease obligations, changes in fair value of non-hedge derivative instruments, asset impairment charges, incentive allocations, depreciation and amortization expense, and interest expense, (b) to include the impact of our pro-rata share of Adjusted EBITDA from unconsolidated entities, and (c) to exclude the impact of equity in earnings of unconsolidated entities and the non-controlling share of Adjusted EBITDA.
Comparison of the year ended December 31, 2017 to the year ended December 31, 2016
The following table presents our consolidated results of operations and reconciliation of net loss attributable to shareholders to Adjusted Net Income (Loss) for the years ended December 31, 2017 and December 31, 2016:
Year Ended December 31, | Change | ||||||||||
2017 | 2016 | ||||||||||
(in thousands) | |||||||||||
Revenues | |||||||||||
Equipment leasing revenues | |||||||||||
Lease income | $ | 99,536 | $ | 69,736 | $ | 29,800 | |||||
Maintenance revenue | 65,651 | 28,697 | 36,954 | ||||||||
Finance lease income | 1,536 | 2,723 | (1,187 | ) | |||||||
Other revenue | 3,277 | 793 | 2,484 | ||||||||
Total equipment leasing revenues | 170,000 | 101,949 | 68,051 | ||||||||
Infrastructure revenues | |||||||||||
Lease income | 1,111 | 32 | 1,079 | ||||||||
Rail revenues | 32,607 | 30,837 | 1,770 | ||||||||
Terminal services revenues | 10,229 | 15,902 | (5,673 | ) | |||||||
Other revenue | 3,712 | — | 3,712 | ||||||||
Total infrastructure revenues | 47,659 | 46,771 | 888 | ||||||||
Total revenues | 217,659 | 148,720 | 68,939 | ||||||||
39
Year Ended December 31, | Change | ||||||||||
2017 | 2016 | ||||||||||
(in thousands) | |||||||||||
Expenses | |||||||||||
Operating expenses | 92,385 | 66,169 | 26,216 | ||||||||
General and administrative | 14,570 | 12,314 | 2,256 | ||||||||
Acquisition and transaction expenses | 7,306 | 6,316 | 990 | ||||||||
Management fees and incentive allocation to affiliate | 15,732 | 16,742 | (1,010 | ) | |||||||
Depreciation and amortization | 88,110 | 60,210 | 27,900 | ||||||||
Interest expense | 38,827 | 18,957 | 19,870 | ||||||||
Total expenses | 256,930 | 180,708 | 76,222 | ||||||||
Other income (expense) | |||||||||||
Equity in losses of unconsolidated entities | (1,601 | ) | (5,992 | ) | 4,391 | ||||||
Gain on sale of assets, net | 18,281 | 5,941 | 12,340 | ||||||||
Loss on extinguishment of debt | (2,456 | ) | (1,579 | ) | (877 | ) | |||||
Asset impairment | — | (7,450 | ) | 7,450 | |||||||
Interest income | 688 | 136 | 552 | ||||||||
Other income | 3,073 | 602 | 2,471 | ||||||||
Total other income (expense) | 17,985 | (8,342 | ) | 26,327 | |||||||
Loss before income taxes | (21,286 | ) | (40,330 | ) | 19,044 | ||||||
Provision for income taxes | 1,954 | 268 | 1,686 | ||||||||
Net loss | (23,240 | ) | (40,598 | ) | 17,358 | ||||||
Less: Net loss attributable to non-controlling interest in consolidated subsidiaries | (23,374 | ) | (20,534 | ) | (2,840 | ) | |||||
Net income (loss) attributable to shareholders | $ | 134 | $ | (20,064 | ) | $ | 20,198 | ||||
Add: Provision for income taxes | 1,954 | 268 | 1,686 | ||||||||
Add: Equity-based compensation expense (income) | 1,343 | (3,672 | ) | 5,015 | |||||||
Add: Acquisition and transaction expenses | 7,306 | 6,316 | 990 | ||||||||
Add: Losses on the modification or extinguishment of debt and capital lease obligations | 2,456 | 1,579 | 877 | ||||||||
Add: Changes in fair value of non-hedge derivative instruments | (1,022 | ) | 3 | (1,025 | ) | ||||||
Add: Asset impairment charges | — | 7,450 | (7,450 | ) | |||||||
Add: Pro-rata share of Adjusted Net Income (Loss) from unconsolidated entities (1) | (1,601 | ) | (2,905 | ) | 1,304 | ||||||
Add: Incentive allocations | 514 | — | 514 | ||||||||
Less: Cash payments for income taxes | (1,726 | ) | (654 | ) | (1,072 | ) | |||||
Less: Equity in losses of unconsolidated entities | 1,601 | 5,992 | (4,391 | ) | |||||||
Less: Non-controlling share of Adjusted Net Income (Loss) (2) | (558 | ) | (2,945 | ) | 2,387 | ||||||
Adjusted Net Income (Loss) | $ | 10,401 | $ | (8,632 | ) | $ | 19,033 | ||||
______________________________________________________________________________________
(1) Pro-rata share of Adjusted Net Income (Loss) from unconsolidated entities includes the Company’s proportionate share of the unconsolidated entities’ net income adjusted for the excluded and included items detailed in the table above.
(2) Non-controlling share of Adjusted Net Income (Loss) is comprised of the following for the years ended December 31, 2017 and 2016: (i) equity-based compensation of $169 and $(1,561), (ii) provision for income tax of $16 and $29, (iii) loss on extinguishment of debt of $0 and $616, (iv) asset impairment charges of $0 and $3,725, (v) acquisition and transaction expense of $0 and $156, (vi) changes in fair value of non-hedge derivative instruments of $404 and $0, less (vii) cash tax payments of $31 and $20, respectively.
40
The following table sets forth a reconciliation of net loss attributable to shareholders to Adjusted EBITDA for the years ended December 31, 2017 and December 31, 2016:
Year Ended December 31, | Change | ||||||||||
2017 | 2016 | ||||||||||
(in thousands) | |||||||||||
Net income (loss) attributable to shareholders | $ | 134 | $ | (20,064 | ) | $ | 20,198 | ||||
Add: Provision for income taxes | 1,954 | 268 | 1,686 | ||||||||
Add: Equity-based compensation expense (income) | 1,343 | (3,672 | ) | 5,015 | |||||||
Add: Acquisition and transaction expenses | 7,306 | 6,316 | 990 | ||||||||
Add: Losses on the modification or extinguishment of debt and capital lease obligations | 2,456 | 1,579 | 877 | ||||||||
Add: Changes in fair value of non-hedge derivative instruments | (1,022 | ) | 3 | (1,025 | ) | ||||||
Add: Asset impairment charges | — | 7,450 | (7,450 | ) | |||||||
Add: Incentive allocations | 514 | — | 514 | ||||||||
Add: Depreciation and amortization expense (3) | 96,417 | 65,656 | 30,761 | ||||||||
Add: Interest expense | 38,827 | 18,957 | 19,870 | ||||||||
Add: Pro-rata share of Adjusted EBITDA from unconsolidated entities (4) | (243 | ) | 1,196 | (1,439 | ) | ||||||
Less: Equity in losses of unconsolidated entities | 1,601 | 5,992 | (4,391 | ) | |||||||
Less: Non-controlling share of Adjusted EBITDA (5) | (12,763 | ) | (14,653 | ) | 1,890 | ||||||
Adjusted EBITDA (non-GAAP) | $ | 136,524 | $ | 69,028 | $ | 67,496 | |||||
________________________________________________________
(3) Depreciation and amortization expense includes $88,110 and $60,210 of depreciation and amortization expense, $4,716 and $4,979 of lease intangible amortization, and $3,591 and $467 of amortization for lease incentives in the years ended December 31, 2017 and 2016, respectively.
(4) Pro-rata share of Adjusted EBITDA from unconsolidated entities includes the following items for the years ended December 31, 2017 and 2016: (i) net loss of $1,786 and $6,161, (ii) interest expense of $785 and $1,323, (iii) depreciation and amortization expense of $758 and $2,966, and (iv) asset impairment charges of $0 and $3,068, respectively.
(5) Non-controlling share of Adjusted EBITDA is comprised of the following items for the years ended December 31, 2017 and 2016: (i) equity based compensation of $169 and $(1,561), (ii) provision for income taxes of $16 and $29, (iii) interest expense of $5,030 and $5,124, (iv) depreciation and amortization expense of $7,144 and $6,564, (v) changes in fair value of non-hedge derivative instruments of $404 and $0, (vi) asset impairment charge of $0 and $3,725, (vii) loss on extinguishment of debt of $0 and $616, and (viii) transaction and acquisition expense of $0 and $156, respectively.
Revenues
For the year ended December 31, 2017 total revenues increased $68,939 compared to the year ended December 31, 2016 driven mainly by higher revenues in the Aviation, Offshore Energy and Ports and Terminals segments partially offset by lower revenues in the Jefferson Terminal segment.
In Equipment Leasing, lease income increased $29,800 in the year ended December 31, 2017 compared to the year ended December 31, 2016 driven by an increase in assets on lease in the Aviation Leasing segment coupled with vessels on hire in the Offshore Energy segment during the year ended December 31, 2017. Maintenance revenue increased by $36,954 in the year ended December 31, 2017 as compared to the year ended December 31, 2016 as we increased the number of aircraft and engines subject to leases with maintenance arrangements and the redelivery of two aircraft with end of lease compensation payments totaling $6,338 in the year ended December 31, 2017. Additionally, other revenues increased $2,484 mainly as a result of crew and insurance reimbursement income in the Offshore Energy segment.
In Infrastructure, other revenue increased $3,712 in the year ended December 31, 2017 compared to the year ended December 31, 2016 due to activity at Long Ridge, which was acquired in 2017. Rail revenues increased $1,770 in the year ended December 31, 2017 compared to the year ended December 31, 2016 due to an increase in traffic and expanded service offerings by our Railroad segment. Partially offsetting these increases was lower revenue of $5,673 in the year ended December 31, 2017 as compared to the year ended December 31, 2016 in the Jefferson Terminal segment due to a decrease in loading and unloading due to ongoing construction at the terminal and the conclusion of a long term take or pay contract.
Expenses
For the year ended December 31, 2017, total expenses increased $76,222 compared to the year ended December 31, 2016 primarily due to increases in i) depreciation and amortization, ii) operating expenses and iii) interest expense.
41
Depreciation and amortization increased $27,900 in the year ended December 31, 2017 compared to the year ended December 31, 2016 primarily due to additional assets acquired in the Aviation Leasing segment coupled with assets at Long Ridge and Repauno going into service.
Operating expenses increased $26,216 in the year ended December 31, 2017 compared to the year ended December 31, 2016 primarily due to increases in i) compensation and benefits of $8,896 primarily reflecting an increase in equity-based compensation expense due to the reversal of an expense related to a forfeiture in 2016, ii) facility operations of $5,813 primarily in the Jefferson Terminal and Railroad segments due to increases in volume, iii) operating expenses of $4,149 related to the Offshore Energy segment, iv) professional fees of $4,031 related to an increase in activity and v) cost of sales of $1,977 reflecting the sale of butane in 2017.
Interest expense increased $19,870 in the year ended December 31, 2017 compared to the year ended December 31, 2016 primarily due to the Senior Notes and Revolving Line of Credit entered into during 2017.
Other Income (Expenses)
Total other income (expense) increased $26,327 in the year ended December 31, 2017 compared to the year ended December 31, 2016 primarily due to higher gain on the sale of assets, net of $12,340, reflecting the sale of available-for-sale securities of an international oil and gas drilling contractor in the Offshore Energy segment. Also contributing to the increase was the asset impairment charge in 2016 of $7,450, where there was no asset impairment charge in 2017 and a decrease in the equity in losses of unconsolidated entities of $4,391.
Provision for Income Taxes
The provision for income taxes increased $1,686 in the year ended December 31, 2017 compared to the year ended December 31, 2016 primarily as a result of an increase in net income attributable to the Company’s corporate subsidiaries subject to U.S. taxation at regular corporate rates.
Net Loss
Net loss attributable to shareholders decreased $20,198 in the year ended December 31, 2017 compared to the year ended December 31, 2016 primarily due to the changes discussed above.
Adjusted Net Income (Loss) (Non-GAAP)
Adjusted Net Income was $10,401, an increase of $19,033 in the year ended December 31, 2017 compared to the year ended December 31, 2016. In addition to the changes in revenue, expenses and other expenses noted above, the increase in the period was driven by an increase in (i) equity based compensation of $5,015, (ii) pro-rata share of Adjusted Net Income from unconsolidated entities of $1,304, and (iii) non-controlling share of Adjusted Net income of $2,387. The increase was partially offset by a decrease in asset impairment charges of $7,450 and equity in losses of unconsolidated entities of $4,391.
Adjusted EBITDA (Non-GAAP)
Adjusted EBITDA was $136,524 for the year ended December 31, 2017, increasing $67,496 compared to the year ended December 31, 2016. In addition to the changes in revenue, expenses and other losses noted above, which resulted in a net income attributable to shareholders, the change was primarily due to (i) depreciation and amortization expense, (ii) interest expense, (iii) the pro-rata share of Adjusted EBITDA from unconsolidated entities, (iv) lower equity-based compensation, (v) lower non-controlling share of Adjusted EBITDA, and (vi) equity in earnings of unconsolidated entities.
42
Aviation Leasing Segment
As of December 31, 2017, in our Aviation Leasing segment, we own and manage 158 aviation assets, including 48 aircraft and 110 commercial jet engines.
As of December 31, 2017, 46 of our commercial aircraft and 76 of our jet engines were leased to operators or other third parties. Aviation assets currently off lease are either undergoing repair and/or maintenance, being prepared to go on lease or held in short term storage awaiting a future lease. Our aviation equipment was approximately 86% utilized as of December 31, 2017, based on the equity value of our on-hire leasing equipment as a percentage of the total equity value of our aviation leasing equipment. Our aircraft currently have a weighted average remaining lease term of 32 months, and our engines currently on-lease have an average remaining lease term of 11 months. The table below provides additional information on the assets in our Aviation Leasing segment:
Aviation Assets | Widebody | Narrowbody | Total | |||||
Aircraft | ||||||||
Assets at January 1, 2017 | 7 | 19 | 26 | |||||
Purchases | 3 | 22 | 25 | |||||
Sales | (1 | ) | (2 | ) | (3 | ) | ||
Assets at December 31, 2017 | 9 | 39 | 48 | |||||
Engines | ||||||||
Assets at January 1, 2017 | 38 | 28 | 66 | |||||
Purchases | 28 | 30 | 58 | |||||
Sales | (9 | ) | (5 | ) | (14 | ) | ||
Assets at December 31, 2017 | 57 | 53 | 110 | |||||
43
The following table presents our results of operations and reconciliation of net income attributable to shareholders to Adjusted Net Income for the Aviation Leasing segment for the years ended December 31, 2017 and December 31, 2016:
Year Ended December 31, | Change | ||||||||||
2017 | 2016 | ||||||||||
(in thousands) | |||||||||||
Revenues | |||||||||||
Equipment leasing revenues | |||||||||||
Lease income | $ | 91,103 | $ | 66,024 | $ | 25,079 | |||||
Maintenance revenue | 65,651 | 28,697 | 36,954 | ||||||||
Other revenue | 39 | 687 | (648 | ) | |||||||
Total revenues | 156,793 | 95,408 | 61,385 | ||||||||
Expenses | |||||||||||
Operating expenses | 6,247 | 4,609 | 1,638 | ||||||||
Acquisition and transaction expenses | 441 | 80 | 361 | ||||||||
Depreciation and amortization | 61,795 | 36,369 | 25,426 | ||||||||
Total expenses | 68,483 | 41,058 | 27,425 | ||||||||
Other income | |||||||||||
Equity in losses of unconsolidated entities | (1,276 | ) | — | (1,276 | ) | ||||||
Gain on sale of assets, net | 7,188 | 5,214 | 1,974 | ||||||||
Interest income | 297 | 142 | 155 | ||||||||
Total other income | 6,209 | 5,356 | 853 | ||||||||
Income before income taxes | 94,519 | 59,706 | 34,813 | ||||||||
Provision for income taxes | 1,966 | 267 | 1,699 | ||||||||
Net income | 92,553 | 59,439 | 33,114 | ||||||||
Less: Net income attributable to non-controlling interest in consolidated subsidiaries | 697 | 435 | 262 | ||||||||
Net income attributable to shareholders | $ | 91,856 | $ | 59,004 | $ | 32,852 | |||||
Add: Provision for income taxes | 1,966 | 267 | 1,699 | ||||||||
Add: Equity-based compensation expense | — | — | — | ||||||||
Add: Acquisition and transaction expenses | 441 | 80 | 361 | ||||||||
Add: Losses on the modification or extinguishment of debt and capital lease obligations | — | — | — | ||||||||
Add: Changes in fair value of non-hedge derivative instruments | — | — | — | ||||||||
Add: Asset impairment charges | — | — | — | ||||||||
Add: Pro-rata share of Adjusted Net Income from unconsolidated entities(1) | (1,276 | ) | — | (1,276 | ) | ||||||
Add: Incentive allocations | — | — | — | ||||||||
Less: Cash payments for income taxes | (1,626 | ) | (583 | ) | (1,043 | ) | |||||
Less: Equity in earnings of unconsolidated entities | 1,276 | — | 1,276 | ||||||||
Less: Non-controlling share of Adjusted Net Income | — | — | — | ||||||||
Adjusted Net Income | $ | 92,637 | $ | 58,768 | $ | 33,869 | |||||
(1) Pro-rata share of Adjusted Net Income from unconsolidated entities includes Aviation’s proportionate share of the unconsolidated entities’ net income adjusted for the excluded and included items detailed in the table above, for which there were no adjustments.
44
The following table sets forth a reconciliation of net income attributable to shareholders to Adjusted EBITDA for the Aviation Leasing segment for the years ended December 31, 2017 and December 31, 2016:
Year Ended December 31, | Change | ||||||||||
2017 | 2016 | ||||||||||
(in thousands) | |||||||||||
Net income attributable to shareholders | $ | 91,856 | $ | 59,004 | $ | 32,852 | |||||
Add: Provision for income taxes | 1,966 | 267 | 1,699 | ||||||||
Add: Equity-based compensation expense | — | — | — | ||||||||
Add: Acquisition and transaction expenses | 441 | 80 | 361 | ||||||||
Add: Losses on the modification or extinguishment of debt and capital lease obligations | — | — | — | ||||||||
Add: Changes in fair value of non-hedge derivative instruments | — | — | — | ||||||||
Add: Asset impairment charges | — | — | — | ||||||||
Add: Incentive allocations | — | — | — | ||||||||
Add: Depreciation and amortization expense (1) | 70,102 | 41,816 | 28,286 | ||||||||
Add: Interest expense | — | — | — | ||||||||
Add: Pro-rata share of Adjusted EBITDA from unconsolidated entities(2) | (1,276 | ) | — | (1,276 | ) | ||||||
Less: Equity in earnings of unconsolidated entities | 1,276 | — | 1,276 | ||||||||
Less: Non-controlling share of Adjusted EBITDA(3) | (537 | ) | (164 | ) | (373 | ) | |||||
Adjusted EBITDA (non-GAAP) | $ | 163,828 | $ | 101,003 | $ | 62,825 | |||||
______________________________________________________________________________________
(1) Depreciation and amortization expense includes $61,795 and $36,369 of depreciation expense, $4,716 and $4,979 of lease intangible amortization, and $3,591 and $468 of amortization for lease incentives in the years ended December 31, 2017 and 2016, respectively.
(2) Aviation Leasing’s pro-rata share of Adjusted EBITDA from unconsolidated entities includes net loss of $1,276 and $0 for the years ended December 31, 2017 and 2016, respectively.
(3) Non-controlling share of Adjusted EBITDA is comprised of depreciation and lease amortization expense of $537 and $164 for the years ended December 31, 2017 and 2016, respectively.
Revenues
Total revenues increased $61,385 in the year ended December 31, 2017 compared to the year ended December 31, 2016, driven by higher lease income and maintenance revenue partially offset by a decrease in other revenue. Lease income increased $25,079 in the year ended December 31, 2017 compared to the year ended December 31, 2016 mainly due to an increase in (i) aircraft lease income of $9,382 primarily driven by the addition of 26 aircraft on lease (ii) engine lease income of $15,697 primarily driven by an additional 45 revenue generating engines in the year ended December 31, 2017 compared to year ended December 31, 2016. Maintenance revenue was $36,954 higher in the year ended December 31, 2017 compared to the year ended December 31, 2016 due to an increase in the number of aircraft and engines on lease, and the receipt of end-of-lease compensation for two aircraft. Other revenue decreased $648 primarily due to fewer forfeited security deposits included in earnings in the year ended December 31, 2017 compared to the year ended December 31, 2016.
Expenses
Total expenses increased $27,425 in the year ended December 31, 2017 compared to the year ended December 31, 2016, primarily due to an increase in depreciation and amortization expense. Depreciation and amortization expense increased $25,426 driven by additional aircraft and engines owned and on lease in the year ended December 31, 2017 compared to the year ended December 31, 2016. Operating expenses increased $1,638 in the year ended December 31, 2017 compared to the year ended December 31, 2016, primarily the result of increases in professional fee expenses of $902, shipping and storage fees of $565 due to the positioning of our assets for lease, and $171 of other expenses due to growth of the Aviation Leasing segment. Acquisition and transaction expenses increased $361 in the year ended December 31, 2017 compared to the year ended December 31, 2016, reflecting higher deal costs in the Aviation Leasing segment.
Other Income
Total other income increased $853 in the year ended December 31, 2017 compared to the year ended December 31, 2016, driven by the gain on sale of assets, partially offset by losses incurred by the advanced engine repair JV of $(1,276).
Provision for Income Taxes
Total provision for income taxes increased $1,699 in year ended December 31, 2017 compared to the year ended December 31, 2016, primarily as a result of an increase in net income attributable to the Company’s corporate subsidiaries subject to U.S. taxation at regular corporate rates.
45
Adjusted Net Income
Adjusted Net Income was $92,637 in the year ended December 31, 2017 increasing $33,869 compared to the year ended December 31, 2016 primarily driven by the changes to net income attributable to shareholders noted above, and cash payments for income taxes due to the Company’s corporate subsidiaries subject to U.S. taxation at regular corporate rates.
Adjusted EBITDA (Non-GAAP)
Adjusted EBITDA was $163,828 for the year ended December 31, 2017 increasing $62,825 compared to the year ended December 31, 2016. In addition to the changes in net income attributable to shareholders noted above, this movement was primarily due to higher depreciation and amortization expense for the additional aircraft and engines owned and on lease, and higher provision for income taxes due to changes noted above in the year ended December 31, 2017, partially offset by an increase in the non-controlling interest share of Adjusted EBITDA.
Offshore Energy Segment
In our Offshore Energy segment, we own one remotely operated vehicle (“ROV”) support vessel, one construction support vessel and one anchor handling tug supply (“AHTS”) vessel. The chart below describes the assets in our Offshore Energy segment as of December 31, 2017:
Offshore Energy Assets | |||
Asset Type | Year Built | Description | Economic Interest (%) |
AHTS Vessel | 2010 | Anchor handling tug supply vessel with accommodation for 30 personnel and a total bollard pull of 68.5 tons | 100% |
Construction Support Vessel | 2014 | DP-3 construction support and well intervention vessel with 250-ton main crane, 2,000 square meter open deck space, moon pool and accommodation for 100 personnel | 100% |
ROV Support Vessel | 2011 | DP-2 dive and ROV support vessel with 50-ton crane, moon pool and accommodation for 120 personnel | 100%* |
_____________________________________________________
*The increase in economic interest in the third quarter of 2017 for the ROV support vessel reflects the transfer of the non-controlling interest to the Company as part of the settlement arrangement as more fully discussed in Note 2 and Note 8 of the Consolidated Financial Statements.
46
The following table presents our results of operations and reconciliation of net income (loss) attributable to shareholders to Adjusted Net (Loss) Income for the Offshore Energy segment for the years ended December 31, 2017 and December 31, 2016:
Year Ended December 31, | Change | ||||||||||
2017 | 2016 | ||||||||||
(in thousands) | |||||||||||
Revenues | |||||||||||
Equipment leasing revenues | |||||||||||
Lease income | $ | 8,433 | $ | 3,712 | $ | 4,721 | |||||
Finance lease income | 1,536 | 1,610 | (74 | ) | |||||||
Other revenue | 3,138 | 6 | 3,132 | ||||||||
Total revenues | 13,107 | 5,328 | 7,779 | ||||||||
Expenses | |||||||||||
Operating expenses | 15,833 | 11,014 | 4,819 | ||||||||
Depreciation and amortization | 6,427 | 6,411 | 16 | ||||||||
Interest expense | 3,670 | 3,747 | (77 | ) | |||||||
Total expenses | 25,930 | 21,172 | 4,758 | ||||||||
Other income (expense) | |||||||||||
Gain on sale of assets, net | 11,405 | — | 11,405 | ||||||||
Asset impairment | — | (7,450 | ) | 7,450 | |||||||
Interest income | 15 | 13 | 2 | ||||||||
Other income | 1,093 | — | 1,093 | ||||||||
Total other income (expense) | 12,513 | (7,437 | ) | 19,950 | |||||||
Loss before income taxes | (310 | ) | (23,281 | ) | 22,971 | ||||||
Provision for income taxes | 11 | — | 11 | ||||||||
Net loss | (321 | ) | (23,281 | ) | 22,960 | ||||||
Less: Net loss attributable to non-controlling interest in consolidated subsidiaries | (526 | ) | (4,368 | ) | 3,842 | ||||||
Net income (loss) attributable to shareholders | $ | 205 | $ | (18,913 | ) | $ | 19,118 | ||||
Add: Provision for income taxes | 11 | — | 11 | ||||||||
Add: Equity-based compensation expense | — | — | — | ||||||||
Add: Acquisition and transaction expenses | — | — | — | ||||||||
Add: Losses on the modification or extinguishment of debt and capital lease obligations | — | — | — | ||||||||
Add: Changes in fair value of non-hedge derivative instruments | — | — | — | ||||||||
Add: Asset impairment charges | — | 7,450 | (7,450 | ) | |||||||
Add: Pro-rata share of Adjusted Net Income from unconsolidated entities | — | — | — | ||||||||
Add: Incentive allocations | — | — | — | ||||||||
Less: Cash payments for income taxes | — | — | — | ||||||||
Less: Equity in earnings of unconsolidated entities | — | — | — | ||||||||
Less: Non-controlling share of Adjusted Net Income (1) | — | (3,725 | ) | 3,725 | |||||||
Adjusted Net Income (Loss) | $ | 216 | $ | (15,188 | ) | $ | 15,404 | ||||
________________________________________________________
(1) Non-controlling share of Adjusted Net Income (Loss) is comprised of asset impairment charges of $0 and $3,725 for the years ended December 31, 2017 and 2016, respectively.
47
The following table sets forth a reconciliation of net income (loss) attributable to shareholders to Adjusted EBITDA for the Offshore Energy segment for the year ended December 31, 2017 and December 31, 2016:
Year Ended December 31, | Change | ||||||||||
2017 | 2016 | ||||||||||
(in thousands) | |||||||||||
Net income (loss) attributable to shareholders | $ | 205 | $ | (18,913 | ) | $ | 19,118 | ||||
Add: Provision for income taxes | 11 | — | 11 | ||||||||
Add: Equity-based compensation expense | — | — | — | ||||||||
Add: Acquisition and transaction expenses | — | — | — | ||||||||
Add: Losses on the modification or extinguishment of debt and capital lease obligations | — | — | — | ||||||||
Add: Changes in fair value of non-hedge derivative instruments | — | — | — | ||||||||
Add: Asset impairment charges | — | 7,450 | (7,450 | ) | |||||||
Add: Incentive allocations | — | — | — | ||||||||
Add: Depreciation and amortization expense | 6,427 | 6,411 | 16 | ||||||||
Add: Interest expense | 3,670 | 3,747 | (77 | ) | |||||||
Add: Pro-rata share of Adjusted EBITDA from unconsolidated entities | — | — | — | ||||||||
Less: Equity in earnings of unconsolidated entities | — | — | — | ||||||||
Less: Non-controlling share of Adjusted EBITDA (2) | (247 | ) | (4,084 | ) | 3,837 | ||||||
Adjusted EBITDA (non-GAAP) | $ | 10,066 | $ | (5,389 | ) | $ | 15,455 | ||||
________________________________________________________
(2) Non-controlling share of Adjusted EBITDA is comprised of the following items for the years ended December 31, 2017 and 2016: (i) depreciation expense of $165 and $245, (ii) interest expense of $82 and $114, and (iii) asset impairment charges of $0 and $3,725, respectively.
Revenues
Total revenues increased $7,779 in the year ended December 31, 2017 compared to the year ended December 31, 2016, primarily due to higher lease income and other revenue. For the year ended December 31, 2017, the offshore construction support vessel was on hire with a long-term lease arrangement that terminated in November 2017, compared to the year ended December 31, 2016 when the vessel was subject to short-term lease arrangements. For the year ended December 31, 2017, the ROV support vessel was on hire with a long-term lease arrangement, as compared to year ended December 31, 2016 when the long-term lease arrangement for the ROV support vessel was terminated in February 2016 resulting in lower lease income from short-term lease arrangements for the remainder of the year. Other revenue increased $3,132 in the year ended December 31, 2017 as compared to the year ended December 31, 2016, primarily due to the crew provisions reimbursement income for the offshore construction support vessel.
Expenses
Total expenses increased $4,758 in the year ended December 31, 2017 compared to the year ended December 31, 2016, primarily due to increases in operating expenses.
For the year ended December 31, 2017, operating expenses increased $4,819 compared to the year ended December 31, 2016. The increase reflected higher (i) crew costs of $1,919, (ii) legal fees of $1,284, (iii) projects costs of $847, (iv) other operating expenses of $509 and (v) mobilization and costs for spare parts of $260 in the year ended December 31, 2017 as compared to the year ended December 31, 2016.
During the year ended December 31, 2017, there was $4,781 and $1,646 of depreciation expense related to the construction support vessel and ROV support vessel, respectively. During the year ended December 31, 2016, there was $4,776 and $1,635 of depreciation expense related to the construction support vessel and ROV support vessel, respectively.
During the year ended December 31, 2017, there was $3,577 and $93 of interest expense primarily related to financing for the construction support vessel and ROV support vessel, respectively. During the year ended December 31, 2016, there was $3,634 and $113 of interest expense related to financing for the construction support vessel and ROV support vessel, respectively. The note relating to the ROV support vessel was settled during the third quarter of 2017 due to the transfer of interests from the non-controlling interest holder to the Company.
48
Other Income (Expense)
Total other income (expense) increased $19,950 in the year ended December 31, 2017 compared to the year ended December 31, 2016, primarily due to the sale of available-for-sale securities of an international oil and gas drilling contractor resulting in a gain of $11,405. Also contributing to the increase is the transfer of interests from the non-controlling interest holder to the Company as settlement for a note receivable, resulting in a gain of $1,093 in the third quarter of 2017. Additionally, there was an asset impairment of $7,450 in the year ended December 31, 2016, and there was no impairment in 2017. In July 2016, the shipbuilder delivered a notice of termination of the ship building contract for MT6015 resulting in the impairment of the investment in the year ended December 31, 2016.
Adjusted Net Income (Loss)
Adjusted Net Income was $216 in the year ended December 31, 2017, an increase of $15,404 as compared to the year ended December 31, 2016. The increase is primarily due to the changes to net income attributable to shareholders described above, partially offset by the net impact of the impairment recorded in the second quarter of 2016 for the MT6015 vessel.
Adjusted EBITDA (Non-GAAP)
Adjusted EBITDA increased by $15,455 in the year ended December 31, 2017 as compared to the year ended December 31, 2016, due to an increase in net income attributable to shareholders of $19,118 as noted above. This was offset by the asset impairment charge recorded during 2016, for the purchase of the MT6015 vessel.
Shipping Containers Segment
In our Shipping Containers segment we own, through a joint venture, interests in approximately 34,000 maritime shipping containers and related equipment. The chart below describes the assets in our Shipping Containers segment as of December 31, 2017:
Shipping Containers Assets | |||||
Number of Containers | Type | Average Age | Lease Type | Customer Mix | Economic Interest (%) |
34,000 | 20’ Dry 20’ Reefer 40’ Dry 40’ HC Dry 40’ HC Reefer | ~10 Years | Direct Finance Lease/Operating Lease | 5 Customers | 51% |
49
The following table presents our results of operations and reconciliation of net income (loss) attributable to shareholders to Adjusted Net Income (Loss) for the Shipping Containers segment for the years ended December 31, 2017 and December 31, 2016:
Year Ended December 31, | Change | ||||||||||
2017 | 2016 | ||||||||||
(in thousands) | |||||||||||
Revenues | |||||||||||
Equipment leasing revenues | |||||||||||
Finance lease income | $ | — | $ | 1,113 | $ | (1,113 | ) | ||||
Other revenue | 100 | 100 | — | ||||||||
Total revenues | 100 | 1,213 | (1,113 | ) | |||||||
Expenses | |||||||||||
Operating expenses | 9 | 43 | (34 | ) | |||||||
Interest expense | — | 410 | (410 | ) | |||||||
Total expenses | 9 | 453 | (444 | ) | |||||||
Other expense | |||||||||||
Equity in losses of unconsolidated entities | (4 | ) | (5,974 | ) | 5,970 | ||||||
Gain on sale of assets, net | — | 304 | (304 | ) | |||||||
Total other expense | (4 | ) | (5,670 | ) | 5,666 | ||||||
Income (loss) before income taxes | 87 | (4,910 | ) | 4,997 | |||||||
Benefit from income taxes | (65 | ) | (86 | ) | 21 | ||||||
Net income (loss) attributable to shareholders | $ | 152 | $ | (4,824 | ) | $ | 4,976 | ||||
Add: Benefit from income taxes | (65 | ) | (86 | ) | 21 | ||||||
Add: Equity-based compensation expense | — | — | — | ||||||||
Add: Acquisition and transaction expenses | — | — | — | ||||||||
Add: Losses on the modification or extinguishment of debt and capital lease obligations | — | — | — | ||||||||
Add: Changes in fair value of non-hedge derivative instruments | — | 3 | (3 | ) | |||||||
Add: Asset impairment charges | — | — | — | ||||||||
Add: Pro-rata share of Adjusted Net Loss from unconsolidated entities (1) | (4 | ) | (2,905 | ) | 2,901 | ||||||
Add: Incentive allocations | — | — | — | ||||||||
Less: Cash payments for income taxes | — | — | — | ||||||||
Less: Equity in earnings of unconsolidated entities | 4 | 5,974 | (5,970 | ) | |||||||
Less: Non-controlling share of Adjusted Net Income | — | — | — | ||||||||
Adjusted Net Income (Loss) | $ | 87 | $ | (1,838 | ) | $ | 1,925 | ||||
________________________________________________________
(1) Pro-rata share of Adjusted Net Loss from unconsolidated entities is comprised of the following for the year ended December 31, 2017 and 2016: (i) the Company’s proportionate share of the unconsolidated entities’ net loss of $189 and $6,161 and (ii) interest expense of $185 and $188, adjusted for (iii) $0 and $3,068 of asset impairment charges, respectively.
50
The following table sets forth a reconciliation of net loss attributable to shareholders to Adjusted EBITDA for the Shipping Containers segment for the years ended December 31, 2017 and December 31, 2016:
_______________________________________________________
Year Ended December 31, | Change | ||||||||||
2017 | 2016 | ||||||||||
(in thousands) | |||||||||||
Net income (loss) attributable to shareholders | $ | 152 | $ | (4,824 | ) | $ | 4,976 | ||||
Add: Benefit from income taxes | (65 | ) | (86 | ) | 21 | ||||||
Add: Equity-based compensation expense | — | — | — | ||||||||
Add: Acquisition and transaction expenses | — | — | — | ||||||||
Add: Losses on the modification or extinguishment of debt and capital lease obligations | — | — | — | ||||||||
Add: Changes in fair value of non-hedge derivative instruments | — | 3 | (3 | ) | |||||||
Add: Asset impairment charges | — | — | — | ||||||||
Add: Incentive allocations | — | — | — | ||||||||
Add: Depreciation and amortization expense | — | — | — | ||||||||
Add: Interest expense | — | 410 | (410 | ) | |||||||
Add: Pro-rata share of Adjusted EBITDA from unconsolidated entities (2) | 1,354 | 1,196 | 158 | ||||||||
Less: Equity in earnings of unconsolidated entities | 4 | 5,974 | (5,970 | ) | |||||||
Less: Non-controlling share of Adjusted EBITDA | — | — | — | ||||||||
Adjusted EBITDA (non-GAAP) | $ | 1,445 | $ | 2,673 | $ | (1,228 | ) | ||||
(2) The Company’s pro-rata share of Adjusted EBITDA from unconsolidated entities includes the following items for the years ended December 31, 2017 and 2016: (i) net loss of $189 and $6,161, (ii) interest expense of $785 and $1,323, (iii) depreciation and amortization expense of $758 and $2,966, and (iv) asset impairment charges of $0 and $3,068, respectively.
Revenues
Total revenues decreased $1,113 in the year ended December 31, 2017 compared to the year ended December 31, 2016. The decrease is primarily driven by the sale of 42,000 shipping containers that were subject to direct finance leases during the first quarter of 2016 and lower finance lease income as a result of the amortization of the underlying principal balances.
Expenses
Total expenses decreased $444 in the year ended December 31, 2017 compared to the year ended December 31, 2016. This was driven by a decrease in interest expense of $410, due to the termination of the term loan sale of the shipping containers during the first quarter of 2016. Additionally, the sale of the 42,000 shipping containers resulted in a decrease in operating expense of $34 in the year ended December 31, 2017, as compared to the year ended December 31, 2016.
Other Expense
Total other expense decreased $5,666 in the year ended December 31, 2017 compared to the year ended December 31, 2016. The decrease in expense was primarily driven by income earned from our shipping container joint venture due to the sale of containers in the portfolios for gains; and no impairment was taken for the year ended December 31, 2017. Partially offsetting the increase in equity income from unconsolidated entities was the gain on sale of direct finance leases of $304 from the sale of 42,000 shipping containers during the first quarter of 2016.
Adjusted Net Income (Loss)
Adjusted Net Income was $87, an increase of $1,925 in the year ended December 31, 2017 compared to the year ended December 31, 2016, reflecting the changes noted above coupled with a decrease in the pro-rata share of Adjusted Net Loss from unconsolidated entities. These changes were mostly offset by the change in equity of losses of unconsolidated entities, due to the impairment recorded in the year ended December 31, 2016.
Adjusted EBITDA (Non-GAAP)
Adjusted EBITDA was $1,445 in the year ended December 31, 2017, decreasing $1,228 in the year ended December 31, 2017 compared to the year ended December 31, 2016. The decrease primarily reflects the change in equity in unconsolidated entities coupled with a higher pro-rata share of Adjusted EBITDA from unconsolidated entities. Also contributing to the decrease was finance lease income for the year ended December 31, 2016 driven by the sale of 42,000 shipping containers during the first quarter of 2016.
51
Jefferson Terminal Segment
The following table presents our results of operations and reconciliation of net loss attributable to shareholders to Adjusted Net Loss for the Jefferson Terminal segment for the years ended December 31, 2017 and December 31, 2016:
Year Ended December 31, | Change | ||||||||||
2017 | 2016 | ||||||||||
(in thousands) | |||||||||||
Revenues | |||||||||||
Infrastructure revenues | |||||||||||
Terminal services revenues | $ | 10,229 | $ | 15,902 | $ | (5,673 | ) | ||||
Total revenues | 10,229 | 15,902 | (5,673 | ) | |||||||
Expenses | |||||||||||
Operating expenses | 31,213 | 21,886 | 9,327 | ||||||||
Acquisition and transaction expenses | — | 400 | (400 | ) | |||||||
Depreciation and amortization | 16,193 | 15,500 | 693 | ||||||||
Interest expense | 13,568 | 13,501 | 67 | ||||||||
Total expenses | 60,974 | 51,287 | 9,687 | ||||||||
Other income (expense) | |||||||||||
Equity in losses of unconsolidated entities | (321 | ) | (18 | ) | (303 | ) | |||||
Loss on extinguishment of debt | — | (1,579 | ) | 1,579 | |||||||
Interest income (expense) | 376 | (19 | ) | 395 | |||||||
Other income | 1,980 | 602 | 1,378 | ||||||||
Total other income (expense) | 2,035 | (1,014 | ) | 3,049 | |||||||
Loss before income taxes | (48,710 | ) | (36,399 | ) | (12,311 | ) | |||||
Provision for income taxes | 42 | 74 | (32 | ) | |||||||
Net loss | (48,752 | ) | (36,473 | ) | (12,279 | ) | |||||
Less: Net loss attributable to non-controlling interest in consolidated subsidiaries | (22,991 | ) | (16,456 | ) | (6,535 | ) | |||||
Net loss attributable to shareholders | $ | (25,761 | ) | $ | (20,017 | ) | $ | (5,744 | ) | ||
Add: Provision for income taxes | 42 | 74 | (32 | ) | |||||||
Add: Equity-based compensation expense | 318 | (4,051 | ) | 4,369 | |||||||
Add: Acquisition and transaction expenses | — | 400 | (400 | ) | |||||||
Add: Losses on the modification or extinguishment of debt and capital lease obligations | — | 1,579 | (1,579 | ) | |||||||
Add: Changes in fair value of non-hedge derivative instruments | (1,022 | ) | — | (1,022 | ) | ||||||
Add: Asset impairment charges | — | — | — | ||||||||
Add: Pro-rata share of Adjusted Net Income from unconsolidated entities(1) | (321 | ) | — | (321 | ) | ||||||
Add: Incentive allocations | — | — | — | ||||||||
Less: Cash payments for income taxes | (79 | ) | (52 | ) | (27 | ) | |||||
Less: Equity in losses of unconsolidated entities | 321 | 18 | 303 | ||||||||
Less: Non-controlling share of Adjusted Net (Income) Loss(2) | (514 | ) | 800 | (1,314 | ) | ||||||
Adjusted Net Loss | $ | (27,016 | ) | $ | (21,249 | ) | $ | (5,767 | ) | ||
(1) Pro-rata share of Adjusted Net Income from unconsolidated entities includes Jefferson’s proportionate share of the unconsolidated entities’ net income adjusted for the excluded and included items detailed above, for which there were no adjustments.
(2) Non-controlling share of Adjusted Net Loss is comprised of the following for the years ended December 31, 2017 and 2016: (i) equity-based compensation of $125 and $(1,581), (ii) provision for income tax of $16 and $29, (iii) acquisition and transaction expenses of $0 and $156, (iv) changes in fair value of non-hedge derivative instruments of $404 and $0, and (v) loss on extinguishment of debt of $0 and $616 less (vi) cash tax payments of $31 and $20, respectively.
52
The following table sets forth a reconciliation of net loss attributable to shareholders to Adjusted EBITDA for the Jefferson Terminal segment for the years ended December 31, 2017 and December 31, 2016:
Year Ended December 31, | Change | ||||||||||
2017 | 2016 | ||||||||||
(in thousands) | |||||||||||
Net loss attributable to shareholders | $ | (25,761 | ) | $ | (20,017 | ) | $ | (5,744 | ) | ||
Add: Provision for income taxes | 42 | 74 | (32 | ) | |||||||
Add: Equity-based compensation expense | 318 | (4,051 | ) | 4,369 | |||||||
Add: Acquisition and transaction expenses | — | 400 | (400 | ) | |||||||
Add: Losses on the modification or extinguishment of debt and capital lease obligations | — | 1,579 | (1,579 | ) | |||||||
Add: Changes in fair value of non-hedge derivative instruments | (1,022 | ) | — | (1,022 | ) | ||||||
Add: Asset impairment charges | — | — | — | ||||||||
Add: Incentive allocations | — | — | — | ||||||||
Add: Depreciation and amortization expense | 16,193 | 15,500 | 693 | ||||||||
Add: Interest expense | 13,567 | 13,501 | 66 | ||||||||
Add: Pro-rata share of Adjusted EBITDA from unconsolidated entities(3) | (321 | ) | — | (321 | ) | ||||||
Less: Equity in earnings of unconsolidated entities | 321 | 18 | 303 | ||||||||
Less: Non-controlling share of Adjusted EBITDA (4) | (11,751 | ) | (10,184 | ) | (1,567 | ) | |||||
Adjusted EBITDA (non-GAAP) | $ | (8,414 | ) | $ | (3,180 | ) | $ | (5,234 | ) | ||
________________________________________________________
(3) Jefferson Terminal’s pro-rata share of Adjusted EBITDA from unconsolidated entities includes net loss of $321 and $0 for the years ended December 31, 2017 and 2016, respectively.
(4) Non-controlling share of Adjusted EBITDA is comprised of the following items for the years ended December 31, 2017 and 2016: (i) equity-based compensation of $125 and $(1,581), (ii) provision for income taxes of $16 and $29, (iii) interest expense of $4,886 and $4,914, (iv) loss on extinguishment of debt of $0 and $616, (v) acquisition and transaction expenses of $0 and $156, (vi) changes in fair value of non-hedge derivative instruments of $404 and $0, and (vii) depreciation and amortization expense of $6,320 and $6,050, respectively.
Revenues
Total revenues decreased $5,673 in the year ended December 31, 2017 compared to the year ended December 31, 2016, reflecting lower terminal services revenue due to lower throughput and volumes at the Terminal, as a result of increased construction and the conclusion of a long term contract.
Expenses
Total expenses increased $9,687 in the year ended December 31, 2017 compared to the year ended December 31, 2016 primarily reflecting higher operating expenses. The increase in operating expenses of $9,327 reflected higher (i) compensation and benefits expense of $5,333 resulting from the one-time reversal of stock based compensation expense incurred in year ended December 31, 2016, (ii) facility operations expense of $1,779 primarily due to higher volume from heavy crude oil trading, (iii) repairs and maintenance of $1,269, (iv) professional fees of $868, (v) tax expense of $548, (vi) equipment storage of $279, and (vii) insurance expense of $249. The above increases were partially offset by lower environmental expense of $902 related to an oil spill in 2016 and other operating expense of $96. Additionally, the increase in expense reflected higher depreciation expense of $693 for the year ended December 31, 2017 compared to the year ended December 31, 2016.
Adjusted Net Loss
Adjusted Net Loss was $27,016 in the year ended December 31, 2017, increasing $5,767 compared to the year ended December 31, 2016. In addition to the changes in net loss attributable to shareholders noted above, the change was driven by the increase in equity-based compensation of $4,369 in the year ended December 31, 2017 as compared to the year ended December 31, 2016, offset by (i) loss on the extinguishment of debt of $1,579, (ii) non-controlling share of Adjusted Net Loss of $1,314, (iii) changes in fair value of non-hedge derivative instruments of $1,022, and (iv) lower acquisition and transaction expenses of $400.
Adjusted EBITDA (Non-GAAP)
Adjusted EBITDA was $(8,414) in the year ended December 31, 2017, decreasing $5,234 compared to the year ended December 31, 2016. In addition to the changes in net loss attributable to shareholders noted above, Adjusted EBITDA was impacted by an increase in (i) equity-based compensation of $4,369, (ii) $1,567 in non-controlling share of Adjusted EBITDA, as well as (iii) depreciation and amortization of $693 and interest expense of $66, mostly offset by decreases in (i) a loss on extinguishment of
53
debt of $1,579, and (ii) changes in fair value of non-hedge derivative instruments of $1,022, for the year ended December 31, 2017 as compared to the year ended December 31, 2016.
Railroad Segment
The following table presents our results of operations and reconciliation of net (loss) income attributable to shareholders to Adjusted Net Income for the Railroad segment for the years ended December 31, 2017 and December 31, 2016:
Year Ended December 31, | Change | ||||||||||
2017 | 2016 | ||||||||||
(in thousands) | |||||||||||
Revenues | |||||||||||
Infrastructure revenues | |||||||||||
Rail revenues | $ | 32,607 | $ | 30,837 | $ | 1,770 | |||||
Total revenues | 32,607 | 30,837 | 1,770 | ||||||||
Expenses | |||||||||||
Operating expenses | 29,966 | 27,975 | 1,991 | ||||||||
Depreciation and amortization | 2,037 | 1,926 | 111 | ||||||||
Interest expense | 1,029 | 754 | 275 | ||||||||
Total expenses | 33,032 | 30,655 | 2,377 | ||||||||
Other (loss) income | |||||||||||
(Loss) Gain on sale of assets, net | (312 | ) | 423 | (735 | ) | ||||||
Total other (loss) income | (312 | ) | 423 | (735 | ) | ||||||
(Loss) Income before income taxes | (737 | ) | 605 | (1,342 | ) | ||||||
Provision for income taxes | — | — | — | ||||||||
Net (loss) income | (737 | ) | 605 | (1,342 | ) | ||||||
Less: Net (loss) income attributable to non-controlling interest in consolidated subsidiaries | (70 | ) | 23 | (93 | ) | ||||||
Net (loss) income attributable to shareholders | $ | (667 | ) | $ | 582 | $ | (1,249 | ) | |||
Add: Provision for income taxes | — | — | — | ||||||||
Add: Equity-based compensation expense | 730 | 379 | 351 | ||||||||
Add: Acquisition and transaction expenses | — | — | — | ||||||||
Add: Losses on the modification or extinguishment of debt and capital lease obligations | — | — | — | ||||||||
Add: Changes in fair value of non-hedge derivative instruments | — | — | — | ||||||||
Add: Asset impairment charges | — | — | — | ||||||||
Add: Pro-rata share of Adjusted Net Income from unconsolidated entities | — | — | — | ||||||||
Add: Incentive allocations | — | — | — | ||||||||
Less: Cash payments for income taxes | — | — | — | ||||||||
Less: Equity in earnings of unconsolidated entities | — | — | — | ||||||||
Less: Non-controlling share of Adjusted Net Income (1) | (44 | ) | (20 | ) | (24 | ) | |||||
Adjusted Net Income | $ | 19 | $ | 941 | $ | (922 | ) | ||||
______________________________________________________
(1) Non-controlling share of Adjusted Net Income (Loss) is comprised of equity-based compensation of $44 and $20 for the years ended December 31, 2017 and December 31, 2016, respectively.
54
The following table sets forth a reconciliation of net (loss) income attributable to shareholders to Adjusted EBITDA for the Railroad segment for the years ended December 31, 2017 and December 31, 2016:
Year Ended December 31, | Change | ||||||||||
2017 | 2016 | ||||||||||
(in thousands) | |||||||||||
Net (loss)/income attributable to shareholders | $ | (667 | ) | $ | 582 | $ | (1,249 | ) | |||
Add: Provision for income taxes | — | — | — | ||||||||
Add: Equity-based compensation expense | 730 | 379 | 351 | ||||||||
Add: Acquisition and transaction expenses | — | — | — | ||||||||
Add: Losses on the modification or extinguishment of debt and capital lease obligations | — | — | — | ||||||||
Add: Changes in fair value of non-hedge derivative instruments | — | — | — | ||||||||
Add: Asset impairment charges | — | — | — | ||||||||
Add: Incentive allocations | — | — | — | ||||||||
Add: Depreciation and amortization expense | 2,037 | 1,925 | 112 | ||||||||
Add: Interest expense | 1,029 | 754 | 275 | ||||||||
Add: Pro-rata share of Adjusted EBITDA from unconsolidated entities | — | — | — | ||||||||
Less: Equity in earnings of unconsolidated entities | — | — | — | ||||||||
Less: Non-controlling share of Adjusted EBITDA (1) | (228 | ) | (166 | ) | (62 | ) | |||||
Adjusted EBITDA (non-GAAP) | $ | 2,901 | $ | 3,474 | $ | (573 | ) | ||||
________________________________________________________
(1) Non-controlling share of Adjusted EBITDA is comprised of the following items for the years ended December 31, 2017 and 2016: (i) equity-based compensation of $44 and $20, (ii) interest expense of $62 and $41, and (iii) depreciation and amortization expense of $122 and $105, respectively.
Revenues
Total revenues increased $1,770, in the year ended December 31, 2017 compared to the year ended December 31, 2016 due to higher traffic and expanded service offerings to customers. The increase primarily reflects increases of $1,465 in freight transportation revenue and $510 in switching and other rail service revenue. Partially offsetting the increase was lower car hire income of $205 in the year ended December 31, 2017 as compared to the year ended December 31, 2016.
Expenses
Total expenses increased $2,377 in the year ended December 31, 2017 compared to the year ended December 31, 2016. The increase primarily consists of $1,991 in operating expense, $111 in depreciation expense related to property, plant and equipment, and interest expense of $275 related to borrowings under the CMQR Credit Agreement used to finance the operations of the railroad. The aforementioned increase in operating expenses of $1,991 reflects higher (i) general operating expense of $2,099 due to certain tax benefits that were taken in the prior year not available for the year ended December 31, 2017, (ii) compensation and benefits of $614 and (iii) fuel expense of $467. Partially offsetting these increases were lower (i) professional fees of $456, (ii) bad debt of $96 and (iii) other expenses of $637.
Adjusted Net Income
Adjusted Net Income decreased $922 in the year ended December 31, 2017 compared to the year ended December 31, 2016. In addition to the changes in net (loss) income attributable to shareholders noted above, Adjusted Net Income was impacted by higher equity-based compensation expense of $351 in the year ended December 31, 2017 compared to the year ended December 31, 2016.
Adjusted EBITDA (Non-GAAP)
Adjusted EBITDA was $2,901 in the year ended December 31, 2017, decreasing $573 compared to the year ended December 31, 2016. In addition to the changes in net (loss) income attributable to shareholders noted above, Adjusted EBITDA was also impacted primarily by higher equity-based compensation expense of $351 and an increase in interest expense of $275, in the year ended December 31, 2017 as compared to the year ended December 31, 2016.
55
Ports and Terminals
The following table presents our results of operations and reconciliation of net loss attributable to shareholders to Adjusted Net Loss for the Ports and Terminals segment for the years ended December 31, 2017 and 2016:
Year Ended December 31, | Change | ||||||||||
2017 | 2016 | ||||||||||
(in thousands) | |||||||||||
Revenues | |||||||||||
Infrastructure revenues | |||||||||||
Lease income | $ | 1,111 | $ | 32 | $ | 1,079 | |||||
Other revenue | 3,712 | — | 3,712 | ||||||||
Total revenues | 4,823 | 32 | 4,791 | ||||||||
Expenses | |||||||||||
Operating expenses | 9,117 | 628 | 8,489 | ||||||||
Depreciation and amortization | 1,658 | 4 | 1,654 | ||||||||
Interest expense | 1,088 | 545 | 543 | ||||||||
Total expenses | 11,863 | 1,177 | 10,686 | ||||||||
Loss before income taxes | (7,040 | ) | (1,145 | ) | (5,895 | ) | |||||
Provision for income taxes | — | 13 | (13 | ) | |||||||
Net loss | (7,040 | ) | (1,158 | ) | (5,882 | ) | |||||
Less: Net loss attributable to non-controlling interest in consolidated subsidiaries | (484 | ) | (157 | ) | (327 | ) | |||||
Net loss attributable to shareholders | $ | (6,556 | ) | $ | (1,001 | ) | $ | (5,555 | ) | ||
Add: Provision for income taxes | — | 13 | (13 | ) | |||||||
Add: Equity-based compensation expense | 295 | — | 295 | ||||||||
Add: Acquisition and transaction expenses | — | — | — | ||||||||
Add: Losses on the modification or extinguishment of debt and capital lease obligations | — | — | — | ||||||||
Add: Changes in fair value of non-hedge derivative instruments | — | — | — | ||||||||
Add: Asset impairment charges | — | — | — | ||||||||
Add: Pro-rata share of Adjusted Net Income from unconsolidated entities | — | — | — | ||||||||
Add: Incentive allocations | — | — | — | ||||||||
Less: Cash payments for income taxes | 4 | (5 | ) | 9 | |||||||
Less: Equity in earnings of unconsolidated entities | — | — | — | ||||||||
Less: Non-controlling share of Adjusted Net Income | — | — | — | ||||||||
Adjusted Net Loss | $ | (6,257 | ) | $ | (993 | ) | $ | (5,264 | ) | ||
56
The following table sets forth a reconciliation of net loss attributable to shareholders to Adjusted EBITDA for the Ports and Terminals segment for the years ended December 31, 2017 and December 31, 2016:
Year Ended December 31, | Change | ||||||||||
2017 | 2016 | ||||||||||
(in thousands) | |||||||||||
Net (loss)/income attributable to shareholders | $ | (6,556 | ) | $ | (1,001 | ) | $ | (5,555 | ) | ||
Add: Provision for income taxes | — | 13 | (13 | ) | |||||||
Add: Equity-based compensation expense | 295 | — | 295 | ||||||||
Add: Acquisition and transaction expenses | — | — | — | ||||||||
Add: Losses on the modification or extinguishment of debt and capital lease obligations | — | — | — | ||||||||
Add: Changes in fair value of non-hedge derivative instruments | — | — | — | ||||||||
Add: Asset impairment charges | — | — | — | ||||||||
Add: Incentive allocations | — | — | — | ||||||||
Add: Depreciation and amortization expense | 1,658 | 4 | 1,654 | ||||||||
Add: Interest expense | 1,089 | 545 | 544 | ||||||||
Add: Pro-rata share of Adjusted EBITDA from unconsolidated entities | — | — | — | ||||||||
Less: Equity in earnings of unconsolidated entities | — | — | — | ||||||||
Less: Non-controlling share of Adjusted EBITDA (1) | — | (55 | ) | 55 | |||||||
Adjusted EBITDA (non-GAAP) | $ | (3,514 | ) | $ | (494 | ) | $ | (3,020 | ) | ||
________________________________________________________
(1) Non-controlling share of Adjusted EBITDA is comprised of the following items for the years ended December 31, 2017 and 2016: interest expense of $0 and $55.
Revenues
Total revenues in the Ports and Terminals segment increased $4,791 in the year ended December 31, 2017 due to butane sales at Repauno of $3,021, recorded in other revenue, as well as the leases that were in place at Long Ridge upon the acquisition of $1,017, recorded in lease revenue.
Expenses
Total expenses in the Ports and Terminals segment increased $10,686 in the year ended December 31, 2017, compared to the year ended December 31, 2016.
The increase of $10,686 primarily consists of $8,489 in operating expense, $1,654 in depreciation expense related to property, plant and equipment, and interest expense of $543 related to the payment obligation to the non-controlling interest holder as part of the Repauno purchase. The increase in operating expenses was driven by higher (i) compensation and benefits of $2,647, (ii) cost of sales of $1,977 related to the sale of butane, (iii) professional fees of $1,413, (iv) facility operations of $1,302, (v) other operating expenses of $1,150 in the year ended December 31, 2017 compared to the year ended December 31, 2016. The increase in depreciation expense is related to the cavern being put into service at Repauno, and assets in service at Long Ridge.
Adjusted Net Loss
Adjusted Net Loss increased $5,264 in the year ended December 31, 2017, compared to the year ended December 31, 2016. In addition to the changes in net loss attributable to shareholders noted above, Adjusted Net Loss was impacted by equity-based compensation expense of $295 in the year ended December 31, 2017.
Adjusted EBITDA (Non-GAAP)
Adjusted EBITDA was $(3,514) in the year ended December 31, 2017, decreasing $3,020 compared to the year ended December 31, 2016. In addition to the changes in net loss attributable to shareholders noted above, Adjusted EBITDA was also impacted primarily by equity-based compensation expense of $295, an increase in depreciation and amortization of $1,654, and an increase in interest expense of $544, in the year ended December 31, 2017 compared to the year ended December 31, 2016.
57
Corporate
The following table presents our results of operations and reconciliation of net loss attributable to shareholders to Adjusted Net Loss for Corporate for the years ended December 31, 2017 and December 31, 2016:
Year Ended December 31, | Change | ||||||||||
2017 | 2016 | ||||||||||
(in thousands) | |||||||||||
Expenses | |||||||||||
Operating expenses | $ | — | $ | 14 | $ | (14 | ) | ||||
General and administrative | 14,570 | 12,314 | 2,256 | ||||||||
Acquisition and transaction expenses | 6,865 | 5,836 | 1,029 | ||||||||
Management fees and incentive allocation to affiliate | 15,732 | 16,742 | (1,010 | ) | |||||||
Interest expense | 19,472 | — | 19,472 | ||||||||
Total expenses | 56,639 | 34,906 | 21,733 | ||||||||
Other expense | |||||||||||
Loss on extinguishment of debt | (2,456 | ) | — | (2,456 | ) | ||||||
Total other expense | (2,456 | ) | — | (2,456 | ) | ||||||
Net loss | (59,095 | ) | (34,906 | ) | (24,189 | ) | |||||
Less: Net loss attributable to non-controlling interest in consolidated subsidiaries | — | (11 | ) | 11 | |||||||
Net loss attributable to shareholders | $ | (59,095 | ) | $ | (34,895 | ) | $ | (24,200 | ) | ||
Add: Provision for income taxes | — | — | — | ||||||||
Add: Equity-based compensation expense | — | — | — | ||||||||
Add: Acquisition and transaction expenses | 6,865 | 5,836 | 1,029 | ||||||||
Add: Losses on the modification or extinguishment of debt and capital lease obligations | 2,456 | — | 2,456 | ||||||||
Add: Changes in fair value of non-hedge derivative instruments | — | — | — | ||||||||
Add: Asset impairment charges | — | — | — | ||||||||
Add: Pro-rata share of Adjusted Net Income from unconsolidated entities | — | — | — | ||||||||
Add: Incentive allocations | 514 | — | 514 | ||||||||
Less: Cash payments for income taxes | (25 | ) | (14 | ) | (11 | ) | |||||
Less: Equity in earnings of unconsolidated entities | — | — | — | ||||||||
Less: Non-controlling share of Adjusted Net Income | — | — | — | ||||||||
Adjusted Net Loss | $ | (49,285 | ) | $ | (29,073 | ) | $ | (20,212 | ) | ||
58
The following table sets forth a reconciliation of net loss attributable to shareholders to Adjusted EBITDA for Corporate for the years ended December 31, 2017 and December 31, 2016:
Year Ended December 31, | Change | ||||||||||
2017 | 2016 | ||||||||||
(in thousands) | |||||||||||
Net loss attributable to shareholders | $ | (59,095 | ) | $ | (34,895 | ) | $ | (24,200 | ) | ||
Add: Provision for income taxes | — | — | — | ||||||||
Add: Equity-based compensation expense | — | — | — | ||||||||
Add: Acquisition and transaction expenses | 6,865 | 5,836 | 1,029 | ||||||||
Add: Losses on the modification or extinguishment of debt and capital lease obligations | 2,456 | — | 2,456 | ||||||||
Add: Changes in fair value of non-hedge derivative instruments | — | — | — | ||||||||
Add: Asset impairment charges | — | — | — | ||||||||
Add: Incentive allocations | 514 | — | 514 | ||||||||
Add: Depreciation and amortization expense | — | — | — | ||||||||
Add: Interest expense | 19,472 | — | 19,472 | ||||||||
Add: Pro-rata share of Adjusted EBITDA from unconsolidated entities | — | — | — | ||||||||
Less: Equity in earnings of unconsolidated entities | — | — | — | ||||||||
Less: Non-controlling share of Adjusted EBITDA | — | — | — | ||||||||
Adjusted EBITDA | $ | (29,788 | ) | $ | (29,059 | ) | $ | (729 | ) | ||
Expenses
Total expenses increased $21,733 in the year ended December 31, 2017 compared to the year ended December 31, 2016, respectively. For the year ended December 31, 2017, the increase primarily consists of (i) interest expense of $19,472 related to the Senior Notes entered into during 2017, (ii) higher general and administrative expenses of $2,256, including $763 of reimbursement expenses to our manager, $410 of general corporate costs, and $1,083 of professional fees related to SOX expenses, and (iii) higher acquisition and transaction costs of $1,029 related to reimbursement expenses to our manager as we continue to evaluate new investments. These increases were partially offset by lower management fees of $1,010 due to a lower equity balance in the year ended December 31, 2017 compared to the year ended December 31, 2016.
Adjusted Net Loss
Adjusted Net Loss was $49,285 in the year ended December 31, 2017, increasing $20,212, compared to the year ended December 31, 2016. In addition to the changes in net loss attributable to shareholders noted above, Adjusted Net Loss was adjusted by acquisition and transaction expenses related to potential acquisition opportunities which were $1,029 higher for the year ended December 31, 2017, as compared to the year ended December 31, 2016. Additionally, there were $2,456 of losses on the extinguishment of debt during the year ended December 31, 2017, as compared to the year ended December 31, 2016.
Adjusted EBITDA (non-GAAP)
Adjusted EBITDA was $(29,788) in the year ended December 31, 2017, decreasing $729 compared to the year ended December 31, 2016. In addition to the changes in net loss attributable to shareholders noted above, Adjusted EBITDA was affected by acquisition and transaction expenses related to potential acquisition opportunities, which were $1,029 higher for the year ended December 31, 2017, compared to year ended December 31, 2016. Additionally, Adjusted EBITDA was affected by interest expense of $19,472 related to the Senior Notes and Revolving Line of Credit entered into during the year ended December 31, 2017. The Company also incurred $2,456 of losses on the extinguishment of debt during the year ended December 31, 2017, as compared to the year ended December 31, 2016.
59
Comparison of the year ended December 31, 2016 to the year ended December 31, 2015
The following table presents our consolidated results of operations and reconciliation of net loss attributable to shareholders to Adjusted Net Income (Loss) for the years ended December 31, 2016 and December 31, 2015:
Year Ended December 31, | Change | ||||||||||
2016 | 2015 | ||||||||||
(in thousands) | |||||||||||
Revenues | |||||||||||
Equipment leasing revenues | |||||||||||
Lease income | $ | 69,736 | $ | 64,883 | $ | 4,853 | |||||
Maintenance revenue | 28,697 | 17,286 | 11,411 | ||||||||
Finance lease income | 2,723 | 8,747 | (6,024 | ) | |||||||
Other revenue | 793 | 1,827 | (1,034 | ) | |||||||
Total equipment leasing revenues | 101,949 | 92,743 | 9,206 | ||||||||
Infrastructure revenues | |||||||||||
Lease income | 32 | 4,620 | (4,588 | ) | |||||||
Rail revenues | 30,837 | 25,550 | 5,287 | ||||||||
Terminal services revenues | 15,902 | 13,655 | 2,247 | ||||||||
Total infrastructure revenues | 46,771 | 43,825 | 2,946 | ||||||||
Total revenues | 148,720 | 136,568 | 12,152 | ||||||||
Expenses | |||||||||||
Operating expenses | 66,169 | 68,793 | (2,624 | ) | |||||||
General and administrative | 12,314 | 7,568 | 4,746 | ||||||||
Acquisition and transaction expenses | 6,316 | 5,683 | 633 | ||||||||
Management fees and incentive allocation to affiliate | 16,742 | 15,018 | 1,724 | ||||||||
Depreciation and amortization | 60,210 | 45,308 | 14,902 | ||||||||
Interest expense | 18,957 | 19,311 | (354 | ) | |||||||
Total expenses | 180,708 | 161,681 | 19,027 | ||||||||
Other expense | |||||||||||
Equity in losses of unconsolidated entities | (5,992 | ) | (6,956 | ) | 964 | ||||||
Gain on sale of assets, net | 5,941 | 3,419 | 2,522 | ||||||||
Loss on extinguishment of debt | (1,579 | ) | — | (1,579 | ) | ||||||
Asset impairment | (7,450 | ) | — | (7,450 | ) | ||||||
Interest income | 136 | 579 | (443 | ) | |||||||
Other income | 602 | 26 | 576 | ||||||||
Total other expense | (8,342 | ) | (2,932 | ) | (5,410 | ) | |||||
Loss before income taxes | (40,330 | ) | (28,045 | ) | (12,285 | ) | |||||
Provision for income taxes | 268 | 586 | (318 | ) | |||||||
Net loss | (40,598 | ) | (28,631 | ) | (11,967 | ) | |||||
Less: Net loss attributable to non-controlling interest in consolidated subsidiaries | (20,534 | ) | (16,805 | ) | (3,729 | ) | |||||
Net loss attributable to shareholders | $ | (20,064 | ) | $ | (11,826 | ) | $ | (8,238 | ) | ||
Add: Provision for income taxes | 268 | 586 | (318 | ) | |||||||
Add: Equity-based compensation expense (income) | (3,672 | ) | 4,662 | (8,334 | ) | ||||||
Add: Acquisition and transaction expenses | 6,316 | 5,683 | 633 | ||||||||
Add: Losses on the modification or extinguishment of debt and capital lease obligations | 1,579 | — | 1,579 | ||||||||
Add: Changes in fair value of non-hedge derivative instruments | 3 | 14 | (11 | ) | |||||||
60
Year Ended December 31, | Change | ||||||||||
2016 | 2015 | ||||||||||
(in thousands) | |||||||||||
Add: Asset impairment charges | 7,450 | — | 7,450 | ||||||||
Add: Pro-rata share of Adjusted Net Income (Loss) from unconsolidated entities (1) | (2,905 | ) | 3,552 | (6,457 | ) | ||||||
Add: Incentive allocations | — | — | — | ||||||||
Less: Cash payments for income taxes | (654 | ) | (507 | ) | (147 | ) | |||||
Less: Equity in losses of unconsolidated entities | 5,992 | 6,956 | (964 | ) | |||||||
Less: Non-controlling share of Adjusted Net Income (Loss) (2) | (2,945 | ) | (1,333 | ) | (1,612 | ) | |||||
Adjusted Net (Loss) Income | $ | (8,632 | ) | $ | 7,787 | $ | (16,419 | ) | |||
______________________________________________________________________________________
(1) Pro-rata share of Adjusted Net Income (Loss) from unconsolidated entities for the years ended December 31, 2016 and 2015 includes the Company’s proportionate share of the unconsolidated entities’ asset impairment charges of $3,068 and $10,508, respectively.
(2) Non-controlling share of Adjusted Net Income (Loss) is comprised of the following for the years ended December 31, 2016 and 2015: (i) equity-based compensation of $(1,561) and $1,387, (ii) provision for income tax of $29 and $16, (iii) loss on extinguishment of debt of $616 and $0, (iv) asset impairment charges of $3,725 and $0, (v) transaction and acquisition expense of $156 and $0 less (vi) cash tax payments of $20 and $70, respectively.
The following table sets forth a reconciliation of net loss attributable to shareholders to Adjusted EBITDA for the year ended December 31, 2016 and December 31, 2015:
Year Ended December 31, | Change | ||||||||||
2016 | 2015 | ||||||||||
(in thousands) | |||||||||||
Net loss attributable to shareholders | $ | (20,064 | ) | $ | (11,826 | ) | $ | (8,238 | ) | ||
Add: Provision for income taxes | 268 | 586 | (318 | ) | |||||||
Add: Equity-based compensation expense (income) | (3,672 | ) | 4,662 | (8,334 | ) | ||||||
Add: Acquisition and transaction expenses | 6,316 | 5,683 | 633 | ||||||||
Add: Losses on the modification or extinguishment of debt and capital lease obligations | 1,579 | — | 1,579 | ||||||||
Add: Changes in fair value of non-hedge derivative instruments | 3 | 14 | (11 | ) | |||||||
Add: Asset impairment charges | 7,450 | — | 7,450 | ||||||||
Add: Incentive allocations | — | — | — | ||||||||
Add: Depreciation and amortization expense (3) | 65,656 | 52,324 | 13,332 | ||||||||
Add: Interest expense | 18,957 | 19,311 | (354 | ) | |||||||
Add: Pro-rata share of Adjusted EBITDA from unconsolidated entities (4) | 1,196 | 6,987 | (5,791 | ) | |||||||
Less: Equity in losses of unconsolidated entities | 5,992 | 6,956 | (964 | ) | |||||||
Less: Non-controlling share of Adjusted EBITDA (5) | (14,653 | ) | (12,075 | ) | (2,578 | ) | |||||
Adjusted EBITDA (non-GAAP) | $ | 69,028 | $ | 72,622 | $ | (3,594 | ) | ||||
________________________________________________________
(3) Depreciation and amortization expense includes $60,210 and $45,308 of depreciation and amortization expense, $4,979 and $6,774 of lease intangible amortization, and $467 and $242 of amortization for lease incentives in the years ended December 31, 2016 and 2015, respectively.
(4) Pro-rata share of Adjusted EBITDA from unconsolidated entities includes the following items for the years ended December 31, 2016 and 2015: (i) net income (loss) of $(6,161) and $(7,165), (ii) interest expense of $1,323 and $1,778, (iii) depreciation and amortization expense of $2,966 and $1,866, and (iv) asset impairment charges of $3,068 and $10,508, respectively.
(5) Non-controlling share of Adjusted EBITDA is comprised of the following items for the years ended December 31, 2016 and 2015: (i) equity based compensation of $(1,561) and $1,387, (ii) provision for income taxes of $29 and $16, (iii) interest expense of $5,124 and $4,926, (iv) depreciation and amortization expense of $6,564 and $5,746, (v) loss on extinguishment of debt of $616 and $0, (vi) asset impairment charge of $3,725 and $0, and (vii) transaction and acquisition expense of $156 and $0, respectively.
61
Revenues
For the year ended December 31, 2016 total revenues increased by $12,152 compared to the year ended December 31, 2015 driven mainly by higher revenues in the Aviation and Railroad segments offset by lower revenues in the Offshore Energy, Shipping Containers and Jefferson Terminal segments.
In Equipment Leasing, lease income increased by $4,853 in the year ended December 31, 2016 as compared to the year ended December 31, 2015 driven by an increase in assets on lease in the Aviation Leasing segment. The Offshore Energy segment offset the increase in the lease income as certain vessels were off hire, subject to short term lease arrangements and due to lower lease rates as a result of unfavorable market conditions. Maintenance revenue increased by $11,411 in the year ended December 31, 2016 as compared to the year ended December 31, 2015 as we increased the number of aircraft and engines subject to leases with maintenance arrangements. Our increase in lease income and maintenance revenues were offset by a $6,024 decrease in finance income for the year ended December 31, 2016 as compared to the year ended December 31, 2015 primarily driven by the sale of 42,000 shipping containers during the first quarter of 2016 and lower finance lease income as a result of the amortization of the underlying principal balances. Additionally, other revenues decreased by $1,034 mainly as a result of declining market conditions in the Offshore Energy segment as we continue to seek favorable leases.
In Infrastructure, rail revenues increased by $5,287 in the year ended December 31, 2016 as compared to the year ended December 31, 2015 due to an increase in traffic and expanded service offerings by our Railroad segment. The Jefferson Terminal segment had an increase in terminal service revenue of $2,247 in the year ended December 31, 2016 as compared to the year ended December 31, 2015 primarily due to a higher tank lease revenue as a result of new lease contracts. The aforementioned increases were offset by a decrease in lease income of $4,588 in the year ended December 31, 2016 as compared to the year ended December 31, 2015 due to the expiration of the railcar lease arrangement in the second half of 2015.
Expenses
For the year ended December 31, 2016, total expenses increased by $19,027 compared to the year ended December 31, 2015 mainly due to increases in general and administrative expenses and depreciation and amortization, which were offset by a decrease in operating expenses and interest expense.
General and administrative expenses increased by $4,746 in the year ended December 31, 2016 as compared to the year ended December 31, 2015 attributable to the higher reimbursements to our Manager, pursuant to new agreements put in place subsequent to our IPO in May of 2015.
Depreciation and amortization increased by $14,902 in the year ended December 31, 2016 as compared to the year ended December 31, 2015 primarily due to additional assets acquired in the Aviation Leasing segment and assets placed into service in the Jefferson Terminal segment.
Operating expenses decreased by $2,624 in the year ended December 31, 2016 as compared to the year ended December 31, 2015 primarily due to a decrease in (i) stock compensation of $8,311 and (ii) facility operations of $5,211 primarily in the Jefferson Terminal segment due to lower volumes. Offsetting the decrease were higher (i) operating taxes of $1,776 primarily due to additional property, plant and equipment placed into service in the Jefferson Terminal segment, (ii) higher operating expenses of $7,065 primarily in to the Offshore Energy segment since, due to the short term nature of the lease arrangements operating expenses are borne by us, (iii) environmental cleanup costs of $578 in the Jefferson Terminal segment net of insurance reimbursements (iv) professional fees of $673 primarily in Offshore Energy and Aviation, (v) compensation and benefits of $796, and (vi) incurred expenses from our growing business units, including Repauno.
Interest expense decreased by $354 in the year ended December 31, 2016 as compared to the year ended December 31, 2015 primarily driven by Shipping Containers due to lower principal balances on the term loans, along with the termination of the term loan in conjunction with the sale of the shipping containers during the first quarter of 2016. The decrease was offset by the Dock and Wharf Facility Revenue Bonds, Series 2016 (the “Series 2016 Bonds”) issued in March 2016.
Other Expenses
Total other expenses increased by $5,410 in the year ended December 31, 2016 as compared to the year ended December 31, 2015 primarily due to an asset impairment charge of $7,450 as we determined not to proceed with the purchase of the MT6015 Vessel (Note 2 of our consolidated financial statements). Additionally, we recognized a $1,579 loss on extinguishment of debt due to an early repayment of debt in the Jefferson Terminal segment. The aforementioned increases in other expenses were offset by a $964 decrease in losses of unconsolidated entities primarily related to a shipping container joint venture in the year ended December 31, 2016 as compared to the year ended December 31, 2015 primarily due to a higher asset impairment charge recorded by the shipping container joint venture during 2015. The increases in other expenses were additionally offset by higher gains on sale of aviation equipment and finance leases of $2,522 in the year ended December 31, 2016 as compared to the year ended December 31, 2015.
Net Loss
Net loss attributable to shareholders increased by $8,238 in the year ended December 31, 2016 as compared to the year ended December 31, 2015 driven primarily by the changes discussed above.
62
Adjusted Net (Loss) Income
Adjusted Net Income decreased by $16,419 in the year ended December 31, 2016 as compared to the year ended December 31, 2015, in addition to the changes in revenue, expenses and other expenses noted above, the decrease in the period was driven by a decrease in (i) equity based compensation of $8,334, (ii) pro-rata share of Adjusted Net Income of $6,457, (iii) losses of unconsolidated entities of $964, and (iv) non-controlling share of Adjusted Net income of $1,612. The decrease was offset by an increase in in asset impairment charges of $7,450 and losses from the extinguishment of debt of $1,579.
Adjusted EBITDA (Non-GAAP)
Adjusted EBITDA was $69,028 for the year ended December 31, 2016 decreasing by $3,594 as compared to the year ended December 31, 2015. In addition to the changes in revenue, expenses and other losses noted above, which resulted in a net loss attributable to shareholders, the change was primarily due to (i) the pro-rata share of Adjusted EBITDA from unconsolidated entities, (ii) lower equity-based compensation and (iii) lower non-controlling share of Adjusted EBITDA, and (iv) equity in earnings of unconsolidated entities.
The change was offset by depreciation and amortization expense from additional assets acquired and placed into service, and interest expense on borrowings executed in the first quarter of 2016. Additionally, for the year ended December 31, 2016, there was an increase in the asset impairment changes and losses from the extinguishment of debt.
Aviation Leasing Segment
As of December 31, 2016, in our Aviation Leasing segment, we own and manage 92 aviation assets, including 26 aircraft and 66 commercial jet engines.
As of December 31, 2016, 24 of our commercial aircraft and 46 of our jet engines were leased to operators or other third parties. Aviation assets currently off lease are either undergoing repair and/or maintenance, being prepared to go on lease or held in short term storage awaiting a future lease. Our aviation equipment was approximately 85% utilized as of December 31, 2016, based on the equity value of our on-hire leasing equipment as a percentage of the total equity value of our aviation leasing equipment. Our aircraft currently have a weighted average remaining lease term of 31 months, and our jet engines currently on-lease have an average remaining lease term of 12 months. The table below provides additional information on the assets in our Aviation Leasing segment:
Aviation Assets | Widebody | Narrowbody | Total | |||||
Aircraft | ||||||||
Assets at January 1, 2016 | 3 | 15 | 18 | |||||
Purchases | 4 | 5 | 9 | |||||
Sales | — | (1 | ) | (1 | ) | |||
Assets at December 31, 2016 | 7 | 19 | 26 | |||||
Jet Engines | ||||||||
Assets at January 1, 2016 | 18 | 24 | 42 | |||||
Purchases | 20 | 8 | 28 | |||||
Sales | — | (4 | ) | (4 | ) | |||
Assets at December 31, 2016 | 38 | 28 | 66 | |||||
63
The following table presents our results of operations and reconciliation of net income attributable to shareholders to Adjusted Net Income for the Aviation Leasing segment for the years ended December 31, 2016 and December 31, 2015:
Year Ended December 31, | Change | ||||||||||
2016 | 2015 | ||||||||||
(in thousands) | |||||||||||
Revenues | |||||||||||
Equipment leasing revenues | |||||||||||
Lease income | $ | 66,024 | $ | 42,924 | $ | 23,100 | |||||
Maintenance revenue | 28,697 | 17,286 | 11,411 | ||||||||
Other revenue | 687 | 1,120 | (433 | ) | |||||||
Total revenues | 95,408 | 61,330 | 34,078 | ||||||||
Expenses | |||||||||||
Operating expenses | 4,609 | 2,820 | 1,789 | ||||||||
Depreciation and amortization | 36,369 | 23,549 | 12,820 | ||||||||
Total expenses | 41,058 | 26,369 | 14,689 | ||||||||
Other income | |||||||||||
Gain on sale of assets, net | 5,214 | 3,053 | 2,161 | ||||||||
Interest income | 142 | 11 | 131 | ||||||||
Total other income | 5,356 | 3,064 | 2,292 | ||||||||
Income before income taxes | 59,706 | 38,025 | 21,681 | ||||||||
Provision for income taxes | 267 | 668 | (401 | ) | |||||||
Net income | 59,439 | 37,357 | 22,082 | ||||||||
Less: Net income attributable to non-controlling interest in consolidated subsidiaries | 435 | 21 | 414 | ||||||||
Net income attributable to shareholders | $ | 59,004 | $ | 37,336 | $ | 21,668 | |||||
Add: Provision for income taxes | 267 | 668 | (401 | ) | |||||||
Add: Equity-based compensation expense | — | — | — | ||||||||
Add: Acquisition and transaction expenses | 80 | — | 80 | ||||||||
Add: Losses on the modification or extinguishment of debt and capital lease obligations | — | — | — | ||||||||
Add: Changes in fair value of non-hedge derivative instruments | — | — | — | ||||||||
Add: Asset impairment charges | — | — | — | ||||||||
Add: Pro-rata share of Adjusted Net Income from unconsolidated entities | — | — | — | ||||||||
Add: Incentive allocations | — | — | — | ||||||||
Less: Cash payments for income taxes | (583 | ) | (227 | ) | (356 | ) | |||||
Less: Equity in earnings of unconsolidated entities | — | — | — | ||||||||
Less: Non-controlling share of Adjusted Net Income | — | — | — | ||||||||
Adjusted Net Income | $ | 58,768 | $ | 37,777 | $ | 20,991 | |||||
64
The following table sets forth a reconciliation of net income attributable to shareholders to Adjusted EBITDA for the Aviation Leasing segment for the year ended December 31, 2016 and December 31, 2015:
Year Ended December 31, | Change | ||||||||||
2016 | 2015 | ||||||||||
(in thousands) | |||||||||||
Net income attributable to shareholders | $ | 59,004 | $ | 37,336 | $ | 21,668 | |||||
Add: Provision for income taxes | 267 | 668 | (401 | ) | |||||||
Add: Equity-based compensation expense | — | — | — | ||||||||
Add: Acquisition and transaction expenses | 80 | — | 80 | ||||||||
Add: Losses on the modification or extinguishment of debt and capital lease obligations | — | — | — | ||||||||
Add: Changes in fair value of non-hedge derivative instruments | — | — | — | ||||||||
Add: Asset impairment charges | — | — | — | ||||||||
Add: Incentive allocations | — | — | — | ||||||||
Add: Depreciation and amortization expense (1) | 41,816 | 30,565 | 11,251 | ||||||||
Add: Interest expense | — | — | — | ||||||||
Add: Pro-rata share of Adjusted EBITDA from unconsolidated entities | — | — | — | ||||||||
Less: Equity in earnings of unconsolidated entities | — | — | — | ||||||||
Less: Non-controlling share of Adjusted EBITDA(2) | (164 | ) | (21 | ) | (143 | ) | |||||
Adjusted EBITDA (non-GAAP) | $ | 101,003 | $ | 68,548 | $ | 32,455 | |||||
______________________________________________________________________________________
(1) Depreciation and amortization expense includes $36,369 and $23,549 of depreciation expense, $4,979 and $6,774 of lease intangible amortization, and $468 and $242 of amortization for lease incentives in the years ended December 31, 2016 and 2015, respectively.
(2) Non-controlling share of Adjusted EBITDA is comprised of depreciation expense of $164 and $21 for the years ended December 31, 2016 and 2015, respectively.
Revenues
Total revenues in the Aviation Leasing segment increased by $34,078 in the year ended December 31, 2016 as compared to the year ended December 31, 2015, driven by higher lease income and maintenance revenue offset by a decrease in other revenue. Lease income increased by $23,100 in the year ended December 31, 2016 as compared to the year ended December 31, 2015 mainly due to an increase in (i) aircraft lease income of $18,081 primarily driven by the addition of nine aircraft on lease and (ii) engine lease income of $5,019 primarily driven by an increase in the number of engines which have generated revenue from 32 in the year ended December 31, 2015 to 50 in the year ended December 31, 2016. Maintenance revenue increased by $11,411 in the year ended December 31, 2016 as compared to the year ended December 31, 2015 due to an increase in the number of aircraft and engines on lease. Other revenue decreased by $433 primarily due to greater security deposits included in earnings in the year ended December 31, 2015, as compared to the year ended December 31, 2016.
Expenses
Total expenses in the Aviation Leasing segment increased by $14,689 in the year ended December 31, 2016 as compared to the year ended December 31, 2015, primarily due to an increase in depreciation and amortization expense and an increase in operating expenses. Depreciation and amortization expense increased by $12,820 driven by additional aircraft and engines owned and on lease in the year ended December 31, 2016 as compared to the year ended December 31, 2015. Operating expenses increased by $1,789 in the year ended December 31, 2016 as compared to the year ended December 31, 2015, primarily the result of increases in professional fee expenses of $812, servicer expense of $376, and shipping and storage fees of $320, due to growth and expansion of the Aviation Leasing segment.
Other Income
Total other income in the Aviation Leasing segment increased by $2,292 in the year ended December 31, 2016 as compared to the year ended December 31, 2015, driven by the gain on sale of assets.
Adjusted Net Income
Adjusted Net Income in the Aviation Leasing segment was $58,768 in the year ended December 31, 2016 increasing by $20,991 as compared to the year ended December 31, 2015 primarily driven by the changes to net income attributable to shareholders noted above, adjusted for the provision for income taxes and cash payments for income taxes.
65
Adjusted EBITDA (Non-GAAP)
Adjusted EBITDA in the Aviation Leasing segment was $101,003 for the year ended December 31, 2016 increasing by $32,455 as compared to the year ended December 31, 2015. In addition to the changes in net income attributable to shareholders noted above, this movement was primarily due to higher depreciation and amortization expense for the additional aircraft and engines owned and on lease in the year ended December 31, 2016, offset by a decrease in the provision for income tax and an increase in the non-controlling interest share of Adjusted EBITDA.
Offshore Energy Segment
In our Offshore Energy segment, we own one remotely operated vehicle (“ROV”) support vessel, one construction support vessel and one anchor handling tug supply (“AHTS”) vessel. The chart below describes the assets in our Offshore Energy segment as of December 31, 2016:
Offshore Energy Assets | |||
Asset Type | Year Built | Description | Economic Interest (%) |
AHTS Vessel | 2010 | Anchor handling tug supply vessel with accommodation for 30 personnel and a total bollard pull of 68.5 tons | 100% |
Construction Support Vessel | 2014 | DP-3 construction support and well intervention vessel with 250-ton main crane, 2,000 square meter open deck space, moon pool and accommodation for 100 personnel | 100% |
ROV Support Vessel | 2011 | DP-2 dive and ROV support vessel with 50-ton crane, moon pool and accommodation for 120 personnel | 85% |
66
The following table presents our results of operations and reconciliation of net (loss) income attributable to shareholders to Adjusted Net (Loss) Income for the Offshore Energy segment for the year ended December 31, 2016 and December 31, 2015:
Year Ended December 31, | Change | ||||||||||
2016 | 2015 | ||||||||||
(in thousands) | |||||||||||
Revenues | |||||||||||
Equipment leasing revenues | |||||||||||
Lease income | $ | 3,712 | $ | 21,959 | $ | (18,247 | ) | ||||
Finance lease income | 1,610 | 1,665 | (55 | ) | |||||||
Other revenue | 6 | 607 | (601 | ) | |||||||
Total revenues | 5,328 | 24,231 | (18,903 | ) | |||||||
Expenses | |||||||||||
Operating expenses | 11,014 | 4,650 | 6,364 | ||||||||
Depreciation and amortization | 6,411 | 5,967 | 444 | ||||||||
Interest expense | 3,747 | 3,794 | (47 | ) | |||||||
Total expenses | 21,172 | 14,411 | 6,761 | ||||||||
Other (expense) income | |||||||||||
Asset impairment | (7,450 | ) | — | (7,450 | ) | ||||||
Interest income | 13 | 483 | (470 | ) | |||||||
Total other (expense) income | (7,437 | ) | 483 | (7,920 | ) | ||||||
(Loss) income before income taxes | (23,281 | ) | 10,303 | (33,584 | ) | ||||||
Provision for income taxes | — | — | — | ||||||||
Net (loss) income | (23,281 | ) | 10,303 | (33,584 | ) | ||||||
Less: Net (loss) income attributable to non-controlling interest in consolidated subsidiaries | (4,368 | ) | 676 | (5,044 | ) | ||||||
Net (loss) income attributable to shareholders | $ | (18,913 | ) | $ | 9,627 | $ | (28,540 | ) | |||
Add: Provision for income taxes | — | — | — | ||||||||
Add: Equity-based compensation expense | — | — | — | ||||||||
Add: Acquisition and transaction expenses | — | — | — | ||||||||
Add: Losses on the modification or extinguishment of debt and capital lease obligations | — | — | — | ||||||||
Add: Changes in fair value of non-hedge derivative instruments | — | — | — | ||||||||
Add: Asset impairment charges | 7,450 | — | 7,450 | ||||||||
Add: Pro-rata share of Adjusted Net Income from unconsolidated entities | — | — | — | ||||||||
Add: Incentive allocations | — | — | — | ||||||||
Less: Cash payments for income taxes | — | — | — | ||||||||
Less: Equity in earnings of unconsolidated entities | — | — | — | ||||||||
Less: Non-controlling share of Adjusted Net Income (1) | (3,725 | ) | — | (3,725 | ) | ||||||
Adjusted Net (Loss) Income | $ | (15,188 | ) | $ | 9,627 | $ | (24,815 | ) | |||
______________________________________________________________________________________
(1) Non-controlling share of Adjusted Net Income (Loss) is comprised of asset impairment charges of $3,725 and $0 for the years ended December 31, 2016 and 2015, respectively.
67
The following table sets forth a reconciliation of net (loss) income attributable to shareholders to Adjusted EBITDA for the Offshore Energy segment for the years ended December 31, 2016 and December 31, 2015:
Year Ended December 31, | Change | ||||||||||
2016 | 2015 | ||||||||||
(in thousands) | |||||||||||
Net (loss) income attributable to shareholders | $ | (18,913 | ) | $ | 9,627 | $ | (28,540 | ) | |||
Add: Provision for income taxes | — | — | — | ||||||||
Add: Equity-based compensation expense | — | — | — | ||||||||
Add: Acquisition and transaction expenses | — | — | — | ||||||||
Add: Losses on the modification or extinguishment of debt and capital lease obligations | — | — | — | ||||||||
Add: Changes in fair value of non-hedge derivative instruments | — | — | — | ||||||||
Add: Asset impairment charges | 7,450 | — | 7,450 | ||||||||
Add: Incentive allocations | — | — | — | ||||||||
Add: Depreciation and amortization expense | 6,411 | 5,967 | 444 | ||||||||
Add: Interest expense | 3,747 | 3,794 | (47 | ) | |||||||
Add: Pro-rata share of Adjusted EBITDA from unconsolidated entities | — | — | — | ||||||||
Less: Equity in earnings of unconsolidated entities | — | — | — | ||||||||
Less: Non-controlling share of Adjusted EBITDA (2) | (4,084 | ) | (345 | ) | (3,739 | ) | |||||
Adjusted EBITDA (non-GAAP) | $ | (5,389 | ) | $ | 19,043 | $ | (24,432 | ) | |||
________________________________________________________
(2) Non-controlling share of Adjusted EBITDA is comprised of the following items for the years ended December 31, 2016 and 2015: (i) depreciation expense of $245 and $225, (ii) interest expense of $114 and $120, and (iii) asset impairment charges of $3,725 and $0, respectively.
Revenues
Total revenues in the Offshore Energy segment decreased by $18,903 in the year ended December 31, 2016 as compared to the year ended December 31, 2015, primarily driven by lower lease income. In 2016, the offshore construction support vessel was subject to short term lease arrangements, as compared to 2015 when the vessel was on hire under a long term arrangement that terminated in the second half of 2015. In February 2016, the long term lease arrangement for the ROV support vessel was terminated resulting in lower lease income from short term lease arrangements for the year ended December 31, 2016 as compared to the year ended December 31, 2015.
Expenses
Total expenses in the Offshore Energy segment increased by $6,761 in the year ended December 31, 2016 as compared to the year ended December 31, 2015, respectively. Total expenses for the offshore construction support vessel included interest expense on term loan financing, depreciation and amortization expense, and operating expenses.
During the year ended December 31, 2016, there was $4,776 and $1,635 of depreciation expense related to the construction support vessel and ROV support vessel, respectively. During the year ended December 31, 2015, there was $4,468 and $1,499 of depreciation expense related to the construction support vessel and ROV support vessel, respectively.
During the year ended December 31, 2016, there was $3,634 and $113 of interest expense primarily related to financing for the construction support vessel and ROV support vessel, respectively. During the year ended December 31, 2015, there was $3,674 and $120 of interest expense related to financing for the construction support vessel and ROV support vessel, respectively.
For the year ended December 31, 2016, operating expenses increased $6,364 as compared to the year ended December 31, 2015. Historically, operating expenses were incurred by the bareboat charterers when the ROV support vessel and the offshore construction support vessel were on lease. In 2016, due to the short term nature of the lease arrangements, operating expenses were borne by us. The increase in operating expenses was the result of increased (i) crew costs of $2,308, (ii) legal fees of $1,863, (iii) mobilization and costs for spare parts of $1,216, (iv) management fees of $237 and (v) other operating expenses of $740 in the year ended December 31, 2016 as compared to the year ended December 31, 2015.
68
Other (Expense) Income
Total other income in the Offshore Energy segment decreased by $7,920 in the year ended December 31, 2016 as compared to the year ended December 31, 2015 due to an asset impairment charge of $7,450. In July 2016, the shipbuilder delivered a notice of termination of the ship building contract for MT6015 resulting in the impairment of the investment in the year ended December 31, 2016.
Adjusted Net (Loss) Income
Adjusted Net Loss was $15,188 in the year ended December 31, 2016, a decrease of $24,815 as compared to the year ended December 31, 2015. This loss was due to the changes described above offset by the asset impairment charge of $7,450, which is added back in the determination of Adjusted Net Loss, less the portion shared with our non-controlling interest holder, in the year ended December 31, 2016.
Adjusted EBITDA (Non-GAAP)
Adjusted EBITDA decreased by $24,432 in the year ended December 31, 2016 as compared to the year ended December 31, 2015, due to a decrease in net income attributable to shareholders of $28,540 as noted above. This was offset by the asset impairment charge of $7,450, which was shared with the non-controlling interest holder in the year ended December 31, 2016, and an increase in depreciation and amortization expense of $444 related to the offshore construction vessel in the year ended December 31, 2016 as compared to the year ended December 31, 2015.
Shipping Containers Segment
In our Shipping Containers segment, we own, through a joint venture, interests in approximately 76,000 maritime shipping containers and related equipment through one portfolio. The chart below describes the assets in our Shipping Containers segment as of December 31, 2016:
Shipping Containers Assets | |||||
Number | Type | Average Age | Lease Type | Customer Mix | Economic Interest (%) |
76,000 | 20’ Dry 20’ Reefer 40’ Dry 40’ HC Dry 40’ HC Reefer 45’ Dry | ~9 Years | Direct Finance Lease/Operating Lease | 5 Customers | 51% |
69
The following table presents our results of operations and reconciliation of net loss attributable to shareholders to Adjusted Net (Loss) Income for the Shipping Containers segment for the years ended December 31, 2016 and December 31, 2015:
Year Ended December 31, | Change | ||||||||||
2016 | 2015 | ||||||||||
(in thousands) | |||||||||||
Revenues | |||||||||||
Equipment leasing revenues | |||||||||||
Finance lease income | $ | 1,113 | $ | 7,082 | $ | (5,969 | ) | ||||
Other revenue | 100 | 100 | — | ||||||||
Total revenues | 1,213 | 7,182 | (5,969 | ) | |||||||
Expenses | |||||||||||
Operating expenses | 43 | 350 | (307 | ) | |||||||
Interest expense | 410 | 2,393 | (1,983 | ) | |||||||
Total expenses | 453 | 2,743 | (2,290 | ) | |||||||
Other expense | |||||||||||
Equity in losses of unconsolidated entities | (5,974 | ) | (6,956 | ) | 982 | ||||||
Gain on sale of assets, net | 304 | — | 304 | ||||||||
Other expense | — | (14 | ) | 14 | |||||||
Total other expense | (5,670 | ) | (6,970 | ) | 1,300 | ||||||
Loss before income taxes | (4,910 | ) | (2,531 | ) | (2,379 | ) | |||||
Provision for income taxes | (86 | ) | (127 | ) | 41 | ||||||
Net loss attributable to shareholders | $ | (4,824 | ) | $ | (2,404 | ) | $ | (2,420 | ) | ||
Add: Provision for income taxes | (86 | ) | (127 | ) | 41 | ||||||
Add: Equity-based compensation expense | — | — | — | ||||||||
Add: Acquisition and transaction expenses | — | — | — | ||||||||
Add: Losses on the modification or extinguishment of debt and capital lease obligations | — | — | — | ||||||||
Add: Changes in fair value of non-hedge derivative instruments | 3 | 14 | (11 | ) | |||||||
Add: Asset impairment charges | — | — | — | ||||||||
Add: Pro-rata share of Adjusted Net (Loss) Income from unconsolidated entities (1) | (2,905 | ) | 3,552 | (6,457 | ) | ||||||
Add: Incentive allocations | — | — | — | ||||||||
Less: Cash payments for income taxes | — | — | — | ||||||||
Less: Equity in earnings of unconsolidated entities | 5,974 | 6,956 | (982 | ) | |||||||
Less: Non-controlling share of Adjusted Net Income | — | — | — | ||||||||
Adjusted Net (Loss) Income | $ | (1,838 | ) | $ | 7,991 | $ | (9,829 | ) | |||
________________________________________________________
(1) Pro-rata share of Adjusted Net Income from unconsolidated entities is comprised of the following for the years ended December 31, 2016 and 2015: (i) the Company’s proportionate share of the unconsolidated entities’ net income (loss) of $(6,161) and $(7,112) and (ii) interest expense of $188 and $156, adjusted for (iii) $3,068 and $10,508 of asset impairment charges, respectively.
70
The following table sets forth a reconciliation of net loss attributable to shareholders to Adjusted EBITDA for the Shipping Containers segment for the years ended December 31, 2016 and December 31, 2015:
Year Ended December 31, | Change | ||||||||||
2016 | 2015 | ||||||||||
(in thousands) | |||||||||||
Net loss attributable to shareholders | $ | (4,824 | ) | $ | (2,404 | ) | $ | (2,420 | ) | ||
Add: Provision for income taxes | (86 | ) | (127 | ) | 41 | ||||||
Add: Equity-based compensation expense | — | — | — | ||||||||
Add: Acquisition and transaction expenses | — | — | — | ||||||||
Add: Losses on the modification or extinguishment of debt and capital lease obligations | — | — | — | ||||||||
Add: Changes in fair value of non-hedge derivative instruments | 3 | 14 | (11 | ) | |||||||
Add: Asset impairment charges | — | — | — | ||||||||
Add: Incentive allocations | — | — | — | ||||||||
Add: Depreciation and amortization expense | — | — | — | ||||||||
Add: Interest expense | 410 | 2,393 | (1,983 | ) | |||||||
Add: Pro-rata share of Adjusted EBITDA from unconsolidated entities (2) | 1,196 | 6,987 | (5,791 | ) | |||||||
Less: Equity in earnings of unconsolidated entities | 5,974 | 6,956 | (982 | ) | |||||||
Less: Non-controlling share of Adjusted EBITDA | — | — | — | ||||||||
Adjusted EBITDA (non-GAAP) | $ | 2,673 | $ | 13,819 | $ | (11,146 | ) | ||||
________________________________________________________
(2) The Company’s pro-rata share of Adjusted EBITDA from unconsolidated entities includes the following items for the years ended December 31, 2016 and 2015: (i) net income (loss) of $(6,161) and $(7,165), (ii) interest expense of $1,323 and $1,778, (iii) depreciation and amortization expense of $2,966 and $1,866, and (iv) asset impairment charges of $3,068 and $10,508, respectively.
Revenues
Total revenues in the Shipping Containers segment decreased by $5,969 in the year ended December 31, 2016 as compared to the year ended December 31, 2015. The decrease is primarily driven by the sale of 42,000 shipping containers that were subject to direct finance leases during the first quarter of 2016 and lower finance lease income as a result of the amortization of the underlying principal balances.
Expenses
Total expenses in the Shipping Containers segment decreased by $2,290 in the year ended December 31, 2016 as compared to the year ended December 31, 2015. This was driven by a decrease in interest expense of $1,983 in the year ended December 31, 2016, as compared to the year ended December 31, 2015, due to lower principal balances on the term loans, along with the termination of the term loan in conjunction with the sale of the shipping containers. Additionally, the sale of the 42,000 shipping containers resulted in a decrease in operating expense of $307 in the year ended December 31, 2016.
Other Expense
Total other expense in the Shipping Containers segment decreased $1,300 in the year ended December 31, 2016 as compared to the year ended December 31, 2015. This was primarily due to a decrease in losses of unconsolidated entities from our shipping container joint venture of $982 in the year ended December 31, 2016, as compared to the year ended December 31, 2015, due to a larger impairment recognized by the shipping container joint venture in September 2015 as compared to the impairment charge recognized in December 2016. The change in other expenses was also impacted by a gain on sale of direct finance leases of $304 from the sale of 42,000 shipping containers during the first quarter of 2016.
Adjusted Net (Loss) Income
Adjusted Net Income decreased by $9,829 in the year ended December 31, 2016 as compared to the year ended December 31, 2015, primarily due to decrease in finance lease income driven by the sale of 42,000 shipping containers during the first quarter of 2016 and lower pro-rata share of Adjusted Net Loss from unconsolidated entities due to the impairment recognized by the shipping container joint venture in September 2015 as compared to December 2016.
Adjusted EBITDA (Non-GAAP)
Adjusted EBITDA was $2,673 in the year ended December 31, 2016, decreasing by $11,146 in the year ended December 31, 2016 as compared to the year ended December 31, 2015, due to the decrease in finance lease income driven by the sale of 42,000 shipping containers during the first quarter of 2016 and lower pro-rata share of Adjusted EBITDA from unconsolidated entities due to the impairment recognized by the shipping container joint venture in September 2015 as compared to December 2016.
71
Jefferson Terminal Segment
The following table presents our results of operations and reconciliation of net loss attributable to shareholders to Adjusted Net Loss for the Jefferson Terminal segment for the years ended December 31, 2016 and December 31, 2015:
Year Ended December 31, | Change | ||||||||||
2016 | 2015 | ||||||||||
(in thousands) | |||||||||||
Revenues | |||||||||||
Infrastructure revenues | |||||||||||
Lease income | $ | — | $ | 4,620 | $ | (4,620 | ) | ||||
Terminal services revenues | 15,902 | 13,655 | 2,247 | ||||||||
Total revenues | 15,902 | 18,275 | (2,373 | ) | |||||||
Expenses | |||||||||||
Operating expenses | 21,886 | 33,154 | (11,268 | ) | |||||||
Acquisition and transaction expenses | 400 | — | 400 | ||||||||
Depreciation and amortization | 15,500 | 13,897 | 1,603 | ||||||||
Interest expense | 13,501 | 12,546 | 955 | ||||||||
Total expenses | 51,287 | 59,597 | (8,310 | ) | |||||||
Other expense | |||||||||||
Equity in losses of unconsolidated entities | (18 | ) | — | (18 | ) | ||||||
Loss on sale of assets, net | — | (199 | ) | 199 | |||||||
Loss on extinguishment of debt | (1,579 | ) | — | (1,579 | ) | ||||||
Interest (expense) income | (19 | ) | 85 | (104 | ) | ||||||
Other income | 602 | 40 | 562 | ||||||||
Total other expense | (1,014 | ) | (74 | ) | (940 | ) | |||||
Loss before income taxes | (36,399 | ) | (41,396 | ) | 4,997 | ||||||
Provision for income taxes | 74 | 41 | 33 | ||||||||
Net loss | (36,473 | ) | (41,437 | ) | 4,964 | ||||||
Less: Net loss attributable to non-controlling interest in consolidated subsidiaries | (16,456 | ) | (17,376 | ) | 920 | ||||||
Net loss attributable to shareholders | $ | (20,017 | ) | $ | (24,061 | ) | $ | 4,044 | |||
Add: Provision for income taxes | 74 | 41 | 33 | ||||||||
Add: Equity-based compensation expense | (4,051 | ) | 3,432 | (7,483 | ) | ||||||
Add: Acquisition and transaction expenses | 400 | — | 400 | ||||||||
Add: Losses on the modification or extinguishment of debt and capital lease obligations | 1,579 | — | 1,579 | ||||||||
Add: Changes in fair value of non-hedge derivative instruments | — | — | — | ||||||||
Add: Asset impairment charges | — | — | — | ||||||||
Add: Pro-rata share of Adjusted Net Income from unconsolidated entities | — | — | — | ||||||||
Add: Incentive allocations | — | — | — | ||||||||
Less: Cash payments for income taxes | (52 | ) | (280 | ) | 228 | ||||||
Less: Equity in losses of unconsolidated entities | 18 | — | 18 | ||||||||
Less: Non-controlling share of Adjusted Net Loss(1) | 800 | (1,285 | ) | 2,085 | |||||||
Adjusted Net Loss | $ | (21,249 | ) | $ | (22,153 | ) | $ | 904 | |||
________________________________________________________
(1) Non-controlling share of Adjusted Net Loss is comprised of the following for the years ended December 31, 2016 and 2015: (i) equity-based compensation of $(1,581) and $1,339, (ii) provision for income tax of $29 and $16, (iii) acquisition and transaction expenses of $156 and $0, and (iv) loss on extinguishment of debt of $616 and $0 less (v) cash tax payments of $20 and $70, respectively.
72
The following table sets forth a reconciliation of net loss attributable to shareholders to Adjusted EBITDA for the Jefferson Terminal segment for the years ended December 31, 2016 and December 31, 2015:
Year Ended December 31, | Change | ||||||||||
2016 | 2015 | ||||||||||
(in thousands) | |||||||||||
Net loss attributable to shareholders | $ | (20,017 | ) | $ | (24,061 | ) | $ | 4,044 | |||
Add: Provision for income taxes | 74 | 41 | 33 | ||||||||
Add: Equity-based compensation expense | (4,051 | ) | 3,432 | (7,483 | ) | ||||||
Add: Acquisition and transaction expenses | 400 | — | 400 | ||||||||
Add: Losses on the modification or extinguishment of debt and capital lease obligations | 1,579 | — | 1,579 | ||||||||
Add: Changes in fair value of non-hedge derivative instruments | — | — | — | ||||||||
Add: Asset impairment charges | — | — | — | ||||||||
Add: Incentive allocations | — | — | — | ||||||||
Add: Depreciation and amortization expense | 15,500 | 13,897 | 1,603 | ||||||||
Add: Interest expense | 13,501 | 12,546 | 955 | ||||||||
Add: Pro-rata share of Adjusted EBITDA from unconsolidated entities | — | — | — | ||||||||
Less: Equity in earnings of unconsolidated entities | 18 | — | 18 | ||||||||
Less: Non-controlling share of Adjusted EBITDA (2) | (10,184 | ) | (11,562 | ) | 1,378 | ||||||
Adjusted EBITDA (non-GAAP) | $ | (3,180 | ) | $ | (5,707 | ) | $ | 2,527 | |||
________________________________________________________
(2) Non-controlling share of Adjusted EBITDA is comprised of the following items for the years ended December 31, 2016 and 2015: (i) equity-based compensation of $(1,581) and $1,339, (ii) provision for income taxes of $29 and $16, (iii) interest expense of $4,914 and $4,783, (iv) loss on extinguishment of debt of $616 and $0, (v) acquisition and transaction expenses of $156 and $0, and (vi) depreciation and amortization expense of $6,050 and $5,424, respectively.
Revenues
Total revenues in the Jefferson Terminal segment decreased by $2,373 in the year ended December 31, 2016 as compared to the year ended December 31, 2015. The decrease was primarily due to a decrease in lease income of $4,620 as rail cars were off-lease during the year ended December 31, 2016. Terminal services revenue increased by $2,247 in the year ended December 31, 2016, due to higher tank lease revenue of $2,709 as a result of new lease contracts, offset by decreases in unloading revenues due to lower volumes.
Expenses
Total expenses in the Jefferson Terminal segment decreased by $8,310 in the year ended December 31, 2016 as compared to the year ended December 31, 2015. The decrease consists of lower operating expenses of $11,268, including lower equity-based compensation expense of $7,483, a decrease of $4,349 in facility operations expense primarily due to lower volume, $1,242 in professional fees and $163 in lease expense. The above decreases were offset by an increase in property tax expense of $1,205 due to additional property, plant and equipment placed into service during the year and maintenance expense of $1,165 due to repair on certain assets. The decrease in operating expenses was offset by an increase of $400 in acquisition and transaction costs, $1,603 of depreciation expense due to property, plant and equipment placed into service and $955 of interest expense driven by the 2016 bonds issued in March 2016.
Adjusted Net Loss
Adjusted Net Loss was $21,249 in the year ended December 31, 2016, decreased by $904 as compared to the year ended December 31, 2015. In addition to the changes in net loss attributable to shareholders noted above, the change was driven by the decrease in equity-based compensation of $7,483 in the year ended December 31, 2016 as compared to the year ended December 31, 2015, offset by acquisition and transaction expenses incurred related to the creation of a joint venture during 2016, and a loss on extinguishment of debt.
Adjusted EBITDA (Non-GAAP)
Adjusted EBITDA was $(3,180) in the year ended December 31, 2016, increasing $2,527 as compared to the year ended December 31, 2015. In addition to the changes in net loss attributable to shareholders noted above, Adjusted EBITDA was impacted by a decrease in equity-based compensation of $7,483, offset by the increase in a loss on extinguishment of debt, depreciation and amortization, and interest expense for the year ended December 31, 2016 as compared to the year ended December 31, 2015.
73
Railroad Segment
The following table presents our results of operations and reconciliation of net income (loss) attributable to shareholders to Adjusted Net Income (Loss) for the Railroad segment for the years ended December 31, 2016 and December 31, 2015:
Year Ended December 31, | Change | ||||||||||
2016 | 2015 | ||||||||||
(in thousands) | |||||||||||
Revenues | |||||||||||
Infrastructure revenues | |||||||||||
Rail revenues | 30,837 | 25,550 | $ | 5,287 | |||||||
Total revenues | 30,837 | 25,550 | 5,287 | ||||||||
Expenses | |||||||||||
Operating expenses | 27,975 | 27,819 | 156 | ||||||||
Depreciation and amortization | 1,926 | 1,895 | 31 | ||||||||
Interest expense | 754 | 578 | 176 | ||||||||
Total expenses | 30,655 | 30,292 | 363 | ||||||||
Other income | |||||||||||
Gain on sale of assets, net | 423 | 565 | (142 | ) | |||||||
Total other income | 423 | 565 | (142 | ) | |||||||
Income (loss) before income taxes | 605 | (4,177 | ) | 4,782 | |||||||
Provision for income taxes | — | — | — | ||||||||
Net income (loss) | 605 | (4,177 | ) | 4,782 | |||||||
Less: Net income (loss) attributable to non-controlling interest in consolidated subsidiaries | 23 | (121 | ) | 144 | |||||||
Net income (loss) attributable to shareholders | $ | 582 | $ | (4,056 | ) | $ | 4,638 | ||||
Add: Provision for income taxes | — | — | — | ||||||||
Add: Equity-based compensation expense | 379 | 1,206 | (827 | ) | |||||||
Add: Acquisition and transaction expenses | — | — | — | ||||||||
Add: Losses on the modification or extinguishment of debt and capital lease obligations | — | — | — | ||||||||
Add: Changes in fair value of non-hedge derivative instruments | — | — | — | ||||||||
Add: Asset impairment charges | — | — | — | ||||||||
Add: Pro-rata share of Adjusted Net Income from unconsolidated entities | — | — | — | ||||||||
Add: Incentive allocations | — | — | — | ||||||||
Less: Cash payments for income taxes | — | — | — | ||||||||
Less: Equity in earnings of unconsolidated entities | — | — | — | ||||||||
Less: Non-controlling share of Adjusted Net Income (1) | (20 | ) | (48 | ) | 28 | ||||||
Adjusted Net Income (Loss) | $ | 941 | $ | (2,898 | ) | $ | 3,839 | ||||
______________________________________________________
(1) Non-controlling share of Adjusted Net Income (Loss) is comprised of equity-based compensation of $20 and $48 for the years ended December 31, 2016 and December 31, 2015, respectively.
74
The following table sets forth a reconciliation of net income (loss) attributable to shareholders to Adjusted EBITDA for the Railroad segment for the years ended December 31, 2016 and December 31, 2015:
Year Ended December 31, | Change | ||||||||||
2016 | 2015 | ||||||||||
(in thousands) | |||||||||||
Net income (loss) attributable to shareholders | $ | 582 | $ | (4,056 | ) | $ | 4,638 | ||||
Add: Provision for income taxes | — | — | — | ||||||||
Add: Equity-based compensation expense | 379 | 1,206 | (827 | ) | |||||||
Add: Acquisition and transaction expenses | — | — | — | ||||||||
Add: Losses on the modification or extinguishment of debt and capital lease obligations | — | — | — | ||||||||
Add: Changes in fair value of non-hedge derivative instruments | — | — | — | ||||||||
Add: Asset impairment charges | — | — | — | ||||||||
Add: Incentive allocations | — | — | — | ||||||||
Add: Depreciation and amortization expense | 1,925 | 1,895 | 30 | ||||||||
Add: Interest expense | 754 | 578 | 176 | ||||||||
Add: Pro-rata share of Adjusted EBITDA from unconsolidated entities | — | — | — | ||||||||
Less: Equity in earnings of unconsolidated entities | — | — | |||||||||
Less: Non-controlling share of Adjusted EBITDA (1) | (166 | ) | (147 | ) | (19 | ) | |||||
Adjusted EBITDA (non-GAAP) | $ | 3,474 | $ | (524 | ) | $ | 3,998 | ||||
________________________________________________________
(2) Non-controlling share of Adjusted EBITDA is comprised of the following items for the year ended December 31, 2016 and 2015: (i) equity-based compensation of $20 and $48, (ii) interest expense of $41 and $23, and (iii) depreciation and amortization expense of $105 and $76, respectively.
Revenues
Total revenues in the Railroad segment increased by $5,287, in the year ended December 31, 2016 due to higher traffic and expanded service offerings to customers. The increase primarily consists of (i) $3,872 in freight transportation revenue and (ii) $837 in car hire income in the year ended December 31, 2016, as compared to the year ended December 31, 2015. Additionally, switching and other rail service revenue increased by $578 in the year ended December 31, 2016 as compared to the year ended December 31, 2015.
Expenses
Total expenses in the Railroad segment increased by $363 in the year ended December 31, 2016, as compared to the year ended December 31, 2015.
The increase of $363 primarily consists of $156 in operating expense, $31 in depreciation expense related to property, plant and equipment, and interest expense of $176 related to borrowings under the CMQR Credit Agreement used to finance construction and improvements to the railroad. The increase in operating expenses was driven by an increase in compensation and benefits of $615, and other operating expenses of $593, which was offset by a decrease in (i) professional fees of $692, (ii) bad debt expenses of $143, and (iii) insurance expense of $217 offset by an increase in in the year ended December 31, 2016 as compared to the year ended December 31, 2015.
Adjusted Net Income (Loss)
Adjusted Net Income increased by $3,839 in the year ended December 31, 2016, as compared to the year ended December 31, 2015. In addition to the changes in net income (loss) attributable to shareholders noted above, Adjusted Net Income was impacted by lower equity-based compensation expense of $827 in the year ended December 31, 2016 as compared to the year ended December 31, 2015.
Adjusted EBITDA (Non-GAAP)
Adjusted EBITDA was $3,474 in the year ended December 31, 2016, increasing by $3,998 as compared to the year ended December 31, 2015. In addition to the changes in net income (loss) attributable to shareholders noted above, Adjusted EBITDA was also impacted primarily by lower equity-based compensation expense of $827 and an increase in interest expense of $176, in the year ended December 31, 2016 as compared to the year ended December 31, 2015.
75
Ports and Terminals
The following table presents our results of operations and reconciliation of net loss attributable to shareholders to Adjusted Net Loss for Ports and Terminals for the years ended December 31, 2016 and 2015:
Year Ended December 31, | Change | |||||||||||
2016 | 2015 | |||||||||||
Revenues | (in thousands) | |||||||||||
Infrastructure revenues | ||||||||||||
Lease income | $ | 32 | $ | — | $ | 32 | ||||||
Total revenues | 32 | — | 32 | |||||||||
Expenses | ||||||||||||
Operating expenses | 628 | — | 628 | |||||||||
Depreciation and amortization | 4 | — | 4 | |||||||||
Interest expense | 545 | — | 545 | |||||||||
Total expenses | 1,177 | — | 1,177 | |||||||||
Loss before income taxes | (1,145 | ) | — | (1,145 | ) | |||||||
Provision for income taxes | 13 | — | 13 | |||||||||
Net loss | (1,158 | ) | — | (1,158 | ) | |||||||
Less: Net loss attributable to non-controlling interest in consolidated subsidiaries | (157 | ) | — | (157 | ) | |||||||
Net loss attributable to shareholders | $ | (1,001 | ) | $ | — | $ | (1,001 | ) | ||||
Add: Provision for income taxes | 13 | — | 13 | |||||||||
Add: Equity-based compensation expense | — | — | — | |||||||||
Add: Acquisition and transaction expenses | — | — | — | |||||||||
Add: Losses on the modification or extinguishment of debt and capital lease obligations | — | — | — | |||||||||
Add: Changes in fair value of non-hedge derivative instruments | — | — | — | |||||||||
Add: Asset impairment charges | — | — | — | |||||||||
Add: Pro-rata share of Adjusted Net Income from unconsolidated entities | — | — | — | |||||||||
Add: Incentive allocations | — | — | — | |||||||||
Less: Cash payments for income taxes | (5 | ) | — | (5 | ) | |||||||
Less: Equity in earnings of unconsolidated entities | — | — | — | |||||||||
Less: Non-controlling share of Adjusted Net Income | — | — | — | |||||||||
Adjusted Net Loss | $ | (993 | ) | $ | — | $ | (993 | ) | ||||
76
The following table sets forth a reconciliation of net loss attributable to shareholders to Adjusted EBITDA for Ports and Terminals for the years ended December 31, 2016 and 2015:
Year Ended December 31, | Change | |||||||||||
2016 | 2015 | |||||||||||
(in thousands) | ||||||||||||
Net loss attributable to shareholders | $ | (1,001 | ) | $ | — | $ | (1,001 | ) | ||||
Add: Benefit from income taxes | 13 | — | 13 | |||||||||
Add: Equity-based compensation expense | — | — | — | |||||||||
Add: Acquisition and transaction expenses | — | — | — | |||||||||
Add: Losses on the modification or extinguishment of debt and capital lease obligations | — | — | — | |||||||||
Add: Changes in fair value of non-hedge derivative instruments | — | — | — | |||||||||
Add: Asset impairment charges | — | — | — | |||||||||
Add: Depreciation and amortization expense | 4 | — | 4 | |||||||||
Add: Interest expense | 545 | — | 545 | |||||||||
Add: Pro-rata share of Adjusted EBITDA from unconsolidated entities | — | — | — | |||||||||
Less: Equity in earnings of unconsolidated entities | — | — | — | |||||||||
Less: Non-controlling share of Adjusted EBITDA (1) | (55 | ) | — | (55 | ) | |||||||
Adjusted EBITDA | $ | (494 | ) | $ | — | $ | (494 | ) | ||||
________________________________________________________
(1) Non-controlling share of Adjusted EBITDA is comprised of the following items for the years ended December 31, 2016 and 205,: (i) interest expense of $55 and $0, respectively.
Revenues
For the year ended December 31, 2016, there was $32 of lease income as a result of an in-place lease agreement acquired with the purchase of Repauno.
Expenses
There was expense of $1,177 for the year ended December 31, 2016 primarily reflecting i) operating expenses of $628 due to compensation and benefits and property taxes incurred due to operations at Repauno which was acquired in July 2016, ii) interest expense of $545 related to the payment obligation to the non-controlling interest as part of the Repauno purchase and iii) depreciation expense of $4.
Adjusted Net Loss
Adjusted Net Loss was $993 for the year ended December 31, 2016 due to the revenue and expense noted above.
Adjusted EBITDA (non-GAAP)
Adjusted EBITDA was $(494) for the year ended December 31, 2016. In addition to the changes in the net loss attributable to shareholders noted above, Adjusted EBITDA includes the impact of interest expense of $545 as a result of the obligation payable to the non-controlling interest as part of the Repauno purchase.
77
Corporate
The following table presents our results of operations and reconciliation of net loss attributable to shareholders to Adjusted Net Loss for Corporate for the years ended December 31, 2016 and December 31, 2015:
Year Ended December 31, | Change | ||||||||||
2016 | 2015 | ||||||||||
(in thousands) | |||||||||||
Expenses | |||||||||||
Operating expenses | $ | 14 | $ | — | $ | 14 | |||||
General and administrative | 12,314 | 7,568 | 4,746 | ||||||||
Acquisition and transaction expenses | 5,836 | 5,683 | 153 | ||||||||
Management fees and incentive allocation to affiliate | 16,742 | 15,018 | 1,724 | ||||||||
Depreciation and amortization | — | — | — | ||||||||
Interest expense | — | — | — | ||||||||
Total expenses | 34,906 | 28,269 | 6,637 | ||||||||
— | |||||||||||
Loss before income taxes | (34,906 | ) | (28,269 | ) | (6,637 | ) | |||||
Provision for income taxes | — | 4 | (4 | ) | |||||||
Net loss | (34,906 | ) | (28,273 | ) | (6,633 | ) | |||||
Less: Net loss attributable to non-controlling interest in consolidated subsidiaries | (11 | ) | (5 | ) | (6 | ) | |||||
Net loss attributable to shareholders | $ | (34,895 | ) | $ | (28,268 | ) | $ | (6,627 | ) | ||
Add: Provision for income taxes | — | 4 | (4 | ) | |||||||
Add: Equity-based compensation expense | — | 24 | (24 | ) | |||||||
Add: Acquisition and transaction expenses | 5,836 | 5,683 | 153 | ||||||||
Add: Losses on the modification or extinguishment of debt and capital lease obligations | — | — | — | ||||||||
Add: Changes in fair value of non-hedge derivative instruments | — | — | — | ||||||||
Add: Asset impairment charges | — | — | — | ||||||||
Add: Pro-rata share of Adjusted Net Income from unconsolidated entities | — | — | — | ||||||||
Add: Incentive allocations | — | — | — | ||||||||
Less: Cash payments for income taxes | (14 | ) | — | (14 | ) | ||||||
Less: Equity in earnings of unconsolidated entities | — | — | — | ||||||||
Less: Non-controlling share of Adjusted Net Income | — | — | — | ||||||||
Adjusted Net Loss | $ | (29,073 | ) | $ | (22,557 | ) | $ | (6,516 | ) | ||
78
The following table sets forth a reconciliation of net loss attributable to shareholders to Adjusted EBITDA for Corporate for the years ended December 31, 2016 and December 31, 2015:
Year Ended December 31, | Change | ||||||||||
2016 | 2015 | ||||||||||
(in thousands) | |||||||||||
Net loss attributable to shareholders | $ | (35,896 | ) | $ | (28,268 | ) | $ | (7,628 | ) | ||
Add: Provision for income taxes | — | 4 | (4 | ) | |||||||
Add: Equity-based compensation expense | — | 24 | (24 | ) | |||||||
Add: Acquisition and transaction expenses | 5,836 | 5,683 | 153 | ||||||||
Add: Losses on the modification or extinguishment of debt and capital lease obligations | — | — | — | ||||||||
Add: Changes in fair value of non-hedge derivative instruments | — | — | — | ||||||||
Add: Asset impairment charges | — | — | — | ||||||||
Add: Incentive allocations | — | — | — | ||||||||
Add: Depreciation and amortization expense | — | — | — | ||||||||
Add: Interest expense | — | — | — | ||||||||
Add: Pro-rata share of Adjusted EBITDA from unconsolidated entities | — | — | — | ||||||||
Less: Equity in earnings of unconsolidated entities | — | — | — | ||||||||
Less: Non-controlling share of Adjusted EBITDA | — | — | — | ||||||||
Adjusted EBITDA | $ | (30,060 | ) | $ | (22,557 | ) | $ | (7,503 | ) | ||
Expenses
Total expenses increased by $6,637 in the year ended December 31, 2016 as compared to the year ended December 31, 2015, respectively.
For the year ended December 31, 2016, the increase primarily consists of higher general and administrative expenses of $4,746, including (i) $3,182 of reimbursement expenses to our manager, (ii) $835 of general corporate costs required for a stand-alone public company including insurance and director fees, (iii) $585 of professional fees, and (iv) $151 of director fees. Also contributing to the increase were higher management fees of $1,724 attributable to new agreements put in place subsequent to our IPO.
Adjusted Net Loss
Adjusted Net Loss was $29,073 for the year ended December 31, 2016, increasing $6,516 compared to the year ended December 31, 2015. In addition to the changes in net loss attributable to shareholders noted above, Adjusted Net Loss was adjusted by acquisition and transaction expenses, incurred for potential acquisition opportunities, which were higher for the year ended December 31, 2016, as compared to the year ended December 31, 2015.
Adjusted EBITDA (non-GAAP)
Adjusted EBITDA was $(30,060) in the year ended December 31, 2016, decreasing $(7,503) compared to the year ended December 31, 2015. In addition to the changes in net loss attributable to shareholders noted above, Adjusted EBITDA was affected by acquisition and transaction expenses, incurred for potential acquisition opportunities, which were higher for the year ended December 31, 2016, as compared to year ended December 31, 2015.
Transactions with Affiliates and Affiliated Entities
We are managed by FIG LLC (the “Manager”), an affiliate of Fortress, pursuant to a management agreement (the “Management Agreement”) which provides for us to bear obligations for management fees and expense reimbursements payable to the Manager. Our Management Agreement requires our Manager to manage our business affairs in conformity with a broad asset acquisition strategy adopted and monitored by our board of directors. From time to time, we may engage (subject to our strategy) in material transactions with our Manager or another entity managed by our Manager or one of its affiliates or other affiliates of Fortress, which may include, but are not limited to, certain financing arrangements, acquisition of assets, acquisition of debt obligations, debt, co-investments, and other assets that present an actual, potential or perceived conflict of interest. Please see Note 13 to our consolidated financial statements included elsewhere in this filing for more information.
79
Subsequent Events
On January 10, 2018, the Company agreed to sell 7,000,000 common shares, par value $0.01 per share, representing limited liability interest in the Company, in connection with a public offering, at a price of $18.65 per share. The offering closed on January 16, 2018. Net proceeds received by the Company from the offering were approximately $128 million, after deducting underwriting discounts and commissions and estimated offering expenses payable by the Company. To compensate the Manager for its successful efforts in raising capital for the Company, in connection with the offering, the Company granted options to the Manager related to 700,000 shares of the Company’s common stock at the public offering price which had a fair value of approximately $1.9 million as of the grant date. The assumptions used in valuing the options were: a 2.52% risk-free rate, a 5.45% dividend yield, a 27.73% volatility and a ten-year term. The Company intends to use the net proceeds from the offering for general corporate purposes, including the funding of future investments.
On February 27, 2018, the Company’s Board of Directors declared a cash dividend on its common shares of $0.33 per share for the quarter ended December 31, 2017, payable on March 27, 2018 to the holders of record on March 16, 2018.
Liquidity and Capital Resources
Our principal uses of liquidity have been and continue to be (i) acquisitions of transportation infrastructure and equipment, (ii) distributions to our shareholders, (iii) expenses associated with our operating activities and (iv) debt service obligations associated with our investments (all dollar amounts are expressed in thousands).
• | In the years ended December 31, 2017, 2016, and 2015, cash used for the purpose of making investments was $594,558, $308,069, and $278,433, respectively. |
• | In the years ended December 31, 2017, 2016 and 2015, distributions to shareholders, including cash dividends, were $100,058, $100,027 and $81,260 respectively, and distributions to non-controlling interest were $254, $0, and $321 respectively. |
• | Uses of liquidity associated with our operating expenses are captured on a net basis in our cash flows from operating activities. Uses of liquidity associated with our debt obligations are captured in our cash flows from financing activities. |
Our principal sources of liquidity to fund these uses have been and continue to be (i) revenues from our transportation infrastructure and equipment assets (including finance lease collections and maintenance reserve collections) net of operating expenses, (ii) proceeds from borrowings or the issuance of securities, (iii) distributions received from unconsolidated investees, (iv) capital contributions from our shareholders, and (v) proceeds from asset sales.
• | During the years ended December 31, 2017, 2016, and 2015, cash flows from operating activities, plus the principal collections on finance leases and maintenance reserve collections were $96,019, $48,220 and $53,969, respectively. |
• | During the year ended December 31, 2017, additional borrowings were obtained in connection with i) the Term Loan of $97,163, net of deferred financing costs, ii) the Revolving Credit Facility of $95,000, iii) the CMQR Credit Agreement of $32,030 and iv) the Senior Notes of $342,998, net of deferred financing costs and repayment of the Term Loan. We made principal repayments of $125,223, primarily relating to the FTAI Pride Credit Agreement, the Revolving Credit Facility and the CMQR Credit Agreement. During year ended December 31, 2016, additional borrowings were obtained in connection with the Series 2016 Bonds of $99,858 and the CMQR Credit Agreement of $10,800. We made total principal repayments of $160,166, primarily relating to the termination of the Jefferson Terminal Credit Agreement, Container Loan #1, and Container Loan #2. During the year ended December 31, 2015, additional borrowings of $200 were obtained in connection with the CMQR Credit Agreement and we made total principal repayments of $23,761. |
• | During the years ended December 31, 2017, 2016, and 2015, we received $0, $462 and $3,937 in cash distributions from our unconsolidated investees, respectively, of which $0, $30 and $209 was included in cash flows from operating activities, respectively. |
• | During the years ended December 31, 2017, 2016, and 2015 proceeds from the sale of assets were $121,419, $94,375 and $14,518, respectively. |
• | During the years ended December 31, 2017, 2016, and 2015 capital contributions from shareholders were $0, $0, and $295,879 respectively, and capital contributions from non-controlling interests were $35, $11,480, and $37,826 respectively. |
• | During the year ended December 31, 2015, proceeds from the issuance of common stock were $351,059, net of issuance costs of $2,998. |
Our net cash provided by operating activities has been less than the amount of distributions to our shareholders. Our board of directors takes this and other factors into account as part of any decision to pay a dividend, and the timing and amount of any future dividend is subject to change at the discretion of our board of directors.
80
The Company is currently evaluating several potential Infrastructure and Equipment Leasing transactions, which could occur within the next 12 months. However, as of the date of this filing, none of these pipeline transactions or negotiations are definitive or included within the planned liquidity needs of the Company. We cannot assure you if or when any such transaction will be consummated or the terms of any such transaction.
The Company has a dividend reinvestment plan in place which allows shareholders to automatically reinvest dividends in the Company’s common shares. The plan became effective on February 24, 2017.
Historical Cash Flow
The following table compares the historical cash flow for the years ended December 31, 2017, 2016 and 2015:
Year Ended | |||||||||||
December 31, 2017 | December 31, 2016 | December 31, 2015 | |||||||||
(in thousands) | |||||||||||
Cash Flow Data: | |||||||||||
Net cash provided by operating activities | $ | 68,497 | $ | 30,903 | $ | 23,528 | |||||
Net cash used in investing activities | $ | (440,230 | ) | $ | (213,098 | ) | $ | (239,921 | ) | ||
Net cash provided by (used in) financing activities | $ | 363,078 | $ | (131,453 | ) | $ | 575,971 | ||||
Comparison of the years ended December 31, 2017 and December 31, 2016
Net cash provided by operating activities was $68,497 in the year ended December 31, 2017 as compared to $30,903 in the year ended December 31, 2016, representing a $37,594 increase. Net loss was $23,240 for the year ended December 31, 2017, compared $40,598 for the year ended December 31, 2016, an increase in net income of $17,358. The increase was also attributable to adjustments to reconcile net income which include an increase of $27,900 relating to depreciation and amortization, $5,015 relating to equity based compensation, and $2,859 of amortization of lease intangibles and incentives, partially offset by asset impairment of $7,450 in 2016 and a change in gain on sale of equipment of $12,340 as compared to 2016. Also contributing to the offset were the changes in accounts receivable, other assets, and other liabilities due to the continued expansion of operations across all business segments.
Net cash used in investing activities was $440,230 and $213,098 in the years ended December 31, 2017 and 2016, respectively, representing a $227,132 increase. Cash used in investing activities increased due to the acquisition of leasing equipment and lease intangibles of $230,751 in the Aviation Leasing segment, cash used for investments of $1,526, and the acquisition of property, plant and equipment of $58,660 mainly due to the acquisition of Long Ridge. Partially offsetting this increase were higher proceeds from the sale of leasing equipment and available-for-sale securities of $68,245 and $30,238, respectively, and a change in restricted cash of $34,385 at December 31, 2017 as compared to December 31, 2016. Additionally, cash used in investing activities increased due to less cash received from the sale of two finance leases of $71,000 in the year ended December 31, 2017 as compared to the year ended December 31, 2016.
Net cash provided by financing activities was $363,078 in the year ended December 31, 2017 as compared to cash used in financing activities of $131,453 in year ended December 31, 2016, representing a $494,531 increase. The increase was primarily attributable to proceeds from borrowings under i) the Term Loan of $97,163, net of deferred financing costs, ii) the Revolving Credit Facility of $95,000, iii) the CMQR Credit Agreement of $32,030 and iv) the Senior Notes of $342,998, net of deferred financing costs and repayment of the Term Loan. Also contributing to the increase was a decrease in the repayment of debt related to the termination of the Jefferson Terminal Credit Agreement and loans associated with the sale of shipping containers in the year ended December 31, 2016, as well as an increase in receipt of maintenance deposits of $12,245, offset by a decrease in cash contributions from non-controlling interests of $11,445.
Comparison of the years ended December 31, 2016 and December 31, 2015
Net cash provided by operating activities was $30,903 in the years ended December 31, 2016 as compared to $23,528 in the year ended December 31, 2015, representing a $7,375 increase. Net loss was $40,598 for the year ended December 31, 2016, compared $28,631 for the year ended December 31, 2015, a decrease of $11,967. The decrease was offset by non-cash adjustments to reconcile net income which include an increase of (i) $7,450 relating to an asset impairment, (ii) $14,902 relating to depreciation and amortization, and (iii) $1,579 loss on extinguishment of debt, offset by a decrease in equity based compensation of $8,334, equity in losses from unconsolidated entities of $964 and gain on sale of equipment of $2,522 as compared to 2015. The decrease was further offset by the changes in in accounts payable, other liabilities, accounts receivable and other assets due to the continued expansion of operations across all business segments,
Net cash used in investing activities was $213,098 and $239,921 in the years ended December 31, 2016 and 2015, respectively, representing a $26,823 decrease. Cash used in investing activities decreased due to cash received for the sale of two finance leases, resulting in proceeds of $71,000, a decrease in cash paid for property, plant and equipment of $38,657, and the investment in the note receivable of $11,803 in the year ended December 31, 2016 as compared to the year ended December 31, 2015. Offsetting these decreases was an increase in cash used for the acquisition of leasing equipment of $35,550, cash used for purchase deposits of aircraft and aircraft engines of $13,681, and investments of $28,784, as well as a decrease principal collections on finance leases of $17,779 in the year ended December 31, 2016 as compared to the year ended December 31, 2015.
81
Net cash used in financing activities was $131,453 in the year ended December 31, 2016 as compared to cash provided by financing activities of $575,971 in year ended December 31, 2015, representing a $707,424 decrease. Such decrease was attributable to (i) a decrease in cash proceeds received due to the issuance of common shares net of issuance costs paid of $351,059, (ii) a decrease in capital contributions from shareholders of $295,879, and (iii) a decrease in capital contributions from non-controlling interests of $26,346. In addition to these decreases, cash outflows increased in the year ended December 31, 2016 as compared to the year ended December 31, 2015 due to repayment of debt, net of proceeds from borrowings of $25,947, cash dividends paid of $63,684, offset by a decrease in distributions to shareholders of $44,917 and a net increase in maintenance deposits of $13,164.
Funds Available for Distribution (Non-GAAP)
The Company uses Funds Available for Distribution (“FAD”) in evaluating its ability to meet its stated dividend policy. FAD is not a financial measure in accordance with GAAP. The GAAP measure most directly comparable to FAD is net cash provided by operating activities. The Company believes FAD is a useful metric for investors and analysts for similar purposes.
The Company defines FAD as: net cash provided by operating activities plus principal collections on finance leases, proceeds from sale of assets, and return of capital distributions from unconsolidated entities, less required payments on debt obligations and capital distributions to non-controlling interest, and excluding changes in working capital. The following table sets forth a reconciliation of Net Cash Provided by Operating Activities to FAD:
Year Ended | |||||||||||
December 31, 2017 | December 31, 2016 | December 31, 2015 | |||||||||
(in thousands) | |||||||||||
Net Cash Provided by Operating Activities | $ | 68,497 | $ | 30,903 | $ | 23,528 | |||||
Add: Principal Collections on Finance Leases | 473 | 2,513 | 20,292 | ||||||||
Add: Proceeds from Sale of Assets (1) | 121,419 | 94,875 | 14,518 | ||||||||
Add: Return of Capital Distributions from Unconsolidated Entities | — | 432 | 3,728 | ||||||||
Less: Required Payments on Debt Obligations (2) | (8,368 | ) | (53,668 | ) | (23,761 | ) | |||||
Less: Capital Distributions to Non-Controlling Interest | (254 | ) | — | (321 | ) | ||||||
Exclude: Changes in Working Capital | (4,515 | ) | 1,730 | 10,104 | |||||||
Funds Available for Distribution (FAD) | $ | 177,252 | $ | 76,785 | $ | 48,088 | |||||
_____________________________________________________
(1) Proceeds from sale of assets includes $500 received in December 2015 for a deposit on the sale of a commercial jet engine, which was completed in the year ended December 31, 2016.
(2) Required payments on debt obligations for the year ended December 31, 2017 excludes $100,000 repayment of the Term Loan, $95,000 repayment of the Revolving Credit Facility and $21,855 repayment of the CMQR Credit Agreement, and for the year ended December 31, 2016 excludes $98,750 repayment upon the termination of the Jefferson Terminal Credit Agreement and $7,748 repayment under the CMQR Credit Agreement which were voluntary refinancing as repayment of these amounts were not required at this time.
Limitations
FAD is subject to a number of limitations and assumptions and there can be no assurance that the Company will generate FAD sufficient to meet its intended dividends. FAD has material limitations as a liquidity measure of the Company because such measure excludes items that are required elements of the Company’s net cash provided by operating activities as described below. FAD should not be considered in isolation nor as a substitute for analysis of the Company’s results of operations under GAAP, and it is not the only metric that should be considered in evaluating the Company’s ability to meet its stated dividend policy. Specifically:
• | FAD does not include equity capital called from the Company’s existing limited partners, proceeds from any debt issuance or future equity offering, historical cash and cash equivalents and expected investments in the Company’s operations. |
• | FAD does not give pro forma effect to prior acquisitions, certain of which cannot be quantified. |
• | While FAD reflects the cash inflows from sale of certain assets, FAD does not reflect the cash outflows to acquire assets as the Company relies on alternative sources of liquidity to fund such purchases. |
• | FAD does not reflect expenditures related to capital expenditures, acquisitions and other investments as the Company has multiple sources of liquidity and intends to fund these expenditures with future incurrences of indebtedness, additional capital contributions and/or future issuances of equity. |
• | FAD does not reflect any maintenance capital expenditures necessary to maintain the same level of cash generation from our capital investments. |
• | FAD does not reflect changes in working capital balances as management believes that changes in working capital are primarily driven by short term timing differences, which are not meaningful to the Company’s distribution decisions. |
• | Management has significant discretion to make distributions, and the Company is not bound by any contractual provision that requires it to use cash for distributions. |
82
If such factors were included in FAD, there can be no assurance that the results would be consistent with the Company’s presentation of FAD.
Debt Obligations
FTAI Pride Credit Agreement—On September 15, 2014, FTAI Pride, LLC, (“FTAI Pride”) a subsidiary of the Company entered into a credit agreement (the “FTAI Pride Credit Agreement”) with a financial institution for a term loan in an aggregate amount of $75,000. The loan proceeds were used in connection with the acquisition of an offshore construction vessel. The FTAI Pride Credit Agreement requires quarterly payments of interest and scheduled principal payments of $1,562 beginning in the quarter ending December 31, 2015, through its maturity on September 15, 2019, and can be prepaid without penalty at any time. The FTAI Pride Credit Agreement is secured on a first priority basis by the offshore construction vessel and charter. Borrowings under the FTAI Pride Credit Agreement bear interest at the LIBOR rate plus a spread of 4.50%.
The FTAI Pride Credit Agreement contains affirmative and negative covenants which limit certain actions of the borrower and a financial covenant requiring the borrower to maintain a Fixed Charges Coverage Ratio, as defined, of not less than 1.15:1.00 in any twelve month period ending December 31, 2014, or later.
CMQR Credit Agreement—On June 30, 2017, CMQR amended its credit agreement (the “CMQR Credit Agreement”) with a financial institution for a revolving credit to increase the aggregate amount from $20,000 to $25,000 and to extend the maturity date to September 18, 2019. Borrowings under the CMQR Credit Agreement bear interest at either (i) Adjusted LIBOR plus a spread of 2.50% of 4.50%, (ii) the U.S. or Canadian Base Rate plus a spread of 1.50% to 3.50%, or (iii) the Canadian Fixed Rate plus a spread of 2.50% or 4.50%, as defined by the CMQR Credit Agreement. The weighted average interest rate as of December 31, 2017 and 2016 was 3.95% and 3.21%, respectively.
The CMQR Credit Agreement is also indirectly supported by Fortress Transportation and Infrastructure Investors LLC (the “Sponsor”). In the event of a default under the credit agreement, CMQR’s lenders can cause CMQR to call up to a total of $29 million in capital from the Sponsor, and in the event of CMQR’s bankruptcy, the lenders can put the debt back to the Sponsor. The CMQR Credit Agreement contains affirmative and negative covenants which limit certain actions of CMQR.
Series 2012 Bonds—On August 1, 2012, Jefferson County Development Corporation issued $46,875 of tax-exempt industrial bonds (“Series 2012 Bonds”), to specifically fund construction and operation of an intermodal transfer facility for crude oil and refined petroleum products. The proceeds of this issuance were loaned to Jefferson Terminal, to be held in trust, as restricted cash, to ensure adherence to the restrictions of use of the funds. Use of the proceeds requires approval from a trustee prior to release of funds. Such restricted cash may only be released to us after payment of applicable reserves, including a six-month interest reserve, and expenses, as determined by the trustee. The Series 2012 Bonds have a stated maturity of July 1, 2032, bear interest at 8.25%, and require scheduled principal payments. The principal of the Series 2012 Bonds is payable annually at varying amounts.
In connection with the Company’s acquisition of Jefferson Terminal, the Series 2012 Bonds were recorded at a fair value of $48,554, which represented a premium of $1,823 as compared to their face value at the date of acquisition; such premium is being amortized using the effective interest method over the remaining contractual term of the Series 2012 Bonds.
The Series 2012 Bond agreement contains a financial covenant requiring a subsidiary of the Company to maintain a long-term debt service coverage ratio, as defined in the agreement, of 1.25 to 1, in each fiscal year, beginning with December 31, 2014.
Series 2016 Bonds—On March 7, 2016, the Port of Beaumont Navigation District of Jefferson County, Texas (the “District”) issued $144,200 of Dock and Wharf Facility Revenue Bonds, Series 2016 (Jefferson Energy Companies Project) (the “Series 2016 Bonds”). Proceeds from the issuance of the Series 2016 Bonds were used, in part, to reimburse Jefferson Railport Terminal II, LLC (“Jefferson Railport II”) for certain costs related to the development, construction and acquisition of certain facilities for the transport, loading, unloading, and storage of petroleum products (the “Facilities”) on behalf of the District, and settle the Jefferson Terminal Credit Agreement. Construction of the Facilities has occurred, and will occur, on property leased by the District to Jefferson Railport II pursuant to a First Amended and Restated Ground Lease between Jefferson Railport II, as lessee, and the District, as lessor. All such Facilities will be leased by the District to Jefferson Railport II pursuant to a Lease and Development Agreement between the District and Jefferson Railport II.
The transaction described above did not qualify for sale-leaseback accounting due to the continuing involvement of the Company resulting from the mandatory tender feature and, as a result, the leases were classified as a financing transaction in the Company’s consolidated financial statements. Under the financing method, the assets constructed or to be constructed will remain on the consolidated balance sheet and the net proceeds received by the Company are recorded as financial debt. Payments under these leases are recorded as interest expense and reduction of principal in accordance with the terms of the bond agreement with annual interest payments and a principal repayment at February 13, 2020 barring a remarketing of the bond on new terms.
83
Under a Capital Call Agreement, the Company has agreed to make funds available to Jefferson Holdings in order to satisfy its obligation under the Standby Bond Purchase Agreement. The Capital Call Agreement contains certain covenants applicable to the Company, including a negative lien covenant regarding Aviation Assets, as defined, as well as maintenance of a minimum total asset value of Aviation Assets and minimum total equity of the Company. In connection with the above, related to the Series 2016 Bonds, a subsidiary of the Company and an affiliate of its Manager entered into a Fee and Support Agreement with FTAI Energy Partners LLC and certain of its subsidiaries. The Fee and Support Agreement provides that both such subsidiary of the Company, and such affiliate, will effectively guarantee a pro rata portion of the obligations under the Standby Bond Purchase Agreement in return for a guarantee fee of $6,873 (shared on the same pro rata basis). This fee will be amortized as interest expense to the redemption date or February 13, 2020.
The Series 2016 Bonds bear interest at an initial rate of 7.25% and require scheduled interest payments. The Series 2016 Bonds have a stated maturity of February 1, 2036 but are subject to mandatory tender for purchase at par on February 13, 2020 if they have not been repurchased from proceeds of a remarketing of the Series 2016 Bonds or redeemed prior to such date. In the event all of the Series 2016 Bonds are not repurchased from proceeds of a remarketing or redeemed at February 13, 2020, Jefferson Railport and Jefferson Railport Terminal II Holdings LLC (“Jefferson Holdings”), a Delaware limited liability company and parent of Jefferson Railport II, have agreed to purchase the Series 2016 Bonds from the Holders thereof at par pursuant to a Standby Bond Purchase Agreement. In addition, pursuant to the Standby Purchase Agreement, Jefferson Holdings will guarantee the payment of all Rent (as defined in the Facilities Lease), and all principal of and premium and interest on the Series 2016 Bonds payable prior to repurchase or redemption at February 13, 2020.
Term Loan—On January 23, 2017, the Company entered into an unsecured credit agreement under which the Company, through its wholly owned subsidiaries, including the Partnership and WWTAI Finance Ltd., an exempted company incorporated with limited liability under the laws of Bermuda, borrowed $100,000 in term loans denominated in U.S. dollars (the “Term Loans”). The proceeds of the Term Loans are to be used for general corporate purposes, including future acquisitions by the Company and its subsidiaries of certain aviation and infrastructure assets. The Terms Loans bear interest at the Base Rate (determined in accordance with the agreement) plus 2.75% per annum, or at the Adjusted Eurodollar Rate (determined in accordance with the agreement) plus 3.75% per annum, if the Company chooses to make Eurodollar Rate borrowings. The Term Loans mature on January 22, 2018, subject to the Company’s right to elect a one-year extension, and require amortization payments in the amount of $250 on the last day of each fiscal quarter beginning on March 31, 2017. On March 15, 2017, all amounts outstanding under the Term Loan were repaid in full and the agreement was terminated. Accordingly, during the year ended December 31, 2017, the Company recorded a loss on extinguishment of debt of $2,456.
Senior Notes—On March 15, 2017, the Company issued $250,000 aggregate principal amount of 6.75% senior unsecured notes due 2022 (the “Senior Notes”). The Senior Notes were issued pursuant to an indenture, dated as of March 15, 2017, between the Company and U.S. Bank National Association, as trustee. On August 23, 2017, the Company issued an additional $100,000 of Senior Notes. The additional notes issued on August 23, 2017 were issued at an offering price of 102.75% of the principal amount plus accrued interest from March 15, 2017 to the date of issuance. On December 20, 2017, the Company issued an additional $100,000 of Senior Notes. The additional notes issued on December 20, 2017 were issued at an offering price of 103.25% of the principal amount plus accrued interest from September 15, 2017.
The Senior Notes bear interest at a rate of 6.75% per annum, payable semi-annually in arrears on March 15 and September 15 of each year, commencing on September 15, 2017, to persons who are registered holders of the Senior Notes on the immediately preceding March 1 and September 1, respectively.
The Senior Notes mature on March 15, 2022. Prior to March 15, 2020, the Company may redeem some or all of the Senior Notes at a redemption price equal to 100.00% of the principal amount of the Senior Notes redeemed, plus accrued and unpaid interest, if any, to, but not including, the applicable redemption date, plus a “make-whole” premium. On or after March 15, 2020, the Company may redeem some or all of the Senior Notes at any time at declining redemption prices equal to (i) 105.063% beginning on March 15, 2020, and (ii) 100.000% beginning on March 15, 2021 and thereafter, plus, in each case, accrued and unpaid interest, if any, to, but not including, the applicable redemption date. In addition, at any time on or prior to March 15, 2020, the Company may redeem up to 40% of the aggregate principal amount of the Senior Notes using net proceeds from certain equity offerings at a redemption price equal to 106.75% of the principal amount of the Senior Notes redeemed, plus accrued and unpaid interest, if any, to, but not including, the applicable redemption date.
The Company used a portion of the proceeds to fully repay all outstanding indebtedness under the Company’s Term Loan in the amount of $100,000, payment of fees related to the issuance of Senior Notes, and to fund the purchase of additional investments. The Company intends to use the remainder of the proceeds for general corporate purposes, including the funding of future investments.
Revolving Credit Facility—On June 16, 2017, the Company entered into a revolving credit facility (the “Revolving Credit Facility”) with certain lenders and issuing banks and JPMorgan Chase Bank N.A., as administrative agent. The Revolving Credit Facility provides for revolving loans in the aggregate principal amount of up to $75,000, of which $25,000 may be utilized for the issuance of letters of credit. The proceeds drawn on this facility will be used for working capital and general corporate purposes, including, without limitation, permitted acquisitions and other investments. The Revolving Credit Facility is secured by the capital stock of certain direct subsidiaries of the Company as defined in the related credit agreement.
Borrowings outstanding under the Revolving Credit Facility at the Adjusted Eurodollar Rate (determined in accordance with the credit agreement) plus 3.00% per annum, if the Company chooses to make Eurodollar Rate borrowings, or at the Base Rate
84
(determined in accordance with the credit agreement) plus 2.00% per annum. The Company will also be required to pay a quarterly commitment fee at a rate per annum equal to 0.50% on the average unused portion of the Revolving Credit Facility, as well as customary letter of credit fees and agency fees.
The Revolving Credit Facility will mature, and commitments in respect of the Revolving Credit Facility will terminate, on June 16, 2020. Any amount borrowed under the Revolving Credit Facility may be voluntarily prepaid without penalty or premium, other than customary breakage costs related to prepayments of Eurodollar Rate Borrowings.
The Revolving Credit Facility includes financial covenants requiring the maintenance of (1) a minimum ratio of the appraised value of certain aviation assets to the aggregate commitments under the Revolving Credit Facility of 3.00 to 1.00 and (2) a maximum ratio of debt to total equity (before reduction for minority interest) for the Company and its subsidiaries of 1.65 to 1.00 per the terms of the credit agreement.
The Company was in compliance with all debt covenants as of December 31, 2017.
Contractual Obligations
The following table summarizes our future obligations, by period due, as of December 31, 2017, under our various contractual obligations and commitments. We had no off-balance sheet arrangements as of December 31, 2017.
Payments Due by Period | |||||||||||||||||||||||||||
(in thousands) | Total | 2018 | 2019 | 2020 | 2021 | 2022 | Thereafter | ||||||||||||||||||||
FTAI Pride Credit Agreement | 53,993 | 6,250 | 47,743 | — | — | — | — | ||||||||||||||||||||
CMQR Credit Agreement | 22,800 | — | 22,800 | — | — | — | — | ||||||||||||||||||||
Series 2012 Bonds | 42,765 | 1,545 | 1,670 | 1,810 | 1,960 | 2,120 | 33,660 | ||||||||||||||||||||
Series 2016 Bonds | 144,200 | — | — | 144,200 | — | — | — | ||||||||||||||||||||
Senior Notes | 450,000 | — | — | — | — | 450,000 | — | ||||||||||||||||||||
Total principal payments on loans and bonds payable | 713,758 | 7,795 | 72,213 | 146,010 | 1,960 | 452,120 | 33,660 | ||||||||||||||||||||
Total estimated interest payments (1) | 269,775 | 47,695 | 46,207 | 34,870 | 33,408 | 91,912 | 15,683 | ||||||||||||||||||||
Obligation to third-party (Repauno) | 5,500 | 5,500 | — | — | — | — | — | ||||||||||||||||||||
Operating lease obligations | 97,054 | 6,802 | 6,635 | 5,550 | 4,350 | 3,004 | 70,713 | ||||||||||||||||||||
Capital lease obligations | 1,139 | 333 | 333 | 317 | 125 | 31 | — | ||||||||||||||||||||
373,468 | 60,330 | 53,175 | 40,737 | 37,883 | 94,947 | 86,396 | |||||||||||||||||||||
Total contractual obligations | $ | 1,087,226 | $ | 68,125 | $ | 125,388 | $ | 186,747 | $ | 39,843 | $ | 547,067 | $ | 120,056 | |||||||||||||
(1) Estimated interest payments based on rates as of December 31, 2017. | |
We expect to meet our future short-term liquidity requirements through cash on hand and net cash provided by our current operations. We expect that our operating subsidiaries will generate sufficient cash flow to cover operating expenses and the payment of principal and interest on our indebtedness as they become due. We may elect to meet certain long-term liquidity requirements or to continue to pursue strategic opportunities through utilizing cash on hand, cash generated from our current operations and the issuance of securities in the future. Management believes adequate capital and borrowings are available from various sources to fund our commitments to the extent required.
Application of Critical Accounting Policies
Operating Leases—The Company leases equipment pursuant to net operating leases. Operating leases with fixed rentals and step rentals are recognized on a straight-line basis over the term of the lease, assuming no renewals. Revenue is not recognized when collection is not reasonably assured. When collectability is not reasonably assured, the customer is placed on non-accrual status and revenue is recognized when cash payments are received.
The Company also recognizes maintenance revenue related to the portion of maintenance payments received from lessees of aviation equipment that are not expected to be reimbursed in connection with major maintenance events.
85
Finance Lease—The Company holds one anchor handling tug supply vessel, subject to a finance lease, as of December 31, 2017. This lease generally includes a lessee obligation to purchase the leased equipment at the end of the lease term, a bargain purchase option, or provides for minimum lease payments with a present value of 90% or more of the fair value of the leased equipment at the date of lease inception. Net investment in finance lease represents the minimum lease payments due from lessee, net of unearned income. The lease payments are segregated into principal and interest components similar to a loan. Unearned income is recognized on an effective interest method over the lease term and is recorded as finance lease income. The principal component of the lease payment is reflected as a reduction to the net investment in finance leases.
Variable Interest Entities—The assessment of whether an entity is a VIE and the determination of whether to consolidate a VIE requires judgment. VIEs are defined as entities in which equity investors do not have the characteristics of a controlling financial interest or do not have sufficient equity at risk for the entity to finance its activities without additional subordinated financial support from other parties. A VIE is required to be consolidated by its primary beneficiary, and only by its primary beneficiary, which is defined as the party who has the power to direct the activities of a VIE that most significantly impact its economic performance and who has the obligation to absorb losses or the right to receive benefits from the VIE that could potentially be significant to the VIE.
Maintenance Payments—Typically, under an operating lease of aircraft, the lessee is responsible for performing all maintenance and is generally required to make maintenance payments to the Company for heavy maintenance, overhaul or replacement of certain high-value components of the aircraft or engine. These maintenance payments are based on hours or cycles of utilization or on calendar time, depending on the component, and are generally required to be made monthly in arrears. If a lessee is making monthly maintenance payments, the Company would typically be obligated to reimburse the lessee for costs they incur for heavy maintenance, overhaul or replacement of certain high-value components to the extent of maintenance payments received in respect of the specific maintenance event, usually shortly following the completion of the relevant work.
The Company records the portion of maintenance payments paid by the lessee that are expected to be reimbursed as maintenance deposit liabilities on the Consolidated Balance Sheet. Reimbursements made to the lessee upon the receipt of evidence of qualifying maintenance work are recorded against the maintenance deposit liability.
In certain leases, the lessee or the Company may be obligated to make a payment to the other party at lease termination based on redelivery conditions stipulated at the inception of the lease. When the lessee is required to return the aircraft in an improved maintenance condition, the Company records a maintenance right asset, as a component of other assets, for the estimated value of the end-of-life maintenance payment at acquisition. The Company recognizes payments received as end-of-lease compensation adjustments, within lease revenue or as a reduction to the maintenance right asset, when payment is received or collectability is assured. In the event the Company is required to make payments at the end of the lease for redelivery conditions, amounts are accrued as additional maintenance liability when the Company is obligated and can reasonably estimate such payment.
Property, Plant and Equipment, Leasing Equipment and Depreciation—Property, plant and equipment and leasing equipment are stated at cost (inclusive of capitalized acquisition costs, where applicable) and depreciated using the straight-line method, over estimated useful lives, to estimated residual values which are summarized as follows:
Asset | Range of Estimated Useful Lives | Residual Value Estimates | ||
Aircraft | 25 years from date of manufacture | Generally not to exceed 15% of manufacturer’s list price when new | ||
Aircraft engines | 2 - 6 years, based on maintenance adjusted service life | Sum of engine core salvage value plus the estimated fair value of life limited parts | ||
Offshore energy vessels | 25 years from date of manufacture | 20% of new build cost | ||
Railcars and locomotives | 40 - 50 years from date of manufacture | Scrap value at end of useful life | ||
Track and track related assets | 15 - 50 years from date of manufacture | Scrap value at end of useful life | ||
Buildings and site improvements | 20 - 30 years | Scrap value at end of useful life | ||
Railroad equipment | 3 - 15 years from date of manufacture | Scrap value at end of useful life | ||
Terminal machinery and equipment | 15 - 25 years from date of manufacture | Scrap value at end of useful life | ||
Vehicles | 5 - 7 years from date of manufacture | Scrap value at end of useful life | ||
Furniture and fixtures | 3 - 6 years from date of purchase | None | ||
Computer hardware and software | 3 - 5 years from date of purchase | None | ||
Impairment of Long-Lived Assets—The Company performs a recoverability assessment of each of its long-lived assets whenever events or changes in circumstances, or indicators, indicate that the carrying amount or net book value of an asset may not be recoverable. Indicators may include, but are not limited to, a significant lease restructuring or early lease termination; significant traffic decline; or the introduction of newer technology aircraft, vessels, engines or railcars. When performing a recoverability assessment, the Company measures whether the estimated future undiscounted net cash flows expected to be generated by the asset exceeds its net book value. The undiscounted cash flows consist of cash flows from currently contracted leases and terminal services contracts, future projected leases, terminal service and freight rail rates, transition costs, estimated down time and estimated residual or scrap values. In the event that an asset does not meet the recoverability test, the carrying value of the asset will be adjusted to fair value resulting in an impairment charge.
86
Management develops the assumptions used in the recoverability analysis based on its knowledge of active contracts, current and future expectations of the global demand for a particular asset and historical experience in the leasing markets, as well as information received from third party industry sources. The factors considered in estimating the undiscounted cash flows are impacted by changes in future periods due to changes in contracted lease rates, terminal service, and freight rail rates, residual values, economic conditions, technology, demand for a particular asset type and other factors.
Goodwill —Goodwill includes the excess of the purchase price over the fair value of the net tangible and intangible assets associated with the acquisitions of CMQR and Jefferson Terminal. The carrying amount of goodwill is approximately $116,584 as of December 31, 2017 and December 31, 2016.
The Company reviews the carrying values of goodwill at least annually to assess impairment since these assets are not amortized. An annual impairment review is conducted as of October 1st of each year. Additionally, the Company reviews the carrying value of goodwill whenever events or changes in circumstances indicate that its carrying amount may not be recoverable. The determination of fair value involves significant management judgment.
For an annual goodwill impairment assessment, an optional qualitative analysis may be performed. If the option is not elected or if it is more likely than not that the fair value of a reporting unit is less than its carrying amount, then a two-step goodwill impairment test is performed to identify potential goodwill impairment and measure an impairment loss. A qualitative analysis was not elected for the years ended December 31, 2017 or December 31, 2016.
The first step of an impairment assessment compares the fair value of a respective reporting unit with its carrying amount, including goodwill. The estimate of fair value of the respective reporting unit is based on the best information available as of the date of assessment, which primarily incorporates certain factors including the Company’s assumptions about operating results, business plans, income projections, anticipated future cash flows and market data. If the estimated fair value of the reporting unit is less than the carrying amount, a second step must be completed in order to determine the amount of goodwill impairment that should be recorded, if any.
For the purpose of performing the annual analysis, the Company’s two reporting units subject to the test are the Jefferson Terminal and Railroad reporting units. The Company estimates the fair value of the reporting units using an income approach, specifically a discounted cash flow analysis. This analysis requires the Company to make significant assumptions and estimates about the extent and timing of future cash flows, discount rates and growth rates. The estimates and assumptions used consider historical performance and are consistent with the assumptions used in determining future profit plans for the reporting units. The Company also utilizes market valuation models and other financial ratios, which require the Company to make certain assumptions and estimates regarding the applicability of those models to its assets and businesses.
Although the Company believes the estimates of fair value are reasonable, the determination of certain valuation inputs is subject to management’s judgment. Changes in these inputs could materially affect the results of the impairment review. If the forecasts of cash flows generated by the Jefferson Terminal and Railroad reporting units or other key inputs are negatively revised in the future, the estimated fair value of the Jefferson Terminal and Railroad reporting units would be adversely impacted, potentially leading to an impairment in the future that could materially affect the Company’s operating results. Specifically, as it relates to the Jefferson Terminal segment, forecasted revenue is dependent on the ramp up of volumes under current contracts and the acquisition of additional storage contracts for the heavy and light crude and refined products during 2018. The expansion of refineries in the Beaumont/Port Arthur area, as well as growing crude oil production in the U.S. and Canada, are expected to result in increased demand for storage on the U.S. Gulf Coast. Other assumptions that are significant in determination of the fair value of the reporting unit include the discount rate utilized in our discounted cash flow analysis of 14% and our terminal growth rate of 3%.
Furthermore, development of both inbound and outbound pipelines to and from the Jefferson Terminal over the next two years will affect our forecasted growth and therefore our estimated fair value. We expect the Jefferson Terminal segment to generate positive Adjusted EBITDA during 2018. The Company’s estimated fair value exceeded carrying value by greater than 15%.
For the years ended December 31, 2017 and December 31, 2016, there was no impairment of goodwill.
Recent Accounting Pronouncements
Please see Note 2 to our consolidated financial statements included elsewhere in this filing for recent accounting pronouncements.
Item 7A. Quantitative and Qualitative Disclosures About Market Risk
Market risk represents the risk of changes in value of a financial instrument, caused by fluctuations in interest rates and foreign exchange rates. Changes in these factors could cause fluctuations in our results of operations and cash flows. We are exposed to the market risks described below.
87
Interest Rate Risk
Interest rate risk is the exposure to loss resulting from changes in the level of interest rates and the spread between different interest rates. Interest rate risk is highly sensitive to many factors, including the U.S. government’s monetary and tax policies, global economic factors and other factors beyond our control. We are exposed to changes in the level of interest rates and to changes in the relationship or spread between interest rates. Our primary interest rate exposure relates to our term loan arrangements.
Our borrowing agreements generally require payments based on a variable interest rate index, such as LIBOR. Therefore, to the extent our borrowing costs are not fixed, increases in interest rates may reduce our net income by increasing the cost of our debt without any corresponding increase in rents or cash flow from our finance leases. We manage our exposure to interest rate movements through the use of interest rate derivatives (interest rate swaps and caps). As a result, when market rates of interest change, there is generally not a material impact on our interest expense, future earnings or cash flows.
The following discussion about the potential effects of changes in interest rates is based on a sensitivity analysis, which models the effects of hypothetical interest rate shifts on our financial condition and results of operations. Although we believe a sensitivity analysis provides the most meaningful analysis permitted by the rules and regulations of the SEC, it is constrained by several factors, including the necessity to conduct the analysis based on a single point in time and by the inability to include the extraordinarily complex market reactions that normally would arise from the market shifts modeled. Although the following results of a sensitivity analysis for changes in interest rates may have some limited use as a benchmark, they should not be viewed as a forecast. This forward-looking disclosure also is selective in nature and addresses only the potential interest expense impacts on our financial instruments and, in particular, does not address the mark-to-market impact on our interest rate derivatives. It also does not include a variety of other potential factors that could affect our business as a result of changes in interest rates.
As of December 31, 2017, assuming we do not hedge our exposure to interest rate fluctuations related to our outstanding floating rate debt, a hypothetical 100-basis point increase/decrease in our variable interest rate on our borrowings would result in an interest expense increase/(decrease) of approximately $860 and $(761), respectively, over the next 12 months before the impact of interest rate derivatives.
Foreign Currency Exchange Risk
Our functional currency is U.S. dollars. All of our leasing arrangements are denominated in U.S. dollars. Currently, the majority of freight rail revenue is also denominated in U.S. dollars, but a portion is denominated in Canadian dollars. Although foreign exchange risk could arise from our operations in multiple jurisdictions, we do not have significant exposure to foreign currency risk as our leasing arrangements are denominated in U.S. dollars. All of our purchase agreements are negotiated in U.S. dollars, and we currently receive the majority of revenue in U.S. dollars. We pay substantially all of our expenses in U.S. dollars; however we pay some expenses in Canadian dollars. Because we currently receive the majority of our revenues in U.S. dollars and pay substantially all of our expenses in U.S. dollars, we do not expect a change in foreign exchange rates would have a significant impact on our results of operations or cash flows.
88
Item 8. Financial Statements and Supplementary Data
Index to Financial Statements:
Consolidated Financial Statements of Fortress Transportation and Infrastructure Investors LLC: | ||
Consolidated Financial Statements of Intermodal Finance I Ltd: | ||
In accordance with Regulation S-X 3-09, the audited consolidated financial statements of Intermodal Finance I Ltd. as of December 31, 2017 and December 31, 2016 and for the years ended December 31, 2017, 2016, and 2015, are presented herein.
89
Report of Independent Registered Public Accounting Firm
To the Shareholders and Board of Directors of Fortress Transportation and Infrastructure Investors LLC
Opinion on the Financial Statements
We have audited the accompanying consolidated balance sheets of Fortress Transportation and Infrastructure Investors LLC (“the Company”) as of December 31, 2017 and 2016, the related consolidated statements of operations, comprehensive (loss) income, changes in equity and cash flows for the years then ended, and the related notes (collectively referred to as the “consolidated financial statements”). In our opinion, the consolidated financial statements present fairly, in all material respects, the financial position of the Company at December 31, 2017 and 2016, and the results of its operations and its cash flows for the years then ended, in conformity with U.S. generally accepted accounting principles.
We also have audited, in accordance with the standards of the Public Company Accounting Oversight Board (United States) (PCAOB), the Company’s internal control over financial reporting as of December 31, 2017, based on criteria established in Internal Control - Integrated Framework issued by the Committee of Sponsoring Organizations of the Treadway Commission (2013 framework) and our report dated March 1, 2018 expressed an adverse opinion thereon.
Basis for Opinion
These financial statements are the responsibility of the Company’s management. Our responsibility is to express an opinion on the Company’s financial statements based on our audits. We are a public accounting firm registered with the PCAOB and are required to be independent with respect to the Company in accordance with the U.S. federal securities laws and the applicable rules and regulations of the Securities and Exchange Commission and the PCAOB.
We conducted our audits in accordance with the standards of the PCAOB. Those standards require that we plan and perform the audit to obtain reasonable assurance about whether the financial statements are free of material misstatement, whether due to error or fraud. Our audits included performing procedures to assess the risks of material misstatement of the financial statements, whether due to error or fraud, and performing procedures that respond to those risks. Such procedures included examining, on a test basis, evidence regarding the amounts and disclosures in the financial statements. Our audits also included evaluating the accounting principles used and significant estimates made by management, as well as evaluating the overall presentation of the financial statements. We believe that our audits provide a reasonable basis for our opinion.
/s/ Ernst & Young LLP
We have served as the Company’s auditor since 2016.
New York, New York
March 1, 2018
90
Report of Independent Registered Public Accounting Firm
To the Board of Directors and Shareholders of Fortress Transportation and Infrastructure Investors LLC:
In our opinion, the consolidated statements of operations, comprehensive (loss) income, changes in equity and cash flows for the year ended December 31, 2015 present fairly, in all material respects, the results of operations and cash flows of Fortress Transportation and Infrastructure Investors LLC and its subsidiaries for the year ended December 31, 2015, in conformity with accounting principles generally accepted in the United States of America. These financial statements are the responsibility of the Company’s management. Our responsibility is to express an opinion on these financial statements based on our audit. We conducted our audit of these financial statements in accordance with the standards of the Public Company Accounting Oversight Board (United States). Those standards require that we plan and perform the audit to obtain reasonable assurance about whether the financial statements are free of material misstatement. An audit includes examining, on a test basis, evidence supporting the amounts and disclosures in the financial statements, assessing the accounting principles used and significant estimates made by management, and evaluating the overall financial statement presentation. We believe that our audit provides a reasonable basis for our opinion.
/s/ PricewaterhouseCoopers LLP
New York, New York
March 8, 2016, except for the change in presentation of debt issuance costs as discussed in Note 2 to the consolidated financial statements, as to which the date is February 24, 2017
91
FORTRESS TRANSPORTATION AND INFRASTRUCTURE INVESTORS LLC
CONSOLIDATED BALANCE SHEETS
(Dollar amounts in thousands, except share and per share data)
Notes | December 31, | ||||||||
2017 | 2016 | ||||||||
Assets | |||||||||
Cash and cash equivalents | 2 | $ | 59,400 | $ | 68,055 | ||||
Restricted cash | 2 | 33,406 | 65,441 | ||||||
Accounts receivable, net | 31,076 | 21,358 | |||||||
Leasing equipment, net | 3 | 1,074,130 | 765,455 | ||||||
Finance leases, net | 4 | 9,244 | 9,717 | ||||||
Property, plant, and equipment, net | 5 | 489,949 | 352,181 | ||||||
Investments (includes $0 and $17,630 available-for-sale securities at fair value as of December 31, 2017 and 2016, respectively) | 6 | 42,538 | 39,978 | ||||||
Intangible assets, net | 7 | 40,043 | 38,954 | ||||||
Goodwill | 116,584 | 116,584 | |||||||
Other assets | 2 | 59,436 | 69,589 | ||||||
Total assets | $ | 1,955,806 | $ | 1,547,312 | |||||
Liabilities | |||||||||
Accounts payable and accrued liabilities | $ | 68,226 | $ | 38,239 | |||||
Debt, net | 8 | 703,264 | 259,512 | ||||||
Maintenance deposits | 2 | 103,464 | 45,394 | ||||||
Security deposits | 2 | 27,257 | 19,947 | ||||||
Other liabilities | 18,520 | 18,540 | |||||||
Total liabilities | $ | 920,731 | $ | 381,632 | |||||
Commitments and contingencies | 16 | ||||||||
Equity | |||||||||
Common shares ($0.01 par value per share; 2,000,000,000 shares authorized; 75,771,738 and 75,750,943 shares issued and outstanding as of December 31, 2017 and December 31, 2016, respectively) | 758 | 758 | |||||||
Additional paid in capital | 985,009 | 1,084,757 | |||||||
Accumulated deficit | (38,699 | ) | (38,833 | ) | |||||
Accumulated other comprehensive income | — | 7,130 | |||||||
Shareholders' equity | 947,068 | 1,053,812 | |||||||
Non-controlling interest in equity of consolidated subsidiaries | 88,007 | 111,868 | |||||||
Total equity | 1,035,075 | 1,165,680 | |||||||
Total liabilities and equity | $ | 1,955,806 | $ | 1,547,312 | |||||
See accompanying notes to consolidated financial statements.
92
FORTRESS TRANSPORTATION AND INFRASTRUCTURE INVESTORS LLC
CONSOLIDATED STATEMENTS OF OPERATIONS
(Dollar amounts in thousands, except share and per share data)
Year Ended December 31, | |||||||||||||
Notes | 2017 | 2016 | 2015 | ||||||||||
Revenues | |||||||||||||
Equipment leasing revenues | $ | 170,000 | $ | 101,949 | $ | 92,743 | |||||||
Infrastructure revenues | 47,659 | 46,771 | 43,825 | ||||||||||
Total revenues | 10 | 217,659 | 148,720 | 136,568 | |||||||||
Expenses | |||||||||||||
Operating expenses | 92,385 | 66,169 | 68,793 | ||||||||||
General and administrative | 14,570 | 12,314 | 7,568 | ||||||||||
Acquisition and transaction expenses | 7,306 | 6,316 | 5,683 | ||||||||||
Management fees and incentive allocation to affiliate | 13 | 15,732 | 16,742 | 15,018 | |||||||||
Depreciation and amortization | 3, 5, 7 | 88,110 | 60,210 | 45,308 | |||||||||
Interest expense | 38,827 | 18,957 | 19,311 | ||||||||||
Total expenses | 256,930 | 180,708 | 161,681 | ||||||||||
Other income (expense) | |||||||||||||
Equity in (losses) earnings of unconsolidated entities | 6 | (1,601 | ) | (5,992 | ) | (6,956 | ) | ||||||
Gain on sale of assets, net | 18,281 | 5,941 | 3,419 | ||||||||||
Loss on extinguishment of debt | (2,456 | ) | (1,579 | ) | — | ||||||||
Asset impairment | — | (7,450 | ) | — | |||||||||
Interest income | 688 | 136 | 579 | ||||||||||
Other income | 3,073 | 602 | 26 | ||||||||||
Total other income (expense) | 17,985 | (8,342 | ) | (2,932 | ) | ||||||||
Loss before income taxes | (21,286 | ) | (40,330 | ) | (28,045 | ) | |||||||
Provision for income taxes | 12 | 1,954 | 268 | 586 | |||||||||
Net loss | (23,240 | ) | (40,598 | ) | (28,631 | ) | |||||||
Less: Net loss attributable to non-controlling interests in consolidated subsidiaries | (23,374 | ) | (20,534 | ) | (16,805 | ) | |||||||
Net income (loss) attributable to shareholders | $ | 134 | $ | (20,064 | ) | $ | (11,826 | ) | |||||
Basic and Diluted Earnings (Loss) per Share | 15 | $ | — | $ | (0.26 | ) | $ | (0.18 | ) | ||||
Weighted Average Shares Outstanding: | |||||||||||||
Basic | 75,766,811 | 75,738,698 | 67,039,439 | ||||||||||
Diluted | 75,766,811 | 75,738,698 | 67,039,439 | ||||||||||
See accompanying notes to consolidated financial statements.
93
FORTRESS TRANSPORTATION AND INFRASTRUCTURE INVESTORS LLC
CONSOLIDATED STATEMENTS OF COMPREHENSIVE (LOSS) INCOME
(Dollar amounts in thousands, unless otherwise noted)
Year Ended December 31, | ||||||||||||
2017 | 2016 | 2015 | ||||||||||
Net loss | $ | (23,240 | ) | $ | (40,598 | ) | $ | (28,631 | ) | |||
Other comprehensive loss: | ||||||||||||
Cash Flow Hedge: | ||||||||||||
Change in fair value of cash flow hedge | — | (97 | ) | (117 | ) | |||||||
Available-for-Sale Securities: | ||||||||||||
Unrealized gain in available-for-sale securities | 4,276 | 7,130 | — | |||||||||
Reclassification of gains included in net income | (11,406 | ) | — | — | ||||||||
Comprehensive loss | (30,370 | ) | (33,565 | ) | (28,748 | ) | ||||||
Comprehensive loss attributable to non-controlling interest | (23,374 | ) | (20,534 | ) | (16,805 | ) | ||||||
Comprehensive loss attributable to shareholders | $ | (6,996 | ) | $ | (13,031 | ) | $ | (11,943 | ) | |||
See accompanying notes to consolidated financial statements.
94
FORTRESS TRANSPORTATION AND INFRASTRUCTURE INVESTORS LLC
CONSOLIDATED STATEMENT OF CHANGES IN EQUITY
(Dollar amounts in thousands, unless otherwise noted)
Common Stock | Additional Paid In Capital | Accumulated Deficit | Accumulated Other Comprehensive Income | Non-Controlling Interest in Equity of Consolidated Subsidiaries | Total Equity | ||||||||||||||||||
Equity - December 31, 2014 | $ | 535 | $ | 613,683 | $ | — | $ | 214 | $ | 99,065 | $ | 713,497 | |||||||||||
Comprehensive (loss) income: | — | ||||||||||||||||||||||
Net income (loss) for the period | 6,943 | (18,769 | ) | (16,805 | ) | (28,631 | ) | ||||||||||||||||
Other comprehensive loss | — | (117 | ) | — | (117 | ) | |||||||||||||||||
Total comprehensive loss | 6,943 | (18,769 | ) | (117 | ) | (16,805 | ) | (28,748 | ) | ||||||||||||||
Capital contributions | 295,879 | 37,826 | 333,705 | ||||||||||||||||||||
Capital distributions | (44,917 | ) | (321 | ) | (45,238 | ) | |||||||||||||||||
Issuance of common shares | 222 | 348,929 | — | 349,151 | |||||||||||||||||||
Dividends declared | (36,343 | ) | — | (36,343 | ) | ||||||||||||||||||
Equity-based compensation | 24 | 4,638 | 4,662 | ||||||||||||||||||||
Equity - December 31, 2015 | $ | 757 | $ | 1,184,198 | $ | (18,769 | ) | $ | 97 | $ | 124,403 | $ | 1,290,686 | ||||||||||
Comprehensive (loss) income: | |||||||||||||||||||||||
Net loss for the period | (20,064 | ) | (20,534 | ) | (40,598 | ) | |||||||||||||||||
Other comprehensive loss | — | 7,033 | — | 7,033 | |||||||||||||||||||
Total comprehensive loss | (20,064 | ) | 7,033 | (20,534 | ) | (33,565 | ) | ||||||||||||||||
Capital contributions | 12,121 | 12,121 | |||||||||||||||||||||
Settlement of equity-based compensation | (200 | ) | (200 | ) | |||||||||||||||||||
Issuance of common shares | 1 | 336 | — | 337 | |||||||||||||||||||
Dividends declared | (99,977 | ) | (50 | ) | (100,027 | ) | |||||||||||||||||
Equity-based compensation | 200 | (3,872 | ) | (3,672 | ) | ||||||||||||||||||
Equity - December 31, 2016 | $ | 758 | $ | 1,084,757 | $ | (38,833 | ) | $ | 7,130 | $ | 111,868 | $ | 1,165,680 | ||||||||||
Comprehensive loss: | |||||||||||||||||||||||
Net income (loss) for the period | 134 | (23,374 | ) | (23,240 | ) | ||||||||||||||||||
Other comprehensive income | — | (7,130 | ) | — | (7,130 | ) | |||||||||||||||||
Total comprehensive (loss) income | 134 | (7,130 | ) | (23,374 | ) | (30,370 | ) | ||||||||||||||||
Capital contributions | 1,296 | 1,296 | |||||||||||||||||||||
Capital distributions | (254 | ) | (254 | ) | |||||||||||||||||||
Transfer of non-controlling interest | (2,798 | ) | (2,798 | ) | |||||||||||||||||||
Settlement of equity-based compensation | (74 | ) | (74 | ) | |||||||||||||||||||
Dividends declared | (100,058 | ) | — | (100,058 | ) | ||||||||||||||||||
Issuance of common shares | — | 310 | — | 310 | |||||||||||||||||||
Equity-based compensation | — | 1,343 | 1,343 | ||||||||||||||||||||
Equity - December 31, 2017 | $ | 758 | $ | 985,009 | $ | (38,699 | ) | $ | — | $ | 88,007 | $ | 1,035,075 | ||||||||||
See accompanying notes to consolidated financial statements.
95
FORTRESS TRANSPORTATION AND INFRASTRUCTURE INVESTORS LLC
CONSOLIDATED STATEMENTS OF CASH FLOWS
(Dollar amounts in thousands, unless otherwise noted)
Year Ended December 31, | |||||||||||
2017 | 2016 | 2015 | |||||||||
Cash flows from operating activities: | |||||||||||
Net loss | $ | (23,240 | ) | $ | (40,598 | ) | $ | (28,631 | ) | ||
Adjustments to reconcile net income to net cash provided by operating activities: | |||||||||||
Equity in losses (earnings) of unconsolidated entities | 1,601 | 5,992 | 6,956 | ||||||||
Gain on sale of assets, net | (18,281 | ) | (5,941 | ) | (3,419 | ) | |||||
Security deposits and maintenance claims included in earnings | (60 | ) | (300 | ) | (439 | ) | |||||
Loss on extinguishment of debt | 2,456 | 1,579 | — | ||||||||
Equity-based compensation | 1,343 | (3,672 | ) | 4,662 | |||||||
Depreciation and amortization | 88,110 | 60,210 | 45,308 | ||||||||
Gain on settlement of liabilities | (1,093 | ) | — | — | |||||||
Asset impairment | — | 7,450 | — | ||||||||
Change in current and deferred income taxes | 227 | (387 | ) | 61 | |||||||
Change in fair value of non-hedge derivative | (1,022 | ) | 3 | 14 | |||||||
Amortization of lease intangibles and incentives | 8,306 | 5,447 | 7,016 | ||||||||
Amortization of deferred financing costs | 4,202 | 2,576 | 1,469 | ||||||||
Operating distributions from unconsolidated entities | — | 30 | 209 | ||||||||
Bad debt expense | 701 | 158 | 676 | ||||||||
Other | 732 | 86 | (250 | ) | |||||||
Change in: | |||||||||||
Accounts receivable | (12,001 | ) | (7,980 | ) | (5,940 | ) | |||||
Other assets | 6,475 | (8,584 | ) | (5,057 | ) | ||||||
Accounts payable and accrued liabilities | 10,266 | 7,726 | 3,180 | ||||||||
Management fees payable to affiliate | 899 | 457 | (1,168 | ) | |||||||
Other liabilities | (1,124 | ) | 6,651 | (1,119 | ) | ||||||
Net cash provided by operating activities | 68,497 | 30,903 | 23,528 | ||||||||
Cash flows from investing activities: | |||||||||||
Change in restricted cash | 32,036 | (2,349 | ) | (526 | ) | ||||||
Investment in notes receivable | — | (3,066 | ) | (14,869 | ) | ||||||
Investment in unconsolidated entities and available for sale securities | (30,310 | ) | (28,784 | ) | — | ||||||
Principal collections on finance leases | 473 | 2,513 | 20,292 | ||||||||
Acquisition of leasing equipment | (425,769 | ) | (200,640 | ) | (165,090 | ) | |||||
Acquisition of property plant and equipment | (116,031 | ) | (57,371 | ) | (96,028 | ) | |||||
Acquisition of lease intangibles | (10,149 | ) | (4,527 | ) | (2,446 | ) | |||||
Purchase deposit for aircraft and aircraft engines | (12,299 | ) | (13,681 | ) | — | ||||||
Proceeds from sale of finance leases | — | 71,000 | — | ||||||||
Proceeds from sale of leasing equipment | 91,130 | 22,885 | 13,625 | ||||||||
Proceeds from sale of available-for-sale securities | 30,238 | — | — | ||||||||
Proceeds from sale of property, plant and equipment | 51 | 490 | 893 | ||||||||
Proceeds from sale of equipment held for sale | — | — | — | ||||||||
Proceeds from deposit on sale of leasing equipment | 400 | 250 | 500 | ||||||||
Return of deposit on sale of leasing equipment | — | (250 | ) | — | |||||||
Return of capital distributions from unconsolidated entities | — | 432 | 3,728 | ||||||||
Net cash used in investing activities | $ | (440,230 | ) | $ | (213,098 | ) | $ | (239,921 | ) | ||
See accompanying notes to consolidated financial statements.
96
FORTRESS TRANSPORTATION AND INFRASTRUCTURE INVESTORS LLC
CONSOLIDATED STATEMENTS OF CASH FLOWS
(Dollar amounts in thousands, unless otherwise noted)
Year Ended December 31, | |||||||||||
2017 | 2016 | 2015 | |||||||||
Cash flows from financing activities: | |||||||||||
Proceeds from debt | $ | 567,191 | $ | 110,658 | $ | 200 | |||||
Repayment of debt | (125,223 | ) | (160,166 | ) | (23,761 | ) | |||||
Payment of other liabilities to non-controlling interest holder | — | (1,000 | ) | — | |||||||
Payment of deferred financing costs | (3,377 | ) | (4,246 | ) | (136 | ) | |||||
Receipt of security deposits | 7,290 | 3,815 | 2,060 | ||||||||
Return of security deposits | (3,231 | ) | (316 | ) | (960 | ) | |||||
Receipt of maintenance deposits | 27,049 | 14,804 | 10,149 | ||||||||
Release of maintenance deposits | (6,270 | ) | (6,255 | ) | (14,764 | ) | |||||
Proceeds from issuance of common shares, net of underwriter's discount | — | — | 354,057 | ||||||||
Common shares issuance costs | — | — | (2,998 | ) | |||||||
Capital contributions from shareholders | — | — | 295,879 | ||||||||
Capital distributions to shareholders | — | — | (44,917 | ) | |||||||
Capital contributions from non-controlling interests | 35 | 11,480 | 37,826 | ||||||||
Capital distributions to non-controlling interests | (254 | ) | — | (321 | ) | ||||||
Settlement of equity-based compensation | (74 | ) | (200 | ) | — | ||||||
Cash dividends | (100,058 | ) | (100,027 | ) | (36,343 | ) | |||||
Net cash provided by (used in) financing activities | $ | 363,078 | $ | (131,453 | ) | $ | 575,971 | ||||
Net (decrease) increase in cash and cash equivalents | (8,655 | ) | (313,648 | ) | 359,578 | ||||||
Cash and cash equivalents, beginning of period | 68,055 | 381,703 | 22,125 | ||||||||
Cash and cash equivalents, end of period | $ | 59,400 | $ | 68,055 | $ | 381,703 | |||||
Supplemental disclosure of cash flow information: | |||||||||||
Cash paid for interest, net of capitalized interest | $ | 25,068 | $ | 13,150 | $ | 18,566 | |||||
Cash paid for taxes | $ | 1,726 | $ | 654 | $ | 507 | |||||
Supplemental disclosure of non-cash investing and financing activities: | |||||||||||
Restricted cash proceeds from borrowings of debt | $ | — | $ | 44,342 | $ | — | |||||
Proceeds from borrowings of debt | 108,339 | — | — | ||||||||
Repayment and settlement of debt | (102,352 | ) | — | — | |||||||
Acquisition of leasing equipment | (35,332 | ) | (7,724 | ) | (5,408 | ) | |||||
Acquisition of property, plant and equipment | (37,281 | ) | (12,184 | ) | (203 | ) | |||||
Financing of property, plant and equipment | — | 5,321 | — | ||||||||
Settled and assumed security deposits | 3,312 | 758 | 2,388 | ||||||||
Billed, assumed and settled maintenance deposits | 37,292 | 6,350 | (1,146 | ) | |||||||
Deferred financing costs | (8,802 | ) | (2,884 | ) | — | ||||||
Non-cash contribution of non-controlling interest | 1,261 | 641 | — | ||||||||
Transfer of non-controlling interest | (2,798 | ) | — | — | |||||||
Common share issuance costs | — | — | (1,908 | ) | |||||||
Equity compensation to non-controlling interest | 1,343 | (3,872 | ) | 4,638 | |||||||
Change in fair value of cash flow hedge | — | (97 | ) | (117 | ) | ||||||
See accompanying notes to consolidated financial statements.
97
FORTRESS TRANSPORTATION AND INFRASTRUCTURE INVESTORS LLC
NOTES TO CONSOLIDATED FINANCIAL STATEMENTS
(Dollar amounts in thousands, unless otherwise noted)
1. | ORGANIZATION |
Fortress Transportation and Infrastructure Investors LLC (the “Company”) is a Delaware limited liability company which, through its subsidiary, Fortress Worldwide Transportation and Infrastructure General Partnership (the “Partnership”), is engaged in the ownership and leasing of i) aviation equipment, ii) offshore energy equipment and iii) shipping containers. The Company also owns and operates i) a short line railroad in North America, Central Maine and Québec Railway (“CMQR”), ii) a multi-modal crude oil and refined products terminal in Beaumont, Texas (“Jefferson Terminal”), iii) a deep-water port located along the Delaware River with an underground storage cavern and multiple industrial development opportunities (“Repauno”), and iv) a multi-modal terminal located along the Ohio River with multiple industrial development opportunities (“Long Ridge”). The Company has six reportable segments, i) Aviation Leasing, ii) Offshore Energy, iii) Shipping Containers, iv) Jefferson Terminal, v) Railroad and vi) Ports and Terminals, which operate in two primary businesses, Equipment Leasing and Infrastructure (Note 14).
At December 31, 2014, through their investment in the Company, the beneficial owners of the Partnership were Fortress Worldwide Transportation and Infrastructure Investors LP (the “Onshore Fund”), with an 89.97% interest and Fortress Worldwide Transportation and Infrastructure Offshore LP (the “Offshore Fund”) with a 9.98% interest; in addition, Fortress Worldwide Transportation and Infrastructure Master GP LLP (the “Master GP”) holds a 0.05% interest. The Master GP is owned by an affiliate of Fortress. The Onshore Fund and the Offshore Fund (collectively, the “Initial Shareholders”) are investment vehicles which are sponsored by Fortress. The general partner of the Onshore Fund and the Offshore Fund is an affiliate of Fortress.
In May 2015, the remaining capital commitments of the investors of the Onshore Fund, Offshore Fund and Master GP were called. Through a series of transactions, the Master GP contributed its rights to previously undistributed incentive allocations pursuant to the partnership agreement in exchange for the limited partnership interests in the Onshore Fund and the Offshore Fund equal to the amount of any such undistributed incentive allocations and 53,502,873 common shares were issued to the Onshore Fund and Offshore Fund based on their relative interests in the Company.
On May 20, 2015, the Company completed an Initial Public Offering (“IPO”) of 20 million common shares at a price to the public of $17.00 per share. On June 15, 2015, the underwriters exercised their overallotment option, pursuant to which the Company issued an additional 2.2 million shares to such underwriters at the IPO price.
2. | SUMMARY OF SIGNIFICANT ACCOUNTING POLICIES |
Basis of Accounting—The accompanying consolidated financial statements are prepared in accordance with U.S. generally accepted accounting principles (“GAAP”) and include the accounts of the Company and its subsidiaries.
Principles of Consolidation—The Company consolidates all entities in which it has a controlling interest and in which it has control over significant operating decisions, as well as variable interest entities (“VIEs”) in which the Company is the primary beneficiary. All significant intercompany transactions and balances have been eliminated. The ownership interest of other investors in consolidated subsidiaries is recorded as non-controlling interest.
The Company uses the equity method of accounting for investments in entities in which the Company exercises significant influence but which do not meet the requirements for consolidation. Under the equity method, the Company records its proportionate share of the underlying net income (loss) of these entities.
Variable Interest Entities—The assessment of whether an entity is a VIE and the determination of whether to consolidate a VIE requires judgment. VIEs are defined as entities in which equity investors do not have the characteristics of a controlling financial interest or do not have sufficient equity at risk for the entity to finance its activities without additional subordinated financial support from other parties. A VIE is required to be consolidated by its primary beneficiary, and only by its primary beneficiary, which is defined as the party who has the power to direct the activities of a VIE that most significantly impact its economic performance and who has the obligation to absorb losses or the right to receive benefits from the VIE that could potentially be significant to the VIE.
WWTAI IES MT6015 Ltd
The Company has an interest in WWTAI IES MT6015 Ltd. (“MT6015”), an entity formed in 2014 which had entered into a contract with a shipbuilder for the construction of an offshore multi service / inspection, maintenance and repair vessel (the “Vessel”) for a price of approximately $75 million. A subsidiary of the Company and a third party each hold a 50% interest in MT6015 and have equal representation on its board of directors. In connection with the initial capitalization of MT6015, another subsidiary of the Company provided the third party partner with a $3,725 loan which was utilized by the third party partner to fund its equity contribution to MT6015. In addition, the agreement provides the Company with disproportionate voting rights, in certain situations, as defined in the agreement. Accordingly, the Company determined that MT6015 is a VIE and that it was the primary beneficiary; accordingly, MT6015 has been presented on a consolidated basis in the accompanying financial statements.
During the year ended December 31, 2016, the Company determined not to proceed with the purchase of the Vessel. The shipbuilder delivered a notice of termination of the shipbuilding contract to MT6015 in July 2016. Correspondingly, in the
98
FORTRESS TRANSPORTATION AND INFRASTRUCTURE INVESTORS LLC
NOTES TO CONSOLIDATED FINANCIAL STATEMENTS
(Dollar amounts in thousands, unless otherwise noted)
second quarter of 2016, the Company recorded an impairment in its MT6015 investment of $7,450. The shipbuilder has no further recourse to the Company.
During the year ended December 31, 2017, the Company entered into a settlement arrangement whereby the holder of the non-controlling interest settled its $3,725 loan due to the Company by transferring its interest in the subsidiary of the Company, and the note payable due to the holder of the non-controlling interest was extinguished. The settlement resulted in a net gain of $1,093 recorded in other income. Refer to Note 8 for further details.
JGP Energy Partners LLC
During the quarter ended September 30, 2016, the Company initiated activities in its 50% owned joint venture, JGP Energy Partners LLC (“JGP”). The other 50% member to the joint venture is a third party ethanol producer. The purpose of the venture is to build storage capacity with capabilities to receive and/or distribute ethanol via water, rail or truck. Each member agreed to contribute up to $27 million (for a total of $54 million) for the development and construction of the ethanol terminal facilities. JGP is governed by a designated operating committee selected by the members in proportion to their equity interests. JGP is solely reliant on its members to finance its activities and therefore is a VIE. The Company concluded that it is not the primary beneficiary of JGP as the members share equally in the risks and rewards and decision making authority of the entity; therefore, the Company does not consolidate JGP and accounts for this investment in accordance with the equity method.
As of December 31, 2017 and 2016, the Company’s investment in JGP was $24,920 and $3,266, respectively, which is included in investments on the Company’s balance sheet. Refer to Note 6 for further details.
Delaware River Partners LLC
On July 1, 2016, the Company, through Delaware River Partners LLC (“DRP”), a consolidated subsidiary, purchased the assets of Repauno, which consisted primarily of land, a storage cavern, and riparian rights for the acquired land, site improvements and rights. Currently there are no operational processes that could be applied to these assets that would result in outputs without significant green field development. The Company currently holds a 90% economic interest and a 100% voting interest in DRP. DRP is solely reliant on the Company to finance its activities and therefore is a VIE. The Company concluded it was the primary beneficiary; and accordingly, DRP has been presented on a consolidated basis in the accompanying financial statements. The Company has the right to purchase an additional 8% economic interest from the non-controlling party after the second anniversary but prior to the fifth year anniversary of the acquisition of Repauno. At the time of the purchase, the Company concluded that 8% of the 10% interest held by the non-controlling party did not share in the risks or rewards of true equity; and, therefore upon acquisition $5,321 was recorded in other liabilities on the Company’s Consolidated Balance Sheets. The remaining 2% economic non-controlling interest was valued at $641 at the acquisition date. Refer to Note 5 for details.
Ohio River Partners LLC
On June 16, 2017, the Company, through Ohio River Partners Shareholders LLC (“ORP”), a consolidated subsidiary, purchased the assets of Long Ridge which consisted primarily of land, buildings, railroad track, docks, water rights, site improvements and other rights. The Company purchased 100% of the interests in these assets. ORP is solely reliant on the Company to finance its activities and therefore is a VIE. The Company concluded it was the primary beneficiary; accordingly, ORP has been presented on a consolidated basis in the accompanying financial statements.
Use of Estimates—The preparation of financial statements in conformity with GAAP requires management to make estimates and assumptions that affect the reported amounts of assets and liabilities, the disclosure of contingent assets and liabilities at the date of the consolidated financial statements and the reported amounts of revenues and expenses during the reporting period. Actual results could differ from those estimates.
Risks and Uncertainties—In the normal course of business, the Company encounters several significant types of economic risk including credit, market, and capital market risks. Credit risk is the risk of the inability or unwillingness of a lessee, customer, or derivative counterparty to make contractually required payments or to fulfill its other contractual obligations. Market risk reflects the risk of a downturn or volatility in the underlying industry segments in which the Company operates which could adversely impact the pricing of the services offered by the Company or a lessee’s or customer’s ability to make payments, increase the risk of unscheduled lease terminations and depress lease rates and the value of the Company’s leasing equipment or operating assets. Capital market risk is the risk that the Company is unable to obtain capital at reasonable rates to fund the growth of its business or to refinance existing debt facilities. The Company, through its subsidiaries, also conducts operations outside of the United States; such international operations are subject to the same risks as those associated with its United States operations as well as additional risks, including unexpected changes in regulatory requirements, heightened risk of political and economic instability, potentially adverse tax consequences and the burden of complying with foreign laws. The Company does not have significant exposure to foreign currency risk as all of its leasing arrangements, terminal services revenue and the majority of freight rail revenue are denominated in U.S. dollars.
Cash and Cash Equivalents—The Company considers all highly liquid short-term investments with a maturity of 90 days or less when purchased to be cash equivalents.
99
FORTRESS TRANSPORTATION AND INFRASTRUCTURE INVESTORS LLC
NOTES TO CONSOLIDATED FINANCIAL STATEMENTS
(Dollar amounts in thousands, unless otherwise noted)
Restricted Cash—Restricted cash of $33,406 and $65,441 as of December 31, 2017 and December 31, 2016, respectively, consists of prepaid interest and principal pursuant to the requirements of certain of the Company’s debt agreements (Note 8), and funds set aside for qualifying constructions projects at Jefferson Terminal.
Available-For-Sale Securities—The Company considers listed equity securities as available-for-sale securities recorded at fair value with unrealized gains (losses) recorded in other comprehensive income (loss) and realized gains (losses) recorded in earnings. The Company’s basis on which the cost of the security sold or the amount reclassified out of other comprehensive income into earnings is determined using specific identification. Available-for-sale securities are included as a component of investments on the accompanying Consolidated Balance Sheets. At each balance sheet date, we evaluate our available for sale securities holdings with unrealized losses to determine if an other-than-temporary impairment has occurred. Refer to Note 6 and 9 for details.
Inventory—Crude oil is carried at the lower of cost or net realizable value on the Company’s balance sheet. Crude oil is removed from inventory based on the average cost at the time of sale. At December 31, 2017 the Company had crude oil inventory of $8,877. The Company records its inventory as a component of other assets on the accompanying Consolidated Balance Sheets.
Property, Plant and Equipment, Leasing Equipment and Depreciation—Property, plant and equipment and leasing equipment are stated at cost (inclusive of capitalized acquisition costs, where applicable) and depreciated using the straight-line method, over estimated useful lives, to estimated residual values which are summarized as follows:
Asset | Range of Estimated Useful Lives | Residual Value Estimates | ||
Aircraft | 25 years from date of manufacture | Generally not to exceed 15% of manufacturer’s list price when new | ||
Aircraft engines | 2 - 6 years, based on maintenance adjusted service life | Sum of engine core salvage value plus the estimated fair value of life limited parts | ||
Offshore energy vessels | 25 years from date of manufacture | 20% of new build cost | ||
Railcars and locomotives | 40 - 50 years from date of manufacture | Scrap value at end of useful life | ||
Track and track related assets | 15 - 50 years from date of manufacture | Scrap value at end of useful life | ||
Buildings and site improvements | 20 - 30 years | Scrap value at end of useful life | ||
Railroad equipment | 3 - 15 years from date of manufacture | Scrap value at end of useful life | ||
Terminal machinery and equipment | 15 - 25 years from date of manufacture | Scrap value at end of useful life | ||
Vehicles | 5 - 7 years from date of manufacture | Scrap value at end of useful life | ||
Furniture and fixtures | 3 - 6 years from date of purchase | None | ||
Computer hardware and software | 3 - 5 years from date of purchase | None | ||
Major improvements and modifications incurred in connection with the acquisition of property, plant and equipment and leasing equipment that are required to get the asset ready for initial service are capitalized and depreciated over the remaining life of the asset. Costs of major additions and betterments are capitalized and depreciation commences once it is placed into service. Interest costs directly related to and incurred during the construction period of property, plant and equipment are capitalized. Significant spare parts are depreciated in conjunction with the underlying property, plant and equipment asset when placed in service.
The Company reviews its depreciation policies on a regular basis to determine whether changes have taken place that would suggest that a change in its depreciation policies, useful lives of its equipment or the assigned residual values is warranted.
For planned major maintenance or component overhaul activities for aviation equipment off lease, the cost of such major maintenance or component overhaul event is capitalized and depreciated on a straight-line basis over the period until the next maintenance or component overhaul event is required.
The Company’s offshore energy vessels are required to be drydocked periodically for recertifications or major repairs and maintenance that cannot be performed while the vessels are operating. Normal repairs and maintenance are expensed as incurred. The Company capitalizes the costs associated with the drydockings and amortizes them on a straight-line basis over the period between drydockings, usually between 30 and 60 months.
100
FORTRESS TRANSPORTATION AND INFRASTRUCTURE INVESTORS LLC
NOTES TO CONSOLIDATED FINANCIAL STATEMENTS
(Dollar amounts in thousands, unless otherwise noted)
In accounting for leasing equipment, the Company makes estimates about the expected useful lives, residual values and the fair value of acquired in-place leases and acquired maintenance liabilities (for aviation equipment). In making these estimates, the Company relies upon observable market data for the same or similar types of equipment and, in the case of aviation equipment, its own estimates with respect to a lessee’s anticipated utilization of the aircraft or engine. When the Company acquires leasing equipment subject to an in-place lease, determining the fair value of the in-place lease requires the Company to make assumptions regarding the current fair values of leases for identical or similar equipment, in order to determine if the in-place lease is within a fair value range of current lease rates. If a lease is below or above the range of current lease rates, the resulting lease discount or premium is recognized as a lease intangible and amortized into lease income over the remaining term of the lease.
Capitalized Interest—The interest cost associated with major development, construction projects and tax exempt bonds is capitalized and included in the cost of the project. Interest capitalization ceases once a project is substantially complete or no longer undergoing construction activities to prepare it for its intended use. The Company capitalized interest of $2,618, $2,721 and $2,128 during the years ended December 31, 2017, 2016 and 2015, respectively.
Repairs and Maintenance—Repair and maintenance costs that do not extend the lives of the assets are expensed as incurred. For the years ended December 31, 2017, 2016 and 2015, $4,963, $3,659 and $3,643, of repairs and maintenance expense, respectively, were recorded in operating expenses in the accompanying Consolidated Statements of Operations.
Impairment of Long-Lived Assets—The Company performs a recoverability assessment of each of its long-lived assets whenever events or changes in circumstances, or indicators, indicate that the carrying amount or net book value of an asset may not be recoverable. Indicators may include, but are not limited to, a significant lease restructuring or early lease termination; significant traffic decline; or the introduction of newer technology aircraft, vessels, engines or railcars. When performing a recoverability assessment, the Company measures whether the estimated future undiscounted net cash flows expected to be generated by the asset exceeds its net book value. The undiscounted cash flows consist of cash flows from currently contracted leases and terminal services contracts, future projected leases, terminal service and freight rail rates, transition costs, estimated down time and estimated residual or scrap values. In the event that an asset does not meet the recoverability test, the carrying value of the asset will be adjusted to fair value resulting in an impairment charge.
Management develops the assumptions used in the recoverability analysis based on its knowledge of active contracts, current and future expectations of the global demand for a particular asset and historical experience in the leasing markets, as well as information received from third party industry sources. The factors considered in estimating the undiscounted cash flows are impacted by changes in future periods due to changes in contracted lease rates, terminal service, and freight rail rates, residual values, economic conditions, technology, demand for a particular asset type and other factors.
Security Deposits—The Company’s operating leases generally require the lessee to pay a security deposit or provide a letter of credit. Security deposits are held until specified return dates stipulated in the lease or lease expiration.
Maintenance Payments—Typically, under an operating lease of aircraft, the lessee is responsible for performing all maintenance and is generally required to make maintenance payments to the Company for heavy maintenance, overhaul or replacement of certain high-value components of the aircraft or engine. These maintenance payments are based on hours or cycles of utilization or on calendar time, depending on the component, and are generally required to be made monthly in arrears. If a lessee is making monthly maintenance payments, the Company would typically be obligated to reimburse the lessee for costs they incur for heavy maintenance, overhaul or replacement of certain high-value components to the extent of maintenance payments received in respect of the specific maintenance event, usually shortly following the completion of the relevant work.
The Company records the portion of maintenance payments paid by the lessee that are expected to be reimbursed as maintenance deposit liabilities on the Consolidated Balance Sheet. Reimbursements made to the lessee upon the receipt of evidence of qualifying maintenance work are recorded against the maintenance deposit liability.
In certain leases, the lessee or the Company may be obligated to make a payment to the other party at lease termination based on redelivery conditions stipulated at the inception of the lease. When the lessee is required to return the aircraft in an improved maintenance condition, the Company records a maintenance right asset, as a component of other assets, for the estimated value of the end-of-life maintenance payment at acquisition. The Company recognizes payments received as end-of-lease compensation adjustments, within lease revenue or as a reduction to the maintenance right asset, when payment is received or collectability is assured. In the event the Company is required to make payments at the end of the lease for redelivery conditions, amounts are accrued as additional maintenance liability and expensed when the Company is obligated and can reasonably estimate such payment.
Lease Incentives and Amortization—Lease incentives, which include lease acquisition costs related to reconfiguration of the aircraft cabin, other lessee specific modifications and other direct costs, are capitalized and amortized as a reduction of lease income over the primary term of the lease, assuming no lease renewals.
101
FORTRESS TRANSPORTATION AND INFRASTRUCTURE INVESTORS LLC
NOTES TO CONSOLIDATED FINANCIAL STATEMENTS
(Dollar amounts in thousands, unless otherwise noted)
Goodwill —Goodwill includes the excess of the purchase price over the fair value of the net tangible and intangible assets associated with the acquisitions of CMQR and Jefferson Terminal. The carrying amount of goodwill is approximately $116,584 as of December 31, 2017 and December 31, 2016.
The Company reviews the carrying values of goodwill at least annually to assess impairment since these assets are not amortized. An annual impairment review is conducted as of October 1st of each year. Additionally, the Company reviews the carrying value of goodwill whenever events or changes in circumstances indicate that its carrying amount may not be recoverable. The determination of fair value involves significant management judgment.
For an annual goodwill impairment assessment, an optional qualitative analysis may be performed. If the option is not elected or if it is more likely than not that the fair value of a reporting unit is less than its carrying amount, then a two-step goodwill impairment test is performed to identify potential goodwill impairment and measure an impairment loss. A qualitative analysis was not elected for the years ended December 31, 2017, December 31, 2016 and December 31, 2015.
The first step of an impairment assessment compares the fair value of a respective reporting unit with its carrying amount, including goodwill. The estimate of fair value of the respective reporting unit is based on the best information available as of the date of assessment, which primarily incorporates certain factors including the Company’s assumptions about operating results, business plans, income projections, anticipated future cash flows and market data. If the estimated fair value of the reporting unit is less than the carrying amount, a second step must be completed in order to determine the amount of goodwill impairment that should be recorded, if any.
For the purpose of performing the annual analysis, the Company’s two reporting units subject to the test are the Jefferson Terminal and Railroad reporting units. The Company estimates the fair value of the reporting units using an income approach, specifically a discounted cash flow analysis. This analysis requires the Company to make significant assumptions and estimates about the extent and timing of future cash flows, discount rates and growth rates. The estimates and assumptions used consider historical performance and are consistent with the assumptions used in determining future profit plans for the reporting units. The Company also utilizes market valuation models and other financial ratios, which require the Company to make certain assumptions and estimates regarding the applicability of those models to its assets and businesses.
Although the Company believes the estimates of fair value are reasonable, the determination of certain valuation inputs is subject to management’s judgment. Changes in these inputs could materially affect the results of the impairment review. If the forecasts of cash flows generated by the Jefferson Terminal and Railroad reporting units or other key inputs are negatively revised in the future, the estimated fair value of the Jefferson Terminal and Railroad reporting units would be adversely impacted, potentially leading to an impairment in the future that could materially affect the Company’s operating results. Specifically, as it relates to the Jefferson Terminal segment, forecasted revenue is dependent on the ramp up of volumes under current contracts and the acquisition of additional storage contracts for both the heavy and light crude and refined products during 2018. The expansion of refineries in the Beaumont/Port Arthur area, as well as growing crude oil production in the U.S. and Canada, are expected to result in increased demand for storage on the U.S. Gulf Coast.
Furthermore, development of both inbound and outbound pipelines to/from the Jefferson Terminal over the next two years will affect our forecasted growth and therefore our estimated fair value. We expect the Jefferson Terminal segment to generate positive Adjusted EBITDA during 2018. The Company’s estimated fair value exceeded carrying value by greater than 15%.
For the years ended December 31, 2017, 2016, and 2015 there was no impairment of goodwill.
Intangibles and amortization—Intangibles include the value of acquired favorable and unfavorable leases and existing customer relationships acquired in connection with the acquisitions of CMQR and Jefferson Terminal.
In accounting for acquired leasing equipment, the Company makes estimates about the fair value of the acquired leases. In determining the fair value of these leases, the Company makes assumptions regarding the current fair values of leases for identical or similar equipment in order to determine if the acquired lease is within a fair value range of current lease rates. If a lease is below or above the range of current lease rates, the resulting lease discount or premium is recognized as a lease intangible and amortized into rental income over the remaining term of the lease. Acquired lease intangibles are amortized on a straight-line basis over the remaining lease terms, which ranged from two to 54 months as of December 31, 2017, and are recorded as a component of equipment leasing revenues in the accompanying Consolidated Statements of Operations.
Customer relationship intangible assets are amortized on a straight-line basis over their useful lives as the pattern in which the asset’s economic benefits are consumed cannot reliably be determined. Customer relationship intangible assets have useful lives ranging from 5 to 10 years, no estimated residual value, and amortization is recorded as a component of depreciation and amortization in the accompanying Consolidated Statements of Operations.
102
FORTRESS TRANSPORTATION AND INFRASTRUCTURE INVESTORS LLC
NOTES TO CONSOLIDATED FINANCIAL STATEMENTS
(Dollar amounts in thousands, unless otherwise noted)
Deferred Financing Costs—Costs incurred in connection with obtaining long term financing are capitalized and amortized to interest expense over the term of the underlying loans. Unamortized deferred financing costs of $11,423 and $6,489 as of December 31, 2017 and December 31, 2016, respectively, are recorded as a component of debt in the accompanying Consolidated Balance Sheets. Amortization expense of $4,202, $2,576 and $1,469 for the years ended December 31, 2017, 2016 and 2015, respectively, are included as a component of interest expense in the accompanying Consolidated Statements of Operations.
Revenue Recognition
Equipment Leasing Revenues
Operating Leases—The Company leases equipment pursuant to net operating leases. Operating leases with fixed rentals and step rentals are recognized on a straight-line basis over the term of the lease, assuming no renewals. Revenue is not recognized when collection is not reasonably assured. When collectability is not reasonably assured, the customer is placed on non-accrual status and revenue is recognized when cash payments are received.
The Company also recognizes maintenance revenue related to the portion of maintenance payments received from lessees of aviation equipment that are not expected to be reimbursed in connection with major maintenance events.
Finance Lease—The Company owns one anchor handling tug supply vessel subject to a finance lease, as of December 31, 2017 and 2016. This lease generally includes a lessee obligation to purchase the leased equipment at the end of the lease term, a bargain purchase option, or provides for minimum lease payments with a present value of 90% or more of the fair value of the leased equipment at the date of lease inception. Net investment in finance lease represents the minimum lease payments due from lessee, net of unearned income. The lease payments are segregated into principal and interest components similar to a loan. Unearned income is recognized on an effective interest method over the lease term and is recorded as finance lease income. The principal component of the lease payment is reflected as a reduction to the net investment in finance leases.
Infrastructure Revenues
Rail Revenues—Rail revenues are recognized proportionally as freight moves from origin to destination. Other miscellaneous revenues, such as unloading and switching revenue, are recognized as the service is performed or contractual obligations are met.
Terminal Services Revenues—Terminal services revenues are recognized when services have been provided to the customer, the product has been delivered, the price is considered to be fixed or determinable and collectability is reasonably assured. Prepayments for services are deferred until the period in which the above criteria are met. Terminal services fees include services provided to third-party customers related to receipt and redelivery of crude oil products.
Lease Revenues—Ports and Terminals revenue are recognized as various tenants lease out storage space including equipment, piping and frac sand. Lease revenue is recognized based on the terms of the lease agreement.
Concentration of Credit Risk—The Company is subject to concentrations of credit risk with respect to amounts due from customers on its finance lease and operating leases. The Company attempts to limit its credit risk by performing ongoing credit evaluations. During the year ended December 31, 2016, the Company earned approximately 10% of its revenue from one customer in the Jefferson Terminal segment. During the year ended December 31, 2015, the Company earned approximately 21% of its revenue from one customer in the Offshore Energy segment and one in the Jefferson Terminal segment. During the year ended December 31, 2017, no customer accounted for 10% of the Company’s revenue.
As of December 31, 2017, accounts receivable from two customers in the Offshore Energy segment each represented 17% and 10% of total accounts receivable, net. As of December 31, 2016, accounts receivable from two customers in the Offshore Segment each represented 22% and 18% of total accounts receivable, net.
The Company maintains cash and restricted cash balances, which generally exceed federally insured limits, and subject the Company to credit risk, in high credit quality financial institutions. The Company monitors the financial condition of these institutions and has not experienced any losses associated with these accounts.
Provision for Doubtful Accounts—The Company determines the provision for doubtful accounts based on its assessment of the collectability of its receivables on a customer-by-customer basis. The provision for doubtful accounts at December 31, 2017 and December 31, 2016 was $983 and $418, respectively. Bad debt expense was $701, $158, and $676 for the years ended December 31, 2017, 2016 and 2015, respectively.
Expense Recognition—Expenses are recognized on an accrual basis as incurred.
Acquisition and Transaction expenses—Acquisition and transaction expense is comprised of costs related to completed business combinations and terminated deal costs related to abandoned pursuits, including advisory, legal, accounting, valuation and other professional or consulting fees.
Comprehensive Income (Loss)—Comprehensive income (loss) is defined as the change in equity of a business enterprise during a period from transactions and other events and circumstances, excluding those resulting from investments by and distributions to owners. The Company’s comprehensive income (loss) represents net income (loss), as presented in the
103
FORTRESS TRANSPORTATION AND INFRASTRUCTURE INVESTORS LLC
NOTES TO CONSOLIDATED FINANCIAL STATEMENTS
(Dollar amounts in thousands, unless otherwise noted)
Consolidated Statements of Operations, adjusted for fair value changes related to the available-for-sale securities and derivatives accounted for as cash flow hedges.
Derivative Financial Instruments—In the normal course of business the Company may utilize interest rate derivatives to manage its exposure to interest rate risks, principally related to the hedging of variable rate interest payments on various debt facilities. If certain conditions are met, an interest rate derivative may be specifically designated as a cash flow hedge. In connection with its debt obligations, the Company entered into one interest rate derivative designated as a cash flow hedge and one non-hedge derivative. The Company terminated both derivatives during the first quarter of 2016 when the related debt obligations were paid in full. For the interest rate derivative designated as a cash flow hedge, all remaining net gains or losses in accumulated other comprehensive income at the date of termination were reclassified into earnings during the year ended December 31, 2016. In 2017 the Company entered into short-term forward crude contracts. The fair value of the short-term derivative asset at December 31, 2017 and 2016 was $1,022 and $0, respectively, recorded in other assets.
The Company does not enter into speculative derivative transactions.
Foreign Currency—The Company’s functional and reporting currency is the U.S. dollar. Purchases and sales of assets and income and expense items denominated in foreign currencies are translated into U.S. dollar amounts on the respective dates of such transactions. Net realized foreign currency gains or losses relating to the differences between these recorded amounts and the U.S. dollar equivalent actually received or paid are reported as a component of operating expenses within the Consolidated Statement of Operations.
Income Taxes—A portion of the Company’s income earned by its corporate subsidiaries is subject to U.S. federal and state income taxation, taxed at prevailing rates. The remainder of the Company’s income is allocated directly to its partners and is not subject to a corporate level of taxation. Certain subsidiaries of the Company are subject to income tax in the foreign countries in which they conduct business.
The Company accounts for these taxes using the asset and liability method under which deferred tax assets and liabilities are recognized for the future tax consequences attributable to differences between the financial statement carrying amounts of existing assets and liabilities and their respective tax bases. A valuation allowance is established when management believes it is more likely than not that a deferred tax asset will not be realized.
The Company files income tax returns in the U.S. federal jurisdiction, various state jurisdictions and in certain foreign jurisdictions. The income tax returns filed by the Company and its subsidiaries are subject to examination by the U.S. federal, state and foreign tax authorities. The Company recognizes tax benefits for uncertain tax positions only if it is more likely than not that the position is sustainable based on its technical merits. Interest and penalties on uncertain tax positions are included as a component of the provision for income taxes in the Consolidated Statements of Operations.
Other Assets—Other assets is primarily comprised of inventory of crude oil of $8,877 and $0, notes receivables of $2,623 and $22,469, leasing equipment purchase deposits of $12,299 and $13,701, lease incentives of $23,811 and $3,556, capitalized costs for potential acquisitions of $97 and $2,116, prepaid expenses of $4,149 and $3,440, and receivables of $1,760 and $21,501 as of December 31, 2017 and December 31, 2016, respectively.
Dividends—Dividends are recorded if and when declared by the Board of Directors. In both the fourth quarters ended December 31, 2017 and 2016, the Board of Directors declared a cash dividend of $0.33 per share, totaling $1.32 of dividends per share for each of the years ended December 31, 2017 and 2016.
Recent Accounting Pronouncements—In July 2015, the Financial Accounting Standards Board (“FASB”) issued an Accounting Standards Update (“ASU”) 2015-11, Simplifying the Measurement of Inventory (Topic 330) (“ASU 2015-11”), which simplifies the measurement of inventory by requiring certain inventory to be measured at the “lower of cost and net realizable value” and the previous parameters for “market value” will be eliminated. ASU 2015-11 defines net realizable value as the “estimated selling prices in the ordinary course of business, less reasonably predictable costs of completion, disposal, and transportation.” The Company adopted ASU 2015-11 on January 1, 2017 and the adoption of this standard did not have a material impact on our financial statements.
In March 2016, the FASB issued ASU 2016-06, Contingent put and call options in debt instruments (“ASU 2016-06”). ASU 2016-06 simplifies the embedded derivative analysis for debt instruments containing contingent call or put options. ASU 2016-06 is effective for fiscal years beginning after December 15, 2016, and interim periods within those fiscal years, with early adoption permitted. The Company adopted ASU 2016-06 as of January 1, 2017 and the adoption of this guidance did not have a material impact on the Company’s consolidated financial statements.
104
FORTRESS TRANSPORTATION AND INFRASTRUCTURE INVESTORS LLC
NOTES TO CONSOLIDATED FINANCIAL STATEMENTS
(Dollar amounts in thousands, unless otherwise noted)
In March 2016, the FASB issued ASU 2016-09, Improvements to Employee Share-Based Payment Accounting (“ASU 2016-09”). ASU 2016-09 requires the income tax effects of awards to be recognized in the income statement when the awards vest or are settled, increases the amount an employer can withhold to cover income taxes on awards and still qualify for the exception to liability classification, and allow recognizing forfeitures of awards as they occur. ASU 2016-09 is effective beginning in the first quarter of 2017, with early adoption permitted. The Company adopted ASU 2016-09 as of January 1, 2017 and the adoption of this guidance did not have a material impact on the Company’s consolidated financial statements.
In October 2016, the FASB issued ASU 2016-17, Consolidation (Topic 810): Interests Held through Related Parties That Are under Common Control (“ASU 2016-17”). ASU 2016-17 amends the consolidation guidance on how a reporting entity that is the single decision maker of a VIE should treat indirect interests in the entity held through related parties that are under common control with the reporting entity when determining whether it is the primary beneficiary of that VIE. Under the amendments, a single decision maker is not required to consider indirect interests held through related parties that are under common control with the single decision maker to be the equivalent of direct interests in their entirety. Instead, a single decision maker is required to include those interests on a proportionate basis consistent with indirect interests held through other related parties. ASU 2016-17 is effective for fiscal years beginning after December 15, 2016, and interim periods within those fiscal years. Early adoption is permitted, including adoption in an interim period. The Company adopted ASU 2016-17 as of January 1, 2017 and the adoption of this guidance did not have a material impact on the Company’s consolidated financial statements.
In January 2017, the FASB issued ASU 2017-01, Business Combinations (Topic 805) (“ASU 2017-01”). ASU 2017-01 clarifying the definition of a business with the objective of adding guidance to assist entities with evaluating whether transactions should be accounted for as acquisitions (or disposals) of businesses or assets. ASU 2017-01 is effective for fiscal years beginning after December 15, 2017, and interim periods within those fiscal years. Early adoption is permitted. The Company adopted ASU 2017-01 as of January 1, 2017 and the adoption of this guidance did not have a material impact on the Company’s consolidated financial statements.
Unadopted Accounting Pronouncements—In May 2014, the FASB issued ASU 2014-09, Revenues from Contracts with Customers (Topic 606) (“ASU 2014-09”). ASU 2014-09 requires that a company recognize revenue when it transfers promised goods or services to customers in an amount that reflects the consideration to which the company expects to be entitled in exchange for those goods or services. In doing so, companies will need to use more judgment and make more estimates than under current guidance. These may include identifying performance obligations in the contract, estimating the amount of variable consideration to include in the transaction price and allocating the transaction price to each separate performance obligation. In August 2015, the FASB deferred the effective date of this standard by one year, which will be for fiscal years, and interim periods within those years, beginning after December 15, 2017. Additionally, the FASB issued ASU 2016-08, Revenue from Contracts with Customers, Principal versus Agent Considerations, ASU 2016-10, Revenue from Contracts with Customers, Identifying Performance Obligations and Licensing and ASU 2016-12, Revenue from Contracts with Customers, Narrow-Scope Improvements and Practical Expedients, ASU 2016-20, Technical Corrections and Improvements to Topic 606, Revenue from Contracts with Customers, ASU 2017-14, Income Statement-Reporting Comprehensive Income (Topic 220), Revenue Recognition (Topic 605), and Revenue from Contracts with Customers (Topic 606) which clarify the guidance on reporting revenue as a principal versus agent, identifying and disclosing performance obligations, accounting for intellectual property licenses, and assessing collectibility, present sales tax, treating noncash consideration. The Company has identified and evaluated relevant revenue contracts within the scope of the guidance. As the Company’s primary source of revenues is from its leasing contracts, subject to ASU 2016-02, Leases, management has concluded that the adoption of this ASU will not result in a material impact on its consolidated financial statements.
In February 2016, the FASB issued ASU 2016-02, Leases (“ASU 2016-02”). ASU 2016-02 amends the existing accounting standards for lease accounting, including requiring lessees to recognize most leases on their balance sheets and making targeted changes to lessor accounting. ASU 2016-02 will be effective beginning in the first quarter of 2019, with early adoption permitted. ASU 2016-02 requires a modified retrospective transition approach for all leases existing at, or entered into after, the date of initial application, with an option to use certain transition relief. The Company’s evaluation of the impact of the new guidance on its consolidated financial statements is ongoing. The Company is currently identifying the lease arrangements within the scope of the new guidance, and evaluating the impact of the lease arrangements. In September 2017, the FASB issued ASU 2017-13, Revenue Recognition (Topic 605), Revenue from contracts from customers (Topic 606), Leases (Topic 840) and Leases (Topic 842), (“ASU 2017-13”) which adds SEC paragraphs to the new revenue and lease sections of the codification on the announcement of the SEC observer made at the July 2017 EITF meeting.
In January 2016, the FASB issued ASU 2016-01, Financial Instruments-Overall (Subtopic 825-10): Recognition and Measurement of Financial Assets and Financial Liabilities (“ASU 2016-01”). ASU 2016-01 requires (i) equity investments, except those accounted for under the equity method of accounting or those that result in consolidation of the investee, to be measured at fair value with changes in fair value recognized in net income, (ii) public business entities to use the exit price notion when measuring the fair value of financial instruments for disclosure purposes, and (iii) separate presentation
105
FORTRESS TRANSPORTATION AND INFRASTRUCTURE INVESTORS LLC
NOTES TO CONSOLIDATED FINANCIAL STATEMENTS
(Dollar amounts in thousands, unless otherwise noted)
of financial assets and financial liabilities by measurement category and form of financial asset. ASU 2016-01 also eliminates the requirement for public business entities to disclose the methods and significant assumptions used to estimate the fair value that is required to be disclosed for financial instruments measured at amortized cost. The pronouncement is effective for fiscal years, and interim periods within those years, beginning after December 15, 2017, with early adoption permitted. The Company does not expect that the adoption of this ASU will have a material impact on its consolidated financial statements.
In May 2016, the FASB issued ASU 2016-11, Revenue Recognition (Topic 605) and Derivatives and Hedging (Topic 815): Rescission of SEC Guidance Because of Accounting Standards Updates 2014-09 and 2014-16 Pursuant to Staff Announcements at the March 3, 2016 EITF Meeting. The Company is currently evaluating the impact of adopting this new guidance on its consolidated financial statements.
In June 2016, the FASB issued ASU 2016-13, Financial Instruments—Credit Losses (Topic 326): Measurement of Credit Losses on Financial Instruments (“ASU 2016-13”). For assets held at amortized cost basis, ASU 2016-13 eliminates the probable initial recognition threshold in current GAAP and, instead, requires an entity to reflect its current estimate of all expected credit losses. The allowance for credit losses is a valuation account that is deducted from the amortized cost basis of the financial assets to present the net amount expected to be collected. For available for sale debt securities, credit losses should be measured in a manner similar to current GAAP, however this ASU requires that credit losses be presented as an allowance rather than as a write-down. This ASU affects entities holding financial assets and net investment in leases that are not accounted for at fair value through net income. The amendments affect loans, debt securities, trade receivables, net investments in leases, off balance sheet credit exposures, reinsurance receivables, and any other financial assets not excluded from the scope that have the contractual right to receive cash. ASU 2016-13 will be effective for fiscal years beginning after December 15, 2019, including interim periods within those fiscal years. The Company is currently evaluating the impact of adopting this new guidance on its consolidated financial statements.
In August 2016, the FASB issued ASU 2016-15, Statement of Cash Flows: Classification of Certain Cash Receipts and Cash Payments (“ASU 2016-15”). ASU 2016-15 addresses the following eight specific cash flow issues: (i) debt prepayment or debt extinguishment costs; (ii) settlement of zero-coupon debt instruments or other debt instruments with coupon interest rates that are insignificant in relation to the effective interest rate of the borrowing; (iii) contingent consideration payments made after a business combination; (iv) proceeds from the settlement of insurance claims; (v) proceeds from the settlement of corporate-owned life insurance policies (COLIs); (vi) distributions received from equity method investees; (vii) beneficial interests in securitization transactions; (viii) and separately identifiable cash flows and application of the predominance principle. ASU 2016-15 will be effective for fiscal years beginning after December 15, 2017, and interim periods within those fiscal years. Early adoption is permitted, including adoption in an interim period. The Company does not expect that the adoption of this ASU will have a material impact on its consolidated financial statements.
In October 2016, the FASB issued ASU 2016-16, Income Taxes (Topic 740): Intra-Entity Transfers of Assets Other Than Inventory (“ASU 2016-16”). ASU 2016-16 prohibits the recognition of current and deferred income taxes for an intra-entity asset transfer until the asset has been sold to an outside party. In addition, interpretations of this guidance have developed in practice for transfers of certain intangible and tangible assets. This prohibition on recognition is an exception to the principle of comprehensive recognition of current and deferred income taxes in GAAP. To more faithfully represent the economics of intra-entity asset transfers, the amendments ASU 2016-16 require that entities recognize the income tax consequences of an intra-entity transfer of an asset other than inventory when the transfer occurs. The amendments in ASU 2016-16 do not change GAAP for the pre-tax effects of an intra-entity asset transfer under Topic 810, Consolidation, or for an intra-entity transfer of inventory. ASU 2016-16 will be effective for annual reporting periods beginning after December 15, 2017, and interim periods within those annual reporting periods. Early adoption is permitted, including adoption in an interim period. The Company does not expect that the adoption of this ASU will have a material impact on its consolidated financial statements.
In November 2016, the FASB issued ASU 2016-18, Statement of Cash Flows (Topic 230): Restricted Cash (“ASU 2016-18”). ASU 2016-18 addresses the diversity in the classification and presentation of changes in restricted cash on the statement of cash flows under Topic 230, Statement of Cash Flows. The amendments in ASU 2016-18 require that a statement of cash flows explain the change during the period in the total of cash, cash equivalents, and amounts generally described as restricted cash or restricted cash equivalents. Therefore, amounts generally described as restricted cash and restricted cash equivalents should be included with cash and cash equivalents when reconciling the beginning-of-period and end-of-period total amounts shown on the statement of cash flows. The amendments in this ASU apply to all entities that have restricted cash or restricted cash equivalents and are required to present a statement of cash flows under Topic 230. ASU 2016-18 will be effective for fiscal years beginning after December 15, 2017, and interim periods within those fiscal years. Early adoption is permitted, including adoption in an interim period. The Company does not expect that the adoption of this ASU will have a material impact on its consolidated financial statements.
106
FORTRESS TRANSPORTATION AND INFRASTRUCTURE INVESTORS LLC
NOTES TO CONSOLIDATED FINANCIAL STATEMENTS
(Dollar amounts in thousands, unless otherwise noted)
In January 2017, the FASB issued ASU 2017-04, Intangibles—Goodwill and Other (Topic 350): Simplifying the Test for Goodwill Impairment (“ASU 2017-04”). ASU 2017-04 addresses concerns over the cost and complexity of the two-step goodwill impairment test by removing the second step of the test. An entity will apply a one-step quantitative test and record the amount of goodwill impairment as the excess of a reporting unit's carrying amount over its fair value, not to exceed the total amount of goodwill allocated to the reporting unit. The new guidance does not amend the optional qualitative assessment of goodwill impairment. ASU 2017-01 will be effective for fiscal years beginning after December 15, 2019, and interim periods within those fiscal years. The Company is currently evaluating the impact of adopting this new guidance on its consolidated financial statements.
In February 2017, the FASB issued ASU 2017-05, Other Income—Gains and Losses from the Derecognition of Nonfinancial Assets (Subtopic 610-20): Clarifying the Scope of Asset Derecognition Guidance and Accounting for Partial Sales of Nonfinancial Assets (“ASU 2017-05”). ASU 2017-05 amends the scope of the nonfinancial asset guidance in Subtopic 610-20. The amendments also clarify that the derecognition of all businesses and nonprofit activities (except those related to conveyances of oil and gas mineral rights or contracts with customers) should be accounted for in accordance with the derecognition and deconsolidation guidance in Subtopic 810-10. In addition, the amendments eliminate the exception in the financial asset guidance for transfers of investments (including equity method investments) in real estate entities and supersede the guidance in the Exchanges of a Nonfinancial Asset for a Noncontrolling Ownership Interest Subsection within Topic 845. The amendments in ASU 2017-05 also provide guidance on the accounting for what often are referred to as partial sales of nonfinancial assets within the scope of Subtopic 610-20 and contributions of nonfinancial assets to a joint venture or other noncontrolled investee. ASU 2017-05 will be effective for annual reporting periods beginning after December 15, 2017, and interim periods within those fiscal years. The Company does not expect that the adoption of this ASU will have a material impact on its consolidated financial statements.
In May 2017, the FASB issued Accounting Standards Update No. 2017-09, Compensation - Stock Compensation (Topic 718): Scope of Modification Accounting ("ASU 2017-09"), which provides guidance about which changes to the terms or conditions of a share-based payment award require an entity to apply modification accounting in Topic 718. ASU 2017-09 is effective for fiscal years beginning after December 15, 2017 and interim periods within those fiscal years, and early adoption is permitted, including in an interim period. ASU 2017-09 is to be applied on a prospective basis to an award modified on or after the adoption date. We do not expect the adoption of ASU 2017-09 to have a material impact on our consolidated financial statements.
3. | LEASING EQUIPMENT, NET |
Leasing equipment, net is summarized as follows:
December 31, | |||||||
2017 | 2016 | ||||||
Leasing equipment | $ | 1,217,862 | $ | 849,565 | |||
Less: Accumulated depreciation | (143,732 | ) | (84,110 | ) | |||
Leasing equipment, net | $ | 1,074,130 | $ | 765,455 | |||
During the year ended December 31, 2017, the Company acquired 25 aircraft and 58 commercial jet engines, and sold 3 aircraft and 14 commercial jet engines. During the year ended December 31, 2016, the Company acquired 9 aircraft and 28 commercial jet engines, and sold 1 aircraft and 4 commercial jet engines. The Company recognized gains of $7,188 and $5,214 related to the sale of these assets in the years ended December 31, 2017 and 2016, respectively, which were recorded in Gains on Sale of Assets in the Company’s Consolidated Statement of Operations.
Depreciation expense for leasing equipment is summarized as follows:
Year Ended December 31, | |||||||||||
2017 | 2016 | 2015 | |||||||||
Depreciation expense for leasing equipment | $ | 69,331 | $ | 43,886 | $ | 30,624 | |||||
107
FORTRESS TRANSPORTATION AND INFRASTRUCTURE INVESTORS LLC
NOTES TO CONSOLIDATED FINANCIAL STATEMENTS
(Dollar amounts in thousands, unless otherwise noted)
4. | FINANCE LEASES, NET |
Finance leases, net are summarized as follows:
December 31, | ||||||||
2017 | 2016 | |||||||
Finance leases | $ | 16,015 | $ | 18,022 | ||||
Unearned revenue | (6,771 | ) | (8,305 | ) | ||||
Finance leases, net | $ | 9,244 | $ | 9,717 | ||||
During the first quarter of 2016, the Company completed the sale of approximately 42,000 shipping containers that were subject to direct finance leases for a modest gain.
As of December 31, 2017, future minimum lease payments to be received under finance leases for the remainder of the lease terms are as follows:
Total | |||
2018 | $ | 2,008 | |
2019 | 2,008 | ||
2020 | 2,013 | ||
2021 | 2,008 | ||
2022 | 2,008 | ||
Thereafter | 5,970 | ||
Total | $ | 16,015 | |
5. | PROPERTY, PLANT AND EQUIPMENT, NET |
Property, plant and equipment, net is summarized as follows:
December 31, | ||||||||
2017 | 2016 | |||||||
Land, site improvements and rights | $ | 74,268 | $ | 57,617 | ||||
Construction in progress | 100,420 | 49,605 | ||||||
Buildings and improvements | 9,807 | 2,750 | ||||||
Terminal machinery and equipment | 299,444 | 236,652 | ||||||
Track and track related assets | 35,371 | 22,948 | ||||||
Railroad equipment | 1,057 | 1,091 | ||||||
Railcars and locomotives | 3,429 | 2,909 | ||||||
Computer hardware and software | 3,105 | 388 | ||||||
Furniture and fixtures | 544 | 405 | ||||||
Vehicles | 1,480 | 985 | ||||||
528,925 | 375,350 | |||||||
Less: Accumulated depreciation | (40,605 | ) | (26,002 | ) | ||||
Spare parts | 1,629 | 2,833 | ||||||
Property, plant and equipment, net | $ | 489,949 | $ | 352,181 | ||||
During the years ended December 31, 2017 and 2016, additional property, plant and equipment of $152,263 and $65,780 was acquired, respectively, primarily consisting of the purchase of land, construction in progress, terminal machinery and equipment, and railcars and locomotives.
On July 1, 2016, the Company, through one of its consolidated subsidiaries, purchased the assets of Repauno for a cash purchase price of approximately $24,000. These amounts consist primarily of land, a storage cavern, riparian rights for the acquired land, site improvements and rights. As part of the transaction, additional amounts of $13,991 were capitalized for costs directly related to the purchase, including costs for legal advice, exploratory diligence, and regulatory permitting costs in an effort to close the transaction and pre-acquisition services provided by our third party shareholder in exchange for a minority interest. As of December 31, 2017 and 2016, Repauno is part of the Ports and Terminals segment.
108
FORTRESS TRANSPORTATION AND INFRASTRUCTURE INVESTORS LLC
NOTES TO CONSOLIDATED FINANCIAL STATEMENTS
(Dollar amounts in thousands, unless otherwise noted)
On June 16, 2017, the Company, through one of its consolidated subsidiaries, purchased the assets of Long Ridge for $30,000. The assets acquired consisted primarily of land, buildings, railroad track, docks, water rights, site improvements and other rights. As part of the transaction, additional amounts of $2,335 were capitalized for costs directly related to the purchase, including costs for legal advice, exploratory diligence, and regulatory permitting. Long Ridge is part of the Ports and Terminals segment as of December 31, 2017.
During the year ended December 31, 2017, disposals of property, plant and equipment totaled $108. During the year ended December 31, 2016, disposals of property, plant and equipment totaled $490, mainly related to railroad equipment, vehicles, and furniture and fixtures.
Depreciation expense for property, plant and equipment is summarized as follows:
Year Ended December 31, | |||||||||||
2017 | 2016 | 2015 | |||||||||
Depreciation expense for property, plant and equipment | $ | 15,181 | $ | 12,726 | $ | 11,099 | |||||
6. | INVESTMENTS |
The following table presents the ownership interests and carrying values of the Company’s investments:
Carrying Value | |||||||||||
Investment | Ownership Percentage | December 31, 2017 | December 31, 2016 | ||||||||
Listed securities | Available-for-sale | —% | $ | — | $ | 17,630 | |||||
Advanced Engine Repair JV | Equity method | 25% | 13,724 | 15,000 | |||||||
JGP Energy Partners LLC | Equity method | 50% | 24,920 | 3,266 | |||||||
Intermodal Finance I, Ltd. | Equity method | 51% | 3,894 | 4,082 | |||||||
$ | 42,538 | $ | 39,978 | ||||||||
The following table presents a rollforward of the Company’s available-for-sale securities:
Available-for-Sale Securities | |||
December 31, 2015 | $ | — | |
Purchases | 10,500 | ||
Unrealized gain | 7,130 | ||
December 31, 2016 | 17,630 | ||
Purchases | 8,332 | ||
Unrealized gain | 4,276 | ||
Sale | (30,238 | ) | |
December 31, 2017 | $ | — | |
Cost | $ | — | |
The Company realized a gain of $11,406 on the sale of the available-for-sale securities during the year ended December 31, 2017, recorded in Gain on Sale of Assets in the Company’s Consolidated Statement of Operations.
The Company did not recognize any other-than-temporary impairments for the year ended December 31, 2017.
Equity Method Investments
Advanced Engine Repair JV
In December 2016, the Company invested $15,000 for 25% interest in an advanced engine repair joint venture. The Company will focus on developing new costs savings programs for engine repairs. The Company exercises significant influence over this investment and accounts for this investment as an equity method investment. The Company’s proportionate share of equity in losses was $1,276 and $0 for the years ended December 31, 2017 and 2016, respectively.
109
FORTRESS TRANSPORTATION AND INFRASTRUCTURE INVESTORS LLC
NOTES TO CONSOLIDATED FINANCIAL STATEMENTS
(Dollar amounts in thousands, unless otherwise noted)
JGP
In 2016, the Company initiated activities in a 50% non-controlling interest in JGP, a joint venture. JGP is governed by a designated operating committee selected by the members in proportion to their equity interests. JGP is solely reliant on its members to finance its activities and therefore is a variable interest entity. The Company concluded it is not the primary beneficiary of JGP as the members share equally in the risks and rewards and decision making authority of the entity; therefore, the Company does not consolidate JGP and instead accounts for this investment in accordance with the equity method. The Company’s proportionate share of equity in losses was $322 and $18 for the years ended December 31, 2017 and 2016, respectively.
The table below presents summarized financial information for the Company’s equity method investments, excluding Intermodal Finance I, Ltd:
Balance Sheet | December 31, 2017 | December 31, 2016 | |||||||
Assets | |||||||||
Cash and cash equivalents | $ | 9,904 | $ | 14,806 | |||||
Prepaid expenses | 1,181 | 3,080 | |||||||
Accounts receivable | 1,282 | 7,844 | |||||||
Intangible asset | 45,000 | 45,000 | |||||||
Property, plants and equipment | 50,042 | $ | 6,924 | ||||||
Total assets | $ | 107,409 | $ | 77,654 | |||||
Liabilities | |||||||||
Accounts payable and accrued liabilities | $ | 2,736 | $ | 3,277 | |||||
Total liabilities | 2,736 | 3,277 | |||||||
Equity | |||||||||
Shareholders’ equity | 110,520 | 74,414 | |||||||
Retained earnings | (5,847 | ) | (37 | ) | |||||
Total equity | 104,673 | 74,377 | |||||||
Total liabilities and equity | $ | 107,409 | $ | 77,654 | |||||
Year Ended | |||||||||
Income Statement | December 31, 2017 | December 31, 2016 | |||||||
Revenue | $ | 1,220 | $ | — | |||||
Total Revenue | 1,220 | — | |||||||
Expenses | |||||||||
Research and development cost | $ | 4,073 | $ | — | |||||
Operating expense | 1,291 | 37 | |||||||
General and administrative expenses | 1,328 | — | |||||||
Depreciation and amortization | 336 | $ | — | ||||||
Total Expenses | $ | 7,028 | $ | 37 | |||||
Loss before income taxes | (5,808 | ) | (37 | ) | |||||
Provision for income taxes | — | — | |||||||
Net loss | $ | (5,808 | ) | $ | (37 | ) | |||
Company’s share of loss | $ | (1,228 | ) | $ | (16 | ) | |||
110
FORTRESS TRANSPORTATION AND INFRASTRUCTURE INVESTORS LLC
NOTES TO CONSOLIDATED FINANCIAL STATEMENTS
(Dollar amounts in thousands, unless otherwise noted)
Intermodal Finance I, Ltd.
In 2012, the Company acquired a 51% non-controlling interest in Intermodal Finance I, Ltd. (“Intermodal”), a joint venture. Intermodal is governed by a board of directors, and its shareholders have voting rights through their equity interests. As such, Intermodal is not within the scope of ASC 810-20 and should be evaluated for consolidation under the voting interest model. Due to the existence of substantive participating rights of the 49% equity investor, including the joint approval of material operating and capital decisions, such as material contracts and capital expenditures consistent with ASC 810-10-25-11, the Company does not have unilateral rights over this investment; therefore, the Company does not consolidate Intermodal but accounts for this investment in accordance with the equity method. The Company does not have a variable interest in this investment as none of the criteria of ASC 810-10-15-14 were met.
As of December 31, 2017, Intermodal owns a portfolio of multiple finance leases, representing five customers and comprising approximately 24,000 shipping containers, as well as a portfolio of approximately 10,000 shipping containers subject to multiple operating leases. During the years ended December 31, 2017, 2016 and 2015, Intermodal Finance I, Ltd. recorded an asset impairment charge of $0, $6,016 and $20,604, respectively, which resulted from certain operating leases not being renewed and containers being returned at a faster pace than expected. The Company's proportionate share of the impairment charge was $0, $3,068 and $10,508 based on its 51% ownership percentage for the years ended December 31, 2017, 2016 and 2015, respectively. The Company’s proportionate share of equity in (losses) earnings was $(189), $(5,974), $(6,956) for the years ended December 31, 2017, 2016, and 2015, respectively.
The audited consolidated financial statements of Intermodal as of and for the years ended December 31, 2017, 2016, and 2015, are presented herein.
7. | INTANGIBLE ASSETS AND LIABILITIES, NET |
The Company’s intangible assets and liabilities, net are summarized as follows:
December 31, 2017 | |||||||||||||||
Aviation Leasing | Jefferson Terminal | Railroad | Total | ||||||||||||
Intangible assets | |||||||||||||||
Acquired favorable lease intangibles | $ | 36,747 | $ | — | $ | — | $ | 36,747 | |||||||
Less: Accumulated amortization | (20,452 | ) | — | — | (20,452 | ) | |||||||||
Acquired favorable lease intangibles, net | 16,295 | — | — | 16,295 | |||||||||||
Customer relationships | — | 35,513 | 225 | 35,738 | |||||||||||
Less: Accumulated amortization | — | (11,825 | ) | (165 | ) | (11,990 | ) | ||||||||
Acquired customer relationships, net | — | 23,688 | 60 | 23,748 | |||||||||||
Total intangible assets, net | $ | 16,295 | $ | 23,688 | $ | 60 | $ | 40,043 | |||||||
Intangible liabilities | |||||||||||||||
Acquired unfavorable lease intangibles | $ | 2,732 | $ | — | $ | — | $ | 2,732 | |||||||
Less: Accumulated amortization | (1,374 | ) | — | — | (1,374 | ) | |||||||||
Acquired unfavorable lease intangibles, net | $ | 1,358 | $ | — | $ | — | $ | 1,358 | |||||||
111
FORTRESS TRANSPORTATION AND INFRASTRUCTURE INVESTORS LLC
NOTES TO CONSOLIDATED FINANCIAL STATEMENTS
(Dollar amounts in thousands, unless otherwise noted)
December 31, 2016 | |||||||||||||||
Aviation Leasing | Jefferson Terminal | Railroad | Total | ||||||||||||
Intangible assets | |||||||||||||||
Acquired favorable lease intangibles | $ | 26,605 | $ | — | $ | — | $ | 26,605 | |||||||
Less: Accumulated amortization | (14,998 | ) | — | — | (14,998 | ) | |||||||||
Acquired favorable lease intangibles, net | 11,607 | — | — | 11,607 | |||||||||||
Customer relationships | — | 35,513 | 225 | 35,738 | |||||||||||
Less: Accumulated amortization | — | (8,271 | ) | (120 | ) | (8,391 | ) | ||||||||
Acquired customer relationships, net | — | 27,242 | 105 | 27,347 | |||||||||||
Total intangible assets, net | $ | 11,607 | $ | 27,242 | $ | 105 | $ | 38,954 | |||||||
Intangible liabilities | |||||||||||||||
Acquired unfavorable lease intangibles | $ | 1,506 | $ | — | $ | — | $ | 1,506 | |||||||
Less: Accumulated amortization | (627 | ) | — | — | (627 | ) | |||||||||
Acquired unfavorable lease intangibles, net | $ | 879 | $ | — | $ | — | $ | 879 | |||||||
Intangible liabilities relate to unfavorable lease intangibles and are included as a component of other liabilities in the accompanying Consolidated Balance Sheets.
Amortization of intangible assets and liabilities is recorded in the Consolidated Statements of Operations as follows:
Classification in Consolidated Statements of Operations | Year Ended December 31, | ||||||||||||
2017 | 2016 | 2015 | |||||||||||
Lease intangibles | Equipment leasing revenues | $ | 4,716 | $ | 4,979 | $ | 6,774 | ||||||
Customer relationships | Depreciation and amortization | 3,598 | 3,598 | 3,585 | |||||||||
Total | $ | 8,314 | $ | 8,577 | $ | 10,359 | |||||||
As of December 31, 2017, estimated net annual amortization of intangibles is as follows:
Total | |||
2018 | $ | 9,997 | |
2019 | 7,771 | ||
2020 | 6,388 | ||
2021 | 5,001 | ||
2022 | 3,596 | ||
Thereafter | 5,932 | ||
Total | $ | 38,685 | |
112
FORTRESS TRANSPORTATION AND INFRASTRUCTURE INVESTORS LLC
NOTES TO CONSOLIDATED FINANCIAL STATEMENTS
(Dollar amounts in thousands, unless otherwise noted)
8. | DEBT, NET |
The Company’s debt, net is summarized as follows:
December 31, 2017 | December 31, 2016 | ||||||
Loans payable | |||||||
FTAI Pride Credit Agreement | $ | 53,993 | $ | 60,937 | |||
CMQR Credit Agreement | 22,800 | 12,625 | |||||
Jefferson Terminal Credit Agreement | — | — | |||||
Revolving Credit Facility | — | — | |||||
Total loans payable | 76,793 | 73,562 | |||||
Bonds payable | |||||||
Series 2012 Bonds (including unamortized premium of $1,639 and $1,697 at December 31, 2017 and December 31, 2016, respectively) | 44,404 | 45,887 | |||||
Series 2016 Bonds | 144,200 | 144,200 | |||||
Senior Notes (including unamortized discount of $6,506 and unamortized premium of $5,796 at December 31, 2017) | 449,290 | — | |||||
Total bonds payable | 637,894 | 190,087 | |||||
Note payable to non-controlling interest | |||||||
Note payable to non-controlling interest | — | 2,352 | |||||
Total note payable to non-controlling interest | — | 2,352 | |||||
Debt | 714,687 | 266,001 | |||||
Less: Debt issuance costs | (11,423 | ) | (6,489 | ) | |||
Total debt, net | $ | 703,264 | $ | 259,512 | |||
Total debt due within one year | $ | 7,795 | $ | 8,078 | |||
FTAI Pride Credit Agreement—On September 15, 2014, FTAI Pride, LLC, (“FTAI Pride”) a subsidiary of the Company entered into a credit agreement (the “FTAI Pride Credit Agreement”) with a financial institution for a term loan in an aggregate amount of $75,000. The loan proceeds were used in connection with the acquisition of an offshore construction vessel. The FTAI Pride Credit Agreement requires quarterly payments of interest and scheduled principal payments of $1,562 beginning in the quarter ending December 31, 2015, through its maturity in 2019 and can be prepaid without penalty at any time. The FTAI Pride Credit Agreement is secured on a first priority basis by the offshore construction vessel and charter. Borrowings under the FTAI Pride Credit Agreement bear interest at the LIBOR rate plus a spread of 4.50%.
The FTAI Pride Credit Agreement contains affirmative and negative covenants which limit certain actions of the borrower and a financial covenant requiring the borrower to maintain a Fixed Charges Coverage Ratio, as defined, of not less than 1.15:1.00 in any twelve month period ending December 31, 2014, or later.
CMQR Credit Agreement—On June 30, 2017, CMQR amended its credit agreement (the “CMQR Credit Agreement”) with a financial institution for a revolving line of credit increase the aggregate amount from $20,000 to $25,000 and to extend the maturity date to September 18, 2019. Borrowings under the CMQR Credit Agreement bear interest at either (i) Adjusted LIBOR plus a spread of 2.50% or 4.50%, (ii) the U.S. or Canadian Base Rate plus a spread of 1.50% or 3.50%, or (iii) the Canadian Fixed Rate plus a spread of 2.50% or 4.50%, as defined by the CMQR Credit Agreement. The weighted-average effective interest rate as of December 31, 2017 and 2016, was 3.95% and 3.21%, respectively.
The CMQR Credit Agreement is also indirectly supported by Fortress Transportation and Infrastructure Investors LLC (the “Sponsor”). In the event of a default under the credit agreement, CMQR’s lenders can cause CMQR to call up to a total of $29 million in capital from the Sponsor, and in the event of CMQR’s bankruptcy, the lenders can put the debt back to the Sponsor. The CMQR Credit Agreement contains affirmative and negative covenants which limit certain actions of CMQR.
Jefferson Terminal Credit Agreement—On August 27, 2014, a subsidiary of the Company entered into a credit agreement (the “Jefferson Terminal Credit Agreement”) with a financial institution for an aggregate amount of $100,000. The Jefferson Terminal Credit Agreement required quarterly payments of $250 beginning with the quarter ending December 31, 2014, with such quarterly payments increasing to $1,250 beginning with the quarter ending December 31, 2016, and could be prepaid or repaid at any time prior to its maturity on February 27, 2018. On March 8, 2016, all amounts outstanding under the Jefferson Terminal Credit Agreement were paid in full and such agreement was terminated. Accordingly, during the first quarter of 2016, the Company recorded a loss on extinguishment of debt of $1,579.
113
FORTRESS TRANSPORTATION AND INFRASTRUCTURE INVESTORS LLC
NOTES TO CONSOLIDATED FINANCIAL STATEMENTS
(Dollar amounts in thousands, unless otherwise noted)
Series 2012 Bonds—On August 1, 2012, Jefferson County Development Corporation issued $46,875 of tax-exempt industrial bonds (“Series 2012 Bonds”), to specifically fund construction and operation of an intermodal transfer facility for crude oil and refined petroleum products. The proceeds of this issuance were loaned to Jefferson Terminal, to be held in trust, as restricted cash, to ensure adherence to the restrictions of use of the funds. Use of the proceeds requires approval from a trustee prior to release of funds. Such restricted cash may only be released to us after payment of applicable reserves, including a six-month interest reserve, and expenses, as determined by the trustee. The Series 2012 Bonds have a stated maturity of July 1, 2032, bear interest at 8.25%, and require scheduled principal payments. The principal of the Series 2012 Bonds is payable annually at varying amounts.
In connection with the Company’s acquisition of Jefferson Terminal, the Series 2012 Bonds were recorded at a fair value of $48,554, which represented a premium of $1,823 as compared to their face value at the date of acquisition; such premium is being amortized using the effective interest method over the remaining contractual term of the Series 2012 Bonds.
The Series 2012 Bond agreement contains a financial covenant requiring a subsidiary of the Company to maintain a long-term debt service coverage ratio, as defined in the agreement, of 1.25 to 1, in each fiscal year, beginning with December 31, 2014.
Series 2016 Bonds—On March 7, 2016, the Port of Beaumont Navigation District of Jefferson County, Texas (the “District”) issued $144,200 of Dock and Wharf Facility Revenue Bonds, Series 2016 (Jefferson Energy Companies Project) (the “Series 2016 Bonds”). Proceeds from the issuance of the Series 2016 Bonds were used, in part, to reimburse Jefferson Railport Terminal II, LLC (“Jefferson Railport II”) for certain costs related to the development, construction and acquisition of certain facilities for the transport, loading, unloading, and storage of petroleum products (the “Facilities”) on behalf of the District, and settle the Jefferson Terminal Credit Agreement. Construction of the Facilities has occurred, and will occur, on property leased by the District to Jefferson Railport II pursuant to a First Amended and Restated Ground Lease between Jefferson Railport II, as lessee, and the District, as lessor. All such Facilities will be leased by the District to Jefferson Railport II pursuant to a Lease and Development Agreement between the District and Jefferson Railport II.
The transaction described above did not qualify for sale-leaseback accounting due to the continuing involvement of the Company resulting from the mandatory tender feature and, as a result, the leases were classified as a financing transaction in the Company’s consolidated financial statements. Under the financing method, the assets constructed or to be constructed will remain on the consolidated balance sheet and the net proceeds received by the Company are recorded as financial debt. Payments under these leases are recorded as interest expense and reduction of principal in accordance with the terms of the bond agreement with annual interest payments and a principal repayment at February 13, 2020 barring a remarketing of the bond on new terms.
Under a Capital Call Agreement, the Company has agreed to make funds available to Jefferson Holdings in order to satisfy its obligation under the Standby Bond Purchase Agreement. The Capital Call Agreement contains certain covenants applicable to the Company, including a negative lien covenant regarding Aviation Assets, as defined therein, as well as maintenance of a minimum total asset value of Aviation Assets and minimum total equity of the Company. In connection with the above, and related to the Series 2016 Bonds, a subsidiary of the Company and an affiliate of its Manager entered into a Fee and Support Agreement with FTAI Energy Partners LLC and certain of its subsidiaries. The Fee and Support Agreement provides that both such subsidiary of the Company and affiliate of the Manager will effectively guarantee a pro rata portion of the obligations under the Standby Bond Purchase Agreement in return for a guarantee fee of $6,873 (shared on the same pro rata basis). This fee will be amortized as interest expense to the earlier of the redemption date or February 13, 2020.
The Series 2016 Bonds bear interest at an initial rate of 7.25% and require scheduled interest payments. The Series 2016 Bonds have a stated maturity of February 1, 2036 but are subject to mandatory tender for purchase at par on February 13, 2020 if they have not been repurchased from proceeds of a remarketing of the Series 2016 Bonds or redeemed prior to such date. In the event all of the Series 2016 Bonds are not repurchased from proceeds of a remarketing or redeemed at February 13, 2020, Jefferson Railport and Jefferson Railport Terminal II Holdings LLC (“Jefferson Holdings”), a Delaware limited liability company and parent of Jefferson Railport II, have agreed to purchase the Series 2016 Bonds from the Holders thereof at par pursuant to a Standby Bond Purchase Agreement. In addition, pursuant to the Standby Purchase Agreement, Jefferson Holdings will guarantee the payment of all Rent (as defined in the Facilities Lease), and all principal of and premium and interest on the Series 2016 Bonds payable prior to repurchase or redemption at February 13, 2020.
114
FORTRESS TRANSPORTATION AND INFRASTRUCTURE INVESTORS LLC
NOTES TO CONSOLIDATED FINANCIAL STATEMENTS
(Dollar amounts in thousands, unless otherwise noted)
Term Loan—On January 23, 2017, the Company entered into an unsecured credit agreement under which the Company, through its wholly owned subsidiaries, including the Partnership and WWTAI Finance Ltd., an exempted company incorporated with limited liability under the laws of Bermuda, borrowed $100,000 in term loans denominated in U.S. dollars (the “Term Loans”). The proceeds of the Term Loan are to be used for general corporate purposes, including future acquisitions by the Company and its subsidiaries of certain aviation and infrastructure assets. The Term Loans bear interest at the Base Rate (determined in accordance with the agreement) plus 2.75% per annum, or at the Adjusted Eurodollar Rate (determined in accordance with the agreement) plus 3.75% per annum, if the Company chooses to make Eurodollar Rate borrowings. The Term Loans mature on January 22, 2018 subject to the Company’s right to elect a one-year extension, and require amortization payments in the amount of $250 on the last day of each fiscal quarter beginning on March 31, 2017. On March 15, 2017, all amounts outstanding under the Term Loan were repaid in full and the agreement was terminated. Accordingly, during the year ended December 31, 2017, the Company recorded a loss on extinguishment of debt of $2,456.
Senior Notes—On March 15, 2017, the Company issued $250,000 aggregate principal amount of 6.75% senior unsecured notes due 2022 (the “Senior Notes”). The Senior Notes were issued pursuant to an indenture, dated as of March 15, 2017, between the Company and U.S. Bank National Association, as trustee. On August 23, 2017, the Company issued an additional $100,000 of Senior Notes. The additional notes issued on August 23, 2017 were issued at an offering price of 102.75% of the principal amount plus accrued interest from March 15, 2017 to the date of issuance. On December 20, 2017, the Company issued an additional $100,000 of Senior Notes. The additional notes issued on December 20, 2017 were issued at an offering price of 103.25% of the principal amount plus accrued interest from September 15, 2017.
The Senior Notes bear interest at a rate of 6.75% per annum, payable semi-annually in arrears on March 15 and September 15 of each year, commencing on September 15, 2017, to persons who are registered holders of the Senior Notes on the immediately preceding March 1 and September 1, respectively.
The Senior Notes mature on March 15, 2022. Prior to March 15, 2020, the Company may redeem some or all of the Senior Notes at a redemption price equal to 100.00% of the principal amount of the Senior Notes redeemed, plus accrued and unpaid interest, if any, to, but not including, the applicable redemption date, plus a “make-whole” premium. On or after March 15, 2020, the Company may redeem some or all of the Senior Notes at any time at declining redemption prices equal to (i) 105.063% beginning on March 15, 2020, and (ii) 100.00% beginning on March 15, 2021 and thereafter, plus, in each case, accrued and unpaid interest, if any, to, but not including, the applicable redemption date. In addition, at any time on or prior to March 15, 2020, the Company may at any time redeem up to 40% of the aggregate principal amount of the Senior Notes using net proceeds from certain equity offerings at a redemption price equal to 106.75% of the principal amount of the Senior Notes redeemed, plus accrued and unpaid interest, if any, to, but not including, the applicable redemption date.
The Company used a portion of the proceeds to fully repay all outstanding indebtedness under the Company’s Term Loan in the amount of $100,000, payment of fees related to the issuance of Senior Notes, and to fund the purchase of additional investments. The Company intends to use the remainder of the proceeds for general corporate purposes, including the funding of future investments.
Revolving Credit Facility—On June 16, 2017, the Company entered into a revolving credit facility (the “Revolving Credit Facility”) with certain lenders and issuing banks and JPMorgan Chase Bank, N.A., as administrative agent. The Revolving Credit Facility provides for revolving loans in the aggregate principal amount of up to $75,000, of which $25,000 may be utilized for the issuance of letters of credit. The proceeds drawn on this facility will be used for working capital and general corporate purposes, including, without limitation, permitted acquisitions and other investments. The Revolving Credit Facility is secured by the capital stock of certain direct subsidiaries of the Company as defined in the related credit agreement.
Borrowings outstanding under the Revolving Credit Facility bear interest at the Adjusted Eurodollar Rate (determined in accordance with the credit agreement) plus 3.00% per annum, if the Company chooses to make Eurodollar Rate borrowings, or at the Base Rate (determined in accordance with the credit agreement) plus 2.00% per annum. The Company will also be required to pay a quarterly commitment fee at a rate per annum equal to 0.50% on the average daily unused portion of the Revolving Credit Facility, as well as customary letter of credit fees and agency fees.
The Revolving Credit Facility will mature, and commitments in respect of the Revolving Credit Facility will terminate, on June 16, 2020. Any amount borrowed under the Revolving Credit Facility may be voluntarily prepaid without penalty or premium, other than customary breakage costs related to prepayments of Eurodollar Rate borrowings.
The Revolving Credit Facility includes financial covenants requiring the maintenance of (1) a minimum ratio of the appraised value of certain aviation assets to the aggregate commitments under the revolving credit facility of 3.00 to 1.00 and (2) a maximum ratio of debt to total equity (before reduction for minority interests) for the Company and its subsidiaries of 1.65 to 1.00 per the terms of the credit agreement.
At December 31, 2017, the Company had no borrowings outstanding under the Revolving Credit Facility.
115
FORTRESS TRANSPORTATION AND INFRASTRUCTURE INVESTORS LLC
NOTES TO CONSOLIDATED FINANCIAL STATEMENTS
(Dollar amounts in thousands, unless otherwise noted)
Note Payable to Non-Controlling Interest—In May 2013, in connection with the capitalization of a consolidated subsidiary, the Company and the owner of the non-controlling interest loaned approximately $18,275 and $3,225, respectively, to the entity in proportion to their respective ownership percentages of 85% and 15%. The loans bear interest at an annual rate of 5% and require monthly payments of principal and interest through their final maturity in May 2021. The loan amount funded by the Company and related interest have been eliminated in consolidation.
During the third quarter of 2017, the Company entered into a settlement arrangement whereby the holder of the non-controlling interest settled its $3,725 loan due to the Company in conjunction with the MT6015 venture by transferring its 15% interest in a consolidated subsidiary of the Company, and the note payable due to the holder of the non-controlling interest was extinguished. The settlement resulted in a net gain of $1,093 recorded in other income. Refer to Note 2 for further detail.
The Company was in compliance with all debt covenants as of December 31, 2017.
As of December 31, 2017, scheduled principal repayments under the Company’s debt agreements for the next five years and thereafter are summarized as follows:
2018 | 2019 | 2020 | 2021 | 2022 | Thereafter | Total | |||||||||||||||||||||
FTAI Pride Credit Agreement | $ | 6,250 | $ | 47,743 | $ | — | $ | — | $ | — | $ | — | $ | 53,993 | |||||||||||||
CMQR Credit Agreement | — | 22,800 | — | — | — | — | 22,800 | ||||||||||||||||||||
Series 2012 Bonds (excluding unamortized premium of $1,639) | 1,545 | 1,670 | 1,810 | 1,960 | 2,120 | 33,660 | 42,765 | ||||||||||||||||||||
Series 2016 Bonds | — | — | 144,200 | — | — | — | 144,200 | ||||||||||||||||||||
Senior Notes | — | — | — | — | 450,000 | — | 450,000 | ||||||||||||||||||||
Total principal payments on loans and bonds payable | $ | 7,795 | $ | 72,213 | $ | 146,010 | $ | 1,960 | $ | 452,120 | $ | 33,660 | $ | 713,758 | |||||||||||||
9. | FAIR VALUE MEASUREMENTS |
Fair value measurements and disclosures require the use of valuation techniques to measure fair value that maximize the use of observable inputs and minimize use of unobservable inputs. These inputs are prioritized as follows:
•Level 1: Observable inputs such as quoted prices in active markets for identical assets or liabilities.
• | Level 2: Inputs other than quoted prices included within Level 1 that are observable, either directly or indirectly, such as quoted prices for similar assets or liabilities or market corroborated inputs. |
• | Level 3: Unobservable inputs for which there is little or no market data and which require the Company to develop its own assumptions about how market participants price the asset or liability. |
The valuation techniques that may be used to measure fair value are as follows:
• | Market approach—Uses prices and other relevant information generated by market transactions involving identical or comparable assets or liabilities. |
• | Income approach—Uses valuation techniques to convert future amounts to a single present amount based on current market expectations about those future amounts. |
• | Cost approach—Based on the amount that currently would be required to replace the service capacity of an asset (replacement cost). |
116
FORTRESS TRANSPORTATION AND INFRASTRUCTURE INVESTORS LLC
NOTES TO CONSOLIDATED FINANCIAL STATEMENTS
(Dollar amounts in thousands, unless otherwise noted)
The following tables set forth the Company’s financial assets measured at fair value on a recurring basis as of December 31, 2017 and December 31, 2016, by level within the fair value hierarchy. Assets measured at fair value are classified in their entirety based on the lowest level of input that is significant to their fair value measurement.
Fair Value as of | Fair Value Measurements Using Fair Value Hierarchy as of | ||||||||||||||||
December 31, 2017 | December 31, 2017 | ||||||||||||||||
Total | Level 1 | Level 2 | Level 3 | Valuation Technique | |||||||||||||
Assets | |||||||||||||||||
Cash and cash equivalents | $ | 59,400 | $ | 59,400 | $ | — | $ | — | Market | ||||||||
Restricted cash | 33,406 | 33,406 | — | — | Market | ||||||||||||
Total | $ | 92,806 | $ | 92,806 | $ | — | $ | — | |||||||||
Fair Value as of | Fair Value Measurements Using Fair Value Hierarchy as of | ||||||||||||||||
December 31, 2016 | December 31, 2016 | ||||||||||||||||
Total | Level 1 | Level 2 | Level 3 | Valuation Technique | |||||||||||||
Assets | |||||||||||||||||
Cash and cash equivalents | $ | 68,055 | $ | 68,055 | $ | — | $ | — | Market | ||||||||
Restricted cash | 65,441 | 65,441 | — | — | Market | ||||||||||||
Available-for-sale securities | 17,630 | 17,630 | — | — | Market | ||||||||||||
Total | $ | 151,126 | $ | 151,126 | $ | — | $ | — | |||||||||
At December 31, 2017 and December 31, 2016, the Company had no liabilities that were measured at fair value on a recurring basis.
The Company’s cash and cash equivalents and restricted cash consist largely of demand deposit accounts with maturities of 90 days or less when purchased that are considered to be highly liquid. These instruments are valued using inputs observable in active markets for identical instruments and are therefore classified as Level 1 within the fair value hierarchy. Publicly traded securities with sufficient trading volume are fair valued by management using quoted prices for identical instruments in active markets and are therefore classified as Level 1 within the fair value hierarchy.
Except as discussed below, the Company’s financial instruments other than cash and cash equivalents, restricted cash and available-for-sale securities consist principally of accounts receivable, accounts payable and accrued liabilities, loans payable, bonds payable, security deposits, maintenance deposits and management fees payable, whose fair value approximates their carrying value based on an evaluation of pricing data, vendor quotes, and historical trading activity or due to their short maturity profiles.
At December 31, 2017 and December 31, 2016, the Company’s notes receivable included a $0 and $17,935, respectively, loan bearing interest at 10% related to a terminal site under development, collateralized by property at that site, which was settled in the acquisition of Long Ridge. At December 31, 2016, the Company’s notes receivable included, as a component of other assets on the accompanying Consolidated Balance Sheets, a $3,725 loan bearing interest at 12.0% made to the Company’s joint venture partner in MT 6015 (Note 2) which was collateralized by other property owned by the joint venture partner. During the third quarter of 2017, the Company entered into a settlement agreement for this loan more fully discussed in Note 2. The fair value of these notes receivable approximate carrying value and are classified as Level 2, which is within the fair value hierarchy.
At December 31, 2017, the Company recorded a derivative asset related to short-term forward crude contracts. The fair value of the short-term derivative asset of $1,022, recorded in other assets, is classified as Level 3 within the fair value hierarchy.
The fair value of Series 2012 bonds, reported in debt, net on the Consolidated Balance Sheets, was approximately $45,691 and $46,488, respectively, at December 31, 2017 and December 31, 2016, based upon market prices for similar municipal securities. The fair value of Series 2016 bonds, reported in debt, net on the Consolidated Balance Sheets, was approximately $150,329 and $149,575 at December 31, 2017 and December 31, 2016, respectively, based upon market prices for similar municipal securities. The fair value of the Senior Notes, reported in debt, net on the Consolidated Balance Sheets, was approximately $449,290 as of December 31, 2017 as the carrying value approximates the market prices. The fair values of all other items reported as debt, net in the Consolidated Balance Sheet approximate their carrying values due to their bearing market rates of interest, and are classified as Level 2 within the fair value hierarchy.
117
FORTRESS TRANSPORTATION AND INFRASTRUCTURE INVESTORS LLC
NOTES TO CONSOLIDATED FINANCIAL STATEMENTS
(Dollar amounts in thousands, unless otherwise noted)
The Company measures the fair value of certain assets and liabilities on a non-recurring basis when GAAP requires the application of fair value, including events or changes in circumstances that indicate that the carrying amounts of assets may not be recoverable. Assets subject to these measurements include goodwill, intangible assets, property, plant and equipment and leasing equipment. The Company records such assets at fair value when it is determined the carrying value may not be recoverable. Fair value measurements for assets subject to impairment tests are based on an income approach which uses Level 3 inputs, which include the Company’s assumptions as to future cash flows from operation of the underlying businesses and the leasing and eventual sale of assets.
10. | REVENUES |
Components of revenue are as follows:
Year Ended December 31, 2017 | |||||||||||||||||||||||||||||||
Equipment Leasing | Infrastructure | ||||||||||||||||||||||||||||||
Revenues | Aviation Leasing | Offshore Energy | Shipping Containers | Jefferson Terminal | Railroad | Ports and Terminals | Corporate | Total | |||||||||||||||||||||||
Equipment leasing revenues | |||||||||||||||||||||||||||||||
Lease income | $ | 91,103 | $ | 8,433 | $ | — | $ | — | $ | — | $ | — | $ | — | $ | 99,536 | |||||||||||||||
Maintenance revenue | 65,651 | — | — | — | — | — | — | 65,651 | |||||||||||||||||||||||
Finance lease income | — | 1,536 | — | — | — | — | — | 1,536 | |||||||||||||||||||||||
Other revenue | 39 | 3,138 | 100 | — | — | — | — | 3,277 | |||||||||||||||||||||||
Total equipment leasing revenues | 156,793 | 13,107 | 100 | — | — | — | — | 170,000 | |||||||||||||||||||||||
Infrastructure revenues | |||||||||||||||||||||||||||||||
Lease income | — | — | — | — | — | 1,111 | — | 1,111 | |||||||||||||||||||||||
Rail revenues | — | — | — | — | 32,607 | — | — | 32,607 | |||||||||||||||||||||||
Terminal services revenues | — | — | — | 10,229 | — | — | — | 10,229 | |||||||||||||||||||||||
Other revenue | — | — | — | — | — | 3,712 | — | 3,712 | |||||||||||||||||||||||
Total infrastructure revenues | — | — | — | 10,229 | 32,607 | 4,823 | — | 47,659 | |||||||||||||||||||||||
Total revenues | $ | 156,793 | $ | 13,107 | $ | 100 | $ | 10,229 | $ | 32,607 | $ | 4,823 | $ | — | $ | 217,659 | |||||||||||||||
Year Ended December 31, 2016 | |||||||||||||||||||||||||||||||
Equipment Leasing | Infrastructure | ||||||||||||||||||||||||||||||
Revenues | Aviation Leasing | Offshore Energy | Shipping Containers | Jefferson Terminal | Railroad | Ports and Terminals | Corporate | Total | |||||||||||||||||||||||
Equipment leasing revenues | |||||||||||||||||||||||||||||||
Lease income | $ | 66,024 | $ | 3,712 | $ | — | $ | — | $ | — | $ | — | $ | — | $ | 69,736 | |||||||||||||||
Maintenance revenue | 28,697 | — | — | — | — | — | — | 28,697 | |||||||||||||||||||||||
Finance lease income | — | 1,610 | 1,113 | — | — | — | — | 2,723 | |||||||||||||||||||||||
Other revenue | 687 | 6 | 100 | — | — | — | — | 793 | |||||||||||||||||||||||
Total equipment leasing revenues | 95,408 | 5,328 | 1,213 | — | — | — | — | 101,949 | |||||||||||||||||||||||
Infrastructure revenues | |||||||||||||||||||||||||||||||
Lease income | — | — | — | — | — | 32 | — | 32 | |||||||||||||||||||||||
Rail revenues | — | — | — | — | 30,837 | — | — | 30,837 | |||||||||||||||||||||||
Terminal services revenues | — | — | — | 15,902 | — | — | — | 15,902 | |||||||||||||||||||||||
Total infrastructure revenues | — | — | — | 15,902 | 30,837 | 32 | — | 46,771 | |||||||||||||||||||||||
Total revenues | $ | 95,408 | $ | 5,328 | $ | 1,213 | $ | 15,902 | $ | 30,837 | $ | 32 | $ | — | $ | 148,720 | |||||||||||||||
118
FORTRESS TRANSPORTATION AND INFRASTRUCTURE INVESTORS LLC
NOTES TO CONSOLIDATED FINANCIAL STATEMENTS
(Dollar amounts in thousands, unless otherwise noted)
Year Ended December 31, 2015 | |||||||||||||||||||||||||||||||
Equipment Leasing | Infrastructure | ||||||||||||||||||||||||||||||
Revenues | Aviation Leasing | Offshore Energy | Shipping Containers | Jefferson Terminal | Railroad | Ports and Terminals | Corporate | Total | |||||||||||||||||||||||
Equipment leasing revenues | |||||||||||||||||||||||||||||||
Lease income | $ | 42,924 | $ | 21,959 | $ | — | $ | — | $ | — | $ | — | $ | — | $ | 64,883 | |||||||||||||||
Maintenance revenue | 17,286 | — | — | — | — | — | — | 17,286 | |||||||||||||||||||||||
Finance lease income | — | 1,665 | 7,082 | — | — | — | — | 8,747 | |||||||||||||||||||||||
Other revenue | 1,120 | 607 | 100 | — | — | — | — | 1,827 | |||||||||||||||||||||||
Total equipment leasing revenues | 61,330 | 24,231 | 7,182 | — | — | — | — | 92,743 | |||||||||||||||||||||||
Infrastructure revenues | |||||||||||||||||||||||||||||||
Lease income | — | — | — | 4,620 | — | — | — | 4,620 | |||||||||||||||||||||||
Rail revenues | — | — | — | — | 25,550 | — | — | 25,550 | |||||||||||||||||||||||
Terminal services revenues | — | — | — | 13,655 | — | — | — | 13,655 | |||||||||||||||||||||||
Total infrastructure revenues | — | — | — | 18,275 | 25,550 | — | — | 43,825 | |||||||||||||||||||||||
Total revenues | $ | 61,330 | $ | 24,231 | $ | 7,182 | $ | 18,275 | $ | 25,550 | $ | — | $ | — | $ | 136,568 | |||||||||||||||
Presented below are the contracted minimum future annual revenues to be received under existing operating leases across several market sectors as of December 31, 2017:
Total | |||
2018 | $ | 118,784 | |
2019 | 77,243 | ||
2020 | 55,474 | ||
2021 | 37,306 | ||
2022 | 19,431 | ||
Thereafter | 8,535 | ||
Total | $ | 316,773 | |
11. | EQUITY-BASED COMPENSATION |
In 2015, the Company established a Nonqualified Stock Option and Incentive Award Plan (“Incentive Plan”) which provides for the ability to award equity compensation awards in the form of stock options, stock appreciation rights, restricted stock, and performance awards to eligible employees, consultants, directors, and other individuals who provide services to the Company, each as determined by the Compensation Committee of the Board of Directors.
As of December 31, 2017, the Incentive Plan provides for the issuance of up to 30 million shares. The Company accounts for equity-based compensation expense in accordance with Accounting Standards Codification 718 Compensation-Stock Compensation (“ASC 718”) and is reported within operating expenses and general and administrative in the Consolidated Statements of Operations.
The Consolidated Statements of Operations includes the following expense (income) related to its stock-based compensation arrangements:
Year Ended December 31, | Remaining Expense To Be Recognized, If All Vesting Conditions Are Met | ||||||||||||||
2017 | 2016 | 2015 | |||||||||||||
Stock Options | $ | — | $ | — | $ | 24 | $ | — | |||||||
Restricted Shares | 318 | (4,051 | ) | 3,432 | 506 | ||||||||||
Common Units | 1,025 | 379 | 1,206 | 594 | |||||||||||
Total | $ | 1,343 | $ | (3,672 | ) | $ | 4,662 | $ | 1,100 | ||||||
119
FORTRESS TRANSPORTATION AND INFRASTRUCTURE INVESTORS LLC
NOTES TO CONSOLIDATED FINANCIAL STATEMENTS
(Dollar amounts in thousands, unless otherwise noted)
Stock Options
In June 2015, the Company issued an aggregate of 15,000 stock options (5,000 options each) to its three independent directors pursuant to the Incentive Plan with a grant date fair value of $24 which immediately vested upon grant and expire after 10 years. The fair value of each stock option was estimated on the date of grant using a Black-Scholes option valuation model using the following assumptions:
Expected volatility | Due to the lack of historical data for the Company’s own stock, the Company has based its expected volatility on a representative peer group with similar business characteristics. | 28% |
Risk free interest rate | The risk-free rate is determined using the implied yield currently available on U.S. government bonds with a term consistent with the expected term on the date of grant. | 2.4% |
Expected dividend yield | The expected dividend yield is based on management’s current expected dividend rate. | 6.50% |
Expected term | Expected term used represents the period of time the options granted are expected to be outstanding. | 5 years |
Options | Weighted-Average Exercise Price (per share) | Aggregate Intrinsic Value | Weighted Average Remaining Contractual Term (in years) | |||||||||
Stock options outstanding at January 1, 2017 | 15,000 | $ | 16.98 | $ | — | 8.40 | ||||||
Granted | — | |||||||||||
Exercised | — | |||||||||||
Forfeited and canceled | — | |||||||||||
Stock options outstanding and exercisable as of December 31, 2017 | 15,000 | $ | 16.98 | $ | — | 7.38 | ||||||
Restricted Shares
Restricted Shares | Weighted-Average Exercise Price (per share) | Aggregate Value (in thousands) | Weighted Average Remaining Contractual Term (in years) | |||||||||
Restricted shares outstanding at January 1, 2017 | 1,302,388 | $ | 19.06 | $ | 24,817 | 0.74 | ||||||
Granted | 31,430 | 17.98 | 565 | 4.00 | ||||||||
Less: vested | 13,097 | 19.10 | 250 | N/A | ||||||||
Less: forfeited and canceled | 1,250,000 | 19.10 | 23,875 | N/A | ||||||||
Restricted shares outstanding and exercisable as of December 31, 2017 | 70,721 | $ | 19.06 | $ | 1,257 | 3.28 | ||||||
The Company granted equity based compensation awards in a subsidiary consisting of 1.3 million restricted shares in exchange for services. The first award for 1.25 million restricted shares had a grant date fair value of $23,879. The fair value was determined on the grant date, August 27, 2014, using the market approach assuming no forfeitures. The shares vest in three tranches over three years, subject to continued employment and achievement of three separate performance conditions based on EBITDA for that subsidiary. The compensation expense will be recognized ratably over the remaining service period when it is probable that the performance conditions will be achieved and expires in August 2017. During the year ended December 31, 2016, the achievement of all performance conditions was deemed not probable and, accordingly, the $4,402 expense previously recognized was reversed in operating expenses in the Consolidated Statement of Operations. During the year ended December 31, 2017, 1.25 million restricted shares became ineligible for vesting due to i) the expiration of the award agreement and ii) certain performance conditions that were not reached. These shares had a grant date fair value of $23,879. This expiration had no impact on the Company’s financial statements for the year ended December 31, 2017.
The second award of 42,000 restricted shares had a grant day fair value of $800 using the market approach and assuming no forfeited awards. The award vests over four years, provided the employee remains employed by the Company. During the first quarter of 2016, the employee terminated his employment, at which time 50% of the award was vested and 50% was forfeited per the terms of the agreement with the employee. In lieu of delivering the vested shares, the Company paid $200 in cash to the former employee in accordance with the amended terms of the agreement during the second quarter of 2016, effectively terminating and canceling the awards.
120
FORTRESS TRANSPORTATION AND INFRASTRUCTURE INVESTORS LLC
NOTES TO CONSOLIDATED FINANCIAL STATEMENTS
(Dollar amounts in thousands, unless otherwise noted)
The third award of 52,388 restricted shares had a grant date fair value of $942. The fair value was determined on the grant date, November 9, 2016, using the discounted cash flows model. The shares vest over four years, subject to continued employment through June 2020. The compensation expense will be recognized ratably through the fourth anniversary of the employee’s start date.
The fourth award of 31,340 restricted shares had a grant date fair value of $495. The fair value was determined on the grant date using the discounted cash flows model. The shares vest ratably through the fourth anniversary of the grant date, subject to continued employment through May 2021. The compensation expense will be recognized ratably through the fourth anniversary of the grant date.
The fair value of the third and fourth awards are based on the fair value of the operating subsidiary on each date of grant, which was estimated using a discounted cash flow analysis which requires the application of discount factors and terminal multiples to projected cash flows. Discount factors and terminal multiples were based on market based inputs and transactions, as available at the measurement date.
Common Units
Common Units | Weighted-Average Exercise Price (per share) | Aggregate Value (in thousands) | Weighted Average Remaining Contractual Term (in years) | |||||||||
Common units outstanding at January 1, 2017 | 83,333 | $ | 1.34 | $ | 113 | 0.77 | ||||||
Granted | 1,025,050 | 1.00 | 1,025 | 1.24 | ||||||||
Less: vested | 535,858 | 1.63 | 873 | N/A | ||||||||
Less: forfeited and canceled | — | — | — | N/A | ||||||||
Common units outstanding and exercisable as of December 31, 2017 | 572,525 | $ | 1.42 | $ | 265 | 1.70 | ||||||
In 2014 and 2015, the Company granted equity based compensation in a subsidiary consisting of common units in exchange for services assuming no forfeited amounts. The awards have varying terms, ranging between 16 and 36 months, and vest subject to continued employment through each respective vesting date. The awards are equity based with compensation expense recognized ratably over the vesting periods.
The fair value of the 2014 and 2015 awards are based on the fair value of the operating subsidiary on each date of grant, which was estimated using a discounted cash flow analysis which requires the application of discount factors and terminal multiples to projected cash flows. Discount factors and terminal multiples were based on market based inputs and transactions, as available at the measurement dates.
In 2017, the Company granted equity based compensation in a subsidiary consisting of 520,000 common units that had a grant date fair value of $894 using a discounted cash flow model, which is determined based on the fair value of the operating segment on the grant date, estimated using a discounted cash flow analysis that requires the application of discount factors and terminal multiples to projected cash flows. Discount factors and terminal multiples were based on market-based inputs and transactions, as available at the measurement date. The awards vest over a range of six to 48 months, provided the employee remains with the Company.
In 2017, the Company granted equity based compensation in a subsidiary consisting of 505,050 common units that had a grant date fair value of $505 in exchange for services assuming no forfeited amounts. The award vests in the following schedule: 50% on the grant date of the award, 25% in May of 2018 and the remaining 25% in May of 2019. The awards are equity based with compensation expense recognized ratably over the vesting periods. The fair value of the 2017 award was based on the fair value of the underlying entity as determined on the acquisition date.
121
FORTRESS TRANSPORTATION AND INFRASTRUCTURE INVESTORS LLC
NOTES TO CONSOLIDATED FINANCIAL STATEMENTS
(Dollar amounts in thousands, unless otherwise noted)
12. | INCOME TAXES |
The current and deferred components of the income tax provision (benefit) included in the Consolidated Statements of Operations are as follows:
Year Ended December 31, | |||||||||||
2017 | 2016 | 2015 | |||||||||
Current: | |||||||||||
Federal | $ | 1,551 | $ | 355 | $ | 86 | |||||
State and local | 145 | 112 | 45 | ||||||||
Foreign | 76 | (176 | ) | 222 | |||||||
Total current provision | 1,772 | 291 | 353 | ||||||||
Deferred: | |||||||||||
Federal | 215 | (50 | ) | (79 | ) | ||||||
State and local | 5 | 6 | — | ||||||||
Foreign | (38 | ) | 21 | 312 | |||||||
Total deferred provision | 182 | (23 | ) | 233 | |||||||
Total provision for income taxes | $ | 1,954 | $ | 268 | $ | 586 | |||||
The Company is taxed as a flow-through entity for U.S. income tax purposes and its taxable income or loss generated is the responsibility of its owners. Taxable income or loss generated by the Company’s corporate subsidiaries is subject to U.S. federal, state and foreign corporate income tax in locations where they conduct business.
The difference between the Company’s reported provision for income taxes and the U.S. federal statutory rate of 35% is as follows:
Year Ended December 31, | ||||||||
2017 | 2016 | 2015 | ||||||
U.S. federal tax at statutory rate | 35.0 | % | 35.0 | % | 35.0 | % | ||
Income not subject to tax | 98.2 | % | 7.9 | % | 25.2 | % | ||
State and local taxes | (0.5 | )% | (0.2 | )% | (0.2 | )% | ||
Foreign taxes | (0.2 | )% | 0.9 | % | (1.9 | )% | ||
Branch Profit Tax | (2.6 | )% | (0.3 | )% | (0.1 | )% | ||
Change in Tax Rates | (6.9 | )% | — | % | — | % | ||
Other | 1.0 | % | (0.4 | )% | (0.1 | )% | ||
Change in valuation allowance | (133.2 | )% | (43.6 | )% | (60.0 | )% | ||
Provision for income taxes | (9.2 | )% | (0.7 | )% | (2.1 | )% | ||
Significant components of our deferred tax assets and liabilities are as follows:
December 31, | |||||||
2017 | 2016 | ||||||
Deferred tax assets: | |||||||
Net operating loss carryforwards | $ | 46,564 | $ | 42,337 | |||
Accrued expenses | 1,684 | 1,642 | |||||
Interest expense | 9,727 | 8,334 | |||||
Other | 202 | 1,404 | |||||
Total deferred tax assets | 58,177 | 53,717 | |||||
Less valuation allowance | (45,624 | ) | (42,270 | ) | |||
Net deferred tax assets | 12,553 | 11,447 | |||||
Deferred tax liabilities: | |||||||
Fixed assets | 13,104 | 11,816 | |||||
Net deferred tax liabilities | $ | (551 | ) | $ | (369 | ) | |
122
FORTRESS TRANSPORTATION AND INFRASTRUCTURE INVESTORS LLC
NOTES TO CONSOLIDATED FINANCIAL STATEMENTS
(Dollar amounts in thousands, unless otherwise noted)
Current and deferred tax assets and liabilities are reported net in other assets or other liabilities in the Consolidated Balance Sheet. In assessing the realizability of deferred tax assets, management considers whether it is more likely than not that some portion or all of the deferred tax assets will not be realized. The ultimate realization of deferred tax assets is dependent upon the generation of future taxable income during the periods in which temporary differences become deductible. The Company has analyzed its deferred tax assets and has determined, based on the weight of available evidence, that it is more likely than not that a significant portion will not be realized. Accordingly, valuation allowances have been recognized as of December 31, 2017 and December 31, 2016 of $45,624 and $42,270, respectively, related to certain deductible temporary differences and net operating loss carryforwards.
A summary of the changes in the valuation allowance is as follows:
December 31, | |||||||
2017 | 2016 | ||||||
Valuation allowance at beginning of period | $ | 42,270 | $ | 24,786 | |||
Increase due to current year losses | 27,549 | 17,484 | |||||
Decrease due to change in tax rates | (24,195 | ) | — | ||||
Valuation allowance at end of period | $ | 45,624 | $ | 42,270 | |||
As of December 31, 2017 and 2016, certain corporate subsidiaries of the Company had U.S. federal net operating loss carryforwards of approximately $184,177 and $106,838, respectively, and $121,574 and $104,263, respectively, of various state and local net operating loss carryforwards that are available to offset future taxable income, if and when it arises. These net operating loss carryforwards begin to expire in the year 2034. As of December 31, 2017 and 2016, the Company also had net operating loss carryforwards for Canadian federal and provincial income taxes of $6,875 and $7,893, respectively, which will begin to expire in the year 2034. As of December 31, 2017 and 2016, the Company also had net operating loss carryforwards for Irish income tax purposes of $33,209 and $18,453, which can be carried forward indefinitely against future business income. The Company also has net operating losses for Malaysian income tax purposes of $968 as of December 31, 2017 which can be carried forward indefinitely. The utilization of the net operating loss carryforwards to reduce future income taxes will depend on the corporate subsidiaries’ ability to generate sufficient taxable income prior to the expiration of the carryforward period. In addition, the maximum annual use of net operating loss carryforwards may be limited in certain situations after changes in stock ownership occur.
The TCJA significantly revises the U.S. corporate income tax regime by, among other things, lowering corporate income tax rates. The Company has accounted for the effects of the TCJA for the year ended December 31, 2017 which relates to the re-measurement of deferred tax assets and liabilities due to the reduction in the corporate income tax rate. Due to the significant portion of the Company’s income that is not subject to entity level tax and the presence of a significant valuation allowance, the effects of the TCJA have had a minimal impact on the income tax provision for the year ended December 31, 2017.
As of and for the period ended December 31, 2017, the Company had not established a liability for uncertain tax positions as no such positions existed. In general, the Company’s tax returns and the tax returns of its corporate subsidiaries are subject to U.S. federal, state, local and foreign income tax examinations by tax authorities. Generally, the Company is not subject to examination by taxing authorities for tax years prior to 2014. The Company does not believe that it is reasonably possible that the total amount of unrecognized tax benefits will significantly change within 12 months of the reporting date.
13. | MANAGEMENT AGREEMENT AND AFFILIATE TRANSACTIONS |
The Manager is paid annual fees in exchange for advising the Company on various aspects of its business, formulating its investment strategies, arranging for the acquisition and disposition of assets, arranging for financing, monitoring performance, and managing its day-to-day operations, inclusive of all costs incidental thereto. In addition, the Manager may be reimbursed for various expenses incurred by the Manager on the Company’s behalf, including the costs of legal, accounting and other administrative activities. In May 2015, in connection with the Company’s IPO, the Company entered into the Management Agreement which replaced its then-existing management agreement as a private fund. Additionally, the Company has entered into certain incentive allocation arrangements with Master GP, which owns 0.05% of the Partnership and is the general partner of the Partnership.
Pre-IPO Management Agreement
The pre-IPO management fee was calculated at an annual rate of 1.25% for any Onshore Fund or Offshore Fund investor (collectively, the “Fund Investors”) with a capital commitment of at least $100 million and 1.50% for any capital commitment of less than $100 million, payable semi-annually in arrears. Commencing with the date of the initial closing of the Onshore Fund and the Offshore Fund and continuing through the third anniversary of their final closing (the “Fund Commitment Period”), this percentage was applied to the weighted average of all capital called, reduced for any return of capital resulting from the partial or complete disposition of any Portfolio Investment, as defined therein. During the year ended December 31, 2015, pre-IPO management fees were $3,873.
123
FORTRESS TRANSPORTATION AND INFRASTRUCTURE INVESTORS LLC
NOTES TO CONSOLIDATED FINANCIAL STATEMENTS
(Dollar amounts in thousands, unless otherwise noted)
In addition, affiliates of the Manager were entitled to receive an amount not to exceed $1 million per annum to cover legal, compliance, operational, tax, accounting, insurance, transfer agent and informational technology services (“Specified General and Administrative Expenses”) performed by employees of such affiliates on behalf of the Company or the Onshore Fund and the Offshore Fund. No expenses were reimbursed to the Manager or its affiliates for any period prior to the IPO.
Prior to the IPO, the Master GP was entitled to an incentive return (the “Incentive Return”) generally equal to 10% of the Partnership’s profits (before certain taxes), as defined, subject to: i) an 8% cumulative preferred return payable to the Onshore Fund and Offshore Fund investors and ii) a clawback provision which requires amounts previously distributed as Incentive Return to be returned to the Company for the benefit of the Onshore Fund and Offshore Fund investors (after adjusting for tax in accordance with the partnership agreement) if, upon the termination of the Company, the amounts ultimately distributed to the Master GP exceed its allocable amount.
The Incentive Return was distributable to the Master GP from Distributable Proceeds of the Partnership (as defined) as they were distributed. Accordingly, an Incentive Return would have been paid to the Master GP in connection with a particular investment if and when such investment generated proceeds in excess of the capital called with respect to such investment, plus an 8% cumulative preferred return on such investment and on all previously liquidated investments. If, upon the termination of the Partnership, the aggregate amount paid to the Master GP as Incentive Return exceeded the amount actually due after taking into account the aggregate return to the Onshore Fund and the Offshore Fund investors, the excess was required to be returned by the Master GP (“clawed back”, after adjusting for tax in accordance with the Company agreements) to the Company for benefit of the Fund Investors.
Immediately prior to the consummation of the IPO, the Master GP contributed its rights to previously undistributed incentive return pursuant to the Partnership Agreement in exchange for limited partnership interests in each of the Onshore Fund and Offshore Fund equal to the amount of any such undistributed incentive returns.
Certain employees of an affiliate of the Manager are or may become entitled to receive profit sharing arrangements from the Master GP, pursuant to which they receive a portion of the Master GP’s Incentive Return. The Company is not required to reimburse the Master GP for such amounts. During the year ended December 31, 2015 the Master GP did not incur any amounts payable to these employees under such profit sharing arrangements attributable to the operations of the Company.
Post-IPO Management Agreement and Other Incentive Allocation
The Manager is entitled to a management fee, incentive allocations (comprised of income incentive allocation and capital gains incentive allocation, defined below) and reimbursement of certain expenses. The post-IPO management fee is determined by taking the average value of total equity (excluding non-controlling interests) determined on a consolidated basis in accordance with GAAP at the end of the two most recently completed months multiplied by an annual rate of 1.50%, and is payable monthly in arrears in cash. The total post-IPO management fees for the years ended December 31, 2017, 2016, and 2015 were $15,218, $16,742, and $11,145 respectively.
The income incentive allocation is calculated and distributable quarterly in arrears based on the pre-incentive allocation net income for the immediately preceding calendar quarter (the “Income Incentive Allocation”). For this purpose, pre-incentive allocation net income means, with respect to a calendar quarter, net income attributable to shareholders during such quarter calculated in accordance with GAAP excluding the Company’s pro rata share of (1) realized or unrealized gains and losses, and (2) certain non-cash or one-time items, and (3) any other adjustments as may be approved by the Company’s independent directors. Pre-incentive allocation net income does not include any Income Incentive Allocation or Capital Gains Incentive Allocation (described below) paid to the Master GP during the relevant quarter.
A subsidiary of the Company allocates and distributes to the Master GP an Income Incentive Allocation with respect to its pre-incentive allocation net income in each calendar quarter as follows: (1) no Income Incentive Allocation in any calendar quarter in which pre-incentive allocation net income, expressed as a rate of return on the average value of the Company’s net equity capital (excluding non-controlling interests) at the end of the two most recently completed calendar quarters, does not exceed 2% for such quarter (8% annualized); (2) 100% of pre-incentive allocation net income with respect to that portion of such pre-incentive allocation net income, if any, that is equal to or exceeds 2% but does not exceed 2.2223% for such quarter; and (3) 10% of the amount of pre-incentive allocation net income, if any, that exceeds 2.2223% for such quarter. These calculations will be prorated for any period of less than three months. No Income Incentive Allocation was due to the Master GP for the years ended December 31, 2017, 2016, and 2015.
Capital Gains Incentive Allocation is calculated and distributable in arrears as of the end of each calendar year and is equal to 10% of the Company’s pro rata share of cumulative realized gains from the date of the IPO through the end of the applicable calendar year, net of the Company’s pro rata share of cumulative realized or unrealized losses, the cumulative non-cash portion of equity-based compensation expenses and all realized gains upon which prior performance-based Capital Gains Incentive Allocation payments were made to the Master GP. Capital Gains Incentive Allocation of $514, $0, and $0 was due to the Master GP for the years ended December 31, 2017, 2016, and 2015.
The Company will pay all of its operating expenses, except those specifically required to be borne by the Manager under the Management Agreement. The expenses required to be paid by the Company include, but are not limited to, issuance and transaction costs incident to the acquisition, disposition and financing of the company’s assets, legal and auditing fees
124
FORTRESS TRANSPORTATION AND INFRASTRUCTURE INVESTORS LLC
NOTES TO CONSOLIDATED FINANCIAL STATEMENTS
(Dollar amounts in thousands, unless otherwise noted)
and expenses, the compensation and expenses of the Company’s independent directors, the costs associated with the establishment and maintenance of any credit facilities and other indebtedness of the Company (including commitment fees, legal fees, closing costs, etc.), expenses associated with other securities offerings of the Company, costs and expenses incurred in contracting with third parties (including affiliates of the Manager), the costs of printing and mailing proxies and reports to the Company’s shareholders, costs incurred by the Manager or its affiliates for travel on the Company’s behalf, costs associated with any computer software or hardware that is used for the Company, costs to obtain liability insurance to indemnify the Company’s directors and officers and the compensation and expenses of the Company’s transfer agent.
The Company will pay or reimburse the Manager and its affiliates for performing certain legal, accounting, due diligence tasks and other services that outside professionals or outside consultants otherwise would perform, provided that such costs and reimbursements are no greater than those which would be paid to outside professionals or consultants. The Manager is responsible for all of its other costs incident to the performance of its duties under the Management Agreement, including compensation of the Manager’s employees, rent for facilities and other “overhead” expenses; the Company will not reimburse the Manager for these expenses. During the years ended December 31, 2017, 2016, and 2015, expense reimbursement of $8,064, $7,301 and $4,119 was recorded in general and administrative expenses, respectively, and $6,295, $4,783 and $2,181 was recorded in acquisition and transaction expenses, respectively, in the Consolidated Statements of Operations.
If the Company terminates the Management Agreement, it will generally be required to pay the Manager a termination fee. The termination fee is equal to the amount of the management fee during the 12 months immediately preceding the date of the termination. In addition, an Incentive Allocation Fair Value Amount will be distributable to the Master GP if the Master GP is removed due to the termination of the Management Agreement in certain specified circumstances. The Incentive Allocation Fair Value Amount is an amount equal to the Income Incentive Allocation and the Capital Gains Incentive Allocation that would be paid to the Master GP if the Company’s assets were sold for cash at their then current fair market value (as determined by an appraisal, taking into account, among other things, the expected future value of the underlying investments).
Upon the successful completion of a post-IPO offering of the Company’s common shares or other equity securities (including securities issued as consideration in an acquisition), the Company will grant the Manager options to purchase common shares in an amount equal to 10% of the number of common shares being sold in the offering (or if the issuance relates to equity securities other than the Company’s common shares, options to purchase a number of common shares equal to 10% of the gross capital raised in the equity issuance divided by the fair market value of a common share as of the date of issuance), with an exercise price equal to the offering price per share paid by the public or other ultimate purchaser or attributed to such securities in connection with an acquisition (or the fair market value of a common share as of the date of the equity issuance if it relates to equity securities other than our common shares). Any ultimate purchaser of common shares for which such options are granted may be an affiliate of Fortress.
As of December 31, 2017 and 2016, no amounts were recorded as a receivable from the Manager. As of December 31, 2017 and 2016, amounts due to the Manager or its affiliates of $2,073 and $1,697, excluding accrued management fees, respectively, are included within accounts payable and accrued liabilities on the Consolidated Balance Sheets. As of December 31, 2017 and 2016, amounts due to the Manager or its affiliates of $1,228 and $1,347, respectively, related to accrued management fees, are included within accounts payable and accrued liabilities on the Consolidated Balance Sheets.
Other Affiliate Transactions
As of December 31, 2017 and 2016, an affiliate of the Company’s Manager owns an approximately 20% interest in Jefferson Terminal which has been accounted for as a component of non-controlling interest in consolidated subsidiaries in the accompanying consolidated financial statements. The carrying amount of this non-controlling interest at December 31, 2017 and 2016 was $66,242 and $74,904, respectively. For the years ended December 31, 2017, 2016, and 2015, the amount of this non-controlling interest share of net loss was $8,662, $7,647, and $7,950, respectively.
In connection with the Capital Call Agreement related to the Series 2016 Bonds discussed in Note 8, the Company and an affiliate of its Manager entered into a Fee and Support Agreement. The Fee and Support Agreement provides that the affiliate of the Manager is compensated for its guarantee of a portion of the obligations under the Standby Bond Purchase Agreement. This affiliate of the Manager received fees of $1,740, which will be amortized as interest expense to the earlier of the redemption date or February 13, 2020.
14. | SEGMENT INFORMATION |
The Company’s reportable segments represent strategic business units comprised of investments in different types of transportation and infrastructure assets. The Company has 6 reportable segments which operate in the Equipment Leasing and Infrastructure businesses across several market sectors. The Company’s reportable segments are (i) Aviation Leasing, (ii) Offshore Energy, (iii) Shipping Containers, (iv) Jefferson Terminal, (v) Railroad and (vi) Ports and Terminals. Aviation Leasing consists of aircraft and aircraft engines held for lease and are typically held long-term. Offshore Energy consists of vessels and equipment that support offshore oil and gas drilling and production which are typically subject to operating leases. Shipping Containers consists of an investment in an unconsolidated entity engaged in the leasing of shipping
125
FORTRESS TRANSPORTATION AND INFRASTRUCTURE INVESTORS LLC
NOTES TO CONSOLIDATED FINANCIAL STATEMENTS
(Dollar amounts in thousands, unless otherwise noted)
containers (on both an operating lease and finance lease basis). Jefferson Terminal consists of a multi-modal crude oil and refined products terminal and other related assets. Railroad consists of our CMQR railroad operations. Ports and Terminals consists of Repauno, a 1,630 acre deep-water port located along the Delaware River with an underground storage cavern and multiple industrial development opportunities, and Long Ridge, a 1,660 acre multi-modal port located along the Ohio River with rail, dock and multiple industrial development opportunities. During the year ended December 31, 2017, the Company created the aforementioned Ports and Terminals segment. This updated segment has been reflected in the results for the year ended December 31, 2017 and accordingly, the segment results for the years ended December 31, 2016 and 2015 have been reclassified to conform to the new presentation.
Corporate consists primarily of unallocated Company level general and administrative expenses and management fees. The accounting policies of the segments are the same as those described in the summary of significant accounting policies; however, financial information presented by segment includes the impact of intercompany eliminations. The Company evaluates investment performance for each reportable segment primarily based on net income attributable to shareholders and Adjusted Net Income.
Adjusted Net Income is defined as net income attributable to shareholders, adjusted (a) to exclude the impact of provision for income taxes, equity-based compensation expense, acquisition and transaction expenses, losses on the modification or extinguishment of debt and capital lease obligations, changes in fair value of non-hedge derivative instruments, asset impairment charges, incentive allocations, and equity in earnings of unconsolidated entities; (b) to include the impact of cash income tax payments, the Company’s pro-rata share of the Adjusted Net Income from unconsolidated entities (collectively “Adjusted Net Income”), and (c) to exclude the impact of the non-controlling share of Adjusted Net Income.
The Company believes that net income attributable to shareholders, as defined by GAAP, is the most appropriate earnings measurement with which to reconcile Adjusted Net Income. Adjusted Net Income should not be considered as an alternative to net income attributable to shareholders as determined in accordance with GAAP.
126
FORTRESS TRANSPORTATION AND INFRASTRUCTURE INVESTORS LLC
NOTES TO CONSOLIDATED FINANCIAL STATEMENTS
(Dollar amounts in thousands, unless otherwise noted)
The following tables set forth certain information for each reportable segment of the Company:
I. For the Year Ended December 31, 2017
Year ended December 31, 2017 | |||||||||||||||||||||||||||||||
Equipment Leasing | Infrastructure | ||||||||||||||||||||||||||||||
Aviation Leasing | Offshore Energy | Shipping Containers | Jefferson Terminal | Railroad | Ports and Terminals | Corporate | Total | ||||||||||||||||||||||||
Revenues | |||||||||||||||||||||||||||||||
Equipment leasing revenues | $ | 156,793 | $ | 13,107 | $ | 100 | $ | — | $ | — | $ | — | $ | — | $ | 170,000 | |||||||||||||||
Infrastructure revenues | — | — | — | 10,229 | 32,607 | 4,823 | — | 47,659 | |||||||||||||||||||||||
Total revenues | 156,793 | 13,107 | 100 | 10,229 | 32,607 | 4,823 | — | 217,659 | |||||||||||||||||||||||
Expenses | |||||||||||||||||||||||||||||||
Operating expenses | 6,247 | 15,833 | 9 | 31,213 | 29,966 | 9,117 | — | 92,385 | |||||||||||||||||||||||
General and administrative | — | — | — | — | — | — | 14,570 | 14,570 | |||||||||||||||||||||||
Acquisition and transaction expenses | 441 | — | — | — | — | — | 6,865 | 7,306 | |||||||||||||||||||||||
Management fees and incentive allocation to affiliate | — | — | — | — | — | — | 15,732 | 15,732 | |||||||||||||||||||||||
Depreciation and amortization | 61,795 | 6,427 | — | 16,193 | 2,037 | 1,658 | — | 88,110 | |||||||||||||||||||||||
Interest expense | — | 3,670 | — | 13,568 | 1,029 | 1,088 | 19,472 | 38,827 | |||||||||||||||||||||||
Total expenses | 68,483 | 25,930 | 9 | 60,974 | 33,032 | 11,863 | 56,639 | 256,930 | |||||||||||||||||||||||
Other income (expense) | |||||||||||||||||||||||||||||||
Equity in losses of unconsolidated entities | (1,276 | ) | — | (4 | ) | (321 | ) | — | — | — | (1,601 | ) | |||||||||||||||||||
Gain (loss) on sale of assets | 7,188 | 11,405 | — | — | (312 | ) | — | — | 18,281 | ||||||||||||||||||||||
Loss on extinguishment of debt | — | — | — | — | — | — | (2,456 | ) | (2,456 | ) | |||||||||||||||||||||
Interest income | 297 | 15 | — | 376 | — | — | — | 688 | |||||||||||||||||||||||
Other income | — | 1,093 | — | 1,980 | — | — | — | 3,073 | |||||||||||||||||||||||
Total other income (expense) | 6,209 | 12,513 | (4 | ) | 2,035 | (312 | ) | — | (2,456 | ) | 17,985 | ||||||||||||||||||||
Income (loss) before income taxes | 94,519 | (310 | ) | 87 | (48,710 | ) | (737 | ) | (7,040 | ) | (59,095 | ) | (21,286 | ) | |||||||||||||||||
Provision for (benefit from) income taxes | 1,966 | 11 | (65 | ) | 42 | — | — | — | 1,954 | ||||||||||||||||||||||
Net income (loss) | 92,553 | (321 | ) | 152 | (48,752 | ) | (737 | ) | (7,040 | ) | (59,095 | ) | (23,240 | ) | |||||||||||||||||
Less: Net income (loss) attributable to non-controlling interests in consolidated subsidiaries | 697 | (526 | ) | — | (22,991 | ) | (70 | ) | (484 | ) | — | (23,374 | ) | ||||||||||||||||||
Net income (loss) attributable to shareholders | $ | 91,856 | $ | 205 | $ | 152 | $ | (25,761 | ) | $ | (667 | ) | $ | (6,556 | ) | $ | (59,095 | ) | $ | 134 | |||||||||||
127
FORTRESS TRANSPORTATION AND INFRASTRUCTURE INVESTORS LLC
NOTES TO CONSOLIDATED FINANCIAL STATEMENTS
(Dollar amounts in thousands, unless otherwise noted)
The following table sets forth a reconciliation of Adjusted Net Income (Loss) to net loss attributable to shareholders:
Year ended December 31, 2017 | |||||||||||||||||||||||||||||||
Equipment Leasing | Infrastructure | ||||||||||||||||||||||||||||||
Aviation Leasing | Offshore Energy | Shipping Containers | Jefferson Terminal | Railroad | Ports and Terminals | Corporate | Total | ||||||||||||||||||||||||
Adjusted Net Income (Loss) | $ | 92,637 | $ | 216 | $ | 87 | $ | (27,016 | ) | $ | 19 | $ | (6,257 | ) | $ | (49,285 | ) | $ | 10,401 | ||||||||||||
Add: Non-controlling share of adjustments to Adjusted Net Income | 558 | ||||||||||||||||||||||||||||||
Add: Equity in losses of unconsolidated entities | (1,601 | ) | |||||||||||||||||||||||||||||
Add: Cash payments for income taxes | 1,726 | ||||||||||||||||||||||||||||||
Less: Incentive allocations | (514 | ) | |||||||||||||||||||||||||||||
Less: Pro-rata share of Adjusted Net Income from investments in unconsolidated entities | 1,601 | ||||||||||||||||||||||||||||||
Less: Asset impairment charges | — | ||||||||||||||||||||||||||||||
Less: Changes in fair value of non-hedge derivative instruments | 1,022 | ||||||||||||||||||||||||||||||
Less: Losses on the modification or extinguishment of debt and capital lease obligations | (2,456 | ) | |||||||||||||||||||||||||||||
Less: Acquisition and transaction expenses | (7,306 | ) | |||||||||||||||||||||||||||||
Less: Equity-based compensation | (1,343 | ) | |||||||||||||||||||||||||||||
Less: Provision for income taxes | (1,954 | ) | |||||||||||||||||||||||||||||
Net loss attributable to shareholders | $ | 134 | |||||||||||||||||||||||||||||
Summary information with respect to the Company’s geographic sources of revenue, based on location of customer, is as follows:
Year ended December 31, 2017 | |||||||||||||||||||||||||||||||
Equipment Leasing | Infrastructure | ||||||||||||||||||||||||||||||
Aviation Leasing | Offshore Energy | Shipping Containers | Jefferson Terminal | Railroad | Ports and Terminals | Corporate | Total | ||||||||||||||||||||||||
Revenues | |||||||||||||||||||||||||||||||
Africa | $ | 9,993 | $ | — | $ | — | $ | — | $ | — | $ | — | $ | — | $ | 9,993 | |||||||||||||||
Asia | 45,794 | 5,974 | 100 | — | — | — | — | 51,868 | |||||||||||||||||||||||
Europe | 84,023 | 5,597 | — | — | — | — | — | 89,620 | |||||||||||||||||||||||
North America | 16,278 | 1,536 | — | 10,229 | 32,607 | 4,823 | — | 65,473 | |||||||||||||||||||||||
South America | 705 | — | — | — | — | — | — | 705 | |||||||||||||||||||||||
Total revenues | $ | 156,793 | $ | 13,107 | $ | 100 | $ | 10,229 | $ | 32,607 | $ | 4,823 | $ | — | $ | 217,659 | |||||||||||||||
128
FORTRESS TRANSPORTATION AND INFRASTRUCTURE INVESTORS LLC
NOTES TO CONSOLIDATED FINANCIAL STATEMENTS
(Dollar amounts in thousands, unless otherwise noted)
II. For the Year Ended December 31, 2016
Year Ended December 31, 2016 | |||||||||||||||||||||||||||||||
Equipment Leasing | Infrastructure | ||||||||||||||||||||||||||||||
Aviation Leasing | Offshore Energy | Shipping Containers | Jefferson Terminal | Railroad | Ports and Terminals | Corporate | Total | ||||||||||||||||||||||||
Revenues | |||||||||||||||||||||||||||||||
Equipment leasing revenues | $ | 95,408 | $ | 5,328 | $ | 1,213 | $ | — | $ | — | $ | — | $ | — | $ | 101,949 | |||||||||||||||
Infrastructure revenues | — | — | — | 15,902 | 30,837 | 32 | — | 46,771 | |||||||||||||||||||||||
Total revenues | 95,408 | 5,328 | 1,213 | 15,902 | 30,837 | 32 | — | 148,720 | |||||||||||||||||||||||
Expenses | |||||||||||||||||||||||||||||||
Operating expenses | 4,609 | 11,014 | 43 | 21,886 | 27,975 | 628 | 14 | 66,169 | |||||||||||||||||||||||
General and administrative | — | — | — | — | — | — | 12,314 | 12,314 | |||||||||||||||||||||||
Acquisition and transaction expenses | 80 | — | — | 400 | — | — | 5,836 | 6,316 | |||||||||||||||||||||||
Management fees and incentive allocation to affiliate | — | — | — | — | — | — | 16,742 | 16,742 | |||||||||||||||||||||||
Depreciation and amortization | 36,369 | 6,411 | — | 15,500 | 1,926 | 4 | — | 60,210 | |||||||||||||||||||||||
Interest expense | — | 3,747 | 410 | 13,501 | 754 | 545 | — | 18,957 | |||||||||||||||||||||||
Total expenses | 41,058 | 21,172 | 453 | 51,287 | 30,655 | 1,177 | 34,906 | 180,708 | |||||||||||||||||||||||
Other income (expense) | |||||||||||||||||||||||||||||||
Equity in losses of unconsolidated entities | — | — | (5,974 | ) | (18 | ) | — | — | — | (5,992 | ) | ||||||||||||||||||||
Gain on sale of assets | 5,214 | — | 304 | — | 423 | — | — | 5,941 | |||||||||||||||||||||||
Loss on extinguishment of debt | — | — | — | (1,579 | ) | — | — | — | (1,579 | ) | |||||||||||||||||||||
Asset impairment | — | (7,450 | ) | — | — | — | — | — | (7,450 | ) | |||||||||||||||||||||
Interest income (expense) | 142 | 13 | — | (19 | ) | — | — | — | 136 | ||||||||||||||||||||||
Other income | — | — | — | 602 | — | — | — | 602 | |||||||||||||||||||||||
Total other income (expense) | 5,356 | (7,437 | ) | (5,670 | ) | (1,014 | ) | 423 | — | — | (8,342 | ) | |||||||||||||||||||
Income (loss) before income taxes | 59,706 | (23,281 | ) | (4,910 | ) | (36,399 | ) | 605 | (1,145 | ) | (34,906 | ) | (40,330 | ) | |||||||||||||||||
Provision (benefit) for income taxes | 267 | — | (86 | ) | 74 | — | 13 | — | 268 | ||||||||||||||||||||||
Net income (loss) | 59,439 | (23,281 | ) | (4,824 | ) | (36,473 | ) | 605 | (1,158 | ) | (34,906 | ) | (40,598 | ) | |||||||||||||||||
Less: Net income (loss) attributable to non-controlling interests in consolidated subsidiaries | 435 | (4,368 | ) | — | (16,456 | ) | 23 | (157 | ) | (11 | ) | (20,534 | ) | ||||||||||||||||||
Net income (loss) attributable to shareholders | $ | 59,004 | $ | (18,913 | ) | $ | (4,824 | ) | $ | (20,017 | ) | $ | 582 | $ | (1,001 | ) | $ | (34,895 | ) | $ | (20,064 | ) | |||||||||
129
FORTRESS TRANSPORTATION AND INFRASTRUCTURE INVESTORS LLC
NOTES TO CONSOLIDATED FINANCIAL STATEMENTS
(Dollar amounts in thousands, unless otherwise noted)
The following table sets forth a reconciliation of Adjusted Net Income (Loss) to net loss attributable to shareholders:
Year Ended December 31, 2016 | |||||||||||||||||||||||||||||||
Equipment Leasing | Infrastructure | ||||||||||||||||||||||||||||||
Aviation Leasing | Offshore Energy | Shipping Containers | Jefferson Terminal | Railroad | Ports and Terminals | Corporate | Total | ||||||||||||||||||||||||
Adjusted Net Income (Loss) | $ | 58,768 | $ | (15,188 | ) | $ | (1,838 | ) | $ | (21,249 | ) | $ | 941 | $ | (993 | ) | $ | (29,073 | ) | $ | (8,632 | ) | |||||||||
Add: Non-controlling share of adjustments to Adjusted Net Income | 2,945 | ||||||||||||||||||||||||||||||
Add: Equity in losses of unconsolidated entities | (5,992 | ) | |||||||||||||||||||||||||||||
Add: Cash payments for income taxes | 654 | ||||||||||||||||||||||||||||||
Less: Incentive allocations | — | ||||||||||||||||||||||||||||||
Less: Pro-rata share of Adjusted Net Income from investments in unconsolidated entities | 2,905 | ||||||||||||||||||||||||||||||
Less: Asset impairment charges | (7,450 | ) | |||||||||||||||||||||||||||||
Less: Changes in fair value of non-hedge derivative instruments | (3 | ) | |||||||||||||||||||||||||||||
Less: Losses on the modification or extinguishment of debt and capital lease obligations | (1,579 | ) | |||||||||||||||||||||||||||||
Less: Acquisition and transaction expenses | (6,316 | ) | |||||||||||||||||||||||||||||
Less: Equity-based compensation income | 3,672 | ||||||||||||||||||||||||||||||
Less: Provision for income taxes | (268 | ) | |||||||||||||||||||||||||||||
Net loss attributable to shareholders | $ | (20,064 | ) | ||||||||||||||||||||||||||||
Summary information with respect to the Company’s geographic sources of revenue, based on location of customer, is as follows:
Year Ended December 31, 2016 | |||||||||||||||||||||||||||||||
Equipment Leasing | Infrastructure | ||||||||||||||||||||||||||||||
Aviation Leasing | Offshore Energy | Shipping Containers | Jefferson Terminal | Railroad | Ports and Terminals | Corporate | Total | ||||||||||||||||||||||||
Revenues | |||||||||||||||||||||||||||||||
Africa | $ | 12,344 | $ | — | $ | — | $ | — | $ | — | $ | — | $ | — | $ | 12,344 | |||||||||||||||
Asia | 42,999 | 3,470 | 885 | — | — | — | — | 47,354 | |||||||||||||||||||||||
Europe | 30,508 | 248 | — | — | — | — | — | 30,756 | |||||||||||||||||||||||
North America | 8,184 | 1,610 | 328 | 15,902 | 30,837 | 32 | — | 56,893 | |||||||||||||||||||||||
South America | 1,373 | — | — | — | — | — | — | 1,373 | |||||||||||||||||||||||
Total revenues | $ | 95,408 | $ | 5,328 | $ | 1,213 | $ | 15,902 | $ | 30,837 | $ | 32 | $ | — | $ | 148,720 | |||||||||||||||
130
FORTRESS TRANSPORTATION AND INFRASTRUCTURE INVESTORS LLC
NOTES TO CONSOLIDATED FINANCIAL STATEMENTS
(Dollar amounts in thousands, unless otherwise noted)
III. For the Year Ended December 31, 2015
Year Ended December 31, 2015 | |||||||||||||||||||||||||||||||
Equipment Leasing | Infrastructure | ||||||||||||||||||||||||||||||
Aviation Leasing | Offshore Energy | Shipping Containers | Jefferson Terminal | Railroad | Ports and Terminals | Corporate | Total | ||||||||||||||||||||||||
Revenues | |||||||||||||||||||||||||||||||
Equipment leasing revenues | $ | 61,330 | $ | 24,231 | $ | 7,182 | $ | — | $ | — | $ | — | $ | — | $ | 92,743 | |||||||||||||||
Infrastructure revenues | — | — | — | 18,275 | 25,550 | — | — | 43,825 | |||||||||||||||||||||||
Total revenues | 61,330 | 24,231 | 7,182 | 18,275 | 25,550 | — | — | 136,568 | |||||||||||||||||||||||
Expenses | |||||||||||||||||||||||||||||||
Operating expenses | 2,820 | 4,650 | 350 | 33,154 | 27,819 | — | — | 68,793 | |||||||||||||||||||||||
General and administrative | — | — | — | — | — | — | 7,568 | 7,568 | |||||||||||||||||||||||
Acquisition and transaction expenses | — | — | — | — | — | — | 5,683 | 5,683 | |||||||||||||||||||||||
Management fees and incentive allocation to affiliate | — | — | — | — | — | — | 15,018 | 15,018 | |||||||||||||||||||||||
Depreciation and amortization | 23,549 | 5,967 | — | 13,897 | 1,895 | — | — | 45,308 | |||||||||||||||||||||||
Interest expense | — | 3,794 | 2,393 | 12,546 | 578 | — | — | 19,311 | |||||||||||||||||||||||
Total expenses | 26,369 | 14,411 | 2,743 | 59,597 | 30,292 | — | 28,269 | 161,681 | |||||||||||||||||||||||
Other income (expense) | |||||||||||||||||||||||||||||||
Equity in losses of unconsolidated entities | — | — | (6,956 | ) | — | — | — | — | (6,956 | ) | |||||||||||||||||||||
Gain (loss) on sale of assets | 3,053 | — | — | (199 | ) | 565 | — | — | 3,419 | ||||||||||||||||||||||
Loss on extinguishment of debt | — | — | — | — | — | — | — | — | |||||||||||||||||||||||
Asset impairment | — | — | — | — | — | — | — | — | |||||||||||||||||||||||
Interest income | 11 | 483 | — | 85 | — | — | — | 579 | |||||||||||||||||||||||
Other (expense) income | — | — | (14 | ) | 40 | — | — | — | 26 | ||||||||||||||||||||||
Total other income (expense) | 3,064 | 483 | (6,970 | ) | (74 | ) | 565 | — | — | (2,932 | ) | ||||||||||||||||||||
Income (loss) before income taxes | 38,025 | 10,303 | (2,531 | ) | (41,396 | ) | (4,177 | ) | — | (28,269 | ) | (28,045 | ) | ||||||||||||||||||
Provision (benefit) for income taxes | 668 | — | (127 | ) | 41 | — | — | 4 | 586 | ||||||||||||||||||||||
Net income (loss) | 37,357 | 10,303 | (2,404 | ) | (41,437 | ) | (4,177 | ) | — | (28,273 | ) | (28,631 | ) | ||||||||||||||||||
Less: Net income (loss) attributable to non-controlling interests in consolidated subsidiaries | 21 | 676 | — | (17,376 | ) | (121 | ) | — | (5 | ) | (16,805 | ) | |||||||||||||||||||
Net income (loss) attributable to shareholders | $ | 37,336 | $ | 9,627 | $ | (2,404 | ) | $ | (24,061 | ) | $ | (4,056 | ) | $ | — | $ | (28,268 | ) | $ | (11,826 | ) | ||||||||||
131
FORTRESS TRANSPORTATION AND INFRASTRUCTURE INVESTORS LLC
NOTES TO CONSOLIDATED FINANCIAL STATEMENTS
(Dollar amounts in thousands, unless otherwise noted)
The following table sets forth a reconciliation of Adjusted Net Income (Loss) to net loss attributable to shareholders:
Year Ended December 31, 2015 | |||||||||||||||||||||||||||||||
Equipment Leasing | Infrastructure | ||||||||||||||||||||||||||||||
Aviation Leasing | Offshore Energy | Shipping Containers | Jefferson Terminal | Railroad | Ports and Terminals | Corporate | Total | ||||||||||||||||||||||||
Adjusted Net Income (Loss) | $ | 37,777 | $ | 9,627 | $ | 7,991 | $ | (22,153 | ) | $ | (2,898 | ) | $ | — | $ | (22,557 | ) | $ | 7,787 | ||||||||||||
Add: Non-controlling share of adjustments to Adjusted Net Income | 1,333 | ||||||||||||||||||||||||||||||
Add: Equity in earnings of unconsolidated entities | (6,956 | ) | |||||||||||||||||||||||||||||
Add: Cash payments for income taxes | 507 | ||||||||||||||||||||||||||||||
Less: Incentive allocations | — | ||||||||||||||||||||||||||||||
Less: Pro-rata share of Adjusted Net Income from investments in unconsolidated entities | (3,552 | ) | |||||||||||||||||||||||||||||
Less: Asset impairment charges | — | ||||||||||||||||||||||||||||||
Less: Changes in fair value of non-hedge derivative instruments | (14 | ) | |||||||||||||||||||||||||||||
Less: Losses on the modification or extinguishment of debt and capital lease obligations | — | ||||||||||||||||||||||||||||||
Less: Acquisition and transaction expenses | (5,683 | ) | |||||||||||||||||||||||||||||
Less: Equity-based compensation expense | (4,662 | ) | |||||||||||||||||||||||||||||
Less: Provision for income taxes | (586 | ) | |||||||||||||||||||||||||||||
Net loss attributable to shareholders | $ | (11,826 | ) | ||||||||||||||||||||||||||||
Summary information with respect to the Company’s geographic sources of revenue, based on location of customer, is as follows:
Year Ended December 31, 2015 | |||||||||||||||||||||||||||||||
Equipment Leasing | Infrastructure | ||||||||||||||||||||||||||||||
Aviation Leasing | Offshore Energy | Shipping Containers | Jefferson Terminal | Railroad | Ports and Terminals | Corporate | Total | ||||||||||||||||||||||||
Revenues | |||||||||||||||||||||||||||||||
Africa | $ | 10,969 | $ | — | $ | — | $ | — | $ | — | $ | — | $ | — | $ | 10,969 | |||||||||||||||
Asia | 27,168 | 7,483 | 5,309 | — | — | — | — | 39,960 | |||||||||||||||||||||||
Europe | 20,008 | 15,071 | — | — | — | — | — | 35,079 | |||||||||||||||||||||||
North America | 2,304 | 1,677 | 1,873 | 18,275 | 25,550 | — | — | 49,679 | |||||||||||||||||||||||
South America | 881 | — | — | — | — | — | — | 881 | |||||||||||||||||||||||
Total revenues | $ | 61,330 | $ | 24,231 | $ | 7,182 | $ | 18,275 | $ | 25,550 | $ | — | $ | — | $ | 136,568 | |||||||||||||||
132
FORTRESS TRANSPORTATION AND INFRASTRUCTURE INVESTORS LLC
NOTES TO CONSOLIDATED FINANCIAL STATEMENTS
(Dollar amounts in thousands, unless otherwise noted)
IV. Balance Sheet and location of long-lived assets
The following tables sets forth summarized balance sheet information and the geographic location of property, plant and equipment and leasing equipment, net as of December 31, 2017 and December 31, 2016:
December 31, 2017 | |||||||||||||||||||||||||||||||
Equipment Leasing | Infrastructure | ||||||||||||||||||||||||||||||
Aviation Leasing | Offshore Energy | Shipping Containers | Jefferson Terminal | Railroad | Ports and Terminals | Corporate | Total | ||||||||||||||||||||||||
Total assets | $ | 952,543 | $ | 195,101 | $ | 4,429 | $ | 579,329 | $ | 51,989 | $ | 123,693 | $ | 48,722 | $ | 1,955,806 | |||||||||||||||
Debt, net | — | 53,590 | — | 184,942 | 22,513 | — | 442,219 | 703,264 | |||||||||||||||||||||||
Total liabilities | 145,882 | 56,853 | 100 | 210,159 | 36,560 | 14,229 | 456,948 | 920,731 | |||||||||||||||||||||||
Non-controlling interests in equity of consolidated subsidiaries | 3,037 | — | — | 81,414 | 2,737 | 295 | 524 | 88,007 | |||||||||||||||||||||||
Total equity | 806,661 | 138,248 | 4,329 | 369,170 | 15,429 | 109,464 | (408,226 | ) | 1,035,075 | ||||||||||||||||||||||
Total liabilities and equity | $ | 952,543 | $ | 195,101 | $ | 4,429 | $ | 579,329 | $ | 51,989 | $ | 123,693 | $ | 48,722 | $ | 1,955,806 | |||||||||||||||
December 31, 2017 | |||||||||||||||||||||||||||||||
Equipment Leasing | Infrastructure | ||||||||||||||||||||||||||||||
Aviation Leasing | Offshore Energy | Shipping Containers | Jefferson Terminal | Railroad | Ports and Terminals | Corporate | Total | ||||||||||||||||||||||||
Property, plant and equipment and leasing equipment, net | |||||||||||||||||||||||||||||||
Africa | $ | 36,648 | $ | — | $ | — | $ | — | $ | — | $ | — | $ | — | $ | 36,648 | |||||||||||||||
Asia | 210,152 | 163,072 | — | — | — | — | — | 373,224 | |||||||||||||||||||||||
Europe | 527,166 | — | — | — | — | — | — | 527,166 | |||||||||||||||||||||||
North America | 96,525 | — | — | 371,687 | 40,512 | 118,317 | — | 627,041 | |||||||||||||||||||||||
South America | — | — | — | — | — | — | — | — | |||||||||||||||||||||||
Total property, plant and equipment and leasing equipment, net | $ | 870,491 | $ | 163,072 | $ | — | $ | 371,687 | $ | 40,512 | $ | 118,317 | $ | — | $ | 1,564,079 | |||||||||||||||
133
FORTRESS TRANSPORTATION AND INFRASTRUCTURE INVESTORS LLC
NOTES TO CONSOLIDATED FINANCIAL STATEMENTS
(Dollar amounts in thousands, unless otherwise noted)
December 31, 2016 | |||||||||||||||||||||||||||||||
Equipment Leasing | Infrastructure | ||||||||||||||||||||||||||||||
Aviation Leasing | Offshore Energy | Shipping Containers | Jefferson Terminal | Railroad | Ports and Terminals | Corporate | Total | ||||||||||||||||||||||||
Total assets | $ | 625,680 | $ | 220,544 | $ | 4,333 | $ | 534,638 | $ | 40,428 | $ | 63,331 | $ | 58,358 | $ | 1,547,312 | |||||||||||||||
Debt, net | — | 62,655 | — | 184,702 | 12,155 | — | — | 259,512 | |||||||||||||||||||||||
Total liabilities | 74,989 | 66,002 | — | 205,536 | 24,971 | 6,287 | 3,847 | 381,632 | |||||||||||||||||||||||
Non-controlling interests in equity of consolidated subsidiaries | 1,334 | 3,325 | — | 104,087 | 2,114 | 483 | 525 | 111,868 | |||||||||||||||||||||||
Total equity | 550,691 | 154,542 | 4,333 | 329,102 | 15,457 | 57,044 | 54,511 | 1,165,680 | |||||||||||||||||||||||
Total liabilities and equity | $ | 625,680 | $ | 220,544 | $ | 4,333 | $ | 534,638 | $ | 40,428 | $ | 63,331 | $ | 58,358 | $ | 1,547,312 | |||||||||||||||
December 31, 2016 | |||||||||||||||||||||||||||||||
Equipment Leasing | Infrastructure | ||||||||||||||||||||||||||||||
Aviation Leasing | Offshore Energy | Shipping Containers | Jefferson Terminal | Railroad | Ports and Terminals | Corporate | Total | ||||||||||||||||||||||||
Property, plant and equipment and leasing equipment, net | |||||||||||||||||||||||||||||||
Africa | $ | 51,136 | $ | — | $ | — | $ | — | $ | — | $ | — | $ | — | $ | 51,136 | |||||||||||||||
Asia | 212,635 | 169,499 | — | — | — | — | — | 382,134 | |||||||||||||||||||||||
Europe | 225,934 | — | — | — | — | — | — | 225,934 | |||||||||||||||||||||||
North America | 56,456 | — | — | 319,503 | 29,866 | 44,486 | — | 450,311 | |||||||||||||||||||||||
South America | 8,121 | — | — | — | — | — | — | 8,121 | |||||||||||||||||||||||
Total property, plant and equipment and leasing equipment, net | $ | 554,282 | $ | 169,499 | $ | — | $ | 319,503 | $ | 29,866 | $ | 44,486 | $ | — | $ | 1,117,636 | |||||||||||||||
15. | EARNINGS PER SHARE |
Basic earnings (loss) per share (“EPS”) is calculated by dividing net income (loss) attributable to the Company by the weighted average number of shares of common stock outstanding. Diluted EPS is calculated by dividing net income (loss) attributable to the Company by the weighted average number of shares of common stock outstanding, plus potentially dilutive securities. Potentially dilutive securities are calculated using the treasury stock method.
The Company completed its IPO on May 20, 2015 in which its previous beneficial owners, the Onshore Fund and the Offshore Fund, immediately prior to the consummation of the IPO, received shares in proportion to their respective ownership percentages. As a result, the Company has retrospectively presented the shares outstanding for all prior periods presented.
The calculation of basic and diluted EPS is presented below.
Year Ended December 31, | |||||||||||
(in thousands, except share and per share data) | 2017 | 2016 | 2015 | ||||||||
Net income (loss) attributable to shareholders | $ | 134 | $ | (20,064 | ) | $ | (11,826 | ) | |||
Weighted Average Shares Outstanding - Basic | 75,766,811 | 75,738,698 | 67,039,439 | ||||||||
Weighted Average Shares Outstanding - Diluted | 75,766,811 | 75,738,698 | 67,039,439 | ||||||||
Basic and Diluted EPS | $ | — | $ | (0.26 | ) | $ | (0.18 | ) | |||
134
FORTRESS TRANSPORTATION AND INFRASTRUCTURE INVESTORS LLC
NOTES TO CONSOLIDATED FINANCIAL STATEMENTS
(Dollar amounts in thousands, unless otherwise noted)
For the years ended December 31, 2017, 2016 and 2015, 438, 8,082 and 0 shares have been excluded from the calculation of Diluted EPS, respectively, because the impact would be anti-dilutive.
16. | COMMITMENTS AND CONTINGENCIES |
In the normal course of business the Company and its subsidiaries may be involved in various claims, legal proceedings, or may enter into contracts that contain a variety of representations and warranties and which provide general indemnifications. Within the Company’s Offshore Energy segment, lessees have asserted that they are entitled to certain reimbursable expenses or adjustments per the terms of the related charter agreement. Although the Company believes it has strong defenses against these claims, the range of potential damages is $0 to $6,580. No amount has been recorded for this matter in the Company’s consolidated financial statements as of December 31, 2017, and the Company will continue to vigorously defend against these claims. The Company’s maximum exposure under other arrangements is unknown as no additional claims have been made. The Company believes the risk of loss in connection with such arrangements is remote.
The Company has also entered into an arrangement with its non-controlling interest holder of Repauno, whereby the non-controlling interest holder may receive additional payments contingent upon the achievement of certain service conditions, not to exceed $15,000 (Note 5). The Company will account for such amounts when and if such service conditions are achieved.
Several of the Company’s subsidiaries are lessees under various operating and capital leases. Total rent expense for operating leases was as follows:
Year Ended December 31, | |||||||||||
2017 | 2016 | 2015 | |||||||||
Rent expense | $ | 4,979 | $ | 4,953 | $ | 3,717 | |||||
As of December 31, 2017, minimum future rental payments under operating and capital leases are as follows:
2018 | $ | 7,135 | |
2019 | 6,968 | ||
2020 | 5,867 | ||
2021 | 4,475 | ||
2022 | 3,035 | ||
Thereafter | 70,713 | ||
Total | $ | 98,193 | |
135
FORTRESS TRANSPORTATION AND INFRASTRUCTURE INVESTORS LLC
NOTES TO CONSOLIDATED FINANCIAL STATEMENTS
(Dollar amounts in thousands, unless otherwise noted)
17. | QUARTERLY FINANCIAL INFORMATION (UNAUDITED) |
The following table unaudited summary information of the Company's quarterly operations.
2017 | |||||||||||||||||||
Quarter Ended | Year Ended December 31 | ||||||||||||||||||
(in thousands except share and per share data) | March 31 | June 30 | September 30 | December 31(1) | |||||||||||||||
Total revenues | $ | 44,673 | $ | 51,194 | $ | 60,362 | $ | 61,430 | $ | 217,659 | |||||||||
Total expenses | 52,264 | 58,315 | 66,328 | 80,023 | 256,930 | ||||||||||||||
Total other (expense) income | (1,409 | ) | 1,776 | 5,204 | 12,414 | 17,985 | |||||||||||||
(Loss) income before income taxes | (9,000 | ) | (5,345 | ) | (762 | ) | (6,179 | ) | (21,286 | ) | |||||||||
Provision for income taxes | 212 | 464 | 909 | 369 | 1,954 | ||||||||||||||
Net (loss) income | (9,212 | ) | (5,809 | ) | (1,671 | ) | (6,548 | ) | (23,240 | ) | |||||||||
Net loss attributable to non-controlling interests in consolidated subsidiaries | (4,798 | ) | (4,349 | ) | (4,669 | ) | (9,558 | ) | (23,374 | ) | |||||||||
Net (loss) income attributable to shareholders | $ | (4,414 | ) | $ | (1,460 | ) | $ | 2,998 | $ | 3,010 | $ | 134 | |||||||
(Loss) earnings per share: | |||||||||||||||||||
Basic | $ | (0.06 | ) | $ | (0.02 | ) | $ | 0.04 | $ | 0.04 | $ | — | |||||||
Diluted | $ | (0.06 | ) | $ | (0.02 | ) | $ | 0.04 | $ | 0.04 | $ | — | |||||||
Weighted Average Shares Outstanding: | |||||||||||||||||||
Basic | 75,762,283 | 75,762,674 | 75,770,529 | 75,771,738 | 75,766,811 | ||||||||||||||
Diluted | 75,762,283 | 75,762,674 | 75,770,665 | 75,772,867 | 75,766,811 | ||||||||||||||
_____________________________________________________
(1)Results of operations for the three months ended December 31, 2017 include a $5.9 million out of period adjustment to interest expense, which relates to interest previously capitalized that should have been expensed ratably during the first nine months of 2017. The impact of the out of period adjustment for the three months ended December 31, 2017, was a decrease of $3.6 million to net (loss) income attributed to shareholders. The Company does not believe this out of period adjustment is material to its financial position, or results of operations for any prior periods.
2016 | |||||||||||||||||||
Quarter Ended | Year Ended December 31 | ||||||||||||||||||
(in thousands except share and per share data) | March 31 | June 30 | September 30 | December 31 | |||||||||||||||
Total revenues | $ | 31,453 | $ | 33,195 | $ | 41,726 | $ | 42,346 | $ | 148,720 | |||||||||
Total expenses | 40,873 | 46,839 | 46,859 | 46,137 | 180,708 | ||||||||||||||
Total other income (expense) | 277 | (6,234 | ) | (430 | ) | (1,955 | ) | (8,342 | ) | ||||||||||
Loss before income taxes | (9,143 | ) | (19,878 | ) | (5,563 | ) | (5,746 | ) | (40,330 | ) | |||||||||
(Benefit) provision for income taxes | (66 | ) | 178 | 83 | 73 | 268 | |||||||||||||
Net loss | (9,077 | ) | (20,056 | ) | (5,646 | ) | (5,819 | ) | (40,598 | ) | |||||||||
Net loss attributable to non-controlling interests in consolidated subsidiaries | (3,295 | ) | (8,863 | ) | (4,370 | ) | (4,006 | ) | (20,534 | ) | |||||||||
Net loss attributable to shareholders | $ | (5,782 | ) | $ | (11,193 | ) | $ | (1,276 | ) | $ | (1,813 | ) | $ | (20,064 | ) | ||||
Loss per Share: | |||||||||||||||||||
Basic | $ | (0.08 | ) | $ | (0.15 | ) | $ | (0.02 | ) | $ | (0.02 | ) | $ | (0.26 | ) | ||||
Diluted | $ | (0.08 | ) | $ | (0.15 | ) | $ | (0.02 | ) | $ | (0.02 | ) | $ | (0.26 | ) | ||||
Weighted Average Shares Outstanding: | |||||||||||||||||||
Basic | 75,727,369 | 75,730,165 | 75,746,200 | 75,750,943 | 75,738,698 | ||||||||||||||
Diluted | 75,727,369 | 75,730,165 | 75,746,200 | 75,750,943 | 75,738,698 | ||||||||||||||
136
FORTRESS TRANSPORTATION AND INFRASTRUCTURE INVESTORS LLC
NOTES TO CONSOLIDATED FINANCIAL STATEMENTS
(Dollar amounts in thousands, unless otherwise noted)
18. | SUBSEQUENT EVENTS |
On January 10, 2018, the Company agreed to sell 7,000,000 common shares, par value $0.01 per share, representing limited liability interest in the Company, in connection with a public offering, at a price of $18.65 per share. The offering closed on January 16, 2018. Net proceeds received by the Company from the offering were approximately $128 million, after deducting underwriting discounts and commissions and estimated offering expenses payable by the Company. To compensate the Manager for its successful efforts in raising capital for the Company, in connection with the offering, the Company granted options to the Manager related to 700,000 shares of the Company’s common stock at the public offering price which had a fair value of approximately $1.9 million as of the grant date. The assumptions used in valuing the options were: a 2.52% risk-free rate, a 5.45% dividend yield, a 27.73% volatility and a ten-year term. The Company intends to use the net proceeds from the offering for general corporate purposes, including the funding of future investments.
On February 27, 2018, the Company’s Board of Directors declared a cash dividend on its common shares of $0.33 per share for the quarter ended December 31, 2017, payable on March 27, 2018 to the holders of record on March 16, 2018.
137
Report of Independent Auditors
To the Management of Intermodal Finance I Ltd.
We have audited the accompanying consolidated financial statements of Intermodal Finance I Ltd. , which comprise the consolidated balance sheets as of December 31, 2017 and 2016, and the related consolidated statements of operations, comprehensive loss, changes in members’ (deficit) equity and cash flows for the years then ended, and the related notes to the consolidated financial statements.
Management’s Responsibility for the Financial Statements
Management is responsible for the preparation and fair presentation of these financial statements in conformity with U.S. generally accepted accounting principles; this includes the design, implementation and maintenance of internal control relevant to the preparation and fair presentation of financial statements that are free of material misstatement, whether due to fraud or error.
Auditor’s Responsibility
Our responsibility is to express an opinion on these financial statements based on our audits. We conducted our audits in accordance with auditing standards generally accepted in the United States. Those standards require that we plan and perform the audit to obtain reasonable assurance about whether the financial statements are free of material misstatement.
An audit involves performing procedures to obtain audit evidence about the amounts and disclosures in the financial statements. The procedures selected depend on the auditor’s judgment, including the assessment of the risks of material misstatement of the financial statements, whether due to fraud or error. In making those risk assessments, the auditor considers internal control relevant to the entity’s preparation and fair presentation of the financial statements in order to design audit procedures that are appropriate in the circumstances, but not for the purpose of expressing an opinion on the effectiveness of the entity’s internal control. Accordingly, we express no such opinion. An audit also includes evaluating the appropriateness of accounting policies used and the reasonableness of significant accounting estimates made by management, as well as evaluating the overall presentation of the financial statements.
We believe that the audit evidence we have obtained is sufficient and appropriate to provide a basis for our audit opinion.
Opinion
In our opinion, the financial statements referred to above present fairly, in all material respects, the consolidated financial position of Intermodal Finance I Ltd. at December 31, 2017 and 2016, and the consolidated results of its operations and its cash flows for the years then ended in conformity with U.S. generally accepted accounting principles.
Supplementary Information
Our audits were conducted for the purpose of forming an opinion on the consolidated financial statements as a whole. The accompanying Other Financial Information is presented for purposes of additional analysis and is not a required part of the financial statements. Such information is the responsibility of management and was derived from and relates directly to the underlying accounting and other records used to prepare the financial statements. The consolidating information has been subjected to the auditing procedures applied in the audit of the consolidated financial statements and certain additional procedures, including comparing and reconciling such information directly to the underlying accounting and other records used to prepare the financial statements or to the financial statements themselves, and other additional procedures in accordance with auditing standards generally accepted in the United States. In our opinion, the information is fairly stated, in all material respects, in relation to the financial statements as a whole.
/s/Ernst & Young LLP
New York, New York
March 1, 2018
138
Report of Independent Auditors
To the Management of Intermodal Finance I Ltd:
We have audited the consolidated financial statements of Intermodal Finance I Ltd. and its subsidiaries, which comprise the consolidated statements of operations, comprehensive (loss) income, members’ equity and cash flows for the year ended December 31, 2015.
Management's Responsibility for the Consolidated Financial Statements
Management is responsible for the preparation and fair presentation of the consolidated financial statements in accordance with accounting principles generally accepted in the United States of America; this includes the design, implementation, and maintenance of internal control relevant to the preparation and fair presentation of consolidated financial statements that are free from material misstatement, whether due to fraud or error.
Auditor's Responsibility
Our responsibility is to express an opinion on the consolidated financial statements based on our audit. We conducted our audit in accordance with auditing standards generally accepted in the United States of America. Those standards require that we plan and perform the audit to obtain reasonable assurance about whether the consolidated financial statements are free from material misstatement.
An audit involves performing procedures to obtain audit evidence about the amounts and disclosures in the consolidated financial statements. The procedures selected depend on our judgment, including the assessment of the risks of material misstatement of the consolidated financial statements, whether due to fraud or error. In making those risk assessments, we consider internal control relevant to the Company's preparation and fair presentation of the consolidated financial statements in order to design audit procedures that are appropriate in the circumstances, but not for the purpose of expressing an opinion on the effectiveness of the Company's internal control. Accordingly, we express no such opinion. An audit also includes evaluating the appropriateness of accounting policies used and the reasonableness of significant accounting estimates made by management, as well as evaluating the overall presentation of the consolidated financial statements. We believe that the audit evidence we have obtained is sufficient and appropriate to provide a basis for our audit opinion.
Opinion
In our opinion, the consolidated financial statements referred to above present fairly, in all material respects, the results of their operations and their cash flows for the year ended December 31, 2015, in accordance with accounting principles generally accepted in the United States of America.
Other Matter
Our audit was conducted for the purpose of forming an opinion on the consolidated financial statements taken as a whole. The consolidating information contained in the Other Financial Information section is the responsibility of management and was derived from and relates directly to the underlying accounting and other records used to prepare the consolidated financial statements. The consolidating information has been subjected to the auditing procedures applied in the audit of the consolidated financial statements and certain additional procedures, including comparing and reconciling such information directly to the underlying accounting and other records used to prepare the consolidated financial statements or to the consolidated financial statements themselves and other additional procedures, in accordance with auditing standards generally accepted in the United States of America. In our opinion, the consolidating information is fairly stated, in all material respects, in relation to the consolidated financial statements taken as a whole. The consolidating information is presented for purposes of additional analysis of the consolidated financial statements rather than to present the financial position or results of operations of the individual companies and is not a required part of the consolidated financial statements. Accordingly, we do not express an opinion on the results of operations of the individual companies.
/s/ PricewaterhouseCoopers LLP
New York, New York
March 8, 2016, except for the change in presentation of debt issuance costs as discussed in Note 2 to the consolidated financial statements, as to which the date is February 24, 2017
INTERMODAL FINANCE I LTD.
CONSOLIDATED BALANCE SHEETS
(dollar amounts in thousands)
December 31, | |||||||
2017 | 2016 | ||||||
Assets | |||||||
Cash and cash equivalents | $ | 1,648 | $ | 4,249 | |||
Restricted cash | 765 | 1,121 | |||||
Accounts Receivable | 1,123 | 1,814 | |||||
Leasing assets, net of accumulated depreciation of $4,085 and $8,398, respectively | 6,037 | 19,007 | |||||
Finance Leases, net | 7,115 | 17,270 | |||||
Other assets | 8 | 9 | |||||
Total Assets | $ | 16,696 | $ | 43,470 | |||
Liabilities and Deficit | |||||||
Accounts payable and accrued liabilities | $ | 35 | $ | 46 | |||
Management fees payable | 214 | 145 | |||||
Accrued interest payable | 346 | 12 | |||||
Accrued interest payable to affiliates | 332 | 310 | |||||
Term loan payable, net | 7,092 | 32,485 | |||||
Loans payable to affiliates | 18,080 | 18,080 | |||||
Syndication liabilities | — | 1,207 | |||||
Other liabilities | 199 | 417 | |||||
Total liabilities | 26,298 | 52,702 | |||||
Members’ deficit | (9,602 | ) | (9,232 | ) | |||
Total liabilities and members’ deficit | $ | 16,696 | $ | 43,470 | |||
See accompanying notes to consolidated financial statements.
140
INTERMODAL FINANCE I LTD.
CONSOLIDATED STATEMENTS OF OPERATIONS
(dollar amounts in thousands)
Year Ended December 31, | |||||||||||
2017 | 2016 | 2015 | |||||||||
Revenues | |||||||||||
Equipment leasing revenue | $ | 2,291 | $ | 7,506 | $ | 11,877 | |||||
Finance revenue | 1,058 | 2,210 | 4,145 | ||||||||
Total revenues | 3,349 | 9,716 | 16,022 | ||||||||
Expenses | |||||||||||
Direct operating expenses | 3,080 | 1,780 | 301 | ||||||||
Management fee | 1,022 | 1,225 | 992 | ||||||||
Depreciation and amortization | 1,763 | 5,815 | 3,659 | ||||||||
Interest expense | 899 | 2,227 | 3,077 | ||||||||
Interest expense-affiliates | 362 | 368 | 411 | ||||||||
Impairment expense | — | 6,016 | 20,604 | ||||||||
General and administrative expense | 260 | 233 | 509 | ||||||||
Bad debt expense | — | 105 | — | ||||||||
Total expenses | 7,386 | 17,769 | 29,553 | ||||||||
Other income (loss) | |||||||||||
Other income | 925 | 1,197 | 247 | ||||||||
Gain (Loss) on disposal of equipment | 2,742 | (5,225 | ) | (766 | ) | ||||||
Total other income (loss) | 3,667 | (4,028 | ) | (519 | ) | ||||||
Net loss | $ | (370 | ) | $ | (12,081 | ) | $ | (14,050 | ) | ||
See accompanying notes to consolidated financial statements.
141
INTERMODAL FINANCE I LTD.
CONSOLIDATED STATEMENTS OF COMPREHENSIVE LOSS
(dollar amounts in thousands)
Year Ended December 31, | |||||||||||
2017 | 2016 | 2015 | |||||||||
Net loss | $ | (370 | ) | $ | (12,081 | ) | $ | (14,050 | ) | ||
Other comprehensive income | — | — | — | ||||||||
Comprehensive loss | $ | (370 | ) | $ | (12,081 | ) | $ | (14,050 | ) | ||
See accompanying notes to consolidated financial statements.
142
INTERMODAL FINANCE I LTD.
CONSOLIDATED STATEMENTS OF CASH FLOWS
(dollar amounts in thousands)
Year Ended December 31, | |||||||||||
2017 | 2016 | 2015 | |||||||||
Cash flow from operating activities: | |||||||||||
Net loss | $ | (370 | ) | $ | (12,081 | ) | $ | (14,050 | ) | ||
Adjustments to reconcile net income to net cash provided by operating activities: | |||||||||||
Depreciation and amortization | 1,763 | 6,093 | 3,936 | ||||||||
(Gain) Loss on disposal of equipment | (2,742 | ) | 5,225 | 766 | |||||||
Impairment of equipment held for lease | — | 6,016 | 20,604 | ||||||||
Bad debt expense | — | 105 | — | ||||||||
Change in: | |||||||||||
Accounts receivable | 333 | 221 | (102 | ) | |||||||
Other assets | 538 | (177 | ) | (23 | ) | ||||||
Accounts payable and accrued liabilities | (11 | ) | (14 | ) | 16 | ||||||
Accrued interest payable | 356 | 309 | (7 | ) | |||||||
Management fees payable | 69 | 65 | (12 | ) | |||||||
Other liabilities | (218 | ) | (41 | ) | 75 | ||||||
Net cash (used in) provided by operating activities | (282 | ) | 5,721 | 11,203 | |||||||
Cash flows from investing activities: | |||||||||||
Principal collections on direct finance leases | 10,155 | 16,886 | 28,132 | ||||||||
Proceeds from disposal of equipment | 14,047 | 11,051 | 1,499 | ||||||||
Restricted cash | 356 | 996 | 203 | ||||||||
Net cash provided by investing activities | 24,558 | 28,933 | 29,834 | ||||||||
Cash used in financing activities: | |||||||||||
Principal repayments on term loan | (25,655 | ) | (32,360 | ) | (32,163 | ) | |||||
Principal repayments on loans payable to affiliates | — | (407 | ) | (4,089 | ) | ||||||
Principal repayments on syndication liabilities | (1,207 | ) | (1,994 | ) | (1,951 | ) | |||||
Deferred financing fee | (15 | ) | — | (31 | ) | ||||||
Capital distributions | — | (440 | ) | (3,221 | ) | ||||||
Net cash used in financing activities | (26,877 | ) | (35,201 | ) | (41,455 | ) | |||||
Net decrease in cash and cash equivalents | (2,601 | ) | (547 | ) | (418 | ) | |||||
Cash and cash equivalents, beginning of year | 4,249 | 4,796 | 5,214 | ||||||||
Cash and cash equivalents, end of year | $ | 1,648 | $ | 4,249 | $ | 4,796 | |||||
Supplemental disclosure: | |||||||||||
Cash paid for interest | $ | 627 | $ | 2,009 | $ | 3,217 | |||||
See accompanying notes to consolidated financial statements.
143
INTERMODAL FINANCE I LTD.
CONSOLIDATED STATEMENTS OF CHANGES IN MEMBERS’ (DEFICIT) EQUITY
(dollar amounts in thousands)
WWTAI Container HoldCo Ltd | Deutsche Bank AG | Total | |||||||||
Members’ Equity at December 31, 2015 | $ | 1,247 | $ | 2,042 | $ | 3,289 | |||||
Capital distributions | (225 | ) | (215 | ) | (440 | ) | |||||
Comprehensive loss: | |||||||||||
Net loss for the period | (6,161 | ) | (5,920 | ) | (12,081 | ) | |||||
Other comprehensive income | — | — | — | ||||||||
Total comprehensive loss | (6,161 | ) | (5,920 | ) | (12,081 | ) | |||||
Members’ Deficit at December 31, 2016 | $ | (5,139 | ) | $ | (4,093 | ) | $ | (9,232 | ) | ||
Capital distributions | — | — | — | ||||||||
Comprehensive loss: | |||||||||||
Net loss for the period | (189 | ) | (181 | ) | (370 | ) | |||||
Other comprehensive income | — | — | — | ||||||||
Total comprehensive loss | (189 | ) | (181 | ) | (370 | ) | |||||
Members’ Deficit at December 31, 2017 | $ | (5,328 | ) | $ | (4,274 | ) | $ | (9,602 | ) | ||
See accompanying notes to consolidated financial statements.
144
1. | ORGANIZATION |
Intermodal Finance I Ltd. (“Intermodal Finance”) is a Cayman Islands limited liability company which was formed on August 21, 2012 for the object and purpose of, directly or indirectly, investing in portfolios of shipping containers subject to operating leases or direct financing leases, and engaging in all activities incidental hereto.
The members of Intermodal Finance are WWTAI Container HoldCo Ltd., with a 51% interest, and Deutsche Bank AG, Cayman Islands Branch, with a 49% interest. Intermodal Finance shall continue in existence until such time as its members determine upon its winding up and dissolution. Intermodal Finance commenced operations on September 5, 2012.
2. | SUMMARY OF SIGNIFICANT ACCOUNTING POLICIES |
Basis of Accounting—The accompanying consolidated financial statements are prepared in accordance with U.S. generally accepted accounting principles (“GAAP”) and include the accounts of Intermodal Finance and its subsidiaries. Intermodal Finance consolidates those entities which it has an investment of 50% or more and in which it has control over significant operating decisions, as well as variable interest entities in which Intermodal Finance is the primary beneficiary. All significant intercompany transactions and balances have been eliminated.
Intermodal Finance holds a variable interest in WWTAI Container 1 Ltd (“Container 1”), an entity which holds an investment in four direct finance leases, and has determined that it is the primary beneficiary of Container 1. Accordingly, Intermodal Finance consolidates Container 1 (collectively, the “Company”).
Use of Estimates—The preparation of financial statements in conformity with GAAP requires management to make estimates and assumptions that affect the reported amounts of assets and liabilities, the disclosure of contingent assets and liabilities at the date of the consolidated financial statements and the reported amounts of revenues and expenses during the reporting period. Actual results could differ from those estimates.
Risks and Uncertainties—In the normal course of business, the Company may encounter two significant types of economic risk: credit risk and market risk. Credit risk is the risk of default on leases, loans, securities or derivatives, as applicable, which results from the inability or unwillingness of a lessee, borrower, or derivative counterparty to make required or expected payments. Market risk reflects changes in the value of leasing assets (including residual value estimates), loans, securities or derivatives, as applicable, due to changes in interest rates or other market factors, including the value of the collateral underlying loans and the valuation of equity and debt securities. The Company conducts operations outside of the United States; such international operations are subject to risks, such as unexpected changes in regulatory requirements, heightened risk of political and economic instability, potentially adverse tax consequences and the burden of complying with foreign laws.
Cash and Cash Equivalents—The Company considers all highly liquid short-term investments with a maturity of 90 days or less when purchased to be cash equivalents. Substantially all of the Company’s amounts on deposit with major financial institutions exceed insured limits.
Restricted Cash—Restricted cash consists of cash held in segregated accounts pursuant to the requirements of the Company’s Term Loan agreement (Note 4).
Deferred Costs and Amortization—Deferred financing costs incurred in connection with the Term Loan are amortized over the seven year term of the underlying loan. Amortization expense for the years ended December 31, 2017, 2016 and 2015 was approximately $278, $278 and $277, respectively.
Deferred costs also include a commission paid to a third party in connection with the acquisition and leaseback of a portfolio of shipping containers. This commission is being amortized using the straight line method over the term of the underlying lease. Amortization expense for the years ended December 31, 2017, 2016 and 2015 was approximately $0, $63 and $217, respectively.
Direct Finance Leases—Direct finance leases are recorded at the aggregated future minimum lease payments, including any bargain or economically compelled purchase options granted to the customer, less unearned income.
Leasing Equipment—Shipping containers held for lease are stated at initial cost and are depreciated on a straight-line basis to an estimated residual value over a 15 year useful life from date of manufacture. The shipping containers owned by the Company are being depreciated over remaining useful lives of 6 months. Depreciation expense for the years ended December 31, 2017, 2016 and 2015 was approximately $1,485, $5,752 and $3,442, respectively.
The Company recognizes repair and maintenance costs that do not extend the lives of the assets as incurred and includes them as a component of direct operating expenses in the consolidated statement of operations.
The Company performs a recoverability assessment of shipping container portfolios at least annually. In addition, a recoverability assessment is performed whenever events or changes in circumstances, or indicators, indicate that the carrying amount or net book value of an asset may not be recoverable. Indicators may include, but are not limited to, a decline in demand for the types of equipment owned by the Company, or other indicators of obsolescence. When performing a recoverability assessment, the Company measures whether the estimated future undiscounted net cash flows expected to be generated by the equipment exceed its net book value. The undiscounted cash flows consist of cash flows from
145
currently contracted leases, future projected lease rates, transition costs, estimated down time and estimated residual or scrap values for the equipment. In the event that the equipment does not meet the recoverability test, the carrying value of the equipment will be adjusted to fair value resulting in an impairment charge.
Management of the Company develops the assumptions used in the recoverability analysis based on its knowledge of active lease contracts, current and future expectations of the global demand for a particular container type and historical experience in the container leasing market, as well as information received from third party industry sources. The factors considered in estimating the undiscounted cash flows are impacted by changes in future periods due to changes in contracted lease rates, residual values, economic conditions, technology, demand for a particular container type and other factors. In the event that the portfolio does not meet the recoverability test, the carrying value will be adjusted to fair value based on a discounted cash flow analysis, resulting in an impairment charge.
On December 31, 2016 and September 30, 2015, Intermodal Finance I, Ltd. recorded an impairment charge of $6,016 and $20,604, respectively, which resulted from certain operating leases not being renewed and containers being returned at a faster pace than expected. Additionally, due to challenging market conditions for shipping containers, a limited number of the returned containers were sold at values lower than previously estimated. There was no impairment recorded for the year ended December 31, 2017.
Revenue Recognition—The Company leases shipping containers pursuant to operating leases. Operating leases with fixed rentals and step rentals are recognized on a straight-line basis over the term of the initial lease, assuming no renewals.
The Company determines the provision for doubtful accounts based on its assessment of the collectability of its receivables on a customer-by-customer basis and places a likelihood of default percentage on each delinquent account individually. Changes in economic conditions may require a re-assessment of the risk and could result in increases or decreases in the allowance for doubtful accounts. At December 31, 2017, 2016 and 2015, there were no provisions for doubtful accounts on the Company’s accounts receivable.
The Company also holds a portfolio of direct finance lease receivables. In most instances, the leases include a bargain purchase option to purchase the leased equipment at the end of the lease term. Net investment in direct finance leases represents the receivables due from lessees, net of unearned income. The lease payments are segregated into principal and interest components similar to a loan. Unearned income is recognized on an effective interest method over the life of the lease term and is recorded as finance revenue in the consolidated statement of operations. The principal component of the lease payment is reflected as a reduction to the net investment in direct finance leases.
Expense Recognition—The Company recognizes expenses as incurred on an accrual basis.
Comprehensive Income (Loss)—Comprehensive income (loss) consists of net income and other gains and losses, net of tax, if any, affecting shareholders’ equity that, under GAAP, are excluded from net income. Such amounts include the changes in the fair value of derivative instruments, reclassification into the earnings of amounts previously deferred relating to the derivative instruments and foreign currency translation gains and losses. For the years ended December 31, 2017, 2016 and 2015, there were no differences between the Company’s comprehensive income and the net income as presented in the consolidated statement of operations.
Foreign Currency—The Company’s functional and reporting currency is the U.S. dollar. Purchases and sales of assets and income and expense items denominated in foreign currencies are translated into U.S. dollar amounts on the respective dates of such transactions. Differences between these recorded amounts and the U.S. dollar equivalent actually received or paid are reported as net realized foreign currency gains or losses.
Federal Income Taxes—No income taxes have been provided for in these consolidated financial statements as each investor in the Company is individually responsible for reporting income or loss based upon its respective share of the Company’s income and expenses as reported for income tax purposes.
There are no uncertain tax positions that would require recognition in the consolidated financial statements. The Company files income tax returns in the U.S. federal jurisdiction and various state jurisdictions. The income tax returns filed by the Company are subject to examination by the U.S. Federal and state tax authorities.
Distributions and Allocations to Members—Distributions to members are recorded when paid or, in the case of an in-kind distribution, when distributed. The character of distributions made during the reporting period may differ from their ultimate characterization for federal income tax purposes due to book/tax differences in the character of income and expense recognition. Distributions and allocations are determined with respect to each member, as defined by and in accordance with the operating agreement.
Concentration of Credit Risk—The Company is subject to concentrations of credit risk with respect to amounts due from customers on its direct finance leases and operating leases. The Company attempts to limit its credit risk by performing ongoing credit evaluations. The Company’s three largest customers represented approximately 23%, 8% (direct finance lease customers) and 68% (operating lease customer) of revenues for the year ended December 31, 2017; 17%, 3% (direct finance lease customers) and 77% (operating lease customer) of revenues for the year ended December 31, 2016; and 15%, 4% (direct finance lease customers) and 74% (operating lease customer) of revenues for the year ended
146
December 31, 2015.
Based on the in-place operating lease contract at December 31, 2017, 2016; and 2015, the maximum amount of loss the Company would incur if the operating lease customer failed completely to perform according to the terms of the lease would be approximately $176, $2,545 and $8,431 million, respectively. As it relates to the Company’s direct finance lease portfolio, the three largest customers account for approximately 58%, 39%, and 25%, 70%, 22% and 5% and 68%, 14% and 11%, of the outstanding principal at December 31, 2017, 2016; and 2015, respectively. If any of these customers were to default, the Company would seek to recover the equipment securing the lease, with a view towards either selling or re-leasing the equipment. To date, the Company has not experienced any losses related to direct finance leases and does not expect future uncollectible amounts related to the principal balances receivable.
Deterioration in credit quality of several of the Company’s major customers could have an adverse effect on its consolidated financial position and operating results. Management does not believe significant risk exists in connection with the Company’s concentrations of credit as of December 31, 2017, 2016; and 2015.
Recent Accounting Pronouncements—In August 2015, the FASB issued ASU 2015-15, Interest - Imputation of Interest (Subtopic 835-30): Presentation and Subsequent Measurement of Debt Issuance Costs Associated With Line-Of-Credit Arrangements (“ASU 2015-15”). ASU 2015-15 provides further guidance related to the presentation or subsequent measurement of debt issuance costs related to term loan arrangements. ASU 2015-15 allows companies to defer and present debt issuance costs as an asset or as a direct deduction from the carrying amount of that debt liability and subsequently amortize the deferred debt issuance costs ratably over the term of the term loan arrangement, regardless of whether there are any outstanding borrowings of the term loan arrangement. The guidance is effective for reporting periods beginning after December 15, 2015 and interim periods within those fiscal years with early adoption permitted. The Company has adopted ASU 2015-15 as of January 1, 2016 and revised its consolidated balance sheets to present debt issuance costs related to debt drawn under a term loan arrangements as a direct deduction from debt rather than within other assets, for all periods presented.
Unadopted Accounting Pronouncements—The FASB has recently issued or discussed a number of proposed standards on such topics as financial instruments and hedging. Some of the proposed changes are significant and could have a material impact on the Company’s financial reporting. The Company has not yet fully evaluated the potential impact of these proposals, but will make such an evaluation as the standards are finalized.
In May 2014, the FASB issued ASU 2014-09, Revenue from Contracts with Customers (Topic 606) (“ASU-2014-09”) which provides a single comprehensive model for recognizing revenue from contracts with customers and supersedes existing revenue recognition guidance. The new standard requires that a company recognize revenue when it transfers promised goods or services to customers in an amount that reflects the consideration the company expects to receive in exchange for those goods or services. Companies will need to use more judgment and estimates than under the guidance currently in effect, including estimating the amount of variable revenue to recognize over each identified performance obligation. Additional disclosures will be required to help users of financial statements understand the nature, amount and timing of revenue and cash flows arising from contracts. In August 2015, the FASB issued ASU 2015-14, Revenue from Contracts with Customers (Topic 606): Deferral of the Effective Date, to defer the effective date of ASU 2014-09 by one year, making it effective for annual reporting periods beginning after December 15, 2018 while also providing for early adoption but not before the original effective date. The Company’s evaluation of the impact of the new guidance on its consolidated financial statements is ongoing. As the Company’s primary source of revenues is from its leasing contracts, subject to ASU 2016-02, Leases, management has concluded that the adoption of this ASU will not result in a material impact on its consolidated financial statements.
In January 2016, the FASB issued ASU 2016-01, Financial Instruments-Overall (Subtopic 825-10): Recognition and Measurement of Financial Assets and Financial Liabilities ("ASU 2016-01"). ASU 2016-01 requires (i) equity investments, except those accounted for under the equity method of accounting or those that result in consolidation of the investee, to be measured at fair value with changes in fair value recognized in net income, (ii) public business entities to use the exit price notion when measuring the fair value of financial instruments for disclosure purposes, and (iii) separate presentation of financial assets and financial liabilities by measurement category and form of financial asset. ASU 2016-01 also eliminates the requirement for public business entities to disclose the method(s) and significant assumptions used to estimate the fair value that is required to be disclosed for financial instruments measured at amortized cost. The pronouncement is effective for fiscal years, and interim periods within those years, beginning after December 15, 2017, with early adoption permitted. The Company is currently evaluating the impact of adopting this new guidance on its consolidated financial statements.
In February 2016, the FASB issued ASU 2016-02, Leases (“ASU 2016-02”). ASU 2016-02 amends the existing accounting standards for lease accounting, including requiring lessees to recognize most leases on their balance sheets and making targeted changes to lessor accounting. ASU 2016-02 will be effective beginning in the first quarter of 2019, with early adoption permitted. ASU 2016-02 requires a modified retrospective transition approach for all leases existing at, or entered into after, the date of initial application, with an option to use certain transition relief. The Company is currently evaluating the impact of adopting this new guidance on its consolidated financial statements.
147
3. | SHIPPING CONTAINER PORTFOLIOS |
The components of the Company’s net investment in direct financing leases are comprised as follows:
December 31, | ||||||||
2017 | 2016 | |||||||
Minimum lease payments | $ | 7,529 | $ | 18,744 | ||||
Less: Unearned income | (414 | ) | (1,474 | ) | ||||
Net investment in direct finance leases | $ | 7,115 | $ | 17,270 | ||||
At December 31, 2017, future minimum lease payments to be received under direct finance leases are as follows:
Year Ending December 31, | Amount | |||
2018 | $ | 5,897 | ||
2019 | 1,632 | |||
Total | $ | 7,529 | ||
Operating Lease Portfolio-As of December 31, 2017 and 2016 all operating leases had expired, and the assets continue to earn per diems until the point at which they are returned.
4. DEBT
Term Loan Payable
On September 5, 2012, the Company entered in to a Term Loan Agreement (the “Term Loan”) with Deutsche Bank AG, Cayman Islands Branch (the “Lender”) for an initial aggregate amount of $125,000 in connection with the acquisition of a portfolio of shipping containers subject to direct finance leases. On December 17, 2012 the Term Loan was amended to provide for an additional borrowing of $53,000 which was used in connection with the acquisition of a portfolio of shipping containers subject to operating leases. Borrowings under the Term Loan bear interest at either (i) LIBOR plus 3% or (ii) a Base Rate (equal to the higher of the Prime Rate or the Federal Funds Rate, plus 0.50%) plus a spread of 0.25%. In addition, an administrative agent fee calculated at a rate of 0.50% per annum is also payable. In April 2013, the administrative agent fee rate was reduced to 0.25%. In October 2014, the LIBOR spread was reduced to 2.75%. All borrowings under the Term Loan as of December 31, 2017 and 2016 were LIBOR based borrowings and the interest rate at December 31, 2017 and 2016 was approximately 4.07% and 3.33%, respectively (exclusive of the administrative agent fee). The Term Loan is secured by the Company’s interest in the shipping containers and related direct finance leases and operating lease agreements. Interest expense on the Term Loan for years ended December 31, 2017, 2016 and 2015 was $736, $1,643 and $2,459, respectively, exclusive of administrative agent fees of $50, $128 and $210, respectively.
Pursuant to the Term Loan agreement, amounts realized by the Company from its operations during each Collection Period, as defined, are accumulated as restricted cash in a Collection Account for disbursement according to payment priorities specified in the Term Loan agreement. Payments of principal and interest on the Term Loans will be made solely to the extent there are funds available and will be paid in accordance with the priorities specified in the Term Loan agreement. Residual amounts remaining in the Collection Account after payment of required obligations are released to the Company. During the years ended December 31, 2017 and 2016, repayments under the Term Loan totaled $25,655 and $32,360, respectively, further repayments are dependent solely on the cash available subject to the priority of payments.
Class B Term Loan Payable to Affiliates
On September 5, 2012, the Company entered in to a Class B Term Loan Agreement (the "Class B Loan”) with its members, pursuant to which it borrowed an initial aggregate amount of $25,000 in connection with the acquisition of a portfolio of shipping containers subject to direct finance leases. On December 17, 2012 the Class B Loan was amended to provide for an additional borrowing of approximately $15,100 which was used in connection with the acquisition of a portfolio of shipping containers subject to operating leases. Borrowings under the Class B Loan are unsecured and bear interest at a rate of 2%. Interest expense on the Class B Loan for the years ended December 31, 2017, 2016 and 2015 was approximately $362, $368 and $411, respectively. Payments of principal and interest on the Class B Loan will be made solely to the extent there are sufficient funds available after satisfaction of senior payment priorities as delineated in the Term Loan agreement. During the year ended December 31, 2017, repayments under the Class B Loan totaled $0, further repayments are dependent solely on the cash available after the satisfaction of the senior payments.
5. | SYNDICATION LIABILITIES |
In connection with the acquisition of the DFL’s in September 2012, the Company assumed syndication liabilities to third parties relating to four of the acquired DFL contracts. At acquisition, the syndication liabilities had remaining terms equal to the remaining terms of the associated DFL contracts, which ranged from 28 months to 42 months. The acquisition date
148
fair value ascribed to these obligations was approximately $19,500. Interest on the syndication liabilities is recognized using the effective interest method at rates which range from 2.30% to 4.44%. Interest expense recognized on the syndication liabilities amounted to approximately $164, $305 and $342 during the years ended December 31, 2017, 2016 and 2015. The obligations pursuant to these arrangements are non-recourse to the Company and the sole source of payment for these obligations is the cash flows generated from the underlying DFL contracts. During the year ended December 31, 2017, the syndication liabilities were paid off.
6. | MANAGEMENT AGREEMENT |
The Company has engaged Container Leasing International LLC (the “Manager”) to manage and administer its DFL portfolio pursuant to a management agreement having an initial term of 10 years and providing for three additional extension terms of one-year each. Pursuant to the management agreement, the Manager receives (i) a base monthly fee equal to 1.5% of payments received on the DFL contracts and is entitled to receive additional fees, as applicable, equal to (a) 5% of the sum of net sales proceeds and casualty proceeds for containers which have been sold or lost and (b) a recovery fee of 25 dollars for each container recovered by the Manager following the occurrence of a lessee default under a DFL contract and (ii) a base monthly fee equal to (a) 4% of the Net Operating Income, as defined, of the containers subject to operating leases and an additional fee of 5% of the net sales proceeds from the sale or disposal of containers subject to operating leases.
149
7. | FAIR VALUE OF FINANCIAL INSTRUMENTS |
In assessing the fair value of financial instruments, the Company applies the provisions included in ASC 820 “Fair Value Measurements and Disclosures.” ASC 820 provides that fair value is a market-based measurement, not an entity-specific measurement. It further clarifies that fair value is an exit price, representing the price that would be received to sell an asset or paid to transfer a liability in the principal or most advantageous market in an orderly transaction between market participants on the measurement date. ASC 820 requires the use of valuation techniques to measure fair value that maximize the use of observable inputs and minimize use of unobservable inputs. These inputs are prioritized as follows:
•Level 1: Observable inputs such as quoted prices in active markets for identical assets or liabilities.
• | Level 2: Inputs other than quoted prices included within Level 1 that are observable for the asset or liability, either directly or indirectly. Level 2 inputs include quoted prices for similar assets or liabilities in active markets and inputs other than quoted prices that are observable for the asset or liability, such as interest rates and yield curves that are observable at commonly quoted intervals. |
• | Level 3: Unobservable inputs for which there is little or no market data and which require internal development of assumptions about how market participants price the asset or liability. |
The Company’s financial instruments consist principally of cash and cash equivalents, restricted cash, accounts receivable, accounts payable and accrued liabilities, term loan payable and syndication liabilities. The fair value of cash and cash equivalents, restricted cash, accounts receivable and accounts payable and accrued liabilities approximates their carrying values because of their short term nature.
The fair value of the term loan payable is based on inputs classified as Level 2 in the fair value hierarchy and approximates its carrying value because such loan bears interest at a floating market rate for similar types of loans.
8. | SUBSEQUENT EVENTS |
The Company has evaluated whether any material events have occurred subsequent to the balance sheet date through March 1, 2018 the date the consolidated financial statements were available to be issued.
150
OTHER FINANCIAL INFORMATION
151
Intermodal Finance I Ltd.
Consolidating Balance Sheet
(dollar amounts in thousands)
December 31, 2017
Intermodal Finance I Ltd | WWTAI Container I Ltd | Eliminations | Consolidated Intermodal Finance I Ltd | |||||||||||||
ASSETS | ||||||||||||||||
Cash and cash equivalents | $ | 2 | $ | 1,646 | $ | — | $ | 1,648 | ||||||||
Restricted cash | 765 | — | — | 765 | ||||||||||||
Accounts receivable | 1,123 | — | — | 1,123 | ||||||||||||
Leasing equipment, net of accumulated depreciation of $4,085 | 6,037 | — | — | 6,037 | ||||||||||||
Net investment in direct finance leases | 3,097 | 4,018 | — | 7,115 | ||||||||||||
Other assets | 8 | — | — | 8 | ||||||||||||
Due from affiliates | 5,465 | — | (5,465 | ) | — | |||||||||||
Total assets | $ | 16,497 | $ | 5,664 | $ | (5,465 | ) | $ | 16,696 | |||||||
LIABILITIES | ||||||||||||||||
Accounts payable and accrued liabilities | $ | 35 | $ | — | $ | — | $ | 35 | ||||||||
Management fees payable | 214 | — | — | 214 | ||||||||||||
Accrued interest payable | 346 | — | — | 346 | ||||||||||||
Accrued interest payable to affiliates | 332 | — | — | 332 | ||||||||||||
Term loan payable | 7,092 | — | — | 7,092 | ||||||||||||
Loans payable to affiliates | 18,080 | — | — | 18,080 | ||||||||||||
Other liabilities | — | 199 | — | 199 | ||||||||||||
Due to affiliate | — | 5,465 | (5,465 | ) | — | |||||||||||
Total liabilities | 26,099 | 5,664 | (5,465 | ) | 26,298 | |||||||||||
Members’ deficit | (9,602 | ) | — | — | (9,602 | ) | ||||||||||
Total liabilities and members’ equity | $ | 16,497 | $ | 5,664 | $ | (5,465 | ) | $ | 16,696 | |||||||
152
Intermodal Finance I Ltd.
Consolidating Balance Sheet
(dollar amounts in thousands)
December 31, 2016
Intermodal Finance I Ltd | WWTAI Container I Ltd | Eliminations | Consolidated Intermodal Finance I Ltd | ||||||||||||
ASSETS | |||||||||||||||
Cash and cash equivalents | $ | 985 | $ | 3,264 | $ | — | $ | 4,249 | |||||||
Restricted cash | 1,121 | — | — | 1,121 | |||||||||||
Accounts receivable | 1,814 | — | — | 1,814 | |||||||||||
Leasing equipment, net of accumulated depreciation of $7,305 | 19,007 | — | — | 19,007 | |||||||||||
Net investment in direct finance leases | 5,245 | 12,025 | — | 17,270 | |||||||||||
Other assets | 9 | — | — | 9 | |||||||||||
Due from affiliates | 13,665 | — | (13,665 | ) | — | ||||||||||
Total assets | $ | 41,846 | $ | 15,289 | $ | (13,665 | ) | $ | 43,470 | ||||||
LIABILITIES | |||||||||||||||
Accounts payable and accrued liabilities | $ | 46 | $ | — | $ | — | $ | 46 | |||||||
Management fees payable | 145 | — | — | 145 | |||||||||||
Accrued interest payable | 12 | — | — | 12 | |||||||||||
Accrued interest payable to affiliates | 310 | — | — | 310 | |||||||||||
Term loan payable | 32,485 | — | — | 32,485 | |||||||||||
Loans payable to affiliates | 18,080 | — | — | 18,080 | |||||||||||
Syndication liabilities | — | 1,207 | — | 1,207 | |||||||||||
Other liabilities | — | 417 | — | 417 | |||||||||||
Due to affiliate | — | 13,665 | (13,665 | ) | — | ||||||||||
Total liabilities | 51,078 | 15,289 | (13,665 | ) | 52,702 | ||||||||||
Members’ equity | (9,232 | ) | — | — | (9,232 | ) | |||||||||
Total liabilities and members’ equity | $ | 41,846 | $ | 15,289 | $ | (13,665 | ) | $ | 43,470 | ||||||
153
Intermodal Finance I Ltd.
Consolidating Statement of Operations
(dollar amounts in thousands)
Year Ended December 31, 2017
Intermodal Finance I Ltd | WWTAI Container I Ltd | Eliminations | Consolidated Intermodal Finance I Ltd | |||||||||||||
REVENUES | ||||||||||||||||
Equipment leasing revenue | $ | 2,291 | $ | — | $ | — | $ | 2,291 | ||||||||
Finance revenue | 780 | 278 | — | 1,058 | ||||||||||||
Participation income-affiliate | 110 | — | (110 | ) | — | |||||||||||
Total revenues | 3,181 | 278 | (110 | ) | 3,349 | |||||||||||
EXPENSES | ||||||||||||||||
Direct operating expenses | 3,076 | 4 | — | 3,080 | ||||||||||||
Management fee | 1,022 | — | — | 1,022 | ||||||||||||
Depreciation and amortization | 1,485 | — | — | 1,485 | ||||||||||||
Interest expense | 1,013 | 164 | — | 1,177 | ||||||||||||
Interest expense-affiliates | 362 | — | — | 362 | ||||||||||||
General and administrative expense | 260 | — | — | 260 | ||||||||||||
Participation expense-affiliate | — | 110 | (110 | ) | — | |||||||||||
Total expenses | 7,218 | 278 | (110 | ) | 7,386 | |||||||||||
OTHER INCOME | ||||||||||||||||
Other income | 925 | — | — | 925 | ||||||||||||
Gain on disposal of equipment | 2,742 | — | — | 2,742 | ||||||||||||
Total other income | 3,667 | — | — | 3,667 | ||||||||||||
NET LOSS | $ | (370 | ) | $ | — | $ | — | $ | (370 | ) | ||||||
154
Intermodal Finance I Ltd.
Consolidating Statement of Operations
(dollar amounts in thousands)
Year Ended December 31, 2016
Intermodal Finance I Ltd | WWTAI Container I Ltd | Eliminations | Consolidated Intermodal Finance I Ltd | |||||||||||||
REVENUES | ||||||||||||||||
Equipment leasing revenue | $ | 7,506 | $ | — | $ | — | $ | 7,506 | ||||||||
Finance revenue | 602 | 1,608 | — | 2,210 | ||||||||||||
Participation income-affiliate | 1,109 | — | (1,109 | ) | — | |||||||||||
Total revenues | 9,217 | 1,608 | (1,109 | ) | 9,716 | |||||||||||
EXPENSES | ||||||||||||||||
Direct operating expenses | 1,691 | 89 | — | 1,780 | ||||||||||||
Management fee | 1,225 | — | — | 1,225 | ||||||||||||
Depreciation and amortization | 5,815 | — | — | 5,815 | ||||||||||||
Interest expense | 1,922 | 305 | — | 2,227 | ||||||||||||
Interest expense-affiliates | 368 | — | — | 368 | ||||||||||||
General and administrative expense | 233 | — | — | 233 | ||||||||||||
Impairment expense | 6,016 | — | — | 6,016 | ||||||||||||
Participation expense-affiliate | — | 1,109 | (1,109 | ) | — | |||||||||||
Bad debt expense | — | 105 | — | 105 | ||||||||||||
Total expenses | 17,270 | 1,608 | (1,109 | ) | 17,769 | |||||||||||
OTHER LOSS | ||||||||||||||||
Other income | 1,197 | — | — | 1,197 | ||||||||||||
Loss on disposal of equipment | (5,225 | ) | — | — | (5,225 | ) | ||||||||||
Total other loss | (4,028 | ) | — | — | (4,028 | ) | ||||||||||
NET LOSS | $ | (12,081 | ) | $ | — | $ | — | $ | (12,081 | ) | ||||||
155
Intermodal Finance I Ltd.
Consolidating Statement of Operations
(dollar amounts in thousands)
Year Ended December 31, 2015
Intermodal Finance I Ltd | WWTAI Container I Ltd | Eliminations | Consolidated Intermodal Finance I Ltd | |||||||||||||
REVENUES | ||||||||||||||||
Equipment leasing revenue | $ | 11,877 | $ | — | $ | — | $ | 11,877 | ||||||||
Finance revenue | 1,490 | 2,655 | — | 4,145 | ||||||||||||
Participation income-affiliate | 2,080 | — | (2,080 | ) | — | |||||||||||
Total revenues | 15,447 | 2,655 | (2,080 | ) | 16,022 | |||||||||||
EXPENSES | ||||||||||||||||
Direct operating expenses | 106 | 195 | — | 301 | ||||||||||||
Management fee | 992 | — | — | 992 | ||||||||||||
Depreciation and amortization | 3,659 | — | — | 3,659 | ||||||||||||
Interest expense | 2,735 | 342 | — | 3,077 | ||||||||||||
Interest expense-affiliates | 411 | — | — | 411 | ||||||||||||
General and administrative expense | 471 | 38 | — | 509 | ||||||||||||
Impairment expense | 20,604 | — | — | 20,604 | ||||||||||||
Participation expense-affiliate | — | 2,080 | (2,080 | ) | — | |||||||||||
Total expenses | 28,978 | 2,655 | (2,080 | ) | 29,553 | |||||||||||
OTHER LOSS | ||||||||||||||||
Other income | 247 | — | — | 247 | ||||||||||||
Loss on disposal of equipment | (766 | ) | — | — | (766 | ) | ||||||||||
Total other loss | (519 | ) | — | — | (519 | ) | ||||||||||
NET LOSS | $ | (14,050 | ) | $ | — | $ | — | $ | (14,050 | ) | ||||||
156
Item 9. Changes in and Disagreements with Accountants on Accounting and Financial Disclosure
None.
Item 9A. Controls and Procedures
Disclosure Controls and Procedures
As of the end of the period covered by this report, an evaluation was carried out under the supervision and with the participation of the Company’s management, including its Chief Executive Officer and Chief Financial Officer, of the effectiveness of its disclosure controls and procedures (as defined in Rule 13a-15(e) under the Securities Exchange Act of 1934 (the “Exchange Act”)). Based upon that evaluation, the Company’s Chief Executive Officer and Chief Financial Officer have concluded that these disclosure controls and procedures were not effective due to the existence of a material weakness in our internal control over financial reporting described below. Notwithstanding the existence of the material weakness discussed below, our management, including our Chief Executive Officer and Chief Financial Officer, has concluded that the consolidated financial statements included in this Annual Report on Form 10-K fairly present, in all material respects, our financial position, results of operations and cash flows for the periods presented in this Annual Report on Form 10-K in conformity with GAAP.
Management's Annual Report on Internal Control over Financial Reporting
Our management is responsible for establishing and maintaining adequate internal control over financial reporting. Our internal control over financial reporting is designed to provide reasonable assurance regarding the reliability of financial reporting and the preparation of financial statements for external purposes in accordance with generally accepted accounting principles. Our internal control over financial reporting includes those policies and procedures that: pertain to the maintenance of records that, in reasonable detail, accurately and fairly reflect our transactions and our dispositions of assets; provide reasonable assurance that transactions are recorded as necessary to permit preparation of financial statements in accordance with generally accepted accounting principles, and that our receipts and expenditures are being made only in accordance with authorizations of our management and directors; and provide reasonable assurance regarding prevention or timely detection of unauthorized acquisition and use or disposition of our assets that could have a material effect on the financial statements.
Because of its inherent limitations, internal control over financial reporting may not prevent or detect misstatements. Also, projections of any evaluation of effectiveness to future periods are subject to the risk that controls may become inadequate because of changes in conditions, or that the degree of compliance with the policies or procedures may deteriorate.
Management assessed the effectiveness of our internal control over financial reporting as of December 31, 2017. In making this assessment, management used the criteria set forth by the Committee of Sponsoring Organizations of the Treadway Commission in Internal Control - Integrated Framework (2013). Based on management’s assessment using this framework, management concluded that, as of December 31, 2017, our internal control over financial reporting was not effective.
The effectiveness of the Company’s internal control over financial reporting as of December 31, 2017 has been audited by Ernst & Young LLP, an independent registered public accounting firm, which contains an adverse opinion on the effectiveness of our internal control over financial reporting, as stated in their report included herein.
Material Weakness in Internal Control over Financial Reporting
A material weakness is a deficiency, or a combination of deficiencies, in internal control over financial reporting, such that there is a reasonable possibility that a material misstatement of our annual or interim financial statements will not be prevented or detected on a timely basis.
We did not maintain effective internal control in the design and operating effectiveness of certain financial reporting related controls over preparation and review of financial information within our Jefferson Operating Segment. Specifically, we determined that we had control deficiencies related to our review over capitalization of interest, lack of segregation of duties within accounts payable and disbursements and the lack of documentation to demonstrate the consistent and timely performance of management review controls at sufficient levels of precision in the preparation of the segment financial information.
These control deficiencies could result in a misstatement of the aforementioned Jefferson Operating Segment accounts or disclosures that would result in a material misstatement to the annual or interim consolidated financial statements that would not be prevented or detected. Accordingly, we determined that these control deficiencies aggregate to a material weakness.
Plan for Remediation of Material Weakness in Control over Financial Reporting
We have already taken steps to remediate the material weakness identified above through the immediate restriction of system access rights that gave rise to the accounts payable segregation of duties deficiency. We also plan to take additional actions to remediate this material weakness, primarily through supplementing the Jefferson operating segment with resources with deepened technical accounting and internal control knowledge. We also intend to enhance our corporate-level monitoring controls over the Jefferson operating segment financial reporting process including monitoring the timeliness and documentation of the operation of management review controls.
157
These actions are subject to ongoing review by our senior management, as well as oversight by the audit committee of our board of directors. Although we plan to complete this remediation process as quickly as possible, we cannot, at this time, estimate when such remediation may occur, and our initiatives may not prove successful in remediating this material weakness.
Changes in Internal Control over Financial Reporting
No change in the Company’s internal control over financial reporting (as defined in Rule 13a-15(f) under the Exchange Act) occurred during its most recent fiscal quarter that has materially affected, or is reasonably likely to materially affect, its internal control over financial reporting.
158
Report of Independent Registered Public Accounting Firm
To the Shareholders and the Board of Directors of Fortress Transportation and Infrastructure Investors LLC
Opinion on Internal Control over Financial Reporting
We have audited Fortress Transportation and Infrastructure Investors LLC internal control over financial reporting as of December 31, 2017, based on criteria established in Internal Control-Integrated Framework issued by the Committee of Sponsoring Organizations of the Treadway Commission (2013 framework) (the COSO criteria). In our opinion, because of the effect of the material weakness described below on the achievement of the objectives of the control criteria, Fortress Transportation and Infrastructure Investors LLC (the Company) has not maintained effective internal control over financial reporting as of December 31, 2017, based on the COSO criteria.
A material weakness is a deficiency, or combination of deficiencies, in internal control over financial reporting, such that there is a reasonable possibility that a material misstatement of the company’s annual or interim financial statements will not be prevented or detected on a timely basis. The following material weakness has been identified and included in management’s assessment.
The Company did not maintain effective internal control in the design and operating effectiveness of certain financial reporting related controls over preparation and review of financial information within its Jefferson Operating Segment. Specifically, the Company determined that it had control deficiencies related to the review over capitalization of interest, lack of segregation of duties within accounts payable and disbursements and the lack of documentation to demonstrate the consistent and timely performance of management review controls at sufficient levels of precision in the preparation of the segment financial information. These control deficiencies could result in a misstatement of the aforementioned Jefferson Operating Segment accounts or disclosures that would result in a material misstatement to the annual or interim consolidated financial statements that would not be prevented or detected. Accordingly, we determined that these control deficiencies aggregate to a material weakness.
We also have audited, in accordance with the standards of the Public Company Accounting Oversight Board (United States) (PCAOB), the consolidated balance sheets of the Company as of December 31, 2017 and 2016, and the related consolidated statements of operations, comprehensive (loss) income, changes in equity and cash flows for the years then ended and the related notes. This material weakness was considered in determining the nature, timing and extent of audit tests applied in our audit of the 2017 consolidated financial statements, and this report does not affect our report dated March 1, 2018, which expressed an unqualified opinion thereon.
Basis for Opinion
The Company’s management is responsible for maintaining effective internal control over financial reporting and for its assessment of the effectiveness of internal control over financial reporting included in the accompanying Management’s Annual Report on Internal Control over Financial Reporting. Our responsibility is to express an opinion on the Company’s internal control over financial reporting based on our audit. We are a public accounting firm registered with the PCAOB and are required to be independent with respect to the Company in accordance with the U.S. federal securities laws and the applicable rules and regulations of the Securities and Exchange Commission and the PCAOB.
We conducted our audit in accordance with the standards of the PCAOB. Those standards require that we plan and perform the audit to obtain reasonable assurance about whether effective internal control over financial reporting was maintained in all material respects. Our audit included obtaining an understanding of internal control over financial reporting, assessing the risk that a material weakness exists, testing and evaluating the design and operating effectiveness of internal control based on the assessed risk, and performing such other procedures as we considered necessary in the circumstances. We believe that our audit provides a reasonable basis for our opinion.
Definition and Limitations of Internal Control Over Financial Reporting
A company’s internal control over financial reporting is a process designed to provide reasonable assurance regarding the reliability of financial reporting and the preparation of financial statements for external purposes in accordance with generally accepted accounting principles. A company’s internal control over financial reporting includes those policies and procedures that (1) pertain to the maintenance of records that, in reasonable detail, accurately and fairly reflect the transactions and dispositions of the assets of the company; (2) provide reasonable assurance that transactions are recorded as necessary to permit preparation of financial statements in accordance with generally accepted accounting principles, and that receipts and expenditures of the company are being made only in accordance with authorizations of management and directors of the company; and (3) provide reasonable assurance regarding prevention or timely detection of unauthorized acquisition, use, or disposition of the company’s assets that could have a material effect on the financial statements.
Because of its inherent limitations, internal control over financial reporting may not prevent or detect misstatements. Also, projections of any evaluation of effectiveness to future periods are subject to the risk that controls may become inadequate because of changes in conditions, or that the degree of compliance with the policies or procedures may deteriorate.
/s/ Ernst & Young LLP
New York, New York
March 1, 2018
159
Item 9B. Other Information
None.
PART III—OTHER INFORMATION
Item 10. Directors, Executive Officers and Corporate Governance
Incorporated by reference to our definitive proxy statement for the 2018 annual meeting of shareholders to be filed with the Securities and Exchange Commission pursuant to Regulation 14A Exchange Act, within 120 days after the fiscal year ended December 31, 2017.
Item 11. Executive Compensation
Incorporated by reference to our definitive proxy statement for the 2018 annual meeting of shareholders to be filed with the Securities and Exchange Commission pursuant to Regulation 14A Exchange Act, within 120 days after the fiscal year ended December 31, 2017.
Item 12. Security Ownership of Certain Beneficial Owners and Management and Related Stockholder Matters
Incorporated by reference to our definitive proxy statement for the 2018 annual meeting of shareholders to be filed with the Securities and Exchange Commission pursuant to Regulation 14A Exchange Act, within 120 days after the fiscal year ended December 31, 2017.
Item 13. Certain Relationships and Related Transactions, and Director Independence
Incorporated by reference to our definitive proxy statement for the 2018 annual meeting of shareholders to be filed with the Securities and Exchange Commission pursuant to Regulation 14A Exchange Act, within 120 days after the fiscal year ended December 31, 2017.
Item 14. Principal Accountant Fees and Services
Incorporated by reference to our definitive proxy statement for the 2018 annual meeting of shareholders to be filed with the Securities and Exchange Commission pursuant to Regulation 14A Exchange Act, within 120 days after the fiscal year ended December 31, 2017.
160
PART IV
Item 15. Exhibits
Exhibit No. | Description | ||
Certificate of Formation (incorporated by reference to Exhibit 3.1 of Amendment No. 4 to the Company's Registration Statement on Form S-1, filed on April 30, 2015). | |||
Amended and Restated Limited Liability Company Agreement of Fortress Transportation and Infrastructure Investors LLC (incorporated by reference to Exhibit 3.2 of the Company's Current Report on Form 8-K, filed on May 21, 2015). | |||
First Amendment to Amended and Restated Limited Liability Company Agreement of Fortress Transportation and Infrastructure Investors LLC (incorporated by reference to Exhibit 3.3 of the Company's Annual Report on Form 10-K, filed on March 10, 2016). | |||
Indenture, dated March 15, 2017, between Fortress Transportation and Infrastructure Investors LLC and U.S. Bank National Association, as trustee, relating to the Company’s 6.75% senior unsecured notes due 2022 (incorporated by reference to Exhibit 4.1 of the Company’s Current Report on Form 8-K, filed on March 15, 2017). | |||
Form of global note representing the Company’s 6.75% senior unsecured notes due 2022 (included in Exhibit 4.1). | |||
First Supplemental Indenture, dated June 8, 2017, between Fortress Transportation and Infrastructure Investors LLC and U.S. Bank National Association, as trustee, relating to the Company’s 6.75% senior unsecured notes due 2022. | |||
Second Supplemental Indenture, dated August 23, 2017, between Fortress Transportation and Infrastructure Investors LLC and U.S. Bank National Association, as trustee, relating to the Company’s 6.75% senior unsecured notes due 2022 (incorporated by reference to Exhibit 4.1 of the Company’s Current Report on Form 8-K, filed on August 23, 2017). | |||
Third Supplemental Indenture, dated December 20, 2017, between Fortress Transportation and Infrastructure LLC (incorporated by reference to Exhibit 4.1 of the Company’s Current Report on Form 8-K filed on December 20, 2017). | |||
Fourth Amended and Restated Partnership Agreement of Fortress Worldwide Transportation and Infrastructure General Partnership (incorporated by reference to Exhibit 10.1 of the Company's Current Report on Form 8-K, filed on May 21, 2015). | |||
† | Management and Advisory Agreement, dated as of May 20, 2015, between Fortress Transportation and Infrastructure Investors LLC and FIG LLC (incorporated by reference to Exhibit 10.2 of the Company's Current Report on Form 8-K, filed on May 21, 2015). | ||
† | Registration Rights Agreement, dated as of May 20, 2015, among Fortress Transportation and Infrastructure Investors LLC, FIG LLC and Fortress Transportation and Infrastructure Master GP LLC (incorporated by reference to Exhibit 10.3 of the Company's Current Report on Form 8-K, filed on May 21, 2015). | ||
† | Fortress Transportation and Infrastructure Investors LLC Nonqualified Stock Option and Incentive Award Plan (incorporated by reference to Exhibit 10.4 of the Company's Current Report on Form 8-K, filed on May 21, 2015). | ||
Form of director and officer indemnification agreement of Fortress Transportation and Infrastructure Investors LLC (incorporated by reference to Exhibit 10.5 of Amendment No. 4 to the Company's Registration Statement on Form S-1, filed April 30, 2015). | |||
Credit Agreement, dated as of August 27, 2014, among Morgan Stanley Senior Funding, Inc., as administrative agent, Jefferson Gulf Coast Energy Partners LLC and the other lenders party thereto (incorporated by reference to Exhibit 10.6 of Amendment No. 4 to the Company's Registration Statement on Form S-1, filed April 30, 2015). | |||
Trust Indenture and Security Agreement between the District and The Bank of New York Mellon Trust Company, National Association, dated as of February 1, 2016 (incorporated by reference to Exhibit 10.7 of the Company's Annual Report on Form 10-K, filed on March 10, 2016). | |||
Standby Bond Purchase Agreement among the Port of Beaumont Navigation District of Jefferson County, Texas, The Bank of New York Mellon Trust Company, National Association, Jefferson Railport Terminal II Holdings LLC and Jefferson Railport Terminal II LLC dated as of February 1, 2016 (incorporated by reference to Exhibit 10.8 of the Company's Annual Report on Form 10-K, filed on March 10, 2016). | |||
Capital Call Agreement, by and among Fortress Transportation and Infrastructure Investors LLC, FTAI Energy Holdings LLC, FTAI Partner Holdings LLC, FTAI Midstream GP Holdings LLC, FTAI Midstream GP LLC, FTAI Midstream Holdings LLC, FTAI Energy Partners LLC and Jefferson Railport Terminal II Holdings LLC, dated as of February 1, 2016 (incorporated by reference to Exhibit 10.9 of the Company's Annual Report on Form 10-K, filed on March 10, 2016). | |||
Fee and Support Agreement, among FTAI Energy Holdings LLC, FEP Terminal Holdings LLC, FTAI Energy Partners LLC and Jefferson Railport Terminal II LLC, dated as of March 7, 2016 (incorporated by reference to Exhibit 10.10 of the Company's Amended Annual Report on Form 10-K/A, filed on April 29, 2016). | |||
Lease and Development Agreement (Facilities Lease), dated as of February 1, 2016, by and between the Port of Beaumont Navigation District of Jefferson County, Texas and Jefferson Railport Terminal II LLC (incorporated by reference to Exhibit 10.11 of the Company's Annual Report on Form 10-K, filed on March 10, 2016). | |||
Deed of Trust of Jefferson Railport Terminal II LLC, dated as of February 1, 2016 (incorporated by reference to Exhibit 10.12 of the Company's Annual Report on Form 10-K, filed on March 10, 2016). | |||
Credit Agreement, dated January 23, 2017, among Fortress Transportation and Infrastructure Investors LLC, as holdings, Fortress Worldwide Transportation and Infrastructure General Partnership, as IntermediateCo, WWTAI Finance Ltd., as Borrower, the Subsidiary Guarantors from time to time party thereto, the lenders from time to time party thereto and Morgan Stanley Senior Funding, Inc., as Administrative Agent (incorporated by reference to Exhibit 10.1 of the Company's Current Report on Form 8-K, filed on January 27, 2017). | |||
Credit Agreement, dated June 16, 2017, among Fortress Transportation and Infrastructure Investors LLC, as Borrower, the lenders and issuing banks from time to time party thereto and JPMorgan Chase Bank, N.A., as Administrative Agent (incorporated by reference to Exhibit 10.1 of the Company’s Current Report on Form 8-K, filed on June 22, 2017). | |||
† | Form of Award Agreement under the Fortress Transportation and Infrastructure Investors Nonqualified Stock Option and Incentive Award Plan (incorporated by reference to Exhibit 10.1 of the Company’s Current Report on Form 8-K, filed on January 17, 2018). | ||
161
Exhibit No. | Description | ||
Calculation of Ratio of Earnings to Fixed Charges | |||
Subsidiaries of Fortress Transportation and Infrastructure Investors LLC. | |||
Consent of Independent Registered Public Accounting Firm | |||
Consent of Independent Registered Public Accounting Firm | |||
Certification of Chief Executive Officer pursuant to Rule 13a-14(a)/15d-14(a), as adopted pursuant to Section 302 of the Sarbanes-Oxley Act of 2002. | |||
Certification of Chief Financial Officer pursuant to Rule 13a-14(a)/15d-14(a), as adopted pursuant to Section 302 of the Sarbanes-Oxley Act of 2002 | |||
Certification of Chief Executive Officer pursuant to 18 U.S.C. Section 1350, as adopted pursuant to Section 906 of the Sarbanes-Oxley Act of 2002. | |||
Certification of Chief Financial Officer pursuant to 18 U.S.C. Section 1350, as adopted pursuant to Section 906 of the Sarbanes-Oxley Act of 2002. | |||
101.INS | XBRL Instance Document. | ||
101.SCH | XBRL Taxonomy Extension Schema Document. | ||
101.CAL | XBRL Taxonomy Extension Calculation Linkbase Document. | ||
101.DEF | XBRL Taxonomy Extension Definition Linkbase Document. | ||
101.LAB | XBRL Taxonomy Extension Label Linkbase Document. | ||
101.PRE | XBRL Taxonomy Extension Presentation Linkbase Document. | ||
† | Management contracts and compensatory plans or arrangements. | ||
Item 16. Form 10-K Summary
None.
162
SIGNATURES
Pursuant to the requirements of the Securities Exchange Act of 1934, the registrant has duly caused this report to be signed on its behalf by the undersigned thereunto duly authorized:
FORTRESS TRANSPORTATION AND INFRASTRUCTURE INVESTORS LLC
By: | /s/ Joseph P. Adams, Jr. | Date: | March 1, 2018 | |
Joseph P. Adams, Jr. | ||||
Chairman and Chief Executive Officer | ||||
Pursuant to the requirements of the Securities Exchange Act of 1934, as amended, this report has been signed below by the following persons on behalf of the Registrant and in the capacities and on the dates indicated.
By: | /s/ Joseph P. Adams, Jr. | Date: | March 1, 2018 | |
Joseph P. Adams, Jr. | ||||
Chairman and Chief Executive Officer | ||||
By: | /s/ Scott Christopher | Date: | March 1, 2018 | |
Scott Christopher | ||||
Chief Financial Officer and | ||||
Chief Accounting Officer | ||||
By: | /s/ Paul R. Goodwin | Date: | March 1, 2018 | |
Paul R. Goodwin | ||||
Director | ||||
By: | /s/ Judith A. Hannaway | Date: | March 1, 2018 | |
Judith A. Hannaway | ||||
Director | ||||
By: | /s/ A. Andrew Levison | Date: | March 1, 2018 | |
A. Andrew Levison | ||||
Director | ||||
By: | /s/ Ray M. Robinson | Date: | March 1, 2018 | |
Ray M. Robinson | ||||
Director | ||||
By: | /s/ Martin Tuchman | Date: | March 1, 2018 | |
Martin Tuchman | ||||
Director | ||||
163