Attached files
| file | filename |
|---|---|
| EX-32.2 - EX-32.2 - FS KKR Capital Corp | d542189dex322.htm |
| EX-32.1 - EX-32.1 - FS KKR Capital Corp | d542189dex321.htm |
| EX-31.2 - EX-31.2 - FS KKR Capital Corp | d542189dex312.htm |
| EX-31.1 - EX-31.1 - FS KKR Capital Corp | d542189dex311.htm |
| EX-21.1 - EX-21.1 - FS KKR Capital Corp | d542189dex211.htm |
Table of Contents
UNITED STATES
SECURITIES AND EXCHANGE COMMISSION
WASHINGTON, D.C. 20549
FORM 10-K
| ☒ | ANNUAL REPORT PURSUANT TO SECTION 13 OR 15(d) OF THE SECURITIES EXCHANGE |
| ACT OF 1934 |
| FOR THE FISCAL YEAR ENDED DECEMBER 31, 2017 |
OR
| ☐ | TRANSITION REPORT PURSUANT TO SECTION 13 OR 15(d) OF THE SECURITIES EXCHANGE |
| ACT OF 1934 |
| FOR THE TRANSITION PERIOD FROM TO |
COMMISSION FILE NUMBER: 814-00757
FS Investment Corporation
(Exact name of registrant as specified in its charter)
| Maryland | 26-1630040 | |
| (State of Incorporation) | (I.R.S. Employer Identification Number) | |
| 201 Rouse Boulevard Philadelphia, Pennsylvania |
19112 | |
| (Address of principal executive offices) | (Zip Code) | |
Registrant’s telephone number, including area code: (215) 495-1150
Securities registered pursuant to Section 12(b) of the Act:
| Common Stock, par value $0.001 per share | The New York Stock Exchange | |
| (Title of class) | (Name of exchange on which registered) |
Securities registered pursuant to Section 12(g) of the Act:
None
Indicate by check mark if the registrant is a well-known seasoned issuer, as defined in Rule 405 of the Securities Act. Yes ☐ No ☒.
Indicate by check mark if the registrant is not required to file reports pursuant to Section 13 or Section 15(d) of the Act. Yes ☐ No ☒.
Indicate by check mark whether the Registrant (1) has filed all reports required to be filed by Section 13 or 15(d) of the Securities Exchange Act of 1934 during the preceding 12 months (or for such shorter period that the Registrant was required to file such reports), and (2) has been subject to such filing requirements for the past 90 days. Yes ☒ No ☐.
Indicate by check mark whether the registrant has submitted electronically and posted on its corporate Web site, if any, every Interactive Data File required to be submitted and posted pursuant to Rule 405 of Regulation S-T (§232.405 of this chapter) during the preceding 12 months (or for shorter period that the registrant was required to submit and post such files). Yes ☐ No ☐.
Indicate by check mark if disclosure of delinquent filers pursuant to Item 405 of Regulation S-K is not contained herein, and will not be contained, to the best of Registrant’s knowledge, in definitive proxy or information statements incorporated by reference in Part III of this Form 10-K or any amendment to this Form 10-K. ☐
Indicate by check mark whether the registrant is a large accelerated filer, an accelerated filer, a non-accelerated filer, or a smaller reporting company. See definition of “accelerated filer,” “large accelerated filer” and “smaller reporting company” in Rule 12b-2 of the Exchange Act. (Check one):
| Large accelerated filer ☒ | Accelerated filer ☐ | |||
| Non-accelerated filer ☐ | (Do not check if a smaller reporting company) | Smaller reporting company ☐ | ||
| Emerging growth company ☐ |
If an emerging growth company, indicate by check mark if the registrant has elected not to use the extended transition period for complying with any new or revised financial accounting standards provided pursuant to Section 13(a) of the Exchange Act. ☐
Indicate by check mark whether the registrant is a shell company (as defined in Rule 12b-2 of the Exchange Act). Yes ☐ No ☒.
The aggregate market value of common stock held by non-affiliates of the registrant (assuming solely for the purpose of this disclosure, but without conceding, all executive officers and directors of the registrant are “affiliates”), as of June 30, 2017, the last business day of the registrant’s most recently completed second fiscal quarter, was approximately $2.2 billion.
There were 245,725,416 shares of the registrant’s common stock outstanding as of February 28, 2018.
Documents Incorporated by Reference
Portions of the registrant’s definitive Proxy Statement relating to the registrant’s 2018 Annual Meeting of Stockholders, to be filed with the U.S. Securities and Exchange Commission within 120 days following the end of the registrant’s fiscal year, are incorporated by reference in Part III of this annual report on Form 10-K as indicated herein.
Table of Contents
| Page | ||||||
| PART I |
||||||
| ITEM 1. |
BUSINESS | 1 | ||||
| ITEM 1A. | 29 | |||||
| ITEM 1B. | 57 | |||||
| ITEM 2. | 57 | |||||
| ITEM 3. | 57 | |||||
| ITEM 4. | 57 | |||||
| PART II |
||||||
| ITEM 5. | 58 | |||||
| ITEM 6. | 61 | |||||
| ITEM 7. | MANAGEMENT’S DISCUSSION AND ANALYSIS OF FINANCIAL CONDITION AND RESULTS OF OPERATIONS |
62 | ||||
| ITEM 7A. | 81 | |||||
| ITEM 8. | 83 | |||||
| ITEM 9. | CHANGES IN AND DISAGREEMENTS WITH ACCOUNTANTS ON ACCOUNTING AND FINANCIAL DISCLOSURE |
153 | ||||
| ITEM 9A. | 153 | |||||
| ITEM 9B. | 154 | |||||
| PART III |
||||||
| ITEM 10. | 155 | |||||
| ITEM 11. | 155 | |||||
| ITEM 12. | SECURITY OWNERSHIP OF CERTAIN BENEFICIAL OWNERS AND MANAGEMENT AND RELATED STOCKHOLDER MATTERS |
155 | ||||
| ITEM 13. | CERTAIN RELATIONSHIPS AND RELATED TRANSACTIONS, AND DIRECTOR INDEPENDENCE |
155 | ||||
| ITEM 14. | 155 | |||||
| PART IV |
||||||
| ITEM 15. | 156 | |||||
| SIGNATURES | 160 | |||||
Table of Contents
PART I
Many of the amounts and percentages presented in Part I have been rounded for convenience of presentation and all dollar amounts, excluding share and per share amounts, are presented in thousands unless otherwise noted.
| Item 1. | Business. |
Summary
FS Investment Corporation (NYSE: FSIC), or the Company, which may also be referred to as “we,” “us” or “our,” was incorporated under the general corporation laws of the State of Maryland on December 21, 2007 and formally commenced investment operations on January 2, 2009. We are an externally managed, non-diversified, closed-end management investment company that has elected to be regulated as a business development company, or BDC, under the Investment Company Act of 1940, as amended, or the 1940 Act. As such, we are required to comply with certain regulatory requirements. In addition, we have elected to be treated for U.S. federal income tax purposes, and intend to qualify annually, as a regulated investment company, or RIC, under Subchapter M of the Internal Revenue Code of 1986, as amended, or the Code. As of December 31, 2017, we had total assets of approximately $4.1 billion.
We are managed by FB Income Advisor, LLC, or FB Advisor, a registered investment adviser under the Investment Advisers Act of 1940, as amended, or the Advisers Act, which oversees the management of our operations and is responsible for making investment decisions with respect to our portfolio. FB Advisor engaged GSO / Blackstone Debt Funds Management LLC, or GDFM, to act as our investment sub-adviser. GDFM currently assists FB Advisor in identifying investment opportunities and makes investment recommendations for approval by FB Advisor, according to guidelines set by FB Advisor. GDFM, a registered investment adviser under the Advisers Act, is a wholly-owned subsidiary of GSO Capital Partners LP, or GSO. GSO is the credit platform of The Blackstone Group L.P., or Blackstone, a leading global alternative asset manager and provider of financial advisory services. GSO is one of the world’s largest credit platforms in the alternative asset business with approximately $138.1 billion in assets under management as of December 31, 2017.
As previously announced by the Company on December 11, 2017, GDFM intends to resign as the investment sub-adviser to the Company and terminate the investment sub-advisory agreement, dated April 13, 2008, or the investment sub-advisory agreement, that FB Advisor has entered into with GDFM, effective April 9, 2018 (the date of such termination, the GDFM end date). In connection with GDFM’s resignation as the investment sub-adviser to the Company, Franklin Square Holdings, L.P. (which does business as FS Investments), or FS Investments, and KKR Credit Advisors (US) LLC, or KKR Credit, desire to enter into a relationship whereby FS Investments and KKR Credit will create a premier alternative lending platform for certain BDCs sponsored, advised and/or sub-advised by them. See “—The Transition of Investment Advisory Services” for information regarding the Company’s potential investment advisory relationship with KKR Credit and/or FS/KKR Advisor, LLC, or FS/KKR Advisor, a newly-formed investment adviser jointly operated by an affiliate of FS Investments, or FS Adviser, and by KKR Credit.
Our investment objectives are to generate current income and, to a lesser extent, long-term capital appreciation. We currently seek to meet our investment objectives by:
| • | utilizing the experience and expertise of the management teams of FB Advisor and GDFM, along with the broader resources of GSO, which include its access to the relationships and human capital of its parent, Blackstone, in sourcing, evaluating and structuring transactions; |
| • | employing a defensive investment approach focused on long-term credit performance and principal protection; |
| • | focusing primarily on debt investments in a broad array of private U.S. companies, including middle-market companies, which we define as companies with annual revenues of $50 million to $2.5 billion |
1
Table of Contents
| at the time of investment. In many market environments, we believe such a focus offers an opportunity for superior risk adjusted returns; |
| • | investing primarily in established, stable enterprises with positive cash flows; and |
| • | maintaining rigorous portfolio monitoring, in an attempt to anticipate and pre-empt negative credit events within our portfolio. |
Our portfolio is comprised primarily of investments in senior secured loans and second lien secured loans of private middle market U.S. companies and, to a lesser extent, subordinated loans of private U.S. companies. Although we do not expect a significant portion of our portfolio to be comprised of subordinated loans, there is no limit on the amount of such loans in which we may invest. We may purchase interests in loans or make other debt investments, including investments in senior secured bonds, through secondary market transactions in the “over-the-counter” market or directly from our target companies as primary market or directly originated investments. In connection with our debt investments, we may on occasion receive equity interests such as warrants or options as additional consideration. We may also purchase or otherwise acquire minority interests in the form of common or preferred equity or equity-related securities, such as rights and warrants that may be converted into or exchanged for common stock or other equity or the cash value of common stock or other equity, in our target companies, generally in conjunction with one of our debt investments or through a co-investment with a financial sponsor, such as an institutional investor or private equity firm. In addition, a portion of our portfolio may be comprised of corporate bonds, collateralized loan obligations, or CLOs, other debt securities and derivatives, including total return swaps and credit default swaps. FB Advisor will seek to tailor our investment focus as market conditions evolve. Depending on market conditions, we may increase or decrease our exposure to less senior portions of the capital structure or otherwise make opportunistic investments.
The senior secured loans, second lien secured loans and senior secured bonds in which we invest generally have stated terms of three to seven years and subordinated debt investments that we make generally have stated terms of up to ten years, but the expected average life of such securities is generally between three and seven years. However, there is no limit on the maturity or duration of any security in our portfolio. Our debt investments may be rated by a nationally recognized statistical rating organization, or NRSRO, and, in such case, generally will carry a rating below investment grade (rated lower than “Baa3” by Moody’s Investors Service, Inc., or Moody’s, or lower than “BBB-” by Standard & Poor’s Ratings Services, or S&P). We also invest in non-rated debt securities.
To seek to enhance our returns, we employ leverage as market conditions permit and at the discretion of FB Advisor, but in no event will leverage employed exceed 50% of the value of our assets, as required by the 1940 Act.
As a BDC, we are subject to certain regulatory restrictions in making our investments. For example, BDCs generally are not permitted to co-invest with certain affiliated entities in transactions originated by the BDC or its affiliates in the absence of an exemptive order from the U.S. Securities and Exchange Commission, or the SEC. However, BDCs are permitted to, and may, simultaneously co-invest in transactions where price is the only negotiated term. In an order dated June 4, 2013, or the Order, the SEC granted exemptive relief permitting us, subject to the satisfaction of certain conditions, to co-invest in certain privately negotiated investment transactions with certain affiliates of FB Advisor, including FS Energy and Power Fund, FS Investment Corporation II, FS Investment Corporation III, FS Investment Corporation IV and any future BDCs that are advised by FB Advisor or its affiliated investment advisers, or collectively our co-investment affiliates. However, in connection with the potential investment advisory relationship with KKR Credit and/or FS/KKR Advisor, and in an effort to mitigate potential future conflicts of interest, our board of directors has authorized and directed that the Company exercise its rights under the Order to decline to participate in any new potential co-investment transaction pursuant to the Order that would be within the then-current investment objectives and strategies of the Company unless sourced by GDFM, KKR Credit or FS/KKR Advisor. We believe this relief has and may
2
Table of Contents
continue to enhance our ability to further our investment objectives and strategy. We believe this relief may also increase favorable investment opportunities for us, in part, by allowing us to participate in larger investments, together with our co-investment affiliates, than would be available to us if such relief had not been obtained. Because we did not seek exemptive relief to engage in co-investment transactions with GDFM and its affiliates, we are permitted to co-invest with GDFM and its affiliates only in accordance with existing regulatory guidance (e.g., where price is the only negotiated term). See “—The Transition of Investment Advisory Services” for information regarding the exemptive relief KKR Credit is seeking with respect to the Company’s potential investment advisory relationship with FS/KKR Advisor.
About FB Advisor
FB Advisor is a subsidiary of our affiliate, FS Investments, a national sponsor of alternative investments designed for the individual investor. FB Advisor is registered as an investment adviser with the SEC under the Advisers Act and is led by substantially the same personnel as the senior management teams of the investment advisers to certain other BDCs, open and closed-end management investment companies and a real estate investment trust sponsored by FS Investments and such personnel may serve in similar or other capacities for the investment advisers to future investment vehicles sponsored by FS Investments.
3
Table of Contents
In addition to managing our investments, the managers, officers and other personnel of FB Advisor also currently manage the following entities, or together with the Company, the Fund Complex, through affiliated investment advisers:
| Name |
Entity |
Investment Focus |
Gross Assets(1) |
|||||
| FS Energy and Power Fund |
BDC | Primarily invests in debt and income-oriented equity securities of privately-held U.S. companies in the energy and power industry. | $ | 4,430,111 | ||||
| FS Investment Corporation II |
BDC | Primarily invests in senior secured loans, second lien secured loans and, to a lesser extent, subordinated loans of private U.S. companies. | $ | 5,218,803 | ||||
| FS Investment Corporation III |
BDC | Primarily invests in senior secured loans, second lien secured loans and, to a lesser extent, subordinated loans of private U.S. companies. | $ | 3,944,960 | ||||
| FS Investment Corporation IV |
BDC | Primarily invests in senior secured loans, second lien secured loans and, to a lesser extent, subordinated loans of private U.S. companies. | $ | 359,158 | ||||
| FS Global Credit Opportunities Fund(2) |
Closed-end management investment company | Primarily invests in secured and unsecured floating and fixed rate loans, bonds and other types of credit instruments. | $ | 2,275,829 | ||||
| FS Energy Total Return Fund(3) |
Closed-end management investment company | Primarily invests in the equity and debt of securities of natural resource companies. | $ | 32,312 | ||||
| FS Multi-Strategy Alternatives Fund(4) |
Open-end management investment company | Primarily invests in a broad spectrum of alternative investment strategies with low correlation to equity and fixed income markets. | $ | 58,326 | ||||
| FS Credit Real Estate Income Trust, Inc. |
REIT | Primarily invests in senior loans secured by commercial real estate in the United States. | $ | 41,281 | ||||
| FS Credit Income Fund(3) |
Closed-end management investment company | Primarily invests in debt obligations and, to a lesser extent, equity observations. | $ | 20,000 | ||||
| (1) | As of September 30, 2017, except as otherwise noted below. |
| (2) | Five funds affiliated with FS Global Credit Opportunities Fund, FS Global Credit Opportunities Fund—A, FS Global Credit Opportunities Fund—D, FS Global Credit Opportunities Fund—T, FS Global Credit Opportunities Fund—ADV and FS Global Credit Opportunities Fund—T2, which also have the same investment objectives and strategies as FS Global Credit Opportunities Fund, closed their respective continuous public offerings to new investors. Gross assets shown as of June 30, 2017. |
| (3) | As of October 31, 2017. |
| (4) | As of December 31, 2017. |
4
Table of Contents
Our chairman and chief executive officer, Michael C. Forman, has led FB Advisor since its inception. In 2007, he co-founded FS Investments with the goal of delivering alternative investment solutions, advised by what FS Investments believes to be best-in-class institutional asset managers, to individual investors nationwide. In addition to leading FB Advisor, Mr. Forman currently serves as chairman, president and/or chief executive officer of each of the other funds in the Fund Complex and each of their respective investment advisers.
FB Advisor’s senior management team has significant experience in private lending and private equity investing, and has developed an expertise in using all levels of a firm’s capital structure to produce income-generating investments, while focusing on risk management. The team also has extensive knowledge of the managerial, operational and regulatory requirements of publicly registered alternative asset entities, such as BDCs. We believe that the active and ongoing participation by FS Investments and its affiliates in the credit markets, and the depth of experience and disciplined investment approach of FB Advisor’s management team, will allow FB Advisor to successfully execute our investment strategy.
All investment decisions currently require the unanimous approval of FB Advisor’s investment committee, which is currently comprised of Sean Coleman, Brian Gerson and Michael Kelly. Our board of directors, including a majority of independent directors, oversees and monitors our investment performance and annually reviews our amended and restated investment advisory agreement, dated July 17, 2014, or the investment advisory agreement, and the investment sub-advisory agreement to determine, among other things, whether the fees payable under such agreements are reasonable in light of the services provided.
About FS Investments
FS Investments is a leading asset manager dedicated to helping individuals, financial professionals and institutions design better portfolios. The firm provides access to alternative sources of income and growth and focuses on setting the industry standards for investor education and transparency.
FS Investments is headquartered in Philadelphia with offices in Orlando, FL, New York, NY and Washington, D.C. The firm had more than $20 billion in assets under management as of September 30, 2017.
About GDFM
From time to time, FB Advisor may enter into sub-advisory relationships with registered investment advisers that possess skills that FB Advisor believes will aid it in achieving our investment objectives. FB Advisor engaged GDFM to act as our investment sub-adviser. GDFM currently assists FB Advisor in identifying investment opportunities and makes investment recommendations for approval by FB Advisor according to guidelines set by FB Advisor. GDFM also serves as the investment sub-adviser to FS Investment Corporation II, FS Investment Corporation III and FS Investment Corporation IV. Furthermore, GDFM’s parent, GSO, currently serves as the investment sub-adviser to FS Energy and Power Fund and FS Global Credit Opportunities Fund. GDFM is a Delaware limited liability company with principal offices located at 345 Park Avenue, New York, New York 10154.
GDFM is a wholly-owned subsidiary of GSO. GSO is the credit platform of Blackstone, a leading global alternative asset manager. As of December 31, 2017, GSO and its affiliates, excluding Blackstone, managed approximately $138.1 billion of assets across multiple strategies and investment types within the leveraged finance marketplace, including leveraged loans, high-yield bonds, distressed, mezzanine and private equity. As investment sub-adviser, GDFM currently makes recommendations to FB Advisor in a manner that is consistent with its existing investment and monitoring processes.
Blackstone is a leading global alternative asset manager and provider of financial advisory services. It is one of the largest independent managers of private capital in the world, with assets under management of approximately $434.1 billion as of December 31, 2017. Blackstone’s alternative asset management businesses include the management of private equity funds, real estate funds, funds of hedge funds, credit-oriented funds, collateralized loan obligation vehicles, separately managed accounts and publicly-traded closed-end mutual
5
Table of Contents
funds. Blackstone is a publicly traded limited partnership that has common units which trade on the New York Stock Exchange, or the NYSE, under the ticker symbol “BX.” Information about Blackstone and its various affiliates, including certain ownership, governance and financial information, is disclosed in Blackstone’s periodic filings with the SEC, which can be obtained from Blackstone’s website at http://ir.blackstone.com or the SEC’s website at www.sec.gov. Information contained on Blackstone’s website and in Blackstone’s filings with the SEC is not incorporated by reference into this annual report on Form 10-K and you should not consider that information to be part of this annual report on Form 10-K.
Potential Market Opportunity
We believe that there are and will continue to be significant investment opportunities in the senior secured and second lien secured loan asset class, as well as investments in debt securities of middle market companies.
Attractive Opportunities in Senior Secured and Second Lien Secured Loans
We believe that opportunities in senior secured and second lien secured loans are significant because of the variable rate structure of most senior secured debt issues and because of the strong defensive characteristics of this investment class. Given current market conditions, we believe that debt issues with variable interest rates often offer a superior return profile to fixed-rate securities, since variable interest rate structures are generally less susceptible to declines in value experienced by fixed-rate securities in a rising interest rate environment.
Senior secured debt also provides strong defensive characteristics. Because this debt has priority in payment among an issuer’s security holders (i.e., holders are due to receive payment before junior creditors and equityholders), they carry the least potential risk among investments in the issuer’s capital structure. Further, these investments are secured by the issuer’s assets, which may be seized in the event of a default, if necessary. They generally also carry restrictive covenants aimed at ensuring repayment before junior creditors, such as most types of unsecured bondholders, and other security holders and preserving collateral to protect against credit deterioration.
The chart below illustrates examples of the collateral used to secure senior secured and second lien secured debt.
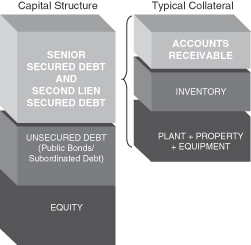
Source: Moody’s Investors Service, Inc.
6
Table of Contents
Opportunity in Middle Market Private Companies
In addition to investing in senior secured and second lien secured loans generally, we believe that the market for lending to private companies, particularly middle market private companies within the United States, is underserved and presents a compelling investment opportunity. We believe that the following characteristics support our belief:
Large Target Market
According to The U.S. Census Bureau, in its 2012 economic census, there were approximately 42,600 middle market companies in the United States with annual revenues between $50 million and $2.5 billion, compared with approximately 1,350 companies with revenues greater than $2.5 billion. These middle market companies represent, we believe, a significant portion of the growth segment of the U.S. economy and often require substantial capital investment to grow their businesses. Middle market companies have generated a significant number of investment opportunities for us and investment programs managed by our affiliates and GDFM over the past several years, and we believe that this market segment will continue to produce significant investment opportunities for us.
Limited Investment Competition
Despite the size of the market, we believe that regulatory changes and other factors have diminished the role of traditional financial institutions in providing financing to middle market companies. As tracked by S&P Capital IQ LCD, U.S. banks’ share of senior secured loans to middle market companies represented approximately just 1% of overall middle market loan volume in 2017, down from 6% in 2016 and nearly 20% in 2011. However, the continuation of this trend is uncertain as a result of the potentially changing regulatory landscape.
We also believe that lending and originating new loans to middle market companies, which are often private, generally requires a greater dedication of the lender’s time and resources compared to lending to larger companies, due in part to the smaller size of each investment and the often fragmented nature of information available from these companies. Further, many investment firms lack the breadth and scale necessary to identify investment opportunities, particularly in regards to directly originated investments in middle market companies, and thus we believe that attractive investment opportunities are often overlooked. In addition, middle market companies may require more active monitoring and participation on the lender’s part. We believe that many large financial organizations, which often have relatively high cost structures, are not suited to deal with these factors and instead emphasize services and transactions to larger corporate clients with a consequent reduction in the availability of financing to middle market companies.
Attractive Market Segment
We believe that the underserved nature of such a large segment of the market can at times create a significant opportunity for investment. In many environments, we believe that middle market companies are more likely to offer attractive economics in terms of transaction pricing, up-front and ongoing fees, prepayment penalties and security features in the form of stricter covenants and quality collateral than loans to larger companies. In addition, as compared to larger companies, middle market companies often have simpler capital structures and carry less leverage, thus aiding the structuring and negotiation process and allowing us greater flexibility in structuring favorable transactions. We believe that these factors will result in advantageous conditions in which to pursue our investment objectives of generating current income and, to a lesser extent, long-term capital appreciation.
Characteristics of and Risks Related to Investments in Private Companies
We invest primarily in the debt of private middle market U.S. companies. Investments in private companies pose significantly greater risks than investments in public companies. First, private companies have
7
Table of Contents
reduced access to the capital markets, resulting in diminished capital resources and ability to withstand financial distress. As a result, these companies, which may present greater credit risk than public companies, may be unable to meet the obligations under their debt securities that we hold. Second, the investments themselves may often be illiquid. The securities of most of the companies in which we invest are not publicly-traded or actively-traded on the secondary market and are, instead, traded on a privately negotiated over-the-counter secondary market for institutional investors. In addition, our directly originated investments generally will not be traded on any secondary market and a trading market for such investments may not develop. These securities may also be subject to legal and other restrictions on resale. As such, we may have difficulty exiting an investment promptly or at a desired price prior to maturity or outside of a normal amortization schedule. These investments may also be difficult to value because little public information generally exists about private companies, requiring an experienced due diligence team to analyze and value the potential portfolio company. Finally, these companies often may not have third-party debt ratings or audited financial statements. We must therefore rely on the ability of FB Advisor and/or GDFM to obtain adequate information through their due diligence efforts to evaluate the creditworthiness of, and risks involved in, investing in these companies, and to determine the optimal time to exit an investment. These companies and their financial information will also generally not be subject to the Sarbanes-Oxley Act of 2002, or the Sarbanes-Oxley Act, and other rules and regulations that govern public companies that are designed to protect investors.
Investment Strategy
Our principal focus is to invest in senior secured and second lien secured loans of private middle market U.S. companies, and to a lesser extent, subordinated loans of private U.S. companies. Although we do not expect a significant portion of our portfolio to be comprised of subordinated loans, there is no limit on the amount of such loans in which we may invest. We may purchase interests in loans or make other debt investments, including investments in senior secured bonds, through secondary market transactions in the “over-the-counter” market or directly from our target companies as primary market or directly originated investments. In connection with our debt investments, we may on occasion receive equity interests such as warrants or options as additional consideration. We may also purchase or otherwise acquire minority interests in the form of common or preferred equity or equity-related securities, such as rights and warrants that may be converted into or exchanged for common stock or other equity or the cash value of common stock or other equity, in our target companies, generally in conjunction with one of our debt investments or through a co-investment with a financial sponsor, such as an institutional investor or private equity firm. In addition, a portion of our portfolio may be comprised of corporate bonds, CLOs, other debt securities and derivatives, including total return swaps and credit default swaps. FB Advisor will seek to tailor our investment focus as market conditions evolve. Depending on market conditions, we may increase or decrease our exposure to less senior portions of the capital structure or otherwise make opportunistic investments.
When identifying prospective portfolio companies, we focus primarily on the attributes set forth below, which we believe will help us generate higher total returns with an acceptable level of risk. While these criteria provide general guidelines for our investment decisions, we caution investors that, if we believe the benefits of investing are sufficiently strong, not all of these criteria necessarily will be met by each prospective portfolio company in which we choose to invest. These attributes are:
| • | Leading, defensible market positions. We seek to invest in companies that have developed strong positions within their respective markets and exhibit the potential to maintain sufficient cash flows and profitability to service our debt in a range of economic environments. We seek companies that can protect their competitive advantages through scale, scope, customer loyalty, product pricing or product quality versus their competitors, thereby minimizing business risk and protecting profitability. |
| • | Investing in stable companies with positive cash flow. We seek to invest in established, stable companies with strong profitability and cash flows. Such companies, we believe, are well-positioned to maintain consistent cash flow to service and repay our loans and maintain growth in their businesses or market share. We do not intend to invest to any significant degree in start-up companies, turnaround situations or companies with speculative business plans. |
8
Table of Contents
| • | Proven management teams. We focus on companies that have experienced management teams with an established track record of success. We typically prefer our portfolio companies to have proper incentives in place, which may include non-cash and performance-based compensation, to align management’s goals with ours. |
| • | Private equity sponsorship. Often, we seek to participate in transactions sponsored by what we believe to be sophisticated and seasoned private equity firms. FB Advisor’s management team believes that a private equity sponsor’s willingness to invest significant sums of equity capital into a company is an endorsement of the quality of the investment. Further, by co-investing with such experienced private equity firms which commit significant sums of equity capital ranking junior in priority of payment to our debt investments, we may benefit from the due diligence review performed by the private equity firm, in addition to our own due diligence review. Further, strong private equity sponsors with significant investments at risk have the ability and a strong incentive to contribute additional capital in difficult economic times should operational or financial issues arise, which could provide additional protections for our investments. |
| • | Allocation among various issuers and industries. We seek to allocate our portfolio broadly among issuers and industries, thereby attempting to reduce the risk of a downturn in any one company or industry having a disproportionate adverse impact on the value of our portfolio. |
| • | Viable exit strategy. While we attempt to invest in securities that may be sold in a privately negotiated over-the-counter market, providing us a means by which we may exit our positions, we expect that a large portion of our portfolio may not be sold on this secondary market. For any investments that are not able to be sold within this market, we focus primarily on investing in companies whose business models and growth prospects offer attractive exit possibilities, including repayment of our investments, an initial public offering of equity securities, a merger, a sale or a recapitalization, in each case with the potential for capital gains. |
In addition, in an order dated June 4, 2013, the SEC granted exemptive relief that, subject to the satisfaction of certain conditions, expands our ability to co-invest in certain privately negotiated investment transactions with our co-investment affiliates, which we believe has and may continue to enhance our ability to further our investment objectives and strategy. See “—The Transition of Investment Advisory Services” for information regarding the exemptive relief KKR Credit is seeking with respect to the Company’s potential investment advisory relationship with FS/KKR Advisor.
Potential Competitive Strengths
We believe that we offer investors the following potential competitive strengths:
Global platform with seasoned investment professionals
We believe that the breadth and depth of the experience of FB Advisor’s senior management team, and currently, together with the wider resources of GSO’s investment team, which is dedicated to sourcing, structuring, executing, monitoring and harvesting a broad range of private investments, as well as the specific expertise of GDFM, provide us with a significant competitive advantage in sourcing and analyzing attractive investment opportunities.
Long-term investment horizon
Our long-term investment horizon gives us great flexibility, which we believe allows us to maximize returns on our investments. Unlike most private equity and venture capital funds, as well as many private debt funds, we are not required to return capital to our stockholders once we exit a portfolio investment. We believe that freedom from such capital return requirements, which allows us to invest using a longer-term focus, provides us with the opportunity to increase total returns on invested capital, compared to other private company investment vehicles.
9
Table of Contents
GDFM transaction sourcing capability
FB Advisor currently seeks to leverage GDFM’s significant access to transaction flow. GDFM seeks to generate investment opportunities through syndicate and club deals (generally, investments made by a small group of investment firms) and, subject to regulatory constraints as discussed under “—Regulation,” and the allocation policies of GDFM and its affiliates, as applicable, also through GSO’s direct origination channels. GDFM also relies on its relationships with private equity sponsors, investment banks and commercial banks to source investment opportunities. These include significant contacts to participants in the credit and leveraged finance marketplace, which it can draw upon in sourcing investment opportunities for us. With respect to syndicate and club deals, GDFM has built a network of relationships with commercial and investment banks, finance companies and other investment funds as a result of the long track record of its investment professionals in the leveraged finance marketplace. With respect to GDFM’s origination channel, FB Advisor currently seeks to leverage the global presence of GSO to generate access to a substantial amount of directly originated transactions with attractive investment characteristics. We believe that the broad network of GDFM currently provides a significant pipeline of investment opportunities for us. GDFM also has a significant trading platform, which, we believe, currently allows us access to the secondary market for investment opportunities.
Disciplined, income-oriented investment philosophy
FB Advisor employs a defensive investment approach focused on long-term credit performance and principal protection. This investment approach involves a multi-stage selection process for each investment opportunity, as well as ongoing monitoring of each investment made, with particular emphasis on early detection of deteriorating credit conditions at portfolio companies which would result in adverse portfolio developments. This strategy is designed to maximize current income and minimize the risk of capital loss while maintaining the potential for long-term capital appreciation.
Investment expertise across all levels of the corporate capital structure
FB Advisor and GDFM believe that their broad expertise and experience investing at all levels of a company’s capital structure enable us to manage risk while affording us the opportunity for significant returns on our investments. We attempt to capitalize on this expertise in an effort to produce and maintain an investment portfolio that will perform in a broad range of economic conditions.
See “—The Transition of Investment Advisory Services” for information regarding GDFM’s resignation as our investment sub-adviser and our potential investment advisory relationship with KKR Credit and/or FS/KKR Advisor.
Operating and Regulatory Structure
Our investment activities are managed by FB Advisor and supervised by our board of directors, a majority of whom are independent. Under the investment advisory agreement, we have agreed to pay FB Advisor an annual base management fee based on the average value of our gross assets and an incentive fee based on our performance. See “Item 7. Management’s Discussion and Analysis of Financial Condition and Results of Operations—Contractual Obligations” for a description of the fees we pay to FB Advisor.
From time to time, FB Advisor may enter into sub-advisory relationships with registered investment advisers that possess skills or attributes that FB Advisor believes will aid it in achieving our investment objectives. FB Advisor engaged GDFM to act as our investment sub-adviser. GDFM currently assists FB Advisor in identifying investment opportunities and makes investment recommendations for approval by FB Advisor according to guidelines set by FB Advisor.
FB Advisor oversees our day-to-day operations, including the provision of general ledger accounting, fund accounting, legal services, investor relations, certain government and regulatory affairs activities, and other administrative services. FB Advisor also performs, or oversees the performance of, our corporate operations and
10
Table of Contents
required administrative services, which includes being responsible for the financial records that we are required to maintain and preparing reports for our stockholders and reports filed with the SEC. In addition, FB Advisor assists us in calculating our net asset value, overseeing the preparation and filing of tax returns and the printing and dissemination of reports to our stockholders, and generally overseeing the payment of our expenses and the performance of administrative and professional services rendered to us by others.
Pursuant to our administration agreement, dated April 16, 2014, or the administration agreement, we reimburse FB Advisor for expenses necessary to perform services related to our administration and operations, including FB Advisor’s allocable portion of the compensation and related expenses of certain personnel of FS Investments providing administrative services to us on behalf of FB Advisor. We reimburse FB Advisor no less than quarterly for all costs and expenses incurred by FB Advisor in performing its obligations and providing personnel and facilities under the administration agreement. FB Advisor allocates the cost of such services to us based on factors such as total assets, revenues, time allocations and/or other reasonable metrics. Our board of directors reviews the methodology employed in determining how the expenses are allocated to us and the proposed allocation of administrative expenses among us and certain affiliates of FB Advisor. Our board of directors then assesses the reasonableness of such reimbursements for expenses allocated to us based on the breadth, depth and quality of such services as compared to the estimated cost to us of obtaining similar services from third-party service providers known to be available. In addition, our board of directors considers whether any single third-party service provider would be capable of providing all such services at comparable cost and quality. Finally, our board of directors compares the total amount paid to FB Advisor for such services as a percentage of our net assets to the same ratio as reported by other comparable BDCs.
We have contracted with State Street Bank and Trust Company to provide various accounting and administrative services, including, but not limited to, preparing preliminary financial information for review by FB Advisor, preparing and monitoring expense budgets, maintaining accounting and corporate books and records, processing trade information provided by us and performing testing with respect to RIC compliance. Prior to April 1, 2015, we had contracted with Vigilant Compliance, LLC to provide the services of Salvatore Faia as our chief compliance officer.
As a BDC, we are required to comply with certain regulatory requirements. Also, while we are permitted to finance investments using debt, our ability to use debt will be limited in certain significant respects pursuant to the 1940 Act. Within the limits of existing regulation, we will adjust our use of debt, according to market conditions, to the level we believe will allow us to generate maximum risk-adjusted returns. See “—Regulation.” We have elected to be treated for U.S. federal income tax purposes, and intend to qualify annually, as a RIC under Subchapter M of the Code.
Investment Types
Our portfolio is comprised primarily of investments in senior secured loans and second lien secured loans of private middle market U.S. companies and, to a lesser extent, subordinated loans of private U.S. companies. Although we do not expect a significant portion of our portfolio to be comprised of subordinated loans, there is no limit on the amount of such loans in which we may invest. We may purchase interests in loans or make other debt investments, including investments in senior secured bonds, through secondary market transactions in the “over-the- counter” market or directly from our target companies as primary market or directly originated investments. In connection with our debt investments, we may on occasion receive equity interests such as warrants or options as additional consideration. We may also purchase or otherwise acquire minority interests in the form of common or preferred equity or equity-related securities, such as rights and warrants that may be converted into or exchanged for common stock or other equity or the cash value of common stock or other equity, in our target companies, generally in conjunction with one of our debt investments or through a co-investment with a financial sponsor, such as an institutional investor or private equity firm. In addition, a portion of our portfolio may be comprised of corporate bonds, CLOs, other debt securities and derivatives, including total return swaps and credit default swaps. FB Advisor will seek to tailor our investment focus as market conditions evolve. Depending on market conditions, we may increase or decrease our exposure to less
11
Table of Contents
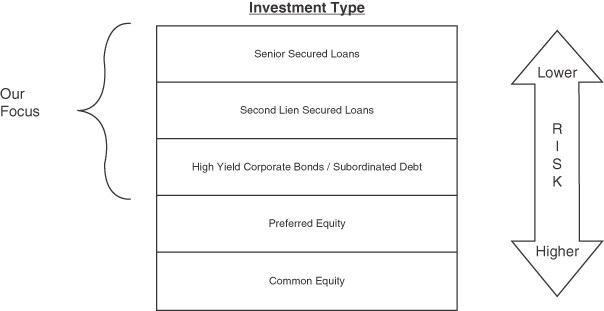
senior portions of the capital structure, where returns tend to be stronger in a more stable or growing economy, but less secure in weak economic environments. Below is a diagram illustrating where these investments lie in a typical portfolio company’s capital structure. Senior secured debt is situated at the top of the capital structure and typically has the first claim on the assets and cash flows of the company, followed by second lien secured debt, subordinated debt, preferred equity and, finally, common equity. Due to this priority of cash flows, an investment’s risk increases as it moves further down the capital structure. Investors are usually compensated for this risk associated with junior status in the form of higher returns, either through higher interest payments or potentially higher capital appreciation. We currently rely on FB Advisor’s and GDFM’s experience to structure investments, possibly using all levels of the capital structure, which we believe will perform in a broad range of economic environments.
Typical Leveraged Capital Structure Diagram
Senior Secured Loans
Senior secured loans are situated at the top of the capital structure. Because these loans generally have priority in payment, they carry the least risk among all investments in a firm. Generally, our senior secured loans are expected to have maturities of three to seven years, offer some form of amortization, and have first priority security interests in the assets of the borrower. Generally, we expect that the interest rate on our senior secured loans typically will have variable rates ranging between 6.0% and 13.0% over a standard benchmark, such as the prime rate or the London Interbank Offered Rate, or LIBOR.
Second Lien Secured Loans
Second lien secured loans are immediately junior to senior secured loans and have substantially the same maturities, collateral and covenant structures as senior secured loans. Second lien secured loans, however, are granted a second priority security interest in the assets of the borrower, which means that any realization of collateral will generally be applied to pay senior secured loans in full before second lien secured loans are paid and the value of the collateral may not be sufficient to repay in full both senior secured loans and second lien secured loans. In return for this junior ranking, second lien secured loans generally offer higher returns compared to senior secured debt. These higher returns come in the form of higher interest and in some cases the potential for equity participation through warrants, though to a lesser extent than with subordinated loans. Generally, we expect these loans to carry a fixed rate, or a floating current yield of 8.0% to 15.0% over a standard benchmark. In addition, we may receive additional returns from any warrants we may receive in connection with these investments.
12
Table of Contents
Senior Secured Bonds
Senior secured bonds are generally secured by collateral on a senior, pari passu or junior basis with other debt instruments in an issuer’s capital structure and have similar maturities and covenant structures as senior secured loans. Generally, we expect these investments to carry a fixed rate of 8.0% to 16.0%.
Subordinated Debt
In addition to senior secured loans, second lien secured loans and senior secured bonds, we may invest a portion of our assets in subordinated debt. Subordinated debt investments usually rank junior in priority of payment to senior debt and are often unsecured, but are situated above preferred equity and common equity in the capital structure. In return for their junior status compared to senior debt, subordinated debt investments typically offer higher returns through both higher interest rates and possible equity ownership in the form of warrants, enabling the lender to participate in the capital appreciation of the borrower. These warrants typically require only a nominal cost to exercise. We generally target subordinated debt with interest-only payments throughout the life of the security, with the principal due at maturity. Typically, subordinated debt investments have maturities of five to ten years. Generally, we expect these securities to carry a fixed rate, or a floating current yield of 8.0% to 18.0% over a standard benchmark. In addition, we may receive additional returns from any warrants we may receive in connection with these investments. In some cases, a portion of the total interest may accrue or be paid-in-kind, or PIK.
Equity and Equity-Related Securities
While we intend to maintain our focus on investments in debt securities, from time to time, when we see the potential for extraordinary gain, or in connection with securing particularly favorable terms in a debt investment, we may enter into investments in preferred or common equity, typically in conjunction with a private equity sponsor we believe to be sophisticated and seasoned. In addition, we typically receive the right to make equity investments in a portfolio company whose debt securities we hold in connection with the next equity financing round for that company. This right may provide us with the opportunity to further enhance our returns over time through equity investments in our portfolio companies. In addition, we may hold equity-related securities, such as rights and warrants that may be converted into or exchanged for common stock or other equity or the cash value of common stock or other equity, generally obtained in conjunction with one of our debt investments or through a co-investment with a financial sponsor, such as an institutional investor or private equity firm. In the future, we may achieve liquidity through a merger or acquisition of a portfolio company, a public offering of a portfolio company’s stock or by exercising our right, if any, to require a portfolio company to repurchase the equity-related securities we hold. With respect to any preferred or common equity investments, we expect to target an annual investment return of at least 15%.
Non-U.S. Securities
We may invest in non-U.S. securities, which may include securities denominated in U.S. dollars or in non-U.S. currencies, to the extent permitted by the 1940 Act.
Collateralized Loan Obligations
We may invest in CLOs, which are a form of securitization where payments from multiple loans are pooled together. Investors may purchase one or more tranches of a CLO and each tranche typically reflects a different level of seniority in payment from the CLO.
Other Securities
We may also invest from time to time in derivatives, including total return swaps and credit default swaps. We anticipate that any use of derivatives would primarily be as a substitute for investing in conventional securities.
13
Table of Contents
Cash and Cash Equivalents
We may maintain a certain level of cash or equivalent instruments, including money market funds, to make follow-on investments, if necessary, in existing portfolio companies or to take advantage of new opportunities.
Comparison of Targeted Debt Investments to Corporate Bonds
Loans to private companies are debt instruments that can be compared to corporate bonds to aid an investor’s understanding. As with corporate bonds, loans to private companies can range in credit quality depending on security-specific factors, including total leverage, amount of leverage senior to the security in question, variability in the issuer’s cash flows, the quality of assets securing debt and the degree to which such assets cover the subject company’s debt obligations. As is the case in the corporate bond market, we will require greater returns for securities that we perceive to carry increased risk. The companies in which we invest may be leveraged, often as a result of leveraged buyouts or other recapitalization transactions, and, in many cases, will not be rated by national rating agencies. When our targeted debt investments do carry ratings from a NRSRO, we believe that such ratings generally will be below investment grade (rated lower than “Baa3” by Moody’s or lower than “BBB-” by S&P). To the extent we make unrated investments, we believe that such investments would likely receive similar ratings if they were to be examined by a NRSRO. Compared to below-investment grade corporate bonds that are typically available to the public, our targeted senior secured and second lien secured loan investments are higher in the capital structure, have priority in receiving payment, are secured by the issuer’s assets, allow the lender to seize collateral if necessary, and generally exhibit higher rates of recovery in the event of default. Corporate bonds, on the other hand, are often unsecured obligations of the issuer.
The market for loans to private companies possesses several key differences compared to the corporate bond market. For instance, due to a possible lack of debt ratings for certain middle market firms, and also due to the reduced availability of information for private companies, investors must conduct extensive due diligence investigations before committing to an investment. This intensive due diligence process gives the investor significant access to management, which is often not possible in the case of corporate bondholders, who rely on underwriters, debt rating agencies and publicly available information for due diligence reviews and monitoring of corporate issuers. While holding these investments, private debt investors often receive monthly or quarterly updates on the portfolio company’s financial performance, along with possible representation on the company’s board of directors, which allows the investor to take remedial action quickly if conditions happen to deteriorate. Due to reduced liquidity, the relative scarcity of capital and extensive due diligence and expertise required on the part of the investor, we believe that private debt securities typically offer higher returns than corporate bonds of equivalent credit quality.
Sources of Income
The primary means through which our stockholders will receive a return of value is through interest income, dividends and capital gains generated by our investments. In addition to these sources of income, we may receive fees paid by our portfolio companies, including one-time closing fees paid at the time each investment is made. Closing fees typically range from 1.0% to 2.0% of the purchase price of an investment. In addition, we may generate revenues in the form of non-recurring commitment, origination, structuring or diligence fees, fees for providing managerial assistance, consulting fees and performance-based fees.
Risk Management
We seek to limit the downside potential of our investment portfolio by:
| • | applying our investment strategy guidelines for portfolio investments; |
| • | requiring a total return on investments (including both interest and potential appreciation) that adequately compensates us for credit risk; |
| • | allocating our portfolio among various issuers and industries, size permitting, with an adequate number of companies, across different industries, with different types of collateral; and |
14
Table of Contents
| • | negotiating or seeking debt investments with covenants or features that protect us while affording portfolio companies flexibility in managing their businesses consistent with preservation of capital, which may include affirmative and negative covenants, default penalties, lien protection, change of control provisions and board rights. |
We may also enter into interest rate hedging transactions at the sole discretion of FB Advisor. Such transactions will enable us to selectively modify interest rate exposure as market conditions dictate.
Affirmative Covenants
Affirmative covenants require borrowers to take actions that are meant to ensure the solvency of the company, facilitate the lender’s monitoring of the borrower, and ensure payment of interest and loan principal due to lenders. Examples of affirmative covenants include covenants requiring the borrower to maintain adequate insurance, accounting and tax records, and to produce frequent financial reports for the benefit of the lender.
Negative Covenants
Negative covenants impose restrictions on the borrower and are meant to protect lenders from actions that the borrower may take that could harm the credit quality of the lender’s investments. Examples of negative covenants include restrictions on the payment of dividends and restrictions on the issuance of additional debt without the lender’s approval. In addition, certain covenants restrict a borrower’s activities by requiring it to meet certain earnings interest coverage ratio and leverage ratio requirements. These covenants are also referred to as financial or maintenance covenants.
Investment Process
The investment professionals employed by FB Advisor and GDFM have spent their careers developing the resources necessary to invest in private companies. Our current transaction process is highlighted below. See “—The Transition of Investment Advisory Services” for information regarding GDFM’s resignation as our investment sub-adviser and our potential investment advisory relationship with KKR Credit and/or FS/KKR Advisor.
Our Transaction Process

Sourcing
In order to source transactions, FB Advisor currently seeks to leverage GDFM’s significant access to transaction flow, along with GDFM’s trading platform. GDFM seeks to generate investment opportunities through its trading platform, through syndicate and club deals, through relationships with investment banks, which may be exclusive to GDFM, and, subject to regulatory constraints and the allocation policies of GDFM and its affiliates, as applicable, through GSO’s direct origination channels. With respect to syndicate and club deals, GDFM has built a network of relationships with commercial and investment banks, finance companies and other investment funds as a result of the long track record of its investment professionals in the leveraged finance marketplace. GDFM may compensate certain brokers or other financial services firms out of its own profits or revenues for services provided in connection with the identification of appropriate investment opportunities. With respect to GDFM’s origination channel, FB Advisor currently seeks to leverage the global presence of GSO to generate access to a substantial amount of directly originated transactions with attractive investment characteristics. We believe that the broad network of GDFM currently provides a significant pipeline of investment opportunities for us.
15
Table of Contents
Evaluation
Initial Review. In its initial review of an investment opportunity to present to FB Advisor, GDFM’s transaction team examines information furnished by the target company and external sources, including rating agencies, if applicable, to determine whether the investment meets our basic investment criteria and other guidelines specified by FB Advisor, within the context of proper allocation of our portfolio among various issuers and industries, and offers an acceptable probability of attractive returns with identifiable downside risk. For the majority of securities available on the secondary market, a comprehensive analysis is conducted and continuously maintained by a dedicated GDFM research analyst, the results of which are available for the transaction team to review. In the case of a directly originated transaction, FB Advisor and GDFM conduct detailed due diligence investigations as necessary.
Credit Analysis/Due Diligence. Before undertaking an investment, the transaction teams from FB Advisor and GDFM conduct a thorough due diligence review of the opportunity to ensure the company fits our investment strategy, which may include:
| • | a full operational analysis to identify the key risks and opportunities of the target’s business, including a detailed review of historical and projected financial results; |
| • | a detailed analysis of industry dynamics, competitive position, regulatory, tax and legal matters; |
| • | on-site visits, if deemed necessary; |
| • | background checks to further evaluate management and other key personnel; |
| • | a review by legal and accounting professionals, environmental or other industry consultants, if necessary; |
| • | financial sponsor due diligence, including portfolio company and lender reference checks, if necessary; and |
| • | a review of management’s experience and track record. |
When possible, our advisory team seeks to structure transactions in such a way that our target companies are required to bear the costs of due diligence, including those costs related to any outside consulting work we may require.
Execution
Recommendation. FB Advisor currently engages GDFM to identify and recommend investment opportunities for its approval. GDFM seeks to maintain a defensive approach toward its investment recommendations by emphasizing risk control in its transaction process, which includes (i) the pre-review of each opportunity by one of its portfolio managers to assess the general quality, value and fit relative to our portfolio, (ii) where possible, transaction structuring with a focus on preservation of capital in varying economic environments and (iii) ultimate approval of investment recommendations by GDFM’s investment committee.
Approval. After completing its internal transaction process, GDFM makes formal recommendations for review and approval by FB Advisor. In connection with its recommendation, it transmits any relevant underwriting material and other information pertinent to the decision-making process. In addition, GDFM makes its staff available to answer inquiries by FB Advisor in connection with its recommendations. The consummation of a transaction requires unanimous approval of the members of FB Advisor’s investment committee.
Monitoring
Portfolio Monitoring. FB Advisor, currently with the help of GDFM, monitors our portfolio with a focus toward anticipating negative credit events. To maintain portfolio company performance and help to ensure a
16
Table of Contents
successful exit, FB Advisor and GDFM currently work closely with, as applicable, the lead equity sponsor, loan syndicator, portfolio company management, consultants, advisers and other security holders to discuss financial position, compliance with covenants, financial requirements and execution of the company’s business plan. In addition, depending on the size, nature and performance of the transaction, we may occupy a seat or serve as an observer on a portfolio company’s board of directors or similar governing body.
Typically, FB Advisor and GDFM receive financial reports detailing operating performance, sales volumes, margins, cash flows, financial position and other key operating metrics on a quarterly basis from our portfolio companies. FB Advisor and GDFM use this data, combined with due diligence gained through contact with the company’s customers, suppliers, competitors, market research and other methods, to conduct an ongoing, rigorous assessment of the company’s operating performance and prospects. GDFM may rely on brokers or other financial services firms that may help identify potential investments from time to time for assistance in monitoring these investments.
In addition to various risk management and monitoring tools, FB Advisor uses an investment rating system to characterize and monitor the expected level of returns on each investment in our portfolio. FB Advisor uses an investment rating scale of 1 to 5. See “Item 7. Management’s Discussion and Analysis of Financial Condition and Results of Operations—Portfolio Asset Quality” for a description of the conditions associated with each investment rating.
Valuation Process. Each quarter, we value investments in our portfolio, and such values are disclosed each quarter in reports filed with the SEC. Investments for which market quotations are readily available are recorded at such market quotations. With respect to investments for which market quotations are not readily available, our board of directors determines the fair value of such investments in good faith, utilizing the input of our valuation committee, FB Advisor and any other professionals or materials that our board of directors deems relevant, including GDFM, independent third-party pricing services and independent third-party valuation services, if applicable. See “Item 7. Management’s Discussion and Analysis of Financial Condition and Results of Operations—Critical Accounting Policies—Valuation of Portfolio Investments.”
Managerial Assistance. As a BDC, we must offer, and provide upon request, managerial assistance to certain of our portfolio companies. This assistance could involve, among other things, monitoring the operations of our portfolio companies, participating in board and management meetings, consulting with and advising officers of portfolio companies and providing other organizational and financial guidance. Depending on the nature of the assistance required, FB Advisor or currently GDFM will provide such managerial assistance on our behalf to portfolio companies that request this assistance. To the extent fees are paid for these services, we, rather than FB Advisor or GDFM, will retain any fees paid for such assistance.
Exit
While we attempt to invest in securities that may be sold in a privately negotiated over-the-counter market, providing us a means by which we may exit our positions, we expect that a large portion of our portfolio may not be sold on this secondary market. For any investments that are not able to be sold within this market, we focus primarily on investing in companies whose business models and growth prospects offer attractive exit possibilities, including repayment of our investments, an initial public offering of equity securities, a merger, a sale or a recapitalization, in each case with the potential for capital gains.
The Transition of Investment Advisory Services
Summary of the Transition
We currently receive investment advisory and administrative services from FB Advisor pursuant to the investment advisory agreement and the administration agreement. GDFM acts as our investment sub-adviser pursuant to the investment sub-advisory agreement. As we previously announced on December 11, 2017, GDFM intends to resign as our investment sub-adviser and terminate the investment sub-advisory agreement effective as
17
Table of Contents
of the GDFM end date. In connection with GDFM’s resignation as the investment sub-adviser to the Company, FS Investments and KKR Credit desire to enter into a relationship whereby FS Investments and KKR Credit will create a premier alternative lending platform for certain BDCs sponsored, advised and/or sub-advised by them. Accordingly, FB Advisor, together with FSIC II Advisor, LLC, FSIC III Advisor, LLC and FSIC IV Advisor, LLC, collectively the FS Advisor Entities, and KKR Credit and certain other parties have entered into a master transaction agreement setting out the terms of the relationship between FB Advisor and KKR Credit. In furtherance thereof, we desire to enter into (i) an investment advisory agreement with FB Advisor and an investment advisory agreement with KKR Credit, or collectively, the investment co-advisory agreements, pursuant to which FB Advisor and KKR Credit would act as our investment co-advisers, and/or (ii) an investment advisory agreement with FS/KKR Advisor or the joint advisor investment advisory agreement, pursuant to which FS/KKR Advisor would act as our investment adviser. In addition, prior to the effectiveness of the investment co-advisory agreements or the joint advisor investment advisory agreement, we may enter into an interim investment advisory agreement pursuant to Rule 15a-4 of the 1940 Act with KKR Credit.
We ultimately intend to receive investment advisory services from FS/KKR Advisor pursuant to the joint advisor investment advisory agreement. However, due to the various conditions required for the investment co-advisory agreements and the joint advisor investment advisory agreement to each become effective, we are seeking, as required by the 1940 Act, stockholder approval of each of the investment co-advisory agreements and the joint advisor investment advisory agreement in order to ensure the continuous provision of investment advisory services to the Company by FB Advisor, KKR Credit and/or FS/KKR Advisor, as applicable, each of which would replace the investment advisory agreement and the investment sub-advisory agreement.
If the joint advisor investment advisory agreement becomes effective on the same day as or prior to the date the investment co-advisory agreements would otherwise become effective, then FS/KKR Advisor would serve as investment adviser to the Company pursuant to the joint advisor investment advisory agreement and the investment co-advisory agreements would not become effective. If the joint advisor investment advisory agreement becomes effective after the investment co-advisory agreements have become effective, then the investment co-advisory agreements would automatically terminate upon the effectiveness of the joint advisor investment advisory agreement. Accordingly, the investment co-advisory agreements and the joint advisor investment advisory agreement would not be simultaneously effective at any time.
Concurrently with seeking stockholder approval of the investment co-advisory agreements and the joint advisor investment advisory agreement, KKR Credit is seeking exemptive relief, or the KKR exemptive relief, in the form of a new co-investment exemptive relief order issued by the SEC to KKR Credit that would permit us, following the effectiveness of the joint advisor investment advisory agreement, to co-invest in privately negotiated investment transactions with certain accounts managed by KKR Credit. There can be no assurance of the timing of the approval of the application or whether the requested KKR exemptive relief will be granted. Receipt of KKR exemptive relief is one of the conditions to the effectiveness of the joint advisor investment advisory agreement.
In order to transition our advisory services, FB Advisor, GDFM and certain of their affiliates have entered into a transition agreement, which provides that GDFM will continue to act as our investment sub-adviser through the GDFM end date and will cooperate with FB Advisor in implementing the transition of our investment advisory services from GDFM.
FS Investments and its affiliates (including FB Advisor) and KKR Credit are committed to transition our advisory services as described herein. To help the FS Investments and FB Advisor teams during the transition, KKR Credit will provide certain administrative services to the FS Advisor Entities and KKR Credit’s broker-dealer affiliate will provide certain sourcing and other services to the FS Advisor Entities, in each case, pursuant to a sourcing and administrative services agreement, or the sourcing agreement. FB Advisor intends to obtain services from KKR Credit’s broker-dealer affiliate pursuant to the sourcing agreement, such as identifying new investment opportunities for FB Advisor, prior to the Company’s entry into any advisory agreement with KKR Credit or one of its affiliates, including FS/KKR Advisor. The sourcing agreement will terminate with respect to
18
Table of Contents
FB Advisor on the earlier of the effective date of the investment co-advisory agreements or the joint advisor investment advisory agreement.
About KKR Credit
KKR Credit is a Delaware limited liability company, located at 555 California Street, 50th Floor, San Francisco, CA 94104, registered as an investment adviser with the SEC under the Advisers Act. It had over $45 billion of assets under management as of December 31, 2017 across investment funds, structured finance vehicles, specialty finance companies and separately managed accounts that invest capital in both liquid and illiquid credit strategies on behalf of some of the largest public and private pension plans, global financial institutions, university endowments and other institutional and public market investors. Its investment professionals utilize an industry and thematic approach to investing and benefit from access, where appropriate, to the broader resources and intellectual capital of KKR & Co. L.P., or KKR & Co. KKR Credit is a subsidiary of KKR & Co., a leading global investment firm with over $168 billion in assets under management as of December 31, 2017 that manages investments across multiple asset classes including private equity, energy, infrastructure, real estate, credit and hedge funds. KKR & Co. aims to generate attractive investment returns by following a patient and disciplined investment approach, employing world-class people, and driving growth and value creation in the assets it manages. KKR & Co. invests its own capital alongside the capital it manages for fund investors and brings debt and equity investment opportunities to others through its capital markets business.
KKR & Co.’s business offers a broad range of investment management services to its fund investors and provides capital markets services to KKR & Co., its portfolio companies and third parties. Throughout KKR & Co.’s history, KKR & Co. has consistently been a leader in the private equity industry. KKR & Co. has grown its firm by expanding its geographical presence and building businesses in new areas, such as credit, special situations, hedge funds, collateralized loan obligations, capital markets, infrastructure, energy and real estate. These efforts build on KKR & Co.’s core principles and industry expertise, allowing KKR & Co. to leverage the intellectual capital and synergies in its businesses, and to capitalize on a broader range of the opportunities it sources. Additionally, KKR & Co. has increased its focus on meeting the needs of its existing fund investors and in developing relationships with new investors in its funds.
KKR & Co. conducts its business with offices throughout the world, providing it with a pre-eminent global platform for sourcing transactions, raising capital and carrying out capital markets activities. KKR & Co.’s growth has been driven by value that it has created through its operationally focused investment approach, the expansion of its existing businesses, its entry into new lines of business, innovation in the products that it offers investors in its funds, an increased focus on providing tailored solutions to its clients and the integration of capital markets distribution activities.
KKR & Co. has also used its balance sheet as a significant source of capital to further grow and expand its business, increase its participation in its existing businesses and further align its interests with those of its fund investors and other stakeholders.
Below are the gross assets of two other BDCs advised or sub-advised by KKR Credit, each of which has a similar investment objective to that of the Company:
| Name |
Entity | Gross Assets(1) | ||||||
| Corporate Capital Trust, Inc. |
BDC | $ | 4,422,594 | |||||
| Corporate Capital Trust II |
BDC | $ | 157,442 | |||||
| (1) | As of September 30, 2017. |
About FS/KKR Advisor
FS/KKR Advisor is a newly-formed Delaware limited liability company, located at 201 Rouse Boulevard, Philadelphia, PA 19112. Prior to the effectiveness of the joint advisor investment advisory agreement, FS/KKR Advisor will register as an investment adviser with the SEC under the Advisers Act. FS/KKR Advisor will be
19
Table of Contents
jointly operated by FS Adviser and KKR Credit. The Company’s chairman and chief executive officer, Michael C. Forman, will serve as FS/KKR Advisor’s chairman and chief executive officer, and Todd C. Builione, the president of KKR Credit, will serve as FS/KKR Advisor’s president.
FS/KKR Advisor’s senior management team will have significant experience in private lending and private equity investing, and will have developed an expertise in using all levels of a firm’s capital structure to produce income-generating investments, while focusing on risk management. The team will also have extensive knowledge of the managerial, operational and regulatory requirements of publicly registered alternative asset entities, such as BDCs. The Company believes that the active and ongoing participation by FS Investments, KKR Credit and their respective affiliates in the credit markets, and the depth of experience and disciplined investment approach of FS/KKR Advisor’s management team, will allow FS/KKR Advisor to successfully execute the Company’s investment strategies.
Duties of FB Advisor, KKR Credit and FS/KKR Advisor
FB Advisor, together with the other FS Advisor Entities, and KKR Credit have agreed to coordinate their activities during the period in which the investment co-advisory agreements and the joint advisor investment advisory agreement would be in effect to avoid duplication of efforts and ensure a balanced and effective allocation of responsibilities and net fee revenue earned by the FS Advisor Entities, KKR Credit and FS/KKR Advisor, and efficiency in the provision of the required services to the Company thereunder.
Investment Co-Advisory Agreements
During the period the investment co-advisory agreements are in effect, the management of the Company’s investment portfolio will be the responsibility of a joint investment committee which will be comprised of three appointees of FS Investments or one of its affiliates (initially Sean Coleman, Brian Gerson and Michael Kelly) and three appointees of KKR Credit (initially Todd Builione, Daniel Pietrzak and Ryan Wilson). A team of dedicated investment professionals consisting of personnel from FB Advisor and KKR Credit will provide services to the Company. In performing their duties under the investment co-advisory agreements, FB Advisor and KKR Credit will provide the Company with services to facilitate the conduct of its business, including but not limited to: (a) sourcing, structuring, underwriting, performing diligence, executing and monitoring investments; (b) researching, selecting, trading and underwriting new investment opportunities; (c) investor account management; (d) legal, compliance, finance, accounting, operations and human resources services; and (e) risk management functions. The FS Advisor Entities and KKR Credit are collectively responsible for providing appropriate assets, resources, time and personnel in order to provide to the Company the services required under the investment co-advisory agreements.
Among other changes, the base management fee will be reduced from 1.75% under the investment advisory agreement to 1.50% under the investment co-advisory agreements (in the aggregate). For the incentive fee under the investment co-advisory agreements (in the aggregate), (i) the hurdle rate will be reduced to 1.75% per quarter and (ii) the “catch-up” feature will be reduced to begin at 2.1875%.
Joint Advisor Investment Advisory Agreement
During the period the joint advisor investment advisory agreement is in effect, the management of the Company’s investment portfolio will be the responsibility of FS/KKR Advisor’s investment committee which will be comprised of three appointees of FS Adviser (initially Sean Coleman, Brian Gerson and Michael Kelly) and three appointees of KKR Credit (initially Todd Builione, Daniel Pietrzak and Ryan Wilson). A team of dedicated investment professionals consisting of personnel from FS Investments and KKR Credit will provide services to the Company on behalf of FS/KKR Advisor. The investment committee will be responsible for establishing and monitoring the Company’s investment program, developing the portfolio, setting the risk parameters for the Company and approving all Company investments. Initial investment decisions will require the unanimous approval of the investment committee.
20
Table of Contents
In performing its duties under the joint advisor investment advisory agreement, FS/KKR Advisor will provide the Company with services to facilitate the conduct of its business, including but not limited to: (a) sourcing, structuring, underwriting, performing diligence, executing and monitoring investments; (b) researching, selecting, trading and underwriting new investment opportunities; (c) investor account management; (d) legal, compliance, finance, accounting, operations and human resources services; and (e) risk management functions. KKR Credit and FS Adviser will be collectively responsible for providing appropriate assets, resources, time and personnel to allow FS/KKR Advisor to provide to the Company the services required under the joint advisor investment advisory agreement.
Among other changes, the base management fee will be reduced from 1.75% under the investment advisory agreement to 1.50% under the joint advisor investment advisory agreement. For the incentive fee under the joint advisor investment advisory agreement, (i) the hurdle rate will be reduced to 1.75% per quarter and (ii) the “catch-up” feature will be reduced to begin at 2.1875%.
For additional information, see the Company’s definitive proxy statement filed on January 18, 2018.
Financing Arrangements
To seek to enhance our returns, we employ leverage as market conditions permit and at the discretion of FB Advisor, but in no event will leverage employed exceed 50% of the value of our assets, as required by the 1940 Act. See Note 8 to our consolidated financial statements contained in this annual report on Form 10-K for additional information regarding our financing arrangements.
Regulation
We have elected to be regulated as a BDC under the 1940 Act. The 1940 Act contains prohibitions and restrictions relating to transactions between BDCs and their affiliates, principal underwriters and affiliates of those affiliates or underwriters. The 1940 Act requires that a majority of our directors be persons other than “interested persons,” as that term is defined in the 1940 Act. In addition, the 1940 Act provides that we may not change the nature of our business so as to cease to be, or to withdraw our election as, a BDC unless approved by a majority of our outstanding voting securities.
The 1940 Act defines “a majority of the outstanding voting securities” as the lesser of (i) 67% or more of the voting securities present at a meeting if the holders of more than 50% of our outstanding voting securities are present or represented by proxy or (ii) 50% of our voting securities.
We will generally not be able to issue and sell our common stock at a price per share, after deducting underwriting commissions and discounts, that is below our net asset value per share. See “Item 1A. Risk Factors—Risks Related to Business Development Companies—Regulations governing our operation as a BDC and a RIC will affect our ability to raise, and the way in which we raise, additional capital or borrow for investment purposes, which may have a negative effect on our growth.” We may, however, sell our common stock, or warrants, options or rights to acquire our common stock, at a price below the then-current net asset value of our common stock if our board of directors determines that such sale is in our best interests and the best interests of our stockholders, and our stockholders approve such sale. At the 2017 annual stockholders meeting, our stockholders approved the sale of shares of our common stock at a price below the then-current net asset value per share, subject to certain conditions, during the period beginning on July 27, 2017 and expiring on July 27, 2018. We currently do not intend to utilize this authority to sell shares of our common stock at a price below the then-current net asset value per share. In addition, we may generally issue new shares of our common stock at a price below net asset value per share in rights offerings to existing stockholders, in payment of dividends and in certain other limited circumstances.
As a BDC, we are subject to certain regulatory restrictions in making our investments. For example, BDCs generally are not permitted to co-invest with certain affiliated entities in transactions originated by the BDC or its affiliates in the absence of an exemptive order from the SEC. However, BDCs are permitted to, and may,
21
Table of Contents
simultaneously co-invest in transactions where price is the only negotiated term. In an order dated June 4, 2013, the SEC granted exemptive relief permitting us, subject to the satisfaction of certain conditions, to co-invest in certain privately negotiated investment transactions with our co-investment affiliates. However, in connection with the potential investment advisory relationship with KKR Credit and/or FS/KKR Advisor, and in an effort to mitigate potential future conflicts of interest, our board of directors has authorized and directed that the Company exercise its rights under the Order to decline to participate in any new potential co-investment transaction pursuant to the Order that would be within the then-current investment objectives and strategies of the Company unless sourced by GDFM, KKR Credit or FS/KKR Advisor. Under the terms of this relief, a “required majority” (as defined in Section 57(o) of the 1940 Act) of our independent directors must make certain conclusions in connection with a co-investment transaction, including that (1) the terms of the proposed transaction, including the consideration to be paid, are reasonable and fair to us and our stockholders and do not involve overreaching of us or our stockholders on the part of any person concerned and (2) the transaction is consistent with the interests of our stockholders and is consistent with our investment objectives and strategy. We believe this relief has and may continue to enhance our ability to further our investment objectives and strategy. We believe this relief may also increase favorable investment opportunities for us, in part, by allowing us to participate in larger investments, together with our co-investment affiliates, than would be available to us if such relief had not been obtained. Because we did not seek exemptive relief to engage in co-investment transactions with GDFM and its affiliates, we are permitted to co-invest with GDFM and its affiliates only in accordance with existing regulatory guidance (e.g., where price is the only negotiated term). See “Item 1. Business—The Transition of Investment Advisory Services” for information regarding the exemptive relief KKR Credit is seeking with respect to the Company’s potential investment advisory relationship with FS/KKR Advisor.
Qualifying Assets
Under the 1940 Act, a BDC may not acquire any asset other than assets of the type listed in Section 55(a) of the 1940 Act, which are referred to as qualifying assets, unless, at the time the acquisition is made, qualifying assets represent at least 70% of the company’s total assets. The principal categories of qualifying assets relevant to our business are any of the following:
| 1. | Securities purchased in transactions not involving any public offering from the issuer of such securities, which issuer (subject to certain limited exceptions) is an eligible portfolio company, or from any person who is, or has been during the preceding 13 months, an affiliated person of an eligible portfolio company, or from any other person, subject to such rules as may be prescribed by the SEC. An eligible portfolio company is defined in the 1940 Act as any issuer which: |
| a. | is organized under the laws of, and has its principal place of business in, the United States; |
| b. | is not an investment company (other than a small business investment company wholly owned by the BDC) or a company that would be an investment company but for certain exclusions under the 1940 Act; and |
| c. | satisfies any of the following: |
| i. | does not have any class of securities that is traded on a national securities exchange; |
| ii. | has a class of securities listed on a national securities exchange, but has an aggregate market value of outstanding voting and non-voting common equity of less than $250 million; |
| iii. | is controlled by a BDC or a group of companies including a BDC and the BDC has an affiliated person who is a director of the eligible portfolio company; or |
| iv. | is a small and solvent company having total assets of not more than $4.0 million and capital and surplus of not less than $2.0 million. |
| 2. | Securities of any eligible portfolio company that we control. |
22
Table of Contents
| 3. | Securities purchased in a private transaction from a U.S. issuer that is not an investment company or from an affiliated person of the issuer, or in transactions incident thereto, if the issuer is in bankruptcy and subject to reorganization or if the issuer, immediately prior to the purchase of its securities was unable to meet its obligations as they came due without material assistance other than conventional lending or financing arrangements. |
| 4. | Securities of an eligible portfolio company purchased from any person in a private transaction if there is no ready market for such securities and we already own 60% of the outstanding equity of the eligible portfolio company. |
| 5. | Securities received in exchange for or distributed on or with respect to securities described in (1) through (4) above, or pursuant to the exercise of warrants or rights relating to such securities. |
| 6. | Cash, cash equivalents, U.S. government securities or high-quality debt securities maturing in one year or less from the time of investment. |
In addition, a BDC must have been organized and have its principal place of business in the United States and must be operated for the purpose of making investments in the types of securities described in (1), (2) or (3) above.
Managerial Assistance to Portfolio Companies
In order to count portfolio securities as qualifying assets for the purpose of the 70% test, we must either control the issuer of the securities or must offer to make available to the issuer of the securities (other than small and solvent companies described above) significant managerial assistance; except that, where we purchase such securities in conjunction with one or more other persons acting together, one of the other persons in the group may make available such managerial assistance. Making available managerial assistance means, among other things, any arrangement whereby the BDC, through its directors, officers or employees, offers to provide, and, if accepted, does so provide, significant guidance and counsel concerning the management, operations or business objectives and policies of a portfolio company.
Temporary Investments
Pending investment in other types of “qualifying assets,” as described above, our investments may consist of cash, cash equivalents, including money market funds, U.S. government securities or high-quality debt securities maturing in one year or less from the time of investment, which we refer to, collectively, as temporary investments, so that 70% of our assets are qualifying assets. Typically, we will invest in U.S. Treasury bills or in repurchase agreements, provided that such agreements are fully collateralized by cash or securities issued by the U.S. government or its agencies. A repurchase agreement involves the purchase by an investor, such as us, of a specified security and the simultaneous agreement by the seller to repurchase it at an agreed-upon future date and at a price that is greater than the purchase price by an amount that reflects an agreed-upon interest rate. There is no percentage restriction on the proportion of our assets that may be invested in such repurchase agreements. However, if more than 25% of our total assets constitute repurchase agreements from a single counterparty, we would not meet the diversification tests in order to maintain our qualification as a RIC for U.S. federal income tax purposes as described below under “—Taxation as a RIC.” Thus, we do not intend to enter into repurchase agreements with a single counterparty in excess of this limit. FB Advisor will monitor the creditworthiness of the counterparties with which we enter into repurchase agreement transactions.
Senior Securities
We are permitted, under specified conditions, to issue multiple classes of debt and one class of stock senior to our common stock if our asset coverage, as defined in the 1940 Act, is at least equal to 200% immediately after each such issuance. In addition, while any senior securities remain outstanding, we must make provisions to prohibit any distribution to our stockholders or the repurchase of such securities or shares unless we meet the
23
Table of Contents
applicable asset coverage ratios at the time of the distribution or repurchase. We may also borrow amounts up to 5% of the value of our total assets for temporary purposes without regard to asset coverage. For a discussion of the risks associated with leverage, see “Item 1A. Risk Factors—Risks Related to Debt Financing” and “Item 1A. Risk Factors—Risks Related to Business Development Companies.”
Code of Ethics
We and FB Advisor have each adopted a code of ethics pursuant to Rule 17j-1 promulgated under the 1940 Act that, among other things, establishes procedures for personal investments and restricts certain personal securities transactions. Personnel subject to the codes may invest in securities for their personal investment accounts, including securities that may be purchased or held by us, so long as such investments are made in accordance with each code’s requirements. Our code of ethics was filed as an exhibit to our current report on Form 8-K filed with the SEC on August 4, 2016 and FB Advisor’s code of ethics was filed as an exhibit to pre-effective amendment no. 1 to our registration statement on Form N-2 filed with the SEC on June 16, 2014. You may also read and copy these codes of ethics at the SEC’s Public Reference Room located at 100 F Street, N.E., Washington, D.C. 20549. You may obtain information on the operation of the Public Reference Room by calling the SEC at (202) 551-8090. In addition, each code of ethics is available on our website at www.fsinvestmentcorp.com and on the EDGAR Database on the SEC’s Internet site at www.sec.gov. You may also obtain a copy of each code of ethics, after paying a duplicating fee, by electronic request at the following e-mail address: publicinfo@sec.gov, or by writing the SEC’s Public Reference Section at 100 F Street, N.E., Washington, D.C. 20549.
Compliance Policies and Procedures
We and FB Advisor have adopted and implemented written policies and procedures reasonably designed to prevent violation of the federal securities laws and are required to review these compliance policies and procedures annually for their adequacy and the effectiveness of their implementation. Our chief compliance officer and the chief compliance officer of FB Advisor are responsible for administering these policies and procedures.
Proxy Voting Policies and Procedures
We have delegated our proxy voting responsibility to FB Advisor. The proxy voting policies and procedures of FB Advisor are set forth below. The guidelines are reviewed periodically by FB Advisor and our independent directors, and, accordingly, are subject to change.
As an investment adviser registered under the Advisers Act, FB Advisor has a fiduciary duty to act solely in the best interests of its clients. As part of this duty, it recognizes that it must vote client securities in a timely manner free of conflicts of interest and in the best interests of its clients. These policies and procedures for voting proxies for the investment advisory clients of FB Advisor are intended to comply with Section 206 of, and Rule 206(4)-6 promulgated under, the Advisers Act.
FB Advisor will vote proxies relating to our securities in the best interest of its clients’ stockholders. It will review on a case-by-case basis each proposal submitted for a stockholder vote to determine its impact on the portfolio securities held by its clients. Although FB Advisor will generally vote against proposals that may have a negative impact on its clients’ portfolio securities, it may vote for such a proposal if there exists compelling long-term reasons to do so.
The proxy voting decisions of FB Advisor are made by the senior officers who are responsible for monitoring each of its clients’ investments. To ensure that its vote is not the product of a conflict of interest, it will require that: (a) anyone involved in the decision-making process disclose to its chief compliance officer any potential conflict that he or she is aware of and any contact that he or she has had with any interested party regarding a proxy vote; and (b) employees involved in the decision making process or vote administration are prohibited from revealing how FB Advisor intends to vote on a proposal in order to reduce any attempted influence from interested parties.
24
Table of Contents
You may obtain information, without charge, regarding how FB Advisor voted proxies with respect to our portfolio securities by making a written request for proxy voting information to: Chief Compliance Officer, FS Investment Corporation, 201 Rouse Boulevard, Philadelphia, Pennsylvania 19112 or by calling us collect at (215) 495-1150.
Other
We will be periodically examined by the SEC for compliance with the 1940 Act.
We are required to provide and maintain a bond issued by a reputable fidelity insurance company to protect us against larceny and embezzlement. Furthermore, as a BDC, we are prohibited from protecting any director or officer against any liability to us or our stockholders arising from willful misconduct, bad faith, gross negligence or reckless disregard of the duties involved in the conduct of such person’s office.
Securities Exchange Act and Sarbanes-Oxley Act Compliance
We are subject to the reporting and disclosure requirements of the Securities Exchange Act of 1934, as amended, or the Exchange Act, including the filing of quarterly, annual and current reports, proxy statements and other required items. In addition, we are subject to the Sarbanes-Oxley Act, which imposes a wide variety of regulatory requirements on publicly-held companies and their insiders. Many of these requirements affect us. For example:
| • | pursuant to Rule 13a-14 promulgated under the Exchange Act, our chief executive officer and chief financial officer are required to certify the accuracy of the financial statements contained in our periodic reports; |
| • | pursuant to Item 307 of Regulation S-K, our periodic reports are required to disclose our conclusions about the effectiveness of our disclosure controls and procedures; |
| • | pursuant to Rule 13a-15 promulgated under the Exchange Act, our management is required to prepare a report regarding its assessment of our internal control over financial reporting; and |
| • | pursuant to Item 308 of Regulation S-K, our auditors must attest to, and report on, our management’s assessment of our internal control over financial reporting. |
The Sarbanes-Oxley Act requires us to review our current policies and procedures to determine whether we comply with the Sarbanes-Oxley Act and the regulations promulgated thereunder. We monitor our compliance with all regulations that are adopted under the Sarbanes-Oxley Act and take actions necessary to ensure that we are in compliance therewith.
Taxation as a RIC
We have elected to be subject to tax as a RIC under Subchapter M of the Code. As a RIC, we generally will not have to pay corporate-level U.S. federal income taxes on any ordinary income or capital gains that we timely distribute each tax year as distributions to our stockholders. To qualify for and maintain our qualification as a RIC, we must, among other things, meet certain source-of-income and asset diversification requirements (as described below). In addition, in order to maintain RIC tax treatment, we must distribute to our stockholders, for each tax year, distributions generally of an amount at least equal to 90% of our “investment company taxable income,” which is generally the sum of our net ordinary income plus the excess, if any, of realized net short-term capital gains over realized net long-term capital losses, determined without regard to any deduction for distributions paid, or the Annual Distribution Requirement.
If we:
| • | qualify as a RIC; and |
25
Table of Contents
| • | satisfy the Annual Distribution Requirement, |
then we will not be subject to U.S. federal income tax on the portion of our income or capital gains we distribute (or are deemed to distribute) as distributions to our stockholders. We will be subject to U.S. federal income tax at the regular corporate rates on any income or capital gains not distributed (or deemed distributed) as distributions to our stockholders.
As a RIC, we will be subject to a 4% nondeductible federal excise tax on certain undistributed income unless we distribute distributions in a timely manner to our stockholders generally of an amount at least equal to the sum of (1) 98% of our net ordinary income (taking into account certain deferrals and elections) for the calendar year, (2) 98.2% of our capital gain net income, which is the excess of capital gains in excess of capital losses, or “capital gain net income” (as adjusted for certain ordinary losses), for the one-year period ending October 31 of that calendar year and (3) any net ordinary income and capital gain net income for the preceding years that were not distributed during such years and on which we paid no U.S. federal income tax, or the Excise Tax Avoidance Requirement. Any distribution declared by us during October, November or December of any calendar year, payable to stockholders of record on a specified date in such a month and actually paid during January of the following calendar year, will be treated as if it had been paid by us, as well as received by our U.S. stockholders, on December 31 of the calendar year in which the distribution was declared.
We have previously incurred, and may incur in the future, such excise tax on a portion of our income and capital gains. While we intend to distribute income and capital gains to minimize exposure to the 4% excise tax, we may not be able to, or may choose not to, distribute amounts sufficient to avoid the imposition of the tax entirely. In that event, we generally will be liable for the excise tax only on the amount by which we do not meet the excise tax avoidance requirement.
In order to qualify as a RIC for U.S. federal income tax purposes, we must, among other things:
| • | continue to qualify as a BDC under the 1940 Act at all times during each tax year; |
| • | derive in each tax year at least 90% of our gross income from dividends, interest, payments with respect to certain securities, loans, gains from the sale of stock or other securities, net income from certain “qualified publicly-traded partnerships,” or other income derived with respect to our business of investing in such stock or other securities, or the 90% Income Test; and |
| • | diversify our holdings so that at the end of each quarter of the tax year: |
| • | at least 50% of the value of our assets consists of cash, cash equivalents, U.S. government securities, securities of other RICs, and other securities if such other securities of any one issuer do not represent more than 5% of the value of our assets or more than 10% of the outstanding voting securities of such issuer; and |
| • | no more than 25% of the value of our assets is invested in the securities, other than U.S. government securities or securities of other RICs, of one issuer, of two or more issuers that are controlled, as determined under applicable Code rules, by us and that are engaged in the same or similar or related trades or businesses or of certain “qualified publicly-traded partnerships,” or the Diversification Tests. |
A RIC is limited in its ability to deduct expenses in excess of its investment company taxable income. If our expenses in a given tax year exceed our investment company taxable income, we may experience a net operating loss for that tax year. However, a RIC is not permitted to carry forward net operating losses to subsequent tax years and such net operating losses do not pass through to its stockholders. In addition, deductible expenses can be used only to offset investment company taxable income, not net capital gain. A RIC may not use any net capital losses (that is, the excess of realized capital losses over realized capital gains) to offset its investment company taxable income, but may carry forward such net capital losses, and use them to offset future
26
Table of Contents
capital gains, indefinitely. Due to these limits on deductibility of expenses and net capital losses, we may for tax purposes have aggregate taxable income for several years that we are required to distribute and that is taxable to our stockholders even if such taxable income is greater than the net income we actually earn during those years.
For U.S. federal income tax purposes, we may be required to recognize taxable income in circumstances in which we do not receive a corresponding payment in cash. For example, if we hold debt instruments that are treated under applicable tax rules as having original issue discount (such as debt instruments with PIK interest or, in certain cases, increasing interest rates or debt instruments that were issued with warrants), we must include in income each tax year a portion of the original issue discount that accrues over the life of the obligation, regardless of whether cash representing such income is received by us in the same tax year. We may also have to include in income other amounts that we have not yet received in cash, such as deferred loan origination fees that are paid after origination of the loan or are paid in non-cash compensation such as warrants or stock. We anticipate that a portion of our income may constitute original issue discount or other income required to be included in taxable income prior to receipt of cash. Further, we may elect to amortize market discount and include such amounts in our taxable income in the current tax year, instead of upon their disposition, as an election not to do so would limit our ability to deduct interest expense for tax purposes.
We invest a portion of our net assets in below investment grade instruments. Investments in these types of instruments may present special tax issues for us. U.S. federal income tax rules are not entirely clear about issues such as when we may cease to accrue interest, original issue discount or market discount, when and to what extent deductions may be taken for bad debts or worthless instruments, how payments received on obligations in default should be allocated between principal and income and whether exchanges of debt instruments in a bankruptcy or workout context are taxable. We will address these and other issues to the extent necessary in order to seek to ensure that we distribute sufficient income to avoid any material U.S. federal income or excise tax.
Because any original issue discount or other amounts accrued will be included in our investment company taxable income for the tax year of the accrual, we may be required to make a distribution to our stockholders in order to satisfy the Annual Distribution Requirement, even though we will not have received any corresponding cash amount. As a result, we may have difficulty meeting the Annual Distribution Requirement necessary to maintain RIC tax treatment under Subchapter M of the Code. We may have to sell or otherwise dispose of some of our investments at times and/or at prices we would not consider advantageous, raise additional debt or equity capital or forgo new investment opportunities for this purpose. If we are not able to obtain cash from other sources, we may fail to qualify for RIC tax treatment and thus become subject to corporate-level income tax.
Although we do not presently expect to do so, we are authorized to borrow funds and to sell or otherwise dispose of assets in order to satisfy distribution requirements. However, under the 1940 Act, we are not permitted to make distributions to our stockholders while our debt obligations and other senior securities are outstanding unless certain “asset coverage” tests are met. See “—Regulation—Senior Securities.” Moreover, our ability to sell or otherwise dispose of assets to meet the Annual Distribution Requirement may be limited by (1) the illiquid nature of our portfolio and/or (2) other requirements relating to our status as a RIC, including the Diversification Tests. If we sell or otherwise dispose of assets in order to meet the Annual Distribution Requirement or the Excise Tax Avoidance Requirement, we may make such dispositions at times that, from an investment standpoint, are not advantageous.
A portfolio company in which we invest may face financial difficulties that require us to work-out, modify or otherwise restructure our investment in the portfolio company. Any such transaction could, depending upon the specific terms of the transaction, result in unusable capital losses and future non-cash income. Any such transaction could also result in our receiving assets that give rise to non-qualifying income for purposes of the 90% Income Test or otherwise would not count toward satisfying the Diversification Tests.
Some of the income that we might otherwise earn, such as fees for providing managerial assistance, certain fees earned with respect to our investments, income recognized in a work-out or restructuring of a portfolio
27
Table of Contents
investment, or income recognized from an equity investment in an operating partnership, may not satisfy the 90% Income Test. To manage the risk that such income might disqualify us as a RIC for failure to satisfy the 90% Income Test, one or more subsidiary entities treated as U.S. corporations for entity-level income tax purposes may be employed to earn such income and (if applicable) hold the related asset. Such subsidiary entities will be required to pay U.S. federal income tax on their earnings, which ultimately will reduce the yield to our stockholders on such fees and income.
Competition
Our primary competitors for investments include other BDCs and investment funds (including private equity funds, mezzanine funds and CLO funds). In addition, alternative investment vehicles, such as hedge funds, have begun to invest in areas in which they have not traditionally invested, including making investments in middle market private U.S. companies. We also compete with traditional financial services companies such as commercial banks. We believe we will be able to compete with these entities for financing opportunities on the basis of, among other things, the experience of FB Advisor’s senior management team, together with the wider resources of GSO’s investment team. Furthermore, while we believe that regulatory changes and other factors have diminished the role of traditional financial institutions and certain other capital providers in providing financing to middle market private U.S. companies, we are not certain whether this trend will continue as a result of the potentially changing regulatory landscape due to the presidential administration. For additional information, see “—Potential Market Opportunity” and “—Potential Competitive Strengths.”
Many of our competitors are substantially larger and have considerably greater financial, technical and marketing resources than we do. For example, some competitors may have a lower cost of capital and access to funding sources that are not available to us. In addition, some of our competitors may have higher risk tolerances or different risk assessments than we have. These characteristics could allow our competitors to consider a wider variety of investments, establish more relationships and offer better pricing and more flexible structuring than us. Furthermore, many of our competitors have greater experience operating under, or are not subject to, the regulatory restrictions that the 1940 Act imposes on us as a BDC. For additional information concerning the competitive risks we face, see “Item 1A. Risk Factors—Risks Related to Our Business and Structure—We may face increasing competition for investment opportunities, which could delay deployment of our capital, reduce returns and result in losses.”
Employees
We do not currently have any employees. Each of our executive officers is a principal, officer or employee of FB Advisor, which manages and oversees our investment operations. In the future, FB Advisor may retain additional investment personnel based upon its needs.
Available Information
We file with or submit to the SEC annual, quarterly and current periodic reports, proxy statements and other information meeting the informational requirements of the Exchange Act. This information is available free of charge by calling us collect at (215) 495-1150 or on our website at www.fsinvestmentcorp.com. Information contained on our website is not incorporated into this annual report on Form 10-K and you should not consider such information to be part of this annual report on Form 10-K. You also may inspect and copy these reports, proxy statements and other information, as well as this annual report on Form 10-K and related exhibits and schedules, at the Public Reference Room of the SEC at 100 F Street, N.E., Washington, D.C. 20549. Such information is also available from the EDGAR database on the SEC’s web site at www.sec.gov. You also can obtain copies of such information, after paying a duplicating fee, by sending a request by e-mail to publicinfo@sec.gov or by writing the SEC’s Public Reference Branch, Office of Consumer Affairs and Information Services, Securities and Exchange Commission, Washington, D.C. 20549. You may obtain information on the operation of the SEC’s Public Reference Room by calling the SEC at (202) 551-8090.
28
Table of Contents
| Item 1A. | Risk Factors |
Investing in our securities involves a number of significant risks. In addition to the other information contained in this annual report on Form 10-K, investors should consider carefully the following information before making an investment in our securities. If any of the following events occur, our business, financial condition and results of operations could be materially and adversely affected. In such case, the net asset value and market price of our common stock could decline or the value of our debt or equity investments may decline, and investors may lose all or part of their investment.
Risks Related to Economic Conditions
Future disruptions or instability in capital markets could negatively impact the valuation of our investments and our ability to raise capital.
From time to time, the global capital markets may experience periods of disruption and instability, which could be prolonged and which could materially and adversely impact the broader financial and credit markets, have a negative impact on the valuations of our investments and reduce the availability to us of debt and equity capital. For example, between 2008 and 2009, instability in the global capital markets resulted in disruptions in liquidity in the debt capital markets, significant write-offs in the financial services sector, the re-pricing of credit risk in the broadly syndicated credit market and the failure of major domestic and international financial institutions. In particular, the financial services sector was negatively impacted by significant write-offs as the value of the assets held by financial firms declined, impairing their capital positions and abilities to lend and invest. More recently, the macroeconomic environment, including recent social and political tensions in the U.S. and around the world (e.g., the United Kingdom referendum to leave the European Union), concerns regarding the Chinese economy and declines in commodity prices, has led to, and may continue to lead to, volatility in the broadly syndicated credit market as investors re-price credit risk.
While most of our investments are not publicly traded, applicable accounting standards require us to assume as part of our valuation process that our investments are sold in a principal market to market participants (even if we plan on holding an investment through its maturity) and impairments of the market values or fair market values of our investments, even if unrealized, must be reflected in our financial statements for the applicable period, which could result in significant reductions to our net asset value for the period. With certain limited exceptions, we are only allowed to borrow amounts or issue debt securities if our asset coverage, as calculated pursuant to the 1940 Act, equals at least 200% immediately after such borrowing. Equity capital may also be difficult to raise during periods of adverse or volatile market conditions because, subject to some limited exceptions, as a BDC, we are generally not able to issue additional shares of our common stock at a price less than net asset value without first obtaining approval for such issuance from our stockholders and our independent directors. If we are unable to raise capital or refinance existing debt on acceptable terms, then we may be limited in our ability to make new commitments or to fund existing commitments to our portfolio companies. Significant changes in the capital markets may also affect the pace of our investment activity and the potential for liquidity events involving our investments. Thus, the illiquidity of our investments may make it difficult for us to sell such investments to access capital if required, and as a result, we could realize significantly less than the value at which we have recorded our investments if we were required to sell them for liquidity purposes.
Uncertainty with respect to the financial stability of the United States and several countries in the European Union (EU) could have a significant adverse effect on our business, financial condition and results of operations.
In August 2011, S&P lowered its long-term sovereign credit rating on the U.S. from “AAA” to “AA+,” which was last affirmed by S&P in November 2016. Moody’s and Fitch Ratings, Inc. have also warned that they may downgrade the U.S. federal government’s credit rating. In addition, the economic downturn and the significant government interventions into the financial markets and fiscal stimulus spending over the last several years have contributed to significantly increased U.S. budget deficits. The U.S. government has on several occasions adopted legislation to suspend the federal debt ceiling to allow the U.S. Treasury Department to issue
29
Table of Contents
additional debt. Further downgrades or warnings by S&P or other rating agencies, and the U.S. government’s credit and deficit concerns in general, including issues around the federal debt ceiling, could cause interest rates and borrowing costs to rise, which may negatively impact both the perception of credit risk associated with our debt portfolio and our ability to access the debt markets on favorable terms. Furthermore, in February 2014, the Federal Reserve began scaling back its bond-buying program, or quantitative easing, which it ended in October 2014. Quantitative easing was designed to stimulate the economy and expand the Federal Reserve’s holdings of long-term securities until key economic indicators, such as the unemployment rate, showed signs of improvement. The Federal Reserve also raised interest rates several times since the fourth quarter of 2015. To the extent the Federal Reserve continues to raise rates, and without quantitative easing by the Federal Reserve, there is a risk that the debt markets may experience increased volatility and that the liquidity of certain of our investments may be reduced. It is unclear what other effects, if any, the end of quantitative easing, future interest rate raises, if any, and the pace of any such raises will have on the value of our investments or our ability to access the debt markets on favorable terms.
In 2010, a financial crisis emerged in Europe, triggered by high budget deficits and rising direct and contingent sovereign debt in Greece, Ireland, Italy, Portugal and Spain, which created concerns about the ability of these nations to continue to service their sovereign debt obligations. In January 2012, S&P lowered its long-term sovereign credit rating for France, Italy, Spain and six other European countries, which has negatively impacted global markets and economic conditions. In addition, in April 2012, S&P further lowered its long-term sovereign credit rating for Spain. While the financial stability of such countries has improved, risks resulting from any future debt crisis in Europe or any similar crisis could have a detrimental impact on the global economic recovery, sovereign and non-sovereign debt in these countries and the financial condition of U.S. and European financial institutions. Furthermore, following the United Kingdom’s referendum to leave the European Union, S&P lowered its long-term sovereign credit rating. In addition, the terms of the United Kingdom’s exit and any future referendums in other European countries may disrupt the global market. Market disruptions in Europe, including the increased cost of funding for certain governments and financial institutions, could negatively impact the global economy, and there can be no assurance that assistance packages will be available, or if available, will be sufficient to stabilize countries and markets in Europe. To the extent uncertainty regarding any economic recovery in Europe negatively impacts consumer confidence levels and spending, personal bankruptcy rates, levels of incurrence and default on consumer debt and home prices, or other credit factors, our business, financial condition and results of operations could be significantly and adversely affected.
Future economic recessions or downturns could impair our portfolio companies and harm our operating results.
Many of our portfolio companies may be susceptible to economic slowdowns or recessions and may be unable to repay our debt investments during these periods. Therefore, our non-performing assets are likely to increase, and the value of our portfolio is likely to decrease during these periods. Adverse economic conditions may also decrease the value of any collateral securing our debt investments. A prolonged recession may further decrease the value of such collateral and result in losses of value in our portfolio and a decrease in our revenues, net income and net asset value. Unfavorable economic conditions also could increase our funding costs, limit our access to the capital markets or result in a decision by lenders not to extend credit to us on terms we deem acceptable. These events could prevent us from increasing investments and harm our operating results. Economic downturns or recessions may also result in a portfolio company’s failure to satisfy financial or operating covenants imposed by us or other lenders, which could lead to defaults and, potentially, acceleration of the time when the loans are due and foreclosure on its assets representing collateral for its obligations, which could trigger cross defaults under other agreements and jeopardize our portfolio company’s ability to meet its obligations under the debt that we hold and the value of any equity securities we own. We may incur expenses to the extent necessary to seek recovery upon default or to negotiate new terms with a defaulting portfolio company.
30
Table of Contents
A prolonged continuation of depressed oil and natural gas prices could negatively impact the energy and power industry and energy-related investments within our investment portfolio.
Prices for oil and natural gas, which historically have been volatile and may continue to be volatile, may be subject to large fluctuations in response to relatively minor changes in the supply of and demand for oil and natural gas. A prolonged continuation of depressed oil and natural gas prices would adversely affect the credit quality and performance of certain of our debt and equity investments in energy and power and related companies. A decrease in credit quality and performance would, in turn, negatively affect the fair value of these investments, which would consequently negatively affect our net asset value. Should a prolonged period of depressed oil and natural gas prices occur, the ability of certain of our portfolio companies in the energy and power and related industries to satisfy financial or operating covenants imposed by us or other lenders may be adversely affected, which could, in turn, negatively impact their financial condition and their ability to satisfy their debt service and other obligations. Likewise, should a prolonged period of depressed oil and natural gas prices occur, it is possible that the cash flow and profit generating capacity of these portfolio companies could also be adversely affected thereby negatively impacting their ability to pay us dividends or distributions on our investments.
Risks Related to Our Business and Structure
Our ability to achieve our investment objectives depends on FB Advisor’s and GDFM’s ability to manage and support our investment process and if either our agreement with FB Advisor or FB Advisor’s agreement with GDFM were to be terminated, or if either FB Advisor or GDFM lose any members of their respective senior management teams, our ability to achieve our investment objectives could be significantly harmed.
Because we have no employees, we depend on the investment expertise, skill and network of business contacts of FB Advisor and, currently, GDFM. FB Advisor, with the assistance of GDFM, evaluates, negotiates, structures, executes, monitors and services our investments. Our future success depends to a significant extent on the continued service and coordination of FB Advisor and GDFM, as well as their respective senior management teams. The departure of any members of FB Advisor’s senior management team could have a material adverse effect on our ability to achieve our investment objectives. Likewise, the departure of any key employees of GDFM or termination of key industry relationships may impact its ability to render services to us under the terms of its investment sub-advisory agreement with FB Advisor.
Our ability to achieve our investment objectives depends on FB Advisor’s ability, with the assistance of GDFM, to identify, analyze, invest in, finance and monitor companies that meet our investment criteria. FB Advisor’s capabilities in structuring the investment process, providing competent, attentive and efficient services to us, and facilitating access to financing on acceptable terms depend on the employment of investment professionals in an adequate number and of adequate sophistication to match the corresponding flow of transactions. To achieve our investment objectives, FB Advisor may need to hire, train, supervise and manage new investment professionals to participate in our investment selection and monitoring process. FB Advisor may not be able to find investment professionals in a timely manner or at all. Failure to support our investment process could have a material adverse effect on our business, financial condition and results of operations.
In addition, each of the investment advisory agreement and administration agreement that FB Advisor has entered into with us, as well as the investment sub-advisory agreement that FB Advisor has entered into with GDFM, have termination provisions that allow the parties to terminate the agreements without penalty. The investment advisory agreement and administration agreement may each be terminated at any time, without penalty, by FB Advisor, upon 60 days’ notice to us. The investment sub-advisory agreement may be terminated at any time, without the payment of any penalty, upon 60 days’ written notice by GDFM or, if our board of directors or the holders of a majority of our outstanding voting securities determine that the investment sub-advisory agreement with GDFM should be terminated, by FB Advisor. If either agreement is terminated, it may adversely affect the quality of our investment opportunities. In addition, in the event such agreements are terminated, it may be difficult for us to replace FB Advisor or for FB Advisor to replace GDFM. Furthermore,
31
Table of Contents
the termination of either of these agreements may adversely impact the terms of any financing arrangement into which we may enter, which could have a material adverse effect on our business and financial condition. It is currently contemplated that the investment sub-advisory agreement will terminate on the GDFM end date and that subject to certain conditions, we will enter into the proposed investment co-advisory agreements and the joint advisor investment advisory agreement with FB Advisor, KKR Credit or FS/KKR Advisor, as applicable. GDFM intends to resign as our investment sub-adviser effective as of the GDFM end date regardless of whether the proposed investment co-advisory agreements and/or the joint advisor investment advisory agreement with FB Advisor, KKR Credit or FS/KKR Advisor, as applicable, have become effective. See “—There can be no assurance that the proposed investment co-advisory agreements or the joint advisor investment advisory agreement with FB Advisor, KKR Credit or FS/KKR Advisor, as applicable, will receive stockholder approval or go into effect. The failure of such investment advisory agreements to go into effect could adversely affect our stock price, business, financial condition, results of operations or ability to achieve our investment objective.” In the event that KKR Credit and/or FS/KKR Advisor becomes our investment co-adviser or adviser as contemplated, at the time of such replacement, all of the risk factors identified in Item 1A of this annual report on Form 10-K that relate to GDFM will also be applicable to KKR Credit and FS/KKR Advisor.
There can be no assurance that the proposed investment co-advisory agreements or the joint advisor investment advisory agreement with FB Advisor, KKR Credit or FS/KKR Advisor, as applicable, will receive stockholder approval or go into effect. The failure of such investment advisory agreements to go into effect could adversely affect our stock price, business, financial condition, results of operations or ability to achieve our investment objective.
On January 18, 2018, the Company filed a definitive proxy statement soliciting stockholder approval of each of the investment co-advisory agreements and the joint advisor investment advisory agreement, each of which would replace the investment advisory agreement and the investment sub-advisory agreement. The effectiveness of each of the investment co-advisory agreements and the joint advisor investment advisory agreement is subject to various conditions, including stockholder approval thereof. If any of these conditions are not satisfied or (to the extent permitted) waived, the investment co-advisory agreements and/or the joint advisor investment advisory agreement may not go into effect. GDFM intends to resign as the Company’s investment sub-adviser effective as of the GDFM end date regardless of whether the investment co-advisory agreements and/or the joint advisor investment advisory agreement have become effective. There can be no assurance that the investment co-advisory agreements and/or the joint advisor investment advisory agreement will become effective prior to the GDFM end date or at all. As a result, the failure of the investment co-advisory agreements and/or the joint advisor investment advisory agreement to go into effect could adversely affect our stock price, business, financial condition, results of operations or ability to achieve our investment objective.
There can be no assurance of the timing of the approval of the application for the KKR exemptive relief or that the KKR exemptive relief will be granted by the SEC.
Concurrently with the Company soliciting stockholder approval of the investment co-advisory agreements and the joint advisor investment advisory agreement, KKR Credit is seeking the KKR exemptive relief in the form of a new co-investment exemptive relief order issued by the SEC to KKR Credit that will cover the Company and would permit the Company, following the effectiveness of the joint advisor investment advisory agreement, to co-invest in privately negotiated investment transactions with certain accounts managed by KKR Credit. There can be no assurance of the timing of the approval of the application for the KKR exemptive relief or whether the requested KKR exemptive relief will be granted by the SEC. Receipt of the KKR exemptive relief is one of the conditions to the effectiveness of the joint advisor investment advisory agreement. Thus, if the KKR exemptive relief is not granted, the joint advisor investment advisory agreement may not go into effect. The failure of the joint advisor investment advisory agreement to go into effect could adversely affect our stock price, business, financial condition, results of operations or ability to achieve our investment objectives.
32
Table of Contents
FS/KKR Advisor will be a newly-formed investment adviser without a track record of acting as an investment adviser to a BDC, and any failure by FS/KKR Advisor to manage and support our investment process may hinder the achievement of our investment objectives.
Because FS/KKR Advisor will be a newly-formed investment adviser jointly operated by FS Adviser (an affiliate of FB Advisor) and KKR Credit, FS/KKR Advisor will have no prior experience acting as an investment adviser to a BDC. The 1940 Act and the Code impose numerous constraints on the operations of BDCs that do not apply to other investment vehicles. While both FB Advisor and KKR Credit have individually acted as investment advisers to BDCs previously, FS/KKR Advisor’s lack of experience in managing a portfolio of assets under the constraints of the 1940 Act and the Code may hinder FS/KKR Advisor’s ability to take advantage of attractive investment opportunities and, as a result, may adversely affect our ability to achieve our investment objectives. FB Advisor’s and KKR Credit’s individual track records and achievements are not necessarily indicative of the future results they will achieve as a joint investment adviser. Accordingly, we can offer no assurance that we will replicate the historical performance of other investment companies with which FB Advisor and KKR Credit have been affiliated, and we caution that our investment returns could be lower than the returns achieved by such other companies.
The transactions contemplated by the transition agreement may not be consummated, and the transition of our investment advisory services may not be completed or may not deliver the benefits we anticipate.
In order to transition the Company’s investment advisory services, on December 10, 2017, FB Advisor, GDFM and certain of their respective affiliates entered into a transition agreement, which provides that GDFM will continue to act as the investment sub-adviser to the Company through the GDFM end date and will cooperate with FB Advisor in implementing the transition of investment advisory services from GDFM for both the Company and several other BDCs. The transition of investment advisory services is subject to certain conditions that may not occur, and if we do not consummate the transactions contemplated by the transition agreement, we may not successfully complete the proposed transition of investment advisory services and/or realize the anticipated benefits of the transition.
We are devoting a significant portion of our time and resources to consummating the transactions contemplated by the transition agreement. However, there can be no assurance that such activities will result in the consummation of the transactions or the completion of the proposed transition of investment advisory services. Additionally, even if we are able to consummate the transactions and complete the transition, the transition may not deliver the benefits we anticipate.
Because our business model depends to a significant extent upon relationships with private equity sponsors, investment banks and commercial banks, the inability of FB Advisor and GDFM to maintain or develop these relationships, or the failure of these relationships to generate investment opportunities, could adversely affect our business.
If FB Advisor or GDFM fails to maintain its existing relationships with private equity sponsors, investment banks and commercial banks on which they rely to provide us with potential investment opportunities, or develop new relationships with other sponsors or sources of investment opportunities, we may not be able to grow our investment portfolio. In addition, individuals with whom FB Advisor and GDFM have relationships generally are not obligated to provide us with investment opportunities, and, therefore, there is no assurance that such relationships will generate investment opportunities for us. GDFM may compensate certain brokers or other financial services firms out of its own profits or revenues for services provided in connection with the identification of appropriate investment opportunities.
We may face increasing competition for investment opportunities, which could delay deployment of our capital, reduce returns and result in losses.
We compete for investments with other BDCs and investment funds (including private equity funds, mezzanine funds and CLO funds), as well as traditional financial services companies such as commercial banks
33
Table of Contents
and other sources of funding. Moreover, alternative investment vehicles, such as hedge funds, have begun to invest in areas in which they have not traditionally invested, including making investments in middle market private U.S. companies. Furthermore, the potentially changing regulatory landscape as a result of the presidential administration may increase the number of middle-market investors. As a result of these new entrants, competition for investment opportunities in middle market private U.S. companies may intensify. Many of our competitors are substantially larger and have considerably greater financial, technical and marketing resources than we do. For example, some competitors may have a lower cost of capital and access to funding sources that are not available to us. In addition, some of our competitors may have higher risk tolerances or different risk assessments than we have. These characteristics could allow our competitors to consider a wider variety of investments, establish more relationships and offer better pricing and more flexible structuring than we are able to do. We may lose investment opportunities if we do not match our competitors’ pricing, terms and structure. If we are forced to match our competitors’ pricing, terms and structure, we may not be able to achieve acceptable returns on our investments or may bear substantial risk of capital loss. A significant part of our competitive advantage stems from the fact that the market for investments in middle market private U.S. companies is underserved by traditional commercial banks and other financial sources. A significant increase in the number and/or the size of our competitors in this target market could force us to accept less attractive investment terms. Furthermore, many of our competitors have greater experience operating under, or are not subject to, the regulatory restrictions that the 1940 Act imposes on us as a BDC.
Our board of directors may change our operating policies and strategies without prior notice or stockholder approval.
Our board of directors has the authority to modify or waive our current operating policies, investment criteria and strategies without prior notice and without stockholder approval. Moreover, we have significant investment flexibility within our investment strategies. Therefore, we may invest our assets in ways with which investors may not agree. We also cannot predict the effect any changes to our current operating policies, investment criteria and strategies would have on our business, net asset value, operating results and the value of our stock. However, the effects might be adverse, which could negatively impact our ability to pay stockholders distributions and cause them to lose all or part of their investment.
Changes in laws or regulations governing our operations or the operations of our business partners may adversely affect our business or cause us to alter our business strategy.
We, our portfolio companies and our business partners are subject to regulation at the local, state and federal level. New legislation may be enacted or new interpretations, rulings or regulations could be adopted, including those governing the types of investments we are permitted to make and the deductability of interest expense by our portfolio companies, potentially with retroactive effect. In particular, over the last several years there has been an increase in regulatory attention to the extension of credit outside of the traditional banking sector, raising the possibility that some portion of the non-bank financial sector will be subject to new regulation. New or repealed legislation, interpretations, rulings or regulations could require changes to certain business practices of us or our portfolio companies, negatively impact the operations, cash flows or financial condition of us or our portfolio companies, impose additional costs on us or our portfolio companies or otherwise adversely affect our business or the business of our portfolio companies. In addition, any changes to the laws and regulations governing our operations, including with respect to permitted investments, may cause us to alter our investment strategy to avail ourselves of new or different opportunities or make other changes to our business. Such changes could result in material differences to our strategies and plans as set forth in this annual report on Form 10-K and may result in our investment focus shifting from the areas of expertise of FB Advisor and GDFM to other types of investments in which FB Advisor and GDFM may have less expertise or little or no experience. Thus, any such changes, if they occur, could have a material adverse effect on our results of operations and the value of a stockholder’s investment.
34
Table of Contents
The impact on us of recent financial reform legislation, including the Dodd-Frank Act, is uncertain.
The Dodd-Frank Wall Street Reform and Consumer Protection Act, as amended, or the Dodd-Frank Act, institutes a wide range of reforms that will have an impact on financial institutions. Many of the requirements called for in the Dodd-Frank Act are expected to be implemented over time, most of which will likely be subject to implementing regulations over the course of several years. However, the presidential administration has announced its intention to repeal, amend or replace certain portions of Dodd-Frank and the regulations implemented thereunder. Given the uncertainty associated with the manner in which and whether the provisions of the Dodd-Frank Act will be implemented, repealed, amended or replaced, the full impact such requirements will have on our business, results of operations or financial condition is unclear. The changes resulting from the Dodd-Frank Act or any changes to the regulations already implemented thereunder may require us to invest significant management attention and resources to evaluate and make necessary changes in order to comply with new statutory and regulatory requirements. Failure to comply with any such laws, regulations or principles, or changes thereto, may negatively impact our business, results of operations and financial condition. While we cannot predict what effect any changes in the laws or regulations or their interpretations would have on us as a result of recent financial reform legislation, these changes could be materially adverse to us and our stockholders.
Future legislation may allow us to incur additional leverage.
As a BDC, we are generally not permitted to incur indebtedness unless immediately after such borrowing we have an asset coverage for total borrowings of at least 200% (i.e., the amount of debt may not exceed 50% of the value of our assets). Legislation was previously introduced in the U.S. House of Representatives that proposed a modification of this section of the 1940 Act to permit an increase in the amount of debt that BDCs could incur by modifying the percentage from 200% to 150%. Similar legislation may be reintroduced and may pass that permits us to incur additional leverage under the 1940 Act. As a result, we may be able to incur additional indebtedness in the future, and, therefore, the risk of an investment in us may increase.
Future legislation or rules could modify how we treat derivatives and other financial arrangements for purposes of our compliance with the leverage limitations of the 1940 Act.
Future legislation or rules may modify how we treat derivatives and other financial arrangements for purposes of our compliance with the leverage limitations of the 1940 Act. For example, the SEC proposed a new rule in December 2015 that is designed to enhance the regulation of the use of derivatives by registered investments companies and business development companies. While the adoption of the December 2015 rule is currently uncertain, the proposed rule, if adopted, or any future legislation or rules, may modify how leverage is calculated under the 1940 Act and, therefore, may increase or decrease the amount of leverage currently available to us under the 1940 Act, which may be materially adverse to us and our stockholders.
As a public company, we are subject to regulations not applicable to private companies, such as provisions of the Sarbanes-Oxley Act. Efforts to comply with such regulations will involve significant expenditures, and non-compliance with such regulations may adversely affect us.
As a public company, we incur legal, accounting and other expenses, including costs associated with the periodic reporting requirements applicable to a company whose securities are registered under the Exchange Act, as well as additional corporate governance requirements, including requirements under the Sarbanes-Oxley Act, and other rules implemented by the SEC and the listing standards of the NYSE. Our management is required to report on our internal control over financial reporting pursuant to Section 404 of the Sarbanes-Oxley Act and rules and regulations of the SEC thereunder. In particular, our management is required to review on an annual basis our internal control over financial reporting, and on a quarterly and annual basis to evaluate and disclose changes in our internal control over financial reporting. Section 404 of the Sarbanes-Oxley Act also generally requires an attestation from our independent registered public accounting firm on the effectiveness of our internal control over financial reporting.
We incur significant expenses in connection with our compliance with the Sarbanes-Oxley Act and other regulations applicable to public companies, which may negatively impact our financial performance and our
35
Table of Contents
ability to make distributions. Compliance with such regulations also requires a significant amount of our management’s time and attention. For example, we cannot be certain as to the timing of the completion of our Sarbanes-Oxley mandated evaluations, testings and remediation actions, if any, or the impact of the same on our operations, and we may not be able to ensure that the process is effective or that our internal control over financial reporting are or will be deemed effective in the future. In the event that we are unable to maintain an effective system of internal control and maintain compliance with the Sarbanes-Oxley Act and related rules, we may be adversely affected.
We may experience fluctuations in our quarterly results.
We could experience fluctuations in our quarterly operating results due to a number of factors, including our ability or inability to make investments in companies that meet our investment criteria, the interest rate payable on the debt securities we acquire, the level of our expenses, variations in and the timing of fee income and the recognition of realized and unrealized gains or losses, the degree to which we encounter competition in our markets and general economic conditions. As a result of these factors, results for any previous period should not be relied upon as being indicative of performance in future periods.
If we, our affiliates and our and their respective third-party service providers are unable to maintain the availability of electronic data systems and safeguard the security of data, our ability to conduct business may be compromised, which could impair our liquidity, disrupt our business, damage our reputation or otherwise adversely affect our business.
Cybersecurity refers to the combination of technologies, processes, and procedures established to protect information technology systems and data from unauthorized access, attack, or damage. We, our affiliates and our and their respective third-party service providers are subject to cybersecurity risks. Cybersecurity risks have significantly increased in recent years and, while we have not experienced any material losses relating to cyber attacks or other information security breaches, we could suffer such losses in the future. Our, our affiliates and our and their respective third-party service providers’ computer systems, software and networks may be vulnerable to unauthorized access, computer viruses or other malicious code and other events that could have a security impact. If one or more of such events occur, this potentially could jeopardize confidential and other information, including nonpublic personal information and sensitive business data, processed and stored in, and transmitted through, computer systems and networks, or otherwise cause interruptions or malfunctions in our operations or the operations of our affiliates and our and their respective third-party service providers. This could result in significant losses, reputational damage, litigation, regulatory fines or penalties, or otherwise adversely affect our business, financial condition or results of operations. Privacy and information security laws and regulation changes, and compliance with those changes, may result in cost increases due to system changes and the development of new administrative processes. In addition, we may be required to expend significant additional resources to modify our protective measures and to investigate and remediate vulnerabilities or other exposures arising from operational and security risks.
Our business and operations could be negatively affected if we become subject to stockholder activism, which could cause us to incur significant expense, hinder the execution of our investment strategy or impact our stock price.
Stockholder activism, which could take many forms, including making public demands that we consider certain strategic alternatives for the Company, engaging in public campaigns to attempt to influence our corporate governance and/or our management, and commencing proxy contests to attempt to elect the activists’ representatives or others to our board of directors, or arise in a variety of situations, has been increasing in the BDC space recently. While we are currently not subject to any stockholder activism, due to the potential volatility of our stock price and for a variety of other reasons, including the recently announced proposed transition as described under “Item 1. Business—The Transition of Investment Advisory Services,” we may in the future become the target of stockholder activism. Stockholder activism could result in substantial costs and divert management’s and our board of directors’ attention and resources from our business. Additionally, such
36
Table of Contents
stockholder activism could give rise to perceived uncertainties as to our future and adversely affect our relationships with service providers and our portfolio companies. Also, we may be required to incur significant legal and other expenses related to any activist stockholder matters. Further, our stock price could be subject to significant fluctuation or otherwise be adversely affected by the events, risks and uncertainties of any stockholder activism.
Risks Related to FB Advisor, GDFM and their respective Affiliates
FB Advisor, GDFM and their respective affiliates, including our officers and some of our directors, face conflicts of interest as a result of compensation arrangements between us and FB Advisor, and FB Advisor and GDFM, which could result in actions that are not in the best interests of our stockholders.
FB Advisor, GDFM and their respective affiliates receive substantial fees from us in return for their services, and these fees could influence the advice provided to us. We pay to FB Advisor an incentive fee that is based on the performance of our portfolio and an annual base management fee that is based on the average value of our gross assets, and FB Advisor shares a portion of these fees with GDFM pursuant to the investment sub-advisory agreement between FB Advisor and GDFM. Because the incentive fee is based on the performance of our portfolio, FB Advisor may be incentivized to make investments on our behalf, and GDFM may be incentivized to recommend investments for us to FB Advisor, that are riskier or more speculative than would be the case in the absence of such compensation arrangement. The way in which the incentive fee is determined may also encourage FB Advisor to use leverage to increase the return on our investments. In addition, because the base management fee is based upon the average value of our gross assets, which includes any borrowings for investment purposes, FB Advisor may be incentivized to recommend the use of leverage or the issuance of additional equity to make additional investments and increase the average value of our gross assets. Under certain circumstances, the use of leverage may increase the likelihood of default, which could disfavor holders of our common stock. Our compensation arrangements could therefore result in our making riskier or more speculative investments, or relying more on leverage to make investments, than would otherwise be the case. This could result in higher investment losses, particularly during cyclical economic downturns.
We may be obligated to pay FB Advisor incentive compensation on income that we have not received.
Any incentive fee payable by us that relates to our net investment income may be computed and paid on income that may include interest that has been accrued but not yet received. If a portfolio company defaults on a loan that is structured to provide accrued interest, it is possible that accrued interest previously included in the calculation of the incentive fee will become uncollectible. FB Advisor is not under any obligation to reimburse us for any part of the incentive fee it received that was based on accrued income that we never received as a result of a default by an entity on the obligation that resulted in the accrual of such income, and such circumstances would result in our paying an incentive fee on income we never received.
For U.S. federal income tax purposes, we are required to recognize taxable income (such as deferred interest that is accrued as original issue discount) in some circumstances in which we do not receive a corresponding payment in cash. Under such circumstances, we may have difficulty meeting the Annual Distribution Requirement necessary to maintain RIC tax treatment under the Code. This difficulty in making the required distribution may be amplified to the extent that we are required to pay an incentive fee with respect to such accrued income. As a result, we may have to sell some of our investments at times and/or at prices we would not consider advantageous, raise additional debt or equity capital, or forgo new investment opportunities for this purpose. If we are not able to obtain cash from other sources, we may fail to qualify for RIC tax treatment and thus become subject to corporate-level income tax.
There may be conflicts of interest related to obligations FB Advisor’s and GDFM’s senior management and investment teams have to our affiliates and to other clients.
The members of the senior management and investment teams of both FB Advisor and GDFM serve or may serve as officers, directors or principals of entities that operate in the same or a related line of business as we
37
Table of Contents
do, or of investment vehicles managed by the same personnel. For example, the officers, managers and other personnel of FB Advisor also serve in similar capacities for the investment advisers to the other funds in the Fund Complex, and may serve in similar or other capacities for the investment advisers to future investment vehicles affiliated with FS Investments. In serving in these multiple and other capacities, they may have obligations to other clients or investors in those entities, the fulfillment of which may not be in our best interests or in the best interest of our stockholders. Our investment objectives may overlap with the investment objectives of such investment funds, accounts or other investment vehicles. For example, we rely on FB Advisor to manage our day-to-day activities and to implement our investment strategy. FB Advisor and certain of its affiliates are presently, and plan in the future to continue to be, involved with activities which are unrelated to us. As a result of these activities, FB Advisor, its employees and certain of its affiliates will have conflicts of interest in allocating their time between us and other activities in which they are or may become involved, including the management of other entities affiliated with FS Investments. FB Advisor and its employees will devote only as much of its or their time to our business as FB Advisor and its employees, in their judgment, determine is reasonably required, which may be substantially less than their full time.
Furthermore, GDFM, on which FB Advisor currently relies to assist it in identifying investment opportunities and making investment recommendations, has similar conflicts of interest. GDFM or its parent, GSO, currently serves as investment sub-adviser to FS Investments’ four other affiliated BDCs and FS Investments’ affiliated closed-end management investment company. GDFM, its affiliates and their respective members, partners, officers and employees will devote as much of their time to our activities as they deem necessary and appropriate. GDFM and its affiliates are not restricted from forming additional investment vehicles, from entering into other investment advisory relationships or from engaging in other business activities, even though such activities may be in competition with us and/or may involve substantial time and resources of GDFM. Also, in connection with such business activities, GDFM and its affiliates may have existing business relationships or access to material, non-public information that may prevent it from recommending investment opportunities that would otherwise fit within our investment objectives. All of these factors could be viewed as creating a conflict of interest in that the time, effort and ability of the members of GDFM, its affiliates and their officers and employees will not be devoted exclusively to our business but will be allocated between us and the management of the monies of other advisees of GDFM and its affiliates.
The time and resources that individuals employed by FB Advisor and GDFM devote to us may be diverted and we may face additional competition due to the fact that individuals employed by FB Advisor and GDFM are not prohibited from raising money for or managing another entity that makes the same types of investments that we target.
Neither FB Advisor nor GDFM, or individuals employed by FB Advisor or GDFM, are prohibited from raising money for and managing another investment entity that makes the same types of investments as those we target. As a result, the time and resources that these individuals may devote to us may be diverted. In addition, we may compete with any such investment entity for the same investors and investment opportunities. In an order dated June 4, 2013, the SEC granted exemptive relief permitting us, subject to the satisfaction of certain conditions, to co-invest in certain privately negotiated investment transactions with our co-investment affiliates. Because we did not seek exemptive relief to engage in co-investment transactions with GDFM and its affiliates, we are permitted to co-invest with GDFM and its affiliates only in accordance with existing regulatory guidance (e.g., where price is the only negotiated term). Affiliates of GDFM, whose primary businesses include the origination of investments, engage in investment advisory business with accounts that compete with us. Affiliates of GDFM have no obligation to make their originated investment opportunities available to GDFM or to us.
FB Advisor’s liability is limited under each of the investment advisory agreement and our administration agreement, and we are required to indemnify it against certain liabilities, which may lead it to act in a riskier manner on our behalf than it would when acting for its own account.
Pursuant to each of the investment advisory agreement and our administration agreement, FB Advisor and its officers, managers, partners, members (and their members, including the owners of their members), agents,
38
Table of Contents
employees, controlling persons and any other person or entity affiliated with FB Advisor will not be liable to us for their acts under the investment advisory agreement or our administration agreement, as applicable, absent willful misfeasance, bad faith or gross negligence in the performance of their duties. We have agreed to indemnify, defend and protect FB Advisor and its officers, managers, partners, members (and their members, including the owners of their members), agents, employees, controlling persons and any other person or entity affiliated with FB Advisor with respect to all damages, liabilities, costs and expenses resulting from acts of FB Advisor not arising out of willful misfeasance, bad faith or gross negligence in the performance of their duties under the investment advisory agreement or our administration agreement, as applicable. These protections may lead FB Advisor to act in a riskier manner when acting on our behalf than it would when acting for its own account.
Risks Related to Business Development Companies
Failure to maintain our status as a BDC would reduce our operating flexibility.
If we do not remain a BDC, we might be regulated as a closed-end investment company under the 1940 Act, which would subject us to substantially more regulatory restrictions under the 1940 Act and correspondingly decrease our operating flexibility.
We are uncertain of our sources for funding our future capital needs and if we cannot obtain debt or equity financing on acceptable terms, or at all, our ability to acquire investments and to expand our operations will be adversely affected.
Any working capital reserves we maintain may not be sufficient for investment purposes, and we may require debt or equity financing to operate. We may also need to access the capital markets to refinance existing debt obligations to the extent maturing obligations are not repaid with cash flows from operations. In order to maintain RIC tax treatment, we must distribute distributions to our stockholders each tax year on a timely basis generally of an amount at least equal to 90% of our investment company taxable income, determined without regard to any deduction for distributions paid, and the amounts of such distributions will therefore not be available to fund investment originations or to repay maturing debt. In addition, with certain limited exceptions, we are only allowed to borrow amounts or issue debt securities or preferred stock, which we refer to collectively as “senior securities,” such that our asset coverage, as calculated pursuant to the 1940 Act, equals at least 200% immediately after such borrowing, which, in certain circumstances, may restrict our ability to borrow or issue debt securities or preferred stock. In the event that we develop a need for additional capital in the future for investments or for any other reason, and we cannot obtain debt or equity financing on acceptable terms, or at all, our ability to acquire investments and to expand our operations will be adversely affected. As a result, we would be less able to allocate our portfolio among various issuers and industries and achieve our investment objectives, which may negatively impact our results of operations and reduce our ability to make distributions to our stockholders.
The requirement that we invest a sufficient portion of our assets in qualifying assets could preclude us from investing in accordance with our current business strategy; conversely, the failure to invest a sufficient portion of our assets in qualifying assets could result in our failure to maintain our status as a BDC.
As a BDC, we may not acquire any assets other than “qualifying assets” unless, at the time of such acquisition, at least 70% of our total assets are qualifying assets. Therefore, we may be precluded from investing in what we believe are attractive investments if such investments are not qualifying assets. Similarly, these rules could prevent us from making additional investments in existing portfolio companies, which could result in the dilution of our position, or could require us to dispose of investments at an inopportune time to comply with the 1940 Act. If we were forced to sell non-qualifying investments in the portfolio for compliance purposes, the proceeds from such sale could be significantly less than the current value of such investments. Conversely, if we fail to invest a sufficient portion of our assets in qualifying assets, we could lose our status as a BDC, which would subject us to substantially more regulatory restrictions and significantly decrease our operating flexibility.
39
Table of Contents
Regulations governing our operation as a BDC and a RIC will affect our ability to raise, and the way in which we raise, additional capital or borrow for investment purposes, which may have a negative effect on our growth.
As a result of our need to satisfy the Annual Distribution Requirement in order to maintain RIC tax treatment under Subchapter M of the Code, we may need to periodically access the capital markets to raise cash to fund new investments. We may issue “senior securities,” as defined in the 1940 Act, including issuing preferred stock, borrowing money from banks or other financial institutions, or issuing debt securities only in amounts such that our asset coverage, as defined in the 1940 Act, equals at least 200% after such incurrence or issuance. Our ability to issue certain other types of securities is also limited. Under the 1940 Act, we are also generally prohibited from issuing or selling our common stock at a price per share, after deducting underwriting commissions, that is below our net asset value per share, without first obtaining approval for such issuance from our stockholders and our independent directors. Compliance with these limitations on our ability to raise capital may unfavorably limit our investment opportunities. These limitations may also reduce our ability in comparison to other companies to profit from favorable spreads between the rates at which we can borrow and the rates at which we can lend.
In addition, because we incur indebtedness for investment purposes, if the value of our assets declines, we may be unable to satisfy the asset coverage test under the 1940 Act, which would prohibit us from paying distributions and, as a result, could cause us to be subject to corporate-level tax on our income and capital gains, regardless of the amount of distributions paid. If we cannot satisfy the asset coverage test, we may be required to sell a portion of our investments and, depending on the nature of our debt financing, repay a portion of our indebtedness at a time when such sales may be disadvantageous.
Our ability to enter into transactions with our affiliates is restricted.
We are prohibited under the 1940 Act from participating in certain transactions with certain of our affiliates without the prior approval of a majority of the independent members of our board of directors and, in some cases, the SEC. Any person that owns, directly or indirectly, 5% or more of our outstanding voting securities will be our affiliate for purposes of the 1940 Act, and we will generally be prohibited from buying or selling any securities from or to such affiliate, absent the prior approval of our board of directors. The 1940 Act also prohibits certain “joint” transactions with certain of our affiliates, which could include investments in the same portfolio company (whether at the same or different times), without prior approval of our board of directors and, in some cases, the SEC. In an order dated June 4, 2013, the SEC granted exemptive relief permitting us, subject to the satisfaction of certain conditions, to co-invest in certain privately negotiated investment transactions with our co-investment affiliates. If a person acquires more than 25% of our voting securities, we will be prohibited from buying or selling any security from or to such person or certain of that person’s affiliates, or entering into prohibited joint transactions with such persons to the extent not covered by the exemptive relief, absent the prior approval of the SEC. Similar restrictions limit our ability to transact business with our officers or directors or their respective affiliates. As a result of these restrictions, we may be prohibited from buying or selling any security from or to any portfolio company of a fund managed by FB Advisor without the prior approval of the SEC, which may limit the scope of investment opportunities that would otherwise be available to us.
Risks Related to Our Investments
Our investments in prospective portfolio companies may be risky, and we could lose all or part of our investment.
Our investments in senior secured loans, second lien secured loans, senior secured bonds, subordinated debt and equity of private U.S. companies, including middle market companies, may be risky and there is no limit on the amount of any such investments in which we may invest.
40
Table of Contents
Senior Secured Loans, Second Lien Secured Loans and Senior Secured Bonds. There is a risk that any collateral pledged by portfolio companies in which we have taken a security interest may decrease in value over time or lose its entire value, may be difficult to sell in a timely manner, may be difficult to appraise and may fluctuate in value based upon the success of the business and market conditions, including as a result of the inability of the portfolio company to raise additional capital. To the extent our debt investment is collateralized by the securities of a portfolio company’s subsidiaries, such securities may lose some or all of their value in the event of the bankruptcy or insolvency of the portfolio company. Also, in some circumstances, our security interest may be contractually or structurally subordinated to claims of other creditors. In addition, deterioration in a portfolio company’s financial condition and prospects, including its inability to raise additional capital, may be accompanied by deterioration in the value of the collateral for the debt. Secured debt that is under-collateralized involves a greater risk of loss. In addition, second lien secured debt is granted a second priority security interest in collateral, which means that any realization of collateral will generally be applied to pay senior secured debt in full before second lien secured debt is paid. Consequently, the fact that debt is secured does not guarantee that we will receive principal and interest payments according to the debt’s terms, or at all, or that we will be able to collect on the debt should we be forced to enforce our remedies.
Subordinated Debt. Our subordinated debt investments will generally rank junior in priority of payment to senior debt and will generally be unsecured. This may result in a heightened level of risk and volatility or a loss of principal, which could lead to the loss of the entire investment. These investments may involve additional risks that could adversely affect our investment returns. To the extent interest payments associated with such debt are deferred, such debt may be subject to greater fluctuations in valuations, and such debt could subject us and our stockholders to non-cash income. Because we will not receive any principal repayments prior to the maturity of some of our subordinated debt investments, such investments will be of greater risk than amortizing loans.
Equity Investments. We may make select equity investments. In addition, in connection with our debt investments, we on occasion receive equity interests such as warrants or options as additional consideration. The equity interests we receive may not appreciate in value and, in fact, may decline in value. Accordingly, we may not be able to realize gains from our equity interests, and any gains that we do realize on the disposition of any equity interests may not be sufficient to offset any other losses we experience.
Non-U.S. Securities. We may invest in non-U.S. securities, which may include securities denominated in U.S. dollars or in non-U.S. currencies, to the extent permitted by the 1940 Act. Because evidences of ownership of such securities usually are held outside the United States, we would be subject to additional risks if we invested in non-U.S. securities, which include possible adverse political and economic developments, seizure or nationalization of foreign deposits and adoption of governmental restrictions which might adversely affect or restrict the payment of principal and interest on the non-U.S. securities to investors located outside the country of the issuer, whether from currency blockage or otherwise. Because non-U.S. securities may be purchased with and payable in foreign currencies, the value of these assets as measured in U.S. dollars may be affected unfavorably by changes in currency rates and exchange control regulations.
Below Investment Grade Risk. In addition, we invest in securities that are rated below investment grade by rating agencies or that would be rated below investment grade if they were rated. Below investment grade securities, which are often referred to as “junk,” have predominantly speculative characteristics with respect to the issuer’s capacity to pay interest and repay principal. They may also be difficult to value and illiquid.
41
Table of Contents
Investing in middle market companies involves a number of significant risks, any one of which could have a material adverse effect on our operating results.
Investments in middle market companies involve some of the same risks that apply generally to investments in larger, more established companies. However, such investments have more pronounced risks in that they:
| • | may have limited financial resources and may be unable to meet the obligations under their debt securities that we hold, which may be accompanied by a deterioration in the value of any collateral pledged under such securities and a reduction in the likelihood of us realizing any guarantees we may have obtained in connection with our investment; |
| • | have shorter operating histories, narrower product lines and smaller market shares than larger businesses, which tends to render them more vulnerable to competitors’ actions and changing market conditions, as well as general economic downturns; |
| • | are more likely to depend on the management talents and efforts of a small group of persons; therefore, the death, disability, resignation or termination of one or more of these persons could have a material adverse impact on our portfolio company and, in turn, on us; |
| • | generally have less predictable operating results, may from time to time be parties to litigation, may be engaged in rapidly changing businesses with products subject to a substantial risk of obsolescence, and may require substantial additional capital to support their operations, finance expansion or maintain their competitive position. In addition, our executive officers and directors and members of FB Advisor may, in the ordinary course of business, be named as defendants in litigation arising from our investments in the portfolio companies; and |
| • | may have difficulty accessing the capital markets to meet future capital needs, which may limit their ability to grow or to repay their outstanding indebtedness upon maturity. |
Our portfolio companies may incur debt that ranks equally with, or senior to, our investments in such companies.
Our portfolio companies may have, or may be permitted to incur, other debt that ranks equally with, or senior to, the debt in which we invest. By their terms, such debt instruments may entitle the holders to receive payment of interest or principal on or before the dates on which we are entitled to receive payments with respect to the debt instruments in which we invest. Also, in the event of insolvency, liquidation, dissolution, reorganization or bankruptcy of a portfolio company, holders of debt instruments ranking senior to our investment in that portfolio company would typically be entitled to receive payment in full before we receive any proceeds. After repaying such senior creditors, such portfolio company may not have any remaining assets to use for repaying its obligation to us. In the case of debt ranking equally with debt instruments in which we invest, we would have to share on an equal basis any distributions with other creditors holding such debt in the event of an insolvency, liquidation, dissolution, reorganization or bankruptcy of the relevant portfolio company.
There may be circumstances where our debt investments could be subordinated to claims of other creditors or we could be subject to lender liability claims.
If one of our portfolio companies were to go bankrupt, depending on the facts and circumstances, including the extent to which we actually provided managerial assistance to that portfolio company, a bankruptcy court might recharacterize our debt investment and subordinate all or a portion of our claim to that of other creditors. In situations where a bankruptcy carries a high degree of political significance, our legal rights may be subordinated to other creditors. We may also be subject to lender liability claims for actions taken by us with respect to a borrower’s business or in instances where we exercise control over the borrower or render significant managerial assistance.
42
Table of Contents
Second priority liens on collateral securing debt investments that we make to our portfolio companies may be subject to control by senior creditors with first priority liens. If there is a default, the value of the collateral may not be sufficient to repay in full both the first priority creditors and us.
Certain debt investments that we make in portfolio companies may be secured on a second priority basis by the same collateral securing first priority debt of such companies. The first priority liens on the collateral will secure the portfolio company’s obligations under any outstanding senior debt and may secure certain other future debt that may be permitted to be incurred by such company under the agreements governing the loans. The holders of obligations secured by the first priority liens on the collateral will generally control the liquidation of and be entitled to receive proceeds from any realization of the collateral to repay their obligations in full before us. In addition, the value of the collateral in the event of liquidation will depend on market and economic conditions, the availability of buyers and other factors. There can be no assurance that the proceeds, if any, from the sale or sales of all of the collateral would be sufficient to satisfy the debt obligations secured by the second priority liens after payment in full of all obligations secured by the first priority liens on the collateral. If such proceeds are not sufficient to repay amounts outstanding under the debt obligations secured by the second priority liens, then we, to the extent not repaid from the proceeds of the sale of the collateral, will only have an unsecured claim against such company’s remaining assets, if any.
The rights we may have with respect to the collateral securing the debt investments we make in our portfolio companies with senior debt outstanding may also be limited pursuant to the terms of one or more intercreditor agreements that we enter into with the holders of senior debt. Under such an intercreditor agreement, at any time that obligations that have the benefit of the first priority liens are outstanding, any of the following actions that may be taken in respect of the collateral will be at the direction of the holders of the obligations secured by the first priority liens: the ability to cause the commencement of enforcement proceedings against the collateral; the ability to control the conduct of such proceedings; the approval of amendments to collateral documents; releases of liens on the collateral; and waivers of past defaults under collateral documents. We may not have the ability to control or direct such actions, even if our rights are adversely affected.
Our investments in CLOs may be riskier than a direct investment in the debt or other securities of the underlying companies.
When investing in CLOs, we may invest in any level of a CLO’s subordination chain, including subordinated (lower-rated) tranches and residual interests (the lowest tranche). CLOs are typically highly levered and therefore, the junior debt and equity tranches that we may invest in are subject to a higher risk of total loss and deferral or nonpayment of interest than the more senior tranches to which they are subordinated. In addition, we will generally have the right to receive payments only from the CLOs, and will generally not have direct rights against the underlying borrowers or entities that sponsored the CLOs. Furthermore, the investments we make in CLOs are at times thinly traded or have only a limited trading market. As a result, investments in such CLOs may be characterized as illiquid securities.
We generally will not control our portfolio companies.
We do not expect to control most of our portfolio companies, even though we may have board representation or board observation rights, and our debt agreements with such portfolio companies may contain certain restrictive covenants. As a result, we are subject to the risk that a portfolio company in which we invest may make business decisions with which we disagree and the management of such company, as representatives of the holders of their common equity, may take risks or otherwise act in ways that do not serve our interests as debt investors. Due to the lack of liquidity for our investments in non-traded companies, we may not be able to dispose of our interests in our portfolio companies as readily as we would like or at an appropriate valuation. As a result, a portfolio company may make decisions that could decrease the value of our portfolio holdings.
43
Table of Contents
Declines in market values or fair market values of our investments could result in significant net unrealized depreciation of our portfolio, which in turn would reduce our net asset value.
Under the 1940 Act, we are required to carry our investments at market value or, if no market value is ascertainable, at fair value as determined in good faith by or under the direction of our board of directors. While most of our investments are not publicly traded, applicable accounting standards require us to assume as part of our valuation process that our investments are sold in a principal market to market participants (even if we plan on holding an investment through its maturity) and impairments of the market values or fair market values of our investments, even if unrealized, must be reflected in our financial statements for the applicable period as unrealized depreciation, which could result in a significant reduction to our net asset value for a given period.
A significant portion of our investment portfolio is and will be recorded at fair value as determined in good faith by our board of directors and, as a result, there is and will be uncertainty as to the value of our portfolio investments.
Under the 1940 Act, we are required to carry our portfolio investments at market value or, if there is no readily available market value, at fair value, as determined by our board of directors. There is not a public market for the securities of the privately held companies in which we invest. Most of our investments are not publicly traded or actively traded on a secondary market but are, instead, traded on a privately negotiated over-the- counter secondary market for institutional investors or are not traded at all. As a result, we value these securities quarterly at fair value as determined in good faith by our board of directors.
Certain factors that may be considered in determining the fair value of our investments include dealer quotes for securities traded on the secondary market for institutional investors, the nature and realizable value of any collateral, the portfolio company’s earnings and its ability to make payments on its indebtedness, the markets in which the portfolio company does business, comparison to comparable publicly traded companies, discounted cash flows and other relevant factors. Because such valuations, and particularly valuations of private securities and private companies, are inherently uncertain, may fluctuate over short periods of time and may be based on estimates, our determinations of fair value may differ materially from the values that would have been used if a ready market for these non-traded securities existed. Due to this uncertainty, our fair value determinations may cause our net asset value on a given date to materially understate or overstate the value that we may ultimately realize upon the sale of one or more of our investments.
We are exposed to risks associated with changes in interest rates.
We are subject to financial market risks, including changes in interest rates. General interest rate fluctuations may have a substantial negative impact on our investments, investment opportunities and cost of capital and, accordingly, may have a material adverse effect on our investment objectives, our rate of return on invested capital and our ability to service our debt and make distributions to our stockholders. In addition, an increase in interest rates would make it more expensive to use debt for our financing needs, if any.
Our investment portfolio primarily consists of senior secured debt with maturities typically ranging from three to seven years. The longer the duration of these securities, generally, the more susceptible they are to changes in market interest rates. As market interest rates increase, those securities with a lower yield-at-cost can experience a mark-to-market unrealized loss. An impairment of the fair market value of our investments, even if unrealized, must be reflected in our financial statements for the applicable period and may therefore have a material adverse effect on our results of operations for that period.
Because we incur indebtedness to make investments, our net investment income is dependent, in part, upon the difference between the rate at which we borrow funds or pay interest on outstanding debt securities and the rate at which we invest these funds. An increase in interest rates would make it more expensive to use debt to finance our investments or to refinance our current financing arrangements. In addition, certain of our financing arrangements provide for adjustments in the loan interest rate along with changes in market interest rates. Therefore, in periods of rising interest rates, our cost of funds will increase, which could materially reduce our
44
Table of Contents
net investment income. Any reduction in the level of interest rates on new investments relative to interest rates on our current investments could also adversely impact our net investment income.
We have and may continue to structure the majority of our debt investments with floating interest rates to position our portfolio for rate increases. However, there can be no assurance that this will successfully mitigate our exposure to interest rate risk. For example, in the event of a rising interest rate environment, payments under floating rate debt instruments generally would rise and there may be a significant number of issuers of such floating rate debt instruments that would be unable or unwilling to pay such increased interest costs and may otherwise be unable to repay their loans. Rising interest rates could also cause portfolio companies to shift cash from other productive uses to the payment of interest, which may have a material adverse effect on their business and operations and could, over time, lead to increased defaults. Investments in floating rate debt instruments may also decline in value in response to rising interest rates if the interest rates of such investments do not rise as much, or as quickly, as market interest rates in general. Similarly, during periods of rising interest rates, our fixed rate investments may decline in value because the fixed rate of interest paid thereunder may be below market interest rates.
In July 2017, the head of the United Kingdom Financial Conduct Authority announced the desire to phase out the use of LIBOR by the end of 2021. Because the statements made by the head of the United Kingdom Financial Conduct Authority are recent in nature, there is no definitive information regarding the future utilization of LIBOR or of any particular replacement rate. As such, the potential effect of any such event on our cost of capital and net investment income cannot yet be determined.
We may use interest rate risk management techniques in an effort to limit our exposure to interest rate fluctuations. These techniques may include various interest rate hedging activities to the extent permitted by the 1940 Act. However, these activities may limit our ability to participate in the benefits of lower interest rates with respect to the hedged portion of our portfolio. We also have limited experience in entering into hedging transactions, and we will initially have to develop such expertise or arrange for such expertise to be provided. Adverse developments resulting from hedging transactions could have a material adverse effect on our business, financial condition, results of operations and cash flows.
Furthermore, because a rise in the general level of interest rates can be expected to lead to higher interest rates applicable to our debt investments, an increase in interest rates would make it easier for us to meet or exceed the incentive fee hurdle rate in the investment advisory agreement and may result in a substantial increase of the amount of incentive fees payable to FB Advisor with respect to pre-incentive fee net investment income.
A covenant breach by our portfolio companies may harm our operating results.
A portfolio company’s failure to satisfy financial or operating covenants imposed by us or other lenders could lead to defaults and, potentially, termination of its loans and foreclosure on its secured assets, which could trigger cross-defaults under other agreements and jeopardize a portfolio company’s ability to meet its obligations under the debt or equity securities that we hold. We may incur expenses to the extent necessary to seek recovery upon default or to negotiate new terms, which may include the waiver of certain financial covenants, with a defaulting portfolio company.
Our portfolio companies may be highly leveraged.
Some of our portfolio companies may be highly leveraged, which may have adverse consequences to these companies and to us as an investor. These companies may be subject to restrictive financial and operating covenants and the leverage may impair these companies’ ability to finance their future operations and capital needs. As a result, these companies’ flexibility to respond to changing business and economic conditions and to take advantage of business opportunities may be limited. Further, a leveraged company’s income and net assets will tend to increase or decrease at a greater rate than if borrowed money were not used.
45
Table of Contents
We may not realize gains from our equity investments.
Certain investments that we may make may include equity related securities, such as rights and warrants that may be converted into or exchanged for common stock or the cash value of the common stock. In addition, we may make direct equity investments in portfolio companies. The equity interests we receive may not appreciate in value and, in fact, may decline in value. Accordingly, we may not be able to realize gains from our equity interests and any gains that we do realize on the disposition of any equity interests may not be sufficient to offset any other losses we experience. We may also be unable to realize any value if a portfolio company does not have a liquidity event, such as a sale of the business, recapitalization or public offering, which would allow us to sell the underlying equity interests. We may be unable to exercise any put rights we acquire, which grant us the right to sell our equity securities back to the portfolio company, for the consideration provided in our investment documents if the issuer is in financial distress.
An investment strategy focused primarily on privately held companies presents certain challenges, including the lack of available information about these companies.
Our investments are primarily in privately held companies. Investments in private companies pose significantly greater risks than investments in public companies. First, private companies have reduced access to the capital markets, resulting in diminished capital resources and the ability to withstand financial distress. As a result, these companies, which may present greater credit risk than public companies, may be unable to meet the obligations under their debt securities that we hold. Second, the investments themselves often may be illiquid. The securities of most of the companies in which we invest are not publicly traded or actively traded on the secondary market and are, instead, traded on a privately negotiated over-the-counter secondary market for institutional investors. In addition, such securities may be subject to legal and other restrictions on resale. As such, we may have difficulty exiting an investment promptly or at a desired price prior to maturity or outside of a normal amortization schedule. In addition, in a restructuring, we may receive substantially different securities than our original investment in a portfolio company, including securities in a different part of the capital structure. These investments may also be difficult to value because little public information generally exists about private companies, requiring an experienced due diligence team to analyze and value the potential portfolio company. Finally, these companies often may not have third-party debt ratings or audited financial statements. We must therefore rely on the ability of FB Advisor and/or GDFM to obtain adequate information through due diligence to evaluate the creditworthiness and potential returns from investing in these companies. These companies and their financial information will generally not be subject to the Sarbanes-Oxley Act and other rules and regulations that govern public companies. If we are unable to uncover all material information about these companies, we may not make a fully informed investment decision, and we may lose money on our investments.
A lack of liquidity in certain of our investments may adversely affect our business.
We invest in certain companies whose securities are not publicly traded or actively traded on the secondary market and are, instead, traded on a privately negotiated over-the-counter secondary market for institutional investors and whose securities are subject to legal and other restrictions on resale or are otherwise less liquid than publicly traded securities. The illiquidity of certain of our investments may make it difficult for us to sell these investments when desired. In addition, if we are required to liquidate all or a portion of our portfolio quickly, we may realize significantly less than the value at which we had previously recorded these investments. The reduced liquidity of our investments may make it difficult for us to dispose of them at a favorable price or at all, and, as a result, we may suffer losses.
We may not have the funds or ability to make additional investments in our portfolio companies.
We may not have the funds or ability to make additional investments in our portfolio companies. After our initial investment in a portfolio company, we may be called upon from time to time to provide additional funds to such company or have the opportunity to increase our investment through the exercise of a warrant to purchase common stock. There is no assurance that we will make, or will have sufficient funds to make, follow-on investments. Any decisions not to make a follow-on investment or any inability on our part to make such an
46
Table of Contents
investment may have a negative impact on a portfolio company in need of such an investment, may result in a missed opportunity for us to increase our participation in a successful operation or may reduce the expected return on the investment.
Prepayments of our debt investments by our portfolio companies could adversely impact our results of operations and reduce our return on equity.
We are subject to the risk that the investments we make in our portfolio companies may be repaid prior to maturity. When this occurs, we will generally reinvest these proceeds in temporary investments, pending their future investment in new portfolio companies. These temporary investments will typically have substantially lower yields than the debt being prepaid and we could experience significant delays in reinvesting these amounts. Any future investment in a new portfolio company may also be at lower yields than the debt that was repaid. As a result, our results of operations could be materially adversely affected if one or more of our portfolio companies elect to prepay amounts owed to us. Additionally, prepayments, net of prepayment fees, could negatively impact our return on equity.
Our investments may include original issue discount and PIK instruments.
To the extent that we invest in original issue discount or PIK instruments and the accretion of original issue discount or PIK interest income constitutes a portion of our income, we will be exposed to risks associated with the requirement to include such non-cash income in taxable and accounting income prior to receipt of cash, including the following:
| • | The higher interest rates on PIK instruments reflect the payment deferral and increased credit risk associated with these instruments, and PIK instruments generally represent a significantly higher credit risk than coupon loans; |
| • | Original issue discount and PIK instruments may have unreliable valuations because the accruals require judgments about collectability of the deferred payments and the value of any associated collateral; |
| • | An election to defer PIK interest payments by adding them to the principal on such instruments increases our future investment income which increases our gross assets and, as such, increases FB Advisor’s future base management fees which, thus, increases FB Advisor’s future income incentive fees at a compounding rate; |
| • | Market prices of PIK instruments and other zero coupon instruments are affected to a greater extent by interest rate changes, and may be more volatile than instruments that pay interest periodically in cash. While PIK instruments are usually less volatile than zero coupon debt instruments, PIK instruments are generally more volatile than cash pay securities; |
| • | The deferral of PIK interest on an instrument increases the loan-to-value ratio, which is a measure of the riskiness of a loan, with respect to such instrument; |
| • | Even if the conditions for income accrual under GAAP are satisfied, a borrower could still default when actual payment is due upon the maturity of such loan; |
| • | For accounting purposes, cash distributions to investors representing original issue discount income are not derived from paid-in capital, although they may be paid from the offering proceeds. Thus, although a distribution of original issue discount income may come from the cash invested by investors, the 1940 Act does not require that investors be given notice of this fact; |
| • | The required recognition of PIK interest for U.S. federal income tax purposes may have a negative impact on liquidity, as it represents a non-cash component of our investment company taxable income that may require cash distributions to stockholders in order to maintain our ability to be subject to tax as a RIC; and |
47
Table of Contents
| • | Original issue discount may create a risk of non-refundable cash payments to FB Advisor based on non-cash accruals that may never be realized. |
We may from time to time enter into total return swaps, credit default swaps or other derivative transactions which expose us to certain risks, including credit risk, market risk, liquidity risk and other risks similar to those associated with the use of leverage.
We may from time to time enter into total return swaps, credit default swaps or other derivative transactions that seek to modify or replace the investment performance of a particular reference security or other asset. These transactions are typically individually negotiated, non-standardized agreements between two parties to exchange payments, with payments generally calculated by reference to a notional amount or quantity. Swap contracts and similar derivative contracts are not traded on exchanges; rather, banks and dealers act as principals in these markets. These investments may present risks in excess of those resulting from the referenced security or other asset. Because these transactions are not an acquisition of the referenced security or other asset itself, the investor has no right directly to enforce compliance with the terms of the referenced security or other asset and has no voting or other consensual rights of ownership with respect to the referenced security or other asset. In the event of insolvency of a counterparty, we will be treated as a general creditor of the counterparty and will have no claim of title with respect to the referenced security or other asset.
A total return swap is a contract in which one party agrees to make periodic payments to another party based on the change in the market value of the referenced security or other assets underlying the total return swap during a specified period, in return for periodic payments based on a fixed or variable interest rate.
A total return swap is subject to market risk, liquidity risk and risk of imperfect correlation between the value of the total return swap and the debt obligations underlying the total return swap. In addition, we may incur certain costs in connection with a total return swap that could in the aggregate be significant.
A credit default swap is a contract in which one party buys or sells protection against a credit event with respect to an issuer, such as an issuer’s failure to make timely payments of interest or principal on its debt obligations, bankruptcy or restructuring during a specified period. Generally, if we sell credit protection using a credit default swap, we will receive fixed payments from the swap counterparty and if a credit event occurs with respect to the applicable issuer, we will pay the swap counterparty par for the issuer’s defaulted debt securities and the swap counterparty will deliver the defaulted debt securities to us. Generally, if we buy credit protection using a credit default swap, we will make fixed payments to the counterparty and if a credit event occurs with respect to the applicable issuer, we will deliver the issuer’s defaulted securities underlying the swap to the swap counterparty and the counterparty will pay us par for the defaulted securities. Alternatively, a credit default swap may be cash settled and the buyer of protection would receive the difference between the par value and the market value of the issuer’s defaulted debt securities from the seller of protection.
Credit default swaps are subject to the credit risk of the underlying issuer. If we are selling credit protection, there is a risk that we will not properly assess the risk of the underlying issuer, a credit event will occur and we will have to pay the counterparty. If we are buying credit protection, there is a risk that we will not properly assess the risk of the underlying issuer, no credit event will occur and we will receive no benefit for the premium paid.
A derivative transaction is also subject to the risk that a counterparty will default on its payment obligations thereunder or that we will not be able to meet our obligations to the counterparty. In some cases, we may post collateral to secure our obligations to the counterparty, and we may be required to post additional collateral upon the occurrence of certain events such as a decrease in the value of the reference security or other asset. In some cases, the counterparty may not collateralize any of its obligations to us.
Derivative investments effectively add leverage to a portfolio by providing investment exposure to a security or market without owning or taking physical custody of such security or investing directly in such market. In addition to the risks described above, such arrangements are subject to risks similar to those associated with the use of leverage.
48
Table of Contents
Risks Related to Debt Financing
We currently incur indebtedness to make investments, which magnifies the potential for gain or loss on amounts invested in our common stock and may increase the risk of investing in our common stock.
The use of borrowings and other types of financing, also known as leverage, magnifies the potential for gain or loss on amounts invested and, therefore, increases the risks associated with investing in our common stock. When we use leverage to partially finance our investments, through borrowing from banks and other lenders or issuing debt securities, we, and therefore our stockholders, will experience increased risks of investing in our common stock. Any lenders and debt holders would have fixed dollar claims on our assets that are senior to the claims of our stockholders. If the value of our assets increases, then leverage would cause the net asset value attributable to our common stock to increase more sharply than it would have had we not utilized leverage. Conversely, if the value of our assets decreases, leverage would cause net asset value to decline more sharply than it otherwise would have had we not utilized leverage. Similarly, any increase in our income in excess of interest payable on our indebtedness would cause our net investment income to increase more than it would without leverage, while any decrease in our income would cause net investment income to decline more sharply than it would have had we not utilized leverage. Such a decline could negatively affect our ability to make distributions to stockholders. Leverage is generally considered a speculative investment technique.
In addition, the decision to utilize leverage will increase our assets and, as a result, will increase the amount of base management fees payable to FB Advisor. See “Risks Related to FB Advisor, GDFM and their respective Affiliates—FB Advisor, GDFM and their respective affiliates, including our officers and some of our directors, face conflicts of interest as a result of compensation arrangements between us and FB Advisor, and FB Advisor and GDFM, which could result in actions that are not in the best interests of our stockholders.”
Illustration. The following table illustrates the effect of leverage on returns from an investment in shares of our common stock assuming various annual returns, net of expenses. The calculations in the table below are hypothetical and actual returns may be higher or lower than those appearing below. The calculation assumes (i) $4.1 billion in total assets, (ii) a weighted average cost of funds of 4.18%, (iii) $2.0 billion in debt outstanding (i.e., assumes that the full $2.0 billion available to us as of December 31, 2017 under our financing arrangements as of such date is outstanding) and (iv) $2.3 billion in stockholders’ equity. In order to compute the “Corresponding return to stockholders,” the “Assumed Return on Our Portfolio (net of expenses)” is multiplied by the assumed total assets to obtain an assumed return to us. From this amount, the interest expense is calculated by multiplying the assumed weighted average cost of funds times the assumed debt outstanding, and the product is subtracted from the assumed return to us in order to determine the return available to stockholders. The return available to stockholders is then divided by our stockholders’ equity to determine the “Corresponding return to stockholders.” Actual interest payments may be different.
| Assumed Return on Our Portfolio (net of expenses) |
-10% | -5% | 0% | 5% | 10% | |||||||||||||||
| Corresponding return to stockholders |
(21.46 | )% | (12.55 | )% | (3.63 | )% | 5.28 | % | 14.19 | % | ||||||||||
Similarly, assuming (i) $4.1 billion in total assets, (ii) a weighted average cost of funds of 4.18% and (iii) $2.0 billion in debt outstanding (i.e., assuming that the full $2.0 billion available to us as of December 31, 2017 under the financing arrangements as of such date is outstanding), our assets would need to yield an annual return (net of expenses) of approximately 2.04% in order to cover the annual interest payments on our outstanding debt.
The agreements governing our debt financing arrangements contain, and agreements governing future debt financing arrangements may contain, various covenants which, if not complied with, could have a material adverse effect on our ability to meet our investment obligations and to pay distributions to our stockholders.
The agreements governing certain of our debt financing arrangements contain, and agreements governing future debt financing arrangements may contain, certain financial and operational covenants. These covenants require us and our subsidiaries to, among other things, maintain certain financial ratios, including asset coverage
49
Table of Contents
and minimum stockholders’ equity. Compliance with these covenants depends on many factors, some of which are beyond our and their control. In the event of deterioration in the capital markets and pricing levels subsequent to this period, net unrealized depreciation in our and our subsidiaries’ portfolios may increase in the future and could result in non-compliance with certain covenants, or our taking actions which could disrupt our business and impact our ability to meet our investment objectives.
There can be no assurance that we and our subsidiaries will continue to comply with the covenants under our financing arrangements, including any covenants related to the identity of our investment adviser. Failure to comply with these covenants could result in a default which, if we and our subsidiaries were unable to obtain a waiver, consent or amendment from the debt holders, could accelerate repayment under any or all of our and their debt instruments and thereby force us to liquidate investments at a disadvantageous time and/or at a price which could result in losses, or allow our lenders to sell assets pledged as collateral under our financing arrangements in order to satisfy amounts due thereunder. These occurrences could have a material adverse impact on our liquidity, financial condition, results of operations and ability to pay distributions. See “Item 7. Management’s Discussion and Analysis of Financial Condition and Results of Operations—Financial Condition, Liquidity and Capital Resources” for a more detailed discussion of the terms of our debt financings.
Risks Related to an Investment in Our Common Stock
There is a risk that investors in our common stock may not receive distributions.
We cannot assure stockholders that we will achieve investment results that will allow us to make a specified level of cash distributions. All distributions will be paid at the discretion of our board of directors and will depend on our earnings, our net investment income, our financial condition, maintenance of our RIC status, compliance with applicable BDC regulations and such other factors as our board of directors may deem relevant from time to time. Furthermore, we are permitted to issue senior securities, including multiple classes of debt and one class of stock senior to our shares of common stock. If any such senior securities are outstanding, we are prohibited from paying distributions to holders of shares of our common stock unless we meet the applicable asset coverage ratios at the time of distribution. As a result, we may be limited in our ability to make distributions. See “Item 1. Business—Regulation—Senior Securities.”
Our distribution proceeds may exceed our earnings. Therefore, portions of the distributions that we make may represent a return of capital to stockholders, which will lower their tax basis in their shares of common stock.
The tax treatment and characterization of our distributions may vary significantly from time to time due to the nature of our investments. The ultimate tax characterization of our distributions made during a tax year may not finally be determined until after the end of that tax year. We may make distributions during a tax year that exceed our investment company taxable income and net capital gains for that tax year. In such a situation, the amount by which our total distributions exceed investment company taxable income and net capital gains generally would be treated as a return of capital up to the amount of a stockholder’s tax basis in the shares, with any amounts exceeding such tax basis treated as a gain from the sale or exchange of such shares. A return of capital generally is a return of a stockholder’s investment rather than a return of earnings or gains derived from our investment activities. Moreover, we may pay all or a substantial portion of our distributions from the proceeds of the sale of shares of our common stock or from borrowings in anticipation of future cash flow, which could constitute a return of stockholders’ capital and will lower such stockholders’ tax basis in our shares, which may result in increased tax liability to stockholders when they sell such shares.
Our shares of common stock may trade at a discount to net asset value, and such discount may be significant.
Shares of closed-end investment companies, including BDCs, may trade at a market price that is less than the net asset value that is attributable to those shares. This characteristic of closed-end investment companies is separate and distinct from the risk that our net asset value per share may decline. It is not possible to predict whether shares of our common stock will trade at, above, or below net asset value. In the recent past, including during much of 2009, the stocks of BDCs as an industry traded below net asset value and at near historic lows as
50
Table of Contents
a result of concerns over liquidity, leverage restrictions and distribution requirements. If our common stock is trading at a price below its net asset value per share, we will generally not be able to issue additional shares of our common stock at their market price without first obtaining approval for such issuance from our stockholders and our independent directors. In past years, we obtained the approval of our stockholders to issue shares of common stock at prices below the then-current net asset value of our common stock, subject to certain conditions, during the twelve-month periods beginning on the dates of such approvals. The current authorization expires on July 27, 2018. We may again seek the approval of our stockholders to issue shares of our common stock at prices below the then-current net asset value per share for a twelve-month period following stockholder approval. However, we may not obtain the necessary approvals to sell shares of common stock below net asset value after July 27, 2018.
We may pay distributions from offering proceeds, borrowings or the sale of assets to the extent our cash flows from operations, net investment income or earnings are not sufficient to fund declared distributions.
We may fund distributions from the uninvested proceeds of a securities offering and borrowings, and we have not established limits on the amount of funds we may use from such proceeds or borrowings to make any such distributions. We have paid and may continue to pay distributions from the sale of assets to the extent distributions exceed our earnings or cash flows from operations. Distributions from offering proceeds or from borrowings could reduce the amount of capital we ultimately invest in our portfolio companies.
A stockholder’s interest in us will be diluted if we issue additional shares, which could reduce the overall value of an investment in us.
Our investors do not have preemptive rights to any shares we issue in the future. Our charter authorizes us to issue 450,000,000 shares of common stock. Pursuant to our charter, a majority of our entire board of directors may amend our charter to increase the number of authorized shares of stock without stockholder approval. After an investor purchases shares, our board of directors may elect to sell additional shares in the future, issue equity interests in private offerings or issue share-based awards to our independent directors or employees of FB Advisor. To the extent we issue additional equity interests after an investor purchases our shares, an investor’s percentage ownership interest in us will be diluted. In addition, depending upon the terms and pricing of any additional offerings and the value of our investments, an investor may also experience dilution in the book value and fair value of his or her shares.
Stockholders may experience dilution in their ownership percentage if they do not participate in our distribution reinvestment plan.
Stockholders who do not participate in our distribution reinvestment plan may experience accretion to the net asset value of their shares if our shares are trading at a premium to net asset value and dilution if our shares are trading at a discount to net asset value. The level of accretion or discount would depend on various factors, including the proportion of our stockholders who participate in the plan, the level of premium or discount at which our shares are trading and the amount of the distribution payable to a stockholder.
Certain provisions of our charter and bylaws as well as provisions of the Maryland General Corporation Law could deter takeover attempts and have an adverse impact on the value of our common stock.
The Maryland General Corporation Law, or the MGCL, and our charter and bylaws contain certain provisions that may have the effect of discouraging, delaying or making difficult a change in control of our company or the removal of our incumbent directors. Under the Business Combination Act of the MGCL, certain business combinations between us and an “interested stockholder” (defined generally to include any person who beneficially owns 10% or more of the voting power of our outstanding shares) or an affiliate thereof is prohibited for five years and thereafter is subject to special stockholder voting requirements, to the extent that such statute is not superseded by applicable requirements of the 1940 Act. However, our board of directors has adopted a resolution exempting from the Business Combination Act any business combination between us and any person to the extent that such business combination receives the prior approval of our board of directors, including a
51
Table of Contents
majority of our directors who are not “interested persons” as defined in the 1940 Act. Under the Control Share Acquisition Act of the MGCL, “control shares” acquired in a “control share acquisition” have no voting rights except to the extent approved by a vote of two-thirds of the votes entitled to be cast on the matter, excluding shares owned by the acquirer, by officers or by directors who are employees of the corporation. Our bylaws contain a provision exempting from the Control Share Acquisition Act any and all acquisitions by any person of shares of our common stock, but such provision may be repealed at any time (before or after a control share acquisition). However, we will amend our bylaws to repeal such provision (so as to be subject to the Control Share Acquisition Act) only if our board of directors determines that it would be in our best interests and if the staff of the SEC does not object to our determination that our being subject to the Control Share Acquisition Act does not conflict with the 1940 Act. The Business Combination Act (if our board of directors should repeal the resolution) and the Control Share Acquisition Act (if we amend our bylaws to be subject to that Act) may discourage others from trying to acquire control of us and increase the difficulty of consummating any offer.
We have also adopted measures that may make it difficult for a third party to obtain control of us, including provisions of our charter: (a) classifying our board of directors into three classes serving staggered three-year terms, (b) providing that a director may be removed only for cause and only by vote of at least two-thirds of the votes entitled to be cast, and (c) authorizing our board of directors to (i) classify or reclassify shares of our stock into one or more classes or series, (ii) cause the issuance of additional shares of our stock, and (iii) amend our charter from time to time, without stockholder approval, to increase or decrease the aggregate number of shares of stock or the number of shares of stock of any class or series that we have authority to issue. These provisions, as well as other provisions of our charter and bylaws, may discourage, delay, defer, make more difficult or prevent a transaction or a change in control that might otherwise be in the best interest of our stockholders.
The net asset value of our common stock may fluctuate significantly.
The net asset value and liquidity, if any, of the market for shares of our common stock may be significantly affected by numerous factors, some of which are beyond our control and may not be directly related to our operating performance. These factors include: (i) changes in regulatory policies or tax guidelines, particularly with respect to RICs or BDCs; (ii) loss of RIC or BDC status; (iii) changes in earnings or variations in operating results; (iv) changes in the value of our portfolio of investments; (v) changes in accounting guidelines governing valuation of our investments; (vi) any shortfall in revenue or net income or any increase in losses from levels expected by investors; (vii) departure of our investment adviser or sub-adviser or certain of their respective key personnel; (viii) general economic trends and other external factors; and (ix) loss of a major funding source.
The market price of our common stock may fluctuate significantly.
The market price and liquidity of the market for our common stock may be significantly affected by numerous factors, some of which are beyond our control and may not be directly related to our operating performance. These factors include:
| • | significant volatility in the market price and trading volume of securities of publicly traded RICs, BDCs or other companies in our sector, which are not necessarily related to the operating performance of these companies; |
| • | price and volume fluctuations in the overall stock market from time to time; |
| • | changes in law, regulatory policies or tax guidelines, or interpretations thereof, particularly with respect to RICs or BDCs; |
| • | loss of our BDC or RIC status; |
| • | changes in our earnings or variations in our operating results; |
| • | changes in the value of our portfolio of investments; |
52
Table of Contents
| • | any shortfall in revenue or net income or any increase in losses from levels expected by investors or securities analysts; |
| • | departure of FB Advisor’s or GDFM’s key personnel; |
| • | operating performance of companies comparable to us; |
| • | short-selling pressure with respect to shares of our common stock or BDCs generally; |
| • | future sales of our securities convertible into or exchangeable or exercisable for our common stock or the conversion of such securities; |
| • | uncertainty surrounding the strength of the economy; |
| • | general economic trends and other external factors; and |
| • | loss of a major funding source. |
In the past, following periods of volatility in the market price of a company’s securities, securities class action litigation has often been brought against that company. If the market price of our common stock fluctuates significantly, we may be the target of securities litigation in the future. Securities litigation could result in substantial costs and divert management’s attention and resources from our business.
If we issue preferred stock, debt securities or convertible debt securities, the net asset value and market value of our common stock may become more volatile.
We also cannot assure you that the issuance of preferred stock, debt securities or convertible debt securities would result in a higher yield or return to the holders of our common stock. The issuance of preferred stock, debt securities or convertible debt securities would likely cause the net asset value and market value of our common stock to become more volatile. If the dividend rate on the preferred stock, or the interest rate on the debt securities, were to approach the net rate of return on our investment portfolio, the benefit of leverage to the holders of our common stock would be reduced. If the dividend rate on the preferred stock, or the interest rate on the debt securities, were to exceed the net rate of return on our portfolio, the use of leverage would result in a lower rate of return to the holders of common stock than if we had not issued the preferred stock or debt securities. Any decline in the net asset value of our investment would be borne entirely by the holders of our common stock. Therefore, if the market value of our portfolio were to decline, the leverage would result in a greater decrease in net asset value to the holders of our common stock than if we were not leveraged through the issuance of preferred stock. This decline in net asset value would also tend to cause a greater decline in the market price for our common stock.
There is also a risk that, in the event of a sharp decline in the value of our net assets, we would be in danger of failing to maintain required asset coverage ratios which may be required by the preferred stock, debt securities, convertible debt or units or of a downgrade in the ratings of the preferred stock, debt securities, convertible debt or units or our current investment income might not be sufficient to meet the dividend requirements on the preferred stock or the interest payments on the debt securities. In order to counteract such an event, we might need to liquidate investments in order to fund redemption of some or all of the preferred stock, debt securities or convertible debt. In addition, we would pay (and the holders of our common stock would bear) all costs and expenses relating to the issuance and ongoing maintenance of the preferred stock, debt securities, convertible debt or any combination of these securities. Holders of preferred stock, debt securities or convertible debt may have different interests than holders of common stock and may at times have disproportionate influence over our affairs.
Holders of any preferred stock that we may issue will have the right to elect members of the board of directors and have class voting rights on certain matters.
The 1940 Act requires that holders of shares of preferred stock must be entitled as a class to elect two directors at all times and to elect a majority of the directors if dividends on such preferred stock are in arrears by
53
Table of Contents
two years or more, until such arrearage is eliminated. In addition, certain matters under the 1940 Act require the separate vote of the holders of any issued and outstanding preferred stock, including changes in fundamental investment restrictions and conversion to open-end status and, accordingly, preferred stockholders could veto any such changes. Restrictions imposed on the declarations and payment of dividends or other distributions to the holders of our common stock and preferred stock, both by the 1940 Act and by requirements imposed by rating agencies, might impair our ability to maintain our qualification as a RIC for U.S. federal income tax purposes.
We may again obtain the approval of our stockholders to issue shares of our common stock at prices below the then-current net asset value per share of our common stock, and any such issuance could materially dilute our stockholders’ interest in our common stock and reduce our net asset value per share.
In past years, we obtained the approval of our stockholders to issue shares of our common stock at prices below the then-current net asset value of our common stock, subject to certain conditions, during the twelve-month periods beginning on the dates of such approvals. The current authorization expires on July 27, 2018. We may again seek the approval of our stockholders to issue shares of our common stock at prices below the then-current net asset value per share of our common stock in one or more offerings for a twelve-month period following stockholder approval. If such approval is obtained, it may allow us to access the capital markets in a way that we typically are unable to do as a result of restrictions that, absent stockholder approval, apply to BDCs under the 1940 Act.
Any sale or other issuance of shares of our common stock at a price below net asset value per share would result in an immediate dilution to our common stock and a reduction of our net asset value per share. This dilution would occur as a result of a proportionately greater decrease in a stockholder’s interest in our earnings and assets and voting interest in us than the increase in our assets resulting from such issuance. Because the number of future shares of common stock that may be issued below our net asset value per share and the price and timing of such issuances are not currently known, we cannot predict the actual dilutive effect of any such issuance nor can we predict the resulting reduction in our net asset value per share, however, such effects may be material. We undertake to describe the material risks and dilutive effects of any offering that we make at a price below our then-current net asset value in the future in a prospectus supplement issued in connection with any such offering.
Risks Related to U.S. Federal Income Tax
We will be subject to corporate-level income tax if we are unable to qualify as a RIC under Subchapter M of the Code or to satisfy the RIC annual distribution requirements.
Besides maintaining our election to be treated as a BDC under the 1940 Act, in order for us to qualify as a RIC under Subchapter M of the Code, we must meet the following annual distribution, income source and asset diversification requirements. See “Item 1. Business—Taxation as a RIC.”
| • | The 90% Income Test will be satisfied if we earn at least 90% of our gross income for each tax year from dividends, interest, gains from the sale of securities or similar sources. |
| • | The Diversification Tests will be satisfied if we meet certain asset diversification requirements at the end of each quarter of our tax year. To satisfy these requirements, at least 50% of the value of our assets must consist of cash, cash equivalents, U.S. government securities, securities of other RICs, and other securities if such securities of any one issuer do not represent more than 5% of the value of our assets or more than 10% of the outstanding voting securities of such issuer; and no more than 25% of the value of our assets can be invested in the securities, other than U.S. government securities or securities of other RICs, of one issuer, of two or more issuers that are controlled, as determined under applicable Code rules, by us and that are engaged in the same or similar or related trades or businesses or of certain “qualified publicly-traded partnerships.” Failure to meet these requirements may result in our having to dispose of certain investments quickly in order to prevent the loss of RIC status. Because most of our investments will be in private companies, and therefore will be relatively illiquid, any such dispositions could be made at disadvantageous prices and could result in substantial losses. |
54
Table of Contents
In any tax year in which we qualify as a RIC, in order for us to be able to be subject to tax as a RIC, we are required to meet an annual distribution requirement. The annual distribution requirement for RIC tax treatment will be satisfied if we distribute to our stockholders, for each tax year, dividends of an amount generally at least equal to the sum of 90% of our investment company taxable income, which is generally the sum of our ordinary net income and realized net short-term capital gains in excess of realized net long-term capital losses, without regard to any deduction for dividends paid. Because we may use debt financing, we are subject to an asset coverage ratio requirement under the 1940 Act and may in the future become subject to certain financial covenants under loan and credit agreements that could, under certain circumstances, restrict us from making distributions necessary to satisfy the annual distribution requirement. If we are unable to obtain cash from other sources, we could fail to qualify for RIC tax treatment and thus become subject to corporate-level income tax.
We must satisfy these tests on an ongoing basis in order to maintain RIC tax treatment, and may be required to make distributions to stockholders at times when it would be more advantageous to invest cash in our existing or other investments, or when we do not have funds readily available for distribution. Compliance with the RIC tax requirements may hinder our ability to operate solely on the basis of maximizing profits and the value of our stockholders’ investments. Also, the rules applicable to our qualification as a RIC are complex, with many areas of uncertainty. If we fail to qualify for or maintain RIC tax treatment for any reason and are subject to corporate income tax, the resulting corporate taxes could substantially reduce our net assets, the amount of income available for distribution and the amount of our distributions. Such a failure may have a material adverse effect on us and on any investment in us. The Code provides certain forms of relief from RIC disqualification due to failures of the 90% Income Test or any of the Diversification Tests, although there may be additional taxes due in such cases. We cannot assure you that we would qualify for any such relief should we fail either the 90% Income Test or any of the Diversification Tests.
Some of our investments may be subject to corporate-level income tax.
We may invest in certain debt and equity investments through taxable subsidiaries and the taxable income of these taxable subsidiaries will be subject to federal and state corporate income taxes. We may invest in certain foreign debt and equity investments which could be subject to foreign taxes (such as income tax, withholding and value added taxes).
We may have difficulty paying our required distributions if we recognize income before or without receiving cash representing such income.
For U.S. federal income tax purposes, we may be required to recognize taxable income in circumstances in which we do not receive a corresponding payment in cash. For example, our investments may include debt instruments that are treated under applicable tax rules as having original issue discount (such as debt instruments with PIK interest or, in certain cases, increasing interest rates or debt instruments that were issued with warrants). To the extent original issue discount or PIK interest constitutes a portion of our income, we must include in taxable income each tax year a portion of the original issue discount or PIK interest that accrues over the life of the instrument, regardless of whether cash representing such income is received by us in the same tax year. We may also have to include in income other amounts that we have not yet received in cash, such as deferred loan origination fees that are paid after origination of the loan or are paid in non-cash compensation such as warrants or stock. We anticipate that a portion of our income may constitute original issue discount or other income required to be included in taxable income prior to receipt of cash. Further, we may elect to amortize market discount and include such amounts in our taxable income in the current tax year, instead of upon disposition, as not making the election would limit our ability to deduct interest expenses for tax purposes.
Because any original issue discount or other amounts accrued will be included in our investment company taxable income for the tax year of the accrual, we may be required to make a distribution to our stockholders in order to satisfy the Annual Distribution Requirement, even though we will not have received any corresponding cash amount. As a result, we may have difficulty meeting the Annual Distribution Requirement necessary to qualify for and maintain RIC tax treatment under Subchapter M of the Code. We may have to sell some of our
55
Table of Contents
investments at times and/or at prices we would not consider advantageous, raise additional debt or equity capital or forgo new investment opportunities for this purpose. If we are not able to obtain cash from other sources, we may fail to qualify for or maintain RIC tax treatment and thus become subject to corporate-level income tax.
Furthermore, we may invest in the equity securities of non-U.S. corporations (or other non-U.S. entities classified as corporations for U.S. federal income tax purposes) that could be treated under the Code and U.S. Treasury regulations as “passive foreign investment companies” and/or “controlled foreign corporations.” The rules relating to investment in these types of non-U.S. entities are designed to ensure that U.S. taxpayers are either, in effect, taxed currently (or on an accelerated basis with respect to corporate level events) or taxed at increased tax rates at distribution or disposition. In certain circumstances, these rules also could require us to recognize taxable income or gains where we do not receive a corresponding payment in cash and, under recently proposed U.S. federal income tax regulations, all or a portion of such taxable income and gains may not be considered qualifying income for purposes of the 90% Income Test.
Our portfolio investments may present special tax issues.
Investments in below-investment grade debt instruments and certain equity securities may present special tax issues for us. U.S. federal income tax rules are not entirely clear about issues such as when we may cease to accrue interest, original issue discount or market discount, when and to what extent deductions may be taken for bad debts or worthless debt in equity securities, how payments received on obligations in default should be allocated between principal and interest income, as well as whether exchanges of debt instruments in a bankruptcy or workout context are taxable. Such matters could cause us to recognize taxable income for U.S. federal income tax purposes, even in the absence of cash or economic gain, and require us to make taxable distributions to our stockholders to maintain our RIC status or preclude the imposition of either U.S. federal corporate income or excise taxation. Additionally, because such taxable income may not be matched by corresponding cash received by us, we may be required to borrow money or dispose of other investments to be able to make distributions to our stockholders. These and other issues will be considered by us, to the extent determined necessary, in order that we minimize the level of any U.S. federal income or excise tax that we would otherwise incur. See “Item 1. Business—Taxation as a RIC.”
If we do not qualify as a “publicly offered regulated investment company,” as defined in the Code, you will be taxed as though you received a distribution of some of our expenses.
A “publicly offered regulated investment company” is a RIC whose shares are either (i) continuously offered pursuant to a public offering, (ii) regularly traded on an established securities market or (iii) held by at least 500 persons at all times during the tax year. If we do not qualify as a publicly offered regulated investment company for any tax year, a noncorporate stockholder’s allocable portion of our affected expenses, including our management fees, will be treated as an additional distribution to the stockholder and will be deductible by such stockholder only to the extent permitted under the limitations described below. For noncorporate stockholders, including individuals, trusts, and estates, significant limitations generally apply to the deductibility of certain expenses of a non-publicly offered regulated investment company, including management fees. In particular, these expenses, referred to as miscellaneous itemized deductions, are deductible to an individual only to the extent they exceed 2% of such a stockholder’s adjusted gross income, are not deductible for alternative minimum tax purposes and are subject to the overall limitation on itemized deductions imposed by the Code. Although we believe that we are currently considered a publicly offered regulated investment company, as defined in the Code, there can be no assurance, however, that we will be considered a publicly offered regulated investment company in the future.
Legislative or regulatory tax changes could adversely affect investors.
At any time, the federal income tax laws governing RICs or the administrative interpretations of those laws or regulations may be amended. Any of those new laws, regulations or interpretations may take effect retroactively and could adversely affect the taxation of us or our stockholders. Therefore, changes in tax laws, regulations or administrative interpretations or any amendments thereto could diminish the value of an
56
Table of Contents
investment in our shares or the value or the resale potential of our investments. In particular, on December 22, 2017, the Tax Cuts and Jobs Act was signed into law. This tax legislation lowers the general corporate income tax rate from 35 percent to 21 percent, makes changes regarding the use of net operating losses, repeals the corporate alternative minimum tax and makes significant changes with respect to the U.S. international tax rules. In addition, the legislation generally requires a holder that uses the accrual method of accounting for U.S. tax purposes to include certain amounts in income no later than the time such amounts are reflected on certain financial statements, which therefore if applicable would require us to accrue income earlier than under prior law, although the precise application of this rule is un-clear at this time. The legislation also limits the amount or value of interest deductions of borrowers and in that way may potentially affect the loan market and our and our portfolio companies’ use of leverage. For individual taxpayers, the legislation reduces the maximum individual income tax rate and eliminates the deductibility of miscellaneous itemized deductions for taxable years 2018 through 2025. The impact of this new legislation is uncertain.
| Item 1B. | Unresolved Staff Comments. |
None.
| Item 2. | Properties. |
We do not own any real estate or other physical properties materially important to our operation. Our headquarters are located at 201 Rouse Boulevard, Philadelphia, Pennsylvania, 19112. We believe that our office facilities are suitable and adequate for our business as it is presently conducted.
| Item 3. | Legal Proceedings. |
We are not currently subject to any material legal proceedings, nor, to our knowledge, is any material legal proceeding threatened against us. From time to time, we may be party to certain legal proceedings in the ordinary course of business, including proceedings relating to the enforcement of our rights under contracts with our portfolio companies. While the outcome of any legal proceedings cannot be predicted with certainty, we do not expect that these proceedings will have a material adverse effect upon our financial condition or results of operations.
| Item 4. | Mine Safety Disclosures. |
Not applicable.
57
Table of Contents
PART II
Many of the amounts and percentages presented in Part II have been rounded for convenience of presentation, and all dollar amounts, excluding share and per share amounts, are presented in thousands unless otherwise noted.
| Item 5. | Market for Registrant’s Common Equity, Related Stockholder Matters and Issuer Purchases of Equity Securities. |
Market Information
Our common stock has been listed on the NYSE under the ticker symbol “FSIC” since April 16, 2014. Prior to such date, there was no public market for our common stock. Our shares of common stock have historically traded at prices both above and below our net asset value per share. It is not possible to predict whether shares of our common stock will trade at, above or below our net asset value in the future. See “Risk Factors—Risks Related to an Investment in Our Common Stock—Our shares of common stock may trade at a discount to net asset value.”
The following table sets forth: (i) the net asset value per share of our common stock as of the applicable period end, (ii) the range of high and low closing sales prices of our common stock as reported on the NYSE during the applicable period and (iii) the closing high and low sales prices as a premium (discount) to net asset value during the applicable period. On February 28, 2018, the last reported closing sales price of our common stock on the NYSE was $7.10 per share.
| Net Asset
Value Per Share(1) |
Closing Sales Price | Premium (Discount) of High Sales Price to Net Asset Value Per Share(2) |
Premium (Discount) of Low Sales Price to Net Asset Value Per Share(2) |
|||||||||||||||||
| For the Three Months Ended |
High | Low | ||||||||||||||||||
| Fiscal 2016 |
||||||||||||||||||||
| March 31, 2016 |
$ | 8.82 | $ | 9.30 | $ | 7.73 | 5.44 | % | (12.36 | )% | ||||||||||
| June 30, 2016 |
9.18 | 9.42 | 8.61 | 2.61 | % | (6.21 | )% | |||||||||||||
| September 30, 2016 |
9.42 | 9.94 | 9.00 | 5.52 | % | (4.46 | )% | |||||||||||||
| December 31, 2016 |
9.41 | 10.45 | 9.25 | 11.05 | % | (1.70 | )% | |||||||||||||
| Fiscal 2017 |
||||||||||||||||||||
| March 31, 2017 |
9.45 | 10.80 | 9.55 | 14.29 | % | 1.06 | % | |||||||||||||
| June 30, 2017 |
9.30 | 9.85 | 8.80 | 5.91 | % | (5.38 | )% | |||||||||||||
| September 30, 2017 |
9.43 | 9.30 | 8.05 | (1.38 | )% | (14.63 | )% | |||||||||||||
| December 31, 2017 |
9.30 | 8.70 | 7.35 | (6.45 | )% | (20.97 | )% | |||||||||||||
| (1) | Net asset value per share is determined as of the last day in the relevant period and therefore may not reflect the net asset value per share on the date of the high and low closing sales prices. The net asset values shown are based on outstanding shares at the end of the relevant period. |
| (2) | Calculated as the respective high or low closing sale price less net asset value, divided by net asset value (in each case, as of the applicable period). |
As of February 28, 2018, we had 2,039 record holders of our common stock which does not include beneficial owners of shares of common stock held in “street name” by brokers and other institutions on behalf of stockholders.
Distributions
Subject to applicable legal restrictions and the sole discretion of our board of directors, we intend to declare and pay regular cash distributions on a quarterly basis. From time to time, we may also pay special interim distributions in the form of cash or shares of our common stock at the discretion of our board of directors. As previously announced by the Company, subject to market conditions, our board of directors currently intends to make a special distribution in the fourth quarter of 2018 that equates to the cumulative amount, if any, of net
58
Table of Contents
investment income earned during the twelve months following October 1, 2017 that is in excess of $0.76 per share. The timing and amount of any future distributions to stockholders are subject to applicable legal restrictions and the sole discretion of our board of directors.
The following table reflects the cash distributions per share that we have declared on our common stock during the years ended December 31, 2017, 2016 and 2015:
| Distribution | ||||||||
| For the Year Ended December 31, |
Per Share | Amount | ||||||
| 2015 |
$ | 0.89100 | $ | 215,606 | ||||
| 2016 |
$ | 0.89100 | $ | 216,933 | ||||
| 2017 |
$ | 0.85825 | $ | 210,549 | ||||
See “Item 7. Management’s Discussion and Analysis of Financial Condition and Results of Operations—RIC Status and Distributions” and Note 5 to our consolidated financial statements contained in this annual report on Form 10-K for additional information regarding our distributions and our distribution reinvestment plan.
Stock Repurchase Program
In February 2018, our board of directors authorized a stock repurchase program. Under the program, we may repurchase up to $50 million in the aggregate of our outstanding common stock in the open market at prices below the current net asset value per share, in accordance with the guidelines specified in Rule 10b-18 of the Exchange Act. The timing, manner, price and amount of any share repurchases will be determined by us, in our discretion, based upon the evaluation of economic and market conditions, our stock price, applicable legal and regulatory requirements and other factors. The program will be in effect through February 21, 2019, unless extended or until the aggregate repurchase amount that has been approved by our board of directors has been expended. The program does not require us to repurchase any specific number of shares and we cannot assure stockholders that any shares will be repurchased under the program. The program may be suspended, extended, modified or discontinued at any time
59
Table of Contents
Stock Performance Graph
This performance graph shall not be deemed “soliciting material” or to be “filed” with the SEC for purposes of Section 18 of the Exchange Act or otherwise subject to the liabilities under that Section, and shall not be deemed to be incorporated by reference into any filing of FS Investment Corporation under the Securities Act.
The following graph shows a comparison from April 16, 2014 (the date our shares of common stock commenced trading on the NYSE) through December 31, 2017 of the cumulative total return for our common stock, the S&P 500 Index, the Russell 2000 Financial Services Index and the Wells Fargo® BDC Index. The graph assumes that $100 was invested at the market close on April 16, 2014 in our common stock, the S&P 500 Index, the Russell 2000 Financial Services Index and the Wells Fargo® BDC Index, is based on historical stock prices and assumes all dividends or distributions are reinvested on the respective dividend or distribution payment dates without commissions. The stock price performance reflected by the following graph is not necessarily indicative of future stock price performance.
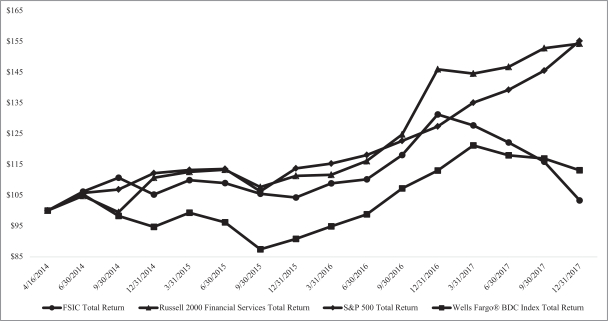
60
Table of Contents
| Item 6. | Selected Financial Data. |
The following selected consolidated financial data for the years ended December 31, 2017, 2016, 2015, 2014 and 2013 is derived from our consolidated financial statements which have been audited by RSM US LLP, our independent registered public accounting firm. The data should be read in conjunction with our consolidated financial statements and related notes thereto and “Item 7. Management’s Discussion and Analysis of Financial Condition and Results of Operations” included elsewhere in this annual report on Form 10-K.
| Year Ended December 31, | ||||||||||||||||||||
| 2017 | 2016 | 2015 | 2014 | 2013 | ||||||||||||||||
| Statements of operations data: |
||||||||||||||||||||
| Investment income |
$ | 419,311 | $ | 422,809 | $ | 474,797 | $ | 464,819 | $ | 474,566 | ||||||||||
| Operating expenses |
||||||||||||||||||||
| Total expenses and excise taxes |
218,127 | 215,486 | 209,707 | 225,648 | 229,590 | |||||||||||||||
| Less: Management fee waiver |
(2,575 | ) | — | — | (2,837 | ) | — | |||||||||||||
|
|
|
|
|
|
|
|
|
|
|
|||||||||||
| Net expenses and excise taxes |
215,552 | 215,486 | 209,707 | 222,811 | 229,590 | |||||||||||||||
|
|
|
|
|
|
|
|
|
|
|
|||||||||||
| Net investment income (loss) |
203,759 | 207,323 | 265,090 | 242,008 | 244,976 | |||||||||||||||
| Total net realized and unrealized gain (loss) |
(21,772 | ) | 86,968 | (226,705 | ) | (47,227 | ) | 20,864 | ||||||||||||
|
|
|
|
|
|
|
|
|
|
|
|||||||||||
| Net increase (decrease) in net assets resulting from operations |
$ | 181,987 | $ | 294,291 | $ | 38,385 | $ | 194,781 | $ | 265,840 | ||||||||||
|
|
|
|
|
|
|
|
|
|
|
|||||||||||
| Per share data: |
||||||||||||||||||||
| Net investment income (loss)—basic and diluted(1) |
$ | 0.83 | $ | 0.85 | $ | 1.10 | $ | 0.97 | $ | 0.96 | ||||||||||
|
|
|
|
|
|
|
|
|
|
|
|||||||||||
| Net increase (decrease) in net assets resulting from operations—basic and diluted(1) |
$ | 0.74 | $ | 1.21 | $ | 0.16 | $ | 0.78 | $ | 1.04 | ||||||||||
|
|
|
|
|
|
|
|
|
|
|
|||||||||||
| Distributions declared(2) |
$ | 0.86 | $ | 0.89 | $ | 0.89 | $ | 1.08 | $ | 0.83 | ||||||||||
|
|
|
|
|
|
|
|
|
|
|
|||||||||||
| Balance sheet data: |
||||||||||||||||||||
| Total assets |
$ | 4,104,275 | $ | 4,110,071 | $ | 4,148,173 | $ | 4,354,886 | $ | 4,444,577 | ||||||||||
|
|
|
|
|
|
|
|
|
|
|
|||||||||||
| Credit facilities, notes, secured borrowing and repurchase agreement payable |
$ | 1,712,016 | $ | 1,693,513 | $ | 1,822,899 | $ | 1,863,827 | $ | 1,673,682 | ||||||||||
|
|
|
|
|
|
|
|
|
|
|
|||||||||||
| Total net assets |
$ | 2,284,723 | $ | 2,297,377 | $ | 2,208,928 | $ | 2,366,986 | $ | 2,640,992 | ||||||||||
|
|
|
|
|
|
|
|
|
|
|
|||||||||||
| Other data: |
||||||||||||||||||||
| Total return based on net asset value(3) |
7.97 | % | 13.19 | % | 1.63 | % | 7.17 | % | 10.43 | % | ||||||||||
| Total return based on market value(4) |
(21.39 | )% | 25.91 | % | (0.78 | )% | 5.52 | — | ||||||||||||
| Number of portfolio company investments at period end |
100 | 102 | 114 | 118 | 165 | |||||||||||||||
| Total portfolio investments for the period |
$ | 1,284,317 | $ | 1,157,827 | $ | 1,647,620 | $ | 2,178,075 | $ | 2,641,733 | ||||||||||
| Proceeds from sales and prepayments of investments |
$ | 1,134,998 | $ | 1,588,498 | $ | 1,625,520 | $ | 2,121,939 | $ | 2,510,887 | ||||||||||
| (1) | The per share data was derived by using the weighted average shares outstanding during the applicable period. |
| (2) | The per share data for distributions reflect the actual amount of distributions paid per share during the applicable period. |
61
Table of Contents
| (3) | The total return based on net asset value for each year presented was calculated by taking the net asset value per share as of the end of the applicable year, adding the cash distributions per share that were declared during the applicable calendar year and dividing the total by the net asset value per share at the beginning of the applicable year. Total return based on net asset value does not consider the effect of any sales commissions or charges that may be incurred in connection with the sale of shares of our common stock. The historical calculation of total return based on net asset value in the table should not be considered a representation of our future total return based on net asset value, which may be greater or less than the return shown in the table due to a number of factors, including our ability or inability to make investments in companies that meet our investment criteria, the interest rates payable on the debt securities we acquire, the level of our expenses, variations in and the timing of the recognition of realized and unrealized gains or losses, the degree to which we encounter competition in our markets and general economic conditions. As a result of these factors, results for any previous period should not be relied upon as being indicative of performance in future periods. The total return calculations set forth above represent the total return on our investment portfolio during the applicable period and do not represent an actual return to stockholders. |
| (4) | The total return based on market value for each period presented was calculated based on the change in market price during the applicable period, including the impact of distributions reinvested in accordance with the Company’s distribution reinvestment plan. The total return based on market value for the year ended December 31, 2014 was calculated based on the period from April 16, 2014, the first day the shares began trading on the NYSE at a closing price of $10.25, to December 31, 2014. Total return based on market value does not consider the effect of any sales commissions or charges that may be incurred in connection with the sale of shares of our common stock. The historical calculation of total return based on market value in the table should not be considered a representation of our future total return based on market value, which may be greater or less than the return shown in the table due to a number of factors, including our ability or inability to make investments in companies that meet its investment criteria, the interest rates payable on the debt securities we acquire, the level of our expenses, variations in and the timing of the recognition of realized and unrealized gains or losses, the degree to which we encounter competition in our markets, general economic conditions and fluctuations in per share market value. As a result of these factors, results for any previous period should not be relied upon as being indicative of performance in future periods. |
| Item 7. | Management’s Discussion and Analysis of Financial Condition and Results of Operations. |
The information contained in this section should be read in conjunction with our consolidated financial statements and related notes thereto appearing elsewhere in this annual report on Form 10-K.
Forward-Looking Statements
Some of the statements in this annual report on Form 10-K constitute forward-looking statements because they relate to future events or our future performance or financial condition. The forward-looking statements contained in this annual report on Form 10-K may include statements as to:
| • | our future operating results; |
| • | our business prospects and the prospects of the companies in which we may invest; |
| • | the impact of the investments that we expect to make; |
| • | the ability of our portfolio companies to achieve their objectives; |
| • | our current and expected financings and investments; |
| • | receiving and maintaining corporate credit ratings and changes in the general interest rate environment; |
| • | the adequacy of our cash resources, financing sources and working capital; |
62
Table of Contents
| • | the timing and amount of cash flows, distributions and dividends, if any, from our portfolio companies; |
| • | our contractual arrangements and relationships with third parties; |
| • | actual and potential conflicts of interest with the other funds in the Fund Complex and their respective investment advisers and sub-advisers, GDFM, KKR Credit, FS/KKR Advisor or any of their affiliates; |
| • | the dependence of our future success on the general economy and its effect on the industries in which we may invest; |
| • | our use of financial leverage; |
| • | the ability of FB Advisor to locate suitable investments for us and to monitor and administer our investments; |
| • | the ability of FB Advisor or its affiliates to attract and retain highly talented professionals; |
| • | our ability to maintain our qualification as a RIC and as a BDC; |
| • | the impact on our business of the Dodd-Frank Act, and the rules and regulations issued thereunder; |
| • | the effect of changes to tax legislation on us and the portfolio companies in which we may invest and our and their tax position; |
| • | the tax status of the enterprises in which we may invest; |
| • | receiving stockholder approval of the investment co-advisory agreements and the joint advisor investment advisory agreements; and |
| • | KKR Credit obtaining the KKR exemptive relief. |
In addition, words such as “anticipate,” “believe,” “expect” and “intend” indicate a forward-looking statement, although not all forward-looking statements include these words. The forward-looking statements contained in this annual report on Form 10-K involve risks and uncertainties. Our actual results could differ materially from those implied or expressed in the forward-looking statements for any reason, including those factors set forth in “Item 1A. Risk Factors.” Factors that could cause actual results to differ materially include:
| • | changes in the economy; |
| • | risks associated with possible disruption in our operations or the economy generally due to terrorism or natural disasters; |
| • | future changes in laws or regulations and conditions in our operating areas; and |
| • | the price at which shares of our common stock may trade on the NYSE. |
We have based the forward-looking statements included in this annual report on Form 10-K on information available to us on the date of this annual report on Form 10-K. Except as required by the federal securities laws, we undertake no obligation to revise or update any forward-looking statements, whether as a result of new information, future events or otherwise. Stockholders are advised to consult any additional disclosures that we may make directly to stockholders or through reports that we may file in the future with the SEC, including annual reports on Form 10-K, quarterly reports on Form 10-Q and current reports on Form 8-K. The forward-looking statements and projections contained in this annual report on Form 10-K are excluded from the safe harbor protection provided by Section 27A of the Securities Act of 1933, as amended, or the Securities Act, and Section 21E of the Exchange Act.
63
Table of Contents
Overview
We were incorporated under the general corporation laws of the State of Maryland on December 21, 2007 and formally commenced investment operations on January 2, 2009. We are an externally managed, non-diversified, closed-end management investment company that has elected to be regulated as a BDC under the 1940 Act and has elected to be treated for U.S. federal income tax purposes, and intends to qualify annually, as a RIC under Subchapter M of the Code.
On April 16, 2014, shares of our common stock began trading on the NYSE under the ticker symbol “FSIC”. This listing accomplished our goal of providing our stockholders with greatly enhanced liquidity.
Our investment activities are managed by FB Advisor and supervised by our board of directors, a majority of whom are independent. Under the investment advisory agreement, we have agreed to pay FB Advisor an annual base management fee based on the average value of our gross assets and an incentive fee based on our performance. FB Advisor engaged GDFM to act as our investment sub-adviser. GDFM currently assists FB Advisor in identifying investment opportunities and makes investment recommendations for approval by FB Advisor according to guidelines set by FB Advisor.
As we previously announced on December 11, 2017, GDFM intends to resign as our investment sub-adviser and terminate the investment sub-advisory agreement effective as of the GDFM end date. In connection with GDFM’s resignation as our investment sub-adviser, FS Investments and KKR Credit desire to enter into a relationship whereby FS Investments and KKR Credit will create a premier alternative lending platform for certain BDCs sponsored, advised and/or sub-advised by them. See “Item 1. Business—The Transition of Investment Advisory Services” for information regarding our potential investment advisory relationship with KKR Credit and/or FS/KKR Advisor.
Our investment objectives are to generate current income and, to a lesser extent, long-term capital appreciation. We have identified and intend to focus on the following investment categories, which we believe will allow us to generate an attractive total return with an acceptable level of risk.
Direct Originations: We intend to leverage our relationships and, currently, our relationship with GDFM and its global sourcing and origination platform, including its industry relationships, to directly source investment opportunities. Such investments are originated or structured for us or made by us and are not generally available to the broader market. These investments may include both debt and equity components, although we do not generally make equity investments independent of having an existing credit relationship. We believe directly originated investments may offer higher returns and more favorable protections than broadly syndicated transactions.
Opportunistic: We intend to seek to capitalize on market price inefficiencies by investing in loans, bonds and other securities where the market price of such investment reflects a lower value than deemed warranted by our fundamental analysis. We believe that market price inefficiencies may occur due to, among other things, general dislocations in the markets, a misunderstanding by the market of a particular company or an industry being out of favor with the broader investment community. We seek to allocate capital to these securities that have been misunderstood or mispriced by the market and where we believe there is an opportunity to earn an attractive return on our investment. Such opportunities may include event driven investments, anchor orders (i.e. opportunities that are originated and then syndicated by a commercial or investment bank but where we provide a capital commitment significantly above the average syndicate participant) and CLOs.
In the case of event driven investments, we intend to take advantage of dislocations that arise in the markets due to an impending event and where the market’s apparent expectation of value differs substantially from our fundamental analysis. Such events may include a looming debt maturity or default, a merger, spin-off or other corporate reorganization, an adverse regulatory or legal ruling, or a material contract expiration, any of which may significantly improve or impair a company’s financial position. Compared to other investment strategies, event driven investing depends more heavily on our ability to successfully predict the outcome of an
64
Table of Contents
individual event rather than on underlying macroeconomic fundamentals. As a result, successful event driven strategies may offer both substantial diversification benefits and the ability to generate performance in uncertain market environments.
We may also invest in anchor orders. In these types of investments, we may receive fees, preferential pricing or other benefits not available to other lenders in return for our significant capital commitment. Our decision to provide an anchor order to a syndicated transaction is predicated on a rigorous credit analysis, our familiarity with a particular company, industry or financial sponsor, and the broader investment experiences of FB Advisor and GDFM.
In addition, we opportunistically invest in CLOs. CLOs are a form of securitization where the cash flow from a pooled basket of syndicated loans is used to support distribution payments made to different tranches of securities. While collectively CLOs represent nearly fifty percent of the broadly syndicated loan universe, investing in individual CLO tranches requires a high degree of investor sophistication due to their structural complexity and the illiquid nature of their securities.
Broadly Syndicated/Other: Although our primary focus is to invest in directly originated transactions and opportunistic investments, in certain circumstances we will also invest in the broadly syndicated loan and high yield markets. Broadly syndicated loans and bonds are generally more liquid than our directly originated investments and provide a complement to our less liquid strategies. In addition, and because we typically receive more attractive financing terms on these positions than we do on our less liquid assets, we are able to leverage the broadly syndicated portion of our portfolio in such a way that maximizes the levered return potential of our portfolio.
Our portfolio is comprised primarily of investments in senior secured loans and second lien secured loans of private middle market U.S. companies and, to a lesser extent, subordinated loans of private U.S. companies. Although we do not expect a significant portion of our portfolio to be comprised of subordinated loans, there is no limit on the amount of such loans in which we may invest. We may purchase interests in loans or make other debt investments, including investments in senior secured bonds, through secondary market transactions in the “over-the-counter” market or directly from our target companies as primary market or directly originated investments. In connection with our debt investments, we may on occasion receive equity interests such as warrants or options as additional consideration. We may also purchase or otherwise acquire interests in the form of common or preferred equity or equity-related securities, such as rights and warrants that may be converted into or exchanged for common stock or other equity or the cash value of common stock or other equity, in our target companies, generally in conjunction with one of our debt investments, including though the restructuring of such investments, or through a co-investment with a financial sponsor, such as an institutional investor or private equity firm. In addition, a portion of our portfolio may be comprised of corporate bonds, CLOs, other debt securities and derivatives, including total return swaps and credit default swaps. FB Advisor will seek to tailor our investment focus as market conditions evolve. Depending on market conditions, we may increase or decrease our exposure to less senior portions of the capital structure or otherwise make opportunistic investments.
The senior secured loans, second lien secured loans and senior secured bonds in which we invest generally have stated terms of three to seven years and subordinated debt investments that we make generally have stated terms of up to ten years, but the expected average life of such securities is generally between three and seven years. However, there is no limit on the maturity or duration of any security in our portfolio. Our debt investments may be rated by a NRSRO and, in such case, generally will carry a rating below investment grade (rated lower than “Baa3” by Moody’s or lower than “BBB-” by S&P). We also invest in non-rated debt securities.
Revenues
The principal measure of our financial performance is net increase in net assets resulting from operations, which includes net investment income, net realized gain or loss on investments, net realized gain or loss on foreign currency, net unrealized appreciation or depreciation on investments and net unrealized gain or loss on
65
Table of Contents
foreign currency. Net investment income is the difference between our income from interest, dividends, fees and other investment income and our operating and other expenses. Net realized gain or loss on investments is the difference between the proceeds received from dispositions of portfolio investments and their amortized cost, including the respective realized gain or loss on foreign currency for those foreign denominated investment transactions. Net realized gain or loss on foreign currency is the portion of realized gain or loss attributable to foreign currency fluctuations. Net unrealized appreciation or depreciation on investments is the net change in the fair value of our investment portfolio, including the respective unrealized gain or loss on foreign currency for those foreign denominated investments. Net unrealized gain or loss on foreign currency is the net change in the value of receivables or accruals due to the impact of foreign currency fluctuations.
We principally generate revenues in the form of interest income on the debt investments we hold. In addition, we generate revenues in the form of non-recurring commitment, closing, origination, structuring or diligence fees, monitoring fees, fees for providing managerial assistance, consulting fees, prepayment fees and performance-based fees. We may also generate revenues in the form of dividends and other distributions on the equity or other securities we hold.
Expenses
Our primary operating expenses include the payment of management and incentive fees and other expenses under the investment advisory agreement and the administration agreement, interest expense from financing facilities and other indebtedness, and other expenses necessary for our operations. The management and incentive fees compensate FB Advisor for its work in identifying, evaluating, negotiating, executing, monitoring and servicing our investments. FB Advisor is responsible for compensating our investment sub-adviser.
FB Advisor oversees our day-to-day operations, including the provision of general ledger accounting, fund accounting, legal services, investor relations, certain government and regulatory affairs activities, and other administrative services. FB Advisor also performs, or oversees the performance of, our corporate operations and required administrative services, which includes being responsible for the financial records that we are required to maintain and preparing reports for our stockholders and reports filed with the SEC. In addition, FB Advisor assists us in calculating our net asset value, overseeing the preparation and filing of tax returns and the printing and dissemination of reports to our stockholders, and generally overseeing the payment of our expenses and the performance of administrative and professional services rendered to us by others.
Pursuant to the administration agreement, we reimburse FB Advisor for expenses necessary to perform services related to our administration and operations, including FB Advisor’s allocable portion of the compensation and related expenses of certain personnel of FS Investments providing administrative services to us on behalf of FB Advisor. We reimburse FB Advisor no less than quarterly for all costs and expenses incurred by FB Advisor in performing its obligations and providing personnel and facilities under the administration agreement. FB Advisor allocates the cost of such services to us based on factors such as total assets, revenues, time allocations and/or other reasonable metrics. Our board of directors reviews the methodology employed in determining how the expenses are allocated to us and the proposed allocation of administrative expenses among us and certain affiliates of FB Advisor. Our board of directors then assesses the reasonableness of such reimbursements for expenses allocated to us based on the breadth, depth and quality of such services as compared to the estimated cost to us of obtaining similar services from third-party service providers known to be available. In addition, our board of directors considers whether any single third-party service provider would be capable of providing all such services at comparable cost and quality. Finally, our board of directors compares the total amount paid to FB Advisor for such services as a percentage of our net assets to the same ratio as reported by other comparable BDCs.
We bear all other expenses of our operations and transactions, including (without limitation) fees and expenses relating to:
| • | corporate and organization expenses relating to offerings of our securities, subject to limitations included in the investment advisory agreement; |
66
Table of Contents
| • | the cost of calculating our net asset value, including the cost of any third-party pricing or valuation services; |
| • | the cost of effecting sales and repurchases of shares of our common stock and other securities; |
| • | investment advisory fees; |
| • | fees payable to third parties relating to, or associated with, making investments and valuing investments, including fees and expenses associated with performing due diligence reviews of prospective investments; |
| • | interest payments on our debt or related obligations; |
| • | transfer agent and custodial fees; |
| • | research and market data (including news and quotation equipment and services, and any computer hardware and connectivity hardware (e.g., telephone and fiber optic lines) incorporated into the cost of obtaining such research and market data); |
| • | fees and expenses associated with marketing efforts; |
| • | federal and state registration fees; |
| • | federal, state and local taxes; |
| • | fees and expenses of directors not also serving in an executive officer capacity for us or FB Advisor; |
| • | costs of proxy statements, stockholders’ reports, notices and other filings; |
| • | fidelity bond, directors and officers/errors and omissions liability insurance and other insurance premiums; |
| • | direct costs such as printing, mailing, long distance telephone and staff; |
| • | fees and expenses associated with accounting, corporate governance, government and regulatory affairs activities, independent audits and outside legal costs; |
| • | costs associated with our reporting and compliance obligations under the 1940 Act and applicable federal and state securities laws, including compliance with the Sarbanes-Oxley Act; |
| • | brokerage commissions for our investments; and |
| • | all other expenses incurred by FB Advisor, GDFM or us in connection with administering our business, including expenses incurred by FB Advisor or GDFM in performing administrative services for us and administrative personnel paid by FB Advisor or GDFM, to the extent they are not controlling persons of FB Advisor, or GDFM, or any of their respective affiliates, subject to the limitations included in the investment advisory agreement and the administration agreement. |
In addition, we have contracted with State Street Bank and Trust Company to provide various accounting and administrative services, including, but not limited to, preparing preliminary financial information for review by FB Advisor, preparing and monitoring expense budgets, maintaining accounting and corporate books and records, processing trade information provided by us and performing testing with respect to RIC compliance.
67
Table of Contents
Portfolio Investment Activity for the Years Ended December 31, 2017 and 2016
Total Portfolio Activity
The following tables present certain selected information regarding our portfolio investment activity for the years ended December 31, 2017 and 2016:
| For the Year Ended | ||||||||
| Net Investment Activity |
December 31, 2017 |
December 31, 2016 |
||||||
| Purchases |
$ | 1,284,317 | $ | 1,157,827 | ||||
| Sales and Repayments |
(1,134,998 | ) | (1,588,498 | ) | ||||
|
|
|
|
|
|||||
| Net Portfolio Activity |
$ | 149,319 | $ | (430,671 | ) | |||
|
|
|
|
|
|||||
| For the Year Ended | ||||||||||||||||
| December 31, 2017 | December 31, 2016 | |||||||||||||||
| New Investment Activity by Asset Class |
Purchases | Percentage | Purchases | Percentage | ||||||||||||
| Senior Secured Loans—First Lien |
$ | 954,681 | 74 | % | $ | 896,207 | 77 | % | ||||||||
| Senior Secured Loans—Second Lien |
77,269 | 6 | % | 52,526 | 5 | % | ||||||||||
| Senior Secured Bonds |
86,049 | 7 | % | 13,189 | 1 | % | ||||||||||
| Subordinated Debt |
118,937 | 9 | % | 67,563 | 6 | % | ||||||||||
| Collateralized Securities |
409 | 0 | % | 4,575 | 0 | % | ||||||||||
| Equity/Other |
46,972 | 4 | % | 123,767 | 11 | % | ||||||||||
|
|
|
|
|
|
|
|
|
|||||||||
| Total |
$ | 1,284,317 | 100 | % | $ | 1,157,827 | 100 | % | ||||||||
|
|
|
|
|
|
|
|
|
|||||||||
The following table summarizes the composition of our investment portfolio at cost and fair value as of December 31, 2017 and 2016:
| December 31, 2017 | December 31, 2016 | |||||||||||||||||||||||
| Amortized Cost(1) |
Fair Value | Percentage of Portfolio |
Amortized Cost(1) |
Fair Value | Percentage of Portfolio |
|||||||||||||||||||
| Senior Secured Loans—First Lien |
$ | 2,501,103 | $ | 2,520,994 | 64 | % | $ | 1,992,159 | $ | 1,935,441 | 52 | % | ||||||||||||
| Senior Secured Loans—Second Lien |
222,232 | 197,588 | 5 | % | 619,892 | 599,155 | 16 | % | ||||||||||||||||
| Senior Secured Bonds |
157,699 | 161,650 | 4 | % | 205,657 | 159,470 | 4 | % | ||||||||||||||||
| Subordinated Debt |
500,626 | 489,761 | 13 | % | 498,080 | 454,045 | 12 | % | ||||||||||||||||
| Collateralized Securities |
47,471 | 54,319 | 1 | % | 59,225 | 72,058 | 2 | % | ||||||||||||||||
| Equity/Other |
387,715 | 501,922 | 13 | % | 368,927 | 506,647 | 14 | % | ||||||||||||||||
|
|
|
|
|
|
|
|
|
|
|
|
|
|||||||||||||
| Total |
$ | 3,816,846 | $ | 3,926,234 | 100 | % | $ | 3,743,940 | $ | 3,726,816 | 100 | % | ||||||||||||
|
|
|
|
|
|
|
|
|
|
|
|
|
|||||||||||||
| (1) | Amortized costs represent the original cost adjusted for the amortization of premiums and/or accretion of discounts, as applicable, on investments. |
68
Table of Contents
The following table presents certain selected information regarding the composition of our investment portfolio as of December 31, 2017 and 2016:
| December 31, 2017 |
December 31, 2016 |
|||||||
| Number of Portfolio Companies |
100 | 102 | ||||||
| % Variable Rate (based on fair value) |
69.4 | % | 67.0 | % | ||||
| % Fixed Rate (based on fair value) |
17.8 | % | 19.4 | % | ||||
| % Income Producing Equity/Other Investments (based on fair value) |
2.3 | % | 2.7 | % | ||||
| % Non-Income Producing Equity/Other Investments (based on fair value) |
10.5 | % | 10.9 | % | ||||
| Average Annual EBITDA of Portfolio Companies |
$ | 85,700 | $ | 100,000 | ||||
| Weighted Average Purchase Price of Debt Investments (as a % of par) |
99.5 | % | 98.6 | % | ||||
| % of Investments on Non-Accrual (based on fair value) |
0.2 | % | 0.2 | % | ||||
| Gross Portfolio Yield Prior to Leverage (based on amortized cost) |
9.6 | % | 9.1 | % | ||||
| Gross Portfolio Yield Prior to Leverage (based on amortized cost)—Excluding Non-Income Producing Assets |
10.5 | % | 10.1 | % | ||||
For the year ended December 31, 2017, our total return based on net asset value was 7.97% and our total return based on market value was (21.39)%. For the year ended December 31, 2016, our total return based on net asset value was 13.19% and our total return based on market value was 25.91%.
Our estimated gross portfolio yield may be higher than an investor’s yield on an investment in shares of our common stock. Our estimated gross portfolio yield does not reflect operating expenses that may be incurred by us. In addition, our estimated gross portfolio yield and total return figures disclosed above do not consider the effect of any sales commissions or charges that may be incurred in connection with the sale of shares of our common stock. Our estimated gross portfolio yield and total return based on net asset value do not represent actual investment returns to stockholders. Our estimated gross portfolio yield and total return figures are subject to change and, in the future, may be greater or less than the rates set forth above. See footnotes 6 and 7 to the table included in Note 11 to our audited consolidated financial statements included herein for information regarding the calculation of our total return based on net asset value and total return based on market value, respectively.
Direct Originations
The following tables present certain selected information regarding our direct originations for the three months and year ended December 31, 2017:
| New Direct Originations |
For the Three Months Ended December 31, 2017 |
For the Year Ended December 31, 2017 |
||||||
| Total Commitments (including unfunded commitments) |
$ | 220,159 | $ | 1,045,807 | ||||
| Exited Investments (including partial paydowns) |
(159,678 | ) | (869,061 | ) | ||||
|
|
|
|
|
|||||
| Net Direct Originations |
$ | 60,481 | $ | 176,746 | ||||
|
|
|
|
|
|||||
| For the Three Months Ended December 31, 2017 |
For the Year Ended December 31, 2017 |
|||||||||||||||
| New Direct Originations by Asset Class (including unfunded commitments) |
Commitment Amount |
Percentage | Commitment Amount |
Percentage | ||||||||||||
| Senior Secured Loans—First Lien |
$ | 163,235 | 74 | % | $ | 872,624 | 83 | % | ||||||||
| Senior Secured Loans—Second Lien |
15,000 | 7 | % | 23,113 | 2 | % | ||||||||||
| Senior Secured Bonds |
25,228 | 11 | % | 32,259 | 3 | % | ||||||||||
| Subordinated Debt |
— | — | 92,000 | 9 | % | |||||||||||
| Collateralized Securities |
— | — | — | — | ||||||||||||
| Equity/Other |
16,696 | 8 | % | 25,811 | 3 | % | ||||||||||
|
|
|
|
|
|
|
|
|
|||||||||
| Total |
$ | 220,159 | 100 | % | $ | 1,045,807 | 100 | % | ||||||||
|
|
|
|
|
|
|
|
|
|||||||||
69
Table of Contents
| For the Three Months Ended December 31, 2017 |
For the Year Ended December 31, 2017 |
|||||||
| Average New Direct Origination Commitment Amount |
$ | 16,935 | $ | 24,900 | ||||
| Weighted Average Maturity for New Direct Originations |
10/8/23 | 4/12/23 | ||||||
| Gross Portfolio Yield Prior to Leverage (based on amortized cost) of New Direct Originations Funded during Period |
8.6 | % | 9.5 | % | ||||
| Gross Portfolio Yield Prior to Leverage (based on amortized cost) of New Direct Originations Funded during Period—Excluding Non-Income Producing Assets |
9.3 | % | 9.7 | % | ||||
| Gross Portfolio Yield Prior to Leverage (based on amortized cost) of Direct Originations Exited during Period |
8.9 | % | 9.7 | % | ||||
The following table presents certain selected information regarding our direct originations as of December 31, 2017 and 2016:
| Characteristics of All Direct Originations held in Portfolio |
December 31, 2017 |
December 31, 2016 |
||||||
| Number of Portfolio Companies |
75 | 67 | ||||||
| Average Annual EBITDA of Portfolio Companies |
$ | 68,600 | $ | 64,600 | ||||
| Average Leverage Through Tranche of Portfolio Companies—Excluding Equity/Other and Collateralized Securities |
4.9x | 4.8x | ||||||
| % of Investments on Non-Accrual |
— | 0.1 | % | |||||
| Gross Portfolio Yield Prior to Leverage (based on amortized cost) of Funded Direct Originations |
9.6 | % | 9.1 | % | ||||
| Gross Portfolio Yield Prior to Leverage (based on amortized cost) of Funded Direct Originations—Excluding Non-Income Producing Assets |
10.4 | % | 10.1 | % | ||||
Portfolio Composition by Strategy
The table below summarizes the composition of our investment portfolio by strategy and enumerates the percentage, by fair value, of the total portfolio assets in such strategies as of December 31, 2017 and 2016:
| December 31, 2017 | December 31, 2016 | |||||||||||||||
| Portfolio Composition by Strategy |
Fair Value |
Percentage
of Portfolio |
Fair Value |
Percentage
of Portfolio |
||||||||||||
| Direct Originations |
$ | 3,606,608 | 92 | % | $ | 3,264,395 | 88 | % | ||||||||
| Opportunistic |
295,501 | 7 | % | 352,937 | 9 | % | ||||||||||
| Broadly Syndicated/Other |
24,125 | 1 | % | 109,484 | 3 | % | ||||||||||
|
|
|
|
|
|
|
|
|
|||||||||
| Total |
$ | 3,926,234 | 100 | % | $ | 3,726,816 | 100 | % | ||||||||
|
|
|
|
|
|
|
|
|
|||||||||
See Note 6 to our audited consolidated financial statements included herein for additional information regarding the composition of our investment portfolio by industry classification.
70
Table of Contents
Portfolio Asset Quality
In addition to various risk management and monitoring tools, FB Advisor uses an investment rating system to characterize and monitor the expected level of returns on each investment in our portfolio. FB Advisor uses an investment rating scale of 1 to 5. The following is a description of the conditions associated with each investment rating:
| Investment Rating |
Summary Description | |
| 1 | Investment exceeding expectations and/or capital gain expected. | |
| 2 | Performing investment generally executing in accordance with the portfolio company’s business plan—full return of principal and interest expected. | |
| 3 | Performing investment requiring closer monitoring. | |
| 4 | Underperforming investment—some loss of interest or dividend possible, but still expecting a positive return on investment. | |
| 5 | Underperforming investment with expected loss of interest and some principal. | |
The following table shows the distribution of our investments on the 1 to 5 investment rating scale at fair value as of December 31, 2017 and 2016:
| December 31, 2017 | December 31, 2016 | |||||||||||||||
| Investment Rating |
Fair Value |
Percentage
of Portfolio |
Fair Value |
Percentage
of Portfolio |
||||||||||||
| 1 |
$ | 418,237 | 11 | % | $ | 383,790 | 10 | % | ||||||||
| 2 |
3,113,283 | 79 | % | 3,049,433 | 82 | % | ||||||||||
| 3 |
370,286 | 10 | % | 242,608 | 7 | % | ||||||||||
| 4 |
10,157 | 0 | % | — | — | |||||||||||
| 5 |
14,271 | 0 | % | 50,985 | 1 | % | ||||||||||
|
|
|
|
|
|
|
|
|
|||||||||
| Total |
$ | 3,926,234 | 100 | % | $ | 3,726,816 | 100 | % | ||||||||
|
|
|
|
|
|
|
|
|
|||||||||
The amount of the portfolio in each grading category may vary substantially from period to period resulting primarily from changes in the composition of the portfolio as a result of new investment, repayment and exit activities. In addition, changes in the grade of investments may be made to reflect our expectation of performance and changes in investment values.
Results of Operations
Comparison of the Years Ended December 31, 2017, 2016 and 2015
Revenues
Our investment income for the years ended December 31, 2017, 2016 and 2015 was as follows:
| Year Ended December 31, | ||||||||||||||||||||||||
| 2017 | 2016 | 2015 | ||||||||||||||||||||||
| Amount | Percentage of Total Income |
Amount | Percentage of Total Income |
Amount | Percentage of Total Income |
|||||||||||||||||||
| Interest income |
$ | 334,296 | 80 | % | $ | 350,728 | 83 | % | $ | 400,288 | 84 | % | ||||||||||||
| Paid-in-kind interest income |
40,978 | 10 | % | 32,837 | 8 | % | 23,529 | 5 | % | |||||||||||||||
| Fee income |
44,016 | 10 | % | 36,293 | 8 | % | 44,182 | 9 | % | |||||||||||||||
| Dividend income |
21 | 0 | % | 2,951 | 1 | % | 6,798 | 2 | % | |||||||||||||||
|
|
|
|
|
|
|
|
|
|
|
|
|
|||||||||||||
| Total investment income(1) |
$ | 419,311 | 100 | % | $ | 422,809 | 100 | % | $ | 474,797 | 100 | % | ||||||||||||
|
|
|
|
|
|
|
|
|
|
|
|
|
|||||||||||||
| (1) | Such revenues represent $373,421, $382,147 and $440,121 of cash income earned as well as $45,890, $40,662 and $34,676 in non-cash portions relating to accretion of discount and PIK interest for the years |
71
Table of Contents
| ended December 31, 2017, 2016 and 2015, respectively. Cash flows related to such non-cash revenues may not occur for a number of reporting periods or years after such revenues are recognized. |
The level of interest income we receive is generally related to the balance of income-producing investments, multiplied by the weighted average yield of our investments. Fee income is transaction based, and typically consists of amendment and consent fees, prepayment fees, structuring fees and other non-recurring fees. As such, fee income is generally dependent on new direct origination investments and the occurrence of events at existing portfolio companies resulting in such fees.
The decrease in interest income and increase in PIK interest income for the year ended December 31, 2017 compared to the year ended December 31, 2016 can be attributed to the prepayment and restructuring of certain higher yielding assets into assets with a higher PIK paying component. The higher fee income during this same period can be attributed to such increased prepayment and restructuring activity.
The decrease in interest income and fee income in the aggregate during the year ended December 31, 2016 compared to the year ended December 31, 2015 was primarily due to reduced leverage levels, prepayments of certain higher-yielding assets and increased equity holdings as a result of a number of restructurings during the year ended December 31, 2016. The decrease in dividend income was due primarily to a one-time dividend paid in respect of one of our investments during the year ended December 31, 2015.
Expenses
Our operating expenses, together with excise taxes, for the years ended December 31, 2017, 2016 and 2015 were as follows:
| Year Ended December 31, | ||||||||||||
| 2017 | 2016 | 2015 | ||||||||||
| Management fees |
$ | 72,797 | $ | 71,280 | $ | 75,401 | ||||||
| Capital gains incentive fees |
— | — | (21,075 | ) | ||||||||
| Subordinated income incentive fees |
50,297 | 51,830 | 61,036 | |||||||||
| Administrative services expenses |
3,051 | 3,475 | 4,182 | |||||||||
| Accounting and administrative fees |
1,014 | 966 | 1,082 | |||||||||
| Interest expense |
79,145 | 74,058 | 75,127 | |||||||||
| Directors’ fees |
1,149 | 1,139 | 1,026 | |||||||||
| Expenses associated with our independent audit and related fees |
350 | 481 | 486 | |||||||||
| Compensation of our chief compliance officer(1) |
— | — | 25 | |||||||||
| Legal fees |
1,134 | 910 | 1,826 | |||||||||
| Printing fees |
1,198 | 1,329 | 1,079 | |||||||||
| Stock transfer agent fees |
134 | 179 | 134 | |||||||||
|
Other(2) |
2,599 | 4,285 | 3,322 | |||||||||
|
|
|
|
|
|
|
|||||||
| Total operating expenses |
$ | 212,868 | $ | 209,932 | $ | 203,651 | ||||||
| Management fee waiver |
(2,575 | ) | — | — | ||||||||
|
|
|
|
|
|
|
|||||||
| Net operating expenses before taxes |
210,293 | 209,932 | 203,651 | |||||||||
| Excise taxes |
5,259 | 5,554 | 6,056 | |||||||||
|
|
|
|
|
|
|
|||||||
| Total net expenses, including excise taxes |
$ | 215,552 | $ | 215,486 | $ | 209,707 | ||||||
|
|
|
|
|
|
|
|||||||
| (1) | On April 1, 2015, James F. Volk was appointed as our chief compliance officer. Prior to that date, we had contracted with Vigilant Compliance, LLC to provide the services of Salvatore Faia as our chief compliance officer. Mr. Volk is employed by FS Investments and will not receive any direct compensation from us in this capacity. |
| (2) | Other expenses during the year ended December 31, 2016 include $938 of breakage fees associated with the partial paydown of a former debt financing arrangement two of our wholly-owned, special purpose financing subsidiaries had entered into with JPMorgan Chase Bank, N.A., London Branch. |
72
Table of Contents
The following table reflects selected expense ratios as a percent of average net assets for the years ended December 31, 2017, 2016 and 2015:
| Year Ended December 31, | ||||||||||||
| 2017 | 2016 | 2015 | ||||||||||
| Ratio of operating expenses and excise taxes to average net assets |
9.48 | % | 9.69 | % | 8.90 | % | ||||||
| Ratio of management fee waiver to average net assets |
(0.11 | )% | — | — | ||||||||
|
|
|
|
|
|
|
|||||||
| Ratio of net operating expenses to average net assets |
9.37 | % | 9.69 | % | 8.90 | % | ||||||
| Ratio of incentive fees, interest expense and excise taxes to average net assets(1) |
5.85 | % | 5.91 | % | 5.15 | % | ||||||
|
|
|
|
|
|
|
|||||||
| Ratio of net operating expenses, excluding certain expenses, to average net assets |
3.52 | % | 3.78 | % | 3.75 | % | ||||||
|
|
|
|
|
|
|
|||||||
| (1) | Ratio data may be rounded in order to recompute the ending ratio of net operating expenses, excluding certain expenses, to average net assets. |
Incentive fees and interest expense, among other things, may increase or decrease our expense ratios relative to comparative periods depending on portfolio performance and changes in amounts outstanding under our financing arrangements and benchmark interest rates such as LIBOR, among other factors.
Net Investment Income
Our net investment income totaled $203,759 ($0.83 per share), $207,323 ($0.85 per share) and $265,090 ($1.10 per share) for the years ended December 31, 2017, 2016 and 2015, respectively. The decrease in net investment income for the years ended December 31, 2017 and 2016 compared to 2015 can be attributed to the reversal of capital gains incentive fees that reduced expenses during the year ended December 31, 2015, as well as lower income during 2017 and 2016 as discussed above.
Net Realized Gains or Losses
Our net realized gains (losses) on investments, secured borrowing and foreign currency for the years ended December 31, 2017, 2016 and 2015 were as follows:
| Year Ended December 31, | ||||||||||||
| 2017 | 2016 | 2015 | ||||||||||
| Net realized gain (loss) on investments(1) |
$ | (142,769 | ) | $ | (63,561 | ) | $ | (62,426 | ) | |||
| Net realized gain (loss) on secured borrowing |
(21 | ) | — | — | ||||||||
| Net realized gain (loss) on foreign currency |
247 | 330 | (640 | ) | ||||||||
|
|
|
|
|
|
|
|||||||
| Total net realized gain (loss) |
$ | (142,543 | ) | $ | (63,231 | ) | $ | (63,066 | ) | |||
|
|
|
|
|
|
|
|||||||
| (1) | We sold investments and received principal repayments, respectively, of $350,171 and $784,827 during the year ended December 31, 2017, $547,222 and $1,041,276 during the year ended December, 31, 2016 and $607,368 and $1,018,152 during the year ended December 31, 2015. |
Net Change in Unrealized Appreciation (Depreciation)
Our net change in unrealized appreciation (depreciation) on investments, secured borrowing and unrealized gain (loss) on foreign currency for the years ended December 31, 2017, 2016 and 2015 were as follows:
| Year Ended December 31, | ||||||||||||
| 2017 | 2016 | 2015 | ||||||||||
| Net change in unrealized appreciation (depreciation) on investments |
$ | 126,512 | $ | 148,691 | $ | (167,165 | ) | |||||
| Net change in unrealized appreciation (depreciation) on secured borrowing |
49 | (49 | ) | — | ||||||||
| Net change in unrealized gain (loss) on foreign currency |
(5,790 | ) | 1,557 | 3,526 | ||||||||
|
|
|
|
|
|
|
|||||||
| Total net change in unrealized appreciation (depreciation) |
$ | 120,771 | $ | 150,199 | $ | (163,639 | ) | |||||
|
|
|
|
|
|
|
|||||||
73
Table of Contents
During the year ended December 31, 2017, the net change in unrealized appreciation (depreciation) on our investments was primarily driven by the conversion of unrealized depreciation to realized losses combined with depreciation of certain equity positions. During the year ended December 31, 2016, the net change in unrealized appreciation (depreciation) on our investments was primarily driven by a general tightening of credit spreads and an increase in the valuation of certain of our energy investments and Caesars Entertainment Operating Co., Inc. loans following positive developments in restructuring efforts concerning these loans.
Net Increase (Decrease) in Net Assets Resulting from Operations
For the years ended December 31, 2017, 2016 and 2015, the net increase in net assets resulting from operations was $181,987 ($0.74 per share), $294,291 ($1.21 per share) and $38,385 ($0.16 per share), respectively.
Financial Condition, Liquidity and Capital Resources
Overview
As of December 31, 2017, we had $138,742 in cash and foreign currency, which we or our wholly-owned financing subsidiaries held in custodial accounts, and $260,750 in borrowings available under our financing arrangements, subject to borrowing base and other limitations. As of December 31, 2017, we also had broadly syndicated investments and opportunistic investments that could be sold to create additional liquidity. As of December 31, 2017, we had twenty unfunded debt investments with aggregate unfunded commitments of $154,074, one unfunded commitment to purchase up to $295 of preferred stock and one unfunded commitment to purchase up to $4 in shares of common stock. We maintain sufficient cash on hand, available borrowings and liquid securities to fund such unfunded commitments should the need arise.
We currently generate cash primarily from cash flows from fees, interest and dividends earned from our investments, as well as principal repayments and proceeds from sales of our investments. To seek to enhance our returns, we also employ leverage as market conditions permit and at the discretion of FB Advisor, but in no event will leverage employed exceed 50% of the value of our assets, as required by the 1940 Act. See “—Financing Arrangements.”
Prior to investing in securities of portfolio companies, we invest the cash received from fees, interest and dividends earned from our investments and principal repayments and proceeds from sales of our investments primarily in cash, cash equivalents, including money market funds, U.S. government securities, repurchase agreements and high-quality debt instruments maturing in one year or less from the time of investment, consistent with our BDC election and our election to be taxed as a RIC.
Financing Arrangements
The following table presents summary information with respect to our outstanding financing arrangements as of December 31, 2017:
| Arrangement |
Type of Arrangement |
Rate |
Amount Outstanding |
Amount Available |
Maturity Date | |||||||||
| Hamilton Street Credit Facility(1) |
Revolving Credit Facility | L+2.50% | $ | 150,000 | $ | — | December 15, 2021 | |||||||
| ING Credit Facility(1) |
Revolving Credit Facility | L+2.25% | $ | 66,750 | (2) | $ | 260,750 | March 16, 2021 | ||||||
| Locust Street Credit Facility(1) |
Term Loan Credit Facility | L+2.68% | $ | 425,000 | $ | — | November 1, 2020 | |||||||
| 4.000% Notes due 2019 |
Unsecured Notes | 4.00% | $ | 400,000 | $ | — | July 15, 2019 | |||||||
| 4.250% Notes due 2020 |
Unsecured Notes | 4.25% | $ | 405,000 | $ | — | January 15, 2020 | |||||||
| 4.750% Notes due 2022 |
Unsecured Notes | 4.75% | $ | 275,000 | $ | — | May 15, 2022 | |||||||
|
|
|
|
|
|||||||||||
| Total |
$ | 1,721,750 | $ | 260,750 | ||||||||||
74
Table of Contents
| (1) | The carrying amount outstanding under the facility approximates its fair value. |
| (2) | Borrowings in Euros and Canadian dollars. Euro balance outstanding of €41,576 has been converted to U.S. dollars at an exchange rate of €1.00 to $1.20 as of December 31, 2017 to reflect total amount outstanding in U.S. dollars. Canadian dollar balance outstanding of CAD $20,987 has been converted to U.S. dollars at an exchange rate of CAD $1.00 to $0.80 as of December 31, 2017 to reflect total amount outstanding in U.S. dollars. |
See Note 8 to our consolidated financial statements included herein for additional information regarding our financing arrangements.
RIC Status and Distributions
We have elected to be subject to tax as a RIC under Subchapter M of the Code. In order to qualify for RIC tax treatment, we must, among other things, make distributions of an amount at least equal to 90% of our investment company taxable income, determined without regard to any deduction for distributions paid, each tax year. As long as the distributions are declared by the later of the fifteenth day of the ninth month following the close of a tax year or the due date of the tax return for such tax year, including extensions, distributions paid up to twelve months after the current tax year can be carried back to the prior tax year for determining the distributions paid in such tax year. We intend to make sufficient distributions to our stockholders to qualify for and maintain our RIC tax status each tax year. We are also subject to a 4% nondeductible federal excise taxes on certain undistributed income unless we make distributions in a timely manner to our stockholders generally of an amount at least equal to the sum of (1) 98% of our net ordinary income (taking into account certain deferrals and elections) for the calendar year, (2) 98.2% of our capital gain net income, which is the excess of capital gains in excess of capital losses, or “capital gain net income” (adjusted for certain ordinary losses), for the one-year period ending October 31 of that calendar year and (3) any net ordinary income and capital gain net income for the preceding years that were not distributed during such years and on which we paid no U.S. federal income tax. Any distribution declared by us during October, November or December of any calendar year, payable to stockholders of record on a specified date in such a month and actually paid during January of the following calendar year, will be treated as if it had been paid by us, as well as received by our U.S. stockholders, on December 31 of the calendar year in which the distribution was declared. We can offer no assurance that we will achieve results that will permit us to pay any cash distributions. If we issue senior securities, we will be prohibited from making distributions if doing so causes us to fail to maintain the asset coverage ratios stipulated by the 1940 Act or if distributions are limited by the terms of any of our borrowings.
Subject to applicable legal restrictions and the sole discretion of our board of directors, we intend to authorize, declare and pay regular cash distributions on a quarterly basis. We will calculate each stockholder’s specific distribution amount for the period using record and declaration dates and each stockholder’s distributions will begin to accrue on the date that shares of our common stock are issued to such stockholder. From time to time, we may also pay special interim distributions in the form of cash or shares of our common stock at the discretion of our board of directors. As previously announced by the Company, subject to market conditions, our board of directors currently intends to make a special distribution in the fourth quarter of 2018 that equates to the cumulative amount, if any, of net investment income earned during the twelve months following October 1, 2017 that is in excess of $0.76 per share. The timing and amount of any future distributions to stockholders are subject to applicable legal restrictions and the sole discretion of our board of directors.
During certain periods, our distributions may exceed our earnings. As a result, it is possible that a portion of the distributions we make may represent a return of capital. A return of capital generally is a return of a stockholder’s investment rather than a return of earnings or gains derived from our investment activities. Each year a statement on Form 1099-DIV identifying the sources of the distributions will be mailed to our stockholders. No portion of the distributions paid during the tax years ended December 31, 2017, 2016 or 2015 represented a return of capital.
75
Table of Contents
We intend to continue to make our regular distributions in the form of cash, out of assets legally available for distribution, except for those stockholders who receive their distributions in the form of shares of our common stock under our distribution reinvestment plan. Any distributions reinvested under the plan will nevertheless remain taxable to a U.S. stockholder.
The following table reflects the cash distributions per share that we have declared on our common stock during the years ended December 31, 2017, 2016 and 2015:
| Distribution | ||||||||
| For the Year Ended December 31, |
Per Share | Amount | ||||||
| 2015 |
$ | 0.89100 | $ | 215,606 | ||||
| 2016 |
$ | 0.89100 | $ | 216,933 | ||||
| 2017 |
$ | 0.85825 | $ | 210,549 | ||||
See Note 5 to our consolidated financial statements contained in this annual report on Form 10-K for additional information regarding our distributions, including a reconciliation of our GAAP-basis net investment income to our tax-basis net investment income for the years ended December 31, 2017, 2016 and 2015.
Critical Accounting Policies
Our financial statements are prepared in conformity with GAAP, which requires us to make estimates and assumptions that affect the reported amounts of assets and liabilities at the date of the financial statements and the reported amounts of revenues and expenses during the reporting periods. Critical accounting policies are those that require the application of management’s most difficult, subjective or complex judgments, often because of the need to make estimates about the effect of matters that are inherently uncertain and that may change in subsequent periods. In preparing the financial statements, management has made estimates and assumptions that affect the reported amounts of assets and liabilities at the date of the financial statements and the reported amounts of revenues and expenses during the reporting periods. In preparing the financial statements, management has utilized available information, including our past history, industry standards and the current economic environment, among other factors, in forming its estimates and judgments, giving due consideration to materiality. Actual results may differ from these estimates. In addition, other companies may utilize different estimates, which may impact the comparability of our results of operations to those of companies in similar businesses. As we execute our operating plans, we will describe additional critical accounting policies in the notes to our future financial statements in addition to those discussed below.
Valuation of Portfolio Investments
We determine the net asset value of our investment portfolio each quarter. Securities are valued at fair value as determined in good faith by our board of directors. In connection with that determination, FB Advisor provides our board of directors with portfolio company valuations which are based on relevant inputs, including, but not limited to, indicative dealer quotes, values of like securities, recent portfolio company financial statements and forecasts, and valuations prepared by independent third-party valuation services.
Accounting Standards Codification Topic 820, Fair Value Measurements and Disclosure, or ASC Topic 820, issued by the Financial Accounting Standards Board, or the FASB, clarifies the definition of fair value and requires companies to expand their disclosure about the use of fair value to measure assets and liabilities in interim and annual periods subsequent to initial recognition. ASC Topic 820 defines fair value as the price that would be received from the sale of an asset or paid to transfer a liability in an orderly transaction between market participants at the measurement date. ASC Topic 820 also establishes a three-tier fair value hierarchy, which prioritizes the inputs used in measuring fair value. These tiers include: Level 1, defined as observable inputs such as quoted prices in active markets; Level 2, which includes inputs such as quoted prices for similar securities in active markets and quoted prices for identical securities where there is little or no activity in the market; and Level 3, defined as unobservable inputs for which little or no market data exists, therefore requiring an entity to develop its own assumptions.
76
Table of Contents
With respect to investments for which market quotations are not readily available, we undertake a multi-step valuation process each quarter, as described below:
| • | our quarterly fair valuation process begins with FB Advisor’s management team reviewing and documenting valuations of each portfolio company or investment, which valuations may be obtained from an independent third-party valuation service, if applicable; |
| • | FB Advisor’s management team then provides the valuation committee with the preliminary valuations for each portfolio company or investment; |
| • | preliminary valuations are then discussed with the valuation committee; |
| • | our valuation committee reviews the preliminary valuations and FB Advisor’s management team, together with our independent third-party valuation services, if applicable, supplement the preliminary valuations to reflect any comments provided by the valuation committee; |
| • | following its review, the valuation committee will recommend that our board of directors approve our fair valuations; and |
| • | our board of directors discusses the valuations and determines the fair value of each such investment in our portfolio in good faith based on various statistical and other factors, including the input and recommendation of FB Advisor, the valuation committee and any independent third-party valuation services, if applicable. |
Determination of fair value involves subjective judgments and estimates. Accordingly, the notes to our consolidated financial statements refer to the uncertainty with respect to the possible effect of such valuations and any change in such valuations on our consolidated financial statements. In making its determination of fair value, our board of directors may use any approved independent third-party pricing or valuation services. However, our board of directors is not required to determine fair value in accordance with the valuation provided by any single source, and may use any relevant data, including information obtained from FB Advisor or any approved independent third-party valuation or pricing service that our board of directors deems to be reliable in determining fair value under the circumstances. Below is a description of factors that FB Advisor’s management team, any approved independent third-party valuation services and our board of directors may consider when determining the fair value of our investments.
Valuation of fixed income investments, such as loans and debt securities, depends upon a number of factors, including prevailing interest rates for like securities, expected volatility in future interest rates, call features, put features and other relevant terms of the debt. For investments without readily available market prices, we may incorporate these factors into discounted cash flow models to arrive at fair value. Other factors that may be considered include the borrower’s ability to adequately service its debt, the fair market value of the borrower in relation to the face amount of its outstanding debt and the quality of collateral securing our debt investments.
For convertible debt securities, fair value generally approximates the fair value of the debt plus the fair value of an option to purchase the underlying security (i.e., the security into which the debt may convert) at the conversion price. To value such an option, a standard option pricing model may be used.
Our equity interests in portfolio companies for which there is no liquid public market are valued at fair value. Our board of directors, in its determination of fair value, may consider various factors, such as multiples of EBITDA, cash flows, net income, revenues or, in limited instances, book value or liquidation value. All of these factors may be subject to adjustments based upon the particular circumstances of a portfolio company or our actual investment position. For example, adjustments to EBITDA may take into account compensation to previous owners or acquisition, recapitalization, restructuring or other related items.
FB Advisor’s management team, any approved independent third-party valuation services and our board of directors may also consider private merger and acquisition statistics, public trading multiples discounted for
77
Table of Contents
illiquidity and other factors, valuations implied by third-party investments in the portfolio companies or industry practices in determining fair value. FB Advisor’s management team, any approved independent third-party valuation services and our board of directors may also consider the size and scope of a portfolio company and its specific strengths and weaknesses, and may apply discounts or premiums, where and as appropriate, due to the higher (or lower) financial risk and/or the smaller size of portfolio companies relative to comparable firms, as well as such other factors as our board of directors, in consultation with FB Advisor’s management team and any approved independent third-party valuation services, if applicable, may consider relevant in assessing fair value. Generally, the value of our equity interests in public companies for which market quotations are readily available is based upon the most recent closing public market price. Portfolio securities that carry certain restrictions on sale are typically valued at a discount from the public market value of the security.
When we receive warrants or other equity securities at nominal or no additional cost in connection with an investment in a debt security, the cost basis in the investment will be allocated between the debt securities and any such warrants or other equity securities received at the time of origination. Our board of directors subsequently values these warrants or other equity securities received at their fair value.
The fair values of our investments are determined in good faith by our board of directors. Our board of directors is responsible for the valuation of our portfolio investments at fair value as determined in good faith pursuant to our valuation policy and consistently applied valuation process. Our board of directors has delegated day-to-day responsibility for implementing our valuation policy to FB Advisor’s management team, and has authorized FB Advisor’s management team to utilize independent third-party valuation and pricing services that have been approved by our board of directors. The valuation committee is responsible for overseeing FB Advisor’s implementation of the valuation process.
See Note 7 to our consolidated financial statements included herein for additional information regarding the fair value of our financial instruments.
Revenue Recognition
Security transactions are accounted for on the trade date. We record interest income on an accrual basis to the extent that we expect to collect such amounts. We record dividend income on the ex-dividend date. We do not accrue as a receivable interest or dividends on loans and securities if we have reason to doubt our ability to collect such income. Our policy is to place investments on non-accrual status when there is reasonable doubt that interest income will be collected. We consider many factors relevant to an investment when placing it on or removing it from non-accrual status including, but not limited to, the delinquency status of the investment, economic and business conditions, the overall financial condition of the underlying investment, the value of the underlying collateral, bankruptcy status, if any, and any other facts or circumstances relevant to the investment. If there is reasonable doubt that we will receive any previously accrued interest, then the interest income will be written-off. Payments received on non-accrual investments may be recognized as income or applied to principal depending upon the collectability of the remaining principal and interest. Non-accrual investments may be restored to accrual status when principal and interest become current and are likely to remain current based on our judgment.
Loan origination fees, original issue discount and market discount are capitalized and we amortize such amounts as interest income over the respective term of the loan or security. Upon the prepayment of a loan or security, any unamortized loan origination fees and original issue discount are recorded as interest income. Structuring and other non-recurring upfront fees are recorded as fee income when earned. We record prepayment premiums on loans and securities as fee income when we earn such amounts.
In May 2014, the FASB issued ASU No. 2014-09, Revenue from Contracts with Customers, which provides for revenue recognition based on the consideration to which an entity expects to be entitled in exchange for transferring goods or services to a customer. When it becomes effective, the new revenue recognition guidance in ASU No. 2014-09 will replace most revenue recognition guidance under existing GAAP. In 2016, the FASB issued additional guidance that clarified, amended and technically corrected prior revenue recognition
78
Table of Contents
guidance. The new revenue recognition guidance applies to all entities and all contracts with customers to provide goods or services in the ordinary course of business, excluding, among other things, financial instruments as well as certain other contractual rights and obligations. For public entities, the new standards are effective during the interim and annual periods beginning after December 15, 2017, with early adoption permitted. The standards permit the use of either the retrospective or cumulative effect transition method. As a result, we are required to adopt the new guidance as of January 1, 2018 and expect to do so using the cumulative effect method applied to in-scope contracts with customers that have not been completed as of the date of adoption.
In connection with our evaluation of the impact of the new revenue recognition guidance on our revenue recognition polices for structuring and other non-recurring upfront fees, we have performed an analysis to identify contracts with customers within the scope of the new revenue recognition guidance and to determine the related performance obligation and transaction price. Under the new revenue recognition guidance, we expect to recognize revenue for in-scope contracts based on the transaction price as the performance obligation is fulfilled. In our analysis, we considered, among other matters, the nature of the performance obligation and constraints on including variable consideration in the transaction price. In addition, we considered the costs incurred to obtain and fulfill in-scope contracts with customers to determine whether such costs would be required to be capitalized.
Based on our analysis, we expect to provide additional revenue recognition disclosures required under the new standard but do not otherwise expect a material effect on our consolidated financial statements.
Net Realized Gains or Losses, Net Change in Unrealized Appreciation or Depreciation and Net Change in Unrealized Gains or Losses on Foreign Currency
Gains or losses on the sale of investments are calculated by using the specific identification method. We measure realized gains or losses by the difference between the net proceeds from the repayment or sale and the amortized cost basis of the investment, without regard to unrealized appreciation or depreciation previously recognized, but considering unamortized fees. Net change in unrealized appreciation or depreciation reflects the change in portfolio investment values during the reporting period, including any reversal of previously recorded unrealized gains or losses when gains or losses are realized. Net change in unrealized gains or losses on foreign currency reflects the change in the value of receivables or accruals during the reporting period due to the impact of foreign currency fluctuations.
We follow the guidance in Accounting Standards Codification Topic 860, Transfers and Servicing, when accounting for loan participations and other partial loan sales. This guidance requires a participation or other partial loan sale to meet the definition of a participating interest, as defined in the guidance, in order for sale treatment to be allowed. Participations or other partial loan sales which do not meet the definition of a participating interest remain on our consolidated balance sheets and the proceeds are recorded as a secured borrowing until the participation or other partial loan sale meets the definition. Secured borrowings are carried at fair value to correspond with the related investments, which are carried at fair value.
Uncertainty in Income Taxes
We evaluate our tax positions to determine if the tax positions taken meet the minimum recognition threshold in connection with accounting for uncertainties in income tax positions taken or expected to be taken for the purposes of measuring and recognizing tax benefits or liabilities in our consolidated financial statements. Recognition of a tax benefit or liability with respect to an uncertain tax position is required only when the position is “more likely than not” to be sustained assuming examination by taxing authorities. We recognize interest and penalties, if any, related to unrecognized tax liabilities as income tax expense in our consolidated statements of operations. During the years ended December 31, 2017, 2016 and 2015, we did not incur any interest or penalties.
See Note 2 to our consolidated financial statements contained in this annual report on Form 10-K for additional information regarding our significant accounting policies.
79
Table of Contents
Contractual Obligations
We have entered into agreements with FB Advisor to provide us with investment advisory and administrative services. Payments for investment advisory services under the investment advisory agreement are equal to (a) an annual base management fee based on the average value of our gross assets and (b) an incentive fee based on our performance. FB Advisor, and to the extent it is required to provide such services, GDFM, are reimbursed for administrative expenses incurred on our behalf. See Note 4 to our consolidated financial statements included herein and “—Related Party Transactions—Compensation of the Investment Adviser” for a discussion of these agreements and for the amount of fees and expenses accrued under these agreements during the years ended December 31, 2017, 2016 and 2015.
A summary of our significant contractual payment obligations for the repayment of outstanding indebtedness at December 31, 2017 is as follows:
| Payments Due By Period | ||||||||||||||||
| Maturity Date(1) | Total | Less than 1 year |
1-3 years | 3-5 years | More than 5 years | |||||||||||
| Hamilton Street Credit Facility(2) |
December 15, 2021 | $150,000 | — | — | $150,000 | — | ||||||||||
| ING Credit Facility(3) |
March 16, 2021 | $66,750 | — | — | $66,750 | — | ||||||||||
| Locust Street Credit Facility(2) |
November 1, 2020 | $425,000 | — | $ | 425,000 | — | — | |||||||||
| 4.000% Notes due 2019 |
July 15, 2019 | $400,000 | — | $ | 400,000 | — | — | |||||||||
| 4.250% Notes due 2020 |
January 15, 2020 | $405,000 | — | $ | 405,000 | — | — | |||||||||
| 4.750% Notes due 2022 |
May 15, 2022 | $275,000 | — | — | $275,000 | — | ||||||||||
| (1) | Amounts outstanding under the financing arrangements will mature, and all accrued and unpaid interest thereunder will be due and payable, on the maturity date. |
| (2) | At December 31, 2017, no amounts remained unused under the financing arrangement. |
| (3) | At December 31, 2017, $260,750 remained unused under the ING credit facility. Borrowings in Euros and Canadian dollars. Euro balance outstanding of €41,576 has been converted to U.S. dollars at an exchange rate of €1.00 to $1.20 as of December 31, 2017 to reflect total amount outstanding in U.S. dollars. Canadian dollar balance outstanding of CAD $20,987 has been converted to U.S. dollars at an exchange rate of CAD $1.00 to $0.80 as of December 31, 2017 to reflect total amount outstanding in U.S. dollars. |
Off-Balance Sheet Arrangements
We currently have no off-balance sheet arrangements, including any risk management of commodity pricing or other hedging practices.
Recently Issued Accounting Standards
None.
Related Party Transactions
Compensation of the Investment Adviser
Pursuant to the investment advisory agreement, FB Advisor is entitled to an annual base management fee equal to 1.75% of the average value of our gross assets and an incentive fee based on our performance. FB Advisor has agreed, effective October 1, 2017 and through September 30, 2018, to (a) waive a portion of the base management fee to which it is entitled under the investment advisory agreement so that the fee received equals 1.50% of the average value of the Company’s gross assets and (b) continue to calculate the subordinated incentive fee on income to which it is entitled under the investment advisory agreement as if the base management fee was 1.75% of the average value of the Company’s gross assets. The investment sub-advisory agreement provides that GDFM will receive 50% of all management and incentive fees payable to FB Advisor
80
Table of Contents
under the investment advisory agreement with respect to each year. Pursuant to the administration agreement, we also reimburse FB Advisor and GDFM for expenses necessary to perform services related to our administration and operations, including FB Advisor’s allocable portion of the compensation and related expenses of certain personnel of FS Investments providing administrative services to us on behalf of FB Advisor.
See Note 4 to our consolidated financial statements contained in this annual report on Form 10-K for additional information regarding our agreements with FB Advisor and our other related party transactions and relationships, including a description of the fees and amounts due to FB Advisor and potential conflicts of interest.
See “Item 1. Business—The Transition of Investment Advisory Services” for information regarding GDFM’s resignation as our investment sub-advisor and our potential advisory relationship with KKR Credit and/or FS/KKR Advisor.
Recent Developments
See “Item 1. Business—The Transition of Investment Advisory Services” for information regarding our potential investment advisory relationship with KKR Credit and/or FS/KKR Advisor.
| Item 7A. | Quantitative and Qualitative Disclosures About Market Risk. |
We are subject to financial market risks, including changes in interest rates. As of December 31, 2017, 69.4% of our portfolio investments (based on fair value) paid variable interest rates, 17.8% paid fixed interest rates, 2.3% were income producing equity or other investments, and the remaining 10.5% consisted of non-income producing equity or other investments. A rise in the general level of interest rates can be expected to lead to higher interest rates applicable to any variable rate investments we hold and to declines in the value of any fixed rate investments we hold. However, many of our variable rate investments provide for an interest rate floor, which may prevent our interest income from increasing until benchmark interest rates increase beyond a threshold amount. To the extent that a substantial portion of our investments may be in variable rate investments, an increase in interest rates beyond this threshold would make it easier for us to meet or exceed the hurdle rate applicable to the subordinated incentive fee on income, and may result in a substantial increase in our net investment income and to the amount of incentive fees payable to FB Advisor with respect to our increased pre-incentive fee net investment income.
Pursuant to the terms of the Hamilton Street credit facility, ING credit facility and Locust Street credit facility, we borrow at a floating rate based on a benchmark interest rate. Under the indenture governing the 4.000% notes, the 4.250% notes and the 4.750% notes, we pay interest to the holders of such notes at a fixed rate. To the extent that any present or future credit facilities or other financing arrangements that we or any of our subsidiaries enter into are based on a floating interest rate, we will be subject to risks relating to changes in market interest rates. In periods of rising interest rates when we or our subsidiaries have such debt outstanding, or financing arrangements in effect, our interest expense would increase, which could reduce our net investment income, especially to the extent we hold fixed rate investments.
81
Table of Contents
The following table shows the effect over a twelve month period of changes in interest rates on our interest income, interest expense and net interest income, assuming no changes in the composition of our investment portfolio, including the accrual status of our investments, and our financing arrangements in effect as of December 31, 2017 (dollar amounts are presented in thousands):
| Basis Point Change in Interest Rates |
Increase (Decrease) in Interest Income(1) |
Increase (Decrease) in Interest Expense |
Increase (Decrease) in Net Interest Income |
Percentage Change in Net Interest Income |
||||||||||||
| Down 100 basis points |
$ | (17,421 | ) | $ | (6,190 | ) | $ | (11,231 | ) | (3.9 | )% | |||||
| No change |
— | — | — | — | ||||||||||||
| Up 100 basis points |
26,256 | 6,190 | 20,066 | 6.9 | % | |||||||||||
| Up 300 basis points |
79,770 | 18,571 | 61,199 | 21.2 | % | |||||||||||
| Up 500 basis points |
133,328 | 30,952 | 102,376 | 35.4 | % | |||||||||||
| (1) | Assumes no defaults or prepayments by portfolio companies over the next twelve months. |
We expect that our long-term investments will be financed primarily with equity and debt. If deemed prudent, we may use interest rate risk management techniques in an effort to minimize our exposure to interest rate fluctuations. These techniques may include various interest rate hedging activities to the extent permitted by the 1940 Act. Adverse developments resulting from changes in interest rates or hedging transactions could have a material adverse effect on our business, financial condition and results of operations. During the years ended December 31, 2017, 2016 and 2015 we did not engage in interest rate hedging activities.
In addition, we may have risk regarding portfolio valuation. See “Item 2. Management’s Discussion and Analysis of Financial Condition and Results of Operations—Critical Accounting Policies—Valuation of Portfolio Investments.”
82
Table of Contents
| Item 8. | Financial Statements and Supplementary Data. |
Index to Financial Statements
83
Table of Contents
MANAGEMENT’S REPORT ON INTERNAL CONTROL OVER FINANCIAL REPORTING
Our management is responsible for establishing and maintaining adequate internal control over financial reporting. In connection with the preparation of our annual financial statements, management has conducted an assessment of the effectiveness of our internal control over financial reporting based on the framework set forth in Internal Control—Integrated Framework issued by the Committee of Sponsoring Organizations of the Treadway Commission in 2013 (“COSO”). Management’s assessment included an evaluation of the design of our internal control over financial reporting and testing of the operational effectiveness of those controls. Based on this evaluation, we have concluded that, as of December 31, 2017, our internal control over financial reporting was effective to provide reasonable assurance regarding the reliability of financial reporting and the preparation of financial statements for external purposes in accordance with U.S. generally accepted accounting principles. Our internal control over financial reporting as of December 31, 2017 has been audited by our independent registered public accounting firm.
84
Table of Contents
REPORT OF INDEPENDENT REGISTERED PUBLIC ACCOUNTING FIRM
To the Board of Directors and Stockholders
FS Investment Corporation
Philadelphia, Pennsylvania
Opinion on the Internal Control Over Financial Reporting
We have audited FS Investment Corporation’s (the Company) internal control over financial reporting as of December 31, 2017, based on criteria established in Internal Control-Integrated Framework issued by the Committee of Sponsoring Organizations of the Treadway Commission in 2013. In our opinion, the Company maintained, in all material respects, effective internal control over financial reporting as of December 31, 2017, based on criteria established in Internal Control-Integrated Framework issued by the Committee of Sponsoring Organizations of the Treadway Commission in 2013.
We have also audited, in accordance with the standards of the Public Company Accounting Oversight Board (United States) (PCAOB), the consolidated balance sheets, including the consolidated schedules of investments, of FS Investment Corporation as of December 31, 2017 and 2016, and the related consolidated statements of operations, changes in net assets and cash flows for each of the three years in the period ended December 31, 2017 and our report dated March 1, 2018 expressed an unqualified opinion.
Basis for Opinion
The Company’s management is responsible for maintaining effective internal control over financial reporting and for its assessment of the effectiveness of internal control over financial reporting in the accompanying Management’s Report on Internal Control Over Financial Reporting. Our responsibility is to express an opinion on the Company’s internal control over financial reporting based on our audit. We are a public accounting firm registered with the PCAOB and are required to be independent with respect to the Company in accordance with U.S. federal securities laws and the applicable rules and regulations of the Securities and Exchange Commission and the PCAOB.
We conducted our audit in accordance with the standards of the PCAOB. Those standards require that we plan and perform the audit to obtain reasonable assurance about whether effective internal control over financial reporting was maintained in all material respects. Our audit included obtaining an understanding of internal control over financial reporting, assessing the risk that a material weakness exists, and testing and evaluating the design and operating effectiveness of internal control based on the assessed risk. Our audit also included performing such other procedures as we considered necessary in the circumstances. We believe that our audit provides a reasonable basis for our opinion.
Definition and Limitations of Internal Control Over Financial Reporting
A company’s internal control over financial reporting is a process designed to provide reasonable assurance regarding the reliability of financial reporting and the preparation of financial statements for external purposes in accordance with generally accepted accounting principles. A company’s internal control over financial reporting includes those policies and procedures that (1) pertain to the maintenance of records that, in reasonable detail, accurately and fairly reflect the transactions and dispositions of the assets of the company; (2) provide reasonable assurance that transactions are recorded as necessary to permit preparation of financial statements in accordance with generally accepted accounting principles, and that receipts and expenditures of the company are being made only in accordance with authorizations of management and directors of the company; and (3) provide reasonable assurance regarding prevention or timely detection of unauthorized acquisition, use or disposition of the company’s assets that could have a material effect on the financial statements.
85
Table of Contents
Because of its inherent limitations, internal control over financial reporting may not prevent or detect misstatements. Also, projections of any evaluation of effectiveness to future periods are subject to the risk that controls may become inadequate because of changes in conditions, or that the degree of compliance with the policies or procedures may deteriorate.
/s/ RSM US LLP
Blue Bell, Pennsylvania
March 1, 2018
86
Table of Contents
REPORT OF INDEPENDENT REGISTERED PUBLIC ACCOUNTING FIRM
To the Board of Directors and Stockholders
FS Investment Corporation
Philadelphia, Pennsylvania
Opinion on the Financial Statements
We have audited the accompanying consolidated balance sheets, including the consolidated schedules of investments, of FS Investment Corporation (the Company) as of December 31, 2017 and 2016, and the related consolidated statements of operations, changes in net assets and cash flows for each of the three years in the period ended December 31, 2017, and the related notes to the consolidated financial statements (collectively, the financial statements). In our opinion, the financial statements present fairly, in all material respects, the financial position of FS Investment Corporation as of December 31, 2017 and 2016, and the results of its operations and its cash flows for each of the three years in the period ended December 31, 2017 in conformity with accounting principles generally accepted in the United States of America.
We have also audited, in accordance with the standards of the Public Company Accounting Oversight Board (United States) (PCAOB), FS Investment Corporation’s internal control over financial reporting as of December 31, 2017, based on criteria established in Internal Control-Integrated Framework issued by the Committee of Sponsoring Organizations of the Treadway Commission in 2013, and our report dated March 1, 2018 expressed an unqualified opinion on the effectiveness of the Company’s internal control over financial reporting.
Basis for Opinion
These financial statements are the responsibility of the Company’s management. Our responsibility is to express an opinion on the Company’s financial statements based on our audits. We are a public accounting firm registered with the PCAOB and are required to be independent with respect to the Company in accordance with U.S. federal securities laws and applicable rules and regulations of the Securities and Exchange Commission and the PCAOB.
We conducted our audits in accordance with the standards of the PCAOB. Those standards require that we plan and perform the audits to obtain reasonable assurance about whether the financial statements are free of material misstatement, whether due to error or fraud. Our audits included performing procedures to assess the risks of material misstatement of the financial statements, whether due to error or fraud, and performing procedures that respond to those risks. Such procedures included examining, on a test basis, evidence regarding the amounts and disclosures in the financial statements. Our audits also included evaluating the accounting principles used and significant estimates made by management, as well as evaluating the overall presentation of the financial statements. Our procedures included confirmation of securities owned as of December 31, 2017 and 2016 by correspondence with the custodians and brokers or by other appropriate auditing procedures where replies from brokers were not received. We believe that our audits provide a reasonable basis for our opinion.
/s/ RSM US LLP
We have served as the auditor of one or more FS Investments investment companies since 2007.
Blue Bell, Pennsylvania
March 1, 2018
87
Table of Contents
FS Investment Corporation
Consolidated Balance Sheets
(in thousands, except share and per share amounts)
| December 31, | ||||||||
| 2017 | 2016 | |||||||
| Assets |
||||||||
| Investments, at fair value |
||||||||
| Non-controlled/unaffiliated investments (amortized cost—$3,532,517 and $3,509,899, respectively) |
$ | 3,600,911 | $ | 3,440,951 | ||||
| Non-controlled/affiliated investments (amortized cost—$197,468 and $153,167, respectively) |
230,055 | 202,795 | ||||||
| Controlled/affiliated investments (amortized cost—$86,861 and $80,874, respectively) |
95,268 | 83,070 | ||||||
|
|
|
|
|
|||||
| Total investments, at fair value (amortized cost—$3,816,846 and $3,743,940, respectively) |
3,926,234 | 3,726,816 | ||||||
| Cash |
134,932 | 264,594 | ||||||
| Foreign currency, at fair value (cost—$3,685 and $4, respectively) |
3,810 | 4 | ||||||
| Receivable for investments sold and repaid |
3,477 | 75,921 | ||||||
| Income receivable |
30,668 | 36,106 | ||||||
| Deferred financing costs |
3,459 | 5,828 | ||||||
| Prepaid expenses and other assets |
1,695 | 802 | ||||||
|
|
|
|
|
|||||
| Total assets |
$ | 4,104,275 | $ | 4,110,071 | ||||
|
|
|
|
|
|||||
| Liabilities |
||||||||
| Payable for investments purchased |
$ | 1,978 | $ | 5,748 | ||||
| Credit facilities payable (net of deferred financing costs of $3,179 and $0, respectively)(1) |
638,571 | 619,932 | ||||||
| Unsecured notes payable (net of deferred financing costs of $1,402 and $1,884, respectively)(1) |
1,073,445 | 1,070,701 | ||||||
| Secured borrowing, at fair value (proceeds of $0 and $2,831, respectively)(1) |
— | 2,880 | ||||||
| Stockholder distributions payable |
46,704 | 54,364 | ||||||
| Management fees payable |
15,450 | 18,022 | ||||||
| Subordinated income incentive fees payable(2) |
12,871 | 12,885 | ||||||
| Administrative services expense payable |
294 | 516 | ||||||
| Interest payable |
22,851 | 20,144 | ||||||
| Directors’ fees payable |
276 | 281 | ||||||
| Other accrued expenses and liabilities |
7,112 | 7,221 | ||||||
|
|
|
|
|
|||||
| Total liabilities |
1,819,552 | 1,812,694 | ||||||
|
|
|
|
|
|||||
| Commitments and contingencies(3) |
— | — | ||||||
| Stockholders’ equity |
||||||||
| Preferred stock, $0.001 par value, 50,000,000 shares authorized, none issued and outstanding |
— | — | ||||||
| Common stock, $0.001 par value, 450,000,000 shares authorized, 245,725,416 and 244,063,357 shares issued and outstanding, respectively |
246 | 244 | ||||||
| Capital in excess of par value |
2,272,591 | 2,261,040 | ||||||
| Accumulated undistributed net realized gain/loss on investments and gain/loss on foreign currency(4) |
(245,288 | ) | (104,274 | ) | ||||
| Accumulated undistributed (distributions in excess of) net investment income(4) |
144,062 | 148,026 | ||||||
| Net unrealized appreciation (depreciation) on investments and secured borrowing and unrealized gain/loss on foreign currency |
113,112 | (7,659 | ) | |||||
|
|
|
|
|
|||||
| Total stockholders’ equity |
2,284,723 | 2,297,377 | ||||||
|
|
|
|
|
|||||
| Total liabilities and stockholders’ equity |
$ | 4,104,275 | $ | 4,110,071 | ||||
|
|
|
|
|
|||||
| Net asset value per share of common stock at year end |
$ | 9.30 | $ | 9.41 | ||||
88
Table of Contents
FS Investment Corporation
Consolidated Balance Sheets (continued)
(in thousands, except share and per share amounts)
| (1) | See Note 8 for a discussion of the Company’s financing arrangements. |
| (2) | See Note 2 for a discussion of the methodology employed by the Company in calculating the subordinated income incentive fees. |
| (3) | See Note 9 for a discussion of the Company’s commitments and contingencies. |
| (4) | See Note 5 for a discussion of the sources of distributions paid by the Company. |
See notes to consolidated financial statements.
89
Table of Contents
Consolidated Statements of Operations
(in thousands, except share and per share amounts)
| Year Ended December 31, | ||||||||||||
| 2017 | 2016 | 2015 | ||||||||||
| Investment income |
||||||||||||
| From non-controlled/unaffiliated investments: |
||||||||||||
| Interest income |
$ | 319,155 | $ | 344,639 | $ | 397,613 | ||||||
| Paid-in-kind interest income |
32,440 | 28,519 | 23,221 | |||||||||
| Fee income |
41,136 | 35,541 | 43,392 | |||||||||
| Dividend income |
21 | 2,727 | 6,499 | |||||||||
| From non-controlled/affiliated investments: |
||||||||||||
| Interest income |
10,768 | 6,087 | 2,295 | |||||||||
| Paid-in-kind interest income |
2,469 | 737 | 308 | |||||||||
| Fee income |
2,880 | 752 | 790 | |||||||||
| Dividend income |
— | 224 | 299 | |||||||||
| From controlled/affiliated investments: |
||||||||||||
| Interest income |
4,373 | 2 | 380 | |||||||||
| Paid-in-kind interest income |
6,069 | 3,581 | — | |||||||||
|
|
|
|
|
|
|
|||||||
| Total investment income |
419,311 | 422,809 | 474,797 | |||||||||
|
|
|
|
|
|
|
|||||||
| Operating expenses |
||||||||||||
| Management fees(1) |
72,797 | 71,280 | 75,401 | |||||||||
| Capital gains incentive fees(2) |
— | — | (21,075 | ) | ||||||||
| Subordinated income incentive fees(2) |
50,297 | 51,830 | 61,036 | |||||||||
| Administrative services expenses |
3,051 | 3,475 | 4,182 | |||||||||
| Accounting and administrative fees |
1,014 | 966 | 1,082 | |||||||||
| Interest expense(3) |
79,145 | 74,058 | 75,127 | |||||||||
| Directors’ fees |
1,149 | 1,139 | 1,026 | |||||||||
| Other general and administrative expenses |
5,415 | 7,184 | 6,872 | |||||||||
|
|
|
|
|
|
|
|||||||
| Total operating expenses |
212,868 | 209,932 | 203,651 | |||||||||
| Management fee waiver(1) |
(2,575 | ) | — | — | ||||||||
|
|
|
|
|
|
|
|||||||
| Net expenses |
210,293 | 209,932 | 203,651 | |||||||||
|
|
|
|
|
|
|
|||||||
| Net investment income before taxes |
209,018 | 212,877 | 271,146 | |||||||||
| Excise taxes |
5,259 | 5,554 | 6,056 | |||||||||
|
|
|
|
|
|
|
|||||||
| Net investment income |
203,759 | 207,323 | 265,090 | |||||||||
|
|
|
|
|
|
|
|||||||
| Realized and unrealized gain/loss |
||||||||||||
| Net realized gain (loss) on investments: |
||||||||||||
| Non-controlled/unaffiliated investments |
(98,580 | ) | (63,535 | ) | (62,426 | ) | ||||||
| Non-controlled/affiliated investments |
8,690 | — | — | |||||||||
| Controlled/affiliated investments |
(52,879 | ) | (26 | ) | — | |||||||
| Net realized gain (loss) on secured borrowing |
(21 | ) | — | — | ||||||||
| Net realized gain (loss) on foreign currency |
247 | 330 | (640 | ) | ||||||||
| Net change in unrealized appreciation (depreciation) on investments: |
||||||||||||
| Non-controlled/unaffiliated investments |
137,342 | 138,719 | (212,155 | ) | ||||||||
| Non-controlled/affiliated investments |
(17,041 | ) | 8,519 | 44,247 | ||||||||
| Controlled/affiliated investments |
6,211 | 1,453 | 743 | |||||||||
90
Table of Contents
FS Investment Corporation
Consolidated Statements of Operations (continued)
(in thousands, except share and per share amounts)
| Year Ended December 31, | ||||||||||||
| 2017 | 2016 | 2015 | ||||||||||
| Net change in unrealized appreciation (depreciation) on secured borrowing |
$ | 49 | $ | (49 | ) | $ | — | |||||
| Net change in unrealized gain (loss) on foreign currency |
(5,790 | ) | 1,557 | 3,526 | ||||||||
|
|
|
|
|
|
|
|||||||
| Total net realized and unrealized gain (loss) |
(21,772 | ) | 86,968 | (226,705 | ) | |||||||
|
|
|
|
|
|
|
|||||||
| Net increase (decrease) in net assets resulting from operations |
$ | 181,987 | $ | 294,291 | $ | 38,385 | ||||||
|
|
|
|
|
|
|
|||||||
| Per share information—basic and diluted |
||||||||||||
| Net increase (decrease) in net assets resulting from operations (Earnings per Share) |
$ | 0.74 | $ | 1.21 | $ | 0.16 | ||||||
|
|
|
|
|
|
|
|||||||
| Weighted average shares outstanding |
245,270,969 | 243,448,610 | 241,946,850 | |||||||||
|
|
|
|
|
|
|
|||||||
| (1) | See Note 4 for a discussion of the waiver by FB Income Advisor, LLC, the Company’s investment adviser, of certain management fees to which it was otherwise entitled during the applicable period. |
| (2) | See Note 2 for a discussion of the methodology employed by the Company in calculating the capital gains incentive fees and subordinated income incentive fees. |
| (3) | See Note 8 for a discussion of the Company’s financing arrangements. |
See notes to consolidated financial statements.
91
Table of Contents
Consolidated Statements of Changes in Net Assets
(in thousands)
| Year Ended December 31, | ||||||||||||
| 2017 | 2016 | 2015 | ||||||||||
| Operations |
||||||||||||
| Net investment income (loss) |
$ | 203,759 | $ | 207,323 | $ | 265,090 | ||||||
| Net realized gain (loss) on investments, secured borrowing and foreign currency |
(142,543 | ) | (63,231 | ) | (63,066 | ) | ||||||
| Net change in unrealized appreciation (depreciation) on investments and secured borrowing(1) |
126,561 | 148,642 | (167,165 | ) | ||||||||
| Net change in unrealized gain (loss) on foreign currency |
(5,790 | ) | 1,557 | 3,526 | ||||||||
|
|
|
|
|
|
|
|||||||
| Net increase (decrease) in net assets resulting from operations |
181,987 | 294,291 | 38,385 | |||||||||
|
|
|
|
|
|
|
|||||||
| Stockholder distributions(2) |
||||||||||||
| Distributions from net investment income |
(210,549 | ) | (216,933 | ) | (181,509 | ) | ||||||
| Distributions from net realized gain on investments |
— | — | (34,097 | ) | ||||||||
|
|
|
|
|
|
|
|||||||
| Net decrease in net assets resulting from stockholder distributions |
(210,549 | ) | (216,933 | ) | (215,606 | ) | ||||||
|
|
|
|
|
|
|
|||||||
| Capital share transactions(3) |
||||||||||||
| Reinvestment of stockholder distributions |
15,908 | 11,091 | 19,163 | |||||||||
| Repurchases of common stock |
— | — | — | |||||||||
|
|
|
|
|
|
|
|||||||
| Net increase (decrease) in net assets resulting from capital share transactions |
15,908 | 11,091 | 19,163 | |||||||||
|
|
|
|
|
|
|
|||||||
| Total increase (decrease) in net assets |
(12,654 | ) | 88,449 | (158,058 | ) | |||||||
| Net assets at beginning of year |
2,297,377 | 2,208,928 | 2,366,986 | |||||||||
|
|
|
|
|
|
|
|||||||
| Net assets at end of year |
$ | 2,284,723 | $ | 2,297,377 | $ | 2,208,928 | ||||||
|
|
|
|
|
|
|
|||||||
| Accumulated undistributed (distributions in excess of) net investment income(2) |
$ | 144,062 | $ | 148,026 | $ | 147,946 | ||||||
|
|
|
|
|
|
|
|||||||
| (1) | See Note 8 for a discussion of the Company’s financing arrangements. |
| (2) | See Note 5 for a discussion of the sources of distributions paid by the Company. |
| (3) | See Note 3 for a discussion of the Company’s capital share transactions. |
See notes to consolidated financial statements.
92
Table of Contents
Consolidated Statements of Cash Flows
(in thousands)
| Year Ended December 31, | ||||||||||||
| 2017 | 2016 | 2015 | ||||||||||
| Cash flows from operating activities |
||||||||||||
| Net increase (decrease) in net assets resulting from operations |
$ | 181,987 | $ | 294,291 | $ | 38,385 | ||||||
| Adjustments to reconcile net increase (decrease) in net assets resulting from operations to net cash provided by (used in) operating activities: |
||||||||||||
| Purchases of investments |
(1,284,317 | ) | (1,157,827 | ) | (1,647,620 | ) | ||||||
| Paid-in-kind interest |
(40,978 | ) | (32,837 | ) | (23,529 | ) | ||||||
| Proceeds from sales and repayments of investments |
1,134,998 | 1,588,498 | 1,625,520 | |||||||||
| Net realized (gain) loss on investments and secured borrowing |
142,790 | 63,561 | 62,426 | |||||||||
| Net change in unrealized (appreciation) depreciation on investments and secured borrowing |
(126,561 | ) | (148,642 | ) | 167,165 | |||||||
| Accretion of discount |
(25,378 | ) | (10,149 | ) | (29,886 | ) | ||||||
| Amortization of deferred financing costs and discount |
5,178 | 4,086 | 3,764 | |||||||||
| Unrealized (gain)/loss on borrowings in foreign currency |
5,658 | (143 | ) | (3,690 | ) | |||||||
| (Increase) decrease in receivable for investments sold and repaid |
72,444 | (75,855 | ) | 8,910 | ||||||||
| (Increase) decrease in income receivable |
5,438 | (1,506 | ) | 17,214 | ||||||||
| (Increase) decrease in prepaid expenses and other assets |
(893 | ) | (73 | ) | (21 | ) | ||||||
| Increase (decrease) in payable for investments purchased |
(3,770 | ) | 5,748 | (28,095 | ) | |||||||
| Increase (decrease) in management fees payable |
(2,572 | ) | (393 | ) | (1,145 | ) | ||||||
| Increase (decrease) in accrued capital gains incentive fees |
— | — | (21,075 | ) | ||||||||
| Increase (decrease) in subordinated income incentive fees payable |
(14 | ) | (489 | ) | 285 | |||||||
| Increase (decrease) in administrative services expense payable |
(222 | ) | (430 | ) | (464 | ) | ||||||
| Increase (decrease) in interest payable |
2,707 | (1,917 | ) | 6,211 | ||||||||
| Increase (decrease) in directors’ fees payable |
(5 | ) | (1 | ) | (14 | ) | ||||||
| Increase (decrease) in other accrued expenses and liabilities |
(109 | ) | 46 | 835 | ||||||||
|
|
|
|
|
|
|
|||||||
| Net cash provided by (used in) operating activities |
66,381 | 525,968 | 175,176 | |||||||||
|
|
|
|
|
|
|
|||||||
| Cash flows from financing activities |
||||||||||||
| Reinvestment of stockholder distributions |
15,908 | 11,091 | 19,163 | |||||||||
| Stockholder distributions |
(218,209 | ) | (216,662 | ) | (179,398 | ) | ||||||
| Borrowings under credit facilities(1) |
291,265 | 1,176,000 | 217,899 | |||||||||
| Borrowings under unsecured notes(1) |
— | 80,425 | 275,000 | |||||||||
| Secured borrowing(3) |
(2,857 | ) | 2,829 | — | ||||||||
| Repayments of credit facilities(1) |
(275,105 | ) | (590,550 | ) | (368,411 | ) | ||||||
| Repayments under repurchase agreement(2) |
— | (800,000 | ) | (150,000 | ) | |||||||
| Deferred financing costs paid |
(3,239 | ) | (6,490 | ) | (4,286 | ) | ||||||
|
|
|
|
|
|
|
|||||||
| Net cash provided by (used in) financing activities |
(192,237 | ) | (343,357 | ) | (190,033 | ) | ||||||
|
|
|
|
|
|
|
|||||||
| Total increase (decrease) in cash |
(125,856 | ) | 182,611 | (14,857 | ) | |||||||
| Cash and foreign currency at beginning of year |
264,598 | 81,987 | 96,844 | |||||||||
|
|
|
|
|
|
|
|||||||
| Cash and foreign currency at end of year |
$ | 138,742 | $ | 264,598 | $ | 81,987 | ||||||
|
|
|
|
|
|
|
|||||||
| Supplemental disclosure |
||||||||||||
| Local and excise taxes paid |
$ | 5,888 | $ | 6,000 | $ | 5,853 | ||||||
|
|
|
|
|
|
|
|||||||
| (1) | See Note 8 for a discussion of the Company’s credit facilities and unsecured notes. During the years ended December 31, 2017, 2016 and 2015, the Company paid $71,096, $48,464 and $36,014, respectively, in interest expense on the credit facilities and unsecured notes. |
| (2) | See Note 8 for a discussion of the Company’s repurchase transaction, which the Company terminated on November 1, 2016. During the years ended December 31, 2016 and 2015, the Company paid $24,736 and $29,138, respectively, in interest expense pursuant to the repurchase agreement. |
See notes to consolidated financial statements.
93
Table of Contents
FS Investment Corporation
Consolidated Statements of Cash Flows (continued)
(in thousands)
| (3) | See Note 8 for a discussion of the Company’s secured borrowing. During the year ended December 31, 2017 and 2016, the Company paid $164 and $40, respectively, in interest expense on the secured borrowing. |
See notes to consolidated financial statements.
94
Table of Contents
Consolidated Schedule of Investments
As of December 31, 2017
(in thousands, except share amounts)
| Portfolio Company(a) |
Footnotes | Industry |
Rate(b) | Floor | Maturity | Principal Amount(c) |
Amortized Cost |
Fair Value(d) |
||||||||||||||||||||||
| Senior Secured Loans—First Lien—110.3% |
||||||||||||||||||||||||||||||
| 5 Arch Income Fund 2, LLC |
(g)(j)(o) | Diversified Financials | 10.5% | 11/18/21 | $ | 29,824 | $ | 29,871 | $ | 29,824 | ||||||||||||||||||||
| 5 Arch Income Fund 2, LLC |
(g)(j)(o)(q) | Diversified Financials | 10.5% | 11/18/21 | 8,176 | 8,176 | 8,176 | |||||||||||||||||||||||
| A.P. Plasman Inc. |
(e)(f)(g)(h)(j) | Capital Goods | L+900 | 1.0% | 12/29/19 | 196,468 | 195,233 | 191,802 | ||||||||||||||||||||||
| Actian Corp. |
(e) | Software & Services | L+806 | 1.0% | 6/30/22 | 11,429 | 11,429 | 11,571 | ||||||||||||||||||||||
| Advanced Lighting Technologies, Inc. |
(g)(t) | Materials | L+750 | 1.0% | 10/4/22 | 20,383 | 17,224 | 20,383 | ||||||||||||||||||||||
| AG Group Merger Sub, Inc. |
(e)(g) | Commercial & Professional Services | L+750 | 1.0% | 12/29/23 | 89,169 | 89,169 | 90,729 | ||||||||||||||||||||||
| All Systems Holding LLC |
(e)(f)(g)(h) | Commercial & Professional Services | L+767 | 1.0% | 10/31/23 | 48,995 | 48,995 | 49,730 | ||||||||||||||||||||||
| Altus Power America, Inc. |
(g) | Energy | L+750 | 1.5% | 9/30/21 | 2,866 | 2,866 | 2,809 | ||||||||||||||||||||||
| Altus Power America, Inc. |
(g)(q) | Energy | L+750 | 1.5% | 9/30/21 | 884 | 884 | 866 | ||||||||||||||||||||||
| Aspect Software, Inc. |
(g)(t) | Software & Services | L+1050 | 1.0% | 5/25/18 | 992 | 992 | 992 | ||||||||||||||||||||||
| Aspect Software, Inc. |
(g)(q)(t) | Software & Services | L+1050 | 1.0% | 5/25/18 | 25 | 25 | 25 | ||||||||||||||||||||||
| Aspect Software, Inc. |
(g)(t) | Software & Services | L+1050 | 1.0% | 5/25/20 | 679 | 679 | 628 | ||||||||||||||||||||||
| Aspect Software, Inc. |
(g)(q)(t) | Software & Services | L+1200 | 1.0% | 5/25/18 | 361 | 361 | — | ||||||||||||||||||||||
| Atlas Aerospace LLC |
(g) | Capital Goods | L+802 | 1.0% | 12/29/22 | 30,476 | 30,476 | 30,476 | ||||||||||||||||||||||
| AVF Parent, LLC |
(e)(h) | Retailing | L+725 | 1.3% | 3/1/24 | 56,843 | 56,843 | 58,019 | ||||||||||||||||||||||
| Borden Dairy Co. |
(e)(g)(h) | Food, Beverage & Tobacco | L+804 | 1.0% | 7/6/23 | 70,000 | 70,000 | 69,979 | ||||||||||||||||||||||
| ConnectiveRX, LLC |
(e)(g)(h) | Health Care Equipment & Services | L+828 | 1.0% | 11/25/21 | 45,019 | 45,019 | 45,037 | ||||||||||||||||||||||
| Crestwood Holdings LLC |
(g) | Energy | L+800 | 1.0% | 6/19/19 | 4,185 | 4,181 | 4,205 | ||||||||||||||||||||||
| CSafe Acquisition Co., Inc. |
(g) | Capital Goods | L+725 | 1.0% | 11/1/21 | 3,326 | 3,326 | 3,297 | ||||||||||||||||||||||
| CSafe Acquisition Co., Inc. |
(g)(q) | Capital Goods | L+725 | 1.0% | 11/1/21 | 2,543 | 2,543 | 2,521 | ||||||||||||||||||||||
| CSafe Acquisition Co., Inc. |
(g)(h) | Capital Goods | L+725 | 1.0% | 10/31/23 | 46,814 | 46,814 | 46,404 | ||||||||||||||||||||||
| CSafe Acquisition Co., Inc. |
(g)(q) | Capital Goods | L+725 | 1.0% | 10/31/23 | 25,122 | 25,122 | 24,902 | ||||||||||||||||||||||
| Dade Paper & Bag, LLC |
(e)(g)(h) | Capital Goods | L+750 | 1.0% | 6/10/24 | 83,605 | 83,605 | 86,531 | ||||||||||||||||||||||
| Eastman Kodak Co. |
(g) | Consumer Durables & Apparel | L+625 | 1.0% | 9/3/19 | 10,255 | 10,185 | 8,896 | ||||||||||||||||||||||
| Empire Today, LLC |
(e)(g) | Retailing | L+800 | 1.0% | 11/17/22 | 81,180 | 81,180 | 81,992 | ||||||||||||||||||||||
| Greystone Equity Member Corp. |
(g)(j) | Diversified Financials | L+1050 | 3/31/21 | 1,358 | 1,361 | 1,360 | |||||||||||||||||||||||
| Greystone Equity Member Corp. |
(g)(j) | Diversified Financials | L+1100 | 3/31/21 | 50,000 | 50,000 | 50,750 | |||||||||||||||||||||||
| Greystone Equity Member Corp. |
(g)(j) | Diversified Financials | L+1100 | 3/31/21 | 2,105 | 2,105 | 2,126 | |||||||||||||||||||||||
| Greystone Equity Member Corp. |
(g)(j)(q) | Diversified Financials | L+1100 | 3/31/21 | 537 | 537 | 542 | |||||||||||||||||||||||
| H.M. Dunn Co., Inc. |
(g) | Capital Goods | L+946 | 1.0% | 3/26/21 | 1,071 | 1,071 | 1,023 | ||||||||||||||||||||||
| Hudson Technologies Co. |
(g)(h)(j) | Commercial & Professional Services | L+725 | 1.0% | 10/10/23 | 39,946 | 39,946 | 40,495 | ||||||||||||||||||||||
| Hudson Technologies Co. |
(g)(j)(q) | Commercial & Professional Services | L+725 | 1.0% | 10/10/23 | 9,511 | 9,511 | 9,642 | ||||||||||||||||||||||
| Icynene U.S. Acquisition Corp. |
(e)(g) | Materials | L+700 | 1.0% | 11/30/24 | 30,000 | 30,000 | 30,006 | ||||||||||||||||||||||
| Imagine Communications Corp. |
(e)(g)(h) | Media | L+825 | 1.0% | 4/29/20 | 75,725 | 75,725 | 76,672 | ||||||||||||||||||||||
See notes to consolidated financial statements.
95
Table of Contents
FS Investment Corporation
Consolidated Schedule of Investments (continued)
As of December 31, 2017
(in thousands, except share amounts)
| Portfolio Company(a) |
Footnotes | Industry |
Rate(b) | Floor | Maturity | Principal Amount(c) |
Amortized Cost |
Fair Value(d) |
||||||||||||||
| Industrial Group Intermediate Holdings, LLC |
(g) | Materials | L+800 | 1.3% | 5/31/20 | $ | 21,492 | $ | 21,492 | $ | 21,815 | |||||||||||
| Industry City TI Lessor, L.P. |
(g) | Consumer Services | 10.8%, 1.0% PIK (1.0% Max PIK) | 6/30/26 | 30,810 | 30,810 | 31,195 | |||||||||||||||
| International Aerospace Coatings, Inc. |
(e)(f)(h) | Capital Goods | L+750 | 1.0% | 6/30/20 | 44,867 | 44,783 | 45,540 | ||||||||||||||
| JMC Acquisition Merger Corp. |
(g) | Capital Goods | L+854 | 1.0% | 11/6/21 | 6,832 | 6,832 | 6,943 | ||||||||||||||
| JSS Holdings, Inc. |
(e)(g) | Capital Goods | L+800, 0.0% PIK (2.5% Max PIK) | 1.0% | 3/31/23 | 110,566 | 109,565 | 112,280 | ||||||||||||||
| JSS Holdings, Inc. |
(g)(q) | Capital Goods | L+800, 0.0% PIK (2.5% Max PIK) | 1.0% | 3/31/23 | 20,182 | 20,182 | 20,495 | ||||||||||||||
| Kodiak BP, LLC |
(h) | Capital Goods | L+725 | 1.0% | 12/1/24 | 10,515 | 10,515 | 10,541 | ||||||||||||||
| Kodiak BP, LLC |
(h)(q) | Capital Goods | L+725 | 1.0% | 12/1/24 | 3,030 | 3,030 | 3,038 | ||||||||||||||
| Latham Pool Products, Inc. |
(e)(h) | Commercial & Professional Services | L+775 | 1.0% | 6/29/21 | 56,183 | 56,183 | 56,815 | ||||||||||||||
| LEAS Acquisition Co Ltd. |
(g)(j) | Capital Goods | L+750 | 1.0% | 6/30/20 | € | 26,372 | 35,872 | 32,181 | |||||||||||||
| LEAS Acquisition Co Ltd. |
(f)(j) | Capital Goods | L+750 | 1.0% | 6/30/20 | $ | 9,251 | 9,251 | 9,390 | |||||||||||||
| Logan’s Roadhouse, Inc. |
(g)(t) | Consumer Services | L+1100 | 1.0% | 5/5/19 | 6,963 | 6,963 | 6,963 | ||||||||||||||
| Logan’s Roadhouse, Inc. |
(g)(q)(t) | Consumer Services | L+1100 | 1.0% | 5/5/19 | 1,120 | 1,131 | 1,120 | ||||||||||||||
| MB Precision Holdings LLC |
(g) | Capital Goods | L+725, 2.3% PIK (2.3% Max PIK) | 1.3% | 1/23/21 | 13,793 | 13,793 | 12,638 | ||||||||||||||
| Micronics Filtration, LLC |
(e)(g)(h) | Capital Goods | L+850 | 1.3% | 12/11/19 | 62,813 | 62,704 | 62,420 | ||||||||||||||
| MORSCO, Inc. |
(g) | Capital Goods | L+700 | 1.0% | 10/31/23 | 2,686 | 2,595 | 2,738 | ||||||||||||||
| Nobel Learning Communities, Inc. |
(g) | Consumer Services | L+450 | 1.0% | 5/5/21 | 38 | 38 | 38 | ||||||||||||||
| Nobel Learning Communities, Inc. |
(g)(q) | Consumer Services | L+450 | 1.0% | 5/5/21 | 101 | 101 | 101 | ||||||||||||||
| Nobel Learning Communities, Inc. |
(g) | Consumer Services | L+436 | 4.5% | 5/5/23 | 1,056 | 1,056 | 1,051 | ||||||||||||||
| Nobel Learning Communities, Inc. |
(g)(q) | Consumer Services | L+375 | 4.5% | 5/5/23 | 621 | 621 | 618 | ||||||||||||||
| North Haven Cadence Buyer, Inc. |
(g)(q) | Consumer Services | L+500 | 1.0% | 9/2/21 | 938 | 938 | 938 | ||||||||||||||
| North Haven Cadence Buyer, Inc. |
(e)(g) | Consumer Services | L+810 | 1.0% | 9/2/22 | 27,686 | 27,686 | 28,206 | ||||||||||||||
| North Haven Cadence Buyer, Inc. |
(g)(q) | Consumer Services | L+750 | 1.0% | 9/2/22 | 3,542 | 3,542 | 3,608 | ||||||||||||||
| Nova Wildcat Amerock, LLC |
(g) | Consumer Durables & Apparel | L+800 | 1.3% | 9/10/19 | 17,312 | 17,312 | 17,399 | ||||||||||||||
| PHRC License, LLC |
(f)(g) | Consumer Services | L+850 | 1.5% | 4/28/22 | 50,625 | 50,625 | 51,891 | ||||||||||||||
| Polymer Additives, Inc. |
(g) | Materials | L+888 | 1.0% | 12/19/22 | 10,511 | 10,511 | 10,879 | ||||||||||||||
| Polymer Additives, Inc. |
(g) | Materials | L+834 | 1.0% | 12/19/22 | 11,019 | 11,019 | 11,239 | ||||||||||||||
| Polymer Additives, Inc. |
(g) | Materials | L+875 | 1.0% | 12/19/22 | € | 15,000 | 16,982 | 18,575 | |||||||||||||
| Power Distribution, Inc. |
(e)(g) | Capital Goods | L+725 | 1.3% | 1/25/23 | $ | 29,928 | 29,928 | 30,377 | |||||||||||||
| Roadrunner Intermediate Acquisition Co., LLC |
(e)(g)(h) | Health Care Equipment & Services | L+725 | 1.0% | 3/15/23 | 34,919 | 34,919 | 35,214 | ||||||||||||||
| Rogue Wave Software, Inc. |
(e)(g)(h) | Software & Services | L+858 | 1.0% | 9/25/21 | 40,688 | 40,688 | 40,688 | ||||||||||||||
| Safariland, LLC |
(e)(g)(h) | Capital Goods | L+768 | 1.1% | 11/18/23 | 126,107 | 126,107 | 127,841 | ||||||||||||||
| Safariland, LLC |
(g)(q) | Capital Goods | L+725 | 1.1% | 11/18/23 | 33,282 | 33,282 | 33,740 | ||||||||||||||
| Sequel Youth and Family Services, LLC |
(e)(g)(h) | Health Care Equipment & Services | L+778 | 1.0% | 9/1/22 | 94,118 | 94,118 | 94,984 | ||||||||||||||
| Sequel Youth and Family Services, LLC |
(g)(q) | Health Care Equipment & Services | L+700 | 1.0% | 9/1/22 | 4,706 | 4,706 | 4,749 | ||||||||||||||
See notes to consolidated financial statements.
96
Table of Contents
FS Investment Corporation
Consolidated Schedule of Investments (continued)
As of December 31, 2017
(in thousands, except share amounts)
| Portfolio Company(a) |
Footnotes | Industry |
Rate(b) | Floor | Maturity | Principal Amount(c) |
Amortized Cost |
Fair Value(d) |
||||||||||||||||
| Sequential Brands Group, Inc. |
(e)(g)(h) | Consumer Durables & Apparel | L+900 | 7/1/22 | $ | 79,039 | $ | 79,039 | $ | 78,249 | ||||||||||||||
| Sorenson Communications, Inc. |
(e)(g)(h) | Telecommunication Services | L+575 | 2.3% | 4/30/20 | 90,681 | 90,474 | 91,418 | ||||||||||||||||
| SSC (Lux) Limited S.à r.l. |
(e)(g)(j) | Health Care Equipment & Services | L+750 | 1.0% | 9/10/24 | 45,455 | 45,455 | 46,364 | ||||||||||||||||
| Staples Canada, ULC |
(g)(j) | Retailing | L+700 | 1.0% | 9/12/23 | C$ | 20,987 | 17,333 | 16,912 | |||||||||||||||
| SunGard Availability Services Capital, Inc. |
(g) | Software & Services | L+700 | 1.0% | 9/30/21 | $ | 4,382 | 4,342 | 4,064 | |||||||||||||||
| SunGard Availability Services Capital, Inc. |
(g)(i) | Software & Services | L+1000 | 1.0% | 10/1/22 | 2,000 | 1,900 | 1,924 | ||||||||||||||||
| Trace3, LLC |
(e)(h) | Software & Services | L+775 | 1.0% | 6/6/23 | 31,094 | 31,094 | 31,832 | ||||||||||||||||
| U.S. Xpress Enterprises, Inc. |
(e)(f)(h) | Transportation | L+1075, 0.0% PIK (1.8% Max PIK) | 1.5% | 5/30/20 | 52,685 | 52,685 | 52,816 | ||||||||||||||||
| USI Senior Holdings, Inc. |
(e)(g) | Capital Goods | L+779 | 1.0% | 1/5/22 | 56,582 | 56,582 | 56,902 | ||||||||||||||||
| USI Senior Holdings, Inc. |
(g)(q) | Capital Goods | L+725 | 1.0% | 1/5/22 | 11,513 | 11,513 | 11,578 | ||||||||||||||||
| VPG Metals Group LLC |
(e)(g)(h) | Materials | L+1050 | 1.0% | 12/30/20 | 114,216 | 114,164 | 115,073 | ||||||||||||||||
| Warren Resources, Inc. |
(f)(g) | Energy | L+900, 1.0% PIK (1.0% Max PIK) | 1.0% | 5/22/20 | 2,037 | 2,037 | 2,088 | ||||||||||||||||
| Waste Pro USA, Inc. |
(e)(g)(h) | Commercial & Professional Services | L+750 | 1.0% | 10/15/20 | 93,590 | 93,590 | 95,345 | ||||||||||||||||
| Zeta Interactive Holdings Corp. |
(e)(g)(h) | Software & Services | L+750 | 1.0% | 7/29/22 | 11,766 | 11,766 | 11,942 | ||||||||||||||||
| Zeta Interactive Holdings Corp. |
(g)(q) | Software & Services | L+750 | 1.0% | 7/29/22 | 2,234 | 2,234 | 2,268 | ||||||||||||||||
|
|
|
|
|
|||||||||||||||||||||
| Total Senior Secured Loans—First Lien | 2,629,542 | 2,649,433 | ||||||||||||||||||||||
| Unfunded Loan Commitments |
(128,439 | ) | (128,439 | ) | ||||||||||||||||||||
|
|
|
|
|
|||||||||||||||||||||
| Net Senior Secured Loans—First Lien | 2,501,103 | 2,520,994 | ||||||||||||||||||||||
|
|
|
|
|
|||||||||||||||||||||
| Senior Secured Loans—Second Lien—8.6% | ||||||||||||||||||||||||
| American Bath Group, LLC |
(g) | Capital Goods | L+975 | 1.0% | 9/30/24 | 18,000 | 17,581 | 18,045 | ||||||||||||||||
| Arena Energy, LP |
(g) | Energy | L+900, 4.0% PIK (4.0% Max PIK) | 1.0% | 1/24/21 | 8,281 | 8,281 | 7,874 | ||||||||||||||||
| Byrider Finance, LLC |
(f)(g) | Automobiles & Components | L+1000, 0.5% PIK (4.0% Max PIK) | 1.3% | 8/22/20 | 13,565 | 13,565 | 12,768 | ||||||||||||||||
| Chisholm Oil and Gas Operating, LLC |
(g) | Energy | L+800 | 1.0% | 3/21/24 | 16,000 | 16,000 | 15,998 | ||||||||||||||||
| Compuware Corp. |
(g) | Software & Services | L+825 | 1.0% | 12/15/22 | 1,206 | 1,162 | 1,212 | ||||||||||||||||
| Gruden Acquisition, Inc. |
(g) | Transportation | L+850 | 1.0% | 8/18/23 | 15,000 | 14,463 | 14,981 | ||||||||||||||||
| JW Aluminum Co. |
(e)(f)(g)(h)(u) | Materials | L+850 | 0.8% | 11/17/20 | 37,447 | 37,432 | 38,008 | ||||||||||||||||
| Logan’s Roadhouse, Inc. |
(g)(t) | Consumer Services | L+850 PIK (L+850 Max PIK) | 1.0% | 11/23/20 | 21,926 | 21,794 | 10,079 | ||||||||||||||||
| LTI Holdings, Inc. |
(e) | Materials | L+875 | 1.0% | 5/16/25 | 6,482 | 6,362 | 6,595 | ||||||||||||||||
| Spencer Gifts LLC |
(e)(h) | Retailing | L+825 | 1.0% | 6/29/22 | 30,000 | 29,903 | 16,200 | ||||||||||||||||
| Stadium Management Corp. |
(e)(g)(h) | Consumer Services | Prime+725 | 0.3% | 2/27/21 | 55,689 | 55,689 | 55,828 | ||||||||||||||||
|
|
|
|
|
|||||||||||||||||||||
| Total Senior Secured Loans—Second Lien | 222,232 | 197,588 | ||||||||||||||||||||||
|
|
|
|
|
|||||||||||||||||||||
See notes to consolidated financial statements.
97
Table of Contents
FS Investment Corporation
Consolidated Schedule of Investments (continued)
As of December 31, 2017
(in thousands, except share amounts)
| Portfolio Company(a) |
Footnotes | Industry |
Rate(b) | Floor | Maturity | Principal Amount(c) |
Amortized Cost |
Fair Value(d) |
||||||||||||||||
| Senior Secured Bonds—7.1% | ||||||||||||||||||||||||
| Advanced Lighting Technologies, Inc. |
(g)(t) | Materials | L+700, 10.0% PIK (10.0% Max PIK) | 1.0 | % | 10/4/23 | $ | 22,728 | $ | 22,728 | $ | 22,728 | ||||||||||||
| Black Swan Energy Ltd. |
(e)(j) | Energy | 9.0% | 1/20/24 | 6,000 | 6,000 | 6,045 | |||||||||||||||||
| FourPoint Energy, LLC |
(e)(f)(h) | Energy | 9.0% | 12/31/21 | 74,813 | 72,272 | 76,028 | |||||||||||||||||
| Global A&T Electronics Ltd. |
(g)(j)(l)(r) | Semiconductors & Semiconductor Equipment | 10.0% | 2/1/19 | 7,000 | 6,967 | 6,490 | |||||||||||||||||
| Mood Media Corp. |
(f)(g)(j)(t) | Media | L+600, 8.0% PIK (8.0% Max PIK) | 1.0 | % | 6/28/24 | 21,568 | 21,568 | 21,675 | |||||||||||||||
| Ridgeback Resources Inc. |
(f)(j) | Energy | 12.0% | 12/29/20 | 132 | 130 | 132 | |||||||||||||||||
| Sorenson Communications, Inc. |
(f) | Telecommunication Services | 9.0%, 0.0% PIK (9.0% Max PIK) | 10/31/20 | 19,898 | 19,476 | 19,898 | |||||||||||||||||
| Sunnova Energy Corp. |
(g) | Energy | 6.0%, 6.0% PIK (6.0% Max PIK) | 10/24/18 | 1,058 | 1,058 | 1,058 | |||||||||||||||||
| Velvet Energy Ltd. |
(g)(j) | Energy | 9.0% | 10/5/23 | 7,500 | 7,500 | 7,596 | |||||||||||||||||
|
|
|
|
|
|||||||||||||||||||||
| Total Senior Secured Bonds | 157,699 | 161,650 | ||||||||||||||||||||||
|
|
|
|
|
|||||||||||||||||||||
| Subordinated Debt—21.4% | ||||||||||||||||||||||||
| Ascent Resources Utica Holdings, LLC |
(g) | Energy | 10.0% | 4/1/22 | 40,000 | 40,000 | 43,226 | |||||||||||||||||
| Aurora Diagnostics, LLC |
(e)(f)(h) | Health Care Equipment & Services | 10.8%, 1.5% PIK (1.5% Max PIK) | 1/15/20 | 14,966 | 13,712 | 13,918 | |||||||||||||||||
| Bellatrix Exploration Ltd. |
(g)(j) | Energy | 8.5% | 5/15/20 | 5,000 | 4,947 | 4,775 | |||||||||||||||||
| Brooklyn Basketball Holdings, LLC |
(f)(g) | Consumer Services | L+725 | 10/25/19 | 19,873 | 19,873 | 20,171 | |||||||||||||||||
| CEC Entertainment, Inc. |
(f) | Consumer Services | 8.0% | 2/15/22 | 5,000 | 5,008 | 4,731 | |||||||||||||||||
| Ceridian HCM Holding, Inc. |
(f)(g) | Commercial & Professional Services | 11.0% | 3/15/21 | 17,393 | 17,829 | 18,196 | |||||||||||||||||
| DEI Sales, Inc. |
(e)(g) | Consumer Durables & Apparel | 9.0%, 4.0% PIK (4.0% Max PIK) | 2/28/23 | 67,532 | 66,763 | 66,519 | |||||||||||||||||
| EV Energy Partners, L.P. |
(f)(r) | Energy | 8.0% | 4/15/19 | 265 | 251 | 135 | |||||||||||||||||
| Global Jet Capital Inc. |
(g) | Commercial & Professional Services | 15.0% PIK (15.0% Max PIK) | 1/30/25 | 849 | 849 | 864 | |||||||||||||||||
| Global Jet Capital Inc. |
(g) | Commercial & Professional Services | 15.0% PIK (15.0% Max PIK) | 4/30/25 | 5,398 | 5,398 | 5,492 | |||||||||||||||||
| Global Jet Capital Inc. |
(g) | Commercial & Professional Services | 15.0% PIK (15.0% Max PIK) | 9/3/25 | 1,115 | 1,115 | 1,135 | |||||||||||||||||
| Global Jet Capital Inc. |
(g) | Commercial & Professional Services | 15.0% PIK (15.0% Max PIK) | 9/29/25 | 1,050 | 1,050 | 1,068 | |||||||||||||||||
| Global Jet Capital Inc. |
(f)(g)(j) | Commercial & Professional Services | 15.0% PIK (15.0% Max PIK) | 12/4/25 | 77,511 | 77,511 | 78,867 | |||||||||||||||||
| Global Jet Capital Inc. |
(f)(g)(j) | Commercial & Professional Services | 15.0% PIK (15.0% Max PIK) | 12/9/25 | 12,677 | 12,677 | 12,899 | |||||||||||||||||
| Global Jet Capital Inc. |
(f)(j) | Commercial & Professional Services | 15.0% PIK (15.0% Max PIK) | 1/29/26 | 6,638 | 6,638 | 6,755 | |||||||||||||||||
| Global Jet Capital Inc. |
(g) | Commercial & Professional Services | 15.0% PIK (15.0% Max PIK) | 4/14/26 | 13,570 | 13,570 | 13,807 | |||||||||||||||||
| Global Jet Capital Inc. |
(g) | Commercial & Professional Services | 15.0% PIK (15.0% Max PIK) | 12/2/26 | 13,320 | 13,320 | 13,553 | |||||||||||||||||
| Greystone Mezzanine Equity Member Corp. |
(g)(j) | Diversified Financials | L+650 | 4.5% | 9/15/25 | 1,365 | 1,365 | 1,365 | ||||||||||||||||
| Greystone Mezzanine Equity Member Corp. |
(g)(j)(q) | Diversified Financials | L+650 | 4.5% | 9/15/25 | 25,635 | 25,635 | 25,635 | ||||||||||||||||
| Imagine Communications Corp. |
(g) | Media | 12.5% PIK (12.5% Max PIK) | 8/4/18 | 661 | 661 | 661 | |||||||||||||||||
| Jupiter Resources Inc. |
(f)(g)(j) | Energy | 8.5% | 10/1/22 | 6,425 | 5,623 | 3,967 | |||||||||||||||||
See notes to consolidated financial statements.
98
Table of Contents
FS Investment Corporation
Consolidated Schedule of Investments (continued)
As of December 31, 2017
(in thousands, except share amounts)
| Portfolio Company(a) |
Footnotes | Industry |
Rate(b) | Floor | Maturity | Principal Amount(c) |
Amortized Cost |
Fair Value(d) |
||||||||||||||
| P.F. Chang’s China Bistro, Inc. |
(f)(g) | Consumer Services | 10.3% | 6/30/20 | $ | 11,433 | $ | 11,664 | $ | 10,478 | ||||||||||||
| PriSo Acquisition Corp. |
(g) | Capital Goods | 9.0% | 5/15/23 | 10,155 | 10,057 | 10,771 | |||||||||||||||
| S1 Blocker Buyer Inc. |
(g) | Commercial & Professional Services | 10.0% PIK (10.0% Max PIK) | 10/31/22 | 139 | 139 | 156 | |||||||||||||||
| Sorenson Communications, Inc. |
(f) | Telecommunication Services | 13.9%, 0.0% PIK (13.9% Max PIK) | 10/31/21 | 15,122 | 14,438 | 15,690 | |||||||||||||||
| SunGard Availability Services Capital, Inc. |
(f)(g) | Software & Services | 8.8% | 4/1/22 | 10,750 | 8,689 | 6,705 | |||||||||||||||
| ThermaSys Corp. |
(e)(f)(g) | Capital Goods | 6.5%, 5.0% PIK (5.0% Max PIK) | 5/3/20 | 145,241 | 145,241 | 131,625 | |||||||||||||||
| VPG Metals Group LLC |
(e)(g) | Materials | 11.0%, 2.0% PIK (2.0% Max PIK) | 6/30/18 | 2,238 | 2,238 | 2,232 | |||||||||||||||
|
|
|
|
|
|||||||||||||||||||
| Total Subordinated Debt | 526,261 | 515,396 | ||||||||||||||||||||
| Unfunded Debt Commitments |
(25,635 | ) | (25,635 | ) | ||||||||||||||||||
|
|
|
|
|
|||||||||||||||||||
| Net Subordinated Debt | 500,626 | 489,761 | ||||||||||||||||||||
|
|
|
|
|
|||||||||||||||||||
| Collateralized Securities—2.4% | ||||||||||||||||||||||
| MP4 2013-2A Class Subord. B |
(f)(g)(j) | Diversified Financials | 14.9% | 7/25/29 | 21,000 | 11,305 | 11,993 | |||||||||||||||
| NewStar Clarendon 2014-1A Class D |
(g)(j) | Diversified Financials | L+435 | 1/25/27 | 1,560 | 1,484 | 1,562 | |||||||||||||||
| NewStar Clarendon 2014-1A Class Subord. B |
(g)(j) | Diversified Financials | 15.8% | 1/25/27 | 17,900 | 12,928 | 14,714 | |||||||||||||||
| Rampart CLO 2007 1A Class Subord. |
(g)(j) | Diversified Financials | 4.5% | 10/25/21 | 10,000 | 775 | 661 | |||||||||||||||
| Wind River CLO Ltd. 2012 1A Class Subord. B |
(g)(j) | Diversified Financials | 9.9% | 1/15/26 | 42,504 | 20,979 | 25,389 | |||||||||||||||
|
|
|
|
|
|||||||||||||||||||
| Total Collateralized Securities | 47,471 | 54,319 | ||||||||||||||||||||
|
|
|
|
|
|||||||||||||||||||
| Portfolio Company(a) |
Footnotes | Industry |
Rate(b) | Floor | Maturity | Number of Shares |
Amortized Cost |
Fair Value(d) |
||||||||||||||
| Equity/Other—22.0%(k) | ||||||||||||||||||||||
| 5 Arches, LLC, Common Equity |
(g)(j)(n) | Diversified Financials | 20,000 | $ | 500 | $ | 500 | |||||||||||||||
| Advanced Lighting Technologies, Inc., Common Equity |
(g)(l)(t) | Materials | 587,637 | 16,520 | 13,046 | |||||||||||||||||
| Advanced Lighting Technologies, Inc., Warrants, 10/4/2027 |
(g)(l)(t) | Materials | 9,262 | 86 | 56 | |||||||||||||||||
| Altus Power America Holdings, LLC, Common Equity |
(g)(l) | Energy | 462,008 | 462 | 69 | |||||||||||||||||
| Altus Power America Holdings, LLC, Preferred Equity |
(g)(p) | Energy | 9.0%, 5.0% PIK | 10/3/23 | 955,284 | 955 | 955 | |||||||||||||||
| AP Exhaust Holdings, LLC, Class A1 Common Units |
(g)(l)(n) | Automobiles & Components | 8 | — | — | |||||||||||||||||
| AP Exhaust Holdings, LLC, Class A1 Preferred Units |
(g)(l)(n) | Automobiles & Components | 803 | 895 | 811 | |||||||||||||||||
| APP Holdings, LP, Warrants, 5/25/2026 |
(g)(j)(l) | Capital Goods | 698,482 | 2,545 | 1,903 | |||||||||||||||||
| Ascent Resources Utica Holdings, LLC, Common Equity |
(g)(l)(m) | Energy | 96,800,082 | 29,100 | 24,200 | |||||||||||||||||
| ASG Everglades Holdings, Inc., Common Equity |
(g)(l)(t) | Software & Services | 1,689,767 | 36,422 | 83,052 | |||||||||||||||||
| ASG Everglades Holdings, Inc., Warrants, 6/27/2022 |
(g)(l)(t) | Software & Services | 229,541 | 6,542 | 6,289 | |||||||||||||||||
| Aspect Software Parent, Inc., Common Equity |
(g)(l)(t) | Software & Services | 428,935 | 20,197 | — | |||||||||||||||||
See notes to consolidated financial statements.
99
Table of Contents
FS Investment Corporation
Consolidated Schedule of Investments (continued)
As of December 31, 2017
(in thousands, except share amounts)
| Portfolio Company(a) |
Footnotes | Industry |
Rate(b) | Floor | Maturity | Number of Shares |
Amortized Cost |
Fair Value(d) |
||||||||||||||||||||
| Aurora Diagnostics Holdings, LLC, Warrants, 5/25/2027 |
(e)(f)(g)(l) | Health Care Equipment & Services | 229,489 | $ | 1,671 | $ | 1,640 | |||||||||||||||||||||
| Burleigh Point, Ltd., Warrants, 7/16/2020 |
(g)(j)(l) | Retailing | 3,451,216 | 1,898 | 49 | |||||||||||||||||||||||
| Chisholm Oil and Gas, LLC, Series A Units |
(g)(l)(n) | Energy | 70,947 | 71 | 70 | |||||||||||||||||||||||
| CSF Group Holdings, Inc., Common Equity |
(g)(l) | Capital Goods | 391,300 | 391 | 274 | |||||||||||||||||||||||
| Eastman Kodak Co., Common Equity |
(g)(l)(s) | Consumer Durables & Apparel | 61,859 | 1,203 | 192 | |||||||||||||||||||||||
| Escape Velocity Holdings, Inc., Common Equity |
(g)(l) | Software & Services | 19,312 | 193 | 456 | |||||||||||||||||||||||
| FourPoint Energy, LLC, Common Equity, Class C-II-A Units |
(g)(l)(n) | Energy | 21,000 | 21,000 | 6,090 | |||||||||||||||||||||||
| FourPoint Energy, LLC, Common Equity, Class D Units |
(g)(l)(n) | Energy | 3,937 | 2,601 | 1,152 | |||||||||||||||||||||||
| FourPoint Energy, LLC, Common Equity, Class E-II Units |
(g)(l)(n) | Energy | 48,025 | 12,006 | 13,807 | |||||||||||||||||||||||
| FourPoint Energy, LLC, Common Equity, Class E-III Units |
(g)(l)(n) | Energy | 70,875 | 17,719 | 20,554 | |||||||||||||||||||||||
| Fronton Investor Holdings, LLC, Class B Units |
(g)(n)(t) | Consumer Services | 14,943 | 7,017 | 17,782 | |||||||||||||||||||||||
| Global Jet Capital Holdings, LP, Preferred Equity |
(f)(g)(j)(l) | Commercial & Professional Services | 42,281,308 | 42,281 | 38,053 | |||||||||||||||||||||||
| H.I.G. Empire Holdco, Inc., Common Equity |
(g)(l) | Retailing | 375 | 1,118 | 1,117 | |||||||||||||||||||||||
| Harvey Holdings, LLC, Common Equity |
(g)(l) | Capital Goods | 2,333,333 | 2,333 | 5,950 | |||||||||||||||||||||||
| Imagine Communications Corp., Common Equity, Class A Units |
(g)(l) | Media | 33,034 | 3,783 | 2,573 | |||||||||||||||||||||||
| Industrial Group Intermediate Holdings, LLC, Common Equity |
(g)(l)(n) | Materials | 441,238 | 441 | 662 | |||||||||||||||||||||||
| International Aerospace Coatings, Inc., Common Equity |
(f)(l) | Capital Goods | 4,401 | 464 | 26 | |||||||||||||||||||||||
| International Aerospace Coatings, Inc., Preferred Equity |
(f)(l) | Capital Goods | 1,303 | 1,303 | 1,303 | |||||||||||||||||||||||
| JMC Acquisition Holdings, LLC, Common Equity |
(g)(l) | Capital Goods | 483 | 483 | 655 | |||||||||||||||||||||||
| JSS Holdco, LLC, Net Profits Interest |
(g)(l) | Capital Goods | — | — | 761 | |||||||||||||||||||||||
| JW Aluminum Co., Common Equity |
(f)(g)(l)(u) | Materials | 972 | — | — | |||||||||||||||||||||||
| JW Aluminum Co., Preferred Equity |
(f)(g)(u) | Materials | 12.5% PIK | 11/17/25 | 4,499 | 49,429 | 57,260 | |||||||||||||||||||||
| MB Precision Investment Holdings LLC, Class A-2 Units |
(g)(l)(n) | Capital Goods | 490,213 | 490 | — | |||||||||||||||||||||||
| Micronics Filtration Holdings, Inc., Common Equity |
(g)(l) | Capital Goods | 53,073 | 553 | — | |||||||||||||||||||||||
| Micronics Filtration Holdings, Inc., Preferred Equity, Series A |
(g)(l) | Capital Goods | 55 | 553 | 901 | |||||||||||||||||||||||
| Micronics Filtration Holdings, Inc., Preferred Equity, Series B |
(g)(l) | Capital Goods | 23 | 229 | 254 | |||||||||||||||||||||||
| Mood Media Corp., Common Equity |
(g)(j)(l)(t) | Media | 16,243,967 | 11,804 | 26,754 | |||||||||||||||||||||||
| North Haven Cadence TopCo, LLC, Common Equity |
(g)(l) | Consumer Services | 1,041,667 | 1,042 | 1,615 | |||||||||||||||||||||||
| PDI Parent LLC, Common Equity |
(g)(l) | Capital Goods | 1,384,615 | 1,385 | 1,454 | |||||||||||||||||||||||
See notes to consolidated financial statements.
100
Table of Contents
FS Investment Corporation
Consolidated Schedule of Investments (continued)
As of December 31, 2017
(in thousands, except share amounts)
| Portfolio Company(a) |
Footnotes | Industry |
Rate(b) | Floor | Maturity | Number of Shares |
Amortized Cost |
Fair Value(d) |
||||||||||||||||||||
| PSAV Holdings LLC, Common Equity |
(f)(l) | Technology Hardware & Equipment | 10,000 | $ | 10,000 | $ | 34,000 | |||||||||||||||||||||
| Ridgeback Resources Inc., Common Equity |
(f)(j)(l) | Energy | 324,954 | 1,997 | 1,973 | |||||||||||||||||||||||
| Roadhouse Holding Inc., Common Equity |
(g)(l)(t) | Consumer Services | 6,672,036 | 6,932 | — | |||||||||||||||||||||||
| S1 Blocker Buyer Inc., Common Equity |
(g) | Commercial & Professional Services | 59 | 587 | 893 | |||||||||||||||||||||||
| Safariland, LLC, Common Equity |
(f)(l) | Capital Goods | 25,000 | 2,500 | 8,200 | |||||||||||||||||||||||
| Safariland, LLC, Warrants, 7/27/2018 |
(f)(l) | Capital Goods | 2,263 | 246 | 742 | |||||||||||||||||||||||
| Safariland, LLC, Warrants, 9/20/2019 |
(f)(l) | Capital Goods | 2,273 | 227 | 746 | |||||||||||||||||||||||
| SandRidge Energy, Inc., Common Equity |
(g)(j)(l)(s) | Energy | 421,682 | 9,413 | 8,885 | |||||||||||||||||||||||
| Sequel Industrial Products Holdings, LLC, Common Equity |
(f)(g)(l) | Commercial & Professional Services | 33,306 | 3,400 | 14,898 | |||||||||||||||||||||||
| Sequel Industrial Products Holdings, LLC, Preferred Equity |
(f)(g) | Commercial & Professional Services | 9.5% PIK | 11/10/18 | 8,000 | 13,376 | 13,378 | |||||||||||||||||||||
| Sequel Industrial Products Holdings, LLC, Warrants, 9/28/2022 |
(g)(l) | Commercial & Professional Services | 1,293 | 1 | 422 | |||||||||||||||||||||||
| Sequel Industrial Products Holdings, LLC, Warrants, 5/10/2022 |
(f)(l) | Commercial & Professional Services | 19,388 | 12 | 6,733 | |||||||||||||||||||||||
| Sequential Brands Group, Inc., Common Equity |
(g)(l)(s) | Consumer Durables & Apparel | 206,664 | 2,790 | 368 | |||||||||||||||||||||||
| Sorenson Communications, Inc., Common Equity |
(f)(l) | Telecommunication Services | 46,163 | — | 37,858 | |||||||||||||||||||||||
| SSC Holdco Limited, Common Equity |
(g)(j)(l) | Health Care Equipment & Services | 113,636 | 2,273 | 2,716 | |||||||||||||||||||||||
| Sunnova Energy Corp., Common Equity |
(g)(l) | Energy | 192,389 | 722 | — | |||||||||||||||||||||||
| Sunnova Energy Corp., Preferred Equity |
(g)(l) | Energy | 35,115 | 187 | 142 | |||||||||||||||||||||||
| The Brock Group, Inc., Common Equity |
(g)(l) | Energy | 183,826 | 3,652 | 3,833 | |||||||||||||||||||||||
| The Stars Group Inc., Warrants, 5/15/2024 |
(g)(j)(l) | Consumer Services | 2,000,000 | 16,832 | 25,140 | |||||||||||||||||||||||
| ThermaSys Corp., Common Equity |
(f)(l) | Capital Goods | 51,813 | 1 | — | |||||||||||||||||||||||
| ThermaSys Corp., Preferred Equity |
(f)(l) | Capital Goods | 51,813 | 5,181 | 78 | |||||||||||||||||||||||
| Viper Holdings, LLC, Series I Units |
(g)(l) | Consumer Durables & Apparel | 308,948 | 509 | 541 | |||||||||||||||||||||||
| Viper Holdings, LLC, Series II Units |
(g)(l)(n) | Consumer Durables & Apparel | 316,770 | 522 | 554 | |||||||||||||||||||||||
| Viper Parallel Holdings LLC, Class A Units |
(g)(l) | Consumer Durables & Apparel | 649,538 | 1,070 | 1,137 | |||||||||||||||||||||||
| VPG Metals Group LLC, Class A-2 Units |
(f)(l) | Materials | 3,637,500 | 3,638 | 2,183 | |||||||||||||||||||||||
| Warren Resources, Inc., Common Equity |
(f)(g)(l) | Energy | 113,515 | 534 | 193 | |||||||||||||||||||||||
| Zeta Interactive Holdings Corp., Preferred Equity, Series E-1 |
(g)(l) | Software & Services | 215,662 | 1,714 | 2,092 | |||||||||||||||||||||||
| Zeta Interactive Holdings Corp., Preferred Equity, Series F |
(g)(l) | Software & Services | 196,151 | 1,714 | 1,830 | |||||||||||||||||||||||
See notes to consolidated financial statements.
101
Table of Contents
FS Investment Corporation
Consolidated Schedule of Investments (continued)
As of December 31, 2017
(in thousands, except share amounts)
| Portfolio Company(a) |
Footnotes | Industry |
Rate(b) | Floor | Maturity | Number of Shares |
Amortized Cost |
Fair Value(d) |
||||||||||||||||||||
| Zeta Interactive Holdings Corp., Warrants, 4/20/2027 |
(g)(l) | Software & Services | 29,422 | $ | — | $ | 102 | |||||||||||||||||||||
|
|
|
|
|
|||||||||||||||||||||||||
| Total Equity/Other |
387,715 | 501,922 | ||||||||||||||||||||||||||
|
|
|
|
|
|||||||||||||||||||||||||
| TOTAL INVESTMENTS—171.8% |
$ 3,816,846 | 3,926,234 | ||||||||||||||||||||||||||
|
|
|
|||||||||||||||||||||||||||
| LIABILITIES IN EXCESS OF OTHER ASSETS—(71.8%) |
(1,641,511) | |||||||||||||||||||||||||||
|
|
|
|||||||||||||||||||||||||||
| NET ASSETS—100% |
$ 2,284,723 | |||||||||||||||||||||||||||
|
|
|
|||||||||||||||||||||||||||
| (a) | Security may be an obligation of one or more entities affiliated with the named company. |
| (b) | Certain variable rate securities in the Company’s portfolio bear interest at a rate determined by a publicly disclosed base rate plus a basis point spread. As of December 31, 2017, the three-month London Interbank Offered Rate, or LIBOR or “L”, was 1.69%, the Euro Interbank Offered Rate, or EURIBOR, was (0.33)% and the U.S. Prime Lending Rate, or Prime, was 4.50%. PIK means paid-in-kind. |
| (c) | Denominated in U.S. dollars unless otherwise noted. |
| (d) | Fair value determined by the Company’s board of directors (see Note 7). |
| (e) | Security or portion thereof held within Locust Street Funding LLC and is pledged as collateral supporting the amounts outstanding under the term loan facility with JPMorgan Chase Bank, N.A. (see Note 8). |
| (f) | Security or portion thereof held within Race Street Funding LLC and is pledged as collateral supporting the amounts outstanding under the revolving credit facility with ING Capital LLC (see Note 8). |
| (g) | Security or portion thereof is pledged as collateral supporting the amounts outstanding under the revolving credit facility with ING Capital LLC (see Note 8). |
| (h) | Security or portion thereof held within Hamilton Street Funding LLC and is pledged as collateral supporting the amounts outstanding under the revolving credit facility with HSBC Bank USA, N.A. (see Note 8). |
| (i) | Position or portion thereof unsettled as of December 31, 2017. |
| (j) | The investment is not a qualifying asset under the Investment Company Act of 1940, as amended. A business development company may not acquire any asset other than qualifying assets, unless, at the time the acquisition is made, qualifying assets represent at least 70% of the company’s total assets. As of December 31, 2017, 82.0% of the Company’s total assets represented qualifying assets. |
| (k) | Listed investments may be treated as debt for GAAP or tax purposes. |
See notes to consolidated financial statements.
102
Table of Contents
FS Investment Corporation
Consolidated Schedule of Investments (continued)
As of December 31, 2017
(in thousands, except share amounts)
| (l) | Security is non-income producing. |
| (m) | Security held within IC American Energy Investments, Inc., a wholly-owned subsidiary of the Company. |
| (n) | Security held within FSIC Investments, Inc., a wholly-owned subsidiary of the Company. |
| (o) | Security held within IC Arches Investments LLC, a wholly-owned subsidiary of the Company. |
| (p) | Security held within IC Altus Investments, LLC, a wholly-owned subsidiary of the Company. |
| (q) | Security is an unfunded commitment. Reflects the stated spread at the time of commitment, but may not be the actual rate received upon funding. |
| (r) | Asset is on non-accrual status. |
| (s) | Security is classified as Level 1 in the Company’s fair value hierarchy (see Note 7). |
| (t) | Under the Investment Company Act of 1940, as amended, the Company generally is deemed to be an “affiliated person” of a portfolio company if it owns 5% or more of the portfolio company’s voting securities and generally is deemed to “control” a portfolio company if it owns more than 25% of the portfolio company’s voting securities or it has the power to exercise control over the management or policies of such portfolio company. As of December 31, 2017, the Company held investments in portfolio companies of which it is deemed to be an “affiliated person” but is not deemed to “control”. The following table presents certain information with respect to investments in portfolio companies of which the Company was deemed to be an affiliated person for the year ended December 31, 2017: |
| Portfolio Company |
Fair Value at December 31, 2016 |
Transfers In or Out |
Purchases
and Paid-in-kind Interest |
Sales and Repayments |
Accretion of Discount |
Net Realized Gain (Loss) |
Net Change in Unrealized Appreciation (Depreciation) |
Fair Value at December 31, 2017 |
Interest Income(5) |
PIK Income(5) |
Fee Income(5) |
|||||||||||||||||||||||||||||||||
| Senior Secured Loans—First Lien |
||||||||||||||||||||||||||||||||||||||||||||
| Advanced Lighting Technologies, Inc. |
$ | — | $ | — | $ | 20,026 | $ | (2,948 | ) | $ | 138 | $ | 8 | $ | 3,159 | $ | 20,383 | $ | 584 | $ | — | $ | 891 | |||||||||||||||||||||
| ASG Technologies Group, Inc. |
54,766 | — | 11,832 | (65,789 | ) | 49 | 295 | (1,153 | ) | — | 3,203 | 356 | — | |||||||||||||||||||||||||||||||
| Aspect Software, Inc.(1)(2) |
— | 634 | 536 | (178 | ) | — | — | — | 992 | 93 | — | 14 | ||||||||||||||||||||||||||||||||
| Aspect Software, Inc.(2) |
— | 697 | — | (18 | ) | — | — | (51 | ) | 628 | 79 | — | 3 | |||||||||||||||||||||||||||||||
| Aspect Software, Inc.(3) |
— | — | — | — | — | — | (361 | ) | (361 | ) | 6 | — | 12 | |||||||||||||||||||||||||||||||
| Logan’s Roadhouse, Inc.(4) |
— | — | 6,963 | — | — | — | (11 | ) | 6,952 | 32 | 81 | 729 | ||||||||||||||||||||||||||||||||
| Senior Secured Loans—Second Lien |
||||||||||||||||||||||||||||||||||||||||||||
| ASG Technologies Group, Inc. |
23,872 | — | — | (24,611 | ) | 549 | 5,529 | (5,339 | ) | — | 2,286 | — | 1,231 | |||||||||||||||||||||||||||||||
| Logan’s Roadhouse, Inc. |
15,415 | — | 5,648 | — | 32 | — | (11,016 | ) | 10,079 | 12 | 2,032 | — | ||||||||||||||||||||||||||||||||
See notes to consolidated financial statements.
103
Table of Contents
FS Investment Corporation
Consolidated Schedule of Investments (continued)
As of December 31, 2017
(in thousands, except share amounts)
| Portfolio Company |
Fair Value at December 31, 2016 |
Transfers In or Out |
Purchases
and Paid-in-kind Interest |
Sales and Repayments |
Accretion of Discount |
Net Realized Gain (Loss) |
Net Change in Unrealized Appreciation (Depreciation) |
Fair Value at December 31, 2017 |
Interest Income(5) |
PIK Income(5) |
Fee Income(5) |
|||||||||||||||||||||||||||||||||
| Senior Secured Bonds |
||||||||||||||||||||||||||||||||||||||||||||
| Advanced Lighting Technologies, Inc. |
$ | — | $ | 32,222 | $ | — | $ | (34,048 | ) | $ | — | $ | 1,826 | $ | — | $ | — | $ | 2,169 | $ | — | $ | — | |||||||||||||||||||||
| Advanced Lighting Technologies, Inc. |
— | — | 22,728 | — | — | — | — | 22,728 | 337 | — | — | |||||||||||||||||||||||||||||||||
| Mood Media Corp. |
— | 21,568 | — | — | — | — | 107 | 21,675 | 1,535 | — | — | |||||||||||||||||||||||||||||||||
| Subordinated Debt |
||||||||||||||||||||||||||||||||||||||||||||
| Mood Media Corp.(2) |
— | 5,689 | — | (6,460 | ) | 44 | 727 | — | — | 432 | — | — | ||||||||||||||||||||||||||||||||
| Equity/Other |
||||||||||||||||||||||||||||||||||||||||||||
| Advanced Lighting Technologies, Inc., Common Equity |
— | — | 16,520 | — | — | — | (3,474 | ) | 13,046 | — | — | — | ||||||||||||||||||||||||||||||||
| Advanced Lighting Technologies, Inc., Warrants |
— | — | 86 | — | — | — | (30 | ) | 56 | — | — | — | ||||||||||||||||||||||||||||||||
| Advanced Lighting Technologies, Inc., Preferred Equity |
— | — | — | — | — | — | — | — | — | — | — | |||||||||||||||||||||||||||||||||
| ASG Everglades Holdings, Inc., Common Equity |
79,673 | — | — | — | — | — | 3,379 | 83,052 | — | — | — | |||||||||||||||||||||||||||||||||
| ASG Everglades Holdings, Inc., Warrants, 6/27/2022 |
5,830 | — | — | — | — | — | 459 | 6,289 | — | — | — | |||||||||||||||||||||||||||||||||
| Aspect Software, Inc.(2) |
— | 19,792 | 100 | — | — | 305 | (20,197 | ) | — | — | — | — | ||||||||||||||||||||||||||||||||
| Fronton Investor Holdings, LLC, Class B Units |
15,092 | — | — | (7,994 | ) | — | — | 10,684 | 17,782 | — | — | — | ||||||||||||||||||||||||||||||||
| Mood Media Corp. |
— | 6,662 | 5,142 | — | — | — | 14,950 | 26,754 | — | — | — | |||||||||||||||||||||||||||||||||
| Roadhouse Holding Inc., Common Equity |
8,147 | — | — | — | — | — | (8,147 | ) | — | — | — | — | ||||||||||||||||||||||||||||||||
|
|
|
|
|
|
|
|
|
|
|
|
|
|
|
|
|
|
|
|
|
|
|
|||||||||||||||||||||||
| Total |
$ | 202,795 | $ | 87,264 | $ | 89,581 | $ | (142,046 | ) | $ | 812 | $ | 8,690 | $ | (17,041 | ) | $ | 230,055 | $ | 10,768 | $ | 2,469 | $ | 2,880 | ||||||||||||||||||||
|
|
|
|
|
|
|
|
|
|
|
|
|
|
|
|
|
|
|
|
|
|
|
|||||||||||||||||||||||
| (1) | Security includes a partially unfunded commitment with an amortized cost of $25 and a fair value of $25. |
| (2) | The Company held this investment as of December 31, 2016 but it was not deemed to be an “affiliated person” of the portfolio company or deemed to “control” the portfolio company as of December 31, 2016. Transfers in or out have been presented at amortized cost. |
| (3) | Security is an unfunded commitment with an amortized cost of $361 and a fair value of $0. |
See notes to consolidated financial statements.
104
Table of Contents
FS Investment Corporation
Consolidated Schedule of Investments (continued)
As of December 31, 2017
(in thousands, except share amounts)
| (4) | Security includes a partially unfunded commitment with an amortized cost of $1,131 and a fair value of $1,120. |
| (5) | Interest, PIK, fee and dividend income presented for the full year ended December 31, 2017. |
| (u) | Under the Investment Company Act of 1940, as amended, the Company generally is deemed to “control” a portfolio company if it owns more than 25% of the portfolio company’s voting securities or it has the power to exercise control over the management or policies of such portfolio company. As of December 31, 2017, the Company held investments in one portfolio company of which it is deemed to be an “affiliated person” and deemed to “control”. During the year ended December 31, 2017, the Company disposed of investments in one portfolio of which it was deemed to be an “affiliated person” and deemed to “control”. The following table presents certain information with respect to investments in portfolio companies of which the Company was deemed to be an affiliated person and deemed to control for the year ended December 31, 2017: |
| Portfolio Company |
Fair Value at December 31, 2016 |
Transfers In or Out |
Purchases
and Paid-in-kind Interest |
Sales and Repayments |
Accretion of Discount |
Net Realized Gain (Loss) |
Net Change in Unrealized Appreciation (Depreciation) |
Fair Value at December 31, 2017 |
Interest Income(2) |
PIK Income(2) |
||||||||||||||||||||||||||||||
| Senior Secured Loans—First Lien |
||||||||||||||||||||||||||||||||||||||||
| Swiss Watch International, Inc.(1) |
$ | — | $ | 12,185 | $ | — | $ | (1,615 | ) | $ | — | $ | (10,570 | ) | $ | — | $ | — | $ | — | $ | — | ||||||||||||||||||
| Swiss Watch International, Inc.(1) |
— | 42,301 | — | — | — | (42,301 | ) | — | — | (7 | ) | — | ||||||||||||||||||||||||||||
| Senior Secured Loans—Second Lien |
||||||||||||||||||||||||||||||||||||||||
| JW Aluminum Co. |
38,039 | — | 146 | (85 | ) | 4 | — | (96 | ) | 38,008 | 3,536 | 146 | ||||||||||||||||||||||||||||
| Equity/Other |
||||||||||||||||||||||||||||||||||||||||
| JW Aluminum Co., Common Equity |
— | — | — | — | — | — | — | — | — | — | ||||||||||||||||||||||||||||||
| JW Aluminum Co., Preferred Equity |
45,031 | — | 5,922 | — | — | — | 6,307 | 57,260 | 844 | 5,923 | ||||||||||||||||||||||||||||||
| SWI Holdco LLC, Common Equity(1) |
— | — | 8 | — | — | (8 | ) | — | — | — | — | |||||||||||||||||||||||||||||
|
|
|
|
|
|
|
|
|
|
|
|
|
|
|
|
|
|
|
|
|
|||||||||||||||||||||
| Total |
$ | 83,070 | $ | 54,486 | $ | 6,076 | $ | (1,700 | ) | $ | 4 | $ | (52,879 | ) | $ | 6,211 | $ | 95,268 | $ | 4,373 | $ | 6,069 | ||||||||||||||||||
|
|
|
|
|
|
|
|
|
|
|
|
|
|
|
|
|
|
|
|
|
|||||||||||||||||||||
| (1) | The Company held this investment as of December 31, 2016 but it was not deemed to be an “affiliated person” of the portfolio company or deemed to “control” the portfolio company as of December 31, 2016. Transfers in or out have been presented at amortized cost. |
| (2) | Interest, PIK, fee and dividend income presented for the full year ended December 31, 2017. |
See notes to consolidated financial statements.
105
Table of Contents
FS Investment Corporation
Consolidated Schedule of Investments
As of December 31, 2016
(in thousands, except share amounts)
| Portfolio Company(a) |
Footnotes |
Industry |
Rate(b) | Floor | Maturity | Principal Amount(c) |
Amortized Cost |
Fair Value(d) |
||||||||||||||||||||
| Senior Secured Loans—First Lien—84.2% |
||||||||||||||||||||||||||||
| 5 Arch Income Fund 2, LLC |
(g)(j)(o) | Diversified Financials | 10.5% | 11/18/21 | $ | 19,561 | $ | 19,611 | $ | 19,561 | ||||||||||||||||||
| 5 Arch Income Fund 2, LLC |
(g)(j)(o)(q) | Diversified Financials | 10.5% | 11/18/21 | 18,439 | 18,439 | 18,439 | |||||||||||||||||||||
| A.P. Plasman Inc. |
(e)(f)(g)(h)(j) | Capital Goods | L+850 | 1.0% | 12/29/19 | 202,235 | 200,358 | 199,707 | ||||||||||||||||||||
| Aeneas Buyer Corp. |
(g) | Health Care Equipment & Services | L+500 | 1.0% | 12/18/21 | 916 | 916 | 916 | ||||||||||||||||||||
| Aeneas Buyer Corp. |
(e)(g)(h) | Health Care Equipment & Services | L+815 | 1.0% | 12/18/21 | 77,220 | 77,220 | 78,378 | ||||||||||||||||||||
| AG Group Merger Sub, Inc. |
(e)(g) | Commercial & Professional Services | L+750 | 1.0% | 12/29/23 | 62,500 | 62,500 | 62,500 | ||||||||||||||||||||
| AG Group Merger Sub, Inc. |
(g)(q) | Commercial & Professional Services | L+750 | 1.0% | 12/29/23 | 27,500 | 27,500 | 27,500 | ||||||||||||||||||||
| All Systems Holding LLC |
(e)(f)(g)(h) | Commercial & Professional Services | L+770 | 1.0% | 10/31/23 | 44,000 | 44,000 | 44,370 | ||||||||||||||||||||
| Altus Power America, Inc. |
(g) | Energy | L+750 | 1.5% | 9/30/21 | 2,665 | 2,665 | 2,715 | ||||||||||||||||||||
| Altus Power America, Inc. |
(g)(q) | Energy | L+750 | 1.5% | 9/30/21 | 1,085 | 1,085 | 1,106 | ||||||||||||||||||||
| AP Exhaust Acquisition, LLC |
(f)(g) | Automobiles & Components | L+775 | 1.5% | 1/16/21 | 15,811 | 15,811 | 14,309 | ||||||||||||||||||||
| ASG Technologies Group, Inc. |
(e)(g)(h)(t) | Software & Services | L+786, 1.2% PIK (1.2% Max PIK) | 1.0% | 4/30/20 | 53,957 | 53,613 | 54,766 | ||||||||||||||||||||
| Aspect Software, Inc. |
(g) | Software & Services | L+1000 | 1.0% | 5/25/18 | 634 | 634 | 634 | ||||||||||||||||||||
| Aspect Software, Inc. |
(g)(q) | Software & Services | L+1000 | 1.0% | 5/25/18 | 22 | 22 | 22 | ||||||||||||||||||||
| Aspect Software, Inc. |
(g) | Software & Services | L+1000 | 1.0% | 5/25/20 | 697 | 697 | 705 | ||||||||||||||||||||
| Atlas Aerospace LLC |
(g) | Capital Goods | L+804 | 1.0% | 5/8/19 | 20,000 | 20,000 | 20,300 | ||||||||||||||||||||
| BenefitMall Holdings, Inc. |
(e)(h) | Commercial & Professional Services | L+725 | 1.0% | 11/24/20 | 14,700 | 14,700 | 14,847 | ||||||||||||||||||||
| Cadence Aerospace Finance, Inc. |
(g) | Capital Goods | L+575 | 1.3% | 5/9/18 | 73 | 73 | 71 | ||||||||||||||||||||
| Caesars Entertainment Operating Co., Inc. |
(e)(g)(j)(l) | Consumer Services | L+575 | 3/1/17 | 9,294 | 9,231 | 9,414 | |||||||||||||||||||||
| Caesars Entertainment Operating Co., Inc. |
(e)(j)(l) | Consumer Services | L+675 | 3/1/17 | 851 | 847 | 872 | |||||||||||||||||||||
| Caesars Entertainment Operating Co., Inc. |
(e)(g)(j)(l) | Consumer Services | L+875 | 1.0% | 3/1/17 | 11,852 | 11,839 | 12,334 | ||||||||||||||||||||
| Corner Investment PropCo, LLC |
(e)(g)(h) | Consumer Services | L+975 | 1.3% | 11/2/19 | 42,303 | 42,404 | 42,725 | ||||||||||||||||||||
| Crestwood Holdings LLC |
(g) | Energy | L+800 | 1.0% | 6/19/19 | 5,021 | 5,009 | 4,926 | ||||||||||||||||||||
| CSafe Acquisition Co., Inc. |
(g) | Capital Goods | L+725 | 11/1/21 | 783 | 783 | 783 | |||||||||||||||||||||
| CSafe Acquisition Co., Inc. |
(g)(q) | Capital Goods | L+725 | 11/1/21 | 5,087 | 5,087 | 5,087 | |||||||||||||||||||||
| CSafe Acquisition Co., Inc. |
(g)(h) | Capital Goods | L+725 | 10/31/23 | 45,000 | 45,000 | 45,000 | |||||||||||||||||||||
| CSafe Acquisition Co., Inc. |
(g)(q) | Capital Goods | L+725 | 10/31/23 | 27,391 | 27,391 | 27,391 | |||||||||||||||||||||
| Eastman Kodak Co. |
(g) | Consumer Durables & Apparel | L+625 | 1.0% | 9/3/19 | 10,438 | 10,331 | 10,503 | ||||||||||||||||||||
| Empire Today, LLC |
(e)(g) | Retailing | L+800 | 1.0% | 11/17/22 | 82,000 | 82,000 | 82,726 | ||||||||||||||||||||
| Greystone Equity Member Corp. |
(g)(j) | Diversified Financials | L+1050 | 3/31/21 | 3,308 | 3,321 | 3,337 | |||||||||||||||||||||
| Greystone Equity Member Corp. |
(g)(j) | Diversified Financials | L+1100 | 3/31/21 | 14,646 | 14,646 | 14,920 | |||||||||||||||||||||
| Greystone Equity Member Corp. |
(g)(j)(q) | Diversified Financials | L+1100 | 3/31/21 | 36,047 | 36,047 | 36,716 | |||||||||||||||||||||
| H.M. Dunn Co., Inc. |
(g) | Capital Goods | L+955 | 1.0% | 3/26/21 | 1,071 | 1,071 | 1,083 | ||||||||||||||||||||
| H.M. Dunn Co., Inc. |
(g)(q) | Capital Goods | L+775 | 1.0% | 3/26/21 | 357 | 357 | 361 | ||||||||||||||||||||
| Imagine Communications Corp. |
(e)(g)(h) | Media | L+825 | 1.0% | 4/29/20 | 75,655 | 75,655 | 76,601 | ||||||||||||||||||||
See notes to consolidated financial statements.
106
Table of Contents
FS Investment Corporation
Consolidated Schedule of Investments (continued)
As of December 31, 2016
(in thousands, except share amounts)
| Portfolio Company(a) |
Footnotes |
Industry |
Rate(b) | Floor | Maturity | Principal Amount(c) |
Amortized Cost |
Fair Value(d) |
||||||||||||||
| Imagine Communications Corp. |
(g)(q) | Media | L+825 | 1.0% | 4/29/20 | $ | 28,600 | $ | 28,600 | $ | 28,958 | |||||||||||
| Industrial Group Intermediate Holdings, LLC |
(g) | Materials | L+800 | 1.3% | 5/31/20 | 20,757 | 20,757 | 21,069 | ||||||||||||||
| Industry City TI Lessor, L.P. |
(g) | Consumer Services | 10.8%, 1.0% PIK (1.0% Max PIK) | 6/30/26 | 32,613 | 32,613 | 33,102 | |||||||||||||||
| JMC Acquisition Merger Corp. |
(g) | Capital Goods | L+857 | 1.0% | 11/6/21 | 6,332 | 6,332 | 6,332 | ||||||||||||||
| Latham Pool Products, Inc. |
(e)(h) | Commercial & Professional Services | L+775 | 1.0% | 6/29/21 | 70,000 | 70,000 | 70,700 | ||||||||||||||
| Leading Edge Aviation Services, Inc. |
(e)(f)(h) | Capital Goods | L+875 | 1.5% | 6/30/19 | 30,254 | 30,119 | 30,254 | ||||||||||||||
| LEAS Acquisition Co Ltd. |
(g)(j) | Capital Goods | L+875 | 1.5% | 6/30/19 | € | 27,188 | 36,988 | 28,692 | |||||||||||||
| LEAS Acquisition Co Ltd. |
(f)(j) | Capital Goods | L+875 | 1.5% | 6/30/19 | $ | 9,538 | 9,538 | 9,538 | |||||||||||||
| MB Precision Holdings LLC |
(g) | Capital Goods | L+725, 1.5% PIK (1.5% Max PIK) | 1.3% | 1/23/20 | 12,853 | 12,853 | 12,355 | ||||||||||||||
| Micronics, Inc. |
(e)(g)(h) | Capital Goods | L+800 | 1.3% | 12/11/19 | 63,461 | 63,271 | 63,461 | ||||||||||||||
| MMM Holdings, Inc. |
(g) | Health Care Equipment & Services | L+825 | 1.5% | 6/30/19 | 6,698 | 6,665 | 6,546 | ||||||||||||||
| MORSCO, Inc. |
(g) | Capital Goods | L+700 | 1.0% | 10/31/23 | 15,000 | 14,413 | 15,150 | ||||||||||||||
| MSO of Puerto Rico, Inc. |
(g) | Health Care Equipment & Services | L+825 | 1.5% | 6/30/19 | 4,869 | 4,846 | 4,759 | ||||||||||||||
| Nobel Learning Communities, Inc. |
(g) | Consumer Services | L+450 | 1.0% | 4/27/20 | 52 | 52 | 52 | ||||||||||||||
| Nobel Learning Communities, Inc. |
(g)(q) | Consumer Services | L+450 | 1.0% | 4/27/20 | 87 | 87 | 87 | ||||||||||||||
| Nobel Learning Communities, Inc. |
(g) | Consumer Services | L+841 | 1.0% | 4/27/21 | 1,056 | 1,056 | 1,072 | ||||||||||||||
| North Haven Cadence Buyer, Inc. |
(g)(q) | Consumer Services | L+500 | 1.0% | 9/2/21 | 938 | 938 | 938 | ||||||||||||||
| North Haven Cadence Buyer, Inc. |
(e)(g) | Consumer Services | L+813 | 1.0% | 9/2/22 | 26,771 | 26,771 | 26,771 | ||||||||||||||
| North Haven Cadence Buyer, Inc. |
(g)(q) | Consumer Services | L+750 | 1.0% | 9/2/22 | 4,479 | 4,479 | 4,479 | ||||||||||||||
| Nova Wildcat Amerock, LLC |
(g) | Consumer Durables & Apparel | L+859 | 1.3% | 9/10/19 | 17,269 | 17,269 | 16,751 | ||||||||||||||
| PHRC License, LLC |
(f)(g) | Consumer Services | L+900 | 1.5% | 8/14/20 | 43,879 | 43,879 | 44,318 | ||||||||||||||
| Polymer Additives, Inc. |
(g) | Materials | L+888 | 1.0% | 12/20/21 | 10,511 | 10,511 | 10,564 | ||||||||||||||
| Polymer Additives, Inc. |
(g) | Materials | L+875 | 1.0% | 12/20/21 | € | 15,000 | 16,982 | 15,830 | |||||||||||||
| PSKW, LLC |
(e)(g)(h) | Health Care Equipment & Services | L+839 | 1.0% | 11/25/21 | $ | 30,000 | 30,000 | 29,189 | |||||||||||||
| Roadrunner Intermediate Acquisition Co., LLC |
(e)(g)(h) | Health Care Equipment & Services | L+800 | 1.0% | 9/22/21 | 35,844 | 35,844 | 36,381 | ||||||||||||||
| Rogue Wave Software, Inc. |
(e)(g)(h) | Software & Services | L+802 | 1.0% | 9/25/21 | 33,188 | 33,188 | 33,188 | ||||||||||||||
| Safariland, LLC |
(e)(g)(h) | Capital Goods | L+769 | 1.0% | 11/18/23 | 126,107 | 126,107 | 125,792 | ||||||||||||||
| Safariland, LLC |
(g)(q) | Capital Goods | L+725 | 1.0% | 11/18/23 | 33,282 | 33,282 | 33,199 | ||||||||||||||
| Sequential Brands Group, Inc. |
(e)(g)(h)(j) | Consumer Durables & Apparel | L+900 | 7/1/22 | 80,652 | 80,652 | 81,459 | |||||||||||||||
| Sorenson Communications, Inc. |
(e)(g)(h) | Telecommunication Services | L+575 | 2.3% | 4/30/20 | 91,621 | 91,339 | 90,933 | ||||||||||||||
| Sports Authority, Inc. |
(g)(l)(r) | Retailing | L+600 | 1.5% | 11/16/17 | 6,318 | 5,108 | 1,287 | ||||||||||||||
| SunGard Availability Services Capital, Inc. |
(g) | Software & Services | L+500 | 1.0% | 3/29/19 | 4,382 | 4,210 | 4,253 | ||||||||||||||
| Sunnova Asset Portfolio 5 Holdings, LLC |
(g) | Energy | 12.0%, 0.0% PIK (12.0% Max PIK) | 11/14/21 | 4,703 | 4,633 | 4,750 | |||||||||||||||
| Swiss Watch International, Inc. |
(g)(l)(r) | Consumer Durables & Apparel | L+825 | 1.3% | 11/8/18 | 12,185 | 12,185 | 4,875 | ||||||||||||||
| Swiss Watch International, Inc. |
(e)(g)(l)(r) | Consumer Durables & Apparel | L+825 | 1.3% | 11/8/18 | 42,611 | 42,301 | — | ||||||||||||||
See notes to consolidated financial statements.
107
Table of Contents
FS Investment Corporation
Consolidated Schedule of Investments (continued)
As of December 31, 2016
(in thousands, except share amounts)
| Portfolio Company(a) |
Footnotes |
Industry |
Rate(b) | Floor | Maturity | Principal Amount(c) |
Amortized Cost |
Fair Value(d) |
||||||||||||||
| Transplace Texas, LP |
(e)(g)(h) | Transportation | L+744 | 1.0% | 9/16/21 | $ | 24,486 | $ | 24,486 | $ | 24,486 | |||||||||||
| Transplace Texas, LP |
(g)(q) | Transportation | L+700 | 1.0% | 9/16/21 | 541 | 541 | 541 | ||||||||||||||
| U.S. Xpress Enterprises, Inc. |
(e)(f)(h) | Transportation | L+1000, 0.0% PIK (1.8% Max PIK) | 1.5% | 5/30/19 | 53,435 | 53,435 | 53,435 | ||||||||||||||
| Vertellus Performance Chemicals LLC |
(f)(g) | Materials | L+950 | 1.0% | 1/30/20 | 38,000 | 38,000 | 35,693 | ||||||||||||||
| VPG Group Holdings LLC |
(e)(g)(h) | Materials | L+900 | 1.0% | 6/30/18 | 61,795 | 61,629 | 61,331 | ||||||||||||||
| Warren Resources, Inc. |
(f)(g) | Energy | L+900, 1.0% PIK (1.0% Max PIK) | 1.0% | 5/22/20 | 2,016 | 2,016 | 2,016 | ||||||||||||||
| Warren Resources, Inc. |
(g)(q) | Energy | L+900, 1.0% PIK (1.0% Max PIK) | 1.0% | 5/22/20 | 144 | 144 | 144 | ||||||||||||||
| Waste Pro USA, Inc. |
(e)(g)(h) | Commercial & Professional Services | L+750 | 1.0% | 10/15/20 | 94,553 | 94,553 | 96,326 | ||||||||||||||
| Zeta Interactive Holdings Corp. |
(e)(g)(h) | Software & Services | L+750 | 1.0% | 7/29/22 | 9,766 | 9,792 | 9,863 | ||||||||||||||
| Zeta Interactive Holdings Corp. |
(g)(s) | Software & Services | L+750 | 1.0% | 7/29/22 | 2,857 | 2,831 | 2,876 | ||||||||||||||
| Zeta Interactive Holdings Corp. |
(g)(q) | Software & Services | L+750 | 1.0% | 7/29/22 | 1,777 | 1,777 | 1,793 | ||||||||||||||
| Zeta Interactive Holdings Corp. |
(g)(q)(s) | Software & Services | L+750 | 1.0% | 7/29/22 | 457 | 457 | 461 | ||||||||||||||
|
|
|
|
|
|||||||||||||||||||
| Total Senior Secured Loans—First Lien | 2,178,392 | 2,121,674 | ||||||||||||||||||||
| Unfunded Loan Commitments |
(186,233 | ) | (186,233 | ) | ||||||||||||||||||
|
|
|
|
|
|||||||||||||||||||
| Net Senior Secured Loans—First Lien | 1,992,159 | 1,935,441 | ||||||||||||||||||||
|
|
|
|
|
|||||||||||||||||||
| Senior Secured Loans—Second Lien—26.1% | ||||||||||||||||||||||
| Alison US LLC |
(g)(j) | Capital Goods | L+850 | 1.0% | 8/29/22 | 4,444 | 4,303 | 4,310 | ||||||||||||||
| AP Exhaust Acquisition, LLC |
(f) | Automobiles & Components | 12.0% PIK (12.0% Max PIK) | 9/28/21 | 3,763 | 3,763 | 3,279 | |||||||||||||||
| Arena Energy, LP |
(g) | Energy | L+900, 4.0% PIK (4.0% Max PIK) | 1.0% | 1/24/21 | 7,955 | 7,955 | 7,994 | ||||||||||||||
| Ascent Resources - Utica, LLC |
(e)(f)(g)(h) | Energy | L+950 | 1.5% | 9/30/18 | 186,037 | 185,553 | 187,665 | ||||||||||||||
| ASG Technologies Group, Inc. |
(g)(t) | Software & Services | L+1100, 0.0% PIK (6.0% Max PIK) | 1.0% | 6/27/22 | 24,611 | 18,533 | 23,872 | ||||||||||||||
| Brock Holdings III, Inc. |
(g) | Energy | L+825 | 1.8% | 3/16/18 | 6,923 | 6,893 | 6,611 | ||||||||||||||
| Byrider Finance, LLC |
(f)(g) | Automobiles & Components | L+1000, 0.5% PIK (0.5% Max PIK) | 1.3% | 8/22/20 | 10,047 | 10,047 | 9,896 | ||||||||||||||
| Compuware Corp. |
(g) | Software & Services | L+825 | 1.0% | 12/15/22 | 6,550 | 5,982 | 6,582 | ||||||||||||||
| DEI Sales, Inc. |
(e)(f)(g)(h) | Consumer Durables & Apparel | L+900 | 1.5% | 1/15/18 | 64,654 | 64,431 | 62,229 | ||||||||||||||
| EagleView Technology Corp. |
(g) | Software & Services | L+825 | 1.0% | 7/14/23 | 11,538 | 11,394 | 11,520 | ||||||||||||||
| Gruden Acquisition, Inc. |
(g) | Transportation | L+850 | 1.0% | 8/18/23 | 15,000 | 14,371 | 11,874 | ||||||||||||||
| JW Aluminum Co. |
(e)(f)(g)(h)(u) | Materials | L+850 PIK (L+850 Max PIK) | 0.8% | 11/17/20 | 37,385 | 37,367 | 38,039 | ||||||||||||||
| Logan’s Roadhouse, Inc. |
(g)(t) | Consumer Services | L+850 PIK (L+850 Max PIK) | 1.0% | 11/23/20 | 16,114 | 16,114 | 15,415 | ||||||||||||||
| National Surgical Hospitals, Inc. |
(e)(h) | Health Care Equipment & Services | L+900 | 1.0% | 6/1/23 | 30,000 | 30,000 | 30,014 | ||||||||||||||
| Nielsen & Bainbridge, LLC |
(g) | Consumer Durables & Apparel | L+925 | 1.0% | 8/15/21 | 16,675 | 16,481 | 16,341 | ||||||||||||||
| Paw Luxco II Sarl |
(f)(j) | Consumer Durables & Apparel | EURIBOR+950 | 1/29/19 | € | 16,364 | 20,914 | 2,055 | ||||||||||||||
| PSAV Acquisition Corp. |
(e)(g)(h) | Technology Hardware & Equipment | L+825 | 1.0% | 1/24/22 | $ | 80,000 | 79,130 | 80,000 | |||||||||||||
| Spencer Gifts LLC |
(e)(h) | Retailing | L+825 | 1.0% | 6/29/22 | 30,000 | 29,885 | 24,825 | ||||||||||||||
See notes to consolidated financial statements.
108
Table of Contents
FS Investment Corporation
Consolidated Schedule of Investments (continued)
As of December 31, 2016
(in thousands, except share amounts)
| Portfolio Company(a) |
Footnotes |
Industry |
Rate(b) | Floor | Maturity | Principal Amount(c) |
Amortized Cost |
Fair Value(d) |
||||||||||||||
| Stadium Management Corp. |
(e)(g)(h) | Consumer Services | L+825 | 1.0% | 2/27/21 | $ | 56,776 | $ | 56,776 | $ | 56,634 | |||||||||||
|
|
|
|
|
|||||||||||||||||||
| Total Senior Secured Loans—Second Lien | 619,892 | 599,155 | ||||||||||||||||||||
|
|
|
|
|
|||||||||||||||||||
| Senior Secured Bonds—6.9% | ||||||||||||||||||||||
| Advanced Lighting Technologies, Inc. |
(f)(g) | Materials | 10.5% | 6/1/19 | 78,500 | 77,670 | 28,103 | |||||||||||||||
| Caesars Entertainment Resort Properties, LLC |
(e)(g)(h) | Consumer Services | 11.0% | 10/1/21 | 24,248 | 24,026 | 26,497 | |||||||||||||||
| FourPoint Energy, LLC |
(e)(f)(h) | Energy | 9.0% | 12/31/21 | 74,813 | 72,520 | 76,589 | |||||||||||||||
| Global A&T Electronics Ltd. |
(g)(j) | Semiconductors & Semiconductor Equipment | 10.0% | 2/1/19 | 7,000 | 6,955 | 5,328 | |||||||||||||||
| Ridgeback Resources Inc. |
(f)(j) | Energy | 12.0% | 12/29/20 | 132 | 129 | 132 | |||||||||||||||
| Sorenson Communications, Inc. |
(f) | Telecommunication Services | 9.0%, 0.0% PIK (9.0% Max PIK) | 10/31/20 | 19,898 | 19,357 | 17,709 | |||||||||||||||
| Velvet Energy Ltd. |
(g)(j) | Energy | 9.0% | 10/5/23 | 5,000 | 5,000 | 5,112 | |||||||||||||||
|
|
|
|
|
|||||||||||||||||||
| Total Senior Secured Bonds | 205,657 | 159,470 | ||||||||||||||||||||
|
|
|
|
|
|||||||||||||||||||
| Subordinated Debt—19.8% | ||||||||||||||||||||||
| Aurora Diagnostics, LLC |
(e)(f)(h) | Health Care Equipment & Services | 10.8% | 1/15/18 | 14,935 | 14,944 | 12,881 | |||||||||||||||
| Bellatrix Exploration Ltd. |
(g)(j) | Energy | 8.5% | 5/15/20 | 5,000 | 4,928 | 4,922 | |||||||||||||||
| Brooklyn Basketball Holdings, LLC |
(f)(g) | Consumer Services | L+725 | 10/25/19 | 19,873 | 19,873 | 19,972 | |||||||||||||||
| CEC Entertainment, Inc. |
(f) | Consumer Services | 8.0% | 2/15/22 | 5,000 | 5,010 | 5,117 | |||||||||||||||
| Ceridian HCM Holding, Inc. |
(f)(g) | Commercial & Professional Services | 11.0% | 3/15/21 | 21,800 | 22,555 | 22,509 | |||||||||||||||
| EV Energy Partners, L.P. |
(f) | Energy | 8.0% | 4/15/19 | 265 | 245 | 188 | |||||||||||||||
| Global Jet Capital Inc. |
(g) | Commercial & Professional Services | 15.0% PIK (15.0% Max PIK) | 1/30/25 | 732 | 732 | 727 | |||||||||||||||
| Global Jet Capital Inc. |
(g) | Commercial & Professional Services | 15.0% PIK (15.0% Max PIK) | 4/30/25 | 4,649 | 4,649 | 4,620 | |||||||||||||||
| Global Jet Capital Inc. |
(g) | Commercial & Professional Services | 15.0% PIK (15.0% Max PIK) | 9/3/25 | 961 | 961 | 955 | |||||||||||||||
| Global Jet Capital Inc. |
(g) | Commercial & Professional Services | 15.0% PIK (15.0% Max PIK) | 9/29/25 | 904 | 904 | 899 | |||||||||||||||
| Global Jet Capital Inc. |
(f)(g)(j) | Commercial & Professional Services | 15.0% PIK (15.0% Max PIK) | 12/4/25 | 66,763 | 66,763 | 66,346 | |||||||||||||||
| Global Jet Capital Inc. |
(f)(g)(j) | Commercial & Professional Services | 15.0% PIK (15.0% Max PIK) | 12/9/25 | 10,919 | 10,919 | 10,851 | |||||||||||||||
| Global Jet Capital Inc. |
(f)(j) | Commercial & Professional Services | 15.0% PIK (15.0% Max PIK) | 1/29/26 | 5,718 | 5,718 | 5,682 | |||||||||||||||
| Global Jet Capital Inc. |
(g) | Commercial & Professional Services | 15.0% PIK (15.0% Max PIK) | 4/14/26 | 11,688 | 11,688 | 11,615 | |||||||||||||||
| Global Jet Capital Inc. |
(g) | Commercial & Professional Services | 15.0% PIK (15.0% Max PIK) | 12/2/26 | 11,473 | 11,473 | 11,473 | |||||||||||||||
| Imagine Communications Corp. |
(g) | Media | 12.5% PIK (12.5% Max PIK) | 8/4/18 | 585 | 585 | 585 | |||||||||||||||
| Jupiter Resources Inc. |
(f)(g)(j) | Energy | 8.5% | 10/1/22 | 6,425 | 5,505 | 5,579 | |||||||||||||||
| Mood Media Corp. |
(g)(i)(j) | Media | 10.0% | 8/6/23 | 6,460 | 5,689 | 5,976 | |||||||||||||||
| Mood Media Corp. |
(f)(g)(j) | Media | 9.3% | 10/15/20 | 43,135 | 42,402 | 26,744 | |||||||||||||||
| NewStar Financial, Inc. |
(g)(j) | Diversified Financials | 8.3%, 0.0% PIK (8.8% Max PIK) | 12/4/24 | 75,000 | 61,615 | 65,250 | |||||||||||||||
| P.F. Chang’s China Bistro, Inc. |
(f)(g) | Consumer Services | 10.3% | 6/30/20 | 11,433 | 11,743 | 11,223 | |||||||||||||||
| PriSo Acquisition Corp. |
(g) | Capital Goods | 9.0% | 5/15/23 | 10,155 | 10,044 | 10,206 | |||||||||||||||
See notes to consolidated financial statements.
109
Table of Contents
FS Investment Corporation
Consolidated Schedule of Investments (continued)
As of December 31, 2016
(in thousands, except share amounts)
| Portfolio Company(a) |
Footnotes |
Industry |
Rate(b) | Floor | Maturity | Principal Amount(c) |
Amortized Cost |
Fair Value(d) |
||||||||||||||
| S1 Blocker Buyer Inc. |
(g) | Commercial & Professional Services | 10.0% PIK (10.0% Max PIK) | 10/31/22 | $ | 127 | $ | 127 | $ | 129 | ||||||||||||
| SandRidge Energy, Inc. |
(g)(j)(l) | Energy | — % | 10/4/20 | 4,405 | 5,871 | 5,530 | |||||||||||||||
| Sequel Industrial Products Holdings, LLC |
(f) | Commercial & Professional Services | 14.5%, 2.5% PIK (2.5% Max PIK) | 9/30/19 | 7,044 | 6,999 | 7,203 | |||||||||||||||
| Sorenson Communications, Inc. |
(f) | Telecommunication Services | 13.9%, 0.0% PIK (13.9% Max PIK) | 10/31/21 | 15,122 | 14,314 | 13,913 | |||||||||||||||
| SunGard Availability Services Capital, Inc. |
(f)(g) | Software & Services | 8.8% | 4/1/22 | 10,750 | 8,363 | 7,404 | |||||||||||||||
| ThermaSys Corp. |
(e)(f)(g) | Capital Goods | 9.0%, 1.8% PIK (5.0% Max PIK) | 5/3/20 | 138,106 | 138,106 | 110,312 | |||||||||||||||
| VPG Group Holdings LLC |
(e)(g) | Materials | 11.0%, 2.0% PIK (2.0% Max PIK) | 6/30/18 | 5,355 | 5,355 | 5,234 | |||||||||||||||
|
|
|
|
|
|||||||||||||||||||
| Total Subordinated Debt | 498,080 | 454,045 | ||||||||||||||||||||
|
|
|
|
|
|||||||||||||||||||
| Collateralized Securities—3.1% | ||||||||||||||||||||||
| ACASC 2013-2A Class Subord. B |
(f)(g)(j) | Diversified Financials | 12.5% | 10/25/25 | 30,500 | 17,799 | 20,270 | |||||||||||||||
| NewStar Clarendon 2014-1A Class D |
(g)(j) | Diversified Financials | L+435 | 1/25/27 | 1,560 | 1,477 | 1,472 | |||||||||||||||
| NewStar Clarendon 2014-1A Class Subord. B |
(g)(j) | Diversified Financials | 16.4% | 1/25/27 | 17,900 | 14,272 | 14,300 | |||||||||||||||
| Rampart CLO 2007 1A Class Subord. |
(g)(j) | Diversified Financials | 17.6% | 10/25/21 | 10,000 | 741 | 1,105 | |||||||||||||||
| Stone Tower CLO VI Class Subord. |
(f)(j) | Diversified Financials | 23.6% | 4/17/21 | 5,000 | 1,636 | 2,434 | |||||||||||||||
| Wind River CLO Ltd. 2012 1A Class Subord. B |
(g)(j) | Diversified Financials | 19.9% | 1/15/26 | 42,504 | 23,300 | 32,477 | |||||||||||||||
|
|
|
|
|
|||||||||||||||||||
| Total Collateralized Securities |
59,225 | 72,058 | ||||||||||||||||||||
|
|
|
|
|
|||||||||||||||||||
| Portfolio Company(a) |
Footnotes | Industry |
Number of Shares |
Amortized Cost |
Fair Value(d) |
|||||||||||||
| Equity/Other—22.1%(k) | ||||||||||||||||||
| 5 Arches, LLC, Common Equity |
(g)(j)(l)(n) | Diversified Financials | 9,475 | $ | 250 | $ | 250 | |||||||||||
| A.P. Plasman Inc., Warrants, 5/25/2026 |
(g)(j)(l) | Capital Goods | 698,482 | 2,545 | 3,073 | |||||||||||||
| Altus Power America Holdings, LLC, Common Equity |
(g)(l) | Energy | 462,008 | 462 | 462 | |||||||||||||
| Altus Power America Holdings, LLC, Preferred Equity |
(g) | Energy | 888,211 | 888 | 888 | |||||||||||||
| Amaya Inc., Warrants, 5/15/2024 |
(g)(j)(l) | Consumer Services | 2,000,000 | 16,832 | 13,360 | |||||||||||||
| AP Exhaust Holdings, LLC, Common Equity |
(g)(l)(n) | Automobiles & Components | 811 | 811 | 41 | |||||||||||||
| Aquilex Corp., Common Equity, Class A Shares |
(g)(l)(n) | Commercial & Professional Services | 15,128 | 1,087 | 4,529 | |||||||||||||
| Aquilex Corp., Common Equity, Class B Shares |
(g)(l)(n) | Commercial & Professional Services | 32,637 | 1,690 | 9,772 | |||||||||||||
| Ascent Resources Utica Holdings, LLC, Common Equity |
(g)(l)(m) | Energy | 96,800,082 | 29,100 | 21,683 | |||||||||||||
| ASG Technologies Group, Inc., Common Equity |
(g)(l)(t) | Software & Services | 1,689,767 | 36,422 | 79,673 | |||||||||||||
| ASG Technologies Group, Inc., Warrants, 6/27/2022 |
(g)(l)(t) | Software & Services | 229,541 | 6,542 | 5,830 | |||||||||||||
| Aspect Software, Inc., Common Equity |
(g)(l) | Software & Services | 409,967 | 19,792 | 22,384 | |||||||||||||
| Burleigh Point, Ltd., Warrants, 7/16/2020 |
(g)(j)(l) | Retailing | 3,451,216 | 1,898 | 276 | |||||||||||||
See notes to consolidated financial statements.
110
Table of Contents
FS Investment Corporation
Consolidated Schedule of Investments (continued)
As of December 31, 2016
(in thousands, except share amounts)
| Portfolio Company(a) |
Footnotes | Industry |
Number of Shares |
Amortized Cost |
Fair Value(d) |
|||||||||||
| CSF Group Holdings, Inc., Common Equity |
(g)(l) | Capital Goods | 391,300 | $ | 391 | $ | 391 | |||||||||
| Eastman Kodak Co., Common Equity |
(g)(l) | Consumer Durables & Apparel | 61,859 | 1,203 | 959 | |||||||||||
| FourPoint Energy, LLC, Common Equity, Class C-II-A Units |
(g)(l)(n) | Energy | 21,000 | 21,000 | 10,133 | |||||||||||
| FourPoint Energy, LLC, Common Equity, Class D Units |
(g)(l)(n) | Energy | 3,937 | 2,601 | 1,919 | |||||||||||
| FourPoint Energy, LLC, Common Equity, Class E-II Units |
(g)(l)(n) | Energy | 87,400 | 21,850 | 39,986 | |||||||||||
| FourPoint Energy, LLC, Common Equity, Class E-III Units |
(g)(l)(n) | Energy | 70,875 | 17,719 | 34,197 | |||||||||||
| Fronton Investor Holdings, LLC, Class B Units |
(g)(n)(t) | Consumer Services | 14,943 | 15,011 | 15,092 | |||||||||||
| Global Jet Capital Holdings, LP, Preferred Equity |
(f)(g)(j)(l) | Commercial & Professional Services | 42,281,308 | 42,281 | 42,281 | |||||||||||
| H.I.G. Empire Holdco, Inc., Common Equity |
(g)(l) | Retailing | 375 | 1,118 | 1,148 | |||||||||||
| Harvey Holdings, LLC, Common Equity |
(g)(l) | Capital Goods | 2,333,333 | 2,333 | 5,367 | |||||||||||
| Imagine Communications Corp., Common Equity, Class A Units |
(g)(l) | Media | 33,034 | 3,783 | 3,191 | |||||||||||
| Industrial Group Intermediate Holdings, LLC, Common Equity |
(g)(l)(n) | Materials | 441,238 | 441 | 772 | |||||||||||
| JMC Acquisition Holdings, LLC, Common Equity |
(g)(l) | Capital Goods | 483 | 483 | 539 | |||||||||||
| JW Aluminum Co., Common Equity |
(f)(g)(l)(u) | Materials | 972 | — | — | |||||||||||
| JW Aluminum Co., Preferred Equity |
(f)(g)(u) | Materials | 4,499 | 43,507 | 45,031 | |||||||||||
| Leading Edge Aviation Services, Inc., Common Equity |
(f)(l) | Capital Goods | 4,401 | 464 | 137 | |||||||||||
| Leading Edge Aviation Services, Inc., Preferred Equity |
(f)(l) | Capital Goods | 1,303 | 1,303 | 1,303 | |||||||||||
| MB Precision Investment Holdings LLC, Class A-2 Units |
(g)(l)(n) | Capital Goods | 490,213 | 490 | 98 | |||||||||||
| Micronics, Inc., Common Equity |
(g)(l) | Capital Goods | 53,073 | 553 | 403 | |||||||||||
| Micronics, Inc., Preferred Equity |
(g)(l) | Capital Goods | 55 | 553 | 740 | |||||||||||
| NewStar Financial, Inc., Warrants, 11/4/2024 |
(g)(j)(l) | Diversified Financials | 3,000,000 | 15,058 | 8,310 | |||||||||||
| North Haven Cadence Buyer, Inc., Common Equity |
(g)(l) | Consumer Services | 1,041,667 | 1,042 | 1,094 | |||||||||||
| PSAV Holdings LLC, Common Equity |
(f) | Technology Hardware & Equipment | 10,000 | 10,000 | 28,500 | |||||||||||
| Ridgeback Resources Inc., Common Equity |
(f)(j)(l) | Energy | 324,954 | 1,997 | 1,997 | |||||||||||
| Roadhouse Holding Inc., Common Equity |
(g)(l)(t) | Consumer Services | 6,672,036 | 6,932 | 8,147 | |||||||||||
| S1 Blocker Buyer Inc., Common Equity |
(g) | Commercial & Professional Services | 59 | 587 | 571 | |||||||||||
| Safariland, LLC, Common Equity |
(f)(l) | Capital Goods | 25,000 | 2,500 | 11,535 | |||||||||||
| Safariland, LLC, Warrants, 7/27/2018 |
(f)(l) | Capital Goods | 2,263 | 246 | 1,044 | |||||||||||
| Safariland, LLC, Warrants, 9/20/2019 |
(f)(l) | Capital Goods | 2,273 | 227 | 1,049 | |||||||||||
| SandRidge Energy, Inc., Common Equity |
(g)(j)(l) | Energy | 186,853 | 4,671 | 4,400 | |||||||||||
| Sequel Industrial Products Holdings, LLC, Common Equity |
(f)(g)(l) | Commercial & Professional Services | 33,306 | 3,400 | 9,682 | |||||||||||
| Sequel Industrial Products Holdings, LLC, Preferred Equity |
(f)(g) | Commercial & Professional Services | 8,000 | 12,174 | 12,179 | |||||||||||
| Sequel Industrial Products Holdings, LLC, Warrants, 9/28/2022 |
(g)(l) | Commercial & Professional Services | 1,293 | 1 | 219 | |||||||||||
| Sequel Industrial Products Holdings, LLC, Warrants, 5/10/2022 |
(f)(l) | Commercial & Professional Services | 19,388 | 12 | 3,697 | |||||||||||
See notes to consolidated financial statements.
111
Table of Contents
FS Investment Corporation
Consolidated Schedule of Investments (continued)
As of December 31, 2016
(in thousands, except share amounts)
| Portfolio Company(a) |
Footnotes | Industry |
Number of Shares |
Amortized Cost |
Fair Value(d) |
|||||||||||
| Sequential Brands Group, Inc., Common Equity |
(g)(j)(l) | Consumer Durables & Apparel | 206,664 | $ | 2,790 | $ | 967 | |||||||||
| Sorenson Communications, Inc., Common Equity |
(f)(l) | Telecommunication Services | 46,163 | — | 38,989 | |||||||||||
| Sunnova Energy Corp., Common Equity |
(g)(l) | Energy | 192,389 | 722 | 1,045 | |||||||||||
| Sunnova Energy Corp., Preferred Equity |
(g)(l) | Energy | 18,182 | 97 | 99 | |||||||||||
| SWI Holdco LLC, Common Equity |
(g)(l) | Consumer Durables & Apparel | 950 | — | 2,613 | |||||||||||
| ThermaSys Corp., Common Equity |
(f)(l) | Capital Goods | 51,813 | 1 | — | |||||||||||
| ThermaSys Corp., Preferred Equity |
(f)(l) | Capital Goods | 51,813 | 5,181 | — | |||||||||||
| VPG Group Holdings LLC, Class A-2 Units |
(f)(l) | Materials | 3,637,500 | 3,638 | 2,183 | |||||||||||
| Warren Resources, Inc., Common Equity |
(f)(g)(l) | Energy | 113,515 | 534 | 488 | |||||||||||
| Zeta Interactive Holdings Corp., Preferred Equity |
(g)(l) | Software & Services | 215,662 | 1,714 | 1,931 | |||||||||||
|
|
|
|
|
|||||||||||||
| Total Equity/Other | 368,927 | 506,647 | ||||||||||||||
|
|
|
|
|
|||||||||||||
| TOTAL INVESTMENTS—162.2% | $ | 3,743,940 | 3,726,816 | |||||||||||||
|
|
|
|||||||||||||||
| LIABILITIES IN EXCESS OF OTHER ASSETS—(62.2%) | $ | (1,429,439 | ) | |||||||||||||
|
|
|
|||||||||||||||
| NET ASSETS—100% | $ | 2,297,377 | ||||||||||||||
|
|
|
|||||||||||||||
| (a) | Security may be an obligation of one or more entities affiliated with the named company. |
| (b) | Certain variable rate securities in the Company’s portfolio bear interest at a rate determined by a publicly disclosed base rate plus a basis point spread. As of December 31, 2016, the three-month London Interbank Offered Rate, or LIBOR or “L”, was 1.00%, the Euro Interbank Offered Rate, or EURIBOR, was (0.32)% and the U.S. Prime Lending Rate, or Prime, was 3.75%. PIK means paid-in-kind. |
| (c) | Denominated in U.S. dollars unless otherwise noted. |
| (d) | Fair value determined by the Company’s board of directors (see Note 7). |
| (e) | Security or portion thereof held within Locust Street Funding LLC and is pledged as collateral supporting the amounts outstanding under the term loan facility with JPMorgan Chase Bank, N.A. (see Note 8). |
| (f) | Security or portion thereof held within Race Street Funding LLC and is pledged as collateral supporting the amounts outstanding under the revolving credit facility with ING Capital LLC (see Note 8). |
| (g) | Security or portion thereof is pledged as collateral supporting the amounts outstanding under the revolving credit facility with ING Capital LLC (see Note 8). |
| (h) | Security or portion thereof held within Hamilton Street Funding LLC and is pledged as collateral supporting the amounts outstanding under the revolving credit facility with HSBC Bank USA, N.A. (see Note 8). |
See notes to consolidated financial statements.
112
Table of Contents
FS Investment Corporation
Consolidated Schedule of Investments (continued)
As of December 31, 2016
(in thousands, except share amounts)
| (i) | Position or portion thereof unsettled as of December 31, 2016. |
| (j) | The investment is not a qualifying asset under the Investment Company Act of 1940, as amended. A business development company may not acquire any asset other than qualifying assets, unless, at the time the acquisition is made, qualifying assets represent at least 70% of the company’s total assets. As of December 31, 2016, 81.8% of the Company’s total assets represented qualifying assets. |
| (k) | Listed investments may be treated as debt for GAAP or tax purposes. |
| (l) | Security is non-income producing. |
| (m) | Security held within IC American Energy Investments, Inc., a wholly-owned subsidiary of the Company. |
| (n) | Security held within FSIC Investments, Inc., a wholly-owned subsidiary of the Company. |
| (o) | Security held within IC Arches Investments LLC, a wholly-owned subsidiary of the Company. |
| (p) | Security held within IC Altus Investments, LLC, a wholly-owned subsidiary of the Company. |
| (q) | Security is an unfunded commitment. Reflects the stated spread at the time of commitment, but may not be the actual rate received upon funding. |
| (r) | Asset is on non-accrual status. |
| (s) | The transfer of a portion of this loan does not qualify for sale accounting under Accounting Standards Codification Topic 860, Transfers and Servicing, and therefore, the entire senior secured loan remains in the consolidated schedule of investments as of December 31, 2016 (see Note 8). |
See notes to consolidated financial statements.
113
Table of Contents
FS Investment Corporation
Consolidated Schedule of Investments (continued)
As of December 31, 2016
(in thousands, except share amounts)
| (t) | Under the Investment Company Act of 1940, as amended, the Company generally is deemed to be an “affiliated person” of a portfolio company if it owns 5% or more of the portfolio company’s voting securities and generally is deemed to “control” a portfolio company if it owns more than 25% of the portfolio company’s voting securities or it has the power to exercise control over the management or policies of such portfolio company. As of December 31, 2016, the Company held investments in portfolio companies of which it is deemed to be an “affiliated person” but is not deemed to “control”. The following table presents certain information with respect to investments in portfolio companies of which the Company was deemed to be an affiliated person for the year ended December 31, 2016: |
| Portfolio Company |
Fair Value at December 31, 2015 |
Purchases
and Paid-in-kind Interest |
Sales and Repayments |
Accretion of Discount |
Net Realized Gain (Loss) |
Net Change in Unrealized Appreciation (Depreciation) |
Fair Value at December 31, 2016 |
Interest Income |
Fee Income |
Dividend Income |
||||||||||||||||||||||||||||||
| Senior Secured Loans—First Lien |
||||||||||||||||||||||||||||||||||||||||
| ASG Technologies Group, Inc. |
$ | 38,321 | $ | 15,628 | — | $ | 44 | — | $ | 773 | $ | 54,766 | $ | 4,841 | — | — | ||||||||||||||||||||||||
| Senior Secured Loans—Second Lien |
||||||||||||||||||||||||||||||||||||||||
| ASG Technologies Group, Inc. |
— | $ | 18,069 | — | $ | 464 | — | $ | 5,339 | $ | 23,872 | $ | 1,818 | $ | 738 | — | ||||||||||||||||||||||||
| Logan’s Roadhouse, Inc. |
— | $ | 16,114 | — | — | — | $ | (699 | ) | $ | 15,415 | $ | 165 | $ | 14 | — | ||||||||||||||||||||||||
| Equity/Other |
||||||||||||||||||||||||||||||||||||||||
| ASG Technologies Group, Inc., Common Equity |
$ | 77,898 | — | — | — | — | $ | 1,775 | $ | 79,673 | — | — | — | |||||||||||||||||||||||||||
| ASG Technologies Group, Inc., Warrants, 6/27/2022 |
— | $ | 6,542 | — | — | — | $ | (712 | ) | $ | 5,830 | — | — | — | ||||||||||||||||||||||||||
| Fronton Investor Holdings, LLC, Class B Units |
$ | 16,138 | — | $ | (1,874 | ) | — | — | $ | 828 | $ | 15,092 | — | — | $ | 224 | ||||||||||||||||||||||||
| Roadhouse Holding Inc., Common Equity |
— | $ | 6,932 | — | — | — | $ | 1,215 | $ | 8,147 | — | — | — | |||||||||||||||||||||||||||
| (u) | Under the Investment Company Act of 1940, as amended, the Company generally is deemed to “control” a portfolio company if it owns more than 25% of the portfolio company’s voting securities or it has the power to exercise control over the management or policies of such portfolio company. As of December 31, 2016, the Company held investments in one portfolio company of which it is deemed to be an “affiliated person” and deemed to “control”. The following table presents certain information with respect to investments in portfolio companies of which the Company was deemed to be an affiliated person and deemed to control for the year ended December 31, 2016: |
| Portfolio Company |
Fair Value at December 31, 2015 |
Purchases
and Paid-in-kind Interest |
Sales and Repayments |
Accretion of Discount |
Net Realized Gain (Loss) |
Net Change in Unrealized Appreciation (Depreciation) |
Fair Value at December 31, 2016 |
Interest Income |
Fee Income |
Dividend Income |
||||||||||||||||||||||||||||||
| Senior Secured Loans—Second Lien |
||||||||||||||||||||||||||||||||||||||||
| JW Aluminum Co. |
$ | 32,887 | $ | 4,478 | — | $ | 2 | — | $ | 672 | $ | 38,039 | $ | 3,338 | — | — | ||||||||||||||||||||||||
| Senior Secured Bonds |
||||||||||||||||||||||||||||||||||||||||
| JW Aluminum Co. |
— | $ | 8,060 | $ | (8,141 | ) | $ | 107 | $ | (26 | ) | — | — | $ | 210 | — | — | |||||||||||||||||||||||
| Equity/Other |
||||||||||||||||||||||||||||||||||||||||
| JW Aluminum Co., Common Equity |
— | — | — | — | — | — | — | — | — | — | ||||||||||||||||||||||||||||||
| JW Aluminum Co., Preferred Equity |
$ | 43,844 | $ | 406 | — | — | — | $ | 781 | $ | 45,031 | $ | 35 | — | — | |||||||||||||||||||||||||
See notes to consolidated financial statements.
114
Table of Contents
Notes to Consolidated Financial Statements
(in thousands, except share and per share amounts)
Note 1. Principal Business and Organization
FS Investment Corporation (NYSE: FSIC), or the Company, was incorporated under the general corporation laws of the State of Maryland on December 21, 2007 and formally commenced investment operations on January 2, 2009. The Company is an externally managed, non-diversified, closed-end management investment company that has elected to be regulated as a business development company, or BDC, under the Investment Company Act of 1940, as amended, or the 1940 Act. In addition, the Company has elected to be treated for U.S. federal income tax purposes, and intends to qualify annually, as a regulated investment company, or RIC, as defined under Subchapter M of the Internal Revenue Code of 1986, as amended, or the Code. As of December 31, 2017, the Company had two wholly-owned financing subsidiaries and five wholly-owned subsidiaries through which it holds interests in portfolio companies. The consolidated financial statements include both the Company’s accounts and the accounts of its wholly-owned subsidiaries as of December 31, 2017. All significant intercompany transactions have been eliminated in consolidation. Certain of the Company’s consolidated subsidiaries are subject to U.S. federal and state income taxes.
The Company’s investment objectives are to generate current income and, to a lesser extent, long-term capital appreciation by investing primarily in senior secured loans and second lien secured loans of private U.S. companies. The Company seeks to generate superior risk-adjusted returns by focusing on debt investments in a broad array of private U.S. companies, including middle market companies, which the Company defines as companies with annual revenues of $50 million to $2.5 billion at the time of investment. The Company may purchase interests in loans or make other debt investments, including investments in senior secured bonds, through secondary market transactions in the “over-the-counter” market or directly from the Company’s target companies as primary market or directly originated investments. In connection with the Company’s debt investments, the Company may on occasion receive equity interests such as warrants or options as additional consideration. The Company may also purchase or otherwise acquire interests in the form of common or preferred equity or equity-related securities, such as rights and warrants that may be converted into or exchanged for common stock or other equity or the cash value of common stock or other equity, in the Company’s target companies, generally in conjunction with one of the Company’s debt investments, including through the restructuring of such investments, or through a co-investment with a financial sponsor, such as an institutional investor or private equity firm. In addition, a portion of the Company’s portfolio may be comprised of corporate bonds, collateralized loan obligations, or CLOs, other debt securities and derivatives, including total return swaps and credit default swaps. The Company’s investment adviser, FB Income Advisor, LLC, or FB Advisor, will seek to tailor the Company’s investment focus as market conditions evolve. Depending on market conditions, the Company may increase or decrease its exposure to less senior portions of the capital structure or otherwise make opportunistic investments.
As the Company previously announced on December 11, 2017, GSO / Blackstone Debt Funds Management LLC, or GDFM, intends to resign as the investment sub-adviser to the Company and terminate the investment sub-advisory agreement, or the investment sub-advisory agreement, between FB Advisor and GDFM, effective April 9, 2018. In connection with GDFM’s resignation as the investment sub-adviser to the Company, Franklin Square Holdings, L.P. (which does business as FS Investments), or FS Investments, and KKR Credit Advisors (US) LLC, or KKR Credit, desire to enter into a relationship whereby FS Investments and KKR Credit will create a premier alternative lending platform for certain BDCs sponsored, advised and/or sub-advised by them. Accordingly, FB Advisor, together with FSIC II Advisor, LLC, FSIC III Advisor, LLC and FSIC IV Advisor, LLC, or collectively the FS Advisor Entities, and KKR Credit and certain other parties have entered into a master transaction agreement setting out the terms of the relationship between FB Advisor and KKR Credit. In furtherance thereof, the Company desires to enter into (i) an investment advisory agreement with FB
115
Table of Contents
FS Investment Corporation
Notes to Consolidated Financial Statements (continued)
(in thousands, except share and per share amounts)
Note 1. Principal Business and Organization (continued)
Advisor and an investment advisory agreement with KKR Credit, pursuant to which FB Advisor and KKR Credit would act as investment co-advisers to the Company and/or (ii) an investment advisory agreement with FS/KKR Advisor, LLC, or FS/KKR Advisor, a newly-formed investment adviser jointly operated by an affiliate of FS Investments and by KKR Credit, pursuant to which FS/KKR Advisor would act as investment adviser to the Company.
Note 2. Summary of Significant Accounting Policies
Basis of Presentation: The accompanying audited consolidated financial statements of the Company have been prepared in accordance with U.S. generally accepted accounting principles, or GAAP. The Company is considered an investment company under GAAP and follows the accounting and reporting guidance applicable to investment companies under Accounting Standards Codification Topic 946, Financial Services—Investment Companies. The Company has evaluated the impact of subsequent events through the date the consolidated financial statements were issued and filed with the U.S. Securities and Exchange Commission, or the SEC.
Use of Estimates: The preparation of the audited consolidated financial statements in conformity with GAAP requires management to make estimates and assumptions that affect the reported amounts of assets and liabilities, and disclosure of contingent assets and liabilities at the date of the financial statements and the reported amounts of revenues and expenses during the reporting period. Actual results could differ from those estimates. Many of the amounts have been rounded, and all amounts are in thousands, except share and per share amounts.
Cash and Cash Equivalents: The Company considers all highly liquid investments with original maturities of three months or less to be cash equivalents. All cash balances are maintained with high credit quality financial institutions, which are members of the Federal Deposit Insurance Corporation.
Valuation of Portfolio Investments: The Company determines the net asset value of its investment portfolio each quarter. Securities are valued at fair value as determined in good faith by the Company’s board of directors. In connection with that determination, FB Advisor provides the Company’s board of directors with portfolio company valuations which are based on relevant inputs, including, but not limited to, indicative dealer quotes, values of like securities, recent portfolio company financial statements and forecasts, and valuations prepared by independent third-party valuation services.
Accounting Standards Codification Topic 820, Fair Value Measurements and Disclosure, or ASC Topic 820, issued by the Financial Accounting Standards Board, or the FASB, clarifies the definition of fair value and requires companies to expand their disclosure about the use of fair value to measure assets and liabilities in interim and annual periods subsequent to initial recognition. ASC Topic 820 defines fair value as the price that would be received from the sale of an asset or paid to transfer a liability in an orderly transaction between market participants at the measurement date. ASC Topic 820 also establishes a three-tier fair value hierarchy, which prioritizes the inputs used in measuring fair value. These tiers include: Level 1, defined as observable inputs such as quoted prices in active markets; Level 2, which includes inputs such as quoted prices for similar securities in active markets and quoted prices for identical securities where there is little or no activity in the market; and Level 3, defined as unobservable inputs for which little or no market data exists, therefore requiring an entity to develop its own assumptions.
116
Table of Contents
FS Investment Corporation
Notes to Consolidated Financial Statements (continued)
(in thousands, except share and per share amounts)
Note 2. Summary of Significant Accounting Policies (continued)
With respect to investments for which market quotations are not readily available, the Company undertakes a multi-step valuation process each quarter, as described below:
| • | the Company’s quarterly fair valuation process begins with FB Advisor’s management team reviewing and documenting valuations of each portfolio company or investment, which valuations may be obtained from an independent third-party valuation service, if applicable; |
| • | FB Advisor’s management team then provides the valuation committee with preliminary valuations for each portfolio company or investment; |
| • | preliminary valuations are then discussed with the valuation committee; |
| • | the Company’s valuation committee reviews the preliminary valuations and FB Advisor’s management team, together with its independent third-party valuation services, if applicable, supplement the preliminary valuations to reflect any comments provided by the valuation committee; |
| • | following its review, the valuation committee will recommend that the Company’s board of directors approve the fair valuations; and |
| • | the Company’s board of directors discusses the valuations and determines the fair value of each such investment in the Company’s portfolio in good faith based on various statistical and other factors, including the input and recommendation of FB Advisor, the valuation committee and any independent third-party valuation services, if applicable. |
Determination of fair value involves subjective judgments and estimates. Accordingly, these notes to the Company’s audited consolidated financial statements refer to the uncertainty with respect to the possible effect of such valuations and any change in such valuations on the Company’s consolidated financial statements. In making its determination of fair value, the Company’s board of directors may use any approved independent third-party pricing or valuation services. However, the Company’s board of directors is not required to determine fair value in accordance with the valuation provided by any single source, and may use any relevant data, including information obtained from FB Advisor or any approved independent third-party valuation or pricing service that the Company’s board of directors deems to be reliable in determining fair value under the circumstances. Below is a description of factors that FB Advisor’s management team, any approved independent third-party valuation services and the Company’s board of directors may consider when determining the fair value of the Company’s investments.
Valuation of fixed income investments, such as loans and debt securities, depends upon a number of factors, including prevailing interest rates for like securities, expected volatility in future interest rates, call features, put features and other relevant terms of the debt. For investments without readily available market prices, the Company may incorporate these factors into discounted cash flow models to arrive at fair value. Other factors that may be considered include the borrower’s ability to adequately service its debt, the fair market value of the borrower in relation to the face amount of its outstanding debt and the quality of collateral securing the Company’s debt investments.
For convertible debt securities, fair value generally approximates the fair value of the debt plus the fair value of an option to purchase the underlying security (i.e., the security into which the debt may convert) at the conversion price. To value such an option, a standard option pricing model may be used.
117
Table of Contents
FS Investment Corporation
Notes to Consolidated Financial Statements (continued)
(in thousands, except share and per share amounts)
Note 2. Summary of Significant Accounting Policies (continued)
The Company’s equity interests in portfolio companies for which there is no liquid public market are valued at fair value. The Company’s board of directors, in its determination of fair value, may consider various factors, such as multiples of earnings before interest, taxes, depreciation and amortization, or EBITDA, cash flows, net income, revenues or, in limited instances, book value or liquidation value. All of these factors may be subject to adjustments based upon the particular circumstances of a portfolio company or the Company’s actual investment position. For example, adjustments to EBITDA may take into account compensation to previous owners or acquisition, recapitalization, restructuring or other related items.
FB Advisor’s management team, any approved independent third-party valuation services and the Company’s board of directors may also consider private merger and acquisition statistics, public trading multiples discounted for illiquidity and other factors, valuations implied by third-party investments in the portfolio companies or industry practices in determining fair value. FB Advisor’s management team, any approved independent third-party valuation services and the Company’s board of directors may also consider the size and scope of a portfolio company and its specific strengths and weaknesses, and may apply discounts or premiums, where and as appropriate, due to the higher (or lower) financial risk and/or the smaller size of portfolio companies relative to comparable firms, as well as such other factors as the Company’s board of directors, in consultation with FB Advisor’s management team and any approved independent third-party valuation services, if applicable, may consider relevant in assessing fair value. Generally, the value of the Company’s equity interests in public companies for which market quotations are readily available is based upon the most recent closing public market price. Portfolio securities that carry certain restrictions on sale are typically valued at a discount from the public market value of the security.
When the Company receives warrants or other equity securities at nominal or no additional cost in connection with an investment in a debt security, the cost basis in the investment will be allocated between the debt securities and any such warrants or other equity securities received at the time of origination. The Company’s board of directors subsequently values these warrants or other equity securities received at their fair value.
The fair values of the Company’s investments are determined in good faith by the Company’s board of directors. The Company’s board of directors is responsible for the valuation of the Company’s portfolio investments at fair value as determined in good faith pursuant to the Company’s valuation policy and consistently applied valuation process. The Company’s board of directors has delegated day-to-day responsibility for implementing its valuation policy to FB Advisor’s management team, and has authorized FB Advisor’s management team to utilize independent third-party valuation and pricing services that have been approved by the Company’s board of directors. The valuation committee is responsible for overseeing FB Advisor’s implementation of the valuation process.
Revenue Recognition: Security transactions are accounted for on the trade date. The Company records interest income on an accrual basis to the extent that it expects to collect such amounts. The Company records dividend income on the ex-dividend date. The Company does not accrue as a receivable interest or dividends on loans and securities if it has reason to doubt its ability to collect such income. The Company’s policy is to place investments on non-accrual status when there is reasonable doubt that interest income will be collected. The Company considers many factors relevant to an investment when placing it on or removing it from non-accrual status including, but not limited to, the delinquency status of the investment, economic and business conditions, the overall financial condition of the underlying investment, the value of the underlying collateral, bankruptcy status, if any, and any other facts or circumstances relevant to the investment. If there is reasonable doubt that the
118
Table of Contents
FS Investment Corporation
Notes to Consolidated Financial Statements (continued)
(in thousands, except share and per share amounts)
Note 2. Summary of Significant Accounting Policies (continued)
Company will receive any previously accrued interest, then the interest income will be written-off. Payments received on non-accrual investments may be recognized as income or applied to principal depending upon the collectability of the remaining principal and interest. Non-accrual investments may be restored to accrual status when principal and interest become current and are likely to remain current based on the Company’s judgment.
Loan origination fees, original issue discount and market discount are capitalized and the Company amortizes such amounts as interest income over the respective term of the loan or security. Upon the prepayment of a loan or security, any unamortized loan origination fees and original issue discount are recorded as interest income. Structuring and other non-recurring upfront fees are recorded as fee income when earned. The Company records prepayment premiums on loans and securities as fee income when it receives such amounts.
In May 2014, the FASB issued ASU No. 2014-09, Revenue from Contracts with Customers, which provides for revenue recognition based on the consideration to which an entity expects to be entitled in exchange for transferring goods or services to a customer. When it becomes effective, the new revenue recognition guidance in ASU No. 2014-09 will replace most revenue recognition guidance under existing GAAP. In 2016, the FASB issued additional guidance that clarified, amended and technically corrected prior revenue recognition guidance. The new revenue recognition guidance applies to all entities and all contracts with customers to provide goods or services in the ordinary course of business, excluding, among other things, financial instruments as well as certain other contractual rights and obligations. For public entities, the new standards are effective during the interim and annual periods beginning after December 15, 2017, with early adoption permitted. The standards permit the use of either the retrospective or cumulative effect transition method. As a result, the Company is required to adopt the new guidance as of January 1, 2018 and expects to do so using the cumulative effect method applied to in-scope contracts with customers that have not been completed as of the date of adoption.
In connection with its evaluation of the impact of the new revenue recognition guidance on its revenue recognition polices for structuring and other non-recurring upfront fees, the Company has performed an analysis to identify contracts with customers within the scope of the new revenue recognition guidance and to determine the related performance obligation and transaction price. Under the new revenue recognition guidance, the Company expects to recognize revenue for in-scope contracts based on the transaction price as the performance obligation is fulfilled. In its analysis, the Company considered, among other matters, the nature of the performance obligation and constraints on including variable consideration in the transaction price. In addition, the Company considered the costs incurred to obtain and fulfill in-scope contracts with customers to determine whether such costs would be required to be capitalized.
Based on its analysis, the Company expects to provide additional revenue recognition disclosures required under the new standard but does not otherwise expect a material effect on its consolidated financial statements.
Net Realized Gains or Losses, Net Change in Unrealized Appreciation or Depreciation and Net Change in Unrealized Gains or Losses on Foreign Currency: Gains or losses on the sale of investments are calculated by using the specific identification method. The Company measures realized gains or losses by the difference between the net proceeds from the repayment or sale and the amortized cost basis of the investment, without regard to unrealized appreciation or depreciation previously recognized, but considering unamortized fees. Net change in unrealized appreciation or depreciation reflects the change in portfolio investment values during the reporting period, including any reversal of previously recorded unrealized gains or losses when gains or losses are realized. Net change in unrealized gains or losses on foreign currency reflects the change in the value of receivables or accruals during the reporting period due to the impact of foreign currency fluctuations.
119
Table of Contents
FS Investment Corporation
Notes to Consolidated Financial Statements (continued)
(in thousands, except share and per share amounts)
Note 2. Summary of Significant Accounting Policies (continued)
Capital Gains Incentive Fee: Pursuant to the terms of the amended and restated investment advisory agreement, dated July 17, 2014, or the investment advisory agreement, by and between the Company and FB Advisor, the incentive fee on capital gains is determined and payable in arrears as of the end of each calendar year (or upon termination of the investment advisory agreement). This fee equals 20.0% of the Company’s incentive fee capital gains (i.e., the Company’s realized capital gains on a cumulative basis from inception, calculated as of the end of the applicable period, net of all realized capital losses and unrealized capital depreciation on a cumulative basis), less the aggregate amount of any previously paid capital gains incentive fees. On a quarterly basis, the Company accrues for the capital gains incentive fee by calculating such fee as if it were due and payable as of the end of such period.
The Company includes unrealized gains in the calculation of the capital gains incentive fee expense and related accrued capital gains incentive fee. This accrual reflects the incentive fees that would be payable to FB Advisor if the Company’s entire portfolio was liquidated at its fair value as of the balance sheet date even though FB Advisor is not entitled to an incentive fee with respect to unrealized gains unless and until such gains are actually realized.
Subordinated Income Incentive Fee: Pursuant to the terms of the investment advisory agreement, FB Advisor may also be entitled to receive a subordinated incentive fee on income. The subordinated incentive fee on income under the investment advisory agreement, which is calculated and payable quarterly in arrears, equals 20.0% of the Company’s “pre-incentive fee net investment income” for the immediately preceding quarter and is subject to a hurdle rate, expressed as a rate of return on the value of the Company’s net assets, equal to 1.875% per quarter, or an annualized hurdle rate of 7.5%. As a result, FB Advisor will not earn this incentive fee for any quarter until the Company’s pre-incentive fee net investment income for such quarter exceeds the hurdle rate of 1.875%. Once the Company’s pre-incentive fee net investment income in any quarter exceeds the hurdle rate, FB Advisor will be entitled to a “catch-up” fee equal to the amount of the pre-incentive fee net investment income in excess of the hurdle rate, until the Company’s pre-incentive fee net investment income for such quarter equals 2.34375%, or 9.375% annually, of net assets. Thereafter, FB Advisor will be entitled to receive 20.0% of pre-incentive fee net investment income.
The subordinated incentive fee on income is subject to a total return requirement, which provides that no incentive fee in respect of the Company’s pre-incentive fee net investment income will be payable except to the extent that 20.0% of the cumulative net increase in net assets resulting from operations over the then-current and eleven preceding calendar quarters exceeds the cumulative incentive fees accrued and/or paid for the eleven preceding calendar quarters. Accordingly, any subordinated incentive fee on income that is payable in a calendar quarter will be limited to the lesser of (i) 20.0% of the amount by which the Company’s pre-incentive fee net investment income for such calendar quarter exceeds the applicable quarterly hurdle rate, subject to the “catch-up” provision, and (ii) (x) 20.0% of the cumulative net increase in net assets resulting from operations for the then-current and eleven preceding calendar quarters minus (y) the cumulative incentive fees accrued and/or paid for the eleven preceding calendar quarters. For the foregoing purpose, the “cumulative net increase in net assets resulting from operations” is the sum of pre-incentive fee net investment income, base management fees, realized gains and losses and unrealized appreciation and depreciation of the Company for the then-current and eleven preceding calendar quarters. There will be no accumulation of amounts on the hurdle rate from quarter to quarter and, accordingly, there will be no clawback of amounts previously paid if subsequent quarters are below the applicable quarterly hurdle rate and there will be no delay of payment if prior quarters are below the applicable quarterly hurdle rate.
120
Table of Contents
FS Investment Corporation
Notes to Consolidated Financial Statements (continued)
(in thousands, except share and per share amounts)
Note 2. Summary of Significant Accounting Policies (continued)
Income Taxes: The Company has elected to be treated for U.S. federal income tax purposes, and intends to qualify annually, as a RIC under Subchapter M of the Code. To qualify for and maintain qualification as a RIC, the Company must, among other things, meet certain source-of-income and asset diversification requirements, as well as distribute to its stockholders, for each tax year, at least 90% of its “investment company taxable income,” which is generally the Company’s net ordinary income plus the excess, if any, of realized net short-term capital gains over realized net long-term capital losses, determined without regard to any deduction for distributions paid. As a RIC, the Company will not have to pay corporate-level U.S. federal income taxes on any income that it distributes to its stockholders. The Company intends to make distributions in an amount sufficient to qualify for and maintain its RIC tax status each tax year and to not pay any U.S. federal income taxes on income so distributed. The Company is also subject to nondeductible federal excise taxes if it does not distribute in respect of each calendar year an amount at least equal to the sum of 98% of net ordinary income, 98.2% of any capital gain net income, if any, and any recognized and undistributed income from prior years for which it paid no U.S. federal income taxes. The Company accrued $5,259, $5,554 and $6,056 in estimated excise taxes payable in respect of income received during the years ended December 31, 2017, 2016 and 2015, respectively. During the years ended December 31, 2017, 2016, and 2015, the Company paid $5,888, $6,000 and $5,853, respectively, in excise and other taxes.
Uncertainty in Income Taxes: The Company evaluates its tax positions to determine if the tax positions taken meet the minimum recognition threshold in connection with accounting for uncertainties in income tax positions taken or expected to be taken for the purposes of measuring and recognizing tax benefits or liabilities in the Company’s consolidated financial statements. Recognition of a tax benefit or liability with respect to an uncertain tax position is required only when the position is “more likely than not” to be sustained assuming examination by taxing authorities. The Company recognizes interest and penalties, if any, related to unrecognized tax liabilities as income tax expense in its consolidated statements of operations. During the years ended December 31, 2017, 2016 and 2015, the Company did not incur any interest or penalties.
The Company has analyzed the tax positions taken on federal and state income tax returns for all open tax years, and has concluded that no provision for income tax for uncertain tax positions is required in the Company’s financial statements. The Company’s federal and state income and federal excise tax returns for tax years for which the applicable statutes of limitations have not expired are subject to examination by the Internal Revenue Service and state departments of revenue.
Distributions: Distributions to the Company’s stockholders are recorded as of the record date. Subject to the discretion of the Company’s board of directors and applicable legal restrictions, the Company intends to declare and pay such distributions on a quarterly basis. Net realized capital gains, if any, are distributed or deemed distributed at least annually.
Partial Loan Sales: The Company follows the guidance in Accounting Standards Codification Topic 860, Transfers and Servicing, or ASC Topic 860, when accounting for loan participations and other partial loan sales. This guidance requires a participation or other partial loan sale to meet the definition of a participating interest, as defined in the guidance, in order for sale treatment to be allowed. Participations or other partial loan sales which do not meet the definition of a participating interest remain on the Company’s consolidated balance sheets and the proceeds are recorded as a secured borrowing until the participation or other partial loan sale meets the definition. Secured borrowings are carried at fair value to correspond with the related investments, which are carried at fair value. See Note 8 for additional information.
121
Table of Contents
FS Investment Corporation
Notes to Consolidated Financial Statements (continued)
(in thousands, except share and per share amounts)
Note 2. Summary of Significant Accounting Policies (continued)
Reclassifications: Certain amounts in the consolidated financial statements for the years ended December 31, 2016 and 2015 have been reclassified to conform to the classifications used to prepare the consolidated financial statements for the year ended December 31, 2017. These reclassifications had no material impact on the Company’s consolidated financial position, results of operations or cash flows as previously reported.
Note 3. Share Transactions
Below is a summary of transactions with respect to shares of the Company’s common stock during the years ended December 31, 2017, 2016 and 2015:
| Year Ended December 31, | ||||||||||||||||||||||||
| 2017 | 2016 | 2015 | ||||||||||||||||||||||
| Shares | Amount | Shares | Amount | Shares | Amount | |||||||||||||||||||
| Reinvestment of Distributions(1) |
1,662,059 | $ | 15,908 | 1,216,341 | $ | 11,091 | 1,950,457 | $ | 19,163 | |||||||||||||||
|
|
|
|
|
|
|
|
|
|
|
|
|
|||||||||||||
| Net Proceeds from Share Transactions |
1,662,059 | $ | 15,908 | 1,216,341 | $ | 11,091 | 1,950,457 | $ | 19,163 | |||||||||||||||
|
|
|
|
|
|
|
|
|
|
|
|
|
|||||||||||||
| (1) | Following the closing of its continuous public offering in May 2012, the Company has continued to issue shares only pursuant to its distribution reinvestment plan. |
During the year ended December 31, 2017, the administrator for the Company’s distribution reinvestment plan, or DRP, purchased 611,141 shares of common stock in the open market at an average price per share of $8.65 (totaling $5,284) pursuant to the DRP, and distributed such shares to participants in the DRP. During the year ended December 31, 2016, the administrator for the DRP purchased 1,232,012 shares of common stock in the open market at an average price per share of $9.10 (totaling $11,216) pursuant to the DRP, and distributed such shares to participants in the DRP. During the period from January 1, 2018 to February 28, 2018, the administrator for the DRP purchased 572,388 shares of common stock in the open market at an average price per share of $7.69 (totaling $4,399) pursuant to the DRP, and distributed such shares to participants in the DRP. For additional information regarding the terms of the DRP, see Note 5.
Note 4. Related Party Transactions
Compensation of the Investment Adviser
Pursuant to the investment advisory agreement, FB Advisor is entitled to an annual base management fee equal to 1.75% of the average value of the Company’s gross assets (gross assets equal the total assets of the Company as set forth on the Company’s consolidated balance sheets) and an incentive fee based on the Company’s performance. Base management fees are paid on a quarterly basis in arrears. FB Advisor has agreed, effective October 1, 2017 and through September 30, 2018, to (a) waive a portion of the base management fee to which it is entitled under the investment advisory agreement so that the fee received equals 1.50% of the average value of the Company’s gross assets and (b) continue to calculate the subordinated incentive fee on income to which it is entitled under the investment advisory agreement as if the base management fee was 1.75% of the average value of the Company’s gross assets. See Note 2 for a discussion of the capital gains and subordinated income incentive fees that FB Advisor may be entitled to under the investment advisory agreement.
Pursuant to the investment sub-advisory agreement, GDFM will receive 50% of all management and incentive fees payable to FB Advisor under the investment advisory agreement with respect to each year.
122
Table of Contents
FS Investment Corporation
Notes to Consolidated Financial Statements (continued)
(in thousands, except share and per share amounts)
Note 4. Related Party Transactions (continued)
On April 16, 2014, the Company entered into an administration agreement with FB Advisor, or the administration agreement, which governs the administrative services provided to the Company by FB Advisor. Pursuant to the administration agreement, the Company reimburses FB Advisor for expenses necessary to perform services related to the Company’s administration and operations, including FB Advisor’s allocable portion of the compensation and related expenses of certain personnel of FS Investments providing administrative services to the Company on behalf of FB Advisor. The Company reimburses FB Advisor no less than quarterly for all costs and expenses incurred by FB Advisor in performing its obligations and providing personnel and facilities under the administration agreement. FB Advisor allocates the cost of such services to the Company based on factors such as total assets, revenues, time allocations and/or other reasonable metrics. The Company’s board of directors reviews the methodology employed in determining how the expenses are allocated to the Company and the proposed allocation of administrative expenses among the Company and certain affiliates of FB Advisor. The Company’s board of directors then assesses the reasonableness of such reimbursements for expenses allocated to the Company based on the breadth, depth and quality of such services as compared to the estimated cost to the Company of obtaining similar services from third-party service providers known to be available. In addition, the Company’s board of directors considers whether any single third-party service provider would be capable of providing all such services at comparable cost and quality. Finally, the Company’s board of directors compares the total amount paid to FB Advisor for such services as a percentage of the Company’s net assets to the same ratio as reported by other comparable BDCs.
The following table describes the fees and expenses accrued under the investment advisory agreement and the administration agreement, as applicable, during the years ended December 31, 2017, 2016 and 2015:
| Year Ended December 31, | ||||||||||||||||
| Related Party |
Source Agreement |
Description |
2017 | 2016 | 2015 | |||||||||||
| FB Advisor |
Investment Advisory Agreement | Base Management Fee(1) | $ | 70,222 | $ | 71,280 | $ | 75,401 | ||||||||
| FB Advisor |
Investment Advisory Agreement | Capital Gains Incentive Fee(2) | — | — | $ | (21,075 | ) | |||||||||
| FB Advisor |
Investment Advisory Agreement | Subordinated Incentive Fee on Income(3) | $ | 50,297 | $ | 51,830 | $ | 61,036 | ||||||||
| FB Advisor |
Administration Agreement | Administrative Services Expenses(4) | $ | 3,051 | $ | 3,475 | $ | 4,182 | ||||||||
| (1) | FB Advisor agreed, effective October 1, 2017, to waive a portion of the base management fee to which it was entitled under the April 2014 investment advisory agreement so that the fee received equaled 1.50% of the average value of the Company’s gross assets. For the year ended December 31, 2017, the amount shown is net of waivers of $2,575. During the years ended December 31, 2017, 2016 and 2015, $72,794, $71,673, and $76,546, respectively, in base management fees were paid to FB Advisor. As of December 31, 2017, $15,450 in base management fees were payable to FB Advisor. |
| (2) | During the year ended December 31, 2015, the Company reversed capital gains incentive fees of $21,075 based on the performance of its portfolio. The Company paid FB Advisor no capital gains incentive fees during the year ended December 31, 2017. As of December 31, 2017, no capital gains incentive fees were accrued. |
| (3) | During the year ended December 31, 2017, $50,311 of subordinated incentive fees on income were paid to FB Advisor. As of December 31, 2017, a subordinated incentive fee on income of $12,871 was payable to FB Advisor. |
| (4) | During the years ended December 31, 2017, 2016 and 2015, $2,796, $3,194 and $3,664, respectively, of administrative services expenses related to the allocation of costs of administrative personnel for services |
123
Table of Contents
FS Investment Corporation
Notes to Consolidated Financial Statements (continued)
(in thousands, except share and per share amounts)
Note 4. Related Party Transactions (continued)
| rendered to the Company by FB Advisor and the remainder related to other reimbursable expenses. The Company paid $3,273, $3,905 and $4,646, respectively, in administrative services expenses to FB Advisor during the years ended December 31, 2017, 2016 and 2015. |
Potential Conflicts of Interest
FB Advisor’s senior management team is comprised of substantially the same personnel as the senior management teams of the investment advisers to certain other BDCs, open- and closed-end management investment companies and a real estate investment trust sponsored by FS Investments, or the Fund Complex. As a result, such personnel provide or expect to provide investment advisory services to certain other funds in the Fund Complex and such personnel may serve in similar or other capacities for the investment advisers to future investment vehicles in the Fund Complex. While none of the investment advisers are currently providing investment advisory services to clients other than funds in the Fund Complex, any, or all, may do so in the future. In the event that FB Advisor or its management team undertakes to provide investment advisory services to other clients in the future, it intends to allocate investment opportunities in a fair and equitable manner consistent with the Company’s investment objectives and strategies, if necessary, so that the Company will not be disadvantaged in relation to any other client of FB Advisor or its management team.
Exemptive Relief
As a BDC, the Company is subject to certain regulatory restrictions in making its investments. For example, BDCs generally are not permitted to co-invest with certain affiliated entities in transactions originated by the BDC or its affiliates in the absence of an exemptive order from the SEC. However, BDCs are permitted to, and may, simultaneously co-invest in transactions where price is the only negotiated term. In an order dated June 4, 2013, or the Order, the SEC granted exemptive relief permitting the Company, subject to the satisfaction of certain conditions, to co-invest in certain privately negotiated investment transactions with certain affiliates of FB Advisor, including FS Energy and Power Fund, FS Investment Corporation II, FS Investment Corporation III, FS Investment Corporation IV and any future BDCs that are advised by FB Advisor or its affiliated investment advisers, or collectively the Company’s co-investment affiliates. However, in connection with the potential investment advisory relationship with KKR Credit and/or FS/KKR Advisor, and in an effort to mitigate potential future conflicts of interest, the Company’s board of directors has authorized and directed that the Company exercise its rights under the Order to decline to participate in any new potential co-investment transaction pursuant to the Order that would be within the then-current investment objectives and strategies of the Company unless sourced by GDFM, KKR Credit or FS/KKR Advisor. The Company believes this relief has and may continue to enhance its ability to further its investment objectives and strategy. The Company believes this relief may also increase favorable investment opportunities for it, in part, by allowing the Company to participate in larger investments, together with its co-investment affiliates, than would be available to the Company if such relief had not been obtained. Because the Company did not seek exemptive relief to engage in co-investment transactions with GDFM and its affiliates, the Company is permitted to co-invest with GDFM and its affiliates only in accordance with existing regulatory guidance (e.g., where price is the only negotiated term).
Trademark License Agreement
On April 16, 2014, in connection with the listing of its common stock on the NYSE, the Company entered into a trademark license agreement, or the trademark license agreement, with FS Investments. Pursuant to the trademark license agreement, FS Investments granted the Company a non-exclusive, nontransferable, royalty-
124
Table of Contents
FS Investment Corporation
Notes to Consolidated Financial Statements (continued)
(in thousands, except share and per share amounts)
Note 4. Related Party Transactions (continued)
free right and license to use the name “FS Investment Corporation” and certain other trademarks, or the licensed marks, as a component of the Company’s name (and in connection with marketing the investment advisory and other services that FB Advisor may provide to the Company). Other than with respect to this limited license, the Company has no other rights to the licensed marks. The trademark license agreement may be terminated by FS Investments or the Company on sixty days’ prior written notice and expires if FB Advisor or one of FS Investments’ affiliates ceases to serve as investment adviser to the Company. Furthermore, FS Investments may terminate the trademark license agreement at any time and in its sole discretion in the event that FS Investments or the Company receives notice of any third-party claim arising out of the Company’s use of the licensed marks or if the Company attempts to assign or sublicense the trademark license agreement or any of the Company’s rights or duties under the trademark license agreement without the prior written consent of FS Investments. FB Advisor is a third-party beneficiary of the trademark license agreement.
Note 5. Distributions
The following table reflects the cash distributions per share that the Company has declared on its common stock during the years ended December 31, 2017, 2016 and 2015:
| Distribution | ||||||||
| For the Year Ended December 31, |
Per Share | Amount | ||||||
| 2015 |
$ | 0.89100 | $ | 215,606 | ||||
| 2016 |
$ | 0.89100 | $ | 216,933 | ||||
| 2017 |
$ | 0.85825 | $ | 210,549 | ||||
On February 21, 2018, the Company’s board of directors declared a regular quarterly cash distribution of $0.19 per share, which will be paid on or about April 3, 2018 to stockholders of record as of the close of business on March 21, 2018. The timing and amount of any future distributions to stockholders are subject to applicable legal restrictions and the sole discretion of the Company’s board of directors.
Pursuant to the DRP, the Company will reinvest all cash dividends or distributions declared by the Company’s board of directors on behalf of stockholders who do not elect to receive their distributions in cash. As a result, if the Company’s board of directors declares a distribution, then stockholders who have not elected to “opt out” of the DRP will have their distributions automatically reinvested in additional shares of the Company’s common stock.
With respect to each distribution pursuant to the DRP, the Company reserves the right to either issue new shares of common stock or purchase shares of common stock in the open market in connection with implementation of the DRP. Unless the Company, in its sole discretion, otherwise directs the plan administrator, (A) if the per share market price (as defined in the DRP) is equal to or greater than the estimated net asset value per share (rounded up to the nearest whole cent) of the Company’s common stock on the payment date for the distribution, then the Company will issue shares of common stock at the greater of (i) net asset value per share of common stock or (ii) 95% of the market price; or (B) if the market price is less than the net asset value per share, then, in the sole discretion of the Company, (i) shares of common stock will be purchased in open market transactions for the accounts of participants to the extent practicable, or (ii) the Company will issue shares of common stock at net asset value per share. Pursuant to the terms of the DRP, the number of shares of common stock to be issued to a participant will be determined by dividing the total dollar amount of the distribution payable to a participant by the price per share at which the Company issues such shares; provided, however, that
125
Table of Contents
FS Investment Corporation
Notes to Consolidated Financial Statements (continued)
(in thousands, except share and per share amounts)
Note 5. Distributions (continued)
shares purchased in open market transactions by the plan administrator will be allocated to a participant based on the average purchase price, excluding any brokerage charges or other charges, of all shares of common stock purchased in the open market.
If a stockholder receives distributions in the form of common stock pursuant to the DRP, such stockholder generally will be subject to the same federal, state and local tax consequences as if it elected to receive distributions in cash. If the Company’s common stock is trading at or below net asset value, a stockholder receiving distributions in the form of additional common stock will be treated as receiving a distribution in the amount of cash that they would have received if they had elected to receive the distribution in cash. If the Company’s common stock is trading above net asset value, a stockholder receiving distributions in the form of additional common stock will be treated as receiving a distribution in the amount of the fair market value of the Company’s common stock. The stockholder’s basis for determining gain or loss upon the sale of common stock received in a distribution will be equal to the total dollar amount of the distribution payable to the stockholder. Any stock received in a distribution will have a holding period for tax purposes commencing on the day following the day on which the shares of common stock are credited to the stockholder’s account.
The Company may fund its cash distributions to stockholders from any sources of funds legally available to it, including proceeds from the sale of shares of the Company’s common stock, borrowings, net investment income from operations, capital gains proceeds from the sale of assets, non-capital gains proceeds from the sale of assets, and dividends or other distributions paid to the Company on account of preferred and common equity investments in portfolio companies. The Company has not established limits on the amount of funds it may use from available sources to make distributions. During certain periods, the Company’s distributions may exceed its earnings. As a result, it is possible that a portion of the distributions the Company makes may represent a return of capital. A return of capital generally is a return of a stockholder’s investment rather than a return of earnings or gains derived from the Company’s investment activities. Each year a statement on Form 1099-DIV identifying the sources of the distributions (i.e., paid from ordinary income, paid from net capital gains on the sale of securities, and/or a return of capital, which is a nontaxable distribution) will be mailed to the Company’s stockholders. There can be no assurance that the Company will be able to pay distributions at a specific rate or at all.
126
Table of Contents
FS Investment Corporation
Notes to Consolidated Financial Statements (continued)
(in thousands, except share and per share amounts)
Note 5. Distributions (continued)
The following table reflects the sources of the cash distributions on a tax basis that the Company has paid on its common stock during the years ended December 31, 2017, 2016 and 2015:
| Year Ended December 31, | ||||||||||||||||||||||||
| 2017 | 2016 | 2015 | ||||||||||||||||||||||
| Source of Distribution |
Distribution Amount |
Percentage | Distribution Amount |
Percentage | Distribution Amount |
Percentage | ||||||||||||||||||
| Offering proceeds |
$ | — | — | $ | — | — | $ | — | — | |||||||||||||||
| Borrowings |
— | — | — | — | — | — | ||||||||||||||||||
| Net investment income(1) |
210,549 | 100 | % | 216,933 | 100 | % | 181,509 | 84 | % | |||||||||||||||
| Short-term capital gains proceeds from the sale of assets |
— | — | — | — | — | — | ||||||||||||||||||
| Long-term capital gains proceeds from the sale of assets |
— | — | — | — | 34,097 | 16 | % | |||||||||||||||||
| Non-capital gains proceeds from the sale of assets |
— | — | — | — | — | — | ||||||||||||||||||
| Distributions on account of preferred and common equity |
— | — | — | — | — | — | ||||||||||||||||||
|
|
|
|
|
|
|
|
|
|
|
|
|
|||||||||||||
| Total |
$ | 210,549 | 100 | % | $ | 216,933 | 100 | % | $ | 215,606 | 100 | % | ||||||||||||
|
|
|
|
|
|
|
|
|
|
|
|
|
|||||||||||||
| (1) | During the years ended December 31, 2017, 2016 and 2015, 89.0%, 90.4% and 92.7%, respectively, of the Company’s gross investment income was attributable to cash income earned, 1.2%, 1.8% and 2.3%, respectively, was attributable to non-cash accretion of discount and 9.8%, 7.8% and 5.0%, respectively, was attributable to paid-in-kind, or PIK, interest. |
The Company’s net investment income on a tax basis for the years ended December 31, 2017, 2016 and 2015 was $206,286, $212,274 and $220,039, respectively. As of December 31, 2017, 2016 and 2015, the Company had $146,647, $153,590 and $158,249, respectively, of undistributed net investment income and $195,140, $73,184 and $35,010, respectively, of accumulated capital losses on a tax basis.
The Company’s undistributed net investment income on a tax basis as of December 31, 2016 was adjusted following the filing of the Company’s 2016 tax return in September 2017. The adjustment was primarily due to tax-basis income received by the Company during the year ended December 31, 2016 exceeding GAAP-basis income on account of certain collateralized securities and interests in partnerships, and the reclassification of realized gains and losses upon the sale of certain collateralized securities held in its investment portfolio during such period. The tax notices for such collateralized securities and interests in partnerships were received by the Company subsequent to the filing of the Company’s annual report on Form 10-K for the year ended December 31, 2016.
The difference between the Company’s GAAP-basis net investment income and its tax-basis net investment income is primarily due to the reclassification of unamortized original issue discount and prepayment fees recognized upon prepayment of loans from income for GAAP purposes to realized gains or deferred to future periods for tax purposes, the impact of consolidating certain subsidiaries for purposes of computing GAAP-basis net investment income but not for purposes of computing tax-basis net investment income, the reversal of non-deductible excise taxes and income recognized for tax purposes on certain transactions but not recognized for GAAP purposes.
127
Table of Contents
FS Investment Corporation
Notes to Consolidated Financial Statements (continued)
(in thousands, except share and per share amounts)
Note 5. Distributions (continued)
The following table sets forth a reconciliation between GAAP-basis net investment income and tax-basis net investment income during the years ended December 31, 2017, 2016 and 2015:
| Year Ended December 31, | ||||||||||||
| 2017 | 2016 | 2015 | ||||||||||
| GAAP-basis net investment income |
$ | 203,759 | $ | 207,323 | $ | 265,090 | ||||||
| Reversal of incentive fee accrual on unrealized gains |
— | — | (21,075 | ) | ||||||||
| Income subject to tax not recorded for GAAP |
(770 | ) | 4,922 | 804 | ||||||||
| Excise taxes |
5,259 | 5,554 | 6,056 | |||||||||
| GAAP versus tax-basis impact of consolidation of certain subsidiaries |
12,181 | 9,009 | 4,852 | |||||||||
| Reclassification of unamortized original issue discount and prepayment fees |
(14,347 | ) | (14,821 | ) | (35,005 | ) | ||||||
| Other miscellaneous differences |
204 | 287 | (683 | ) | ||||||||
|
|
|
|
|
|
|
|||||||
| Tax-basis net investment income |
$ | 206,286 | $ | 212,274 | $ | 220,039 | ||||||
|
|
|
|
|
|
|
|||||||
The Company may make certain adjustments to the classification of stockholders’ equity as a result of permanent book-to-tax differences. During the year ended December 31, 2017, the Company increased accumulated undistributed net realized gains on investments and gain/loss on foreign currency and accumulated undistributed (distributions in excess of) net investment income by $1,529 and $2,826, respectively, and decreased capital in excess of par value by $4,355. During the year ended December 31, 2016, the Company increased accumulated undistributed net realized gains on investments and gain/loss on foreign currency and accumulated undistributed (distributions in excess of) net investment income by $4,705 and $9,690, respectively, and decreased capital in excess of par value by $14,395, respectively. During the year ended December 31, 2015, the Company increased accumulated undistributed net realized gains on investments and gain/loss on foreign currency by $17,657 and decreased capital in excess of par value and accumulated undistributed (distributions in excess of) net investment income by $13,364 and $4,293, respectively.
The determination of the tax attributes of the Company’s distributions is made annually as of the end of the Company’s fiscal year based upon the Company’s taxable income for the full year and distributions paid for the full year. The actual tax characteristics of distributions to stockholders are reported to stockholders annually on Form 1099-DIV.
As of December 31, 2017 and 2016, the components of accumulated earnings on a tax basis were as follows:
| Year Ended December 31, | ||||||||
| 2017 | 2016 | |||||||
| Distributable ordinary income |
$ | 146,647 | $ | 150,910 | ||||
| Distributable realized gains (accumulated capital losses)(1) |
(195,140 | ) | (73,555 | ) | ||||
| Other temporary differences |
(257 | ) | 3,580 | |||||
| Net unrealized appreciation (depreciation) on investments and secured borrowing and gain/loss on foreign currency(2) |
60,636 | (44,842 | ) | |||||
|
|
|
|
|
|||||
| Total |
$ | 11,886 | $ | 36,093 | ||||
|
|
|
|
|
|||||
128
Table of Contents
FS Investment Corporation
Notes to Consolidated Financial Statements (continued)
(in thousands, except share and per share amounts)
Note 5. Distributions (continued)
| (1) | Under the Regulated Investment Company Modernization Act of 2010, net capital losses recognized for tax years beginning after December 22, 2010, may be carried forward indefinitely, and their character is retained as short-term or long-term losses. As of December 31, 2017, the Company had short-term and long-term capital loss carryforwards available to offset future realized capital gains of $27,890 and $167,250, respectively. |
| (2) | As of December 31, 2017 and 2016, the gross unrealized appreciation on the Company’s investments and secured borrowing and gain on foreign currency was $259,416 and $226,121, respectively. As of December 31, 2017 and 2016, the gross unrealized depreciation on the Company’s investments and secured borrowing and loss on foreign currency was $198,780 and $270,134, respectively. |
The aggregate cost of the Company’s investments for U.S. federal income tax purposes totaled $3,869,322 and $3,780,294 as of December 31, 2017 and 2016, respectively. The aggregate net unrealized appreciation (depreciation) on a tax basis was $56,912 and $(53,478) as of December 31, 2017 and 2016, respectively.
As of December 31, 2017, the Company had a deferred tax liability of $6,538 resulting from unrealized appreciation on investments held by the Company’s wholly-owned taxable subsidiaries and a deferred tax asset of $13,161 resulting from net operating losses of the Company’s wholly-owned taxable subsidiaries. As of December 31, 2017, certain wholly-owned taxable subsidiaries anticipated that they would be unable to fully utilize their generated net operating losses, therefore the deferred tax asset was offset by a valuation allowance of $6,623. For the year ended December 31, 2017, the Company did not record a provision for taxes related to wholly-owned taxable subsidiaries.
Note 6. Investment Portfolio
The following table summarizes the composition of the Company’s investment portfolio at cost and fair value as of December 31, 2017 and 2016:
| December 31, 2017 | December 31, 2016 | |||||||||||||||||||||||
| Amortized Cost(1) |
Fair Value | Percentage of Portfolio |
Amortized Cost(1) |
Fair Value | Percentage of Portfolio |
|||||||||||||||||||
| Senior Secured Loans—First Lien |
$ | 2,501,103 | $ | 2,520,994 | 64 | % | $ | 1,992,159 | $ | 1,935,441 | 52 | % | ||||||||||||
| Senior Secured Loans—Second Lien |
222,232 | 197,588 | 5 | % | 619,892 | 599,155 | 16 | % | ||||||||||||||||
| Senior Secured Bonds |
157,699 | 161,650 | 4 | % | 205,657 | 159,470 | 4 | % | ||||||||||||||||
| Subordinated Debt |
500,626 | 489,761 | 13 | % | 498,080 | 454,045 | 12 | % | ||||||||||||||||
| Collateralized Securities |
47,471 | 54,319 | 1 | % | 59,225 | 72,058 | 2 | % | ||||||||||||||||
| Equity/Other |
387,715 | 501,922 | 13 | % | 368,927 | 506,647 | 14 | % | ||||||||||||||||
|
|
|
|
|
|
|
|
|
|
|
|
|
|||||||||||||
| Total |
$ | 3,816,846 | $ | 3,926,234 | 100 | % | $ | 3,743,940 | $ | 3,726,816 | 100 | % | ||||||||||||
|
|
|
|
|
|
|
|
|
|
|
|
|
|||||||||||||
| (1) | Amortized cost represents the original cost adjusted for the amortization of premiums and/or accretion of discounts, as applicable, on investments. |
In general, under the 1940 Act, the Company would be presumed to “control” a portfolio company if it owned more than 25% of its voting securities or it had the power to exercise control over the management or policies of such portfolio company, and would be an “affiliated person” of a portfolio company if it owned 5% or more of its voting securities.
As of December 31, 2017, the Company held investments in one portfolio company of which it is deemed to “control.” As of December 31, 2017, the Company held investments in six portfolio companies of which it is
129
Table of Contents
FS Investment Corporation
Notes to Consolidated Financial Statements (continued)
(in thousands, except share and per share amounts)
Note 6. Investment Portfolio (continued)
deemed to be an “affiliated person” but is not deemed to “control.” For additional information with respect to such portfolio companies, see footnotes (t) and (u) to the consolidated schedule of investments as of December 31, 2017.
As of December 31, 2016, the Company held investments in one portfolio company of which it is deemed to “control.” As of December 31, 2016, the Company held investments in three portfolio companies of which it is deemed to be an “affiliated person” but is not deemed to “control.” For additional information with respect to such portfolio companies, see footnotes (t) and (u) to the consolidated schedule of investments as of December 31, 2016.
The Company’s investment portfolio may contain loans and other unfunded arrangements that are in the form of lines of credit, revolving credit facilities, delayed draw credit facilities or other investments, which require the Company to provide funding when requested by portfolio companies in accordance with the terms of the underlying agreements. As of December 31, 2017, the Company had twenty unfunded debt investments with aggregate unfunded commitments of $154,074, one unfunded commitment to purchase up to $295 in shares of preferred stock of Altus Power America Holdings, LLC and one unfunded commitment to purchase up to $4 in shares of common stock of Chisholm Oil and Gas, LLC. As of December 31, 2016, the Company had seventeen unfunded debt investments with aggregate unfunded commitments of $186,233 and one unfunded commitment to purchase up to $362 in shares of preferred stock of Altus Power America Holdings, LLC. The Company maintains sufficient cash on hand and available borrowings to fund such unfunded commitments should the need arise. For additional details regarding the Company’s unfunded debt investments, see the Company’s consolidated schedule of investments as of December 31, 2017 and 2016.
130
Table of Contents
FS Investment Corporation
Notes to Consolidated Financial Statements (continued)
(in thousands, except share and per share amounts)
Note 6. Investment Portfolio (continued)
The table below describes investments by industry classification and enumerates the percentage, by fair value, of the total portfolio assets in such industries as of December 31, 2017 and 2016:
| December 31, 2017 | December 31, 2016 | |||||||||||||||
| Industry Classification |
Fair Value |
Percentage
of Portfolio |
Fair Value |
Percentage
of Portfolio |
||||||||||||
| Automobiles & Components |
$ | 13,579 | 0 | % | $ | 27,525 | 1 | % | ||||||||
| Capital Goods |
1,053,614 | 27 | % | 708,946 | 19 | % | ||||||||||
| Commercial & Professional Services |
560,414 | 14 | % | 514,682 | 14 | % | ||||||||||
| Consumer Durables & Apparel |
173,855 | 4 | % | 198,752 | 5 | % | ||||||||||
| Consumer Services |
265,220 | 7 | % | 343,211 | 9 | % | ||||||||||
| Diversified Financials |
140,249 | 4 | % | 184,355 | 5 | % | ||||||||||
| Energy |
257,841 | 7 | % | 432,047 | 12 | % | ||||||||||
| Food, Beverage & Tobacco |
69,979 | 2 | % | — | — | |||||||||||
| Health Care Equipment & Services |
239,916 | 6 | % | 199,064 | 5 | % | ||||||||||
| Materials |
370,740 | 10 | % | 263,849 | 7 | % | ||||||||||
| Media |
128,335 | 3 | % | 113,455 | 3 | % | ||||||||||
| Retailing |
174,289 | 4 | % | 110,262 | 3 | % | ||||||||||
| Semiconductors & Semiconductor Equipment |
6,490 | 0 | % | 5,328 | 0 | % | ||||||||||
| Software & Services |
205,052 | 5 | % | 265,501 | 7 | % | ||||||||||
| Technology Hardware & Equipment |
34,000 | 1 | % | 108,500 | 3 | % | ||||||||||
| Telecommunication Services |
164,864 | 4 | % | 161,544 | 4 | % | ||||||||||
| Transportation |
67,797 | 2 | % | 89,795 | 3 | % | ||||||||||
|
|
|
|
|
|
|
|
|
|||||||||
| Total |
$ | 3,926,234 | 100 | % | $ | 3,726,816 | 100 | % | ||||||||
|
|
|
|
|
|
|
|
|
|||||||||
Note 7. Fair Value of Financial Instruments
Under existing accounting guidance, fair value is defined as the price that the Company would receive upon selling an investment or pay to transfer a liability in an orderly transaction to a market participant in the principal or most advantageous market for the investment. This accounting guidance emphasizes valuation techniques that maximize the use of observable market inputs and minimize the use of unobservable inputs. Inputs refer broadly to the assumptions that market participants would use in pricing an asset or liability, including assumptions about risk. Inputs may be observable or unobservable. Observable inputs are inputs that reflect the assumptions market participants would use in pricing an asset or liability developed based on market data obtained from sources independent of the Company. Unobservable inputs are inputs that reflect the assumptions market participants would use in pricing an asset or liability developed based on the best information available in the circumstances. The Company classifies the inputs used to measure these fair values into the following hierarchy as defined by current accounting guidance:
Level 1: Inputs that are quoted prices (unadjusted) in active markets for identical assets or liabilities.
Level 2: Inputs that are quoted prices for similar assets or liabilities in active markets.
Level 3: Inputs that are unobservable for an asset or liability.
A financial instrument’s categorization within the valuation hierarchy is based upon the lowest level of input that is significant to the fair value measurement.
131
Table of Contents
FS Investment Corporation
Notes to Consolidated Financial Statements (continued)
(in thousands, except share and per share amounts)
Note 7. Fair Value of Financial Instruments (continued)
As of December 31, 2017 and 2016, the Company’s investments and secured borrowing were categorized as follows in the fair value hierarchy:
| December 31, 2017 | December 31, 2016 | |||||||||||||||
| Valuation Inputs |
Investments | Secured Borrowing |
Investments | Secured Borrowing |
||||||||||||
| Level 1—Price quotations in active markets |
$ | 9,445 | — | $ | 6,326 | $ | — | |||||||||
| Level 2—Significant other observable inputs |
— | — | — | — | ||||||||||||
| Level 3—Significant unobservable inputs |
3,916,789 | — | 3,720,490 | (2,880 | ) | |||||||||||
|
|
|
|
|
|
|
|
|
|||||||||
| $ | 3,926,234 | — | $ | 3,726,816 | $ | (2,880 | ) | |||||||||
|
|
|
|
|
|
|
|
|
|||||||||
The Company has elected the fair value option under ASC Topic 825, Financial Instruments, relating to accounting for debt obligations at their fair value for its secured borrowings which arose due to partial loan sales which did not meet the criteria for sale treatment under ASC Topic 860. The Company reports changes in the fair value of its secured borrowing as a component of the net change in unrealized appreciation (depreciation) on secured borrowing in the consolidated statements of operations. The net gain or loss reflects the difference between the fair value and the principal amount due on maturity.
The secured borrowing as of December 31, 2016 was valued using Level 3 inputs under the fair value hierarchy. The Company’s approach to determining fair value of the Level 3 secured borrowing was consistent with its approach to determining fair value of the Level 3 investments that were associated with the secured borrowing. See Note 2 and Note 8 for additional information regarding the Company’s secured borrowing.
The Company’s investments consist primarily of debt investments that were acquired directly from the issuer. Debt investments, for which broker quotes are not available, are valued by independent valuation firms, which determine the fair value of such investments by considering, among other factors, the borrower’s ability to adequately service its debt, prevailing interest rates for like investments, expected cash flows, call features, anticipated repayments and other relevant terms of the investments. Except as described below, all of the Company’s equity/other investments are also valued by independent valuation firms, which determine the fair value of such investments by considering, among other factors, contractual rights ascribed to such investments, as well as various income scenarios and multiples of EBITDA, cash flows, net income, revenues or, in limited instances, book value or liquidation value. An investment that is newly issued and purchased near the date of the financial statements is valued at cost if the Company’s board of directors determines that the cost of such investment is the best indication of its fair value. Investments that are traded on an active public market are valued at their closing price as of the date of the financial statements. Except as described above, the Company values its other investments by using the midpoint of the prevailing bid and ask prices from dealers on the date of the relevant period end, which are provided by independent third-party pricing services and screened for validity by such services.
The Company periodically benchmarks the bid and ask prices it receives from the third-party pricing services and/or dealers, as applicable, against the actual prices at which the Company purchases and sells its investments. Based on the results of the benchmark analysis and the experience of the Company’s management in purchasing and selling these investments, the Company believes that these prices are reliable indicators of fair value. However, because of the private nature of this marketplace (meaning actual transactions are not publicly reported), the Company believes that these valuation inputs are classified as Level 3 within the fair value hierarchy. The Company may also use other methods, including the use of an independent valuation firm, to determine fair value for securities for which it cannot obtain prevailing bid and ask prices through third-party
132
Table of Contents
FS Investment Corporation
Notes to Consolidated Financial Statements (continued)
(in thousands, except share and per share amounts)
Note 7. Fair Value of Financial Instruments (continued)
pricing services or independent dealers, or where the Company’s board of directors otherwise determines that the use of such other methods is appropriate. The Company periodically benchmarks the valuations provided by the independent valuation firms against the actual prices at which the Company purchases and sells its investments. The valuation committee of the Company’s board of directors and the board of directors, reviewed and approved the valuation determinations made with respect to these investments in a manner consistent with the Company’s valuation policy.
The following is a reconciliation for the years ended December 31, 2017 and 2016 of investments for which significant unobservable inputs (Level 3) were used in determining fair value:
| For the Year Ended December 31, 2017 | ||||||||||||||||||||||||||||
| Senior
Secured Loans—First Lien |
Senior
Secured Loans—Second Lien |
Senior Secured Bonds |
Subordinated Debt |
Collateralized Securities |
Equity/ Other |
Total | ||||||||||||||||||||||
| Fair value at beginning of period |
$ | 1,935,441 | $ | 599,155 | $ | 159,470 | $ | 454,045 | $ | 72,058 | $ | 500,321 | $ | 3,720,490 | ||||||||||||||
| Accretion of discount (amortization of premium) |
1,715 | 8,758 | 631 | 14,264 | 8 | 2 | 25,378 | |||||||||||||||||||||
| Net realized gain (loss) |
(56,390 | ) | (23,684 | ) | (43,564 | ) | (14,397 | ) | (379 | ) | (4,355 | ) | (142,769 | ) | ||||||||||||||
| Net change in unrealized appreciation (depreciation) |
76,609 | (3,907 | ) | 50,138 | 33,170 | (5,985 | ) | (21,890 | ) | 128,135 | ||||||||||||||||||
| Purchases |
954,681 | 77,269 | 86,049 | 118,937 | 409 | 42,230 | 1,279,575 | |||||||||||||||||||||
| Paid-in-kind interest |
2,596 | 2,942 | 27 | 28,291 | — | 7,122 | 40,978 | |||||||||||||||||||||
| Sales and repayments |
(393,658 | ) | (462,945 | ) | (91,101 | ) | (144,549 | ) | (11,792 | ) | (30,953 | ) | (1,134,998 | ) | ||||||||||||||
| Net transfers in or out of Level 3 |
— | — | — | — | — | — | — | |||||||||||||||||||||
|
|
|
|
|
|
|
|
|
|
|
|
|
|
|
|||||||||||||||
| Fair value at end of period |
$ | 2,520,994 | $ | 197,588 | $ | 161,650 | $ | 489,761 | $ | 54,319 | $ | 492,477 | $ | 3,916,789 | ||||||||||||||
|
|
|
|
|
|
|
|
|
|
|
|
|
|
|
|||||||||||||||
| The amount of total gains or losses for the period included in changes in net assets attributable to the change in unrealized gains or losses relating to investments still held at the reporting date |
$ | 23,533 | $ | (17,408 | ) | $ | 3,045 | $ | 19,233 | $ | (2,716 | ) | $ | (15,273 | ) | $ | 10,414 | |||||||||||
|
|
|
|
|
|
|
|
|
|
|
|
|
|
|
|||||||||||||||
133
Table of Contents
FS Investment Corporation
Notes to Consolidated Financial Statements (continued)
(in thousands, except share and per share amounts)
Note 7. Fair Value of Financial Instruments (continued)
| For the Year Ended December 31, 2016 | ||||||||||||||||||||||||||||
| Senior
Secured Loans—First Lien |
Senior
Secured Loans—Second Lien |
Senior Secured Bonds |
Subordinated Debt |
Collateralized Securities |
Equity/ Other |
Total | ||||||||||||||||||||||
| Fair value at beginning of period |
$ | 2,173,829 | $ | 624,814 | $ | 240,754 | $ | 438,414 | $ | 85,007 | $ | 465,769 | $ | 4,028,587 | ||||||||||||||
| Accretion of discount (amortization of premium) |
2,680 | 2,752 | 2,633 | 1,619 | 38 | 427 | 10,149 | |||||||||||||||||||||
| Net realized gain (loss) |
13,090 | 242 | (82,669 | ) | (441 | ) | 839 | 5,378 | (63,561 | ) | ||||||||||||||||||
| Net change in unrealized appreciation (depreciation) |
17,872 | 16,191 | 57,255 | 10,209 | 22,520 | 25,185 | 149,232 | |||||||||||||||||||||
| Purchases |
896,207 | 52,526 | 13,189 | 67,563 | 4,575 | 119,096 | 1,153,156 | |||||||||||||||||||||
| Paid-in-kind interest |
4,733 | 7,235 | — | 18,655 | — | 2,214 | 32,837 | |||||||||||||||||||||
| Sales and repayments |
(1,172,970 | ) | (104,605 | ) | (71,692 | ) | (81,974 | ) | (40,921 | ) | (116,336 | ) | (1,588,498 | ) | ||||||||||||||
| Net transfers in or out of Level 3(1) |
— | — | — | — | — | (1,412 | ) | (1,412 | ) | |||||||||||||||||||
|
|
|
|
|
|
|
|
|
|
|
|
|
|
|
|||||||||||||||
| Fair value at end of period |
$ | 1,935,441 | $ | 599,155 | $ | 159,470 | $ | 454,045 | $ | 72,058 | $ | 500,321 | $ | 3,720,490 | ||||||||||||||
|
|
|
|
|
|
|
|
|
|
|
|
|
|
|
|||||||||||||||
| The amount of total gains or losses for the period included in changes in net assets attributable to the change in unrealized gains or losses relating to investments still held at the reporting date |
$ | 44,825 | $ | 10,428 | $ | 16,217 | $ | 4,734 | $ | 13,350 | $ | 37,005 | $ | 126,559 | ||||||||||||||
|
|
|
|
|
|
|
|
|
|
|
|
|
|
|
|||||||||||||||
| (1) | There was one transfer of an investment from Level 3 to Level 1 during the year ended December 31, 2016. It is the Company’s policy to recognize transfers between levels at the beginning of the reporting period. |
134
Table of Contents
FS Investment Corporation
Notes to Consolidated Financial Statements (continued)
(in thousands, except share and per share amounts)
Note 7. Fair Value of Financial Instruments (continued)
The following is a reconciliation for the years ended December 31, 2017 and 2016 of the secured borrowing for which significant unobservable inputs (Level 3) were used in determining fair value:
| Secured Borrowing | ||||||||
| For the Year Ended December 31, |
||||||||
| 2017 | 2016 | |||||||
| Fair value at beginning of period |
$ | (2,880 | ) | $ | — | |||
| Amortization of premium (accretion of discount) |
(5 | ) | (2 | ) | ||||
| Net realized gain (loss) |
(21 | ) | — | |||||
| Net change in unrealized appreciation (depreciation) |
49 | (49 | ) | |||||
| Repayments on secured borrowing |
2,857 | — | ||||||
| Paid-in-kind interest |
— | — | ||||||
| Proceeds from secured borrowing |
— | (2,829 | ) | |||||
| Net transfers in or out of Level 3 |
— | — | ||||||
|
|
|
|
|
|||||
| Fair value at end of period |
$ | — | $ | (2,880 | ) | |||
|
|
|
|
|
|||||
| The amount of total gains or losses for the period included in changes in net assets attributable to the change in unrealized gains or losses relating to investments still held at the reporting date |
$ | — | $ | (49 | ) | |||
|
|
|
|
|
|||||
135
Table of Contents
FS Investment Corporation
Notes to Consolidated Financial Statements (continued)
(in thousands, except share and per share amounts)
Note 7. Fair Value of Financial Instruments (continued)
The valuation techniques and significant unobservable inputs used in recurring Level 3 fair value measurements as of December 31, 2017 and 2016 were as follows:
| Type of Investment |
Fair Value at December 31, 2017 |
Valuation Technique(1) |
Unobservable Input |
Range |
Weighted Average |
|||||||||
| Senior Secured Loans—First Lien |
$ | 2,355,454 | Market Comparables | Market Yield (%) | 6.2% - 14.0% | 9.8% | ||||||||
| EBITDA Multiples (x) | 5.0x - 8.0x | 7.2x | ||||||||||||
| 52,295 | Other(2) | Other(2) | N/A | N/A | ||||||||||
| 113,245 | Market Quotes | Indicative Dealer Quotes | 85.5% - 102.8% | 99.4% | ||||||||||
| Senior Secured Loans—Second Lien |
84,727 | Market Comparables | Market Yield (%) | 8.3% - 20.7% | 11.3% | |||||||||
| EBITDA Multiples (x) | 5.0x - 6.0x | 5.5x | ||||||||||||
| 112,861 | Market Quotes | Indicative Dealer Quotes | 50.5% - 102.3% | 93.7% | ||||||||||
| Senior Secured Bonds |
112,534 | Market Comparables | Market Yield (%) | 7.7% - 12.3% | 8.6% | |||||||||
| EBITDA Multiples (x) | 4.8x - 8.0x | 7.7x | ||||||||||||
| Production Multiples (Mboe/d) | $42,250.0 - $44,750.0 | $43,500.0 | ||||||||||||
| Proved Reserves Multiples (Mmboe) | $10.3 - $11.3 | $10.8 | ||||||||||||
| PV-10 Multiples (x) | 0.8x - 0.8x | 0.8x | ||||||||||||
| 29,218 | Other(2) | Other(2) | N/A | N/A | ||||||||||
| 19,898 | Market Quotes | Indicative Dealer Quotes | 99.5% - 100.5% | 100.0% | ||||||||||
| Subordinated Debt |
357,169 | Market Comparables | Market Yield (%) | 7.8% - 16.8% | 14.5% | |||||||||
| EBITDA Multiples (x) | 9.0x - 11.0x | 9.5x | ||||||||||||
| 132,592 | Market Quotes | Indicative Dealer Quotes | 50.0% - 108.5% | 99.4% | ||||||||||
| Collateralized Securities |
54,319 | Market Quotes | Indicative Dealer Quotes | 6.6% - 100.2% | 65.8% | |||||||||
| Equity/Other |
448,949 | Market Comparables | Market Yield (%) | 15.3% - 15.8% | 15.5% | |||||||||
| Capacity Multiple ($/kW) | $2,000.0 - $2,250.0 | $2,125.0 | ||||||||||||
| EBITDA Multiples (x) | 4.8x - 23.5x | 8.3x | ||||||||||||
| Production Multiples (Mboe/d) | $32,500.0 - $44,750.0 | $34,191.4 | ||||||||||||
| Production Multiples (MMcfe/d) | $5,000.0 - $5,500.0 | $5,250.0 | ||||||||||||
| Proved Reserves Multiples (Bcfe) | $1.8 - $2.0 | $1.9 | ||||||||||||
| Proved Reserves Multiples (Mmboe) | $8.3 - $11.3 | $8.6 | ||||||||||||
| PV-10 Multiples (x) | 0.8x - 2.6x | 2.3x | ||||||||||||
| Discounted Cash Flow | Discount Rate (%) | 11.0% - 13.0% | 12.0% | |||||||||||
| Option Valuation Model | Volatility (%) | 30.0% - 36.5% | 35.3% | |||||||||||
| 43,528 | Other(2) | Other(2) | N/A | N/A | ||||||||||
|
|
|
|||||||||||||
| Total |
$ | 3,916,789 | ||||||||||||
|
|
|
|||||||||||||
| (1) | Investments using a market quotes valuation technique were valued by using the midpoint of the prevailing bid and ask prices from dealers on the date of the relevant period end, which were provided by independent third-party pricing services and screened for validity by such services. For investments utilizing a market comparables valuation technique, a significant increase (decrease) in the market yield, in isolation, would result in a significantly lower (higher) fair value measurement, and a significant increase (decrease) in any of the valuation multiples, in isolation, would result in a significantly higher (lower) fair value measurement. For investments utilizing a discounted cash flow valuation technique, a significant increase (decrease) in the discount rate, in isolation, would result in a significantly lower (higher) fair value measurement. For investments utilizing an option valuation model valuation technique, a significant increase (decrease) in the volatility, in isolation, would result in a significantly higher (lower) fair value measurement. |
| (2) | Fair value based on expected outcome of proposed corporate transactions and/or other factors. |
136
Table of Contents
FS Investment Corporation
Notes to Consolidated Financial Statements (continued)
(in thousands, except share and per share amounts)
Note 7. Fair Value of Financial Instruments (continued)
| Type of Investment |
Fair Value
at December 31, 2016 |
Valuation Technique(1) |
Unobservable Input |
Range |
Weighted Average | |||||||
| Senior Secured Loans—First Lien |
$ | 1,575,465 | Market Comparables | Market Yield (%) | 5.5% - 17.3% | 10.0% | ||||||
| 93,703 | Other(2) | Other(2) | N/A | N/A | ||||||||
| 203,773 | Market Quotes | Indicative Dealer Quotes | 18.2% - 104.1% | 99.6% | ||||||||
| 62,500 | Cost | Cost | 100.0% - 100.0% | 100.0% | ||||||||
| Senior Secured Loans—Second Lien |
458,403 | Market Comparables | Market Yield (%) | 8.8% - 26.0% | 12.4% | |||||||
| 140,752 | Market Quotes | Indicative Dealer Quotes | 8.8% - 101.0% | 93.3% | ||||||||
| Senior Secured Bonds |
109,936 | Market Comparables | Market Yield (%) | 7.5% - 9.0% | 7.8% | |||||||
| EBITDA Multiples (x) | 6.3x - 7.3x | 6.5x | ||||||||||
| Production Multiples (Mboe/d) | $45,000.0 - $50,000.0 | $47,500.0 | ||||||||||
| Proved Reserves Multiples (Mmboe) | $14.5 - $15.0 | $14.8 | ||||||||||
| PV-10 Multiples (x) | 0.8x - 0.9x | 0.9x | ||||||||||
| 49,534 | Market Quotes | Indicative Dealer Quotes | 76.0% - 109.6% | 98.5% | ||||||||
| Subordinated Debt |
321,853 | Market Comparables | Market Yield (%) | 8.0% - 15.3% | 13.0% | |||||||
| EBITDA Multiples (x) | 7.3x - 10.3x | 8.7x | ||||||||||
| 132,192 | Market Quotes | Indicative Dealer Quotes | 60.8% - 125.5% | 89.0% | ||||||||
| Collateralized Securities |
72,058 | Market Quotes | Indicative Dealer Quotes | 11.1% - 94.3% | 72.7% | |||||||
| Equity/Other |
453,246 | Market Comparables | EBITDA Multiples (x) | 4.5x - 16.3x | 8.8x | |||||||
| Production Multiples (Mboe/d) | $2,225.0 - $50,000.0 | $42,391.6 | ||||||||||
| Proved Reserves Multiples (Mmboe) | $0.7 - $15.0 | $8.8 | ||||||||||
| Undeveloped Acreage Multiples ($/Acre) | $8,000.0 - $10,000.0 | $9,000.0 | ||||||||||
| Capacity Multiple ($/kW) | $2,375.0 - $2,875.0 | $2,625.0 | ||||||||||
| Discounted Cash Flow | Discount Rate (%) | 11.0% - 24.8% | 19.9% | |||||||||
| Option Valuation Model | Volatility (%) | 34.5% - 41.0% | 39.5% | |||||||||
| 47,075 | Other(2) | Other(2) | N/A | N/A | ||||||||
|
|
|
|||||||||||
| Total |
$ | 3,720,490 | ||||||||||
|
|
|
|||||||||||
| Secured Borrowing |
$ | (2,880 | ) | Market Comparables | Market Yield (%) | (6.0)% - (7.1)% | (6.6)% | |||||
|
|
|
|||||||||||
| (1) | Investments using a market quotes valuation technique were valued by using the midpoint of the prevailing bid and ask prices from dealers on the date of the relevant period end, which were provided by independent third-party pricing services and screened for validity by such services. For investments utilizing a market comparables valuation technique, a significant increase (decrease) in the market yield, in isolation, would result in a significantly lower (higher) fair value measurement, and a significant increase (decrease) in any of the valuation multiples, in isolation, would result in a significantly higher (lower) fair value measurement. For investments utilizing a discounted cash flow valuation technique, a significant increase (decrease) in the discount rate, in isolation, would result in a significantly lower (higher) fair value measurement. For investments utilizing an option valuation model valuation technique, a significant increase (decrease) in the volatility, in isolation, would result in a significantly higher (lower) fair value measurement. |
| (2) | Fair value based on expected outcome of proposed corporate transactions and/or other factors. |
137
Table of Contents
FS Investment Corporation
Notes to Consolidated Financial Statements (continued)
(in thousands, except share and per share amounts)
Note 8. Financing Arrangements
The following tables present summary information with respect to the Company’s outstanding financing arrangements as of December 31, 2017 and 2016:
| As of December 31, 2017 | ||||||||||||||||||
| Arrangement |
Type of Arrangement | Rate |
Amount Outstanding |
Amount Available |
Maturity Date | |||||||||||||
| Hamilton Street Credit Facility(1) |
Revolving Credit Facility | L+2.50% | $ | 150,000 | $ | — | December 15, 2021 | |||||||||||
| ING Credit Facility(1) |
Revolving Credit Facility | L+2.25% | 66,750 | (2) | 260,750 | March 16, 2021 | ||||||||||||
| Locust Street Credit Facility(1) |
Term Loan Credit Facility | L+2.68% | 425,000 | — | November 1, 2020 | |||||||||||||
| 4.000% Notes due 2019 |
Unsecured Notes | 4.00% | 400,000 | — | July 15, 2019 | |||||||||||||
| 4.250% Notes due 2020 |
Unsecured Notes | 4.25% | 405,000 | — | January 15, 2020 | |||||||||||||
| 4.750% Notes due 2022 |
Unsecured Notes | 4.75% | 275,000 | — | May 15, 2022 | |||||||||||||
|
|
|
|
|
|||||||||||||||
| Total |
$ | 1,721,750 | $ | 260,750 | ||||||||||||||
| (1) | The carrying amount outstanding under the facility approximates its fair value. |
| (2) | Borrowings in Euros and Canadian dollars. Euro balance outstanding of €41,576 has been converted to U.S. dollars at an exchange rate of €1.00 to $1.20 as of December 31, 2017 to reflect total amount outstanding in U.S. dollars. Canadian dollar balance outstanding of CAD $20,987 has been converted to U.S. dollars at an exchange rate of CAD $1.00 to $0.80 as of December 31, 2017 to reflect total amount outstanding in U.S. dollars. |
| As of December 31, 2016 | ||||||||||||||||||
| Arrangement |
Type of Arrangement | Rate |
Amount Outstanding |
Amount Available |
Maturity Date | |||||||||||||
| Hamilton Street Credit Facility |
Revolving Credit Facility | L+2.50% | $ | 150,000 | $ | — | December 15, 2021 | |||||||||||
| ING Credit Facility |
Revolving Credit Facility | L+2.50% | 44,932 | (1) | 255,068 | April 3, 2018 | ||||||||||||
| Locust Street Credit Facility |
Term Loan Credit Facility | L+2.68% | 425,000 | — | November 1, 2020 | |||||||||||||
| 4.000% Notes due 2019 |
Unsecured Notes | 4.00% | 400,000 | — | July 15, 2019 | |||||||||||||
| 4.250% Notes due 2020 |
Unsecured Notes | 4.25% | 405,000 | — | January 15, 2020 | |||||||||||||
| 4.750% Notes due 2022 |
Unsecured Notes | 4.75% | 275,000 | — | May 15, 2022 | |||||||||||||
| Partial Loan Sale |
Secured Borrowing | L+4.50% (1% floor) | 2,857 | — | July 29, 2022 | |||||||||||||
|
|
|
|
|
|||||||||||||||
| Total |
$ | 1,702,789 | $ | 255,068 | ||||||||||||||
| (1) | Borrowings in Euros. Euro balance outstanding of €42,575 has been converted to U.S. dollars at an exchange rate of €1.00 to $1.06 as of December 31, 2016 to reflect total amount outstanding in U.S. dollars. |
138
Table of Contents
FS Investment Corporation
Notes to Consolidated Financial Statements (continued)
(in thousands, except share and per share amounts)
Note 8. Financing Arrangements (continued)
For the years ended December 31, 2017, 2016 and 2015, the components of total interest expense for the Company’s financing arrangements were as follows:
|
Arrangement(1) |
Broad Street Credit Facility |
Hamilton Street Credit Facility(2) |
ING Credit Facility(2) |
JPM Facility |
Locust Street Credit Facility |
4.000% Notes due 2019 |
4.250% Notes due 2020 |
4.75% Notes due 2022 |
Partial Loan Sale(3) |
Total | ||||||||||||||||||||||||||||||
| Fiscal 2017 |
||||||||||||||||||||||||||||||||||||||||
| Interest expense |
$ | — | $ | 5,679 | $ | 5,213 | $ | — | $ | 16,663 | $ | 16,000 | $ | 17,212 | $ | 13,063 | $ | 137 | $ | 73,967 | ||||||||||||||||||||
| Amortization of deferred financing costs and discount |
— | 327 | 826 | — | 1,120 | 1,233 | 1,126 | 541 | 5 | 5,178 | ||||||||||||||||||||||||||||||
|
|
|
|
|
|
|
|
|
|
|
|
|
|
|
|
|
|
|
|
|
|||||||||||||||||||||
| Total interest expense |
$ | — | $ | 6,006 | $ | 6,039 | $ | — | $ | 17,783 | $ | 17,233 | $ | 18,338 | $ | 13,604 | $ | 142 | $ | 79,145 | ||||||||||||||||||||
|
|
|
|
|
|
|
|
|
|
|
|
|
|
|
|
|
|
|
|
|
|||||||||||||||||||||
| Fiscal 2016 |
||||||||||||||||||||||||||||||||||||||||
| Interest expense |
$ | — | $ | 261 | $ | 4,422 | $ | 19,103 | $ | 3,395 | $ | 15,631 | $ | 14,030 | $ | 13,063 | $ | 67 | $ | 69,972 | ||||||||||||||||||||
| Amortization of deferred financing costs and discount |
— | 13 | 1,132 | — | 182 | 1,237 | 976 | 544 | 2 | 4,086 | ||||||||||||||||||||||||||||||
|
|
|
|
|
|
|
|
|
|
|
|
|
|
|
|
|
|
|
|
|
|||||||||||||||||||||
| Total interest expense |
$ | — | $ | 274 | $ | 5,554 | $ | 19,103 | $ | 3,577 | $ | 16,868 | $ | 15,006 | $ | 13,607 | $ | 69 | $ | 74,058 | ||||||||||||||||||||
|
|
|
|
|
|
|
|
|
|
|
|
|
|
|
|
|
|
|
|
|
|||||||||||||||||||||
| Fiscal 2015 |
||||||||||||||||||||||||||||||||||||||||
| Interest expense |
$ | 406 | $ | — | $ | 4,047 | $ | 28,081 | $ | — | $ | 16,082 | $ | 13,966 | $ | 8,781 | $ | — | 71,363 | |||||||||||||||||||||
| Amortization of deferred financing costs and discount |
— | — | 1,131 | 61 | — | 1,240 | 974 | 358 | — | 3,764 | ||||||||||||||||||||||||||||||
|
|
|
|
|
|
|
|
|
|
|
|
|
|
|
|
|
|
|
|
|
|||||||||||||||||||||
| Total interest expense |
$ | 406 | $ | — | $ | 5,178 | $ | 28,142 | $ | — | $ | 17,322 | $ | 14,940 | $ | 9,139 | $ | — | $ | 75,127 | ||||||||||||||||||||
|
|
|
|
|
|
|
|
|
|
|
|
|
|
|
|
|
|
|
|
|
|||||||||||||||||||||
| (1) | Borrowings of each of the Company’s wholly-owned, special-purpose financing subsidiaries are considered borrowings of the Company for purposes of complying with the asset coverage requirements applicable to BDCs under the 1940 Act. |
| (2) | Interest expense includes the effect of non-usage fees. |
| (3) | Total interest expense for the secured borrowing includes the effect of amortization of discount. |
139
Table of Contents
FS Investment Corporation
Notes to Consolidated Financial Statements (continued)
(in thousands, except share and per share amounts)
Note 8. Financing Arrangements (continued)
For the years ended December 31, 2017, 2016 and 2015, the cash paid for interest expense, average borrowings, effective interest rate and weighted average interest rate for the Company’s financing arrangements were as follows:
| Arrangement |
Broad Street Credit Facility |
Hamilton Street Credit Facility(2)(3) |
ING Credit Facility(2)(4) |
JPM Facility(3) |
Locust Street Credit Facility(3) |
4.000% Notes due 2019(5) |
4.250% Notes due 2020(5) |
4.75% Notes due 2022(5) |
Partial Loan Sale(3) |
Total/ Average |
||||||||||||||||||||||||||||||
| Fiscal 2017 |
||||||||||||||||||||||||||||||||||||||||
| Cash paid for interest expense |
— | $ | 5,193 | $ | 4,581 | — | $ | 15,047 | $ | 16,000 | $ | 17,213 | $ | 13,062 | $ | 164 | $ | 71,260 | ||||||||||||||||||||||
| Average borrowings |
— | $ | 150,000 | $ | 111,237 | — | $ | 425,000 | $ | 400,000 | $ | 405,000 | $ | 275,000 | $ | 2,787 | $ | 1,769,024 | ||||||||||||||||||||||
| Effective interest rate |
— | 3.81 | % | 6.51 | % | — | 3.98 | % | 4.00 | % | 4.25 | % | 4.75 | % | — | 4.26 | % | |||||||||||||||||||||||
| Weighted average interest rate(1) |
— | 3.79 | % | 4.69 | % | — | 3.92 | % | 4.00 | % | 4.25 | % | 4.75 | % | 5.69 | % | 4.18 | % | ||||||||||||||||||||||
| Fiscal 2016 |
||||||||||||||||||||||||||||||||||||||||
| Cash paid for interest expense |
— | — | $ | 4,764 | $ | 24,736 | $ | 825 | $ | 16,000 | $ | 13,812 | $ | 13,063 | $ | 40 | $ | 73,240 | ||||||||||||||||||||||
| Average borrowings |
— | $ | 6,967 | $ | 108,634 | $ | 578,142 | $ | 93,566 | $ | 400,000 | $ | 330,246 | $ | 275,000 | $ | 1,194 | $ | 1,793,749 | |||||||||||||||||||||
| Effective interest rate |
— | 3.69 | % | 8.18 | % | — | 3.57 | % | 4.00 | % | 4.25 | % | 4.75 | % | 5.50 | % | 4.16 | % | ||||||||||||||||||||||
| Weighted average interest rate(1) |
— | 3.69 | % | 4.00 | % | 3.25 | % | 3.57 | % | 4.00 | % | 4.25 | % | 4.75 | % | 5.50 | % | 3.84 | % | |||||||||||||||||||||
| Fiscal 2015 |
||||||||||||||||||||||||||||||||||||||||
| Cash paid for interest expense |
$ | 635 | — | $ | 3,741 | $ | 29,138 | — | $ | 16,044 | $ | 8,518 | $ | 7,076 | — | $ | 65,152 | |||||||||||||||||||||||
| Average borrowings |
$ | 22,706 | — | $ | 92,550 | $ | 852,192 | — | $ | 400,000 | $ | 325,000 | $ | 185,341 | — | $ | 1,877,789 | |||||||||||||||||||||||
| Effective interest rate |
— | — | 10.79 | % | 3.25 | % | — | 4.00 | % | 4.25 | % | 4.75 | % | — | 3.96 | % | ||||||||||||||||||||||||
| Weighted average interest rate(1) |
1.76 | % | — | 4.31 | % | 3.25 | % | — | 4.00 | % | 4.25 | % | 4.75 | % | — | 3.75 | % | |||||||||||||||||||||||
| (1) | The weighted average interest rates presented for periods of less than one year are annualized. |
140
Table of Contents
FS Investment Corporation
Notes to Consolidated Financial Statements (continued)
(in thousands, except share and per share amounts)
Note 8. Financing Arrangements (continued)
| (2) | Effective interest rate and weighted average interest rate includes the effect of non-usage fees. |
| (3) | Interest is paid quarterly in arrears. |
| (4) | Interest is paid at the end of each interest period (but no less frequently than quarterly) in arrears for Eurocurrency Loans (as described below) and quarterly in arrears for ABR Loans (as described below). |
| (5) | Interest is paid semi-annually in arrears. |
Broad Street Credit Facility
On January 28, 2011, Broad Street Funding LLC, or Broad Street, the Company’s former wholly-owned, special-purpose financing subsidiary, Deutsche Bank AG, New York Branch, or Deutsche Bank, and the other lenders party thereto entered into an amended and restated multi-lender, syndicated revolving credit facility, or the Broad Street credit facility, which amended and restated the revolving credit facility that Broad Street originally entered into with Deutsche Bank on March 10, 2010 and the amendments thereto. On December 15, 2015, Broad Street and Deutsche Bank entered into an amendment to the facility which extended the maturity date to January 19, 2016. The Broad Street credit facility matured and terminated on January 19, 2016, and the Company thereafter dissolved Broad Street. The Broad Street credit facility provided for borrowings of up to $125,000 at a rate of LIBOR, for an interest period equal to the weighted average LIBOR interest period of debt securities owned by Broad Street, plus 1.50% per annum.
During the year ended December 31, 2015, the Broad Street credit facility was fully repaid.
Hamilton Street Credit Facility
On December 15, 2016, Hamilton Street Funding LLC, or Hamilton Street, a wholly owned, special purpose financing subsidiary of the Company, entered into a revolving credit facility, or the Hamilton Street credit facility, pursuant to (a) a Loan and Security Agreement, dated as of December 15, 2016, by and among Hamilton Street, as borrower, each of the lenders from time to time party thereto, each of the lender agents from time to time party thereto, HSBC Bank USA, National Association, as administrative agent, and U.S. Bank National Association, as collateral agent, account bank and custodian, and (b) certain other related transaction documents.
The Hamilton Street credit facility provides for a five-year credit facility with a four-year revolving period, during which Hamilton Street is permitted to borrow, repay and reborrow advances in U.S. dollars and certain agreed foreign currencies in an initial aggregate amount of up to $150,000, subject to its compliance with the terms of the Hamilton Street credit facility (including maintenance of the required borrowing base). The Hamilton Street credit facility has an accordion option that would permit the parties to increase the commitments by an additional $50,000 to $200,000. After the revolving period, outstanding advances under the Hamilton Street credit facility must be repaid by 5% each month until the maturity date at which time all remaining outstanding advances must be repaid.
Hamilton Street has appointed the Company to manage its portfolio of assets pursuant to the terms of a collateral management agreement. Hamilton Street’s obligations to the lenders and other secured parties under the Hamilton Street credit facility are secured by a first priority security interest in substantially all of Hamilton Street’s assets. The obligations of Hamilton Street under the Hamilton Street credit facility are non-recourse to the Company, and, accordingly, the Company’s exposure under the Hamilton Street credit facility is limited to the value of the Company’s investment in Hamilton Street.
141
Table of Contents
FS Investment Corporation
Notes to Consolidated Financial Statements (continued)
(in thousands, except share and per share amounts)
Note 8. Financing Arrangements (continued)
Hamilton Street will pay interest quarterly in arrears on the advances under the Hamilton Street credit facility at a rate per annum equal to LIBOR for a three-month interest period (subject to a 0% floor) plus a spread of 2.50%. Hamilton Street will pay an undrawn fee during the revolving period in an amount equal to 0.50% per annum on any unborrowed amounts up to 35% of the commitments plus 1.65% per annum on any unborrowed amounts above that threshold.
In connection with the Hamilton Street credit facility, Hamilton Street has made certain representations and warranties and is required to comply with various covenants, reporting requirements and other customary requirements for similar facilities. The Hamilton Street credit facility contains customary events of default for similar financing transactions, including: (a) Hamilton Street’s failure to make principal, interest or other payments when due; (b) any uncured deficiency in the required borrowing base or excess foreign currency exposure; (c) the failure of Hamilton Street or the Company to observe or perform their respective covenants under the transaction documents, subject to applicable cure periods; (d) Hamilton Street’s representation and warranties being false; (e) any cross-default to other material indebtedness of Hamilton Street or the Company after giving effect to applicable cure periods; (f) the insolvency or bankruptcy of Hamilton Street or the Company; (g) the failure of the Company to own 100% of the outstanding interests of Hamilton Street; (h) the failure of the Company to be regulated as a BDC under the 1940 Act; (i) the failure of the Company to maintain a 200% asset coverage ratio; and (j) the failure of the Company to maintain a net asset value of at least $400,000. Upon the occurrence and during the continuance of an event of default, the administrative agent may declare the outstanding advances and all other obligations under the Hamilton Street credit facility immediately due and payable.
The Company incurred costs in connection with obtaining the Hamilton Street credit facility, which the Company has recorded as deferred financing costs on its consolidated balance sheets and amortizes to interest expense over the life of the facility. As of December 31, 2017, $1,297 of such deferred financing costs had yet to be amortized to interest expense.
ING Credit Facility
On April 3, 2014, the Company entered into a senior secured revolving credit facility with ING Capital LLC, or ING, as administrative agent, and the lenders party thereto, or the ING credit facility. The ING credit facility originally provided for borrowings in U.S. dollars and certain agreed upon foreign currencies in an initial aggregate amount of up to $300,000, with an option for the Company to request, at one or more times after closing, that existing or new lenders, at their election, provide up to $100,000 of additional commitments. The ING credit facility provides for the issuance of letters of credit in an aggregate face amount not to exceed $25,000. The Company’s obligations under the ING credit facility are guaranteed by all of the Company’s subsidiaries, other than its special-purpose financing subsidiaries. The Company’s obligations under the ING credit facility are secured by a first priority security interest in substantially all of the assets of the Company and the subsidiary guarantors thereunder other than the equity interests of its special-purpose financing subsidiaries.
On March 16, 2017, the Company, certain subsidiary guarantors of the Company, the several banks and other financial institutions or entities from time to time party thereto and ING entered into a second amendment, or the Amendment, to the ING credit facility. The Amendment, among other things, (i) increased the lenders’ aggregate commitments under the ING credit facility to $327,500, (ii) extended the term of the revolving period to March 16, 2020 and the final maturity date to March 16, 2021, (iii) increased the size of the accordion provision to permit increases to the lenders’ aggregate commitments under the ING credit facility up to $600,000
142
Table of Contents
FS Investment Corporation
Notes to Consolidated Financial Statements (continued)
(in thousands, except share and per share amounts)
Note 8. Financing Arrangements (continued)
and (iv) decreased the Applicable Margin (as defined therein) to 1.25% with respect to any ABR Loan (as defined therein) and 2.25% with respect to any Eurocurrency Loan (as defined therein).
Borrowings under the ING credit facility are subject to compliance with a borrowing base. Interest under the ING credit facility for (i) loans for which the Company elects the base rate option is payable at a rate equal to 1.25% per annum plus the greatest of (x) the “U.S. Prime Rate” as published in The Wall Street Journal, (y) the federal funds effective rate plus 0.5% per annum and (z) three-month LIBOR plus 1% per annum and (ii) loans for which the Company elects the option to borrow in Euro is payable at a rate equal to 2.25% per annum plus adjusted LIBOR. The ING credit facility is subject to a non-usage fee of (a) 1% per annum on the unused portion of the commitment under the ING credit facility for each day such unused portion is 65% or more of the commitments and (b) 0.375% per annum on the unused portion of the commitments for each day the unused portion is less than 65%. The Company will pay letter of credit participation fees and a fronting fee on the average daily amount of any lender’s exposure with respect to any letters of credit issued under the ING credit facility.
In connection with the ING credit facility, the Company has made certain representations and warranties and must comply with various covenants and reporting requirements customary for facilities of this type. In addition, the Company must comply with the following financial covenants: (a) the Company’s minimum stockholders’ equity, measured as of each fiscal quarter-end, must be greater than or equal to the greater of (i) 40% of assets of the Company and its subsidiaries as of the last day of such fiscal quarter and (ii) $1,700,000,000, plus 50% of the net proceeds of any equity offerings following the Amendment; (b) the Company must maintain at all times a 200% asset coverage ratio; (c) at any time when the borrowing base is less than 1.50 times the sum of the aggregated covered debt amount (defined as (i) borrowings outstanding under the ING credit facility plus (ii) the aggregate amount of the any of the following then outstanding obligations of the Company (excluding obligations of any financing subsidiaries): (1) secured longer-term debt, (1) unsecured shorter-term debt and (3) net obligations that would be owed if any hedging arrangements were terminated minus (z) exposure under letters of credit issued under the ING credit facility that has been cash collateralized or satisfactorily backstopped), the sum of (x) the Company and the guarantors’ net worth (defined as stockholders’ equity minus the net asset value held by the Company in any special-purpose financing subsidiaries) plus (y) 30% of the equity value of any special-purpose financing subsidiaries, must be at least equal to the sum of (A) any unsecured longer-term debt of the Company and (B) accrued but unpaid base management fees and incentive fees at the time of measurement; and (d) the aggregate value of eligible portfolio investments that can be converted to cash in fewer than 20 business days without more than a 5% change in price must not be less than 10% of the covered debt amount (defined as the aggregate amount of outstanding loans and issued letters of credit under the facility, plus, to the extent incurred after closing of the ING credit facility, certain other permitted debt of the Company) for more than 30 business days during any period during which the covered debt amount (less cash and cash equivalents included in the borrowing base) is greater than 90% of the borrowing base (less cash and cash equivalents included therein).
The ING credit facility contains events of default customary for financing transactions of this type. Upon the occurrence of an event of default, ING, at the instruction of the lenders, may terminate the commitments and declare the outstanding advances and all other obligations under the ING credit facility immediately due and payable. During the continuation of an event of default and subject, in certain cases, to the instructions of the lenders, the Company must pay interest at a default rate.
143
Table of Contents
FS Investment Corporation
Notes to Consolidated Financial Statements (continued)
(in thousands, except share and per share amounts)
Note 8. Financing Arrangements (continued)
The Company incurred costs in connection with obtaining the ING credit facility, which the Company has recorded as deferred financing costs on its consolidated balance sheets and amortizes to interest expense over the life of the facility. As of December 31, 2017, $2,162 of such deferred financing costs had yet to be amortized to interest expense.
JPM Financing
On July 21, 2011, through its two wholly-owned, special-purpose financing subsidiaries, Locust Street Funding LLC, or Locust Street, and Race Street Funding LLC, or Race Street, the Company entered into a debt financing arrangement with JPMorgan Chase Bank, N.A., London Branch, or JPM, which was subsequently amended several times, or the JPM Facility. Prior to its termination, the Company and JPM most recently amended the financing arrangement on April 28, 2016 to, among other things, reduce the amount of outstanding available debt financing from $725,000 to $650,000. On November 1, 2016, in connection with the entrance into the Locust Street credit facility (as defined below), (i) the Class A Notes issued by Locust Street to Race Street were redeemed, (ii) the amended and restated global master repurchase agreement between Race Street and Locust Street was terminated and (iii) the JPM Facility was prepaid and terminated.
JPM Term Loan Facility
On November 1, 2016, Locust Street entered into a loan agreement, or the Locust Street loan agreement and, together with the related transaction documents, the Locust Street term loan facility, with JPM, as lender and administrative agent, Citibank, N.A., as collateral agent and securities intermediary, and Virtus Group, LP, as collateral administrator, pursuant to which JPM advanced $625,000 to Locust Street. Advances outstanding under the Locust Street term loan facility bear interest at a rate equal to LIBOR for a three-month interest period plus a spread of 2.6833% per annum. Interest is payable in arrears beginning on January 15, 2017 and each quarter thereafter. Under the Locust Street loan agreement, Locust Street agreed to repay $200,000 of the aggregate principal amount of the advances on or before January 31, 2017, which repayment was satisfied in full in December 2016. All remaining outstanding advances under the Loan Agreement will mature, and all accrued and unpaid interest thereunder, will be due and payable, on November 1, 2020.
Advances under the Locust Street loan agreement are subject to a compliance condition which will be satisfied at any given time if the outstanding advances minus the amount of principal and certain interest proceeds in Locust Street’s accounts is less than or equal to fifty-three percent (53%) of the net asset value of Locust Street’s portfolio of assets. Locust Street also made certain customary representations and warranties and is required to comply with various customary covenants, reporting requirements and other requirements.
The Locust Street loan agreement contains events of default customary for similar financing transactions, including: (i) the failure to make principal payments when due or any other payments under the Locust Street loan agreement within two business days of when they are due; (ii) the insolvency or bankruptcy of Locust Street or the Company; (iii) a “Change of Control” (as defined in the Locust Street loan agreement) of Locust Street; (iv) the transaction documents are amended in a manner materially adverse to JPM, as administrative agent, without JPM’s consent; and (v) GDFM or an affiliate thereof ceases to be the Company’s investment sub-adviser. Upon the occurrence and during the continuation of an event of default, JPM may declare the outstanding advances and all other obligations under the Locust Street loan agreement immediately due and payable.
144
Table of Contents
FS Investment Corporation
Notes to Consolidated Financial Statements (continued)
(in thousands, except share and per share amounts)
Note 8. Financing Arrangements (continued)
The occurrence of events of default (as described above) or events defined as “Coverage Events” in the Locust Street loan agreement triggers (i) a requirement that Locust Street obtain the consent of JPM prior to entering into any sale or disposition with respect to portfolio assets and (ii) the right of JPM to direct Locust Street to enter into sales or dispositions with respect to any portfolio assets, in each case, in JPM’s sole discretion.
Locust Street’s obligations to JPM under the Locust Street credit facility are secured by a first priority security interest in substantially all of the assets of Locust Street, including its portfolio of assets. The obligations of Locust Street under the Locust Street credit facility are non-recourse to the Company, and the Company’s exposure under the Locust Street credit facility is limited to the value of the Company’s investment in Locust Street.
The Company incurred costs in connection with obtaining the Locust Street credit facility, which the Company has recorded as deferred financing costs on its consolidated balance sheets and amortizes to interest expense over the life of the facility. As of December 31, 2017, $3,179 of such deferred financing costs had yet to be amortized to interest expense.
4.000% Notes due 2019
On July 14, 2014, the Company and U.S. Bank National Association, or U.S. Bank, entered into an indenture, or the base indenture, and a first supplemental indenture thereto, or together with the base indenture and any supplemental indentures thereto, the indenture, relating to the Company’s issuance of $400,000 aggregate principal amount of its 4.000% notes due 2019, or the 4.000% notes.
The 4.000% notes will mature on July 15, 2019 and may be redeemed in whole or in part at the Company’s option at any time or from time to time at the applicable redemption price set forth in the indenture. The 4.000% notes bear interest at a rate of 4.000% per year, payable semi-annually on January 15 and July 15 of each year, commencing on January 15, 2015. The 4.000% notes are general unsecured obligations of the Company that rank senior in right of payment to all of the Company’s existing and future indebtedness that is expressly subordinated in right of payment to the 4.000% notes and rank pari passu with all outstanding and future unsecured unsubordinated indebtedness issued by the Company.
In addition, on the occurrence of a “change of control repurchase event,” as defined in the indenture, the Company will generally be required to make an offer to purchase the outstanding 4.000% notes at a price equal to 100% of the principal amount of such notes plus accrued and unpaid interest to the repurchase date.
The indenture contains certain covenants, including covenants requiring the Company to comply with the asset coverage requirements of Section 18(a)(1)(A) of the 1940 Act, as modified by Section 61(a)(1) of the 1940 Act, whether or not it is subject to those requirements, and to provide financial information to the holders of the 4.000% notes and U.S. Bank if the Company is no longer subject to the reporting requirements under the Securities Exchange Act of 1934, as amended, or the Exchange Act. These covenants are subject to limitations and exceptions that are described in the indenture.
As of December 31, 2017, the fair value of the 4.000% notes was approximately $406,966. The Company incurred costs in connection with issuing the 4.000% notes, which the Company has recorded as deferred financing costs on its consolidated balance sheets and amortizes to interest expense over the life of the 4.000% notes. As of December 31, 2017, $171 of such deferred financing costs had yet to be amortized to interest
145
Table of Contents
FS Investment Corporation
Notes to Consolidated Financial Statements (continued)
(in thousands, except share and per share amounts)
Note 8. Financing Arrangements (continued)
expense. In connection with issuing the 4.000% notes, the Company has charged discount against the carrying amount of such notes. As of December 31, 2017, $1,720 of such discount had yet to be amortized to interest expense.
4.250% Notes due 2020
On December 3, 2014, the Company and U.S. Bank entered into a second supplemental indenture to the base indenture relating to the Company’s issuance of $325,000 aggregate principal amount of its 4.250% notes due 2020, or the 4.250% notes. On December 8, 2016, the Company issued an additional $80,000 aggregate principal amount of the 4.250% notes as additional notes under the second supplemental indenture.
The 4.250% notes will mature on January 15, 2020 and may be redeemed in whole or in part at the Company’s option at any time or from time to time at the applicable redemption price set forth in the indenture. The 4.250% notes bear interest at a rate of 4.250% per year, payable semi-annually on January 15 and July 15 of each year, commencing on July 15, 2015. The 4.250% notes are general unsecured obligations of the Company that rank senior in right of payment to all of the Company’s existing and future indebtedness that is expressly subordinated in right of payment to the 4.250% notes and rank pari passu with all outstanding and future unsecured unsubordinated indebtedness issued by the Company.
In addition, on the occurrence of a “change of control repurchase event,” as defined in the indenture, the Company will generally be required to make an offer to purchase the outstanding 4.250% notes at a price equal to 100% of the principal amount of such notes plus accrued and unpaid interest to the repurchase date.
The indenture contains certain covenants, including covenants requiring the Company to comply with the asset coverage requirements of Section 18(a)(1)(A) of the 1940 Act, as modified by Section 61(a)(1) of the 1940 Act, whether or not it is subject to those requirements, and to provide financial information to the holders of the 4.250% notes and U.S. Bank if the Company is no longer subject to the reporting requirements under the Exchange Act. These covenants are subject to limitations and exceptions that are described in the indenture.
As of December 31, 2017, the fair value of the 4.250% notes was approximately $414,828. The Company incurred costs in connection with issuing the 4.250% notes, which the Company has recorded as deferred financing costs on its consolidated balance sheets and amortizes to interest expense over the life of the 4.250% notes. As of December 31, 2017, $935 of such deferred financing costs had yet to be amortized to interest expense. In connection with issuing the 4.250% notes, the Company has charged discount against the carrying amount of such notes. As of December 31, 2017, $1,359 of such discount had yet to be amortized to interest expense.
4.750% Notes due 2022
On April 30, 2015, the Company and U.S. Bank entered into a third supplemental indenture to the base indenture relating to the Company’s issuance of $275,000 aggregate principal amount of its 4.750% notes due 2022, or the 4.750% notes.
The 4.750% notes will mature on May 15, 2022 and may be redeemed in whole or in part at the Company’s option at any time or from time to time at the applicable redemption price set forth in the indenture. The 4.750% notes bear interest at a rate of 4.750% per year, payable semi-annually on May 15 and November 15 of each year, commencing on November 15, 2015. The 4.750% notes are general unsecured
146
Table of Contents
FS Investment Corporation
Notes to Consolidated Financial Statements (continued)
(in thousands, except share and per share amounts)
Note 8. Financing Arrangements (continued)
obligations of the Company that rank senior in right of payment to all of the Company’s existing and future indebtedness that is expressly subordinated in right of payment to the 4.750% notes and rank pari passu with all outstanding and future unsecured unsubordinated indebtedness issued by the Company.
In addition, on the occurrence of a “change of control repurchase event,” as defined in the indenture, the Company will generally be required to make an offer to purchase the outstanding 4.750% notes at a price equal to 100% of the principal amount of such notes plus accrued and unpaid interest to the repurchase date.
The indenture contains certain covenants, including covenants requiring the Company to comply with the asset coverage requirements of Section 18(a)(1)(A) of the 1940 Act, as modified by Section 61(a)(1) of the 1940 Act, whether or not it is subject to those requirements, and to provide financial information to the holders of the 4.750% notes and U.S. Bank if the Company is no longer subject to the reporting requirements under the Exchange Act. These covenants are subject to limitations and exceptions that are described in the indenture.
As of December 31, 2017, the fair value of the 4.750% notes was approximately $283,895. The Company incurred costs in connection with issuing the 4.750% notes, which the Company has recorded as deferred financing costs on its consolidated balance sheets and amortizes to interest expense over the life of the 4.750% notes. As of December 31, 2017, $296 of such deferred financing costs had yet to be amortized to interest expense. In connection with issuing the 4.750% notes, the Company has charged discount against the carrying amount of such notes. As of December 31, 2017, $2,074 of such discount had yet to be amortized to interest expense.
Partial Loan Sale
Certain partial loan sales do not qualify for sale accounting under ASC Topic 860 because these sales do not meet the definition of a participating interest, as defined in the guidance, in order for sale treatment to be allowed. Participations or other partial loan sales which do not meet the definition of a participating interest remain as an investment on the consolidated balance sheets and the portion sold is recorded as a secured borrowing in the liabilities section of the consolidated balance sheets. For these partial loan sales, the interest earned on the entire loan balance is recorded within interest income and the interest earned by the buyer in the partial loan sale is recorded within interest expense in the consolidated statements of operations.
As of December 31, 2016, the Company recognized a secured borrowing at fair value of $2,880 and the fair value of the loan that is associated with the secured borrowing was $14,993. The secured borrowing was the result of the Company’s completion of a partial sale of a senior secured loan associated with one portfolio company that did not meet the definition of a participating interest. As a result, sale treatment was not allowed and the partial loan sale was treated as a secured borrowing.
During the year ended December 31, 2017, the secured borrowing was fully repaid.
Note 9. Commitments and Contingencies
The Company enters into contracts that contain a variety of indemnification provisions. The Company’s maximum exposure under these arrangements is unknown; however, the Company has not had prior claims or losses pursuant to these contracts. Management of FB Advisor has reviewed the Company’s existing contracts and expects the risk of loss to the Company to be remote.
The Company is not currently subject to any material legal proceedings and, to the Company’s knowledge, no material legal proceedings are threatened against the Company. From time to time, the Company may be a
147
Table of Contents
FS Investment Corporation
Notes to Consolidated Financial Statements (continued)
(in thousands, except share and per share amounts)
Note 9. Commitments and Contingencies (continued)
party to certain legal proceedings in the ordinary course of business, including proceedings relating to the enforcement of the Company’s rights under contracts with its portfolio companies. While the outcome of these legal proceedings cannot be predicted with certainty, the Company does not expect that any such proceedings will have a material effect upon its financial condition or results of operations.
See Note 6 for a discussion of the Company’s unfunded commitments.
Note 10. Senior Securities Asset Coverage
Information about the Company’s senior securities is shown in the table below for the years ended December 31, 2017, 2016, 2015, 2014 and 2013:
| Year Ended December 31, |
Total Amount Outstanding Exclusive of Treasury Securities |
Asset Coverage per Unit(1) |
Involuntary Liquidation Preference per Unit(2) |
Average Market Value per Unit(3) (Exclude Bank Loans) |
||||||||||||
| 2013 |
$ | 1,673,682 | 2.58 | — | N/A | |||||||||||
| 2014 |
$ | 1,863,827 | 2.27 | — | N/A | |||||||||||
| 2015 |
$ | 1,834,625 | 2.20 | — | N/A | |||||||||||
| 2016 |
$ | 1,702,789 | 2.35 | — | N/A | |||||||||||
| 2017 |
$ | 1,721,750 | 2.33 | — | N/A | |||||||||||
| (1) | Asset coverage per unit is the ratio of the carrying value of the Company’s total consolidated assets, less all liabilities and indebtedness not represented by senior securities, to the aggregate amount of senior securities representing indebtedness. |
| (2) | The amount to which such class of senior security would be entitled upon the voluntary liquidation of the Company in preference to any security junior to it. The “—” in this column indicates that the SEC expressly does not require this information to be disclosed for certain types of senior securities. |
| (3) | Not applicable because senior securities are not registered for public trading on an exchange. |
148
Table of Contents
FS Investment Corporation
Notes to Consolidated Financial Statements (continued)
(in thousands, except share and per share amounts)
Note 11. Financial Highlights
The following is a schedule of financial highlights of the Company for the years ended December 31, 2017, 2016, 2015, 2014 and 2013:
| Year Ended December 31, | ||||||||||||||||||||
| 2017 | 2016 | 2015 | 2014 | 2013 | ||||||||||||||||
| Per Share Data:(1) |
||||||||||||||||||||
| Net asset value, beginning of period |
$ | 9.41 | $ | 9.10 | $ | 9.83 | $ | 10.18 | $ | 9.97 | ||||||||||
| Results of operations(2) |
||||||||||||||||||||
| Net investment income (loss) |
0.83 | 0.85 | 1.10 | 0.97 | 0.96 | |||||||||||||||
| Net realized gain (loss) and unrealized appreciation (depreciation) |
(0.08 | ) | 0.35 | (0.94 | ) | (0.19 | ) | 0.08 | ||||||||||||
|
|
|
|
|
|
|
|
|
|
|
|||||||||||
| Net increase (decrease) in net assets resulting from operations |
0.75 | 1.20 | 0.16 | 0.78 | 1.04 | |||||||||||||||
|
|
|
|
|
|
|
|
|
|
|
|||||||||||
| Stockholder distributions(3) |
||||||||||||||||||||
| Distributions from net investment income |
(0.86 | ) | (0.89 | ) | (0.75 | ) | (0.79 | ) | (0.83 | ) | ||||||||||
| Distributions from net realized gain on investments |
— | — | (0.14 | ) | (0.29 | ) | — | |||||||||||||
|
|
|
|
|
|
|
|
|
|
|
|||||||||||
| Net decrease in net assets resulting from stockholder distributions |
(0.86 | ) | (0.89 | ) | (0.89 | ) | (1.08 | ) | (0.83 | ) | ||||||||||
|
|
|
|
|
|
|
|
|
|
|
|||||||||||
| Capital share transactions |
||||||||||||||||||||
| Issuance of common stock(4) |
0.00 | 0.00 | 0.00 | 0.00 | 0.00 | |||||||||||||||
| Repurchases of common stock(5) |
— | — | — | (0.05 | ) | (0.00 | ) | |||||||||||||
|
|
|
|
|
|
|
|
|
|
|
|||||||||||
| Net increase (decrease) in net assets resulting from capital share transactions |
— | — | — | (0.05 | ) | — | ||||||||||||||
|
|
|
|
|
|
|
|
|
|
|
|||||||||||
| Net asset value, end of period |
$ | 9.30 | $ | 9.41 | $ | 9.10 | $ | 9.83 | $ | 10.18 | ||||||||||
|
|
|
|
|
|
|
|
|
|
|
|||||||||||
| Per share market value, end of period |
$ | 7.35 | $ | 10.30 | $ | 8.99 | $ | 9.93 | — | |||||||||||
|
|
|
|
|
|
|
|
|
|
|
|||||||||||
| Shares outstanding, end of period |
245,725,416 | 244,063,357 | 242,847,016 | 240,896,559 | 259,320,161 | |||||||||||||||
|
|
|
|
|
|
|
|
|
|
|
|||||||||||
| Total return based on net asset value(6) |
7.97 | % | 13.19 | % | 1.63 | % | 7.17 | % | 10.43 | % | ||||||||||
|
|
|
|
|
|
|
|
|
|
|
|||||||||||
| Total return based on market value(7) |
(21.39 | )% | 25.91 | % | (0.78 | )% | 5.52 | % | — | |||||||||||
|
|
|
|
|
|
|
|
|
|
|
|||||||||||
| Ratio/Supplemental Data: |
||||||||||||||||||||
| Net assets, end of period |
$ | 2,284,723 | $ | 2,297,377 | $ | 2,208,928 | $ | 2,366,986 | $ | 2,640,992 | ||||||||||
|
|
|
|
|
|
|
|
|
|
|
|||||||||||
| Ratio of net investment income to average net assets(8) |
8.86 | % | 9.32 | % | 11.25 | % | 9.54 | % | 9.50 | % | ||||||||||
|
|
|
|
|
|
|
|
|
|
|
|||||||||||
| Ratio of total operating expenses to average net assets(8) |
9.48 | % | 9.69 | % | 8.90 | % | 8.90 | % | 8.90 | % | ||||||||||
|
|
|
|
|
|
|
|
|
|
|
|||||||||||
| Ratio of net operating expenses to average net assets(8) |
9.37 | % | 9.69 | % | 8.90 | % | 8.79 | % | 8.90 | % | ||||||||||
|
|
|
|
|
|
|
|
|
|
|
|||||||||||
| Portfolio turnover |
29.17 | % | 29.65 | % | 39.93 | % | 50.27 | % | 61.18 | % | ||||||||||
|
|
|
|
|
|
|
|
|
|
|
|||||||||||
| Total amount of senior securities outstanding, exclusive of treasury securities |
$ | 1,721,750 | $ | 1,702,789 | $ | 1,834,625 | $ | 1,863,827 | $ | 1,673,682 | ||||||||||
|
|
|
|
|
|
|
|
|
|
|
|||||||||||
| Asset coverage per unit(9) |
2.33 | 2.35 | 2.20 | 2.27 | 2.58 | |||||||||||||||
149
Table of Contents
FS Investment Corporation
Notes to Consolidated Financial Statements (continued)
(in thousands, except share and per share amounts)
Note 11. Financial Highlights (continued)
| (1) | Per share data may be rounded in order to recompute the ending net asset value per share. |
| (2) | The per share data was derived by using the weighted average shares outstanding during the applicable period. |
| (3) | The per share data for distributions reflect the actual amount of distributions paid per share during the applicable period. |
| (4) | The issuance of common stock on a per share basis reflects the incremental net asset value changes as a result of the issuance of shares of common stock pursuant to the Company’s distribution reinvestment plan. The issuance of common stock at a price that is greater than the net asset value per share results in an increase in net asset value per share. The per share impact of the Company’s distribution reinvestment plan is an increase to the net asset value of less than $0.01 per share during the years ended December 31, 2017, 2016, 2015, 2014 and 2013. |
| (5) | The listing tender offer and the purchase of shares of common stock pursuant thereto on June 4, 2014 resulted in a reduction to net asset value as a result of the Company repurchasing shares at a price greater than its net asset value per share. The per share impact of the Company’s repurchases of common stock is a reduction to net asset value of less than $0.01 per share during the year ended December 31, 2013. |
| (6) | The total return based on net asset value for each year presented was calculated by taking the net asset value per share as of the end of the applicable year, adding the cash distributions per share that were declared during the applicable calendar year and dividing the total by the net asset value per share at the beginning of the applicable year. Total return based on net asset value does not consider the effect of any sales commissions or charges that may be incurred in connection with the sale of shares of the Company’s common stock. The historical calculation of total return based on net asset value in the table should not be considered a representation of the Company’s future total return based on net asset value, which may be greater or less than the return shown in the table due to a number of factors, including the Company’s ability or inability to make investments in companies that meet its investment criteria, the interest rates payable on the debt securities the Company acquires, the level of the Company’s expenses, variations in and the timing of the recognition of realized and unrealized gains or losses, the degree to which the Company encounters competition in its markets and general economic conditions. As a result of these factors, results for any previous period should not be relied upon as being indicative of performance in future periods. The total return calculations set forth above represent the total return on the Company’s investment portfolio during the applicable period and do not represent an actual return to stockholders. |
| (7) | The total return based on market value for each period presented was calculated based on the change in market price during the applicable period, including the impact of distributions reinvested in accordance with the Company’s DRP. The total return based on market value for the year ended December 31, 2014 was calculated based on the period from April 16, 2014, the first day the shares began trading on the NYSE at a closing price of $10.25, to December 31, 2014. Total return based on market value does not consider the effect of any sales commissions or charges that may be incurred in connection with the sale of shares of the Company’s common stock. The historical calculation of total return based on market value in the table should not be considered a representation of the Company’s future total return based on market value, which may be greater or less than the return shown in the table due to a number of factors, including the Company’s ability or inability to make investments in companies that meet its investment criteria, the interest rates payable on the debt securities the Company acquires, the level of the Company’s expenses, variations in and the timing of the recognition of realized and unrealized gains or losses, the degree to which the Company encounters competition in its markets, general economic conditions and fluctuations in per share market value. As a result of these factors, results for any previous period should not be relied upon as being indicative of performance in future periods. |
| (8) | Weighted average net assets during the applicable period are used for this calculation. The following is a schedule of supplemental ratios for the years ended December 31, 2017, 2016, 2015, 2014 and 2013: |
| Year Ended December 31, | ||||||||||||||||||||
| 2017 | 2016 | 2015 | 2014 | 2013 | ||||||||||||||||
| Ratio of accrued capital gains incentive fees to average net assets |
— | — | (0.89 | )% | (0.37 | )% | 0.16 | % | ||||||||||||
| Ratio of subordinated income incentive fees to average net assets |
2.19 | % | 2.33 | % | 2.59 | % | 2.29 | % | 2.41 | % | ||||||||||
| Ratio of interest expense to average net assets |
3.44 | % | 3.33 | % | 3.19 | % | 2.56 | % | 1.97 | % | ||||||||||
| Ratio of excise taxes to average net assets |
0.23 | % | 0.25 | % | 0.26 | % | 0.21 | % | 0.22 | % | ||||||||||
150
Table of Contents
FS Investment Corporation
Notes to Consolidated Financial Statements (continued)
(in thousands, except share and per share amounts)
Note 11. Financial Highlights (continued)
| (9) | Asset coverage per unit is the ratio of the carrying value of the Company’s total consolidated assets, less liabilities and indebtedness not represented by senior securities, to the aggregate amount of senior securities representing indebtedness. |
Note 12. Selected Quarterly Financial Data (Unaudited)
The following is the quarterly results of operations for the years ended December 31, 2017 and 2016. The following information reflects all normal recurring adjustments necessary for a fair presentation of the information for the periods presented. The operating results for any quarter are not necessarily indicative of results for any future period.
| Quarter Ended | ||||||||||||||||
| December 31, 2017 |
September 30, 2017 |
June 30, 2017 |
March 31, 2017 |
|||||||||||||
| Investment income |
$ | 110,861 | $ | 103,691 | $ | 98,695 | $ | 106,064 | ||||||||
| Operating expenses |
||||||||||||||||
| Net expenses and excise taxes |
56,800 | 53,043 | 52,235 | 53,474 | ||||||||||||
|
|
|
|
|
|
|
|
|
|||||||||
| Net investment income |
54,061 | 50,648 | 46,460 | 52,590 | ||||||||||||
| Realized and unrealized gain (loss) |
(39,307 | ) | 34,750 | (28,018 | ) | 10,803 | ||||||||||
|
|
|
|
|
|
|
|
|
|||||||||
| Net increase (decrease) in net assets resulting from operations |
$ | 14,754 | $ | 85,398 | $ | 18,442 | $ | 63,393 | ||||||||
|
|
|
|
|
|
|
|
|
|||||||||
| Per share information-basic and diluted |
||||||||||||||||
| Net investment income |
$ | 0.22 | $ | 0.21 | $ | 0.19 | $ | 0.22 | ||||||||
|
|
|
|
|
|
|
|
|
|||||||||
| Net increase (decrease) in net assets resulting from operations |
$ | 0.06 | $ | 0.35 | $ | 0.08 | $ | 0.26 | ||||||||
|
|
|
|
|
|
|
|
|
|||||||||
| Weighted average shares outstanding |
245,725,416 | 245,678,745 | 245,107,405 | 244,554,969 | ||||||||||||
|
|
|
|
|
|
|
|
|
|||||||||
| Quarter Ended | ||||||||||||||||
| December 31, 2016 |
September 30, 2016 |
June 30, 2016 |
March 31, 2016 |
|||||||||||||
| Investment income |
$ | 108,978 | $ | 100,557 | $ | 110,211 | $ | 103,063 | ||||||||
| Operating expenses |
||||||||||||||||
| Net expenses and excise taxes |
57,436 | 51,554 | 53,371 | 53,125 | ||||||||||||
|
|
|
|
|
|
|
|
|
|||||||||
| Net investment income |
51,542 | 49,003 | 56,840 | 49,938 | ||||||||||||
| Realized and unrealized gain (loss) |
320 | 65,366 | 83,317 | (62,035 | ) | |||||||||||
|
|
|
|
|
|
|
|
|
|||||||||
| Net increase (decrease) in net assets resulting from operations |
$ | 51,862 | $ | 114,369 | $ | 140,157 | $ | (12,097 | ) | |||||||
|
|
|
|
|
|
|
|
|
|||||||||
| Per share information-basic and diluted |
||||||||||||||||
| Net investment income |
$ | 0.21 | $ | 0.20 | $ | 0.23 | $ | 0.21 | ||||||||
|
|
|
|
|
|
|
|
|
|||||||||
| Net increase (decrease) in net assets resulting from operations |
$ | 0.21 | $ | 0.47 | $ | 0.58 | $ | (0.05 | ) | |||||||
|
|
|
|
|
|
|
|
|
|||||||||
| Weighted average shares outstanding |
244,016,474 | 243,488,590 | 243,435,681 | 242,847,016 | ||||||||||||
|
|
|
|
|
|
|
|
|
|||||||||
151
Table of Contents
FS Investment Corporation
Notes to Consolidated Financial Statements (continued)
(in thousands, except share and per share amounts)
Note 12. Selected Quarterly Financial Data (Unaudited) (continued)
The sum of quarterly per share amounts does not necessarily equal per share amounts reported for the years ended December 31, 2017 and 2016. This is due to changes in the number of weighted-average shares outstanding and the effects of rounding for each period.
For the year ended December 31, 2017, 82.28% of net investment income distributions qualified as interest related dividends, which are exempt from U.S. withholding tax applicable to non U.S. shareholders.
152
Table of Contents
| Item 9. | Changes in and Disagreements with Accountants on Accounting and Financial Disclosure. |
None.
| Item 9A. | Controls and Procedures. |
Evaluation of Disclosure Controls and Procedures
We maintain disclosure controls and procedures that are designed to ensure that information required to be disclosed in our reports filed under the Exchange Act is recorded, processed, summarized and reported within the time periods specified in the SEC’s rules and forms and that such information is accumulated and communicated to our management, including our chief executive officer and chief financial officer, as appropriate, to allow for timely decisions regarding required disclosure. In designing and evaluating the disclosure controls and procedures, management recognizes that any controls and procedures, no matter how well designed and operated, can provide only reasonable assurance of achieving the desired control objectives, and management is required to apply its judgment in evaluating the cost-benefit relationship of possible controls and procedures.
As required by Exchange Act Rule 13(a)-15(b), we carried out an evaluation under the supervision and with the participation of our management, including our chief executive officer and chief financial officer, of the effectiveness of the design and operation of our disclosure controls and procedures as of December 31, 2017. Based on the foregoing, our chief executive officer and chief financial officer concluded that our disclosure controls and procedures were (a) designed to ensure that the information we are required to disclose in our reports under the Exchange Act is recorded, processed and reported in an accurate manner and on a timely basis and the information that we are required to disclose in our Exchange Act reports is accumulated and communicated to management to permit timely decisions with respect to required disclosure and (b) operating in an effective manner.
Management’s Annual Report on Internal Control Over Financial Reporting
Our management is responsible for establishing and maintaining adequate internal control over financial reporting. As defined in Exchange Act Rules 13a-15(f) and 15d-15(f), internal control over financial reporting is a process designed by, or under the supervision of, the company’s principal executive and principal financial officers, or persons performing similar functions, and effected by the company’s board of directors, management and other personnel, to provide reasonable assurance regarding the reliability of financial reporting and the preparation of financial statements for external purposes in accordance with GAAP.
Our internal control over financial reporting includes those policies and procedures that:
1. Pertain to the maintenance of records that, in reasonable detail, accurately and fairly reflect the Company’s transactions and the dispositions of assets of the Company;
2. Provide reasonable assurance that transactions are recorded as necessary to permit preparation of financial statements in accordance with generally accepted accounting principles, and that receipts and expenditures of the Company are being made only in accordance with authorizations of our management and board of directors; and
3. Provide reasonable assurance regarding prevention or timely detection of unauthorized acquisition, use or disposition of the Company’s assets that could have a material effect on the financial statements.
Because of its inherent limitations, a system of internal control over financial reporting can provide only reasonable assurance with respect to financial statement preparation and presentation and may not prevent or detect misstatements. Also, projections of any evaluation of effectiveness to future periods are subject to the risk that controls may become inadequate because of changes in conditions, or that the degree of compliance with the policies or procedures may deteriorate.
153
Table of Contents
Management’s report on internal control over financial reporting is set forth above under the heading “Management’s Report on Internal Control over Financial Reporting” in Item 8 of this annual report on Form 10-K.
Attestation Report of the Registered Public Accounting Firm
Our registered public accounting firm has issued an attestation report on our internal control over financial reporting. This report appears on page 85.
Changes in Internal Control Over Financial Reporting
During the quarter ended December 31, 2017, there was no change in our internal control over financial reporting (as defined in Exchange Act Rules 13a-15(f) or 15d-15(f)) that materially affected, or is reasonably likely to materially affect, our internal control over financial reporting.
| Item 9B. | Other Information. |
None.
154
Table of Contents
PART III
We will file a definitive Proxy Statement for our 2018 Annual Meeting of Stockholders with the SEC, pursuant to Regulation 14A promulgated under the Exchange Act, not later than 120 days after the end of our fiscal year. Accordingly, certain information required by Part III has been omitted under General Instruction G(3) to Form 10-K. Only those sections of our definitive Proxy Statement that specifically address the items set forth herein are incorporated by reference.
| Item 10. | Directors, Executive Officers and Corporate Governance. |
The information required by Item 10 is hereby incorporated by reference from the Company’s definitive Proxy Statement relating to the Company’s 2018 Annual Meeting of Stockholders, to be filed with the SEC within 120 days following the end of our fiscal year.
| Item 11. | Executive Compensation. |
The information required by Item 11 is hereby incorporated by reference from the Company’s definitive Proxy Statement relating to the Company’s 2018 Annual Meeting of Stockholders, to be filed with the SEC within 120 days following the end of our fiscal year.
| Item 12. | Security Ownership of Certain Beneficial Owners and Management and Related Stockholder Matters. |
The information required by Item 12 is hereby incorporated by reference from the Company’s definitive Proxy Statement relating to the Company’s 2018 Annual Meeting of Stockholders, to be filed with the SEC within 120 days following the end of our fiscal year.
| Item 13. | Certain Relationships and Related Transactions, and Director Independence. |
The information required by Item 13 is hereby incorporated by reference from the Company’s definitive Proxy Statement relating to the Company’s 2018 Annual Meeting of Stockholders, to be filed with the SEC within 120 days following the end of our fiscal year.
| Item 14. | Principal Accountant Fees and Services. |
The information required by Item 14 is hereby incorporated by reference from the Company’s definitive Proxy Statement relating to the Company’s 2018 Annual Meeting of Stockholders, to be filed with the SEC within 120 days following the end of our fiscal year.
155
Table of Contents
PART IV
| Item 15. | Exhibits, Financial Statement Schedules. |
a. Documents Filed as Part of this Report
The following financial statements are set forth in Item 8:
| Page | ||||
| Management’s Report on Internal Control over Financial Reporting |
84 | |||
| Report of Independent Registered Public Accounting Firm |
85 | |||
| Report of Independent Registered Public Accounting Firm |
87 | |||
| Consolidated Balance Sheets as of December 31, 2017 and 2016 |
88 | |||
| Consolidated Statements of Operations for the years ended December 31, 2017, 2016 and 2015 |
90 | |||
| Consolidated Statements of Changes in Net Assets for the years ended December 31, 2017, 2016 and 2015 |
92 | |||
| Consolidated Statements of Cash Flows for the years ended December 31, 2017, 2016 and 2015 |
93 | |||
| Consolidated Schedules of Investments as of December 31, 2017 and 2016 |
95 | |||
| Notes to Consolidated Financial Statements |
115 | |||
b. Exhibits
Please note that the agreements included as exhibits to this annual report on Form 10-K are included to provide information regarding their terms and are not intended to provide any other factual or disclosure information about the Company or the other parties to the agreements. The agreements contain representations and warranties by each of the parties to the applicable agreement that have been made solely for the benefit of the other parties to the applicable agreement and may not describe the actual state of affairs as of the date they were made or at any other time.
156
Table of Contents
The following exhibits are filed as part of this annual report or hereby incorporated by reference to exhibits previously filed with the SEC:
157
Table of Contents
158
Table of Contents
| * | Filed herewith. |
c. Financial statement schedules
No financial statement schedules are filed herewith because (1) such schedules are not required or (2) the information has been presented in the aforementioned financial statements.
159
Table of Contents
Pursuant to the requirements of Section 13 or 15(d) of the Securities Exchange Act of 1934, the registrant has duly caused this annual report to be signed on its behalf by the undersigned, thereunto duly authorized.
| FS INVESTMENT CORPORATION | ||||
| Date: March 1, 2018 |
/s/ MICHAEL C. FORMAN | |||
| Michael C. Forman Chief Executive Officer | ||||
Pursuant to the requirements of the Securities Exchange Act of 1934, this annual report has been signed below by the following persons on behalf of the registrant and in the capacity and on the dates indicated.
| Date: March 1, 2018 |
/s/ MICHAEL C. FORMAN | |||
| Michael C. Forman Chief Executive Officer and Director (Principal Executive Officer) | ||||
| Date: March 1, 2018 |
/s/ WILLIAM GOEBEL | |||
| William Goebel Chief Financial Officer (Principal Accounting and Financial Officer) | ||||
| Date: March 1, 2018 |
/s/ DAVID J. ADELMAN | |||
| David J. Adelman Director | ||||
| Date: March 1, 2018 |
/s/ GREGORY P. CHANDLER | |||
| Gregory P. Chandler Director | ||||
| Date: March 1, 2018 |
/s/ BARRY H. FRANK | |||
| Barry H. Frank Director | ||||
| Date: March 1, 2018 |
/s/ THOMAS J. GRAVINA | |||
| Thomas J. Gravina Director | ||||
| Date: March 1, 2018 |
/s/ MICHAEL J. HAGAN | |||
| Michael J. Hagan Director | ||||
| Date: March 1, 2018 |
/s/ JEFFREY K. HARROW | |||
| Jeffrey K. Harrow Director | ||||
| Date: March 1, 2018 |
/s/ MICHAEL HELLER | |||
| Michael Heller Director | ||||
| Date: March 1, 2018 |
/s/ PHILIP E. HUGHES | |||
| Philip E. Hughes Director | ||||
160
Table of Contents
| Date: March 1, 2018 |
/s/ PEDRO A. RAMOS | |||
| Pedro A. Ramos Director | ||||
| Date: March 1, 2018 |
/s/ JOSEPH P. UJOBAI | |||
| Joseph P. Ujobai Director | ||||
161