Attached files
| file | filename |
|---|---|
| EX-32.2 - EXHIBIT 32.2 - CommerceHub, Inc. | ex322chub123117.htm |
| EX-32.1 - EXHIBIT 32.1 - CommerceHub, Inc. | ex321chub123117.htm |
| EX-31.2 - EXHIBIT 31.2 - CommerceHub, Inc. | ex312chub123117.htm |
| EX-31.1 - EXHIBIT 31.1 - CommerceHub, Inc. | ex311chub123117.htm |
| EX-23.1 - EXHIBIT 23.1 - CommerceHub, Inc. | ex231consentofkpmgllp123117.htm |
| EX-21.1 - EXHIBIT 21.1 - CommerceHub, Inc. | ex211subsidiariesoftheregi.htm |
| EX-10.20 - EXHIBIT 10.20 - CommerceHub, Inc. | ex1020chub123117.htm |
| EX-10.19 - EXHIBIT 10.19 - CommerceHub, Inc. | ex1019chub123117.htm |
| EX-10.15 - EXHIBIT 10.15 - CommerceHub, Inc. | ex1015chub123117.htm |
| EX-10.12 - EXHIBIT 10.12 - CommerceHub, Inc. | ex1012chub123117.htm |
| EX-10.3 - EXHIBIT 10.3 - CommerceHub, Inc. | ex103chub123117.htm |
UNITED STATES
SECURITIES AND EXCHANGE COMMISSION
Washington, D.C. 20549
FORM 10-K
ý | ANNUAL REPORT PURSUANT TO SECTION 13 OR 15(d) OF THE SECURITIES EXCHANGE ACT OF 1934 |
For the fiscal year ended December 31, 2017
OR
¨ | TRANSITION REPORT PURSUANT TO SECTION 13 OR 15(d) OF THE SECURITIES EXCHANGE ACT OF 1934 |
For the transition period from _______ to _______
Commission File Number 001-37840
COMMERCEHUB, INC.
(Exact name of Registrant as specified in its charter)
Delaware (State or other jurisdiction of incorporation or organization) | 7372 (Primary Standard Industrial Classification code number) | 81-1001640 (I.R.S. Employer Identification No.) | ||
201 Fuller Road, 6th Floor, Albany, New York 12203
(address of principal executive office, including zip code)
Registrant's telephone number, including area code: (518) 810-0700
Securities registered pursuant to Section 12(b) of the Act:
Title of each class: | Name of each exchange on which registered: | |
Series A common stock, par value $0.01 per share | The NASDAQ Stock Market LLC | |
Series C common stock, par value $0.01 per share | The NASDAQ Stock Market LLC | |
Securities registered pursuant to Section 12(g) of the Act: None
Indicate by check mark if the registrant is a well-known seasoned issuer, as defined in Rule 405 of the Securities Act. Yes ý No ¨
Indicate by check mark if the registrant is not required to file reports pursuant to Section 13 or Section 15(d) of the Act. Yes ¨ No ý
Indicate by check mark whether the registrant (1) has filed all reports required to be filed by Section 13 or 15(d) of the Securities Exchange Act of 1934 during the preceding 12 months (or for such shorter period that the registrant was required to file such reports), and (2) has been subject to such filing requirements for the past 90 days. Yes ý No ¨
Indicate by check mark whether the registrant has submitted electronically and posted on its corporate Web site, if any, every Interactive Data File required to be submitted and posted pursuant to Rule 405 of Regulation S-T during the preceding 12 months (or for such shorter period that the registrant was required to submit and post such files). Yes ý No ¨
Indicate by check mark if disclosure of delinquent filers pursuant to Item 405 of Regulation S-K is not contained herein, and will not be contained to the best of registrant’s knowledge, in definitive proxy or information statements incorporated by reference in Part III of this Form 10-K or any amendment to this Form 10-K. ý
Indicate by check mark whether the registrant is a large accelerated filer, an accelerated filer, a non-accelerated filer, a smaller reporting company, or emerging growth company. See the definitions of "large accelerated filer," "accelerated filer," "smaller reporting company," and "emerging growth company" in Rule 12b-2 of the Exchange Act.
Large accelerated filer | ý | Accelerated filer | o | Non-accelerated filer | o | Smaller reporting company | o | |||
Emerging growth company | o | |||||||||
If an emerging growth company, indicate by check mark if the registrant has elected not to use the extended transition period for complying with any new or revised financial accounting standards provided pursuant to Section 13(a) of the Exchange Act. ¨
Indicate by check mark whether the registrant is a shell company (as defined in Rule 12b-2 of the Exchange Act). Yes ¨ No ý
As of June 30, 2017, the last business day of the registrant’s most recently completed second fiscal quarter, the aggregate market value of shares of the registrant’s common stock held by non-affiliates of the registrant (based upon the closing sale per-share price of $17.42 for our Series A common stock and $17.44 for our Series C common stock, in each case on the Nasdaq Global Market, and $17.40 for our Series B common stock on the OTC Markets) was approximately $711.4 million.
The number of outstanding shares of CommerceHub, Inc. common stock as of February 21, 2018 was:
Series A | Series B | Series C | ||
CommerceHub, Inc. common stock: | 13,599,641 | 707,567 | 29,199,753 | |
DOCUMENTS INCORPORATED BY REFERENCE
Portions of the registrant's Proxy Statement for its 2018 Annual Meeting of Stockholders are incorporated by reference in Part II, Item 5, and Part III of this Annual Report on Form 10-K to the extent stated herein. Such Proxy Statement will be filed with the Securities and Exchange Commission within 120 days of the Registrant's fiscal year ended December 31, 2017.
TABLE OF CONTENTS
PART I. | |
PART II. | |
Part III. | |
PART IV. | |
Cautionary Note Regarding Forward-Looking Statements
This Annual Report on Form 10-K contains forward-looking statements within the meaning of the Private Securities Litigation Reform Act of 1995, including statements about future business strategies, future financial performance, cost savings, market conditions and potential, future growth of ecommerce, customer growth and performance, sales channel expansion, international expansion and other matters that are not historical facts. In particular, statements under Item 1 "Business," Item 1A "Risk-Factors," Item 7 "Management's Discussion and Analysis of Financial Condition and Results of Operations" and Item 7A "Quantitative and Qualitative Disclosures About Market Risk" contain forward-looking statements. These statements involve risks, uncertainties, estimates and assumptions, many of which are beyond our control, that could cause actual results to differ materially from those expressed or implied in such statements, including, without limitation, market acceptance and performance of our products and services, competitive issues, general market conditions, regulatory matters and changes in law affecting our business, and the risk factors described in this Annual Report on Form 10-K under Item 1A "Risk Factors.” Further, we operate in a very competitive and rapidly changing environment, and new risks emerge from time to time. It is not possible for our management to predict all potential risks or assess their potential effects on our business.
Forward-looking statements set forth herein speak only as of the date of this Annual Report on Form 10-K, and we expressly disclaim any obligation or undertaking to disseminate any updates or revisions to any such statement contained herein to reflect any change in our expectations with regard thereto or any change in events, conditions or circumstances on which any such statement is based. Where, in any forward-looking statement, we express an expectation or belief as to future results or events, such expectation or belief is expressed in good faith and believed to have a reasonable basis, but there can be no assurance that the expectation or belief will result or be achieved or accomplished. There can be no assurance that any expectation or belief expressed in a forward-looking statement will occur, and you should not place undue reliance on any forward-looking statements.
As used herein, "CommerceHub," "we," "us," "our," the "Company" and similar terms include CommerceHub, Inc. and its subsidiaries, unless the context indicates otherwise.
This report contains references to our trademarks and service marks and to those belonging to other entities. Solely for convenience, trademarks and trade names referred to in this report may appear without the ® or ™ symbols, but despite the omission of such symbols we intend to assert our rights or the rights of the applicable licensor to these trademarks and trade names. We do not intend our use or display of other companies' trade names, trademarks or service marks to imply a relationship with, or endorsement or sponsorship of us by, any other companies.
PART I.
Item 1. Business
Overview
We are a leading provider of cloud-based ecommerce fulfillment and marketing solutions for large retailers, marketplaces, consumer brands and their suppliers. Our solutions help our customers implement strategies to increase their ecommerce revenues and create meaningful operational efficiencies within their supply chains. Our customers use our cloud-based software and service capabilities, which are tailored for specific customer business rules and processes, to more effectively fulfill consumer orders, generate consumer demand for their products and deliver those products to consumers.
Since the beginning of ecommerce, retailers and brands have faced significant financial and operational difficulties transitioning their businesses to digital environments. For example, retailers have been challenged by the task of providing their customers with the large selection of products that they expect and increasingly demand. Buying larger assortments of products from suppliers and storing them in inventory requires significant capital investment for retailers. Similarly, operating warehouses equipped with the capabilities needed to receive and prepare orders for shipment is complex and expensive. CommerceHub helps to solve these problems by helping retailers leverage the "virtual inventory" of thousands of suppliers. Through CommerceHub’s platform, retailers and suppliers can share product information and inventory data, and process customer orders that are drop-shipped with the retailer's branding and delivery speed promises. In addition, by connecting with our large network of retailers and other demand channels, brands and suppliers are able to proactively unlock new sources of demand for their products. For example, rather than relying exclusively on their legacy wholesale relationships and the consumer demand generated by their own websites, brands are able to extend their reach by selling through additional retailers and online marketplaces, such as Amazon and eBay.
We provide our solutions to our customers through two offerings that are delivered through our cloud-based CommerceHub software platform and complementary services.
CommerceHub for Retailers. Retailers and online marketplaces use CommerceHub to increase their online revenue through an “asset-light” fulfillment strategy called drop-shipping, where products are sold online by a retailer and then drop-shipped directly to a retailer’s customer by the supplier. Our platform enables retailers to expand their product offerings without the economic and logistical limitations and risks typically associated with buying, storing and shipping physical inventory. Our network of over 11,000 drop-ship-capable suppliers are able to receive orders from retailers and rapidly deliver products directly to consumers.
CommerceHub for Brands. Brands and other marketplace sellers use CommerceHub to grow their online revenue by selling their products through retailers and marketplaces. Our platform gives brands and other sellers greater exposure to consumer demand through access to, and product listing management capabilities for, many of the largest and most important sales channels in North America, including major retailers, online marketplaces and other demand channels, such as social and product advertising.
A core set of software and service capabilities underpin both our retailer and brand offerings. Our platform facilitates rapid, cost-efficient, on-time delivery of products to consumers with greater control of, and visibility into, the consumer experience through more dynamic and intelligent use of third-party logistics (“3PL”) providers and national, regional, local and specialty delivery companies. For example, our SmartShipping solution enables retailers to automatically adjust carrier service levels to help meet consumer delivery promise dates in the most cost-effective manner available based on the geographical location of the inventory and the consumer. To help reduce delivery times, our network of 3PL partners helps retailers and other sellers distribute inventory to locations that are closer to a wider distribution of their customers, enabling them to meet their customers' delivery expectations while reducing the associated delivery costs.
Complementing the software capabilities common to our retailer and brand offerings, our customers form a collective trading partner network where retailers, marketplaces, brands and their suppliers are able to conduct business with each other through the CommerceHub platform. Each trading partner on the network is able to integrate to CommerceHub using file formats and messages native to their own internal information systems, and CommerceHub acts as a centralized integration hub that translates individual messages into the format required by each of their trading partner's disparate systems. This approach is effective at reducing the overall cost and complexity of conducting business because each trading partner needs to manage only their integration to CommerceHub, instead of having to manage and maintain multiple integrations to the thousands of other trading partners also connected to CommerceHub. Additionally, the operational risk of transitioning an existing drop-ship supply chain to CommerceHub is reduced because over 11,000 brands and distributors are already connected to our network, and we have over 20 years of experience setting up and maintaining these integrations with significant operational efficiency.
1
Supply Chain Transformation from the Secular Shift of Retail Spending into Ecommerce
Consumers are increasingly shopping for products online using ecommerce channels such as online retailers and marketplaces because of convenience and large product selections. As consumer spending shifts into these online channels, retailers and brands are discovering that their existing supply chains are not set up to efficiently manage the order fulfillment process. Before ecommerce, retailer and brand supply chains were focused inward and were optimized to manage the physical assets owned and managed by the retailer or brand. Coordination between trading partners took place through negotiated replenishment orders that arranged for the infrequent movement of large quantities of physical goods between parties. Warehouses owned and managed by retailers were designed to support receiving goods from brands and distributors, and shipping of goods to physical stores, in quantities that were batched into large bulk shipments. Conversely, warehouses owned and managed by brands and distributors were designed to receive goods from manufacturers and importers and to ship goods to retailers in bulk shipments. Only specialized catalog and TV-based retailers were adept at packaging single products into individual shipments to consumers at high volume.
The rise of ecommerce has fundamentally transformed, and continues to transform, supply-chain design. As traditional retailers started to sell online, they retro-fitted a portion of their warehouses to enable direct-to-consumer fulfillment. However, the growth of ecommerce order volumes has proved too much for many retailers to handle on their own. Retail organizations have faced difficult strategic decisions on whether to invest significant amounts of financial and human capital to increase fulfillment capacity by building and stocking new warehouses, or to outsource those functions to their suppliers. In many cases, shifting inventory management and fulfillment responsibilities to suppliers has benefited both retailers and suppliers. Retailers have been able to increase revenues without corresponding increases in capital investments, and their suppliers, including brands and distributors, have been able to increase their own revenues because the retailers have been able to list more of their products for sale online. This approach, called drop-shipping, has fundamentally changed the way trading partners interact as their relationships, and the supply chains built to support those relationships, have moved from low-volume replenishment orders to high-volume drop-ship orders.
The current landscape of global ecommerce requires sellers to integrate their supply chains and information systems to a variety of third parties, including retailers, online marketplaces, search engines and fulfillment sources, such as brands, distributors and 3PL providers. The relationships retailers and brands have with third parties form a network of distributed commerce where each party acts as a trading partner playing a role to support the business of other trading partners. Through CommerceHub, our customers are able to integrate their systems to our software platform to extend the reach and capability of their supply chains to include the capabilities of their other trading partners.
Software Platform and Trading Partner Network
Our customers include over 11,600 retailers, online marketplaces, brands and other suppliers that use our platform every day to conduct business with each other, including processing orders and invoices, exchanging product information and other electronic documents, and tracking their customers’ buying experience from order through fulfillment and delivery. Our customers include many of North America’s largest retailers and brands, who use CommerceHub to generate consumer demand, fulfill customer orders and facilitate the delivery of products to customers. We estimate that, in 2017, our customers used CommerceHub to enable the fulfillment of goods worth an estimated $16 billion in gross merchandise value ("GMV"). As described in more detail below under "—Our Revenue," the majority of our revenue is variable and tied to order fees that are primarily based on the volume of customer activity we enable on our platform.
Collectively, our customers and the other trading partners on our platform comprise a vast network of retailers, brands, other suppliers, online marketplaces, demand channels and other trading partners that constitute a critical mass of many of the largest and most influential companies in North American ecommerce. This critical mass has helped us achieve a meaningful network effect, attracting new brand customers to our large network of retailers and demand channels, and attracting new retailer and demand channel customers to our network of thousands of suppliers, enabling us to grow our business with a comparatively low cost of customer acquisition.
Our Growth Strategy
In any given year, the majority of our revenue tends to come from our existing customers, and we structure our customer relationships so that the majority of our revenue is earned through order fees, which are primarily driven by the volume of customer activity on our platform. We believe there are three distinct drivers of volume growth on our platform. First is the secular shift of retail into the ecommerce channel, which has provided a natural tailwind for us where activity on our platform (and thus, our revenue) has increased as more consumers shop online. Next is our ability to increase the share of our customers’ overall ecommerce GMV that is transacted through our platform, which we refer to as our “GMV share.” When we increase our GMV share with customers, we achieve additional volume growth in excess of the organic growth rate of those customers. Finally, we have the ability to sign new retailer and brand customers, which provides additional revenue through
2
setup and professional services fees, subscription fees and, as these new customers ramp up their adoption of our platform, order fees. Today, the majority of our customers are located in the United States and Canada. In 2017, we signed our first retailer customer in the United Kingdom, and we believe this was an initial step toward growing revenue through the signing of European retailer customers.
In addition, we seek to increase our revenue through a combination of upselling new software features and cross-selling opportunities with our existing customers. These opportunities include:
• | expanding the number of retailer-to-supplier connections within our existing customer base; |
• | leveraging our expansive trading partner network of retailer and marketplace customers to attract new brands and other suppliers, and leveraging our expansive network of suppliers to attract new retailer and marketplace customers; |
• | enabling our existing customers to more easily sell and promote their product assortments through newly emerging ecommerce channels, such as social networks; and |
• | continuing to develop new and innovative solutions and features that help our customers capture a larger share of the growing ecommerce market to further increase the volume of ecommerce transactions processed through our platform. |
Our Role as Strategic Partner
CommerceHub is generally viewed as a "mission critical" partner to our customers. Our solutions address some of the most important issues facing online sellers today. Retailers and brands that sell direct-to-consumer face a challenging market environment characterized by flat-to-declining retail store sales, more demanding consumer expectations in terms of product availability and delivery, and the proliferation of emerging search and social ecommerce channels to convert sales. Our platform and solutions enable our customers to meet these market challenges and more efficiently grow their online sales.
We have a long history of successfully helping our customers reduce the overall complexity of their trading partner relationships to help them grow their revenue through ecommerce in a capital-efficient manner. In addition, our solutions help our customers grow their online sales by facilitating more rapid fulfillment of orders and enabling them to capture more consumer demand through online marketplaces, social and product advertising and other demand channels. Many of our retailer and marketplace customers use our solutions to enable a large percentage of their overall online sales, and our brand and other supplier customers use our solutions to tap into direct-to-consumer demand. In each case, our solutions help our customers better coordinate and manage their fulfillment and delivery capabilities with greater visibility to ensure a positive consumer experience. We believe that this combination of "supply" (enabling the fulfillment of consumer orders through a network of suppliers), "demand" (connecting sellers to consumer demand by facilitating access to demand channels) and "delivery" (facilitating rapid, cost-efficient, on-time delivery to consumers) solutions is unique in our industry and provides us with a compelling platform to continue to successfully grow our business.
Because our solutions play a critical role in helping our customers manage a complex array of business relationships in a highly competitive retail environment, we have benefited from strong loyalty and enduring, long-term relationships with many of our customers. We believe we are becoming an increasingly strategic partner to our customers as we become more deeply integrated into their systems and go-to-market efforts, as our GMV share increases, and as more retailers, marketplaces, brands and suppliers connect into the CommerceHub platform.
We also enhance our platform through value-added capabilities that we continue to develop, many of which are based on feedback we receive from our customers about challenges they face in their ecommerce businesses. For example, the following capabilities solve unique issues related to virtual inventory fulfillment:
• | managing high drop-ship order volumes with multiple parties: each order a retailer receives must be managed with at least one third-party supplier that fulfills the order on the retailer's behalf, which is more complex than traditional direct fulfillment, as the retailer is entrusting an important part of the customer experience to an outsourced supplier, and this complexity increases exponentially when scaled across large retailer supplier networks and transaction volumes; |
• | retailer branding requirements: retailers frequently want the multi-party drop-ship fulfillment process be invisible to the consumer, which requires that third-party suppliers include retailer-branded packing slips and other materials in shipments to consumers; |
• | insight, analytics and proactive error resolution: retailers must monitor and track a high volume of drop-ship orders and identify shipments that are at risk of missing the consumer's delivery promise date; and |
• | coordination with third-party logistics providers: our ability to integrate with 3PL providers enables retailers and suppliers to locate inventory closer to broad distributions of consumers, helping them to increase delivery speeds and reduce delivery costs. |
3
• | product content collection and compliance: before retailers can sell products online, they must collect detailed digital product information from their suppliers, including descriptions, titles, prices and images. Suppliers maintain and manage product information in disparate databases and formats that are not compliant with retail-specific requirements. Our software provides retailers with the ability to more efficiently collect product information from suppliers and then transform their digital assets into a format that can be more easily imported into a retailer’s own information systems to reduce the time it takes to post products for sale online; and |
• | ship-to-store and omnichannel capabilities: many brick and mortar retailers are relying heavily on omnichannel strategies that provide for more effective coordination between online and offline channels. Our ship-to-store capabilities enable retailers to drop ship products directly to specific physical retail store locations, providing consumers with more flexible and convenient delivery options. |
Our Industry
Ecommerce has grown significantly over the last several years as consumers have increasingly shifted retail purchases from traditional "brick-and-mortar" stores to online stores and marketplaces. This growth has been attributable to a number of factors, including:
• | the availability of a broader selection of merchandise online; |
• | consumer convenience and ease of use; |
• | more competitive and transparent pricing; |
• | increased functionality and reliability of ecommerce websites; |
• | the emergence of mobile-connected devices and specialized websites; |
• | the proliferation of online distribution channels; and |
• | the reduction in "brick-and-mortar" locations for many retailers. |
As a result of these and other factors, consumers today have more options to discover, research and purchase products online. Although these ecommerce growth drivers create significant opportunity for sellers, they also create additional complexities and challenges. Retailers and brands seeking new avenues to expand their online sales must manage product data, transactions and delivery promises across hundreds of highly fragmented online channels with different requirements for conducting business, varying data attributes and other technical requirements, evolving business models and competitive pressure to increase the pace of innovation.
In addition to the shift toward ecommerce retailing, organic growth of the economy and consumer spending provides an additional tailwind. In this environment, well-run brick-and-mortar retailers have increasingly focused on optimizing the interplay between their physical and online storefronts. This omnichannel approach enables customers to shop and interact between channels in a more fluid manner. For example, shoppers can buy a product online but pick it up in-store, retailers can use their stores as warehouses, fulfilling online orders through in-store delivery or by shipping items from their stores, and shoppers can return products purchased online to in-store locations. An omnichannel strategy enables a retailer to position its physical storefront not as a liability, but rather as part of a strategy to provide consumers with a more consistent, convenient and effortless retail experience, regardless of how they choose to engage the retailer. As a result of their success, we believe that omnichannel strategies represent an increasingly significant component of all retailers' revenue mix.
Growth in ecommerce spending has consistently outpaced overall growth in retail sales, a trend that is expected to continue. Based on data from the U.S. Department of Commerce, ecommerce spending in the U.S. has grown at a compound annual rate of approximately 15% since 2010, exceeding $450 billion in 2017 when it amounted to approximately 8.9% of all retail sales. During the same period, total non-inflation adjusted retail sales, offline and online, grew at a compound annual rate of approximately 4.2%.
Ecommerce Fulfillment Industry Background
The ecommerce fulfillment industry enables thousands of retailers around the world to transact and grow their relationships with tens of thousands of suppliers. Additional participants in this market include 3PL providers, parcel carriers and other delivery companies, fulfillment and warehousing providers and sourcing companies. Supply chain management involves communicating data about the goods themselves, data related to the exchange of goods among these trading partners, and information about the many thousands of companies who are members of the supply chain community. At virtually every stage of the supply chain, there are inefficient, labor-intensive processes between trading partners with administrative and communication requirements, such as the exchange of product information between retailers and suppliers for the purpose of listing products for sale and verifying the status of goods before shipment, while in transit and upon delivery, to ensure that consumers receive the products they ordered by the date promised. Mistakes made during these processes negatively impact trading partners and their businesses, either through penalties that counterparties impose or through poor consumer experiences that discourage future purchases. Ecommerce fulfillment solutions must address trading partners' needs for integration,
4
collaboration, connectivity, visibility and data analytics to improve the speed, accuracy and efficiency with which goods are ordered and supplied.
The industry initially focused on electronically connecting retailers and suppliers over the Internet to avoid costly and error-prone manual, paper and fax-based communication processes. The next evolution included automating and streamlining these fulfillment transactions between retailers, suppliers and others in the supply chain, ensuring orders were placed accurately and quickly and that goods were delivered on time and in accordance with the retailer's requirements. As familiarity and acceptance of cloud-based services continues to accelerate, we believe that ecommerce participants, both large and small, will continue to turn to cloud-based solutions such as ours for their supply chain integration needs.
Traditional Solutions
Traditional ecommerce fulfillment solutions implemented using on-premise licensed software tend to focus primarily on fulfillment automation within a single facility and among a small network of trading partners. On-premise software provides connectivity between only one organization and its trading partners and typically requires significant time and technical expertise to configure, deploy and maintain, and to accommodate new trading partners added to the network. On-premise software licensors primarily link retailers and suppliers through the Electronic Data Interchange, also known as "EDI," protocol, which enables the structured electronic transmission of data between organizations. Because of set-up and maintenance costs, technical complexity and a growing volume of requirements from retailers, the traditional software model is not well-suited for many retailers and suppliers, especially where the network includes small and medium-sized suppliers with disparate systems and smaller information technology budgets.
Additionally, the traditional approach to supply chain automation involves a system architecture made up of many point-to-point connections between retailers and their suppliers. These multiple connections are inherently error-prone and can be difficult to adapt to changing requirements and market circumstances. For instance, if there is a broad trend in the market that many members of a retailing segment would like to adopt, a supplier would be faced with a series of enhancements, on a one-by-one basis, to each connection they have with their retailer relationships. Lacking flexibility, adaptability and ability to scale, traditional approaches do not have the dynamic architectural capabilities necessary for retailers and suppliers to maximize the opportunities presented by the rapid evolution of market trends.
Expansion of Product Assortments
While online retailing has removed the shelf-space constraints placed on retailers wanting to offer a large product assortment to consumers, it has not removed the physical and operational constraints of storing products in inventory and picking, packing and shipping them to consumers quickly when they are ordered. In fact, the need to offer massive numbers of products for sale online has put more pressure on retailers to substantially increase capital investments in more expansive inventories and larger, more sophisticated warehouse and distribution operations. As an alternative to expensive product and infrastructure investment, however, retailers looking to increase the number of products they offer often turn to third-party fulfillment mechanisms, specifically drop-ship fulfillment, to expand their assortments through virtual inventory. With drop-shipping, a retailer is able to take a consumer's order and provide it to a supplier that then delivers the product directly to the consumer. The consumer perceives that the product was received directly from the retailer, even though the retailer never touched the ordered item.
Each retailer imposes unique specifications on their trading partners for electronically communicating supply chain information. These specifications set the standards for transmitting and acknowledging invoices, inventory reporting, purchase orders and shipping notices. Suppliers that transact with multiple retailers need to accommodate different specifications for each retailer, which often vary based on a retailer's size, industry and technological capabilities. Suppliers that fail to comply with a retailer's specifications risk errors with processing orders and compliance fines, and recurring performance issues may cause a retailer to discontinue its relationship with a supplier. As a result, suppliers are increasingly seeking out solutions to help them manage these challenges and improve their service levels with the retailers they supply.
Before a retailer can list a supplier's products on its website, it must import the supplier's product content data, transform that data into a format that the retailer's online storefront supports, and then enhance the data in a way that makes the product appear more compelling to consumers. This process includes rewriting product titles and descriptions, creating additional data attributes that describe the products, and manipulating product images to conform to the retailer's standards. All of this work falls under the responsibility of individual retailer and supplier employees, who frequently rely on general purpose software and tools, such as email and spreadsheets, to accomplish these tasks, resulting in labor-intensive and error-prone processes with no activity tracking or management capabilities. The inefficiency of this process directly impacts a retailer's financial performance by increasing the amount of time and resources required to list products for sale online, or by reducing the number of products a retailer is able to carry online due to capacity constraints resulting from the manual tasks. A similar
5
exercise takes place in the context of an online marketplace, where sellers must list products for sale and describe them in a manner that conforms to the marketplace's requirements.
Driving Demand
Ecommerce is a large and global market that continues to expand. However, it is also an increasingly complex and fragmented market due to the hundreds of channels available to sellers and the rapid pace of change and innovation across those channels. Historically, a retailer or brand might have simply established an online storefront and used a basic paid search program to drive traffic to its website. Today, however, in order to gain consumers' attention in a more crowded and competitive online marketplace, many retailers and an increasing number of consumer brands sell their merchandise through an omnichannel strategy where each channel has its own rules, requirements and specifications. In addition, retailers and brands often seek to sell their products in multiple countries, each with its own local consumer preferences and behaviors.
The fragmentation and increasing complexity of ecommerce channels are placing greater demands on retailers and brands that seek to grow their online sales. These sellers need omnichannel solutions that enable them to integrate their product offerings and inventory across multiple online channels. Traditional solutions, however, typically suffer from several limitations. In-house solutions are often costly, slow to implement and difficult to keep current. External solutions are often too narrowly tailored or aimed at helping sellers manage a single online channel or single category of channels rather than multiple platforms in a unified approach.
Delivering Products
From the consumer's perspective, an ecommerce transaction is not complete until the ordered products arrive at their doorstep. There is room for error in even the simplest fulfillment process, where a retailer is operating a single distribution facility with a small inventory of products, and the complexity of having a large network of third-party drop-ship suppliers and third-party fulfillment providers significantly increases the likelihood of error. Instead of managing a single distribution facility, a retailer must ensure that hundreds, and potentially thousands, of third-party suppliers are shipping the correct product to the correct consumer address and that the product will arrive at the consumer's doorstep by the date the retailer promised. Every ecommerce order must be split into its component "line items" and transmitted to the relevant supplier, which must then select the appropriate carrier service level to meet the delivery promise date. Unless the retailer is able to manage this process across its network of suppliers, the retailer risks uncontrolled costs as each supplier makes its own shipping decisions and then charges back to the retailer the cost of delivery. The consequences of poor supplier network performance are even more significant, as the consumer will blame the retailer for any fulfillment problems caused by the third-party supplier or fulfillment provider, thus damaging the customer's perception of the retailer's brand.
Our Solutions and Capabilities
Our solutions are designed to fulfill our product strategy of unifying disparate sources of demand, supply and delivery. Within our CommerceHub for Retailers and CommerceHub for Brands software and service offerings, our solutions help retailers, marketplaces, brands and suppliers reduce the complexity of selling products through online sales channels, including sourcing through multiple suppliers, selling on emerging online sales channels and delivering products to consumers.
Beyond the cloud-based software required to build and operate successful ecommerce strategies, our solutions include highly targeted services that help our customers rapidly adopt and maximize the utility of our offerings. By combining our software with value-added services, we enable easier adoption of the most effective strategies and tactics for product merchandising, online marketing and product delivery.
Our solutions include:
Assortment Expansion through Drop-Ship Fulfillment. The core CommerceHub solution enables our retailer customers to communicate electronically with their drop-ship suppliers through a single, integrated connection. Through this "virtual inventory" solution, retailers are able to link their order management systems to each supplier's system to exchange order processing data in compliant formats, allowing for better order and inventory coordination. By using our platform, retailers are able to communicate orders to their suppliers, view data indicating the inventory quantity each supplier has available, receive updates regarding the shipment of orders, view reports that describe each supplier's fulfillment performance and receive notifications when exceptions in the fulfillment process occur. Suppliers are able to receive and manage orders from multiple retailers through a web-based application (or a system-to-system connection for high-volume suppliers) and print retailer-branded packing slips for their shipments to consumers, all while complying with each retailer's unique and exacting requirements without needing to understand the retailer's underlying technical protocols. Retailers using our assortment expansion solution are able to compete more effectively in the market through the operation, at scale, of various delivery strategies, including drop-shipping, ship-to-store, in-store special orders and optimized delivery.
6
Our assortment expansion solutions include the following capabilities:
• | Distributed Inventory Management—Our inventory management capability enables retailers to receive aggregated and geographically identified inventory data feeds from a large network of suppliers. Instead of manually receiving and processing individual inventory feeds separately for each of their suppliers, our inventory management capability aggregates disparate inventory data files and provides the resulting output to the retailer in a transformed file format that can be imported directly into the retailer's inventory management software to provide an updated view of the products available for sale from its suppliers and to avoid listing out-of-stock products as available for sale. Including geographic location information in the inventory data feed enables retailers to select more efficient and cost-effective delivery methods, facilitating product shipment from warehouses that are closer to the delivery destination. |
• | Compliance Management—Our compliance management capability tracks supplier delivery performance, which is then aggregated and presented to the retailer in the form of performance reports and supplier "scorecards." These scorecards provide a snapshot of each supplier's fulfillment performance, helping our retailer customers better manage and assess the performance of their supplier network. Retailers can also use this enhanced visibility to identify trends and address systemic issues across their supplier network to improve the consumer experience by increasing the pace and accuracy of order fulfilment. This capability also benefits suppliers by helping them improve performance and increase their volumes with retailers. |
• | Returns Management—Our returns management capability helps retailers manage the process of accepting returns from consumers. |
• | LTL and Special Order Management—Our "Less-Than-Truckload" ("LTL") shipping and special order capabilities provide detailed visibility and management tools to facilitate the fulfillment of complex orders that require the coordination of several parties, including third-party delivery agents and installers. |
• | Product Content Collection, Management and Syndication—Our product content capabilities enable retailers to automate the process of communicating their product content specifications to suppliers and enable suppliers to more efficiently upload their product catalog into CommerceHub's cloud-based environment in a format that complies with the retailer's requirements, thereby reducing the time and effort required for retailers to list new products for sale. Through our cloud-based software, the retailer is able to efficiently collect and manipulate product content so that it meets the retailer's specifications and then export the compliant content to its website to expedite the process of adding products to their assortment. |
Consumer Demand Generation. Our demand channel solutions enable sellers to upload their entire product catalog to our platform and then transform and syndicate that product catalog to a wide array of ecommerce demand channels to facilitate consumer demand generation. Unlike competing solutions, our platform acts as the single source for a seller's entire product offering with the capability to transform product data into a format that is tailored to each demand channel's unique requirements. Instead of the time-consuming process of managing point-to-point integrations with online demand channels, sellers can upload their product catalog once and then create content rules that transform and map the data in a way that is optimized for each channel.
Our demand channel solutions facilitate multiple revenue-enhancing strategies for retailers and brands and include the following capabilities:
• | Cross-Channel Optimization for Online Marketplaces—Our channel optimization capabilities provide the ability for retailers and brands to sell through an array of online marketplaces, such as Amazon, eBay, Walmart Marketplace and Jet.com, while maintaining compliance with each marketplace's technical requirements. Sellers list the products they have for sale and provide price and inventory updates to the marketplace on an ongoing basis. When consumers buy products, our cloud-based software tracks the orders from the marketplaces to the seller for fulfillment. |
• | Cross-Channel Optimization for Digital Advertising—Our channel optimization capabilities for digital advertising manage the listing and configuration of product advertisements on a variety of different ecommerce marketing channels, including Google and social networks such as Facebook and Pinterest. Leveraging the data provided by the product catalog capability of our demand channel solutions, the digital advertising capability enables sellers to optimize performance on supported ecommerce marketing channels by simplifying the process of managing a large number of online advertisement campaigns per channel. A seller that wants to create and manage hundreds of online advertisement campaigns on Google can significantly reduce their workload through one process, managed through our software, which uses content rules to replicate campaign configuration across hundreds of campaigns. |
7
Enhanced Delivery Experience. Our solutions for enhanced delivery experience help retailers and suppliers improve the efficiency of their consumer delivery networks through the application of algorithms that optimize shipping decisions and more effectively allocate physical product inventory across fulfillment locations.
Our solutions for enhanced delivery experience include the following capabilities:
• | Shipping Optimization—Our shipping optimization capability enables retailers to use efficient algorithms to make shipping decisions that help our retailer customers reduce costs and delivery times and meet consumer promise dates. For example, retailers can use our solutions to automatically downgrade a shipment from the two-day priority service level to the more cost-effective ground service level if shipment via ground will meet the consumer's delivery promise date. Alternatively, a retailer can upgrade the service level of shipments that are at risk of arriving to the consumer late, based on the geographic location of the consumer, the supplier shipping the product and the date by which the consumer was promised delivery. |
• | Integrated Third-Party Logistics Providers—Our integrated 3PL capability enables retailers and suppliers to partner with 3PL providers and place physical inventory in warehouses located closer to a broader distribution of consumers. These integrated 3PL providers are then able to act as suppliers to the retailer or supplier and ship products to consumers that are located near the 3PL providers' facilities, which reduces delivery costs and increases delivery speeds. |
Our Revenue
Our revenue primarily consists of fees charged to retailers and suppliers utilizing our CommerceHub for Retailers and CommerceHub for Brands offerings, including use of our drop-ship and demand channel solutions. Our “core drop-ship revenue” represents retailer, supplier and brand revenue derived from our customer relationships with retailers and includes order fees, subscription and other platform fees and set-up and professional services fees. Our revenue also consists of fees charged to consumer brands, distributors, retailers and other marketplace sellers using our demand channel and related solutions, which we refer to as "demand channel revenue."
Order fee revenue accounted for 54% of our total revenue for the year ended December 31, 2017 and is attributable to fees charged to retailers and suppliers based on the volume of consumer orders processed through our platform using our drop-ship solutions. We charge these fees on a per-order basis, or pursuant to minimum order commitments required to be maintained by a customer under their contract with us. Order fee revenue grows as the overall volume of goods purchased online through our retailer customers increases. We track and measure order fee revenue because it corresponds to our customers' drop-ship activity on our platform.
Subscription and other platform revenue accounted for 32% of our total revenue for the year ended December 31, 2017 and is attributable to subscription fees charged to retailers and suppliers for the use of our drop-ship solutions. A customer's subscription and other platform fees are based on several factors, including, for example, the number and type of trading partners that a customer is connected to through our platform and the adoption of certain available feature upgrades that enhance the functionality of our platform. Subscription and other platform revenue tends to grow as new customers join the platform, connect to and create new relationships with other trading partners, adopt new features and upgrades, and ramp up their activity on the platform. Subscription and other platform revenue also includes other drop-ship platform fees for activity related to our delivery-related solutions, inventory management, third-party communication capabilities and other platform activities related to ecommerce relationships. We track and measure subscription and other platform revenue because it provides insight into the size and scope of our platform in terms of total trading partner customers, relationships among those customers and the extent of their engagement with our platform.
Set-up and professional services revenue accounted for 6% of our total revenue for the year ended December 31, 2017 and includes fees for the configuration, design and set-up of a customer's onboarding to our drop-ship solution and other services that we provide to new and existing customers on our drop-ship solution, including highly targeted services that are focused on helping our customers to more quickly adopt our drop-ship solutions and maximize their utility. We track and measure set-up and professional services revenue as it is an indication of new trading partner connections, enhancements to existing customer connections and the extent of customers' engagement with our platform's capabilities.
Demand channel revenue accounted for 8% of our total revenue for the year ended December 31, 2017 and includes set-up, professional services, subscription fees and other fees related to the volume of online sales and orders that retailers, sellers and brands achieve using our demand channel solutions. We track and measure demand channel revenue because it represents our customers' engagement and success with our demand channel solutions.
Our revenue is currently generated primarily from the United States and Canada. For financial information related to the geographic areas in which we do business, see Note 2 to the accompanying audited consolidated financial statements.
8
No single customer accounted for more than 10% of our total revenue in any of the years ended December 31, 2017, 2016 or 2015. However, our revenue model is primarily based on retailer and supplier program relationships whereby many revenue-generating supplier transactions conducted through our platform may be attributable to a single retailer ("Total Program Revenue"). For the year ended December 31, 2017, there were seven customers with Total Program Revenue that accounted for more than 5% each of our total revenue, two of which had Total Program Revenue that accounted for between 10% and 15% each of our total revenue.
Seasonality
Ecommerce is affected by the same seasonality as traditional brick-and-mortar retail, and many of our customers typically realize a significant portion of their sales in the fourth quarter of each calendar year. Although our customers do not all experience the same seasonal variation, and some customers may have seasonal peaks that occur in periods other than the fourth quarter, the seasonality of our customers' businesses impacts our financial results and may become more concentrated as we continue to expand our solutions to more customers. If our customer base changes to include more customers that experience more concentrated seasonal variation, our revenue may fluctuate significantly among quarters. Historically, the percentage of our annual revenue has been relatively uniform over the first three quarters of the year with approximately 33% to 34% of our annual revenue being generated in the fourth quarter.
Regulatory Matters
General
Various laws and regulations in the United States and foreign countries apply, both directly and indirectly, to our business, including laws and regulations regarding privacy, online commerce and communications, taxation, intellectual property and the provision of goods and services through the Internet. U.S. and foreign laws and regulations are subject to the actions of a range of governing and legislative bodies and regulatory entities and to the interpretations of a range of courts, making their application to our business uncertain and subject to change.
Data Privacy and Security
We are subject to laws governing the collection, use, retention, security and transfer of personally identifiable information about our customers. The enactment, interpretation and application of user data protection and privacy laws are in a state of flux, and the interpretation and application of such laws may vary from country to country. For example, in 2015, the Court of Justice of the European Union ("EU") invalidated the "Safe Harbor Framework," which had allowed companies to collect and process personal data in EU nations for use in the United States. In August 2016, the EU-U.S. Privacy Shield, a new data transfer framework agreed upon by EU and U.S. authorities, became fully operational. However, the validity of Privacy Shield framework has been challenged in EU courts, and the long-term viability of the Privacy Shield remains uncertain. In addition, the European Commission proposed new regulations regarding privacy and electronic communications in 2017, including additional regulation of the Internet tracking tools known as “cookies.” Finally, the new European General Data Protection Regulation (the "GDPR") will take effect in May 2018. The GDPR includes operational requirements for companies that receive or process personal data of residents of the EU that are different than those currently in place in the EU, and will include significant penalties for non-compliance.
In the United States, the Federal Trade Commission has released a privacy policy framework and principles and has called for federal legislation to require organizations that suffer a breach of security related to personal information to provide notice of such breach. In the absence of federal legislation, most states and the District of Columbia and Puerto Rico have adopted laws requiring notification to users when there is a security breach affecting personal data. Complying with differing national and state requirements may cause our business to incur substantial costs. In addition, online commerce businesses such as ours have publicly available privacy policies and practices regarding the collection, use and disclosure of user data. A failure to adequately disclose all relevant company data collection and usage practices in such privacy policies, or to comply with such privacy policies or with the requirements of federal, state or foreign privacy laws, could result in proceedings or actions by governmental agencies or others (such as class action litigation), which could adversely affect our business. Technical violations of certain privacy laws can result in significant penalties, including statutory penalties. In 2012, the Federal Communications Commission (the "FCC") amended its regulations under the Telephone Consumer Protection Act (the "TCPA"), which could subject our business to increased liability for certain telephonic communications with customers, including but not limited to text messages to mobile phones. Under the TCPA, plaintiffs may seek recovery for actual monetary loss or statutory damages of $500 per violation, whichever is greater, and courts may treble such damage awards for willful or knowing violations. Data collection, privacy and security continue to be significant and growing public concerns. Congress and individual states and foreign legislative bodies may consider additional online privacy legislation.
9
Online Commerce
Our business also must comply with other federal, state and foreign laws, rules and regulations regarding online communications and commerce to the extent applicable to our business. For example, the Children's Online Privacy Protection Act prohibits web sites directed at children under the age of 13 from collecting personally identifiable information online from such children without parental consent and imposes a number of operational requirements. Certain email activities are subject to the Controlling the Assault of Non-Solicited Pornography and Marketing Act of 2003, commonly known as the "CAN-SPAM" Act. The CAN-SPAM Act regulates the sending of unsolicited commercial email by requiring the email sender, among other things, to comply with specific disclosure requirements and to provide an "opt-out" mechanism for recipients. Both of these laws include statutory penalties for non-compliance. The Digital Millennium Copyright Act limits, but does not eliminate, liability for listing or linking to third-party websites that may include content that infringes on copyrights or other rights so long as our business complies with the statutory requirements. Various U.S. states also have adopted laws regulating certain aspects of Internet communications, websites, marketing and online commerce. Federal legislation enacted in 2016 permanently extended the moratorium on state and local taxes on Internet access and commerce. The EU has enacted a variety of Directives (separately implemented by each EU member state via local legislation) and Regulations (directly applicable to all EU member states) relating to online commerce, including Directive 2000/31/EC on Electronic Commerce, Directive 2011/83/EU on Consumer Rights, and the GDPR.
Additional Internet-related laws, rules and regulations may be adopted in the future on issues such as emerging commerce technologies and marketing approaches, Internet access, cross-border online transactions, defamatory speech, copyright infringement, pricing and characteristics and quality of products and services. Such additional laws or regulations may slow the growth of ecommerce services and the Internet, which could in turn cause a decline in the demand for our customers' online commerce business, and increase our cost (or our customers' cost) of doing business or otherwise have an adverse effect on our business, prospects, results of operations, financial condition and/or cash flows. Moreover, the applicability of existing laws governing issues such as property ownership, libel, personal privacy and taxation to commercial online services and the Internet is uncertain and could expose our business to substantial liability.
In 2015, the FCC adopted rules in its open Internet proceeding that restricted the ability of broadband providers to block or otherwise disadvantage our business. Among other things, the open Internet (or "net neutrality") rules prohibited Internet service providers from: (1) blocking access to, or impairing or degrading, legal content, applications, services or non-harmful devices; and (2) favoring selected Internet traffic. On December 14, 2017, the FCC adopted a Declaratory Ruling, Report and Order, and Order (the “2017 Order”) that, among other things, eliminates these prohibitions. The 2017 Order does require Internet service providers to disclose information to consumers regarding practices such as throttling, paid prioritization and affiliated prioritization. We expect that various parties will challenge the 2017 Order in court and at the FCC. Legislative proposals regarding the open Internet rules also are pending in Congress.
Proposed Changes in Law and Regulation
The regulation of Internet services and access, privacy, data protection, ecommerce and related matters is subject to the political process, has been in constant flux over the past decade and is expected to remain in flux. Further material changes in the law and regulatory requirements must be anticipated, and there can be no assurance that our business will not be adversely affected by future legislation, regulation or deregulation.
Intellectual Property
We rely on a combination of trademarks, copyrights, domain names, trade dress and trade secrets to protect our proprietary technology, our software code, our performance data and our brand. Certain of our intellectual property rights have been acquired through third-party licenses and agreements. We protect our intellectual property by relying on confidentiality procedures and contractual provisions, as well as on international, national, state and common law rights. In addition, we enter into confidentiality and invention assignment agreements with employees and contractors and confidentiality agreements with other third parties. We protect our brands through trademark registration of our core brands, maintenance of our trademark portfolio, contractual trademark rights protection and reliance on common law trademark rights. We also register copyrights and domain names as necessary.
Research and Development
For financial information related to our research and development activities, see the discussion of our operating expenses for the years ended December 31, 2017, 2016 and 2015 included in Item 7, "Management’s Discussion and Analysis of Financial Condition and Results of Operations" and see our consolidated statements of comprehensive income (loss) and the related notes included in Item 8, "Financial Statements and Supplementary Data."
10
Competition
We compete with other SaaS providers servicing the ecommerce industry and with in-house developed solutions used by retailers that choose to build and maintain their own proprietary integrations to suppliers and online channels, using a combination of order management, custom written software and value-added networks. The competitive dynamics of our market are unpredictable because it is fragmented and rapidly evolving. Due to the nature of our business and the variety of products we offer, we do not believe there is any particular competitor or small group of competitors that compete with our business as a whole. Rather, our competitors vary by our solutions and offerings.
We believe that there are several factors unique to our business that differentiate our solutions in the competitive marketplace, including:
• | the network effect of our existing connections and relationships with a diverse group of leading online retailers, suppliers, 3PL providers and other trading partners; |
• | the fulfillment management capabilities of our solutions that enable retailers to operate large scale drop-ship fulfillment programs with a high degree of consumer satisfaction; |
• | our history of long-term relationships with a blue-chip retailer customer base and our deep experience successfully serving and contributing to the growth of large retailers, which engenders trust in our capabilities as prospective retailers and suppliers consider engaging our services; |
• | the breadth of our platform's existing integrations and support for a wide variety of online demand generation channels, including retailers and marketplaces; |
• | our focus on data-quality software and services to structure product data in an optimized format for each online channel; |
• | a history of establishing and maintaining reliable integration connections with our trading partners; |
• | a proven, scalable technology with easy-to-use and accessible software and services; |
• | our brand recognition and reputation in the markets in which we operate; and |
• | the reliability and performance of our cloud-based software. |
While no single competitor currently offers all of the solutions that we offer, we do have competitors with longer operating histories, larger customer bases and greater financial, technical, marketing and other resources than we have, and if one or more of our competitors were to acquire, merge with or partner with another of our competitors, our ability to compete effectively could suffer. In addition, a number of competitive factors could cause us to lose potential sales or to sell our solutions at lower prices or at reduced margins. See Item 1A "Risk Factors—Risks Relating to Our Business—We may not be able to compete successfully against current and future competitors" for more information.
Employees
As of December 31, 2017, we had approximately 323 full-time and part-time employees, substantially all of whom are located in the United States. None of our employees were represented by a labor union or covered by a collective bargaining agreement. We believe that our employee relations are good.
Corporate History
Our Company was founded in 1997 in Albany, New York by our President and Chief Executive Officer, Francis Poore, and our Chief Technology Officer, Richard Jones. It was acquired by an affiliate of Liberty Interactive Corporation, our former parent company ("Liberty"), in 2006 and became a subsidiary of Liberty in 2010.
During November 2015, the board of directors of Liberty authorized a plan to distribute shares of our Company to holders of its Liberty Ventures common stock (the "Spin-Off"). CommerceHub, Inc. was a newly formed Delaware corporation that, pursuant to an internal restructuring, effective July 21, 2016, became the parent company of Commerce Technologies, LLC, a Delaware limited liability company that, as a result of the restructuring, is the successor to Commerce Technologies, Inc. ("CTI"), the entity through which CommerceHub transacted prior to the Spin-Off. Following the completion of the Spin-Off on July 22, 2016, CommerceHub now operates as a stand-alone publicly traded company and neither Liberty nor CommerceHub has any stock ownership, beneficial or otherwise, in the other.
Our Series A and Series C common stock began trading on the Nasdaq Global Market on July 25, 2016 under the symbols "CHUBA" and "CHUBK," respectively, and our Series B common stock began trading on the OTC Markets on July 25, 2016 under the symbol “CHUBB.”
Our headquarters and principal executive offices are located at ZEN Building, 201 Fuller Road, 6th Floor, Albany, New York, 12203, and our telephone number is (518) 810-0700.
11
Available Information
Our website is located at www.commercehub.com, and our Investor Relations website is located at ir.commercehub.com. Our Annual Reports on Form 10-K, Quarterly Reports on Form 10-Q, Current Reports on Form 8-K, proxy statements and amendments thereto filed or furnished with the Securities and Exchange Commission (the "SEC") pursuant to Sections 13(a) and 15(d) of the Securities Exchange Act of 1934, as amended (the "Exchange Act"), are available through our Investor Relations website, free of charge, after we file them with the SEC. We also provide a link to the section of the SEC's website at www.sec.gov that has all of the reports and other information that we file or furnish with the SEC. You may read and copy any materials we file or furnish with the SEC at the SEC's Public Reference Room at 100 F Street, NE, Washington, D.C. 20549. You can get information on the operation of the Public Reference Room by calling the SEC at 1-800-SEC-0330.
In addition to the reports and other information we file and furnish with the SEC, investors and others should note that we use our Investor Relations website, located at ir.commercehub.com, as a means of disclosing material non-public information, including material financial and operating information, to the investment community and for complying with our disclosure obligations under Regulation FD of the Exchange Act. We webcast via our Investor Relations website our earnings calls and certain other events we participate in or host with members of the investment community. Our Investor Relations website also provides notifications of news and/or announcements regarding our financial performance, including SEC filings, investor events, press and earnings releases and other information we may post on our Investor Relations website from time to time. In addition, we use social media and our blog (located at www.commercehub.com/blog) to communicate with the public about our Company, and it is possible that information we post on social media or our blog could be deemed to be material. Accordingly, in addition to following our SEC filings, press releases and public conference calls and webcasts, investors should monitor and review closely the information we post on our Investor Relations website, the social media channels listed on our Investor Relations website and our blog.
The contents of the websites referred to above are not incorporated into this filing. Further, our references to the URLs for these websites are intended to be inactive textual references only.
12
Item 1A. Risk Factors
You should consider carefully the risks described below and all of the other information included in this Annual Report on Form 10-K, including the section entitled "Cautionary Note Regarding Forward-Looking Statements," in evaluating our Company. Any of the following risks, if realized, could have a material adverse effect on our business, prospects, financial condition, results of operations and/or cash flows. The risks described below are those we consider the most material, although they are not the only ones we face. Additional risks and uncertainties not currently known to us or that we currently view as immaterial could also materially adversely affect us.
Risks Relating to Our Business
Consolidation or simplification of the ecommerce industry could diminish demand for our solutions.
The ecommerce industry is complex and fragmented, and our solutions are designed to help customers navigate this complexity, including disparate online channels. Although the number and variety of online channels available to retailers and their suppliers have generally been increasing, the share of online sales made through a small number of larger channels, particularly Amazon, has also been increasing. If the trend toward consolidation around a few large online channels accelerates, the difficulties faced by retailers and brands, which our solutions are designed to address, could decline, and more companies could potentially maintain competing solutions in-house or through on-premise software solutions they manage. We have also seen certain large retailers expand their own online distribution channels, including Walmart's launch of the Walmart Marketplace and acquisition of Jet.com and a number of other online retailers. If our solutions become less important to retailers and their suppliers or brands and other sellers, our sales and opportunities for growth could decline and our business, prospects, financial condition, results of operations and/or cash flows could be negatively impacted.
We may not be able to compete successfully against current and future competitors.
The market for ecommerce solutions, applications and services is very competitive. While no single competitor currently offers all of the solutions that we offer, we do have competitors with longer operating histories, larger customer bases and greater financial, technical, marketing and other resources than we have. Increased competition may result in reduced pricing for our solutions, longer sales cycles or a decrease in our market share, any of which could negatively affect our business, prospects, financial condition, results of operations and/or cash flows.
A number of competitive factors could cause us to lose potential sales or to sell our solutions at lower prices or at reduced margins, including, among others:
• | current and potential customers may develop or expand their existing use of competing in-house solutions or may acquire external solutions or providers of solutions, rather than pay for our solutions; |
• | marketplaces, retailers and other demand channels, which typically offer software tools, often for free, that allow trading partners seeking to sell on these channels to connect to them, may decide to compete more vigorously with us or make it easier for our customers to self-service their omnichannel strategies, rather than relying on our offerings to assist their efforts; |
• | competitors may adopt more aggressive pricing policies and offer more attractive sales terms, adapt more quickly to new technologies and changes in customer requirements, and devote greater resources to the promotion and sale of their products and services than we can; |
• | current and potential competitors may establish cooperative relationships among themselves or with third parties to enhance their products and expand their markets; |
• | new competitors or alliances among competitors may emerge and rapidly acquire significant market share; |
• | current and potential competitors may offer technology or services that address one or more ecommerce needs at a lower price point or with greater depth than our solutions and may be able to devote greater resources to those solutions than we can; and |
• | software vendors could bundle ecommerce solutions with other solutions or offer such products and services at a lower price as part of a larger product sale. |
In addition, if one or more of our competitors were to acquire, merge with or partner with another of our competitors, our ability to compete effectively could suffer. Our competitors may also establish or strengthen cooperative relationships with our current or future strategic partners or other parties with whom we or our customers or prospects have relationships, thereby limiting our ability to promote our solutions. Consolidation in our industry is likely to increase and could negatively impact our business.
Competition in our industry may also intensify as our competitors raise additional capital and enter into business combinations or alliances. New competitors may also emerge as established companies in other market segments or
13
geographic markets expand into our market segments or geographic markets. If we cannot compete successfully, our business, prospects, financial condition, results of operations and/or cash flows could be adversely affected.
The loss, poor performance or financial difficulty of one or more of our larger customers could have a material adverse effect on our financial results.
Some of our customers and their trading partners have experienced financial difficulties, particularly certain traditional brick-and-mortar retailers. Insolvency, credit problems or other financial difficulties confronting our customers could expose us to financial risk. Additionally, if our customers reduce the volume or size of the ecommerce sales they process or generate through our platform, for example, as a result of declines in our customers' overall sales or greater reliance on fulfillment methods that do not utilize our services, our business, prospects, financial condition, results of operations and/or cash flows could be materially adversely affected.
Our revenue model, in large part, is based on retailer and supplier program relationships whereby many revenue-generating supplier transactions conducted through our platform may be attributable to a single retailer. Although no single customer accounted for more than 10% of our total revenue in either of the years ended December 31, 2017, 2016, or 2015, for the year ended December 31, 2017 there were seven customers with Total Program Revenue that accounted for greater than 5% each of our total revenue, two of which had Total Program Revenue that accounted for between 10% and 15% each of our total revenue.
Our customers have no obligation to renew their subscriptions with us after the term expires, and even if they renew they may not do so on the same or on more profitable terms. As a result, our ability to grow depends in part on subscription renewals and our ability to meet or exceed our customers' expectations. In addition, a significant portion of our revenue is based on the volume of transactions our customers complete using our platform. This volume often directly correlates to demand for our customers’ products, so if our customers are unable to generate and maintain demand for and sales of their products, they may send fewer transactions through our platform, resulting in lower revenue to us. Furthermore, many of our contracts are non-exclusive, and it is possible that our customers could send fewer transactions through our platform at any time during the contract term, for any reason. We may not be able to accurately predict future trends in customer renewals or transaction volumes, and our customers' renewal rates or volumes may decline or fluctuate because of several factors, including but not limited to the cost of our services, dissatisfaction with our services, the cost or nature of services offered by our competitors, reductions in our customers' spending levels, internalization of alternative technology solutions by our customers or changes in demand for our customers' products. If our customers do not renew their subscriptions, if they renew on less favorable terms, complete fewer transactions or fail to grow their business using our platform, or if they do not purchase additional offerings to complement their existing services, our business, prospects, financial condition, results of operations and/or cash flows could be materially adversely affected.
The ecommerce market changes rapidly, and our inability to respond to changes in a timely manner could have a material adverse effect on our business.
The ecommerce market can change rapidly in multiple ways through frequent new product and service introductions, frequent changes in rules, specifications and other requirements and evolving industry standards. Our ability to attract new customers and retain and increase revenue from existing customers is dependent on our ability to understand the changes that are affecting the ecommerce marketplace and to adapt our solutions at a rapid pace to address those changing market conditions. To achieve market acceptance for our solutions, we must effectively anticipate and offer solutions that meet changing customer demands, sales and marketing channels and third-party requirements in a timely manner. Customers and the ecommerce channels that they utilize may require features and capabilities that our current solutions do not have. If we fail to develop solutions that satisfy customer preferences in a timely and cost-effective manner, our ability to renew our contracts with existing customers and our ability to create or increase demand for our solutions will be impaired.
We may experience difficulties with software development, industry standards, design or marketing that could delay or prevent our development, introduction or implementation of new solutions and enhancements. In addition, the introduction of new solutions by competitors, the emergence of new industry standards or the development of entirely new technologies to replace existing offerings could render our existing or future solutions obsolete.
As the ecommerce industry continues to evolve, new demand channels and new technologies will emerge to offer consumers new ways to purchase products. We monitor these new demand channels and technologies and attempt to predict which channels are likely to be successful to select projects we anticipate will generate a positive return on our development investment. Our software development activities can be significant, and recovering our investment may take a significant amount of time, if it occurs at all. Our customers may expect us to support a broader array of demand channels than may be commercially feasible, especially emerging channels that are considered likely to be successful by popular opinion, the media and other industry experts. We may therefore be compelled to invest heavily in development resources to enhance our offerings
14
to support new channels that fail to attract consumer usage, take an unexpectedly long time to attract consumer usage, or are successful for our customers and consumers but are disproportionately costly for us to develop, maintain and support. We expect to continue making significant investments in software development, and we may devote resources to advancements that are ultimately unsuccessful, at the expense of other projects that may be more successful, incurring significant opportunity cost to do so. If we deploy significant resources to particular platforms that ultimately fail to attract market participants or materialize as anticipated, we may incur costs that we never recover.
If we are unable to successfully develop or acquire new capabilities and functionality, enhance our existing solutions to anticipate and meet customer preferences and rapidly evolving industry requirements or sell our solutions into new markets, if we fail to realize returns on development initiatives, or if our customers require that we service technologies that are too costly to maintain, our business, prospects, financial condition, results of operations and/or cash flows could suffer a material adverse effect.
If fewer retailers elect to rely on drop-ship delivery as a means to expand their product assortments, demand for our solutions could decline.
We generate a substantial portion of our revenue from the sale and usage of our drop-ship solutions that enable retailers to increase their online product offerings through virtual inventory and leverage suppliers to ship those products directly to consumers. While the market has trended towards increased adoption of drop-ship solutions as a means to offer more products without making large capital investments in inventory and warehouse space and assuming associated inventory risk, use of drop-ship delivery requires retailers to entrust order fulfillment and delivery to third-party suppliers that ship on their behalf. If more retailers elect instead to expand their own warehouses and inventory to assume greater control over order fulfillment, rather than employing drop-ship solutions, or if other methods of fulfillment emerge that are perceived as more effective than drop-shipping, demand for our solutions could decline, which could have a material adverse effect on our business, prospects, financial condition, results of operations and/or cash flows.
Conditions in the global economy, the geographic markets we serve and the financial markets may adversely affect us.
Our business is sensitive to general economic conditions. Slower global economic growth, the credit market crisis and European debt crisis, uncertainty relating to the Euro and British Pound Sterling, particularly in light of the United Kingdom's intended exit from the EU and uncertainty regarding the terms of such exit, high levels of unemployment globally, reduced levels of capital expenditures, changes in government fiscal and monetary policies, government deficit reduction and budget negotiation dynamics, sequestration, other austerity measures and other challenges affecting the global economy adversely affect us and our customers, including having the effect of:
• | reducing demand for our products and services and limiting the financing available to our customers, resulting in longer sales cycles and slower adoption of new technologies; |
• | increasing the difficulty in collecting accounts receivable; |
• | increasing price competition in the markets we serve; |
• | increasing the risk that we could be required to record charges relating to restructuring costs or the impairment of assets; and |
• | increasing the risk that our counterparties will become insolvent or otherwise unable to fulfill their contractual obligations to us, which, in addition to increasing the risks identified above, could result in preference actions against us. |
Improvement in the global economy remains uneven and uncertain. If slower growth in the global economy or in any of the geographic markets we serve continues for a significant period, if there is significant deterioration in the global economy or any of the markets we serve or if improvements in the global economy do not benefit the markets we serve and our customers, our business, prospects, financial condition, results of operations and/or cash flow could be materially adversely affected.
Our business is dependent on our ability to maintain and scale our technical infrastructure.
As our customer base and the amount and types of information shared on our platform continue to grow, we must be able to increase our technical infrastructure, including network capacity and computing power, to satisfy the growing needs of our customers. If we fail to effectively scale and grow our technical infrastructure to accommodate these increased demands, our customers could experience degraded service, which could harm our reputation and negatively impact our business and prospects.
We have experienced significant growth in the scope of our business operations, which has the potential to place significant strain on our managerial, administrative, operational, financial and other resources, and these trends may continue.
15
We intend to expand our overall business, customer base, headcount and operations both domestically and internationally, with no assurance that we will be successful in these efforts or that our business or revenue will continue to grow in any event.
We have also experienced significant growth in the number of users and transactions and the amount of data that our infrastructure supports. We seek to maintain adequate excess capacity in our infrastructure to be sufficiently flexible and scalable to meet the needs of all of our customers, to facilitate the rapid provision of new customer deployments and the expansion of existing customer deployments and to handle spikes in usage, but the provision of new network infrastructure requires significant lead time. If we do not accurately predict our infrastructure capacity requirements, particularly during periods of increased traffic, or if customer traffic patterns significantly change, our customers could experience service degradation or disruption that could result in customer losses and may subject us to financial penalties and liabilities. If our cloud network infrastructure capacity fails to keep pace with increased sales and customer expansion, customers may experience delays as we seek to obtain additional capacity, which could harm our reputation and adversely affect our business and prospects.
Our future success will depend, in part, upon our ability to manage growth effectively. If we do not effectively manage our growth, the quality of our solutions and services may suffer, which could negatively affect our reputation and demand for our solutions and have a material adverse effect on our business, prospects, financial condition, results of operations and/or cash flows.
Cybersecurity incidents could harm our business and negatively impact our financial results.
Our business involves the collection and use of confidential and otherwise sensitive information of our customers and their trading partners, including, for example, consumer shipping information and purchasing habits. The collection and use of this information sometimes requires us to integrate with our customers' information systems and other systems operated by our partners and third-party technology providers. We serve as a conduit for transmitting information between our customers and their trading partners, as well as third-party platforms they use, and cannot operationally control the nature of the information transmitted through our systems. In addition, given our critical role as a service provider to the retail industry, we may be an attractive target for cyber attacks. If third parties are able to gain unauthorized access to our system or data we process or to systems operated by our customers, partners or third-party providers, our customers' trust in our security practices and our business could be impaired.
We cannot assure you that our efforts to prevent unauthorized access to or use of information we process or control will always be successful. Our security measures may be breached as a result of third-party action, including intentional misconduct by computer hackers, employee error or misconduct, malfeasance or otherwise, and any such breach may result in one or more third parties obtaining unauthorized access to our customers' data or our data, including our intellectual property and other confidential or otherwise sensitive information, or our information technology ("IT") systems. Additionally, we may be subject to social engineering or other tactics that attempt to fraudulently induce our employees, vendors, technology partners or customers into disclosing sensitive information such as usernames, passwords or other information in order to gain access to our customers' data or our data or IT systems. Because the techniques used to obtain unauthorized access, or to sabotage systems, change frequently and generally are not recognized until launched against a target or in some cases long thereafter, we may be unable to anticipate or detect these techniques or to implement adequate preventative measures. Malicious parties may also conduct attacks designed to temporarily deny customers access to our services or our customers' websites.
If our information security efforts are compromised, or if we fail to detect and appropriately respond to a data security breach, we could be subject to legal or regulatory action, including direct claims by customers or other injured parties, class actions, shareholder derivative suits and governmental action. A data security breach may also negatively affect our reputation, increase our insurance costs or result in loss of coverage, and we may need to incur other significant costs to protect against information security breaches in the future. In addition, because of the critical nature of data security, any perceived breach of our security measures or harm to our reputation could cause existing or potential customers not to use our solutions. Any of these outcomes could have a material adverse effect on our business, prospects, financial condition, results of operations and/or cash flows.
In addition, our customers' or partners' online and other sales may be significantly impacted by cybersecurity incidents limiting the number of revenue-generating transactions they conduct through our platform. For example, our customers or partners may experience "denial-of-service" type attacks that could make all or portions of such customers' or partners' websites unavailable for periods of time, or consumer purchases could decline because of mistrust in customers' or partners' security practices. Because a significant portion of our revenue is derived from transactions effected on or through our customers' and partners' websites, operational disruptions such as these could cause our revenue to decline.
16
We may experience service failures or interruptions due to defects in the hardware, software, infrastructure, third-party components or processes that comprise our solutions.
Our solutions are complex and may contain undetected defects in the hardware, software, infrastructure, third-party components or processes that comprise such solutions. Our solutions are designed to automate various order fulfillment and product listing functions across multiple online channels for large volumes of our customers' sales, as well as to ensure that their sales comply with the policies of each channel, and sometimes to dynamically determine or communicate product pricing and inventory levels at any given moment. If our solutions do not function properly, errors could occur, including that our customers might sell more inventory than they have in stock, make sales that violate channel policies or underprice or overprice their offerings. Overselling inventory could force our customers to cancel orders at rates that violate channel policies, underpricing could result in material losses to our customers and overpricing could result in lost sales. Any of these results or other errors could reduce demand for our solutions and hurt our business reputation.
If any defects in our solutions lead to service failures, we could experience delays or lost revenue, diversion of software engineering and management resources, material monetary and non-monetary concessions, damage to our reputation with customers and prospective customers, negative media attention or increased service costs as a result of performance claims during the period required to correct the cause of any such defects. In addition, one or more of our customers could seek recourse against us. Although most of our customer contracts limit our liability for these defects, disruptions and errors, we nonetheless could be subject to litigation for actual or alleged losses to our customers' businesses. Where a particular defect is replicated across multiple large customers (as may conceivably occur in the context of a multi-tenant SaaS hosting environment), individual contractual liability caps may be aggregated across multiple claimants to create a much larger exposure. Defending a lawsuit, regardless of its merit, could be costly and divert management's attention and could cause our business to suffer.
We cannot be certain that defects will not be found in new solutions or upgraded solutions, resulting in loss of, or delay in, market acceptance. Our insurance providers could deny coverage of claims resulting from an error or defect in our technology or a resulting disruption in our solutions, and our insurance coverage might not be adequate to cover all of the damages and other costs associated with such a claim. Moreover, we cannot assure you that our current liability insurance policies will continue to be available to us on acceptable terms or at all. The successful assertion against us of one or more large claims that exceeds our insurance coverage, or the occurrence of changes in our liability insurance coverage terms, including an increase in premiums or imposition of large deductible or co-insurance requirements, could have a material adverse effect on our business, prospects, financial condition, results of operations and/or cash flows.
We use a limited number of data centers to deliver a significant portion of our services, and any disruption of service or security breach at these facilities could harm our business.
We manage our services and serve our customers from a limited number of data center facilities. We engineer and architect the computer and storage systems upon which our platform runs, and own and operate our primary data center, in Albany, New York. We also lease redundant (or back-up) data center colocation facilities in Albany, New York and greater Chicago, Illinois, and we do not control the physical operation of these back-up facilities. The owners of these back-up facilities have no obligation to renew their lease agreements with us on commercially reasonable terms, or at all. If we are unable to renew these agreements on commercially reasonable terms, we may be required to locate alternative back-up facilities, and we may incur significant costs and temporary loss of high-availability or disaster recovery services in connection with doing so.
Our data centers are vulnerable to damage or interruption from human error, intentional bad acts, earthquakes, hurricanes, floods, fires, war, terrorist attacks, labor strikes, health epidemics, power losses, hardware failures, systems failures, telecommunications failures, cyber attacks, such as misconduct by computer hackers, unauthorized intrusions, computer viruses and denial of service attacks, and similar events. The occurrence of a natural disaster or an act of terrorism, vandalism or other misconduct, a decision to close the facilities without adequate notice or other unanticipated problems could result in lengthy interruptions in the availability of our solutions or impair their functionality. Because we operate a multi-tenant SaaS environment shared by many large customers, such an event, if it occurred, would not be confined to a single customer or small number of customers, but instead would impact a significant portion of our customer base collectively. The occurrence of any such event, or any other events that may cause our customers and potential customers to lose confidence in the reliability of our solutions, could have a material adverse effect on our business, prospects, financial condition, results of operations and/or cash flows.
Although we plan to expand our use of third-party cloud-based offerings and are moving portions of our service offerings away from traditional data centers, these third-party cloud-based offerings have defined service boundaries in which they operate, and we have minimal, if any, ability to manage how those services are provided. We are dependent on the administrative, physical and procedural safeguards put in place by these third-party providers to protect our confidential
17
information and customer information. The services and features provided by these third-party providers may not continue to be available to us on commercially reasonable terms, or at all. If we are unable to maintain the right to use these services or are unable to upgrade our arrangements with these providers to accommodate the scalability of our business, our customers could experience a degradation or disruption of service or be unable to access features within our solutions until we can obtain and integrate a functionally equivalent replacement technology. Any available alternatives could be more difficult or costly than currently available third-party offerings. In addition, integration of such alternatives into our platform could require significant work and substantial time and resources. Any delays or failures associated with integrating such alternatives into our platform could injure our reputation with customers and potential customers and could have a material adverse effect on our business, prospects, financial condition, results of operations and/or cash flows.
As our customers continue to scrutinize and refine their own data security practices, the security and confidentiality obligations they seek to impose on their SaaS and ecommerce providers are becoming increasingly onerous.
Many of our customers and potential customers are prominent merchants that process large volumes of sensitive consumer and business data. As such, they are increasingly targeted for cybersecurity attacks and, in turn, they are increasingly seeking to shift these risks by pursuing more onerous contractual terms in their agreements with third-party service providers, including burdensome security procedures, reporting, notification and audit rights, additional warranties, guarantees and other contractual assurances, indemnification provisions, specialized remedies and liability limitation exclusions. Our customers may also seek to require our adherence to customer-specific operational protocols and procedures that may compromise our ability to operate and scale our business efficiently or that may be unworkable. As a result, we are contractually obligated in many cases, and otherwise under intense commercial pressure, to continuously enhance our security programs and incur increased compliance costs to provide current and potential customers with the protections they expect. This contractual and commercial pressure also makes it more difficult to obtain new customers, as we experience longer sales cycles to negotiate mutually acceptable terms, and increases the cost and complexity of our compliance procedures. If we are unsuccessful in our attempts to negotiate acceptable outcomes or meet expectations in this area, we could experience customer erosion, increased compliance requirements and associated costs to satisfy more onerous contractual terms and/or impositions on our ability to grow our sales and attract new customers, which could have a material adverse effect on our business, prospects, financial condition, results of operations and/or cash flows.
Our business is substantially dependent upon the continued acceptance of SaaS solutions as a viable option for providing information technology services.
We generate a substantial amount of our revenue from the sale of our solutions and related revenue sources, which are delivered under a SaaS or SaaS-plus model. As a result, continued widespread use and acceptance of this business model is critical to our future growth and success. With increasing concerns around cybersecurity and access to data, some companies are predisposed to maintaining control of their IT systems and infrastructure, and our customers may become increasingly resistant to accessing software functionality that involves transmission of their sensitive data through a third-party platform. In addition, customers may seek to build and utilize in-house software and service solutions for their ecommerce programs where they believe they can do so more effectively or where they seek to reduce long-term dependence on third-party services for these programs. Existing and new market participants may also introduce new types of solutions and different approaches to enable organizations to address their needs. If the market for our SaaS solutions fails to grow or grows more slowly than we currently anticipate, demand for our solutions and our business, prospects, financial condition, results of operations and/or cash flows could be negatively impacted.
Our business and financial results may be impacted by the seasonality of our customers' businesses.
The ecommerce marketplace is affected by the same seasonality as the traditional brick-and-mortar marketplace, and many of our customers typically realize a significant portion of their sales in the fourth quarter of each calendar year during the holiday season. Although our customers do not all experience the same seasonal variation, and some customers may have seasonal peaks that occur in periods other than the fourth quarter, the seasonality of our customers' businesses impacts our financial results and may become more concentrated as we continue to expand our solutions to more customers. Historically, the percentage of our annual revenue has been relatively uniform over the first three quarters of the year with approximately 33% to 34% of our annual revenue being generated in the fourth quarter. If our customer base changes to include more customers that experience more concentrated seasonal variation, our revenue may become even more concentrated in the fourth quarter. Any negative impact on the fourth quarter results, and particularly the holiday season sales, of our major retailer customers, whether resulting from negative economic conditions, natural disasters, acts of war or terrorism or other force majeure events, or even unseasonably inclement weather, could have a material adverse effect on our business, prospects, financial condition, results of operations and/or cash flow.
18
Our growth depends, in part, on the success of our strategic relationships with third parties.
We anticipate that we will continue to depend on our relationships with various third parties to grow our business, including online marketplaces, other demand channels and other technology and service providers, such as 3PL and fulfillment services providers. Identifying, negotiating and documenting relationships with third parties requires significant time and resources, as does integrating third-party content and technology with our solutions. If the third-party content or technology integrated with our solutions is not well received by our customers, our brand and reputation could be negatively affected. Our agreements with third-party business partners are typically non-exclusive and generally do not prohibit them from working with our competitors or from offering competing services. To the extent that any of these third parties compete with us, it could hurt our business and prospects.
In addition, a significant number of the transactions that our customers process through our platform are generated from sales on online marketplaces and other demand channels with which we have strategic relationships. As a result, we rely on these relationships with third-party demand channels for a significant portion of our revenue. When a demand channel leaves our platform, not only do we lose revenue from that demand channel but we also lose revenue from customers that have trading partner connections associated with that particular demand channel. In many cases, these demand channels have no obligation to do business with us or to allow us or our customers access to their systems, and they may decide at any time and for any reason or no reason to significantly curtail or preclude our ability to integrate our solutions with their platforms. If our connection to a particular demand channel represents a significant portion of the perceived value of our platform to a customer, our loss of that demand channel may jeopardize our relationship with that customer. Consequently, the loss of a demand channel could have a material adverse effect on our business, prospects, financial condition, results of operations and/or cash flows.
Additionally, these demand channels may decide to make significant changes to their respective business models, policies, systems or plans, and those changes could impair or inhibit our customers' ability or desire to use our solutions to sell their products on those channels, or may adversely affect the number of transactions that our customers can process through those channels or reduce the desirability of selling on those channels. Further, these channels could decide to compete with us. Finally, service outages at our demand channel partners could prevent, or severely disrupt, the ability for consumers to make purchases from our customers on those demand channels. In such a scenario, the order volume and associated transaction fee revenue we would have anticipated receiving from those demand channels may decrease significantly, or cease altogether. Any of the foregoing results could cause our customers to reevaluate the value of our products and services and potentially terminate their relationships with us, which could have a material adverse effect on our business, prospects, financial condition, results of operations and/or cash flows.
The loss of key personnel or an inability to attract and retain highly skilled personnel may adversely affect our business and limit our ability to implement our business plan successfully.
Our future success is dependent, in large part, upon our ability to attract and retain highly qualified managerial, technical, sales and professional personnel. We face intense competition for qualified individuals from numerous technology and ecommerce companies, which may be able to offer more lucrative compensation packages than we can. The replacement of any key employee, such as our Chief Executive Officer, or group of key employees likely would involve significant time and costs, and the loss of any one or more key employees may significantly delay or prevent the achievement of our business objectives or result in a loss of important institutional knowledge. In addition, our headquarters have been located in Albany, New York since 1997 and, although we have been successful in attracting and retaining high-quality managerial, technical, sales and professional personnel, the pool of available local talent with the specialized skills required for our business is smaller than in larger cities, and we may struggle to find adequate replacements if any of our key personnel were to leave. In September 2017, we commenced a restructuring process to consolidate software development and other corporate activities in our Albany headquarters (the "2017 restructuring plan"), which included the immediate reduction of certain positions in our Seattle, Washington office, the retention of certain Seattle-based engineers for a transition period and the gradual replacement of many of those positions in Albany. The 2017 restructuring plan also included the long-term retention of a Seattle-based account services team dedicated to brands and marketplace customers. We may have difficulties finding adequate engineering replacements in Albany and/or retaining our Seattle-based account services team and, as a result, may not realize the anticipated benefits of the 2017 restructuring plan. Our inability to attract and retain key personnel could have a material adverse effect on our business, prospects, financial condition, results of operations and/or cash flow.
We have expanded, and may expand in the future, by acquiring or investing in other companies, which may divert our management's attention, result in dilution to our stockholders and consume significant resources.
Our business strategy has included, and may include in the future, acquiring complementary services, solutions, technologies or businesses. For example, in January 2015, we acquired Mercent Corporation ("Mercent") to expand our demand channel offerings and capabilities. We also have entered into, and may enter into in the future, relationships with other
19
businesses to expand our service offerings, which could involve preferred or exclusive licenses, additional channels of distribution, discount pricing or investments in other companies. Negotiating these transactions can be time-consuming, difficult and expensive, and our ability to close these transactions may often be subject to conditions or approvals that are beyond our control. Consequently, these transactions, even if undertaken and announced, may not close.
Current or future acquisitions, investments or new business relationships may result in unforeseen operating difficulties and expenditures. Acquisitions may also disrupt our business, divert our resources and require significant management attention that would otherwise be available for the development of our business. Moreover, the anticipated benefits of any acquisition, investment or business relationship may not be realized or may expose us to unknown liabilities. In addition, any acquisition or investment may require us to use significant amounts of cash, issue potentially dilutive equity securities or incur indebtedness (which may be on unfavorable terms or which we may be unable to repay).
Acquisitions involve numerous risks, any of which could harm our business, including:
• | difficulties in integrating the businesses, technologies, products, personnel or operations of acquired companies, especially if those businesses operate outside of our core competency of providing ecommerce SaaS and SaaS-plus solutions; |
• | potential loss of key employees of acquired businesses; |
• | cultural challenges associated with integrating employees from acquired businesses into our organization; |
• | ineffectiveness or incompatibility of acquired technologies or services; |
• | failure to successfully further develop the acquired technology in order to recoup our investment; |
• | inability to maintain the key business relationships and reputations of acquired businesses due to changes in management or otherwise; |
• | diversion of management's attention from other business concerns; |
• | litigation or assumed liabilities related to activities of acquired businesses, including assumption of liability for violation of law or other compliance issues, or claims from terminated employees, customers, former stockholders or other third parties; |
• | obligations and/or restrictions assumed under contracts of the acquired business that could negatively impact us; |
• | in the case of foreign acquisitions, the need to integrate operations across different cultures and languages and to address the particular economic, currency, political and regulatory risks associated with specific countries; |
• | costs necessary to establish and maintain effective internal controls or other procedures and policies for acquired businesses; |
• | increased fixed costs; and |
• | adverse tax consequences, substantial depreciation or deferred compensation charges. |
Any of these outcomes could have a material adverse effect on our business, prospects, financial condition, results of operations and/or cash flow.
Our long-term success depends, in part, on our ability to expand the sales of our ecommerce solutions to customers located outside of the United States, and thus our business is susceptible to risks associated with international sales and operations.
Outside of the United States, we currently maintain offices and have sales personnel in the United Kingdom and also service customers in Canada and Europe. We intend to continue to expand our international operations as part of our long-term strategy, but any such efforts may not be successful. In addition, conducting international operations in new markets will require considerable management attention and resources and will subject us to numerous challenges and risks associated with supporting a rapidly growing business in a cross-border environment, including but not limited to:
• | disparate government regulations from multiple nations relating to ecommerce and other services, electronic devices, data privacy and competition; |
• | restrictive governmental actions (such as trade protection measures, including export duties and quotas and custom duties and tariffs), nationalization and restrictions on foreign ownership; |
• | limited fulfillment and technology infrastructure; |
• | lower levels of consumer spending and fewer opportunities for growth compared to the United States; |
• | difficulty with localizing our solutions, including translation into foreign languages and adaptation for regulatory requirements and local practices; |
• | lack of familiarity, and the burdens of complying, with applicable foreign laws, regulations and legal practices; |
• | lack of familiarity with local customs and cultures; |
• | unexpected changes in regulatory requirements, taxes, trade laws, tariffs, export quotas, custom duties or other trade restrictions; |
• | differing technology standards and internationalization/localization requirements; |
• | longer accounts receivable payment cycles and difficulties in collecting accounts receivable; |
20
• | difficulties in managing and staffing international operations and differing employer/employee relationships, including recruiting and retaining employees in foreign countries; |
• | fluctuations in currency exchange rates that may increase the volatility of our foreign-based revenue; |
• | compliance with the laws of numerous foreign taxing jurisdictions, potential double taxation of our international earnings and potentially adverse tax consequences, including the complexities of foreign value added tax (or other tax) systems or due to changes in applicable U.S. and foreign tax laws, and restrictions on the repatriation of earnings; |
• | increased costs to establish and maintain effective controls at foreign locations; |
• | the greater potential for corruption and bribery, which may adversely impact our compliance with anti-bribery and anti-corruption laws of foreign jurisdictions; |
• | uncertain political and economic climates; |
• | reduced or varied protection for intellectual property rights in some countries; and |
• | overall higher costs of doing business internationally. |
These factors may cause our international costs of doing business to exceed our comparable domestic costs, and there is no guarantee that the financial performance of our operations in international markets will be similar to our historical performance. A variety of factors, including different pricing models and costs related to building out additional operational infrastructure in international markets, could result in lower gross margins, operating margins or cash flow. Any negative impact from our international business efforts could have a material adverse effect on our business, prospects, financial condition, results of operations and/or cash flow.
Our business is subject, directly and indirectly, to a variety of U.S. and foreign laws and regulations that are continuously evolving.
We and our customers are or may become subject to a variety of laws and regulations in the United States and abroad that involve matters central to our business, including laws and regulations relating to ecommerce, privacy, data protection, data security, data retention, consumer protection, antitrust, advertising, intellectual property, manufacturing, taxes, anti-bribery and anti-corruption, and economic or other trade prohibitions or sanctions. These laws and regulations are continuously evolving and developing, and the scope and interpretation of the laws and regulations that are or may be applicable to us are often uncertain and may be conflicting.
For example, the collection of state and local sales taxes with respect to ecommerce and SaaS sales is an evolving and complex area of law, and an increasing number of states have considered or adopted laws that attempt to require out-of-state ecommerce and SaaS sellers to collect sales taxes on their behalf. We cannot predict whether further state or federal legislation will ultimately be adopted or what form it might take if adopted, and disparate rules, interpretations and positions across jurisdictions could make it more difficult and costly to do business. In January 2018, the U.S. Supreme Court agreed to hear a case about whether states can require out-of-state online retailers to collect sales taxes on their behalf. If attempts to require ecommerce and SaaS sellers to collect state or local sales taxes on out-of-state purchases are successful, our business and the businesses of many of our customers could be negatively impacted. Similar issues exist outside of the United States, where the application of value-added tax, goods and services tax or other indirect taxes on online retailers and companies like ours that facilitate ecommerce is uncertain and evolving.
In addition, there are numerous U.S. federal, state and local laws and regulations, and foreign laws and regulations, relating to privacy and the collection, sharing, use, processing, disclosure and protection of personal information and other user data, the scope of which is changing and subject to differing and inconsistent interpretations. We strive to comply with all applicable laws, policies, legal obligations, and industry codes of conduct relating to privacy, data security and data protection, but given that the scope, interpretation and application of these laws and regulations are often uncertain and sometimes conflicting, our obligations could be interpreted and applied in a manner that is inconsistent from one jurisdiction to another and may conflict with other rules or our practices. It may be difficult for us to adjust our policies and procedures to respond to rapid changes in privacy laws, rules and regulations governing privacy, data protection and data processing in and between certain countries, such as the invalidation of the EU-US Safe Harbor Framework in 2015. In addition, the GDPR becomes effective in May 2018. The GDPR will include operational requirements for companies that receive or process personal data of residents of the EU that are different than those currently in place in the EU. Efforts to comply with the law may require substantial expense and the diversion of resources from other projects, and non-compliance with the GDPR may result in monetary penalties of up to 4% of worldwide revenue. Any failure or perceived failure to comply with our privacy or security policies or privacy-related legal obligations by us or third-party service providers, or any compromise of security that results in the unauthorized release or transfer of personally identifiable information or other user data, could result in governmental enforcement actions, litigation and/or negative publicity, which could have a material adverse effect on our business, prospects, financial condition, results of operations and/or cash flows.
21
Although many regulations might not apply to us directly, laws regulating the solicitation, collection or processing of personal and consumer information could affect our or our customers' ability to use and share data, potentially reducing demand for our solutions and services. Moreover, if future laws and regulations limit or overly burden our customers' ability to use and share consumer data or our ability to store, process and share data with our customers over the Internet, demand for our solutions could decrease and our costs could increase. In addition, any increased fees and costs for Internet usage or other limits to access imposed by government agencies or by private organizations, which could be more likely following the FCC's repeal of net neutrality rules in December 2017, or regulations imposing increased taxes on the services we provide or restricting information exchanged over the Internet, could result in a decline in the use and viability of Internet-based services, like ours.
Taxing authorities may successfully assert that we should have collected or in the future should collect sales and use, value added or similar taxes, and we could be subject to liability with respect to past or future sales, which could adversely affect our financial results.
Sales and use, value added and similar tax laws and rates vary greatly by jurisdiction. Based on our belief that certain of these taxes are not applicable to our sales in certain jurisdictions, we do not collect such taxes in all jurisdictions in which we have sales. However, certain jurisdictions in which we do not collect such taxes may assert that such taxes are applicable, which could result in tax assessments, penalties and interest, and we may be required to collect such taxes in the future. Such tax assessments, penalties and interest or future requirements may have an adverse effect on our business, prospects, results of operations, financial condition and/or cash flows.
We are subject to disparate and complex regulatory and contractual restrictions regarding our rights to use data that we process or produce.
We are subject to complex and differing regulatory and contractual restrictions governing our use of data that we process or produce. This includes restrictions in contracts with our customers, vendors and other third parties, as well as our privacy policy and other internal policies and applicable privacy and data security legislation and regulation to which we are subject. We rely on data we process and information derived from it to provide services to customers, develop new offerings and, where appropriate and permissible, report on industry trends and elsewhere in our marketing efforts. Although we monitor these restrictions and have procedures in place to maintain compliance, there can be no assurance that our compliance efforts will always be effective, and third parties may seek to assert claims that our use of such data in a particular manner is unauthorized. Future litigation may be necessary to defend ourselves or to determine the scope, enforceability and/or validity of such restrictions or to establish our proprietary rights. Claimants may have substantially greater resources than we do and may be able to sustain the costs of complex litigation to a greater degree and for longer periods of time than us. Regardless of whether such claims have any merit, these claims are time-consuming and costly to evaluate and defend and could:
• | hurt our reputation; |
• | adversely affect our relationships with current or prospective customers; |
• | cause delays or stoppages in providing our services or developing new services; |
• | divert management's attention and resources; |
• | require costly changes to our software and/or business practices; |
• | subject us to significant liabilities; and |
• | require us to cease some or all of our activities. |
In addition to liability for monetary damages against us, which may be unlimited by contract or regulation and which may include attorneys' fees or governmental fines, we may be prohibited from operating portions of our business or operating in jurisdictions that are dependent on obtaining such data use rights unless we obtain licenses from, and pay royalties to, the holders of such rights, which may not be possible on commercially reasonable terms, or at all. If we are required to make substantial payments or undertake other changes or actions as a result of misappropriation claims against us or any obligation to indemnify our customers or other third parties for such claims, such payments, changes or other actions could have a material adverse effect on our business, prospects, financial condition, results of operations and/or cash flows.
We could incur substantial costs in protecting our intellectual property from infringement, and any failure to protect our intellectual property could impair our business.
We regard the protection of our intellectual property, which includes trade secrets, copyrights, trademarks and domain names, as critical to our success. We strive to protect our intellectual property rights by relying on federal, state and common law rights, as well as contractual restrictions. We enter into confidentiality and invention assignment agreements with our employees and contractors, and confidentiality agreements with parties with whom we conduct business, in order to limit access to, and disclosure and use of, our proprietary information. In addition, we have sought protection for some of our technologies and currently have registered trademarks in the CommerceHub name and several of our product names. We also
22
have copyright protection with respect to our software code and protect trade secrets through non-disclosure agreements and employee confidentiality training.
Despite our efforts to protect our intellectual property, unauthorized parties may attempt to copy aspects of our products or to obtain and use information that we regard as proprietary. Effective intellectual property protection is expensive to develop and maintain, both in terms of initial and ongoing registration requirements and the costs of defending our rights on an ongoing basis. Monitoring unauthorized use of our intellectual property is difficult, and we may be required to protect our intellectual property in an increasing number of domestic and foreign jurisdictions and through additional means, including patent and other filings. These protective measures are expensive and time-consuming, and in the end may not prevent the misappropriation of our intellectual property. As a result, we may not pursue these protections in every location where our intellectual property is threatened. Further, we may not be able to detect unauthorized use of, or take appropriate steps to enforce, our intellectual property rights.
In some cases, litigation may be necessary to enforce our intellectual property rights, to protect our trade secrets, to determine the validity and scope of the proprietary rights of others or to defend against claims of infringement or invalidity. Such litigation could be extremely costly, time-consuming and distracting to management, resulting in a diversion of resources. Furthermore, our efforts to enforce our intellectual property rights may be met with defenses, counterclaims and countersuits attacking the validity and enforceability of our intellectual property rights, which could result in the potential impairment or loss of portions of our intellectual property.
Despite our precautions, it may be possible for unauthorized third parties to copy our solutions and use information that we regard as proprietary to create products and services that compete with ours. Some license provisions protecting against unauthorized use, copying, transfer and disclosure of our licensed solutions may be unenforceable under applicable laws. Further, the laws of some countries do not protect proprietary rights to the same extent as the laws of the United States. To the extent we expand our international activities, our exposure to unauthorized copying and use of our solutions and proprietary information may increase.
There can be no assurance that we will be able to adequately protect our intellectual property or that our competitors will not independently develop similar technology and information. If we fail to meaningfully protect our intellectual property, then our business, prospects, financial condition, results of operations and/or cash flow could be materially adversely affected.
Our lengthy sales and implementation cycles make it difficult to predict our future revenue and cause variability in our operating results.
Our sales and implementation cycles can vary substantially from customer to customer, depending on the size and complexity of the opportunity. A number of factors influence the length and variability of our sales and implementation cycles, including, for example:
• | the need to educate potential customers about the uses and benefits of our solutions; |
• | the commitments customers make in their agreements with us; |
• | the discretionary nature of potential customers' purchasing and budget cycles and decisions; |
• | the competitive nature of potential customers' evaluation and purchasing processes; |
• | evolving ecommerce needs, budgets and functionality demands of potential customers; |
• | announcements or planned introductions of new products by us or our competitors; |
• | the length of purchasing approval processes of, and contract negotiations with, potential customers; and |
• | the complexity of the implementations and integrations with customer and third-party systems. |
In addition, with larger enterprise customers, we face greater costs, longer sales cycles and less predictability in completing some of our sales. The customer's decision to use our service may be an enterprise-wide decision and, if so, these types of sales would require us to provide greater levels of education regarding the use and benefits of our solutions.
Lengthy sales and implementation cycles make it difficult to predict the quarter in which revenue from a new customer may first be recognized. Further, our potential customers frequently need to obtain approvals from multiple decision makers before making purchase decisions. Delays in our sales or implementation cycles could cause significant variability in our revenue and operating results for any particular period.
We may have a significant indemnity obligation to Liberty if the Spin-Off is treated as a taxable transaction.
In connection with the Spin-Off, Liberty received an opinion of its tax counsel to the effect that, for U.S. federal income tax purposes, the Spin-Off will qualify as a tax-free transaction to Liberty and to the holders of its Liberty Ventures common stock under Section 355 of the Internal Revenue Code of 1986, as amended (the “Code”), except with respect to the receipt of cash in lieu of fractional shares. An opinion of tax counsel is not binding on the Internal Revenue Service (the "IRS")
23
or a court, and there can be no assurance that the IRS will not challenge the conclusions reached in the tax opinion or that a court would not sustain such a challenge.
Even if the Spin-Off otherwise qualifies under Section 355 of the Code, the Spin-Off would result in a significant U.S. federal income tax liability to Liberty (but not to holders of Liberty Ventures common stock) under Section 355(e) of the Code if one or more persons acquire, directly or indirectly, a 50% or greater interest (measured by vote or value) in the stock of Liberty or our Company (or any successor corporation) as part of a plan or series of related transactions that includes the Spin-Off. Generally, under Section 355(e) of the Code, an acquisition of the stock of Liberty or our Company will be presumed to be part of a plan (or series of related transactions) with the Spin-Off if such acquisition occurs within two years before or after the Spin-Off; however, this presumption may be rebutted under certain circumstances. The process for determining whether an acquisition is part of a plan under these rules is complex, inherently factual in nature and subject to a comprehensive analysis of the facts and circumstances of the particular case. Notwithstanding the opinion of tax counsel described above, Liberty or we might inadvertently cause or permit a prohibited change in ownership of Liberty or our Company, thereby triggering tax liability to Liberty.
If, for any reason, it is determined that the Spin-Off does not qualify for tax-free treatment (except with respect to the receipt of cash in lieu of fractional shares of our common stock), Liberty and/or the holders of its Liberty Ventures common stock could incur significant tax liabilities.
Prior to the Spin-Off, we entered into a tax sharing agreement with Liberty. Under this agreement, we are required to indemnify Liberty, its subsidiaries and certain related persons for taxes and losses resulting from the failure of the Spin-Off to qualify as a tax-free transaction under Section 355 of the Code to the extent that such taxes and losses (i) result primarily from, individually or in the aggregate, the breach of certain covenants made by us (applicable to actions or failures to act by our Company and our subsidiaries following the completion of the Spin-Off) or (ii) result from the application of Section 355(e) of the Code to the Spin-Off as a result of the treatment of the Spin-Off as part of a plan (or series of related transactions) pursuant to which one or more persons acquire, directly or indirectly, a 50% or greater interest (measured by vote or value) in the stock of our Company (or any successor corporation). Our indemnification obligations to Liberty, its subsidiaries and certain related persons are not limited in amount or subject to any cap. If we are required to indemnify Liberty, its subsidiaries or such related persons under the circumstances set forth in the tax sharing agreement, we may be subject to substantial liabilities, which could materially adversely affect our financial position.
To preserve the tax-free treatment of the Spin-Off, we may determine to forgo certain transactions that might have otherwise been advantageous to our company, including certain asset dispositions or other strategic transactions, for some period of time following the Spin-Off. In addition, our indemnity obligation under the tax sharing agreement might discourage, delay or prevent our entering into a change of control transaction for some period of time following the Spin-Off.
Risks Relating to our Common Stock and the Securities Market
Our stock price may be volatile.
The market price of our common stock may fluctuate significantly due to a number of factors, some of which may be beyond our control, including:
• | actual or anticipated fluctuations in our operating results; |
• | changes in earnings estimates by securities analysts or our ability to meet those estimates; |
• | the operating and stock price performance of comparable companies and/or our customers; |
• | the relatively low trading volumes of each series of our common stock; and |
• | domestic and foreign economic conditions. |
Furthermore, in recent years the stock market has experienced significant price and volume fluctuations. This volatility has had a significant impact on the market price of securities issued by many companies, including companies in our industry. The changes frequently appear to occur without regard to the operating performance of the affected companies. As such, the price of our common stock could fluctuate based upon factors that have little or nothing to do with us, and these fluctuations could materially reduce the price of our common stock and materially affect the value of your investment.
Transactions in our common stock by our directors, officers and employees could depress the market price of our common stock.
Our directors, officers and employees own shares of, and equity incentive awards with respect to, our common stock. Sales of, or other transactions relating to, shares of our common stock by our directors, officers or employees could cause a perception in the marketplace that our stock price has peaked or that adverse events or trends have occurred or may be occurring at our Company. This perception can result notwithstanding any personal financial motivation for these insider
24
transactions, and the effect could be magnified by the relatively low trading volumes of each series of our common stock. As a result, insider transactions could depress the market price for shares of our common stock.
It may be difficult for a third party to acquire us, even if doing so may be beneficial to our stockholders.
Certain provisions of our certificate of incorporation and bylaws may discourage, delay or prevent a change in control of our Company that a stockholder may consider favorable. These provisions include the following:
• | a capital structure with multiple series of common stock: a Series B that entitles the holders to ten votes per share, a Series A that entitles the holders to one vote per share and a Series C that, except as otherwise required by applicable law, entitles the holders to no voting rights; |
• | the availability of "blank check" preferred stock, which could be issued by our board of directors to increase the number of outstanding shares and thwart a takeover attempt; |
• | a classified board of directors with staggered three-year terms, which may lengthen the time required to gain control of our board of directors; |
• | limits on who may call special meetings of stockholders; |
• | the prohibition of stockholder action by written consent, thereby requiring all stockholder actions to be taken at a meeting of the stockholders; |
• | advance notice requirements for nominations of candidates for election to our board of directors or for proposing matters that can be acted upon by stockholders at stockholder meetings; |
• | required stockholder approval by holders of (a) at least 66 2/3% of our combined voting power or (b) a majority of our combined voting power together with the approval of at least 75% of our board of directors, in each case with respect to certain extraordinary matters, such as a merger or consolidation of our Company, a sale of all or substantially all of our assets or an amendment to our certificate of incorporation; and |
• | the existence of authorized and unissued stock which would allow our board of directors to issue shares to persons friendly to current management, thereby protecting the continuity of management, or which could be used to dilute the stock ownership of persons seeking to obtain control of us. |
We may be controlled by one principal stockholder.
As of December 31, 2017, John C. Malone beneficially owned shares of our common stock entitling him to in excess of 30% of the aggregate voting power of the outstanding shares of all series of our common stock. Mr. Malone's rights to vote or dispose of his equity interest in our Company are not subject to any restrictions in favor of our Company other than as may be required by applicable law.
Holders of a single series of our common stock may not have any remedies if an action by our board of directors has an adverse effect on only that series of our common stock.
Principles of Delaware law and the provisions of our certificate of incorporation may protect decisions of our board of directors that have a disparate impact upon holders of any single series of our common stock. Under Delaware law, the board of directors has a duty to act with due care and in the best interests of all of our stockholders, including the holders of all series of our common stock. Principles of Delaware law established in cases involving differing treatment of multiple classes or series of stock provide that a board of directors owes an equal duty to all common stockholders regardless of class or series and does not have separate or additional duties to any group of stockholders. As a result, in some circumstances, our directors may be required to make a decision that is viewed as adverse to the holders of one series of our common stock. Under the principles of Delaware law and the business judgment rule, holders may not be able to successfully challenge decisions that they believe have a disparate impact upon the holders of one series of our common stock if our board of directors is disinterested and independent with respect to the action taken, is adequately informed with respect to the action taken and acts in good faith and in the honest belief that the board is acting in the best interest of all of our stockholders.
Although our Series B common stock trades on the OTC Markets, there is no meaningful trading market for the stock.
Our Series B common stock is not widely held, with over 90% of the outstanding shares as of December 31, 2017 beneficially owned by John C. Malone, the Chairman of the Board of Liberty. Although it is quoted on the OTC Markets, it is sparsely traded and does not have an active trading market. The OTC Markets tend to be highly illiquid, in part, because there is no national quotation system by which potential investors can track the market price of shares except through information received or generated by a limited number of broker-dealers that make markets in particular stocks. There is also a greater chance of market volatility for securities that trade on the OTC Markets as opposed to a national exchange or quotation system. This volatility is attributable to a variety of factors, including a lack of readily available price quotations, lower trading volumes, absence of consistent administrative supervision of “bid” and “ask” quotations and other market conditions. Each share of our Series B common stock is convertible, at any time at the option of the holder, into one share of our Series A common stock, which is listed and traded on the Nasdaq Global Market under the symbol "CHUBA."
25
Our bylaws designate the Court of Chancery of the State of Delaware as the sole and exclusive forum for certain types of actions and proceedings that may be initiated by our stockholders, which could limit our stockholders' ability to obtain a favorable judicial forum for disputes with us or our directors, officers or other employees.
Our bylaws provide that, unless we consent in writing to an alternative forum, the Court of Chancery of the State of Delaware (or, if the Court of Chancery does not have jurisdiction, any state or federal court located within the State of Delaware) shall be the sole and exclusive forum for substantially all disputes between us (including our directors, officers, employees, and agents) and our stockholders, including, among others, any action asserting claims for breach of fiduciary duty, claims arising pursuant to the General Corporation Law of the State of Delaware and claims governed by the internal affairs doctrine. Any person purchasing or otherwise acquiring any interest in any shares of our capital stock shall be deemed to have notice of and to have consented to this provision of our bylaws. This choice-of-forum provision may limit our stockholders' ability to bring a claim in a judicial forum that it finds favorable for disputes with us or our directors, officers or other employees, which may discourage such lawsuits. Alternatively, if a court were to find this provision of our bylaws inapplicable or unenforceable with respect to one or more of the specified types of actions or proceedings, we may incur additional costs associated with resolving such matters in other jurisdictions.
Item 1B. Unresolved Staff Comments
None.
Item 2. Properties
Our Company leases approximately 49,500 square feet in Albany, New York to house our corporate headquarters, executive offices and data centers. We also lease two properties in Seattle, Washington, one approximately 19,000 square feet and serving as office space, and the other approximately 20,000 square feet, which we sub-lease to another tenant. We lease shared office and executive office facilities in Hertford, England. Our primary data center is located in our offices in Albany, New York. Additionally, we have co-location arrangements with third-party data center providers that house equipment we own and maintain at their facilities in Albany, New York and Chicago, Illinois to house secondary and disaster recovery data center facilities capable of continuing our operations in the event of a disruption at our corporate headquarters.
Item 3. Legal Proceedings
From time to time, we may become involved in various lawsuits and legal proceedings which arise in the ordinary course of business. We are currently not aware of any such legal proceedings or claims that we believe will have, individually or in the aggregate, a material adverse effect on our business, prospects, financial condition, results of operations and/or cash flows.
Item 4. Mine Safety Disclosures
Not applicable.
26
PART II.
Item 5. Market for Registrant’s Common Equity, Related Stockholder Matters and Issuer Purchases of Equity Securities
Market Information for Our Common Stock
On July 25, 2016, the first business day following the Spin-Off, our Series A and Series C common stock began trading on the Nasdaq Global Market under the symbols “CHUBA" and "CHUBK," respectively. The following table sets forth, for the periods indicated, the high and low sale prices for our Series A and Series C common stock on the Nasdaq Global Market.
CHUBA | CHUBK | ||||||||||||||
High | Low | High | Low | ||||||||||||
Year ended December 31, 2017 | |||||||||||||||
Fourth Quarter | $ | 23.85 | $ | 19.87 | $ | 22.40 | $ | 18.78 | |||||||
Third Quarter | $ | 24.53 | $ | 16.73 | $ | 22.50 | $ | 16.75 | |||||||
Second Quarter | $ | 18.48 | $ | 14.94 | $ | 18.57 | $ | 14.85 | |||||||
First Quarter | $ | 17.23 | $ | 13.74 | $ | 17.37 | $ | 13.73 | |||||||
Year ended December 31, 2016 | |||||||||||||||
Fourth Quarter | $ | 16.69 | $ | 13.24 | $ | 16.40 | $ | 13.14 | |||||||
Third Quarter (beginning July 25, 2016) | $ | 16.62 | $ | 11.91 | $ | 15.98 | $ | 11.90 | |||||||
Our Series B common stock is not listed, but it is quoted and traded in the OTC Markets under the symbol "CHUBB." Although it is quoted on the OTC Markets, it is sparsely traded and does not have an active trading market. There is a greater chance of market volatility for securities that trade on the OTC Markets as opposed to a national exchange or quotation system, which is due to a variety of factors, including a lack of readily available price quotations, lower trading volume, absence of consistent administrative supervision of “bid” and “ask” quotations, and market conditions. The following table sets forth, for the periods indicated, the range of high and low bid information for our Series B common stock as reported by the OTC Markets. The information below represents inter-dealer prices without dealer mark-ups, mark-downs or commissions, and may not be indicative of the value of the common stock or the existence of an active market.
CHUBB | |||||||
High | Low | ||||||
Year ended December 31, 2017 | |||||||
Fourth Quarter | $ | 25.95 | $ | 20.35 | |||
Third Quarter | $ | 24.85 | $ | 17.40 | |||
Second Quarter | $ | 19.18 | $ | 16.06 | |||
First Quarter | $ | 19.67 | $ | 14.45 | |||
Year ended December 31, 2016 | |||||||
Fourth Quarter | $ | 20.00 | $ | 14.63 | |||
Third Quarter (beginning July 25, 2016) | $ | 18.00 | $ | 11.35 | |||
Holders of Record
As of February 21, 2018, there were 893, 46 and 952 holders of record of our Series A, Series B and Series C common stock, respectively. The foregoing numbers of record holders do not include the number of stockholders whose shares are held nominally by banks, brokerage houses or other institutions, but include each such institution as one holder.
Dividends
We have not paid any cash dividends on our common stock since the Spin-Off, and we do not expect to pay any cash dividends in the foreseeable future. All decisions regarding the payment of dividends by our Company in the future will be made by our board of directors in accordance with applicable law after taking into account various factors, including our
27
financial condition, results of operations, current and anticipated cash needs, plans for expansion and possible loan covenants which may restrict or prohibit our payment of dividends.
Securities Authorized for Issuance under Equity Compensation Plans
The information required by this item is incorporated herein by reference to our Proxy Statement for our 2018 Annual Meeting of Stockholders (the "2018 Proxy Statement") to be filed with the SEC within 120 days of the fiscal year ended December 31, 2017.
Stock Performance Graph
The graph below compares the cumulative total shareholder return on our Series A and Series C common stock with the cumulative total returns of the Nasdaq Composite Index and the Nasdaq Computer Index. The graph tracks the performance of a $100 investment in our Series A and Series C common stock and in each index (although the graph assumes the reinvestment of all dividends, the Company paid no dividends during this period) from July 25, 2016 (the date our Series A and Series C common stock commenced trading on the Nasdaq Global Market) through December 31, 2017. The stock price performance depicted in the following graph is not indicative of future stock price performance.
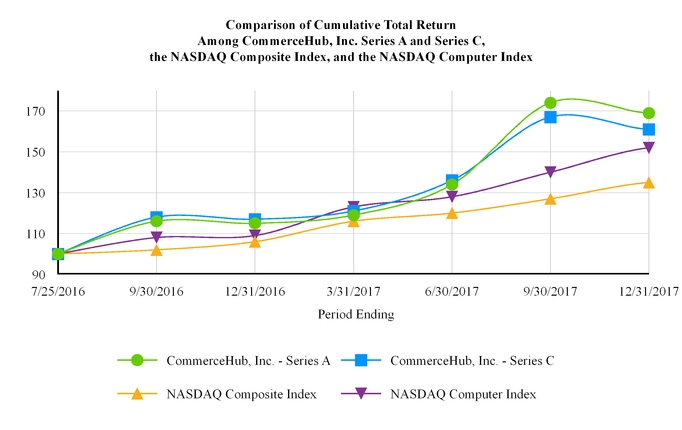
7/25/2016 | 9/30/2016 | 12/31/2016 | 3/31/2017 | 6/30/2017 | 9/30/2017 | 12/31/2017 | |
CommerceHub, Inc. - Series A | $100 | $116 | $115 | $119 | $134 | $174 | $169 |
CommerceHub, Inc. - Series C | $100 | $118 | $117 | $121 | $136 | $167 | $161 |
NASDAQ Composite Index | $100 | $102 | $106 | $116 | $120 | $127 | $135 |
NASDAQ Computer Index | $100 | $108 | $109 | $123 | $128 | $140 | $152 |
This performance graph shall not be deemed “filed” for purposes of Section 18 of the Exchange Act, or incorporated by reference into any filing of CommerceHub under the Securities Act of 1933, as amended, or the Exchange Act, except as shall be expressly set forth by specific reference to this performance graph in such filing.
Recent Sales of Unregistered Securities
None.
28
Purchases of Equity Securities by the Issuer and Affiliated Purchasers
None.
Item 6. Selected Financial Data
The following selected financial data is derived from our audited consolidated financial statements, and should be read together with Item 7 “Management’s Discussion and Analysis of Financial Condition and Results of Operations” and our audited consolidated financial statements and the related notes appearing in Item 8 "Financial Statements and Supplementary Data" of this Annual Report on Form 10-K.
Years ended December 31, | ||||||||||||||||
2017 | 2016 | 2015 | 2014 | |||||||||||||
amounts in thousands, except per share amounts | ||||||||||||||||
Consolidated Statement of Operations Data: | ||||||||||||||||
Revenue | $ | 111,121 | $ | 100,552 | $ | 87,614 | $ | 65,761 | ||||||||
Gross profit | 89,521 | 77,495 | 64,914 | 53,109 | ||||||||||||
Income (loss) from operations | 26,466 | 16,692 | (6,948 | ) | 6,595 | |||||||||||
Net income (loss) | $ | 9,858 | $ | 9,096 | $ | (4,467 | ) | $ | 4,307 | |||||||
Earnings (loss) per basic share: | $ | 0.23 | $ | 0.21 | $ | (0.10 | ) | $ | 0.10 | |||||||
Earnings (loss) per diluted share: | $ | 0.22 | $ | 0.21 | $ | (0.10 | ) | $ | 0.10 | |||||||
As of December 31, | ||||||||||||||||
2017 | 2016 | 2015 | 2014 | |||||||||||||
amounts in thousands | ||||||||||||||||
Consolidated Balance Sheets Data: | ||||||||||||||||
Cash and cash equivalents | $ | 19,841 | $ | 6,471 | $ | 19,337 | $ | 26,385 | ||||||||
Note receivable—Parent | — | — | 36,107 | 35,507 | ||||||||||||
Deferred income taxes | 5,798 | 7,714 | 38,825 | 22,956 | ||||||||||||
Total assets | 85,119 | 80,020 | 153,800 | 120,401 | ||||||||||||
Deferred revenue | 13,611 | 12,730 | 12,022 | 9,779 | ||||||||||||
Share-based compensation liability | — | — | 96,213 | 61,570 | ||||||||||||
Long-term debt | $ | — | $ | 26,000 | $ | — | $ | — | ||||||||
29
Item 7. Management's Discussion and Analysis of Financial Condition and Results of Operations
The following discussion and analysis should be read in conjunction with our audited consolidated financial statements and the related notes included in Item 8 "Financial Statements and Supplementary Data" of this Annual Report on Form 10-K. This discussion contains forward-looking statements that involve risks and uncertainties, and our actual results could differ materially from those discussed below. See "Cautionary Note Regarding Forward-Looking Statements."
Overview
We are a leading provider of cloud-based ecommerce fulfillment and marketing solutions for large retailers, marketplaces, consumer brands and their suppliers. Our solutions help our customers implement strategies to increase their ecommerce revenues and create meaningful operational efficiencies within their supply chains. Our customers use our cloud-based software and service capabilities, which are tailored for specific customer business rules and processes, to more effectively fulfill consumer orders, generate consumer demand for their products and deliver those products to consumers.
Key Financial Metrics
Order Fee Revenue
Order fee revenue is attributable to fees charged to retailers and suppliers based on the volume of consumer orders processed through our platform using our drop-ship solutions. Order fee revenue grows as the overall volume of goods purchased online through our retailer customers increases. We track and measure order fee revenue because it corresponds to our customers' drop-ship activity on our platform.
Subscription and Other Platform Revenue
Subscription and other platform revenue is primarily attributable to subscription fees charged to retailers and suppliers for the use of our drop-ship solutions. Subscription revenue grows as new customers join the platform, connect to and create new relationships with other trading partners, adopt new features and upgrades, and ramp up their activity on the platform. Subscription and other platform revenue also includes other drop-ship platform fees for activity related to our delivery-related solutions, inventory management, third-party communication capabilities and other platform activities related to ecommerce relationships. We track and measure subscription and other platform revenue because it provides insight into the size and scope of our platform in terms of total trading partner customers, relationships among those customers and the extent of their engagement with our platform.
Set-Up and Professional Services Revenue
Set-up and professional services revenue includes fees for the configuration, design and set-up of a customer's onboarding to our platform and other services that we provide to new and existing customers, including highly targeted services that are focused on helping our customers to more quickly adopt our drop-ship solutions and maximize their utility. We track and measure set-up and professional services revenue as it is an indication of new trading partner connections, enhancements to existing customer connections and the extent of customers' engagement with our platform's capabilities.
Demand Channel Revenue
Demand channel revenue includes set-up, professional services, subscription fees and other fees related to the volume of online sales and orders that retailers, sellers and brands achieve using our demand channel solutions. We track and measure demand channel revenue because it represents the access our customers' engagement and success with our demand channel solutions.
Seasonality
The ecommerce marketplace is affected by the same seasonality as the traditional brick-and-mortar marketplace, and many of our customers typically realize a significant portion of their sales in the fourth quarter of each calendar year. Historically, the percentage of our annual revenue has been relatively uniform over the first three quarters of the year with approximately 33% to 34% of our annual revenue being generated in the fourth quarter.
Management's Use of Non-GAAP Measures
In addition to reporting financial measures calculated in accordance with U.S. generally accepted accounting principles ("GAAP"), we provide Adjusted EBITDA (as defined below), a non-GAAP financial measure that management considers in reviewing our financial performance because we feel it is a relevant measure of the overall efficiency of our business model. Adjusted EBITDA is not a substitute for, or superior to, and should be considered only in addition to, net income calculated in accordance with GAAP. Adjusted EBITDA is subject to inherent limitations and excludes significant
30
expenses and income that are required by GAAP to be recorded in our consolidated financial statements. Certain of these adjustments are based on estimates and assumptions of management and do not purport to reflect actual historical results. In addition, our computation of Adjusted EBITDA may not be comparable to other similarly titled measures computed by other companies, because all companies do not calculate these measures in the same fashion.
We define “Adjusted EBITDA” as net income or loss plus interest expense, income tax expense, depreciation of property and equipment, amortization of capitalized software costs and intangible assets, share-based compensation, and restructuring charges, less interest income and income tax benefit. Adjusted EBITDA excludes restructuring charges, the elimination of which does not result in a reduction of operating expenses necessary to conduct our business. By excluding these charges, we believe Adjusted EBITDA provides supplemental information that enables us and investors to better analyze our operating performance and the sustainability of our results and to compare our performance on a more consistent basis from period to period.
Updated Presentation of Key Revenue Metrics
During the year ended December 31, 2017, we updated how we present our revenue by type to better align with how we evaluate the key components, drivers and metrics influencing our total revenue. As a result, we have updated revenue by type for comparative periods to conform with our current presentation, as shown in the table below.
Component of Revenue | Historical Presentation | Current Presentation |
Fees for retailer orders processed using our drop-ship solutions | Usage revenue | Order fee revenue |
Fees for marketplace and other non-retailer demand channel orders using our demand channel solutions | Usage revenue | Demand channel revenue |
Other platform fees, including fees associated with our delivery-related solutions, inventory management and third-party communication capabilities | Usage revenue | Subscription and other platform revenue |
Subscription fees associated with our drop-ship solutions | Subscription revenue | Subscription and other platform revenue |
Subscription fees associated with our demand channel solutions | Subscription revenue | Demand channel revenue |
Set-up and professional services associated with our drop-ship solutions | Set-up and professional services | Set-up and professional services revenue |
Set-up and professional services associated with our demand channel solutions | Set-up and professional services | Demand channel revenue |
Other Metrics
Cost of Revenue
Cost of revenue primarily consists of personnel costs, including salaries, bonuses, payroll taxes, benefits, share-based compensation expense and facility cost and overhead allocations for our teams supporting customer service, application support, customer set-up and professional services, and performance marketing. We capitalize the cost of acquired software, qualifying payroll and payroll-related costs incurred in developing and enhancing our solutions and related product offerings, such as internal tools used by our operations teams. Amortization expense related to these costs are included in cost of revenue. Additionally, facility costs for our data centers, communication service charges and depreciation expense related to computer equipment directly associated with generating revenue are captured in cost of revenue.
Research and Development Expenses
Research and development expenses consist of personnel costs, including salaries, bonuses, payroll taxes, and benefits net of amounts capitalized as developed software, share-based compensation expense and facility cost and overhead allocations for employees engaged in the design, development, testing and maintenance of our solutions. Also included are fees paid to third-party firms who assist in the development of our product solutions, net of amounts capitalized as developed software.
Sales and Marketing Expenses
Sales and marketing expenses consist of personnel expenses, including salaries, commissions, bonuses, payroll taxes, benefits, share-based compensation expense and facility cost and overhead allocations for sales, client management and marketing employees. Other expenses associated with sales and marketing include expenses incurred related to corporate
31
marketing, including brand awareness and trade shows. Much of our marketing effort is focused on thought leadership, as our marketing team engages with media and other industry influencers to publish and present on topics relevant to our solutions in trade publications and relevant industry conferences. Our client management expenses are attributable to our personnel and programs intended to oversee and develop comprehensive relationships with our customers and to provide strategic account management and coordination of cross-selling opportunities.
General and Administrative Expenses
General and administrative expenses consist primarily of personnel costs, including salaries, bonuses, payroll taxes, benefits, share-based compensation expense and facility cost and overhead allocations for our corporate functions, including executive leadership, finance, legal, information technology and human resources, as well as professional service and other fees related to legal, tax and finance. Also included are costs attributable to credit card processing and bad debt expense.
New Accounting Pronouncements
Information regarding new accounting pronouncements is included in Note 4 to the accompanying audited consolidated financial statements.
Critical Accounting Policies
The preparation of our consolidated financial statements in conformity with GAAP requires us to make estimates and assumptions that affect the reported amounts of assets and liabilities at the date of the financial statements and the reported amounts of revenue and expenses during the reporting period. Listed below are the accounting policies and estimates that we believe are critical to our financial statements due to the degree of uncertainty regarding the estimates or assumptions involved and the magnitude of the asset, liability, revenue or expense reported.
Revenue and Deferred Revenue
We generate revenue through the delivery of our ecommerce fulfillment and marketing software solutions. We follow Financial Accounting Standards Board guidance set forth in Accounting Standards Codification ("ASC") Subtopic 985-605-05 related to Hosting Arrangements and ASC Subtopic 605-25 related to Revenue Arrangements with Multiple Deliverables. We recognize revenue when all of the following conditions are met: there is persuasive evidence of an arrangement, the services have been delivered to the customer, the collection of the related fees is reasonably assured and the amount of the related fees is fixed and determinable.
Revenue from new customer acquisition is generated under services agreements with multiple elements. Customers do not have the contractual right to take possession of our solutions. We evaluate each element in a multiple-element arrangement to determine whether it represents a separate unit of accounting. An element constitutes a separate unit of accounting when the delivered item has standalone value and delivery of the undelivered element is probable and within our control.
Fees charged to customers based on the level of a customer's utilization of our solutions and other platform fees attributable to inventory management and third-party communication capabilities are recognized in the period in which such fees are earned. We recognize monthly subscription fees as revenue in the period in which the subscription is earned.
Set-up fees charged to customers in connection with providing access to our solutions are billed during the implementation phase and recorded as deferred revenue until a customer's subscription period has commenced. We also provide professional services to provide certain customer-requested enhancements to our solutions as well as other professional services. Set-up and professional services fees related to customer solution enhancements do not have stand-alone value because they are sold only in conjunction with a subscription to our solutions, they are sold only by us, a customer could not resell them, and they do not represent the culmination of a separate earnings process. Set-up fees without stand-alone value are recognized over the longer of the life of the agreement or the expected customer life. We recognize revenue for professional services fees charged to customers for solution enhancement services over the estimated remaining customer life. Professional services charged to customers that do have stand-alone value are recognized in the period in which the professional services fees are earned.
In determining the estimated life of our customers, we consider our historical experience with customer contract renewals, the type of the customer, the size of the customer and the period over which the customer is expected to benefit from the related offerings. As of December 31, 2017, our estimated life of customers ranged from 1 to 10 years, reflecting a shorter life for smaller customers and a longer life for our largest retail customers. Deferred revenue consists of the unearned portion of deferred set-up and professional services fees and annual subscription fees.
Reimbursements of out-of-pocket expenses are recorded as revenue and cost of revenue in the consolidated statements of comprehensive income (loss).
32
Refer to Note 4 of the accompanying audited consolidated financial statements for further discussion on ASU No. 2014-09, Revenue from Contracts with Customers (Topic 606), which is effective beginning in 2018, and the effects this standard will have on our consolidated financial statements.
Capitalized Software Costs
We capitalize the cost of payroll, payroll-related costs and third-party consulting fees incurred in the direct development or enhancement of solutions as internal-use software. During 2016, we changed and further refined our methodologies and processes to estimate the portion of software development costs that is eligible to be capitalized, which is assessed at a project level. We expense development costs during the preliminary project stage, and we expense costs for requirements gathering, data conversion activities, training, maintenance and minor enhancements as such costs are incurred. We capitalize development costs incurred for the coding, configuration, interfacing, automation and testing of new functionality after the preliminary project stage is complete. Capitalized software costs are amortized on a straight-line basis over two to three years based on the nature and estimated useful life of the applicable solution. Amortization of capitalized software costs is included in cost of revenue within the consolidated statements of comprehensive income (loss).
Deferred Services Costs
We defer direct payroll, payroll-related costs and third-party consulting costs incurred for the set-up and integration of new customers on our platform and for enhancing our platform to accommodate specific customer needs. We recognize deferred services costs associated with the integration of customers on our platform over the estimated life of our customers. We recognize deferred services costs incurred to enhance our platform for specific customer needs over the estimated remaining customer life. Amortization of deferred services costs are included in cost of revenue within the consolidated statements of comprehensive income (loss).
Share-Based Compensation
Share-based awards exchanged for employee services are recorded as expense, net of estimated forfeitures, at the estimated fair value of these awards over the requisite employee service period (typically annual straight-line vesting over four years) or, where applicable for performance-based awards, over the service period when the achievement of certain performance-based conditions are considered probable, and expire after 10 years.
Prior to the Spin-Off, our share-based awards consisted of stock options and stock appreciation rights ("SARs") issued by CTI, our predecessor entity, which were classified as liability awards and were included as a share-based compensation liability on our consolidated balance sheets (see Note 3 to the accompanying audited consolidated financial statements, which further describes our accounting and fair value methodologies of these liability awards held prior to the Spin-Off, as well as Note 12, which further describes the modification of these liability awards in connection with the Spin-Off). Following the Spin-Off, we grant to our employees, directors and consultants stock options and restricted stock units ("RSUs") in respect of our Series C common stock under the CommerceHub, Inc. 2016 Omnibus Incentive Plan (as amended, amended and restated or otherwise modified from time to time, the "Omnibus Incentive Plan"), which was adopted in connection with the Spin-Off.
We estimate the fair value of stock options and awards under the CommerceHub, Inc. 2016 Employee Stock Purchase Plan (as amended, amended and restated or otherwise modified from time to time) using a Black-Scholes pricing model as further described in Note 3 to the accompanying audited consolidated financial statements. We determine the fair value of our RSU awards based on the closing market price per share of our Series C common stock on the date of grant. We estimate our forfeiture rate based on our historical turnover experience and other qualitative factors. We review and update our forfeiture rate, if necessary, at least annually, or more frequently if facts or circumstances indicate a change is necessary.
Income Taxes
We record income taxes under the asset and liability method. Deferred tax assets and liabilities reflect our estimates of the future tax consequences of temporary differences between the carrying amounts of assets and liabilities and their respective tax bases, including operating losses and tax credit carryforwards. We determine deferred income taxes based on the differences in accounting methods and timing between financial statement and income tax reporting. Accordingly, we determine the deferred tax asset or liability for each temporary difference based on the enacted tax rates expected to be in effect when we realize the underlying items of income and expense. We consider all relevant factors when assessing the likelihood of future realization of our deferred tax assets, including our recent earnings experience by jurisdiction, our expectations of future taxable income and the carry forward periods available to us for tax reporting purposes. We may establish a valuation allowance to reduce deferred tax assets to the amount we believe is more-likely-than-not to be realized. This process requires management to make judgments regarding the timing and probability of the ultimate tax impact of the various agreements and transactions to which we are party. Due to inherent complexities arising from the nature of our business, future changes in
33
income tax law, tax sharing agreements or variances between our actual and anticipated operating results, actual income taxes may vary materially from these estimates and could have a significant impact on our financial position.
We record liabilities to address uncertain tax positions that we have taken in previously filed tax returns or that we expect to take in a future tax return. The determination for required liabilities is based upon an analysis of each individual tax position, taking into consideration whether it is more-likely-than-not that our tax position, based on technical merits, will be sustained upon examination. When we conclude that a tax position is more-likely-than-not to be sustained, we recognize the largest amount of tax benefit that is greater than 50% likely of being realized upon ultimate settlement with the taxing authority. The difference between the amount recognized and the total tax position is recorded as a liability. The ultimate resolution of these tax positions may be greater or less than the liabilities recorded.
Results of Operations for the Years Ended December 31, 2017 and 2016
Revenue:
(amounts in thousands) | Year Ended December 31, | Change | ||||||||||||
2017 | 2016 | $ | % | |||||||||||
Revenue: | ||||||||||||||
Core Drop-Ship Revenue | ||||||||||||||
Order fee revenue | $ | 59,788 | $ | 52,095 | $ | 7,693 | 15 | % | ||||||
Subscription and other platform revenue | 35,224 | 32,617 | 2,607 | 8 | % | |||||||||
Set-up and professional services revenue | 7,047 | 5,692 | 1,355 | 24 | % | |||||||||
Total core drop-ship revenue | 102,059 | 90,404 | 11,655 | 13 | % | |||||||||
Demand channel revenue | 9,062 | 10,148 | (1,086 | ) | (11 | )% | ||||||||
Total revenue | $ | 111,121 | $ | 100,552 | $ | 10,569 | 11 | % | ||||||
Order fee revenue represented 54% and 52% of our total revenue for the years ended December 31, 2017 and 2016, respectively. The increase in our order fee revenue was primarily driven by a 16% increase in the volume of customer orders processed through our platform, mainly from existing customers.
Subscription and other platform revenue represented 32% of our total revenue for the years ended December 31, 2017 and 2016, and is primarily attributable to subscription fees charged to retailers and suppliers for the use of our drop-ship solutions. The increase in our subscription fees for the year ended December 31, 2017, as compared to 2016, was primarily driven by an increase in the number of retailer and supplier selling relationships on our platform, which was primarily attributable to a 15% increase in our total customer count. The increase in other platform fees for the year ended December 31, 2017, as compared to 2016, is attributable to an increase in the volume of transactions processed through our platform, mainly from existing customers.
Set-up and professional services revenue represented 6% of our total revenue for each of the years ended December 31, 2017 and 2016. The increase in our set-up and professional services revenue for the year ended December 31, 2017, as compared to 2016, was driven by an increase in the number of retailer and supplier selling relationships on our platform, which was primarily attributable to a 15% increase in our total customer count, as well as the acceleration of deferred revenue in connection with the termination of customers from our platform, including due to bankruptcies.
Demand channel revenue represented 8% and 10% of our total revenue for the years ended December 31, 2017 and 2016, respectively. The decrease in our demand channel revenue for the year ended December 31, 2017, as compared to 2016, was primarily driven by a decrease in the volume of online demand channel sales and orders processed through our platform, attributable to attrition of customers as we have focused our business strategy away from certain digital marketing services.
34
Cost of Revenue and Gross Profit:
(amounts in thousands) | Year Ended December 31, | Change | |||||||||||||
2017 | 2016 | $ | % | ||||||||||||
Cost of revenue | $ | 21,600 | $ | 23,057 | $ | (1,457 | ) | (6 | )% | ||||||
Gross profit | $ | 89,521 | $ | 77,495 | $ | 12,026 | 16 | % | |||||||
Gross margin | 81 | % | 77 | % | 4 | % | |||||||||
The decrease in cost of revenue for the year ended December 31, 2017, as compared to 2016, was primarily driven by a $0.9 million reduction in personnel costs, largely attributable to lower headcount, and a $0.8 million decrease in intangible asset amortization. In addition, there was a $0.2 million decrease in amortization expense related to capitalized software costs, which, as of December 31, 2017, we expect will continue to decrease in 2018 by approximately $2.6 million, as we changed and further refined our methodologies and processes to estimate the portion of software development eligible to be capitalized in 2016. This decrease was partially offset by a $0.5 million increase in restructuring charges incurred in connection with our 2017 restructuring plan (see Note 16 to the accompanying audited consolidated financial statements for a detailed description of our 2017 restructuring plan), which did not occur in 2016.
Gross profit increased for the year ended December 31, 2017, as compared to 2016, primarily due to increased profit as we create leverage through our scalable platform and existing personnel while increasing revenues.
Operating Expenses:
(amounts in thousands) | Year Ended December 31, | Change | |||||||||||||
2017 | 2016 | $ | % | ||||||||||||
Operating expenses: | |||||||||||||||
Research and development | $ | 25,559 | $ | 19,187 | $ | 6,372 | 33 | % | |||||||
Sales and marketing | 8,576 | 11,334 | (2,758 | ) | (24 | )% | |||||||||
General and administrative | 28,920 | 30,282 | (1,362 | ) | (4 | )% | |||||||||
Total operating expenses | $ | 63,055 | $ | 60,803 | $ | 2,252 | 4 | % | |||||||
Research and development expenses. Research and development expenses increased due to a $5.1 million increase in personnel costs, of which $3.1 million was attributable to a reduction in the amount of software development projects capitalized in 2017, as we changed and further refined our methodologies and processes to estimate the portion of software development eligible to be capitalized in 2016, and $2.0 million was attributable to the expansion of our development teams, net of costs deferred in connection with the integration of customers onto our platform. In addition, we incurred $1.3 million of restructuring charges in connection with our 2017 restructuring plan.
Sales and marketing expenses. Sales and marketing expenses decreased due to a $2.2 million decrease in commissions expense and a $1.2 million decrease in personnel costs, in each case primarily attributable to lower headcount on our sales team. The decrease was partially offset by $0.4 million of restructuring charges incurred in connection with our 2017 restructuring plan and a $0.4 million increase in professional services costs.
General and administrative expenses. General and administrative expenses decreased due to a $1.0 million decrease in intangible asset amortization and a $2.3 million reduction in share-based compensation expense resulting from the mark-to-market adjustment of liability-based awards in 2016, which resulted in higher expense in 2016 as compared to the equity-based awards in 2017, which are not marked-to-market. This decrease was partially offset by a $1.3 million increase in professional services costs, primarily attributable to becoming a public company, and a $0.6 million increase in bad debt expense due, in part, to customer bankruptcies in 2017.
Other Expenses and Income:
(amounts in thousands) | Year Ended December 31, | Change | |||||||||||||
2017 | 2016 | $ | % | ||||||||||||
Other (expense) income: | |||||||||||||||
Interest expense | $ | (738 | ) | $ | (707 | ) | $ | (31 | ) | 4 | % | ||||
Interest income | 6 | 273 | (267 | ) | (98 | )% | |||||||||
Total other (expense) income | $ | (732 | ) | $ | (434 | ) | $ | (298 | ) | 69 | % | ||||
35
Other expense increased primarily due to increased interest expense, including commitment fees, incurred in connection with borrowings outstanding under our revolving credit facility, coupled with a decrease in interest earned, which in 2016 was primarily generated under our promissory note receivable due from Liberty that was fully repaid in June 2016.
Income Taxes:
(amounts in thousands) | Year Ended December 31, | Change | |||||||||||||
2017 | 2016 | $ | % | ||||||||||||
Income tax expense | $ | 15,876 | $ | 7,162 | $ | 8,714 | 122 | % | |||||||
Effective tax rate | 62 | % | 44 | % | 18 | % | |||||||||
The increase in income tax expense was primarily due to pre-tax book income of $25.7 million in the year ended December 31, 2017 as compared to pre-tax book income of $16.3 million in 2016. For the year ended December 31, 2017, actual income tax expense was greater than the amounts computed by applying the U.S. federal income tax rate of 35% due to an adjustment recorded in the fourth quarter of 2017 associated with the U.S. Tax Cuts and Jobs Act ("Tax Act"). The Tax Act was enacted on December 22, 2017 and introduces significant changes to U.S. income tax law. Effective in 2018, the Tax Act reduces our U.S. statutory tax rate from 35% to 21%, among other changes. Accordingly, we have adjusted our deferred income taxes as of December 22, 2017 to reflect the reduced rate that will apply in future periods when these deferred taxes are settled or realized, which resulted in deferred tax expense of $3.2 million, or a 12% increase in our 2017 effective tax rate.
In addition, actual income tax expense for the year ended December 31, 2017 was greater than the federal income tax rate of 35% due to an immaterial error correction recorded in 2017 associated with limitations on deductions under Section 162(m) of the Internal Revenue Code (the “IRC”) with respect to certain share-based compensation awards granted prior to the Spin-Off, which limit the Company’s future deductions on these share-based compensation awards in our stand-alone provision beginning at the Spin-Off. The $3.3 million effect of this error was not material, and was corrected in the fourth quarter of 2017 and is incorporated in our 2017 tax expense.
For the year ended December 31, 2016, actual income tax expense was greater than the amounts computed by applying the U.S. federal income tax rate of 35% primarily because of an immaterial error correction recorded in 2016 associated with a change in tax law in New York State (“NY”) that updated the method used to determine the NY apportionment. Under the new method, our income allocated to NY was decreased, resulting in a reduction to current state tax expense post-2016 but an increase in deferred tax expense in 2016 due to the reduction in the value of our deferred state tax assets. The $1.5 million net effect of this error was not material, and was corrected in the fourth quarter of 2016 and is incorporated in our 2016 tax expense.
Net Income and Adjusted EBITDA:
Net Income
Net income for the year ended December 31, 2017 increased, as compared to 2016, primarily due to a $10.6 million increase in revenue, while leveraging our scalable platform and existing personnel, among other changes in cost of revenue and operating expenses as further described above, all of which collectively contributed to a $9.8 million increase in income from operations. This increase in income from operations was partially offset by changes in interest expense and income tax expense as further described above.
Net income for the year ended December 31, 2017 is inclusive of $2.3 million of restructuring charges, primarily termination and retention benefits, associated with our 2017 restructuring plan. For the year ended December 31, 2017, we recognized $1.2 million of impairment and cash compensation charges, net of savings, associated with our 2017 restructuring plan, consisting of $2.3 million of gross restructuring charges, offset by $1.1 million of savings from permanent headcount reductions and open positions transitioning to our corporate headquarters.
For the year ending December 31, 2018, we expect up to $1.0 million of cash compensation charges, net of savings, depending on the pace of hiring. This estimate consists of approximately $4.0 million of gross restructuring charges, offset by approximately $3.5 million of cash savings from permanent headcount reductions, reduced cost of positions transitioned to our corporate headquarters, and open positions during that transition.
For the year ending December 31, 2019, we expect approximately $3.0 million to $4.0 million in net cash savings, from permanent headcount reductions and reduced cost of positions transitioned to our corporate headquarters.
In addition to the above, we realized a $0.3 million reduction in share-based compensation for fiscal 2017, and we expect a $0.3 million reduction in share-based compensation for each of fiscal 2018 and fiscal 2019.
36
For the year ended December 31, 2017, restructuring charges included in the statements of comprehensive income (loss) were as follows (amounts in thousands):
Cost of Revenue | Research and Development | Sales and Marketing | General and Administrative | Total Restructuring Expenses | |||||||||||||||
Termination & retention benefits | $ | 295 | $ | 1,345 | $ | 384 | $ | 64 | $ | 2,088 | |||||||||
Impairment of capitalized software | 191 | — | — | — | 191 | ||||||||||||||
Total restructuring expenses | $ | 486 | $ | 1,345 | $ | 384 | $ | 64 | $ | 2,279 | |||||||||
Adjusted EBITDA
(amounts in thousands) | Year Ended December 31, | Change | |||||||||||||
2017 | 2016 | $ | % | ||||||||||||
Net income and Adjusted EBITDA: | |||||||||||||||
Net income | $ | 9,858 | $ | 9,096 | $ | 762 | 8 | % | |||||||
Interest expense, net | 732 | 434 | 298 | 69 | % | ||||||||||
Income tax expense | 15,876 | 7,162 | 8,714 | 122 | % | ||||||||||
Depreciation and amortization | 8,032 | 9,803 | (1,771 | ) | (18 | )% | |||||||||
Share-based compensation | 8,629 | 11,290 | (2,661 | ) | (24 | )% | |||||||||
Restructuring charges (1) | 2,279 | — | 2,279 | 100 | % | ||||||||||
Adjusted EBITDA | $ | 45,406 | $ | 37,785 | $ | 7,621 | 20 | % | |||||||
(1) | Restructuring charges include termination and retention benefits and the impairment of certain capitalized software projects in connection with our 2017 restructuring plan described in Note 16 to the accompanying audited consolidated financial statements. |
Adjusted EBITDA for the year ended December 31, 2017 increased, as compared to 2016, due to increased operating profit on higher revenue as we continued to leverage our scalable platform and existing personnel. This increase was also attributable to a $2.2 million decrease in commissions expense primarily attributable to lower headcount on our sales team. This increase was partially offset by a $2.9 million reduction in the amount of software development costs capitalized, net of related amortization, increased ongoing professional services costs of $1.3 million, primarily attributable to becoming a public company, and increased bad debt expense of $0.6 million, due in large part to customer bankruptcies in 2017.
Results of Operations for the Years Ended December 31, 2016 and 2015
Revenue:
(amounts in thousands) | Year Ended December 31, | Change | ||||||||||||
2016 | 2015 | $ | % | |||||||||||
Revenue: | ||||||||||||||
Core Drop-Ship Revenue | ||||||||||||||
Order fee revenue | $ | 52,095 | $ | 45,269 | $ | 6,826 | 15 | % | ||||||
Subscription and other platform revenue | 32,617 | 27,498 | 5,119 | 19 | % | |||||||||
Set-up and professional services revenue | 5,692 | 4,293 | 1,399 | 33 | % | |||||||||
Total core drop-ship revenue | 90,404 | 77,060 | 13,344 | 17 | % | |||||||||
Demand channel revenue | 10,148 | 10,554 | (406 | ) | (4 | )% | ||||||||
Total revenue | $ | 100,552 | $ | 87,614 | $ | 12,938 | 15 | % | ||||||
Order fee revenue represented 52% of our total revenue for the years ended December 31, 2016 and 2015. The increase in our order fee revenue was primarily driven by a 16% increase in the volume of customer orders processed through our platform, mainly from existing customers.
Subscription and other platform revenue represented 32% and 31% of our total revenue for the years ended December 31, 2016 and 2015, respectively, and is primarily attributable to subscription fees charged to retailers and suppliers for the use of our drop-ship solutions. The increase in our subscription fees for the year ended December 31, 2016, as compared to 2015, was primarily driven by an increase in the number of retailer and supplier selling relationships on our platform, which
37
was primarily attributable to an increase in our total customer count. The increase in other platform fees for the year ended December 31, 2017, as compared to 2016, is attributable to an increase in the volume of transactions processed through our platform, mainly from existing customers.
Set-up and professional services revenue represented 6% and 5% of our total revenue for the years ended December 31, 2016 and 2015, respectively. The increase in our set-up and professional services revenue for the year ended December 31, 2016, as compared to 2015, was driven by an increase in the number of retailer and supplier selling relationships on our platform, which was primarily due to an increase in our total customer count.
Demand channel revenue represented 10% and 12% of our total revenue for the years ended December 31, 2016 and 2015, respectively. The decrease in our demand channel revenue for the year ended December 31, 2016, as compared to 2015, was primarily driven from a decrease in the volume of online demand channel sales and orders processed through our platform, attributable to attrition of customers as we have focused our business strategy away from certain digital marketing services.
Cost of Revenue and Gross Profit:
(amounts in thousands) | Year Ended December 31, | Change | |||||||||||||
2016 | 2015 | $ | % | ||||||||||||
Cost of revenue | $ | 23,057 | $ | 22,700 | $ | 357 | 2 | % | |||||||
Gross profit | $ | 77,495 | $ | 64,914 | $ | 12,581 | 19 | % | |||||||
Gross margin | 77 | % | 74 | % | 3 | % | |||||||||
The increase in cost of revenue in 2016 was primarily driven by a $1.6 million increase in amortization of capitalized software and a $1.3 million increase in recognized deferred services cost, in each case as compared to 2015. This increase was offset by lower share-based compensation expense of approximately $2.5 million due to a larger mark-to-market adjustment on awards, and resulting expense, in 2015, as compared to 2016. Gross profit increased for the year ended December 31, 2016, as compared to 2015, as we continued to leverage our existing platform and personnel while increasing revenues.
Operating Expenses:
(amounts in thousands) | Year Ended December 31, | Change | |||||||||||||
2016 | 2015 | $ | % | ||||||||||||
Operating expenses: | |||||||||||||||
Research and development | $ | 19,187 | $ | 16,304 | $ | 2,883 | 18 | % | |||||||
Sales and marketing | 11,334 | 11,287 | 47 | — | % | ||||||||||
General and administrative | 30,282 | 44,271 | (13,989 | ) | (32 | )% | |||||||||
Total operating expenses | $ | 60,803 | $ | 71,862 | $ | (11,059 | ) | (15 | )% | ||||||
Research and development expenses. The increase in research and development expenses was mainly attributable to higher personnel-related costs of $7.4 million, of which $5.3 million was attributable to the expansion of our development team to support continued investment in our platform, with the remaining $2.1 million attributable to a reduction in the amount of software development costs capitalized as we changed and refined our methodologies and processes to estimate the portion of software development costs that is eligible to be capitalized. This increase was partially offset by a $5.0 million reduction in share-based compensation expense due to a larger mark-to-market adjustment on awards, and resulting expense, in 2015, as compared to 2016.
Sales and marketing expenses. Sales and marketing expenses remained flat year-over-year. We experienced an increase in personnel-related costs of approximately $1.2 million from the expansion of our sales and marketing teams and a $1.6 million increase in commission expense to our sales team in 2016 as compared to 2015. We also experienced an increase in sales tax expense, driven by a $0.6 million benefit in connection with a favorable state tax ruling in 2015 that did not recur in 2016. However, these increases were offset by a share-based compensation expense reduction of $3.3 million due to a larger mark-to-market adjustment on awards, and resulting expense, in 2015, coupled with reduction in value of performance-based awards, as compared to 2016.
General and administrative expenses. The decrease in general and administrative expenses resulted from a $20.2 million reduction in share-based compensation expense due to a larger mark-to-market adjustment on awards, and resulting expense, in 2015, as compared to 2016. This decrease was partially offset by a $1.2 million increase in personnel-related expenses due to increased headcount, a $1.1 million increase in payroll-related taxes due to exercises of SARs and
38
option awards and a $4.3 million increase in professional services expenses associated with the Spin-Off and other public company costs.
Other Expenses and Income:
(amounts in thousands) | Year Ended December 31, | Change | |||||||||||||
2016 | 2015 | $ | % | ||||||||||||
Other (expense) income: | |||||||||||||||
Interest expense | $ | (707 | ) | $ | — | $ | (707 | ) | — | % | |||||
Interest income | 273 | 600 | (327 | ) | (55 | )% | |||||||||
Total other (expense) income | $ | (434 | ) | $ | 600 | $ | (1,034 | ) | (172 | )% | |||||
The increased expense in other (expense) income was attributable to interest expense, including commitment fees, incurred in 2016 on borrowings under our credit facility and amounts owed to Liberty under our promissory note, which we entered into in June 2016, coupled with a decrease in interest earned under our promissory note receivable due from Liberty, which was fully repaid in June 2016.
Income Taxes:
(amounts in thousands) | Year Ended December 31, | Change | ||||||||||||
2016 | 2015 | $ | % | |||||||||||
Income tax (benefit) expense | $ | 7,162 | $ | (1,881 | ) | $ | 9,043 | nm | ||||||
Effective tax rate | 44 | % | 30 | % | 14 | % | ||||||||
The increase in income tax expense was primarily due to pre-tax book income of $16.3 million in the year ended December 31, 2016 as compared to a pre-tax book loss of $6.3 million in 2015. For the year ended December 31, 2016, actual income tax benefit was greater than the amounts computed by applying the U.S. federal income tax rate of 35% primarily because of an immaterial error correction recorded in 2016 associated with a change in NY tax law that updated the method used to determine the NY apportionment. Under the new method our income allocated to NY was decreased, resulting in a reduction to current state tax expense post-2016 but an increase in deferred tax expense in 2016 due to the reduction in the deferred state tax assets. The $1.5 million net effect of this error was not material, and was recorded in the fourth quarter of 2016 and is incorporated in our 2016 tax expense. For the year ended December 31, 2015, the difference between actual income tax expense and the computed tax was driven primarily by market adjustments for stock options exercised under CTI's share-based compensation programs.
Net Income and Adjusted EBITDA:
Net income increased by $13.6 million for the year ended December 31, 2016, as compared to 2015. The increase was primarily due to a $23.6 million increase in income from operations, which was attributable to increased gross profit while we continued to leverage our scalable platform and existing personnel while increasing revenues, and a decrease in operating expenses, primarily attributable to a $30.9 million decrease in share-based compensation expense.
The primary driver of the decrease in share-based compensation expense was the mark-to-market adjustment, primarily generated by the change in underlying share price, for each period. For both the year ended December 31, 2015 and the three months ended March 31, 2016, the estimated share price, which was based on an internal valuation using the assistance of a third-party advisory firm, increased and resulted in higher expense. For the nine months ended December 31, 2016, the estimated share price was based on the fair market value of our Series C common stock traded immediately following the Spin-Off (for shares granted prior to the Spin-Off) or the fair market value of our Series C common stock on the grant date (for shares granted after the Spin-Off), which decreased as compared to our most recent internal valuation and resulted in a reduction to expense as compared to the prior period.
39
The net income increase was partially offset by a $9.0 million increase in income tax expense, which was attributable to higher pre-tax book income and the NY state tax law change described above, and a $1.0 million increase in net interest expense on our outstanding borrowings.
(amounts in thousands) | Year Ended December 31, | Change | |||||||||||||
2016 | 2015 | $ | % | ||||||||||||
Net income and Adjusted EBITDA: | |||||||||||||||
Net income (loss) | $ | 9,096 | $ | (4,467 | ) | $ | 13,563 | nm | |||||||
Interest expense (income) | 434 | (600 | ) | 1,034 | (172 | )% | |||||||||
Income tax expense (benefit) | 7,162 | (1,881 | ) | 9,043 | nm | ||||||||||
Depreciation and amortization | 9,803 | 7,794 | 2,009 | 26 | % | ||||||||||
Share-based compensation | 11,290 | 42,150 | (30,860 | ) | (73 | )% | |||||||||
Adjusted EBITDA | $ | 37,785 | $ | 42,996 | $ | (5,211 | ) | (12 | )% | ||||||
Adjusted EBITDA decreased for the year ended December 31, 2016, as compared to 2015. Commencing in 2016, we incurred approximately $4.3 million of incremental expenses relating to resources and other costs required to support the Spin-Off and public company compliance. The decrease was also attributable to an increase of $1.4 million in payroll-related taxes on exercises of CTI SARs and options, and a $2.1 million reduction in the amount of software development costs capitalized, as we changed and refined our methodologies and processes to estimate the portion of software development costs that is eligible to be capitalized. Further, for the year ended December 31, 2015, we recognized a benefit in connection with a favorable state sales tax ruling of $0.6 million, which did not recur in 2016. These decreases were partially offset by increased operating profit on higher revenues in 2016, as compared to 2015.
Liquidity and Capital Resources
(amounts in thousands) | Year Ended December 31, | |||||||||||
2017 | 2016 | 2015 | ||||||||||
Net cash provided by (used in): | ||||||||||||
Operating activities | $ | 38,101 | $ | (48,122 | ) | $ | 24,534 | |||||
Investing activities | (2,562 | ) | 26,840 | (30,867 | ) | |||||||
Financing activities | $ | (22,172 | ) | $ | 8,416 | $ | (715 | ) | ||||
Historically, the cash we generate from operations has been sufficient to fund our working capital requirements and capital expenditures. Substantially all of our cash and cash equivalents are held within the U.S. Cash generated internally is used for our international working capital needs. At December 31, 2017, we had $19.8 million of cash and cash equivalents, no borrowings under our revolving credit facility and available borrowings under the facility of $125.0 million. Our cash is invested in money market deposit accounts that are currently providing only a minimal return. Historically, we have not entered into investments, but we may do so in the future. Effective in 2018, assuming a similar tax and business structure, we anticipate a reduction in income taxes paid and accrued as a result of the Tax Act. The Tax Act reduces our U.S. federal statutory tax rate from 35% to 21%. We expect that cash from operations and available borrowings under our revolving credit facility will be sufficient to meet our cash flow requirements for the foreseeable future.
Cash Flow from Operating Activities
The increase in cash flows from operating activities for the year ended December 31, 2017, as compared to 2016, was primarily attributable to:
• | $86.7 million of cash payments in 2016 for the settlement of share-based awards, which no longer occur following the modification of CTI's share-based compensation plans in connection with the Spin-Off; and |
• | a $0.8 million improvement in net income and a $19.7 million net increase in cash flows generated from other working capital related accounts, largely as a result of a reduction in cash outflows associated with income taxes (including the settlement of taxes due to Liberty at the Spin-Off, which is included in our net payables due to Liberty in 2016). |
The increase was partially offset by a $21.0 million net decrease in non-cash expenses (primarily forfeiture of net operating losses included in deferred income taxes attributed to the Spin-Off in 2016, share-based compensation, depreciation and amortization).
40
The decrease in cash flows from operating activities for the year ended December 31, 2016, as compared to 2015, was primarily attributable to:
• | a $79.2 million increase in cash payments for the settlement of share-based awards; and |
• | a $12.6 million decrease in cash flows generated from other working capital related accounts, largely as a result of a reduction in cash outflows associated with our net payables due to Liberty and income taxes. |
The decrease was partially offset by a $13.6 million increase in net income and a $5.5 million increase in non-cash expenses (primarily depreciation, amortization, share-based compensation, deferred income taxes and other).
Cash Flow from Investing Activities
The decrease in cash flows from investing activities for the year ended December 31, 2017, as compared to 2016, was primarily attributable to a $36.4 million reduction in cash inflows from collections on our note receivable due from Liberty in 2016. This decrease was partially offset by
• | a $3.7 million reduction in cash outflows for property and equipment purchases, primarily attributable to 2016 leasehold improvements and outfitting of our new corporate headquarters, which did not recur in 2017; and |
• | a $3.3 million decrease in our capitalization of internally developed software, due to the reduction in software development costs eligible to be capitalized as described above. |
The increase in cash flows from investing activities for the year ended December 31, 2016, as compared to 2015, was primarily attributable to:
• | the collection of $36.4 million owed to us under the intercompany promissory note receivable due from Liberty, which was fully repaid in June 2016; |
• | the use of $20.2 million to fund the acquisition of Mercent in 2015 (Note 6); and |
• | a $1.9 million decrease in capitalized software costs in 2016. |
The increase was partially offset by increased cash outflows for property and equipment purchases of $0.8 million, primarily associated with $2.4 million in leasehold improvements and outfitting of our new corporate headquarters in 2016.
Cash Flow from Financing Activities
The decrease in cash flows from financing activities for the year ended December 31, 2017, as compared to 2016, was driven by:
• | a $32.7 million reduction in net cash inflows in connection with the Spin-Off, which were attributable to borrowings under our revolving credit facility and various financing activities involving Liberty and other pre-Spin-Off shareholders; and |
• | a $2.0 million increase in repayments under our credit facility, as we repaid $26.0 million under our credit facility during 2017. |
The decrease was partially offset by:
• | a $3.0 million increase in net cash inflows from the exercise of stock options, employee stock purchases and the issuance of deferred stock units; and |
• | a $1.1 million reduction in cash outflows for debt issuance costs incurred in connection with our credit facility. |
The increase in cash flows from financing activities for the year ended December 31, 2016, as compared to 2015, was primarily driven by:
• | a $33.4 million increase in net cash inflows in connection with the Spin-Off, which were attributable to borrowings under our revolving credit facility and various financing activities involving Liberty and other pre-Spin-Off shareholders; and |
• | a $0.8 million increase in cash received from the exercise of stock options. |
41
The increase was partially offset by:
• | a $24.0 million increase in repayments under our credit facility; and |
• | a $1.1 million increase in net cash outflows for debt issuance costs incurred in connection with our credit facility. |
Contractual Obligations
Our principal commitments consist of lease obligations for our office space and purchase obligations for software subscriptions and other services. The following table summarizes these contractual obligations at December 31, 2017 (in thousands):
Payment due by period | |||||||||||||||||||
Total | Less than 1 year | 1-3 years | 3-5 years | More than 5 years | |||||||||||||||
Operating lease obligations (1) | $ | 9,537 | $ | 2,652 | $ | 4,384 | $ | 2,501 | $ | — | |||||||||
Purchase obligations | 1,148 | 1,029 | 119 | — | — | ||||||||||||||
Total contractual obligations | $ | 10,685 | $ | 3,681 | $ | 4,503 | $ | 2,501 | $ | — | |||||||||
(1) Operating lease obligations exclude $2.4 million in rental income from sub-tenants, of which $0.6 million is due within one year, $1.2 million is due within one to three years and $0.6 million is due within three to five years.
Item 7A. Quantitative and Qualitative Disclosures about Market Risk
We are exposed to market risk in the normal course of business due to our ongoing investing and financial activities and the conduct of operations in different foreign countries. Market risk refers to the risk of loss arising from adverse changes in stock prices, interest rates and foreign currency exchange rates. The risk of loss can be assessed from the perspective of adverse changes in fair values, cash flows and future earnings.
We are exposed to changes in interest rates primarily as a result of borrowings we may make under our revolving credit facility used to maintain liquidity and to fund business operations. The amount of our long-term debt is expected to vary as a result of future funding requirements, cash generation, market conditions and other factors. We have not entered into any interest rate swap arrangements to manage our exposure to interest rate risk, although we may do so in the future if and when we deem appropriate. We performed a sensitivity analysis on our exposure to interest rate risk as of December 31, 2017, and we do not believe a 1.00% increase or decrease in interest rate would have a material impact on our interest expense, primarily because we had no long-term debt at that date.
Although not significant, we have revenue, expenses, assets and liabilities that are denominated in currencies other than the U.S. dollar, including the British pound sterling and the Canadian dollar. As we expand internationally, our results of operations and cash flows will continue to be impacted by foreign currency fluctuations. We have not used any forward contracts or currency borrowings to hedge our exposure to foreign currency exchange risk, although we may do so in the future.
42
Item 8. Financial Statements and Supplementary Data
COMMERCEHUB, INC.
INDEX TO CONSOLIDATED FINANCIAL STATEMENTS
43
Report of Independent Registered Public Accounting Firm
To the Shareholders and Board of Directors of CommerceHub, Inc.:
Opinion on the Consolidated Financial Statements
We have audited the accompanying consolidated balance sheets of CommerceHub, Inc. and subsidiaries (“CommerceHub”) as of December 31, 2017 and 2016, and the related consolidated statements of comprehensive income (loss), equity and cash flows for each of the years in the three-year period ended December 31, 2017, and the related notes (collectively, the “consolidated financial statements”). In our opinion, the consolidated financial statements present fairly, in all material respects, the financial position of CommerceHub as of December 31, 2017 and 2016, and the results of their operations and their cash flows for each of the years in the three-year period ended December 31, 2017, in conformity with U.S. generally accepted accounting principles.
We also have audited, in accordance with the standards of the Public Company Accounting Oversight Board (United States) (“PCAOB”), CommerceHub’s internal control over financial reporting as of December 31, 2017, based on criteria established in Internal Control - Integrated Framework (2013) issued by the Committee of Sponsoring Organizations of the Treadway Commission (COSO), and our report dated March 1, 2018 expressed an unqualified opinion on the effectiveness of CommerceHub’s internal control over financial reporting.
Basis for Opinion
These consolidated financial statements are the responsibility of CommerceHub’s management. Our responsibility is to express an opinion on these consolidated financial statements based on our audits. We are a public accounting firm registered with the PCAOB and are required to be independent with respect to CommerceHub in accordance with the U.S. federal securities laws and the applicable rules and regulations of the Securities and Exchange Commission and the PCAOB.
We conducted our audits in accordance with the standards of the PCAOB. Those standards require that we plan and perform the audit to obtain reasonable assurance about whether the consolidated financial statements are free of material misstatement, whether due to error or fraud. Our audits included performing procedures to assess the risks of material misstatement of the consolidated financial statements, whether due to error or fraud, and performing procedures that respond to those risks. Such procedures included examining, on a test basis, evidence supporting the amounts and disclosures in the consolidated financial statements. Our audits also included evaluating the accounting principles used and significant estimates made by management, as well as evaluating the overall presentation of the consolidated financial statements. We believe that our audits provide a reasonable basis for our opinion.
We have served as the auditor of CommerceHub, Inc. since 2013.
/s/ KPMG LLP
Albany, New York
March 1, 2018
44
Report of Independent Registered Public Accounting Firm
The Shareholders and Board of Directors of CommerceHub, Inc.:
Opinion on Internal Control Over Financial Reporting
We have audited CommerceHub, Inc. and subsidiaries’ (“CommerceHub”) internal control over financial reporting as of December 31, 2017, based on criteria established in Internal Control - Integrated Framework (2013) issued by the Committee of Sponsoring Organizations of the Treadway Commission. In our opinion, CommerceHub maintained, in all material respects, effective internal control over financial reporting as of December 31, 2017, based on criteria established in Internal Control-Integrated Framework (2013) issued by the Committee of Sponsoring Organizations of the Treadway Commission.
We also have audited, in accordance with the standards of the Public Company Accounting Oversight Board (United States) (“PCAOB”), the consolidated balance sheets of CommerceHub as of December 31, 2017 and 2016, and the related consolidated statements of comprehensive income (loss), equity and cash flows for each of the years in the three-year period ended December 31, 2017, and the related notes (collectively, the “consolidated financial statements”) and our report dated March 1, 2018 expressed an unqualified opinion on those consolidated financial statements.
Basis for Opinion
CommerceHub’s management is responsible for maintaining effective internal control over financial reporting and for its assessment of the effectiveness of internal control over financial reporting, included in the accompanying Management’s Report on Internal Control over Financial Reporting (Item 9A). Our responsibility is to express an opinion on CommerceHub’s internal control over financial reporting based on our audit. We are a public accounting firm registered with the PCAOB and are required to be independent with respect to CommerceHub in accordance with the U.S. federal securities laws and the applicable rules and regulations of the Securities and Exchange Commission and the PCAOB.
We conducted our audit in accordance with the standards of the PCAOB. Those standards require that we plan and perform the audit to obtain reasonable assurance about whether effective internal control over financial reporting was maintained in all material respects. Our audit of internal control over financial reporting included obtaining an understanding of internal control over financial reporting, assessing the risk that a material weakness exists, and testing and evaluating the design and operating effectiveness of internal control based on the assessed risk. Our audit also included performing such other procedures as we considered necessary in the circumstances. We believe that our audit provides a reasonable basis for our opinion.
Definitions and Limitations of Internal Control Over Financial Reporting
A company’s internal control over financial reporting is a process designed to provide reasonable assurance regarding the reliability of financial reporting and the preparation of financial statements for external purposes in accordance with generally accepted accounting principles. A company’s internal control over financial reporting includes those policies and procedures that (1) pertain to the maintenance of records that, in reasonable detail, accurately and fairly reflect the transactions and dispositions of the assets of the company; (2) provide reasonable assurance that transactions are recorded as necessary to permit preparation of financial statements in accordance with generally accepted accounting principles, and that receipts and expenditures of the company are being made only in accordance with authorizations of management and directors of the company; and (3) provide reasonable assurance regarding prevention or timely detection of unauthorized acquisition, use, or disposition of the company’s assets that could have a material effect on the financial statements.
Because of its inherent limitations, internal control over financial reporting may not prevent or detect misstatements. Also, projections of any evaluation of effectiveness to future periods are subject to the risk that controls may become inadequate because of changes in conditions, or that the degree of compliance with the policies or procedures may deteriorate.
/s/ KPMG LLP
Albany, New York
March 1, 2018
45
COMMERCEHUB, INC.
Consolidated Balance Sheets
(In thousands, except share data)
December 31, | |||||||
2017 | 2016 | ||||||
Assets | |||||||
Current assets: | |||||||
Cash and cash equivalents | $ | 19,841 | $ | 6,471 | |||
Accounts receivable, net of allowances of $1,084 and $200, respectively | 21,310 | 18,109 | |||||
Prepaid income taxes | — | 4,311 | |||||
Prepaid expenses and other current assets | 1,652 | 1,549 | |||||
Total current assets | 42,803 | 30,440 | |||||
Capitalized software, net | 2,850 | 6,716 | |||||
Deferred services costs | 4,853 | 4,989 | |||||
Property and equipment, net | 6,066 | 7,629 | |||||
Goodwill | 21,410 | 21,410 | |||||
Deferred income taxes | 5,798 | 7,714 | |||||
Other long-term assets | 1,339 | 1,122 | |||||
Total assets | $ | 85,119 | $ | 80,020 | |||
Liabilities and Equity | |||||||
Current liabilities: | |||||||
Accounts payable and accrued expenses | $ | 3,360 | $ | 2,135 | |||
Accrued payroll and related expenses | 9,429 | 7,435 | |||||
Income taxes payable | 962 | 7 | |||||
Deferred revenue | 5,339 | 5,149 | |||||
Total current liabilities | 19,090 | 14,726 | |||||
Deferred revenue, long-term | 8,272 | 7,581 | |||||
Other long-term liabilities | 3,210 | 1,135 | |||||
Long-term debt | — | 26,000 | |||||
Total liabilities | 30,572 | 49,442 | |||||
Equity: | |||||||
Preferred stock, $0.01 par value. Authorized shares of 50,000,000; 0 shares issued and outstanding at December 31, 2017 and 2016 | — | — | |||||
Series A common stock, $0.01 par value. 40,000,000 shares authorized; 13,599,641 and 13,536,502 shares issued and outstanding at December 31, 2017 and 2016, respectively | 136 | 135 | |||||
Series B common stock, $0.01 par value. 1,500,000 shares authorized; 707,567 and 711,992 shares issued and outstanding at December 31, 2017 and 2016, respectively | 7 | 7 | |||||
Series C common stock, $0.01 par value. 83,000,000 shares authorized; 29,171,981 and 28,672,805 shares issued and outstanding at December 31, 2017 and 2016, respectively | 292 | 287 | |||||
Additional paid-in capital | 31,010 | 16,904 | |||||
Accumulated other comprehensive loss | (1 | ) | — | ||||
Retained earnings | 23,103 | 13,245 | |||||
Total equity | 54,547 | 30,578 | |||||
Total liabilities and equity | $ | 85,119 | $ | 80,020 | |||
See accompanying notes to these consolidated financial statements
46
COMMERCEHUB, INC.
Consolidated Statements of Comprehensive Income (Loss)
(In thousands, except per share data)
Year Ended December 31, | |||||||||||
2017 | 2016 | 2015 | |||||||||
Revenue (Note 8) | $ | 111,121 | $ | 100,552 | $ | 87,614 | |||||
Cost of revenue | 21,600 | 23,057 | 22,700 | ||||||||
Gross profit | 89,521 | 77,495 | 64,914 | ||||||||
Operating expenses: | |||||||||||
Research and development | 25,559 | 19,187 | 16,304 | ||||||||
Sales and marketing | 8,576 | 11,334 | 11,287 | ||||||||
General and administrative | 28,920 | 30,282 | 44,271 | ||||||||
Total operating expenses | 63,055 | 60,803 | 71,862 | ||||||||
Income (loss) from operations | 26,466 | 16,692 | (6,948 | ) | |||||||
Other (expense) income: | |||||||||||
Interest expense | (738 | ) | (707 | ) | — | ||||||
Interest income | 6 | 273 | 600 | ||||||||
Total other (expense) income | (732 | ) | (434 | ) | 600 | ||||||
Income (loss) before income taxes | 25,734 | 16,258 | (6,348 | ) | |||||||
Income tax expense (benefit) | 15,876 | 7,162 | (1,881 | ) | |||||||
Net income (loss) | 9,858 | 9,096 | (4,467 | ) | |||||||
Currency translation adjustment | (1 | ) | — | — | |||||||
Total comprehensive income (loss) | $ | 9,857 | $ | 9,096 | $ | (4,467 | ) | ||||
Earnings (loss) per share: | |||||||||||
Basic | $ | 0.23 | $ | 0.21 | $ | (0.10 | ) | ||||
Diluted | $ | 0.22 | $ | 0.21 | $ | (0.10 | ) | ||||
Shares used in computing earnings (loss) per share: | |||||||||||
Basic | 43,204 | 42,831 | 42,703 | ||||||||
Diluted | 45,230 | 44,343 | 42,703 | ||||||||
See accompanying notes to these consolidated financial statements
47
COMMERCEHUB, INC.
Consolidated Statements of Equity
(In thousands, except share data)
Shares of Common Stock | ||||||||||||||||||||||||
Series A | Series B | Series C | Par Value | APIC | Parent's Investment | AOCL | Retained Earnings | Total Equity | ||||||||||||||||
Balance at January 1, 2015 | — | — | — | $ | — | $ | — | $ | 22,915 | $ | — | $ | 9,200 | $ | 32,115 | |||||||||
Issuance of common stock for exercised options | 33 | 33 | ||||||||||||||||||||||
Repurchase of outstanding shares | (164 | ) | (164 | ) | ||||||||||||||||||||
Cash dividends paid | (584 | ) | (584 | ) | ||||||||||||||||||||
Net income (loss) | (4,467 | ) | (4,467 | ) | ||||||||||||||||||||
Balance at December 31, 2015 | — | — | — | $ | — | $ | — | $ | 22,784 | $ | — | $ | 4,149 | $ | 26,933 | |||||||||
Net income (loss) | 9,096 | 9,096 | ||||||||||||||||||||||
Exercise of stock options | 73 | 73 | ||||||||||||||||||||||
Contribution from Parent | 6,000 | 6,000 | ||||||||||||||||||||||
Cash dividends paid to Parent and others | (19,730 | ) | (19,730 | ) | ||||||||||||||||||||
Change in capitalization in connection with the Spin-Off | 13,522,288 | 711,992 | 28,468,562 | 427 | 8,700 | (9,127 | ) | — | ||||||||||||||||
Reclassification of share-based compensation liability | 12,489 | 12,489 | ||||||||||||||||||||||
Issuance of minority shares | 109,354 | 1 | (1 | ) | — | |||||||||||||||||||
Forfeiture of net operating losses to Parent | (9,785 | ) | (9,785 | ) | ||||||||||||||||||||
Share-based compensation expense | 4,730 | 4,730 | ||||||||||||||||||||||
Exercise of stock options | 15,268 | 96,917 | 1 | 772 | 773 | |||||||||||||||||||
Excess tax deduction from the exercise of stock options | (1 | ) | (1 | ) | ||||||||||||||||||||
Issuance of restricted stock units | 2 | 7 | — | |||||||||||||||||||||
Cancellation of restricted shares | (1,056 | ) | (2,035 | ) | — | |||||||||||||||||||
Balance at December 31, 2016 | 13,536,502 | 711,992 | 28,672,805 | $ | 429 | $ | 16,904 | $ | — | $ | — | $ | 13,245 | $ | 30,578 | |||||||||
Net income (loss) | 9,858 | 9,858 | ||||||||||||||||||||||
Share-based compensation expense | 8,629 | 8,629 | ||||||||||||||||||||||
Adjustment to net operating loss forfeiture to Parent | 1,655 | 1,655 | ||||||||||||||||||||||
Exercise of stock options | 61,248 | 345,727 | 4 | 3,285 | 3,289 | |||||||||||||||||||
Issuance of common stock under employee stock purchase plan | 36,298 | 1 | 463 | 464 | ||||||||||||||||||||
Issuance of deferred stock units | 75 | 75 | ||||||||||||||||||||||
Issuance of restricted stock units | 151 | 123,977 | 1 | (1 | ) | — | ||||||||||||||||||
Cancellation of restricted shares | (2,685 | ) | (6,826 | ) | — | |||||||||||||||||||
Conversion of Series B shares to Series A shares | 4,425 | (4,425 | ) | — | ||||||||||||||||||||
Other comprehensive loss | (1 | ) | (1 | ) | ||||||||||||||||||||
Balance at December 31, 2017 | 13,599,641 | 707,567 | 29,171,981 | $ | 435 | $ | 31,010 | $ | — | $ | (1 | ) | $ | 23,103 | $ | 54,547 | ||||||||
See accompanying notes to these consolidated financial statements.
48
COMMERCEHUB, INC.
Consolidated Statements of Cash Flows
(In thousands)
Year Ended December 31, | |||||||||||
2017 | 2016 | 2015 | |||||||||
Cash flows from operating activities: | |||||||||||
Net income (loss) | $ | 9,858 | $ | 9,096 | $ | (4,467 | ) | ||||
Adjustments to reconcile net income (loss) to net cash provided by (used in) operating activities: | |||||||||||
Depreciation and amortization | 8,032 | 9,803 | 7,794 | ||||||||
Amortization of debt issuance costs | 221 | 111 | — | ||||||||
Share-based compensation expense | 8,629 | 11,290 | 42,150 | ||||||||
Deferred income taxes | 3,571 | 21,326 | (12,289 | ) | |||||||
Bad debt expense | 1,269 | 629 | 481 | ||||||||
Accrued interest income | — | (273 | ) | (600 | ) | ||||||
Impairment and loss on disposal of long-term assets | 310 | 179 | — | ||||||||
Change in operating assets and liabilities, net of acquisition: | |||||||||||
Accounts receivable | (4,470 | ) | (2,326 | ) | (816 | ) | |||||
Prepaid expenses and other assets | (532 | ) | (599 | ) | (40 | ) | |||||
Income taxes, net | 5,266 | (4,304 | ) | — | |||||||
Deferred costs | 136 | (33 | ) | (1,094 | ) | ||||||
Deferred revenue | 883 | 708 | 2,031 | ||||||||
Accounts payable and accrued expenses | 2,210 | 166 | (2,683 | ) | |||||||
Accrued payroll and related expenses | 2,718 | 1,901 | 2,097 | ||||||||
Share-based compensation liability payments | — | (86,684 | ) | (7,507 | ) | ||||||
Parent receivables and payables, net | — | (9,112 | ) | (523 | ) | ||||||
Net cash provided by (used in) operating activities | 38,101 | (48,122 | ) | 24,534 | |||||||
Cash flows from investing activities: | |||||||||||
Purchases of property and equipment | (1,315 | ) | (4,995 | ) | (4,158 | ) | |||||
Additions to capitalized software | (1,247 | ) | (4,545 | ) | (6,484 | ) | |||||
Acquisition of business, net of cash acquired | — | — | (20,225 | ) | |||||||
Collection of note receivable - Parent | — | 36,380 | — | ||||||||
Net cash (used in) provided by investing activities | (2,562 | ) | 26,840 | (30,867 | ) | ||||||
Cash flows from financing activities: | |||||||||||
Borrowings on revolver | — | 50,000 | — | ||||||||
Payments on revolver | (26,000 | ) | (24,000 | ) | — | ||||||
Cash paid for debt issuance costs | — | (1,100 | ) | — | |||||||
Purchase of treasury stock | — | (3,600 | ) | (164 | ) | ||||||
Cash received from exercise of stock options | 3,289 | 846 | 33 | ||||||||
Cash received from employee stock purchase plan | 464 | — | — | ||||||||
Cash received from deferred stock units | 75 | — | — | ||||||||
Borrowings on note payable - Parent | — | 28,664 | — | ||||||||
Payments on note payable - Parent | — | (28,664 | ) | — | |||||||
Contribution from Parent | — | 6,000 | — | ||||||||
Dividends paid to Parent and other pre-Spin-Off shareholders | — | (19,730 | ) | (584 | ) | ||||||
Net cash (used in) provided by financing activities | (22,172 | ) | 8,416 | (715 | ) | ||||||
Currency effect on cash and cash equivalents | 3 | — | — | ||||||||
Net increase (decrease) in cash and cash equivalents | 13,370 | (12,866 | ) | (7,048 | ) | ||||||
Cash and cash equivalents, beginning of period | 6,471 | 19,337 | 26,385 | ||||||||
Cash and cash equivalents, end of period | $ | 19,841 | $ | 6,471 | $ | 19,337 | |||||
Supplemental disclosure of non-cash investing and financing activities: | |||||||||||
Contractual obligations for acquisition of fixed assets | $ | 360 | $ | — | $ | 876 | |||||
Supplemental disclosures of cash flow information: | |||||||||||
Cash paid for interest | $ | 462 | $ | 531 | $ | — | |||||
Cash paid for taxes | $ | 8,505 | $ | 7,809 | $ | 11,723 | |||||
Collection of federal tax benefit from Parent | $ | — | $ | 8,522 | $ | — | |||||
49
See accompanying notes to these consolidated financial statements
50
Note 1 - Description of Business
CommerceHub, Inc. ("CommerceHub," the "Company," "us," "we" and "our") was founded in 1997 (then known as Commerce Technologies, Inc. ("CTI")) and is headquartered in Albany, New York, with additional locations in Seattle, Washington and Hertford, England. We are a leading provider of cloud-based ecommerce fulfillment and marketing solutions for large retailers, marketplaces, consumer brands and their suppliers. Our solutions help our customers implement strategies that increase their ecommerce revenues and create meaningful operational efficiencies within their supply chains. The customized solutions we create for specific customer types utilize our cloud-based software and service capabilities to more effectively fulfill consumer orders, generate consumer demand for products and deliver products to consumers.
During November 2015, the board of directors of Liberty Interactive Corporation, our former parent company ("Liberty" or "Parent"), authorized a plan to distribute to the holders of Liberty's Series A and Series B Liberty Ventures common stock, shares of CommerceHub (the "Spin-Off"). At the time, CommerceHub was a newly formed Delaware corporation that, pursuant to an internal restructuring, effective July 21, 2016, became the parent of Commerce Technologies, LLC, a Delaware limited liability company that, as a result of the restructuring, is the successor to CTI, the entity through which CommerceHub transacted prior to the Spin-Off. The Spin-Off was completed on July 22, 2016 and was effected as a pro rata dividend of shares of CommerceHub to the stockholders of Liberty's Series A and Series B Liberty Ventures common stock. The Internal Revenue Service (“IRS”) has completed its review of the Spin-Off and has notified Liberty that it agreed with the nontaxable characterization of the Spin-Off.
Following the Spin-Off, CommerceHub operates as a stand-alone publicly traded company, and neither Liberty nor CommerceHub has any stock ownership, beneficial or otherwise, in the other.
Note 2 - Basis of Presentation
The consolidated financial statements include the accounts of CommerceHub and its subsidiaries. All intercompany accounts and transactions have been eliminated in the consolidated financial statements, which have been prepared in conformity with U.S. generally accepted accounting principles ("GAAP").
Use of Estimates
Preparing these consolidated financial statements in conformity with GAAP requires management to make estimates and assumptions that affect the reported amounts of assets and liabilities at the date of the consolidated financial statements and the reported amounts of revenues and expenses during the reporting periods. Actual results could differ from those estimates and assumptions.
Segment and Geographic Information
Operating segments are components of our business for which discrete financial information is available and evaluated by the chief operating decision maker ("CODM") for purposes of allocating resources and evaluating financial performance. Our Chief Executive Officer, who is our CODM, reviews the Company's consolidated financial information results to allocate resources and evaluate performance. As such, the Company operates as a single segment.
The following table summarizes revenue by type (in thousands):
Year Ended December 31, | |||||||||||
2017 | 2016 | 2015 | |||||||||
Revenue: | |||||||||||
Core Drop-Ship Revenue | |||||||||||
Order fee revenue | $ | 59,788 | $ | 52,095 | $ | 45,269 | |||||
Subscription and other platform revenue | 35,224 | 32,617 | 27,498 | ||||||||
Set-up and professional services revenue | 7,047 | 5,692 | 4,293 | ||||||||
Total core drop-ship revenue | 102,059 | 90,404 | 77,060 | ||||||||
Demand channel revenue | 9,062 | 10,148 | 10,554 | ||||||||
Total revenue | $ | 111,121 | $ | 100,552 | $ | 87,614 | |||||
51
We generate nearly all of our revenue in the United States and Canada. For the years ended December 31, 2017, 2016 and 2015, we generated approximately 96% of our revenue from customers located in the United States. Substantially all of our assets are located within the United States.
Updated Presentation of Revenue by Type
During the year ended December 31, 2017, we updated the way in which we present revenue by type. The table below provides revenue by type for previously reported periods under our current presentation.
For the three months ended: | |||||||||||||||||||||||||||||||||
9/30/2017 | 6/30/2017 | 3/31/2017 | 12/31/2016 | 9/30/2016 | 6/30/2016 | 3/31/2016 | 12/31/2015 | 9/30/2015 | 6/30/2015 | 3/31/2015 | |||||||||||||||||||||||
Revenue by type: | |||||||||||||||||||||||||||||||||
Core drop-ship revenue: | |||||||||||||||||||||||||||||||||
Order fee revenue | $ | 12,276 | $ | 12,901 | $ | 12,038 | $ | 19,569 | $ | 10,900 | $ | 11,227 | $ | 10,399 | $ | 17,070 | $ | 9,414 | $ | 9,683 | $ | 9,102 | |||||||||||
Subscription and other platform revenue | 8,544 | 8,432 | 8,451 | 9,195 | 8,053 | 7,827 | 7,542 | 7,728 | 6,767 | 6,529 | 6,474 | ||||||||||||||||||||||
Set-up and professional services revenue | 1,713 | 1,622 | 1,725 | 1,387 | 1,431 | 1,491 | 1,383 | 1,238 | 1,106 | 1,055 | 894 | ||||||||||||||||||||||
Total core drop-ship revenue | 22,533 | 22,955 | 22,214 | 30,151 | 20,384 | 20,545 | 19,324 | 26,036 | 17,287 | 17,267 | 16,470 | ||||||||||||||||||||||
Demand channel revenue | 2,081 | 2,253 | 2,354 | 2,730 | 2,094 | 2,558 | 2,766 | 3,235 | 2,408 | 2,591 | 2,320 | ||||||||||||||||||||||
Total | $ | 24,614 | $ | 25,208 | $ | 24,568 | $ | 32,881 | $ | 22,478 | $ | 23,103 | $ | 22,090 | $ | 29,271 | $ | 19,695 | $ | 19,858 | $ | 18,790 | |||||||||||
Note 3 - Significant Accounting Policies
Cash and Cash Equivalents
The Company considers all highly liquid securities with original maturities of 90 days or less to be cash equivalents, including bank and money market accounts. Cash and cash equivalents at December 31, 2017 consisted principally of cash and money market accounts held at financial institutions in the United States that management believes to be reputable. Cash and cash equivalents at December 31, 2016 consisted principally of cash held at such financial institutions. At times, our accounts exceed insured limits. Money market accounts are carried at cost, which approximates fair value.
Accounts Receivable and Allowance for Doubtful Accounts
The Company grants credit to customers in the normal course of business without collateral. Accounts receivable are stated net of allowances for doubtful accounts, which represent estimated losses resulting from the inability of certain customers to make the required payments. When determining the allowances for doubtful accounts, we take several factors into consideration, including the overall composition of the accounts receivable aging, our prior history of accounts receivable write-offs, the types of customers and our experience with specific customers. We write off accounts receivable when they are determined to be uncollectible. Changes in the allowances for doubtful accounts are recorded as bad debt expense and are included in general and administrative expenses in our consolidated statements of comprehensive income (loss).
Our allowance for doubtful accounts activity, included in accounts receivable, net, was as follows for the years ended December 31, (in thousands):
2017 | 2016 | 2015 | ||||||||||
Balances as of January 1 | $ | 200 | $ | 239 | $ | 233 | ||||||
Provision for doubtful accounts | 1,269 | 629 | 481 | |||||||||
Write-offs | (385 | ) | (668 | ) | (475 | ) | ||||||
Balances as of December 31 | $ | 1,084 | $ | 200 | $ | 239 | ||||||
52
The increase in our provision for doubtful accounts for the year ended December 31, 2017 is due, primarily, to customer bankruptcies.
Property and Equipment
Property and equipment are stated at cost. Equipment under capital leases are stated at the present value of minimum lease payments. Repairs and maintenance costs are expensed as incurred. Depreciation of property and equipment is computed using the straight-line method over the following estimated useful lives:
Computer equipment | 3 to 5 years | |
Furniture and fixtures | 5 years | |
Leasehold improvements | lesser of remaining lease term or estimated useful life | |
Capitalized Software Costs
The Company capitalizes the cost of payroll, payroll-related costs and third-party consulting fees incurred in the direct development or enhancement of solutions as internal-use software. During 2016, we changed and further refined our methodologies and processes to estimate the portion of software development costs that is eligible to be capitalized, which is assessed at a project level. Development costs incurred during the preliminary project stage or costs incurred for requirements gathering, data conversion activities, training, maintenance and minor enhancements are expensed as incurred. Development costs incurred for the coding, configuration, interfacing, automation and testing of new functionality after the preliminary project stage is complete are capitalized. Capitalized software costs are amortized on a straight-line basis over two to three years, based on the nature and estimated useful life of the applicable solution. Amortization of capitalized software costs is included in cost of revenue within the consolidated statements of comprehensive income (loss).
Deferred Services Costs
The Company defers direct payroll, payroll-related costs and third-party consulting costs incurred for the set-up and integration of new customers on our platform and for enhancements we make to our platform that are particular to specific customers. Deferred services costs associated with the integration of customers on our platform are recognized over the estimated life of such customers. Deferred services costs incurred to enhance existing customers' platforms are recognized over the estimated remaining customer life. Amortization of deferred services costs is included in cost of revenue within the consolidated statements of comprehensive income (loss).
Impairment of Long-Lived Assets
Long-lived assets, such as property and equipment, capitalized software costs, deferred services costs and intangible assets are reviewed for impairment whenever events or changes in circumstances indicate that the carrying amount of an asset may not be recoverable. If circumstances require a long-lived asset or asset group to be tested for possible impairment, the Company first compares undiscounted cash flows expected to be generated by that asset or asset group to its carrying value. If the carrying value of the long-lived asset or asset group is not recoverable on an undiscounted cash flow basis, an impairment is recognized to the extent that the carrying value exceeds its fair value. Fair value may be determined through various valuation techniques, including discounted cash flow models, quoted market values and independent third-party appraisals, as considered necessary or appropriate.
Goodwill
Goodwill is an asset representing the future economic benefits arising from other assets acquired in a business combination that are not individually identified and separately recognized. Goodwill is reviewed for impairment at least annually as of October 1, and more frequently if events or changes in circumstances indicate that goodwill might be impaired.
GAAP provides the option to perform a qualitative assessment to determine whether it is more-likely-than-not that the fair value of a reporting unit is less than its carrying amount prior to performing the two-step goodwill impairment test. If it is more-likely-than-not that the fair value of a reporting unit is less than its carrying amount, the two-step goodwill impairment test is required. If it is more-likely-than-not that the fair value of a reporting unit is greater than its carrying amount, the two-step goodwill impairment test is not required.
For the year ended December 31, 2017, we performed step one of the goodwill impairment test utilizing the market capitalization approach to determine whether the fair value of our reporting unit is less than its carrying amount. Based upon our assessment, we believe the fair value exceeds the carrying value, and no impairment loss was recorded in 2017.
53
Revenue and Deferred Revenue
The Company generates revenue through delivery of its ecommerce fulfillment and marketing software solutions. The Company follows Financial Accounting Standards Board ("FASB") guidance set forth in Accounting Standards Codification ("ASC") Subtopic 985-605-05 related to Hosting Arrangements and ASC Subtopic 605-25 related to Revenue Arrangements with Multiple Deliverables. The Company recognizes revenue when all of the following conditions are met: there is persuasive evidence of an arrangement, the services have been delivered to the customer, the collection of the related fees is reasonably assured and the amount of the related fees is fixed and determinable.
Revenue from new customer acquisition is generated under services agreements with multiple elements. Customers do not have the contractual right to take possession of our solutions. We evaluate each element in a multiple-element arrangement to determine whether it represents a separate unit of accounting. An element constitutes a separate unit of accounting when the delivered item has standalone value and delivery of the undelivered element is probable and within our control.
Fees charged to customers based on the level of a customer's utilization of our solutions and other platform fees attributable to inventory management and third-party communication capabilities are recognized in the period in which such fees are earned. We recognize monthly subscription fees as revenue in the period in which the subscription is earned.
Set-up fees provide customers access to our solutions through production launch. They are billed during the implementation phase and recorded as deferred revenue until a customer's subscription period has commenced. We also provide professional services to provide certain customer-requested enhancements to our solutions as well as other professional services. Set-up and professional services fees related to customer solution enhancements do not have stand-alone value because they are sold only in conjunction with a subscription to our solutions, they are sold only by us, a customer could not resell them, and they do not represent the culmination of a separate earnings process. Set-up fees without stand-alone value are recognized over the longer of the life of the agreement or the expected customer life. We recognize revenue for professional services fees charged to customers for solution enhancement services over the estimated remaining customer life. Professional services charged to customers that do have stand-alone value are recognized in the period in which the professional services fees are earned.
In determining the estimated life of our customers, we consider our historical experience with customer contract renewals, the type of customer, the size of the customer and the period over which the customer will benefit from the related offerings. As of December 31, 2017, the estimated life of certain customers ranges from 1 to 10 years, reflecting a shorter life for smaller customers and a longer life for our largest retail customers. Deferred revenue consists of the unearned portion of deferred set-up and professional services fees and annual subscription fees.
Reimbursement payments received for out-of-pocket expenses are recorded as revenue and cost of revenue in the consolidated statements of comprehensive income (loss).
Advertising Expenses
The Company incurs advertising expense consisting of promotions and public relations to promote our solutions. Advertising is expensed as incurred and was $295 thousand, $100 thousand and $314 thousand for the years ended December 31, 2017, 2016 and 2015, respectively.
Share-Based Compensation
Share-based awards exchanged for employee services are recorded as expense, net of estimated forfeitures, at the estimated fair value of these awards over the requisite employee service period (typically with annual straight-line vesting over 4 years), or where applicable for performance-based awards, over the service period, when the achievement of certain performance-based conditions are considered probable, and expire after 10 years.
Pre-Spin-Off Valuation Inputs and Methodologies
Prior to the Spin-Off, the Company's share-based awards consisted of CTI-issued stock options and stock appreciation rights ("SARs"), which were classified as liability awards and were included as a share-based compensation liability on the consolidated balance sheets. We estimated the fair value of these awards using a Black-Scholes pricing model. We measured the cost of services received in exchange for these awards based on the fair value of the award, and remeasured the fair value of the award at each reporting date.
In valuing these share-based awards, significant judgment is required in determining the fair value of the Company's share price, the expected volatility of common stock and the expected term for which individuals will hold their share-based
54
awards prior to exercise. The estimation of these awards that will ultimately vest requires judgment, and to the extent actual results differ from the Company's estimates, such amounts are recorded as an adjustment in the period in which estimates are revised. With the assistance of an independent third-party advisory firm, for the year ended December 31, 2015 and the three months ended March 31, 2016, we estimated share-price based on an internal valuation using a combination of three different approaches:
• | Market Multiple Approach - this approach involves the capitalization of revenue and earnings before interest, taxes, depreciation and amortization, and option expense. Multiples are determined through an analysis of certain publicly traded companies, selected based on operational and economic similarity with the principal business and operational revenue model of CommerceHub. Multiples are calculated for the comparative companies based upon their trading prices. The risk analysis incorporates quantitative and qualitative risk factors, which relate to, among other things, the nature of the industry in which we and the other comparative companies are engaged, relative size, profitability and growth rates. |
• | Guideline Transaction Approach - this approach is similar to the Market Multiple Approach in that it involves a consideration of multiples of revenue and Adjusted EBITDA. However, multiples used for this approach were determined through the analysis of transactions involving controlling interests in companies with operations similar to CommerceHub's business. |
• | Discounted Cash Flow ("DCF") Approach - internally prepared financial projections are used to develop the DCF Approach, a valuation method that estimates the present value of the projected cash flows to be generated from the business. In the DCF Approach, a discount rate, reflecting all risks of ownership and associated risks of realizing the stream of projected future cash flows, is applied to the stream of projected cash flows. |
For the three months ended June 30, 2016, the estimated share-price was based on the fair market value of our Series C common stock traded immediately following the Spin-Off. In connection with the Spin-Off, the outstanding CTI share-based awards were adjusted, such that each holder of an option award or a SAR with respect to shares of CTI common stock received an option award to purchase shares of our Series C common stock. Unlike the original CTI options and SARs, which were able to be settled in cash prior to completion of the Spin-Off, the new option awards resulting from the conversion of the original CTI options and SARs may be settled only in shares of our Series C common stock (see Note 12).
Post-Spin-Off Valuation Inputs and Methodologies
Following the Spin-Off, we grant to our employees stock options and restricted stock units ("RSUs") in respect of our Series C common stock under the CommerceHub, Inc. 2016 Omnibus Incentive Plan (as amended, amended and restated or otherwise modified from time to time, the "Omnibus Plan"), which was adopted in connection with the Spin-Off.
The Company determined the fair value of RSU awards based on the closing market price per share of our Series C common stock on the date of grant.
The Company estimates the fair value of stock options using a Black-Scholes pricing model. For awards granted subsequent to the Spin-Off, the share-price is based on the closing price of our Series C common stock on the date of grant. Expected volatility of the stock was based on our industry peer group because we did not have sufficient historical volatility data for our stock. The expected term of the options considers our historical and expected future employee exercise behavior and was determined using the simplified method, which was considered to be our best estimate of expected future term as we lacked sufficient history of exercise activity as a stand-alone public company. Further, our historical exercise experience is not considered to be representative of our future expected term based on the significant exercise activity that occurred in 2016 in anticipation of the Spin-Off. The risk-free interest rate assumption was based upon observed interest rates for constant maturity U.S. Treasury securities consistent with the expected term of the Company's share-based awards. The Company assumed a zero dividend yield as, following the Spin-Off, we do not expect to pay any cash dividends in the foreseeable future.
55
The following table summarizes the assumptions used for estimating the fair value of stock options and SAR awards granted during the years ended December 31:
2017 | 2016 Post Spin-Off | 2016 Pre Spin-Off | 2015 | ||||
Risk-free interest rate | 1.93% - 2.25% | 1.36% - 2.27% | 1.23% - 1.44% | 1.76% | |||
Expected term (years) | 6.3 | 6.3 | 5.9 - 6.3 | 5.3 - 6.2 | |||
Expected volatility | 40.16% - 41.60% | 41.51% - 41.89% | 42.12% | 30% - 31% | |||
Dividend yield | —% | —% | —% | —% | |||
Weighted average grant-date fair value | $7.25 | $6.22 | $15.18 | $14.13 | |||
The awards outstanding at the time of the Spin-Off were converted at an exchange ratio of approximately 2.18, which reduced the underlying share price and resulting grant date fair value of awards granted after the Spin-Off. For awards granted prior to the Spin-Off, as these awards were classified as liability-based awards and were marked-to-market each reporting period, the weighted after grant date fair value in the table above represents the most recent marked-to-market fair value of such awards.
The Company also grants employees rights to purchase discounted shares of our Series C common stock under the CommerceHub, Inc. 2016 Employee Stock Purchase Plan (as amended, amended and restated or otherwise modified from time to time, the "ESPP"). We estimate the fair value of ESPP rights based on the market price of our Series C common stock at the beginning of each offering period and the Black-Scholes option pricing model.
The following table summarizes the assumptions used for estimating the fair value of ESPP rights granted during the year ended December 31, 2017:
Volatility | 41.16% - 41.51% |
Term (in years) | 0.5 |
Risk-free interest rate | 0.82% - 1.17% |
Dividend yield | —% |
The Company estimates the forfeiture rate for share-based awards based on our historical turnover experience and other qualitative factors. We review and update our forfeiture rate, if necessary, at least annually, or more frequently if facts or circumstances indicate a change is necessary or appropriate.
Income Taxes
Deferred tax assets and liabilities are recognized for the future tax consequences attributable to differences between the consolidated financial statement carrying amounts of existing assets and liabilities and their respective tax bases and operating loss and tax credit carry-forwards. Deferred tax assets and liabilities are measured using enacted tax rates expected to apply to taxable income in the years in which those temporary differences are expected to be recovered or settled. The effect on deferred tax assets and liabilities of a change in tax rates is recognized in the period that includes the enactment date. A tax valuation allowance is established, as needed, to reduce deferred tax assets to the amount expected to be realized. In the event it becomes more-likely-than-not that some or all of the deferred tax asset allowances will not be needed, the valuation allowance will be adjusted.
In the ordinary course of business, there is inherent uncertainty in quantifying our income tax positions. We assess our income tax positions and record tax benefits for all years subject to examination based upon management's evaluation of the facts, circumstances and information available at the reporting date. For those tax positions where it is more-likely-than-not that a tax benefit will be sustained, we have determined the amount of the tax benefit to be recognized by estimating the largest amount of tax benefit that has a greater than 50% likelihood of being realized upon ultimate settlement with a taxing authority that has full knowledge of all relevant information. For those income tax positions where it is not more-likely-than-not that a tax benefit will be sustained, no tax benefit has been recognized in the financial statements. Interest and penalties related to unrecognized tax benefits are recognized as a component of income tax expense when settled.
56
Business Combinations
Assets acquired and liabilities assumed in a business combination are recognized at their estimated fair values as of the acquisition date. Transaction costs associated with a business combination are expensed as incurred. Any excess of the acquisition price over the estimated fair value of individually identifiable net assets acquired is recorded as goodwill. Assets acquired may also include identifiable intangible assets, such as subscriber relationships, which are recognized separately from goodwill.
We make estimates and assumptions to value assets acquired and liabilities assumed at the acquisition date, including deferred income taxes, uncertain tax positions and tax-related valuation allowances. These estimates are inherently uncertain and subject to refinement, and they typically include the calculation of an appropriate discount rate and projection of the cash flows associated with each acquired asset. As a result, during the measurement period, which may be up to one year after the acquisition date, we may record adjustments to assets acquired and liabilities assumed with a corresponding offset to goodwill. Upon the conclusion of the one year measurement period or final determination of the values of assets acquired or liabilities assumed, whichever comes first, any subsequent adjustments are recorded to the consolidated statements of comprehensive income (loss).
Note 4 - Recent Accounting Pronouncements
In May 2014, the FASB issued ASU No. 2014-09, Revenue from Contracts with Customers (Topic 606) ("ASU No. 2014-09"). This standard is effective for fiscal years beginning after December 15, 2017, with two transition methods of adoption allowed: a full retrospective or modified retrospective. In May 2016, FASB issued ASU No. 2016-08, Revenue from Contracts with Customers (Topic 606): Principal versus Agent Considerations (Reporting Revenue Gross versus Net). This update was issued to further clarify the implementation guidance on principal versus agent considerations in ASU No. 2014-09. In April 2016, FASB issued ASU No. 2016-10, Identifying Performance Obligations and Licensing, which clarifies implementation guidance on the identification of performance obligations and the licensing implementation guidance in ASU No. 2014-09. In May 2016, FASB issued ASU No. 2016-12, Narrow-Scope Improvements and Practical Expedients, which clarifies the guidance on assessing collectability, presentation of sales taxes, non-cash consideration and completed contracts and contract modifications at transition. In December 2016, FASB issued ASU No. 2016-20, Technical Corrections and Improvements to Topic 606, which clarifies certain narrow aspects of ASU No. 2014-09.
We continue to evaluate the impacts of this new standard on our business processes, information technology systems and associated internal controls. We have developed an implementation plan to adopt this standard, and, as part of this plan, we continue to assess the impacts this standard is expected to have on our financial statements and related disclosures. We will adopt this standard using the modified retrospective transition method effective January 1, 2018. The adoption of this standard will not significantly impact our recognition of order fee revenue and subscription and other platform revenue associated with our drop-ship and demand channel solutions. In addition, the adoption of this standard will impact our accounting for certain set-up and professional services revenue and the periods over which this revenue and the related deferred services costs are recognized. Further, this standard will impact how we account for costs to acquire a contract. We expect that applying this standard will result in the deferral of additional costs, including certain commission expenses to sales representatives directly associated with acquiring a new revenue contract, which we expect to recognize over the estimated customer life. We do not expect these impacts to set-up and professional services revenue and related deferred service costs and commissions will be significant to our consolidated financial statements. Based on our impact analysis performed to date, we estimate approximately a $0.3 million reduction to retained earnings upon the adoption of this standard on January 1, 2018.
In February 2016, the FASB issued ASU No. 2016-02, Leases (Topic 842) ("ASU No. 2016-02"). This topic provides that a lessee should recognize the assets and liabilities that arise from leases and requires an entity to separate the lease components from the non-lease components in a contract. ASU No. 2016-02 is intended to improve financial reporting on lease transactions and is effective for fiscal years beginning after December 15, 2018. We are evaluating the financial statement impact this update will have on our consolidated financial statements.
In March 2016, the FASB issued ASU No. 2016-09, Improvements to Employee Share-Based Payment Accounting ("ASU No. 2016-09"), which is intended to improve the accounting for share-based payment transactions as part of the FASB's simplification initiative. ASU No. 2016-09 changed aspects of the accounting for share-based payment award transactions, including: (1) accounting for income taxes; (2) classification of excess tax benefits on the statement of cash flows; (3) forfeitures; (4) minimum statutory tax withholding requirements; and (5) classification of employee taxes paid on the statement of cash flows when an employer withholds shares for tax-withholding purposes. We adopted ASU No. 2016-09 in the first quarter of 2017, which did not have a significant impact on our consolidated financial statements.
57
In August 2016, the FASB issued ASU No. 2016-15, Classification of Certain Cash Receipts and Cash Payments (Topic 230) ("ASU No. 2016-15"), which addresses eight specific cash flow matters with the objective of reducing diversity in practice in how certain cash receipts and cash payments are classified in statements of cash flows. ASU No. 2016-15 is effective for fiscal years beginning after December 15, 2017. We are adopting ASU No. 2016-15 in the first quarter of 2018, which we do not expect to have a significant impact on our consolidated financial statements.
In November 2016, the FASB issued ASU No. 2016-18, Restricted Cash ("ASU No. 2016-18"), which requires that entities show changes in total of cash, cash equivalents and restricted cash in the statement of cash flows. Transfers between cash, cash equivalents and restricted cash should not be presented as cash flow activities on the statement of cash flows. ASU No. 2016-18 is effective for fiscal years beginning after December 15, 2017. We are adopting ASU 2016-18 in the first quarter of 2018, which we do not expect to have a significant impact on the consolidated financial statements.
In January 2017, the FASB issued ASU No. 2017-04, Intangibles - Goodwill and Other (Topic 350): Simplifying the Accounting for Goodwill Impairment ("ASU No. 2017-04"), which removes Step 2 of the goodwill impairment test, which requires a hypothetical purchase price allocation. An impairment charge will now equal the amount by which the reporting unit's carrying value exceeds its fair value. ASU No. 2017-04 is effective for fiscal years beginning after December 15, 2019. We do not expect the adoption of this standard will have a significant impact on our consolidated financial statements.
In May 2017, the FASB issued ASU No. 2017-09, Compensation-Stock Compensation (Topic 718): Scope of Modification Accounting ("ASU No. 2017-09"), which clarifies what constitutes a modification of a share-based payment award. ASU No. 2017-09 is effective for fiscal years beginning after December 15, 2017. We are adopting ASU No. 2017-09 in the first quarter of 2018, which we do not expect to have a significant impact on the consolidated financial statements.
Note 5 - Earnings (Loss) Per Share
For the years ended December 31, 2017 and 2016, basic earnings per common share is computed by dividing net income by the weighted average number of common shares outstanding during that period (excluding pre-Spin-Off periods in 2016). For the year ended December 31, 2015, basic and diluted earnings (loss) per common share is computed by dividing net income (loss) for the respective period by 42,702,842 common shares, which is the aggregate of 13,522,288 shares of Series A common stock, 711,992 shares Series B common stock and 28,468,562 shares of Series C common stock issued upon completion of the Spin-Off on July 22, 2016. The shares used in the calculation of diluted earnings (loss) per share for 2015 exclude issuances of 109,354 shares of common stock issued to pre-Spin-Off minority shareholders of CTI and 7,362,933 outstanding awards to purchase shares of our common stock, which occurred after the Spin-Off.
Diluted earnings per share gives effect to all dilutive potential shares attributable to outstanding share-based awards during the applicable period. The shares used in the calculation of diluted earnings per share exclude options to purchase shares where the exercise price was greater than the average market price of such share for the period, awards where the effect of their inclusion would have an anti-dilutive effect, and awards with performance-based conditions where the performance criteria had not been met as of the reporting date.
The following table sets forth net income (loss) and the basic and diluted shares used to calculate earnings per share (in thousands):
Year Ended December 31, | |||||||||||
2017 | 2016 | 2015 | |||||||||
Net income (loss) | $ | 9,858 | $ | 9,096 | $ | (4,467 | ) | ||||
Basic - weighted average shares outstanding | 43,204 | 42,831 | 42,703 | ||||||||
Effect of dilutive potential securities | 2,026 | 1,512 | — | ||||||||
Diluted - weighted average shares outstanding | 45,230 | 44,343 | 42,703 | ||||||||
Anti-dilutive securities | 3,837 | 4,222 | — | ||||||||
Note 6 - Business Combinations
On January 8, 2015, we acquired 100% of the shares of Mercent Corporation ("Mercent"), an online marketing technology and service company that helped merchants optimize performance across online channels, for total cash consideration of approximately $20.2 million, net of cash acquired. During the year ended December 31, 2015, we incurred
58
transaction-related costs of approximately $166 thousand, which are included in general and administrative expenses on the consolidated statements of comprehensive income (loss).
Under the acquisition method of accounting, the Company allocated the purchase price to the identifiable assets and liabilities based on their estimated fair value, including customer relationships and developed software technology. Methodologies used in valuing the intangible assets included, but were not limited to, the multiple period excess earnings method for developed software technology and customer relationships. The excess of the purchase price over the total net identifiable assets has been recorded as goodwill, which includes synergies expected from the expanded service capabilities and the value of the assembled work force. For federal income tax purposes, the transaction is treated as a stock acquisition and the goodwill is not deductible.
Note 7 - Concentrations of Significant Customers and Credit Risk
No single customer accounted for more than 10% of our total revenue in any of the years ended December 31, 2017, 2016 or 2015. However, our revenue model is primarily based on retailer and supplier program relationships whereby many revenue-generating supplier transactions conducted through our platform may be attributable to a single retailer ("Total Program Revenue"). For the year ended December 31, 2017, there were seven customers with Total Program Revenue that accounted for more than 5% each of our total revenue, two of which had Total Program Revenue that accounted for between 10% and 15% each of our total revenue.
No customer represented more than 10% of accounts receivable at December 31, 2017.
Note 8 - Related Party Transactions
Prior to the Spin-Off, Liberty, QVC, Inc. (“QVC”), which is a wholly owned subsidiary of Liberty, and other subsidiaries and equity investments of Liberty were related parties of CommerceHub for GAAP purposes and related persons of CommerceHub for purposes of Regulation S-K under the Securities Exchange Act of 1934, as amended. As a result, because this report includes pre-Spin-Off periods, we have disclosed activities with these entities during such periods. For the year ended December 31, 2017 and future periods that do not include pre-Spin-Off periods, based on current facts and circumstances, we do not expect Liberty, QVC or other subsidiaries or equity investments of Liberty to be related parties or related persons of CommerceHub, but we will continue to monitor and evaluate these relationships and other potential relationships with related parties and/or related persons.
Transactions with QVC
We provide our solutions to QVC in the ordinary course of business. For the years ended December 31, 2016 and 2015, Total Program Revenue with QVC accounted for approximately 7% and 8% of total revenue, respectively. We had accounts receivable owing from QVC of approximately $784 thousand at December 31, 2016.
Transactions with Liberty
In previous periods, we had outstanding a promissory note as a lender to Liberty, which carried an interest rate based on one-year LIBOR plus 100 basis points. In the years ended December 31, 2016 and 2015, we earned interest of $273 thousand and $600 thousand on this promissory note, respectively. During the second quarter of 2016, Liberty fully repaid the $36.4 million outstanding under this promissory note, including accumulated interest of $2.4 million.
During June 2016, we entered into a funding arrangement with Liberty pursuant to a previously established intercompany funding agreement. Under this arrangement, Liberty agreed to loan us $28.7 million, at current market interest rates, so we could fulfill our obligations under the predecessor plan to the CommerceHub, Inc. Legacy Stock Appreciation Rights Plan and our related liquidity program. In July 2016, we fully repaid amounts outstanding pursuant to this arrangement, including accumulated interest, to Liberty using borrowings under our credit facility, and the funding agreement between us and Liberty was terminated as of the completion of the Spin-Off.
In July 2016, in conjunction with the Spin-Off, we collected amounts due from Liberty for federal tax benefits of $8.5 million and fully repaid amounts due for state taxes paid of $1.3 million. Further, we received a contribution from Liberty of $6.0 million to compensate the Company for the dilution associated with Parent equity awards, we paid a dividend of $18.9 million to the holders of CTI common stock, including Parent, as a return on investment, and we paid an additional dividend of $0.9 million to Parent, as the holder of CTI preferred shares. Amounts owed to Liberty of $33 thousand at December 31, 2016 are included in accounts payable and accrued expenses within the consolidated balance sheets.
59
Note 9 - Capitalized Software
Capitalized software, net was comprised of the following at December 31 (in thousands):
2017 | 2016 | ||||||
Capitalized software | $ | 31,650 | $ | 32,506 | |||
Less accumulated amortization | (28,800 | ) | (25,790 | ) | |||
Capitalized software, net | $ | 2,850 | $ | 6,716 | |||
During 2017, we recorded impairment charges totaling $254 thousand, included within cost of revenue in the consolidated statements of comprehensive income (loss), for capitalized software projects that will no longer be pursued. A portion of these charges was incurred in connection with our 2017 restructuring plan (see Note 16).
Amortization expense related to capitalized software is included in cost of revenue and was approximately $4.9 million, $5.0 million and $3.4 million, for the years ended December 31, 2017, 2016 and 2015, respectively.
Future amortization expense of existing capitalized software as of December 31, 2017 is expected to be as follows for the years ending December 31 (in thousands):
2018 | $ | 2,288 | |
2019 | 477 | ||
2020 | 85 | ||
$ | 2,850 | ||
Note 10 - Property and Equipment
Property and equipment consisted of the following at December 31 (in thousands):
2017 | 2016 | ||||||
Computer equipment | $ | 14,068 | $ | 14,892 | |||
Furniture and fixtures | 1,130 | 1,101 | |||||
Leasehold improvements | 3,028 | 2,965 | |||||
Total | 18,226 | 18,958 | |||||
Less accumulated depreciation | (12,160 | ) | (11,329 | ) | |||
Property and equipment, net | $ | 6,066 | $ | 7,629 | |||
Depreciation of property and equipment totaled approximately $3.2 million, $3.0 million and $2.6 million during the years ended December 31, 2017, 2016 and 2015, respectively.
Note 11 - Goodwill and Intangible Assets
There were no changes in the carrying amount of goodwill during the years ended December 31, 2017 and 2016.
Intangible assets acquired as of December 31, 2017 and 2016 were as follows (in thousands):
Weighted Average Life (Years) | Gross Carrying Amount | Accumulated Amortization | Net Book Value | ||||||||||
Developed technology | 2.0 | $ | 1,500 | $ | (1,500 | ) | $ | — | |||||
Customer relationships | 2.0 | 2,000 | (2,000 | ) | — | ||||||||
Total | $ | 3,500 | $ | (3,500 | ) | $ | — | ||||||
There was no amortization expense related to intangible assets acquired for the year ended December 31, 2017 and there was $1.8 million for each of the years ended December 31, 2016 and 2015. Intangible assets acquired were fully amortized as of December 31, 2016.
60
Note 12 - Share-Based Awards
We grant equity incentive awards to certain of our employees (including our executive officers), directors and consultants. Following the Spin-Off, all of the awards we have granted have been stock options and RSUs relating to shares of our Series C common stock. Most of these awards contain service-based vesting conditions (typically annual vesting over four years), and some of these awards contain both service- and milestone-based vesting conditions. We also grant deferred stock units ("DSUs") in respect of our Series C common stock to our directors under the Omnibus Incentive Plan and the CommerceHub, Inc. Non-Employee Director Deferred Compensation Plan (the "Deferred Compensation Plan").
Included in the consolidated statements of comprehensive income (loss) are the following amounts of share-based compensation, net of estimated forfeitures, for the years ended December 31 (amounts in thousands):
2017 | 2016 | 2015 | |||||||||
Cost of revenue | $ | 396 | $ | (102 | ) | $ | 2,361 | ||||
Research and development | 1,728 | 2,261 | 7,229 | ||||||||
Sales and marketing | 553 | 834 | 4,098 | ||||||||
General and administrative | 5,952 | 8,297 | 28,462 | ||||||||
$ | 8,629 | $ | 11,290 | $ | 42,150 | ||||||
Gross tax-related benefits of $3.6 million, $87.2 million and $7.5 million were also recognized for the years ended December 31, 2017, 2016 and 2015, respectively. Cash received from exercises of stock options totaled $3.3 million, $0.8 million, and $33 thousand for the years ended December 31, 2017, 2016 and 2015, respectively, and is included in financing activities in the consolidated statements of cash flows.
CommerceHub Employee Plans
Legacy Plans
Prior to the Spin-Off, CTI issued share-based awards pursuant to an incentive and nonqualified stock option plan adopted in 1999 (the "1999 Plan") and its 2010 Stock Appreciation Rights Plan (the "SAR Plan"). The 1999 Plan authorized grants of options to purchase up to 4,000,000 shares of authorized but unissued common stock. Options granted under the 1999 Plan were to vest over a period of four years and expire ten years from the date of grant. No shares of common stock are available for grants, or have been available for grants under the 1999 Plan, since September 2009 when the 1999 Plan expired. The SAR Plan authorized grants of up to 6,000,000 SARs, which included and was not in addition to shares previously issued, or shares issuable in respect of awards previously issued, under the 1999 Plan. The SARs issued under the SAR Plan typically vested over a period of four years and expired ten years from the date of grant for service-based awards. SARs that included both service and performance-based conditions vested based on the satisfaction of service requirements and achievement of performance conditions over the period specified in the applicable award agreement. The SAR Plan was terminated in connection with the Spin-Off.
All of the Company's share-based awards under these plans were classified as liability awards, as the SARs could have been settled in cash and the stock options could have been settled in cash at the option of the holder, in each case under a liquidity program. The Company measured the cost of services received in exchange for a liability classified award based on the current fair value of the award, and remeasured the fair value of the award at each reporting date.
In connection with the Spin-Off, the 2,663,616 CTI awards then outstanding, consisting of 33,950 options and 2,629,666 SARs, were converted at an exchange ratio of approximately 2.18, into 5,811,150 options to purchase shares of our Series C common stock. Unlike the original CTI options and SARs, which were able to be settled in cash prior to completion of the Spin-Off, the option awards resulting from the conversion of the original CTI options and SARs may be settled only in shares of our Series C common stock. Except as described above, the terms of these awards (including, for example, the vesting terms thereof) are, in all material respects, the same as those of the corresponding original CTI option or SAR award. These awards were issued pursuant to the CommerceHub, Inc. Legacy Stock Option Plan and the CommerceHub, Inc. Legacy SAR Plan (together, the "Legacy Plans"). The Legacy Plans govern the terms and conditions of these option awards but will not be used to make any new grants following the Spin-Off.
The foregoing conversion of these awards as part of our internal restructuring in connection with the Spin-Off resulted in a modification of the terms and conditions of the pre-Spin-Off awards, and the reclassification of the awards from liability to equity awards. As of the July 21, 2016 modification date, we performed a fair value analysis of the awards immediately before
61
and immediately after the restructuring. Because the 1999 Plan and the SAR Plan contained antidilution provisions, there was no incremental fair value or compensation expense as a result of the restructuring. The fair value of these awards immediately before and immediately after the Spin-Off was approximately $12.5 million. The value of these awards at the time of the restructuring was reclassified from share-based compensation liability to additional paid in capital. The remaining unvested compensation expense is recognized over the remaining service period or, for those awards with performance-based conditions, the service period when such performance conditions are considered probable.
CommerceHub, Inc. 2016 Omnibus Incentive Plan
In connection with the Spin-Off, we adopted the Omnibus Plan. The Omnibus Plan is designed to provide additional remuneration to officers, employees, nonemployee directors and independent contractors for service to CommerceHub and to encourage each plan participant’s investment in CommerceHub. Stock options, SARs, restricted shares, restricted stock units, cash awards, performance awards or any combination of the foregoing may be granted under the Omnibus Plan (collectively, "awards"). On January 1, 2017, the number of shares available for issuance under the Omnibus Plan was increased by 2,146,064 shares, or 5.0% of the outstanding shares of our common stock on December 31, 2016, to 15,346,064 shares of our Series C common stock, subject to anti-dilution, annual share-reserve increases and other adjustment provisions of the Omnibus Plan. The Omnibus Plan is administered by the compensation committee of the Company’s board of directors with regard to awards granted under the Omnibus Plan other than awards granted to the nonemployee directors, which are administered by the full board of directors, and the compensation committee and its designees (and the board of directors with respect to awards granted to non-employee directors) have full power and authority to determine the terms and conditions of such awards. We amended and restated the Omnibus Plan on October 13, 2016 in order to permit the compensation committee of the Company’s board of directors to delegate award granting authority under the Omnibus Plan. On June 16, 2017, our public stockholders approved the Second Amended and Restated Omnibus Plan at our 2017 Annual Meeting of Stockholders.
Options Activity under the Omnibus Plan and Legacy Plans (Series C)
The following tables summarize the share-based award activity of options to purchase shares of our common stock under our Omnibus Plan and Legacy Plans for the year ended December 31, 2017:
CommerceHub Employee Plans | |||||||||||||||
Omnibus Plan | Legacy Plans | ||||||||||||||
Series C | Weighted Average Exercise Price | Series C | Weighted Average Exercise Price | ||||||||||||
Outstanding at January 1, 2017 | 193,998 | $ | 14.59 | 5,580,109 | $ | 12.96 | |||||||||
Granted | 364,075 | $ | 16.56 | — | $ | — | |||||||||
Exercised | (3,544 | ) | $ | 14.85 | (205,963 | ) | $ | 10.38 | |||||||
Forfeited | (229,437 | ) | $ | 15.68 | (453,925 | ) | $ | 15.53 | |||||||
Outstanding at December 31, 2017 | 325,092 | $ | 16.02 | 4,920,221 | $ | 12.83 | |||||||||
Weighted average remaining contractual life (in years) | 9.0 | 7.2 | |||||||||||||
Aggregate intrinsic value (in thousands) | $ | 1,502 | $ | 38,187 | |||||||||||
Exercisable at December 31, 2017 | 28,274 | $ | 14.55 | 2,457,076 | $ | 9.61 | |||||||||
Weighted average remaining contractual life (in years) | 7.7 | 5.9 | |||||||||||||
Aggregate intrinsic value (in thousands) | $ | 171 | $ | 26,978 | |||||||||||
Vested and expected to vest at December 31, 2017 | 285,180 | $ | 15.99 | 4,643,090 | $ | 12.62 | |||||||||
Weighted average remaining contractual life (in years) | 9.0 | 7.1 | |||||||||||||
Aggregate intrinsic value (in thousands) | $ | 1,325 | $ | 36,999 | |||||||||||
The aggregate intrinsic value of options exercised under the Omnibus Plan during 2017 was $23 thousand. There were no exercises under the Omnibus Plan during 2016.
We do not issue new grants under the Legacy Plans. The aggregate intrinsic value of options exercised under the Legacy Plans was $1.7 million during 2017 and $0.5 million during the post-Spin-Off period in 2016. The aggregate intrinsic value of options exercised under the 1999 Plan and the SAR Plan was $86.7 million during the pre-Spin-Off period in 2016 and $7.5 million during the year ended December 31, 2015.
62
As of December 31, 2017, unrecognized compensation cost related to options to purchase shares of our Series C common stock under the Omnibus Plan and Legacy Plans was approximately $1.4 million and $9.9 million, respectively, and is expected to be recognized over weighted-average remaining vesting periods of approximately 3.2 years and 2.6 years, respectively.
RSU Activity Under the Omnibus Plan (Series C)
The following table summarizes the share-based award activity of RSUs relating to our Series C common stock granted under the Omnibus Plan for the year ended December 31, 2017:
Number of awards | Weighted average grant-date fair value | |||||
Outstanding at January 1, 2017 | 505,831 | $ | 14.35 | |||
Granted | 442,263 | $ | 17.31 | |||
Vested | (123,645 | ) | $ | 14.34 | ||
Forfeited | (280,954 | ) | $ | 15.36 | ||
Outstanding at December 31, 2017(1) | 543,495 | $ | 16.15 | |||
(1) Includes 40,850 DSUs relating to our Series C common stock issued to our directors. These DSUs are vested, but the underlying shares of Series C common stock will not be issued until delivery pursuant to the Deferred Compensation Plan.
The weighted average grant-date fair value of RSUs granted under the Omnibus Plan during 2016 was $14.35. The total fair value as of the respective vesting dates of RSUs vested during 2017 was $2.3 million and there were no RSUs vested for both years ended December 31, 2016 and 2015.
As of December 31, 2017, unrecognized compensation cost in respect of RSUs relating to shares of Series C common stock was approximately $4.3 million and is expected to be recognized over a weighted average remaining vesting period of approximately 2.8 years.
CommerceHub, Inc. Employee Stock Purchase Plan
In connection with the Spin-Off, we also adopted the ESPP, which provides employees with the opportunity to invest a portion of their annual eligible compensation to purchase shares of our Series C common stock at a purchase price equal to 85% of the lower of (a) the fair market value of our Series C common stock at the beginning of the applicable six-month offering period, and (b) the fair market value of our Series C common stock at the end of the applicable six-month offering period. We originally reserved 900,000 shares of our Series C common stock for issuance under the ESPP, which was increased to 1,329,212 shares on January 1, 2017 and is increased annually on the first day of each calendar year by the lesser of one percent of our total outstanding common stock on the last day of the immediately preceding calendar year or such other amount determined by the plan administrator. The first offering period under the ESPP began on January 1, 2017. For the year ended December 31, 2017, we recorded approximately $302 thousand of share-based compensation expense associated with the ESPP. During 2017, employees purchased 36,298 shares of Series C common stock under the ESPP and total cash received from ESPP purchases was $464 thousand.
Liberty Employee Plans
In connection with the Spin-Off, holders of option awards, RSUs and restricted stock awards ("RSAs") relating to Liberty's Liberty Ventures common stock received CommerceHub options, RSUs and RSAs, respectively, pursuant to the CommerceHub, Inc. Transitional Stock Adjustment Plan (the “Transitional Plan”). The Transitional Plan, which is administered for the benefit of Liberty employees and consultants, governs the terms and conditions of these new awards but will not be used to make any further grants.
CommerceHub, Inc. Transitional Stock Adjustment Plan
Prior to the Spin-Off, Liberty had granted to certain directors, officers, employees and consultants of Liberty options to purchase shares of Liberty Ventures common stock (each, an "original Ventures option award") pursuant to applicable incentive plans in place at Liberty. Each holder of an outstanding original Ventures option award on the record date for the Spin-Off (the "record date") who was a member of the Liberty board of directors or an officer of Liberty holding the position of Vice President or above received (i) an option to purchase shares of the corresponding series of our common stock and an option to purchase shares of our Series C common stock (such new option awards, "new CommerceHub option awards") and (ii) an
63
adjustment to the exercise price of and the number of shares subject to the original Ventures option award (as so adjusted, an "adjusted Ventures option award"). The exercise prices of and the number of shares subject to the new CommerceHub option awards and the related adjusted Ventures option awards were determined based on the exercise price of and the number of shares subject to the applicable original Ventures option award, the distribution ratios used in the Spin-Off, the pre-Spin-Off trading price of Liberty Ventures common stock (determined using the volume weighted average price of the applicable series of Liberty Ventures common stock over the three consecutive trading days immediately preceding the Spin-Off) and the relative post-Spin-Off trading prices of Liberty Ventures common stock and our common stock (determined using the volume-weighted average price of the applicable series of common stock over the three consecutive trading days beginning on the first trading day following the Spin-Off on which both the Liberty Ventures common stock and our common stock traded in the "regular way" (meaning once the common stock trades using a standard settlement cycle)), such that the pre-Spin-Off intrinsic value of the original Ventures option awards was allocated between the new CommerceHub option awards and the adjusted Ventures option awards.
All other holders of original Ventures option awards did not receive any new CommerceHub option awards as a result of the distribution. Rather, the holders' original Ventures option awards were adjusted so as to preserve the pre-Spin-Off intrinsic value of the original Ventures option awards based on the exercise price of and number of shares subject to such original Ventures option awards, the distribution ratios used in the Spin-Off, the pre-Spin-Off trading price of Liberty Ventures common stock and the post-Spin-Off trading price of Liberty Ventures common stock (determined as described above).
Except as described above, all other terms of the adjusted Ventures option awards and the new CommerceHub option awards (including, for example, the vesting terms thereof) are, in all material respects, the same as those of the corresponding original Ventures option awards.
Options Activity Under the Transitional Plan (Series A and Series C)
The following table summarizes the share-based award activity of options to purchase shares of our common stock under the Transitional Plan for the year ended December 31, 2017:
Liberty Employee Plans | |||||||||||||||
Transitional Plan | |||||||||||||||
Series A | Weighted Average Exercise Price | Series C | Weighted Average Exercise Price | ||||||||||||
Outstanding at January 1, 2017 | 329,188 | $ | 7.46 | 1,006,043 | $ | 8.93 | |||||||||
Granted | — | $ | — | — | $ | — | |||||||||
Exercised | (61,248 | ) | $ | 5.63 | (136,220 | ) | $ | 5.62 | |||||||
Forfeited | (1,785 | ) | $ | 12.51 | (3,558 | ) | $ | 12.46 | |||||||
Outstanding and expected to vest at December 31, 2017 | 266,155 | $ | 7.90 | 866,265 | $ | 9.45 | |||||||||
Weighted average remaining contractual life (in years) | 3.0 | 3.5 | |||||||||||||
Aggregate intrinsic value (in thousands) | $ | 3,733 | $ | 9,650 | |||||||||||
Exercisable at December 31, 2017 | 203,611 | $ | 6.44 | 460,899 | $ | 7.23 | |||||||||
Weighted average remaining contractual life (in years) | 2.3 | 2.6 | |||||||||||||
Aggregate intrinsic value (in thousands) | $ | 3,149 | $ | 6,159 | |||||||||||
We do not issue new grants under the Transitional Plan. The aggregate intrinsic value of options to purchase Series A common stock exercised under the Transitional Plan was $0.7 million during 2017 and $0.1 million during the post-Spin-Off period in 2016. The aggregate intrinsic value of options to purchase Series C common stock exercised under the Transitional Plan was $1.5 million during 2017 and $0.2 million during the post-Spin-Off period in 2016. There is no unrecognized compensation cost related to stock options under the Transitional Plan because they are held by employees of Liberty and any related compensation expense is incurred by Liberty.
Options Activity Under the Transitional Plan (Series B)
As of December 31, 2017, there were 172,882 new CommerceHub option awards to purchase shares of our Series B common stock outstanding, with a weighted average exercise price of $11.89, aggregate intrinsic value of $2.0 million, and weighted average remaining contractual life of 4.2 years. There was no activity relating to these awards during the year ended December 31, 2017. As of December 31, 2017, 32,052 of these stock options were exercisable, with a weighted average
64
exercise price of $12.49, aggregate intrinsic value of $353 thousand and weighted average remaining contractual life of 4.9 years. There is no unrecognized compensation cost related to options to purchase shares of our Series B common stock under the Transitional Plan because these awards are held by an employee of Liberty and any related compensation expense is incurred by Liberty.
RSAs and RSUs Under the Transitional Plan
Each holder of an RSU relating to shares of Series A or Series B Liberty Ventures common stock (an "original Ventures RSU") on the record date received 0.1 of an RSU relating to shares of the corresponding series of CommerceHub common stock and 0.2 of an RSU relating to shares of CommerceHub Series C common stock (such new RSU awards, "new CommerceHub RSUs") for each original Ventures RSU held by them as of the record date, with cash paid in lieu of fractional new CommerceHub RSUs. Except as described herein, the terms of all of the new CommerceHub RSUs (including, for example, the vesting terms thereof) are, in all material respects, the same as those of the corresponding original Ventures RSU.
Each holder of an RSA relating to shares of Series A or Series B Liberty Ventures common stock (an "original Ventures RSA") on the record date received (i) 0.1 of an RSA relating to the corresponding series of CommerceHub common stock and (ii) 0.2 of an RSA relating to CommerceHub Series C common stock (such new RSAs, "new CommerceHub RSAs") for each RSA relating to Liberty Ventures common stock held by them as of the record date, with cash paid in lieu of fractional new CommerceHub RSAs. Except as described herein, the terms of all new CommerceHub RSAs (including, for example, the vesting terms thereof) are, in all material respects, the same as those of the corresponding original Ventures RSA.
RSA and RSU Activity Under the Transitional Plan (Series A and Series C)
Share-based award activity for RSUs and RSAs relating to our Series A and Series C common stock issued under the Transitional Plan for the year ended December 31, 2017 was not material. As of December 31, 2017, there were 4,357 RSAs and 118 RSUs relating to our Series A common stock outstanding, and there were 8,745 RSAs and 236 RSUs relating to our Series C common stock outstanding. There is no unrecognized compensation cost related to these awards because they are held by employees of Liberty and any related compensation expense is incurred by Liberty.
Note 13 - Income Taxes
For pre-Spin-Off periods, CTI was part of the Liberty federal consolidated tax group, and federal income taxes were paid to (or refunded by) Liberty pursuant to the terms of a tax sharing agreement under which taxes were computed on a separate company basis. Following the Spin-Off, CommerceHub is a separate, stand-alone federal taxpayer. The tax provision included in these consolidated financial statements has been prepared on a stand-alone basis, as if CommerceHub was not part of the Liberty consolidated group. Accordingly, the effective tax rate of the Company in future years could vary from its historical effective tax rates depending on, among other factors, the Company's legal structure and related tax elections from time to time.
Liberty filed income tax returns in the U.S. federal jurisdiction, various state jurisdictions and the United Kingdom. In the normal course of business, Liberty is subject to examination by various taxing authorities. All tax years prior to 2015 are closed. Liberty's 2015 and 2016 tax years are being examined currently under the IRS's Compliance Assurance Process ("CAP") program. The 2015 and 2016 examinations are substantially complete and are expected to be formally closed in the first quarter of 2018. The statute of limitations periods in the applicable state jurisdictions vary, but generally expire three to four years from the due date or filing of the tax return.
Beginning with the 2016 post-Spin-Off period and for subsequent periods, CommerceHub files income tax returns in the U.S. federal jurisdiction, various state jurisdictions and the United Kingdom. CommerceHub has historically filed stand-alone income tax returns in various state jurisdictions and has expanded the list of states in the post-Spin-Off period. In the normal course of business, CommerceHub is subject to examination by various taxing authorities. CommerceHub's 2016 post-Spin-Off tax return is currently "open" and is not eligible to participate in the CAP program. The statute of limitations periods in the various state jurisdictions in which CommerceHub historically filed stand-alone income tax returns vary, but generally expire three to four years from the due date or filing of the tax return.
65
Income tax expense (benefit) consists of the following at December 31 (in thousands):
2017 | 2016 | 2015 | |||||||||
Current | |||||||||||
Federal | $ | 10,884 | $ | (11,497 | ) | $ | 7,931 | ||||
State and local | 1,411 | (2,674 | ) | 2,477 | |||||||
Foreign | 10 | 7 | — | ||||||||
Total current | 12,305 | (14,164 | ) | 10,408 | |||||||
Deferred | |||||||||||
Federal | 2,815 | 15,869 | (9,942 | ) | |||||||
State and local | 756 | 5,457 | (2,347 | ) | |||||||
Total deferred | 3,571 | 21,326 | (12,289 | ) | |||||||
Total tax expense (benefit) | $ | 15,876 | $ | 7,162 | $ | (1,881 | ) | ||||
There were no uncertain tax positions as of December 31, 2017 or December 31, 2016. There were no accrued interest or penalties recognized in the consolidated balance sheet as of December 31, 2017 and December 31, 2016.
Income tax expense differed from the amounts computed by applying the U.S. federal income tax rate of 35% to income (loss) before taxes as a result of the following for the years ended December 31 (in thousands):
2017 | 2016 | 2015 | |||||||||
Computed "expected" tax expense | $ | 9,007 | $ | 5,690 | $ | (2,222 | ) | ||||
Increase (decrease) resulting from: | |||||||||||
Impact of the Tax Act on deferred tax assets | 3,161 | — | — | ||||||||
Section 162(m) adjustment | 3,276 | — | — | ||||||||
State tax law change | — | 1,524 | — | ||||||||
State and local income taxes, net of federal income tax benefit | 852 | 284 | (21 | ) | |||||||
Impact of state rate change on deferred taxes | 293 | — | 105 | ||||||||
Non-deductible expenses | 21 | 66 | 228 | ||||||||
Excess share-based compensation deduction | (157 | ) | — | — | |||||||
Market adjustment for options exercised | — | 127 | 319 | ||||||||
Write-off federal NOL | — | 122 | — | ||||||||
Research and development tax credits | (559 | ) | (649 | ) | (368 | ) | |||||
Other | (18 | ) | (2 | ) | 78 | ||||||
Total tax expense (benefit) | $ | 15,876 | $ | 7,162 | $ | (1,881 | ) | ||||
The increase in income tax expense was due to increased pre-tax book income of $25.7 million in the year ended December 31, 2017 as compared to pre-tax book income of $16.3 million in 2016. In addition, the U.S. Tax Cuts and Jobs Act ("Tax Act") was enacted on December 22, 2017 and introduces significant changes to U.S. income tax law. Effective in 2018, the Tax Act reduces the U.S. statutory tax rate from 35% to 21%, among other changes. Accordingly, we have adjusted our deferred income taxes as of December 22, 2017 to reflect the reduced rate that will apply in future periods when these deferred taxes are settled or realized, which resulted in a deferred tax expense of $3.2 million.
In addition, actual income tax expense for the year ended December 31, 2017 was greater than the federal income tax rate of 35% due to an immaterial error correction recorded in 2017 associated with limitations on deductions under Section 162(m) of the Internal Revenue Code (the “IRC”) with respect to certain share-based compensation awards granted prior to the Spin-Off, which limit the Company’s future deductions on these share-based compensation awards in our stand-alone provision beginning at the Spin-Off. The Company did not appropriately reflect these Section 162(m) limitations on our deferred tax asset at the time of the Spin-Off in 2016. As a result, fiscal 2016 deferred income tax expense was understated by approximately $3.3 million, with a corresponding overstatement of deferred tax assets. The $3.3 million effect of this error was corrected in the fourth quarter of 2017 and is incorporated in our 2017 tax expense and included in the “Section 162(m) adjustment” in the table above.
66
Furthermore, the increase in income tax expense in 2016 as compared to the benefit in 2015 is primarily due to pre-tax book income of $16.3 million in 2016 as compared to a pre-tax book loss of $6.3 million in 2015. In 2016, actual income tax expense was greater than the amounts computed by applying the U.S. federal income tax rate of 35%, primarily due to an immaterial error correction recorded in 2016 associated with a change in tax law in New York State (“NY”). This tax law change, which was enacted in 2014 and effective in 2015, revised the method used to determine NY apportionment. We did not appropriately update the NY apportionment rate to reflect the impact of this law change in 2014. The $1.5 million net effect of this error was corrected in the fourth quarter of 2016 and is incorporated in our 2016 income tax expense, and included in “State tax law change” in the table above.
Based on our assessment of the quantitative and qualitative factors, these errors and related impacts, both individually and in the aggregate, were not considered material to the consolidated financial statements for any periods in which these errors originated, and correction of these errors was not considered material to our 2016 or 2017 consolidated financial statements.
The write-off of federal net operating loss carryforwards ("NOLs") is the result of forfeiting one year of IRC Section 382 limitations described below and NOLs in conjunction with the Spin-Off, as both the pre- and post-Spin-Off periods in 2016 count against the available number of periods, while the amount of NOLs we are limited to in 2016 does not change.
The tax effects of temporary differences that give rise to significant portions of the deferred tax assets and deferred tax liabilities are presented below (in thousands) at December 31:
2017 | 2016 | ||||||
Deferred tax assets: | |||||||
Accounts receivable allowances | $ | 268 | $ | 75 | |||
Deferred revenue | 1,695 | 2,721 | |||||
Accrued liabilities | 965 | 426 | |||||
Shared-based compensation | 3,106 | 5,948 | |||||
Net operating loss | 1,852 | 3,999 | |||||
Other | 59 | 1 | |||||
Total deferred tax assets | 7,945 | 13,170 | |||||
Deferred tax liabilities: | |||||||
Software and deferred costs | 1,909 | 4,372 | |||||
Property and equipment | 238 | 1,084 | |||||
Total gross deferred tax liabilities | 2,147 | 5,456 | |||||
Net deferred tax asset | $ | 5,798 | $ | 7,714 | |||
In assessing the realizability of deferred tax assets, management considers whether it is more-likely-than-not that some portion or all of the deferred tax assets will not be realized. The ultimate realization of deferred tax assets is dependent upon the generation of future taxable income during the periods in which those temporary differences become deductible. Management considered the scheduled reversal of deferred tax liabilities and projected future taxable income in making this assessment. Based upon the level of projections for future taxable income over the periods in which the deferred tax assets are deductible, management believes it is more-likely-than-not that the Company will realize the benefits of these deductible differences.
During the year ended December 31, 2016, the exercise of a significant portion of share-based compensation awards created a tax deductible expense, and reduced our deferred tax asset related to share-based compensation awards by $31.3 million. The deductions generated estimated gross federal NOLs of approximately $74.7 million. As allowed under the tax sharing agreement between the Company and Liberty entered into prior to the Spin-Off, $49.1 million of these NOLs were utilized to refund federal income taxes paid to Liberty in the prior two tax years. In accordance with the same tax sharing agreement, subject to finalizing our 2016 pre-Spin-Off federal tax return, the estimated remaining federal NOLs of $25.6 million were forfeited and recorded as an equity distribution to Liberty upon the Spin-Off in 2016. During the year ended December 31, 2017, upon finalizing our consolidated federal returns for the pre-spin period, we adjusted the amount of remaining gross federal NOLs we ultimately forfeited to Liberty. The adjustment totaled $5.1 million, which was recorded as an equity distribution to Liberty in 2017 and is included in the change in additional paid-in capital on our consolidated balances sheets for 2017.
As of December 31, 2017, we had unused federal NOLs that were acquired as part of the Mercent acquisition. Under IRC Section 382, if it is determined that, due to transactions involving CommerceHub's shares owned by its 5 percent or greater
67
shareholders, a change of ownership has occurred under the provisions of IRC Section 382, our federal NOLs could be subject to IRC Section 382 limitations.
Based on studies of the changes in ownership of Mercent at acquisition, we have determined that IRC Section 382 ownership changes did occur, which limit the amount of NOLs that can be used in future years. As of December 31, 2017, we had a total of $7.9 million in unused NOLs, of which approximately $1.5 million of NOLs are available to be utilized each year from 2018 to 2019, and approximately $350 thousand of NOLs are available to be utilized each year from 2020 to 2033.
Note 14 - Long-Term Debt
On June 28, 2016, we entered into a credit agreement governing a $125.0 million revolving credit facility, which expires on June 28, 2021. At December 31, 2017, we had no borrowings and no letters of credit outstanding under the facility, and our available borrowings under the facility were $125.0 million. The fair value of the debt under our credit facility, which holds a floating interest rate of a short duration and is based on Level 2 valuation inputs, approximates the carrying value when a balance is outstanding.
Interest on the revolving credit facility is based on a base rate or Eurodollar rate plus an applicable margin that increases as our total leverage ratio increases, with the base rate margin ranging from 0.75% to 1.25% and the Eurodollar rate margin ranging from 1.75% to 2.25%. The revolving credit facility also carries a commitment fee on the unused portion that increases as our total leverage ratio increases, ranging from 0.25% to 0.50% per annum. In conjunction with entering into this credit facility, we incurred charges totaling $1.1 million. These charges are included in other long-term assets on the consolidated balance sheets and are recognized over the term of the credit facility.
Borrowings under the credit facility are collateralized by substantially all of our assets. The credit agreement contains covenants and restrictions which, among other things, require the maintenance of certain financial ratios, including a total leverage ratio and an interest coverage ratio, and restrict dividend payments and the incurrence of certain indebtedness and other activities, including acquisitions and dispositions. We were in compliance with these covenants and restrictions as of December 31, 2017.
Note 15 - Commitments and Contingencies
Legal Proceedings
From time to time, we may become involved in various lawsuits and legal proceedings which arise in the ordinary course of business. We are currently not aware of any such legal proceedings or claims that we believe will have, individually or in the aggregate, a material adverse effect on our business, prospects, financial condition, results of operations and/or cash flows.
Leases
The Company leases its corporate offices and primary operations facility under an operating lease arrangement which expires in March 2022, with renewal provisions that allow the Company to extend the lease through March 2028. We also lease office facilities in Seattle, Washington and shared office and executive office facilities in Hertford, England. During the first quarter of 2017, we entered into a new lease for office space in Seattle, Washington and, at the same time, entered into a sub-lease of our existing space in Seattle. During the second quarter of 2017, we vacated our previous office and moved into the new office space and, as a result, recognized an impairment charge equal to the fair value of the unrecovered payments for the remainder of the lease, which was not material.
Total rent expense for the Company's office space for the years ended December 31, 2017, 2016 and 2015 was $2.0 million, $1.9 million and $1.4 million, respectively.
Future minimum lease payments due under operating lease arrangements contain rent increases over the term of the lease. Rent expense on these operating leases is recognized over the term of the lease on a straight-line basis. The excess of rent expense over future minimum lease payments due totaled $2.5 million and $1.1 million at December 31, 2017 and 2016, respectively, and is included in other long-term liabilities on the consolidated balance sheets.
68
At December 31, 2017, contractual minimum payments under operating leases were as follows (in thousands):
Year Ending December 31, | |||
2018 | $ | 2,652 | |
2019 | 2,201 | ||
2020 | 2,183 | ||
2021 | 2,139 | ||
2022 | 362 | ||
Total minimum lease payments (1) | $ | 9,537 | |
(1) Total minimum payments under our operating leases exclude $2.4 million in rental income from sub-tenants, consisting of $0.6 million due in each of the respective years ending December 31, 2018 through 2021.
Note 16 - Restructuring
In September 2017, we commenced a plan to consolidate our software development team and certain other corporate activities into our Albany, NY headquarters to more effectively support the ongoing growth of our business by streamlining and centralizing operations (the "2017 restructuring plan"). The 2017 restructuring plan included the immediate reduction of certain positions in our Seattle, WA office, the retention of certain Seattle-based engineers for a transition period, the gradual replacement of many of those positions in Albany, and the long-term presence of a Seattle-based account services team dedicated to brands and marketplace customers.
In connection with the 2017 restructuring plan, we recognized charges for termination benefits during the year ended December 31, 2017. The 2017 restructuring plan also includes retention benefits for employees who stay with the Company, which will be earned and paid out based on time-based milestones, with the last payments expected to occur in January 2019. As a result, the expenses related to these retention incentives will be recorded ratably over each employee’s applicable retention period.
As of December 31, 2017, we estimate that the total expenses associated with the 2017 restructuring plan will be approximately $6.0 million, of which $2.3 million was recognized in 2017, with the remaining expenses primarily being recognized throughout 2018. This estimate includes future expenses expected to be incurred from termination and retention benefits accrued over the retention period as well as payroll and related costs for redundant positions as we transition our software development team and certain other corporate activities into our Albany, NY headquarters, but which does not take into account actual and expected cost savings from reduced headcount associated with the 2017 restructuring plan.
During the year ended December 31, 2017, we incurred $2.3 million in restructuring charges within the consolidated statements of comprehensive income (loss) as follows (amounts in thousands):
Cost of Revenue | Research and Development | Sales and Marketing | General and Administrative | Total Restructuring Expenses | |||||||||||||||
Termination & retention benefits | $ | 295 | $ | 1,345 | $ | 384 | $ | 64 | $ | 2,088 | |||||||||
Impairment of capitalized software | 191 | — | — | — | 191 | ||||||||||||||
Total restructuring expenses | $ | 486 | $ | 1,345 | $ | 384 | $ | 64 | $ | 2,279 | |||||||||
The table below sets forth our restructuring liability during the year ended December 31, 2017 (in thousands):
Total Restructuring Liability | |||
Balance at January 1, 2017 | $ | — | |
Restructuring charges | 2,088 | ||
Non-cash adjustments | — | ||
Cash payouts | (812 | ) | |
Balance at December 31, 2017 | $ | 1,276 | |
69
Our total restructuring liability of $1.3 million consists of accruals for termination and retention benefits. We expect $0.5 million of these benefits will be paid within the next 12 months, and this portion is included in accounts payable and accrued expenses within the consolidated balance sheets. The remaining $0.8 million of these benefits, which we expect to fully pay by the first quarter of 2019, is included in other long-term liabilities within the consolidated balance sheets.
Note 17 - Selected Quarterly Information (unaudited)
Three Months Ended, | |||||||||||||||
March 31, 2017 | June 30, 2017 | September 30, 2017 | December 31, 2017 | ||||||||||||
(in thousands, except per share amounts) | |||||||||||||||
Revenue | $ | 24,568 | $ | 25,208 | $ | 24,614 | $ | 36,731 | |||||||
Gross profit | 19,052 | 19,569 | 19,586 | 31,314 | |||||||||||
Income from operations | 4,267 | 3,841 | 3,318 | 15,040 | |||||||||||
Net income | $ | 2,459 | $ | 2,245 | $ | 1,988 | $ | 3,166 | |||||||
Earnings per share: | |||||||||||||||
Basic | $ | 0.06 | $ | 0.05 | $ | 0.05 | $ | 0.07 | |||||||
Diluted | $ | 0.06 | $ | 0.05 | $ | 0.04 | $ | 0.07 | |||||||
Three Months Ended, | |||||||||||||||
March 31, 2016 | June 30, 2016 | September 30, 2016 | December 31, 2016 | ||||||||||||
(in thousands, except per share amounts) | |||||||||||||||
Revenue | $ | 22,090 | $ | 23,103 | $ | 22,478 | $ | 32,881 | |||||||
Gross profit | 15,985 | 17,783 | 16,741 | 26,986 | |||||||||||
Income (loss) from operations | (3,026 | ) | 7,280 | 633 | 11,805 | ||||||||||
Net income (loss) | $ | (1,990 | ) | $ | 4,424 | $ | 710 | $ | 5,952 | ||||||
Earnings (loss) per share:* | |||||||||||||||
Basic | $ | (0.04 | ) | $ | 0.10 | $ | 0.02 | $ | 0.14 | ||||||
Diluted | $ | (0.04 | ) | $ | 0.10 | $ | 0.02 | $ | 0.13 | ||||||
* Share count for pre-Spin-Off periods represent the shares issued at Spin-Off on July 22, 2016.
Item 9. Changes in and Disagreements with Accountants on Accounting and Financial Disclosure
None.
Item 9A. Controls and Procedures
Evaluation of Disclosure Controls and Procedures
Our management, with the participation of our Chief Executive Officer and Chief Financial Officer, evaluated the effectiveness of our disclosure controls and procedures pursuant to Rule 13a-15 and 15d-15 under the Exchange Act, as of the end of the period covered by this Annual Report on Form 10-K.
Based on this evaluation, our Chief Executive Officer and Chief Financial Officer concluded that, as of December 31, 2017, our disclosure controls and procedures are designed at a reasonable assurance level and are effective to provide reasonable assurance that information we are required to disclose in reports that we file or submit under the Exchange Act is recorded, processed, summarized and reported within the time periods specified in the SEC’s rules and forms, and that such information is accumulated and communicated to our management, including our Chief Executive Officer and Chief Financial Officer, as appropriate, to allow timely decisions regarding required disclosure.
70
Management's Report on Internal Control Over Financial Reporting
Our management is responsible for establishing and maintaining adequate internal control over financial reporting, as defined in Rule 13a-15(f) of the Exchange Act. Our management conducted an evaluation of the effectiveness of our internal control over financial reporting based on the framework set forth in "Internal Control—Integrated Framework" issued by the Committee of Sponsoring Organizations of the Treadway Commission (2013 framework).
Based on this evaluation, management concluded that our internal control over financial reporting was effective as of December 31, 2017. Management reviewed the results of its assessment with our Audit Committee.
The effectiveness of our internal control over financial reporting as of December 31, 2017 has been audited by KPMG LLP, an independent registered public accounting firm, as stated in its report, which is included in Item 8 of this Annual Report on Form 10-K.
Limitations on Effectiveness of Controls and Procedures and Internal Control over Financial Reporting
In designing and evaluating the disclosure controls and procedures, management recognizes that any controls and procedures and internal control over financial reporting, no matter how well designed and operated, can provide only reasonable assurance of achieving the desired control objectives and preventing and detecting misstatements.
Remediation of Prior Material Weakness in Internal Control over Financial Reporting
We identified a material weakness in our internal control over financial reporting that existed as of December 31, 2015 and 2016, relating to the processes and controls to properly identify and account for transactions of a complex and non-routine nature. We hired a new Chief Accounting Officer and a new Chief Financial Officer in May and June 2016, respectively. Together, these officers developed and executed a plan to remediate the material weakness, which included hiring additional personnel with SEC reporting and technical accounting experience and creating tax and internal audit functions. In addition to these organizational changes, we implemented new policies and processes, including formalizing our delegation of authority, defining processes to document the accounting for non-routine or complex transactions, enhancing account reconciliation controls, and expanding the use of our financial systems used for accounting and financial reporting. We also have completed our process to review, document and test our internal control over financial reporting.
Based upon the successful execution of the remediation plan above and the testing and evaluation of the effectiveness of our internal control over financial reporting, we have concluded that the material weakness referred to above no longer existed as of December 31, 2017.
Changes in Internal Control over Financial Reporting
In December 2017, our former Chief Financial Officer resigned from the Company, at which time our Chief Commercial Officer and former Chief Accounting Officer was appointed as Chief Financial Officer, also assuming the role of principal financial and accounting officer, while continuing to serve as our Chief Commercial Officer.
Other than the changes noted above, no changes occurred in our internal control over financial reporting (as defined in Rule 13a-15(f) and 15d-15(f) under the Exchange Act) during the quarter ended December 31, 2017 that materially affected, or are reasonably likely to materially affect, our internal control over financial reporting.
Item 9B. Other Information
None.
71
PART III.
Item 10. Directors, Executive Officers and Corporate Governance
The information required by this item is incorporated herein by reference to the 2018 Proxy Statement to be filed with the SEC within 120 days of the fiscal year ended December 31, 2017.
Item 11. Executive Compensation
The information required by this item is incorporated herein by reference to the 2018 Proxy Statement to be filed with the SEC within 120 days of the fiscal year ended December 31, 2017.
Item 12. Security Ownership of Certain Beneficial Owners and Management and Related Stockholder Matters
The information required by this item is incorporated herein by reference to the 2018 Proxy Statement to be filed with the SEC within 120 days of the fiscal year ended December 31, 2017.
Item 13. Certain Relationships and Related Transactions, and Director Independence
The information required by this item is incorporated herein by reference to the 2018 Proxy Statement to be filed with the SEC within 120 days of the fiscal year ended December 31, 2017.
Item 14. Principal Accounting Fees and Services
The information required by this item is incorporated herein by reference to the 2018 Proxy Statement to be filed with the SEC within 120 days of the fiscal year ended December 31, 2017.
72
PART IV.
Item 15. Exhibits, Financial Statement Schedules
(a) We have filed the following documents as part of this Annual Report on Form 10-K:
(1) Financial Statements:
See the Index to Consolidated Financial Statements under Item 8 "Financial Statements and Supplementary Financial Data" of this Annual Report on Form 10-K.
(2) Financial Statement Schedules:
All schedules are omitted as information required is inapplicable or the information is presented in the consolidated financial statements and the related notes under Item 8 "Financial Statements and Supplementary Financial Data" of this Annual Report on Form 10-K.
(3) Exhibits:
Listed below are the exhibits filed as part of this Annual Report on Form 10-K (according to the number assigned to them in Item 601 of Regulation S-K):
Exhibit Number | Exhibit Description |
2.1 | |
3.1 | |
3.2 | |
4.1 | |
4.2 | |
4.3 | |
4.4 | |
4.5 | |
10.1 | |
10.2 | |
10.3 | |
10.4 | |
10.5 | |
10.6 | |
73
10.7 | |
10.8 | |
10.9 | |
10.10 | |
10.11 | |
10.12 | |
10.13 | |
10.14 | |
10.15 | |
10.16 | |
10.17 | |
10.18 | |
10.19 | |
10.20 | |
21.1 | |
23.1 | |
24.1 | |
31.1 | |
31.2 | |
32.1 | |
32.2 | |
101.INS | XBRL Instance Document* |
101.SCH | XBRL Taxonomy Extension Schema Document* |
101.CAL | XBRL Taxonomy Calculation Linkbase Document* |
101.LAB | XBRL Taxonomy Label Linkbase Document* |
101.PRE | XBRL Taxonomy Presentation Linkbase Document* |
101.DEF | XBRL Taxonomy Definition Document* |
______________
* Filed herewith.
** Furnished herewith.
Item 16. Form 10-K Summary
None.
74
SIGNATURES
Pursuant to the requirements of Section 13 or 15(d) of the Securities Exchange Act of 1934, the Registrant has duly caused this report to be signed on its behalf by the undersigned, thereunto duly authorized, on March 1, 2018.
COMMERCEHUB, INC. | |
By: | /s/ FRANCIS POORE |
Name: | Francis Poore |
Title: | President and Chief Executive Officer |
POWER OF ATTORNEY
KNOW ALL PERSONS BY THESE PRESENTS, that each person whose signature appears below constitutes and appoints Francis Poore, Michael Trimarchi and Douglas Wolfson, jointly and severally, his or her attorneys-in-fact, each with the power of substitution, for him or her in any and all capacities, to sign any amendments to this Annual Report on Form 10-K and to file the same, with exhibits thereto and other documents in connection therewith, with the Securities and Exchange Commission, hereby ratifying and confirming all that each of said attorneys-in-fact, or his substitute or substitutes, may do or cause to be done by virtue hereof.
Pursuant to the requirements of the Securities Exchange Act of 1934, this report has been signed below by the following persons on behalf of the Registrant and in the capacities and on the dates indicated:
Signature | Title | Date | ||
/s/ FRANCIS POORE | President, Chief Executive Officer and Director (Principal Executive Officer) | March 1, 2018 | ||
Francis Poore | ||||
/s/ MICHAEL TRIMARCHI | Chief Financial Officer, Chief Commercial Officer and Treasurer (Principal Financial and Accounting Officer) | March 1, 2018 | ||
Michael Trimarchi | ||||
/s/ RICHARD N. BAER | Chairman of the Board and Director | March 1, 2018 | ||
Richard N. Baer | ||||
/s/ MARK CATTINI | Director | March 1, 2018 | ||
Mark Cattini | ||||
/s/ DAVID GOLDHILL | Director | March 1, 2018 | ||
David Goldhill | ||||
/s/ CHAD HOLLINGSWORTH | Director | March 1, 2018 | ||
Chad Hollingsworth | ||||
/s/ MICHAEL P. HUSEBY | Director | March 1, 2018 | ||
Michael P. Huseby | ||||
/s/ BETSY L. MORGAN | Director | March 1, 2018 | ||
Betsy L. Morgan | ||||
/s/ LUIS UBINAS | Director | March 1, 2018 | ||
Luis Ubinas | ||||
/s/ BRIAN WENDLING | Director | March 1, 2018 | ||
Brian Wendling | ||||
75