Attached files
| file | filename |
|---|---|
| 8-K - FORM 8-K - Alexander & Baldwin, Inc. | tv487551_8k.htm |
Exhibit 99.1

1 ALEXANDER & BALDWIN Fourth Quarter& Full - year 2017 Earnings Call February 28, 2018
2 SAFE HARBOR STATEMENT S tatements in this call and presentation that are not historical facts are forward - looking statements within the meaning of the Private Securities Litigation Reform Act of 1995 that involve a number of risks and uncertainties that could cause actual results to differ materially from those contemplated by the relevant forward - looking statements . These forward - looking statements include, but are not limited to, statements regarding possible or assumed future results of operations, business strategies, growth opportunities and competitive positions . Such forward - looking statements speak only as of the date the statements were made and are not guarantees of future performance . Forward - looking statements are subject to a number of risks, uncertainties, assumptions and other factors that could cause actual results and the timing of certain events to differ materially from those expressed in or implied by the forward - looking statements . These factors include, but are not limited to, prevailing market conditions and other factors related to the Company's REIT status and the Company business generally discussed in the Company's most recent Form 10 - K, Form 10 - Q and other filings with the Securities and Exchange Commission . The information in this call and presentation should be evaluated in light of these important risk factors . We do not undertake any obligation to update the Company's forward - looking statements .

3 STRATEGY & PERFORMANCE

4

5 CRE STRATEGIC PROGRESS • REIT conversion completed • Advanced significant initiatives to grow commercial portfolio in 2017 – Achieved re - leasing spreads of 13.9% – Same - store cash NOI up 4.8%, above 3 - 4% guidance – Development of in - house leasing and property management ▪ Better tenant relations ▪ Ability to manage across the portfolio ▪ Strengthen ability to place tenants in multiple locations ▪ Positions A&B as lessor of choice for new - to - Hawaii retailers – Advanced repositioning, renovation and ground - up projects – Acquired industrial warehouse on the Big Island • Acquired Terramar Hawaii assets for $254.1M Note: See appendix for a statement on management’s use of non - GAAP financial measures and reconciliations.

6 Located: Lihue, Kauai Type: Grocery - anchored Built: 2015 Leased: 97% HOKULEI VILLAGE Located: Ewa Beach, Oahu Type: Grocery - anchored Built: 2012 Leased: 95 % LAULANI VILLAGE Located: Kahului, Maui Type: Target shadow - anchored Built: 2018 Leased: 60% PU’UNENE SHOPPING CENTER 6

7 REINVESTING IN HAWAII Pearl Highlands Center 2013 Kaka`ako Commerce Center 2016 2013 2014 2018 Kailua Town Manoa Marketplace Terramar Hawaii Retail Mainland Assets Sold • Broadlands Marketplace • Meadows on the Parkway • Rancho Temecula Town Center • Activity Distribution Center • Heritage Business Park • Savannah Logistics Park • Prospect Park • Gateway Oaks • Ninigret Office Park • Midstate 99 Distribution Center • Concord Commerce Center • Deer Valley Financial Center • Preston Park • Little Cottonwood Center • Royal MacArthur Center • Sparks Business Center • Republic Distribution Center • Centennial Plaza • Issaquah Office Center • San Pedro Plaza • Wilshire Center

8 FOCUSED ON CRE GROWTH 2012 2017 Pro Forma Post Terramar Exchanges $ 61.8M CASH NET OPERATING INCOME 57% 43% 13% 87% Hawaii Mainland $ 84.8M 37% 100% 57% 43% Note: See appendix for a statement on management’s use of non - GAAP financial measures and reconciliations.

9 ACTIVE FOR - HOLD PROJECTS Project Phase Target Stabilization Capital Incremental Stabilized NOI Stabilized Yield on Cost Sq. ft. Pearl Highlands Center – Food court/ Regal renovation* Stabilization 1Q18 $6.0M $0.6M 10.0 - 10.3% 54,000 Lau Hala Shops (Kailua Macy’s) repositioning Construction 1Q19 $21.0M $2.2 - 2.7M 10.5 - 12.9% 50,500 Ho`okele Shopping Center development for hold Pre - leasing 2Q20 $41.9M** $3.1 - 3.6M 7.4 - 8.6% 94,000 Total $68.9M $5.9 - 6.9M 8.6 - 10.0% 198,500 As of December 31, 2017 * Includes $3M of tenant improvement capital to Regal Entertainment for their renovations that provide a 10.3% stabilized yield on cost ** Includes land at book value Note: Complete table, including leasing activity, is included the quarterly Supplemental Information report. Lau Hala Shops Repositioning Lau Hala Shops Rendering 9

10 CRE PERFORMANCE METRICS The Shops at Kukui’ula Performance Metric 4Q17 2017 Same - store cash NOI growth 5.5% 4.8% Leasing spreads 6.9% 13.9% % Occupancy As of Dec. 31, 2017 ABR/sf Hawaii Mainland Total Hawaii Retail 93.1 96.9 93.4 $27.85 Industrial 95.1 100.0 96.5 $13.52 Office 89.1 88.0 88.3 $28.86 Total 93.5 94.1 93.6 $23.27 Note: See appendix for a statement on management’s use of non - GAAP financial measures and reconciliations. 10
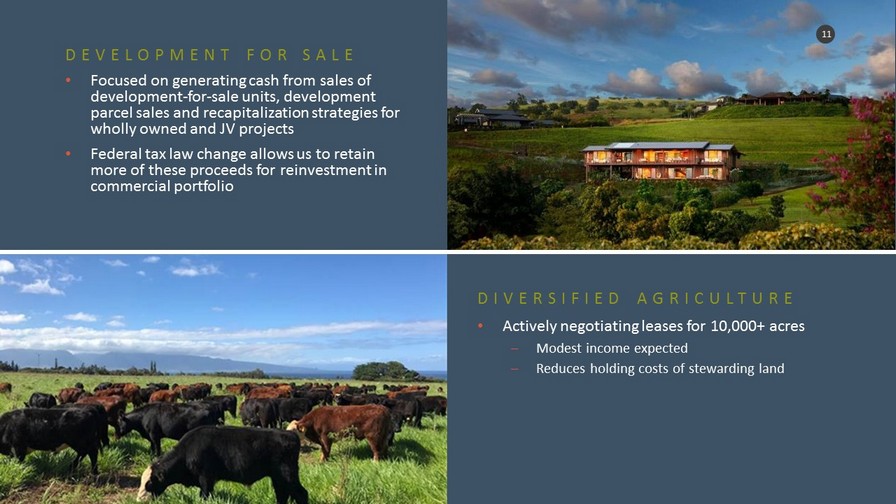
11 DEVELOPMENT FOR SALE • Focused on generating cash from sales of development - for - sale units, development parcel sales and recapitalization strategies for wholly owned and JV projects • Federal tax law change allows us to retain more of these proceeds for reinvestment in commercial portfolio DIVERSIFIED AGRICULTURE • Actively negotiating leases for 10,000+ acres – Modest income expected – Reduces holding costs of stewarding land 11

12 MATERIALS & CONSTRUCTION • Enhancing sales efforts to increase volume of 3rd party aggregate sales • Optimizing labor management to reduce variable costs of paving operations • Implementing new information systems to improve cost management and contract bidding • Positioning for anticipated increases in state and federal contracts later in 2018 12

13 FINANCIAL UPDATE

14 4Q17 Per Basic Share Amounts available to A&B shareholders from continuing operations, net of income taxes $212.2 $4.31 Major 4Q17 drivers Income tax benefit related to deferred income taxes $220.0 $4.47 Mainland CRE dispositions for TRC asset acquisition: Gain on sale of MidState 99 $6.3 $0.13 Impairments of mainland assets to be sold (22.4) (0.46) Net charges related to mainland CRE dispositions $(16.1) $(0.33) REIT evaluation/conversion costs $(3.8) $(0.08) DOLLARS IN MILLIONS, EXCEPT PER SHARE AMOUNTS 4Q17 FINANCIAL RESULTS & MAJOR DRIVERS

15 Cash distribution $156.6 Stock distribution 626.4 $783.0 Date declared November 16, 2017 Date paid January 23, 2018 • Balance Sheet treated as all cash • Income Statement treated as all stock DOLLARS IN MILLIONS SPECIAL DISTRIBUTION

16 BALANCE SHEET ACCOUNTING SPECIAL DISTRIBUTION DOLLARS IN MILLIONS Balance Sheet Line Item Dec. 31, 2017 Pro Forma Impact of Special Distribution Pro Forma Dec. 31, 2017 Cash and cash equivalents 68.9 (68.9) (A) - Total assets 2,231.2 (68.9) (A) 2,162.3 Accrued dividends 783.0 (783.0) (A)(B) - Long - term debt 585.2 87.7 (A) 672.9 Total liabilities 1,572.1 (695.3) (A)(B) 876.8 Redeemable noncontrolling interest 8.0 - 8.0 Total A&B shareholders’ equity 651.1 626.4 (B) 1,277.5 Total liabilities and equity 2,231.2 (68.9) (B) 2,162.3 (A) Pro Forma adjustment related to the cash portion of the Special Distribution of $165.6 million . The pro forma condensed consolidated balance sheet assumes that the cash portion of the Special Distribution was funded through the a combination of (1) $68.9 million of cash and cash equivalents on ha nd as of December 31, 2017 and (2) incremental debt borrowings of $87.7 million . (B) Pro Forma adjustment related to the stock portion of the Special Distribution of $626.4 million. Upon settlement of the Special Distribution, the Company issued common stock with an aggregate value of $626.4 million to its shareholders.

17 SPECIAL DISTRIBUTION SHARE DETERMINATION 4Q2017 4Q2016 2017 2016 Basic 49.2 49.0 49.2 49.0 Diluted 62.0 49.4 53.0 49.4 Actual shares outstanding as of February 27, 2018 72.0 IN MILLIONS

18 2017 SEGMENT FINANCIAL HIGHLIGHTS • 4.8% increase in same - store cash NOI • 2017 major Land O perations sales: – Kahala lot - $13.6M – 36 Kamalani unit sales - $ 13.0M – 713 acres on Maui and Kauai - $20.1M – Maui Business Park six lots totaling 3.1 acres - $ 6.0M • 4,500 acres redeployed in diversified agriculture • M&C asphalt deliveries 24 % higher at lower margins Note: See appendix for a statement on management’s use of non - GAAP financial measures and reconciliations. 18
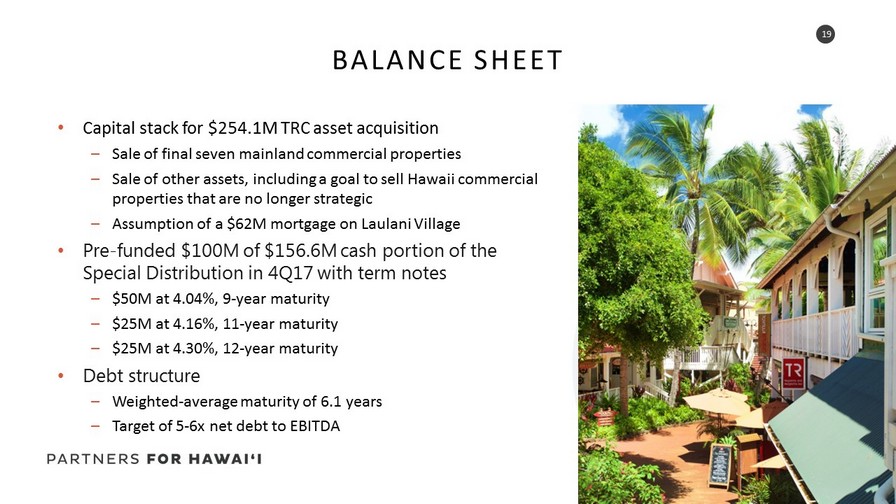
19 • Capital stack for $ 254.1M TRC asset acquisition – Sale of final seven mainland commercial properties – Sale of other assets, including a goal to sell Hawaii commercial properties that are no longer strategic – Assumption of a $62M mortgage on Laulani Village • Pre - funded $100M of $156.6M cash portion of the Special Distribution in 4Q17 with term notes – $50M at 4.04%, 9 - year maturity – $25M at 4.16%, 11 - year maturity – $25M at 4.30%, 12 - year maturity • Debt structure – Weighted - average maturity of 6.1 years – Target of 5 - 6x net debt to EBITDA BALANCE SHEET

20 2018 GUIDANCE DOLLARS IN MILLIONS, EXCEPT AS INDICATED Metric Guidance CRE Leasing spreads 6.5 - 7.5% Same - store NOI growth 3 - 4% Maintenance cap ex $9 Growth cap ex $35 Total company G&A ~ $60 Net debt to EBITDA at 12 - 31 - 18 Mid - 5x Note: See appendix for a statement on management’s use of non - GAAP financial measures and reconciliations.

21 OTHER FINANCIAL MATTERS • 10 - K to be filed 3/1/18 • 8 - K/A with pro forma financials for Terramar to be filed 3/2/18 • S - 3 to be filed 3/5/18 21

22 CLOSING REMARKS

23 +1.1% December 2017 Seasonally Adjusted Non - ag Jobs +4.5% 2017 General Excise Tax Revenue 2.0% December 2017 Unemployment +7.9% 2017 Individual Income Sources: Hawaii Department of Business, Economic Development & Tourism (DBEDT), Monthly Economic Indicators December 2017 http :// hawaii.gov/dbedt ; State of Hawaii Department of Labor and Industrial Relations. Data provided for informational purposes only; no endorsement implied . CONSTRUCTIVE HAWAII ECONOMIC ENVIRONMENT

24 CLOSING REMARKS • D elivering on articulated strategy • Hawaii’s economy is strong • ALEX is differentiated by: – High - quality demographics of the Hawaii marketplace – Limited retail square footage per capita – Better insulation to internet shopping due to geography and high cost of shipping – Portfolio includes needs - based retail, light industrial and high - quality ground leases – Embedded opportunities for growth ▪ Ground lease reversions ▪ Development and redevelopment for hold ▪ Monetization of development for sale and other assets • Committed to continued value creation

25 ALEXANDER & BALDWIN Fourth Quarter& Full - year 2017 Earnings Call February 28, 2018

26 APPENDIX

27 STATEMENT ON USE OF NON - GAAP FINANCIAL MEASURES The Company presents certain non - GAAP financial measures in this presentation . The Company uses these non - GAAP measures when evaluating operating performance because management believes that they provide additional insight into the Company’s and segments' core operating results, and/or the underlying business trends affecting performance on a consistent and comparable basis from period to period . These measures generally are provided to investors as an additional means of evaluating the performance of ongoing core operations . The non - GAAP financial information presented herein should be considered supplemental to, and not as a substitute for or superior to, financial measures calculated in accordance with GAAP . The Company’s methods of calculating non - GAAP measures may differ from methods employed by other companies and thus may not be comparable to such other companies . Required reconciliations of these non - GAAP financial measures to the most directly comparable financial measure calculated and presented in accordance with GAAP are set forth in the following slides .

28 CRE CASH NET OPERATING INCOME Cash Net Operating Income (Cash NOI) is a non - GAAP measure used by the Company in evaluating the CRE segment’s operating performance as it is an indicator of the return on property investment, and provides a method of comparing performance of operations, on an unlevered basis, over time . Cash NOI is calculated as total property revenues less direct property - related operating expenses . Cash NOI excludes straight - line rent adjustments, amortization of favorable/unfavorable leases, amortization of tenant incentives, general and administrative expenses, impairment of real estate, and depreciation and amortization (including amortization of maintenance capital, tenant improvements and leasing commissions) . The Company’s methods of calculating non - GAAP measures may differ from methods employed by other companies and thus may not be comparable to such other companies . The Company reports Cash NOI on a same store basis, which includes the results of properties that were owned and operated for the entirety of the prior calendar year . The same store pool excludes properties under development or redevelopment and also excludes properties acquired or sold during the comparable reporting periods . While there is management judgment involved in classifications , new developments and redevelopments are moved into the same store pool upon one full calendar year of stabilized operation, which is typically upon attainment of market occupancy . The Company provides guidance on the projected growth in same - store Cash NOI for 2018 . While it is not practicable to provide a reconciliation of the Commercial Real Estate operating profit to same - store Cash NOI for 2018 , the Company believes that the differences between the Commercial Real Estate operating profit and same - store Cash NOI for 2018 would be similar to the items included in the 2017 reconciliation .

29 CRE CASH NET OPERATING INCOME RECONCILIATION OF GAAP TO NON - GAAP MEASURES ( DOLLARS IN MILLIONS ) Quarter Ended Dec. 31, Quarter Ended Dec. 31, Change* 2017 2016 CRE Operating Profit $(6.9) $13.5 Plus: Depreciation and amortization 6.3 6.7 Less: Straight - line lease adjustments (0.3) (0.5) Less: Lease incentive amortization - - Less: Favorable/(unfavorable) lease amortization (0.7) (0.7) Less: Termination income (1.7) - Less: Other (income)/expense, net 0.1 (0.1) Plus: Impairment of real estate assets 22.4 - Plus: Selling, general, administrative and other expenses 1.8 1.0 CRE Cash NOI $21.0 $19.9 5.5% Acquisition/dispositions and other adjustments (2.2) (2.0) CRE Same - Store Cash NOI $18.8 $17.9 5.5% • Change calculated on non - rounded amounts. Note: Additional information is included in the Company’s quarterly Supplemental Information report, which is furnished to th e S EC and available at www.alexanderbaldwin.com.

30 CRE CASH NET OPERATING INCOME RECONCILIATION OF GAAP TO NON - GAAP MEASURES (DOLLARS IN MILLIONS) Year Ended Dec. 31, Year Ended Dec. 31, Change* 2017 2016 CRE Operating Profit $34.4 $54.8 Plus: Depreciation and amortization 26.0 28.4 Less: Straight - line lease adjustments (1.6) (2.1) Less: Lease incentive amortization - 0.1 Less: Favorable/(unfavorable) lease amortization (2.9) (3.3) Less: Termination income (1.7) 0.1 Less: Other (income)/expense, net 0.3 0.4 Plus: Impairment of real estate assets 22.4 - Plus: Selling, general, administrative and other expenses 7.9 4.8 CRE Cash NOI $84.8 $83.0 2.2% Acquisition/dispositions and other adjustments (9.2) (10.8) CRE Same - Store Cash NOI $75.6 $72.2 4.8% • Change calculated on non - rounded amounts. Note: Additional information is included in the Company’s quarterly Supplemental Information report, which is furnished to th e S EC and available at www.alexanderbaldwin.com.

31 CRE CASH NET OPERATING INCOME RECONCILIATION OF GAAP TO NON - GAAP MEASURES (DOLLARS IN MILLIONS) Year Ended Dec. 31, Year Ended Dec. 31, Change* 2017 2012 CRE Operating Profit $34.4 $41.6 Plus: Depreciation and amortization 26.0 22.2 Less: Straight - line lease adjustments (1.6) (3.6) Less: Lease incentive amortization - 0.1 Less: Favorable/(unfavorable) lease amortization (2.9) (1.1) Less: Termination income (1.7) (0.2) Less: Other (income)/expense, net 0.3 (0.3) Plus: Impairment of real estate assets 22.4 - Plus: Selling, general, administrative and other expenses 7.9 3.1 CRE Cash NOI $84.8 $61.8 37.2% • Change calculated on non - rounded amounts. Note: Additional information is included in the Company’s quarterly Supplemental Information report, which is furnished to th e S EC and available at www.alexanderbaldwin.com.

32 EBITDA EBITDA is presented for the Company on a consolidated basis . EBITDA represents the Company’s consolidated net income adjusted to exclude the impact of depreciation and amortization, interest expense and income taxes . The Company provides this information to investors as an additional means of evaluating the performance of the Company’s operations and should be not be viewed as a substitute for, or superior to, financial measures calculated in accordance with GAAP . A reconciliation of consolidated net income to EBITDA follows : Dollars in Millions Year Ended Dec. 31, 2017 Net income $230.5 Depreciation and amortization 41.4 Interest expense 25.6 Income tax expense (benefit) (216.9) EBITDA $80.6 Note: Additional information is included in the Company’s quarterly Supplemental Information report, which is furnished to th e S EC and available at www.alexanderbaldwin.com.

33 Other discrete items impacting EBITDA Year Ended Dec. 31, 2017 Income attributable to noncontrolling interests $(2.2) Income from discontinued operations before interest, income taxes and depreciation and amortization (3.7) REIT evaluation/conversion costs 15.2 Reduction in solar investments, net 2.6 Impairment of real estate assets 22.4 Net gain on sales of improved property (9.3) Note: Additional information is included in the Company’s quarterly Supplemental Information report, which is furnished to th e S EC and available at www.alexanderbaldwin.com. EBITDA DOLLARS IN MILLIONS