Attached files
| file | filename |
|---|---|
| EX-31.1 - EXHIBIT 31.1 - Aegion Corp | exhibit311-12312017q4.htm |
| EX-95 - EXHIBIT 95 - Aegion Corp | exhibit95to2017form10-kq4.htm |
| EX-32.2 - EXHIBIT 32.2 - Aegion Corp | exhibit322-12312017q4.htm |
| EX-32.1 - EXHIBIT 32.1 - Aegion Corp | exhibit321-12312017q4.htm |
| EX-31.2 - EXHIBIT 31.2 - Aegion Corp | exhibit312-12312017q4.htm |
| EX-23 - EXHIBIT 23 - Aegion Corp | exhibit23to2017form10-kq4.htm |
| EX-21 - EXHIBIT 21 - Aegion Corp | exhibit21to2017form10-kq4.htm |
| EX-10.20 - EXHIBIT 10.20 - Aegion Corp | exhibit1020-12x31x2017q4.htm |
| EX-10.19 - EXHIBIT 10.19 - Aegion Corp | exhibit1019-12312017q4.htm |
| EX-10.17 - EXHIBIT 10.17 - Aegion Corp | exhibit1017-12x31x2017q4.htm |
| EX-10.10 - EXHIBIT 10.10 - Aegion Corp | exhibit1010-12x31x2017q4.htm |
UNITED STATES SECURITIES AND EXCHANGE COMMISSION
WASHINGTON, D.C. 20549
FORM 10-K
x | ANNUAL REPORT PURSUANT TO SECTION 13 OR 15(d) OF THE SECURITIES EXCHANGE ACT OF 1934 |
For the fiscal year ended December 31, 2017 | |
or | |
¨ | TRANSITION REPORT PURSUANT TO SECTION 13 OR 15(d) OF THE SECURITIES EXCHANGE ACT OF 1934 |
For the transition period from to | |
Commission File Number: 001-35328
Aegion Corporation | ||
(Exact name of registrant as specified in its charter) | ||
Delaware | 45-3117900 | |
(State or other jurisdiction of incorporation or organization) | (I.R.S. Employer Identification No.) | |
17988 Edison Avenue, Chesterfield, Missouri | 63005-1195 | |
(Address of principal executive offices) | (Zip Code) | |
Registrant’s telephone number, including area code: (636) 530-8000 | ||
Securities registered pursuant to Section 12(b) of the Act:
Title of each class Name of each exchange on which registered
Class A Common Shares, $.01 par value The Nasdaq Global Select Market
Securities registered pursuant to Section 12(g) of the Act: None
Indicate by check mark if the registrant is a well-known seasoned issuer, as defined in Rule 405 of the Securities Act. Yes x No ¨
Indicate by check mark if the registrant is not required to file reports pursuant to Section 13 of 15(d) of the Act. Yes ¨ No x
Indicate by check mark whether the registrant (1) has filed all reports required to be filed by Section 13 or 15(d) of the Securities Exchange Act of 1934 during the preceding 12 months (or for such shorter period that the registrant was required to file such reports), and (2) has been subject to such filing requirements for the past 90 days. Yes x No ¨
Indicate by check mark whether the registrant has submitted electronically and posted on its corporate Web site, if any, every Interactive Data File required to be submitted and posted pursuant to Rule 405 of Regulation S-T (§232.405 of this chapter) during the preceding 12 months (or for such shorter period that the registrant was required to submit and post such files). Yes x No ¨
Indicate by check mark if disclosure of delinquent filers pursuant to Item 405 of Regulation S-K(§229.405 of this chapter) is not contained herein, and will not be contained, to the best of registrant’s knowledge, in definitive proxy or information statements incorporated by reference in Part III of this Form 10-K or any amendment to this Form 10-K. x
Indicate by check mark whether the registrant is a large accelerated filer, an accelerated filer, a non-accelerated filer, smaller reporting company, or an emerging growth company. See the definitions of “large accelerated filer,” “accelerated filer,” “smaller reporting company,” and “emerging growth company” in Rule 12b-2 of the Exchange Act.
Large accelerated filer x | Accelerated filer ¨ | Non-accelerated filer ¨ | Smaller reporting company ¨ | Emerging growth company ¨ |
If an emerging growth company, indicate by check mark if the registrant has elected not to use the extended transition period for complying with any new or revised financial accounting standards provided pursuant to Section 13(a) of the Exchange Act. ¨
Indicate by checkmark whether the registrant is a shell company (as defined in Rule 12b-2 of the Exchange Act). Yes ¨ No x
State the aggregate market value of the voting and non-voting common equity held by non-affiliates computed by reference to the price at which the common equity was last sold, or the average bid and asked price of such common equity, as of June 30, 2017: $724,676,376.
There were 32,635,327 shares of Class A common stock, $.01 par value per share, outstanding at February 22, 2018.
DOCUMENTS INCORPORATED BY REFERENCE
As provided herein, portions of the documents below are incorporated by reference:
Document Part — Form 10-K
Registrant’s Proxy Statement for the 2018 Annual Meeting of Stockholders Part III
TABLE OF CONTENTS
PART I | ||
Item 1. | ||
Item 1A. | ||
Item 1B. | ||
Item 2. | ||
Item 3. | ||
Item 4. | ||
Item 4A. | ||
PART II | ||
Item 5. | ||
Item 6. | ||
Item 7. | ||
Item 7A. | ||
Item 8. | ||
Item 9. | ||
Item 9A. | ||
Item 9B. | ||
PART III | ||
Item 10. | ||
Item 11. | ||
Item 12. | ||
Item 13. | ||
Item 14. | ||
PART IV | ||
Item 15. | ||
1
Note About Forward-Looking Information
The Private Securities Litigation Reform Act of 1995 provides a “safe harbor” for forward-looking statements. We make forward-looking statements in this Annual Report on Form 10-K for the year ended December 31, 2017 (this “Report”) that represent our beliefs or expectations about future events or financial performance. These forward-looking statements are based on information currently available to us and on management’s beliefs, assumptions, estimates and projections and are not guarantees of future events or results. When used in this report, the words “anticipate,” “estimate,” “believe,” “plan,” “intend,” “may,” “will” and similar expressions are intended to identify forward-looking statements, but are not the exclusive means of identifying such statements. Such statements are subject to known and unknown risks, uncertainties and assumptions, including those referred to in the “Risk Factors” section of this Report. In light of these risks, uncertainties and assumptions, the forward-looking events discussed may not occur. In addition, our actual results may vary materially from those anticipated, estimated, suggested or projected. Except as required by law, we do not assume a duty to update forward-looking statements, whether as a result of new information, future events or otherwise. Investors should, however, review additional disclosures made by us from time to time in our filings with the Securities and Exchange Commission. Please use caution and do not place reliance on forward-looking statements. All forward-looking statements made by us in this Report are qualified by these cautionary statements.
PART I
Item 1. Business
Unless otherwise indicated, the terms “Aegion Corporation,” “Aegion,” “the Company,” “we,” “our” and “us” are used in this Report to refer to Aegion Corporation or one of our consolidated subsidiaries or to all of them taken as a whole. We are incorporated in the State of Delaware. We maintain executive offices at 17988 Edison Avenue, Chesterfield, Missouri 63005. Our telephone number is (636) 530-8000 or toll free at (800) 325-1159. Our website address is www.aegion.com. Our common shares, $.01 par value, are traded on The Nasdaq Global Select Market under the symbol “AEGN”. Our fiscal year ends on December 31 of each calendar year.
Overview
Aegion combines innovative technologies with market leading expertise to maintain, rehabilitate and strengthen pipelines and other infrastructure around the world. Since 1971, we have played a pioneering role in finding transformational solutions to rehabilitate aging infrastructure, primarily pipelines in the wastewater, water, energy, mining and refining industries. We also maintain the efficient operation of refineries and other industrial facilities and provide innovative solutions for the strengthening of buildings, bridges and other structures. We are committed to Stronger. Safer. Infrastructure®. Our products and services are currently utilized in over 80 countries across six continents. We believe the depth and breadth of our products and services make us a leading provider for the world’s infrastructure rehabilitation and protection needs.
Our Company premise is to use technology to extend the structural design life and maintain, if not improve, the performance of infrastructure, mostly related to pipelines and piping systems. We have proved this expertise can be applied in a variety of markets to protect pipelines in oil, gas, nuclear, mining, wastewater and water applications and can be extended to the rehabilitation and maintenance of commercial structures and the provision of professional services in energy-related industries. Many types of infrastructure must be protected from the corrosive and abrasive materials that pass through or near them. Our expertise in non-disruptive corrosion engineering and abrasion protection is wide-ranging. We have a long history of product development and intellectual property management. We manufacture many of the engineered solutions we offer to customers as well as the specialized equipment required to install them. Finally, decades of experience give us an advantage in understanding municipal, energy, mining, industrial and commercial customers. Strong customer relationships and brand recognition allow us to support the expansion of existing and innovative technologies in our core end markets.
We originally incorporated in Delaware in 1980 to act as the exclusive United States licensee of the Insituform® cured-in-place pipe (“CIPP”) process, which Insituform’s founder invented in 1971. The Insituform® CIPP process served as the first trenchless technology for rehabilitating wastewater pipelines and has enabled municipalities and private industry to avoid the extraordinary expense and extreme disruption that can result from conventional “dig-and-replace” methods. We have maintained our leadership position in the CIPP market from manufacturing to technological innovations and market share for over 45 years.
We embarked on a diversification strategy in 2009 to expand not only our geographic reach but also our product and service portfolio into the oil and gas markets. Through a series of strategic initiatives and key acquisitions, we possess a broad portfolio of cost-effective solutions for rehabilitating and maintaining aging or deteriorating infrastructure, protecting new infrastructure from corrosion and providing integrated professional services in engineering, procurement, construction, maintenance and turnaround services for oil companies, primarily in the downstream market. Today, our long-term strategy is to invest in our core end markets for organic growth and acquire innovative technologies to enhance our competitive position.
2
Our Segments
We have three operating segments, which are also our reportable segments: Infrastructure Solutions, Corrosion Protection and Energy Services. Our operating segments correspond to our management organizational structure. Each operating segment has leadership that reports to our chief executive officer, who is also the chief operating decision manager (“CODM”). The operating results and financial information reported by each of the segments are evaluated separately, reviewed regularly and used by the CODM to evaluate segment performance, allocate resources and determine management incentive compensation. See Note 13 to the consolidated financial statements contained in this Report for further discussion regarding our segments.
Infrastructure Solutions – The majority of our work is performed in the municipal water and wastewater pipeline sector and, while the pace of growth is primarily driven by government funding and spending, overall demand due to required infrastructure improvements in our core markets should result in a long-term stable growth opportunity for our market leading products, Insituform® CIPP, Tyfo® system and Fusible PVC® pipe.
Corrosion Protection – Corrosion Protection is positioned to capture the benefits of continued oil and natural gas pipeline infrastructure developments across North America and internationally, as producers and midstream pipeline companies transport their product from onshore and offshore oil and gas fields to regional demand centers both domestically and internationally. The segment has a broad portfolio of technologies, products and services to protect, maintain, rehabilitate, assess and monitor pipelines from the effects of corrosion, including cathodic protection, interior pipe linings, interior and exterior pipe coatings and insulation, as well as an increasing offering of inspection and repair capabilities. We provide solutions to customers to enhance the safety, environmental integrity, reliability and compliance of their pipelines in the oil and gas markets.
Energy Services – We offer a unique value proposition based on our world-class safety and labor productivity programs, which allow us to provide cost-effective construction, maintenance, turnaround and specialty services at customers’ refineries, chemical and other industrial facilities. We understand the demands and the level of critical planning required to ensure a successful turnaround or shutdown and offer a full range of services as part of our facility maintenance solutions, while maintaining a reputation for being safe and professional and providing predictable value.
Our Long-Term Strategy
We are committed to being a valued partner to our customers, with a constant focus on expanding those relationships by solving complex infrastructure problems, enhancing our capabilities and improving execution while also developing or acquiring innovative technologies and comprehensive services. We are pursuing three key strategic initiatives:
Municipal Pipeline Rehabilitation – The fundamental driver in the global municipal pipeline rehabilitation market is the growing gap between the need and current spend. While we do not expect the spending gap to close any time soon, the increasing need for pipeline rehabilitation supports a long-term sustainable market for the technologies and services offered by our Infrastructure Solutions segment. We are committed to maintaining our market leadership position in the rehabilitation of wastewater pipelines in North America using our CIPP technology, the largest contributor to Aegion’s consolidated revenues. We have a diverse portfolio of trenchless technologies to rehabilitate aging and damaged municipal pipelines. The focus today is growing our presence in the rehabilitation of pressure pipelines through both internal development and acquisitions. In 2016, we acquired Underground Solutions, Inc. and its subsidiary, Underground Solutions Technologies Group, Inc. (collectively, “Underground Solutions”), adding its patented Fusible PVC® pipe technology to our pressure pipe portfolio, which includes InsituMain® CIPP as well as the Tyfo® fiber-reinforce polymer (“FRP”) and Tite Liner® high-density polyethylene (“HDPE”) systems. Our international strategy is to use a blend of third-party product sales as well as CIPP and FRP contract installation operations in select markets. A key to the success of this strategy is a continuing focus on improving productivity to reduce costs and increase efficiencies across the entire value chain from engineering, manufacturing and installation of our technology-based solutions.
Midstream Pipeline Integrity Management – There are over one million miles of regulated pipelines in North America, which remain the safest and most cost-effective mode of oil and gas transmission. Within our Corrosion Protection segment, the design and installation of cathodic protection systems to help prevent pipeline corrosion have historically represented a majority of the revenues and profits for the segment. We also provide inspection services to monitor these systems and detect early signs of corrosion. In 2017, we launched a new asset integrity management program designed to increase the efficiency and accuracy of the pipeline corrosion assessment data we collect as well as upgrade how we share this valuable information with customers. We seek to improve customer regulatory
3
compliance and add new services in the areas of data gathering and validation, advanced analytics and predictive maintenance.
Downstream Oil Refining and Industrial Facility Maintenance – We have long-term relationships with oil refinery and industrial customers on the United States West Coast through our Energy Services segment. Our objective is to leverage those relationships to expand the services we provide in mechanical maintenance, electrical and instrumentation services, small capital construction, shutdown and turnaround maintenance activity and specialty services. We continue to promote our safety services and recently began offering scaffolding services. There are opportunities in other industries on the West Coast such as oil and oil product terminals, chemicals, industrial gas and power to leverage our experience in maintenance and construction services.
Our Products and Services
Today our diverse portfolio of full service solutions includes:
Rehabilitation of Water and Wastewater Pipelines with CIPP Products – Through our Infrastructure Solutions segment, we offer manufacturing and installation of cost-effective solutions to remediate operational, health, regulatory and environmental problems resulting from aging and defective water and wastewater pipelines. Our Insituform® CIPP product is a trenchless, jointless, seamless pipe-within-a-pipe solution used to rehabilitate pipes in various diameters. Our Insituform® CIPP process provides a more affordable alternative to dig-and-replace methods and is a less disruptive and more environmentally friendly method for pipe repairs. We have maintained our leadership position in the CIPP market through our ISO 9001:2008 certified manufacturing facilities and technological innovations for the past 45 years. Our Insituform® portfolio of products and services are utilized worldwide.
Fusible Polyvinyl Chloride Products for Rehabilitation – Underground Solutions’ patented Fusible PVC® pipe is used in the rehabilitation of pressure pipelines, primarily in North America. Underground Solutions uniquely complements Aegion’s existing pressure pipe rehabilitation technologies (InsituMain® CIPP as well as the Tyfo® and Tite Liner® systems) and increases Aegion’s presence in the pressure pipe market.
Fiber Reinforced Polymer Systems for Rehabilitation and Strengthening – We use the Tyfo® system to rehabilitate medium- to large-diameter pipelines, providing a unique advantage over conventional rehabilitation methods. The Tyfo® system consists of proprietary and specialized carbon, glass, aramid and hybrid lightweight and low profile woven fabrics combined with the proprietary resin and epoxy polymers, which, in unique combinations, create the tested, proven and certified Tyfo® advanced composite system. The Tyfo® system is specifically engineered, manufactured and installed to solve a host of structural deficiencies or demands in existing structures. Certified Tyfo® system applicators apply the technology to civil structures to withstand seismic and force loads and provide strengthening, repair and restoration of masonry, concrete, steel and wooden infrastructure worldwide. We offer personalized technical support to our customers through a highly-trained structural engineering team that assists in all phases of a potential project, from the initial design to implementation and installation. We believe there is a growing addressable market in North America as well as an increasing acceptance of our products and services internationally, with particular focus in Southeast Asia.
Cathodic Protection for Corrosion Engineering Control and Infrastructure Rehabilitation – Through our Corrosion Protection segment, we offer cathodic protection solutions, a time-tested pipeline corrosion mitigation technology that is mandated by regulatory rules in many types of pipeline systems. We provide engineering and inspection services by National Association of Corrosion Engineers International (“NACE”) trained and certified inspectors (one of the largest independent consulting corrosion engineering organizations in the world), project management, training, research, testing and design, consultation and installation services to the following markets: pipeline, refinery, above and underground storage tanks, water/wastewater structures, concrete infrastructure and offshore and marine structures. We also offer a full line of superior quality corrosion control and cathodic protection materials, which are NSF/ANSI 61 classified for drinking water system components. Through our subsidiary, Hockway Middle East FZE (“Hockway”), our joint venture in Saudi Arabia and our branch office in Abu Dhabi, we have an expanded presence of cathodic protection capabilities in the Middle East. Hockway offers a complete cathodic protection solution from initial investigative surveys through engineering design, manufacture of equipment, site installation and commissioning of systems with subsequent planned operational inspection and maintenance. More recently, we have enhanced our pipeline inspection services through the internal development of an asset integrity management program, which is designed to digitize the critical pipeline data we gather and efficiently transmit, store and display the results to our customers.
Pipe Coatings for Corrosion and Thermal Control and Prevention – We provide products and services to protect pipes from corrosion and to provide flow assurance primarily for the oil and gas industries. We accomplish this through external and internal pipe coatings utilizing fusion bonded epoxy (“FBE”), concrete for buoyancy reduction, extruded polyethylene for additional protection, insulation coating for thermal control and field joint coating for corrosion protection of fittings, valves and other primary sources for metal corrosion. Additionally, we provide custom coating services on pipe bends, fittings, fabricated spools, valves and short runs of straight pipe for oil, gas and potable water services, as well as onshore or offshore
4
fabrication and welding services. We also offer a proprietary robotic pipe coating and inspection technology for internal and external welded pipe field joints and rebar coating.
Thermoplastic Pipe Lining for Corrosion Control, Abrasion Protection and Pipeline Rehabilitation – Our proprietary Tite Liner® installation system provides chemical, corrosion and abrasion resistance for numerous pipeline applications, including in the oil and gas, mining and chemical pipeline markets, and has application in the rehabilitation of pressure pipes in the municipal marketplace. Our system can rehabilitate pipelines for a fraction of the cost and time associated with industrial pipeline replacement. We offer our lining protection products and services worldwide, with a strategic focus on expanding our presence in key end markets with sustainable capital spend on oil, gas and mining activities.
Our cathodic protection capabilities and products for lining and coating pipelines are applicable worldwide in the oil, gas and mining markets, with a focus on the Gulf of Mexico, Western Canada, the United States, Europe, the Middle East, East and Southern Africa, and South America.
Construction and Maintenance of Oil and Gas Facilities – Through our Energy Services segment, which operates as Aegion Energy Services, we are a leading integrated service provider of maintenance, construction and turnaround activities for the oil and gas markets. Focused on serving large oil and gas customers on the United States West Coast, primarily California, Energy Services offers an industry-leading safety record, a strong reputation for reliability and quality and comprehensive solutions needed for major refinery maintenance, repairs and retrofits. These core competencies position Energy Services to meet the growing demand for non-discretionary operating and maintenance expenditures.
Strategic Initiatives and Key Acquisitions
Acquisitions
Our recent acquisition strategy has focused on acquisitions that add new technologies to our Company’s product and services portfolio or new geographic areas. During 2017 and 2016, we targeted strategic acquisitions in the infrastructure sector by:
i. | adding patented Fusible PVC® pipe technology to our pressure pipe rehabilitation portfolio through the acquisition of Underground Solutions; |
ii. | expanding our CIPP presence in Europe by acquiring the CIPP contracting operations of Leif M. Jensen A/S (“LMJ”), a Danish company and the Insituform licensee in Denmark since 2011, and acquiring Environmental Techniques Limited and its parent holding company, Killeen Trading Limited (collectively “Environmental Techniques”), a Northern Ireland-based provider of trenchless drainage inspection, cleaning and rehabilitation services throughout the United Kingdom and the Republic of Ireland; |
iii. | acquiring the remaining worldwide rights that we did not already own to market, manufacture and install the patented Tyfo® system by acquiring the operations and territories of Fyfe Europe S.A. and related companies (“Fyfe Europe”); and |
iv. | expanding our FRP presence in Asia Pacific through the acquisition of Concrete Solutions Limited (“CSL”) and Building Chemical Supplies Limited (“BCS”), two New Zealand-based companies that were the Tyfo® system certified applicators in New Zealand since the late 1990’s (collectively, “Concrete Solutions”). |
See Notes 1 and 2 to the consolidated financial statements contained in this Report for additional information and disclosures regarding our acquisitions.
Restructuring Activities
2017 Restructuring
On July 28, 2017, our board of directors approved a realignment and restructuring plan (the “2017 Restructuring”) to: (i) divest our pipe coating and insulation businesses in Louisiana, The Bayou Companies, LLC and Bayou Wasco Insulation, LLC (collectively “Bayou”); (ii) exit all non-pipe related contract applications for the Tyfo® system in North America; (iii) right-size our cathodic protection services operation in Canada; and (iv) reduce corporate and other operating costs. These decisions reflected our: (a) desire to reduce further our exposure in the North American upstream oil and gas markets; (b) assessment of our ability to drive sustainable, profitable growth in the non-pipe FRP contracting market in North America; and (c) assessment of continuing weak conditions in the Canadian oil and gas markets. During 2017, we also completed a detailed assessment of the Infrastructure Solutions’ CIPP businesses in Australia and Denmark, which resulted in additional restructuring actions in both countries.
We expect the 2017 Restructuring to reduce consolidated annual expenses by over $20 million, of which approximately $12 million and $4 million relate to cost reductions expected to be recognized within Infrastructure Solutions and Corrosion
5
Protection, respectively, and $4 million related to reduced corporate and other costs. Cost reductions are expected to be fully realized in 2018.
2016 Restructuring
On January 4, 2016, our board of directors approved a restructuring plan (the “2016 Restructuring”) to reduce our exposure to the upstream oil markets and to reduce consolidated expenses. During 2016, we completed the 2016 Restructuring, which: (i) repositioned Energy Services’ upstream operations in California; (ii) reduced Corrosion Protection’s upstream exposure by divesting our interest in Bayou Perma-Pipe Canada, Ltd. (“BPPC”), our Canadian pipe coating joint venture; (iii) right-sized Corrosion Protection to compete more effectively; and (iv) reduced corporate and other operating costs. The 2016 Restructuring reduced consolidated annual operating costs by approximately $17.4 million, of which approximately $1.2 million, $6.6 million and $5.6 million related to recognized savings within Infrastructure Solutions, Corrosion Protection and Energy Services, respectively, and $4.0 million related to reduced corporate costs.
2014 Restructuring
On October 6, 2014, our board of directors approved a restructuring plan (the “2014 Restructuring”) to improve gross margins and profitability over the long-term by exiting certain unprofitable international locations for our CIPP business and eliminating certain idle facilities in our pipe coating and insulation operation in Louisiana. The 2014 Restructuring reduced consolidated annual operating costs by approximately $10.8 million and consisted of approximately $8.4 million and $2.4 million of recognized savings within Infrastructure Solutions and Corrosion Protection, respectively.
See Notes 1 and 3 to the consolidated financial statements contained in this Report for a detailed discussion regarding strategic initiatives and restructuring efforts.
Divestitures – Planned and Completed
Through our restructuring efforts to exit higher-risk, low return markets and streamline our operations, we have divested, or planned to divest, certain businesses in our Infrastructure Solutions and Corrosion Protection segments during 2017, 2016 and 2015:
i. | On July 28, 2017, as part of the 2017 Restructuring, the Company’s board of directors approved a plan to divest our pipe coating and insulation businesses at Bayou. We are currently engaged in a process to market and sell Bayou. |
ii. | In February 2016, we sold our fifty-one percent (51%) interest in BPPC to our joint venture partner, Perma-Pipe, Inc. BPPC served as our pipe coating and insulation operation in Canada. The sale of our interest in BPPC was part of a broader effort to reduce our exposure in the North American upstream market in light of expectations for a prolonged low oil price environment. |
iii. | In February 2015, we sold our wholly-owned subsidiary, Video Injection - Insituform SAS (“VII”), our French CIPP contracting operation, to certain employees of VII. |
See Note 1 to the consolidated financial statements contained in this Report for a detailed discussion regarding strategic initiatives and divestitures.
Available Information
Our website is www.aegion.com. We make available on this website (under “Investors” and then under “SEC Information”), free of charge, our proxy statements used in conjunction with stockholder meetings, annual reports on Form
10-K, quarterly reports on Form 10-Q, current reports on Form 8-K and Section 16 beneficial ownership reports (as well as any amendments to those reports) as soon as reasonably practicable after we electronically file such material with, or furnish it to, the Securities and Exchange Commission. In addition, our Code of Ethics for our Chief Executive Officer, Chief Financial Officer and senior financial employees, our Code of Conduct applicable to all of our officers, directors and employees, our Corporate Governance Guidelines and our Board committee charters are available, free of charge, on our website (under “Investors” and then under “Corporate Governance”). In addition, paper copies of these documents will be furnished to any stockholder, upon request, free of charge.
Technologies
Infrastructure Solutions
Our Insituform® CIPP process (including Insitupipe® and Insitutube®) for the rehabilitation of wastewater pipelines and other conduits utilizes a custom-manufactured tube, or liner, made of synthetic fiber. After the tube is saturated (impregnated)
6
with a thermosetting resin mixture, it is installed in the host pipe by various processes. The resin is then cured, by heat using hot water, steam or ultraviolet light, forming a new rigid pipe within a pipe.
Our iPlus® Infusion® pull-in CIPP is a trenchless method for the rehabilitation of small-diameter wastewater pipelines, whereby a felt liner is continuously impregnated with liquid, thermosetting resin through a proprietary process, after which the liner is pulled into the host pipe, inflated with air and cured with steam.
Our iPlus® Composite CIPP is used for the trenchless rehabilitation of large-diameter wastewater pipelines, where the felt liner is reinforced with carbon or glass fiber, impregnated with liquid, thermosetting resin, inverted into place and cured with hot water or steam.
Our InsituMain® CIPP system is a solution for pressure pipes, including water mains and force mains up to 96-inches in diameter. The system can negotiate bends and is pressure-rated up to 150 psi. The InsituMain® system has also been certified as complying with NSF/ANSI Standard 61.
Our Insituform® RPP™ process is a trenchless technology used for the rehabilitation of wastewater force mains and industrial pressure pipelines. The felt tube is reinforced with glass and impregnated with liquid, thermosetting resin, after which it is inverted with water and cured with hot water to form a structural, jointless pipe within the host pipe.
Our Insituform® PPL® process is a trenchless technology certified to NSF/ANSI Standard 61 used for the rehabilitation of drinking water and industrial pressure pipelines. A glass-reinforced liner is impregnated with an epoxy or vinyl ester resin, inverted with water and cured with hot water to form a jointless pipe lining within the host pipe.
Our ultraviolet/glass lining system is a CIPP solution for small- to medium-diameter pipes utilizing a glass fiber tube that is impregnated with a resin sensitive to ultraviolet light or steam curing. The tube is pulled into place in the host pipe, inflated by air and cured via an ultraviolet light source or steam.
Sliplining is a method used to push or pull a new pipeline into an old one. With segmented sliplining, short segments of pipe are joined to form the new pipe. For gravity wastewater rehabilitation, these short segments can often be joined in a manhole or access structure, eliminating the need for a large pulling pit.
Our sealing method reconnects a ferrule of a service line from within the bore of a lined host pipe.
Our Fusible PVC® technology contains proprietary polyvinyl chloride (“PVC”) formulation that, when combined with its patented fusion process, results in a monolithic, fully-restrained, gasket-free, leak-free piping system. Fusible PVC® pipe products include Fusible C-900®, Fusible C-905® and FPVC® pipes. Fusible C-900® and Fusible C-905® pipes both comply with the AWWA standards AWWA C900 and C905, respectively, and are certified to the NSF/ANSI Standard 61.
Our ServiceGuard® composite pipe product combines the performance benefits of chlorinated PVC with the strength and durability of an aluminum core to offer the ultimate water service line pipe.
Our Tyfo® system applies high-strength fiber fabric to strengthen structures, including pipelines, and the connections between structural components, thereby strengthening, repairing and restoring masonry, concrete, steel and wooden structures. Beyond general strengthening of pipelines and structures, the Tyfo® system also has application in blast mitigation and seismic reinforcement.
See “Patents and Proprietary Technologies” below for more information concerning certain of these technologies.
Corrosion Protection
Our Tite Liner® system is a method of lining new and existing pipe with a corrosion and abrasion resistant thermoplastic pipe.
Our Safetyliner™ product is a grooved thermoplastic liner that is installed in an industrial pipeline using the Tite Liner® process. The Safetyliner™ liner is normally used in natural gas or CO2 pipelines to allow the release of gas that permeates the thermoplastic liner. If gas is allowed to build in the annular space under normal operating conditions, the line can be susceptible to collapse upon sudden changes in operating pressures. The Safetyliner™ liner also has been used in pipelines as a leak detection system and for dual containment in mine water pipelines.
The fusion bonded epoxy (“FBE”) application process utilizes heat to melt a dry powder FBE coating material into liquid form. The liquid material flows onto the steel pipe and solidifies through a process called cross-linking. Once cooled, this “fusion-bonded” epoxy cannot return to its original state and forms a corrosion protection barrier on the interior or exterior surface of the pipe.
Our deepwater pipe coating and insulation capabilities answer the challenge of subsea wet insulation requirements for high-pressure and high-temperature environments.
7
Our 3-layer polyethylene coating and 3-layer polypropylene coating offerings are intended for use as an external coating for buried or submerged oil or gas pipelines and offer superior adhesion, cathodic disbondment resistance and mechanical protection.
Our 5-layer polypropylene coating offering is one of our insulating coating solutions that provides superior thermal insulation and mechanical protection for high-temperature pipelines in deepwater environments.
Our concrete coatings provide submerged weight stability and protect the external corrosion protective coating on pipelines installed offshore and at other water crossings such as swamps or bays.
Our InnerGard™ product is an internal FBE coating that provides corrosion protection for water injection lines and reduces costs compared to alloy pipe.
Our Enventure™ product is an internal lubricity coating for solid expandable downhole tubulars.
Our internal field joint coating technology consists of self-contained robots that travel inside the pipe, find the weld and then blast clean, vacuum and coat the area. Utilizing various cameras, these field joint coating robots transmit a real-time video image back to the operator which is then used for control and inspection. The technology allows for the field application of FBE and plural component liquid materials to the weld area.
Cathodic protection is an electrochemical process that prevents corrosion of new structures and stops corrosion on existing structures. Metal loss is prevented by the passing of a very small direct current from a cathodic protection electrode (anode), through the electrolyte (soil, water, concrete, etc.) on to the structure to be protected (cathode). In this process, the anode corrodes, sacrificing itself to protect the integrity of the cathode. Structures commonly protected by this process include oil and gas pipelines, offshore platforms, above and underground storage tanks, ships, electric power plants, bridges, parking garages, transit systems and water and wastewater facilities.
Our CorrFlex® system is a linear anode system installed parallel to pipelines, oftentimes to prevent stress corrosion cracking that can lead to ruptures on high pressure gas transmission pipelines.
Our CorrSpray® product provides a unique solution for preventing corrosion of steel reinforcements in concrete structures.
Our Green Rectifier® system is an ecologically friendly method of cathodic protection using solar panels and a wind generator to power the cathodic protection process.
Our Grid™ system has set the global standard for preventing releases from external corrosion of at-grade storage tanks containing oil and petroleum products, thereby ensuring safe operations and protection of the environment.
Our AC interference mitigation solution protects pipeline operators and the public from electrical hazards when pipelines share space on rights-of-way with overhead electric transmission lines. Beginning with advanced predictive modeling, we then design mitigation schemes and provide systems to protect people and the pipeline.
Our asset integrity management platform allows for the collection, communication and storage of data in a geospatial information system-based, centralized, integrated repository that provides us and our customers more timely information and improved data analytics.
See “Patents and Proprietary Technologies” below for more information concerning certain of these technologies.
Energy Services
Our DelayTrak® system identifies delays in real time. The data is used to identify and quickly communicate improvement opportunities and, later, action plans for improvement.
Our TimeTrak™ system tracks how time is spent by crews on a jobsite. The data is used to drive process improvements in routine maintenance.
Operations
We are organized into three operating segments, which are also our reportable segments: Infrastructure Solutions, Corrosion Protection and Energy Services. Each segment is regularly reviewed and evaluated separately.
Our operations are generally project oriented. Projects may range in duration from just a few days to several years and can be performed as one-time contracts or as part of longer-term agreements. These contracts are usually obtained through competitive bidding or negotiations and require performance at a fixed price or time and materials basis. Our Corrosion Protection and Energy Services projects are generally performed under contracts with industrial entities. A majority of our water and wastewater rehabilitation installation projects in our Infrastructure Solutions segment are performed under contracts with municipal entities. Independent contractors may be utilized to perform portions of the work on any given project that we provide.
8
Infrastructure Solutions Operations
Our water and wastewater pipeline rehabilitation activities are conducted principally through installation and other construction operations performed directly by our subsidiaries.
Our North American Infrastructure Solutions operations, including research and development, engineering, training and financial support systems, are headquartered in Chesterfield, Missouri. Tube manufacturing and processing facilities for North America are maintained in ten locations, geographically dispersed throughout the United States and Canada to support our North American contracting operations and through which we sell liners to third parties, domestically and internationally.
We also conduct Insituform® CIPP process rehabilitation operations worldwide through our wholly-owned subsidiaries. We utilize multifunctional robotic devices developed by a wholly-owned French subsidiary in connection with the inspection and repair of pipelines. We also maintain a manufacturing facility in Wellingborough, United Kingdom to support our international operations and through which we sell liners to third parties internationally.
We have granted licenses to our trenchless rehabilitation processes to unaffiliated companies in certain geographic regions. As described under “Ownership Interests in Operating Licensees and Joint Ventures” below, we have also entered into contractual joint ventures from time to time to capitalize on our trenchless rehabilitation processes. Under these contractual joint venture relationships, work is bid by the joint venture entity and subcontracted to the joint venture partners or to third parties. The joint venture partners are primarily responsible for their subcontracted work, but both joint venture partners are liable to the customer for all of the work. Revenues and associated costs are recorded using percentage-of-completion accounting for our subcontracted portion of the total contract only.
Our acquisition in February 2016 of Underground Solutions bolstered our capabilities with respect to water pipeline rehabilitation operations. We are now able to provide additional infrastructure technologies for water, wastewater and conduit applications, primarily Fusible PVC® pipe, which, when combined with its patented fusion process, results in a monolithic, fully-restrained, gasket-free, leak-free piping system.
In addition to wastewater pipeline rehabilitation, we have performed water pipeline rehabilitation operations since 2006 using our pressure pipe product portfolio. We are now able to restore water pipes using our InsituMain® CIPP, Tite Liner® system, Tyfo® system and Fusible PVC® pipe.
Our infrastructure rehabilitation operations also utilize FRP to rehabilitate and strengthen pipelines throughout the United States through Fibrwrap Construction Services, headquartered in San Diego, California. We also design and manufacture FRP composite systems used for rehabilitating buildings, bridges, tunnels, industrial developments and waterfront structures, which we supply to certified applicators. We service the European FRP markets with respect to product and engineering services through our wholly-owned subsidiaries in the United Kingdom. We service the Asia-Pacific FRP market, with respect to both product and engineering services as well as application services, through our wholly-owned subsidiaries in Singapore, Japan, Malaysia, Hong Kong and New Zealand and through our joint ventures in Borneo and Indonesia. Finally, we have granted licenses to our proprietary FRP products and processes to unaffiliated companies in certain additional geographic regions, as described under “Ownership Interests in Operating Licensees and Joint Ventures” below.
Corrosion Protection Operations
Our corrosion protection operations perform maintenance, rehabilitation and corrosion protection services for oil and gas, industrial and mineral piping systems and structures. We also offer products for gas release and leak detection systems. Our worldwide corrosion protection operations are headquartered in Houston, Texas and conducted through our various subsidiaries (Corrpro based in Houston, Texas; United Pipeline Systems based in Durango, Colorado; Bayou based in New Iberia, Louisiana; and Aegion Coating Services, LLC (“ACS”) based in Tulsa, Oklahoma and Conroe, Texas). Certain of our corrosion protection operations outside of the United States are conducted through our wholly-owned subsidiaries in the United Kingdom, Portugal, Chile, Canada, Argentina, Brazil and the United Arab Emirates and through our joint ventures in Mexico, Oman, Saudi Arabia and South Africa.
Our Corrpro business performs fully-integrated corrosion prevention services including: (i) engineering and design; (ii) product and material sales; (iii) construction and installation; (iv) inspection, surveying, monitoring, data collection and maintenance; and (v) coatings. United Pipeline Systems performs pipeline rehabilitation and protection services using our proprietary Tite Liner® process. Our Bayou business performs internal and external pipeline coating, lining, and weighting and insulation services, including project management and logistics. Our ACS business specializes in the application of internal corrosion coatings services, provision of external field joint anti-corrosion coating services and the supply of equipment, all for pipeline construction projects onshore and offshore in locations around the world.
Energy Services Operations
Aegion Energy Services is based in Irvine, California and performs construction, maintenance and turnaround services, primarily for the downstream oil and gas industry. Aegion Energy Services’ operations are located in California and
9
Washington. We specialize in offering clients a flexible, single source for all project needs. Clients may choose a single service or multiple integrated services, from technical consulting to turnkey project delivery, ongoing maintenance and scaffolding services. We provide project management professionals across various disciplines, including chemical, civil, structural, mechanical, electrical, instrumentation, project controls, estimating, procurement and safety. AllSafe Services, Inc., a wholly-owned subsidiary of Aegion Energy Services, provides safety field services.
Sweeping refinery industry changes are occurring in California as a result of the implementation of California Health and Safety Code section 25536.7 (the “California Refinery Safety Law”). The law introduced new requirements for refineries and outside contractors at covered facilities in California, which are providing new opportunities for the Energy Services segment. Energy Services has successfully transitioned three of its clients’ refinery operations to building trade union employees as required by the California Refinery Safety Law.
Licensees
We have granted licenses for the Insituform® CIPP process covering exclusive and non-exclusive territories to non-affiliated licensees that provide pipe repair and rehabilitation services throughout their respective licensed territories. The licenses generally grant to the licensee the right to utilize our know-how and patent rights (where such rights exist) relating to the subject process, and to use our copyrights and trademarks. These licenses have an average term of ten years with a right to renew.
Our CIPP licensees generally are obligated to pay a royalty at a specified rate. Any improvements or modifications a licensee may make in the subject process during the term of the license agreement generally becomes our property or is licensed to us. Should a licensee fail to meet its royalty obligations or other material obligations, we may terminate the license at our discretion. Licensees, upon prior notice to us, may generally terminate the license for certain specified reasons. We may vary the terms of agreements entered into with new licensees according to prevailing conditions. Income from royalties are immaterial to our overall consolidated revenues.
Our Fyfe joint ventures in Borneo and Indonesia provide design, product and engineering support to applicators of FRP systems in Asia-Pacific. Our joint ventures in Asia-Pacific are granted the non-exclusive right to use Fyfe products in their respective territories. Fyfe Co. also periodically licenses its patented technology on a project-by-project basis to both affiliated and third-party certified applicators.
With regard to our Underground Solutions business, we have granted licenses to our Fusible PVC® pipe products and fusion processes internationally covering exclusive and non-exclusive territories to non-affiliated licensees that provide fusible PVC products and services. The licenses generally grant to the licensee, in exchange for royalties at a specified rate, the right to utilize our know-how and patent rights (where such rights exist) relating to the subject products and processes, and to use our copyrights and trademarks. Underground Solutions also licenses domestically its patented technology to third-party extruders and installers.
Ownership Interests in Operating Licensees and Joint Ventures
We hold controlling interests in Fyfe/Fibrwrap joint ventures in Borneo and Indonesia. Through our wholly-owned subsidiary, Fyfe Asia Pte. Ltd., we hold (i) a fifty-one percent (51%) equity interest in Fyfe Borneo Sdn Bhd., with the other forty-nine percent (49%) equity interest held by C. Tech Sdn Bhd; and (ii) a fifty-five percent (55%) equity interest in PT Fyfe Fibrwrap Indonesia, with the other forty-five percent (45%) equity interest held by PT Graha Citra Anugerah Lestari.
Through our subsidiary, INA Acquisition Corp., we hold a fifty-five percent (55%) equity interest in United Pipeline de Mexico S.A. de C.V., our licensee of the Tite Liner® process in Mexico. The remaining ownership interest is held by Miller Pipeline de Mexico S.A. de C.V., an unaffiliated Mexican company.
Through our subsidiary, Aegion Holding Company, LLC, we hold a fifty-one percent (51%) equity interest in Bayou Wasco Insulation, LLC through which we provide insulation services primarily for projects located in the United States, Central America, the Gulf of Mexico and the Caribbean. The other forty-nine percent (49%) equity interest is held by Wasco Energy, a leading insulation coatings provider based in Malaysia.
Through our subsidiary, Corrpro Canada, Inc., we hold a seventy-percent (70%) equity interest in Corrpower International Limited (“Corrpower”) based in Saudi Arabia, through which we provide fully integrated corrosion prevention products and services to government and private sector clients throughout the Kingdom of Saudi Arabia. The other thirty-percent (30%) equity interest is held by Saudi Trading & Research Co., Ltd., based in Al-Khobar, Saudi Arabia.
Through our subsidiary, Insituform Technologies Netherlands B.V., we hold a fifty-one percent (51%) equity interest in United Special Technical Services LLC located in Oman for the purpose of executing pipeline, piping and flow line thermoplastic lining services throughout the Middle East and Northern Africa. The other forty-nine percent (49%) equity interest is held by Special Technical Services LLC, an Omani company.
10
Through our subsidiary Aegion International Holdings Limited, we hold a sixty percent (60%) equity interest in Aegion South Africa (Pty) Ltd located in South Africa, through which we provide pipeline rehabilitation products and services in East and Southern Africa. The other forty percent (40%) equity interest is held by Robor Proprietary Limited, a South African manufacturer and supplier of steel pipe.
We have previously entered into teaming and other cooperative arrangements in various geographic regions throughout the world in order to develop cooperative bids on contracts for our thermoplastic pipeline rehabilitation and cathodic protection businesses. Typically, the arrangements provide for each participant to complete its respective scope of work, and we are not required to complete the other participant’s scope of work. We continue to investigate opportunities for expanding our business through such arrangements.
We previously entered into contractual joint ventures in other geographic regions in order to develop joint bids on contracts for our wastewater pipeline rehabilitation business. Typically, the joint venture entity holds the contract with the owner and subcontracts portions of the work to the joint venture partners. As part of the subcontracts, the partners usually provide bonds to the joint venture. We could be required to complete our joint venture partner’s portion of the contract if the partner were unable to complete its portion and a bond is not available. We continue to investigate opportunities for expanding our business through such arrangements.
Product Development
We seek out and develop innovative solutions for pipelines and other infrastructure. To that end, in 2014, we introduced a stage-gate process for management of our research and development initiatives. The process is executed under the direction of our Chief Technical Officer with a market and business impact evaluation at each gate review. Corporate and business unit resources make up the specific research and development teams, supplemented, where beneficial, by our technology partners (often major suppliers), outside consultants and academic institutions. During the years ended December 31, 2017, 2016 and 2015, we spent $4.2 million, $4.7 million and $2.6 million, respectively, on research and development related activities, including engineering.
Customers and Marketing
We offer our products and services to highly diverse markets worldwide. We service municipal, state and federal governments, as well as corporate customers in numerous industries including pipelines, energy, oil and gas, refinery, mining, general and industrial construction, infrastructure (buildings, bridges, tunnels, railways, etc.), water and wastewater, transportation, utilities, maritime and defense. Our products and services are currently utilized and performed in over 80 countries across six continents.
We offer our corrosion protection solutions worldwide to energy, refinery, mining and other customers to protect new and existing pipelines and other structures. The marketing of wastewater pipeline rehabilitation technologies is focused primarily on the municipal wastewater markets worldwide. We offer our water rehabilitation products to municipal and commercial customers. We offer our other infrastructure rehabilitation products worldwide to certain certified third-party installers and applicators and market our engineering, manufacturing and, in some countries, installation services to municipal, state, federal and commercial customers. We offer our Energy Services solutions primarily to the oil and gas markets on the West Coast. No customer accounted for more than 10% of our consolidated revenues during the years ended December 31, 2016 or 2015. During the year ended December 31, 2017, we had one customer that accounted for approximately 12.1% of our consolidated revenues primarily due to a large deepwater pipe coating and insulation project that was substantially completed during the year.
To help shape decision making at every step, we use a highly-trained, multi-level sales force structured around target markets and key accounts, focusing on engineers, contractors, consultants, administrators, technical staff and public officials. Due to the technical nature of our products and services, many of our sales personnel have engineering or technical expertise and experience. We also produce sales literature and presentations, participate in trade shows, present at conferences and execute other marketing programs for our own sales force and those of unaffiliated licensees. Our unaffiliated licensees are responsible for marketing and sales activities in their respective territories. See “Licensees” and “Ownership Interests in Operating Licensees and Joint Ventures” above for a description of our licensing operations and for a description of investments in licensees.
Contract Backlog
Contract backlog is our expectation of revenues to be generated from received, signed and uncompleted contracts, the cancellation of which is not anticipated at the time of reporting. We assume that these signed contracts are funded. For government or municipal contracts, our customers generally obtain funding through local budgets or pre-approved bond financing. We generally do not undertake a process to verify funding status of these contracts and, therefore, cannot reasonably
11
estimate what portion, if any, of our contracts in backlog have not been funded. However, we have little history of signed contracts being canceled due to the lack of funding. Contract backlog excludes any term contract amounts for which there are not specific and determinable work releases and projects where we have been advised that we are the low bidder, but have not formally been awarded the contract.
In accordance with industry practice, substantially all of our contracts are subject to cancellation, termination or suspension at the discretion of the customer. Contracts in our backlog are subject to changes in scope and of services to be provided as well as adjustments to the costs relating to the contracts. Accordingly, backlog is not necessarily indicative of our future revenues or earnings.
Included within backlog for Energy Services are amounts that represent expected revenues to be realized under long-term Master Service Agreements (“MSAs”) and other signed contracts. If the remaining term of these arrangements exceeds 12 months, the unrecognized revenues attributable to such arrangements included in backlog are limited to only the next 12 months of expected revenues. Although backlog represents only those contracts and MSAs that are considered to be firm, there can be no assurance that cancellation or scope adjustments will not occur with respect to such contracts.
Included within backlog for Infrastructure Solutions and Corrosion Protection are certain contracts that are performed through our variable interest entities in which we own a controlling portion of the entity. With the exception of Energy Services, a substantial majority of our contracts in these two segments are fixed price contracts with individual private businesses and municipal and federal government entities across the world. Energy Services generally enters into cost reimbursable contracts that are based on costs incurred at agreed upon contractual rates.
For additional information regarding our backlog including those risk factors specific to backlog, please refer to “Risk Factors” in Item 1A, and “Management’s Discussion and Analysis of Financial Condition and Results of Operations” in Item 7 below.
Manufacturing and Suppliers
We maintain our North American Insituform® CIPP process liner manufacturing facility in Batesville, Mississippi. In Europe, we manufacture and sell Insituform® CIPP process liners from our plant located in Wellingborough, United Kingdom. Although raw materials used in Insituform® CIPP process products are typically available from multiple sources, our historical practice has been to purchase materials from a limited number of suppliers. We maintain our own felt manufacturing facility in Batesville, Mississippi. Substantially all of our fiber requirements are purchased from two sources, but there are alternate vendors readily available. We source our global resin supply from multiple vendors. We also manufacture certain equipment used in our Insituform® CIPP business. We believe that the sources of supply for our Insituform® CIPP operations in North America, Europe and Asia-Pacific are adequate for our needs.
We sell Insituform® CIPP process liners and related products to third parties and certain licensees on a long-term or, in certain instances, on a project to project basis. In Europe, in addition to sales made on a project by project basis, we have entered into supply agreements with two third parties to supply them with Insituform® CIPP process liners and related products.
With regard to Underground Solutions, we have three qualified third-party extruders to toll manufacture our Fusible PVC® pipe products.
The principal raw materials used by Fyfe Co. in the manufacture of FRP composite materials are carbon, glass, resins, fabric and epoxy raw materials. Fabric and epoxies are the most significant materials purchased, which are currently purchased through a select group of suppliers, although these and the other materials are available from a number of vendors. The weaving of FRP components into woven fabric is done at our facility in La Conner, Washington. Fyfe Co. does specialized blending of unique epoxies from basic chemicals at our Batesville, Mississippi facility. The epoxy resin is also repackaged at our Batesville, Mississippi facility, and the specialized blending is usually done on each job site. Fyfe Co. also sells finished materials throughout the United States and worldwide to our affiliates and certain certified third-party applicators.
Product and material revenues for our Corrpro business are derived principally from the sale of products that are purchased from select outside vendors or from assembling components that are sourced from suppliers. We conduct light assembly for a number of our Corrpro products in our production facilities in Sand Springs, Oklahoma; Edmonton, Alberta, Canada; the United Kingdom; Dubai, United Arab Emirates; and Saudi Arabia. In addition, we manufacture our own line of rectifiers and other power supplies in Canada, the United Kingdom and Saudi Arabia. The primary products and raw materials used by our Corrpro businesses include zinc, aluminum, magnesium and other metallic anodes, as well as wire and cable. We maintain relationships with multiple vendors for these products and are not dependent on any single vendor to meet our supply needs.
The product and service revenues for our United Pipeline Systems business are derived primarily from the manufacturing and installation of polyethylene liners inside pipelines. The raw material used for these liners is extruded thermoplastic pipe. It has been our practice to purchase this material from a selective group of suppliers; however, we believe that it is readily
12
available from many other sources. We manufacture most of the proprietary equipment and many of the consumable items used in Tite Liner® system installations in our own facilities in Canada, the United States and Chile.
Product and service revenues for our Bayou and ACS businesses are derived principally from internal and external pipeline coating, lining, weighting and insulation. Facilities are located in New Iberia, Louisiana; Tulsa, Oklahoma; and Conroe, Texas. The primary raw materials used in the coating process include FBE, paint, concrete, iron ore, sand and gravel. Although our historical practice has been to purchase materials from a limited number of suppliers, we believe that the raw materials used in the coating process are typically available from multiple sources. However, in certain limited circumstances, our customer has required use of a specific material available from only a single source.
Our pricing of raw materials is subject to fluctuations in the underlying commodity prices. See “Commodity Risk” in Item 7A of this Report for detail on our management of the risks associated with such price fluctuations.
Patents and Proprietary Technologies
As of December 31, 2017, we held 30 United States patents relating to the Insituform® CIPP process. As of December 31, 2017, we had three pending United States patent applications relating to the Insituform® CIPP process.
We have obtained and are pursuing patent protection in our principal foreign markets covering various aspects of the Insituform® CIPP process. As of December 31, 2017, there were 97 issued foreign patents and utility models relating to the Insituform® CIPP processes, and 16 applications pending in foreign jurisdictions. Of the applications pending in foreign jurisdictions, one is a Patent Cooperation Treaty (“PCT”) application that covers most jurisdictions throughout the world. The specifications and/or rights granted in relation to each patent will vary from jurisdiction to jurisdiction. In addition, as a result of differences in the nature of the work performed and in the climate of the countries in which the work is carried out, we do not necessarily seek patent protection for all of our inventions in every jurisdiction in which we do business.
As of December 31, 2017, we held 15 United States patents and 22 foreign patents with regard to Fusible PVC® pipe products and fusion processes as well as other infrastructure technologies for water, wastewater and conduit applications that relate to our Fusible PVC® pipe lining business.
As of December 31, 2017, we held 15 issued patents and five pending patent applications in the United States and eight issued patents and 13 pending patent applications in foreign jurisdictions that relate to our Tyfo® system. Of these applications, one is a PCT application that covers multiple jurisdictions in Europe and throughout the world.
For our Corrosion Protection operations, as of December 31, 2017, we held nine issued patents and seven pending patent applications in the United States and ten issued patents and seven pending patent applications in foreign jurisdictions that relate to our cathodic protection and pipe coating businesses. As of December 31, 2017, we had four issued patents and one pending patent application in the United States, and six issued patents and seven pending patent applications in foreign jurisdictions that relate to the Tite Liner® process. Of the foreign applications, one is a European regional application which covers all of Europe. As of December 31, 2017, we have two pending patent applications in the United States, and two pending applications in foreign jurisdictions, that relate to our pipeline coatings process.
There can be no assurance that the validity of our patents will not be successfully challenged. Our business could be adversely affected by increased competition upon expiration of the patents or if one or more of our patents were adjudicated to be invalid or inadequate in scope to protect our operations. We believe in either case that our long experience with the proprietary processes, the strength of our trademarks and our degree of market penetration should enable us to continue to compete effectively in the pipeline rehabilitation, corrosion protection, energy, mining and infrastructure protection markets.
In some instances throughout each of our three platforms, we have elected to maintain certain internally developed technologies, know-how and inventions as trade secrets. We have entered into confidentiality agreements with employees, consultants and third parties to whom we disclose such trade secrets. Although there can be no assurance that these measures will suffice to prevent unauthorized disclosure or use or that third parties will not develop similar technologies, we believe it would take substantial time and resources to independently develop such technologies.
See “Risk Factors” in Item 1A of this Report for further discussion.
Competition
The markets in which we operate are highly competitive, primarily on the basis of price, quality of service and capacity to perform. Many of our products and services face direct competition from competitors offering similar or essentially equivalent products or services. In addition, customers can select a variety of methods to meet their infrastructure installation, strengthening and rehabilitation needs, as well as their coating and cathodic protection needs, including a number of methods that we do not offer.
In the trenchless wastewater rehabilitation market, the CIPP process is one of the preferred rehabilitation methods. Because relatively few significant barriers to entry exist in this market, any organization with adequate financial resources and
13
access to technical expertise may become a competitor. As such, there are numerous companies with which we compete. Worldwide, we compete with numerous smaller firms on local or regional levels and with several larger firms on the global and national levels. Despite the number of competitors, Insituform, as the worldwide pioneer of this technology, has maintained its role as a global market leader, both in the United States and abroad.
In water rehabilitation, dig-and-replace is still the preferred method for the majority of customers. Currently, we believe CIPP is utilized in less than 5% of water pipeline rehabilitation projects in the United States. Because this is a more specialized field, with more barriers to entry, including strict government mandates, we compete primarily with a handful of global and national specialty contractors.
Our Fusible PVC® products compete against other more-traditional products in the pressure pipe market, such as HDPE and restrained joint PVC pipe products.
In our infrastructure rehabilitation business, the FRP process competes against traditional methods of pipeline and structural retrofitting, but is gaining acceptance in the construction and retrofitting industries. With its proprietary technologies relating to both products and application, Fyfe Co. is a leader in the FRP market and Fibrwrap Construction, having successfully performed installations of FRP systems for 25 years, is one of the most experienced applicators of the Tyfo® system and has a well-established reputation. In this field, there are barriers to entry, including testing requirements, experience, intellectual property and certifications. Fyfe has teamed with a number of universities around the world to conduct extensive product testing. In addition, Fyfe has dedicated significant resources to obtaining technical market acceptance of its proprietary products. As a result, Fyfe has received a number of certifications, including NSF certification for its Tyfo® system; International Code Council - Evaluation Service Report (ESR-2103), indicating product approval by the International Building Code; and compliance with ICC-AC125 guidelines for FRP strengthening. Because of the barriers to entry, Fyfe Co. and Fibrwrap Construction tend to compete with a small number of companies on a regional or national level, most of which do not provide the full spectrum of services provided by Fyfe Co. and Fibrwrap Construction.
In our Corrosion Protection segment, Corrpro operates in the highly-competitive field of cathodic protection for corrosion control. While this market is highly competitive, because there are relatively few barriers to entry, Corrpro is a recognized market leader in North America in this field. Competitors include a limited number of large firms, which provide services nationally and, in some instances, globally, although more prevalent are a number of small- and medium-sized firms with more limited portfolios of products and services, which are only provided on a regional or local level. Corrpro’s competitive advantage is its broad depth of high-quality cathodic protection offerings, including its cost-effective engineering, pipeline integrity, construction and coating services, which are provided to customers worldwide. Through Hockway and our Corrpower joint venture, we are expanding our position as a leader in cathodic protection in the Middle East.
The process of utilizing thermoplastic liners is a prevalent method used to protect pipelines servicing the energy and mining industries. United Pipeline Systems is recognized as a leader in the thermoplastic market, having provided relining solutions on six continents. Due to barriers to entry arising from necessary technological capabilities, United Pipeline Systems mainly competes with a small number of specialty firms globally, nationally and regionally. Through our focused efforts on expanding our services worldwide, United Pipeline Systems enjoys significant name recognition and substantial market share in this industry in the key energy and mining regions of the world.
The FBE process is one of the standard methods for pipe coating. Bayou has a presence in the FBE and insulation coating market in the Gulf South of the United States. Because the pipe coating industry is very capital intensive, Bayou usually competes with a small number of global and national companies. However, Bayou also competes on a project-specific basis with small firms on local or regional jobs. These regional firms are often steel mills that have coatings plants on-site to provide for their coatings needs, but these firms will outsource their coatings services if projects are beyond their geographic reach. Competition from these regional firms on more than a project basis is unlikely as these firms tend to be restricted geographically due to their shipping limitations. In recent years, Bayou has achieved differentiation in certain pipe coating and insulation applications through the development of our deepwater pipe coating and insulation capabilities described above under “Technologies” and “Patents and Proprietary Technologies”.
ACS has a strong presence in the field of FBE coating and is an industry leader in both inner diameter robotic coatings and outer diameter coatings. Because of these specialized fields, ACS usually competes with a small number of specialty providers.
Our Energy Services segment operates in a fragmented and intensely competitive field of plant maintenance and construction and specialty services in the downstream oil refining industry, as well as performing work in the industrial and natural gas, gas processing and compression markets. Competitors may be local, regional or national contractors and service providers and vary with the markets that are served, with few competitors competing in all of the geographic markets we serve or offering all of the services we provide. With the implementation of the California Refinery Safety Law, competition at refineries in California is from building trade union contractors or, in some instances, from customers themselves expanding their own workforces to reduce reliance on contractors. Contracts are generally awarded based on safety performance, reputation for quality, price, schedule and client satisfaction.
14
There can be no assurance as to the success of our processes in competition with our competitors and alternative technologies for pipe installation and rehabilitation, coating, cathodic protection and infrastructure installation, strengthening and rehabilitation.
Seasonality
Our operations can be affected by seasonal variations and our results tend to be stronger in the second and third quarters of each year due to milder weather. We are more likely to be impacted by weather extremes, such as excessive rain, hurricanes or monsoons, snow and ice or frigid temperatures, which may cause temporary, short-term anomalies in our operational performance in certain localized geographic regions. However, these impacts usually have not been material to our operations as a whole. See “Risk Factors” in Item 1A of this Report for further discussion.
Employees
As of December 31, 2017, we had approximately 5,820 employees. Certain of our subsidiaries are parties to collective bargaining agreements that covered an aggregate of approximately 1,450 employees as of December 31, 2017. We generally consider our relations with our employees and unions to be good.
Insurance and Bonding
We are required to carry insurance and provide bonding in connection with certain projects and, accordingly, maintain comprehensive insurance policies, including workers’ compensation, general and automobile liability and property coverage. We believe that we presently maintain adequate insurance coverage for all operations. We have also arranged bonding capacity for bid, performance and payment bonds. Typically, the cost of a performance bond is less than 1% of the contract value. We are required to indemnify the surety companies against losses from third-party claims of customers and subcontractors. The indemnification obligations are collateralized by unperfected liens on our assets and the assets of those subsidiaries that are parties to the applicable indemnification agreement.
Government Regulation
We are required to comply with all applicable United States federal, state and local, and all applicable foreign statutes, regulations and ordinances. In addition, our installation and other operations have to comply with various relevant occupational safety and health regulations, transportation regulations, code specifications, permit and licensing requirements and bonding and insurance requirements, as well as with fire regulations relating to the storage, handling and transporting of flammable materials. Our manufacturing and coatings facilities, as well as our installation and other operations, are subject to federal and state environmental protection regulations, none of which presently have any material effect on our capital expenditures, earnings or competitive position in connection with our present business. However, although our installation and other operations have established monitoring programs and safety procedures, further restrictions could be imposed on the manner in which installation and other activities are conducted, on equipment used in installation and other activities, on volatile organic compounds and hazardous air pollutant emissions from our paintings and coatings processes and on the use of solvents or the thermosetting resins used in the Insituform® CIPP process.
The use of both thermoplastics and thermosetting resin materials in contact with drinking water is strictly regulated in most countries. In the United States, a consortium led by NSF International, under arrangements with the United States Environmental Protection Agency (“EPA”), establishes minimum requirements for the control of potential human health effects from substances added indirectly to water via contact with treatment, storage, transmission and distribution system components, by defining the maximum permissible concentration of materials that may be leached from such components into drinking water, and methods for testing them. Our lining and coating products for drinking water use are NSF/ANSI Standard 61 compliant, including the entire Tyfo® system, Insituform’s full range of water pipe lining products and our Fusible C-900® and Fusible C-905® products. In addition, our Tite Liner® HDPE system is certified to NSF/ANSI Standard 61. Corrpro’s corrosion control products are NSF/ANSI Standard 61 classified for drinking water systems and its cathodic protection solutions for water storage tanks and water treatment units are compliant with AWWA Standard D104 and NACE recommended practices. NSF assumes no liability for use of any products, and NSF’s arrangements with the EPA do not constitute the EPA’s endorsement of NSF, NSF’s policies or its standards. Dedicated equipment is needed in connection with use of these products in drinking water applications.
Item 1A. Risk Factors.
You should carefully consider the following risks and other information contained or incorporated by reference into this Report when evaluating our business and financial condition and an investment in our common stock. Should any of the following risks or uncertainties develop into actual events, such developments could have material adverse effects on our business, financial condition, cash flows and results of operations.
15
Our businesses face significant competition in the industries in which they operate.
Many of our products and services face direct competition from companies offering similar products or services. Competition can place downward pressure on our contract prices and profit margins. Intense competition is expected to continue in these markets. If we are unable to realize our objectives, we could lose market share to our competitors and experience an overall reduction in our profits.
In the water and wastewater rehabilitation portion of our Infrastructure Solutions segment, we face competition from companies providing similar products and services as well as companies providing other methods of rehabilitation that we do not offer, including traditional dig-and-replace, which is still the preferred method in the water rehabilitation market. In the trenchless wastewater rehabilitation market, CIPP is one of the preferred methods. In this market, few significant barriers to entry exist and, as a result, any organization that has the financial resources and access to technical expertise and bonding may become a competitor. As such, we compete with many smaller firms on a local or regional level and with several larger firms on the global and national levels. In water rehabilitation, where there are more significant barriers to entry because the market is strictly regulated, we compete with a smaller number of specialty contractors around the world. Further, our Fusible PVC® pipe products compete against other more traditional products, such as HDPE and restrained joint PVC pipe products.
In the infrastructure rehabilitation portion of our Infrastructure Solutions segment, the Tyfo® system competes against traditional methods of structural retrofitting. There are significant barriers to entry, including testing requirements, experience, intellectual property and certifications. In manufacturing, we only compete with a handful of FRP suppliers. However, with respect to installation, we compete with a number of FRP applicators. Our ability to grow revenues in this market could be adversely impacted if any of our competitors were to become fully-integrated like us or if new entrants in the market were to develop strong installation and manufacturing expertise.
In our Corrosion Protection platform, we compete primarily with a small number of global and national companies in the pipe coating industry, specialty firms in the pipeline protection industry, a limited number of large firms globally and a large number of smaller firms regionally in the cathodic protection industry. In addition, customers can select a variety of methods to meet their pipe installation, rehabilitation, coating and cathodic protection needs, including methods that we do not offer.
In our Energy Services platform, we compete with a limited number of local, regional and national companies in the oil and gas procurement, construction, maintenance, scaffolding and turnaround industries on the U.S. West Coast.
Our business depends upon the maintenance of our proprietary technologies and information.
We depend on our proprietary technologies and information, many of which are no longer subject to patent protection. We rely principally upon trade secret and copyright laws to protect our proprietary technologies. We regularly enter into confidentiality agreements with our key employees, customers, potential customers and other third parties and limit access to and distribution of our trade secrets and other proprietary information. However, these measures may not be adequate to prevent misappropriation of our technologies or to assure that our competitors will not independently develop technologies that are substantially equivalent or superior to our technologies. In addition, the laws of other countries in which we operate may not protect our proprietary rights to the same extent as the laws of the United States. We are also subject to the risk of adverse claims and litigation alleging infringement of intellectual property rights.
Our efforts to develop new products and services or enhance existing products and services involve substantial research, development and marketing expenses, and the resulting new or enhanced products or services may not generate sufficient revenues to justify such expenses.
Our future success will depend in part on our ability to anticipate and respond to changing technologies and customer requirements by enhancing our existing products and services. We will need to develop and introduce, on a timely and cost-effective basis, new products, features and services that address the needs of our customer base. As a result of these efforts, we may be required to expend substantial research, development and marketing resources, and the time and expense required to develop a new product or service or enhance an existing product or service are difficult to predict. We cannot assure that we will succeed in developing, introducing and marketing new products or services or product or service enhancements. In addition, we cannot be certain that any new or enhanced product or service will generate sufficient revenues to justify the expenses and resources devoted to this product development and enhancement effort.
Acquisitions and investments could result in operating difficulties, dilution and other harmful consequences that may adversely impact our business and results of operations.
Acquisitions are an element of our overall corporate strategy and use of capital, and these transactions could be material to our financial condition and results of operations. We expect to continue to evaluate and enter into discussions regarding a wide array of potential strategic transactions. The process of integrating an acquired company, business or technology has created, and will continue to create, unforeseen operating difficulties and expenditures. The areas where we face risks include:
16
• | Diversion of management time and focus from operating our business to acquisition integration challenges. |
• | Failure to successfully operate and further develop the acquired business or technology. |
• | Implementation or remediation of controls, procedures and policies at the acquired company. |
• | Integration of the acquired company’s accounting, human resource and other administrative systems, and coordination of product, engineering and sales and marketing functions. |
• | Transition of operations, users and customers onto our existing platforms. |
• | Failure to obtain required approvals on a timely basis, if at all, from governmental authorities, or conditions placed upon approval, under competition and antitrust laws which could, among other things, delay or prevent us from completing a transaction, or otherwise restrict our ability to realize the expected financial or strategic goals of an acquisition. |
• | In the case of foreign acquisitions, the need to integrate operations across different cultures and languages and to address the particular economic, currency, political and regulatory risks associated with specific countries. |
• | Cultural challenges associated with integrating employees from the acquired company into our organization, and retention of employees from the businesses we acquire. |
• | Liability for activities of the acquired company before the acquisition, including patent and trademark infringement claims, violations of laws, commercial disputes, tax liabilities and other known and unknown liabilities. |
• | Assumption of contracts with terms, including, without limitation, terms relating to liability, waiver of damages and indemnification, that are not in line with our normal contracting practices. |
• | Litigation or other claims in connection with the acquired company, including claims from terminated employees, customers, former stockholders or other third parties. |
Our failure to address these risks or other problems encountered in connection with our past or future acquisitions and investments could cause us to fail to realize the anticipated benefits of such acquisitions or investments, incur unanticipated liabilities, and harm our business generally.
Our acquisitions could also result in dilutive issuances of our equity securities, the incurrence of debt, the assumption of contingent liabilities, amortization expenses, impairment of goodwill and purchased long-lived assets and restructuring charges, any of which could harm our financial condition or results of operations. Also, the anticipated benefit of many of our acquisitions may not materialize for reasons separate and apart from the specific risks set forth above.
We may be liable to complete the work of our joint venture partners under our joint venture arrangements.
We enter into contractual joint ventures in order to develop joint bids on certain contracts. The success of these joint ventures depends largely on the satisfactory performance by our joint venture partners of their obligations with respect to the joint venture. Under these joint venture arrangements, we may be required to complete our joint venture partner’s portion of the contract if the joint venture partner is unable to complete its portion and a bond is not available. In such case, the additional obligations could result in reduced profits or, in some cases, significant losses for us.
Our backlog is an uncertain indicator of our future earnings.
Our backlog, which at December 31, 2017 was approximately $692.4 million, is subject to unexpected adjustments and cancellation. The revenues projected in this backlog may not be realized or, if realized, may not result in profits. We may be unable to complete some projects included in our backlog in the estimated time and, as a result, such projects could remain in backlog for extended periods of time. To the extent that we experience project cancellation or scope adjustments, we could face a reduction in the dollar amount of our backlog and the revenues that we actually receive from such backlog. In addition, one or more of our multi-year contracts have in the past and may in the future contribute a material portion of our backlog in any one year. The loss of business from any one of these significant customers could have a material adverse effect on our business or results of operations.
The preparation of our consolidated financial statements requires us to make estimates and judgments, which are subject to an inherent degree of uncertainty and which may differ from actual results.
Our consolidated financial statements are prepared in accordance with accounting principles generally accepted in the United States, which require us to make estimates and judgments that affect the reported amounts of assets, liabilities, revenues and expenses and related disclosure of contingent assets and liabilities. Some accounting policies require the application of significant judgment by management in selecting the appropriate assumptions for calculating financial estimates. By their nature, these estimates and judgments are subject to an inherent degree of uncertainty and actual results may differ from these
17
estimates and judgments under different assumptions or conditions, which may have an adverse effect on our financial condition or results of operations in subsequent periods.
Our use of the percentage-of-completion method of accounting could result in a reduction or reversal of previously recorded results.
We employ the percentage-of-completion method of accounting for our construction projects. This methodology recognizes revenues and profits over the life of a project based on costs incurred to date compared to total estimated project costs. Revisions to revenues and profits are made once amounts are known and can be reasonably estimated. Given the uncertainties associated with some of our contracts, it is possible for actual costs to vary from estimates previously made. Revisions to estimates could result in the reversal of revenues and gross profit previously recognized. For the year ended December 31, 2017, approximately 67% of our revenues were derived from percentage-of-completion accounting.
We may experience cost overruns on our projects.
We conduct a significant portion of our business under guaranteed maximum price or fixed price contracts, where we bear a significant portion of the risk for cost overruns. Under such contracts, prices are established in part on cost and scheduling estimates, which are based on a number of assumptions, including assumptions about future economic conditions, prices and availability of materials and other exigencies. Our profitability depends heavily on our ability to make accurate estimates. Inaccurate estimates, or changes in other circumstances, such as unanticipated technical problems, difficulties obtaining permits or approvals, changes in local laws or labor conditions, weather delays, cost of raw materials, currency fluctuations or our suppliers’ or subcontractors’ inability to perform could result in substantial losses, as such changes adversely affect the revenues and gross profit recognized on each project.
Our recognition of revenues from change orders, extra work or variations in the scope of work could be subject to reversal in future periods.
We recognize revenues from change orders, extra work or variations in the scope of work as set forth in our written contracts with our clients when management believes that realization of these revenues is probable and the recoverable amounts can be reasonably estimated. We also factor in all other information that we possess with respect to the change order to determine whether the change order should be recognized at all and, if recognition is appropriate, what dollar amount of the change order should be recognized. Due to factors that we may not anticipate at the time of recognition, however, revenues ultimately received on these change orders could be less than revenues that we recognized in a prior reporting period or periods, which could require us in subsequent reporting periods to reduce or reverse revenues and gross profit previously recognized.
We may incur significant costs in providing services in excess of original project scope without having an approved change order.
After commencement of a contract, we may perform, without the benefit of an approved change order from the customer, additional services requested by the customer that were not contemplated in our contract price for various reasons, including customer changes, incomplete or inaccurate engineering, changes in project specifications and other similar information provided to us by the customer. Our construction contracts generally require the customer to compensate us for additional work or expenses incurred under these circumstances.
A failure to obtain adequate compensation for these matters could require us to record in the current period an adjustment to revenues and profit recognized in prior periods under the percentage-of-completion accounting method. Any such adjustments, if substantial, could have a material adverse effect on our results of operations and financial condition, particularly for the period in which such adjustments are made. We can provide no assurance that we will be successful in obtaining, through negotiation, arbitration, litigation or otherwise, approved change orders in an amount adequate to compensate us for our additional work or expenses.
Cyclical downturns in the mining, oil and natural gas industries, including a substantial or extended decline in the price of mined minerals, oil or natural gas, or in the oil field, refinery and mining services businesses, may have a material adverse effect on our financial condition or results of operations.
The mining, oil and natural gas industries are highly cyclical. Demand for the majority of the oil field, refinery and mining products and services provided by our Corrosion Protection and Energy Services platforms are substantially dependent on the level of expenditures by the mining, oil and natural gas industries for the exploration, development and production of mined minerals, crude oil and natural gas reserves, which are sensitive to the prices of these commodities and generally dependent on the industry’s view of future mined mineral, oil and natural gas prices. The prices of these commodities can be volatile. There are numerous factors affecting the related industries and, thereby, the supply of, and demand for, our products and services, which include, but are not limited to:
• | market prices of mined minerals, oil and natural gas and expectations about future prices; |
• | cost of producing mined minerals, oil and natural gas; |
18
• | the level of mining, drilling and production activity; |
• | the discovery rate of new oil and gas reserves; |
• | mergers, consolidations and downsizing among our clients; |
• | coordination by the Organization of Petroleum Exporting Countries (OPEC); |
• | the output and willingness to export of certain oil-producing countries; |
• | the impact of commodity prices on the expenditure levels of our clients; |
• | financial condition of our client base and their ability to fund capital and maintenance expenditures; |
• | adverse weather conditions; |
• | political instability in oil-producing countries; |
• | tax incentives, including for alternative energy sources; |
• | domestic and worldwide economic conditions; |
• | weather conditions that can affect mining, oil or natural gas operations over a wide area; |
• | availability of energy sources other than oil and gas; |
• | level of consumption of minerals, oil, natural gas and petrochemicals by consumers, including the effects of increased regulation, conservation measures and technological advances affecting energy consumption; and |
• | availability of services and materials for our clients to grow their capital expenditures. |
As seen in the historic high volatility in crude oil prices and other energy commodities, prices for mined minerals, oil and natural gas are subject to periodic downturns and large fluctuations in response to relatively minor changes in supply and demand, market uncertainty and a variety of other factors (including those set forth above) that are beyond our control, and we expect such prices to continue to be volatile. Demand for the products and services we provide could decrease in the event of a sustained reduction in demand for mined minerals, oil or natural gas, while perceptions of long-term decline in the prices of mined materials, oil and natural gas by mining, oil and gas companies (some of our customers) can similarly reduce or defer major expenditures given the long-term nature of many large-scale projects or result in downward pressure on the prices we charge. As such, a significant downturn in the mining, oil and/or natural gas industries could result in a reduction in demand for our mining, oil field and refinery services and could adversely affect our operating results. Additionally, the volatility of such prices and the resulting effects are difficult to predict, which reduces our ability to anticipate and respond effectively to changing conditions.
Our operations could be adversely impacted by the continuing effects from the U.S. government regulations on offshore drilling projects.
In response to the Deepwater Horizon incident in the U.S. Gulf of Mexico in April 2010, the U.S. government implemented various new regulations intended to improve offshore drilling safety and environmental protection and increase liability for oil spills in the federal waters of the outer continental shelf. These new regulations increased the complexity of the drilling permit process and have delayed the receipt of drilling permits in both deepwater and shallow-water areas since the incident, although there has been an increase in the number of drilling permits issued and drilling activity is recovering.
While the current U.S. federal government administration may be considering amending offshore drilling regulations, we cannot be certain that the regulations will be amended, nor can we predict what the continuing effects from the U.S. government regulations on offshore deepwater drilling projects may have on offshore oil and gas exploration and development activity, or what actions may be taken by our customers in our Corrosion Protection segment or other industry participants in response to these regulations. This could reduce demand for our services, which could have an adverse impact on certain aspects of our business.
Our operations could be adversely impacted by the California Refinery Safety Law related to downstream work performed in California refineries.
Aegion Energy Services continues to face challenges with the impacts of the California Refinery Safety Law, which went into effect on January 1, 2014. The law introduced new requirements for refineries and outside contractors at covered facilities when construction, alteration, demolition, installation, repair or maintenance work is performed at the covered facility. The law imposes the following requirements:
• | all subject workers must be paid the applicable prevailing wage rate; |
• | all subject workers must be either “skilled journeymen” or “registered apprentices”; and |
• | at least 60% of skilled journeypersons on the project must be graduates of certified apprenticeship programs. |
19
The effect of the California Refinery Safety Law is to require the use of building trade union contractors or refinery owners or operators to perform the covered work.
These requirements only pertain to contracts entered into, extended or renewed after January 1, 2014. Contracts entered into, extended or renewed prior to that date generally will expire in 2018 across the industry. Aegion Energy Services currently has long-term contracts in place with many of its major downstream clients, which it is attempting to maintain through its building trade union entity. There are no assurances that customers will maintain their contracts with Aegion Energy Services, which could materially and adversely impact its revenues.
Federal and state legislative and regulatory initiatives as well as governmental reviews relating to hydraulic fracturing could result in increased costs and additional operating restrictions or delays that could adversely affect our Corrosion Protection customers.
Federal, state and local legislative and regulatory initiatives relating to hydraulic fracturing could result in increased costs and additional operating restrictions or delays in the production of oil and natural gas, including from the developing shale plays. Our Corrosion Protection segment services oil and gas companies in the shale plays and we foresee strong market opportunities here. A decline in drilling of new wells and related servicing activities caused by these initiatives could have an adverse effect on our business, financial position or results of operations.
The effects of the Tax Cuts and Jobs Act on our business have not yet been fully analyzed and could have an adverse effect on our business and financial condition.
Public Law No. 115-97, commonly referred to as the Tax Cuts and Jobs Act (the “TCJA”), was signed into law on December 22, 2017. The TCJA contains significant changes to corporate taxation, including reducing the corporate tax rate from 35% to 21%, limiting the tax deduction for interest expense to 30% of earnings (except for certain small businesses), limiting the deduction for net operating losses to 80% of current year taxable income and eliminating net operating loss carrybacks, one-time taxing of offshore earnings at reduced rates regardless of whether they are repatriated, eliminating U.S. tax on foreign earnings (subject to certain important exceptions), immediately deducting certain new investments instead of deducting depreciation expense over time, and modifying or repealing many business deductions and credits. Information regarding the impacts of the TCJA consists of preliminary estimates which are forward-looking statements, is based on our current calculations, as well our current interpretations, assumptions and expectations relating to TCJA, and is subject to change, possibly materially, as we continue to analyze the impact of the TCJA. The impacts of the legislation may differ from this estimate, possibly materially (and the amount of the impact on the Company may accordingly be adjusted over the course of 2018), due to guidance that may be issued, changes in interpretations and assumptions the Company has made, and actions the Company may take as a result of the TCJA. While we will continue to examine the impact the TCJA may have on our business, the overall impact of the TCJA is uncertain, and our business and financial condition could be adversely affected.
A general downturn in U.S. and global economic conditions, and specifically a downturn in the municipal bond market, may reduce our business prospects and decrease our revenues and cash flows.
Our business is affected by general economic conditions. Any extended weakness in the U.S. and global economies could reduce our business prospects and could cause decreases in our revenues and operating cash flows. Specifically, a downturn in the municipal bond market caused by an actual downgrade of monoline insurers could result in our municipal customers being required to spend municipal funds previously allocated to projects that would benefit our business to pay off outstanding bonds.
We conduct manufacturing, sales and distribution operations on a worldwide basis and are subject to a variety of risks associated with doing business outside the United States.
We maintain significant international operations, including operations in North America, Europe, Asia-Pacific, Australia, the Middle East, South America and Africa. For the years ended December 31, 2017, 2016 and 2015, approximately 24%, 24%, and 28%, respectively, of our revenues were derived from international operations. We expect a significant portion of our revenues and profits to come from international operations and joint ventures for the foreseeable future and to continue to grow over time.
As a result, we are subject to a number of risks and complications associated with international manufacturing, sales, services and other operations. These include:
• | difficulties in enforcing agreements, collecting receivables and resolving disputes through some foreign legal systems; |
• | foreign customers with longer payment cycles than customers in the United States; |
• | difficulties in enforcing intellectual property rights or weaker intellectual property right protections in some countries; |
• | tax rates in certain foreign countries that exceed those in the United States and foreign earnings subject to withholding requirements; |
20
• | tax laws that restrict our ability to use tax credits, offset gains or repatriate funds; |
• | tax laws that impose additional taxes on our operations, including the implementation of value added tax in certain countries in the Middle East; |
• | tariffs, exchange controls or other trade restrictions, including transfer pricing restrictions, when products produced in one country are sold to an affiliated entity in another country; |
• | abrupt changes in foreign government policies and regulations; |
• | unsettled political conditions; |
• | acts of terrorism or criminality; |
• | kidnapping of employees; |
• | nationalization or privatization of companies with which we do business; |
• | protectionist policies in certain foreign countries, including those in the Middle East, that disfavor foreign companies operating in such countries; |
• | forced negotiation or modification of contracts; |
• | increased governmental ownership and regulation of markets in which we operate; |
• | the financial instability of, and the related inability or unwillingness to timely pay for our services by, national oil companies and other foreign customers resulting from, and/or exacerbated by, depressed oil prices; |
• | hostility from local populations, particularly in the Middle East; |
• | tenuous, unstable or hostile relationships between countries that are interconnected in our operations; and |
• | difficulties associated with compliance with a variety of laws and regulations governing international trade, including the Foreign Corrupt Practices Act. |
To the extent that our international operations are affected by these unexpected and adverse foreign economic and political conditions, we may experience project disruptions and losses that could significantly reduce our revenues and profits.
Implementation and achievement of international growth objectives also may be impeded by political, social and economic uncertainties or unrest in countries in which we conduct operations or market or distribute our products. In addition, compliance with multiple, and potentially conflicting, international laws and regulations, import and export limitations, anti-corruption laws and exchange controls may be difficult, burdensome or expensive.
For example, we are subject to compliance with various laws and regulations, including the Foreign Corrupt Practices Act and similar anti-bribery laws, which generally prohibit companies and their intermediaries from making improper payments to officials for the purpose of obtaining or retaining business. While our employees and agents are required to comply with these laws, we cannot provide assurance that our internal policies, procedures and controls will always protect us from violations of these laws, despite our commitment to legal compliance and corporate ethics. The occurrence or allegation of these types of risks may adversely affect our business, performance, prospects, value, financial condition and results of operations.
Operational disruptions caused by political instability and conflict in the Middle East, South America, Africa and Asia could adversely impact our current operations and plans of expansion in these regions.
Our Corrosion Protection segment currently operates in the Middle East, South America and Africa, and our Infrastructure Solutions segment currently operates in Asia. Both segments continue to focus efforts on expansion in these regions. Political instability and social unrest in the Middle East, South America, Africa and Asia, as well as the potential for catastrophic events such as abrupt political change, terrorist acts and conflicts or wars in these and other regions may cause damage or disruption to the economy, financial markets and our current and prospective customers in the these regions. Political instability, conflicts and the potential for catastrophic events have contributed to, and will likely continue to contribute to, volatility in these regions, which could adversely affect our operations and operating results.
As a result of our operations and plans of expansion in the these regions, we are also exposed to certain other uncertainties not generally encountered in our U.S. operations, including those detailed in the risks detailed in the risk factor immediately above.
Business operations could be adversely affected by terrorism.
The threat of, or actual acts of, terrorism may affect our operations around the world in unpredictable ways and may force an increase in security measures and cause disruptions in supplies and markets. If any of our facilities, including our manufacturing facilities, or if any of the projects we are working on, particularly in the energy and mining sector, were to be a direct target, or an indirect casualty, of an act of terrorism, our operations could be adversely affected. Corresponding instability in the financial markets as a result of terrorism also could adversely affect our ability to raise capital.
21
International trade tariffs and restrictions in the steel market may adversely affect our Bayou business.
The business of our subsidiary, Bayou, is heavily dependent on providing products and services to customers that import steel pipe into the United States from the international markets. To the extent that trade tariffs and other restrictions imposed by the United States increase the price of, or limit the amount of, steel pipe imported into the United States, the demand from Bayou’s customers for Bayou’s products and services will be diminished, which will adversely affect Bayou’s revenues and profitability.
We have international operations that are subject to foreign economic uncertainties and foreign currency fluctuation.
Global financial and credit markets have been, and continue to be, unstable and unpredictable. For example, the June 2016 referendum by British voters to exit the European Union (commonly referred to as “Brexit”) has created significant uncertainties affecting the economy and business operations, including our operations, in the United Kingdom and the European Union. While the United Kingdom is currently scheduled to depart the European Union on March 29, 2019, the terms of Brexit have not yet been confirmed, and as such, it is difficult to predict the effect of Brexit on our Company and our operations in the United Kingdom, including our operations in Northern Ireland and the Republic of Ireland, our manufacturing facility in Wellingborough, United Kingdom, which distributes liners to the European Union and elsewhere, and our manufacturing facility in Stockton-on-Tees, United Kingdom, which manufactures and distributes cathodic protection equipment world wide. Brexit could, among other things, affect the legal and regulatory schemes to which our operations in the United Kingdom are subject, adversely affect trade between the United Kingdom and the European Union and continue to cause economic uncertainty. The instability of the markets and weakness of the economy could affect the demand for our services, the financial strength of our customers and suppliers, their ability or willingness to do business with us, our willingness to do business with them, and/or our suppliers’ and customers’ ability to fulfill their obligations to us and/or the ability of us, our customers or our suppliers to obtain credit. These factors could adversely affect our operations, earnings and financial condition.
A significant portion of our contracts and revenues are denominated in foreign currencies, which may result in additional risk of fluctuating currency values and exchange rates, hard currency shortages and controls on currency exchange. Changes in the value of foreign currencies could increase our U.S. dollar costs for, or reduce our U.S. dollar revenues from, our foreign operations. Any increased costs or reduced revenues as a result of foreign currency fluctuations could affect our profits. For example, if there is another significant strengthening of the U.S. dollar compared to the Euro, the Canadian dollar or the Australian dollar, it may adversely affect our operating results and financial condition.
An inability to attract and retain qualified personnel, and in particular, engineers, estimators, project managers, line workers, skilled craft workers and other experienced professionals, could impact our ability to perform on our contracts, which could harm our business and impair our future revenues and profitability.
Our ability to attract and retain qualified engineers, estimators, project managers, line workers, skilled craft workers and other experienced professionals in accordance with our needs is an important factor in our ability to maintain profitability and grow our business. The market for these professionals is competitive, particularly during periods of economic growth when the supply is limited. We cannot provide any assurance that we will be successful in our efforts to retain or attract qualified personnel when needed. Therefore, when we anticipate or experience growing demand for our services, we may incur additional cost to maintain a professional staff in excess of our current contract needs in an effort to have sufficient qualified personnel available to address this anticipated demand. If we do incur additional compensation and benefit costs, our customer contracts may not allow us to pass through these costs.
Competent and experienced engineers, project managers and craft workers are especially critical to the profitable performance of our contracts, particularly on our fixed-price contracts where superior design or execution of the project can result in profits greater than originally estimated or where inferior design or project execution can reduce or eliminate estimated profits or even result in a loss. Our project managers are involved in most aspects of contracting and contract execution including:
• | supervising the bidding process, including providing estimates of significant cost components, such as material and equipment needs, and the size, productivity and composition of the workforce; |
• | negotiating contracts; |
• | supervising project performance, including performance by our employees, subcontractors and other third-party suppliers and vendors; |
• | estimating costs for completion of contracts that is used to estimate amounts that can be reported as revenues and earnings on the contract under the percentage-of-completion method of accounting; |
• | negotiating requests for change orders and the final terms of approved change orders; and |
• | determining and documenting claims by us for increased costs incurred due to the failure of customers, subcontractors and other third-party suppliers of equipment and materials to perform on a timely basis and in |
22
accordance with contract terms.
The California Refinery Safety Law, which requires owners and operators to use only building trade union contractors for covered work at the refineries (if not self-performed), has the potential to reduce the entire labor pool for refinery maintenance in California by: (i) eliminating the non-union workforce; and (ii) requiring the use of the same workforce that also performs public works and general construction in California. This could adversely affect staffing for large turnaround projects at California refineries. This could also adversely affect Energy Services’ ability to support turnaround and project work outside California, due to its past reliance on its mobile California workforce to staff short term projects throughout the West Coast. There will be a significant wage differential between high union wages in California and wages in other states on the West Coast, creating a large disincentive for the California workforce to leave the state. All of the uncertainty created by this industry workforce change has the potential to negatively impact the entire West Coast refinery labor market, which in turn would negatively impact our revenues, profits and operations.
In addition, we use a multi-level sales force structured around target markets and key accounts, focusing on marketing our products and services to engineers, consultants, administrators, technical staff and elected officials. We are dependent on our personnel to continue to develop improvements to our proprietary processes, including materials used and the methods of manufacturing, installing, strengthening, coating and cathodic protection and we require quality field personnel to effectively and profitably perform our work. Our success in attracting and retaining qualified personnel is dependent on the resources available in individual geographic areas and the impact on the labor supply of general economic conditions, as well as our ability to provide a competitive compensation package and work environment. Our failure to attract, train, integrate, engage and retain qualified personnel could have a significant effect on our financial condition and results of operations.
Our profitability could be negatively impacted if we are not able to maintain appropriate utilization of our workforce.
The extent to which we utilize our workforce affects our profitability. If we under utilize our workforce, our project gross margins and overall profitability suffer in the short term. If we over utilize our workforce, we may negatively impact safety, employee satisfaction and project execution, which could result in an increase in injuries to our employees and a decline of future project awards. The utilization of our workforce is impacted by numerous factors including:
• | our estimate of the headcount requirements for various units based on our forecast of the demand for our products and services; |
• | our ability to maintain our talent base and manage attrition; |
• | our ability to schedule our portfolio of projects to efficiently utilize our employees and minimize downtime between project assignments; and |
• | our need to invest time and resources into functions such as training, business development, employee recruiting, and sales that are not chargeable to customer projects. |
Our business may be adversely impacted by work stoppages, staffing shortages and other labor matters.
As of December 31, 2017, our Aegion Energy Services business had approximately 1,300 employees that were represented by unions, although these numbers are constantly changing as customer demands change. Infrastructure Solutions has approximately 150 employees represented by unions. Although we believe that our relations with our employees and the unions are good, no assurances can be made that we will not experience these and other types of conflicts with labor unions, works councils, other groups representing employees, or our employees in general, especially in the context of any future negotiations with our labor unions. We can also make no assurance that future negotiations with our labor unions will not result in a significant increase in the cost of labor. Approximately one-third of our Energy Services union employees currently participate in twenty-nine multi-employer benefit plans, which may increase in the future if more clients transition to using our building trade union contracting entity. Participation in multi-employer benefit plans may result in liability to Aegion Energy Services in excess of that directly attributable to employees of Aegion Energy Services.
Additionally, the employees of some of our customers are unionized, especially the customers of our Aegion Energy Services business. Any strikes, work stoppages or other labor matters experienced by our customers may impact our ability to work on projects and, as a result, have an adverse effect on our financial condition and results of operations.
The revenues from the water and wastewater portion of our Infrastructure Solutions platform are substantially dependent on municipal government spending.
Many of our customers are municipal governmental agencies and, as such, we are dependent on municipal spending. Spending by our municipal customers can be affected by local political circumstances, budgetary constraints and other factors. Consequently, future municipal spending may not be allocated to projects that would benefit our business or may not be allocated in the amounts or for the size of the projects that we anticipated. A decrease in municipal spending on such projects would adversely impact our revenues, results of operations and cash flows.
23
The loss of one or more of our significant customers could adversely affect us.
One or more customers have in the past and may in the future contribute a material portion of our revenues in any one year. Because these significant customers generally contract with us for specific projects or for specific periods of time, we may lose these customers from year to year as the projects or maintenance contracts are completed. The loss of business from any one of these customers could have a material adverse effect on our business or results of operations.
The execution of our growth strategy is dependent upon the continued availability of third-party financing arrangements for our customers.
Tighter credit markets could adversely affect our customers’ ability to secure the financing necessary to proceed or continue with pipe or other infrastructure installation, rehabilitation, strengthening, coating and cathodic protection projects. Our customers’ or potential customers’ inability to secure financing for projects could result in the delay, cancellation or downsizing of new projects or the suspension of projects already under contract, which could cause a decline in the demand for our services and negatively impact our revenues and earnings.
A substantial portion of our raw materials is from a limited number of vendors, and we are subject to market fluctuations in the prices of certain commodities.
The primary products and raw materials used by our Corrpro operations include zinc, aluminum, magnesium and other metallic anodes, as well as wire and cable. We believe that Corrpro has multiple sources available for these raw materials and is not dependent on any single vendor to meet its supply needs. However, the prices of these raw materials have historically been affected by the prices of energy, petroleum, steel and other commodities, tariffs and duties on imported materials and foreign currency and exchange rates. A significant increase in the prices of these raw materials could adversely affect our results of operations.
We purchase the majority of our fiber requirements for Insituform® tube manufacturing from two sources. We believe, however, that alternate sources are readily available, and we continue to negotiate with other supply sources. The manufacture of the Insituform® tubes used in our water and wastewater pipeline rehabilitation business is dependent upon the availability of resin, a petroleum-based product. We currently have qualified four resin suppliers from which we intend to purchase the majority of our resin requirements for our North American operations. For our European operations, we currently have qualified six resin suppliers, and we currently have qualified six resin suppliers for our Asia-Pacific operations. We believe that these and other sources of resin supply are readily available. Historically, resin prices have fluctuated on the basis of the prevailing prices of its inputs, including styrene and oil. We anticipate that prices will continue to be heavily influenced by the events affecting these inputs, including the oil market. If there is a shortage or contraction of fiber or resin suppliers or if the price of fiber or resin increase, it could have an adverse effect on our results of operations.
The primary products and raw materials used by the infrastructure rehabilitation portion of our Infrastructure Solutions segment in the manufacture of FRP composite systems are carbon, glass, resins, fabric and epoxy raw materials. Carbon and epoxies are the largest materials purchased, which are currently purchased through a select group of suppliers, although we believe these and the other materials are available from a number of vendors. The price of epoxy historically is affected by the price of oil. In addition, a number of factors such as worldwide demand, labor costs, energy costs, import duties and other trade restrictions may influence the price of these raw materials. An increase in the price of these raw materials may have an adverse effect on our operations. Further, because we utilize a limited number of extruders to toll manufacture our Fusible PVC® pipe products, we could be adversely affected if one or more of these extruders is unable to continue to toll manufacture our Fusible PVC® pipe products.
We also purchase a significant volume of fuel to operate our trucks and equipment. At present, we do not engage in any type of hedging activities to mitigate the risks of fluctuating market prices for oil or fuel. A significant increase in the price of oil could cause an adverse effect on our cost structure that we may not be able to recover from our customers.
Extreme weather conditions may adversely affect our operations.
We are likely to be impacted by weather extremes, such as excessive rain or hurricanes, tornadoes, typhoons, snow and ice or frigid temperatures, which may cause temporary, short-term anomalies in our operational performance in certain localized geographic regions. Our Infrastructure Solutions segment is particularly sensitive to weather extremes. Delays and other weather impacts could adversely affect our ability to meet project deadlines and may increase a project’s cost and decrease its profitability.
Certain of our facilities are located in regions that may be affected by natural disasters.
Certain of our Bayou facilities are located on the Gulf Coast in Louisiana. We also have facilities near Houston, Texas, and in Florida. These regions are subject to increased hurricane activity that can result in substantial flooding. Our Aegion Energy Services business serves large oil and gas customers in California and is headquartered in Irvine, California with operations
24
near major earthquake faults throughout California. Furthermore, our Infrastructure Solutions segment has substantial operations in California near major earthquake faults. Our Bayou facilities have in the past experienced damage due to winds and floods, while our facilities in these other locations have experienced minimal damages from recent natural disasters. Although we maintain loss insurance where necessary, a hurricane, earthquake or other natural disaster could result in significant damage to our facilities, destruction or disruption of our critical business or information technology systems, recovery costs and interruption to certain of our operations. In addition, a catastrophic event could interrupt operations of our customers and suppliers, which could result in delays or cancellation of customer orders, the loss of customers, and impediments to the manufacture or shipment of products, which could result in loss of business or an increase in expense, both of which may have a material adverse effect on our business.
The actual timing, costs and benefits of the 2017 Restructuring may differ from those currently expected, which may reduce our operating results.
On July 28, 2017, we announced the 2017 Restructuring, which is intended to reduce the Company’s consolidated annual expenses by more than $20 million. We completed a majority of the 2017 Restructuring during 2017 and will substantially complete the 2017 Restructuring during 2018. See Notes 1 and 3 to the consolidated financial statements contained in this report for additional information and disclosures regarding our restructuring activities.
The 2017 Restructuring is subject to various risks, which could result in the actual timing, costs and benefits of the plan differing from those currently anticipated. These risks and uncertainties include, among others, that: (i) we may not be able to implement the 2017 Restructuring in the timeframe currently planned; (ii) our costs related to the 2017 Restructuring may be higher than currently estimated; (iii) the expected annual expense reductions may be less than currently estimated; and (iv) unanticipated disruptions to our operations may result in additional costs being incurred. We also cannot provide assurance that we will not undertake additional restructuring activities in the future. Because of these and other factors, we cannot predict whether we will realize the purpose and anticipated benefits of the 2017 Restructuring, and if we do not, our business and results of operations may be adversely impacted.
Additionally, the 2017 Restructuring may yield unintended consequences, such as:
• | actual or perceived disruption of service or reduction in service standards to customers; |
• | the failure to preserve supplier relationships and distribution, sales and other important relationships and to resolve conflicts that may arise; |
• | attrition beyond our intended reduction in headcount and reduced employee morale, which may cause our employees who were not affected by the 2017 Restructuring to seek alternate employment; |
• | increased risk of employment litigation; and |
• | diversion of management attention from ongoing business activities. |
We may face significant challenges in our plans to divest The Bayou Companies, LLC and Bayou Wasco Insulation, LLC.
On July 28, 2017, we initiated actions to divest Bayou, our pipe coating and insulation businesses in Louisiana. Divestitures pose risks and challenges that could negatively impact our business, including required separation or carve-out activities, disputes with buyers and unexpected costs. The uncertainty resulting from our announced plans to divest Bayou could cause significant disruption to the Bayou businesses. Our management’s attention to our ongoing operations may be diverted by efforts to divest Bayou. There are significant risks and uncertainties in the sales process, including the timing and uncertainty of completion of any transaction and the fulfillment of closing conditions, some of which may be outside of our control. Any significant delay in the completion of this divestiture, or the failure to complete the divestiture, may negatively impact our ability to implement new strategic plans, or achieve our previously announced strategic plans. We may also dispose of a business at a price or on terms that are less favorable, or at a higher cost, than we had previously anticipated, which may result in impairment charges or losses on disposal. If we reach an agreement with a buyer for the disposition of a business, we might be subject to satisfaction of pre-closing conditions, as well as necessary regulatory and governmental approvals on acceptable terms, which may prevent us from completing a transaction. Dispositions may also involve continued financial involvement, as we may be required to retain responsibility for, or agree to indemnify a buyer against, contingent liabilities related to businesses sold, such as lawsuits, tax liabilities, lease payments, product liability claims or environmental matters. Under these types of arrangements, performance by the divested businesses or other conditions outside of our control could affect future financial results.
We may from time to time undertake internal reorganizations that may adversely impact our business and results of operations.
From time to time, including in 2018, in an effort to simplify our organizational structure and streamline our operations or for other operational reasons, we may undertake certain internal reorganizations that may involve, among other things, the
25
combination or dissolution of certain of our existing subsidiaries, the creation of new subsidiaries and business divisions and the settlement of historical inter-company transactions. Additionally, as a result of the enactment of the TCJA and its effect on the taxation of offshore earnings, in connection with these actions or our operations generally, we may determine to repatriate certain earnings from our international subsidiaries, which earnings were previously permanently reinvested in such subsidiaries’ operations. In undertaking such actions, we consider, among other things, the alignment of our corporate structure with our organizational objectives, the operational and tax efficiency of our corporate structure and the long-term cash flow needs of our business. These efforts may not result in the intended or expected benefits, may result in disruptions to our business and may cause the Company to incur additional expenses or tax liabilities. Accordingly, such actions may adversely impact our business and results of operations.
Changes in the industries within which we operate and market conditions could lead to charges related to discontinuances of certain of our businesses, asset impairment, workforce reductions or restructurings.
In response to changes in industry and market conditions, we may be required to strategically realign our resources and to consider restructuring, disposing of or otherwise exiting businesses. Any resource realignment, or decision to limit investment in or dispose of or otherwise exit businesses, may result in the recording of special charges, such as asset write-offs, workforce reductions, restructuring costs or charges relating to consolidation of excess facilities or businesses. Our estimates with respect to the useful life or ultimate recoverability of our carrying basis of assets, including purchased intangible assets, could change as a result of such assessments and decisions. Further, our estimates relating to the liabilities for excess facilities are affected by changes in real estate market conditions.
We may incur further impairments to goodwill or long-lived assets.
We review our long-lived assets, including goodwill and other intangible assets, for impairment annually or whenever events or changes in circumstances indicate that the carrying amount of these assets may not be recoverable. The valuation of goodwill and other intangible assets requires assumptions and estimates of many critical factors, including revenue and market growth, operating cash flows, market multiples and discount rates. Negative industry or economic trends, including reduced market prices of our common stock, reduced estimates of future cash flows, disruptions to our business, slower growth rates, or lack of growth in our relevant businesses, could lead to further impairment charges against our long-lived assets, including goodwill and other intangible assets. If, in any period, our stock price decreases to the point where our fair value, as determined by our market capitalization, is less than the book value of our assets for an extended period of time, this could also indicate a potential impairment, and we may be required to record an impairment charge in that period, which could adversely affect our results of operations.
We may be subject to information technology system failures, network disruptions, cybersecurity attacks and breaches in data security, which could disrupt our operations and could result in a loss of assets.
In the ordinary course of our business, we collect and store sensitive data, including intellectual property, our proprietary business information, and personally identifiable information of our customers and employees, in our data centers and on our networks. The secure processing, maintenance and transmission of this information is critical to our operations. Despite our security measures, our information technology and infrastructure may be vulnerable to attacks by hackers or breached due to employee error, malfeasance or other disruptions. Any such breach could compromise our networks and the information stored there could be accessed, publicly disclosed, lost or stolen. Any such access, disclosure or other loss of information could result in legal claims or proceedings, liability under laws that protect the privacy of personal information, and regulatory penalties, and damage our reputation, which could adversely affect our business/operating margins, revenues and competitive position. The secure processing, maintenance, and transmission of this information is critical to our operations, and we devote significant resources to protecting our information. We maintain cyber risk insurance, but this insurance may not be sufficient to cover all of our losses from any breaches of our systems.
To improve the effectiveness of our operations and to interface with our customers and suppliers, we use our suppliers’ or vendors’ information technology systems to submit and process invoices and payments. The failures of these systems could disrupt our operations by causing transaction errors, processing inefficiencies, delays or cancellation of customer orders, impediments to the manufacture or shipment of products and other business disruptions. These events could lead to financial losses from loss of business or an increase in expense, all of which may have a material adverse effect on our business.
Increasing regulatory focus on privacy issues and expanding laws could expose us to increased liability.
In May 2018, the European Union’s new General Data Protection Regulation will replace the existing European Union Data Protection Directive, and it will have a significant impact on how businesses can collect and process the personal data of European Union individuals, including the requirement for business to self-report personal data breaches to the relevant supervisory authority and, under certain circumstances, to the affected data subjects, and provide additional rights to individuals whose data is processed. Penalties for non-compliance are also significantly higher under the new law, with the maximum fine being the higher of €20 million or 4% of global turnover for the preceding year. More than 5% of our workforce as of
26
December 31, 2017 was employed in the European Union. In addition, numerous proposals regarding privacy and data protection are pending before U.S. and non-U.S. legislative and regulatory bodies. Despite our commitment to complying with applicable laws, actual or alleged violations of these laws could result in legal claims or proceedings and regulatory penalties, which could disrupt our business, distract our employees and negatively impact our reputation as well as our results of operations.
We are subject to a number of restrictive debt covenants under our credit facility.
In October 2015, the Company amended and restated its $650.0 million senior secured credit facility (as amended, the “Credit Facility”) with a syndicate of banks. Our Credit Facility contains certain restrictive covenants, which restrict our ability to, among other things, incur additional indebtedness, incur certain liens on our assets or sell assets, make investments and make other restricted payments. Our Credit Facility also requires us to maintain specified financial ratios under certain conditions and satisfy financial condition tests. Our ability to meet those financial ratios and tests and otherwise comply with our financial covenants may be affected by the factors described in this “Risk Factors” section of this Report and other factors outside our control, and we may not be able to continue to meet those ratios, tests and covenants. Our ability to generate sufficient cash from operations to meet our debt obligations will depend upon our future operating performance, which will be affected by general economic, financial, competitive, business and other factors beyond our control. A breach of any of these covenants, ratios, tests or restrictions, as applicable, or any inability to pay interest on, or principal of, our outstanding debt as it becomes due could result in an event of default. Upon an event of default, if not waived by our lenders, our lenders may declare all amounts outstanding as due and payable.
At December 31, 2017, we were in compliance with all of our debt covenants as required under the Credit Facility. If we are unable to comply with the restrictive covenants in the future, we would be required to obtain amendments or waivers from our lenders or secure another source of financing. If our current lenders accelerate the maturity of our indebtedness, we may not have sufficient capital available at that time to pay the amounts due to our lenders on a timely basis. In addition, these restrictive covenants may prevent us from engaging in transactions that benefit us, including responding to changing business and economic conditions and taking advantage of attractive business opportunities.
We occasionally access the financial markets to finance a portion of our working capital requirements and support our liquidity needs. Our ability to access these markets may be adversely affected by factors beyond our control and could negatively impact our ability to finance our operations, meet certain obligations or implement our operating strategy.
We occasionally borrow under our existing credit facility to fund operations, including working capital investments. Market disruptions such as those experienced in the United States and abroad in the past few years have materially impacted liquidity in the credit and debt markets, making financing terms for borrowers less attractive and, in certain cases, resulting in the unavailability of certain types of financing. Uncertainty in the financial markets may negatively impact our ability to access additional financing or to refinance our existing credit facility or existing debt arrangements on favorable terms or at all, which could negatively affect our ability to fund current and future expansion as well as future acquisitions and development. These disruptions may include turmoil in the financial services industry, volatility in the markets where our outstanding securities trade and general economic downturns in the areas where we do business. If we are unable to access funds at competitive rates, or if our short-term or long-term borrowing costs increase, our ability to finance our operations, meet our short-term obligations and implement our operating strategy could be adversely affected.
As a holding company, Aegion depends on its operating subsidiaries to meet its financial obligations.
Aegion Corporation is a holding company with no significant operating assets. Our subsidiaries conduct all of our operations and own substantially all of our assets. Our cash flow and our ability to meet our obligations depends on the cash flow of our subsidiaries. In addition, the payments of funds in the form of dividends, intercompany payments, tax sharing payments and other forms may be subject to restrictions under the laws of the states and countries in which we operate.
The market price of our common stock is highly volatile and may result in investors selling shares of our common stock at a loss.
The trading price of our common stock is highly volatile and subject to wide fluctuations in price in response to various factors, many of which are beyond our control, including:
• | actual or anticipated variations in quarterly operating results; |
• | changes in financial estimates by securities analysts that cover our stock or our failure to meet these estimates; |
• | conditions or trends in the U.S. wastewater rehabilitation market; |
• | conditions or trends in mined materials, oil and natural gas markets; |
• | changes in municipal and corporate spending practices; |
• | a downturn of the municipal bond market or lending markets generally; |
27
• | changes in the federal or state governments that impact regulation and spending regarding energy and infrastructure; |
• | changes in market valuations of other companies operating in our industries; |
• | announcements by us or our competitors of a significant acquisition or divestiture; and |
• | additions or departures of key personnel. |
In addition, the stock market in general and The Nasdaq Global Select Market in particular have experienced extreme price and volume fluctuations that may be unrelated or disproportionate to the operating performance of listed companies. Industry factors may seriously harm the market price of our common stock, regardless of our operating performance. Such stock price volatility could result in investors selling shares of our common stock at a loss.
Future sales of our common stock or equity-linked securities in the public market could adversely affect the trading price of our common stock and our ability to raise funds in new stock offerings.
Sales of substantial numbers of additional shares of our common stock or any shares of our preferred stock, including sales of shares in connection with any future acquisitions, or the perception that such sales could occur, may have a harmful effect on prevailing market prices for our common stock and our ability to raise additional capital in the financial markets at a time and price favorable to us. We may issue equity securities in the future for a number of reasons, including to finance our operations and business strategy, to adjust our ratio of debt to equity, to satisfy obligations upon exercise of outstanding warrants or options or for other reasons. Our certificate of incorporation provides that we have authority to issue 125,000,000 shares of common stock. As of December 31, 2017, 32,462,542 shares of common stock were issued and outstanding.
Provisions in our certificate of incorporation could make it more difficult for a third party to acquire us or could adversely affect the rights of holders of our common stock or the market price of our common stock.
Our certificate of incorporation provides that our board of directors has the authority, without any action of our stockholders, to issue up to 2,000,000 shares of preferred stock. Preferred stock may be issued upon such terms and with such designations as our board of directors may fix in its discretion, including with respect to: (i) the payment of dividends upon our liquidation, dissolution or winding up; (ii) voting rights that dilute the voting power of our common stock; (iii) dividend rates; (iv) redemption or conversion rights; (v) liquidation preferences; or (vi) voting rights.
In addition, our certificate of incorporation provides that subject to the rights of the holders of any class or series of preferred stock set forth in our certificate of incorporation, the certificate of designation relating to such class or series of preferred stock, or as otherwise required by law, any stockholder action may be taken only at a meeting of stockholders and may not be effected by any written consent by such stockholders. The affirmative vote of the holders of at least 80% of the capital stock entitled to vote for the election of directors is required to amend, repeal or adopt any provision inconsistent with such arrangement.
These provisions could potentially be used to discourage attempts by others to obtain control of our company through merger, tender offer, proxy, consent or otherwise by making such attempts more difficult or more costly, even if the offer may be considered beneficial by our stockholders. These provisions also may make it more difficult for stockholders to take action opposed by our board of directors or otherwise adversely affect the rights of holders of our common stock or the market price of our common stock.
Our amended and restated by-laws designate the state courts of Delaware or, if no such state court has jurisdiction, the federal court for the District of Delaware, as the sole and exclusive forum for certain types of claims that may be initiated by our stockholders, which could discourage lawsuits against Aegion and Aegion’s directors and officers.
Our amended and restated by-laws provide that, unless waived by Aegion, the state courts of the State of Delaware or, if no state court located in the State of Delaware has jurisdiction, the federal court for the District of Delaware, will be the sole and exclusive forum for any claims brought by a stockholder (including a beneficial owner) (i) that are based upon a violation of a duty by a current or former director, officer or stockholder in such capacity or (ii) as to which the Delaware General Corporation Law confers jurisdiction upon the Delaware Court of Chancery. This exclusive forum provision may limit the ability of our stockholders to bring a claim in a judicial forum that such stockholders find favorable for disputes with Aegion or Aegion’s directors or officers, which may discourage such lawsuits against Aegion and Aegion’s directors and officers. Alternatively, if a court outside of Delaware were to find this exclusive forum provision inapplicable to, or unenforceable in respect of, one or more of the specified types of actions or proceedings described above, we could incur additional costs associated with resolving such matters in other jurisdictions, which could adversely affect our business, financial condition or results of operations.
We do not intend to pay cash dividends on our common stock in the foreseeable future.
We do not anticipate paying cash dividends on our common stock in the foreseeable future. Our present policy is to retain earnings to provide for the operation and expansion of our business or for the repurchase of shares of our common stock. Any
28
payment of cash dividends will depend upon our earnings, financial condition, cash flows, financing agreements and other factors deemed relevant by our board of directors. Furthermore, under the terms of certain debt arrangements to which we are a party, we are subject to certain limitations on paying dividends. However, we carefully review this policy regularly and could initiate dividends in the future depending on appropriate circumstances.
Item 1B. Unresolved Staff Comments.
None.
Item 2. Properties.
We own our executive offices located in Chesterfield, Missouri, a suburb of St. Louis, at 17988 Edison Avenue. We also own our research and development and training facilities in Chesterfield.
Insituform Technologies, LCC owns a liner manufacturing facility and a contiguous felt manufacturing facility in Batesville, Mississippi. Insituform Linings Limited, our United Kingdom manufacturing company, owns certain premises in Wellingborough, United Kingdom, where its felt liner manufacturing facility is located and leases a facility for its glass liner manufacturing.
Underground Solutions, our wholly-owned subsidiary, leases office and warehouse space in California and Pennsylvania, and also leases pipe storage space in North Dakota and South Carolina.
Fyfe Co., our wholly-owned subsidiary, leases an office in San Diego, California.
Corrpro, our wholly-owned subsidiary, owns certain office and warehouse space in Medina, Ohio as well as a manufacturing and warehouse facility in Sands Springs, Oklahoma. Its subsidiary, Corrpro Canada, Inc., also owns certain premises in Edmonton, Alberta, Canada used for office and warehouse space. In addition, our Corrpro subsidiary in the United Kingdom, Corrpro Companies Europe Ltd., owns an office and production facility in Stockton-on-Tees, United Kingdom.
Our wholly-owned subsidiary, United Pipeline Systems, Inc., owns an office and shop facility as well as additional property in Durango, Colorado. In addition, our wholly-owned Canadian subsidiary, United Pipeline Systems Limited, owns an operating facility in Edmonton, Alberta, Canada for office space and manufacturing.
Our wholly-owned subsidiary, The Bayou Companies, LLC, owns a pipe yard in New Iberia, Louisiana and leases approximately 220 acres from the Port of Iberia and other property owners in Louisiana, of which a certain portion has been subleased to Bayou Wasco Insulation, LLC.
ACS, another wholly-owned subsidiary, owns certain premises in Conroe, Texas that are used as office space and operational facilities.
Our wholly-owned subsidiary, Aegion Energy Services, leases an office in Irvine, California for its headquarters and also leases various operational facilities throughout California and Washington.
We own or lease various other operational facilities in the United States, Canada, Europe, Latin America, South America, Asia-Pacific, Australia, South Africa and the Middle East, and the foregoing facilities are regarded by management as adequate for the current requirements of our business.
Item 3. Legal Proceedings.
We are involved in certain actions incidental to the conduct of our business and affairs. Management, after consultation with legal counsel, does not believe that the outcome of any such actions, individually and in the aggregate, will have a material adverse effect on our consolidated financial condition, results of operations or cash flows.
Item 4. Mine Safety Disclosure.
Information concerning mine safety violations or other regulatory matters required by section 1503(a) of the Dodd-Frank Wall Street Reform and Consumer Protection Act and Item 104 of SEC Regulation S-K is included in Exhibit 95 to this annual report on Form 10-K.
29
Item 4A. Executive Officers of the Registrant.
Our executive officers, and their respective ages and positions with us, are as follows:
Charles R. Gordon | 59 | President and Chief Executive Officer | ||
David F. Morris | 56 | Executive Vice President, Interim Chief Financial Officer, Chief Administrative Officer, General Counsel and Secretary | ||
Michael D. White | 45 | Senior Vice President, Chief Accounting Officer and Corporate Controller | ||
Stephen P. Callahan | 51 | Senior Vice President, Human Resources | ||
Charles R. Gordon serves as our President and Chief Executive Officer, a position he has held since October 2014. Mr. Gordon had been serving as our interim Chief Executive Officer since May 2014 and has served on our Board of Directors since 2009. Prior to serving as interim Chief Executive Officer of the Company, Mr. Gordon served as Chief Executive Officer of Natural Systems Utilities, LLC, a distributed water infrastructure company, from February 2014 to May 2014. Prior to Natural Systems Utilities, LLC, Mr. Gordon was President and Chief Operating Officer of Nuverra Environmental Solutions, Inc. (a holding company formerly known as Heckmann Corporation that buys and builds companies in the water sector) from November 2010 until his resignation in October 2013. Mr. Gordon was President and Chief Executive Officer of Siemens Water Technologies (a business unit of Siemens AG, a world leader in products, systems and services for water and wastewater treatment for industrial, institutional and municipal customers) from 2008 to 2010. Previously, Mr. Gordon served as Executive Vice President of the Siemens Water & Wastewater Systems Group from 2005 to 2008 and as Executive Vice President of the Siemens Water & Wastewater Services and Products Group from 2003 to 2005. His past experience also includes various management positions with US Filter Corporation and Arrowhead Industrial Water, prior to the acquisition of US Filter Corporation by the Siemens family of companies in 2004.
David F. Morris serves as our Executive Vice President, Interim Chief Financial Officer, Chief Administrative Officer, General Counsel and Secretary, a position he has held since November 2017. Mr. Morris served as our Vice President, General Counsel and Secretary beginning in January 2005 through April 2007, at which time he was promoted to Senior Vice President. Mr. Morris became our Chief Administrative Officer in August 2007. Mr. Morris was promoted to Executive Vice President in October 2014. From March 1993 until January 2005, Mr. Morris was an attorney with the law firm of Thompson Coburn LLP, St. Louis, Missouri, most recently as a partner in its corporate and securities practice areas.
Michael D. White serves as our Senior Vice President, Chief Accounting Officer and Corporate Controller, a position he has held since April 2017. Mr. White joined Aegion in October 2013 as Vice President and Corporate Controller and was promoted to Senior Vice President in October 2014. Prior to joining Aegion, he served in various financial leadership positions in the oil and gas and technology industries, including Chief Accounting Officer for SunGard Energy and Chief Financial Officer for Baker Energy. Prior to 2001, he was a manager with Ernst & Young, LLP. Mr. White earned a BBA in Accounting and Finance from the University of Houston and is a Certified Public Accountant and member of the American Institute of Certified Public Accountants.
Stephen P. Callahan serves as our Senior Vice President, Human Resources, a position he has held since November 2015. Prior to joining Aegion, Mr. Callahan was Vice President of Corporate and International Human Resources and HRIS at Peabody Energy from October 2010 until November 2015, where he was responsible for driving global alignment within the human resources function, HRIS, global mobility, business development support and M&A integration, HR metrics and analytics and corporate generalist support. Mr. Callahan has over 20 years of global experience working in Romania, India, France, China, Indonesia, Mongolia, Singapore and the United Kingdom.
30
PART II
Item 5. Market for Registrant’s Common Equity, Related Stockholder Matters and Issuer Purchases of Equity Securities.
Our common shares, $.01 par value, are traded on The Nasdaq Global Select Market under the symbol “AEGN”. The following table sets forth the range of quarterly high and low sales prices for the years ended December 31, 2017 and 2016, as reported on The Nasdaq Global Select Market. Quotations represent prices between dealers and do not include retail mark-ups, mark-downs or commissions.
Period | High | Low | ||||||
2017 | ||||||||
First Quarter | $ | 26.68 | $ | 21.43 | ||||
Second Quarter | 23.94 | 19.16 | ||||||
Third Quarter | 24.25 | 19.11 | ||||||
Fourth Quarter | 28.19 | 19.81 | ||||||
2016 | ||||||||
First Quarter | $ | 21.50 | $ | 16.00 | ||||
Second Quarter | 21.95 | 17.35 | ||||||
Third Quarter | 21.00 | 17.18 | ||||||
Fourth Quarter | 26.14 | 17.85 | ||||||
During the quarter ended December 31, 2017, we did not offer any equity securities that were not registered under the Securities Act of 1933, as amended. As of February 22, 2018, the number of holders of record of our common stock was 407.
Holders of common stock are entitled to receive dividends as and when they may be declared by our board of directors. Our present policy is to retain earnings to provide for the operation and expansion of our business. However, our board of directors will review our dividend policy from time to time and will consider our earnings, financial condition, cash flows, financing agreements and other relevant factors in making determinations regarding future dividends, if any. Under the terms of our debt arrangement to which we are a party, we are subject to certain limitations on paying dividends. See “Management’s Discussion and Analysis of Financial Condition and Results of Operations – Liquidity and Capital Resources – Long-Term Debt” for further discussion of such limitations.
The following table provides information as of December 31, 2017 with respect to the shares of common stock that may be issued under our existing equity compensation plans:
Equity Compensation Plan Information
Plan Category | Number of securities to be issued upon exercise of outstanding options, warrants and rights (a) | Weighted-average exercise price of outstanding options, warrants and rights (b) | Number of securities remaining available for future issuance under equity compensation plans (excluding securities reflected in column (a)) (c) | |||||||
Equity compensation plans approved by security holders (1) | 1,825,535 | $ | 19.71 | 1,619,223 | ||||||
Equity compensation plans not approved by security holders | — | — | — | |||||||
Total | 1,825,535 | $ | 19.71 | 1,619,223 | ||||||
_________________________________
(1) | The number of securities to be issued upon exercise of granted/awarded options, warrants and rights includes: (i) 126,680 stock options; (ii) 1,428,878 restricted stock, restricted stock units and restricted performance units; and (iii) 269,977 deferred stock units outstanding at December 31, 2017. |
31
Issuer Purchases of Equity Securities
The following table provides information regarding repurchases made by us of our common stock during the year ended December 31, 2017, pursuant to share repurchase programs approved by our board of directors.
Total Number of Shares (or Units) Purchased | Average Price Paid per Share (or Unit) | Total Number of Shares (or Units) Purchased as Part of Publicly Announced Plans or Programs | Maximum Number (or Approximate Dollar Value) of Shares (or Units) that May Yet Be Purchased Under the Plans or Programs | |||||||||||||
January 2017 (1) (2) | 117,029 | $ | 22.92 | 107,647 | $ | 37,540,031 | ||||||||||
February 2017 (1) (2) | 125,211 | 22.95 | 108,355 | 35,054,935 | ||||||||||||
March 2017 (1) (2) | 220,077 | 22.49 | 150,912 | 31,627,784 | ||||||||||||
April 2017 (1) (2) | 126,448 | 22.76 | 126,400 | 28,751,326 | ||||||||||||
May 2017 (1) (2) | 205,735 | 19.99 | 205,200 | 24,649,082 | ||||||||||||
June 2017 (1) (2) | 171,037 | 20.67 | 169,708 | 21,140,282 | ||||||||||||
July 2017 (1) (2) | 152,479 | 23.17 | 149,100 | 17,682,708 | ||||||||||||
August 2017 (1) (2) | 179,652 | 20.66 | 178,810 | 13,988,740 | ||||||||||||
September 2017 (1) (2) | 154,628 | 22.25 | 150,000 | 10,645,225 | ||||||||||||
October 2017 (1) (2) | 169,497 | 22.54 | 165,100 | 6,924,663 | ||||||||||||
November 2017 (1) (2) | 38,224 | 25.65 | 37,700 | 5,956,757 | ||||||||||||
December 2017 (1) (2) (3) | 51,975 | 25.38 | 50,161 | — | ||||||||||||
Total | 1,711,992 | $ | 22.10 | 1,599,093 | ||||||||||||
_________________________________
(1) | In October 2016, our board of directors authorized the open market repurchase of up to $40.0 million of our common stock to be made during 2017. We began repurchasing shares under this program in January 2017 and ceased on December 31, 2017 due to expiration of the program. Once repurchased, we promptly retired the shares. |
(2) | In connection with approval of our then current Credit Facility, our board of directors approved the purchase of up to $10.0 million of our common stock in each calendar year in connection with our equity compensation programs for employees and directors. The number of shares purchased includes shares surrendered to us to pay the exercise price and/or to satisfy tax withholding obligations in connection with “net, net” exercises of employee stock options and/or the vesting of restricted stock or deferred stock units issued to employees and directors. During 2017, zero shares were surrendered in connection with stock swap transactions and 112,899 shares were surrendered in connection with restricted stock and restricted stock unit transactions. The deemed price paid was the closing price of our common stock on The Nasdaq Global Select Market on the date that the restricted stock or restricted stock units vested or the stock option was exercised. Once a repurchase is complete, we promptly retire the shares. |
(3) | In October 2017, our board of directors authorized the open market repurchase of up to $40.0 million of our common stock to be made during 2018. Any shares repurchased will be pursuant to one or more 10b5-1 plans. The program will expire on the earlier of: (i) December 31, 2018; (ii) the repurchase by the Company of $40.0 million of common stock pursuant to the program; or (iii) the board of directors’ termination of the program. On February 27, 2018, we amended our senior secured credit facility, which limits the open market repurchase of our common stock to be made during 2018 to $30.0 million. |
32
Performance Graph
The following performance graph compares the total stockholder return on our common stock to the S&P 500 Index and a selected peer group index for the past five years. The compensation committee of our board of directors also reviews data for this peer group in establishing the compensation of our executive officers. In 2017, the peer group index was comprised of the following companies:
Actuant Corporation | Matrix Service Company |
Barnes Group, Inc. | McDermott International Inc. |
CIRCOR International, Inc. | Mistras Group, Inc. |
Dril-Quip, Inc. | Newpark Resources, Inc. |
Forum Energy Technologies, Inc. | Oil States International Inc. |
Granite Construction Incorporated | Team, Inc. |
Helix Energy Solutions Group, Inc. | Tetra Tech, Inc. |
Kennametal, Inc. | Valmont Industries, Inc. |
MasTec, Inc. | Willbros Group, Inc. |
The graph assumes that $100 was invested in our common stock and each index on December 31, 2012 and that all dividends, if any, were reinvested.
Comparison of Five-Year Cumulative Return
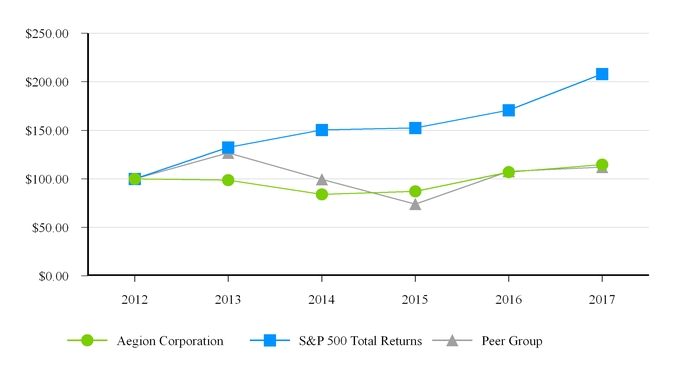
2012 | 2013 | 2014 | 2015 | 2016 | 2017 | |||||||||||||||||||
Aegion Corporation | $ | 100.00 | $ | 98.65 | $ | 83.87 | $ | 87.02 | $ | 106.80 | $ | 114.60 | ||||||||||||
S&P 500 Total Returns | 100.00 | 132.39 | 150.51 | 152.59 | 170.84 | 208.14 | ||||||||||||||||||
Peer Group | 100.00 | 126.70 | 99.40 | 73.80 | 107.71 | 112.04 | ||||||||||||||||||
Notwithstanding anything set forth in any of our previous filings under the Securities Act of 1933 or the Securities Exchange Act of 1934 which might incorporate future filings, including this Annual Report on Form 10-K, in whole or in part, the preceding performance graph shall not be deemed incorporated by reference into any such filings.
33
Item 6. Selected Financial Data.
The selected financial data set forth below has been derived from our consolidated financial statements contained in “Item 8. Financial Statements and Supplementary Data” of this Report and previously published historical financial statements not included in this Report. The selected financial data set forth below should be read in conjunction with “Management’s Discussion and Analysis of Financial Condition and Results of Operations” and our consolidated financial statements, including the footnotes, contained in this Report.
Years Ended December 31, | ||||||||||||||||||||
2017(1) | 2016(2) | 2015(3) | 2014(4) | 2013(5) | ||||||||||||||||
(In thousands, except per share amounts) | ||||||||||||||||||||
STATEMENT OF OPERATIONS DATA: | ||||||||||||||||||||
Revenues | $ | 1,359,019 | $ | 1,221,920 | $ | 1,333,570 | $ | 1,331,421 | $ | 1,091,420 | ||||||||||
Operating income (loss) | (43,173 | ) | 50,826 | 19,946 | (19,812 | ) | 66,882 | |||||||||||||
Income (loss) from continuing operations (6) | (69,054 | ) | 29,488 | (8,067 | ) | (33,320 | ) | 50,812 | ||||||||||||
Loss from discontinued operations | — | — | — | (3,847 | ) | (6,461 | ) | |||||||||||||
Net income (loss) (6) | (69,054 | ) | 29,488 | (8,067 | ) | (37,167 | ) | 44,351 | ||||||||||||
Basic earnings (loss) per share: | ||||||||||||||||||||
Income (loss) from continuing operations (6) | (2.08 | ) | 0.85 | (0.22 | ) | (0.88 | ) | 1.31 | ||||||||||||
Loss from discontinued operations | — | — | — | (0.10 | ) | (0.17 | ) | |||||||||||||
Net income (loss) (6) | (2.08 | ) | 0.85 | (0.22 | ) | (0.98 | ) | 1.14 | ||||||||||||
Diluted earnings (loss) per share: | ||||||||||||||||||||
Income (loss) from continuing operations (6) | (2.08 | ) | 0.84 | (0.22 | ) | (0.88 | ) | 1.30 | ||||||||||||
Loss from discontinued operations | — | — | — | (0.10 | ) | (0.17 | ) | |||||||||||||
Net income (loss) (6) | (2.08 | ) | 0.84 | (0.22 | ) | (0.98 | ) | 1.13 | ||||||||||||
BALANCE SHEET DATA: | ||||||||||||||||||||
Cash and cash equivalents | $ | 105,717 | $ | 129,500 | $ | 209,253 | $ | 174,965 | $ | 158,045 | ||||||||||
Working capital, net of cash | 219,673 | 172,136 | 171,176 | 198,834 | 210,858 | |||||||||||||||
Current assets (7) | 587,064 | 532,237 | 678,196 | 638,122 | 603,858 | |||||||||||||||
Property, plant and equipment, net | 109,040 | 156,747 | 144,833 | 168,213 | 182,303 | |||||||||||||||
Goodwill | 260,715 | 298,619 | 249,120 | 293,023 | 348,680 | |||||||||||||||
Identified intangible assets, net | 132,345 | 194,911 | 174,118 | 182,273 | 209,283 | |||||||||||||||
Total assets (7) | 1,107,099 | 1,193,582 | 1,254,013 | 1,291,133 | 1,372,332 | |||||||||||||||
Current maturities of long-term debt | 26,555 | 19,835 | 17,648 | 26,399 | 22,024 | |||||||||||||||
Long-term debt, less current maturities | 318,240 | 350,785 | 333,480 | 346,536 | 361,530 | |||||||||||||||
Total liabilities (7) | 602,043 | 617,399 | 659,457 | 646,048 | 645,411 | |||||||||||||||
Total stockholders’ equity | 494,246 | 568,500 | 578,025 | 626,635 | 709,368 | |||||||||||||||
_________________________________
(1) | 2017 results include charges of $24.0 million related to our restructuring efforts, $86.4 million related to certain goodwill and definite-lived intangible asset impairments, and $2.9 million in acquisition and divestiture expenses related to our acquisition of Environmental Techniques and our planned divestiture of Bayou. Results also include tax expenses of $2.4 million related to impacts from the TCJA. |
(2) | 2016 results include charges of $15.9 million related to our restructuring efforts and $2.7 million in acquisition expenses related to our acquisitions of Underground Solutions, Fyfe Europe, Concrete Solutions, LMJ and diligence on other targets. Results also include a gain of $6.6 million in connection with the settlement of two longstanding lawsuits. |
(3) | 2015 results include charges of $11.0 million related to our restructuring efforts, $43.5 million related to certain goodwill impairments, and $1.9 million in acquisition expenses related to our acquisitions of Schultz, Underground Solutions and diligence on other targets. Results also include $3.4 million related to expenses associated with the Credit Facility and our write-off of unamortized debt issuance costs from our prior credit facility. |
(4) | 2014 results include charges of $49.5 million related to our restructuring efforts, $52.7 million related to certain goodwill and definite-lived intangible asset impairments, and $1.4 million in acquisition expenses related to our acquisition of Brinderson and diligence on other targets. Results also include $4.5 million in proceeds received in connection with the settlement of escrow claims related to the purchase of Brinderson. |
(5) | 2013 results include $5.8 million in acquisition expenses related to our acquisition of Brinderson and diligence on other targets. |
(6) | All periods presented include amounts attributable to Aegion Corporation. |
(7) | 2014 and 2013 amounts also include certain components of discontinued operations. |
34
Item 7. Management’s Discussion and Analysis of Financial Condition and Results of Operation.
Executive Summary
Aegion combines innovative technologies with market leading expertise to maintain, rehabilitate and strengthen pipelines and other infrastructure around the world. Since 1971, we have played a pioneering role in finding innovative solutions to rehabilitate aging infrastructure, primarily pipelines in the wastewater, water, energy, mining and refining industries. We also maintain the efficient operation of refineries and other industrial facilities and provide innovative solutions for the strengthening of buildings, bridges and other structures. We are committed to Stronger. Safer. Infrastructure®. Our products and services are currently utilized in over 80 countries across six continents. We believe the depth and breadth of our products and services make us a leading provider for the world’s infrastructure rehabilitation and protection needs.
Business Outlook
We believe favorable end markets and the progress made over the last three years to advance our long-term strategy give us the opportunity to grow operating income in 2018, which is expected to result in strong earnings per share growth, greater cash generation and an increase in return on invested capital.
Infrastructure Solutions
One of the most attractive areas for growth is in the rehabilitation of municipal pressure pipelines, primarily in North America. We have a diverse portfolio of solutions in a highly fragmented and growing North American market. We also have an attractive market in Asia-Pacific for large-diameter pressure pipe strengthening. We completed a research and development effort in 2016 that has significantly reduced material and installation costs for the Tyfo® system while maintaining the superior material properties and quality of the technology. We also improved our InsituMain® CIPP technology to give customers a more robust solution. These enhancements and favorable market conditions support our expectations for strong growth in North America pressure pipeline rehabilitation activities in 2018.
Similar to investments made in 2017, we will make additional investments in 2018 to expand the use of Insituform® CIPP in several regions currently underserved by Insituform in the North American wastewater pipeline market. Our objective is to maintain growth and our leading share in a large and mature market. Outside North America, we are targeting select markets in Europe for Insituform® CIPP contract installation activities and continuing to pursue a strategy of growing third-party product sales across the continent. We also plan to grow third-party CIPP sales in several Asian countries.
With favorable end markets, strategic investments and technology enhancements, we expect Infrastructure Solutions in 2018 to grow revenues in the low to mid-single digit range, after a year of strong orders and revenue growth in 2017. Operating margins will also likely be higher in 2018 than in 2017 due to the expected avoidance of losses incurred in 2017 in our CIPP businesses in Denmark and Australia and in our FRP business in North America, partially offset by potential increases in petroleum based inputs and construction labor costs. We are employing continuous improvement processes in our CIPP manufacturing and operations to partially offset these expected cost headwinds.
Corrosion Protection
For Corrosion Protection, we expect a 10 percent to 15 percent revenue decline in 2018 compared to 2017, reflecting the lost contribution from the large deepwater project. Excluding the large deepwater project, revenues are projected to increase 15 percent to 20 percent in 2018 compared to 2017.
Nearly 50 percent of Corrosion Protection’s revenues come from cathodic protection services for midstream oil and gas pipelines in North America, an attractive and growing market that we believe justifies further investment to outpace market growth. To that end, we plan to continue to promote our new asset integrity management program, which we introduced in 2017, for pipeline corrosion inspections. The new service improves data accuracy and processing efficiency, customizes the data transfer format (including geospatial mapping) and provides faster access to the information by customers. Corrosion Protection’s pipeline inspection services are expected to create a multiplier effect for our other capabilities in direct pipeline inspections, engineering, cathodic protection system installation and pipeline corrosion remediation. Our objective is to expand the relationships with our top customers, who are the leading pipeline owners in North America, to accelerate revenue growth.
With oil prices trading in a more stable range, we have responded to more customer inquiries for our Tite Liner® lining pipeline protection system, pipe coatings and insulation for the United States Gulf Coast region and field pipe coatings domestically and overseas. We are encouraged by the growing customer interest and believe this can lead to a modestly improved energy market in 2018, especially in North America.
35
Energy Services
We expect Energy Services to build on the momentum achieved in 2017 after completing the downsizing of its upstream operations in Central California and the Permian Basin as part of the 2016 Restructuring. The outlook for day-to-day downstream refinery maintenance remains robust based on long-term contracts and our position as the lead maintenance provider in 13 out of the 17 refineries on the United States West Coast. We have an effort underway to expand our services to those customers in mechanical maintenance, turnaround support, electrical and instrumentation maintenance, scaffolding services and small capital construction activities. We will continue to improve operating efficiencies to maximize margins and cash generation. The favorable outlook we expect in 2018 supports mid-single digit revenue growth and a 75 basis point to 150 basis point improvement in operating margins compared to 2017.
Acquisitions/Strategic Initiatives/Divestitures
Acquisitions
Our recent acquisition strategy has focused on acquisitions that add new technologies to our Company’s product and services portfolio or new geographic areas. During 2017 and 2016, we targeted strategic acquisitions in the infrastructure sector by:
i. | adding patented Fusible PVC® pipe technology to our pressure pipe rehabilitation portfolio through the acquisition of Underground Solutions; |
ii. | expanding our CIPP presence in Europe by acquiring the CIPP contracting operations of Leif M. Jensen A/S (“LMJ”), a Danish company and the Insituform licensee in Denmark since 2011, and acquiring Environmental Techniques Limited and its parent holding company, Killeen Trading Limited (collectively “Environmental Techniques”), a Northern Ireland-based provider of trenchless drainage inspection, cleaning and rehabilitation services throughout the United Kingdom and the Republic of Ireland; |
iii. | acquiring the remaining worldwide rights that we did not already own to market, manufacture and install the patented Tyfo® system by acquiring the operations and territories of Fyfe Europe S.A. and related companies (“Fyfe Europe”); and |
iv. | expanding our FRP presence in Asia Pacific through the acquisition of Concrete Solutions Limited (“CSL”) and Building Chemical Supplies Limited (“BCS”), two New Zealand-based companies that were the Tyfo® system certified applicators in New Zealand since the late 1990’s (collectively, “Concrete Solutions”). |
See Note 1 to the consolidated financial statements contained in this Report for additional information and disclosures regarding our acquisitions.
2017 Restructuring
On July 28, 2017, our board of directors approved a realignment and restructuring plan (the “2017 Restructuring”) to: (i) divest our pipe coating and insulation businesses in Louisiana, The Bayou Companies, LLC and Bayou Wasco Insulation, LLC (collectively “Bayou”); (ii) exit all non-pipe related contract applications for the Tyfo® system in North America; (iii) right-size our cathodic protection services operation in Canada; and (iv) reduce corporate and other operating costs. These decisions reflect our: (i) desire to reduce further our exposure in the North American upstream oil and gas markets; (ii) assessment of our ability to drive sustainable, profitable growth in the non-pipe FRP contracting market in North America; and (iii) assessment of continuing weak conditions in the Canadian oil and gas markets. During 2017, we also completed a detailed assessment of the Infrastructure Solutions’ CIPP businesses in Australia and Denmark, which resulted in additional restructuring actions in both countries.
We expect the 2017 Restructuring to reduce consolidated annual expenses by more than $20 million, primarily through headcount reductions, office closures and reduced amortization of intangible assets. Approximately $12 million and $4 million relate to cost reductions expected to be recognized within Infrastructure Solutions and Corrosion Protection, respectively, and $4 million related to reduced corporate and other costs. Cost reductions are expected to be fully realized in 2018. The Company reduced headcount by approximately 300 employees as a result of these actions.
Total pre-tax 2017 Restructuring charges recorded during 2017 were $23.7 million ($20.6 million post-tax) and consisted of employee severance, retention, extension of benefits, employment assistance programs, early lease and contract termination and other restructuring costs associated with the restructuring efforts described above. We expect to incur additional cash charges of $5 million to $7 million in 2018. Additionally, as we look to simplify our organizational structure and streamline our operations to best accommodate the TCJA or for other operational reasons, we could incur both cash and non-cash charges in 2018 primarily related to the the combination or dissolution of certain of our existing subsidiaries, the creation of new subsidiaries, and the foreign currency impact from settlement of inter-company loans. These charges are expected to be mainly in Infrastructure Solutions and, to a lesser extent, Corrosion Protection.
36
As a result of the above actions to exit all non-pipe related contract applications for the Tyfo® system in North America, we recorded pre-tax goodwill impairment charges of $45.4 million ($42.2 million post-tax) and pre-tax long-lived asset impairment charges of $41.0 million ($36.4 million post-tax) related to the Fyfe reporting unit, which is included in the Infrastructure Solutions reportable segment, in the third quarter of 2017.
2016 Restructuring
During 2016, we completed our 2016 Restructuring, which: (i) repositioned Energy Services’ upstream operations in California; (ii) reduced Corrosion Protection’s upstream exposure by divesting our interest in Bayou Perma-Pipe Canada, Ltd. (“BPPC”), our Canadian pipe coating joint venture; (iii) right-sized Corrosion Protection to compete more effectively; and (iv) reduced corporate and other operating costs. The 2016 Restructuring reduced consolidated annual operating costs by approximately $17.4 million, of which approximately $1.2 million, $6.6 million and $5.6 million related to recognized savings within Infrastructure Solutions, Corrosion Protection and Energy Services, respectively, and $4.0 million related to reduced corporate costs. Cost savings were achieved primarily through office closures and reducing headcount by 964 employees, or 15.5% of our total workforce as of December 31, 2015.
During 2016, we recorded pre-tax charges of $16.1 million ($10.3 million post-tax), most of which were cash charges, consisting primarily of employee severance, extension of benefits, early lease termination and other costs associated with the restructuring efforts as described above. We do not expect to incur any future charges related to the 2016 Restructuring.
2014 Restructuring
The 2014 Restructuring reduced consolidated annual operating costs by approximately $10.8 million and consisted of approximately $8.4 million and $2.4 million of recognized savings within Infrastructure Solutions and Corrosion Protection, respectively. We achieved these cost savings by exiting certain unprofitable international locations for our CIPP business and eliminating certain idle facilities in our pipe coating and insulation operation in Louisiana.
We completed all of the aforementioned objectives related to the 2014 Restructuring and do not expect to incur any future charges. Total headcount reductions were 86 and total pre-tax 2014 Restructuring charges since inception were $60.6 million ($45.0 million post-tax), consisting of non-cash charges totaling $48.3 million and cash charges totaling $12.3 million.
See “Financial Statements and Supplementary Data” in Item 8 of this Report for further discussion regarding our recent acquisitions and strategic initiatives. See Note 3 to the consolidated financial statements contained in this Report for additional information on the charges related to our restructuring efforts.
Divestitures – Planned and Completed
Through our restructuring efforts, we have divested, or plan to divest, certain businesses in our Infrastructure Solutions and Corrosion Protection segments during 2017, 2016 and 2015:
i. | On July 28, 2017, as part of the 2017 Restructuring, our board of directors approved a plan to divest our pipe coating and insulation businesses in Louisiana. We are currently engaged in a process to sell the businesses. As of December 31, 2017, the assets and liabilities of these businesses were classified as held for sale on our consolidated balance sheet. If we are unable to sell these businesses or if we dispose of them at a price or on terms that are less favorable, or at a higher cost, than we currently anticipate, we could incur impairment charges or losses on disposal. |
ii. | In February 2016, we sold our fifty-one percent (51%) interest in BPPC to our joint venture partner, Perma-Pipe, Inc. BPPC served as our pipe coating and insulation operation in Canada. The sale of our interest in BPPC was part of a broader effort to reduce our exposure in the North American upstream market in light of expectations for a prolonged low oil price environment. |
iii. | In February 2015, we sold our wholly-owned subsidiary, Video Injection - Insituform SAS (“VII”), our French CIPP contracting operation, to certain employees of VII. |
See Notes 1 and 5 to the consolidated financial statements contained in this Report for additional information and disclosures regarding our divestitures.
Results of Operations
Overview
Record revenues of $1.36 billion were generated in 2017 primarily due to work performed on a large deepwater project in our pipe coating and insulation operation within Corrosion Protection and continued expansion of our CIPP business within Infrastructure Solutions.
37
While the U.S. oil and gas markets experienced slight improvement in 2017 from customer spending levels in 2016 and 2015, Corrosion Protection continued to experience upstream, and to a lesser extent midstream, market challenges mostly in our domestic coating services and industrial linings operations as a result of recent and current oil prices. Internationally, Corrosion Protection benefited from increased coating services and industrial linings project activities primarily in the Middle East and North America. As part of our restructuring efforts to lower our exposure to the upstream market, we completed the divestiture of our pipe coating joint venture in Canada in early 2016 and we are engaged in a process to divest Bayou, which is our domestic pipe coating and insulation operation in New Iberia, Louisiana.
Infrastructure Solutions experienced higher revenues in 2017 compared to 2016 primarily due to continued favorable market conditions in our CIPP business in North America and acquisitions made in Europe and Asia-Pacific. However, negative impacts from our FRP business in North America and our CIPP businesses in Australia and Denmark, all of which were included in our 2017 Restructuring, resulted in an overall decline in profitability in 2017 as compared to 2016 for Infrastructure Solutions. As part of our 2017 Restructuring, we decided to exit all non-pipe related contract applications for the Tyfo® system in North America, which resulted in goodwill and long-lived asset impairment charges totaling $86.4 million in the third quarter of 2017.
Energy Services, which successfully completed its restructuring objectives in 2016 by decreasing its exposure to the upstream market and lowering its related cost structure, generated improved financial results in 2017 as compared to 2016 primarily due to increased turnaround services activities and cost savings associated with its restructuring efforts.
The TCJA had a negative impact to our effective tax rate in 2017, specifically related to the transition of U.S. international taxation to a modified territorial tax system, which resulted in a one-time U.S. tax liability on earnings that have not previously been repatriated to the U.S. However, we expect to benefit from a lower effective tax rate in 2018 as a result of the new legislation.
Significant Events
2017 Restructuring – As part of the 2017 Restructuring, we recorded pre-tax charges of $23.7 million ($20.6 million post-tax) during 2017. These charges exclude long-lived asset impairment charges of $86.4 million in 2017 for the Fyfe reporting unit noted below. Including those charges, total 2017 Restructuring pre-tax charges were $110.1 million ($99.2 million post-tax) in 2017 (see Notes 2 and 3 to the consolidated financial statements contained in this Report).
2016 Restructuring – As part of the 2016 Restructuring, we recorded pre-tax charges of $16.1 million ($10.3 million post-tax) during 2016 (see Note 3 to the consolidated financial statements contained in this Report).
2014 Restructuring – As part of the 2014 Restructuring, we recorded pre-tax charges (credits) of $0.2 million ($0.1 million post-tax), $(0.2) million ($(0.1) million post-tax) and $11.0 million ($8.7 million post-tax) during 2017, 2016 and 2015, respectively (see Note 3 to the consolidated financial statements contained in this Report).
Impairment of goodwill – We recorded pre-tax, non-cash goodwill impairment charges of $45.4 million ($42.2 million post-tax) and $43.5 million ($35.7 million post-tax) during 2017 and 2015, respectively (see Note 2 to the consolidated financial statements contained in this Report). These charges were recorded as follows:
Fyfe Reporting Unit – During the third quarter of 2017, we recognized a pre-tax, non-cash charge of $45.4 million. As part of the 2017 Restructuring, we exited all non-pipe related contract applications for the Tyfo® system in North America, permanently lowering the expected future cash flows of the reporting unit. As a result of this action, we evaluated the goodwill of our Fyfe reporting unit and determined that a triggering event occurred. The Fyfe reporting unit is included in the Infrastructure Solutions reportable segment.
Energy Services Reporting Unit – During the fourth quarter of 2015, we recognized a pre-tax, non-cash charge of $33.5 million. In response to contract losses in the Central California upstream energy market during the fourth quarter of 2015 and our subsequent decision to reduce exposure to the upstream market, we performed a market assessment of our energy-related businesses and concluded that sustained low oil prices would continue to create market challenges for the foreseeable future, including a continued reduction in spending by certain of our customers in 2016. The loss of contracts, coupled with the decision to downsize, caused us to perform an interim impairment review of the goodwill and long-lived assets of our operations affected by these circumstances. As a result of the review, we determined that goodwill was impaired; however, there were no impairment charges related to long-lived assets. The Energy Services reporting unit is included in the Energy Services reportable segment.
CRTS Reporting Unit – During the fourth quarter of 2015, we recognized a pre-tax, non-cash charge of $10.0 million. In response to customer-driven work delays, work order cancellations and canceled sales opportunities as a result of declining oil prices, we performed an impairment review for goodwill and long-lived assets at CRTS. We determined that goodwill was impaired; however, there were no impairment charges related to long-lived assets. The CRTS reporting unit is included in the Corrosion Protection reportable segment.
38
Impairment of long-lived assets – During 2017, we recorded pre-tax, non-cash long-lived asset impairment charges of $41.0 million ($36.4 million post-tax) related to the Fyfe reporting unit (see Note 2 to the consolidated financial statements contained in this Report). In the third quarter of 2017, as part of our 2017 Restructuring, we determined that the carrying value of the Fyfe North America asset group exceeded the fair value, which caused us to evaluate the long-lived assets of the asset group. Based on the results of the valuation, the carrying amount of certain long-lived assets at the Fyfe North America asset group, such as customer relationships, trademarks and patents, exceeded their fair value.
Legal settlement – In December 2016, we settled two lawsuits related to the December 2012 departure of several key leaders in sales and operations for the Tyfo® technology, which is part of the Infrastructure Solutions reportable segment. Under the settlement, we will receive $6.6 million, which was recorded as “Gain on litigation settlement” in the Consolidated Statement of Operations. The initial $3.6 million cash payment was received in December 2016 and the remainder is to be paid in $750,000 annual installments over a four-year period, the first installment of which was received in December 2017.
Divestitures – In December 2015, we recognized a loss of $0.6 million related to the sale of our 51% joint venture interest in BPPC, which transaction closed in February 2016 (see Notes 2 and 5 to the consolidated financial statements contained in this Report).
See Note 1 to the consolidated financial statements contained in this Report.
Operating Results
2017 vs 2016 | 2016 vs 2015 | ||||||||||||||||||||||||
(dollars in thousands) | Years Ended December 31, | Increase (Decrease) | Increase (Decrease) | ||||||||||||||||||||||
2017 | 2016 | 2015 | $ | % | $ | % | |||||||||||||||||||
Revenues | $ | 1,359,019 | $ | 1,221,920 | $ | 1,333,570 | $ | 137,099 | 11.2 | % | $ | (111,650 | ) | (8.4 | )% | ||||||||||
Gross profit | 284,812 | 253,164 | 275,787 | 31,648 | 12.5 | (22,623 | ) | (8.2 | ) | ||||||||||||||||
Gross profit margin | 21.0 | % | 20.7 | % | 20.7 | % | N/A | 30 | bp | N/A | — | ||||||||||||||
Operating expenses | 225,826 | 197,099 | 209,477 | 28,727 | 14.6 | (12,378 | ) | (5.9 | ) | ||||||||||||||||
Goodwill impairment | 45,390 | — | 43,484 | 45,390 | N/M | (43,484 | ) | N/M | |||||||||||||||||
Definite-lived intangible asset impairment | 41,032 | — | — | 41,032 | N/M | — | N/M | ||||||||||||||||||
Gain on litigation settlement | — | (6,625 | ) | — | 6,625 | N/M | (6,625 | ) | N/M | ||||||||||||||||
Acquisition and divestiture expenses | 2,923 | 2,696 | 1,912 | 227 | 8.4 | 784 | 41.0 | ||||||||||||||||||
Restructuring and related charges 1 | 12,814 | 9,168 | 968 | 3,646 | 39.8 | 8,200 | 847.1 | ||||||||||||||||||
Operating income (loss) | (43,173 | ) | 50,826 | 19,946 | (93,999 | ) | (184.9 | ) | 30,880 | 154.8 | |||||||||||||||
Operating margin | (3.2 | )% | 4.2 | % | 1.5 | % | N/A | (740 | )bp | N/A | 270 | bp | |||||||||||||
Net income (loss) attributable to Aegion Corporation | (69,054 | ) | 29,488 | (8,067 | ) | (98,542 | ) | (334.2 | ) | 37,555 | 465.5 | ||||||||||||||
______________________________
1 See Note 3 to the consolidated financial statements contained in this Report for a complete accounting of all charges related to restructuring efforts.
“N/A” represents not applicable.
“N/M” represents not meaningful.
2017 Compared to 2016
Revenues
Revenues increased $137.1 million, or 11.2%, to $1,359.0 million in 2017 compared to $1,221.9 million in 2016. The increase in revenues was due to a $54.7 million increase in Corrosion Protection, driven by a $53.5 million increase in revenues from the substantial completion of a large deepwater project in our pipe coating and insulation operation as well as increased international project activities in our coating services and industrial linings operations, a $41.8 million increase in Energy Services mainly due to increased turnaround services activities and, to a lesser extent, construction and maintenance services activities, and a $40.6 million increase in Infrastructure Solutions primarily as a result of increased CIPP contracting installation services activities in our North American and European operations.
39
Gross Profit and Gross Profit Margin
Gross profit increased $31.6 million, or 12.5%, to $284.8 million in 2017 compared to $253.2 million in 2016. The increase in gross profit was primarily due to a $25.0 million increase in Corrosion Protection largely driven by higher revenues, as discussed above, and a $7.5 million increase in Energy Services generated mainly from increased revenues, improved project performance and project mix. Partially offsetting the increases in gross profit was a decrease of $0.9 million in Infrastructure Solutions primarily due to operations included in our 2017 Restructuring which experienced a decline in high-margin revenues and lower project performance associated with FRP project activity in our North American operation and lower project performances in CIPP contracting installation services activity in Australia and Denmark within our Asia-Pacific and European operations, respectively. Substantially offsetting the decrease in gross profit in Infrastructure Solutions was an increase in our North American operation primarily driven by higher CIPP revenues and an expense of $3.6 million in 2016 related to the recognition of inventory step up expense associated with the acquisition of Underground Solutions.
Gross profit margin improved 30 basis points to 21.0% in 2017 compared to 20.7% in 2016. The improvement was primarily due to higher gross profit margin performance in Corrosion Protection driven by higher margin projects and improved project performance, specifically related to the large deepwater project and international project activities noted above, and higher gross profit margin in Energy Services resulting from improved project performance, project mix and the elimination of cost overruns on certain isolated lump sum construction projects associated with the downsizing of our upstream operation in 2016. Partially offsetting the increases in gross profit margin was a decrease in Infrastructure Solutions primarily due to lower project performances in CIPP contracting installation services activity in Australia and Denmark within our Asia-Pacific and European operations, respectively, and in FRP project activity in our North American operation.
Operating Expenses
Operating expenses increased $28.7 million, or 14.6%, to $225.8 million in 2017 compared to $197.1 million in 2016. Included within operating expenses are restructuring charges totaling $11.0 million and $6.2 million in 2017 and 2016, respectively. Excluding these charges, operating expenses increased $23.9 million, or 12.5%, to $214.8 million in 2017 compared to $190.9 million in 2016. The increase in operating expenses was primarily due to: (i) an $8.4 million increase in Infrastructure Solutions, mostly driven by incremental operating expense contributions from acquisitions made in 2017 and 2016 and investments made to hire professional sales and administrative staff to facilitate continued growth in our North American operation; (ii) a $10.5 million increase in Corrosion Protection mainly due to increased incentive compensation expense, higher bad debt reserves, gains from sales of fixed assets in 2016 and added sales and administrative support costs; and (iii) a $5.0 million increase in Energy Services resulting from a $4.1 million decrease in reserves for certain Brinderson pre-acquisition matters in 2016, increased incentive compensation expense and an increase in general and administrative costs to support continued growth.
Operating expenses as a percentage of revenues were 16.6% and 16.1% in 2017 and 2016, respectively. Excluding restructuring charges, operating expenses as a percentage of revenues were 15.8% and 15.6% in 2017 and 2016, respectively.
Consolidated Net Income (Loss)
Consolidated net income (loss) decreased $98.5 million, or (334.2)%, to a consolidated net loss of $69.1 million in 2017, from consolidated net income of $29.5 million in 2016. Included in consolidated net income (loss) were the following items: (i) goodwill impairment charges of $45.4 million ($42.2 million post-tax) in 2017; (ii) definite-lived intangible asset impairment charges of $41.0 million ($36.4 million post-tax) in 2017; (iii) restructuring charges of $24.0 million ($20.8 million post-tax) and $15.9 million ($10.2 million post-tax) in 2017 and 2016, respectively; (iv) gain on a litigation settlement of $6.6 million ($4.0 million post-tax) in 2016; and (v) acquisition and divestiture expenses of $3.1 million ($2.0 million post-tax) and $2.7 million ($2.2 million post-tax) in 2017 and 2016, respectively.
Excluding the above items, consolidated net income decreased $5.6 million, or 14.7%, to $32.4 million in 2017 from $37.9 million in 2016. The decrease was due to: (i) lower gross profit primarily from performances in operations that are included in our 2017 Restructuring within Infrastructure Solutions; (ii) an increase in consolidated operating expenses; (iii) negative impacts from foreign currency losses; and (iv) higher tax expense primarily due to negative impacts associated with changes in tax valuation allowances and a $2.4 million charge related to TCJA. Partially offsetting the decreases in consolidated net income noted above were higher revenues and related gross profit in Corrosion Protection and Energy Services.
2016 Compared to 2015
Revenues
Revenues decreased $111.7 million, or 8.4%, to $1,221.9 million in 2016 compared to $1,333.6 million in 2015. The decrease in revenues was due to a $90.5 million decline in revenues in Energy Services primarily resulting from our decision in the first quarter of 2016 to downsize our exposure to the upstream energy market due to the effects of lower oil prices and a decrease in refinery clean-up, construction and turnaround services activities. Revenues in Corrosion Protection decreased
40
$36.4 million mainly due to: (i) a decrease in Canadian upstream, and to a lesser extent midstream, project activity attributable to a decline in client spending on crude oil projects as well as a $25.3 million revenue decline associated with the sale of our Canadian pipe coating joint venture interest in February 2016; (ii) a decrease in domestic upstream project activity; and (iii) the completion of certain large international projects performed primarily in 2015 and completed in early 2016. Revenues in Infrastructure Solutions increased $15.3 million primarily due to our acquisition of Underground Solutions in February 2016 and an increase in CIPP contracting installation services activity in our North American operation, partially offset by decreases in FRP project activity in our North American operation and international CIPP contracting installation services activity.
Gross Profit and Gross Profit Margin
Gross profit decreased $22.6 million, or 8.2%, to $253.2 million in 2016 compared to $275.8 million in 2015. As part of our restructuring efforts, we recognized charges totaling $0.3 million and $2.7 million in 2016 and 2015, respectively. Excluding restructuring charges, gross profit decreased $25.0 million, or 9.0%, to $253.5 million in 2016 compared to $278.5 million in 2015. The decrease in gross profit was primarily due to a $10.0 million decrease in Corrosion Protection and a $14.5 million decrease in Energy Services primarily due to declines in revenues, as noted above, and added costs associated with certain challenging international projects in Corrosion Protection. Gross profit in Infrastructure Solutions increased $1.8 million largely driven by changes in our North American operation which included increased CIPP contracting installation services activity and the contribution from Underground Solutions, partially offset by a decline in higher margin, emergency large diameter FRP pressure pipe project activity.
Gross profit margin remained consistent at 20.7% in 2016 and 2015. Excluding restructuring charges, gross profit margin declined 20 basis points to 20.7% in 2016 from 20.9% in 2015. Gross profit margin declined primarily due to the negative impacts from challenging upstream energy market conditions in Corrosion Protection and decreased labor and equipment utilization in our international CIPP operations in Infrastructure Solutions, partially offset by the higher margin contribution from Infrastructure Solutions’ Underground Solutions business and improved margins in Energy Services.
Operating Expenses
Operating expenses decreased $12.4 million, or 5.9%, to $197.1 million in 2016 compared to $209.5 million in 2015. We recognized restructuring charges of $6.2 million and $4.4 million in 2016 and 2015, respectively. In 2015, we recorded a loss reserve of $2.9 million related to a long-dated accounts receivable in Corrosion Protection and a loss reserve of $2.8 million related to a legal matter in Infrastructure Solutions. Excluding restructuring charges and noted loss reserves, operating expenses decreased $8.5 million, or 4.3%, to $190.9 million in 2016 compared to $199.4 million in 2015.
The decrease in operating expenses was primarily due to our restructuring efforts, which generated cost savings mainly in Energy Services’ upstream operation and Corrosion Protection’s upstream and midstream operations. Included in the decrease in operating expenses was an offset to operating expenses related to favorable reductions in reserves for certain Brinderson pre-acquisition matters in Energy Services and a decrease related to the sale of our Canadian pipe coating operation in Corrosion Protection. Partially offsetting the decrease in operating expenses was an increase in Infrastructure Solutions primarily related to the acquisition of Underground Solutions.
Operating expenses as a percentage of revenues were 16.1% and 15.7% in 2016 and 2015, respectively. Excluding restructuring charges and loss reserves noted above, operating expenses as a percentage of revenues were 15.6% and 15.0% in 2016 and 2015, respectively.
Consolidated Net Income (Loss)
Consolidated net income (loss) increased $37.6 million, or 465.5%, to $29.5 million in 2016, from a consolidated net loss of $8.1 million in 2015. Included in consolidated net income (loss) were the following items: (i) restructuring charges of $15.9 million ($10.2 million post-tax) and $11.0 million ($8.7 million post-tax) in 2016 and 2015, respectively; (ii) goodwill impairment charges of $43.5 million ($35.7 million post-tax) in 2015; (iii) loss reserves of $2.9 million ($1.1 million post-tax) in 2015 related to long-dated accounts receivable; (iv) a loss reserve of $2.8 million ($1.7 million post-tax) related to a legal matter in 2015; (v) gain on a litigation settlement of $6.6 million ($4.0 million post-tax) in 2016; (vi) loss on divestitures of $0.8 million ($1.4 million post-tax) in 2015; (vii) credit facility arrangement fees of $3.4 million ($2.0 million post-tax) in 2015; and (viii) acquisition and divestiture expenses of $2.7 million ($2.2 million post-tax) and $1.9 million ($4.7 million post-tax) in 2016 and 2015, respectively.
Excluding the above items, consolidated net income decreased $9.3 million, or 19.7%, to $37.9 million in 2016 from $47.2 million in 2015. This decrease was primarily due to declining revenues and gross profit related to the negative impacts from the low oil price environment in Energy Services and Corrosion Protection, partially offset by an increase in revenues and gross profit in Infrastructure Solutions. Operating expenses favorably impacted consolidated net income as a result of operating expense savings associated with our restructuring efforts and decreases in reserves for certain Brinderson pre-acquisition matters noted above, partially offset by the operating expense contribution from Underground Solutions. Consolidated net income in 2016, as compared to 2015, was negatively impacted by an increase in interest expense due to higher borrowing
41
costs and higher debt balances, but positively benefited from the $4.2 million reversal of a previously recorded valuation allowance due to changes in the realization of future tax benefits.
Contract Backlog
Contract backlog is our expectation of revenues to be generated from received, signed and uncompleted contracts, the cancellation of which is not anticipated at the time of reporting. We assume these signed contracts are funded. For government or municipal contracts, our customers generally obtain funding through local budgets or pre-approved bond financing. We have not undertaken a process to verify funding status of these contracts and, therefore, cannot reasonably estimate what portion, if any, of contracts in backlog have not been funded. However, we have little history of signed contracts being canceled due to the lack of funding. Contract backlog excludes any term contract amounts for which there are not specific and determinable work releases and projects where we have been advised that we are the low bidder, but have not formally been awarded the contract.
The following table summarizes our consolidated backlog by segment (in millions):
December 31, | |||||||||||
2017 | 2016 | 2015 | |||||||||
Infrastructure Solutions | $ | 328.9 | $ | 283.4 | $ | 311.2 | |||||
Corrosion Protection (1) | 155.7 | 213.4 | 272.5 | ||||||||
Energy Services | 207.8 | 192.8 | 192.8 | ||||||||
Total backlog | $ | 692.4 | $ | 689.6 | $ | 776.5 | |||||
_________________________________
(1) | December 31, 2017, 2016 and 2015 included backlog from our large domestic pipe coating and insulation contract of $3.5 million, $96.8 million and $134.3 million, respectively. |
Included within backlog for Energy Services are amounts that represent expected revenues to be realized under long-term MSAs and other signed contracts. If the remaining term of these arrangements exceeds 12 months, the unrecognized revenues attributable to such arrangements included in backlog are limited to only the next 12 months of expected revenues. Although backlog represents only those contracts and MSAs that are considered to be firm, there can be no assurance that cancellation or scope adjustments will not occur with respect to such contracts.
Within our Infrastructure Solutions and Corrosion Protection segments, certain contracts are performed through our variable interest entities, in which we own a controlling portion of the entity. As of December 31, 2017, 0.5% and 15.0% of our Infrastructure Solutions backlog and Corrosion Protection backlog, respectively, related to these variable interest entities. A substantial majority of our contracts in these two segments are fixed price contracts with individual private businesses and municipal and federal government entities across the world. Energy Services, however, generally enters into cost reimbursable contracts that are based on costs incurred at agreed upon contractual rates.
In accordance with industry practice, substantially all of our contracts are subject to cancellation or termination at the discretion of the customer. In a situation where a customer terminates a contract, we would ordinarily be entitled to receive payment for work performed up to the date of termination and, in certain circumstances, we may be entitled to allowable termination and cancellation costs. There were no significant cancellations in 2017.
While management uses all information available to it to determine backlog, our backlog at any given time is subject to changes in the scope of services to be provided as well as increases or decreases in costs relating to the contracts included therein. Accordingly, backlog is not necessarily a reliable indicator of future revenues.
Total contract backlog increased $2.8 million, or 0.4%, to $692.4 million at December 31, 2017 from $689.6 million at December 31, 2016. The increase in backlog was due to several factors, including: (i) robust activity in the North American CIPP market; (ii) increase attributable to Environmental Techniques, which was acquired in 2017; (iii) sizable contract awards in Corrosion Protection for onshore and offshore gas field development in the Middle East; and (iv) increased market share on the West Coast of the United States, primarily California, for our maintenance services activities in Energy Services. Substantially offsetting these increases in total backlog was a decrease related to work performed during 2017 on the large domestic pipe coating and insulation contract included in backlog at December 31, 2016 within Corrosion Protection. Excluding this particular project, backlog at December 31, 2017 increased $96.1 million, or 16.2%, from December 31, 2016.
Consolidated customer orders, net of cancellations (“New Orders”), increased $227.5 million, or 20.0%, to $1,362.3 million in 2017 compared to $1,134.9 million in 2016. New Orders in 2015 were $1,352.1 million and bolstered by the $134 million domestic pipe coating and insulation contract award.
42
Subject to factors discussed in Item 1A – “Risk Factors”, we estimate that approximately $682.4 million, or 98.6%, of total backlog at December 31, 2017 will be realized as revenues in 2018.
Segment Results
Infrastructure Solutions Segment
Key financial data for Infrastructure Solutions was as follows:
2017 vs 2016 | 2016 vs 2015 | ||||||||||||||||||||||||
(dollars in thousands) | Years Ended December 31, | Increase (Decrease) | Increase (Decrease) | ||||||||||||||||||||||
2017 | 2016 | 2015 | $ | % | $ | % | |||||||||||||||||||
Revenues | $ | 612,154 | $ | 571,551 | $ | 556,234 | $ | 40,603 | 7.1 | % | $ | 15,317 | 2.8 | % | |||||||||||
Gross profit | 140,823 | 141,681 | 139,895 | (858 | ) | (0.6 | ) | 1,786 | 1.3 | ||||||||||||||||
Gross profit margin | 23.0 | % | 24.8 | % | 25.2 | % | N/A | (180 | )bp | N/A | (40 | )bp | |||||||||||||
Operating expenses | 106,397 | 89,477 | 90,928 | 16,920 | 18.9 | (1,451 | ) | (1.6 | ) | ||||||||||||||||
Goodwill impairment | 45,390 | — | — | 45,390 | N/M | — | N/M | ||||||||||||||||||
Definite-lived intangible asset impairment | 41,032 | — | — | 41,032 | N/M | — | N/M | ||||||||||||||||||
Gain on litigation settlement | — | (6,625 | ) | — | 6,625 | N/M | (6,625 | ) | N/M | ||||||||||||||||
Acquisition and divestiture expenses | 651 | 2,696 | 1,132 | (2,045 | ) | (75.9 | ) | 1,564 | 138.2 | ||||||||||||||||
Restructuring and related charges 1 | 9,160 | 2,630 | 968 | 6,530 | 248.3 | 1,662 | 171.7 | ||||||||||||||||||
Operating income (loss) | (61,807 | ) | 53,503 | 46,867 | (115,310 | ) | (215.5 | ) | 6,636 | 14.2 | |||||||||||||||
Operating margin | (10.1 | )% | 9.4 | % | 8.4 | % | N/A | (1,950 | )bp | N/A | 100 | bp | |||||||||||||
______________________________
1 See Note 3 to the consolidated financial statements contained in this Report for a complete accounting of all charges related to restructuring efforts.
“N/A” represents not applicable.
“N/M” represents not meaningful.
2017 Compared to 2016
Revenues
Revenues in Infrastructure Solutions increased $40.6 million, or 7.1%, to $612.2 million in 2017 compared to $571.6 million in 2016. The increase in revenues was primarily driven by record CIPP revenues in our North American operation. Revenues also improved as a result of an increase in CIPP contracting installation services activity in our European operation and FRP project activity in our Asia-Pacific operation, both of which benefited from business acquisitions in the second and third quarters of 2016, respectively. Partially offsetting the increases in revenues was a decrease in FRP project activity in our North American operation, specifically associated with non-pressure pipe FRP contracting installation services activity. As part of our 2017 Restructuring, we are exiting contracting installation services for non-pressure pipe FRP applications within the North American market.
Gross Profit and Gross Profit Margin
Gross profit in Infrastructure Solutions decreased $0.9 million, or 0.6%, to $140.8 million in 2017 compared to $141.7 million in 2016. Gross profit decreased primarily due to operations included in our 2017 Restructuring, which experienced a decline in high-margin revenues and lower project performance associated with FRP project activity in our North American operation and lower project performance in CIPP contracting installation services activity in Australia and Denmark within our Asia-Pacific and European operations, respectively. Substantially offsetting the decreases in gross profit were increases primarily driven by higher revenues within our North American operation associated with CIPP contracting installation services activity, royalty income from a $3.9 million license settlement and an expense of $3.6 million in 2016 related to the recognition of inventory step-up required in the accounting for business combinations related to the Underground Solutions acquisition in February 2016.
Gross profit margin declined 180 basis points to 23.0% in 2017 from 24.8% in 2016. Gross profit margin declined primarily due to the same factors impacting the changes in gross profit, as noted above.
43
Operating Expenses
Operating expenses in Infrastructure Solutions increased $16.9 million, or 18.9%, to $106.4 million in 2017 compared to $89.5 million in 2016. As part of our restructuring efforts, we recognized charges totaling $8.8 million and $0.3 million in 2017 and 2016, respectively, related to cost reduction efforts. Excluding restructuring charges, operating expenses increased $8.4 million, or 9.4%, to $97.6 million in 2017 compared to $89.2 million in 2016. The increase in operating expenses was primarily due to incremental operating expense contributions from acquisitions in the European CIPP market and the Asia-Pacific FRP market during 2017 and 2016, as well as the operating expense contribution from the acquisition of Underground Solutions in the first quarter of 2016. Operating expenses also increased as a result of investments in the hiring of experienced sales and business development professionals and administrative support costs to facilitate continued growth in our North American operation.
Operating expenses as a percentage of revenues were 17.4% and 15.7% in 2017 and 2016, respectively. Excluding restructuring charges, operating expenses as a percentage of revenues were 15.9% and 15.6% in 2017 and 2016, respectively.
Operating Income (Loss) and Operating Margin
Operating income (loss) in Infrastructure Solutions decreased $115.3 million, or 215.5%, to a loss of $61.8 million in 2017 compared to income of $53.5 million in 2016. Operating margin declined 1,950 basis points to (10.1)% in 2017 compared to 9.4% in 2016. Included in operating income (loss) were the following items: (i) goodwill impairment charges of $45.4 million in 2017; (ii) definite-lived intangible asset impairment charges of $41.0 million in 2017; (iii) restructuring charges of $18.1 million and $2.9 million in 2017 and 2016, respectively, primarily related to severance, extension of benefits, employee assistance programs, wind-down and other restructuring costs; (iv) acquisition and divestiture related expenses of $0.7 million and $2.7 million in 2017 and 2016, respectively; (v) inventory step-up expense of $3.6 million associated with the acquisition of Underground Solutions in 2016; and (vi) gain on litigation settlement of $6.6 million related to our FRP business in North America in 2016.
Excluding the above items, operating income decreased $12.8 million, or 22.7%, to $43.3 million in 2017 compared to $56.1 million in 2016 and operating margin declined 270 basis points to 7.1% in 2017 from 9.8% in 2016. Operating income and operating margin deceased primarily due to poor international CIPP project performances specifically in Australia and Denmark, declining revenues and lower project performance related to FRP project activity in our North American operation and higher operating expenses resulting from acquisitions and growth initiatives. Partially offsetting the decreases in operating income and operating margin were increases mainly driven by higher revenues and related gross profit from our North American CIPP operation, as discussed above.
2016 Compared to 2015
Revenues
Revenues in Infrastructure Solutions increased $15.3 million, or 2.8%, to $571.6 million in 2016 compared to $556.2 million in 2015. As part of the 2014 Restructuring, we exited certain foreign operations primarily in 2015. Excluding revenues from restructured operations, revenues in Infrastructure Solutions increased $23.3 million, or 4.3%, in 2016 compared to 2015. The increase in revenues was primarily driven by the $29.4 million contribution from Underground Solutions, which was acquired in February 2016, and to-date record CIPP revenues in our North American operation. Revenues in our European operation increased primarily due to the $4.9 million contribution from LMJ, which was acquired in June 2016. Partially offsetting the increases in revenues was a decrease in FRP project activity in North America, which included the completion of a large industrial project that was performed and completed in 2015, and a decrease in CIPP contracting installation services activity in our Asia-Pacific operation.
Gross Profit and Gross Profit Margin
Gross profit in Infrastructure Solutions increased $1.8 million, or 1.3%, to $141.7 million in 2016 compared to $139.9 million in 2015. We recognized restructuring charges of $0.1 million and $2.7 million in 2016 and 2015, respectively, related to costs associated with the exiting of certain foreign locations. Excluding restructuring charges, gross profit decreased $0.9 million, or 0.6%, to $141.7 million in 2016 compared to $142.6 million in 2015. The decrease in gross profit was primarily due to: (i) a decline in emergency, large diameter pressure pipe FRP project activity in our North American operation; (ii) a decline in CIPP contracting installation services activity, primarily related to project execution, in our Asia-Pacific operation; (iii) a decline in gross profit primarily due to lower labor and equipment utilization related to CIPP contracting installation services activity in our European operation; and (iv) an expense of $3.6 million in the first half of 2016 for the recognition of inventory step up related to the Underground Solutions acquisition. Substantially offsetting the decrease in gross profit were increases in our North American operation, which included the contribution from Underground Solutions and increased CIPP contracting installation services activity.
44
Gross profit margin declined 40 basis points to 24.8% in 2016 from 25.2% in 2015. Excluding restructuring charges, gross profit margin declined 80 basis points to 24.8% in 2016 from 25.6% in 2015. Gross profit margin declined mainly as a result of a decline in FRP project activity in our North American operation and, to a lesser extent, lower labor and equipment utilization related to CIPP project activities in our European and Asia-Pacific operations. Partially offsetting the declines in gross profit margin were increases related to higher margin project activity in Underground Solutions and greater efficiencies in CIPP project activity in our North American operation.
Operating Expenses
Operating expenses in Infrastructure Solutions decreased $1.5 million, or 1.6%, to $89.5 million in 2016 compared to $90.9 million 2015. As part of the 2016 Restructuring, we recognized charges totaling $0.6 million in 2016 related to cost reduction efforts. As part of the 2014 Restructuring, we recognized expense reversals totaling $0.3 million and charges totaling $4.4 million in 2016 and 2015, respectively, associated with the exiting of certain foreign locations. In 2015, we recorded a loss reserve of $2.8 million related to a legal matter. Excluding restructuring charges and the loss reserve related to a legal matter in 2015, operating expenses increased $5.4 million, or 6.5%, to $89.2 million in 2016 compared to $83.8 million in 2015. The increase in operating expenses was primarily due to the contribution from Underground Solutions since its acquisition in February 2016 and, to a lesser extent, operating expense contributions related to the acquisitions of LMJ, Concrete Solutions and Fyfe Europe in 2016. Partially offsetting the increases in operating expenses were decreases related to cost savings in our FRP and CIPP businesses in our North American operation.
Operating expenses as a percentage of revenues were 15.7% and 16.3% in 2016 and 2015, respectively. Excluding restructuring charges and the loss reserve noted above, operating expenses as a percentage of revenues were 15.6% and 15.1% in 2016 and 2015, respectively.
Operating Income and Operating Margin
Operating income in Infrastructure Solutions increased $6.6 million, or 14.2%, to $53.5 million in 2016 compared to $46.9 million in 2015. Operating margin increased 100 basis points to 9.4% in 2016 compared to 8.4% in 2015. Included in operating income were the following items: (i) gain on litigation settlement of $6.6 million related to our FRP business in North America in 2016; (ii) restructuring charges of $2.9 million and $8.1 million in 2016 and 2015, respectively, primarily related to severance, extension of benefits, employee assistance programs, wind-down and other restructuring costs; (iii) inventory step-up expense of $3.6 million associated with the acquisition of Underground Solutions in 2016; (iv) acquisition-related expenses of $2.7 million and $1.1 million in 2016 and 2015, respectively; and (v) a loss reserve of $2.8 million related to a legal matter in 2015.
Excluding the above items, operating income decreased $2.8 million, or 4.7%, to $56.1 million in 2016 compared to $58.8 million in 2015 and operating margin declined 80 basis points to 9.8% in 2016 from 10.6% in 2015. These decreases were primarily driven by a decline in FRP project activity in our North American operation, a decline in profitability in CIPP project activity from lower labor and equipment utilization in our European operation and a decline in CIPP contracting installation services activity mainly due to delays in project timing in our Asia-Pacific operation. Partially offsetting the decreases in operating income and operating margin were increases primarily related to our North American operation, which benefited from increased CIPP contracting installation services activity, improved efficiencies and the contribution from Underground Solutions.
45
Corrosion Protection Segment
Key financial data for Corrosion Protection was as follows:
2017 vs 2016 | 2016 vs 2015 | ||||||||||||||||||||||||
(dollars in thousands) | Years Ended December 31, | Increase (Decrease) | Increase (Decrease) | ||||||||||||||||||||||
2017 | 2016 | 2015 | $ | % | $ | % | |||||||||||||||||||
Revenues | $ | 456,139 | $ | 401,469 | $ | 437,921 | $ | 54,670 | 13.6 | % | $ | (36,452 | ) | (8.3 | )% | ||||||||||
Gross profit | 108,240 | 83,269 | 93,220 | 24,971 | 30.0 | (9,951 | ) | (10.7 | ) | ||||||||||||||||
Gross profit margin | 23.7 | % | 20.7 | % | 21.3 | % | N/A | 300 | bp | N/A | (60 | )bp | |||||||||||||
Operating expenses | 89,877 | 77,657 | 84,577 | 12,220 | 15.7 | (6,920 | ) | (8.2 | ) | ||||||||||||||||
Goodwill impairment | — | — | 9,957 | — | N/M | (9,957 | ) | N/M | |||||||||||||||||
Acquisition and divestiture expenses | 2,272 | — | 457 | 2,272 | N/M | (457 | ) | N/M | |||||||||||||||||
Restructuring and related charges 1 | 3,654 | 3,803 | — | (149 | ) | (3.9 | ) | 3,803 | N/M | ||||||||||||||||
Operating income (loss) | 12,437 | 1,809 | (1,771 | ) | 10,628 | 587.5 | 3,580 | (202.1 | ) | ||||||||||||||||
Operating margin | 2.7 | % | 0.5 | % | (0.4 | )% | N/A | 220 | bp | N/A | 90 | bp | |||||||||||||
______________________________
1 See Note 3 to the consolidated financial statements contained in this Report for a complete accounting of all charges related to restructuring efforts.
“N/A” represents not applicable.
“N/M” represents not meaningful.
2017 Compared to 2016
Revenues
Revenues in Corrosion Protection increased $54.7 million, or 13.6%, to $456.1 million in 2017 compared to $401.5 million in 2016. The increase was primarily due to a $46.2 million increase in revenues in our pipe coating and insulation operation, which included revenues from the substantial completion of a large deepwater project totaling $93.6 million and $40.1 million in 2017 and 2016, respectively. Also contributing to the increase in revenues was an increase in international project activities, primarily in the Middle East and North America, in our coating services and industrial linings operations. Partially offsetting the increases in revenues was a decline in revenues in our cathodic protection operation, primarily in North America and Europe, as well as a decline in domestic revenues in our industrial linings operation.
Gross Profit and Gross Profit Margin
Gross profit in Corrosion Protection increased $25.0 million, or 30.0%, to $108.2 million in 2017 compared to $83.3 million in 2016. The increase in gross profit was substantially due to production on a large deepwater project in our pipe coating and insulation operation and, to a lesser extent, increased gross profit in our coating services operation driven primarily from project activities in the Middle East and in our industrial linings operation generated primarily from project activities in several international countries. Partially offsetting the increases in gross profit was a decrease in our cathodic protection operation resulting from project mix and isolated project performance issues in the United States and weaker oil and gas market conditions in Canada.
Gross profit margin improved 300 basis points to 23.7% in 2017 from 20.7% in 2016 primarily due to higher margins generated from a large deepwater project in our pipe coating and insulation operation and higher margin projects performed in the Middle East in our coating services, industrial linings and cathodic protection operations. Partially offsetting the increases in gross profit margin was a decline resulting from project mix and isolated project performance issues in the United States in our cathodic protection operation.
Operating Expenses
Operating expenses in Corrosion Protection increased $12.2 million, or 15.7%, to $89.9 million in 2017 compared to $77.7 million in 2016. As a part of our restructuring efforts, we recognized charges of $2.2 million and $0.5 million in 2017 and 2016, respectively, related to the downsizing of certain midstream and upstream operations. Excluding these restructuring charges, operating expenses increased $10.5 million, or 13.5%, to $87.6 million in 2017 compared to $77.2 million in 2016. The increase in operating expenses was primarily due to increased incentive compensation expense, higher bad debt reserves, gains from sales of fixed assets in 2016 and added sales and administrative support costs.
46
Operating expenses as a percentage of revenues were 19.7% and 19.3% in 2017 and 2016, respectively. Excluding restructuring charges, as noted above, operating expenses as a percentage of revenues were 19.2% and 19.2% in 2017 and 2016, respectively.
Operating Income and Operating Margin
Operating income in Corrosion Protection increased $10.6 million, or 587.5%, to $12.4 million in 2017 compared to $1.8 million in 2016. Operating margin improved 220 basis points to 2.7% in 2017 compared to 0.5% in 2016. Included in operating income were the following items: (i) restructuring charges of $5.9 million and $4.6 million in 2017 and 2016, respectively, related to employee severance, retention, extension of benefits, employee assistance programs, early lease termination, wind-down and other restructuring costs; and (ii) acquisition and divestiture related expenses of $2.3 million in 2017 primarily related to the planned sale of our pipe coating and insulation operation.
Excluding restructuring charges and acquisition and divestiture expenses, operating income increased $14.3 million, or 223.6%, to $20.6 million in 2017 compared to $6.4 million in 2016 and operating margin improved 290 basis points to 4.5% in 2017 from 1.6% in 2016. The increases in operating income and operating margin were substantially due to increased gross profit and related gross profit margin contribution from a large deepwater project in our pipe coating and insulation operation and, to a lesser extent, increased contribution from international project activities primarily in the Middle East in our coating services operation, partially offset by a lower contribution from our cathodic protection operation and increased operating expenses, as noted above.
2016 Compared to 2015
Revenues
Revenues in Corrosion Protection decreased $36.5 million, or 8.3%, to $401.5 million in 2016 compared to $437.9 million in 2015. The decrease in revenues was primarily due to a $43.2 million decline in revenues generated from our Canadian operations, which included a $25.3 million decline related to the sale of our Canadian pipe coating and insulation operation in February 2016, as weak Canadian market conditions negatively impacted our cathodic protection and industrial linings operations. Also contributing to the decrease in revenues was a decline in project activities in the Middle East primarily in our cathodic protection and industrial linings operations and the completion of a large coating services project in South America. Partially offsetting the decreases in revenues were increases primarily due to revenues of $40.1 million in 2016 generated from a large deepwater project which commenced in 2016 in our pipe coating and insulation operation in Louisiana, increased project activities in our domestic and European cathodic protection operation and increased project activities in our coating services operation in the Middle East.
Gross Profit and Gross Profit Margin
Gross profit in Corrosion Protection decreased $10.0 million, or 10.7%, to $83.3 million in 2016 compared to $93.2 million in 2015. As part of our restructuring efforts, we recognized charges of $0.3 million in 2016 related to the downsizing of certain upstream and midstream operations. Excluding restructuring charges, gross profit decreased $9.7 million, or 10.4%. The decrease in gross profit was primarily due to a $11.7 million decline in gross profit generated from our Canadian operations, which included a $4.7 million decline related to the sale of our Canadian pipe coating and insulation operation, as project activity in Canada declined as noted above. Also contributing to the decrease in gross profit were added costs on certain challenging coating services projects in the Middle East and a large coating services project in South America performed mostly in 2015 and completed in early 2016. Partially offsetting the decreases in gross profit were increases primarily related to production on a large deepwater project in our pipe coating and insulation operation in Louisiana, increased project activities in our domestic as well as European cathodic protection operation and increased project activities in the United States in our industrial linings operation. Improved efficiencies resulting from our restructuring efforts in 2016 also led to higher gross profit generated in our cathodic protection operation.
Gross profit margin declined 60 basis points to 20.7% in 2016 from 21.3% in 2015. Excluding restructuring charges, gross profit margin declined 50 basis points in 2016 from 2015. The decrease in gross profit margin was primarily due to added costs on certain coating services projects in the Middle East as well as lower labor and equipment utilization in our Canadian operations. Partially offsetting the decreases in gross profit margin were increases primarily related to higher margins generated from a large deepwater project in our pipe coating and insulation operation, higher margin work in our domestic industrial linings operation and improved efficiencies resulting from our restructuring efforts in 2016 in our cathodic protection operation.
Operating Expenses
Operating expenses in Corrosion Protection decreased $6.9 million, or 8.2%, to $77.7 million in 2016 compared to $84.6 million in 2015. Excluding restructuring charges of $0.5 million in 2016 and loss reserves of $2.9 million related to long-dated accounts receivable in 2015, operating expenses decreased $4.5 million, or 5.5%, to $77.2 million in 2016 compared to $81.7
47
million in 2015. The decrease in operating expenses was primarily due to cost savings associated with our restructuring plan and other controlled spending efforts in a period of declining revenues. Also contributing to the decrease in operating expenses was a $1.6 million decline in operating expenses related to the sale of our Canadian pipe coating operation.
Operating expenses as a percentage of revenues were 19.3% and 19.3% in 2016 and 2015, respectively. Excluding restructuring charges in 2016 and the loss reserves in 2015, as noted above, operating expenses as a percentage of revenues were 19.2% and 18.7% in 2016 and 2015, respectively.
Operating Income (Loss) and Operating Margin
Operating income in Corrosion Protection increased $3.6 million, or 202.1%, to $1.8 million in 2016 compared to a loss of $1.8 million in 2015. Operating margin improved 90 basis points to 0.5% in 2016 compared to (0.4)% in 2015. Included in operating income (loss) were the following items: (i) restructuring charges of $4.6 million in 2016 related to employee severance, retention, extension of benefits, employee assistance programs, wind-down and other restructuring costs; (ii) goodwill impairment charges of $10.0 million in 2015; (iii) loss reserves of $2.9 million in 2015 related to a long-dated accounts receivable; and (iv) acquisition and divestiture related expenses of $0.5 million in 2015.
Excluding the above items, operating income decreased $5.2 million, or 44.7%, to $6.4 million in 2016 compared to $11.5 million in 2015 and operating margin declined 100 basis points to 1.6% in 2016 from 2.6% in 2015. These decreases were mainly due to declining revenues and gross profit, as noted above, partially offset by operating expense savings primarily generated from cost saving initiatives associated with our restructuring efforts in 2016.
Energy Services Segment
Key financial data for Energy Services was as follows:
2017 vs 2016 | 2016 vs 2015 | ||||||||||||||||||||||||
(dollars in thousands) | Years Ended December 31, | Increase (Decrease) | Increase (Decrease) | ||||||||||||||||||||||
2017 | 2016 | 2015 | $ | % | $ | % | |||||||||||||||||||
Revenues | $ | 290,726 | $ | 248,900 | $ | 339,415 | $ | 41,826 | 16.8 | % | $ | (90,515 | ) | (26.7 | )% | ||||||||||
Gross profit | 35,749 | 28,214 | 42,672 | 7,535 | 26.7 | (14,458 | ) | (33.9 | ) | ||||||||||||||||
Gross profit margin | 12.3 | % | 11.3 | % | 12.6 | % | N/A | 100 | bp | N/A | (130 | )bp | |||||||||||||
Operating expenses | 29,552 | 29,965 | 33,972 | (413 | ) | (1.4 | ) | (4,007 | ) | (11.8 | ) | ||||||||||||||
Goodwill impairment | — | — | 33,527 | — | N/M | (33,527 | ) | N/M | |||||||||||||||||
Acquisition and divestiture expenses | — | — | 323 | — | N/M | (323 | ) | N/M | |||||||||||||||||
Restructuring and related charges 1 | — | 2,735 | — | (2,735 | ) | N/M | 2,735 | N/M | |||||||||||||||||
Operating income (loss) | 6,197 | (4,486 | ) | (25,150 | ) | 10,683 | 238.1 | 20,664 | (82.2 | ) | |||||||||||||||
Operating margin | 2.1 | % | (1.8 | )% | (7.4 | )% | N/A | 390 | bp | N/A | 560 | bp | |||||||||||||
______________________________
1 See Note 3 to the consolidated financial statements contained in this Report for a complete accounting of all charges related to restructuring efforts.
“N/A” represents not applicable.
“N/M” represents not meaningful.
2017 Compared to 2016
Revenues
Revenues in Energy Services increased $41.8 million, or 16.8%, to $290.7 million in 2017 compared to $248.9 million in 2016. The increase was primarily due to turnaround services activity generated from an increase in the number of turnaround plans performed in 2017 and the related turnaround labor volume, which more than doubled in 2017 compared to 2016. An increase in construction and maintenance services activities also contributed to the increase in revenues. These increases in revenues were the result of increased demand from existing customers, coupled with expanded market share from various customers primarily on the West Coast of the United States.
Gross Profit and Gross Profit Margin
Gross profit in Energy Services increased $7.5 million, or 26.7%, to $35.7 million in 2017 compared to $28.2 million in 2016. The increase in gross profit was primarily due to improved revenues, as noted above, and improved project performance and project mix in turnaround, construction and maintenance services activities. Also contributing to the increase in gross
48
profit was the elimination of cost overruns mainly from certain isolated lump sum construction projects in the first half of 2016 associated with the downsizing of our upstream operation in 2016.
Gross profit margin improved 100 basis points to 12.3% in 2017 compared to 11.3% in 2016 primarily due to improved project performance, project mix and the elimination of cost overruns on certain isolated lump sum construction projects, as discussed above.
Operating Expenses
Operating expenses in Energy Services decreased $0.4 million, or 1.4%, to $29.6 million in 2017 compared to $30.0 million in 2016. As part of our restructuring efforts, we recognized charges of $5.4 million in 2016 primarily related to downsizing our upstream operation. Excluding restructuring charges, operating expenses increased $5.0 million, or 20.5%, primarily due to a $4.1 million decrease in reserves for certain Brinderson pre-acquisition matters in 2016, increased incentive compensation expense and an increase in general and administrative expenses to support continued growth of the business.
Operating expenses as a percentage of revenues were 10.2% and 12.0% in 2017 and 2016, respectively. Excluding restructuring charges noted above, operating expenses as a percentage of revenues were 10.2% and 9.9% in 2017 and 2016, respectively.
Operating Income (Loss) and Operating Margin
Operating income (loss) in Energy Services increased $10.7 million, or 238.1%, to income of $6.2 million in 2017 compared to a loss of $4.5 million in 2016. Operating margin improved 390 basis points to 2.1% in 2017 from (1.8)% in 2016. Included in operating income (loss) were restructuring charges of $8.2 million in 2016 primarily related to severance, retention, extension of benefits, employee assistance programs, wind-down, early lease termination and other restructuring costs related to the downsizing of our upstream operation.
Excluding restructuring charges, operating income increased $2.5 million, or 68.2%, to $6.2 million in 2017 compared to $3.7 million in 2016 and operating margin improved 60 basis points to 2.1% in 2017 compared to 1.5% in 2016. These increases were primarily due to higher revenues and related gross profit generated from increased turnaround, construction and maintenance services activities, partially offset by an increase in operating expenses, as discussed above.
2016 Compared to 2015
Revenues
Revenues in Energy Services decreased $90.5 million, or 26.7%, to $248.9 million in 2016 compared to $339.4 million in 2015. The decrease was substantially due to a decline in revenues of $68.3 million related to upstream projects, located primarily in Central California and the Permian Basin, with the majority of the decline affecting upstream maintenance services activity and, to a lesser extent, upstream construction services activity. As part of the 2016 Restructuring, we significantly reduced our exposure to the upstream energy market in response to challenging upstream energy market conditions. Also contributing to the decrease in revenues was a decline in maintenance services activity, primarily driven by reduced refinery clean-up, and a decline in construction and turnaround services activities.
Gross Profit and Gross Profit Margin
Gross profit in Energy Services decreased $14.5 million, or 33.9%, to $28.2 million in 2016 compared to $42.7 million in 2015. The decrease in gross profit was primarily due to declining revenues, as noted above, and cost overruns mainly on certain isolated lump sum construction projects in the first half of 2016 associated with the downsizing of our upstream operation.
Gross profit margin declined 130 basis points to 11.3% in 2016 compared to 12.6% in 2015 primarily due to the cost overruns mentioned above, a decline in higher margin refinery clean-up work as part of maintenance services activity, and a decline in higher margin construction and turnaround services activities.
Operating Expenses
Operating expenses in Energy Services decreased $4.0 million, or 11.8%, to $30.0 million in 2016 compared to $34.0 million in 2015. Included in operating expenses in 2016 were restructuring charges of $5.4 million primarily related to the downsizing our upstream operation. Excluding restructuring charges, operating expenses decreased $9.4 million, or 27.8%, primarily due to controlled spending efforts as well as reserve decreases totaling $4.1 million in 2016 for certain Brinderson pre-acquisition matters and a $0.7 million expense in 2015 for severance related costs due to organizational leadership changes.
Operating expenses as a percentage of revenues were 12.0% and 10.0% in 2016 and 2015, respectively. Excluding restructuring charges noted above, operating expenses as a percentage of revenues were 9.9% and 10.0% in 2016 and 2015, respectively.
49
Operating Loss and Operating Margin
Operating loss in Energy Services decreased $20.7 million, or 82.2%, to a loss of $4.5 million in 2016 compared to a loss of $25.2 million in 2015. Operating margin improved 560 basis points to (1.8)% in 2016 from (7.4)% in 2015. Included in operating loss were the following items: (i) restructuring charges of $8.2 million in 2016 primarily related to severance, retention, extension of benefits, employee assistance programs, wind-down, early lease termination and other restructuring costs related to the downsizing of our upstream operation; (ii) goodwill impairment charges of $33.5 million in 2015; and (iii) acquisition-related expenses of $0.3 million in 2015 related to the purchase of Schultz.
Excluding the above items, operating income decreased $5.0 million, or 57.6%, to $3.7 million in 2016 compared to $8.7 million in 2015 and operating margin declined 110 basis points to 1.5% in 2016 compared to 2.6% in 2015. These decreases were primarily due to decreases in revenues and related impacts to gross profit and gross profit margins, as noted above, partially offset by reduced operating expenses resulting from restructuring efforts and a reduction in reserves related to certain Brinderson pre-acquisition matters.
Other Income (Expense)
Interest Income and Expense
Interest income decreased less than $0.1 million in 2017 compared to 2016. Interest expense increased by $1.0 million to $16.0 million in 2017 compared to $15.0 million in 2016. Interest expense increased primarily due to rising LIBOR-based borrowing costs under our Credit Facility, partially offset by reduced outstanding loan principal balances during 2017 compared to 2016.
Interest income decreased less than $0.1 million in 2016 compared to 2015. Interest expense decreased by $1.0 million to $15.0 million in 2016 compared to $16.0 million in 2015.
During the fourth quarter of 2015, we recognized charges of $3.4 million related to certain arrangement fees associated with securing our new $650.0 million senior secured credit facility as well as the write-off of previously unamortized deferred financing costs. Excluding these prior year charges, interest expense increased $2.4 million in 2016 compared to 2015 due to higher borrowing costs under our new Credit Facility, higher debt balances resulting from the February 2016 acquisition of Underground Solutions and an increase in amortized loan fees.
Other Income (Expense)
Other expense was $2.2 million in 2017 and primarily consisted of foreign currency transaction losses. Other expense was $0.7 million in 2016 and primarily consisted of foreign currency transaction losses, partially offset by the release of cumulative currency translation gains related to disposed entities. Other expense was $2.9 million in 2015 and primarily related to foreign currency transaction losses, the $2.9 million loss recognized on the sale of Video Injection - Insituform SAS and the $0.6 million loss recognized on the sale of BPPC (both of which are discussed in Note 1 to the consolidated financial statements contained in this Report), partially offset by income of $0.8 million related to a settlement of escrow claims for the acquisition of CRTS, Inc. (as discussed in Note 1 to the consolidated financial statements contained in this Report) and the recorded gains of approximately $0.7 million on the sale of certain assets related to our restructured entities.
Taxes on Income (Loss)
On December 22, 2017, the U.S. government enacted the TCJA. The TCJA includes significant changes to the U.S. corporate income tax system including: (i) a federal corporate rate reduction from 35% to 21%; (ii) limitations on the deductibility of interest expense and executive compensation; (iii) creation of new minimum taxes such as the Global Intangible Low Taxed Income (“GILTI”) tax and the base erosion anti-abuse tax (“BEAT”); and (iv) the transition of U.S. international taxation from a worldwide tax system to a modified territorial tax system, which will result in a one time U.S. tax liability on those earnings that have not previously been repatriated to the U.S.
Taxes on income (loss) decreased $1.1 million to $5.0 million in 2017 compared to $6.1 million in 2016. Our effective tax rate was negative 8.2% and 17.3% in 2017 and 2016, respectively. The effective tax rate in 2017 was unfavorably impacted by (i) charges associated with the TCJA, which resulted in additional income tax expense of $2.4 million. The expense is primarily related to the TCJA’s transition tax on previously unremitted earnings of non-U.S. subsidiaries offset by the release of a deferred tax liability on unremitted foreign earnings; (ii) significant pre-tax charges primarily related to goodwill impairment, which were not deductible for tax purposes; and (iii) the impact of establishing valuation allowances on deferred tax assets in jurisdictions where we are unlikely to recognize these benefits.
Taxes on income decreased $3.1 million to $6.1 million in 2016 compared to $9.2 million in 2015. The effective tax rate in 2016 was positively impacted by: (i) a $4.2 million net benefit, or 11.8% benefit to the effective tax rate, related to
50
reductions of previously recorded valuation allowances in the U.S., due to changes in the realization of future tax benefits and deferred tax composition changes; and (ii) a $2.6 million net benefit from foreign tax rate differences primarily related to earnings from Europe. Partially offsetting these benefits was: (i) a $1.4 million increase in the valuation allowance on certain net operating losses and deferred tax assets in foreign jurisdictions, primarily Europe; (ii) certain non-deductible tax items related to the 2016 Restructuring; and (iii) a higher mix of earnings toward U.S. jurisdictions, which generally have higher statutory tax rates.
The effective tax rate in 2015 was 757.6% and unfavorably impacted by: (i) significant pre-tax charges primarily related to goodwill impairments, certain of which are not deductible for tax purposes; (ii) U.S. income and foreign withholding taxes on the repatriation of foreign earnings; and (iii) the impact of establishing valuation allowances on deferred tax assets in jurisdictions where we are unlikely to recognize these benefits. Partially offsetting these items was a $1.5 million net benefit from foreign tax rate differences primarily related to earnings from Europe and Canada.
Non-controlling Interests
Income and loss attributable to non-controlling interests was income of $2.8 million in 2017, a loss of $0.3 million in 2016 and income of $0.1 million in 2015. In 2017, income was primarily driven from our joint venture in Louisiana, which performed a majority of its work on a large deepwater project in our pipe coating and insulation operation.
Liquidity and Capital Resources
Cash and Equivalents
December 31, | |||||||
2017 | 2016 | ||||||
(in thousands) | |||||||
Cash and cash equivalents | $ | 105,717 | $ | 129,500 | |||
Restricted cash | 1,839 | 4,892 | |||||
Restricted cash held in escrow primarily relates to funds reserved for legal requirements, deposits made in lieu of retention on specific projects performed for municipalities and state agencies, or advance customer payments and compensating balances for bank undertakings in Europe. Changes in restricted cash flows are reported in the consolidated statements of cash flows based on the nature of the restriction.
Sources and Uses of Cash
We expect the principal operational use of funds for the foreseeable future will be for capital expenditures, working capital, debt service, share repurchases and potential acquisitions.
During 2017, capital expenditures were primarily related to growth and maintenance capital associated with the CIPP operations in Infrastructure Solutions, primarily in the United States and Europe. For 2018, we anticipate that we will spend approximately $30.0 million to $35.0 million for capital expenditures, which is a similar overall level from that in 2017. During 2018, we expect a continued level of capital expenditures to support the CIPP growth of our Infrastructure Solutions business, increased levels to support our Corrosion Protection businesses in the Middle East, and also to expand our domestic cathodic protection facilities.
Under the terms of our Credit Facility, we are authorized to purchase annually up to $40.0 million of our common stock in open market transactions (reduced to $30.0 million in 2018 as a result of the February 27, 2018 Credit Facility amendment), subject to Board of Director authorization. The shares are repurchased from time to time in the open market, subject to cash availability, market conditions and other factors, and in accordance with applicable regulatory requirements. We are not obligated to acquire any particular amount of common stock and, subject to applicable regulatory requirements, may commence, suspend or discontinue purchases at any time without notice or authorization. During 2017, we acquired 1,599,093 shares of our common stock for $35.3 million ($22.10 average price per share) through the open market repurchase program discussed above. In addition, we repurchased 112,899 shares of our common stock for $2.5 million ($22.15 average price per share) in connection with the satisfaction of tax obligations in connection with the vesting of restricted stock, restricted stock units and performance units. In October 2017, our Board of Directors authorized the open market repurchase of up to $40.0 million of our common stock to be made during 2018. That authorization is now limited to $30.0 million in 2018 due to the recent amendment to our Credit Facility. Any shares repurchased during 2018 are expected to be funded primarily through available cash. Once repurchased, we promptly retire such shares.
51
As part of our 2017 Restructuring, we incurred cash charges of $13.6 million during 2017 related to employee severance, extension of benefits, employment assistance programs, early lease and contract termination and other restructuring related costs as we exit our non-pipe related contract applications for the Tyfo® system in North America, right-size our cathodic protection services operations in Canada, right-size our Infrastructure Solutions businesses in Australia and Denmark, and reduce corporate and other operating costs. We estimate our remaining cash costs in 2018 will be approximately $5 million to $7 million related to these activities. Additionally, as we look to simplify our organizational structure and streamline our operations to best accommodate the TCJA or for other operational reasons, we could incur both cash and non-cash charges in 2018 primarily related to the the combination or dissolution of certain of our existing subsidiaries, the creation of new subsidiaries, and the foreign currency impact from settlement of inter-company loans.
As part of our 2016 Restructuring, we incurred $15.3 million in cash charges during 2016 related to employee severance, extension of benefits, employment assistance programs and early lease termination and other restructuring costs as we repositioned our Energy Services’ upstream operations in California, right-sized Corrosion Protection to compete more effectively, and reduced corporate and other operating costs. We do not expect to incur any future cash costs related to the 2016 Restructuring. These actions reduced consolidated annual operating costs by approximately $17.4 million primarily through headcount reductions and office closures.
At December 31, 2017, our cash balances were located worldwide for working capital and support needs. Given the breadth of our international operations, approximately $51.5 million, or 48.7%, of our cash was denominated in currencies other than the United States dollar as of December 31, 2017. We manage our worldwide cash requirements by reviewing available funds among the many subsidiaries through which we conduct business and the cost effectiveness with which those funds can be accessed.
The repatriation of cash balances from certain of our subsidiaries could have adverse tax consequences or be subject to regulatory capital requirements; however, those balances are generally available without legal restrictions to fund ordinary business operations. As part of the February 2016 acquisition of Underground Solutions, we repatriated approximately $29.7 million from foreign subsidiaries to assist in funding the transaction, incurring approximately $3.2 million in additional taxes. This was viewed as a one-time, special-use transaction. As a result of the deemed mandatory repatriation provisions in the TCJA, we have included an estimated $210.6 million of undistributed earnings in income subject to U.S. tax at reduced tax rates. The TCJA resulted in certain reassessments of previous indefinite reinvestment assertions with respect to certain jurisdictions. We do not intend to distribute earnings in a taxable manner, and therefore, intend to limit distributions to: (i) earnings previously taxed in the U.S.; (ii) earnings that would qualify for the 100 percent dividends received deduction provided in the TCJA; or (iii) earnings that would not result in significant foreign taxes. As a result, we have not recognized a deferred tax liability on our investment in foreign subsidiaries at December 31, 2017. We continue to refine our provisional balances under the TCJA and adjustments may be made during the allowed one-year measurement period. The ultimate impact of the TCJA may differ from the current provisional amounts and the adjustments could be material.
Our primary source of cash is operating activities. We occasionally borrow under our line of credit’s available capacity to fund operating activities, including working capital investments. Our operating activities include the collection of accounts receivable as well as the ultimate billing and collection of costs and estimated earnings in excess of billings. At December 31, 2017, we believed our net accounts receivable and our costs and estimated earnings in excess of billings, as reported on our consolidated balance sheet, were fully collectible and a significant portion of the receivables will be collected within the next twelve months. From time to time, we have net receivables recorded that we believe will be collected but are being disputed by the customer in some manner. Disputes of this nature could meaningfully impact the timing of receivable collection or require us to invoke our contractual or legal rights in a lawsuit or alternative dispute resolution proceeding. If in a future period we believe any of these receivables are no longer collectible, we would increase our allowance for bad debts through a charge to earnings.
In March 2016, we settled an outstanding project dispute with a client in Infrastructure Solutions. In connection with the settlement, we agreed to forgo approximately $7.5 million in receivables owed by our client and we agreed to pay an additional $2.4 million. During April 2016, we paid the settlement amount. The customer receivable, along with the related allowance for doubtful account, was written off as of March 31, 2016.
Cash Flows from Operations
Cash flows from operating activities provided $66.3 million in 2017 compared to $73.2 million provided in 2016. The decrease in operating cash flow from 2017 to 2016 was primarily due to lower cash flows related to working capital as a result of the timing of customer payments. Cash flows during 2017 and 2016 were negatively impacted by $9.4 million and $15.3 million, respectively, in cash payments related to our restructuring activities.
The net losses recorded in 2017 were primarily driven by non-cash charges of $96.5 million related to restructuring, definite-lived intangible asset impairments and goodwill impairments. Working capital used $10.2 million of cash during 2017
52
compared to $10.1 million used in 2016. This decrease in cash flow was primarily due to the timing of customer payments on certain large projects and an overall growth in revenues during 2017 compared to 2016. Days sales outstanding increased by approximately ten days as of December 31, 2017 compared to December 31, 2016. However, excluding the impacts of the coating and insulation project activity at our Bayou Louisiana facility, days sales outstanding decreased by five days year over year, primarily due to stronger collections in all of our Corrosion Protection platform businesses.
Cash flows from operating activities provided $132.0 million in 2015. The decrease in operating cash flow from 2015 to 2016 was primarily due to lower cash-related earnings in 2016 and lower cash flows related to working capital primarily as a result of the timing of vendor payments. In addition, cash flows during 2016 were also negatively impacted by $15.3 million in cash charges related to our 2016 Restructuring. Working capital used $10.1 million of cash during 2016 compared to $35.5 million provided in 2015. This decrease was primarily due to significant movements in billings in excess of costs and estimated earnings and prepaid expenses and other current assets. Our billings in excess of costs and estimated earnings was $62.7 million at December 31, 2016, a decrease of $24.8 million from December 31, 2015, due primarily to the timing of billing and advance deposits received on the coating and insulation project noted above. Our prepaid expenses and other current assets was $51.8 million at December 31, 2016, a decrease of $15.2 million from December 31, 2015, due primarily to the timing of advance deposits paid to suppliers on the same project described above. Excluding the changes in the line items described above, the other elements of working capital provided $0.9 million in cash in 2016 primarily due to a focused effort on accounts receivable management, partially offset by the timing of vendor payments. Days sales outstanding decreased by approximately five days as of December 31, 2016 compared to December 31, 2015 primarily due to the coating and insulation project activity stated above and the impact of stronger collections in nearly all operations globally, with particular improvement in the North American CIPP operation.
Cash Flows from Investing Activities
Cash flows from investing activities used $37.5 million and $127.3 million of cash in 2017 and 2016, respectively. During 2017, we used approximately $8.0 million to acquire Environmental Techniques. During 2016, we used $96.3 million to acquire Underground Solutions, Fyfe Europe, the CIPP business of LMJ and Concrete Solutions. During 2016, we received proceeds of $6.6 million, net of cash disposed, from the sale of our interest in our Canadian pipe coating operation. We used $30.8 million in cash for capital expenditures in 2017 compared to $38.8 million in the prior year. The decrease was primarily due to $13.5 million in capital expenditures during 2016 related to constructing the new pipe coating and insulation plant in our Corrosion Protection segment. In 2017 and 2016, $1.0 million and $1.2 million, respectively, of non-cash capital expenditures were included in accounts payable and accrued expenses. Capital expenditures in 2017 and 2016 were partially offset by $0.7 million and $3.3 million, respectively, in proceeds received from asset disposals.
In 2015, cash flows from investing activities used $39.1 million of cash. We used $29.5 million in cash for capital expenditures and transferred $3.5 million to restricted cash. Also in 2015, we used $6.7 million to acquire Schultz Mechanical Contractors.
Cash Flows from Financing Activities
Cash flows from financing activities used $56.4 million during 2017 compared to $25.9 million used in 2016. In 2017 and 2016, we used cash of $37.8 million and $44.5 million, respectively, to repurchase 1.7 million and 2.3 million shares, respectively, of our common stock through open market purchases and in connection with our equity compensation programs as discussed in Note 8 to the consolidated financial statements contained in this report. During 2017, we had net borrowings of $2.0 million from our line of credit to fund domestic working capital needs, and we used cash of $21.6 million to pay down the principal balance of our term loan. During 2016, we had net borrowings of $36.0 million from our line of credit primarily to fund our acquisition activity, and we used cash of $17.5 million to pay down the principal balance of our term loan.
During 2015, we amended and restated our $650.0 million credit facility and (i) borrowed $350.0 million on the term loan; (ii) used cash of $368.8 million to retire the previous credit facility; (iii) used cash of $4.4 million for facility financing fees; and (iv) made a $26.5 million mandatory prepayment on the balance of our term loan, utilizing $26.0 million from our line of credit to fund the term loan prepayment. Additionally, we used cash of $27.8 million to repurchase 1.5 million shares of our common stock.
Long-Term Debt
In October 2015, we entered into our Credit Facility. At December 31, 2017, the Credit Facility consisted of a $300.0 million five-year revolving line of credit and a $350.0 million five-year term loan facility.
Our indebtedness at December 31, 2017 consisted of $308.4 million outstanding from the $350.0 million term loan under the Credit Facility, $38.0 million on the line of credit under the Credit Facility and $0.9 million of third-party notes and bank debt. Additionally, we had $7.7 million of debt held by our joint venture partner (representing funds loaned by our joint
53
venture partner) listed as held for sale at December 31, 2017 related to the planned sale of Bayou. During 2017, we had net borrowings of $2.0 million on the line of credit for domestic working capital needs.
As of December 31, 2017, we had $30.5 million in letters of credit issued and outstanding under the Credit Facility. Of such amount, $13.4 million was collateral for the benefit of certain of our insurance carriers and $17.1 million was for letters of credit or bank guarantees of performance or payment obligations of foreign subsidiaries.
In October 2015, we entered into an interest rate swap agreement for a notional amount of $262.5 million, which is set to expire in October 2020. The notional amount of this swap mirrors the amortization of a $262.5 million portion of our $350.0 million term loan drawn from our Credit Facility. The swap requires us to make a monthly fixed rate payment of 1.46% calculated on the amortizing $262.5 million notional amount, and provides for us to receive a payment based upon a variable monthly LIBOR interest rate calculated on the same amortizing $262.5 million notional amount. The receipt of the monthly LIBOR-based payment offsets the variable monthly LIBOR-based interest cost on a corresponding $262.5 million portion of our term loan from the Credit Facility. This interest rate swap is used to partially hedge the interest rate risk associated with the volatility of monthly LIBOR rate movement and is accounted for as a cash flow hedge.
The Credit Facility is subject to certain financial covenants, including a consolidated financial leverage ratio and consolidated fixed charge coverage ratio. In conjunction with the amended Credit Facility, as described below and in Note 15 to the consolidated financial statements contained in this Report, these financial covenants were subsequently revised effective as of December 31, 2017. At December 31, 2017, based upon the amended financial covenants, we had the capacity to borrow up to $95.3 million of additional debt under our amended Credit Facility. We were in compliance with all covenants at December 31, 2017 and expect continued compliance for the foreseeable future.
On February 27, 2018, we amended our existing Credit Facility to, among other items: (i) extend the expiration date and the amortization period for the term loan facility from October 2020 to February 2023; (ii) receive approval for the sale of Bayou; and (iii) update the defined terms to allow for the add-back of certain charges related to the 2017 Restructuring when calculating our compliance with the financial covenants. In the event of the sale of Bayou, the net cash proceeds are required to be applied first against any outstanding borrowings on the revolving line of credit. Additionally, upon any such sale, the maximum aggregate principal amount of the revolving line of credit will be permanently reduced from $300.0 million to $275.0 million.
We believe that we have adequate resources and liquidity to fund future cash requirements and debt repayments with cash generated from operations, existing cash balances and additional short- and long-term borrowing capacity for the next 12 months. We expect cash generated from operations to increase in 2018 due to improved operating income, improved working capital management initiatives and the cost savings generated through our restructuring efforts.
See Notes 7 and 15 to the consolidated financial statements contained in this Report for additional information and disclosures regarding our long-term debt.
Disclosure of Contractual Obligations and Commercial Commitments
We have entered into various contractual obligations and commitments in the course of our ongoing operations and financing strategies. Contractual obligations are considered to represent known future cash payments that we are required to make under existing contractual arrangements, such as debt and lease agreements. These obligations may result from both general financing activities or from commercial arrangements that are directly supported by related revenue-producing activities. Commercial commitments represent contingent obligations, which become payable only if certain pre-defined events were to occur, such as funding financial guarantees. See Note 11 to the consolidated financial statements contained in this Report for further discussion regarding our commitments and contingencies.
54
The following table provides a summary of our contractual obligations and commercial commitments as of December 31, 2017. This table includes cash obligations related to principal outstanding under existing debt agreements and operating leases (in thousands):
Payments Due by Period | |||||||||||||||||||||||||||
Cash Obligations (1) (2) (3) (4) (5) (6) | Total | 2018 | 2019 | 2020 | 2021 | 2022 | Thereafter | ||||||||||||||||||||
Long-term debt and notes payable | $ | 347,312 | $ | 26,555 | $ | 28,437 | $ | 292,320 | $ | — | $ | — | $ | — | |||||||||||||
Interest on long-term debt | 32,567 | 12,655 | 11,327 | 8,585 | — | — | — | ||||||||||||||||||||
Operating leases | 70,283 | 21,084 | 16,336 | 11,652 | 8,148 | 5,245 | 7,818 | ||||||||||||||||||||
Total contractual cash obligations | $ | 450,162 | $ | 60,294 | $ | 56,100 | $ | 312,557 | $ | 8,148 | $ | 5,245 | $ | 7,818 | |||||||||||||
___________________
(1) | Cash obligations are not discounted. See Notes 7 and 11 to the consolidated financial statements contained in this Report regarding our long-term debt and Credit Facility and commitments and contingencies, respectively. |
(2) | Interest on long-term debt was calculated using the current annualized rate on our long-term debt as discussed in Note 7 to the consolidated financial statements contained in this Report. |
(3) | Liabilities related to Financial Accounting Standards Board Accounting Standards Codification 740, Income Taxes, have not been included in the table above because we are uncertain as to if or when such amounts may be settled. As of December 31, 2017, we had income tax receivable and income tax payable of $2.3 million and $4.6 million, respectively, recorded on our consolidated balance sheet. |
(4) | There were no material purchase commitments at December 31, 2017. |
(5) | Amounts exclude approximately $5.0 million to $7.0 million of cash charges expected to be incurred in 2018 related to the 2017 Restructuring and estimated charges resulting from the TCJA of $0.8 million in each year between 2018 and 2022, $1.6 million in 2023, $2.1 million in 2024 and $2.7 million in 2025. |
(6) | See Note 15 to the consolidated financial statements contained in this Report regarding the amended Credit Facility. |
Off-Balance Sheet Arrangements
We use various structures for the financing of operating equipment, including borrowings and operating leases. All debt is presented in the balance sheet. Our future commitments were $450.2 million at December 31, 2017. We have no other off-balance sheet financing arrangements or commitments. See Note 11 to the consolidated financial statements contained in this Report regarding commitments and contingencies.
Critical Accounting Policies
Discussion and analysis of our financial condition and results of operations are based upon our consolidated financial statements, which have been prepared in accordance with accounting principles generally accepted in the United States of America. The preparation of these financial statements requires us to make estimates and judgments that affect the reported amount of assets and liabilities, revenues and expenses, and related disclosure of contingent assets and liabilities at the financial statement dates. Actual results may differ from these estimates under different assumptions or conditions.
Some accounting policies require the application of significant judgment by management in selecting the appropriate assumptions for calculating financial estimates. By their nature, these judgments are subject to an inherent degree of uncertainty. We believe that our critical accounting policies are those described below. For a detailed discussion on the application of these and other accounting policies, see Note 2 to the consolidated financial statements contained in this Report.
Revenue Recognition
We recognize revenues and costs as construction, engineering and installation contracts progress using the percentage-of-completion method of accounting, which relies on total expected contract revenues and estimated total costs. Under this method, estimated contract revenues and resulting gross profit margin are recognized based on actual costs incurred to date as a percentage of total estimated costs. We follow this method since reasonably dependable estimates of the revenues and costs applicable to various elements of a contract can be made. Since the financial reporting of these contracts depends on estimates, which are assessed continually during the term of these contracts, recognized revenues and gross profit are subject to revisions as the contract progresses to completion. Total estimated costs, and thus contract gross profit, are impacted by changes in productivity, scheduling and the unit cost of labor, subcontracts, materials and equipment. Additionally, external factors such as weather, customer needs, customer delays in providing approvals, labor availability, governmental regulation and politics also may affect the progress and estimated cost of a project’s completion and thus the timing of revenue recognition and gross profit. A revision in profit estimates are reflected in the period in which the facts that give rise to the revision become known. The effects of any changes in estimates are disclosed in the notes to the consolidated financial statements and in the
55
Management’s Discussion and Analysis section of this Report, if material. When current estimates of total contract costs indicate that the contract will result in a loss, the projected loss is recognized in full in the period in which the loss becomes evident. Revenues from change orders, extra work and variations in the scope of work are recognized when it is probable that they will result in additional contract revenue and when the amount can be reliably estimated. Given the uncertainties associated with some of our contracts, it is possible for actual costs to vary from estimates previously made. Revisions to estimates could result in the reversal of revenues and gross profit previously recognized. Approximately 67%, 69%, and 69% of our revenues were derived from percentage-of-completion accounting in each of the years ended December 31, 2017, 2016 and 2015, respectively.
Revenues from our Energy Services segment are derived mainly from multiple maintenance contracts under multi-year, long-term Master Service Agreements and alliance contracts, as well as engineering and construction type contracts. Businesses within Energy Services enter into customer contracts that contain three principal types of pricing provisions: time and materials, cost plus fixed fee and fixed price. Although the terms of these contracts vary, most are made pursuant to cost reimbursable contracts on a time and materials basis under which revenues are recorded based on costs incurred at agreed upon contractual rates. Energy Services also performs services on a cost plus fixed fee basis under which revenues are recorded based upon costs incurred at agreed upon rates and a proportionate amount of the fixed fee or percentage stipulated in the contract.
Many of our contracts provide for termination of the contract at the convenience of the customer. If a contract is terminated prior to completion, we would typically be compensated for progress up to the time of termination and any termination costs. In addition, many contracts are subject to certain completion schedule requirements with liquidated damages in the event schedules are not met as the result of circumstances that are within our control. Losses on terminated contracts and liquidated damages have historically not been significant.
Taxation
We provide for estimated income taxes payable or refundable on current year income tax returns, as well as the estimated future tax effects attributable to temporary differences and carryforwards, in accordance with FASB ASC 740, Income Taxes (“FASB ASC 740”). FASB ASC 740 also requires that a valuation allowance be recorded against any deferred tax assets that are not likely to be realized in the future. The determination is based on our ability to generate future taxable income and, at times, is dependent on our ability to implement strategic tax initiatives to ensure full utilization of recorded deferred tax assets. Should we not be able to implement the necessary tax strategies, we may need to record valuation allowances for certain deferred tax assets, including those related to foreign income tax benefits. Significant management judgment is required in determining the provision for income taxes, deferred tax assets and liabilities and any valuation allowances recorded against net deferred tax assets.
As a result of the TCJA’s reduction in the U.S. corporate income tax rate from 35% to 21%, FASB ASC 740 required us to remeasure our deferred tax assets and liabilities based on tax rates at which the balances are expected to reverse in the future. The provisional amount recorded for the remeasurement of our deferred tax balances resulted in no adjustment to tax expense. The remeasurement of the deferred tax assets gave rise to an additional income tax expense of $5.1 million, which was offset by an equal reduction in the valuation allowance of $5.1 million. We continue to analyze certain aspects of the TCJA, including consideration of additional forthcoming technical guidance, which could potentially affect the measurement of these balances or potentially give rise to new deferred tax amounts.
In accordance with FASB ASC 740, tax benefits from an uncertain tax position may be recognized when it is more likely than not that the position will be sustained upon examination, including resolutions of any related appeals or litigation processes, based on the technical merits. In addition, this recognition model includes a measurement attribute that measures the position as the largest amount of tax that is greater than 50% likely of being realized upon ultimate settlement in accordance with FASB ASC 740. This interpretation also provides guidance on derecognition, classification, interest and penalties, accounting in interim periods, disclosure and transition.
We recognize tax liabilities in accordance with FASB ASC 740 and we adjust these liabilities when our judgment changes as a result of the evaluation of new information not previously available. Due to the complexity of some of these uncertainties, the ultimate resolution may result in a payment that is materially different from our current estimate of the tax liabilities. These differences will be reflected as increases or decreases to income tax expense in the period in which they are determined. While we believe the resulting tax balances as of December 31, 2017 and 2016 were appropriately accounted for in accordance with FASB ASC 740, the ultimate outcome of such matters could result in favorable or unfavorable adjustments to our consolidated financial statements and such adjustments could be material.
In connection with our initial analysis of the impact of the TCJA, we have recorded a provisional estimated net tax expense of $2.4 million, which consists of a charge of $10.4 million for the deemed mandatory repatriation, and reduced by a $7.1 million release of a deferred tax liability on unremitted foreign earnings and $0.9 million of other TCJA related impacts. On December 22, 2017, the SEC issued guidance under Staff Accounting Bulletin No. 118, Income Tax Accounting Implications of
56
the Tax Cuts and Jobs Act, (“SAB 118”), directing a taxpayer to consider the impact of the U.S. legislation as “provisional” when it does not have the necessary information available, prepared, or analyzed (including computations) in reasonable detail to complete the accounting for income tax effects of the TCJA. In accordance with SAB 118, the additional estimated income tax of $2.4 million represents our best estimate understanding that the provisional amount is subject to further adjustments under SAB 118. We continue to refine provisional balances, and adjustments may be made under SAB 118 during the measurement period as a result of future changes in interpretation, issuance of additional regulatory guidance from the U.S. federal and state tax authorities, or our own assumption changes. All accounting will be completed within the one-year measurement period allowed under SAB 118. The ultimate impact of the TCJA may differ from the current provisional amounts and the adjustments could be material.
Purchase Price Accounting
We account for our acquisitions in accordance with FASB ASC 805, Business Combinations. The base cash purchase price plus the estimated fair value of any non-cash or contingent consideration given for an acquired business is allocated to the assets acquired (including identified intangible assets) and liabilities assumed based on the estimated fair values of such assets and liabilities. The excess of the total consideration over the aggregate net fair values assigned is recorded as goodwill. Contingent consideration, if any, is recognized as a liability as of the acquisition date with subsequent adjustments recorded in the consolidated statements of operations. Indirect and general expenses related to business combinations are expensed as incurred.
We typically determine the fair value of tangible and intangible assets acquired in a business combination using independent valuations that rely on management’s estimates of inputs and assumptions that a market participant would use. Key assumptions include cash flow projections, growth rates, asset lives, and discount rates based on an analysis of weighted average cost of capital.
Long-Lived Assets
Property, plant and equipment and other identified intangibles (primarily customer relationships, patents and acquired technologies, trademarks, licenses and non-compete agreements) are recorded at cost, net of accumulated depreciation and impairment, and, except for goodwill and certain trademarks, are depreciated or amortized on a straight-line basis over their estimated useful lives. Changes in circumstances such as technological advances, changes to our business model or changes in our capital strategy can result in the actual useful lives differing from our estimates. During 2017, no such changes were noted. If we determine that the useful life of our property, plant and equipment or our identified intangible assets should be changed, we would depreciate or amortize the net book value in excess of the salvage value over its revised remaining useful life, thereby increasing or decreasing depreciation or amortization expense.
Long-lived assets, including property, plant and equipment and other intangibles, are reviewed for impairment whenever events or changes in circumstances indicate that the carrying amount of an asset may not be recoverable. Such impairment tests are based on a comparison of undiscounted cash flows to the recorded value of the asset. The estimate of cash flow is based upon, among other things, assumptions about expected future operating performance. Our estimates of undiscounted cash flow may differ from actual cash flow due to, among other things, technological changes, economic conditions, changes to our business model or changes in our operating performance. If the sum of the undiscounted cash flows is less than the carrying value, we recognize an impairment loss, measured as the amount by which the carrying value exceeds the fair value of the asset.
Impairment Review – 2017
As part of the 2017 Restructuring, which was approved by our board of directors on July 28, 2017, we exited all non-pipe related contract applications for the Tyfo® system in North America. As a result of this action, we evaluated the long-lived assets of our Fyfe reporting unit, which caused us to review the financial performance of at-risk asset groups within that reporting unit in accordance with FASB ASC 360, Property, Plant and Equipment (“FASB ASC 360”). The results of the Fyfe reporting unit and its related asset groups are reported within the Infrastructure Solutions reportable segment.
The assets of an asset group represent the lowest level for which identifiable cash flows can be determined independent of other groups of assets and liabilities. The Fyfe North America asset group was the only at-risk asset group reviewed for impairment. We developed internal forward business plans under the guidance of local and regional leadership to determine the undiscounted expected future cash flows derived from Fyfe North America’s long-lived assets. Such were based on management’s best estimates considering the likelihood of various outcomes. Based on the internal projections, we determined that the sum of the undiscounted expected future cash flows for the Fyfe North America asset group was less than the carrying value of the assets, and as a result, engaged a third-party valuation firm to assist management in determining the fair value of long-lived assets for the Fyfe North America asset group.
In order to determine the impairment amount of long-lived assets, we first determined the fair value of each key component of our long-lived assets for the Fyfe North America asset group. The fair values were derived using various
57
income-based approaches, which utilize discounted cash flows to evaluate the net earnings attributable to the asset being measured. Key assumptions used in assessment include the discount rate (based on weighted-average cost of capital), revenue growth rates, contributory asset charges, customer attrition, income tax rates and working capital needs, which were based on current market conditions and were consistent with internal management projections.
Based on the results of the valuation, the carrying amount of certain long-lived assets for the Fyfe North America asset group exceeded the fair value. Accordingly, we recorded impairment charges of $3.4 million to trademarks, $20.8 million to customer relationships and $16.8 million to patents and acquired technology in the third quarter of 2017. The impairment charges were recorded to “Definite-lived intangible asset impairment” in the Consolidated Statement of Operations. Property, plant and equipment was determined to have a carrying value that exceeded fair value; thus, no impairment was recorded.
Impairment Reviews – 2015
As a result of the annual impairment assessment in accordance with FASB ASC 350, Intangibles - Goodwill and Other (“FASB ASC 350”) as of October 1, 2015, the CRTS reporting unit had a fair value below its carrying value, which caused us to review the financial performance of at risk asset groups within that reporting unit in accordance with FASB ASC 360. The results of CRTS are reported within the Corrosion Protection reportable segment.
In response to contract losses in the Central California upstream energy market during the fourth quarter of 2015 and our subsequent decision to reduce exposure to the upstream market, we performed a market assessment of our energy-related businesses and concluded that sustained low oil prices would continue to create market challenges for the foreseeable future, including a continued reduction in spending by certain of our customers in 2016. The loss of the contracts, coupled with the decision to downsize, caused us to review the financial performance of at risk asset groups within the reporting unit. The results of Energy Services are reported within the Energy Services reportable segment.
The assets of each asset group represent the lowest level for which identifiable cash flows can be determined independent of other groups of assets and liabilities. We developed internal forward business plans under the guidance of local and regional leadership to determine the undiscounted expected future cash flows derived from each of the at risk asset groups’ long-lived assets. Such were based on our best estimates considering the likelihood of various outcomes. Based on the internal projections, we determined that the undiscounted expected future cash flows for all of the identified at risk asset groups exceeded the carrying value of the assets, and as such, no impairment to recorded long-lived assets was required.
The fair value estimates described above were determined using observable inputs and significant unobservable inputs, which are based on level 3 inputs as defined in Note 12.
Goodwill
Under FASB ASC 350, we assess recoverability of goodwill on an annual basis or when events or changes in circumstances indicate that the carrying amount of goodwill may not be recoverable. An impairment charge will be recognized to the extent that the fair value of a reporting unit is less than its carrying value. Factors that could potentially trigger an impairment review include (but are not limited to):
•significant underperformance of a segment relative to expected, historical or forecasted operating results;
•significant negative industry or economic trends;
•significant changes in the strategy for a segment including extended slowdowns in the segment’s market;
•a decrease in market capitalization below our book value; and
•a significant change in regulations.
Whether during the annual impairment assessment or during a trigger-based impairment review, we determine the fair value of our reporting units and compare such fair value to the carrying value of those reporting units to determine if there are any indications of goodwill impairment.
Fair value of reporting units is determined using a combination of two valuation methods: a market approach and an income approach with each method given equal weight in determining the fair value assigned to each reporting unit. Absent an indication of fair value from a potential buyer or similar specific transaction, we believe the use of these two methods provides a reasonable estimate of a reporting unit’s fair value. Assumptions common to both methods are operating plans and economic outlooks, which are used to forecast future revenues, earnings and after-tax cash flows for each reporting unit. These assumptions are applied consistently for both methods.
The market approach estimates fair value by first determining earnings before interest, taxes, depreciation and amortization (“EBITDA”) multiples for comparable publicly-traded companies with similar characteristics of the reporting unit. The EBITDA multiples for comparable companies are based upon current enterprise value. The enterprise value is based upon current market capitalization and includes a control premium. We believe this approach is appropriate because it provides a fair value estimate using multiples from entities with operations and economic characteristics comparable to its reporting units.
58
The income approach is based on forecasted future (debt-free) cash flows that are discounted to present value using factors that consider timing and risk of future cash flows. We believe this approach is appropriate because it provides a fair value estimate based upon the reporting unit’s expected long-term operating cash flow performance. Discounted cash flow projections are based on financial forecasts developed from operating plans and economic outlooks, growth rates, estimates of future expected changes in operating margins, terminal value growth rates, future capital expenditures and changes in working capital requirements. Estimates of discounted cash flows may differ from actual cash flows due to, among other things, changes in economic conditions, changes to business models, changes in our weighted average cost of capital, or changes in operating performance.
The discount rate applied to the estimated future cash flows is one of the most significant assumptions utilized under the income approach. We determine the appropriate discount rate for each of its reporting units based on the weighted average cost of capital (“WACC”) for each individual reporting unit. The WACC takes into account both the pre-tax cost of debt and cost of equity (including the risk-free rate on twenty year U.S. Treasury bonds), and certain other company-specific and market-based factors. As each reporting unit has a different risk profile based on the nature of its operations, the WACC for each reporting unit is adjusted, as appropriate, to account for company-specific risks. Accordingly, the WACC for each reporting unit may differ.
Impairment Review – Third Quarter 2017
As part of the 2017 Restructuring, which was approved by our board of directors on July 28, 2017, we exited all non-pipe related contract applications for the Tyfo® system in North America. As a result of this action, we evaluated the goodwill of our Fyfe reporting unit and determined that a triggering event occurred. As such, we engaged a third-party valuation firm to assist management in performing a goodwill impairment review for our Fyfe reporting unit during the third quarter of 2017. In accordance with the provisions of FASB ASC 350, we determined the fair value of the reporting unit and compared such fair value to the carrying value of the reporting unit. For the Fyfe reporting unit, carrying value, as adjusted for the long-lived asset impairments discussed previously, exceeded fair value by approximately 45%.
Despite our recent investments in sales resources to drive growth in North America, FRP technology has become more widely accepted and more contractors have become proficient with installation, which has begun to commoditize the application of the Tyfo® system during construction in the North American civil structure market. As a result of this and other factors, we decided to exit all non-pipe related contract applications for the Tyfo® system in North America. We are now focused on using our expertise in FRP technologies to promote third-party product sales, continuing pipe-related FRP installations and providing technical engineering support in the civil structural market in North America. The FRP operation in Asia remains largely unchanged as market conditions remain favorable.
Our decision, as noted above, permanently lowered the expected future cash flows of the reporting unit. As a result, the values derived from both the income approach and the market approach decreased from the October 1, 2016 annual goodwill impairment analysis. The fair value for the Fyfe reporting unit decreased $105.2 million, or 65.3%, from the previous analysis. The impairment analysis assumed a weighted average cost of capital of 17.0%, which is higher than the 16.0% utilized in the October 1, 2016 review, primarily due to rising risk-free rates on twenty-year U.S. Treasury bonds. The company-specific factors influencing discount rates remained consistent in both analyses. The impairment analysis also assumed a long-term growth rate of 2.5%, which was reduced from 3.5% used in the October 1, 2016 review. This change reflects our expectations for future annual revenue growth, which were lowered from 10.8% in the previous analysis to 4.0%, primarily due to the downsizing of the North American operations. Expected gross margins were consistent between both analyses.
As of January 1, 2017, we adopted FASB Accounting Standards Update No. 2017-04, Simplifying the Test for Goodwill Impairment, which states that an impairment charge should be recognized for the amount by which the carrying amount exceeds the reporting unit’s fair value. Based on the impairment analysis, we determined that recorded goodwill at the Fyfe reporting unit was impaired by $45.4 million, which was recorded to “Goodwill impairment” in the Consolidated Statement of Operations during the third quarter of 2017. As of December 31, 2017, we had remaining Fyfe goodwill of $9.6 million. Projected cash flows were based, in part, on the ability to grow third-party product sales and pressure pipe contracting in North America, and maintaining a presence in other international markets. If these assumptions do not materialize in a manner consistent with our expectations, there is risk of additional impairment to recorded goodwill.
Annual Impairment Assessment – October 1, 2017
We had seven reporting units for purposes of assessing goodwill at October 1, 2017 as follows: Municipal Pipe Rehabilitation, Fyfe, Corrpro, United Pipeline Systems, Bayou, Coating Services and Energy Services. During 2017, we acquired Environmental Techniques (see Note 1 to the consolidated financial statements contained in this Report) and integrated it into the Municipal Pipe Rehabilitation reporting unit.
Significant assumptions used in our October 1, 2017 goodwill review included: (i) discount rates ranging from 12.0% to 17.0%; (ii) compound annual growth rates for revenues generally ranging from 1.4% to 5.8%; (iii) gross margin stability or
59
slight improvement in the short term related to certain reporting units affected by the 2017 Restructuring, but sustained or slightly increased gross margins long term; (iv) peer group EBITDA multiples; and (v) terminal values for each reporting unit using a long-term growth rate of 1.0% to 3.0%. If actual results differ from estimates used in these calculations, we could incur future impairment charges.
During the assessment of our reporting units’ fair values in relation to their respective carrying values, no reporting units had a fair value below carrying value and only one reporting unit had a fair value within 10% percent of its carrying value. The reporting unit with a fair value within 10% of its carrying value was the Fyfe reporting unit, which recorded goodwill impairment and adjusted its carrying value to fair value during the third quarter of 2017 as discussed above.
Annual Impairment Assessment – October 1, 2015
As a result of the annual impairment assessment in accordance with FASB ASC 350, the CRTS reporting unit had a fair value less than its carrying value. Long-term expectations for the CRTS businesses remained low due to continued uncertainty in the upstream oil markets, which caused customer-driven delays in the more profitable international offshore pipeline market and delayed or canceled sales opportunities in certain North American markets. CRTS secured sizable project wins during 2014 and 2015; however, most were situated in international onshore and mining markets, which typically offer lower margin profiles. As a result of failing Step 1, we performed Step 2 procedures, which compares the carrying value of goodwill to its implied fair value. Based on this analysis, we determined that recorded goodwill at CRTS was impaired by $10.0 million, which was recorded to “Goodwill impairment” in the Consolidated Statement of Operations in the fourth quarter of 2015. As of December 31, 2015, we had remaining CRTS goodwill of $4.4 million. Projected cash flows were based, in part, on maintaining a presence in the higher-margin, international offshore pipeline market and our ability to expand its technology to other applications.
Impairment Review – December 31, 2015
In response to contract losses in the Central California upstream energy market during the fourth quarter of 2015 and our subsequent decision to reduce exposure to the upstream market, we performed a market assessment of our energy-related businesses and concluded that sustained low oil prices would continue to create market challenges for the foreseeable future, including a continued reduction in spending by certain of our customers in 2016. The loss of the contracts, coupled with the decision to downsize, caused us to review the goodwill of our operations affected by these circumstances and determined that a triggering event had occurred. As such, we performed an interim goodwill impairment review for our Energy Services reporting unit as of December 31, 2015.
In accordance with the provisions of FASB ASC 350, we determined the fair value of the affected reporting unit and it was found to be less than the carrying value. As a result of failing Step 1, we performed Step 2 procedures, which compares the carrying value of goodwill to its implied fair value. Based on this analysis, we determined that recorded goodwill at Energy Services was impaired by $33.5 million, which was recorded to “Goodwill impairment” in the Consolidated Statement of Operations in the fourth quarter of 2015. As of December 31, 2015, Energy Services had remaining goodwill of $46.7 million. Projected cash flows were based on maintaining a smaller but profitable presence in the upstream energy market and continued strength in the Central California downstream energy market. Also included in the projected cash flows were certain cost savings expected to be achieved through the 2016 Restructuring.
See Note 6 to the consolidated financial statements contained in this Report for a reconciliation of the beginning and ending balances of goodwill.
Accounting Standards Updates
See Note 2 to the consolidated financial statements contained in this Report.
Item 7A. Quantitative and Qualitative Disclosures About Market Risk
Market Risk
We are exposed to the effect of interest rate changes and of foreign currency and commodity price fluctuations. We currently do not use derivative contracts to manage commodity risks. From time to time, we may enter into foreign currency forward contracts to fix exchange rates for net investments in foreign operations to hedge our foreign exchange risk.
Interest Rate Risk
The fair value of our cash and short-term investment portfolio at December 31, 2017 approximated carrying value. Given the short-term nature of these instruments, market risk, as measured by the change in fair value resulting from a hypothetical 100 basis point change in interest rates, would not be material.
60
Our objectives in managing exposure to interest rate changes are to limit the impact of interest rate changes on earnings and cash flows and to lower overall borrowing costs. To achieve these objectives, we maintain fixed rate debt whenever favorable; however, the majority of our debt at December 31, 2017 was variable rate debt. We substantially mitigate our interest rate risk through interest rate swap agreements, which are used to hedge the volatility of monthly LIBOR rate movement of our debt. We currently utilize interest rate swap agreements with a notional amount that mirrors approximately 75% of our outstanding borrowings from the term loan under our Credit Facility.
At December 31, 2017, the estimated fair value of our long-term debt was approximately $356.0 million. Fair value was estimated using market rates for debt of similar risk and maturity and a discounted cash flow model. Market risk related to the potential increase in fair value resulting from a hypothetical 100 basis point increase in our debt specific borrowing rates at December 31, 2017 would result in a $1.0 million increase in interest expense.
Foreign Exchange Risk
We operate subsidiaries and are associated with licensees and affiliated companies operating solely outside of the United States and in foreign currencies. Consequently, we are inherently exposed to risks associated with the fluctuation in the value of the local currencies compared to the U.S. dollar. At December 31, 2017, a substantial portion of our cash and cash equivalents was denominated in foreign currencies, and a hypothetical 10.0% change in currency exchange rates could result in an approximate $12.2 million impact to our equity through accumulated other comprehensive loss.
In order to help mitigate this risk, we may enter into foreign exchange forward contracts to minimize the short-term impact of foreign currency fluctuations. We do not engage in hedging transactions for speculative investment reasons. There can be no assurance that our hedging operations will eliminate or substantially reduce risks associated with fluctuating currencies. At December 31, 2017, there were no material foreign currency hedge instruments outstanding. See Note 12 to the consolidated financial statements contained in this Report for additional information and disclosures regarding our derivative financial instruments.
Commodity Risk
We have exposure to the effect of limitations on supply and changes in commodity pricing relative to a variety of raw materials that we purchase and use in our operating activities, most notably resin, iron ore, chemicals, staple fiber, fuel, metals and pipe. We manage this risk by entering into agreements with certain suppliers utilizing a request for proposal, or RFP, format and purchasing in bulk, and advantageous buying on the spot market for certain metals, when possible. We also manage this risk by continuously updating our estimation systems for bidding contracts so that we are able to price our products and services appropriately to our customers. However, we face exposure on contracts in process that have already been priced and are not subject to any cost adjustments in the contract. This exposure is potentially more significant on our longer-term projects.
We obtain a majority of our global resin requirements, one of our primary raw materials, from multiple suppliers in order to diversify our supplier base and thus reduce the risks inherent in concentrated supply streams. We have qualified a number of vendors in North America, Europe and Asia that can deliver, and are currently delivering, proprietary resins that meet our specifications.
The primary products and raw materials used by our infrastructure rehabilitation operations in the manufacture of FRP composite systems are carbon, glass, resins, fabric and epoxy raw materials. Fabric and epoxies are the largest materials purchased, which are currently purchased through a select group of suppliers, although we believe these and the other materials are available from a number of vendors. The price of epoxy historically is affected by the price of oil. In addition, a number of factors such as worldwide demand, labor costs, energy costs, import duties and other trade restrictions may influence the price of these raw materials.
We rely on a select group of third-party extruders to manufacture our Fusible PVC® pipe products.
Iron ore inventory balances are managed according to our anticipated volume of concrete weight coating projects. We obtain the majority of our iron ore from a limited number of suppliers, and pricing can be volatile. Iron ore is typically purchased near the start of each project. Concrete weight coating revenue accounts for a small percentage of our overall revenues.
61
Item 8. Financial Statements and Supplementary Data
INDEX TO CONSOLIDATED FINANCIAL STATEMENTS
62
Management’s Report on Internal Control Over Financial Reporting
The Company’s management is responsible for establishing and maintaining adequate internal control over financial reporting, as such term is defined in Exchange Act Rule 13a-15(f).
Under the supervision and with the participation of Company management, including the Chief Executive Officer (the principal executive officer) and the Chief Financial Officer (the principal financial officer), an evaluation was performed of the effectiveness of the Company’s internal control over financial reporting as of December 31, 2017. In performing this evaluation, management employed the criteria set forth by the Committee of Sponsoring Organizations of the Treadway Commission in Internal Control – Integrated Framework (2013).
Based on the criteria set forth in Internal Control – Integrated Framework (2013), management, including the Company’s Chief Executive Officer and its Chief Financial Officer, has concluded that the Company’s internal control over financial reporting was effective as of December 31, 2017.
Because of inherent limitations, internal control over financial reporting may not prevent or detect misstatements. Also, projections of any evaluation of effectiveness to future periods are subject to the risk that controls may become inadequate because of changes in conditions, or that the degree of compliance with the policies or procedures may deteriorate.
The effectiveness of the Company’s internal control over financial reporting as of December 31, 2017 has been audited by PricewaterhouseCoopers LLP, an independent registered public accounting firm, as stated in its report which appears herein.
/s/ Charles R. Gordon | |
Charles R. Gordon President and Chief Executive Officer (Principal Executive Officer) | |
/s/ David F. Morris | |
David F. Morris Executive Vice President, General Counsel and Interim Chief Financial Officer (Principal Financial Officer) | |
63
Report of Independent Registered Public Accounting Firm
To the Board of Directors and Shareholders of Aegion Corporation:
Opinions on the Financial Statements and Internal Control over Financial Reporting
We have audited the accompanying consolidated balance sheets of Aegion Corporation and its subsidiaries as of December 31, 2017 and 2016, and the related consolidated statements of operations, comprehensive income, equity and cash flows for each of the three years in the period ended December 31, 2017, including the related notes (collectively referred to as the “consolidated financial statements”). We also have audited the Company’s internal control over financial reporting as of December 31, 2017, based on criteria established in Internal Control - Integrated Framework (2013) issued by the Committee of Sponsoring Organizations of the Treadway Commission (COSO).
In our opinion, the consolidated financial statements referred to above present fairly, in all material respects, the financial position of the Company as of December 31, 2017 and 2016, and the results of their operations and their cash flows for each of the three years in the period ended December 31, 2017 in conformity with accounting principles generally accepted in the United States of America. Also in our opinion, the Company maintained, in all material respects, effective internal control over financial reporting as of December 31, 2017, based on criteria established in Internal Control - Integrated Framework (2013) issued by the COSO.
Basis for Opinions
The Company’s management is responsible for these consolidated financial statements, for maintaining effective internal control over financial reporting, and for its assessment of the effectiveness of internal control over financial reporting, included in the accompanying Management’s Report on Internal Control Over Financial Reporting. Our responsibility is to express opinions on the Company’s consolidated financial statements and on the Company’s internal control over financial reporting based on our audits. We are a public accounting firm registered with the Public Company Accounting Oversight Board (United States) (“PCAOB”) and are required to be independent with respect to the Company in accordance with the U.S. federal securities laws and the applicable rules and regulations of the Securities and Exchange Commission and the PCAOB.
We conducted our audits in accordance with the standards of the PCAOB. Those standards require that we plan and perform the audits to obtain reasonable assurance about whether the consolidated financial statements are free of material misstatement, whether due to error or fraud, and whether effective internal control over financial reporting was maintained in all material respects.
Our audits of the consolidated financial statements included performing procedures to assess the risks of material misstatement of the consolidated financial statements, whether due to error or fraud, and performing procedures that respond to those risks. Such procedures included examining, on a test basis, evidence regarding the amounts and disclosures in the consolidated financial statements. Our audits also included evaluating the accounting principles used and significant estimates made by management, as well as evaluating the overall presentation of the consolidated financial statements. Our audit of internal control over financial reporting included obtaining an understanding of internal control over financial reporting, assessing the risk that a material weakness exists, and testing and evaluating the design and operating effectiveness of internal control based on the assessed risk. Our audits also included performing such other procedures as we considered necessary in the circumstances. We believe that our audits provide a reasonable basis for our opinions.
Definition and Limitations of Internal Control over Financial Reporting
A company’s internal control over financial reporting is a process designed to provide reasonable assurance regarding the reliability of financial reporting and the preparation of financial statements for external purposes in accordance with generally accepted accounting principles. A company’s internal control over financial reporting includes those policies and procedures that (i) pertain to the maintenance of records that, in reasonable detail, accurately and fairly reflect the transactions and dispositions of the assets of the company; (ii) provide reasonable assurance that transactions are recorded as necessary to permit preparation of financial statements in accordance with generally accepted accounting principles, and that receipts and expenditures of the company are being made only in accordance with authorizations of management and directors of the company; and (iii) provide reasonable assurance regarding prevention or timely detection of unauthorized acquisition, use, or disposition of the company’s assets that could have a material effect on the financial statements.
Because of its inherent limitations, internal control over financial reporting may not prevent or detect misstatements. Also, projections of any evaluation of effectiveness to future periods are subject to the risk that controls may become inadequate because of changes in conditions, or that the degree of compliance with the policies or procedures may deteriorate.
/s/ PricewaterhouseCoopers LLP
Saint Louis, Missouri
March 1, 2018
We have served as the Company’s auditor since 2002.
64
AEGION CORPORATION AND SUBSIDIARIES
CONSOLIDATED STATEMENTS OF OPERATIONS
(in thousands, except per share amounts)
Years Ended December 31, | |||||||||||
2017 | 2016 | 2015 | |||||||||
Revenues | $ | 1,359,019 | $ | 1,221,920 | $ | 1,333,570 | |||||
Cost of revenues | 1,074,207 | 968,756 | 1,057,783 | ||||||||
Gross profit | 284,812 | 253,164 | 275,787 | ||||||||
Operating expenses | 225,826 | 197,099 | 209,477 | ||||||||
Goodwill impairment | 45,390 | — | 43,484 | ||||||||
Definite-lived intangible asset impairment | 41,032 | — | — | ||||||||
Gain on litigation settlement | — | (6,625 | ) | — | |||||||
Acquisition and divestiture expenses | 2,923 | 2,696 | 1,912 | ||||||||
Restructuring and related charges | 12,814 | 9,168 | 968 | ||||||||
Operating income (loss) | (43,173 | ) | 50,826 | 19,946 | |||||||
Other income (expense): | |||||||||||
Interest expense | (16,001 | ) | (15,029 | ) | (16,044 | ) | |||||
Interest income | 145 | 166 | 218 | ||||||||
Other | (2,201 | ) | (694 | ) | (2,905 | ) | |||||
Total other expense | (18,057 | ) | (15,557 | ) | (18,731 | ) | |||||
Income (loss) before taxes on income | (61,230 | ) | 35,269 | 1,215 | |||||||
Taxes on income (loss) | 5,005 | 6,109 | 9,205 | ||||||||
Net income (loss) | (66,235 | ) | 29,160 | (7,990 | ) | ||||||
Non-controlling interests (income) loss | (2,819 | ) | 328 | (77 | ) | ||||||
Net income (loss) attributable to Aegion Corporation | $ | (69,054 | ) | $ | 29,488 | $ | (8,067 | ) | |||
Earnings (loss) per share attributable to Aegion Corporation: | |||||||||||
Basic | $ | (2.08 | ) | $ | 0.85 | $ | (0.22 | ) | |||
Diluted | $ | (2.08 | ) | $ | 0.84 | $ | (0.22 | ) | |||
The accompanying notes are an integral part of the consolidated financial statements.
65
AEGION CORPORATION AND SUBSIDIARIES
CONSOLIDATED STATEMENTS OF COMPREHENSIVE INCOME
(in thousands)
Years Ended December 31, | |||||||||||
2017 | 2016 | 2015 | |||||||||
Net income (loss) | $ | (66,235 | ) | $ | 29,160 | $ | (7,990 | ) | |||
Other comprehensive income (loss): | |||||||||||
Currency translation adjustments | 19,390 | (6,343 | ) | (25,379 | ) | ||||||
Deferred gain on hedging activity, net of tax(1) | 1,402 | 746 | 279 | ||||||||
Pension activity, net of tax(2) | 93 | (8 | ) | 145 | |||||||
Total comprehensive income (loss) | (45,350 | ) | 23,555 | (32,945 | ) | ||||||
Comprehensive (income) loss attributable to non-controlling interests | (3,040 | ) | 294 | 1,686 | |||||||
Comprehensive income (loss) attributable to Aegion Corporation | $ | (48,390 | ) | $ | 23,849 | $ | (31,259 | ) | |||
__________________________
(1) | Amounts presented net of tax of $930, $496 and $187 for the years ended December 31, 2017, 2016 and 2015, respectively. |
(2) | Amounts presented net of tax of $22, $(2) and $37 for the years ended December 31, 2017, 2016, and 2015, respectively. |
The accompanying notes are an integral part of the consolidated financial statements.
66
AEGION CORPORATION AND SUBSIDIARIES
CONSOLIDATED BALANCE SHEETS
(in thousands, except share amounts)
December 31, | |||||||
2017 | 2016 | ||||||
Assets | |||||||
Current assets | |||||||
Cash and cash equivalents | $ | 105,717 | $ | 129,500 | |||
Restricted cash | 1,839 | 4,892 | |||||
Receivables, net of allowances of $5,775 and $6,098, respectively | 201,570 | 186,016 | |||||
Retainage | 33,002 | 33,643 | |||||
Costs and estimated earnings in excess of billings | 75,371 | 62,401 | |||||
Inventories | 63,969 | 63,953 | |||||
Prepaid expenses and other current assets | 35,282 | 51,832 | |||||
Assets held for sale | 70,314 | — | |||||
Total current assets | 587,064 | 532,237 | |||||
Property, plant & equipment, less accumulated depreciation | 109,040 | 156,747 | |||||
Other assets | |||||||
Goodwill | 260,715 | 298,619 | |||||
Identified intangible assets, less accumulated amortization | 132,345 | 194,911 | |||||
Deferred income tax assets | 1,666 | 1,848 | |||||
Other assets | 16,269 | 9,220 | |||||
Total other assets | 410,995 | 504,598 | |||||
Total Assets | $ | 1,107,099 | $ | 1,193,582 | |||
Liabilities and Equity | |||||||
Current liabilities | |||||||
Accounts payable | $ | 70,611 | $ | 63,058 | |||
Accrued expenses | 92,011 | 85,010 | |||||
Billings in excess of costs and estimated earnings | 51,597 | 62,698 | |||||
Current maturities of long-term debt | 26,555 | 19,835 | |||||
Liabilities held for sale | 20,900 | — | |||||
Total current liabilities | 261,674 | 230,601 | |||||
Long-term debt, less current maturities | 318,240 | 350,785 | |||||
Deferred income tax liabilities | 9,211 | 23,339 | |||||
Other non-current liabilities | 12,918 | 12,674 | |||||
Total liabilities | 602,043 | 617,399 | |||||
(See Commitments and Contingencies: Note 11) | |||||||
Equity | |||||||
Preferred stock, undesignated, $.10 par – shares authorized 2,000,000; none outstanding | — | — | |||||
Common stock, $.01 par – shares authorized 125,000,000; shares issued and outstanding 32,462,542 and 33,956,304, respectively | 325 | 340 | |||||
Additional paid-in capital | 140,749 | 166,598 | |||||
Retained earnings | 386,008 | 455,062 | |||||
Accumulated other comprehensive loss | (32,836 | ) | (53,500 | ) | |||
Total stockholders’ equity | 494,246 | 568,500 | |||||
Non-controlling interests | 10,810 | 7,683 | |||||
Total equity | 505,056 | 576,183 | |||||
Total Liabilities and Equity | $ | 1,107,099 | $ | 1,193,582 | |||
The accompanying notes are an integral part of the consolidated financial statements.
67
AEGION CORPORATION AND SUBSIDIARIES
CONSOLIDATED STATEMENTS OF EQUITY
(in thousands, except number of shares)
Common Stock | Additional Paid-In Capital | Retained Earnings | Accumulated Other Comprehensive Income (Loss) | Non- Controlling Interests | Total Equity | |||||||||||||||||||||
Shares | Amount | |||||||||||||||||||||||||
BALANCE, December 31, 2014 | 37,360,515 | $ | 374 | $ | 217,289 | $ | 433,641 | $ | (24,669 | ) | $ | 18,450 | $ | 645,085 | ||||||||||||
Net income (loss) | — | — | — | (8,067 | ) | — | 77 | (7,990 | ) | |||||||||||||||||
Issuance of common stock upon stock option exercises, including tax benefit | 209,205 | 2 | 2,464 | — | — | — | 2,466 | |||||||||||||||||||
Issuance of shares pursuant to restricted stock units | 12,646 | — | — | — | — | — | — | |||||||||||||||||||
Issuance of shares pursuant to deferred stock unit awards | 27,779 | — | — | — | — | — | — | |||||||||||||||||||
Forfeitures of restricted shares | (54,045 | ) | (1 | ) | — | — | — | — | (1 | ) | ||||||||||||||||
Shares repurchased and retired | (1,502,601 | ) | (14 | ) | (27,789 | ) | — | — | — | (27,803 | ) | |||||||||||||||
Equity-based compensation expense | — | 7,987 | — | — | — | 7,987 | ||||||||||||||||||||
Investment by non-controlling interests | — | — | — | — | — | 239 | 239 | |||||||||||||||||||
Purchase of non-controlling interests | — | — | — | — | (472 | ) | (472 | ) | ||||||||||||||||||
Currency translation adjustment and derivative transactions, net | — | — | (23,192 | ) | (1,763 | ) | (24,955 | ) | ||||||||||||||||||
BALANCE, December 31, 2015 | 36,053,499 | $ | 361 | $ | 199,951 | $ | 425,574 | $ | (47,861 | ) | $ | 16,531 | $ | 594,556 | ||||||||||||
Net income (loss) | — | — | — | 29,488 | — | (328 | ) | 29,160 | ||||||||||||||||||
Issuance of common stock upon stock option exercises, including tax benefit | 114,307 | 1 | 1,817 | — | — | — | 1,818 | |||||||||||||||||||
Issuance of shares pursuant to restricted stock units | 141,507 | 1 | — | — | — | — | 1 | |||||||||||||||||||
Issuance of shares pursuant to deferred stock unit awards | 39,660 | — | — | — | — | — | — | |||||||||||||||||||
Forfeitures of restricted shares | (42,775 | ) | — | — | — | — | — | — | ||||||||||||||||||
Shares repurchased and retired | (2,349,894 | ) | (23 | ) | (44,431 | ) | — | — | — | (44,454 | ) | |||||||||||||||
Equity-based compensation expense | — | — | 9,261 | — | — | — | 9,261 | |||||||||||||||||||
Sale of non-controlling interest | — | — | — | — | — | (7,278 | ) | (7,278 | ) | |||||||||||||||||
Distributions to non-controlling interests | — | — | — | — | — | (1,276 | ) | (1,276 | ) | |||||||||||||||||
Currency translation adjustment and derivative transactions, net | — | — | — | — | (5,639 | ) | 34 | (5,605 | ) | |||||||||||||||||
BALANCE, December 31, 2016 | 33,956,304 | $ | 340 | $ | 166,598 | $ | 455,062 | $ | (53,500 | ) | $ | 7,683 | $ | 576,183 | ||||||||||||
Net income (loss) | — | — | — | (69,054 | ) | — | 2,819 | (66,235 | ) | |||||||||||||||||
Issuance of common stock upon stock option exercises | 43,573 | — | 822 | — | — | — | 822 | |||||||||||||||||||
Issuance of shares pursuant to restricted stock units | 95,510 | 1 | — | — | — | — | 1 | |||||||||||||||||||
Issuance of shares pursuant to performance units | 49,672 | — | — | — | — | — | — | |||||||||||||||||||
Issuance of shares pursuant to deferred stock unit awards | 30,559 | — | — | — | — | — | — | |||||||||||||||||||
Forfeitures of restricted shares | (1,084 | ) | — | — | — | — | — | — | ||||||||||||||||||
Shares repurchased and retired | (1,711,992 | ) | (16 | ) | (37,833 | ) | — | — | — | (37,849 | ) | |||||||||||||||
Equity-based compensation expense | — | — | 11,162 | — | — | — | 11,162 | |||||||||||||||||||
Investments from non-controlling interest | — | — | — | — | — | 158 | 158 | |||||||||||||||||||
Distributions to non-controlling interests | — | — | — | — | — | (71 | ) | (71 | ) | |||||||||||||||||
Currency translation adjustment and derivative transactions, net | — | — | — | — | 20,664 | 221 | 20,885 | |||||||||||||||||||
BALANCE, December 31, 2017 | 32,462,542 | $ | 325 | $ | 140,749 | $ | 386,008 | $ | (32,836 | ) | $ | 10,810 | $ | 505,056 | ||||||||||||
The accompanying notes are an integral part of the consolidated financial statements.
68
AEGION CORPORATION AND SUBSIDIARIES
CONSOLIDATED STATEMENTS OF CASH FLOWS
(in thousands)
Years Ended December 31, | |||||||||||
2017 | 2016 | 2015 | |||||||||
Cash flows from operating activities: | |||||||||||
Net income (loss) | $ | (66,235 | ) | $ | 29,160 | $ | (7,990 | ) | |||
Adjustments to reconcile to net cash provided by operating activities: | |||||||||||
Depreciation and amortization | 44,419 | 46,719 | 43,791 | ||||||||
Gain on sale of fixed assets | (59 | ) | (1,916 | ) | (929 | ) | |||||
Equity-based compensation expense | 11,162 | 9,261 | 7,987 | ||||||||
Deferred income taxes | (9,376 | ) | 1,772 | 924 | |||||||
Non-cash restructuring charges | 10,080 | 300 | 1,816 | ||||||||
Non-cash portion of litigation settlement | — | (3,000 | ) | — | |||||||
Definite-lived intangible asset impairment | 41,032 | — | — | ||||||||
Goodwill impairment | 45,390 | — | 43,484 | ||||||||
Debt issuance costs | — | — | 3,377 | ||||||||
Loss on sale of businesses | — | — | 3,414 | ||||||||
Loss on foreign currency transactions | 2,152 | 911 | 80 | ||||||||
Other | (1,562 | ) | (1,044 | ) | (168 | ) | |||||
Changes in operating assets and liabilities (net of acquisitions): | |||||||||||
Restricted cash related to operating activities | 1,258 | 2,055 | (382 | ) | |||||||
Receivables net, retainage and costs and estimated earnings in excess of billings | (29,847 | ) | 52,774 | 12,283 | |||||||
Inventories | (1,926 | ) | (2,569 | ) | 6,984 | ||||||
Prepaid expenses and other assets | 8,732 | 16,759 | (28,895 | ) | |||||||
Accounts payable and accrued expenses | 18,803 | (49,259 | ) | (582 | ) | ||||||
Billings in excess of costs and estimated earnings | (5,924 | ) | (27,761 | ) | 45,700 | ||||||
Other operating | (1,798 | ) | (946 | ) | 1,129 | ||||||
Net cash provided by operating activities | 66,301 | 73,216 | 132,023 | ||||||||
Cash flows from investing activities: | |||||||||||
Capital expenditures | (30,830 | ) | (38,760 | ) | (29,454 | ) | |||||
Proceeds from sale of fixed assets | 707 | 3,310 | 3,173 | ||||||||
Patent expenditures | (379 | ) | (1,043 | ) | (1,503 | ) | |||||
Restricted cash related to investing activities | 2,000 | (1,086 | ) | (3,538 | ) | ||||||
Purchase of Underground Solutions, Inc., net of cash acquired | — | (84,740 | ) | — | |||||||
Other acquisition activity, net of cash acquired | (9,045 | ) | (11,567 | ) | (6,662 | ) | |||||
Sale of interest in Bayou Perma-Pipe Canada, Ltd., net of cash disposed | — | 6,599 | — | ||||||||
Payment to Fyfe Asia sellers for final net working capital | — | — | (1,098 | ) | |||||||
Net cash used in investing activities | (37,547 | ) | (127,287 | ) | (39,082 | ) | |||||
69
Cash flows from financing activities: | |||||||||||
Proceeds from issuance of common stock upon stock option exercises, including tax effects | 823 | 1,818 | 2,466 | ||||||||
Repurchase of common stock | (37,849 | ) | (44,454 | ) | (27,804 | ) | |||||
Investments from non-controlling interest | 158 | — | — | ||||||||
Sale of non-controlling interest | — | — | 239 | ||||||||
Purchase of or distributions to non-controlling interests | (71 | ) | (1,276 | ) | (472 | ) | |||||
Payment of contingent consideration | (500 | ) | (500 | ) | (684 | ) | |||||
Credit facility financing fees | — | — | (4,360 | ) | |||||||
Proceeds from (payments on) notes payable, net | 639 | — | (370 | ) | |||||||
Proceeds from (payments on) line of credit, net | 2,000 | 36,000 | (45,500 | ) | |||||||
Proceeds from long-term debt | — | — | 350,000 | ||||||||
Principal payments on long-term debt | (21,647 | ) | (17,500 | ) | (323,750 | ) | |||||
Net cash used in financing activities | (56,447 | ) | (25,912 | ) | (50,235 | ) | |||||
Effect of exchange rate changes on cash | 4,899 | (2,213 | ) | (5,975 | ) | ||||||
Net increase (decrease) in cash and cash equivalents for the year | (22,794 | ) | (82,196 | ) | 36,731 | ||||||
Cash and cash equivalents, beginning of year | 129,500 | 211,696 | 174,965 | ||||||||
Cash and cash equivalents, end of year | 106,706 | 129,500 | 211,696 | ||||||||
Cash and cash equivalents associated with assets held for sale, end of year | (989 | ) | — | (2,443 | ) | ||||||
Cash and cash equivalents, end of year | $ | 105,717 | $ | 129,500 | $ | 209,253 | |||||
Supplemental disclosures of cash flow information: | |||||||||||
Cash paid (received) for: | |||||||||||
Interest | $ | 14,998 | $ | 11,118 | $ | 9,873 | |||||
Income taxes | 5,649 | (517 | ) | 8,753 | |||||||
The accompanying notes are an integral part of the consolidated financial statements.
70
AEGION CORPORATION AND SUBSIDIARIES
NOTES TO CONSOLIDATED FINANCIAL STATEMENTS
1. DESCRIPTION OF BUSINESS
Aegion Corporation combines innovative technologies with market leading expertise to maintain, rehabilitate and strengthen pipelines and other infrastructure around the world. Since 1971, the Company has played a pioneering role in finding transformational solutions to rehabilitate aging infrastructure, primarily pipelines in the wastewater, water, energy, mining and refining industries. The Company also maintains the efficient operation of refineries and other industrial facilities and provide innovative solutions for the strengthening of buildings, bridges and other structures. Aegion is committed to Stronger. Safer. Infrastructure®. The Company’s products and services are currently utilized and performed in over 80 countries across six continents. The Company believes that the depth and breadth of its products and services platform make Aegion a leading “one-stop” provider for the world’s infrastructure rehabilitation and protection needs.
The Company is primarily built on the premise that it is possible to use technology to extend the structural design life and maintain, if not improve, the performance of infrastructure, mostly pipe. The Company is proving that this expertise can be applied in a variety of markets to protect pipelines in oil, gas, mining, wastewater and water applications and extending this to the rehabilitation and maintenance of commercial structures and the provision of professional services in energy-related industries. Many types of infrastructure must be protected from the corrosive and abrasive materials that pass through or near them. The Company’s expertise in non-disruptive corrosion engineering and abrasion protection is now wide-ranging, opening new markets for growth. The Company has a long history of product development and intellectual property management. The Company manufactures most of the engineered solutions it creates as well as the specialized equipment required to install them. Finally, decades of experience give the Company an advantage in understanding municipal, energy, mining, industrial and commercial customers. Strong customer relationships and brand recognition allow the Company to support the expansion of existing and innovative technologies into new high growth end markets.
The Company’s predecessor was originally incorporated in Delaware in 1980 to act as the exclusive United States licensee of the Insituform® cured-in-place pipe (“CIPP”) process, which Insituform’s founder invented in 1971. The Insituform® CIPP process served as the first trenchless technology for rehabilitating sewer pipelines and has enabled municipalities and private industry to avoid the extraordinary expense and extreme disruption that can result from conventional “dig-and-replace” methods. For more than 45 years, the Company has maintained its leadership position in the CIPP market from manufacturing to technological innovations and market share.
In order to strengthen the Company’s ability to service the emerging demands of the infrastructure protection market and to better position the Company for sustainable growth, the Company embarked on a diversification strategy in 2009 to expand its product and service portfolio and its geographical reach. Through a series of strategic initiatives and key acquisitions, the Company now possesses a broad portfolio of cost-effective solutions for rehabilitating and maintaining aging or deteriorating infrastructure, protecting new infrastructure from corrosion worldwide and providing integrated professional services in engineering, procurement, construction, maintenance, and turnaround services for oil companies, primarily in the downstream market.
Recognizing that the breadth of offerings expanded beyond the Company’s flagship Insituform® brand, which constituted less than half of the Company’s revenues in 2011, the Company reorganized Insituform Technologies, Inc. (“Insituform”), the parent company at the time, into a new holding company structure in October 2011. Aegion became the new parent company and Insituform became a wholly-owned subsidiary of Aegion. Aegion reflects the Company’s mission of extending its leadership capabilities to furnish products and services to provide: (i) long-term protection for water and wastewater pipes, oil and gas pipelines and infrastructure as well as commercial and governmental structures and transportation infrastructure; and (ii) integrated professional services to energy companies.
Acquisitions/Strategic Initiatives/Divestitures
2017 Restructuring
On July 28, 2017, the Company’s board of directors approved a realignment and restructuring plan (the “2017 Restructuring”) to: (i) divest the Company’s pipe coating and insulation businesses in Louisiana, The Bayou Companies, LLC and Bayou Wasco Insulation, LLC (collectively “Bayou”); (ii) exit all non-pipe related contract applications for the Tyfo® system in North America; (iii) right-size the cathodic protection services operation in Canada; and (iv) reduce corporate and other operating costs. These decisions reflected the Company’s: (a) desire to reduce further its exposure in the North American upstream oil and gas markets; (b) assessment of its ability to drive sustainable, profitable growth in the non-pipe fiber reinforced polymer (“FRP”) contracting market in North America; and (c) assessment of continuing weak conditions in the Canadian oil and gas markets. During 2017, the Company also completed a detailed assessment of Infrastructure Solutions’ CIPP businesses in Australia and Denmark, which resulted in additional restructuring actions in both countries. See Note 3.
71
2016 Restructuring
On January 4, 2016, the Company’s board of directors approved a restructuring plan (the “2016 Restructuring”) to reduce the Company’s exposure to the upstream oil markets and to reduce consolidated expenses. The 2016 Restructuring repositioned Energy Services’ upstream operations in California, reduced Corrosion Protection’s upstream exposure by divesting its interest in a Canadian pipe coating joint venture, right-sized Corrosion Protection to compete more effectively and reduced corporate and other operating costs. The Company completed all of the aforementioned objectives related to the 2016 Restructuring. See Note 3.
Infrastructure Solutions Segment (“Infrastructure Solutions”)
On March 1, 2017, the Company acquired Environmental Techniques Limited and its parent holding company, Killeen Trading Limited (collectively “Environmental Techniques”), for a purchase price of £6.5 million, approximately $8.0 million, which was funded from the Company’s international cash balances. The purchase price is subject to post-closing working capital adjustments and included £1.0 million, approximately $1.2 million, held in escrow as security for any post-closing purchase price adjustments and post-closing indemnification obligations of Environmental Techniques’ previous owners. Environmental Techniques provides trenchless drainage inspection, cleaning and rehabilitation services throughout the United Kingdom and the Republic of Ireland.
On July 1, 2016, the Company acquired Concrete Solutions Limited (“CSL”) and Building Chemical Supplies Limited (“BCS”), two New Zealand companies (collectively, “Concrete Solutions”), for a purchase price paid at closing of NZD 7.5 million, approximately $5.5 million, which was funded from the Company’s cash balances. The sellers have the ability to earn up to an additional NZD 2.0 million, approximately $1.4 million, of proceeds based on reaching certain future performance targets. CSL provides structural strengthening, concrete repair and bridge jointing solutions primarily through application of FRP and injection resins and had served as a Tyfo® system certified applicator in New Zealand since the late 1990’s. BCS imports and distributes materials, including fiber reinforced polymer, injection resins, repair mortars and protective coatings.
On June 2, 2016, the Company acquired the cured-in-place pipe (“CIPP”) contracting operations of Leif M. Jensen A/S (“LMJ”), a Danish company and the Insituform licensee in Denmark since 2011. The purchase price was €2.9 million, approximately $3.2 million, and was funded from the Company’s cash balances.
On May 13, 2016, the Company acquired the operations and territories of Fyfe Europe S.A. and related companies (“Fyfe Europe”) for a purchase price of $3.0 million. The transaction was funded from the Company’s cash balances. Fyfe Europe held rights to provide Fyfe® product engineering and support to installers and applicators of FRP systems in 72 countries throughout Europe, the Middle East and North Africa. The acquisition of these territories now provides the Company with worldwide rights to market, manufacture and install the patented Tyfo® technology.
On February 18, 2016, the Company acquired Underground Solutions, Inc. and its subsidiary, Underground Solutions Technologies Group, Inc. (collectively, “Underground Solutions”), for an initial purchase price of $85.0 million plus an additional $5.0 million for the value of the estimated tax benefits associated with Underground Solutions’ net operating loss carry forwards. The purchase price included $6.3 million held in escrow as security for the post-closing purchase price adjustments and post-closing indemnification obligations of Underground Solutions’ previous owners. The transaction was funded partially from the Company’s cash balances and partially from borrowings under the Company’s revolving credit facility. To supplement the domestic cash balances, the Company repatriated approximately $29.7 million from foreign subsidiaries to assist in funding the transaction, incurring approximately $3.2 million in additional taxes, an accrual for which was included in the Company’s tax provision amounts for 2015. Underground Solutions provides infrastructure technologies for water, sewer and conduit applications.
In February 2015, the Company sold its wholly-owned subsidiary, Video Injection - Insituform SAS (“VII”), the Company’s French cured-in-place pipe (“CIPP”) contracting operation, to certain employees of VII. In connection with the sale, the Company entered into a five-year exclusive tube supply agreement whereby VII will purchase liners from Insituform Linings Limited. VII will also be entitled to continue to use its trade name based on a trade mark license granted for the same five-year time period. The sale resulted in a loss of approximately $2.9 million that was recorded to “Other income (expense)” in the Consolidated Statement of Operations during the first quarter of 2015.
On October 6, 2014, the Company’s board of directors approved a realignment and restructuring plan (the “2014 Restructuring”) which included the decision to exit Insituform’s contracting markets in France, Switzerland, Hong Kong, Malaysia and Singapore (see Note 3). The Company completed all of the aforementioned objectives related to the 2014 Restructuring. See Note 3.
Corrosion Protection Segment (“Corrosion Protection”)
In September 2017, the Company organized Aegion South Africa Proprietary Limited, a joint venture in South Africa between Aegion International Holdings Limited, a subsidiary of the Company (“Aegion International”), and Robor Proprietary
72
Limited (“Robor”), for the purpose of providing Aegion’s Corrosion Protection and Infrastructure Solutions products and services to Eastern and Southern Africa. Aegion International owns sixty percent (60%) of the joint venture and Robor owns the remaining forty percent (40%).
On July 28, 2017, the Company’s board of directors approved a plan to divest Bayou. Accordingly, the Company has classified Bayou’s assets and liabilities as held for sale on the Consolidated Balance Sheet at December 31, 2017. See Note 5.
On February 1, 2016, the Company sold its fifty-one percent (51%) interest in its Canadian pipe-coating joint venture, Bayou Perma-Pipe Canada, Ltd. (“BPPC”), to its joint venture partner, Perma-Pipe, Inc. The sale price was $9.6 million, which consisted of a $7.6 million payment at closing and a $2.0 million promissory note, which was paid in full on July 28, 2016. BPPC served as the Company’s pipe coating and insulation operation in Canada. As a result of the sale, the Company recognized a pre-tax, non-cash charge of approximately $0.6 million at December 31, 2015 to reflect the expected loss on the sale of the business. This loss was derived primarily from the release of cumulative currency translation adjustments and was recorded to “Other income (expense)” in the Consolidated Statement of Operations.
In July 2015, the Company paid $0.7 million to the sellers of CRTS, Inc. (“CRTS”) related to contingent consideration achieved during the year ended December 31, 2013. Also, in June 2015, the Company finalized the settlement of escrow claims made pursuant to the CRTS purchase agreement. As a result of the settlement, the Company received proceeds of approximately $1.0 million in July 2015, of which $0.2 million was recorded as an offset to operating expenses and the remaining $0.8 million was recorded to “Other income (expense)” in the Consolidated Statement of Operations.
Energy Services Segment (“Energy Services”)
On March 1, 2015, the Company acquired Schultz Mechanical Contractors, Inc. (“Schultz”), a California corporation, for a total purchase price of $7.7 million. Schultz primarily services customers in California and Arizona and is a provider of piping installations, concrete construction and excavation and trenching services to the upstream and downstream oil and gas markets.
Purchase Price Accounting
During 2017, the Company substantially completed its accounting for Environmental Techniques and finalized its accounting for Underground Solutions, Fyfe Europe, LMJ and Concrete Solutions. There were no significant adjustments to the purchase price accounting for Underground Solutions, Fyfe Europe, LMJ or Concrete Solutions during 2017. As the Company completes its final accounting for the Environmental Techniques acquisition, future adjustments related to working capital, deferred income taxes, definite-lived intangible assets and goodwill could occur. The goodwill and definite-lived intangible assets associated with the Fyfe Europe, LMJ and Concrete Solutions acquisitions are deductible for tax purposes; whereas, the goodwill and definite-lived intangible assets associated with the Environmental Techniques and Underground Solutions acquisitions are not deductible for tax purposes.
Schultz, Underground Solutions, Fyfe Europe, LMJ, Concrete Solutions and Environmental Techniques made the following contributions to the Company’s revenues and profits (in thousands):
Year Ended December 31, | |||||||||||||||||||||||
2017 | 2016 | 2015 | |||||||||||||||||||||
Revenues | Net Loss | Revenues | Net Income (Loss) | Revenues | Net Loss | ||||||||||||||||||
Schultz (1) | $ | 71,252 | $ | (891 | ) | $ | 24,702 | $ | (1,068 | ) | $ | 13,771 | $ | (1,470 | ) | ||||||||
Underground Solutions (2) | 32,063 | (3,778 | ) | 29,425 | (2,694 | ) | N/A | N/A | |||||||||||||||
Fyfe Europe | 583 | (190 | ) | 23 | (764 | ) | N/A | N/A | |||||||||||||||
LMJ (3) | 3,070 | (2,186 | ) | 4,865 | (1,153 | ) | N/A | N/A | |||||||||||||||
Concrete Solutions (4) | 5,922 | (1,940 | ) | 2,700 | 106 | N/A | N/A | ||||||||||||||||
Environmental Techniques | 5,270 | (909 | ) | N/A | N/A | N/A | N/A | ||||||||||||||||
“N/A” represents not applicable.
(1) | The reported net loss in 2017 includes a pre-tax allocation of corporate expenses of $6.8 million. The reported net loss in 2016 includes pre-tax 2016 Restructuring charges of $0.2 million and a pre-tax allocation of corporate expenses of $2.9 million. The reported net loss in 2015 includes a pre-tax impairment charge of $1.7 million allocated from goodwill impairments in the Energy Services reporting unit (see Note 2) and a pre-tax allocation of corporate expenses of $1.0 million. |
(2) | The reported net loss in 2017 includes a pre-tax allocation of corporate expenses of $4.5 million. The reported net loss in 2016 includes a pre-tax charge for inventory step-up of $3.6 million, recognized as part of the accounting for business combinations, and a pre-tax allocation of corporate expenses of $3.2 million. |
73
(3) | The reported net loss in 2017 includes pre-tax 2017 Restructuring charges of $0.1 million. |
(4) | The reported net loss in 2017 includes a pre-tax impairment charge of $2.2 million allocated from goodwill impairments in the Fyfe reporting unit (see Note 2). |
The following unaudited pro forma summary presents combined information of the Company as if the Schultz, Underground Solutions, Fyfe Europe, LMJ, Concrete Solutions and Environmental Techniques acquisitions had occurred at the beginning of the year preceding their acquisition (in thousands, except earnings per share):
Years Ended December 31, | |||||||||||
2017(1) | 2016(2) | 2015(3) | |||||||||
Revenues | $ | 1,359,901 | $ | 1,238,730 | $ | 1,387,465 | |||||
Net income (loss) (4) | (69,227 | ) | 29,959 | (6,545 | ) | ||||||
Diluted earnings (loss) per share | $ | (2.09 | ) | $ | 0.85 | $ | (0.18 | ) | |||
_____________________
(1) | Includes pro-forma results related to Environmental Techniques. |
(2) | Includes pro-forma results related to Environmental Techniques, Underground Solutions, Fyfe Europe, LMJ and Concrete Solutions. |
(3) | Includes pro-forma results related to Underground Solutions, Fyfe Europe, LMJ, Concrete Solutions and Schultz. |
(4) | Includes pro-forma adjustments for depreciation and amortization associated with acquired tangible and intangible assets, as if those assets were recorded at the beginning of the year preceding the acquisition date. |
The transaction purchase price to acquire Environmental Techniques was £6.5 million, approximately $8.0 million, which represented cash consideration paid at closing.
The transaction purchase price to acquire Underground Solutions was $88.4 million, which included: (i) a payment at closing of $85.0 million; (ii) a payment of $5.0 million for the value of the estimated tax benefits associated with Underground Solutions’ net operating loss carry forwards; and (iii) working capital adjustments of $1.6 million payable to the Company.
The transaction purchase price to acquire Fyfe Europe was $3.0 million, which represented cash consideration paid at closing of $2.8 million plus $0.2 million of deferred contingent consideration, which was paid during 2017.
The transaction purchase price to acquire LMJ was €2.9 million, approximately $3.2 million, which was paid at closing.
The transaction purchase price to acquire Concrete Solutions was NZD 8.9 million, approximately $6.4 million, which included: (i) a payment at closing of NZD 7.5 million, approximately $5.5 million; (ii) a preliminary working capital adjustment payable to the sellers of NZD 0.2 million, approximately $0.1 million; and (iii) the estimated fair value of earnout consideration of NZD 1.2 million, approximately $0.9 million. During 2017, the Company reversed $0.1 million of the earnout consideration as operating results for the twelve-month period ended June 30, 2017 were below the target amounts in the purchase agreement. The accrual adjustment resulted in an offset to “Operating expenses” in the Consolidated Statement of Operations. After the accrual adjustment, the estimated fair value of the contingent consideration was NZD 1.0 million, approximately $0.8 million, and recorded to “Other non-current liabilities” in the Consolidated Balance Sheet. The fair value estimate was determined using observable inputs and significant unobservable inputs, which are based on level 3 inputs as defined in Note 12.
Total cash consideration recorded to acquire Schultz was $6.7 million, which was funded by the Company’s cash reserves. The cash consideration included the purchase price paid at closing of $7.1 million less working capital adjustments of $0.4 million. The total purchase price was $7.7 million, which represented the cash consideration of $6.7 million plus $1.0 million of deferred contingent consideration. The fair value estimate of the contingent consideration was determined using observable inputs and significant unobservable inputs, which are based on level 3 inputs as defined in Note 12. In each of the first quarters of 2017 and 2016, $0.5 million of the contingent consideration was paid to the previous owners.
74
The following table summarizes the fair value of identified assets and liabilities of the Environmental Techniques, Underground Solutions, Fyfe Europe, LMJ, Concrete Solutions and Schultz acquisitions at their respective acquisition dates (in thousands):
Environmental Techniques | Underground Solutions | Fyfe Europe | LMJ | Concrete Solutions | Schultz | ||||||||||||||||||
Cash | $ | — | $ | 3,630 | $ | — | $ | — | $ | — | $ | — | |||||||||||
Receivables and cost and estimated earnings in excess of billings | 801 | 6,339 | — | — | 1,469 | 1,086 | |||||||||||||||||
Inventories | 1,281 | 12,629 | — | 504 | 857 | — | |||||||||||||||||
Prepaid expenses and other current assets | 93 | 671 | — | — | 18 | 19 | |||||||||||||||||
Property, plant and equipment | 2,147 | 2,755 | 50 | 1,194 | 422 | 162 | |||||||||||||||||
Identified intangible assets | 1,869 | 33,370 | 513 | 795 | 1,722 | 3,060 | |||||||||||||||||
Deferred income tax assets | 124 | 13,282 | — | — | — | — | |||||||||||||||||
Other assets | — | 90 | — | — | — | ||||||||||||||||||
Accounts payable | (1,025 | ) | (4,653 | ) | — | — | (837 | ) | (663 | ) | |||||||||||||
Accrued expenses | (186 | ) | (5,900 | ) | — | — | (149 | ) | — | ||||||||||||||
Billings in excess of cost and estimated earnings | — | (2,943 | ) | — | — | — | — | ||||||||||||||||
Deferred tax liabilities | (413 | ) | (14,562 | ) | — | — | (482 | ) | — | ||||||||||||||
Total identifiable net assets | $ | 4,691 | $ | 44,708 | $ | 563 | $ | 2,493 | $ | 3,020 | $ | 3,664 | |||||||||||
Total consideration recorded | $ | 8,046 | $ | 88,370 | $ | 3,000 | $ | 3,235 | $ | 6,393 | $ | 7,662 | |||||||||||
Less: total identifiable net assets | 4,691 | 44,708 | 563 | 2,493 | 3,020 | 3,664 | |||||||||||||||||
Final purchase price goodwill | $ | 3,355 | $ | 43,662 | $ | 2,437 | $ | 742 | $ | 3,373 | $ | 3,998 | |||||||||||
2. ACCOUNTING POLICIES
Principles of Consolidation
The consolidated financial statements include the accounts of the Company, its wholly-owned subsidiaries and majority-owned subsidiaries in which the Company is deemed to be the primary beneficiary. All significant intercompany transactions and balances have been eliminated.
Accounting Estimates
The preparation of financial statements in conformity with accounting principles generally accepted in the United States requires management to make estimates and assumptions that affect the reported amounts of assets and liabilities and disclosure of contingent assets and liabilities at the date of the financial statements and the reported amounts of revenues and expenses during the reporting period. Actual results could differ from those estimates.
Revenues
Revenues include construction, engineering and installation revenues that are recognized using the percentage-of-completion method of accounting in the ratio of costs incurred to estimated final costs. Revenues from change orders, extra work and variations in the scope of work are recognized when it is probable that they will result in additional contract revenue and when the amount can be reliably estimated. Contract costs include all direct material and labor costs and those indirect costs related to contract performance, such as indirect labor, supplies, tools and equipment costs. The Company expenses all pre-contract costs in the period these costs are incurred. Since the financial reporting of these contracts depends on estimates, which are assessed continually during the term of these contracts, recognized revenues and profit are subject to revisions as the contract progresses to completion. A revision in profit estimates are reflected in the period in which the facts that give rise to the revision become known. If material, the effects of any changes in estimates are disclosed in the notes to the consolidated financial statements. When estimates indicate that a loss will be incurred on a contract, a provision for the expected loss is recorded in the period in which the loss becomes evident. Any revenue recognized is only to the extent costs have been recognized in the period. Additionally, the Company expenses all costs for unpriced change orders in the period in which they are incurred.
75
Revenues from the Company’s Energy Services segment are derived mainly from multiple maintenance contracts under multi-year, long-term Master Service Agreements and alliance contracts, as well as engineering and construction type contracts. Businesses within Energy Services enter into customer contracts that contain three principal types of pricing provisions: time and materials, cost plus fixed fee and fixed price. Although the terms of these contracts vary, most are made pursuant to cost reimbursable contracts on a time and materials basis under which revenues are recorded based on costs incurred at agreed upon contractual rates. Energy Services also performs services on a cost plus fixed fee basis under which revenues are recorded based upon costs incurred at agreed upon rates and a proportionate amount of the fixed fee or percentage stipulated in the contract.
Foreign Currency
For the Company’s international subsidiaries, the local currency is generally the functional currency. Assets and liabilities of these subsidiaries are translated into U.S. dollars using rates in effect at the balance sheet date while revenues and expenses are translated into U.S. dollars using average exchange rates. The cumulative translation adjustment resulting from changes in exchange rates are included in the Consolidated Balance Sheets as a component of accumulated other comprehensive loss in total stockholders’ equity.
The Company’s accumulated other comprehensive loss is comprised of three main components: (i) currency translation; (ii) derivatives; and (iii) gains and losses associated with the Company’s defined benefit plan in the United Kingdom (in thousands):
December 31, | |||||||
2017 | 2016 | ||||||
Currency translation adjustments (1) | $ | (35,928 | ) | $ | (54,145 | ) | |
Derivative hedging activity | 3,336 | 1,004 | |||||
Pension activity | (244 | ) | (359 | ) | |||
Total accumulated other comprehensive loss | $ | (32,836 | ) | $ | (53,500 | ) | |
__________________________
(1) | Due to the weakening of the U.S. dollar, there was a substantial increase during 2017 with respect to certain functional currencies and their relation to the U.S. dollar, most notably the Canadian dollar, Australian dollar, British pound and euro. |
Net foreign exchange transaction losses of $3.3 million, $0.9 million and $0.1 million for 2017, 2016 and 2015, respectively, are included in “Other expense” in the Consolidated Statements of Operations.
Research and Development
The Company expenses research and development costs as incurred. Research and development costs of $4.2 million, $4.7 million and $2.6 million for the years ended December 31, 2017, 2016 and 2015, respectively, are included in “Operating expenses” in the consolidated statements of operations.
Taxation
The Company provides for estimated income taxes payable or refundable on current year income tax returns as well as the estimated future tax effects attributable to temporary differences and carryforwards, based upon enacted tax laws and tax rates, and in accordance with FASB ASC 740, Income Taxes (“FASB ASC 740”). FASB ASC 740 also requires that a valuation allowance be recorded against any deferred tax assets that are not likely to be realized in the future. The determination is based on the Company’s ability to generate future taxable income and, at times, is dependent on its ability to implement strategic tax initiatives to ensure full utilization of recorded deferred tax assets. Should the Company not be able to implement the necessary tax strategies, it may need to record valuation allowances for certain deferred tax assets, including those related to foreign income tax benefits. Significant management judgment is required in determining the provision for income taxes, deferred tax assets and liabilities and any valuation allowances recorded against net deferred tax assets.
As a result of the reduction in the U.S. corporation income tax rate from 35% to 21% under the Tax Cuts and Jobs Act (“TCJA”), FASB ASC 740 required the Company to remeasure its deferred tax assets and liabilities based on tax rates at which the balances are expected to reverse in the future. The provisional amount recorded for the remeasurement of the Company’s deferred tax balances resulted in no adjustment to tax expense. The remeasurement of the deferred tax assets gave rise to an additional income tax expense of $5.1 million, which was offset by an equal reduction in the valuation allowance of $5.1 million. The Company continues to analyze certain aspects of the TCJA, including consideration of additional forthcoming technical guidance, which could potentially affect the measurement of these balances or potentially give rise to new deferred tax amounts.
76
In accordance with FASB ASC 740, tax benefits from an uncertain tax position may be recognized when it is more likely than not that the position will be sustained upon examination, including resolutions of any related appeals or litigation processes, based on the technical merits. In addition, this recognition model includes a measurement attribute that measures the position as the largest amount of tax that is greater than 50% likely of being realized upon ultimate settlement in accordance with FASB ASC 740. This interpretation also provides guidance on derecognition, classification, interest and penalties, accounting in interim periods, disclosure and transition.
The Company recognizes tax liabilities in accordance with FASB ASC 740 and adjusts these liabilities when judgment changes as a result of the evaluation of new information not previously available. Due to the complexity of some of these uncertainties, the ultimate resolution may result in a payment that is materially different from the current estimate of the tax liabilities. These differences will be reflected as increases or decreases to income tax expense in the period in which they are determined. While the Company believes the resulting tax balances as of December 31, 2017 and 2016 were appropriately accounted for in accordance with FASB ASC 740, the ultimate outcome of such matters could result in favorable or unfavorable adjustments to the consolidated financial statements and such adjustments could be material.
In connection with the Company’s initial analysis of the impact of the TCJA, it recorded a provisional estimated net tax expense of $2.4 million, which consisted of a charge of $10.4 million for the deemed mandatory repatriation, and reduced by a $7.1 million release of a deferred tax liability on unremitted foreign earnings and $0.9 million of other TCJA related impacts. On December 22, 2017, the SEC issued guidance under Staff Accounting Bulletin No. 118, Income Tax Accounting Implications of the Tax Cuts and Jobs Act, (“SAB 118”), directing a taxpayer to consider the impact of the U.S. legislation as “provisional” when it does not have the necessary information available, prepared, or analyzed (including computations) in reasonable detail to complete the accounting for income tax effects of the TCJA. In accordance with SAB 118, the additional estimated income tax of $2.4 million represents the Company’s best estimate understanding that the provisional amount is subject to further adjustments under SAB 118. The Company continues to refine provisional balances, and adjustments may be made under SAB 118 during the measurement period as a result of future changes in interpretation, issuance of additional regulatory guidance from the U.S. federal and state tax authorities, or its own assumption changes. All accounting will be completed within the one-year measurement period allowed under SAB 118. The ultimate impact of the TCJA may differ from the current provisional amounts and the adjustments could be material.
Refer to Note 10 for additional information regarding taxes on income.
Earnings per Share
Earnings per share have been calculated using the following share information:
Years Ended December 31, | ||||||||
2017 | 2016 | 2015 | ||||||
Weighted average number of common shares used for basic EPS | 33,150,949 | 34,713,937 | 36,554,437 | |||||
Effect of dilutive stock options and restricted and deferred stock unit awards | — | 496,493 | — | |||||
Weighted average number of common shares and dilutive potential common stock used in dilutive EPS | 33,150,949 | 35,210,430 | 36,554,437 | |||||
The Company excluded 735,577 and 324,804 stock options and restricted and deferred stock units in 2017 and 2015, respectively, from the diluted earnings per share calculation for the Company’s common stock because of the reported net loss for each period. The Company excluded 73,897, 77,807 and 164,014 stock options in 2017, 2016 and 2015, respectively, from the diluted earnings per share calculations for the Company’s common stock because they were anti-dilutive as their exercise prices were greater than the average market price of common shares for each period.
Purchase Price Accounting
The Company accounts for its acquisitions in accordance with FASB ASC 805, Business Combinations. The base cash purchase price plus the estimated fair value of any non-cash or contingent consideration given for an acquired business is allocated to the assets acquired (including identified intangible assets) and liabilities assumed based on the estimated fair values of such assets and liabilities. The excess of the total consideration over the aggregate net fair values assigned is recorded as goodwill. Contingent consideration, if any, is recognized as a liability as of the acquisition date with subsequent adjustments recorded in the consolidated statements of operations. Indirect and general expenses related to business combinations are expensed as incurred.
The Company typically determines the fair value of tangible and intangible assets acquired in a business combination using independent valuations that rely on management’s estimates of inputs and assumptions that a market participant would use. Key assumptions include cash flow projections, growth rates, asset lives, and discount rates based on an analysis of weighted average cost of capital.
77
Classification of Current Assets and Current Liabilities
The Company includes in current assets and current liabilities certain amounts realizable and payable under construction contracts that may extend beyond one year. The construction periods on projects undertaken by the Company generally range from less than one month to 24 months.
At December 31, 2017, the Company’s balance in billings in excess of costs and estimated earnings was $51.6 million, which decreased $11.1 million from $62.7 million at December 31, 2016 primarily due to the timing of billing and advance deposits received on certain pipe coating and insulation projects at our Bayou facility in Louisiana. Correspondingly, the Company’s balance in prepaid expenses and other current assets was $35.3 million at December 31, 2017, a decrease of $16.6 million from $51.8 million at December 31, 2016 due primarily to the timing of advance deposits paid to suppliers on those same projects.
Cash, Cash Equivalents and Restricted Cash
The Company classifies highly liquid investments with original maturities of 90 days or less as cash equivalents. Recorded book values are reasonable estimates of fair value for cash and cash equivalents. Restricted cash primarily consists of funds reserved for legal requirements, payments from certain customers placed in escrow in lieu of retention in case of potential issues regarding future job performance by the Company, or advance customer payments and compensating balances for bank undertakings in Europe. Restricted cash related to operations is similar to retainage, and is, therefore, classified as a current asset, consistent with the Company’s policy on retainage. Changes in restricted cash flows are reported in the consolidated statements of cash flows based on the nature of the restriction.
Inventories
Inventories are stated at the lower of cost (first-in, first-out) or market. Actual cost is used to value raw materials and supplies. Standard cost, which approximates actual cost, is used to value work-in-process, finished goods and construction materials. Standard cost includes direct labor, raw materials and manufacturing overhead based on normal capacity. For certain businesses within our Corrosion Protection segment, the Company uses actual costs or average costs for all classes of inventory.
Retainage
Many of the contracts under which the Company performs work contain retainage provisions. Retainage refers to that portion of revenue earned by the Company but held for payment by the customer pending satisfactory completion of the project. The Company generally invoices its customers periodically as work is completed. Under ordinary circumstances, collection from municipalities is made within 60 to 90 days of billing. In most cases, 5% to 15% of the contract value is withheld by the municipal owner pending satisfactory completion of the project. Collections from other customers are generally made within 30 to 45 days of billing. Unless reserved, the Company believes that all amounts retained by customers under such provisions are fully collectible. Retainage on active contracts is classified as a current asset regardless of the term of the contract. Retainage is generally collected within one year of the completion of a contract, although collection can extend beyond one year from time to time. As of December 31, 2017, retainage receivables aged greater than 365 days approximated 10% of the total retainage balance and collectibility was assessed as described in the allowance for doubtful accounts section below.
Allowance for Doubtful Accounts
Management makes estimates of the uncollectibility of accounts receivable and retainage. The Company records an allowance based on specific accounts to reduce receivables, including retainage, to the amount that is expected to be collected. The specific allowances are reevaluated and adjusted as additional information is received. After all reasonable attempts to collect the receivable or retainage have been explored, the account is written off against the allowance. The Company also includes reserves related to certain accounts receivable that may be in litigation or dispute.
Long-Lived Assets
Property, plant and equipment and other identified intangibles (primarily customer relationships, patents and acquired technologies, trademarks, licenses and non-compete agreements) are recorded at cost, net of accumulated depreciation and impairment, and, except for goodwill and certain trademarks, are depreciated or amortized on a straight-line basis over their estimated useful lives. Changes in circumstances such as technological advances, changes to the Company’s business model or changes in the Company’s capital strategy can result in the actual useful lives differing from the Company’s estimates. If the Company determines that the useful life of its property, plant and equipment or its identified intangible assets should be changed, the Company would depreciate or amortize the net book value in excess of the salvage value over its revised remaining useful life, thereby increasing or decreasing depreciation or amortization expense.
78
Long-lived assets, including property, plant and equipment and other intangibles, are reviewed for impairment whenever events or changes in circumstances indicate that the carrying amount of an asset may not be recoverable. Such impairment tests are based on a comparison of undiscounted cash flows to the recorded value of the asset. The estimate of cash flow is based upon, among other things, assumptions about expected future operating performance. The Company’s estimates of undiscounted cash flow may differ from actual cash flow due to, among other things, technological changes, economic conditions, changes to its business model or changes in its operating performance. If the sum of the undiscounted cash flows is less than the carrying value, the Company recognizes an impairment loss, measured as the amount by which the carrying value exceeds the fair value of the asset.
Impairment Review – 2017
As part of the 2017 Restructuring, which was approved by the Company’s board of directors on July 28, 2017, the Company exited all non-pipe related contract applications for the Tyfo® system in North America. As a result of this action, the Company evaluated the long-lived assets of its Fyfe reporting unit, which caused the Company to review the financial performance of at-risk asset groups within the Fyfe reporting unit in accordance with FASB ASC 360, Property, Plant and Equipment (“FASB ASC 360”). The results of the Fyfe reporting unit and its related asset groups are reported within the Infrastructure Solutions reportable segment.
The assets of an asset group represent the lowest level for which identifiable cash flows can be determined independent of other groups of assets and liabilities. The Fyfe North America asset group was the only at-risk asset group reviewed for impairment. The Company developed internal forward business plans under the guidance of local and regional leadership to determine the undiscounted expected future cash flows derived from Fyfe North America’s long-lived assets. Such were based on management’s best estimates considering the likelihood of various outcomes. Based on the internal projections, the Company determined that the sum of the undiscounted expected future cash flows for the Fyfe North America asset group was less than the carrying value of the assets, and as a result, engaged a third-party valuation firm to assist management in determining the fair value of long-lived assets for the Fyfe North America asset group.
In order to determine the impairment amount of long-lived assets, the Company first determined the fair value of each key component of its long-lived assets for the Fyfe North America asset group. The fair values were derived using various income-based approaches, which utilize discounted cash flows to evaluate the net earnings attributable to the asset being measured. Key assumptions used in assessment include the discount rate (based on weighted-average cost of capital), revenue growth rates, contributory asset charges, customer attrition, income tax rates and working capital needs, which were based on current market conditions and were consistent with internal management projections.
Based on the results of the valuation, the carrying amount of certain long-lived assets for the Fyfe North America asset group exceeded the fair value. Accordingly, the Company recorded impairment charges of $3.4 million to trademarks, $20.8 million to customer relationships and $16.8 million to patents and acquired technology in the third quarter of 2017. The impairment charges were recorded to “Definite-lived intangible asset impairment” in the Consolidated Statement of Operations. Property, plant and equipment were determined to have a carrying value that exceeded fair value; thus, no impairment was recorded.
Impairment Reviews – 2015
As a result of the annual impairment assessment in accordance with FASB ASC 350, Intangibles - Goodwill and Other (“FASB ASC 350”) as of October 1, 2015, the CRTS reporting unit had a fair value below its carrying value, which caused the Company to review the financial performance of at risk asset groups within that reporting unit in accordance with FASB ASC 360. The results of CRTS are reported within the Corrosion Protection reportable segment.
In response to contract losses in the Central California upstream energy market during the fourth quarter of 2015 and the Company’s subsequent decision to reduce our Energy Service segment’s exposure to the upstream market, the Company performed a market assessment and concluded that sustained low oil prices would continue to create market challenges for the foreseeable future, including a continued reduction in spending by certain of its customers in 2016. The loss of the contracts, coupled with the decision to downsize, caused the Company to review the financial performance of at risk asset groups within the reporting unit. The results of Energy Services are reported within the Energy Services reportable segment.
The assets of each asset group represent the lowest level for which identifiable cash flows can be determined independent of other groups of assets and liabilities. The Company developed internal forward business plans under the guidance of local and regional leadership to determine the undiscounted expected future cash flows derived from each of the at risk asset groups’ long-lived assets. Such were based on management’s best estimates considering the likelihood of various outcomes. Based on the internal projections, the Company determined that the undiscounted expected future cash flows for all of the identified at risk asset groups exceeded the carrying value of the assets, and as such, no impairment to recorded long-lived assets was required.
79
The fair value estimates described above were determined using observable inputs and significant unobservable inputs, which are based on level 3 inputs as defined in Note 12.
Goodwill
Under FASB ASC 350, the Company assesses recoverability of goodwill on an annual basis or when events or changes in circumstances indicate that the carrying amount of goodwill may not be recoverable. An impairment charge will be recognized to the extent that the fair value of a reporting unit is less than its carrying value. Factors that could potentially trigger an impairment review include (but are not limited to):
• | significant underperformance of a segment relative to expected, historical or forecasted operating results; |
• | significant negative industry or economic trends; |
• | significant changes in the strategy for a segment including extended slowdowns in the segment’s market; |
• | a decrease in market capitalization below the Company’s book value; and |
• | a significant change in regulations. |
Whether during the annual impairment assessment or during a trigger-based impairment review, the Company determines the fair value of its reporting units and compares such fair value to the carrying value of those reporting units to determine if there are any indications of goodwill impairment.
Fair value of reporting units is determined using a combination of two valuation methods: a market approach and an income approach with each method given equal weight in determining the fair value assigned to each reporting unit. Absent an indication of fair value from a potential buyer or similar specific transaction, the Company believes the use of these two methods provides a reasonable estimate of a reporting unit’s fair value. Assumptions common to both methods are operating plans and economic outlooks, which are used to forecast future revenues, earnings and after-tax cash flows for each reporting unit. These assumptions are applied consistently for both methods.
The market approach estimates fair value by first determining earnings before interest, taxes, depreciation and amortization (“EBITDA”) multiples for comparable publicly-traded companies with similar characteristics of the reporting unit. The EBITDA multiples for comparable companies are based upon current enterprise value. The enterprise value is based upon current market capitalization and includes a control premium. The Company believes this approach is appropriate because it provides a fair value estimate using multiples from entities with operations and economic characteristics comparable to its reporting units.
The income approach is based on forecasted future (debt-free) cash flows that are discounted to present value using factors that consider timing and risk of future cash flows. The Company believes this approach is appropriate because it provides a fair value estimate based upon the reporting unit’s expected long-term operating cash flow performance. Discounted cash flow projections are based on financial forecasts developed from operating plans and economic outlooks, growth rates, estimates of future expected changes in operating margins, terminal value growth rates, future capital expenditures and changes in working capital requirements. Estimates of discounted cash flows may differ from actual cash flows due to, among other things, changes in economic conditions, changes to business models, changes in the Company’s weighted average cost of capital, or changes in operating performance.
The discount rate applied to the estimated future cash flows is one of the most significant assumptions utilized under the income approach. The Company determines the appropriate discount rate for each of its reporting units based on the weighted average cost of capital (“WACC”) for each individual reporting unit. The WACC takes into account both the pre-tax cost of debt and cost of equity (including the risk-free rate on twenty year U.S. Treasury bonds), and certain other company-specific and market-based factors. As each reporting unit has a different risk profile based on the nature of its operations, the WACC for each reporting unit is adjusted, as appropriate, to account for company-specific risks. Accordingly, the WACC for each reporting unit may differ.
Impairment Review – Third Quarter 2017
As part of the 2017 Restructuring, which was approved by the Company’s board of directors on July 28, 2017, the Company exited all non-pipe related contract applications for the Tyfo® system in North America. As a result of this action, the Company evaluated the goodwill of its Fyfe reporting unit and determined that a triggering event occurred. As such, the Company engaged a third-party valuation to assist management in performing a goodwill impairment review for its Fyfe reporting unit during the third quarter of 2017. In accordance with the provisions of FASB ASC 350, the Company determined the fair value of the reporting unit and compared such fair value to the carrying value of the reporting unit. For the Fyfe reporting unit, carrying value, as adjusted for the long-lived asset impairments discussed previously, exceeded fair value by approximately 45%.
80
Despite the Company’s recent investments in sales resources to drive growth in North America, FRP technology has become more widely accepted and more contractors have become proficient with installation, which has begun to commoditize the application of the Tyfo® system during construction in the North American civil structure market. As a result of this and other factors, the Company decided to exit all non-pipe related contract applications for the Tyfo® system in North America. The Company is now focused on using its expertise in FRP technologies to promote third-party product sales, continuing pipe-related FRP installations and providing technical engineering support in the civil structural market in North America. The FRP operation in Asia remains largely unchanged as market conditions remain favorable.
The Company’s decision, as noted above, permanently lowered the expected future cash flows of the reporting unit. As a result, the values derived from both the income approach and the market approach decreased from the October 1, 2016 annual goodwill impairment analysis. The fair value for the Fyfe reporting unit decreased $105.2 million, or 65.3%, from the previous analysis. The impairment analysis assumed a weighted average cost of capital of 17.0%, which is higher than the 16.0% utilized in the October 1, 2016 review, primarily due to rising risk-free rates on twenty-year U.S. Treasury bonds. The company-specific factors influencing discount rates remained consistent in both analyses. The impairment analysis also assumed a long-term growth rate of 2.5%, which was reduced from 3.5% used in the October 1, 2016 review. This change reflects the Company’s expectations for future annual revenue growth, which were lowered from 10.8% in the previous analysis to 4.0%, primarily due to the downsizing of the North American operations. Expected gross margins were consistent between both analyses.
As of January 1, 2017, the Company adopted FASB Accounting Standards Update No. 2017-04, Simplifying the Test for Goodwill Impairment, which states that an impairment charge should be recognized for the amount by which the carrying amount exceeds the reporting unit’s fair value. Based on the impairment analysis, the Company determined that recorded goodwill at the Fyfe reporting unit was impaired by $45.4 million, which was recorded to “Goodwill impairment” in the Consolidated Statement of Operations during the third quarter of 2017. As of December 31, 2017, the Company had remaining Fyfe goodwill of $9.6 million. Projected cash flows were based, in part, on the ability to grow third-party product sales and pressure pipe contracting in North America, and maintaining a presence in other international markets. If these assumptions do not materialize in a manner consistent with Company’s expectations, there is risk of additional impairment to recorded goodwill.
Annual Impairment Assessment – October 1, 2017
The Company had seven reporting units for purposes of assessing goodwill at October 1, 2017 as follows: Municipal Pipe Rehabilitation, Fyfe, Corrpro, United Pipeline Systems, Bayou, Coating Services and Energy Services. During 2017, the Company acquired Environmental Techniques (see Note 1) and integrated it into the Municipal Pipe Rehabilitation reporting unit.
Significant assumptions used in the Company’s October 2017 goodwill review included: (i) discount rates ranging from 12.0% to 17.0%; (ii) compound annual growth rates for revenues generally ranging from 1.4% to 5.8%; (iii) gross margin stability or slight improvement in the short term related to certain reporting units affected by the 2017 Restructuring, but sustained or slightly increased gross margins long term; (iv) peer group EBITDA multiples; and (v) terminal values for each reporting unit using a long-term growth rate of 1.0% to 3.0%.
During the Company’s assessment of its reporting units’ fair values in relation to their respective carrying values, no reporting units had a fair value below carrying value and only one reporting unit had a fair value within 10% percent of its carrying value. The reporting unit with a fair value within 10% of its carrying value was the Fyfe reporting unit, which recorded goodwill impairment and adjusted its carrying value to fair value during the third quarter of 2017 as discussed above.
Annual Impairment Assessment – October 1, 2015
As a result of the annual impairment assessment in accordance with FASB ASC 350, the CRTS reporting unit had a fair value less than its carrying value. Long-term expectations for the CRTS businesses remained low due to continued uncertainty in the upstream oil markets, which caused customer-driven delays in the more profitable international offshore pipeline market and delayed or canceled sales opportunities in certain North American markets. CRTS secured sizable project wins during 2014 and 2015; however, most were situated in international onshore and mining markets, which typically offer lower margin profiles. As a result of failing Step 1, the Company performed Step 2 procedures, which compares the carrying value of goodwill to its implied fair value. Based on this analysis, the Company determined that recorded goodwill at CRTS was impaired by $10.0 million, which was recorded to “Goodwill impairment” in the Consolidated Statement of Operations in the fourth quarter of 2015. As of December 31, 2015, the Company had remaining CRTS goodwill of $4.4 million. Projected cash flows were based, in part, on maintaining a presence in the higher-margin, international offshore pipeline market and the Company’s ability to expand its technology to other applications.
81
Impairment Review – December 31, 2015
In response to contract losses in the Central California upstream energy market during the fourth quarter of 2015 and the Company’s subsequent decision to reduce exposure to the upstream market, the Company performed a market assessment of its energy-related businesses and concluded that sustained low oil prices would continue to create market challenges for the foreseeable future, including a continued reduction in spending by certain of its customers in 2016. The loss of the contracts, coupled with the decision to downsize, caused the Company to review the goodwill of its operations affected by these circumstances and determined that a triggering event had occurred. As such, the Company performed an interim goodwill impairment review for its Energy Services reporting unit as of December 31, 2015.
In accordance with the provisions of FASB ASC 350, the Company determined the fair value of the affected reporting unit and it was found to be less than the carrying value. As a result of failing Step 1, the Company performed Step 2 procedures, which compares the carrying value of goodwill to its implied fair value. Based on this analysis, the Company determined that recorded goodwill at Energy Services was impaired by $33.5 million, which was recorded to “Goodwill impairment” in the Consolidated Statement of Operations in the fourth quarter of 2015. As of December 31, 2015, Energy Services had remaining goodwill of $46.7 million. Projected cash flows were based on maintaining a smaller but profitable presence in the upstream energy market and continued strength in the Central California downstream energy market. Also included in the projected cash flows were certain cost savings expected to be achieved through the 2016 Restructuring.
Investments in Variable Interest Entities
The Company evaluates all transactions and relationships with variable interest entities (“VIE”) to determine whether the Company is the primary beneficiary of the entities in accordance with FASB ASC 810, Consolidation.
The Company’s overall methodology for evaluating transactions and relationships under the VIE requirements includes the following two steps:
• | determine whether the entity meets the criteria to qualify as a VIE; and |
• | determine whether the Company is the primary beneficiary of the VIE. |
In performing the first step, the significant factors and judgments that the Company considers in making the determination as to whether an entity is a VIE include:
• | the design of the entity, including the nature of its risks and the purpose for which the entity was created, to determine the variability that the entity was designed to create and distribute to its interest holders; |
• | the nature of the Company’s involvement with the entity; |
• | whether control of the entity may be achieved through arrangements that do not involve voting equity; |
• | whether there is sufficient equity investment at risk to finance the activities of the entity; and |
• | whether parties other than the equity holders have the obligation to absorb expected losses or the right to receive residual returns. |
If the Company identifies a VIE based on the above considerations, it then performs the second step and evaluates whether it is the primary beneficiary of the VIE by considering the following significant factors and judgments:
• | whether the entity has the power to direct the activities of a variable interest entity that most significantly impact the entity’s economic performance; and |
• | whether the entity has the obligation to absorb losses of the entity that could potentially be significant to the variable interest entity or the right to receive benefits from the entity that could potentially be significant to the variable interest entity. |
Based on its evaluation of the above factors and judgments, as of December 31, 2017, the Company consolidated any VIEs in which it was the primary beneficiary.
82
Financial data for consolidated variable interest entities are summarized in the following tables (in thousands):
December 31, | |||||||
Balance sheet data | 2017 (1) | 2016 | |||||
Current assets | $ | 42,732 | $ | 51,354 | |||
Non-current assets | 26,346 | 25,607 | |||||
Current liabilities | 12,449 | 29,324 | |||||
Non-current liabilities | 30,675 | 28,849 | |||||
_____________________
(1) | Amounts include $25.4 million of assets and $9.8 million of liabilities classified as held for sale relating to our pipe coating and insulation joint venture in Louisiana, Bayou Wasco Insulation, LLC. See Note 5. |
Years Ended December 31, | |||||||||||
Statement of operations data | 2017 (1) | 2016 | 2015 | ||||||||
Revenue | $ | 91,947 | $ | 61,205 | $ | 77,361 | |||||
Gross profit | 15,194 | 5,760 | 11,325 | ||||||||
Net income (loss) | 3,432 | (3,075 | ) | 321 | |||||||
_____________________
(1) | During 2017, increases were primarily driven from: (i) our joint venture in Louisiana, which completed its work on a large deepwater pipe coating and insulation project; and (ii) the formation of our new joint venture in South Africa. |
Accounting Standards Updates
In February 2018, the FASB issued Accounting Standards Update No. 2018-02, Reclassification of Certain Tax Effects from Accumulated Other Comprehensive Income, which permits a company to reclassify the income tax effects of the TCJA on items within AOCI to retained earnings. The guidance is effective for the Company’s fiscal year beginning January 1, 2019, including interim periods within that fiscal year. Companies may adopt the new guidance using one of two transition methods: (i) retrospective to each period (or periods) in which the income tax effects are recognized, or (ii) at the beginning of the period of adoption. The Company is currently evaluating the effect the guidance will have on its consolidated financial statements.
In August 2017, the FASB issued Accounting Standards Update No. 2017-12, Derivatives and Hedging (Topic 815): Targeted Improvements to Accounting for Hedging Activities, which amends the recognition and presentation requirements for hedge accounting activities. The standard will improve the financial reporting of hedging relationships to better portray the economic results of an entity’s risk management activities in its financial statements and reduce the complexity of applying hedge accounting. This new guidance is effective for the Company’s fiscal year beginning January 1, 2019, including interim periods within that fiscal year, and the new guidance is to be applied retrospectively. The Company intends to early adopt this standard effective January 1, 2018; the adoption of which is not expected to have a material impact on its consolidated financial statements.
In January 2017, the FASB issued Accounting Standards Update No. 2017-04, Intangibles - Goodwill and Other (Topic 350): Simplifying the Test for Goodwill Impairment, which simplifies the subsequent measurement of goodwill by removing the second step of the two-step impairment test. The standard requires an entity to perform its goodwill impairment test by comparing the fair value of a reporting unit with its carrying amount. An impairment charge should be recognized for the amount by which the carrying amount exceeds the reporting unit’s fair value. The standard is effective for the Company’s fiscal year beginning January 1, 2020, but early adoption is permitted for interim or annual goodwill impairment tests performed after January 1, 2017. The Company adopted this standard, effective January 1, 2017, and applied the guidance in its goodwill impairment testing for the Fyfe reporting unit, as described above.
In November 2016, the FASB issued Accounting Standards Update No. 2016-18, Statement of Cash Flows (Topic 230): Restricted Cash, which requires that a statement of cash flows explain the change during the period in the total of cash, cash equivalents, and restricted cash. As a result, restricted cash will be included with cash and cash equivalents when reconciling the beginning-of-period and end-of-period total amounts shown on the statement of cash flows. This new guidance is effective for the Company’s fiscal year beginning January 1, 2018, including interim periods within that fiscal year, and will be applied retrospectively. The Company’s adoption of this standard is not expected to have a material impact on its consolidated financial statements, other than the classification of restricted cash on the consolidated statement of cash flows.
In August 2016, the FASB issued Accounting Standards Update No. 2016-15, Statement of Cash Flows (Topic 230): Classification of Certain Cash Receipts and Cash Payments, which addresses diversity in how certain cash receipts and cash payments are presented and classified in the statement of cash flows. The standard is effective for the Company’s fiscal year
83
beginning January 1, 2018, including interim periods within that fiscal year. The Company’s adoption of this standard is not expected to have a material impact on its consolidated financial statements.
In March 2016, the FASB issued Accounting Standards Update No. 2016-09, Compensation - Stock Compensation (Topic 718): Improvements to Employee Share-Based Payment Accounting, which simplifies several aspects of the accounting for share-based payment awards to employees, including the accounting for income taxes, classification of awards as either equity or liabilities and classification in the statement of cash flows. The standard was effective for the Company’s fiscal year beginning January 1, 2017, including interim periods within the year. The Company’s adoption of this standard, effective January 1, 2017, did not have a material impact on its consolidated financial statements.
In February 2016, the FASB issued Accounting Standards Update No. 2016-02, Leases (Topic 842), that requires lessees to present right-of-use assets and lease liabilities on the balance sheet for all leases with lease terms longer than twelve months. The standard is effective for the Company’s fiscal year beginning January 1, 2019, including interim periods within that fiscal year. Early adoption is permitted, although the Company does not intend to do so. The Company intends to adopt the new guidance using the cumulative effect method, which would apply to all new lease contracts initiated on or after January 1, 2019. For existing lease contracts that have remaining obligations as of January 1, 2019, the difference between the recognition criteria in the new guidance and the Company’s current practices would be recognized using a cumulative effect adjustment to the opening balance of retained earnings.
In 2017, the Company identified a project manager as well as a cross-functional implementation team responsible for identifying and assessing the impact on its lease contracts. During 2017, the implementation team began the assessment phase, which included data retrieval from the Company’s key third-party lease administration vendors and the identification of the Company’s known lease contracts throughout the world. During the first half of 2018, the Company will: (i) perform an analysis of the new standard on its current lease contracts as well as other existing arrangements to determine if they qualify for lease accounting under the new standard; and (ii) identify potential changes to business processes, systems and controls to support recognition and disclosure under the new standard.
In November 2015, the FASB issued Accounting Standards Update No. 2015-17, Income Taxes (Topic 740): Balance Sheet Classification of Deferred Taxes, which requires all deferred tax assets and liabilities, along with any related valuation allowance, to be presented as non-current within the Consolidated Balance Sheet. It was effective for the Company’s fiscal year beginning January 1, 2017, including interim periods within the year. The Company’s adoption of this standard, effective January 1, 2017, did not have a material impact on its consolidated financial statements. Prior period balances were not retrospectively adjusted.
In May 2014, the FASB issued Accounting Standards Update No. 2014-09, Revenue from Contracts with Customers (Topic 606), which replaces revenue recognition requirements regarding contracts with customers to transfer goods or services with a single revenue recognition model for recognizing revenue. Under the new guidance, entities are required to recognize revenue to depict the transfer of promised goods or services to customers in an amount that reflects the consideration to which the entity expects to be entitled in exchange for those goods or services. The guidance provides a five-step analysis to be performed on transactions to determine when and how revenue is recognized. This new guidance is effective for the Company’s fiscal year beginning January 1, 2018. Early adoption is permitted; however, the Company will adopt the new guidance as of the effective date. Entities are allowed to transition to the new standard either on a full retrospective basis or under the cumulative effect method. The Company will adopt the new guidance using the cumulative effect method and will expand consolidated financial disclosures to comply with the new guidance. Under this method, the new guidance would apply to all new contracts initiated on or after January 1, 2018. The Company determined the adoption of Topic 606 will not have a material impact on the Company's consolidated results of operations, cash flows or financial position.
In early 2016, the Company identified a project manager as well as a cross-functional implementation team responsible for assessing the impact on its contracts. During 2017, the implementation team finalized: (i) the assessment phase, which included the identification of the Company’s key revenue streams (fixed fee, time and materials, product sales and royalty fees from license arrangements) and the comparison of historical accounting policies and practices to the requirements of the new revenue standard; (ii) the contract review phase, which included identifying the population of contracts and a comprehensive analysis of the new standard on individual contract terms; and (iii) the process of identifying potential changes to business processes, systems and controls to support recognition and disclosure under the new standard. The findings and progress of each phase, as discussed herein, were reported to the Company’s management and audit committee on a frequent basis since early 2016.
Based on the conclusions of the assessment and contract review phases, the Company determined that the majority of its revenues, which are earned from construction, engineering and installation services and currently recognized using the cost-to-cost method for measuring progress under the percentage-of-completion method of accounting, are expected to follow a revenue recognition pattern under the new guidance consistent with the Company’s current practice. Revenue for the majority of the Company’s contracts will continue to be recognized over time primarily as: (i) services performed or products installed
84
by the Company are for the enhancement of assets owned and controlled by the customer; (ii) customized products and services performed do not have an alternative use to the Company; and (iii) there is continuous transfer of control to the customer. The Company also determined that revenues related to time and materials projects and product sales are expected to follow a revenue recognition pattern under the new guidance consistent with the Company’s current practice. The Company identified required changes under the new guidance for the recognition of royalty fees and the capitalization of contract fees. Based on the review of contracts across all of the Company’s business units, changes related to these items are expected to have an inconsequential impact on the timing or amount of revenue recognized as compared to current practices. The Company evaluated all new contracts through the date of adoption as part of its review.
The Company implemented changes to its financial reporting processes, systems and controls to comply with the disclosure requirements of the new guidance including: (i) changes to balances in contract assets and contract liabilities; and (ii) disaggregation of revenues. The Company expects to change the presentation of certain financial statement accounts to align with the new standard. The most notable change will be presenting costs and estimated earnings in excess of billings as contract assets and billings in excess of costs and estimated earnings as contract liabilities. The Company will report contract balances as a net contract asset or liability position on a contract-by-contract basis at the end of each reporting period.
3. RESTRUCTURING
2017 Restructuring
On July 28, 2017, the Company’s board of directors approved the 2017 Restructuring to: (i) divest the Company’s pipe coating and insulation businesses in Louisiana, The Bayou Companies, LLC and Bayou Wasco Insulation, LLC (collectively “Bayou”); (ii) exit all non-pipe related contract applications for the Tyfo® system in North America; (iii) right-size the cathodic protection services operation in Canada; and (iv) reduce corporate and other operating costs. These decisions reflected the Company’s: (a) desire to reduce further its exposure in the North American upstream oil and gas markets; (b) assessment of its ability to drive sustainable, profitable growth in the non-pipe FRP contracting market in North America; and (c) assessment of continuing weak conditions in the Canadian oil and gas markets. During the third quarter of 2017, the Company also completed a detailed assessment of Infrastructure Solutions’ CIPP businesses in Australia and Denmark, which resulted in additional restructuring actions in both countries.
During 2017, total pre-tax 2017 Restructuring charges recorded were $23.7 million ($20.6 million post-tax), which consisted of cash charges of $13.6 million and non-cash charges of $10.1 million, related to employee severance, retention, extension of benefits, employment assistance programs, early lease termination and other restructuring costs associated with the restructuring efforts described above. The Company expects to incur additional charges of $5 million to $7 million, most of which are expected to be cash charges incurred in 2018. These charges are mainly in Infrastructure Solutions and, to a lesser extent, Corrosion Protection. The Company reduced headcount by approximately 300 employees as a result of these actions.
During 2017, the Company recorded pre-tax expenses related to the 2017 Restructuring as follows (in thousands):
Infrastructure Solutions | Corrosion Protection | Total | |||||||||
Severance and benefit related costs | $ | 4,587 | $ | 2,758 | $ | 7,345 | |||||
Lease and contract termination costs | 4,545 | 775 | 5,320 | ||||||||
Relocation and other moving costs | 26 | 121 | 147 | ||||||||
Other restructuring costs (1) | 8,668 | 2,263 | 10,931 | ||||||||
Total pre-tax restructuring charges (2) | $ | 17,826 | $ | 5,917 | $ | 23,743 | |||||
__________________________
(1) | Includes charges primarily related to exiting non-pipe-related applications for the Tyfo® system in North America and right-sizing the cathodic protection services operation in Canada, inclusive of wind-down costs, professional fees, patent write offs, fixed asset disposals and certain other restructuring and related charges. |
(2) | Includes $1.3 million of corporate-related restructuring charges that have been allocated to the Infrastructure Solutions and Corrosion Protection reportable segments. |
2017 Restructuring costs related to severance, other termination benefit costs and early lease and contract termination costs were $12.8 million in 2017 and are reported on a separate line in the Consolidated Statements of Operations.
85
The following table summarizes all charges related to the 2017 Restructuring recognized in 2017 as presented in their affected line in the Consolidated Statements of Operations (in thousands):
Infrastructure Solutions | Corrosion Protection | Total (1) | |||||||||
Cost of revenues | $ | 30 | $ | 15 | $ | 45 | |||||
Operating expenses | 8,636 | 2,248 | 10,884 | ||||||||
Restructuring and related charges | 9,160 | 3,654 | 12,814 | ||||||||
Total pre-tax restructuring charges | $ | 17,826 | $ | 5,917 | $ | 23,743 | |||||
__________________________
(1) | Total pre-tax restructuring charges include cash charges of $13.6 million and non-cash charges of $10.1 million. Cash charges consist of charges incurred during the year that will be settled in cash, either during the current period or future periods. |
The following table summarizes the 2017 Restructuring activity during 2017 (in thousands):
2017 Charge to Income | Utilized in 2017 | Reserves at December 31, 2017 | |||||||||||||
Cash(1) | Non-Cash | ||||||||||||||
Severance and benefit related costs | $ | 7,345 | $ | 3,481 | $ | — | $ | 3,864 | |||||||
Lease and contract termination costs | 5,320 | 2,706 | 1,964 | 650 | |||||||||||
Relocation and other moving costs | 147 | 147 | — | — | |||||||||||
Other restructuring costs | 10,931 | 2,140 | 8,116 | 675 | |||||||||||
Total pre-tax restructuring charges | $ | 23,743 | $ | 8,474 | $ | 10,080 | $ | 5,189 | |||||||
__________________________
(1) | Refers to cash utilized to settle charges during 2017. |
2016 Restructuring
On January 4, 2016, the Company’s board of directors approved the 2016 Restructuring to reduce its exposure to the upstream oil markets and to reduce consolidated expenses. During 2016, the Company completed its restructuring, which included repositioning Energy Services’ upstream operations in California, reducing Corrosion Protection’s upstream exposure by divesting its interest in a Canadian pipe coating joint venture, right-sizing Corrosion Protection to compete more effectively and reducing corporate and other operating costs. The 2016 Restructuring reduced consolidated annual expenses by approximately $17.4 million, of which approximately $1.2 million, $6.6 million and $5.6 million related to recognized savings within Infrastructure Solutions, Corrosion Protection and Energy Services, respectively, and $4.0 million related to reduced corporate costs. Cost savings were achieved primarily through office closures and reducing headcount by 964 employees, or 15.5% of the Company’s total workforce as of December 31, 2015.
The Company recorded total pre-tax charges, most of which were cash charges, of $16.1 million ($10.3 million post-tax) in connection with the 2016 Restructuring. These charges included employee severance, retention, extension of benefits, early lease termination and other restructuring costs associated with the restructuring efforts described above.
During 2016, the Company recorded pre-tax expense related to the 2016 Restructuring as follows (in thousands):
Year Ended December 31, 2016 | |||||||||||||||
Infrastructure Solutions | Corrosion Protection | Energy Services | Total | ||||||||||||
Severance and benefit related costs | $ | 2,249 | $ | 3,588 | $ | 1,559 | $ | 7,396 | |||||||
Lease termination costs | — | 154 | 983 | 1,137 | |||||||||||
Relocation and other moving costs | 307 | 62 | 193 | 562 | |||||||||||
Other restructuring costs (1) | 808 | 761 | 5,436 | 7,005 | |||||||||||
Total pre-tax restructuring charges (2) | $ | 3,364 | $ | 4,565 | $ | 8,171 | $ | 16,100 | |||||||
__________________________
(1) | For Energy Services, includes charges primarily related to downsizing the Company’s upstream operations in California, inclusive of wind-down costs, professional fees, fixed asset disposals and certain other restructuring charges. |
(2) | Includes $1.4 million of corporate-related restructuring charges that have been allocated to the Infrastructure Solutions, Corrosion Protection and Energy Services reportable segments. |
86
2016 Restructuring costs related to severance, other termination benefit costs and early lease termination costs were $9.1 million in 2016 and reported on a separate line in the Consolidated Statements of Operations.
The following tables summarize all charges related to the 2016 Restructuring recognized in 2016 as presented in their affected line in the Consolidated Statements of Operations (in thousands):
Year Ended December 31, 2016 | |||||||||||||||
Infrastructure Solutions | Corrosion Protection | Energy Services | Total (1) | ||||||||||||
Cost of revenues | $ | — | $ | 278 | $ | — | $ | 278 | |||||||
Operating expenses | 559 | 483 | 5,436 | 6,478 | |||||||||||
Restructuring and related charges | 2,557 | 3,803 | 2,735 | 9,095 | |||||||||||
Other expense | 249 | — | — | 249 | |||||||||||
Total pre-tax charges | $ | 3,365 | $ | 4,564 | $ | 8,171 | $ | 16,100 | |||||||
__________________________
(1) | Total pre-tax restructuring charges include cash charges of $15.3 million and non-cash charges of $0.8 million for in 2016. Cash charges consist of charges incurred during the period that will be settled in cash, either during the current period or future periods. |
The following tables summarize the 2016 Restructuring activity during 2017 and 2016 (in thousands):
Reserves at December 31, 2016 | 2017 Charge to Income | Utilized in 2017 | Reserves at December 31, 2017 | ||||||||||||||||
Cash (1) | Non-Cash | ||||||||||||||||||
Severance and benefit related costs | $ | 645 | $ | — | $ | 645 | $ | — | $ | — | |||||||||
Lease termination costs | 125 | — | 125 | — | — | ||||||||||||||
Relocation and other moving costs | 10 | — | 10 | — | — | ||||||||||||||
Other restructuring costs | 120 | — | 120 | — | — | ||||||||||||||
Total pre-tax restructuring charges | $ | 900 | $ | — | $ | 900 | $ | — | $ | — | |||||||||
__________________________
(1) | Refers to cash utilized to settle charges during 2017. |
2016 Charge to Income | Utilized in 2016 | Reserves at December 31, 2016 | |||||||||||||
Cash (1) | Non-Cash | ||||||||||||||
Severance and benefit related costs | $ | 7,396 | $ | 6,751 | $ | — | $ | 645 | |||||||
Lease termination costs | 1,137 | 1,012 | — | 125 | |||||||||||
Relocation and other moving costs | 562 | 552 | — | 10 | |||||||||||
Other restructuring costs | 7,005 | 6,120 | 765 | 120 | |||||||||||
Total pre-tax restructuring charges | $ | 16,100 | $ | 14,435 | $ | 765 | $ | 900 | |||||||
__________________________
(1) | Refers to cash utilized to settle charges during 2016. |
2014 Restructuring
On October 6, 2014, the Company’s board of directors approved the 2014 Restructuring to improve gross margins and profitability over the long term by exiting certain unprofitable international locations for the Company’s CIPP business and eliminating certain idle facilities in the Company’s pipe coating and insulation operation in Louisiana.
The Company completed all of the aforementioned objectives related to the 2014 Restructuring and reduced consolidated annual operating costs by approximately $10.8 million, consisting of approximately $8.4 million and $2.4 million of recognized savings within Infrastructure Solutions and Corrosion Protection, respectively.
Total pre-tax 2014 Restructuring charges since inception were $60.6 million ($45.0 million post-tax) and consisted of non-cash charges totaling $48.3 million and cash charges totaling $12.3 million. The non-cash charges of $48.3 million included: (i) $22.2 million related to the impairment of certain long-lived assets and definite-lived intangible assets for Bayou’s pipe coating operation in Louisiana; and (ii) $26.1 million related to impairment of definite-lived intangible assets, allowances for accounts receivable, write-off of certain other current assets and long-lived assets, inventory obsolescence, as well as losses related to the sales of the Company’s CIPP contracting operations in France and Switzerland, which were reported in Infrastructure Solutions. Cash charges totaling $12.3 million included employee severance, retention, extension of benefits,
87
employment assistance programs and other costs associated with the restructuring of Insituform’s European and Asia-Pacific operations and Fyfe’s worldwide business.
The Company recorded pre-tax expenses (reversals) of $0.2 million, $(0.2) million and $11.0 million in 2017, 2016 and 2015, respectively, related to the 2014 Restructuring.
4. SUPPLEMENTAL BALANCE SHEET INFORMATION
Allowance for Doubtful Accounts
Activity in the allowance for doubtful accounts is summarized as follows (in thousands):
Years Ended December 31, | |||||||||||
2017 | 2016 | 2015 | |||||||||
Balance, January 1, 2017 | $ | 6,098 | $ | 14,524 | $ | 19,307 | |||||
Bad debt expense (1)(2) | 3,155 | 1,083 | 6,369 | ||||||||
Write-offs and adjustments (1)(2) | (3,478 | ) | (9,509 | ) | (11,152 | ) | |||||
Balance, December 31, 2017 (3) | $ | 5,775 | $ | 6,098 | $ | 14,524 | |||||
__________________________
(1) | The Company recorded bad debt expense (reversals) of $0.4 million, $(0.6) million and $1.2 million in 2017, 2016 and 2015, respectively, as part of the restructuring efforts (see Note 3) and was primarily due to the exiting of certain low-return businesses mainly in foreign locations. |
(2) | The Company recorded bad debt expense of $2.9 million in 2015 related to long-dated receivables within Corrosion Protection. |
(3) | December 31, 2015 balance includes $7.5 million related to long-dated receivables, some of which were in litigation or dispute, within Infrastructure Solutions. |
Costs and Estimated Earnings on Uncompleted Contracts
Costs and estimated earnings on uncompleted contracts consisted of the following (in thousands):
December 31, | |||||||
2017 | 2016 | ||||||
Costs incurred on uncompleted contracts | $ | 751,399 | $ | 741,590 | |||
Estimated earnings to date | 138,998 | 165,862 | |||||
Subtotal | 890,397 | 907,452 | |||||
Less – billings to date | (866,623 | ) | (907,749 | ) | |||
Total | $ | 23,774 | $ | (297 | ) | ||
Included in the accompanying balance sheets: | |||||||
Costs and estimated earnings in excess of billings | $ | 75,371 | $ | 62,401 | |||
Billings in excess of costs and estimated earnings | (51,597 | ) | (62,698 | ) | |||
Total | $ | 23,774 | $ | (297 | ) | ||
Costs and estimated earnings in excess of billings represent work performed that has not been billed either due to contract stipulations or the required contractual documentation has not been finalized. Substantially all unbilled amounts are expected to be billed and collected within one year.
Inventories
Inventories are summarized as follows (in thousands):
December 31, | |||||||
2017 | 2016 | ||||||
Raw materials and supplies | $ | 30,265 | $ | 31,399 | |||
Work-in-process | 3,246 | 2,207 | |||||
Finished products | 13,596 | 14,015 | |||||
Construction materials | 16,862 | 16,332 | |||||
Total | $ | 63,969 | $ | 63,953 | |||
88
Property, Plant and Equipment
Property, plant and equipment consisted of the following (in thousands):
Estimated Useful Lives (Years) | December 31, | ||||||||||
2017 | 2016 | ||||||||||
Land and land improvements | $ | 10,258 | $ | 10,414 | |||||||
Buildings and improvements | 5 | — | 40 | 47,725 | 65,505 | ||||||
Machinery and equipment | 4 | — | 10 | 159,626 | 189,849 | ||||||
Furniture and fixtures | 3 | — | 10 | 35,149 | 32,386 | ||||||
Autos and trucks | 3 | — | 10 | 54,039 | 50,128 | ||||||
Construction in progress | 8,424 | 9,944 | |||||||||
Subtotal | 315,221 | 358,226 | |||||||||
Less – Accumulated depreciation | (206,181 | ) | (201,479 | ) | |||||||
Total | $ | 109,040 | $ | 156,747 | |||||||
Depreciation expense was $29.3 million, $30.4 million and $30.6 million for the years ended December 31, 2017, 2016 and 2015, respectively. The decrease in 2017 was primarily due to the held for sale classification of Bayou’s assets during the third quarter of 2017.
Accrued Expenses
Accrued expenses consisted of the following (in thousands):
December 31, | |||||||
2017 | 2016 | ||||||
Vendor and other accrued expenses | $ | 35,193 | $ | 33,108 | |||
Estimated casualty and healthcare liabilities | 14,772 | 14,610 | |||||
Job costs | 9,585 | 8,707 | |||||
Accrued compensation | 27,901 | 23,398 | |||||
Income taxes payable | 4,560 | 1,870 | |||||
Deferred income taxes (1) | — | 3,317 | |||||
Total | $ | 92,011 | $ | 85,010 | |||
__________________________
(1) | As of January 1, 2017, the Company adopted FASB Accounting Standards Update No. 2015-17, Balance Sheet Classification of Deferred Taxes, which requires all deferred tax assets and liabilities, along with any related valuation allowance, to be presented as non-current. Prior period balances were not retrospectively adjusted. |
89
5. ASSETS AND LIABILITIES HELD FOR SALE
On July 28, 2017, the Company’s board of directors approved a plan to sell the assets and liabilities of Bayou (see Note 1). It is probable that such sale will occur within one year of July 28, 2017. As a result, the relevant asset and liability balances are accounted for as held for sale and measured at the lower of carrying value or fair value less cost to sell. No impairment charges were recorded as the net carrying value approximated or was less than management’s current expectation of fair value less cost to sell. In the event the Company is unable to sell the assets and liabilities of Bayou or sells them at a price or on terms that are less favorable, or at a higher cost than currently anticipated, the Company could incur impairment charges or a loss on disposal.
On September 17, 2017, the Company entered into an agreement with Wasco Coatings UK Ltd. (“Wasco UK”), the Company’s joint venture partner in Bayou Wasco Insulation, LLC (“Bayou Wasco”), whereby the Company paid $1.5 million to Wasco UK for Wasco UK’s waiver of its transfer restrictions contained in the original operating agreement for Bayou Wasco. The payment was recorded to “Acquisition and divestiture expenses” in the Consolidated Statement of Operations in 2017.
The following table provides the components of assets and liabilities held for sale (in thousands):
Assets held for sale: | December 31, 2017 | ||
Current assets | |||
Cash and cash equivalents | $ | 989 | |
Receivables | 6,368 | ||
Costs and estimated earnings in excess of billings | 1,299 | ||
Inventories | 3,727 | ||
Prepaid expenses and other current assets | 827 | ||
Total current assets | 13,210 | ||
Property, plant & equipment, less accumulated depreciation | 53,887 | ||
Identified intangible assets, less accumulated amortization | 3,217 | ||
Total assets held for sale | $ | 70,314 | |
Liabilities held for sale: | |||
Current liabilities | |||
Accounts payable | $ | 5,763 | |
Accrued expenses | 1,805 | ||
Billings in excess of costs and estimated earnings | 5,478 | ||
Total current liabilities | 13,046 | ||
Debt | 7,757 | ||
Other liabilities | 97 | ||
Total liabilities held for sale | $ | 20,900 | |
90
6. GOODWILL AND INTANGIBLE ASSETS
Goodwill
The following table presents a reconciliation of the beginning and ending balances of the Company’s goodwill (in millions):
Infrastructure Solutions | Corrosion Protection | Energy Services | Total | ||||||||||||
Balance, December 31, 2015 | |||||||||||||||
Goodwill, gross | $ | 190,525 | $ | 73,345 | $ | 80,246 | $ | 344,116 | |||||||
Accumulated impairment losses | (16,069 | ) | (45,400 | ) | (33,527 | ) | (94,996 | ) | |||||||
Goodwill, net | 174,456 | 27,945 | 46,719 | 249,120 | |||||||||||
2016 Activity: | |||||||||||||||
Acquisitions (1) | 50,585 | — | — | 50,585 | |||||||||||
Foreign currency translation | (1,616 | ) | 530 | — | (1,086 | ) | |||||||||
Balance, December 31, 2016 | |||||||||||||||
Goodwill, gross | 239,494 | 73,875 | 80,246 | 393,615 | |||||||||||
Accumulated impairment losses | (16,069 | ) | (45,400 | ) | (33,527 | ) | (94,996 | ) | |||||||
Goodwill, net | 223,425 | 28,475 | 46,719 | 298,619 | |||||||||||
2017 Activity: | |||||||||||||||
Acquisitions (2) | 3,355 | — | — | 3,355 | |||||||||||
Impairments (3) | (45,390 | ) | — | — | (45,390 | ) | |||||||||
Foreign currency translation | 3,637 | 494 | — | 4,131 | |||||||||||
Balance, December 31, 2017 | |||||||||||||||
Goodwill, gross | 246,486 | 74,369 | 80,246 | 401,101 | |||||||||||
Accumulated impairment losses | (61,459 | ) | (45,400 | ) | (33,527 | ) | (140,386 | ) | |||||||
Goodwill, net | $ | 185,027 | $ | 28,969 | $ | 46,719 | $ | 260,715 | |||||||
__________________________
(1) | During 2016 , the Company recorded goodwill of $44.0 million, $2.4 million, $0.8 million and $3.4 million related to the acquisitions of Underground Solutions, Fyfe Europe, LMJ and Concrete Solutions, respectively (see Note 1) |
(2) | During 2017, the Company recorded goodwill of $3.4 million related to the acquisition of Environmental Techniques (see Note 1). |
(3) | During 2017, the Company recorded a $45.4 million goodwill impairment to its Fyfe reporting unit, which is included in the Infrastructure Solutions reportable segment (see Note 2). |
Intangible Assets
Intangible assets were as follows (in thousands):
December 31, 2017 | December 31, 2016 | ||||||||||||||||||||||||
Weighted Average Useful Lives (Years) | Gross Carrying Amount | Accumulated Amortization | Net Carrying Amount | Gross Carrying Amount | Accumulated Amortization | Net Carrying Amount | |||||||||||||||||||
License agreements | 10.5 | $ | 4,497 | $ | (3,623 | ) | $ | 874 | $ | 4,418 | $ | (3,438 | ) | $ | 980 | ||||||||||
Leases | 3.0 | 796 | (534 | ) | 262 | 2,065 | (912 | ) | 1,153 | ||||||||||||||||
Trademarks (1)(2) | 10.5 | 15,464 | (6,184 | ) | 9,280 | 24,185 | (7,868 | ) | 16,317 | ||||||||||||||||
Non-competes | 1.7 | 1,197 | (1,048 | ) | 149 | 1,308 | (1,054 | ) | 254 | ||||||||||||||||
Customer relationships (1)(2) | 9.9 | 160,423 | (56,907 | ) | 103,516 | 187,554 | (53,830 | ) | 133,724 | ||||||||||||||||
Patents and acquired technology (2)(3) | 6.1 | 39,285 | (21,021 | ) | 18,264 | 66,222 | (23,739 | ) | 42,483 | ||||||||||||||||
$ | 221,662 | $ | (89,317 | ) | $ | 132,345 | $ | 285,752 | $ | (90,841 | ) | $ | 194,911 | ||||||||||||
__________________________
(1) | During 2017, the Company recorded trademarks of $0.1 million and customer relationships of $1.7 million related to the acquisition of Environmental Techniques (see Note 1). |
91
(2) | During 2017, the Company recorded intangible asset impairments related to restructuring and realignment efforts at Fyfe North America of $3.4 million for trademarks, $20.8 million for customer relationships and $16.8 million for patents and acquired technology (see Note 2). |
(3) | During 2017, the Company wrote off $5.3 million related to certain patents abandoned as part of the 2017 Restructuring (see Note 3). |
Amortization expense was $16.1 million, $16.4 million and $13.2 million for the years ended December 31, 2017, 2016 and 2015, respectively. Estimated amortization expense by year is as follows (in thousands):
Year | Amount | |||
2018 | $ | 13,733 | ||
2019 | 13,569 | |||
2020 | 13,496 | |||
2021 | 13,328 | |||
2022 | 13,328 | |||
7. LONG-TERM DEBT AND CREDIT FACILITY
Long-term debt, term note and notes payable consisted of the following (in thousands):
December 31, | |||||||
2017 | 2016 | ||||||
Term note, due October 30, 2020, annualized rates of 3.60% and 3.08%, respectively | $ | 308,437 | $ | 328,125 | |||
Line of credit, 3.50% and 2.96%, respectively | 38,000 | 36,000 | |||||
Other notes with interest rates from 3.3% to 7.8% | 875 | 9,901 | |||||
Subtotal | 347,312 | 374,026 | |||||
Less – Current maturities and notes payable | 26,555 | 19,835 | |||||
Less – Unamortized loan costs | 2,517 | 3,406 | |||||
Total | $ | 318,240 | $ | 350,785 | |||
At December 31, 2017, principal payments required to be made for each of the next five years are summarized as follows (in thousands):
Year | Amount (1) | |||
2018 | $ | 26,555 | ||
2019 | 28,437 | |||
2020 | 292,320 | |||
2021 | — | |||
2022 | — | |||
Thereafter | — | |||
Total | $ | 347,312 | ||
___________________
(1) | See Note 15 to the consolidated financial statements contained in this Report regarding the amended Credit Facility. |
Financing Arrangements
In October 2015, the Company entered into an amended and restated $650.0 million senior secured credit facility (the “Credit Facility”) with a syndicate of banks. Bank of America, N.A. served as the sole administrative agent and JP Morgan Chase Bank, N.A. and U.S. Bank National Association acted as co-syndication agents. Merrill Lynch Pierce Fenner & Smith Incorporated, JPMorgan Securities LLC and U.S. Bank National Association acted as joint lead arrangers and joint book managers in the syndication of the Credit Facility.
At December 31, 2017, the Credit Facility consisted of a $300.0 million five-year revolving line of credit and a $350.0 million five-year term loan facility. The Company drew the entire term loan from the Credit Facility to (i) retire $344.7 million in indebtedness outstanding under the Company’s prior credit facility; (ii) fund expenses associated with the Credit Facility; and (iii) fund general corporate purposes.
92
In 2015, the Company paid expenses of $4.4 million associated with the Credit Facility, $1.8 million related to up-front lending fees and $2.6 million related to third-party arranging fees, the latter of which was recorded in interest expense on the consolidated statement of operations. In addition, the Company had $3.5 million in unamortized loan costs associated with the prior credit facility, of which $0.8 million was recorded in interest expense on the consolidated statement of operations.
Generally, interest is charged on the principal amounts outstanding under the Credit Facility at the British Bankers Association LIBOR rate plus an applicable rate ranging from 1.25% to 2.25% depending on the Company’s consolidated leverage ratio. The Company can also opt for an interest rate equal to a base rate (as defined in the credit documents) plus an applicable rate, which is also based on the Company’s consolidated leverage ratio. The applicable LIBOR borrowing rate (LIBOR plus Company’s applicable rate) as of December 31, 2017 was approximately 3.59%.
The Company’s indebtedness at December 31, 2017 consisted of $308.4 million outstanding from the $350.0 million term loan under the Credit Facility, $38.0 million on the line of credit under the Credit Facility and $0.9 million of third-party notes and bank debt. Additionally, the Company had $7.7 million of debt held by its joint venture partner (representing funds loaned by its joint venture partner) listed as held for sale at December 31, 2017 related to the planned sale of Bayou. During 2017, the Company had net borrowings of $2.0 million on the line of credit for domestic working capital needs.
As of December 31, 2017, the Company had $30.5 million in letters of credit issued and outstanding under the Credit Facility. Of such amount, $13.4 million was collateral for the benefit of certain of our insurance carriers and $17.1 million was for letters of credit or bank guarantees of performance or payment obligations of foreign subsidiaries.
The Company’s indebtedness at December 31, 2016 consisted of $328.1 million outstanding from the term loan under the Credit Facility and $36.0 million on the line of credit under the Credit Facility. During 2016, the Company: (i) borrowed $30.0 million on the line of credit to help fund the acquisition of Underground Solutions; (ii) borrowed $3.0 million on the line of credit to help fund a small acquisition; and (iii) had net borrowings of $3.0 million on the line of credit for both domestic and international working capital needs. Additionally, the Company designated $9.6 million of debt held by its joint ventures (representing funds loaned by its joint venture partners) as third-party debt in the consolidated financial statements and held $0.3 million of third-party notes and bank debt at December 31, 2016.
At December 31, 2017 and 2016, the estimated fair value of the Company’s long-term debt was approximately $356.0 million and $366.0 million, respectively. Fair value was estimated using market rates for debt of similar risk and maturity and a discounted cash flow model, which are based on Level 3 inputs as defined in Note 12.
In October 2015, the Company entered into an interest rate swap agreement for a notional amount of $262.5 million, which is set to expire in October 2020. The notional amount of this swap mirrors the amortization of a $262.5 million portion of the Company’s $350.0 million term loan drawn from the Credit Facility. The swap requires the Company to make a monthly fixed rate payment of 1.46% calculated on the amortizing $262.5 million notional amount, and provides for the Company to receive a payment based upon a variable monthly LIBOR interest rate calculated on the same amortizing $262.5 million notional amount. The receipt of the monthly LIBOR-based payment offsets the variable monthly LIBOR-based interest cost on a corresponding $262.5 million portion of the Company’s term loan from the Credit Facility. This interest rate swap is used to partially hedge the interest rate risk associated with the volatility of monthly LIBOR rate movement and is accounted for as a cash flow hedge. See Note 12.
The Credit Facility is subject to certain financial covenants, including a consolidated financial leverage ratio and consolidated fixed charge coverage ratio. Under the amended Credit Facility, as described in Note 15, these financial covenants were subsequently revised and effective as of December 31, 2017. Subject to the specifically defined terms and methods of calculation as set forth in the amended Credit Facility, the financial covenant requirements, as of each quarterly reporting period end, are defined as follows:
• | Consolidated financial leverage ratio, as amended, compares consolidated funded indebtedness to amended Credit Facility defined income with a maximum amount not to exceed 3.75 to 1.00. At December 31, 2017, the Company’s consolidated financial leverage ratio was 2.97 to 1.00 and, using the amended Credit Facility defined income, the Company had the capacity to borrow up to $95.3 million of additional debt. |
• | Consolidated fixed charge coverage ratio, as amended, compares amended Credit Facility defined income to amended Credit Facility defined fixed charges with a minimum permitted ratio of not less than 1.15 to 1.00. At December 31, 2017, the Company’s fixed charge ratio was 1.72 to 1.00. |
At December 31, 2017, the Company was in compliance with all of its debt and financial covenants as required under the amended Credit Facility.
See Note 15 for further information regarding the amended Credit Facility.
93
8. STOCKHOLDERS’ EQUITY
Share Repurchase Plan
Under the terms of its Credit Facility, the Company is authorized to purchase up to $40.0 million of shares of its common stock in open market purchases on an annual basis, subject to board of director authorization. In October 2016, the Company’s board of directors authorized the open market repurchase of up to $40.0 million of our common stock to be made during 2017. The Company repurchased shares under this program throughout 2017. In October 2017, the Company’s board of directors authorized a similar $40.0 million program for 2018. On February 27, 2018, the Company amended its Credit Facility, which limits the open market share repurchases to $30.0 million for 2018 (see Note 15). Once repurchased, the Company promptly retires such shares.
The Company is also authorized to repurchase up to $10.0 million of the Company’s common stock in each calendar year in connection with the Company’s equity compensation programs for employees. The participants in the Company’s equity plans may surrender shares of common stock in satisfaction of tax obligations arising from the vesting of restricted stock and restricted stock unit awards under such plans and in connection with the exercise of stock option awards. The deemed price paid is the closing price of the Company’s common stock on The Nasdaq Global Select Market on the date that the restricted stock or restricted stock unit vests or the shares of the Company’s common stock are surrendered in exchange for stock option exercises. With regard to stock option awards, the option holder may elect a “net, net” exercise in connection with the exercise of employee stock options such that the option holder receives a number of shares equal to the built-in gain in the option shares divided by the market price of the Company’s common stock on the date of exercise, less a number of shares equal to the taxes due upon the exercise of the option divided by the market price of the Company’s common stock on the date of exercise. The shares of Company common stock surrendered to the Company for taxes due on the exercise of the option are deemed repurchased by the Company.
During 2017, the Company acquired 1,599,093 shares of the Company’s common stock for $35.3 million ($22.10 average price per share) through the open market repurchase programs discussed above and 112,899 shares of the Company’s common stock for $2.5 million ($22.15 average price per share) in connection with the satisfaction of tax obligations in connection with the vesting of restricted stock and restricted stock units. Once repurchased, the Company immediately retired all such shares. During 2017, the Company did not acquire any of the Company’s common stock in connection with “net, net” exercises of employee stock options.
During 2016, the Company acquired 2,226,875 shares of the Company’s common stock for $41.8 million ($18.76 average price per share) through open market repurchase programs and 61,039 shares of the Company’s common stock for $1.2 million ($19.65 average price per share) in connection with the satisfaction of tax obligations in connection with the vesting of restricted stock and restricted stock units. In addition, during 2016, the Company acquired 61,980 shares of the Company’s common stock in connection with “net, net” exercises of employee stock options for a gross value of $1.5 million ($1.2 million in cash value). Once repurchased, the Company immediately retired all such shares.
During 2015, the Company acquired 1,306,199 shares of the Company’s common stock for $24.3 million ($18.58 average price per share) through open market repurchase programs and 32,902 shares of the Company’s common stock for $0.6 million ($17.05 average price per share) in connection with the satisfaction of tax obligations in connection with the vesting of restricted stock, the exercise of stock options and the distribution of deferred stock units. In addition, during 2015, the Company acquired 163,500 shares of the Company’s common stock in connection with “net, net” exercises of employee stock options for a gross value of $3.0 million ($0.9 million in cash value). Once repurchased, the Company immediately retired all such shares.
Equity-Based Compensation Plans
Employee Plans
In April 2016, the Company’s stockholders approved the 2016 Employee Equity Incentive Plan, which was amended in 2017 by the First Amendment to the 2016 Employee Equity Incentive Plan (as amended, the “2016 Employee Plan”). The 2016 Employee Plan replaced the 2013 Employee Equity Incentive Plan. The 2016 Employee Plan provides for equity-based compensation awards, including restricted shares of common stock, performance awards, stock options, stock units and stock appreciation rights. There are 2,132,739 shares of the Company’s common stock registered for issuance under the 2016 Employee Plan. The 2016 Employee Plan is administered by the Compensation Committee of the Board of Directors, which determines eligibility, timing, pricing, amount and other terms or conditions of awards. At December 31, 2017, there were no options and 448,225 unvested restricted stock units outstanding under the 2016 Employee Plan.
Prior to the 2016 Employee Plan, the Board of Directors administered the 2013 Employee Equity Incentive Plan (the “2013 Employee Plan”) and the 2009 Employee Equity Incentive Plan (the “2009 Employee Plan”). At December 31, 2017, there were no options and 980,653 unvested shares of restricted stock and restricted stock units outstanding under the 2013
94
Employee Plan, and 126,680 options and no unvested shares of restricted stock and restricted stock units outstanding under the 2009 Employee Plan.
Director Plans
In April 2016, the Company’s stockholders also approved the 2016 Director Equity Incentive Plan (the “2016 Director Plan”), which replaced the 2011 Non-Employee Director Equity Incentive Plan. The 2016 Director Plan provides for equity-based compensation awards, including non-qualified stock options and stock units. The Board of Directors administers the 2016 Director Plan and has the authority to establish, amend and rescind any rules and regulations related to the 2016 Director Plan. There are 166,456 shares of the Company’s common stock registered for issuance under the 2016 Director Plan. At December 31, 2017, there were 49,195 deferred stock units outstanding under the 2016 Director Plan.
Prior to the 2016 Director Plan, the Board of Directors administered the 2011 Non-Employee Director Equity Plan (“2011 Director Plan”), the 2006 Non-Employee Director Equity Plan (“2006 Director Plan”) and the 2001 Non-Employee Director Equity Plan (“2001 Director Plan”), all of which contained substantially the same provisions as the current plan. At December 31, 2017, there were 119,366 deferred stock units outstanding under the 2011 Director Plan, 46,841 deferred stock units outstanding under the 2006 Director Plan and 54,575 deferred stock units outstanding under the 2001 Director Equity Plan.
Activity and related expense associated with these plans are described in Note 9.
9. EQUITY-BASED COMPENSATION
Stock Awards
Stock awards, which include shares of restricted stock, restricted stock units and performance units, are awarded from time to time to executive officers and certain key employees of the Company. Stock award compensation is recorded based on the award date fair value and charged to expense ratably through the requisite service period. The forfeiture of unvested restricted stock, restricted stock units and performance units causes the reversal of all previous expense recorded as a reduction of current period expense.
A summary of stock award activity is as follows:
Years Ended December 31, | ||||||||||||||||||||
2017 | 2016 | 2015 | ||||||||||||||||||
Stock Awards | Weighted Average Award Date Fair Value | Stock Awards | Weighted Average Award Date Fair Value | Stock Awards | Weighted Average Award Date Fair Value | |||||||||||||||
Outstanding, beginning of year | 1,501,021 | $ | 20.58 | 1,275,707 | $ | 20.54 | 767,540 | $ | 21.93 | |||||||||||
Restricted stock units awarded | 257,532 | 23.06 | 335,026 | 18.43 | 422,141 | 17.37 | ||||||||||||||
Performance stock units awarded | 213,436 | 28.18 | 245,586 | 25.69 | 297,164 | 21.55 | ||||||||||||||
Restricted shares distributed | (179,169 | ) | 22.44 | (162,554 | ) | 23.49 | (90,607 | ) | 19.25 | |||||||||||
Restricted stock units distributed | (95,510 | ) | 20.71 | (23,739 | ) | 20.73 | (12,646 | ) | 19.62 | |||||||||||
Performance stock units distributed | (49,672 | ) | 21.95 | — | — | — | — | |||||||||||||
Restricted shares forfeited | (1,084 | ) | 23.01 | (22,045 | ) | 23.34 | (54,045 | ) | 23.40 | |||||||||||
Restricted stock units forfeited | (81,626 | ) | 20.36 | (71,992 | ) | 17.60 | (27,360 | ) | 18.79 | |||||||||||
Performance stock units forfeited | (136,050 | ) | 24.29 | (74,968 | ) | 22.64 | (26,480 | ) | 22.42 | |||||||||||
Outstanding, end of year | 1,428,878 | $ | 21.53 | 1,501,021 | $ | 20.58 | 1,275,707 | $ | 20.54 | |||||||||||
Expense associated with stock awards was $10.1 million, $8.3 million and $6.8 million in 2017, 2016 and 2015, respectively. Unrecognized pre-tax expense of $11.8 million related to stock awards is expected to be recognized over the weighted average remaining service period of 1.7 years for awards outstanding at December 31, 2017.
At December 31, 2017, 1,501,962 shares of common stock were available for equity-based compensation awards pursuant to the 2016 Employee Plan.
95
Deferred Stock Unit Awards
Deferred stock units generally are awarded to directors of the Company and represent the Company’s obligation to transfer one share of the Company’s common stock to the grantee at a future date and generally are fully vested on the date of grant. The expense related to the issuance of deferred stock units is recorded as of the date of the award.
The following table summarizes information about deferred stock unit activity:
Years Ended December 31, | ||||||||||||||||||||
2017 | 2016 | 2015 | ||||||||||||||||||
Deferred Stock Units | Weighted Average Award Date Fair Value | Deferred Stock Units | Weighted Average Award Date Fair Value | Deferred Stock Units | Weighted Average Award Date Fair Value | |||||||||||||||
Outstanding, beginning of year | 253,445 | $ | 19.93 | 247,219 | $ | 19.92 | 221,471 | $ | 20.10 | |||||||||||
Awarded | 47,091 | 23.53 | 45,886 | 21.22 | 53,527 | 18.56 | ||||||||||||||
Shares distributed | (30,559 | ) | 23.57 | (39,660 | ) | 21.29 | (27,779 | ) | 18.76 | |||||||||||
Outstanding, end of year | 269,977 | $ | 20.14 | 253,445 | $ | 19.93 | 247,219 | $ | 19.92 | |||||||||||
Expense associated with awards of deferred stock units was $1.1 million, $1.0 million and $1.0 million in 2017, 2016 and 2015, respectively.
At December 31, 2017, 117,261 shares of common stock were available for equity-based compensation awards pursuant to the 2016 Director Plan.
Stock Options
Stock options on the Company’s common stock are awarded from time to time to executive officers and certain key employees of the Company. Stock options granted generally have a term of seven to ten years and an exercise price equal to the market value of the underlying common stock on the date of grant.
A summary of stock option activity is as follows:
Years Ended December 31, | ||||||||||||||||||||
2017 | 2016 | 2015 | ||||||||||||||||||
Shares | Weighted Average Exercise Price | Shares | Weighted Average Exercise Price | Shares | Weighted Average Exercise Price | |||||||||||||||
Outstanding at January 1 | 170,253 | $ | 21.99 | 288,383 | $ | 21.73 | 503,134 | $ | 18.18 | |||||||||||
Exercised | (43,573 | ) | 18.87 | (114,307 | ) | 21.33 | (209,205 | ) | 13.13 | |||||||||||
Canceled/Expired | — | — | (3,823 | ) | 22.24 | (5,546 | ) | 24.21 | ||||||||||||
Outstanding at December 31 | 126,680 | $ | 23.06 | 170,253 | $ | 21.99 | 288,383 | $ | 21.73 | |||||||||||
Exercisable at December 31 | 126,680 | $ | 23.06 | 170,253 | $ | 21.99 | 284,929 | $ | 21.78 | |||||||||||
In 2017, 2016 and 2015, the Company recorded expense of zero, less than $0.1 million and $0.1 million, respectively, related to stock option grants. Unrecognized pre-tax expense related to stock option grants was zero at December 31, 2017.
Financial data for stock option exercises are summarized in the following table (in thousands):
Years Ended December 31, | |||||||||||
2017 | 2016 | 2015 | |||||||||
Amount collected from stock option exercises | $ | 822 | $ | 306 | $ | 2,748 | |||||
Total intrinsic value of stock option exercises | 370 | 47 | 1,108 | ||||||||
Tax benefit of stock option exercises recorded in income tax expense (1) | 63 | — | — | ||||||||
Tax benefit of stock option exercises recorded in additional paid-in-capital (1) | — | 315 | 209 | ||||||||
Aggregate intrinsic value of outstanding stock options | 386 | 102 | 173 | ||||||||
Aggregate intrinsic value of exercisable stock options | 386 | 102 | 169 | ||||||||
96
__________________________
(1) | As of January 1, 2017, the Company adopted FASB Accounting Standards Update No. 2016-09, Compensation - Stock Compensation (Topic 718): Improvements to Employee Share-Based Payment Accounting, which, among other items, changed the accounting for the tax benefit of stock option exercises so that it is now recorded as part of current earnings rather than additional paid-in capital. Prior period balances were not retrospectively adjusted. |
The intrinsic value calculations are based on the Company’s closing stock price of $25.43, $23.70 and $19.31 on December 31, 2017, 2016 and 2015, respectively.
10. TAXES ON INCOME
Income (loss) before taxes on income was as follows (in thousands):
Years Ended December 31, | |||||||||||
2017 | 2016 | 2015 | |||||||||
Domestic | $ | (39,660 | ) | $ | 23,205 | $ | (15,944 | ) | |||
Foreign | (21,570 | ) | 12,064 | 17,159 | |||||||
Total | $ | (61,230 | ) | $ | 35,269 | $ | 1,215 | ||||
Provisions for taxes on income (loss) consisted of the following components (in thousands):
Years Ended December 31, | |||||||||||
2017 | 2016 | 2015 | |||||||||
Current: | |||||||||||
Federal | $ | 3,764 | $ | (636 | ) | $ | 2,150 | ||||
Foreign | 7,512 | 3,585 | 5,600 | ||||||||
State | 3,351 | 175 | 528 | ||||||||
Subtotal | 14,627 | 3,124 | 8,278 | ||||||||
Deferred: | |||||||||||
Federal | (8,706 | ) | 2,158 | 218 | |||||||
Foreign | (1,099 | ) | 475 | 1,382 | |||||||
State | 183 | 352 | (673 | ) | |||||||
Subtotal | (9,622 | ) | 2,985 | 927 | |||||||
Total tax provision | $ | 5,005 | $ | 6,109 | $ | 9,205 | |||||
97
Income tax expense differed from the amounts computed by applying the U.S. federal income tax rate of 35% to income (loss) before taxes on income as a result of the following (in thousands):
Years Ended December 31, | |||||||||||
2017 | 2016 | 2015 | |||||||||
Income taxes (benefit) at U.S. federal statutory tax rate | $ | (21,431 | ) | $ | 12,344 | $ | 425 | ||||
Increase (decrease) in taxes resulting from: | |||||||||||
Change in the balance of the valuation allowance for deferred tax assets allocated to foreign income tax expense | 4,598 | 1,364 | (756 | ) | |||||||
Change in the balance of the valuation allowance for deferred tax assets allocated to domestic income tax expense | 12,755 | (4,202 | ) | 4,834 | |||||||
State income taxes, net of federal income tax benefit | 2,270 | 342 | (94 | ) | |||||||
Divestitures | — | 271 | 2,269 | ||||||||
Meals and entertainment | 785 | 736 | 761 | ||||||||
Changes in taxes previously accrued | (1,339 | ) | 23 | (489 | ) | ||||||
Foreign tax rate differences | 913 | (2,559 | ) | (1,468 | ) | ||||||
Goodwill impairment | 6,359 | — | 3,485 | ||||||||
Recognition of uncertain tax positions | (62 | ) | 85 | 24 | |||||||
Deemed mandatory repatriation | 10,406 | — | — | ||||||||
Release of deferred tax liability on foreign earnings | (7,051 | ) | — | — | |||||||
Settlement of escrow arrangement | — | — | (1,115 | ) | |||||||
Domestic Production Activities deduction | (1,921 | ) | (1,017 | ) | (528 | ) | |||||
Incremental U.S. taxes on undistributed foreign earnings | — | — | 2,102 | ||||||||
Other matters | (1,277 | ) | (1,278 | ) | (245 | ) | |||||
Total tax provision | $ | 5,005 | $ | 6,109 | $ | 9,205 | |||||
Effective tax rate | (8.2 | )% | 17.3 | % | 757.6 | % | |||||
On December 22, 2017, the U.S. government enacted the TCJA, which includes significant changes to the U.S. corporate income tax system including: (i) a federal corporate rate reduction from 35% to 21%; (ii) limitations on the deductibility of interest expense and executive compensation; (iii) creation of new minimum taxes such as the Global Intangible Low Taxed Income (“GILTI”) tax and the base erosion anti-abuse tax (“BEAT”); and (iv) the transition of U.S. international taxation from a worldwide tax system to a modified territorial tax system, which will result in a one time U.S. tax liability on those earnings that have not previously been repatriated to the U.S.
The transitional tax is a tax on previously untaxed accumulated and current earnings and profits (“E&P”) of certain of the Company’s non-U.S. subsidiaries. To determine the amount of the transition tax, the Company must determine the amount of post-1986 E&P of the relevant subsidiaries, as well as the amount of non-U.S. income taxes paid on such earnings. Further, the one-time transition tax is based on the amount of those earnings held in cash and other specified assets, either at the end of 2017 or the average of the year end balances for 2015 and 2016. Based on the Company’s initial analysis of the TCJA, it has recorded a provisional estimated net tax expense of $2.4 million, which consists of a charge of $10.4 million for the deemed mandatory repatriation, and reduced by a $7.1 million release of a deferred tax liability on unremitted foreign earnings and $0.9 million of other TCJA related impacts. The Company continues to gather additional information and will further analyze its calculation of the transition tax based on additional technical guidance from U.S. federal and state tax authorities about the application of these new rules.
98
Net deferred taxes consisted of the following (in thousands):
December 31, | |||||||
2017 | 2016 | ||||||
Deferred income tax assets: | |||||||
Foreign tax credit carryforwards | $ | 466 | $ | 3,426 | |||
Net operating loss carryforwards | 23,216 | 26,212 | |||||
Accrued expenses | 12,107 | 17,366 | |||||
Other | 4,707 | 8,701 | |||||
Total gross deferred income tax assets | 40,496 | 55,705 | |||||
Less valuation allowance | (29,782 | ) | (15,428 | ) | |||
Net deferred income tax assets | 10,714 | 40,277 | |||||
Deferred income tax liabilities: | |||||||
Property, plant and equipment | (9,482 | ) | (12,627 | ) | |||
Intangible assets | (2,201 | ) | (28,346 | ) | |||
Undistributed foreign earnings | — | (7,051 | ) | ||||
Other | (6,576 | ) | (9,237 | ) | |||
Total deferred income tax liabilities | (18,259 | ) | (57,261 | ) | |||
Net deferred income tax liabilities | $ | (7,545 | ) | $ | (16,984 | ) | |
The Company’s tax assets and liabilities, netted by taxing location, are in the following captions in the balance sheets (in thousands):
December 31, | |||||||
2017 | 2016 | ||||||
Current deferred income tax assets, net (1) | $ | — | $ | 7,824 | |||
Current deferred income tax liabilities, net (1) | — | (3,317 | ) | ||||
Noncurrent deferred income tax assets, net | 1,666 | 1,848 | |||||
Noncurrent deferred income tax liabilities, net | (9,211 | ) | (23,339 | ) | |||
Net deferred income tax liabilities | $ | (7,545 | ) | $ | (16,984 | ) | |
__________________________
(1) | As of January 1, 2017, the Company adopted FASB Accounting Standards Update No. 2015-17, Balance Sheet Classification of Deferred Taxes, which requires all deferred tax assets and liabilities, along with any related valuation allowance, to be presented as non-current. Prior period balances were not retrospectively adjusted. |
The Company’s deferred tax assets at December 31, 2017 included $23.2 million in federal, state and foreign net operating loss (“NOL”) carryforwards. These NOLs include $14.6 million, which if not used will expire between the years 2018 and 2037, and $8.6 million that have no expiration dates. The Company also has deferred tax amounts related to foreign tax credit carryforwards of $0.5 million, of which, $0.3 million will expire in 2026 if not used and $0.2 million have no expiration date.
For financial reporting purposes, a valuation allowance of $29.8 million has been recognized to reduce the deferred tax assets related to certain federal, state and foreign net operating loss carryforwards and other assets, for which it is more likely than not that the related tax benefits will not be realized, due to uncertainties as to the timing and amounts of future taxable income. The valuation allowance at December 31, 2016 was $15.4 million.
The increase during 2017 was primarily related to the assessment of positive and negative evidence to estimate if sufficient future taxable income will be generated to use the existing deferred tax assets. A significant component of the objective negative evidence evaluated was the cumulative loss incurred over the three-year period ended December 31, 2017. Such objective evidence limits the ability to consider other subjective evidence such as our projections for future growth.
On the basis of this evaluation, as of December 31, 2017, a valuation allowance has been recorded to record only the portion of the deferred tax asset that is more likely than not to be realized. The amount of the deferred tax asset considered realizable; however, could be adjusted if estimates of future taxable income during the carryforward period are reduced or increased or if objective negative evidence in the form of cumulative losses is no longer present and additional weight may be given to subjective evidence such as our projections for growth.
99
Activity in the valuation allowance is summarized as follows (in thousands):
Years Ended December 31, | |||||||||||
2017 | 2016 | 2015 | |||||||||
Balance, at beginning of year | $ | 15,428 | $ | 18,897 | $ | 19,353 | |||||
Additions | 19,260 | 3,095 | 7,783 | ||||||||
Reversals | (183 | ) | (4,984 | ) | (5,294 | ) | |||||
Remeasurement of U.S. deferred tax balances | (5,141 | ) | — | — | |||||||
Other adjustments | 418 | (1,580 | ) | (2,945 | ) | ||||||
Balance, at end of year | $ | 29,782 | $ | 15,428 | $ | 18,897 | |||||
As a result of the deemed mandatory repatriation provisions in the TCJA, during 2017 the Company included an estimated $210.6 million of undistributed earnings in income subject to U.S. tax at reduced tax rates. The TCJA resulted in certain reassessments of previous indefinite reinvestment assertions with respect to certain jurisdictions. The Company does not intend to distribute earnings in a taxable manner; and therefore, intends to limit distributions to: (i) earnings previously taxed in the U.S.; (ii) earnings that would qualify for the 100 percent dividends received deduction provided in the TCJA; or (iii) earnings that would not result in significant foreign taxes. As a result, the Company has not recognized a deferred tax liability on its investment in foreign subsidiaries as of December 31, 2017. The Company continues to refine its provisional balances under the TCJA and adjustments may be made during the one-year measurement period under SAB 118. The ultimate impact of the TCJA may differ from the current provisional amounts and the adjustments could be material.
As part of the February 2016 acquisition of Underground Solutions, the Company repatriated approximately $29.7 million from foreign subsidiaries to assist in funding the transaction, incurring approximately $3.2 million in additional taxes, an estimate for which was accrued as of December 31, 2015. This was viewed as a one-time, special-use transaction.
FASB ASC 740, Income Taxes (“FASB ASC 740”), prescribes a more-likely-than-not threshold for the financial statement recognition and measurement of a tax position taken or expected to be taken in a tax return. FASC ASC 740 also provides guidance on de-recognition, classification, interest and penalties, accounting in interim periods and disclosure of uncertain tax positions in financial statements.
A reconciliation of the beginning and ending balance of unrecognized tax benefits is as follows (in thousands):
Years Ended December 31, | |||||||||||
2017 | 2016 | 2015 | |||||||||
Balance, at beginning of year | $ | 2,465 | $ | 2,410 | $ | 2,672 | |||||
Additions for tax positions of prior years related to acquisitions | — | 148 | — | ||||||||
Additions for tax positions of prior years | 12 | 10 | 10 | ||||||||
Lapse in statute of limitations | (274 | ) | (83 | ) | (218 | ) | |||||
Foreign currency translation | 26 | (20 | ) | (54 | ) | ||||||
Balance, at end of year, total tax provision | $ | 2,229 | $ | 2,465 | $ | 2,410 | |||||
The total amount of unrecognized tax benefits, if recognized, that would affect the effective tax rate was $0.5 million at December 31, 2017.
The Company recognizes interest and penalties, if any, related to unrecognized tax benefits in income tax expense. During the years ended December 31, 2017, 2016 and 2015, approximately $0.3 million was expensed for interest and penalties in each period.
The Company believes that it is reasonably possible that the total amount of unrecognized tax benefits will change in 2018. The Company has certain tax return years subject to statutes of limitation that will expire within twelve months. Unless challenged by tax authorities, the expiration of those statutes of limitation is expected to result in the recognition of uncertain tax positions in the amount of approximately $0.4 million.
The Company is subject to taxation in the United States, various states and foreign jurisdictions. With few exceptions, the Company is no longer subject to U.S. federal, state, local or foreign examinations by tax authorities for years before 2013.
100
11. COMMITMENTS AND CONTINGENCIES
Leases
The Company leases a number of its administrative and operations facilities under non-cancellable operating leases expiring at various dates through 2025. In addition, the Company leases certain construction, automotive and computer equipment on a multi-year, monthly or daily basis. Rental expense in the years ended December 31, 2017, 2016 and 2015 was $26.7 million, $23.8 million and $24.9 million, respectively.
At December 31, 2017, the future minimum lease payments required under the non-cancellable operating leases were as follows (in thousands):
Year | Minimum Lease Payments | |||
2018 | $ | 21,084 | ||
2019 | 16,336 | |||
2020 | 11,652 | |||
2021 | 8,148 | |||
2022 | 5,245 | |||
Thereafter | 7,818 | |||
Total | $ | 70,283 | ||
Litigation
In December 2016, the Company settled two lawsuits related to the December 2012 departure of several key leaders in sales and operations for the Tyfo® technology, which is part of the Infrastructure Solutions platform. Under the settlement, Aegion will receive $6.6 million over the next four years; and accordingly, recorded the gain to “Gain on litigation settlement” in the Consolidated Statement of Operations. The initial $3.6 million cash payment was received in December 2016 and the first cash installment of $750,000 was received in December 2017. The remainder is to be paid in $750,000 annual installments over the next three years. At December 31, 2017, $750,000 was recorded to “Prepaid expenses and other current assets” and $1.5 million was recorded to “Other assets” in the Consolidated Balance Sheet.
The Company is involved in certain litigation incidental to the conduct of its business and affairs. Management, after consultation with legal counsel, does not believe that the outcome of any such litigation, individually or in the aggregate, will have a material adverse effect on the Company’s consolidated financial condition, results of operations or cash flows.
Contingencies
In connection with the Brinderson acquisition, certain pre-acquisition matters were identified in 2014 whereby a loss is both probable and reasonably estimable. The Company establishes liabilities in accordance with FASB ASC Subtopic No. 450-20, Contingencies - Loss Contingencies, and accordingly, recorded an accrual related to various legal, tax, employee benefits and employment matters. At December 31, 2016, the accrual relating to these matters was $6.0 million. During 2017, the Company made a $0.3 million payment related to one of the above matters. Additionally, the Company reassessed its reserve during the year for: (i) the lapse of certain payroll tax statutory limitation periods; and (ii) further developments in the legal status of these matters, including the preliminary settlement through mediated resolution of several matters. Following consultation with internal and third-party legal and tax counsel, the Company lowered its accrual for such matters by $1.5 million during 2017. The accrual adjustments resulted in an offset to “Operating expense” in the Consolidated Statement of Operations. As of December 31, 2017, the remaining accrual relating to these matters was $4.2 million.
Purchase Commitments
The Company had no material purchase commitments at December 31, 2017.
Guarantees
The Company has many contracts that require the Company to indemnify the other party against loss from claims, including claims of patent or trademark infringement or other third party claims for injuries, damages or losses. The Company has agreed to indemnify its surety against losses from third-party claims of subcontractors. The Company has not previously experienced material losses under these provisions and, while there can be no assurances, currently does not anticipate any future material adverse impact on its consolidated financial position, results of operations or cash flows.
The Company regularly reviews its exposure under all its engagements, including performance guarantees by contractual joint ventures and indemnification of its surety. As a result of the most recent review, the Company has determined that the risk
101
of material loss is remote under these arrangements and has not recorded a liability for these risks at December 31, 2017 on its consolidated balance sheet.
Retirement Plans
Approximately 450 of our U.S. employees participate in multi-employer retirement plans. Substantially all of the Company’s remaining U.S. employees are eligible to participate in one of the Company’s sponsored defined contribution savings plans, which are qualified plans under the requirements of Section 401(k) of the Internal Revenue Code. Company contributions to the domestic plans were $6.3 million, $5.5 million and $5.5 million for the years ended December 31, 2017, 2016 and 2015, respectively.
Certain foreign subsidiaries maintain various other defined contribution retirement plans. Company contributions to such plans for the years ended December 31, 2017, 2016 and 2015 were $1.0 million, $0.8 million and $0.8 million, respectively.
In connection with the Company’s 2009 acquisition of Corrpro, the Company assumed an obligation associated with a contributory defined benefit pension plan sponsored by a subsidiary of Corrpro located in the United Kingdom. Employees of this Corrpro subsidiary no longer accrue benefits under the plan; however, Corrpro continues to be obligated to fund prior period benefits. Corrpro funds the plan in accordance with recommendations from an independent actuary and made contributions of $0.0 million, $0.1 million and $0.1 million in 2017, 2016 and 2015, respectively. Both the pension expense and funding requirements for the years ended December 31, 2017, 2016 and 2015 were immaterial to the Company’s consolidated financial position and results of operations. The benefit obligation and plan assets at December 31, 2017 were approximately $7.5 million and $9.3 million, respectively. The Company used a discount rate of 2.5% for the evaluation of the pension liability. The Company recorded an asset associated with the overfunded status of this plan of approximately $1.8 million, which is included in other long-term assets on the consolidated balance sheet. The benefit obligation and plan assets at December 31, 2016 approximated $7.4 million and $8.8 million, respectively. Plan assets consist of investments in equity and debt securities as well as cash, which are primarily Level 2 investments under the fair value hierarchy of U.S. GAAP.
12. DERIVATIVE FINANCIAL INSTRUMENTS
As a matter of policy, the Company uses derivatives for risk management purposes, and does not use derivatives for speculative purposes. From time to time, the Company may enter into foreign currency forward contracts to hedge foreign currency cash flow transactions. For cash flow hedges, gain or loss is recorded in the consolidated statements of operations upon settlement of the hedge. All of the Company’s hedges that are designated as hedges for accounting purposes were highly effective; therefore, no notable amounts of hedge ineffectiveness were recorded in the Company’s consolidated statements of operations for the outstanding hedged balance. During each of the years ended December 31, 2017, 2016 and 2015, the Company recorded less than $0.1 million as a gain on the consolidated statements of operations in the other income (expense) line item upon settlement of the cash flow hedges. At December 31, 2017, the Company’s cash flow hedges were in a net deferred gain position of $3.3 million due to favorable movements in short-term interest rates relative to the hedged position. The gain was recorded in prepaid expenses and other current assets and other comprehensive income on the Consolidated Balance Sheets and on the foreign currency translation adjustment and derivative transactions line of the Consolidated Statements of Equity. The Company presents derivative instruments in the consolidated financial statements on a gross basis. The gross and net difference of derivative instruments are considered to be immaterial to the financial position presented in the financial statements.
The Company engages in regular inter-company trade activities with, and receives royalty payments from, its wholly-owned Canadian entities, paid in Canadian Dollars, rather than the Company’s functional currency, U.S. Dollars. In order to reduce the uncertainty of the U.S. Dollar settlement amount of that anticipated future payment from the Canadian entities, the Company uses forward contracts to sell a portion of the anticipated Canadian Dollars to be received at the future date and buys U.S. Dollars.
In October 2015, the Company entered into an interest rate swap agreement for a notional amount of $262.5 million, which is set to expire in October 2020. The notional amount of this swap mirrors the amortization of a $262.5 million portion of the Company’s $350.0 million term loan drawn from the Credit Facility. The swap requires the Company to make a monthly fixed rate payment of 1.46% calculated on the amortizing $262.5 million notional amount, and provides for the Company to receive a payment based upon a variable monthly LIBOR interest rate calculated on the same amortizing $262.5 million notional amount. The receipt of the monthly LIBOR-based payment offsets the variable monthly LIBOR-based interest cost on a corresponding $262.5 million portion of the Company’s term loan from the Credit Facility. This interest rate swap is used to partially hedge the interest rate risk associated with the volatility of monthly LIBOR rate movement and is accounted for as a cash flow hedge.
102
The following table provides a summary of the fair value amounts of our derivative instruments, all of which are Level 2 (as defined below) inputs (in thousands):
December 31, | ||||||||||
Designation of Derivatives | Balance Sheet Location | 2017 | 2016 | |||||||
Derivatives Designated as Hedging Instruments: | ||||||||||
Forward Currency Contracts | Prepaid expenses and other current assets | $ | 176 | $ | — | |||||
Interest Rate Swaps | Other non-current assets | 3,193 | 1,061 | |||||||
Total Assets | $ | 3,369 | $ | 1,061 | ||||||
Forward Currency Contracts | Accrued expenses | $ | 33 | $ | 57 | |||||
Total Liabilities | $ | 33 | $ | 57 | ||||||
Derivatives Not Designated as Hedging Instruments: | ||||||||||
Forward Currency Contracts | Prepaid expenses and other current assets | $ | 10 | $ | 26 | |||||
Total Assets | $ | 10 | $ | 26 | ||||||
Total Derivative Assets | $ | 3,379 | $ | 1,087 | ||||||
Total Derivative Liabilities | 33 | 57 | ||||||||
Total Net Derivative Asset (Liability) | $ | 3,346 | $ | 1,030 | ||||||
FASB ASC 820, Fair Value Measurements (“FASB ASC 820”), defines fair value, establishes a framework for measuring fair value and expands disclosure requirements about fair value measurements for interim and annual reporting periods. The guidance establishes a three-tier fair value hierarchy, which prioritizes the inputs used in measuring fair value. These tiers include: Level 1 – defined as quoted prices in active markets for identical instruments; Level 2 – defined as inputs other than quoted prices in active markets that are either directly or indirectly observable; and Level 3 – defined as unobservable inputs in which little or no market data exists, therefore requiring an entity to develop its own assumptions. In accordance with FASB ASC 820, the Company determined that the instruments summarized below are derived from significant observable inputs, referred to as Level 2 inputs.
The following table represents assets and liabilities measured at fair value on a recurring basis and the basis for that measurement (in thousands):
Total Fair Value at December 31, 2017 | Quoted Prices in Active Markets for Identical Assets (Level 1) | Significant Observable Inputs (Level 2) | Significant Unobservable Inputs (Level 3) | ||||||||||||
Assets: | |||||||||||||||
Forward Currency Contracts | $ | 186 | $ | — | $ | 186 | $ | — | |||||||
Interest Rate Swaps | 3,193 | — | 3,193 | — | |||||||||||
Total | $ | 3,379 | $ | — | $ | 3,379 | $ | — | |||||||
Liabilities: | |||||||||||||||
Forward Currency Contracts | $ | 33 | $ | — | $ | 33 | $ | — | |||||||
Total | $ | 33 | $ | — | $ | 33 | $ | — | |||||||
103
Total Fair Value at December 31, 2016 | Quoted Prices in Active Markets for Identical Assets (Level 1) | Significant Observable Inputs (Level 2) | Significant Unobservable Inputs (Level 3) | ||||||||||||
Assets: | |||||||||||||||
Forward Currency Contracts | $ | 26 | $ | — | $ | 26 | $ | — | |||||||
Interest Rate Swap | 1,061 | — | 1,061 | — | |||||||||||
Total | $ | 1,087 | $ | — | $ | 1,087 | $ | — | |||||||
Liabilities: | |||||||||||||||
Forward Currency Contracts | $ | 57 | $ | — | $ | 57 | $ | — | |||||||
Total | $ | 57 | $ | — | $ | 57 | $ | — | |||||||
The following table summarizes the Company’s derivative positions at December 31, 2017:
Position | Notional Amount | Weighted Average Remaining Maturity In Years | Average Exchange Rate | ||||||
Canadian Dollar/USD | Sell | $ | 1,662,500 | 0.3 | 1.26 | ||||
USD/British Pound | Sell | £ | 4,595,000 | 0.3 | 1.35 | ||||
EURO/British Pound | Sell | £ | 2,568,300 | 0.3 | 0.89 | ||||
USD/South African Rand | Sell | R | 38,371,793 | 0.1 | 12.44 | ||||
Interest Rate Swap | $ | 231,328,125 | 2.8 | ||||||
The Company had no transfers between Level 1, 2 or 3 inputs during 2017. Certain financial instruments are required to be recorded at fair value. Changes in assumptions or estimation methods could affect the fair value estimates; however, the Company does not believe any such changes would have a material impact on our financial condition, results of operations or cash flows. Other financial instruments including cash and cash equivalents and short-term borrowings, including notes payable, are recorded at cost, which approximates fair value, which are based on Level 2 inputs as previously defined.
13. SEGMENT AND GEOGRAPHIC INFORMATION
The Company operates in three distinct markets: energy and mining; water and wastewater; and commercial and structural services. The Company’s three operating segments are also its reportable segments: Infrastructure Solutions; Corrosion Protection; and Energy Services. The Company’s operating segments correspond to its management organizational structure. Each operating segment has a president who reports to the chief operating decision manager (“CODM”). The operating results and financial information reported by each segment are evaluated separately, regularly reviewed and used by the CODM to evaluate segment performance, allocate resources and determine management incentive compensation.
The following disaggregated financial results have been prepared using a management approach that is consistent with the basis and manner with which management internally disaggregates financial information for the purpose of making internal operating decisions. The Company evaluates performance based on stand-alone operating income (loss).
104
Financial information by segment was as follows (in thousands):
Years Ended December 31, | |||||||||||
2017 | 2016 | 2015 | |||||||||
Revenues: | |||||||||||
Infrastructure Solutions | $ | 612,154 | $ | 571,551 | $ | 556,234 | |||||
Corrosion Protection | 456,139 | 401,469 | 437,921 | ||||||||
Energy Services | 290,726 | 248,900 | 339,415 | ||||||||
Total revenues | $ | 1,359,019 | $ | 1,221,920 | $ | 1,333,570 | |||||
Operating income (loss): | |||||||||||
Infrastructure Solutions (1) | $ | (61,807 | ) | $ | 53,503 | $ | 46,867 | ||||
Corrosion Protection (2) | 12,437 | 1,809 | (1,771 | ) | |||||||
Energy Services (3) | 6,197 | (4,486 | ) | (25,150 | ) | ||||||
Total operating income (loss) | (43,173 | ) | 50,826 | 19,946 | |||||||
Other income (expense): | |||||||||||
Interest expense | (16,001 | ) | (15,029 | ) | (16,044 | ) | |||||
Interest income | 145 | 166 | 218 | ||||||||
Other | (2,201 | ) | (694 | ) | (2,905 | ) | |||||
Total other expense | (18,057 | ) | (15,557 | ) | (18,731 | ) | |||||
Income (loss) before taxes on income | $ | (61,230 | ) | $ | 35,269 | $ | 1,215 | ||||
Total assets: | |||||||||||
Infrastructure Solutions | $ | 531,746 | $ | 584,425 | $ | 508,817 | |||||
Corrosion Protection | 329,848 | 424,007 | 489,519 | ||||||||
Energy Services | 152,416 | 147,171 | 183,763 | ||||||||
Corporate | 22,775 | 37,979 | 50,854 | ||||||||
Assets held for sale | 70,314 | — | 21,060 | ||||||||
Total assets | $ | 1,107,099 | $ | 1,193,582 | $ | 1,254,013 | |||||
Capital expenditures: | |||||||||||
Infrastructure Solutions | $ | 16,680 | $ | 19,834 | $ | 7,657 | |||||
Corrosion Protection | 8,603 | 14,393 | 17,226 | ||||||||
Energy Services | 2,713 | 2,514 | 2,202 | ||||||||
Corporate | 2,834 | 2,019 | 2,369 | ||||||||
Total capital expenditures | $ | 30,830 | $ | 38,760 | $ | 29,454 | |||||
Depreciation and amortization: | |||||||||||
Infrastructure Solutions | $ | 18,731 | $ | 17,547 | $ | 14,836 | |||||
Corrosion Protection | 15,598 | 18,792 | 18,834 | ||||||||
Energy Services | 6,726 | 7,067 | 7,641 | ||||||||
Corporate | 4,319 | 3,313 | 2,480 | ||||||||
Total depreciation and amortization | $ | 45,374 | $ | 46,719 | $ | 43,791 | |||||
__________________________
(1) | Operating loss for 2017 includes: (i) $18.1 million of restructuring charges (see Note 3); (ii) $45.4 million of goodwill impairment charges (see Note 2); (iii) $41.0 million of definite-lived intangible asset impairment charges (see Note 2); and (iv) $0.7 million of costs incurred related to the acquisition of Environmental Techniques. Operating income for 2016 includes: (i) $2.9 million of restructuring charges (see Note 3); (ii) $2.7 million of costs incurred related to the acquisitions of Underground Solutions, Fyfe Europe, LMJ and Concrete Solutions; (iii) inventory step up expense of $3.6 million recognized as part of the accounting for business combinations; and (iv) a gain of $6.6 million in connection with the settlement of two longstanding lawsuits (see Note 11). Operating income for 2015 includes $8.1 million of restructuring charges (see Note 3) and $1.1 million of costs incurred related to the acquisition of Underground Solutions. |
105
(2) | Operating income for 2017 includes: (i) $5.9 million of restructuring charges (see Note 3); and (ii) $2.3 million of costs incurred related to the planned divestiture of Bayou. Operating income for 2016 includes $4.6 million of 2016 Restructuring charges (see Note 3). Operating loss for 2015 includes $10.0 million of goodwill impairment charges (see Note 2) and $0.5 million of acquisition related expenses. |
(3) | Operating loss for 2016 includes $8.2 million of restructuring charges (see Note 3). Operating loss for 2015 includes $33.5 million of goodwill impairment charges (see Note 2) and $0.3 million of costs incurred related to the acquisition of Schultz. |
The following table summarizes revenues, operating income (loss) and long-lived assets by geographic region (in thousands):
Years Ended December 31, | |||||||||||
2017 | 2016 | 2015 | |||||||||
Revenues: (1) | |||||||||||
United States | $ | 1,028,313 | $ | 924,580 | $ | 965,957 | |||||
Canada | 139,734 | 129,291 | 174,827 | ||||||||
Europe | 71,839 | 60,238 | 56,474 | ||||||||
Other foreign | 119,133 | 107,811 | 136,312 | ||||||||
Total revenues | $ | 1,359,019 | $ | 1,221,920 | $ | 1,333,570 | |||||
Operating income (loss): | |||||||||||
United States | $ | (33,236 | ) | $ | 28,048 | $ | (18,959 | ) | |||
Canada | 12,220 | 16,156 | 27,126 | ||||||||
Europe | (3,771 | ) | 981 | 3,217 | |||||||
Other foreign | (18,386 | ) | 5,641 | 8,562 | |||||||
Total operating income (loss) | $ | (43,173 | ) | $ | 50,826 | $ | 19,946 | ||||
Long-lived assets: (1)(2) | |||||||||||
United States | $ | 93,472 | $ | 140,099 | $ | 124,120 | |||||
Canada | 8,816 | 9,464 | 9,872 | ||||||||
Europe | 13,435 | 7,575 | 7,268 | ||||||||
Other foreign | 9,586 | 8,829 | 9,189 | ||||||||
Total long-lived assets | $ | 125,309 | $ | 165,967 | $ | 150,449 | |||||
__________________________
(1) | Revenues and long-lived assets are attributed to the country of origin for the Company’s legal entities. For a significant majority of its legal entities, the country of origin relates to the country or geographic area that it services. |
(2) | Long-lived assets as of December 31, 2017, 2016 and 2015 do not include intangible assets, goodwill or deferred tax assets. |
14. SELECTED QUARTERLY FINANCIAL DATA (UNAUDITED)
Unaudited quarterly financial data was as follows (in thousands, except per share data):
First Quarter(1) | Second Quarter(2) | Third Quarter(3) | Fourth Quarter(4) | ||||||||||||
Year ended December 31, 2017: | |||||||||||||||
Revenues | $ | 325,175 | $ | 354,473 | $ | 341,872 | $ | 337,499 | |||||||
Gross profit | 67,412 | 79,768 | 73,442 | 64,190 | |||||||||||
Operating income (loss) | 14,133 | 21,659 | (75,009 | ) | (3,956 | ) | |||||||||
Net income (loss) | 7,753 | 12,178 | (73,782 | ) | (12,384 | ) | |||||||||
Earnings per share attributable to Aegion Corporation: | |||||||||||||||
Basic | $ | 0.17 | $ | 0.33 | $ | (2.23 | ) | $ | (0.39 | ) | |||||
Diluted | $ | 0.17 | $ | 0.33 | $ | (2.23 | ) | $ | (0.39 | ) | |||||
____________________
(1) | Includes pre-tax expense reversals of $(0.1) million related to our restructuring efforts (see Note 3). |
106
(2) | Includes pre-tax expenses of $0.3 million related to our restructuring efforts (see Note 3). |
(3) | Includes pre-tax expenses of $6.7 million related to our restructuring efforts (see Note 3); pre-tax goodwill impairment charges of $45.4 million (see Note 2); and pre-tax definite-lived intangible asset impairment charges of $41.0 million (see Note 2). |
(4) | Includes pre-tax expenses of $17.1 million related to our restructuring efforts (see Note 3). |
First Quarter(1) | Second Quarter(2) | Third Quarter(3) | Fourth Quarter(4) | ||||||||||||
Year ended December 31, 2016: | |||||||||||||||
Revenues | $ | 293,908 | $ | 297,686 | $ | 308,524 | $ | 321,802 | |||||||
Gross profit | 54,414 | 61,190 | 66,318 | 71,242 | |||||||||||
Operating income (loss) | (4,139 | ) | 8,145 | 20,505 | 26,315 | ||||||||||
Net income (loss) | (3,949 | ) | 3,193 | 11,787 | 18,129 | ||||||||||
Earnings per share attributable to Aegion Corporation: | |||||||||||||||
Basic | $ | (0.11 | ) | $ | 0.10 | $ | 0.35 | $ | 0.52 | ||||||
Net income (loss) | $ | (0.11 | ) | $ | 0.10 | $ | 0.34 | $ | 0.52 | ||||||
____________________
(1) | Includes pre-tax expenses of $9.5 million related to our restructuring efforts (see Note 3). |
(2) | Includes pre-tax expenses of $3.9 million related to our restructuring efforts (see Note 3). |
(3) | Includes pre-tax expenses of $0.9 million related to our restructuring efforts (see Note 3). |
(4) | Includes pre-tax expenses of $1.6 million related to our restructuring efforts (see Note 3), and a gain on litigation settlement of $6.6 million (see Note 11). |
15. SUBSEQUENT EVENT
On February 27, 2018, the Company amended its existing $650.0 million senior secured credit facility with a syndicate of banks. Bank of America, N.A. served as the sole administrative agent and U.S. Bank National Association, PNC Bank, National Association and Compass Bank acted as co-syndication agents. Merrill Lynch Pierce Fenner & Smith Incorporated, U.S. Bank National Association, PNC Capital Markets, LLC and Compass Bank acted as joint lead arrangers and joint book managers in the syndication of the amended Credit Facility.
The amended Credit Facility consists of a $300.0 million five-year revolving line of credit and a $308.4 million five-year term loan facility. Interest terms from the Company’s existing Credit Facility have not changed under the amendment. The amended Credit Facility also: (i) extended the expiration date of the Credit Facility and the amortization period for the term loan facility from October 2020 to February 2023; (ii) approved the sale of Bayou; and (iii) updated the defined terms to allow for the add-back of certain charges related to the 2017 Restructuring when calculating our compliance with the financial covenants. In the event of the sale of Bayou, the net cash proceeds are required to be applied first against any outstanding borrowings on the revolving line of credit. Additionally, upon any such sale, the maximum aggregate principal amount of the revolving line of credit will be permanently reduced from $300.0 million to $275.0 million.
The Company paid approximately $2.4 million for arranging fees, up-front lending fees and other expenses associated with the amended Credit Facility.
The amended Credit Facility is subject to certain financial covenants, including a consolidated financial leverage ratio and consolidated fixed charge coverage ratio. Subject to the specifically defined terms and methods of calculation as set forth in the amended Credit Facility, the financial covenant requirements, as of each quarterly reporting period end beginning with December 31, 2017, are defined as follows:
• | Consolidated financial leverage ratio compares consolidated funded indebtedness to amended Credit Facility defined income. The initial maximum amount is not to exceed 3.75 to 1.00 and will decrease periodically at scheduled reporting periods to not more than 3.50 to 1.00 beginning with the quarter ending September 30, 2018. |
• | Consolidated fixed charge coverage ratio compares amended Credit Facility defined income to amended Credit Facility defined fixed charges. The initial minimum permitted ratio is not less than 1.15 to 1.00 and will increase to 1.25 to 1.00 beginning with the quarter ending December 31, 2018. |
107
Item 9. Changes in and Disagreements with Accountants on Accounting and Financial Disclosure.
None.
Item 9A. Controls and Procedures.
Our management, under the supervision and with the participation of our Chief Executive Officer (our principal executive officer) and interim Chief Financial Officer (our principal financial officer), has conducted an evaluation of the effectiveness of the design and operation of our disclosure controls and procedures (as defined in Rules 13a-15(e) and 15d-15(e) of the Securities Exchange Act of 1934, as amended (the “Exchange Act”), as of December 31, 2017. Based upon and as of the date of this evaluation, our Chief Executive Officer and interim Chief Financial Officer have concluded that our disclosure controls were effective to provide reasonable assurance that the information required to be disclosed by us in the reports that we file or submit under the Exchange Act (a) is recorded, processed, summarized and reported within the time period specified in the Securities and Exchange Commission’s rules and forms, and (b) is accumulated and communicated to our management, including our principal executive and principal financial officers, as appropriate to allow timely decisions regarding required disclosure.
Management’s report is included in Item 8 of this Report under the caption entitled “Management’s Report on Internal Control Over Financial Reporting,” and is incorporated herein by reference. The effectiveness of the Company’s internal control over financial reporting as of December 31, 2017 has been audited by PricewaterhouseCoopers LLP, an independent registered public accounting firm, as stated in its report which is included in Item 8 of this Report under the caption entitled “Report of Independent Registered Public Accounting Firm” and is incorporated herein by reference.
Changes in Internal Control Over Financial Reporting
There were no changes in our internal control over financial reporting that occurred during the quarter ended December 31, 2017 that materially affected, or are reasonably likely to materially affect, our internal control over financial reporting.
Item 9B. Other Information.
Not applicable.
108
PART III
Item 10. Directors, Executive Officers and Corporate Governance.
Information concerning this item is included in “Item 4A. Executive Officers of the Registrant” of this Report and under the captions “Certain Information Concerning Director Nominees,” “Section 16(a) Beneficial Ownership Reporting Compliance,” “Corporate Governance—Corporate Governance Documents,” “Corporate Governance—Board Meetings and Committees—Audit Committee” and “Corporate Governance—Board Meetings and Committees—Audit Committee Financial Expert” in our Proxy Statement for our 2018 Annual Meeting of Stockholders (“2018 Proxy Statement”) and is incorporated herein by reference.
Item 11. Executive Compensation.
Information concerning this item is included under the captions “Executive Compensation,” “Compensation in Last Fiscal Year,” “Director Compensation,” “Corporate Governance—Board Meetings and Committees—Compensation Committee Interlocks and Insider Participation” and “Compensation Committee Report” in the 2018 Proxy Statement and is incorporated herein by reference.
Item 12. Security Ownership of Certain Beneficial Owners and Management and Related Stockholder Matters.
Information concerning this item is included in Item 5 of this Report under the caption “Equity Compensation Plan Information” and under the caption “Information Concerning Certain Stockholders” in the 2018 Proxy Statement and is incorporated herein by reference.
Item 13. Certain Relationships and Related Transactions, and Director Independence.
Information concerning this item is included under the captions “Related-Party Transactions” and “Corporate Governance—Independent Directors” in the 2018 Proxy Statement and is incorporated herein by reference.
Item 14. Principal Accountant Fees and Services.
Information concerning this item is included under the caption “Independent Auditors’ Fees” in the 2018 Proxy Statement and is incorporated herein by reference.
109
PART IV
Item 15. Exhibits and Financial Statement Schedules.
1. Financial Statements:
The consolidated financial statements filed in this Annual Report on Form 10-K are listed in the Index to Consolidated Financial Statements included in “Item 8. Financial Statements and Supplementary Data,” which information is incorporated herein by reference.
2. Financial Statement Schedules:
No financial statement schedules are included herein because of the absence of conditions under which they are required or because the required information is contained in the consolidated financial statements or notes thereto contained in this Report.
3. Exhibits:
The exhibits required to be filed as part of this Annual Report on Form 10-K are listed in the Index to Exhibits attached hereto.
110
SIGNATURES
Pursuant to the requirements of Section 13 or 15(d) of the Securities Exchange Act of 1934, the registrant has duly caused this Report to be signed on its behalf by the undersigned, thereunto duly authorized.
Dated: March 1, 2018 | AEGION CORPORATION | ||
By: | /s/ Charles R. Gordon | ||
Charles R. Gordon | |||
President and Chief Executive Officer | |||
POWER OF ATTORNEY
The registrant and each person whose signature appears below hereby appoint Charles R. Gordon and David F. Morris as attorneys-in-fact with full power of substitution, severally, to execute in the name and on behalf of the registrant and each such person, individually and in each capacity stated below, one or more amendments to the annual report which amendments may make such changes in the report as the attorney-in-fact acting deems appropriate and to file any such amendment to the report with the Securities and Exchange Commission.
Pursuant to the requirements of the Securities Exchange Act of 1934, this Report has been signed below by the following persons on behalf of the registrant and in the capacities and on the dates indicated.
Signature | Title | Date |
/s/ Charles R. Gordon | Principal Executive Officer and | March 1, 2018 |
Charles R. Gordon | Director | |
/s/ David F. Morris | Principal Financial Officer | March 1, 2018 |
David F. Morris | ||
/s/ Michael D. White | Principal Accounting Officer | March 1, 2018 |
Michael D. White | ||
/s/ Stephen P. Cortinovis | Director | March 1, 2018 |
Stephen P. Cortinovis | ||
/s/ Stephanie A. Cuskley | Director | March 1, 2018 |
Stephanie A. Cuskley | ||
/s/ Walter J. Galvin | Director | March 1, 2018 |
Walter J. Galvin | ||
/s/ Rhonda Germany Ballintyn | Director | March 1, 2018 |
Rhonda Germany Ballintyn | ||
/s/ Juanita H. Hinshaw | Director | March 1, 2018 |
Juanita H. Hinshaw | ||
/s/ M. Richard Smith | Director | March 1, 2018 |
M. Richard Smith | ||
/s/ Alfred L. Woods | Director | March 1, 2018 |
Alfred L. Woods | ||
/s/ Phillip D. Wright | Director | March 1, 2018 |
Phillip D. Wright | ||
111
INDEX TO EXHIBITS (1)
112
10.13 | |
10.14 | |
10.15 | |
10.16 | |
10.17 | |
10.18 | |
10.19 | |
10.20 | |
10.21 | |
10.22 | |
10.23 | |
10.24 | |
10.25 | |
10.26 | |
10.27 | |
10.28 | |
113
21 | |
23 | |
24 | Power of Attorney (set forth on signature page). |
31.1 | |
31.2 | |
32.1 | |
32.2 | |
95 | |
101.INS | XBRL Instance Document* |
101.SCH | XBRL Taxonomy Extension Schema Document* |
101.CAL | XBRL Taxonomy Extension Calculation Linkbase Document* |
101.DEF | XBRL Taxonomy Extension Definition Linkbase Document* |
101.LAB | XBRL Taxonomy Extension Label Linkbase Document* |
101.PRE | XBRL Taxonomy Extension Presentation Linkbase Document* |
* In accordance with Rule 406T under Regulation S-T, the XBRL-related information in Exhibit 101 shall be deemed “furnished” and not “filed”.
(1) | The Company’s current, quarterly and annual reports are filed with the Securities and Exchange Commission under file no. 001-35328. |
(2) | Management contract or compensatory plan or arrangement. |
* * *
Documents listed in this Index to Exhibits will be made available upon written request.
114