Attached files
UNITED STATES
SECURITIES AND EXCHANGE COMMISSION
Washington, D.C. 20549
FORM 10-K
x | ANNUAL REPORT PURSUANT TO SECTION 13 OR 15(d) OF THE SECURITIES EXCHANGE ACT OF 1934 |
For the fiscal year ended December 31, 2017
or
o | TRANSITION REPORT PURSUANT TO SECTION 13 OR 15(d) OF THE SECURITIES EXCHANGE ACT OF 1934 |
Commission File Number: 001-35462
Worldpay, Inc.
(Exact name of registrant as specified in its charter)
Delaware | 26-4532998 | |
(State or other jurisdiction of incorporation or organization) | (I.R.S. Employer Identification No.) | |
8500 Governor’s Hill Drive
Symmes Township, OH 45249
(Address of principal executive offices)
Registrant’s telephone number, including area code: (513) 900-5250
Securities registered pursuant to 12(b) of the Act:
Title of each class | Name of each exchange on which registered | |
Class A Common Stock, $0.00001 par value | New York Stock Exchange | |
Securities registered pursuant to 12(g) of the Act: None
Indicate by check mark if the registrant is a well-known seasoned issuer, as defined in Rule 405 of the Securities Act. Yes x No o
Indicate by check mark if the registrant is not required to file reports pursuant to Section 13 or Section 15(d) of the Act. Yes o No x
Indicate by check mark whether the registrant (1) has filed all reports required to be filed by Section 13 or 15 (d) of the Securities Exchange Act of 1934 during the preceding 12 months (or for such shorter period that the registrant was required to file such reports) and (2) has been subject to such filing requirements for the past 90 days. Yes x No o
Indicate by check mark whether the registrant has submitted electronically and posted on its corporate Website, if any, every Interactive Data File required to be submitted and posted pursuant to Rule 405 of Regulation S-T (§232.405 of this chapter) during the preceding 12 months (or for such shorter period that the registrant was required to submit and post such files). Yes x No o
Indicate by check mark if disclosure of delinquent filers pursuant to Item 405 of Regulation S-K (§229.405 of this chapter) is not contained herein, and will not be contained, to the best of registrant’s knowledge, in definitive proxy or information statements incorporated by reference in Part III of this Form 10-K or any amendment to this Form 10-K. x
Indicate by check mark whether the registrant is a large accelerated filer, an accelerated filer, a non-accelerated filer, a smaller reporting company or an emerging growth company. See definitions of “large accelerated filer,” “accelerated filer”, “smaller reporting company” and “emerging growth company” in Rule 12b-2 of the Exchange Act.
Large accelerated filer x | Accelerated filer o | |
Non-accelerated filer o | Smaller reporting company o | |
Emerging growth company o | ||
If an emerging growth company, indicate by check mark if the registrant has elected not to use the extended transition period for complying with any new or revised financial accounting standards provided pursuant to Section 13(a) of the Exchange Act. o
Indicate by check mark whether the registrant is a shell company (as defined in Rule 12b-2 of the Act). Yes o No x
As of June 30, 2017 (the last business day of the registrant’s most recently completed second fiscal quarter), the aggregate market value of the voting and non-voting common stock held by non-affiliates of the registrant was $10.3 billion.
As of December 31, 2017, there were 162,595,981 shares of the registrant’s Class A common stock outstanding and 15,252,826 shares of the registrant’s Class B common stock outstanding.
Documents Incorporated by Reference: |
Portions of the registrant’s definitive Proxy Statement for the 2018 Annual Meeting of Stockholders are incorporated by reference in Part III of this Annual Report on Form 10-K as indicated. Such proxy statement will be filed with the Securities and Exchange Commission within 120 days of the registrant’s fiscal year ended December 31, 2017.
WORLDPAY, INC.
FORM 10-K
For the Fiscal Year Ended December 31, 2017
TABLE OF CONTENTS
Page | |
2
NOTE REGARDING FORWARD-LOOKING STATEMENTS
This Annual Report on Form 10-K, including the sections entitled “Management’s Discussion and Analysis of Financial Condition and Results of Operations” and “Risk Factors,” contains forward-looking statements within the meaning of Section 27A of the Securities Act of 1933 and Section 21E of the Securities Exchange Act of 1934. All statements other than statements of historical fact, including statements regarding our future results of operations and financial position, our business strategy and plans, our objectives for future operations, and any statements of a general economic or industry specific nature, are forward-looking statements. You can identify forward-looking statements by the fact that they do not relate strictly to historical or current facts. Words such as “anticipate,” “estimate,” “expect,” “project,” “plan,” “intend,” “believe,” “may,” “will,” “continue,” “could,” “should,” “can have,” “likely,” or the negative or plural of these words and similar expressions are intended to identify forward-looking statements. We have based these forward-looking statements largely on our current expectations and projections about future events and trends that we believe, based on information currently available to our management, may affect our financial condition, results of operations, business strategy, short-term and long-term business operations and objectives, and financial needs. These forward-looking statements are subject to a number of risks, uncertainties and assumptions, including those described in the “Risk Factors” section of this report. Moreover, we operate in a very competitive and rapidly changing environment. New risks emerge from time to time. It is not possible for our management to predict all risks, nor can we assess the impact of all factors on our business or the extent to which any factor, or combination of factors, may cause actual results to differ materially from those contained in any forward-looking statements we may make. In light of these risks, uncertainties and assumptions, the future events and trends discussed in this report may not occur and actual results could differ materially and adversely from those anticipated or implied in the forward-looking statements.
You should not rely upon forward-looking statements as predictions of future events. The events and circumstances reflected in the forward-looking statements may not be achieved or occur. Although we believe that the expectations and assumptions reflected in the forward-looking statements are reasonable, we cannot guarantee future results, levels of activity, performance, or achievements. We undertake no obligation to publicly update any forward-looking statement after the date of this report, whether as a result of new information, future developments or otherwise, or to conform these statements to actual results or revised expectations, except as may be required by law.
3
PART I
Item 1. Business
Worldpay, Inc., formerly Vantiv, Inc., a Delaware corporation, is a holding company that conducts its operations through its majority-owned subsidiary, Vantiv Holding, LLC (“Vantiv Holding”). Worldpay, Inc., Vantiv Holding and their subsidiaries are referred to collectively as the “Company,” “Worldpay,” “we,” “us” or “our,” unless the context requires otherwise.
Recent Acquisition
On January 16, 2018, we completed the previously announced acquisition of all of the outstanding shares of Worldpay Group Limited, formerly Worldpay Group plc, a public limited company (“Legacy Worldpay”). Following the acquisition, we changed our name from “Vantiv, Inc.” to “Worldpay, Inc.” (“Worldpay”), by amending our Second Amended and Restated Certificate of Incorporation. The effective date of the name change was January 16, 2018.
Business and Client Description
Worldpay is a leading payment processor differentiated by a technology platform in the U.S., breadth of distribution and superior cost structure. According to the Nilson Report, we are the largest merchant acquirer and the largest PIN debit acquirer by number of transactions in the United States. Our U.S. technology platform is differentiated from our competitors’ multiple platform architectures. It enables us to efficiently provide a comprehensive suite of services to merchants and financial institutions of all sizes as well as to innovate, develop and deploy new services, while providing us with significant economies of scale. Our broad and varied distribution includes multiple sales channels, such as our direct and indirect sales forces and referral partner relationships, which provide us with a growing and diverse client base of merchants and financial institutions. We believe this combination of attributes provides us with competitive advantages that generate strong growth and profitability by enabling us to efficiently manage, update and maintain our technology, to utilize technology integration and value-added services to expand our new sales and distribution, and to realize significant operating leverage.
We offer a broad suite of payment processing services that enable our clients to meet their payment processing needs through a single provider, including in omni-channel environments that span point-of-sale, ecommerce and mobile devices. We enable merchants of all sizes to accept and process credit, debit and prepaid payments and provide them supporting value-added services, such as security solutions and fraud management, information solutions, and interchange management. We also provide mission critical payment services to financial institutions, such as card issuer processing, payment network processing, fraud protection, card production, prepaid program management, ATM driving and network gateway and switching services that utilize our proprietary Jeanie PIN debit payment network.
Merchant Services
We have a broad and diversified merchant client base. Our merchant client base includes merchant locations across the United States. In 2017, we processed approximately 23 billion transactions for these merchants. Our merchant client base has low client concentration and is heavily weighted in non-discretionary everyday spend categories, such as grocery and pharmacy, and includes large national retailers, including eleven of the top 25 national retailers by revenue in 2016. We provide a comprehensive suite of payment processing services to our merchant services clients. We authorize, clear, settle and provide reporting for electronic payment transactions, as further discussed below.
Acquiring and Processing. We provide merchants with a broad range of credit, debit and prepaid payment processing services. We give them the ability to accept and process Visa, Mastercard, American Express, Discover and PIN debit network card transactions originated at the point of sale as well as for ecommerce and mobile transactions. This service includes all aspects of card processing, including authorization and settlement, customer service, chargeback and retrieval processing and network fee and interchange management.
Value-added Services. We offer value-added services that help our clients operate and manage their businesses including omni-channel acceptance, prepaid services and gift card solutions. We also provide security solutions such as point-to-point encryption and tokenization both at the point of sale and for ecommerce transactions.
4
Financial Institution Services
Our financial institution client base is also generally well diversified and includes regional banks, community banks, credit unions and regional PIN debit networks. In 2017, we processed approximately 3.5 billion transactions for these financial institutions. We generally focus on small to mid-sized institutions with less than $15 billion in assets. Smaller financial institutions generally do not have the scale or infrastructure typical of large institutions and are more likely to outsource their payment processing needs. We provide integrated card issuer processing, payment network processing and value-added services to our financial institutions clients. These services are discussed further below.
Integrated Card Issuer and Processing. We process and service credit, debit, ATM and prepaid transactions. We process and provide statement production, collections and inbound/outbound call centers. Our card processing solution includes processing and other services such as card portfolio analytics, program strategy and support, fraud and security management and chargeback and dispute services. We provide authorization support in the form of online or batch settlement, as well as real-time transaction research capability and archiving and daily and monthly cardholder reports for statistical analysis.
Value-added Services. We provide additional services to our financial institution clients that complement our issuing and processing services. These services include fraud protection, card production, prepaid cards, ATM driving, portfolio optimization, data analytics and card program marketing. We also provide network gateway and switching services that utilize our Jeanie PIN network. Our Jeanie network offers real-time electronic payment, network bill payment, single point settlement, shared deposit taking and customer select PINs.
Technology Platform
Our U.S. technology platform provides our merchant and financial institution clients with differentiated payment processing solutions and provides us with significant strategic and operational benefits. Small and mid-sized merchants are able to easily connect to our U.S. technology platform using our application process interfaces, or APIs, software development kits, or SDKs, and other tools we make available to technology partners, which we believe enhances our capacity to sell to such merchants. Our U.S. technology platform allows us to collect, manage and analyze data across both our Merchant Services and our Financial Institution Services segments that we can then package into information solutions for our clients. It provides insight into market trends and opportunities as they emerge, which enhances our ability to innovate and develop new value-added services, including security solutions and fraud management, and it allows us to easily deploy new solutions that span the payment processing value chain, such as ecommerce and mobile services, which are high growth market opportunities. It is highly scalable, which enables us to efficiently manage, update and maintain our technology, increase capacity and speed, and realize significant operating leverage. We believe our U.S. technology platform is a key differentiator from payment processors that operate on multiple technology platforms and provides us with a significant competitive advantage.
Sales and Marketing
Our U.S. technology platform enables us to provide a comprehensive suite of services to merchants and financial institutions of all sizes. We distribute our services through multiple sales channels that enable us to efficiently and effectively target a growing and diverse client base of merchants and financial institutions. Our sales channels include direct and indirect sales forces as well as referral partner relationships within our Merchant Services and Financial Institution Services segments as described below.
Merchant Services. We distribute our comprehensive suite of services to a broad range of merchants, including large, mid-sized and small merchants, through multiple sales channels as further discussed below.
• | Direct: Includes a national sales force that targets large national merchants, a regional and mid-market sales team that sells solutions to merchants and third-party reseller clients, and a telesales operation that targets small and mid-sized merchants. |
• | Indirect: Includes Independent Sales Organizations (ISOs) that target small and mid-sized merchants. |
• | Merchant Bank: Includes referral partner relationships with financial institutions that target their financial services customers as merchant referrals to us. |
• | Integrated Payments (IP): Includes referral partner relationships with independent software vendors (ISVs), value-added resellers (VARs), and payment facilitators that target their technology customers as merchant referrals to us. |
• | eCommerce: Includes a sales force that targets internet retail, online services and direct marketing merchants. |
These sales channels utilize multiple strategies and leverage relationships with referral partners that sell our solutions to small and mid-sized merchants. We offer certain of our services on a white-label basis which enables them to be marketed
5
under our partners' brand. We select referral partners that enhance our distribution and augment our services with complimentary offerings. We believe our sales structure provides us with broad geographic coverage and access to various industries and verticals.
Financial Institution Services. We distribute our services by utilizing direct sales forces as well as a diverse group of referral partner relationships. These sales channels utilize multiple strategies and leverage relationships with core processors that sell our solutions to small and mid-sized financial institutions. We offer certain of our services on a white-label basis which enables them to be marketed under our client’s brand. We select resellers that enhance our distribution and augment our services with complementary offerings. Our relationships with core processors are necessary for developing the processing environments required by our financial institution clients. Many of our core processing relationships are non-contractual and continue for so long as an interface between us and the core processor is needed to accommodate one or more common financial institution customers.
Our sales teams in both Merchant Services and Financial Institution Services are paid a combination of base salary and commission. As of December 31, 2017, we had approximately 1,000 full-time employees participating in sales and marketing, including sales support personnel. Commissions paid to our sales force are based upon a percentage of revenue from new business and cross-selling to existing clients. Residual payments to our referral partners are based upon a percentage of revenues earned from referred business. For the year ended December 31, 2017, combined sales force commissions and residual payments represent approximately 79% of total sales and marketing expenses, or $528.0 million.
Our History
We have a 40 year history of providing payment processing services. We operated as a business unit of Fifth Third Bank (“Fifth Third”) until June 2009 when we separated as a stand-alone company, established our own organization, headquarters, brand, growth strategy and completed our initial public offering (“IPO”) in March 2012.
As a result of us acquiring Legacy Worldpay on January 16, 2018, below is a description of Legacy Worldpay’s business as well as the rationale for the acquisition.
Legacy Worldpay Business Description
Legacy Worldpay is a leader in global payments. Legacy Worldpay provides a broad range of technology-led solutions to its merchant customers to allow them to accept payments of almost any type, across multiple payment channels, nearly anywhere in the world. The fast growth of eCommerce and its increasingly international nature is making payments more complex for merchants in a number of ways, including in complying with local market regulations and practices, in minimizing the costs inherent in cross-border trade, in managing cash flows and reporting in many different currencies, in taking a large number of different payment types, and in dealing with greater threats of fraud.
Legacy Worldpay is one of the few global businesses able to address these complexities. It does so by offering functionality in most aspects of payment acceptance, whether in-store, online or on a mobile device, and granting access to a global payments network through an agile, integrated, secure, reliable and highly scalable proprietary global payments platform. Legacy Worldpay deploys this platform to optimize business outcomes for its customers, including by providing for acceptance of a greater number of payment types and opening access to new geographic markets, enabling its customers to reduce the chances of losing a potential sale, allowing them to get a single view of key customer data, and increasing transaction acceptance while protecting against fraud. Legacy Worldpay can also leverage the data gained as a result of its core payment solutions to offer payment analytics, insights on peers, industry benchmarking and additional functionality to its customers, allowing them to, for example, run loyalty schemes, guide their consumers to preferred payment types and improve their performance.
Legacy Worldpay serves a diverse set of merchants across a variety of end-markets, sizes and geographies. Globally, Legacy Worldpay also partners with innovative and fast-growing eCommerce businesses including many of the world’s most renowned and dynamic online brands.
Legacy Worldpay serves its customers through:
• | Global eCom - Global eCom provides a wide range of online and mobile multi-currency payment acceptance, validation and settlement services for its customer which include large and fast growing Internet-led multinationals. The vast majority of Global eCom’s customers sit within five priority industry verticals: Digital Content, Global Retail, Airlines, Regulated Gambling and Travel. |
6
• | Traditional Merchant - Legacy Worldpay serves a broad and diversified group of merchants. Legacy Worldpay’s client base primarily consists of merchant locations in the United Kingdom and the United States. Legacy Worldpay provides a comprehensive set of payment processing services to their merchants. |
Our acquisition of Legacy Worldpay is consistent with our strategy of investing in high growth segments of the payments market. Legacy Worldpay is a leader in the fast growing global and cross-border eCommerce segments. By combining with Legacy Worldpay, we have expanded from our number one position in the U.S. to become the number one global acquirer with leading global and cross-border eCommerce capabilities. Together, we will be uniquely positioned to become a global payment solutions provider, powering integrated omni-commerce worldwide.
Industry Background
Electronic Payments
Electronic payments in the United States have evolved into a large and growing market with favorable secular trends that continue to increase the adoption and use of card-based payment services, such as those for credit, debit and prepaid cards.
This growth is driven by the shift from cash and checks towards card-based and other electronic forms of payment due to their greater convenience, security, enhanced services and rewards and loyalty features. We believe changing demographics and emerging trends, such as the adoption of new technologies and business models, including ecommerce, mobile commerce and prepaid services, will also continue to drive growth in electronic payments.
Payment Processing Industry
The payment processing industry is comprised of various processors that create and manage the technology infrastructure that enables electronic payments. Payment processors help merchants and financial institutions develop and offer electronic payment solutions to their customers, facilitate the routing and processing of electronic payment transactions and manage a range of supporting security, value-added and back office services. In addition, many large banks manage and process their card accounts in-house. This is collectively referred to as the payment processing value chain.
Many payment processors specialize in providing services in discrete areas of the payment processing value chain, which can result in merchants and financial institutions using payment processing services from multiple providers. A limited number of payment processors have capabilities or offer services in multiple parts of the payment processing value chain. We provide solutions across the payment processing value chain as a merchant acquirer, payment network, and as an issuer processor, primarily by utilizing our U.S. technology platform to enable our clients to easily access a broad range of payment processing services as illustrated below:
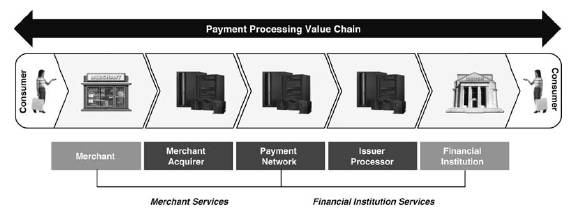
The payment processing value chain encompasses three key types of processing:
• | Merchant Acquiring Processing. Merchant acquiring processors sell electronic payment acceptance, processing and supporting services to merchants and third-party resellers. These processors route transactions originated by |
7
consumer transactions with the merchant, including in omni-channel environments that span point-of-sale, ecommerce and mobile devices, to the appropriate payment networks for authorization, known as “front-end” processing, and then ensure that each transaction is appropriately cleared and settled into the merchant’s bank account, known as “back-end” processing. Many of these processors also provide specialized reporting, back office support, risk management and other value-added services to merchants. Merchant acquirers charge merchants based on a percentage of the value of each transaction or on a per transaction basis. Merchant acquirers pay the payment network processors a routing fee per transaction and pass through interchange fees to the issuing financial institution.
• | Payment Network Processing. Payment network processors, such as Visa, Mastercard and PIN debit payment networks, sell electronic payment network routing and support services to financial institutions that issue cards and merchant acquirers that provide transaction processing. Depending on their market position and network capabilities, these providers route credit, debit and prepaid card transactions from merchant acquiring processors to the financial institution that issued the card, and they ensure that the financial institution’s authorization approvals are routed back to the merchant acquiring processor and that transactions are appropriately settled between the merchant’s bank and the card-issuing financial institution. These providers also provide specialized risk management and other value-added services to financial institutions. Payment networks charge merchant acquiring processors and issuing financial institutions routing fees per transaction and monthly or annual maintenance fees and assessments. |
• | Issuer Card Processing. Issuer card processors sell electronic payment issuing, processing and supporting services to financial institutions. These providers authorize transactions received from the payment networks and ensure that each transaction is appropriately cleared and settled from the originating card account. These companies also provide specialized program management, reporting, outsourced customer service, back office support, risk management and other value-added services to financial institutions. Card processors charge issuing financial institutions fees based on the number of transactions processed and the number of cards that are managed. |
Emerging Trends and Opportunities in the Payment Processing Industry
The payment processing industry will continue to adopt new technologies, develop new products and services, evolve new business models and experience new market entrants and changes in the regulatory environment. In the near-term, as merchants and financial institutions seek services that help them enhance their own offerings to consumers, including acceptance and issuance of Europay-Mastercard-Visa (EMV) chip-based cards, other security and fraud management services, information services, and support for omni-commerce environments, we believe that payment processors may seek to develop additional capabilities and expand across the payment processing value chain to meet these demands and capture additional data and provide additional value per transaction. To facilitate this expansion and deliver more robust service offerings, we believe that payment processors will need to develop greater control over and integration of their technology platforms, to enable them to deliver and differentiate their offerings from other providers.
We believe that emerging, alternative electronic payment technologies will be adopted by merchants and other businesses. As a result, non-financial institution enterprises, such as mobile payment providers, internet, retail and social media companies, could become more active participants in the development of these alternative electronic payment technologies and facilitate the convergence of retail, online, mobile and social commerce applications, representing an attractive growth opportunity for the industry. We believe that payment processors that have an integrated business, provide solutions across the payment processing value chain and utilize broad distribution capabilities will be best positioned to provide processing services for emerging alternative electronic payment technologies and to successfully partner with new market entrants.
8
Competition
Merchant Services
Our competitors include financial institutions and well-established payment processing companies, including Bank of America Merchant Services, Chase Paymentech Solutions, Elavon Inc. (a subsidiary of U.S. Bancorp), First Data Corporation, Global Payments, Inc., and Total System Services, Inc. in our Merchant Services segment. Furthermore, we are facing new competitive pressure from non-traditional payments processors and other parties entering the payments industry, such as PayPal, Google, Apple, Alibaba, Amazon, Square, Stripe and Adyen who may compete in one or more of the functions performed in processing merchant transactions. The most significant competitive factors in this segment are price, breadth of features and functionality, data security, system performance and reliability, scalability, service capability and brand.
Financial Institution Services
In our Financial Institution Services segment, competitors include Fidelity National Information Services, Inc., First Data Corporation, Fiserv, Inc., Total System Services, Inc. and Visa Debit Processing Service. In addition to competition with direct competitors, we also compete with the capabilities of many larger potential clients to conduct their key payment processing applications in-house. The most significant competitive factors in this segment are price, system performance and reliability, breadth of services and functionality, data security, scalability, flexibility of infrastructure and servicing capability.
Our Strategy
We plan to grow our business over the course of the next few years, depending on market conditions, by continuing to execute on the following four key strategies:
• | Invest in and leverage our integrated business model and technology platform to strengthen and protect our core business; |
• | Broaden and deepen our distribution channels to grow our merchant and financial institutions client base; |
• | Differentiate through value-added services that address evolving client demands and provide additional cross-selling opportunities, including security and fraud management, information services, ease of connection and delivery, and support for omni-channel environments; and |
• | Enter new geographic markets through strategic partnerships or acquisitions that enhance our distribution channels, client base, and service capabilities. |
Financial Highlights
Revenue for the year ended December 31, 2017, increased 13% to $4,026.5 million from $3,579.0 million in 2016. Income from operations for the year ended December 31, 2017, decreased 8% to $521.5 million from $568.5 million in 2016. Net income for the year ended December 31, 2017, decreased 35% to $182.7 million from $280.9 million in 2016. Net income attributable to Worldpay, Inc. for the year ended December 31, 2017, decreased 39% to $130.1 million from $213.2 million in 2016.
The following tables provide a summary of the results for our two segments, Merchant Services and Financial Institution Services, for the years ended December 31, 2017, 2016 and 2015.
Year Ended December 31, | |||||||||||
2017 | 2016 | 2015 | |||||||||
(dollars in thousands) | |||||||||||
Merchant Services | |||||||||||
Total revenue | $ | 3,567,533 | $ | 3,082,951 | $ | 2,656,906 | |||||
Network fees and other costs | 1,780,179 | 1,537,072 | 1,321,312 | ||||||||
Net revenue | 1,787,354 | 1,545,879 | 1,335,594 | ||||||||
Sales and marketing | 646,479 | 557,942 | 478,736 | ||||||||
Segment profit | $ | 1,140,875 | $ | 987,937 | $ | 856,858 | |||||
Non-financial data: | |||||||||||
Transactions (in millions) | 22,747 | 20,955 | 18,959 | ||||||||
9
Year Ended December 31, | |||||||||||
2017 | 2016 | 2015 | |||||||||
(dollars in thousands) | |||||||||||
Financial Institution Services | |||||||||||
Total revenue | $ | 458,944 | $ | 496,040 | $ | 503,032 | |||||
Network fees and other costs | 122,986 | 137,158 | 156,890 | ||||||||
Net revenue | 335,958 | 358,882 | 346,142 | ||||||||
Sales and marketing | 23,027 | 24,309 | 25,213 | ||||||||
Segment profit | $ | 312,931 | $ | 334,573 | $ | 320,929 | |||||
Non-financial data: | |||||||||||
Transactions (in millions) | 3,542 | 4,018 | 4,032 | ||||||||
Refer to “Item 7 - Management’s Discussion and Analysis of Financial Condition and Results of Operations” for more details.
Regulation
The financial services regulatory regime affects our operations and costs. The financial services industry is highly regulated under U.S. and non-U.S. law. Federal, state, local and foreign statutes, regulations, policies and guidance are continually under review by governmental authorities. Changes in the regulatory regime, including changes in how they are interpreted, implemented or enforced, could have a material adverse effect on our business. Violations or perceived weaknesses in compliance or internal controls may result in civil or criminal enforcement action; suspension or revocation of licenses or registrations; limitation, suspension or termination of services; civil or criminal penalties, such as fines; and reputational harm. In addition to governmental regulation, certain of our services are subject to rules set by various payment networks, such as Visa and Mastercard. Many of these aspects of the regulatory regime are described in more detail below.
Licensing and Registration in Multiple Jurisdictions
Our regulatory environment varies from jurisdiction to jurisdiction. In some U.S. and non-U.S. jurisdictions, we are required to obtain and maintain various licenses and registrations to conduct our business. For example, in the United States, we are authorized in multiple U.S. states to engage in debt administration and debt collection activities on behalf of some of our card issuing financial institution clients through calls and letters to the debtors in those states. Our international operations and subsidiaries are subject to a range of licensing, registration and regulatory requirements under U.K., Dutch, European Union and other non-U.S. regulatory regimes. We may seek, or be required to obtain, licenses or registrations in other jurisdictions based on changes in our business or the applicable regulatory regime.
As a licensed or registered provider of financial services, we are subject to the exercise of discretionary supervisory, regulatory and enforcement powers by numerous U.S. and non-U.S. regulatory authorities. Licensing and regulatory authorities can require, among other things, the provision of detailed information covering our management, business plan, products and services, compliance, internal controls, ownership structure and financial performance. Regulators and other governmental authorities have a range of enforcement powers in the event that we fail to comply with applicable laws and regulations or do not meet their guidance or supervisory expectations.
Dodd-Frank Act
The Dodd-Frank Wall Street Reform and Consumer Protection Act of 2010 (Dodd-Frank Act) made significant structural and other changes to the regulation of the U.S. financial services industry. Those changes included important provisions affecting credit card and debit transactions.
The Dodd-Frank Act allows merchants to set minimum dollar amounts (not to exceed $10) for the acceptance of a credit card (and allows federal governmental entities and institutions of higher education to set maximum amounts for the acceptance of credit cards). The Dodd-Frank Act also allows merchants to provide discounts or incentives to entice consumers to pay with cash, checks, debit cards or credit cards, as the merchant prefers.
In addition, the “Durbin Amendment” to the Dodd-Frank Act provided that interchange fees that a card issuer or payment network receives or charges for debit transactions are now regulated by the Federal Reserve and must be “reasonable
10
and proportional” to the cost incurred by the card issuer in authorizing, clearing and settling the transaction. The Durbin Amendment also contains prohibitions on network exclusivity and merchant routing restrictions.
Consumer Protection Laws and the Consumer Financial Protection Bureau
Our business is subject to a wide range of consumer protection laws. For example, we are also subject to the Fair Debt Collection Practices Act and similar state laws in connection with our credit card processing business. In addition, the Dodd-Frank Act established the Consumer Financial Protection Bureau (CFPB) to regulate consumer financial services, including many of the types of services offered by our clients. We are subject to regulation and enforcement by the CFPB because we are a service provider to insured depository institutions with assets of $10 billion or more in connection with their consumer financial products and to entities that are larger participants in markets for consumer financial products and services such as prepaid cards. CFPB rules, examinations and enforcement actions may require us to adjust our activities and may increase our compliance costs. In addition to rulemaking authority over several enumerated federal consumer financial protection laws, the CFPB is authorized to issue rules prohibiting unfair, deceptive or abusive acts or practices by persons offering consumer financial products or services and those, such as us, who are service providers to such persons, and has authority to enforce these consumer financial protection laws and CFPB rules.
Banking Regulation
Although we are not a bank, the U.S. bank regulatory regime affects our business because we provide services to banks. Banking regulators are authorized to examine, supervise and bring enforcement action against nonbank companies that perform services for U.S. banks. Because we provide data processing and other services to U.S. banks and financial institutions, we are subject to regular oversight and examination by the Federal Financial Institutions Examination Council (FFIEC). The FFIEC is an interagency body of the Federal Deposit Insurance Corporation, the Office of the Comptroller of the Currency, the Board of Governors of the Federal Reserve (Federal Reserve), the National Credit Union Administration and the CFPB. We are also subject to review under state laws and rules governing the provision of services to U.S. banks and other financial institutions, including electronic data processing, back-office services, and use of consumer information. In addition, independent auditors annually review several of our operations to provide reports on internal controls for our clients’ auditors and regulators. Our failure to comply with applicable laws and regulations, or to meet supervisory expectations, may result in adverse action against us by regulators or by the financial institutions to which we provide services.
Our business may also be affected by banking regulation because Fifth Third Bank is an investor in us. Fifth Third Bank is a state-chartered bank and a member of the Federal Reserve System. Fifth Third Bank is regulated, examined and supervised by the Ohio Division of Financial Institutions (ODFI) and the Federal Reserve. Fifth Third Bank is an indirect subsidiary of Fifth Third Bancorp, which is a bank holding company regulated, examined and supervised by the Federal Reserve under the Bank Holding Company Act of 1956 (BHC Act). Depending on the facts and circumstances, a company in which a bank or bank holding company owns equity securities may be subject to banking regulation, supervision, examination and enforcement.
Following our acquisition of Legacy Worldpay, Fifth Third Bank owns less than 5% of our voting securities. At this ownership level, Fifth Third Bank is presumed not to "control" us under the statutory terms of the BHC Act. Neither the ODFI nor the Federal Reserve required us to obtain any approval, or otherwise acted to prevent, our acquisition of Legacy Worldpay. Nevertheless, in the future or in connection with other initiatives, the ODFI or Federal Reserve could assert that Fifth Third Bank's investment in, or other relationships with, us impose limitations, conditions or approval requirements under banking laws that affect our activities, investments or acquisitions. The imposition of such limitations, conditions or approval requirements could have an adverse impact on our business, such as by preventing us from pursuing an otherwise attractive acquisition or business opportunity.
In connection with our acquisition of Legacy Worldpay, we agreed with Fifth Third Bank and Fifth Third Bancorp to amend the prior framework by which we would address such circumstances. That agreed framework is set forth in the Second Amended and Restated Limited Liability Company Agreement of Vantiv Holding, LLC, as amended by that certain Transaction Agreement, dated August 7, 2017, by and among the Company, Vantiv Holding, Fifth Third Bank and Fifth Third Bancorp (the Vantiv Holding LLC Agreement). Among other things, we must notify Fifth Third Bank before we engage in any business activity (by acquisition, investment, organic growth or otherwise) that may reasonably require Fifth Third Bank or an affiliate of Fifth Third Bank to obtain regulatory approval, so that Fifth Third Bank can consider the legal permissibility of the activity and any required regulatory approvals, and we and Fifth Third Bank must use our respective reasonable best efforts to obtain any such regulatory approvals if we determine to pursue the business activity. The Vantiv Holding LLC Agreement also includes provisions to address circumstances where any such required regulatory approval is not obtained.
11
Association and Network Rules
We are subject to the network rules of Visa, Mastercard and other payment networks. The payment networks routinely update and modify their requirements. On occasion, we have received notices of non-compliance and fines, which have typically related to excessive chargebacks by a merchant or data security failures. Although these network rules are not government regulations, our failure to comply with the networks’ requirements or to pay the fines they impose could cause the termination of our registration and require us to stop providing payment processing services.
Privacy and Information Security Regulations
We provide services that may be subject to privacy laws and regulations of a variety of U.S. and non-U.S. jurisdictions. These laws and regulations restrict the collection, processing, storage, use and disclosure of personal information, require notice to individuals of privacy practices and provide individuals with certain rights to prevent the use and disclosure of protected information. These laws also impose requirements for safeguarding and proper destruction of personal information through the issuance of data security standards or guidelines. For example, relevant U.S. federal privacy laws include the Gramm-Leach-Bliley Act of 1999, which applies directly to a broad range of financial institutions and indirectly, or in some instances directly, to companies that provide services to financial institutions. In addition, there are state laws restricting the ability to collect and utilize certain types of information such as Social Security and driver’s license numbers. U.S. federal and state and non-U.S. laws also impose privacy and data security requirements, which can include obligations to provide notification of security breaches of computer databases that contain personal information to affected individuals, officers and consumer reporting agencies and businesses and governmental agencies that own data.
Anti-Money Laundering and Counter Terrorist Regulation
Our business is subject to U.S. and non-U.S. laws governing anti-money laundering and counter-terrorist financing. For example, U.S. federal anti-money laundering laws include the Bank Secrecy Act, as amended by the USA PATRIOT Act of 2001, which we refer to collectively as the BSA. The BSA requires, among other things, money services businesses to develop and implement risk-based anti-money laundering programs, report large cash transactions and suspicious activity and maintain transaction records. We are also subject to certain economic and trade sanctions programs that are administered by the Treasury Department’s Office of Foreign Assets Control, or OFAC, that prohibit or restrict transactions to or from or dealings with specified countries, their governments and, in certain circumstances, their nationals, narcotics traffickers, and terrorists or terrorist organizations, as well as similar anti-money laundering, counter terrorist financing and proceeds of crime laws applicable to movements of currency and payments through electronic transactions and to dealings with certain specified persons. We continually develop new compliance programs and enhance existing ones to monitor and address legal and regulatory requirements and developments, including with respect to anti-money laundering and counter-terrorist financing.
Federal Trade Commission Act and Other Laws Impacting Our and our Customers’ Business
All persons engaged in commerce, including, but not limited to, us and our merchant and financial institution customers are subject to Section 5 of the Federal Trade Commission Act prohibiting unfair or deceptive acts or practices, or UDAP. In addition, there are other laws, rules and or regulations, including the Telemarketing Sales Act and the Unlawful Internet Gambling Enforcement Act of 2006, that may directly impact the activities of our merchant customers and in some cases may subject us, as the merchant’s payment processor, to litigation, investigations, fees, fines and disgorgement of funds in the event we are deemed to have aided and abetted or otherwise provided the means and instrumentalities to facilitate the illegal activities of the merchant through our payment processing services. Various federal and state regulatory enforcement agencies including the Federal Trade Commission, or FTC, and the states’ attorneys general have authority to take action against nonbanks that engage in UDAP or violate other laws, rules and regulations.
Prepaid Services
Prepaid card programs managed by us are subject to various federal and state laws and regulations, which may include laws and regulations related to consumer and data protection, licensing, consumer disclosures, escheat, anti-money laundering, banking, trade practices and competition and wage and employment. For example, most states require entities engaged in money transmission in connection with the sale of prepaid cards to be licensed as a money transmitter with, and subject to examination by, that jurisdiction’s banking department. In the future, we may have to obtain state licenses to expand our distribution network for prepaid cards, which licenses we may not be able to obtain. Furthermore, the Credit Card Accountability Responsibility and Disclosure Act of 2009 and the Federal Reserve’s Regulation E impose requirements on general-use prepaid cards, store gift cards and electronic gift certificates. These laws and regulations are sometimes inconsistent
12
and subject to judicial and regulatory challenge and interpretation, and therefore the extent to which these laws and rules have application to, and their impact on, us, financial institutions, merchants or others could change. Prepaid services may also be subject to the rules and regulations of Visa, Mastercard and other payment networks with which we and the card issuers do business. The programs in place to process these products generally may be modified by the payment networks in their discretion and such modifications could also impact us, financial institutions, merchants and others. We are also registered with the Financial Crimes Enforcement Network of the U.S. Department of the Treasury, or FinCEN, as a “money services business-provider of prepaid access.”
Other
We are subject to the Housing Assistance Tax Act of 2008, which requires information returns to be made for each calendar year by merchant acquiring entities. In addition, we are subject to U.S. federal and state unclaimed or abandoned property (escheat) laws in the United States which require us to turn over to certain government authorities the property of others we hold that has been unclaimed for a specified period of time such as account balances that are due to a merchant following discontinuation of its relationship with us.
The foregoing list of laws and regulations to which we are subject is not exhaustive, and the regulatory framework governing our operations changes continuously. The enactment of new laws and regulations may increasingly affect the operation of our business, directly and indirectly, which could result in substantial regulatory compliance costs, litigation expense, adverse publicity, the loss of revenue and decreased profitability.
Intellectual Property
We rely on a combination of intellectual property laws, confidentiality procedures and contractual provisions to protect our proprietary technology and our brand. We have registered, and applied for the registration of, U.S. and international trademarks, service marks, and domain names. Additionally, we own U.S. patents and have filed U.S. patent applications covering certain of our proprietary technology relating to payment solutions, transaction processing and other matters. Over time, we have assembled and continue to assemble a portfolio of patents, trademarks, service marks, copyrights, domain names and trade secrets covering our products and services. Intellectual property is a component of our ability to be a leading payment services provider and any significant impairment of, or third-party claim against, our intellectual property rights could harm our business or our ability to compete.
Employees
As of December 31, 2017, we had 3,661 employees. As of December 31, 2017, this included 928 Merchant Services employees, 85 Financial Institution Services employees, 931 IT employees, 1,117 Operations employees, and 600 general and administrative employees. None of our employees are represented by a collective bargaining agreement. We believe that relations with our employees are good.
Corporate Information
We are a Delaware corporation incorporated on March 25, 2009. We completed our initial public offering in March 2012 and our Class A common stock is listed on the New York Stock Exchange under the symbol “WP” and as of January 16, 2018, on the London Stock Exchange via a secondary standard listing under the symbol “WPY.” Our principal executive offices are located at 8500 Governor’s Hill Drive, Symmes Township, Ohio 45249, and our telephone number is (513) 900-4811. Our website address is www.worldpay.com.
Available Information
We are subject to the informational requirements of the Securities Exchange Act of 1934 and file or furnish reports, proxy statements, and other information with the U.S. Securities and Exchange Commission, or SEC. You can read our SEC filings over the Internet at the SEC’s website at www.sec.gov. Our filings with the SEC, including our Annual Report on Form 10-K, Quarterly Reports on Form 10-Q, Current Reports on Form 8-K, and any amendments to those reports, also are available free of charge on the investors section of our website at http://investors.worldpay.com when such reports are available on the SEC’s website. Further corporate governance information, including our certificate of incorporation, bylaws, governance guidelines, board committee charters, and code of business conduct and ethics, is also available on the investors section of our website.
You may also read and copy any document we file with the SEC at its public reference facilities at 100 F Street, NE, Room 1580, Washington, DC 20549. You may also obtain copies of the documents at prescribed rates by writing to the Public
13
Reference Section at the SEC at 100 F Street, NE, Room 1580, Washington, DC 20549. Please call the SEC at 1-800-SEC-0330 for further information on the operation of the public reference facilities. The contents of the websites referred to above are not incorporated into this filing or in any other report or document we file with the SEC, and any references to these websites are intended to be inactive textual references only.
14
Item 1A. Risk Factors
Our business is subject to numerous risks. You should carefully consider the following risk factors and all other information contained in this Annual Report on Form 10-K and in our other filings with the SEC. Any of these risks could adversely affect our business, results of operations, financial condition and prospects.
Risks Related to Our Business
If we cannot keep pace with rapid developments, changes and consolidation occurring in our industry and provide new services to our clients, the use of our services could decline, reducing our revenues.
The electronic payments market in which we operate is characterized by rapid technological change, new product and service introductions, including ecommerce services, mobile payment applications, and prepaid services, evolving industry standards, changing customer and consumer needs, the entrance of non-traditional competitors and periods of increased consolidation. In order to remain competitive in this rapidly evolving market, we are continually involved in a number of projects to develop new and innovative services. These projects carry risks, such as cost overruns, delays in delivery, performance problems and lack of market acceptance of new or innovated services. Any delay in the delivery of new services or the failure to differentiate our services or to accurately predict and address market demand could render our services less desirable, or even obsolete, to our clients.
In addition, the new or innovated services we develop are designed to process very complex transactions and provide information on those transactions, all at very high volumes and processing speeds. Any failure to deliver reliable, effective and secure services that meet the expectations of our clients could result in increased costs and/or a loss in business and revenues that could reduce our earnings. If we are unable to develop, adapt to or access technological changes or evolving industry standards on a timely and cost effective basis, our business, financial condition and results of operations would be materially adversely affected.
The payment processing industry is highly competitive. Such competition could adversely affect the transaction and other fees we receive from merchants and financial institutions, and as a result, our margins, business, financial condition and results of operations.
Our competitors include financial institutions and well-established payment processing companies, including Bank of America Merchant Services, Chase Paymentech Solutions, Elavon Inc. (a subsidiary of U.S. Bancorp), First Data Corporation, Global Payments, Inc., and Total System Services, Inc. in our Merchant Services segment, and Fidelity National Information Services, Inc., First Data Corporation, Fiserv, Inc., Total System Services, Inc. and Visa Debit Processing Service in our Financial Institution Services segment. With respect to our Financial Institutions Services segment, in addition to competition with direct competitors, we also compete with the capabilities of many larger potential clients to conduct their key payment processing applications in-house.
In addition, our competitors that are financial institutions or are affiliated with financial institutions may not incur the sponsorship costs we incur for registration with the payment networks. Accordingly, these competitors may be able to offer more attractive fees to our current and prospective clients or other services that we do not provide. Competition could result in a loss of existing clients, and greater difficulty attracting new clients. Furthermore, if competition causes us to reduce the fees we charge in order to attract or retain clients, there is no assurance we can successfully control our costs in order to maintain our profit margins. One or more of these factors could have a material adverse effect on our business, financial condition and results of operations.
Furthermore, we are facing new competitive pressure from non-traditional payments processors and other parties entering the payments industry, such as PayPal, Google, Apple, Alibaba, Amazon, Square, Stripe and Adyen, who may compete in one or more of the functions performed in processing merchant transactions. These companies have significant financial resources and robust networks and are highly regarded by consumers. If these companies gain a greater share of total electronic payments transactions or if we are unable to successfully react to changes in the industry spurred by the entry of these new market participants, it could have a material adverse effect on our business, financial condition and results of operations.
Unauthorized disclosure of data, whether through cybersecurity breaches, computer viruses or otherwise, could expose us to liability, protracted and costly litigation and damage our reputation.
We have responsibility for certain third parties, including merchants, ISOs, third party service providers and other agents, which we refer to collectively as associated participants, under Visa, Mastercard and other payment network rules and
15
regulations. We and certain of our associated participants process, store and/or transmit sensitive data, such as names, addresses, social security numbers, credit or debit card numbers, driver’s license numbers and bank account numbers, and we have ultimate liability to the payment networks and member financial institutions that register us with Visa, Mastercard and other payment networks for our failure or the failure of our associated participants to protect this data in accordance with payment network requirements. The loss of merchant or cardholder data by us or our associated participants could result in significant fines and sanctions by the payment networks or governmental bodies. A significant cybersecurity breach could also result in payment networks prohibiting us from processing transactions on their networks or the loss of our financial institution sponsorship that facilitates our participation in the payment networks, which would have a material adverse effect on our business, financial condition and results of operations.
These concerns about security are increased when we transmit information over the Internet. The techniques used to obtain unauthorized access, disable or degrade service or sabotage systems change frequently and are often difficult to detect. We and our associated participants have been in the past and could be in the future, subject to breaches of security by hackers. In such circumstances, our encryption of data and other protective measures have not prevented and may not prevent unauthorized access service disruption or system sabotage. Although we have not incurred material losses or liabilities as a result of security breaches we or our associated participants have experienced, any future breach of our system or an associated participant could be material and harm our reputation, deter clients and potential clients from using our services, increase our operating expenses, expose us to uninsured losses or other liabilities, increase our risk of regulatory scrutiny, subject us to lawsuits, result in material penalties and fines under state and federal laws or by the payment networks, and adversely affect our continued payment network registration and financial institution sponsorship.
We cannot assure you that our arrangements with associated participants will prevent the unauthorized use or disclosure of data or that we would be reimbursed by associated participants in the event of unauthorized use or disclosure of data. Any such unauthorized use or disclosure of data could result in protracted and costly litigation, which could have a material adverse effect on our business, financial condition and results of operations.
Our systems and our third party providers’ systems may fail or become obsolete due to not keeping pace with technology changes or factors beyond our control, which could interrupt our service, cause us to lose business and increase our costs.
We depend on the efficient and uninterrupted operation of numerous systems, including our computer systems, software, data centers and telecommunications networks, as well as the systems of third parties, in order to provide services to our clients. Our systems and operations and those of our third party providers, could be exposed to damage or interruption from, among other things, fire, natural disaster, power loss, telecommunications failure, unauthorized entry, security breach, computer viruses, defects and development delays. Our property and business interruption insurance may not be adequate to compensate us for all losses or failures that may occur. Defects in our systems or those of third parties, errors or delays in the processing of payment transactions, telecommunications failures or other difficulties could result in loss of revenues and clients, reputational harm, additional operating expenses in order to remediate the failures, fines imposed by payment networks and exposure to other losses or other liabilities.
We may not be able to continue to expand our share of the existing payment processing markets or expand into new markets which would inhibit our ability to grow and increase our profitability.
Our future growth and profitability depend upon the growth of the markets in which we currently operate and our ability to increase our penetration and service offerings within these markets, as well as the emergence of new markets for our services and our ability to penetrate these new markets. It is difficult to attract new clients because of potential disadvantages associated with switching payment processing vendors, such as transition costs, business disruption and loss of accustomed functionality. We seek to overcome these factors by making investments to enhance the functionality of our software and differentiate our services. However, there can be no assurance that our efforts will be successful, and this resistance may adversely affect our growth.
Our expansion into new markets is also dependent upon our ability to adapt our existing technology and offerings or to develop new or innovative applications to meet the particular service needs of each new market. In order to do so, we will need to anticipate and react to market changes and devote appropriate financial and technical resources to our development efforts, and there can be no assurance that we will be successful in these efforts.
Furthermore, in response to market developments, we may continue to expand into new geographical markets and foreign countries in which we do not currently have any operating experience. We cannot assure you that we will be able to successfully continue such expansion efforts due to our lack of experience and the multitude of risks associated with global operations or lack of appropriate regulatory approval.
16
Any acquisitions, partnerships or joint ventures that we make could disrupt our business and harm our financial condition.
Acquisitions, partnerships and joint ventures are part of our growth strategy. We evaluate, and expect in the future to evaluate potential strategic acquisitions of, and partnerships or joint ventures with, complementary businesses, services or technologies. However, we may not be able to successfully identify suitable acquisition, partnership or joint venture candidates in the future. In addition, bank regulators may assert that an acquisition or other corporate initiative is inconsistent with applicable banking laws and regulations or is subject to limitations or approval requirements. Such limitations or approval requirements could limit our ability to acquire other businesses or enter into other strategic transactions.
If we do enter into acquisitions, partnerships and joint ventures, they may not provide us with the benefits we anticipate. We may not be able to successfully integrate any businesses, services or technologies that we acquire or with which we form a partnership or joint venture, or comply with applicable regulatory requirements. Furthermore, the integration of any acquisition, including our recent acquisitions, may divert management’s time and resources from our core business and disrupt our operations. Certain partnerships and joint ventures we make may also prevent us from competing for certain clients or in certain lines of business. To the extent we pay the purchase price of any acquisition in cash, it would reduce our cash reserves, and to the extent the purchase price is paid with our stock, it could be dilutive to our stockholders. To the extent we pay the purchase price with proceeds from the incurrence of debt, it would increase our already high level of indebtedness and could negatively affect our liquidity and restrict our operations.
If we fail to comply with the applicable requirements of the Visa, Mastercard or other payment networks, those payment networks could seek to fine us, suspend us or terminate our registrations through our financial institution sponsors. Fines could have a material adverse effect on our business, financial condition or results of operations, and if these registrations are terminated, we may not be able to conduct our business.
In order to provide our transaction processing services, we are registered through our bank sponsorships with the Visa, Mastercard and other payment networks as service providers for member institutions. We and many of our clients are subject to payment network rules. If we or our associated participants do not comply with the payment network requirements, the payment networks could seek to fine us, suspend us or terminate our registrations. We have occasionally received notices of noncompliance and fines, which have typically related to excessive chargebacks by a merchant or data security failures on the part of a merchant. If we are unable to recover fines from or pass through costs to our merchants or other associated participants, we would experience a financial loss. The termination of our registration, or any changes in the payment network rules that would impair our registration, could require us to stop providing payment network services to the Visa, Mastercard or other payment networks, which would have a material adverse effect on our business, financial condition and results of operations.
Changes in payment network rules or standards could adversely affect our business, financial condition and results of operations.
Payment network rules are established and changed from time to time by each payment network as they may determine in their sole discretion and with or without advance notice to their participants. In some cases, payment networks compete with us, and their ability to modify and enhance their rules in their sole discretion may provide them an advantage in selling or developing their own services that may compete directly or indirectly with our services. Any changes in payment network rules or standards or the way they are implemented could increase our cost of doing business or limit our ability to provide transaction processing services to or through our clients and have a material adverse effect on our business, financial condition and results of operations.
If we cannot pass along to our merchants increases in interchange and other fees from payment networks, our operating margins would be reduced.
We pay interchange, assessment, transaction and other fees set by the payment networks to the card issuing financial institution and the payment networks for each transaction we process. From time to time, the payment networks increase the interchange fees and other fees that they charge payment processors and the financial institution sponsors. At their sole discretion, our financial institution sponsors have the right to pass any increases in interchange and other fees on to us and they have consistently done so in the past. We are generally permitted under the contracts into which we enter, and in the past we have been able to, pass these fee increases along to our merchants through corresponding increases in our processing fees. However, if we are unable to pass through these and other fees in the future, it could have a material adverse effect on our business, financial condition and results of operations.
17
If our agreements with financial institution sponsors and clearing service providers to process electronic payment transactions are terminated or otherwise expire and we are unable to renew existing or secure new sponsors or clearing service providers, we will not be able to conduct our business.
The Visa, Mastercard and other payment network rules require us to be sponsored by a member bank in order to process electronic payment transactions. Because we are not a bank, we are unable to directly access these payment networks. We are currently registered with the Visa, Mastercard and other payment networks through Fifth Third Bank and other sponsor banks. Our current agreement with Fifth Third Bank expires in December 2024. These agreements with Fifth Third Bank and other sponsors give them substantial discretion in approving certain aspects of our business practices, including our solicitation, application and qualification procedures for merchants and the terms of our agreements with merchants. Our financial institution sponsors’ discretionary actions under these agreements could have a material adverse effect on our business, financial condition and results of operations. We also rely on Fifth Third Bank and various other financial institutions to provide clearing services in connection with our settlement activities. Without these sponsorships or clearing services agreements, we would not be able to process Visa, Mastercard and other payment network transactions or settle transactions which would have a material adverse effect on our business, financial condition and results of operations. Furthermore, our financial results could be adversely affected if our costs associated with such sponsorships or clearing services agreements increase.
Increased merchant, financial institution or referral partner attrition and decreased transaction volume could cause our revenues to decline.
We experience attrition and declines in merchant and financial institution credit, debit or prepaid card processing volume resulting from several factors, including business closures, consolidations, loss of accounts to competitors, account closures that we initiate due to heightened credit risks, and reductions in our merchants’ sales volumes. Our referral partners, many of which are not exclusive, such as merchant banks, ISVs, VARs, payment facilitators, ISOs and trade associations are contributors to our revenue growth in our Merchant Services segment. If an ISO or referral partner switches to another transaction processor, shuts down or becomes insolvent, we will no longer receive new merchant referrals from the ISO or referral partner, and we risk losing existing merchants that were originally enrolled by the ISO or referral partner. We cannot predict the level of attrition and decreased transaction volume in the future and our revenues could decline as a result of higher than expected attrition, which could have a material adverse effect on our business, financial condition and results of operations.
We are subject to economic and political risk, the business cycles and credit risk of our clients and the overall level of consumer, business and government spending, which could negatively impact our business, financial condition and results of operations.
The electronic payments industry depends heavily on the overall level of consumer, business and government spending. We are exposed to general economic conditions that affect consumer confidence, consumer spending, consumer discretionary income or changes in consumer purchasing habits. A sustained deterioration in general economic conditions, particularly in the United States, or increases in interest rates may adversely affect our revenues by reducing the number or average purchase amount of transactions made using electronic payments that we process. Furthermore, if economic conditions cause credit card issuers to tighten credit requirements, the negative effects on the use of electronic payments could be exacerbated. Since we have a certain amount of fixed and semi-fixed costs, including rent, debt service, processing contractual minimums and salaries, our ability to quickly adjust costs and respond to changes in our business and the economy is limited. As a result, changes in economic conditions could adversely impact our future revenues and profits.
In addition, a sustained deterioration in economic conditions could affect our merchants through a higher rate of closures or bankruptcies, resulting in lower revenues and earnings for us. In addition, our merchants and other associated participants are liable for any charges properly reversed by the card issuer on behalf of the cardholder and for any fines or penalties that may be assessed by payment networks. In the event that we are not able to collect such amounts from the associated participants, due to closure, insolvency or other reasons, we may be liable for any such charges.
Fraud by merchants or others could have a material adverse effect on our business, financial condition and results of operations.
We face potential liability for fraudulent electronic payment transactions initiated by merchants or other associated participants. Examples of merchant fraud include when a merchant or other party knowingly accepts payment by a stolen or counterfeit credit, debit or prepaid card, card number or other credentials records a false sales transaction utilizing a stolen or counterfeit card or credentials, processes an invalid card, or intentionally fails to deliver the merchandise or services sold in an
18
otherwise valid transaction. In the event a dispute between a cardholder and a merchant is not resolved in favor of the merchant, the transaction is normally charged back to the merchant and the purchase price is credited or otherwise refunded to the cardholder. Failure to effectively manage risk and prevent fraud would increase our chargeback liability or other liability. In addition, beginning October 2015, merchants that cannot process EMV chip-based cards are held financially responsible for certain fraudulent transactions conducted using such cards. This will likely increase the amount of risk for merchants who are not yet EMV-compliant and could result in us having to seek increased chargebacks from such merchants. Increases in chargebacks or other liability could have a material adverse effect on our business, financial condition and results of operations.
A decline in the use of credit, debit or prepaid cards as a payment mechanism for consumers or adverse developments with respect to the payment processing industry in general could have a materially adverse effect on our business, financial condition and results of operations.
If consumers do not continue to use credit, debit or prepaid cards as a payment mechanism for their transactions or if there is a change in the mix of payments between cash, alternative currencies and technologies, credit, debit and prepaid cards, or the corresponding methodologies used for each, which is adverse to us, it could have a materially adverse effect on our business, financial condition and results of operations. Moreover, if there is an adverse development in the payments industry in general, such as new legislation or regulation that makes it more difficult for our clients to do business, our business, financial condition and results of operations may be adversely affected.
If Fifth Third Bank fails or is acquired by a third party, it could place certain of our material contracts at risk, decrease our revenue, and transfer the ultimate voting power of Fifth Third Bank’s stock ownership in us (including any shares of Class A common stock that may be issued in exchange for Fifth Third Bank’s units in Vantiv Holding) to a third party.
Fifth Third Bank accounted for less than 2% of our revenue during the year ended December 31, 2017 and is the provider of the services under our Clearing, Settlement and Sponsorship Agreement, Referral Agreement and Master Services Agreement. If Fifth Third Bank were to be placed into receivership or conservatorship, it could jeopardize our ability to generate revenue and conduct our business.
If Fifth Third Bank were to be acquired by a third party, it could affect certain of our contractual arrangements with them. For instance, in the event of a change of control or merger of Fifth Third Bank, our Clearing, Settlement and Sponsorship Agreement and our Referral Agreement provide that Fifth Third Bank may assign the contract to an affiliate or successor, in which case we would not have the right to terminate the contract regardless of such assignee’s ability to perform such services. Our Master Services Agreement provides that Fifth Third Bank would be in default under the agreement upon a change of control, in which case we would have the right to terminate the agreement effective upon 60 days’ notice to Fifth Third Bank unless the surviving entity assumes Fifth Third Bank’s obligation and the level of fees paid to us pursuant to the Master Services Agreement remains equal or greater than fees paid to us prior to the change of control. In addition, the acquiring company may choose to terminate the terms of such contracts, requiring us to litigate if we believe such termination is not pursuant to contract terms, and find alternative clients, counterparties or sponsorships. The added expense of litigation and the inability to find suitable substitute clients or counterparties in a timely manner would have a material adverse effect on our business, financial condition and results of operations. Furthermore, such an acquisition would place in the hands of the acquiring third party the voting power of Fifth Third Bank’s stock ownership in Worldpay, Inc. (including any shares of Class A common stock that may be issued in exchange for Fifth Third Bank’s units in Vantiv Holding). We may not have a historical relationship with the acquiring party, and the acquiring party may be a competitor of ours or provide many of the same services that we provide. The acquiring party may vote its shares of our common stock or units in a manner adverse to us and our other stockholders.
Our risk management framework may not be fully effective in mitigating our risk exposure against all types of risks.
Our risk management framework seeks to mitigate risk and loss to us. We have established processes and procedures intended to identify, measure, monitor, manage and report our risks. However, as with any risk management framework, there are inherent limitations to our risk management strategies such that there could be risks that we cannot anticipate or identify. If our risk management framework were to become ineffective, we could experience unexpected losses that could have a material adverse effect on our business, financial condition or results of operations.
We and our clients are subject to extensive government regulation. Violations, perceived weaknesses in compliance or internal controls, or changes in the regulatory regime or industry standards may have an unfavorable impact on our business, financial condition, results of operations and reputation.
Our business is impacted by numerous laws, regulations, regulatory guidance and examinations that affect us and our industry, many of which are discussed under “Item 1. Business - Regulation.” The regulatory regime is evolving and subject to
19
new or changing laws and regulations, as well as changes in the way exiting laws and regulations are interpreted and enforced. For example, the Dodd-Frank Wall Street Reform and Consumer Protection Act, or the Dodd-Frank Act, significantly changed the U.S. payment processing industry by restricting amounts of debit card fees that certain issuing financial institutions can charge merchants and allowing merchants to set minimum dollar amounts for the acceptance of credit cards and offer discounts for different payment methods. These and other regulatory changes on our business and industry could negatively affect our business in a variety of ways including the number of debit transactions, and prices charged per transaction.
In the future, due to applicable law and regulation, we may have to seek and obtain additional licenses in various jurisdictions. If we fail or are unable to comply with these requirements, our clients (or in certain instances, we) could be subject to the imposition of fines, other penalties or enforcement-related actions which may impact our ability to offer our credit issuer processing services, prepaid or other related services and could have a material adverse effect on our business, financial condition and results of operations.
Because our business is highly regulated, it is very important to our business that our operations, policies and procedures comply with applicable laws, regulations and related requirements. Our failure to comply with applicable laws and regulations, or our failure to adapt to changes in the regulatory regime, industry standards, or social expectations of corporate fairness, could increase our costs or result in enforcement, litigation, or other governmental action against us, which could adversely affect our business, financial condition, results of operations, and reputation.
Governmental regulations designed to protect or limit access to consumer information could adversely affect our ability to effectively provide our services to merchants.
Governmental bodies in the United States and abroad have adopted, or are considering the adoption of, laws and regulations restricting the transfer of, and requiring safeguarding of, non-public personal information. For example, in the United States, all financial institutions must undertake certain steps to ensure the privacy and security of consumer financial information. Although we have limited our use of consumer information solely to providing services to other businesses and financial institutions, we are required by regulations and contracts with our merchants and financial institution clients to provide assurances regarding the confidentiality and security of non-public consumer information. These contracts require periodic audits by independent companies regarding our compliance with industry standards and also allow for similar audits regarding best practices established by regulatory guidelines. The compliance standards relate to our infrastructure, components and operational procedures designed to safeguard the confidentiality and security of non-public consumer personal information shared by our clients with us. Our ability to maintain compliance with these standards and satisfy these audits will affect our ability to attract and maintain business in the future. If we fail to comply with these regulations or requirements, we could be exposed to suits for breach of contract or to governmental proceedings. In addition, our client relationships and reputation could be harmed, and we could be inhibited in our ability to obtain new clients. Furthermore, the EU General Data Protection Regulation (GDPR), which becomes effective in May 2018, requires companies to meet new requirements regarding the handling of personal data and substantially increases the penalties for non-compliance. Our GDPR compliance efforts could cause us to incur significant expenses, and if more restrictive privacy laws or rules are adopted by authorities in the future on the federal or state level, our compliance costs may increase, our opportunities for growth may be curtailed by our compliance capabilities or reputational harm and our potential liability for security breaches may increase, all of which could have a material adverse effect on our business, financial condition and results of operations.
We are subject to regulation, supervision, examination, and enforcement authority of banking regulators and the CFPB because we provide services to banks and other financial institutions. Our failure to comply with applicable banking laws, or our failure to meet supervisory expectations of the banking regulators or CFPB, could result in adverse regulatory action against us and limit our activities or ability to execute corporate initiatives. In addition, banking regulators could also assert that our relationship with Fifth Third Bank causes our business to be subject to limits on our activities or future corporate initiatives.
Because we provide data processing and other services to U.S. banks, we are subject to regular oversight and examination by the Federal Financial Institutions Examination Council (FFIEC), which is an inter-agency body of federal banking regulators. Because we are a service provider to insured depository institutions with assets of $10 billion or more in connection with their consumer financial products and to entities that are larger participants in markets for consumer financial products and services such as prepaid cards, we are subject to regulation and enforcement by the Consumer Financial Protection Bureau (CFPB). Our business may also be affected by banking regulation because Fifth Third Bank is an investor in us. Banking regulators could assert that Fifth Third Bank's investment in, or other relationships with, us impose limitations, conditions or approval requirements affecting our activities, investments or acquisitions. The imposition of such limitations, conditions or approval requirements could have an adverse impact on our business, such as by preventing us from pursuing an otherwise attractive acquisition or business opportunity. We have agreed with Fifth Third Bank to a framework for addressing
20
any such limitations, conditions or approval requirements. See the section above entitled “Banking Regulation” for a more detailed discussion of such framework.
The banking regulators and CFPB have broad discretion in the implementation, interpretation and enforcement of banking and consumer protection laws. Our failure to comply with these laws, or our failure to meet the supervisory expectations of the banking regulators or CFPB, could result in adverse action against us. The regulators have the power to, among other things, enjoin “unsafe or unsound” practices; require affirmative actions to correct any violation or practice; issue administrative orders that can be judicially enforced; direct the sale of subsidiaries or other assets; and assess civil money penalties.
Changes in tax laws or their interpretations, or becoming subject to additional international, U.S., state or local taxes that cannot be passed through to our merchants, could reduce our net income.
We are subject to tax laws in each jurisdiction where we do business. Changes in tax laws or their interpretations could decrease the amount of revenues we receive, the value of any tax loss carryforwards and tax credits recorded on our balance sheet and the amount of our cash flow, and have a material adverse impact on our business, financial condition and results of operations. Furthermore, companies in the electronic payments industry, including us, may become subject to incremental taxation in various tax jurisdictions. Taxing jurisdictions have not yet adopted uniform positions on this topic. If we are required to pay additional taxes and are unable to pass the tax expense through to our merchants, our costs would increase and our net income would be reduced.
The costs and effects of pending and future litigation, investigations or similar matters, or adverse facts and developments related thereto, could materially affect our business, financial position and results of operations.
We are involved in various litigation matters and from time to time may be involved in governmental or regulatory investigations or similar matters arising out of our current or future business. Our insurance or indemnities may not cover all claims that may be asserted against us, and any claims asserted against us, regardless of merit or eventual outcome, may harm our reputation. Furthermore, there is no guarantee that we will be successful in defending ourselves in pending or future litigation or similar matters under various laws. Should the ultimate judgments or settlements in any pending litigation or future litigation or investigation significantly exceed our insurance coverage, they could have a material adverse effect on our business, financial condition and results of operations.
We may not be able to successfully manage our intellectual property and may be subject to infringement claims.
Third parties may challenge, invalidate, circumvent, infringe or misappropriate our intellectual property, or such intellectual property may not provide us any competitive advantages, which could result in costly redesign efforts, discontinuance of certain service offerings or other competitive harm. Our competitors could also independently develop similar technology, duplicate our services or design around our intellectual property. We may be forced to litigate to enforce or determine the scope and enforceability of our intellectual property rights, trade secrets and know-how, which is expensive, could cause a diversion of resources and may not prove successful. Also, we may not be able to obtain or continue to obtain licenses and technologies from third parties on reasonable terms or at all. The loss of intellectual property protection or the inability to obtain third party intellectual property could harm our business and ability to compete.
We may also be subject to costly litigation in the event our services and technology infringe upon or otherwise violate a third party’s proprietary rights, or if a third party claims we have breached their copyright, trademark, license usage or other intellectual property rights. Any claim from third parties may result in a limitation on our ability to use the intellectual property subject to these claims. Additionally, we could be required to defend against individuals and groups who have been purchasing intellectual property assets for the sole purpose of making claims of infringement and attempting to extract settlements from companies like ours. Claims of intellectual property infringement also might require us to pay costly settlement or damage awards, or prevent us from marketing or selling certain of our services. If we cannot redesign affected services or license the infringed technology on reasonable terms or substitute similar technology from another source, our revenue and earnings could be adversely impacted.
Finally, we could be subject to suits by parties claiming ownership of what we believe to be open source software, which we use in connection with our technology and services. Despite our efforts to prevent it from occurring, we could be required to by some of our open source software licenses to publicly disclose all or part of the source code to such software and/or make available any derivative works of the open source code on unfavorable terms or at no cost. Any requirement to disclose our proprietary source code could be harmful to our business, financial condition and results of operations.
21
If we lose key personnel or are unable to attract, recruit, retain and develop qualified employees, our business, financial condition and results of operations may be adversely affected.
We are dependent upon the ability and experience of a number of our key personnel who have substantial experience with our operations, the rapidly changing payment processing industry and the selected markets in which we offer our services. The loss of the services of one or a combination of our senior executives or key managers, including Charles D. Drucker, our chief executive officer, could have a material adverse effect on our business, financial condition and results of operations.
Additionally, in order for us to successfully compete and grow, we must attract, recruit, retain and develop the necessary personnel who can provide the needed expertise across the entire spectrum of our intellectual capital needs. We have hired significant numbers of new personnel in recent years and must continue to hire additional personnel to execute our strategic plans. However, the market for qualified personnel is competitive, and we may not succeed in recruiting additional personnel or may fail to effectively replace current personnel who depart. Failure to retain or attract key personnel could have a material adverse effect on our business, financial condition and results of operations.
Our operating results are subject to seasonality, which could result in fluctuations in our quarterly net income.
We have experienced in the past, and expect to continue to experience, seasonal fluctuations in our revenues as a result of consumer spending patterns. Historically our revenues have been strongest in our fourth quarter, and weakest in our first quarter. This is due to the increase in the number and amount of electronic payment transactions related to seasonal retail events.
We may need to raise additional funds to finance our future capital needs, which may prevent us from growing our business.
We may need to raise additional funds to finance our future capital needs, including developing new services and technologies, and to fund ongoing operating expenses. We also may need additional financing earlier than we anticipate if we, among other things:
• | are required to pay significant settlements or fines; |
• | repurchase our common stock; or |
• | finance Worldpay, Inc.’s purchase of Class B units of Vantiv Holding from Fifth Third Bank upon the exercise of its right to put its Class B units of Vantiv Holding to Worldpay, Inc. in exchange for cash to the extent that we decide to purchase rather than exchange such units for Class A common stock. |
If we raise additional funds through the sale of equity securities, these transactions may dilute the value of our outstanding Class A common stock. We may also decide to issue securities, including debt securities that have rights, preferences and privileges senior to our Class A common stock. Any debt financing would increase our already high level of indebtedness and could negatively affect our liquidity and restrict our operations. We may be unable to raise additional funds on terms favorable to us or at all. If financing is not available or is not available on acceptable terms, we may be unable to fund our future needs. This may prevent us from increasing our market share, capitalizing on new business opportunities or remaining competitive in our industry.
We have a long sales cycle for many of our services, and if we fail to close sales after expending significant time and resources to do so, our business, financial condition and results of operations could be adversely affected.
The initial installation and set-up of many of our services often involve significant resource commitments by our clients, particularly those with larger operational scale. Potential clients generally commit significant resources to an evaluation of available services and require us to expend substantial time (six to nine months is not uncommon), effort and money educating them as to the value of our services. We incur substantial costs in order to obtain each new customer. We may expend significant funds and management resources during a sales cycle and ultimately fail to close the sale. Our sales cycle may be extended due to our clients’ budgetary constraints or for other reasons. If we are unsuccessful in closing sales after expending significant funds and management resources or we experience delays, it could have a material adverse effect on our business, financial condition and results of operations.
22
Risks Related to Our Indebtedness and Organizational Structure
Our substantial indebtedness could adversely affect our ability to raise additional capital to fund our operations, limit our ability to react to changes in the economy or our industry, expose us to interest rate risk to the extent of our variable rate debt and prevent us from meeting our debt obligations.
We have a high level of indebtedness. As of December 31, 2017, we had total indebtedness of $5.7 billion. For the year ended December 31, 2017, total payments under our annual debt service obligations, including interest and principal, were approximately $253 million. Subsequent to the closing of the Legacy Worldpay acquisition, we had total indebtedness of approximately $8.3 billion. Our high degree of leverage could have significant negative consequences, including:
• | increasing our vulnerability to adverse economic, industry or competitive developments; |
• | requiring a substantial portion of cash flow from operations to be dedicated to the payment of principal and interest on our indebtedness, thereby reducing our ability to use our cash flow to fund our operations, capital expenditures and future business opportunities; |
• | exposing us to the risk of increased interest rates because certain of our borrowings, including our borrowings under our senior secured credit facilities, are at variable rates of interest; |
• | making it more difficult for us to comply with the obligations of our debt instruments, including restrictive covenants and borrowing conditions, which could result in an event of default under the agreements governing such indebtedness; |
• | restricting us from making strategic acquisitions or causing us to make non-strategic divestitures; |
• | making it more difficult for us to obtain payment network sponsorship and clearing services from financial institutions; |
• | limiting our ability to obtain additional financing for working capital, capital expenditures, product development, debt service requirements, acquisitions and general corporate or other purposes; and |
• | limiting our flexibility in planning for, or reacting to, changes in our business or market conditions and placing us at a competitive disadvantage compared to our competitors who are less highly leveraged and who, therefore, may be able to take advantage of opportunities that our leverage prevents us from exploiting. |
As of the closing of the Legacy Worldpay acquisition mentioned above, the majority of our indebtedness consists of indebtedness under our senior secured credit facilities consisting of a $3.8 billion term A-5 loan which matures in 2023, a $179 million term A-3 loan which matures in 2021, a $1.8 billion term B-4 loan which matures in 2024, and a $757 million term B-3 loan which matures in 2023. Our indebtedness also consists of $1.1 billion senior unsecured notes due in 2025 and a $613 million senior unsecured note due in 2022 (See Note 21 - Subsequent Events from Notes to Consolidated Financial Statements for additional discussion). We may not be able to refinance our senior secured credit facilities or any other indebtedness because of our high level of debt, debt incurrence restrictions under our debt agreements or because of adverse conditions in credit markets generally.
Despite our high indebtedness level, we still may be able to incur significant additional amounts of debt, which could further exacerbate the risks associated with our substantial indebtedness. Although our senior secured credit facilities contain restrictions on the incurrence of additional indebtedness, these restrictions are subject to a number of significant qualifications and exceptions, and under certain circumstances, the amount of indebtedness that could be incurred in compliance with these restrictions could be substantial. For example, we may incur up to $1.25 billion of additional debt pursuant to an incremental facility under our senior secured credit facilities, subject to certain terms and conditions.
Our use of derivative financial instruments may not be successful in managing our interest rate risks and could result in material financial losses by us.
To the extent that we hedge our exposure to fluctuations in interest rates, we forgo the benefits we would otherwise experience if interest rates were to change in our favor. Developing an effective strategy for dealing with movements in interest rates is complex, and no strategy can completely insulate us from risks associated with such fluctuations. In addition, a counterparty to the arrangement could default on its obligation, thereby exposing us to credit risk. Further, we may have to repay certain costs, such as transaction fees or breakage costs, if we terminate these arrangements. Finally, our interest rate risk management activities could expose us to substantial losses if interest rates move materially differently from management’s expectations. As a result, we cannot assure that our interest rate hedging arrangements will effectively manage our interest rate sensitivity or have the desired beneficial impact on our results of operations or financial condition.
23
Our balance sheet includes significant amounts of goodwill and intangible assets. The impairment of a significant portion of these assets would negatively affect our business, financial condition and results of operations.
Our balance sheet includes goodwill and intangible assets that represent 56% of our total assets at December 31, 2017. These assets consist primarily of goodwill and customer relationship intangible assets associated with our acquisitions. Additional acquisitions would also result in our recognition of additional goodwill and intangible assets. As a result of the Legacy Worldpay acquisition we will add a significant amount of additional goodwill and customer relationships to our balance sheet. Under current accounting standards, we are required to amortize certain intangible assets over the useful life of the asset, while goodwill is not amortized. On at least an annual basis, we assess whether there have been impairments in the carrying value of goodwill and certain intangible assets. If the carrying value of the asset is determined to be impaired, then it is written down to fair value by a charge to operating earnings. An impairment of a significant portion of goodwill or intangible assets could have a material adverse effect on our results of operations.
We are party to tax receivable agreements and the amounts we may be required to pay under these agreements are expected to be significant. In certain cases, payments under the tax receivable agreements may be accelerated and/or significantly exceed the actual benefits we realize in respect of the tax attributes subject to the tax receivable agreements.
We are party to tax receivable agreements (“TRAs”) as further described in “Item 7 - Management’s Discussion and Analysis of Financial Condition and Results of Operations.” The payments we will be required to make under these TRAs are expected to be substantial. As of December 31, 2017, we have a liability recorded of approximately $780.6 million associated with the TRAs. Because payments under the TRAs are determined based on realized cash savings resulting from the underlying tax attributes, a period of declining profitability would result in a corresponding reduction in our TRA payments, except in certain specified circumstances where we may be required to make payments in excess of such cash savings. We will incur additional liabilities in connection with any future purchases by us of units in Vantiv Holding from Fifth Third Bank or from the future exchange of units by Fifth Third Bank for cash or shares of our Class A common stock. If Fifth Third Bank had exchanged its remaining Class B units of Vantiv Holding all for shares of Class A common stock on December 31, 2017, we would have recorded an additional full and undiscounted TRA obligation of approximately $350.0 million. This estimate is subject to material change based on changes in Fifth Third Bank’s tax basis in the partnership interest, changes in tax rates, or significant changes in our stock price. It is possible that future transactions or events, including changes in tax rates, could increase or decrease the actual tax benefits realized and the corresponding TRA payments. There may be a material adverse effect on our liquidity if, as a result of timing discrepancies or otherwise, distributions to us by Vantiv Holding are not sufficient to permit us to make payments under the TRAs.
The TRAs provide that, upon certain mergers, asset sales, other forms of business combination or certain other changes of control, our obligations to make payments with respect to tax benefits would be based on certain assumptions, including that we would have sufficient taxable income to fully use the NOLs or deductions arising from increased tax basis of assets. As a result, upon a merger or other change of control, we could be required to make payments under the TRAs that are greater than 85% of our actual tax savings.
We may elect to terminate any or all of the remaining TRAs prior to the time they terminate in accordance with their terms, or enter into repurchase addendums providing for the early settlement of certain obligations. If we were to so elect, or if we materially breach a material obligation in the TRAs and we do not cure such breach within a specified time period, we would be required to make an immediate payment equal to the present value of the anticipated future tax benefits taken into account under the TRAs. In these circumstances, the anticipated future tax benefits would be determined under certain assumptions that in general assume that we would recognize the greatest amount of benefits at the earliest time. As a result, the payments we would be required to make could exceed 85% of the tax savings that we actually realize from the increased tax basis and/or the NOLs, and we could be required to make those payments significantly in advance of the time the tax savings arise.
If the Internal Revenue Service, or the IRS, challenges the tax basis increases or NOLs that give rise to payments under the TRAs and the tax basis increases or NOLs are subsequently disallowed, our payments under the TRAs could exceed our actual tax savings, and we may not be able to recoup payments under the TRAs that were calculated on the assumption that the disallowed tax savings were available.
24
We are a holding company and our principal assets are our interests in Vantiv Holding, and we depend on dividends, distributions and other payments from Vantiv Holding to meet any existing or future debt service and other obligations and to pay dividends, if any, and taxes and other expenses.
We are a holding company and conduct all of our operations through Vantiv Holding and its subsidiaries. We have no material assets other than our ownership of units of Vantiv Holding. To the extent that we need funds and Vantiv Holding is restricted from making distributions to us under applicable law or regulation, or by the terms of Vantiv Holding’s indebtedness, or Vantiv Holding is otherwise unable to provide such funds, it could materially adversely affect our liquidity and, consequently, our business, financial condition and results of operations.
Some provisions of Delaware law and our amended and restated certificate of incorporation and amended and restated bylaws may deter third parties from acquiring us and diminish the value of our Class A common stock.
Our amended and restated certificate of incorporation and amended and restated bylaws provide for, among other things:
• | restrictions on the ability of our stockholders to call a special meeting and the business that can be conducted at such meeting; |
• | prohibition on the ability of our stockholders to remove directors elected by the holders of our Class A common stock without cause; |
• | our ability to issue additional shares of Class A common stock and to issue preferred stock with terms that the board of directors may determine, in each case without stockholder approval (other than as specified in our amended and restated certificate of incorporation); |
• | the absence of cumulative voting in the election of directors; |
• | supermajority approval requirements for amending or repealing provisions in the amended and restated certificate of incorporation and bylaws; |
• | a classified board of directors; |
• | a prohibition on action by written consent of stockholders; and |
• | advance notice requirements for stockholder proposals and nominations. |
These provisions in our amended and restated certificate of incorporation and amended and restated bylaws may discourage, delay or prevent a transaction involving a change in control of our company that is in the best interest of our stockholders. Even in the absence of a takeover attempt, the existence of these provisions may adversely affect the prevailing market price of our Class A common stock if they are viewed as discouraging future takeover attempts. These provisions could also make it more difficult for stockholders to nominate directors for election to our board of directors and take other corporate actions.
Risks Related to the Ownership of our Class A Common Stock
Future sales of our Class A common stock or securities convertible into or exchangeable for Class A common stock could depress the market price of our Class A common stock.
Sales of substantial amounts of our Class A common stock in the public market, or the perception that such sales could occur, could adversely affect the market price of our Class A common stock. As of December 31, 2017, we had 162,595,981 shares of Class A common stock outstanding. Subject to compliance with applicable documentation, which includes the Exchange Agreement, Fifth Third Bank could acquire up to 15,252,826 shares of our Class A common stock. Pursuant to the Registration Rights Agreement, Fifth Third Bank is entitled to certain demand and “piggyback” registration rights and any shares of our Class A common stock that are sold by Fifth Third Bank pursuant to such a registration would become eligible for sale in the public market without restriction. In addition, we have filed registration statements on Form S-8 relating to an aggregate of 39,750,519 shares of our Class A common stock that we have issued or may issue in the future pursuant to employee benefit plans. These shares may be sold in the public market upon issuance and once vested, subject to the terms of the equity incentive plan and applicable award agreements.
25
Failure to maintain effective systems of internal control over financial reporting and disclosure controls and procedures could adversely affect the trading price of our common stock.
Effective internal control over financial reporting is necessary for us to provide accurate financial information. If we are unable to adequately maintain effective internal control over financial reporting, we may not be able to accurately report our financial results, which could cause investors to lose confidence in our reported financial information and negatively affect the trading price of our common stock. Furthermore, we cannot be certain that our internal control over financial reporting and disclosure controls and procedures will prevent all possible error and fraud. Because of inherent limitations in all control systems, no evaluation of controls can provide absolute assurance that all control issues and instances of error or fraud, if any, in our company have been detected. These inherent limitations include the realities that judgments in decision-making can be faulty and that breakdowns can occur because of simple error or mistake, which could have an adverse impact on our business.
The price of our Class A common stock may be volatile.
Securities markets worldwide have experienced, and are likely to continue to experience, significant price and volume fluctuations. This market volatility, as well as general economic, market or political conditions could reduce the market price of our Class A common stock regardless of our results of operations. The trading price of our Class A common stock is likely to be highly volatile and could be subject to wide price fluctuations in response to various factors, including, among other things, the risk factors described in this section of this Annual Report on Form 10-K, and other factors beyond our control. Factors affecting the trading price of our common stock will include:
• | market conditions in the broader stock market; |
• | actual or anticipated variations in our quarterly financial and operating results; |
• | variations in operating results of similar companies; |
• | introduction of new services by us, our competitors or our clients |
• | issuance of new, negative or changed securities analysts’ reports or recommendations or estimates; |
• | investor perceptions of us and the industries in which we or our clients operate; |
• | sales, or anticipated sales, of our stock, including sales by existing stockholders; |
• | additions or departures of key personnel; |
• | regulatory or political developments; |
• | stock-based compensation expense under applicable accounting standards; |
• | litigation and governmental investigations; and |
• | changing economic conditions. |
These and other factors may cause the market price and demand for shares of our Class A common stock to fluctuate substantially, which may limit or prevent investors from readily selling their shares of Class A common stock and may otherwise negatively affect the liquidity of our Class A common stock. In addition, in the past, when the market price of a stock has been volatile, holders of that stock have sometimes instituted securities class action litigation against the company that issued the stock. Securities litigation against us, regardless of the merits or outcome, could result in substantial costs and divert the time and attention of our management from our business, which could significantly harm our business, profitability and reputation.
We have not declared or paid any cash dividends on our common stock since our initial public offering, and we do not intend to in the foreseeable future.
We have not declared or paid any cash dividends on our common stock since our initial public offering, and we do not intend to in the foreseeable future. We currently intend to retain our future earnings, if any, to repay indebtedness and to support our general corporate purposes. We are a holding company that does not conduct any business operations of our own. As a result, our ability to pay cash dividends on our common stock, if any, is dependent upon cash dividends and distributions and other transfers from Vantiv Holding. The amounts available to us to pay cash dividends are also restricted by our subsidiaries’ debt agreements, and, to the extent that we require additional funding, the sources of such additional funding may prohibit the payment of a dividend. As a result, appreciation in the price of our Class A common stock, if any, will be the only source of gain on an investment in our Class A common stock.
26
Risks Related to our Acquisition of Legacy Worldpay
Since we closed the Legacy Worldpay acquisition (“the Acquisition”) in January 2018, our business is subject to a number of risks, whether currently known or unknown, including but not limited to those described below, related to the acquisition and the new business environment in which we operate.
We may fail to realize the anticipated benefits and operating synergies expected from the Acquisition, which could adversely affect our business, financial condition and operating results.
The success of the Acquisition will depend, in significant part, on our ability to successfully integrate the acquired business, grow our revenue and realize the anticipated strategic benefits and synergies from the Acquisition. We believe that the addition of Legacy Worldpay will complement our strategy by providing scale and revenue diversity, accelerate our growth strategy and enable us to have a strong global footprint. Achieving these goals requires growth of the revenue and realization of the targeted operating synergies expected from the Acquisition. This growth and the anticipated benefits of the Acquisition may not be realized fully or at all, or may take longer to realize than we expect. Actual operating, technological, strategic and revenue opportunities, if achieved at all, may be less significant than we expect or may take longer to achieve than anticipated. If we are not able to achieve these objectives and realize the anticipated benefits and synergies expected from the Acquisition within a reasonable time, our business, financial condition and operating results may be adversely affected.
The Acquisition will result in significant integration costs and any material delays or unanticipated additional expenses may harm our business, financial condition and results of operations.
The complexity and magnitude of the integration effort associated with the Acquisition are significant and require that we fund significant capital and operating expenses to support the integration of the combined operations. Such expenses have included significant transaction, consulting and third party service fees. We incurred integration planning costs during 2017 and anticipate that we may incur additional integration implementation costs through 2020. We have incurred and expect to continue to incur additional operating expenses as we build up internal resources or engage third party providers while we integrate the combined company following the Acquisition. In addition to these transition costs, we have incurred and expect to continue to incur increased expenses relating to, among other things, restructuring. Any material delays, difficulties or unanticipated additional expenses associated with integration activities may harm our business, financial conditions and results of operations.
We may not be able to successfully integrate Legacy Worldpay or, maintain or renew certain of Legacy Worldpay’s commercial relationships.
Our acquisition of Legacy Worldpay involves the integration of two businesses that currently operate independently. The integration of the departments, systems, business units, operating procedures and information technologies of the two businesses will present a significant challenge to management. There can be no assurance that we will be able to integrate and manage these operations effectively or that such operations, once integrated, will provide us with the benefits we anticipate. The failure to successfully integrate the two businesses in a timely manner, or at all, could have an adverse effect on our business, financial condition and results of operations. In addition, we may be unable to renew certain business relationships maintained by Legacy Worldpay on terms favorable to us or at all, including but not limited to Legacy Worldpay’s relationships with the Royal Bank of Scotland and Citizens Bank. The challenges of combining us with Legacy Worldpay include:
• | the necessity of coordinating geographically separated organizations; |
• | implementing common systems and controls; |
• | integrating personnel with diverse business backgrounds; |
• | the challenges in developing new products and services that optimize the assets and resources of the two businesses; |
• | integrating the businesses’ technology and products; |
• | combining different corporate cultures; |
• | unanticipated expenses related to integration, including technical and operational integration; |
• | increased fixed costs and unanticipated liabilities that may affect operating results; |
• | retaining key employees; and |
• | retaining and maintaining relationships with existing customers, distributors and other partners. |
27
Also, the process of integrating operations could cause an interruption of, or loss of momentum in, the activities of one or both of us and Legacy Worldpay. The diversion of management’s attention and any delays or difficulties encountered in connection with the integration of the operations could have an adverse effect on our business, financial condition and results of operations.
The Acquisition may expose us to significant unanticipated liabilities that could adversely affect our business, financial condition and results of operations.
Our acquisition of Legacy Worldpay may expose us to significant unanticipated liabilities relating to the operation of the combined company. These liabilities could include employment, regulatory, retirement or severance-related obligations under applicable law or other benefit arrangements, legal claims, warranty or similar liabilities to customers, and claims by or amounts owed to vendors. Particularly in international jurisdictions, our acquisition of Legacy Worldpay, or our decision to independently enter new international markets where Legacy Worldpay previously conducted business, could also expose us to tax liabilities and other amounts owed by Legacy Worldpay. The incurrence of such unforeseen or unanticipated liabilities, should they be significant, could have a material adverse effect on our business, financial condition and results of operations.
The complexity of the integration and transition associated with the Acquisition, together with our increased scale and global presence, may affect our internal control over financial reporting and our ability to effectively and timely report our financial results.
The additional scale of Legacy Worldpay’s operations, together with the complexity of the integration effort, including changes to or implementation of critical information technology systems, may adversely affect our ability to report our financial results on a timely basis. In addition, we will have to train new employees and third party providers, and assume operations in jurisdictions where we have not previously had operations. We expect that the Acquisition may necessitate significant modifications to our internal control systems, processes and information systems, both on a transition basis and over the longer-term as we fully integrate. Due to the complexity of the Acquisition, there can be no assurances that changes to our internal control over financial reporting will be effective for any period, or on an ongoing basis. If we are unable to accurately report our financial results in a timely manner, or are unable to assert that our internal controls over financial reporting are effective, our business, financial condition and results of operations and the market perception thereof may be materially adversely affected.
As a result of the Acquisition of Legacy Worldpay, our business is now international in nature, which subjects us to various geopolitical, regulatory, tax and business risks, including movement in foreign exchange rates.
Our business is subject to risks associated with doing business internationally. Operating in foreign countries, especially in the U.K and the European Union countries, subjects us to multiple risks, including:
• | differing local product preferences and product requirements; |
• | geopolitical events, including natural disasters, public health issues, acts of war, nationalism and terrorism, social unrest or human rights issues; |
• | partial or total expropriation of international assets; |
• | trade protection measures, including tariffs or import-export restrictions; |
• | enforceability of intellectual property and contract rights; |
• | different, uncertain, or more stringent user protection, data protection, privacy, and other laws; and |
• | potentially negative consequences from changes in or interpretations of tax laws or policies. |
Violations of the complex foreign and U.S. laws, rules and regulations that apply to our international operations may result in fines, criminal actions, or sanctions against us, our officers, or our colleagues; prohibitions on the conduct of our business; and damage to our reputation. Although we have implemented policies and procedures designed to promote compliance with these laws, violations by our colleagues, contractors, or agents could nevertheless occur. These risks are inherent in our international operations and expansion, may increase our costs of doing business internationally, and could harm our business and reputation. In addition, we may in the future undertake projects and make investments in countries in which we have little or no previous investment or operating experience. We may not be able to fully or accurately assess the risks of investing in such countries, or may be unfamiliar with the laws and regulations in such countries governing its investments and
28
operations. As a result, we may be unable to effectively implement its strategy in new jurisdictions. Investment opportunities in certain jurisdictions may be also restricted by legal limits on foreign investment in local assets or classes of assets.
We may incur losses associated with foreign currency exchange rate fluctuations and may not be able to effectively hedge our exposure.
Following the Acquisition of Legacy Worldpay, we have an increased proportion of assets, liabilities and earnings denominated in foreign currencies, particularly British pound sterling and the Euro. As a result, a depreciation of non-U.S. dollar currencies relative to the U.S. dollar could have an adverse impact on our financial results and affect our reported results of operations and the value of its assets and liabilities in its consolidated balance sheet in future periods.
We attempt to mitigate a portion of these risks through foreign currency hedging based on our judgment of the appropriate trade-offs among risk, opportunity and expense, and we regularly review our program to partially hedge our exposure to foreign currency fluctuations and make adjustments as necessary. Although these hedging arrangements are in place to mitigate foreign currency risk, such arrangements may prove ineffective in protecting us from any negative impacts of foreign exchange fluctuations and our financial condition and results of operation will therefore be sensitive to movements in foreign exchange rates.
Global economic and political uncertainty, including Brexit, could adversely affect our revenue and results of operations.
As a result of the international nature of our business, we have become increasingly subject to the risks arising from adverse changes in global economic and political conditions. Uncertainty about the effects of current and future economic and political conditions on us, our customers, suppliers and partners makes it difficult for us to forecast operating results and to make decisions about future investments. Deterioration in economic conditions in any of the countries in which we do business could result in reductions in sales of our products and services and could cause slower or impaired collections on accounts receivable, which may adversely impact our liquidity and financial condition.
The June 2016 referendum supporting the exit of the U.K. from the European Union (“Brexit”) specifically is causing significant political uncertainty in both the U.K. and the European Union. The impact of Brexit and the resulting effect on the political and economic future of the U.K. and the European Union is uncertain, and our business may be adversely affected in ways we do not currently anticipate. Brexit may result in a significant change in the British regulatory environment, which may likely increase our compliance costs. We may find it more difficult to conduct business in the U.K. and the European Union, as Brexit may result in increased restrictions on the movement of capital, goods and personnel. Depending on the outcome of negotiations between the U.K. and the European Union regarding the terms of Brexit, we may decide to relocate or otherwise alter our European operations to respond to the new business, legal, regulatory, tax and trade environments that may result.
As with any political instability or adverse political developments in or around any of the major countries in which we do business, developments related to Brexit may materially and adversely affect with customers, suppliers and employees and could harm our business, results of operations and financial condition.
Failure to comply with the laws and regulations of the United States as well as those of many foreign countries may affect our ability to conduct business in certain countries and may affect our financial performance.
We are subject to a variety of laws regarding our international operations, including the U.S. Foreign Corrupt Practices Act, the U.K. Bribery Act, regulations issued by U.S. Customs and Border Protection and the U.S. Bureau of Industry and Security, import and export control laws, payment card industry data security standards, anti-trust and competition laws, securities regulations and regulations of various foreign governmental and regulatory agencies. We cannot predict the nature, scope or effect of future regulatory requirements to which our international operations might be subject or the manner in which existing laws might be administered or interpreted. Compliance with these laws and regulations may involve significant costs or require changes in our business practices that result in reduced revenue and profitability. Non-compliance could also result in fines, damages, criminal sanctions against us, our officers or our employees, prohibitions on the conduct of our business, and damage to our reputation.
While we seek to actively monitor the regulatory status of our activities across all the jurisdictions in which we operate, there is a level of complexity that we face in terms of interpreting, complying with and tracking changes to licensing requirements meaning it is not always possible to determine whether our merchant acquiring and other payment processing activities are, or are treated by regulators as amounting to, regulated activity, and applicable laws and regulations are often vague as to whether or not they definitively cover such activities. Actual or alleged violations of any relevant laws or regulations could result in enforcement actions and financial penalties that could result in substantial costs and reputational
29
damage and could have a material and adverse effect on our business, financial condition and results of operations. In particular, we are in a process of reviewing our approximately 60 alternative payment method providers which is expected to complete during 2018. Although no adverse impact has occurred to date or is expected, the completion of this review could lead to customer attrition and failure to complete the exercise in a timely manner could give rise to other forms of legal and regulatory risk.
In addition, we are exposed to changes in laws governing our employee relationships in various U.S. and foreign jurisdictions, including laws and regulations regarding wage and hour requirements, fair labor standards, employee data privacy, unemployment tax rates, workers’ compensation rates, citizenship requirements and payroll and other taxes, which likely would have a direct impact on our operating costs.
Holders of Depositary Interests must rely on the Depositary or the Custodian to exercise rights attaching to our shares for the benefit of the holders of Depositary Interests.
We have entered into depositary arrangements to enable investors to settle and pay for our shares through CREST, which is the central securities depository in the U.K. The rights of holders of Depositary Interests will be governed by, among other things, the relevant provisions of the CREST Manual and the CREST Rules (as defined in the CREST Terms and Conditions issued by Euroclear UK & Ireland Limited (“EUI”)). As the registered holder, the Depositary will have the power to exercise voting and other rights conferred by Delaware law and the bylaws of Worldpay on behalf of the relevant holder. Consequently, the holders of Depositary Interests must rely on the Depositary to exercise such rights for the benefit of the holders of Depositary Interests. Although we will enter into arrangements whereby EUI will make a copy of the register of the names and addresses of holders of Depositary Interests available to the Company to enable it to send out notices of shareholder meetings and proxy forms to its holders of Depositary Interests and pursuant to EUI’s omnibus proxy arrangements, subject to certain requirements, the Depositary will be able to give each beneficial owner of a Depositary Interest the right to vote directly in respect of such owner’s underlying Worldpay Shares, there can be no assurance that such information, and consequently, all such rights and, entitlements, will at all times be duly and timely passed on or that such proxy arrangements will be effective.
The standard listing of our shares affords investors a lower level of regulatory protection than a premium listing.
Our shares are admitted to the standard segment of the Official List of the LSE. A standard listing affords investors in Worldpay a lower level of regulatory protection than that afforded to investors in a company with a premium listing, which is subject to additional obligations under the Listing Rules. A standard listing also does not permit us to gain a FTSE UK Index Series indexation (which includes the FTSE 100 and FTSE 250 indices), which may have an adverse effect on the price of our shares.
There is currently a limited U.K. market for our shares and no U.K. trading history prior to our Acquisition of Legacy Worldpay. A robust U.K. market for our shares may not develop, which would adversely affect the liquidity and price of our shares.
Because of the relatively low trading volume of our shares listed on the LSE, and the lack of a trading history prior to our Acquisition of Legacy Worldpay, investors in the United Kingdom have limited information when making their decision to invest. Although our current intention is that our shares will continue to trade on the LSE, we cannot assure investors that it this will always be the case. In addition, an active U.K. trading market for our shares may never develop or, if developed, may not be maintained. Investors, particularly investors outside of the United States, may be unable to sell their Worldpay shares unless a market can be established and maintained, and if we subsequently obtain a further listing on an exchange in addition to, or in lieu of, the LSE, the level of liquidity of our shares may decline.
Our shares are listed on two separate markets and investors seeking to take advantage of price differences between such markets may create unexpected volatility in our share price. In addition, investors may not be able to easily move shares for trading between such markets.
Our shares are listed and traded on both the NYSE and on the LSE. While our shares are traded on both markets, price and volume levels could fluctuate significantly on either market, independent on the share price or trading volume on the other market. Investors could seek to sell or buy our shares to take advantage of any price differences between the two markets through a process referred to as arbitrage. Any arbitrage activity could create unexpected volatility in both the price of our shares on either exchange and in the volume of our shares available for trading on either market. In addition, holders of our shares in either jurisdiction will not immediately be able to transfer such shares for trading on the other market without effecting necessary procedures with our transfer agents/registrars. This could result in time delays and additional cost for our Shareholders.
30
Item 1B. Unresolved Staff Comments
None
Item 2. Properties
Our principal place of business is our corporate headquarters located at 8500 Governor’s Hill Drive, Symmes Township, Cincinnati, Ohio 45249.
In addition to our corporate headquarters, as of December 31, 2017 we leased operational, sales, and administrative facilities in Arizona, California, Colorado, Georgia, Illinois, Massachusetts and Texas and owned a facility in Colorado. As of December 31, 2017, we leased data center facilities in Colorado, Kentucky and Michigan. We believe that our facilities are suitable and adequate for our business as presently conducted, however, we periodically review our facility requirements and may acquire new space to meet the needs of our business or consolidate and dispose of facilities that are no longer required.
Item 3. Legal Proceedings
From time to time, we are involved in various litigation matters arising in the ordinary course of our business. While it is impossible to ascertain the ultimate resolution or range of financial liability with respect to these contingent matters, management believes none of these matters, either individually or in the aggregate, would have a material adverse effect on us, except as discussed in Note 10 - Commitments, Contingencies and Guarantees in Part II, Item 8. See the information under Legal Reserve in Note 10 - Commitments, Contingencies and Guarantees, which we incorporate herein by reference.
Item 4. Mine Safety Disclosures
Not applicable
31
PART II
Item 5. Market for Registrant’s Common Equity, Related Stockholder Matters and Issuer Purchases of Equity Securities
Price Range of Common Stock
Our Class A common stock is traded on the New York Stock Exchange under the symbol “WP” and as of January 16, 2018, on the London Stock Exchange via a secondary standard listing under the symbol “WPY.” There is currently no established public trading market for our Class B common stock. The information presented in the table below represents the high and low sales prices per share of Class A common stock as reported on the NYSE for the periods indicated.
2016 | High | Low | ||||||
First Quarter | $ | 54.50 | $ | 42.01 | ||||
Second Quarter | $ | 58.09 | $ | 50.52 | ||||
Third Quarter | $ | 59.62 | $ | 52.45 | ||||
Fourth Quarter | $ | 60.25 | $ | 54.38 | ||||
2017 | High | Low | ||||||
First Quarter | $ | 66.47 | $ | 59.60 | ||||
Second Quarter | $ | 66.24 | $ | 59.62 | ||||
Third Quarter | $ | 73.14 | $ | 59.10 | ||||
Fourth Quarter | $ | 76.22 | $ | 67.71 | ||||
There were approximately 317 holders of record of our Class A common stock and one holder of our Class B common stock as of January 31, 2018.
Issuer Purchases of Equity Securities
The following table sets forth information regarding shares of Class A common stock repurchased by us during the three months ended December 31, 2017:
Period | Total Number of Shares Purchased (1)(2) | Average Price Paid per Share | Total Shares Purchased as Part of Publicly Announced Plans or Programs (2) | Approximate Dollar Value of Shares that May Yet Be Purchased Under the Plans or Programs (in millions) (2) | ||||||||||
October 1, 2017 to October 31, 2017 | 11,744 | $ | 69.01 | — | $ | 243.2 | ||||||||
November 1, 2017 to November 30, 2017 | 652 | $ | 69.31 | — | $ | 243.2 | ||||||||
December 1, 2017 to December 31, 2017 | — | $ | — | — | $ | 243.2 | ||||||||
(1) | Includes shares of Class A common stock surrendered to us to satisfy tax withholding obligations in connection with the vesting of restricted stock awards. |
(2) | On October 25, 2016, the board of directors authorized a program to repurchase up to an additional $250 million of our Class A common stock. During the three months ended December 31, 2017, we did not repurchase any shares of Class A common stock under this program. Purchases under the repurchase program are allowed from time to time in the open market, in privately negotiated transactions, or otherwise. The manner, timing, and amount of any purchases are determined by management based on an evaluation of market conditions, stock price, and other factors. The share repurchase program has no expiration date and we may discontinue purchases at any time that management determines additional purchases are not warranted. |
Dividend Policy
Since our initial public offering, we have not declared or paid any cash dividends on our common stock, and we do not intend to in the foreseeable future. We are a holding company that does not conduct any business operations of our own. As a result, our ability to pay cash dividends on our common stock, if any, is dependent upon cash dividends and distributions and other transfers from Vantiv Holding. The amounts available to us to pay cash dividends are subject to the covenants and
32
restrictions in our subsidiaries’ loan agreements. Any future determination as to the declaration and payment of dividends, if any, will be at the discretion of our board of directors and will depend on then existing conditions, including our financial condition, operating results, legal and contractual restrictions, capital requirements, business prospects and other factors our board of directors may deem relevant.
Vantiv Holding paid aggregate tax distributions to Fifth Third Bank of $18.8 million, $8.7 million and $10.9 million, respectively, for the years ended December 31, 2017, 2016 and 2015, pursuant to the terms of the Amended and Restated Vantiv Holding Limited Liability Company Agreement. Vantiv Holding will continue to make tax distributions to Fifth Third in accordance with the Amended and Restated Vantiv Holding Limited Liability Company Agreement.
Additionally, Vantiv Holding paid distributions to a bank partner relating to its joint venture of $3.8 million, $4.2 million and $2.0 million, respectively, for the years ended December 31, 2017, 2016 and 2015.
Stock Performance Graph
The following graph shows a comparison from December 31, 2012 through December 31, 2017 of the cumulative total return for our Class A common stock, the S&P 500 Index and the S&P Information Technology Index. Data for the S&P 500 Index and the S&P Information Technology Index assume reinvestment of dividends. Note that historic stock price performance is not necessarily indicative of future stock price performance.
COMPARISON OF 5 YEAR CUMULATIVE TOTAL RETURN*
Among Worldpay, Inc., the S&P 500 Index, and the S&P Information Technology Index
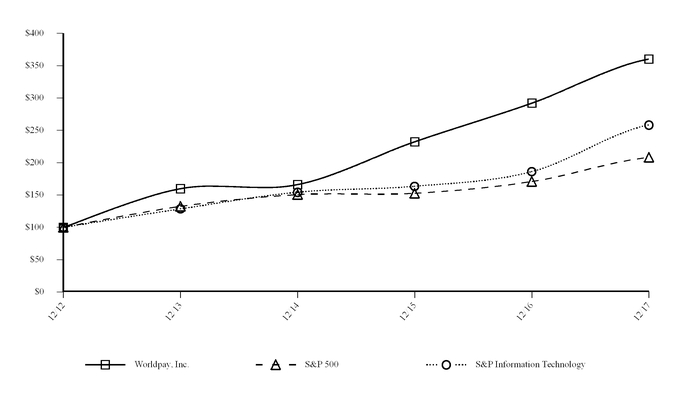
*$100 invested on 12/31/12 in stock or in index, including reinvestment of dividends.
Fiscal year ending December 31.
Fiscal year ending December 31.
This performance graph shall not be deemed “soliciting material” or to be “filed” with the Securities and Exchange Commission for purposes of Section 18 of the Securities Exchange Act of 1934, as amended, or otherwise subject to the liabilities under that Section, and shall not be deemed to be incorporated by reference into any filing of Worldpay, Inc. under the Securities Act of 1933, as amended.
33
Item 6. Selected Financial Data
The following table sets forth our historical financial and other data for the periods and as of the dates indicated. We derived the statement of income data for the years ended December 31, 2017, 2016 and 2015 and our balance sheet data as of December 31, 2017 and 2016 from our audited financial statements for such periods included elsewhere in this Annual Report on Form 10-K. The statement of income data for the years ended December 31, 2014 and 2013 and the balance sheet data as of December 31, 2015, 2014 and 2013 are derived from our audited financial statements that are not included in this Annual Report on Form 10-K.
The results indicated below are not necessarily indicative of our future performance. You should read this information together with “Item 7 - Management’s Discussion and Analysis of Financial Condition and Results of Operations” and “Item 8 - Financial Statements and Supplementary Data.”
Year Ended December 31, 2017 | Year Ended December 31, 2016 | Year Ended December 31, 2015 | Year Ended December 31, 2014 | Year Ended December 31, 2013 | |||||||||||||||
(in thousands, except share data) | |||||||||||||||||||
Statement of income data: | |||||||||||||||||||
Revenue | $ | 4,026,477 | $ | 3,578,991 | $ | 3,159,938 | $ | 2,577,203 | $ | 2,108,077 | |||||||||
Network fees and other costs | 1,903,165 | 1,674,230 | 1,478,202 | 1,174,665 | 935,441 | ||||||||||||||
Sales and marketing | 669,506 | 582,251 | 503,949 | 396,353 | 312,044 | ||||||||||||||
Other operating costs | 318,665 | 294,235 | 284,066 | 242,439 | 200,630 | ||||||||||||||
General and administrative | 295,101 | 189,707 | 182,369 | 173,986 | 121,707 | ||||||||||||||
Depreciation and amortization | 318,493 | 270,054 | 276,942 | 275,069 | 185,453 | ||||||||||||||
Income from operations | 521,547 | 568,514 | 434,410 | 314,691 | 352,802 | ||||||||||||||
Interest expense-net | (140,661 | ) | (109,534 | ) | (105,736 | ) | (79,701 | ) | (40,902 | ) | |||||||||
Non-operating income (expense) | 432,826 | (36,256 | ) | (31,268 | ) | 177 | (20,000 | ) | |||||||||||
Income before applicable income taxes | 813,712 | 422,724 | 297,406 | 235,167 | 291,900 | ||||||||||||||
Income tax expense | 631,020 | 141,853 | 88,177 | 66,177 | 83,760 | ||||||||||||||
Net income | 182,692 | 280,871 | 209,229 | 168,990 | 208,140 | ||||||||||||||
Less: Net income attributable to non-controlling interests | (52,582 | ) | (67,663 | ) | (61,283 | ) | (43,698 | ) | (74,568 | ) | |||||||||
Net income attributable to Worldpay, Inc. | $ | 130,110 | $ | 213,208 | $ | 147,946 | $ | 125,292 | $ | 133,572 | |||||||||
Net income per share attributable to Worldpay, Inc. Class A common stock: | |||||||||||||||||||
Basic | $ | 0.81 | $ | 1.37 | $ | 1.02 | $ | 0.88 | $ | 0.96 | |||||||||
Diluted | $ | 0.80 | $ | 1.32 | $ | 0.95 | $ | 0.75 | $ | 0.87 | |||||||||
Shares used in computing net income per share of Class A common stock: | |||||||||||||||||||
Basic | 161,293,062 | 156,043,636 | 145,044,577 | 141,936,933 | 138,836,314 | ||||||||||||||
Diluted | 162,807,146 | 162,115,549 | 200,934,442 | 199,170,813 | 206,027,557 | ||||||||||||||
As of December 31, | |||||||||||||||||||
2017 | 2016 | 2015 | 2014 | 2013 | |||||||||||||||
(in thousands) | |||||||||||||||||||
Balance sheet data: | |||||||||||||||||||
Cash and cash equivalents | $ | 126,503 | $ | 139,148 | $ | 197,096 | $ | 411,568 | $ | 171,427 | |||||||||
Total assets | 8,666,973 | 7,044,007 | 6,465,426 | 6,336,083 | 4,189,553 | ||||||||||||||
Total long-term liabilities | 6,231,861 | 3,747,706 | 3,944,981 | 4,072,164 | 2,327,918 | ||||||||||||||
Non-controlling interests | 68,115 | 291,624 | 272,278 | 397,573 | 408,391 | ||||||||||||||
Total equity | 600,654 | 1,607,289 | 1,225,066 | 1,300,586 | 1,176,322 | ||||||||||||||
34
Item 7. Management’s Discussion and Analysis of Financial Condition and Results of Operations
This management’s discussion and analysis provides a review of the results of operations, financial condition and liquidity and capital resources of Worldpay, Inc., formerly Vantiv, Inc. (“Worldpay”, “we”, “us”, “our” or the “company” refer to Worldpay, Inc. and its consolidated subsidiaries) and outlines the factors that have affected recent results, as well as those factors that may affect future results. Our actual results in the future may differ materially from those anticipated in these forward looking statements as a result of many factors, including those set forth under “Risk Factors,” Forward Looking Statements” and elsewhere in this report. The following discussion and analysis should be read in conjunction with the consolidated financial statements and related notes included in “Item 8 - Financial Statements and Supplementary Data” of this report.
Overview
Worldpay is the largest merchant acquirer and the largest PIN debit acquirer by number of transactions, according to the Nilson Report, and a leading payment processor in the United States differentiated by our U.S. technology platform, breadth of distribution and superior cost structure. Our U.S. technology platform enables us to efficiently provide a comprehensive suite of services to both merchants and financial institutions of all sizes as well as to innovate, develop and deploy new services, while providing us with significant economies of scale. Our broad and varied distribution provides us with a growing and diverse client base of merchants and financial institutions. Our merchant client base includes merchant locations across the United States and is heavily-weighted in non-discretionary everyday spend categories where spending has generally been more resilient during economic downturns. In 2017, we processed approximately 23 billion transactions for these merchants. Our financial institution client base includes regional banks, community banks, credit unions and regional PIN debit networks. In 2017, we processed approximately 3.5 billion transactions for these financial institutions. See Item 1 - Business for a more detailed discussion of the business overview.
Executive Overview
Revenue for the year ended December 31, 2017 increased 13% to $4,026.5 million from $3,579.0 million in 2016.
Income from operations for the year ended December 31, 2017 decreased 8% to $521.5 million from $568.5 million in 2016.
Net income for the year ended December 31, 2017 decreased 35% to $182.7 million from $280.9 million in 2016. Net income attributable to Worldpay, Inc. for the year ended December 31, 2017 decreased 39% to $130.1 million from $213.2 million in 2016. See the “Results of Operations” section of this Management’s Discussion and Analysis for a discussion of our financial results.
In October 2016, our board of directors authorized a program to repurchase up to $250 million of our Class A common stock. We currently have approximately $243 million of share repurchase authority remaining as of December 31, 2017 under this authorization.
Recent Acquisitions
On January 16, 2018, we completed the acquisition of Worldpay Group Limited, formerly Worldpay Group plc, a public limited company (“Legacy Worldpay”) by acquiring 100% of the issued and outstanding shares. The approximately $11.9 billion purchase price consisted of Legacy Worldpay shareholders receiving 55 pence in cash and 0.0672 new shares of our Class A common stock for each Legacy Worldpay ordinary share held. As of the closing of the acquisition, Legacy Worldpay had 2,000,000,000 shares outstanding, thus resulting in an approximately $1.5 billion cash payment and 134.4 million shares of our Class A common stock being issued to fund the acquisition.
In addition, the Legacy Worldpay shareholders received an interim dividend of 0.8 pence per Legacy Worldpay ordinary share paid on October 23, 2017 by Legacy Worldpay and a special dividend of 4.2 pence per Legacy Worldpay ordinary share paid by Worldpay shortly after the acquisition date.
The acquisition creates a leading global integrated payment technology and international eCommerce payment provider and will enable us to take advantage of strategic and innovative opportunities to provide differentiated and diversified solutions to address clients’ needs.
35
On January 16, 2018, our Class A common stock began trading on the New York Stock Exchange under the new symbol “WP” and on the London Stock Exchange via a secondary standard listing under the symbol “WPY.” Legacy Worldpay shares were delisted from the London Stock Exchange on the same day.
On May 25, 2017, we acquired Paymetric Holdings, Inc. (“Paymetric”) for $532 million in cash, which is net of cash acquired. We funded the acquisition with cash on hand and borrowings under our revolving credit facility. Paymetric automates business-to-business payment workflows within enterprise systems and tokenizes payments data within these systems in order to enable secure storage of customer information and history. This acquisition helps to further accelerate our growth. The operations of Paymetric are included in our Merchant Services segment operating results.
Fifth Third Share Purchase
On August 9, 2017, pursuant to a transaction agreement with Fifth Third Bank, we purchased 19,790,000 shares of our Class A common stock directly from Fifth Third Bank at a price of $64.04 per share. The total purchase price of approximately $1.27 billion was funded with an additional Term B Loan. In connection with the purchase, we recorded a liability of approximately $647.5 million during the quarter ended September 30, 2017 under the tax receivable agreement with Fifth Third Bank.
Our Segments, Revenue and Expenses
Segments
We report our results of operations in two segments, Merchant Services and Financial Institution Services. We evaluate segment performance based upon segment profit, which is defined as net revenue, which represents total revenue less network fees and other costs, less sales and marketing expense attributable to that segment. See “Item 1 - Business” for a more detailed discussion of the business segments.
Revenue
We generate revenue primarily by processing electronic payment transactions. Set forth below is a description of our revenues by segment and factors impacting segment revenues.
Our Merchant Services segment revenues are primarily derived from processing credit and debit card transactions. Merchant Services revenue is primarily comprised of fees charged to businesses, net of interchange fees, for payment processing services, including authorization, capture, clearing, settlement and information reporting of electronic transactions. The fees charged consist of either a percentage of the dollar volume of the transaction or a fixed fee, or both, and are recognized at the time of the transaction. Merchant Services revenue also includes a number of revenue items that are incurred by us and are reimbursable as the costs are passed through to and paid by our clients. These items primarily consist of Visa, Mastercard and other payment network fees. In addition, for sales through referral partners in which we are the primary party to the contract with the merchant, we record the full amount of the fees collected from the merchant as revenue. Associated residual payments made to referral partners are included in sales and marketing expenses. Merchant Services revenue also includes revenue from ancillary services such as fraud management, equipment sales and terminal rent. Revenue in our Merchant Services segment is impacted primarily by transaction volume, average transaction size, the mix of merchant types in our client portfolio, the performance of our merchant clients and the effectiveness of our distribution channels.
Our Financial Institution Services revenues are primarily derived from debit, credit and ATM card transaction processing, ATM driving and support, and PIN debit processing services. Financial Institution Services revenue associated with processing transactions includes per transaction and account related fees, card production fees and fees generated from our Jeanie network. Financial Institution Services revenue is impacted by the number of financial institutions using our services as well as their transaction volume. The number of financial institutions in the United States has declined as a result of prevailing economic conditions and consolidation, as well as other market and regulatory pressures. These factors have contributed to industry-wide pricing compression of the fees that financial institutions are willing to pay for payment processing.
36
Network Fees and Other Costs
Network fees and other costs primarily consist of pass through expenses incurred by us in connection with providing processing services to our clients, including Visa and Mastercard network association fees and payment network fees.
Net Revenue
Net revenue is revenue, less network fees and other costs and reflects revenue generated from the services we provide to our clients. Management uses net revenue to assess our operating performance. We believe that net revenue, when reviewed together with revenue, is meaningful to our investors in order to understand our performance.
Expenses
Set forth below is a brief description of the components of our expenses, aside from the network fees and other costs discussed above:
• | Sales and marketing expense primarily consists of salaries and benefits paid to sales personnel, sales management and other sales and marketing personnel, residual payments made to referral partners and advertising and promotional costs. |
• | Other operating costs primarily consist of salaries and benefits paid to operational and IT personnel, costs associated with operating our technology platform and data centers, information technology costs for processing transactions, product development costs, software fees and maintenance costs. |
• | General and administrative expenses primarily consist of salaries and benefits paid to executive management and administrative employees, including finance, human resources, product development, legal and risk management, share-based compensation costs, equipment and occupancy costs and consulting costs. The year ended December 31, 2017 includes a charge related to a settlement agreement stemming from legacy litigation of an acquired company. |
• | Depreciation and amortization expense consists of our depreciation expense related to investments in property, equipment and software as well as our amortization of intangible assets. |
• | Interest expense—net consists primarily of interest on borrowings under our senior secured credit facilities less interest income earned on our cash and cash equivalents. |
• | Income tax expense represents federal, state and local taxes based on income in multiple jurisdictions. |
• | Non-operating income (expense) during the year ended December 31, 2017 primarily consists of a gain relating to the impact to the tax receivable agreement (“TRA”) liability as a result of the Tax Cuts and Jobs Act (“Tax Reform”) being enacted on December 22, 2017 and an unrealized gain related to the change in the fair value of a deal contingent foreign currency forward entered into in connection with the Worldpay acquisition, partially offset by the change in fair value of a TRA entered into as part of the acquisition of Mercury Payment Systems, LLC (“Mercury”). The 2016 amount primarily related to the change in the fair value of the Mercury TRA entered into as part of the acquisition of Mercury and a charge related to the refinancing of our senior secured credit facilities in October 2016. The 2015 amount primarily related to the change in the fair value of the Mercury TRA. |
Non-Controlling Interest
As a result of the non-controlling ownership interests in Vantiv Holding held by Fifth Third, our results of operations include net income attributable to non-controlling interests. Future sales or redemptions of ownership interests in Vantiv Holding by Fifth Third will continue to reduce the amount recorded as non-controlling interest and increase net earnings attributable to our Class A stockholders. In addition, net income attributable to non-controlling interests includes the non-controlling interest related to a joint venture with a bank partner. See Note 9 - Controlling and Non-controlling Interests in “Item 8 - Financial Statements and Supplementary Data” for more information.
37
Factors and Trends Impacting Our Business and Results of Operations
We expect a number of factors will impact our business, results of operations and financial condition. In general, our revenue is impacted by the number and dollar volume of card based transactions which in turn are impacted by general economic conditions, consumer spending and the emergence of new technologies and payment types, such as ecommerce, mobile payments, and prepaid cards. In our Merchant Services segment, our net revenues are impacted by the mix of the size of merchants that we provide services to as well as the mix of transaction volume by merchant category. In our Financial Institution Services segment, our net revenues are also impacted by the mix of the size of financial institutions to which we provide services as well as consolidation and market and industry pressures, which have contributed and are expected to continue to contribute to pricing compression of payment processing fees in this segment. We also expect our results of operations to be impacted by the factors discussed below.
Adjusted Net Income
We use adjusted net income for financial and operational decision making as a means to evaluate period-to-period comparisons of our performance and results of operations. The adjusted net income is also incorporated into performance metrics underlying certain share-based payments issued under the 2012 Worldpay, Inc. Equity Incentive Plan and our annual incentive plan. We believe the adjusted net income provides useful information about our performance and operating results, enhances the overall understanding of past financial performance and future prospects and allows for greater transparency with respect to key metrics used by management in its financial and operational decision making.
In calculating the adjusted net income, we make certain non-GAAP adjustments, as well as certain tax adjustments, to adjust our GAAP operating results for the items discussed below. This non-GAAP measure should be considered together with GAAP operating results.
Non-GAAP Adjustments
Transition, Acquisition and Integration Costs
In connection with our acquisitions, we incur costs associated with the acquisitions and related integration activities, consisting primarily of consulting fees for advisory, conversion and integration services and related personnel costs. Also included in these expenses are costs related to employee termination benefits and other transition activities. These transition, acquisition and integration costs are included in other operating costs and general and administrative expenses. Included in transition, acquisition and integration costs in the year ended December 31, 2017 is a $41.5 million charge to general and administrative expense related to a settlement agreement stemming from legacy litigation of an acquired company.
Share-Based Compensation
We have granted share-based awards to certain employees and members of our board of directors and intend to continue to grant additional share-based awards in the future. Share-based compensation is included in general and administrative expense.
Intangible Amortization Expense
These expenses represent amortization of intangible assets acquired through business combinations and customer portfolio and related asset acquisitions.
Non-operating Income (Expense)
Non-operating income for the year ended December 31, 2017 primarily consisted of a gain relating to the impact to the TRA liability as a result of Tax Reform being enacted on December 22, 2017 and an unrealized gain related to the change in the fair value of a deal contingent forward entered into in connection with the Worldpay acquisition, partially offset by the change in fair value of the Mercury TRA entered into as part of the acquisition of Mercury.
Non-operating expense for the year ended December 31, 2016 primarily consisted of the change in fair value of the Mercury TRA entered into as part of the acquisition of Mercury and a charge related to the refinancing of our senior secured credit facilities in October 2016.
38
Tax Adjustments
Income Tax Expense Adjustments
Our effective tax rate reported in our results of operations reflects the impact of our non-controlling interest not being taxed at the statutory corporate tax rate. For purposes of calculating the adjusted net income, income tax expense is adjusted accordingly to reflect an effective tax rate assuming conversion of Fifth Third’s non-controlling interests into shares of Class A common stock, including the income tax effect of the non-GAAP adjustments described above. The adjusted effective tax rate for the year ended December 31, 2017 is 34.0% and includes the impact of excess tax benefits relating to our adoption of ASU 2016-09, Compensation - Stock Compensation (Topic 718): Improvements to Employee Share-Based Payment Accounting. The adjusted effective tax rate was 36.0% for the year ended December 31, 2016.
Other Tax Adjustments
In addition to the adjustment described above, income tax expense is also adjusted for the cash tax benefits resulting from certain tax attributes, primarily the amortization of tax intangible assets resulting from or acquired with our acquisitions, the tax basis step up associated with our separation from Fifth Third and the purchase or exchange of units of Vantiv Holding, net of payment obligations under TRAs established at the time of our initial public offering (“IPO”) and in connection with our acquisition of Mercury. The estimate of the cash tax benefits is based on the consistent and highly predictable realization of the underlying tax attributes.
The following table provides a schedule of the tax adjustments discussed above which are reflected in the adjusted net income table below:
Year Ended December 31, | ||||||||
2017 | 2016 | |||||||
TRA Tax Benefits (a) | $ | 5,375 | $ | 10,182 | ||||
Acquired Tax Benefits (b) | 124,911 | 65,978 | ||||||
Adjusted Tax Benefits (c) | $ | 130,286 | $ | 76,160 | ||||
(a) Represents the 15% benefit that we retain for the shared tax benefits related to the TRAs.
(b) Represents the tax benefits wholly owned by us, acquired through acquisition or termination of TRAs in which we retain 100% of the benefit.
(c) Represents the net cash tax benefit retained by us from the use of the tax attributes, as reflected in the Tax Adjustments.
The table below provides a reconciliation of GAAP income before applicable income taxes to the adjusted net income for the years ended December 31, 2017 and 2016:
Year Ended December 31, | |||||||
2017 | 2016 | ||||||
(in thousands) | |||||||
Income before applicable income taxes | $ | 813,712 | $ | 422,724 | |||
Non-GAAP Adjustments: | |||||||
Transition, acquisition and integration costs | 130,146 | 37,558 | |||||
Share-based compensation | 47,855 | 35,871 | |||||
Intangible amortization | 217,849 | 190,822 | |||||
Non-operating (income) expenses | (432,826 | ) | 36,256 | ||||
Non-GAAP Adjusted Income Before Applicable Taxes | 776,736 | 723,231 | |||||
Less: Tax Adjustments | |||||||
Adjusted tax expense | 133,804 | 184,203 | |||||
JV non-controlling interest | 1,804 | 1,200 | |||||
Adjusted Net Income | $ | 641,128 | $ | 537,828 | |||
39
Results of Operations
The following tables set forth our statements of income in dollars and as a percentage of net revenue for the periods presented.
Year Ended December 31, | ||||||||||||||
2017 | 2016 | $ Change | % Change | |||||||||||
(dollars in thousands) | ||||||||||||||
Revenue | $ | 4,026,477 | $ | 3,578,991 | $ | 447,486 | 13 | % | ||||||
Network fees and other costs | 1,903,165 | 1,674,230 | 228,935 | 14 | ||||||||||
Net revenue | 2,123,312 | 1,904,761 | 218,551 | 11 | ||||||||||
Sales and marketing | 669,506 | 582,251 | 87,255 | 15 | ||||||||||
Other operating costs | 318,665 | 294,235 | 24,430 | 8 | ||||||||||
General and administrative | 295,101 | 189,707 | 105,394 | 56 | ||||||||||
Depreciation and amortization | 318,493 | 270,054 | 48,439 | 18 | ||||||||||
Income from operations | $ | 521,547 | $ | 568,514 | $ | (46,967 | ) | (8 | )% | |||||
Non-financial data: | ||||||||||||||
Transactions (in millions) | 26,289 | 24,973 | 5 | % | ||||||||||
As a Percentage of Net Revenue | Year Ended December 31, | ||||
2017 | 2016 | ||||
Net revenue | 100.0 | % | 100.0 | % | |
Sales and marketing | 31.5 | 30.6 | |||
Other operating costs | 15.0 | 15.4 | |||
General and administrative | 13.9 | 10.0 | |||
Depreciation and amortization | 15.0 | 14.2 | |||
Income from operations | 24.6 | % | 29.8 | % | |
Fiscal Year Ended December 31, 2017 Compared to Fiscal Year Ended December 31, 2016
Revenue
Revenue increased 13% to $4,026.5 million for the year ended December 31, 2017 from $3,579.0 million for the year ended December 31, 2016. The increase was due primarily to revenue growth in our Merchant segment offset by a slight decrease in revenue in our FI segment.
Network Fees and Other Costs
Network fees and other costs increased 14% to $1,903.2 million for the year ended December 31, 2017 from $1,674.2 million for the year ended December 31, 2016. The increase was due to a combination of transaction growth of 5% and higher network fees.
Net Revenue
Net revenue, which is revenue less network fees and other costs, increased 11% to $2,123.3 million for the year ended December 31, 2017 from $1,904.8 million for the year ended December 31, 2016 due to the factors discussed above.
Sales and Marketing
Sales and marketing expense increased 15% to $669.5 million for the year ended December 31, 2017 from $582.3 million for the year ended December 31, 2016. The increase was primarily attributable to higher residual payments to referral partners as a result of increased revenue in our Merchant Services segment in connection with the continued penetration of small and mid-sized merchants.
40
Other Operating Costs
Other operating costs increased 8% to $318.7 million for the year ended December 31, 2017 from $294.2 million for the year ended December 31, 2016. When excluding transition, acquisition and integration costs, other operating costs increased 6% to $303.8 million for the year ended December 31, 2017 from $285.4 million for the year ended December 31, 2016. The increase is primarily attributable to an increase in information technology and operation costs, in support of our revenue growth as well as $8.9 million relating to the acquisition of Paymetric.
General and Administrative
General and administrative expenses increased 56% to $295.1 million for the year ended December 31, 2017 from $189.7 million for the year ended December 31, 2016. When excluding transition, acquisition and integration costs, which include a $41.5 million charge related to a settlement agreement stemming from legacy litigation of an acquired company, as well as share-based compensation, general and administrative costs increased 5% to $132.0 million for the year ended December 31, 2017 from $125.2 million for the year ended December 31, 2016.
Depreciation and Amortization
Depreciation expense associated with our property, equipment and software increased to $95.9 million for the year ended December 31, 2017 from $70.5 million for the year ended December 31, 2016. The increase is primarily attributable to our recent acquisitions.
Amortization expense associated with intangible assets, which consist primarily of customer relationship intangible assets, increased to $222.6 million for the year ended December 31, 2017 from $199.6 million for the year ended December 31, 2016. The increase is primarily attributable to an increase in amortization of customer relationship intangible assets as a result of recent acquisitions.
Income from Operations
Income from operations decreased 8% to $521.5 million for the year ended December 31, 2017 from $568.5 million for the year ended December 31, 2016.
Interest Expense—Net
Interest expense—net increased to $140.7 million for the year ended December 31, 2017 from $109.5 million for the year ended December 31, 2016. The increase in interest expense—net is primarily attributable to our October 2016 debt refinancing, which resulted in an increase in the amount of outstanding debt, our recent incremental Term B loan and an increase in interest rates.
Non-Operating Income (Expense)
Non-operating income was $432.8 million for the year ended December 31, 2017, primarily consisting of a gain relating to the impact to the TRA liability as a result of Tax Reform being enacted on December 22, 2017 and an unrealized gain relating to the change in the fair value of a deal contingent forward entered into in connection with the Worldpay acquisition, partially offset by the change in fair value of a TRA entered into as part of the acquisition of Mercury. Non-operating expense was $36.3 million for the year ended December 31, 2016, primarily related to the change in fair value of the Mercury TRA and a charge related to the October 2016 debt refinancing.
Income Tax Expense
Income tax expense for the year ended December 31, 2017 was $631.0 million compared to $141.9 million for the year ended December 31, 2016, reflecting effective rates of 77.5% and 33.6%, respectively. The increase in income tax expense is primarily attributable to tax expense of $363.6 million as a result of an adjustment to deferred taxes for the change in tax rates resulting from Tax Reform being enacted on December 22, 2017.
41
Segment Results
The following tables provide a summary of the components of segment profit for our two segments for the years ended December 31, 2017 and 2016.
Merchant Services
Year Ended December 31, | ||||||||||||||
2017 | 2016 | $ Change | % Change | |||||||||||
(dollars in thousands) | ||||||||||||||
Total revenue | $ | 3,567,533 | $ | 3,082,951 | $ | 484,582 | 16 | % | ||||||
Network fees and other costs | 1,780,179 | 1,537,072 | 243,107 | 16 | ||||||||||
Net revenue | 1,787,354 | 1,545,879 | 241,475 | 16 | ||||||||||
Sales and marketing | 646,479 | 557,942 | 88,537 | 16 | ||||||||||
Segment profit | $ | 1,140,875 | $ | 987,937 | $ | 152,938 | 15 | % | ||||||
Non-financial data: | ||||||||||||||
Transactions (in millions) | 22,747 | 20,955 | 9 | % | ||||||||||
Net Revenue
Net revenue in this segment increased 16% to $1,787.4 million for the year ended December 31, 2017 from $1,545.9 million for the year ended December 31, 2016. The increase during the year ended December 31, 2017 was due primarily to transaction growth of 9% and a 7% increase in net revenue per transaction associated with our continued penetration of small and mid-sized merchants and $35.7 million in net revenue from the Paymetric acquisition.
Sales and Marketing
Sales and marketing expense increased 16% to $646.5 million for the year ended December 31, 2017 from $557.9 million for the year ended December 31, 2016. The increase was primarily attributable to higher residual payments to referral partners as a result of increased revenue in connection with the continued penetration of small and mid-sized merchants.
Financial Institution Services
Year Ended December 31, | ||||||||||||||
2017 | 2016 | $ Change | % Change | |||||||||||
(dollars in thousands) | ||||||||||||||
Total revenue | $ | 458,944 | $ | 496,040 | $ | (37,096 | ) | (7 | )% | |||||
Network fees and other costs | 122,986 | 137,158 | (14,172 | ) | (10 | ) | ||||||||
Net revenue | 335,958 | 358,882 | (22,924 | ) | (6 | ) | ||||||||
Sales and marketing | 23,027 | 24,309 | (1,282 | ) | (5 | ) | ||||||||
Segment profit | $ | 312,931 | $ | 334,573 | $ | (21,642 | ) | (6 | )% | |||||
Non-financial data: | ||||||||||||||
Transactions (in millions) | 3,542 | 4,018 | (12 | )% | ||||||||||
Net Revenue
Net revenue in this segment decreased 6% to $336.0 million for the year ended December 31, 2017 from $358.9 million for the year ended December 31, 2016. The decrease during the year ended December 31, 2017 was due to the de-conversion of a major client and approximately $8.1 million relating to compression from the Fifth Third contract renewal.
Sales and Marketing
Sales and marketing expense decreased 5% to $23.0 million for the year ended December 31, 2017 from $24.3 million for the year ended December 31, 2016.
42
Fiscal Year Ended December 31, 2016 Compared to Fiscal Year Ended December 31, 2015
The following tables set forth our statements of income in dollars and as a percentage of net revenue for the periods presented.
Year Ended December 31, | ||||||||||||||
2016 | 2015 | $ Change | % Change | |||||||||||
(dollars in thousands) | ||||||||||||||
Revenue | $ | 3,578,991 | $ | 3,159,938 | $ | 419,053 | 13 | % | ||||||
Network fees and other costs | 1,674,230 | 1,478,202 | 196,028 | 13 | ||||||||||
Net revenue | 1,904,761 | 1,681,736 | 223,025 | 13 | ||||||||||
Sales and marketing | 582,251 | 503,949 | 78,302 | 16 | ||||||||||
Other operating costs | 294,235 | 284,066 | 10,169 | 4 | ||||||||||
General and administrative | 189,707 | 182,369 | 7,338 | 4 | ||||||||||
Depreciation and amortization | 270,054 | 276,942 | (6,888 | ) | (2 | ) | ||||||||
Income from operations | $ | 568,514 | $ | 434,410 | $ | 134,104 | 31 | % | ||||||
Non-financial data: | ||||||||||||||
Transactions (in millions) | 24,973 | 22,991 | 9 | % | ||||||||||
As a Percentage of Net Revenue | Year Ended December 31, | ||||
2016 | 2015 | ||||
Net revenue | 100.0 | % | 100.0 | % | |
Sales and marketing | 30.6 | 30.0 | |||
Other operating costs | 15.4 | 16.9 | |||
General and administrative | 10.0 | 10.8 | |||
Depreciation and amortization | 14.2 | 16.5 | |||
Income from operations | 29.8 | % | 25.8 | % | |
Revenue
Revenue increased 13% to $3,579.0 million for the year ended December 31, 2016 from $3,159.9 million for the year ended December 31, 2015. The increase was due to transaction growth of 9%. Additionally, growth in our Merchant Services segment as a result of our continued penetration of small and mid-sized merchants contributed to higher net revenue per transaction.
Network Fees and Other Costs
Network fees and other costs increased 13% to $1,674.2 million for the year ended December 31, 2016 from $1,478.2 million for the year ended December 31, 2015. The increase was due to a combination of transaction growth of 9% and rising pass through expenses.
Net Revenue
Net revenue, which is revenue less network fees and other costs, increased 13% to $1,904.8 million for the year ended December 31, 2016 from $1,681.7 million for the year ended December 31, 2015 due to the factors discussed above.
Sales and Marketing
Sales and marketing expense increased 16% to $582.3 million for the year ended December 31, 2016 from $503.9 million for the year ended December 31, 2015. The increase was primarily attributable to higher residual payments to referral partners as a result of increased revenue in our Merchant Services segment in connection with the continued penetration of small and mid-sized merchants.
43
Other Operating Costs
Other operating costs increased 4% to $294.2 million for the year ended December 31, 2016 from $284.1 million for the year ended December 31, 2015. When excluding transition, acquisition and integration costs, other operating costs increased 11% to $285.4 million for the year ended December 31, 2016 from $256.3 million for the year ended December 31, 2015. The increase was primarily attributable to an increase in the information technology and operation costs, in support of our revenue growth.
General and Administrative
General and administrative expenses increased 4% to $189.7 million for the year ended December 31, 2016 from $182.4 million for the year ended December 31, 2015. When excluding transition, acquisition and integration costs as well as share-based compensation, general and administrative costs increased 7% to $125.2 million for the year ended December 31, 2016 from $117.1 million for the year ended December 31, 2015. General and administrative expenses continue to grow slower than net revenue as we continue to drive efficiencies in the back office.
Depreciation and Amortization
Depreciation expense associated with our property, equipment and software decreased to $70.5 million for the year ended December 31, 2016 from $76.6 million for the year ended December 31, 2015.
Amortization expense associated with intangible assets, which consist primarily of customer relationship intangible assets, decreased to $199.6 million for the year ended December 31, 2016 from $200.4 million for the year ended December 31, 2015.
Income from Operations
Income from operations increased 31% to $568.5 million for the year ended December 31, 2016 from $434.4 million for the year ended December 31, 2015.
Interest Expense—Net
Interest expense—net increased to $109.5 million for the year ended December 31, 2016 from $105.7 million for the year ended December 31, 2015. The increase in interest expense—net is primarily attributable to our interest rate swaps.
Non-Operating Income (Expense)
Non-operating expenses were $36.3 million for the year ended December 31, 2016, related to the change in fair value of the Mercury TRA entered into as part of the acquisition of Mercury and a charge related to the October 2016 debt refinancing. Non-operating expense was $31.3 million for the year ended December 31, 2015, primarily related to the change in fair value of the Mercury TRA.
Income Tax Expense
Income tax expense for the year ended December 31, 2016 was $141.9 million compared to $88.2 million for the year ended December 31, 2015, reflecting effective rates of 33.6% and 29.6%, respectively. Our effective rate reflects the impact of our non-controlling interest not being taxed at the statutory corporate tax rates. As our non-controlling interest declines to the point Vantiv Holding is a wholly-owned subsidiary, we expense our effective rate to increase to approximately 36.0%.
44
Segment Results
The following tables provide a summary of the components of segment profit for our two segments for the years ended December 31, 2016 and 2015.
Merchant Services
Year Ended December 31, | ||||||||||||||
2016 | 2015 | $ Change | % Change | |||||||||||
(dollars in thousands) | ||||||||||||||
Total revenue | $ | 3,082,951 | $ | 2,656,906 | $ | 426,045 | 16 | % | ||||||
Network fees and other costs | 1,537,072 | 1,321,312 | 215,760 | 16 | ||||||||||
Net revenue | 1,545,879 | 1,335,594 | 210,285 | 16 | ||||||||||
Sales and marketing | 557,942 | 478,736 | 79,206 | 17 | ||||||||||
Segment profit | $ | 987,937 | $ | 856,858 | $ | 131,079 | 15 | % | ||||||
Non-financial data: | ||||||||||||||
Transactions (in millions) | 20,955 | 18,959 | 11 | % | ||||||||||
Net Revenue
Net revenue in this segment increased 16% to $1,545.9 million for the year ended December 31, 2016 from $1,335.6 million for the year ended December 31, 2015. The increase during the year ended December 31, 2016 was due primarily to transaction growth of 11% and a 5% increase in net revenue per transaction associated with our continued penetration of small and mid-sized merchants.
Sales and Marketing
Sales and marketing expense increased 17% to $557.9 million for the year ended December 31, 2016 from $478.7 million for the year ended December 31, 2015. The increase was primarily attributable to higher residual payments to referral partners as a result of increased revenue in connection with the continued penetration of small and mid-sized merchants.
Financial Institution Services
Year Ended December 31, | ||||||||||||||
2016 | 2015 | $ Change | % Change | |||||||||||
(dollars in thousands) | ||||||||||||||
Total revenue | $ | 496,040 | $ | 503,032 | $ | (6,992 | ) | (1 | )% | |||||
Network fees and other costs | 137,158 | 156,890 | (19,732 | ) | (13 | ) | ||||||||
Net revenue | 358,882 | 346,142 | 12,740 | 4 | ||||||||||
Sales and marketing | 24,309 | 25,213 | (904 | ) | (4 | ) | ||||||||
Segment profit | $ | 334,573 | $ | 320,929 | $ | 13,644 | 4 | % | ||||||
Non-financial data: | ||||||||||||||
Transactions (in millions) | 4,018 | 4,032 | — | % | ||||||||||
Net Revenue
Net revenue in this segment increased 4% to $358.9 million for the year ended December 31, 2016 from $346.1 million for the year ended December 31, 2015. The increase during the year ended December 31, 2016 was due to a 4% increase in net revenue per transaction primarily due to value-added services including the impact of EMV card reissuance and fraud related services.
Sales and Marketing
Sales and marketing expense decreased $0.9 million to $24.3 million for the year ended December 31, 2016 from $25.2 million for the year ended December 31, 2015.
45
Liquidity and Capital Resources
Our liquidity is funded primarily through cash provided by operations, debt and a line of credit, which is generally sufficient to fund our operations, planned capital expenditures, tax distributions made to our non-controlling interest holders, required payments under our TRA agreements, debt service and acquisitions. As of December 31, 2017, our principal sources of liquidity consisted of $126.5 million of cash and cash equivalents and $425.0 million of availability under the revolving portion of our senior secured credit facilities. Our total indebtedness, including capital leases, was $5.7 billion as of December 31, 2017.
We have approximately $243 million of share repurchase authority remaining as of December 31, 2017 under a program authorized by the board of directors in October 2016 to repurchase up to an additional $250 million of our Class A common stock.
Purchases under the repurchase programs are allowed from time to time in the open market, in privately negotiated transactions, or otherwise. The manner, timing, and amount of any purchases are determined by management based on an evaluation of market conditions, stock price, and other factors. The share repurchase programs have no expiration date and we may discontinue purchases at any time that management determines additional purchases are not warranted.
In connection with our IPO, we entered into the Exchange Agreement with Fifth Third, under which Fifth Third has the right, from time to time, to exchange their units in Vantiv Holding for shares of our Class A common stock or, at our option, cash. If we choose to satisfy the exchange in cash, we anticipate that we will fund such exchange through cash from operations, funds available under the revolving portion of our senior secured credit facilities, equity financings or a combination thereof.
Except for the dividend paid in connection with the Legacy Worldpay acquisition, we do not intend to pay cash dividends on our Class A common stock in the foreseeable future. Worldpay, Inc. is a holding company that does not conduct any business operations of its own. As a result, Worldpay, Inc.’s ability to pay cash dividends on its common stock, if any, is dependent upon cash dividends and distributions and other transfers from Vantiv Holding. The amounts available to Worldpay, Inc. to pay cash dividends are subject to the covenants and distribution restrictions in its subsidiaries’ loan agreements.
In addition to principal needs for liquidity discussed above, our strategy includes investing in and leveraging our integrated business model and technology platform, broadening and deepening our distribution channels, entry into new geographic markets and development of additional payment processing services. Our near-term priorities for capital allocation include debt reduction, investing in our operations to support organic growth, and share repurchases. Long-term priorities remain unchanged and include investing for growth through strategic acquisitions and returning excess capital to shareholders.
We anticipate that to the extent that we require additional liquidity, it will be funded through the incurrence of other indebtedness, equity financings or a combination thereof. We cannot assure you that we will be able to obtain this additional liquidity on reasonable terms, or at all. Additionally, our liquidity and our ability to meet our obligations and fund our capital requirements are also dependent on our future financial performance, which is subject to general economic, financial and other factors that are beyond our control. Accordingly, we cannot assure you that our business will generate sufficient cash flow from operations or that future borrowings will be available under our credit facilities or otherwise to meet our liquidity needs. If we decide to pursue one or more significant acquisitions, we may incur additional debt or sell additional equity to finance such acquisitions.
Cash Flows
The following table presents a summary of cash flows from operating, investing and financing activities for the years ended December 31, 2017, 2016 and 2015 (in thousands). The year ended December 31, 2017 reflects restricted cash and the years ended December 31, 2016 and 2015 have been adjusted as a result of the early adoption of two new accounting pronouncements in 2017 as discussed in Note 1 - Basis of Presentation and Summary of Significant Accounting Policies.
Year Ended December 31, | |||||||||||
2017 | 2016 | 2015 | |||||||||
Net cash provided by operating activities | $ | 784,811 | $ | 645,135 | $ | 727,580 | |||||
Net cash used in investing activities | (684,123 | ) | (570,121 | ) | (126,727 | ) | |||||
Net cash provided by (used in) financing activities | 1,032,367 | (132,962 | ) | (815,325 | ) | ||||||
46
Cash Flow from Operating Activities
Net cash provided by operating activities was $784.8 million for the year ended December 31, 2017 as compared to $645.1 million for the year ended December 31, 2016. The increase is due primarily to changes in accounts receivable and net settlement assets and obligations. Settlement assets and obligations can fluctuate due to seasonality as well as day of the month end.
Net cash provided by operating activities was $645.1 million for the year ended December 31, 2016 as compared to $727.6 million for the year ended December 31, 2015. The decrease is due primarily to an increase in accounts receivable balance and a decrease in net settlement assets and obligations. Settlement assets and obligations can fluctuate due to seasonality as well as day of the month end.
Cash Flow from Investing Activities
Net cash used in investing activities was $684.1 million for the year ended December 31, 2017 as compared to $570.1 million for the year ended December 31, 2016. The increase was primarily due to the acquisition of Paymetric.
Net cash used in investing activities was $570.1 million for the year ended December 31, 2016 as compared to $126.7 million for the year ended December 31, 2015. The increase was primarily due to the acquisition of Moneris USA as well as an increase in capital expenditures and premium paid to enter into the interest rate caps.
Cash Flow from Financing Activities
Net cash provided by financing activities was $1,032.4 million for the year ended December 31, 2017 as compared to net cash used of $133.0 million for the year ended December 31, 2016. Cash provided by financing activities during the year ended December 31, 2017 consisted primarily of proceeds from issuance of additional seven-year term B loans, proceeds from issuance of senior unsecured notes and borrowings under our revolving credit facility, partially offset by the purchase of Class A common stock from Fifth Third, repayment of debt and capital leases, payments under tax receivable agreements and addendums, and distributions to non-controlling interests.
Net cash used in financing activities was $133.0 million for the year ended December 31, 2016 as compared to $815.3 million for the year ended December 31, 2015. Cash used in financing activities during the year ended December 31, 2016 consisted primarily of payments and settlements made under tax receivable agreements, the repurchase of Class A common stock and distributions to non-controlling interests. Cash used in financing activities was partially offset by proceeds from the October 2016 debt refinancing.
Credit Facilities
At December 31, 2017, we have $2.3 billion, $2.0 billion and $1.1 billion outstanding under our term A loans, term B loans and senior unsecured notes, respectively, and there were outstanding borrowings of $225.0 million on our revolving credit facility. See additional discussion in Note 6 - Long-Term Debt in “Item 8 - Financial Statements and Supplementary Data.”
The Existing Loan Agreement at December 31, 2017 requires us to maintain a leverage ratio no greater than 4.75 to 1.00 (based upon the ratio of total funded debt to consolidated EBITDA, as defined in the loan agreement) and a minimum interest coverage ratio of 4.00 to 1.00 (based upon the ratio of consolidated EBITDA to interest expense). As of December 31, 2017, we were in compliance with these covenants with a leverage ratio of 4.03 to 1.00 and an interest coverage ratio of 8.73 to 1.00.
47
As of the completion of the Legacy Worldpay acquisition on January 16, 2018, our outstanding debt consisted of the following (in thousands):
January 16, 2018 | |||
Term A-5 loan, maturing in January 2023(1) | $ | 3,771,731 | |
Term A-3 loan, maturing in October 2021(2) | 179,175 | ||
Term B-4 loan, maturing in August 2024(3) | 1,805,000 | ||
Term B-3 loan, maturing in October 2023(4) | 757,350 | ||
Senior Unsecured Dollar Notes, maturing in November 2025(5) | 500,000 | ||
Senior Unsecured Sterling Notes, maturing in November 2025(6) | 648,859 | ||
Senior Unsecured Euro Note, expiring in November 2022(7) | 613,175 | ||
Leasehold mortgage, expiring on August 10, 2021(8) | 10,131 | ||
Notes payable and note payable to related party | $ | 8,285,421 | |
(1) | Interest at a variable base rate (LIBOR) plus a spread rate (225 basis points) (total rate of 3.81% at January 16, 2018) and amortizing on a basis of 1.25% per quarter during each of the first twelve quarters (June 2018 through March 2021), 1.875% per quarter during the next four quarters (June 2021 through March 2022) and 2.50% per quarter during the next three quarters (June 2022 through December 2022) with a balloon payment due at maturity. |
(2) | Interest at a variable base rate (LIBOR) plus a spread rate (200 basis points) (total rate of 3.56% at January 16, 2018) and amortizing on a basis of 1.32% per quarter during each of the first eight quarters (March 2018 through December 2019), 1.97% per quarter during the next four quarters (March 2020 through December 2020) and 2.63% per quarter during the next three quarters (March 2021 through September 2021) with a balloon payment due at maturity. |
(3) | Interest at a variable base rate (LIBOR) plus a spread rate (200 basis points) (total rate of 3.56% at January 16, 2018) and amortizing on a basis of 0.25% per quarter, with a balloon payment due at maturity. |
(4) | Interest at a variable base rate (LIBOR) plus a spread rate (200 basis points) (total rate of 3.56% at January 16, 2018) and amortizing on a basis of 0.25% per quarter, with a balloon payment due at maturity. |
(5) | $500 million principal senior unsecured notes with interest payable semi-annually at a fixed rate of 4.375% and principal due upon maturity. |
(6) | £470 million principal senior unsecured notes with interest payable semi-annually at a fixed rate of 3.875% and principal due upon maturity. The spot rate of 1.3806 U.S. dollars per Pound Sterling at January 16, 2018 was used to translate the Note to U.S. dollars. |
(7) | €500 million principal senior unsecured note with interest payable semi-annually at a fixed rate of 3.75% and principal due upon maturity. The spot rate of 1.2264 U.S. dollars per Euro at January 16, 2018 was used to translate the Note to U.S. dollars. |
(8) | Interest payable monthly at a fixed rate of 6.22%. |
Prior to the closing of the Legacy Worldpay acquisition, we entered into multiple amendments to the Existing Loan Agreement, which became effective at the closing of the acquisition. The resulting incremental funding is as follows:
• | $1.605 billion of additional five-year term Tranche A-5 loans (included in table above) |
• | $535.0 million of additional seven-year term Tranche B-4 loans (included in table above) |
• | $600.0 million of additional revolving credit commitments, resulting in total available revolving credit of $1.25 billion (no outstanding balance at January 16, 2018) |
• | $594.5 million backstop Tranche B-2 (no outstanding balance at January 16, 2018) |
The amendments to the Existing Loan Agreement, as of the completion of the Legacy Worldpay acquisition, requires us to maintain a leverage ratio no greater than established thresholds (based upon the ratio of total funded debt to consolidated EBITDA, as defined in the loan agreement) and a minimum interest coverage ratio (based upon the ratio of consolidated EBITDA to interest expense), which are tested quarterly based on the last four fiscal quarters. The required financial ratios become more restrictive over time, with the specific ratios required by period set forth in the below table.
Period | Leverage Ratio (must not exceed) | Interest Coverage Ratio (must exceed) | ||
January 16, 2018 to September 30, 2018 | 6.50 to 1.00 | 4.00 to 1.00 | ||
December 31, 2018 to September 30, 2019 | 5.75 to 1.00 | 4.00 to 1.00 | ||
December 31, 2019 to September 30, 2020 | 5.00 to 1.00 | 4.00 to 1.00 | ||
December 31, 2020 and thereafter | 4.25 to 1.00 | 4.00 to 1.00 | ||
48
Interest Rate Swaps and Caps
As of December 31, 2017, we have a total of 4 outstanding interest rate swaps and 6 interest rate cap agreements that were designated as cash flow hedges of interest rate risk. See Note 8 - Derivatives and Hedging Activities in “Item 8 - Financial Statements and Supplementary Data” for more information about the interest rate swaps and caps.
Tax Receivable Agreements
As of December 31, 2017, we are party to several TRAs in which we agree to make payments to various parties of 85% of the federal, state, local and foreign income tax benefits realized by us as a result of certain tax deductions. Unless amended as discussed further below, payments under the TRAs will be based on our tax reporting positions and are only required to the extent we realize cash savings as a result of the underlying tax attributes. The cash savings realized by us are computed by comparing our actual income tax liability to the amount of such taxes we would have been required to pay had there been no deductions related to the tax attributes. Under the agreement between us and Fifth Third dated August 7, 2017, in certain specified circumstances, we may be required to make payments in excess of such cash savings.
Obligations recorded pursuant to the TRAs are based on estimates of future deductions and future tax rates. On an annual basis, we evaluate the assumptions underlying the TRA obligations.
On December 22, 2017 the President of the United States signed into law Tax Reform, which amends the Internal Revenue Code to reduce tax rates and modify policies, credits and deductions for businesses. The changes to the federal tax rate and other modifications of the tax code have a material impact on TRA benefits related to the 2018 and future tax years. As a result of Tax Reform, we reduced our TRA liability to reflect the impact of the lower rate for tax years beginning after December 31, 2017 by $418.9 million.
In connection with the Fifth Third share purchase discussed in Note 9 - Controlling and Non-controlling Interests in “Item 8 - Financial Statements and supplementary data”, we recorded a liability of approximately $647.5 million during the
quarter ending September 30, 2017 under the tax receivable agreements we entered into with Fifth Third Bank at the time of our IPO. This liability is based on the closing share price of our Class A common stock on August 4, 2017.
In July 2016, we entered into a purchase addendum in connection with our TRA with Fifth Third (the “Fifth Third TRA Addendum”) to terminate and settle a portion of our obligations owed to Fifth Third under the Fifth Third TRA and the NPC TRA. We are granted call options (collectively, the “Fifth Third Call Options”) pursuant to which certain additional obligations under the Fifth Third TRA and the NPC TRA would be terminated and settled in consideration for cash payments. In the unlikely event we do not exercise Fifth Third Call Options, Fifth Third is granted put options pursuant to which certain these obligations would also be terminated in consideration for cash payments with similar amounts to the Fifth Third Call Options.
Under the terms of the Fifth Third TRA Addendum, we made payments of approximately $63.4 million and $116.3 million to settle approximately $157.6 million and $330.7 million of Fifth Third TRA obligations in 2017 and 2016, respectively, the difference of the obligations settled and the cash paid was recorded as an addition to paid-in capital, net of deferred taxes. The remaining call/put options, if exercised require payments of $25.6 million, $26.4 million, $27.2 million and $28.1 million, effectively due on March 31, 2018, June 30, 2018, September 30, 2018 and December 31, 2018, respectively.
Since Fifth Third was a significant stockholder in 2016, a special committee of our board of directors comprised of independent, disinterested directors authorized the TRA Addendum.
During 2015, we entered into the Mercury TRA Addendum with each of the pre-acquisition owners of Mercury ("Mercury TRA Holders"). We exercised all previous eligible options. We have two remaining options that can be exercised beginning December 1st of each 2017 and 2018, and ending June 30th of 2018 and 2019, pursuant to which certain additional obligations under the Mercury TRA would be terminated in consideration for cash payments of $38.0 million and $43.0 million, respectively. In the unlikely event we do not exercise the relevant Mercury Call Option, the Mercury TRA Holders are granted put options to which certain these obligations would also be terminated in consideration for cash payments with similar amounts to the Mercury Call Options.
Except to the extent our obligations under the Mercury TRA, the Fifth Third TRA and the NPC TRA have been terminated and settled in full in accordance with the terms of the Mercury TRA and Fifth Third TRA Addendums, the Mercury
49
TRA, Fifth Third TRA and the NPC TRA will each remain in effect, and the parties thereto will continue to have all rights and obligations thereunder.
All TRA obligations are recorded based on the full and undiscounted amount of the expected future payments, except for the Mercury TRA which represents contingent consideration relating to an acquired business, and is recorded at fair value for financial reporting purposes (see Note 15 - Fair Value Measurements in “Item 8 - Financial Statements and Supplementary Data”). The following table reflects TRA activity and balances for the year ended December 31, 2017 (in thousands):
Balance as of December 31, 2016 | 2017 TRA Payment | 2017 TRA Settlements | 2017 Fifth Third Share Purchase | Change in Value(1) | Balance as of December 31, 2017 | ||||||||||||||||||
TRA with Fifth Third Bank | $ | 642,332 | $ | (33,355 | ) | $ | (157,626 | ) | $ | 647,507 | $ | (418,858 | ) | $ | 680,000 | ||||||||
Mercury TRA | 147,040 | (22,340 | ) | (38,100 | ) | — | 13,971 | 100,571 | |||||||||||||||
Total | $ | 789,372 | $ | (55,695 | ) | $ | (195,726 | ) | $ | 647,507 | $ | (404,887 | ) | $ | 780,571 | ||||||||
(1) Change in TRA with Fifth Third bank is due to Tax Reform.
The timing and/or amount of aggregate payments due under the TRAs outside of the call/put structures may vary based on a number of factors, including the amount and timing of the taxable income we generate in the future and the tax rate then applicable, the use of loss carryovers and amortizable basis. Payments under the TRAs, if necessary, are required to be made no later than January 5th of the second year immediately following the taxable year in which the obligation occurred. We made a payment under the TRA obligations of approximately $61.7 million in January 2018. The January 2018 payment is recorded as current portion of tax receivable agreement obligations on the accompanying consolidated statement of financial position. Unless settled under the terms of the repurchase addenda, the term of the TRAs will continue until all the underlying tax benefits have been utilized or expired.
If Fifth Third Bank had exchanged its remaining Class B units of Vantiv Holding all for shares of Class A common stock on December 31, 2017, we would have recorded an additional full and undiscounted TRA obligation of approximately $350 million. This estimate is subject to material change based on changes in Fifth Third Bank’s tax basis in the partnership interest, changes in tax rates, or significant changes in our stock price.
See additional discussion in Note 7 - Tax Receivable Agreements in “Item 8 - Financial Statements and Supplementary Data.”
Contractual Obligations
The following table summarizes our (including Legacy Worldpay) contractual obligations and commitments as of December 31, 2017:
Payments Due By Period | |||||||||||||||||||
Total | Less than 1 year | 1 - 3 Years | 3 - 5 Years | More than 5 Years | |||||||||||||||
(in thousands) | |||||||||||||||||||
Operating leases | $ | 222,031 | $ | 35,631 | $ | 58,191 | $ | 42,271 | $ | 85,938 | |||||||||
Capital leases | 50,969 | 30,591 | 20,378 | — | — | ||||||||||||||
Borrowings(1) | 10,214,044 | 487,761 | 1,060,257 | 1,959,153 | 6,706,873 | ||||||||||||||
Purchase commitments(2)(3) | 168,486 | 60,419 | 54,507 | 29,560 | 24,000 | ||||||||||||||
Obligations under TRAs(4) | 750,767 | 207,075 | 100,264 | 52,040 | 391,388 | ||||||||||||||
Total | $ | 11,406,297 | $ | 821,477 | $ | 1,293,597 | $ | 2,083,024 | $ | 7,208,199 | |||||||||
(1) | Represents principal and variable interest payments due under our senior unsecured notes, senior secured credit facilities and the loan agreement for our corporate headquarters facility as of December 31, 2017. Interest payments are approximately as follows: $315.7 million for less than 1 year; $607.9 million for 1 - 3 years; $561.5 million for 3 - 5 years and $268.1 million for more than 5 years. Variable interest payments were calculated using interest rates as of December 31, 2017. |
(2) | Includes obligations related to software licenses, software maintenance support and telecommunication and network services. |
(3) | We have agreements with third-party processors to provide gateway authorization and other processing services. These agreements require us to submit a minimum number of transactions for processing. If we submit a number of transactions that is less than the minimum, we are required to pay the third party processor’s fees that they would have received if we had submitted the required minimum number of transactions. Processing services includes amounts due under network sponsorship agreements. |
50
(4) | Represents estimated TRA payments to various parties and cash payments to exercise the call options pursuant to which certain additional obligations of the Company under the Fifth Third and Mercury TRAs would be terminated. See Note 7 - Tax Receivable Agreements in “Item 8 - Financial Statements and Supplementary Data” for more details. |
Critical Accounting Policies and Estimates
Our discussion and analysis of our financial condition and results of operations are based upon our audited consolidated financial statements, which have been prepared in accordance with GAAP. The preparation of these financial statements requires us to make estimates and judgments that affect the reported amounts of assets, liabilities, revenues and expenses. On an ongoing basis, we evaluate our critical estimates giving consideration to a combination of factors, including historical experience, current conditions and on various other assumptions that are believed to be reasonable under the circumstances. Actual results may differ from these estimates under different assumptions or conditions.
The accounting policies we believe to be most critical to understanding our financial results and condition and that require complex and subjective management judgments are discussed below.
Revenue Recognition
We have contractual agreements with our clients that set forth the general terms and conditions of the relationship including line item pricing, payment terms and contract duration. Revenues are recognized as earned (i.e., for transaction based fees, when the underlying transaction is processed) in conjunction with ASC 605, Revenue Recognition. ASC 605, Revenue Recognition, establishes guidance as to when revenue is realized or realizable and earned by using the following criteria: (1) persuasive evidence of an arrangement exists; (2) delivery has occurred or services have been rendered; (3) the seller’s price is fixed or determinable; and (4) collectibility is reasonably assured.
We follow guidance provided in ASC 605-45, Principal Agent Considerations. ASC 605-45, Principal Agent Considerations, states that the determination of whether a company should recognize revenue based on the gross amount billed to a customer or the net amount retained is a matter of judgment that depends on the facts and circumstances of the arrangement and that certain factors should be considered in the evaluation. We recognize processing revenues net of interchange fees, which are assessed to our merchant customers on all processed transactions. Interchange rates are not controlled by us, in which we effectively act as a clearing house collecting and remitting interchange fee settlement on behalf of issuing banks, debit networks, credit card associations and its processing customers. All other revenue is reported on a gross basis, as we contract directly with the end customer, assume the risk of loss and have pricing flexibility. See Note 1 - Basis of Presentation and Summary of Significant Accounting Policies in “Item 8 - Financial Statements and Supplementary Data” for changes effective January 1, 2018 as a result of our adoption of ASU 2014-09, Revenue From Contracts with Customers.
Goodwill and Intangible Assets
In accordance with ASC 350, Intangibles—Goodwill and Other, we test goodwill for impairment for each reporting unit on an annual basis, or when events occur or circumstances indicate the fair value of a reporting unit is below its carrying value. If the fair value of a reporting unit is less than its carrying value, an impairment loss is recorded to the extent that fair value of the goodwill within the reporting unit is less than its carrying value. We performed our most recent annual goodwill impairment test for all reporting units as of July 31, 2017 using market data and discounted cash flow analyses. Based on this analysis, it was determined that the fair value of all reporting units were substantially in excess of the carrying value. There have been no other events or changes in circumstances subsequent to the testing date that would indicate impairment of these reporting units as of December 31, 2017.
Intangible assets consist of acquired customer relationships, trade names, customer portfolios and related assets that are amortized over their estimated useful lives. We review finite lived intangible assets for possible impairment whenever events or changes in circumstances indicate that carrying amounts may not be recoverable.
Off-Balance Sheet Arrangements
We have no off-balance sheet financing arrangements.
Item 7A. Quantitative and Qualitative Disclosure about Market Risk
We are exposed to interest rate risk in connection with our senior secured credit facilities, which are subject to variable interest rates. We hedge a portion of our exposure to interest rate fluctuations through the utilization of interest rate swaps and caps in order to mitigate the risk of this exposure.
51
As of December 31, 2017 we had a total of 4 outstanding interest rate swaps covering an exposure period from January 2017 through January 2019 and have a combined notional balance of $500 million. In addition, we have 6 interest rate cap agreements with a combined $1.0 billion notional balance and a cap strike rate of 0.75% covering an exposure period from January 2017 to January 2020.
Based on the amount outstanding under our senior secured credit facilities at December 31, 2017, a change in one percentage point in variable interest rates, after the effect of our interest rate swaps and caps effective at December 31, 2017, would cause an increase or decrease in interest expense of $31.0 million on an annual basis.
52
Item 8. Financial Statements and Supplementary Data
Index to Consolidated Financial Statements
Page | ||
Worldpay, Inc. and Subsidiaries | ||
53
REPORT OF INDEPENDENT REGISTERED PUBLIC ACCOUNTING FIRM
To the Stockholders and the Board of Directors of Worldpay, Inc.
Opinion on the Financial Statements
We have audited the accompanying consolidated statements of financial position of Worldpay, Inc. (formerly Vantiv, Inc.) and subsidiaries (the "Company") as of December 31, 2017 and 2016, the related consolidated statements of income, comprehensive income, equity, and cash flows for each of the three years in the period ended December 31, 2017, and the related notes and the schedule listed in the Index at Item 15 (collectively referred to as the "financial statements"). In our opinion, the financial statements present fairly, in all material respects, the financial position of the Company as of December 31, 2017 and 2016, and the results of its operations and its cash flows for each of the three years in the period ended December 31, 2017, in conformity with accounting principles generally accepted in the United States of America.
We have also audited, in accordance with the standards of the Public Company Accounting Oversight Board (United States) (PCAOB), the Company's internal control over financial reporting as of December 31, 2017, based on criteria established in Internal Control - Integrated Framework (2013) issued by the Committee of Sponsoring Organizations of the Treadway Commission and our report dated February 28, 2018, expressed an unqualified opinion on the Company's internal control over financial reporting.
Basis for Opinion
These financial statements are the responsibility of the Company's management. Our responsibility is to express an opinion on the Company's financial statements based on our audits. We are a public accounting firm registered with the PCAOB and are required to be independent with respect to the Company in accordance with the U.S. federal securities laws and the applicable rules and regulations of the Securities and Exchange Commission and the PCAOB.
We conducted our audits in accordance with the standards of the PCAOB. Those standards require that we plan and perform the audit to obtain reasonable assurance about whether the financial statements are free of material misstatement, whether due to error or fraud. Our audits included performing procedures to assess the risks of material misstatement of the financial statements, whether due to error or fraud, and performing procedures that respond to those risks. Such procedures included examining, on a test basis, evidence regarding the amounts and disclosures in the financial statements. Our audits also included evaluating the accounting principles used and significant estimates made by management, as well as evaluating the overall presentation of the financial statements. We believe that our audits provide a reasonable basis for our opinion.
/s/ DELOITTE & TOUCHE LLP
Cincinnati, Ohio
February 28, 2018
We have served as the Company's auditor since 2009.
54
Worldpay, Inc.
CONSOLIDATED STATEMENTS OF INCOME
(In thousands, except share data)
Year Ended December 31, | ||||||||||||
2017 | 2016 | 2015 | ||||||||||
Revenue: | ||||||||||||
External customers | $ | 3,959,742 | $ | 3,504,129 | $ | 3,079,506 | ||||||
Related party revenues | 66,735 | 74,862 | 80,432 | |||||||||
Total revenue | 4,026,477 | 3,578,991 | 3,159,938 | |||||||||
Network fees and other costs | 1,903,165 | 1,674,230 | 1,478,202 | |||||||||
Sales and marketing | 669,506 | 582,251 | 503,949 | |||||||||
Other operating costs | 318,665 | 294,235 | 284,066 | |||||||||
General and administrative | 295,101 | 189,707 | 182,369 | |||||||||
Depreciation and amortization | 318,493 | 270,054 | 276,942 | |||||||||
Income from operations | 521,547 | 568,514 | 434,410 | |||||||||
Interest expense—net | (140,661 | ) | (109,534 | ) | (105,736 | ) | ||||||
Non-operating income (expense) | 432,826 | (36,256 | ) | (31,268 | ) | |||||||
Income before applicable income taxes | 813,712 | 422,724 | 297,406 | |||||||||
Income tax expense | 631,020 | 141,853 | 88,177 | |||||||||
Net income | 182,692 | 280,871 | 209,229 | |||||||||
Less: Net income attributable to non-controlling interests | (52,582 | ) | (67,663 | ) | (61,283 | ) | ||||||
Net income attributable to Worldpay, Inc. | $ | 130,110 | $ | 213,208 | $ | 147,946 | ||||||
Net income per share attributable to Worldpay, Inc. Class A common stock: | ||||||||||||
Basic | $ | 0.81 | $ | 1.37 | $ | 1.02 | ||||||
Diluted | $ | 0.80 | $ | 1.32 | $ | 0.95 | ||||||
Shares used in computing net income per share of Class A common stock: | ||||||||||||
Basic | 161,293,062 | 156,043,636 | 145,044,577 | |||||||||
Diluted | 162,807,146 | 162,115,549 | 200,934,442 | |||||||||
See Notes to Consolidated Financial Statements.
55
Worldpay, Inc.
CONSOLIDATED STATEMENTS OF COMPREHENSIVE INCOME
(In thousands)
Year Ended December 31, | ||||||||||||
2017 | 2016 | 2015 | ||||||||||
Net income | $ | 182,692 | $ | 280,871 | $ | 209,229 | ||||||
Other comprehensive income (loss), net of tax: | ||||||||||||
Gain (loss) on cash flow hedges and other | 10,909 | 4,053 | (8,209 | ) | ||||||||
Comprehensive income | 193,601 | 284,924 | 201,020 | |||||||||
Less: Comprehensive income attributable to non-controlling interests | (54,402 | ) | (68,709 | ) | (58,510 | ) | ||||||
Comprehensive income attributable to Worldpay, Inc. | $ | 139,199 | $ | 216,215 | $ | 142,510 | ||||||
See Notes to Consolidated Financial Statements.
56
Worldpay, Inc.
CONSOLIDATED STATEMENTS OF FINANCIAL POSITION
(In thousands, except share data)
December 31, 2017 | December 31, 2016 | ||||||
Assets | |||||||
Current assets: | |||||||
Cash and cash equivalents | $ | 126,503 | $ | 139,148 | |||
Accounts receivable—net | 985,888 | 940,052 | |||||
Related party receivable | 736 | 1,751 | |||||
Settlement assets | 142,010 | 152,490 | |||||
Prepaid expenses | 33,524 | 39,229 | |||||
Other | 83,951 | 15,188 | |||||
Total current assets | 1,372,612 | 1,287,858 | |||||
Customer incentives | 68,365 | 67,288 | |||||
Property, equipment and software—net | 473,723 | 348,553 | |||||
Intangible assets—net | 678,532 | 787,820 | |||||
Goodwill | 4,172,964 | 3,738,589 | |||||
Deferred taxes | 739,524 | 771,139 | |||||
Proceeds from senior unsecured notes | 1,135,205 | — | |||||
Other assets | 26,048 | 42,760 | |||||
Total assets | $ | 8,666,973 | $ | 7,044,007 | |||
Liabilities and equity | |||||||
Current liabilities: | |||||||
Accounts payable and accrued expenses | $ | 622,871 | $ | 471,979 | |||
Related party payable | 9,013 | 3,623 | |||||
Settlement obligations | 816,235 | 801,381 | |||||
Current portion of note payable to related party | 5,384 | 7,557 | |||||
Current portion of notes payable | 102,513 | 123,562 | |||||
Current portion of tax receivable agreement obligations to related parties | 190,220 | 191,014 | |||||
Current portion of tax receivable agreement obligations | 55,324 | 60,400 | |||||
Deferred income | 18,879 | 7,907 | |||||
Current maturities of capital lease obligations | 8,044 | 7,870 | |||||
Other | 5,975 | 13,719 | |||||
Total current liabilities | 1,834,458 | 1,689,012 | |||||
Long-term liabilities: | |||||||
Note payable to related party | 158,358 | 143,577 | |||||
Notes payable | 5,427,990 | 2,946,026 | |||||
Tax receivable agreement obligations to related parties | 489,780 | 451,318 | |||||
Tax receivable agreement obligations | 45,247 | 86,640 | |||||
Capital lease obligations | 4,456 | 13,223 | |||||
Deferred taxes | 65,617 | 62,148 | |||||
Other | 40,413 | 44,774 | |||||
Total long-term liabilities | 6,231,861 | 3,747,706 | |||||
Total liabilities | 8,066,319 | 5,436,718 | |||||
Commitments and contingencies (See Note 10 - Commitments, Contingencies and Guarantees) | |||||||
Equity: | |||||||
Class A common stock, $0.00001 par value; 890,000,000 shares authorized; 162,595,981 shares outstanding at December 31, 2017; 161,134,831 shares outstanding at December 31, 2016 | 1 | 1 | |||||
Class B common stock, no par value; 100,000,000 shares authorized; 15,252,826 shares issued and outstanding at December 31, 2017; 35,042,826 shares issued and outstanding at December 31, 2016 | — | — | |||||
Preferred stock, $0.00001 par value; 10,000,000 shares authorized; no shares issued and outstanding | — | — | |||||
Paid-in capital | 55,431 | 706,055 | |||||
Retained earnings | 558,013 | 689,512 | |||||
Accumulated other comprehensive income (loss) | 2,892 | (6,197 | ) | ||||
Treasury stock, at cost; 2,861,671 shares at December 31, 2017 and 2,710,195 shares at December 31, 2016 | (83,798 | ) | (73,706 | ) | |||
Total Worldpay, Inc. equity | 532,539 | 1,315,665 | |||||
Non-controlling interests | 68,115 | 291,624 | |||||
Total equity | 600,654 | 1,607,289 | |||||
Total liabilities and equity | $ | 8,666,973 | $ | 7,044,007 | |||
See Notes to Consolidated Financial Statements.
57
Worldpay, Inc.
CONSOLIDATED STATEMENTS OF CASH FLOWS
(In thousands)
Year Ended December 31, | |||||||||||
2017 | 2016 | 2015 | |||||||||
Operating Activities: | |||||||||||
Net income | $ | 182,692 | $ | 280,871 | $ | 209,229 | |||||
Adjustments to reconcile net income to net cash provided by operating activities: | |||||||||||
Depreciation and amortization expense | 318,493 | 270,054 | 276,942 | ||||||||
Amortization of customer incentives | 24,347 | 25,818 | 18,256 | ||||||||
Amortization and write-off of debt issuance costs | 5,989 | 22,584 | 8,376 | ||||||||
Unrealized gain on foreign currency forward | (33,108 | ) | — | — | |||||||
Share-based compensation expense | 47,855 | 35,871 | 30,492 | ||||||||
Deferred tax expense | 596,802 | 79,668 | 55,280 | ||||||||
Excess tax benefit from share-based compensation | — | (12,167 | ) | (16,707 | ) | ||||||
Tax receivable agreements non-cash items | (421,663 | ) | (3,928 | ) | (2,127 | ) | |||||
Other | 3,966 | 467 | (945 | ) | |||||||
Change in operating assets and liabilities: | |||||||||||
Accounts receivable and related party receivable | (38,914 | ) | (212,862 | ) | (70,194 | ) | |||||
Net settlement assets and obligations | 25,334 | 79,719 | 168,319 | ||||||||
Customer incentives | (24,502 | ) | (42,548 | ) | (32,892 | ) | |||||
Prepaid and other assets | (1,214 | ) | 39,636 | 11,324 | |||||||
Accounts payable and accrued expenses | 125,103 | 92,749 | 57,861 | ||||||||
Payable to related party | 5,390 | (1,075 | ) | 2,663 | |||||||
Other liabilities | (31,759 | ) | (9,722 | ) | 11,703 | ||||||
Net cash provided by operating activities | 784,811 | 645,135 | 727,580 | ||||||||
Investing Activities: | |||||||||||
Purchases of property and equipment | (110,805 | ) | (118,194 | ) | (84,730 | ) | |||||
Acquisition of customer portfolios and related assets and other | (41,784 | ) | (23,627 | ) | (41,997 | ) | |||||
Purchase of derivative instruments | — | (21,523 | ) | — | |||||||
Cash used in acquisitions, net of cash acquired | (531,534 | ) | (406,777 | ) | — | ||||||
Net cash used in investing activities | (684,123 | ) | (570,121 | ) | (126,727 | ) | |||||
Financing Activities: | |||||||||||
Proceeds from issuance of long-term debt | 1,270,000 | 3,234,375 | — | ||||||||
Proceeds from issuance of senior unsecured notes | 1,135,205 | — | — | ||||||||
Repayment of debt and capital lease obligations | (143,708 | ) | (3,084,922 | ) | (326,462 | ) | |||||
Borrowings on revolving credit facility | 8,442,000 | 1,250,000 | 177,000 | ||||||||
Repayment of revolving credit facility | (8,217,000 | ) | (1,250,000 | ) | (177,000 | ) | |||||
Payment of debt issuance costs | (27,621 | ) | (20,115 | ) | — | ||||||
Proceeds from issuance of Class A common stock under employee stock plans | 14,566 | 15,389 | 13,630 | ||||||||
Purchase and cancellation of Class A common stock | (1,268,057 | ) | — | — | |||||||
Warrant termination | — | — | (200,219 | ) | |||||||
Repurchase of Class A common stock | — | (81,369 | ) | (200,406 | ) | ||||||
Repurchase of Class A common stock (to satisfy tax withholding obligations) | (10,092 | ) | (6,248 | ) | (16,527 | ) | |||||
Settlement of certain tax receivable agreements | (93,902 | ) | (149,022 | ) | (63,724 | ) | |||||
Payments under tax receivable agreements | (46,472 | ) | (40,271 | ) | (22,805 | ) | |||||
Excess tax benefit from share-based compensation | — | 12,167 | 16,707 | ||||||||
Distribution to non-controlling interests | (22,552 | ) | (12,934 | ) | (12,892 | ) | |||||
Other | — | (12 | ) | — | |||||||
(Decrease) in cash overdraft | — | — | (2,627 | ) | |||||||
Net cash provided by (used in) financing activities | 1,032,367 | (132,962 | ) | (815,325 | ) | ||||||
Net increase (decrease) in cash and cash equivalents | 1,133,055 | (57,948 | ) | (214,472 | ) | ||||||
Cash and cash equivalents—Beginning of period | 139,148 | 197,096 | 411,568 | ||||||||
Cash and cash equivalents—End of period | $ | 1,272,203 | $ | 139,148 | $ | 197,096 | |||||
Cash Payments: | |||||||||||
Interest | $ | 123,056 | $ | 102,695 | $ | 98,971 | |||||
Income taxes | 45,801 | 51,140 | 6,565 | ||||||||
Non-cash Items: | |||||||||||
Issuance of tax receivable agreements to related parties | $ | 647,507 | $ | 171,162 | $ | 376,597 | |||||
See Notes to Consolidated Financial Statements.
58
Worldpay, Inc.
CONSOLIDATED STATEMENT OF EQUITY
(In thousands)
Accumulated | ||||||||||||||||||||||||||||||||||||||||
Common Stock | Other | Non- | ||||||||||||||||||||||||||||||||||||||
Total | Class A | Class B | Treasury Stock | Paid-in | Retained | Comprehensive | Controlling | |||||||||||||||||||||||||||||||||
Equity | Shares | Amount | Shares | Amount | Shares | Amount | Capital | Earnings | Income (Loss) | Interests | ||||||||||||||||||||||||||||||
Beginning Balance, January 1, 2017 | $ | 1,607,289 | 161,135 | $ | 1 | 35,043 | $ | — | 2,710 | $ | (73,706 | ) | $ | 706,055 | $ | 689,512 | $ | (6,197 | ) | $ | 291,624 | |||||||||||||||||||
Cumulative effect of accounting change | 491 | — | — | — | — | — | — | 1,299 | (808 | ) | — | — | ||||||||||||||||||||||||||||
Net income | 182,692 | — | — | — | — | — | — | — | 130,110 | — | 52,582 | |||||||||||||||||||||||||||||
Issuance of Class A common stock under employee stock plans, net of forfeitures | 14,566 | 1,613 | — | — | — | — | — | 14,566 | — | — | — | |||||||||||||||||||||||||||||
Repurchase of Class A common stock (to satisfy tax withholding obligation) | (10,092 | ) | (152 | ) | — | — | — | 152 | (10,092 | ) | — | — | — | — | ||||||||||||||||||||||||||
Purchase and cancellation of Class A common stock | (1,270,589 | ) | — | — | (19,790 | ) | — | — | — | (1,009,788 | ) | (260,801 | ) | — | — | |||||||||||||||||||||||||
Settlement of certain tax receivable agreements | 59,800 | — | — | — | — | — | — | 59,800 | — | — | — | |||||||||||||||||||||||||||||
Issuance of tax receivable agreements | (19,715 | ) | — | — | — | — | — | — | (19,715 | ) | — | — | — | |||||||||||||||||||||||||||
Unrealized gain on hedging activities, net of tax | 10,909 | — | — | — | — | — | — | — | — | 9,089 | 1,820 | |||||||||||||||||||||||||||||
Distribution to non-controlling interests | (22,552 | ) | — | — | — | — | — | — | — | — | — | (22,552 | ) | |||||||||||||||||||||||||||
Share-based compensation | 47,855 | — | — | — | — | — | — | 41,309 | — | — | 6,546 | |||||||||||||||||||||||||||||
Reallocation of non-controlling interests of Vantiv Holding due to change in ownership | — | — | — | — | — | — | — | 261,905 | — | — | (261,905 | ) | ||||||||||||||||||||||||||||
Ending Balance, December 31, 2017 | $ | 600,654 | 162,596 | $ | 1 | 15,253 | $ | — | 2,862 | $ | (83,798 | ) | $ | 55,431 | $ | 558,013 | $ | 2,892 | $ | 68,115 | ||||||||||||||||||||
See Notes to Consolidated Financial Statements.
59
Worldpay, Inc.
CONSOLIDATED STATEMENT OF EQUITY
(In thousands)
Accumulated | ||||||||||||||||||||||||||||||||||||||||||||
Common Stock | Other | Non- | ||||||||||||||||||||||||||||||||||||||||||
Total | Class A | Class B | Treasury Stock | Paid-in | Retained | Comprehensive | Controlling | |||||||||||||||||||||||||||||||||||||
Equity | Shares | Amount | Shares | Amount | Shares | Amount | Capital | Earnings | Income (Loss) | Interests | ||||||||||||||||||||||||||||||||||
Beginning Balance, January 1, 2016 | $ | 1,225,066 | 155,488 | $ | 1 | 35,043 | $ | — | 2,593 | $ | (67,458 | ) | $ | 553,145 | $ | 476,304 | $ | (9,204 | ) | $ | 272,278 | |||||||||||||||||||||||
Net income | 280,871 | — | — | — | — | — | — | — | 213,208 | — | 67,663 | |||||||||||||||||||||||||||||||||
Issuance of Class A common stock under employee stock plans, net of forfeitures | 15,389 | 1,520 | — | — | — | — | — | 15,389 | — | — | — | |||||||||||||||||||||||||||||||||
Excess tax benefit from employee share-based compensation | 12,167 | — | — | — | — | — | — | 12,167 | — | — | — | |||||||||||||||||||||||||||||||||
Repurchase of Class A common stock | (81,369 | ) | (1,407 | ) | — | — | — | — | — | (81,369 | ) | — | — | — | ||||||||||||||||||||||||||||||
Repurchase of Class A common stock (to satisfy tax withholding obligation) | (6,248 | ) | (117 | ) | — | — | — | 117 | (6,248 | ) | — | — | — | — | ||||||||||||||||||||||||||||||
Exercise of warrant | — | 5,651 | — | — | — | — | — | 25,022 | — | — | (25,022 | ) | ||||||||||||||||||||||||||||||||
Termination of certain tax receivable agreements | 130,318 | — | — | — | — | — | — | 130,318 | — | — | — | |||||||||||||||||||||||||||||||||
Issuance of tax receivable agreements | 4,117 | — | — | — | — | — | — | 4,117 | — | — | — | |||||||||||||||||||||||||||||||||
Unrealized loss on hedging activities and other, net of tax | 4,053 | — | — | — | — | — | — | — | — | 3,007 | 1,046 | |||||||||||||||||||||||||||||||||
Distribution to non-controlling interests | (12,934 | ) | — | — | — | — | — | — | — | — | — | (12,934 | ) | |||||||||||||||||||||||||||||||
Share-based compensation | 35,871 | — | — | — | — | — | — | 29,317 | — | — | 6,554 | |||||||||||||||||||||||||||||||||
Other | (12 | ) | — | — | — | — | — | — | — | — | — | — | (12 | ) | — | — | — | |||||||||||||||||||||||||||
Reallocation of non-controlling interests of Vantiv Holding due to change in ownership | — | — | — | — | — | — | — | 17,961 | — | — | (17,961 | ) | ||||||||||||||||||||||||||||||||
Ending Balance, December 31, 2016 | $ | 1,607,289 | 161,135 | $ | 1 | 35,043 | $ | — | 2,710 | $ | (73,706 | ) | $ | 706,055 | $ | 689,512 | $ | (6,197 | ) | $ | 291,624 | |||||||||||||||||||||||
See Notes to Consolidated Financial Statements.
60
Worldpay, Inc.
CONSOLIDATED STATEMENT OF EQUITY
(In thousands)
Accumulated | |||||||||||||||||||||||||||||||||||||||||
Common Stock | Other | Non- | |||||||||||||||||||||||||||||||||||||||
Total | Class A | Class B | Treasury Stock | Paid-in | Retained | Comprehensive | Controlling | ||||||||||||||||||||||||||||||||||
Equity | Shares | Amount | Shares | Amount | Shares | Amount | Capital | Earnings | Income (Loss) | Interests | |||||||||||||||||||||||||||||||
Beginning Balance, January 1, 2015 | $ | 1,300,586 | 145,455 | $ | 1 | 43,043 | $ | — | 2,174 | $ | (50,931 | ) | $ | 629,353 | $ | 328,358 | $ | (3,768 | ) | $ | 397,573 | ||||||||||||||||||||
Net income | 209,229 | — | — | — | — | — | — | — | 147,946 | — | 61,283 | ||||||||||||||||||||||||||||||
Issuance of Class A common stock under employee stock plans, net of forfeitures | 13,630 | 1,523 | — | — | — | — | — | 13,630 | — | — | — | ||||||||||||||||||||||||||||||
Excess tax benefit from employee share-based compensation | 16,707 | — | — | — | — | — | — | 16,707 | — | — | — | ||||||||||||||||||||||||||||||
Repurchase of Class A common stock (to satisfy tax withholding obligation) | (16,527 | ) | (419 | ) | — | — | — | 419 | (16,527 | ) | — | — | — | — | |||||||||||||||||||||||||||
Warrant retirement | (144,568 | ) | — | — | — | — | — | — | (129,173 | ) | — | — | (15,395 | ) | |||||||||||||||||||||||||||
Issuance of Class A common stock and cancellation of Class B common stock in connection with secondary offering | — | 8,000 | — | (8,000 | ) | — | — | — | — | — | — | — | |||||||||||||||||||||||||||||
Repurchase of Class A common stock | (200,406 | ) | (4,446 | ) | — | — | — | — | — | (200,406 | ) | — | — | — | |||||||||||||||||||||||||||
Termination of certain tax receivable agreements | 58,191 | — | — | — | — | — | — | 58,191 | — | — | — | ||||||||||||||||||||||||||||||
Partial exercise of warrant | — | 5,375 | — | — | — | — | — | — | 25,022 | — | — | (25,022 | ) | ||||||||||||||||||||||||||||
Issuance of tax receivable agreements | (21,167 | ) | — | — | — | — | — | — | (21,167 | ) | — | — | — | ||||||||||||||||||||||||||||
Unrealized loss on hedging activities and other, net of tax | (8,209 | ) | — | — | — | — | — | — | — | — | (5,436 | ) | (2,773 | ) | |||||||||||||||||||||||||||
Distribution to non-controlling interests | (12,892 | ) | — | — | — | — | — | — | — | — | — | (12,892 | ) | ||||||||||||||||||||||||||||
Share-based compensation | 30,492 | — | — | — | — | — | — | 23,588 | — | — | 6,904 | ||||||||||||||||||||||||||||||
Reallocation of non-controlling interests of Vantiv Holding due to change in ownership | — | — | — | — | — | — | — | 137,400 | — | — | (137,400 | ) | |||||||||||||||||||||||||||||
Ending Balance, December 31, 2015 | $ | 1,225,066 | 155,488 | $ | 1 | 35,043 | $ | — | 2,593 | $ | (67,458 | ) | $ | 553,145 | $ | 476,304 | $ | (9,204 | ) | $ | 272,278 | ||||||||||||||||||||
See Notes to Consolidated Financial Statements.
61
Worldpay, Inc.
NOTES TO CONSOLIDATED FINANCIAL STATEMENTS
1. BASIS OF PRESENTATION AND SUMMARY OF SIGNIFICANT ACCOUNTING POLICIES
Description of Business
Worldpay, Inc., formerly Vantiv, Inc., a Delaware corporation, is a holding company that conducts its operations through its majority-owned subsidiary, Vantiv Holding, LLC (“Vantiv Holding”). Worldpay, Inc. and Vantiv Holding are referred to collectively as the “Company,” “Worldpay,” “we,” “us” or “our,” unless the context requires otherwise.
On January 16, 2018, Worldpay completed the previously announced acquisition of all of the outstanding shares of Worldpay Group Limited, formerly Worldpay Group plc, a public limited company (“Legacy Worldpay”). Following the acquisition, the Vantiv, Inc. name was changed to Worldpay, Inc. by amending our Second Amended and Restated Certificate of Incorporation. The effective date of the name change was January 16, 2018.
The Company provides electronic payment processing services to merchants and financial institutions throughout the United States of America and operates in two reportable segments, Merchant Services and Financial Institution Services. For more information about the Company’s segments, refer to Note 19 - Segment Information. The Company markets its services through diverse distribution channels, including national, regional and mid-market sales teams, third-party reseller clients and a telesales operation. The Company also has relationships with a broad range of referral partners that include merchant banks, independent software vendors (“ISVs”), value-added resellers (“VARs”), payment facilitators, independent sales organizations (“ISOs”) and trade associations as well as arrangements with core processors.
Basis of Presentation and Consolidation
The accompanying consolidated financial statements include those of Worldpay, Inc. and all subsidiaries thereof, including its majority-owned subsidiary, Vantiv Holding, LLC. The accompanying consolidated financial statements have been prepared in accordance with accounting principles generally accepted in the United States of America (“U.S. GAAP”). All intercompany balances and transactions have been eliminated.
As of December 31, 2017, Worldpay, Inc. and Fifth Third owned interests in Vantiv Holding of 91.42% and 8.58%, respectively (see Note 9 - Controlling and Non-controlling Interests for changes in non-controlling interests).
The Company accounts for non-controlling interests in accordance with Accounting Standards Codification (“ASC”) 810, Consolidation. Non-controlling interests primarily represent Fifth Third’s minority share of net income or loss of equity in Vantiv Holding. Net income attributable to non-controlling interests does not include expenses incurred directly by Worldpay, Inc., including income tax expense attributable to Worldpay, Inc. Non-controlling interests are presented as a component of equity in the accompanying consolidated statements of financial position.
Sponsorship
In order to provide electronic payment processing services, Visa, Mastercard and other payment networks require sponsorship of non-financial institutions by a member clearing bank. The Company has an agreement with Fifth Third (the “Sponsoring Member”) to provide sponsorship services to the Company through December 31, 2024. The Company also has agreements with certain other banks that provide sponsorship into the card networks.
Use of Estimates
The preparation of financial statements in conformity with U.S. GAAP requires management to make estimates and assumptions that affect the reported amount of assets and liabilities and disclosure of contingent assets and liabilities at the date of the financial statements and the reported amounts of revenues and expenses during the reporting periods. Actual results could differ from those estimates.
Revenue Recognition
The Company has contractual agreements with its clients that set forth the general terms and conditions of the relationship including line item pricing, payment terms and contract duration. Revenues are recognized as earned (i.e., for transaction based fees, when the underlying transaction is processed) in conjunction with ASC 605, Revenue Recognition. ASC
62
605, Revenue Recognition, establishes guidance as to when revenue is realized or realizable and earned by using the following criteria: (1) persuasive evidence of an arrangement exists; (2) delivery has occurred or services have been rendered; (3) the seller’s price is fixed or determinable; and (4) collectibility is reasonably assured.
The Company follows guidance provided in ASC 605-45, Principal Agent Considerations, which states that the determination of whether a company should recognize revenue based on the gross amount billed to a customer or the net amount retained is a matter of judgment that depends on the facts and circumstances of the arrangement and that certain factors should be considered in the evaluation. The Company recognizes processing revenues net of interchange fees, which are assessed to the Company’s merchant customers on all processed transactions. Interchange rates are not controlled by the Company, which effectively acts as a clearing house collecting and remitting interchange fee settlement on behalf of issuing banks, debit networks, credit card associations and its processing customers. All other revenue is reported on a gross basis, as the Company contracts directly with the end customer, assumes the risk of loss and has pricing flexibility.
The Company generates revenue primarily by processing electronic payment transactions. Set forth below is a description of the Company’s revenue by segment.
Merchant Services
The Company’s Merchant Services segment revenue is primarily derived from processing credit and debit card transactions. Merchant Services revenue is primarily comprised of fees charged to businesses, net of interchange fees, for payment processing services, including authorization, capture, clearing, settlement and information reporting of electronic transactions. The fees charged consist of either a percentage of the dollar volume of the transaction or a fixed fee, or both, and are recognized at the time of the transaction. Merchant Services revenue also includes a number of revenue items that are incurred by the Company and are reimbursable as the costs are passed through to and paid by the Company’s clients. These items primarily consist of Visa, Mastercard and other payment network fees. In addition, for sales through referral partners in which the Company is the primary party to the contract with the merchant, the Company records the full amount of the fees collected from the merchant as revenue. Merchant Services segment revenue also includes revenue from ancillary services such as fraud management, equipment sales and terminal rent. Merchant Services revenue is recognized as services are performed.
Financial Institution Services
The Company’s Financial Institution Services segment revenues are primarily derived from debit, credit and automated teller machine (“ATM”) card transaction processing, ATM driving and support, and PIN debit processing services. Financial Institution Services revenue associated with processing transactions includes per transaction and account related fees, card production fees and fees generated from the Company’s Jeanie network. Financial Institution Services revenue related to card transaction processing is recognized when consumers use their client-issued cards to make purchases. Financial Institution Services also generates revenue through other services, including statement production, collections and inbound/outbound call centers for credit transactions and other services such as credit card portfolio analytics, program strategy and support, fraud and security management and chargeback and dispute services. Financial Institution Services revenue is recognized as services are performed.
Financial Institution Services provides certain services to Fifth Third. Revenues related to these services are included in the accompanying statements of income as related party revenues.
Expenses
Set forth below is a brief description of the components of the Company’s expenses:
• | Network fees and other costs primarily consist of pass through expenses incurred by the Company in connection with providing processing services to its clients, including Visa and Mastercard network association fees and payment network fees. |
• | Sales and marketing expense primarily consists of salaries and benefits paid to sales personnel, sales management and other sales and marketing personnel, residual payments made to referral partners, and advertising and promotional costs. |
63
• | Other operating costs primarily consist of salaries and benefits paid to operational and IT personnel, costs associated with operating the Company’s technology platform and data centers, information technology costs for processing transactions, product development costs, software fees and maintenance costs. |
• | General and administrative expenses primarily consist of salaries and benefits paid to executive management and administrative employees, including finance, human resources, product development, legal and risk management, share-based compensation costs, equipment and occupancy costs and consulting costs. The year ended December 31, 2017 includes a charge related to a settlement agreement stemming from legacy litigation of an acquired company. |
• | Non-operating income (expense): |
◦ | Non-operating income for the year ended December 31, 2017 primarily consists of a gain relating to the impact to the tax receivable agreement (“TRA”) liability as a result of the Tax Cuts and Jobs Act (“Tax Reform”) being enacted on December 22, 2017 (see note 7 - Tax Receivable Agreements) and an unrealized gain relating to the change in the fair value of a deal contingent foreign currency forward entered into in connection with the Worldpay Group plc (“Worldpay”) acquisition (see Note 8 - Derivatives and Hedging Activities), partially offset by the change in the fair value of a TRA entered into as part of the acquisition of Mercury Payment Systems, LLC (“Mercury”) (see Note 7 - Tax Receivable Agreements). |
◦ | Non-operating expense for the year ended December 31, 2016 relates to the change in fair value of the Mercury TRA entered into as part of the acquisition of Mercury (see Note 7 - Tax Receivable Agreements) and a charge related to the refinancing of the Company’s senior secured credit facilities in October 2016 (see Note 6 - Long-Term Debt). |
◦ | Non-operating expense for the year ended December 31, 2015 primarily relates to the change in the fair value of the Mercury TRA (see Note 7 - Tax Receivable Agreements). |
Share-Based Compensation
The Company expenses employee share-based payments under ASC 718, Compensation—Stock Compensation, which requires compensation cost for the grant-date fair value of share-based payments to be recognized over the requisite service period. The Company estimates the grant date fair value of the share-based awards issued in the form of options using the Black-Scholes option pricing model. The fair value of shares issued as restricted stock, performance awards and under the Employee Stock Purchase Plan (“ESPP”) is measured based on the market price of the Company’s stock on the grant date. In 2017, the Compensation Committee of the Company’s Board of Directors approved a resolution that stock options, restricted shares and restricted stock units shall vest or become exercisable in three equal annual installments beginning on the first anniversary of the grant date.
In March 2016, the Financial Accounting Standards Board (“FASB”) issued Accounting Standards Update (“ASU”) 2016-09, Compensation- Stock Compensation (Topic 718): Improvements to Employee Share-Based Payment Accounting. The update simplifies several aspects of the accounting for share-based payment award transactions, including the accounting for income taxes, forfeitures, and statutory tax withholding requirements, as well as classification in the statement of cash flows. The Company adopted this ASU on January 1, 2017. Under previous guidance, excess tax benefits and deficiencies from share-based compensation arrangements were recorded in equity when the awards vested or settled. ASU 2016-09 requires prospective recognition of excess tax benefits and deficiencies in the income statement, resulting in the recognition of excess tax benefits of $16.7 million in income tax expense, rather than in paid-in capital, for the year ended December 31, 2017.
Additionally, under ASU 2016-09, excess income tax benefits from share-based compensation arrangements are classified as cash flow from operations, rather than as cash flow from financing activities. The Company has elected to apply the cash flow classification guidance of ASU 2016-09 prospectively, resulting in an increase to operating cash flow of $16.7 million for the year ended December 31, 2017, and the prior year periods have not been adjusted. The presentation requirements for cash flows related to employee taxes paid for withheld shares have no impact to the periods presented in our consolidated cash flows statements since such cash flows have historically been presented as a financing activity.
Prior to adopting ASU 2016-09, the Company estimated forfeitures as part of share-based compensation expense. Under ASU 2016-09, an entity can make an election to either estimate the number of awards that are expected to vest or account for forfeitures as they occur. The Company has elected to account for forfeitures as they occur. The cumulative-effect
64
of this change in election resulted in an increase to additional paid-in capital of $1.3 million, an increase to deferred tax assets of $0.5 million, and a decrease to retained earnings of $0.8 million at the beginning of 2017.
ASU 2016-09 requires excess tax benefits and deficiencies to be prospectively excluded from assumed future proceeds in the calculation of diluted shares, resulting in an increase in diluted weighted average shares outstanding of approximately 436,000 shares for the year ended December 31, 2017. See Note 13 - Share-Based Compensation Plans for further discussion.
Earnings per Share
Basic earnings per share is computed by dividing net income attributable to Worldpay, Inc. by the weighted average shares outstanding during the period. Diluted earnings per share is computed by dividing net income attributable to Worldpay, Inc., adjusted as necessary for the impact of potentially dilutive securities, by the weighted-average shares outstanding during the period and the impact of securities that would have a dilutive effect on earnings per share. See Note 16 - Net Income Per Share for further discussion.
Income Taxes
Worldpay, Inc. is taxed as a C corporation for U.S. income tax purposes and is therefore subject to both federal and state taxation at a corporate level.
Income taxes are computed in accordance with ASC 740, Income Taxes, and reflect the net tax effects of temporary differences between the financial reporting carrying amounts of assets and liabilities and the corresponding income tax amounts. The Company has deferred tax assets and liabilities and maintains valuation allowances where it is more likely than not that all or a portion of deferred tax assets will not be realized. To the extent the Company determines that it will not realize the benefit of some or all of its deferred tax assets, such deferred tax assets will be adjusted through the Company’s provision for income taxes in the period in which this determination is made. As of December 31, 2017 and 2016, the Company had recorded no valuation allowances against deferred tax assets. See Note 14 - Income Taxes for further discussion of income taxes.
Cash and Cash Equivalents
Cash on hand and investments with original maturities of three months or less (that are readily convertible to cash) are considered to be cash equivalents. The Company has restricted cash held in money market accounts, which approximate fair value and therefore are a level 1 input in the fair value hierarchy. Following the adoption of ASU 2016-18, Statement of Cash Flows (Topic 230): Restricted Cash, the Company includes restricted cash in the cash and cash equivalents balance of the consolidated statements of cash flows. The reconciliation between the consolidated statement of financial position and the consolidated statement of cash flows is as follows:
December 31, 2017 | December 31, 2016 | |||||||
Cash and cash equivalents on consolidated statement of financial position | $ | 126,503 | $ | 139,148 | ||||
Proceeds from senior unsecured notes - restricted for closing of Worldpay acquisition | 1,135,205 | — | ||||||
Other restricted cash (in other current assets) | 10,495 | — | ||||||
Total cash and cash equivalents on consolidated statement of cash flows | $ | 1,272,203 | $ | 139,148 | ||||
Accounts Receivable—net
Accounts receivable primarily represent processing revenues earned but not collected. For a majority of its customers, the Company has the authority to debit the client’s bank accounts through the Federal Reserve’s Automated Clearing House; as such, collectibility is reasonably assured. The Company records a reserve for doubtful accounts when it is probable that the accounts receivable will not be collected. The Company reviews historical loss experience and the financial position of its customers when estimating the allowance. As of December 31, 2017 and 2016, the allowance for doubtful accounts was not material to the Company’s statements of financial position.
65
Customer Incentives
Customer incentives represent signing bonuses paid to customers. Customer incentives are paid in connection with the acquisition or renewal of customer contracts, and are therefore deferred and amortized using the straight-line method based on the contractual agreement. Related amortization is recorded as contra-revenue.
Property, Equipment and Software—net
Property, equipment and software consists of the Company’s facilities, furniture and equipment, software, land and leasehold improvements. Facilities, furniture and equipment and software are depreciated on a straight-line basis over their respective useful lives. Leasehold improvements are depreciated on a straight-line basis over the lesser of the estimated useful life of the improvement or the term of the lease. Also included in property, equipment and software is work in progress consisting of costs associated with software developed for internal use which has not yet been placed in service.
The Company capitalizes certain costs related to computer software developed for internal use and amortizes such costs on a straight-line basis over an estimated useful life. Research and development costs incurred prior to establishing technological feasibility are charged to operations as such costs are incurred. Once technological feasibility has been established, costs are capitalized until the software is placed in service. See Note 3 - Property, Equipment and Software for additional information.
Goodwill and Intangible Assets
In accordance with ASC 350, Intangibles—Goodwill and Other, the Company tests goodwill for impairment for each reporting unit on an annual basis, or when events occur or circumstances indicate the fair value of a reporting unit is below its carrying value. If the fair value of a reporting unit is less than its carrying value, an impairment loss is recorded to the extent that implied fair value of the goodwill within the reporting unit is less than its carrying value. The Company performed its most recent annual goodwill impairment test for all reporting units as of July 31, 2017 using market data and discounted cash flow analyses. Based on this analysis, it was determined that the fair value of all reporting units was substantially in excess of the carrying value. There have been no other events or changes in circumstances subsequent to the testing date that would indicate
impairment of these reporting units as of December 31, 2017.
Intangible assets consist of acquired customer relationships, trade names, customer portfolios and related assets that are amortized over their estimated useful lives. The Company reviews finite lived intangible assets for possible impairment whenever events or changes in circumstances indicate that carrying amounts may not be recoverable. As of December 31, 2017, there have been no such events or circumstances that would indicate potential impairment of finite lived intangible assets.
Settlement Assets and Obligations
Settlement assets and obligations result from Financial Institution Services when funds are transferred from or received by the Company prior to receiving or paying funds to a different entity. This timing difference results in a settlement asset or obligation. The amounts are generally collected or paid the following business day.
The settlement assets and obligations recorded by Merchant Services represent intermediary balances due to differences between the amount the Sponsoring Member receives from the card associations and the amount funded to the merchants. Such differences arise from timing differences, interchange expenses, merchant reserves and exception items. In addition, certain card associations limit the Company from accessing or controlling merchant settlement funds and, instead, require that these funds be controlled by the Sponsoring Member. The Company follows a net settlement process whereby, if the settlement received from the card associations precedes the funding obligation to the merchant, the Company temporarily records a corresponding liability. Conversely, if the funding obligation to the merchant precedes the settlement from the card associations, the amount of the net receivable position is recorded by the Company, or in some cases, the Sponsoring Member may cover the position with its own funds in which case a receivable position is not recorded by the Company.
Derivatives
The Company accounts for derivatives in accordance with ASC 815, Derivatives and Hedging. This guidance establishes accounting and reporting for derivative instruments, including certain derivative instruments embedded in other contracts, and for hedging activities. All derivatives, whether designated in hedging relationships or not, are required to be
66
recorded on the statement of financial position at fair value. If the derivative is designated as a fair value hedge, the changes in the fair value of the derivative and the hedged item will be recognized in earnings. If the derivative is designated as a cash flow hedge, the effective portion of the change in the fair value of the derivative will be recorded in accumulated other comprehensive income (loss) (“AOCI”) and will be recognized in the statement of income when the hedged item affects earnings. The Company does not enter into derivative financial instruments for speculative purposes.
New Accounting Pronouncements
In August 2017, the FASB issued ASU 2017-12, Derivatives and Hedging (Topic 815): Targeted Improvements to Accounting for Hedging Activities, which amends and simplifies existing guidance to better align an entity’s risk management activities and financial reporting for hedging relationships through changes to both the designation and measurement guidance for qualifying hedging relationships and the presentation of hedge results. This ASU is effective for the Company in the first quarter of fiscal 2019, with early adoption permitted. The Company is currently evaluating the impact of the adoption of this principle on the Company’s consolidated financial statements.
In November 2016, the FASB issued ASU 2016-18, Statement of Cash Flows (Topic 230): Restricted Cash. The update requires that companies should include cash and cash equivalents with restrictions in total cash and cash equivalents on the statement of cash flows. If restricted cash is presented separately from cash and cash equivalents on the balance sheet, a reconciliation between the statement of financial position and the statement of cash flows must be disclosed. The update requires retrospective application to all periods presented. The effective date of this update is for fiscal years, and interim periods within those fiscal years, beginning after December 15, 2017, with early adoption permitted. As of December 31, 2017, the Company has elected to early adopt this ASU and included restricted cash in the ending cash and cash equivalents balance on the statement of cash flows. The reconciliation between the Company’s consolidated statements of financial position and the consolidated statements of cash flows is disclosed in the cash and cash equivalents section of this footnote.
In August 2016, the FASB issued ASU 2016-15, Statement of Cash Flows (Topic 230): Classification of Certain Cash Receipts and Cash Payments. The update clarifies how cash receipts and cash payments in certain transactions are presented and classified in the statement of cash flows. The effective date of this update is for fiscal years, and interim periods within those fiscal years, beginning after December 15, 2017, with early adoption permitted. The update requires retrospective application to all periods presented but may be applied prospectively if retrospective application is impracticable. This guidance requires contingent cash payments to be classified as financing activities up to the amount of the initial contingent liability recognized, with any excess payments classified as operating activities. The Company recorded a contingent consideration liability related to the Mercury TRA entered into as part of the acquisition of Mercury in 2014. As of December 31, 2017, the Company has elected to early adopt this ASU on a retrospective basis, resulting in a decrease in operating cash flow and an increase in financing cash flow of $16.8 million, $23.5 million, and $30.3 million, respectively, for the years ended December 31, 2017, 2016, and 2015.
In February 2016, the FASB issued ASU 2016-02, Leases (Topic 842). This ASU amends the existing guidance by recognizing all leases, including operating leases, with a term longer than 12 months on the balance sheet and disclosing key information about the lease arrangements. The effective date of this update is for fiscal years, and interim periods within those fiscal years, beginning after December 15, 2018, with early adoption permitted. As written, the update requires modified retrospective transition, which requires application of the ASU at the beginning of the earliest comparative period presented in the year of adoption. The FASB is currently considering an option that entities may elect not to restate their comparative periods in transition. This option would allow an entity to recognize the effects of applying the standard as a cumulative-effect adjustment to retained earnings as of the adoption date and not restate prior periods. The Company has formed a project team to review contracts to determine which qualify as a lease and then evaluate the impact of the adoption of this principle on the Company’s consolidated financial statements. The Company anticipates adopting this ASU on January 1, 2019.
In May 2014, the FASB issued ASU 2014-09, Revenue From Contracts With Customers (Topic 606). The ASU supersedes the revenue recognition requirements in ASC 605, Revenue Recognition. The new standard provides a five-step analysis of transactions to determine when and how revenue is recognized, based upon the core principle that revenue is recognized to depict the transfer of goods or services to customers in an amount that reflects the consideration to which the entity expects to be entitled in exchange for those goods or services. The new standard also requires additional disclosures regarding the nature, amount, timing, and uncertainty of revenue and cash flows arising from contracts with customers. The new standard, as amended, is effective for fiscal years, and interim periods within those fiscal years, beginning after December 15, 2017, with early adoption permitted. The amendment allows companies to use either a full retrospective or a modified retrospective approach to adopt this ASU. The Company formed a project team to assess the impact of the adoption of this
67
principle on the Company’s consolidated financial statements. As a result of the new standard, the Company does not anticipate material changes to the timing of its revenue recognition. However, the Company will record fees paid to third parties, including network fees and other costs, net of revenue. These fees are currently recorded on a gross basis. This change in presentation will not impact income from operations. Additionally, the Company will capitalize and amortize costs to obtain and fulfill a contract, which is currently expensed as incurred. The amount that will be capitalized on the Company’s balance sheet as of January 1, 2018 is expected to range from $25 million to $35 million. The Company adopted this ASU on January 1, 2018 using the modified retrospective approach.
2. BUSINESS COMBINATIONS
Acquisition of Paymetric Holdings, Inc.
On May 25, 2017, the Company completed the acquisition of Paymetric Holdings, Inc. (“Paymetric”) by acquiring 100% of the issued and outstanding shares. Paymetric automates business-to-business payment workflows within enterprise systems and tokenizes payments data within these systems in order to enable secure storage of customer information and history. This acquisition helps to further accelerate the Company’s growth.
The acquisition was accounted for as a business combination under ASC 805, Business Combinations (“ASC 805”). The purchase price was allocated to the assets acquired and the liabilities assumed based on the estimated fair value at the date of acquisition. The excess of the purchase price over the fair value of the net assets acquired was allocated to goodwill, of which approximately $7.8 million is deductible for tax purposes. Goodwill, assigned to Merchant Services, consists primarily of the acquired workforce and growth opportunities, none of which qualify as an intangible asset. The preliminary purchase price allocation is as follows (in thousands):
Cash acquired | $ | 11,864 | |
Current assets | 7,243 | ||
Property, equipment and software | 92,121 | ||
Intangible assets | 47,800 | ||
Goodwill | 433,972 | ||
Other assets | 67 | ||
Current liabilities | (18,075 | ) | |
Deferred tax liability | (23,059 | ) | |
Non-current liabilities | (8,535 | ) | |
Total purchase price | $ | 543,398 | |
The above estimated fair values of assets acquired and liabilities assumed are preliminary and are based on the information that was available as of the reporting date to estimate the fair value of assets acquired and liabilities assumed. The Company believes that the information provides a reasonable basis for estimating the fair values of the acquired assets and assumed liabilities, but the potential for measurement period adjustments exists based on the Company’s continuing review of
matters related to the acquisition. The Company expects to complete the purchase price allocation as soon as practicable, but no later than one year from the acquisition date.
Intangible assets primarily consist of customer relationship assets with a weighted average estimated useful life of 10 years.
The Company incurred transaction expenses of approximately $7.1 million during the year ended December 31, 2017 in conjunction with the acquisition of Paymetric, which are included in general and administrative expenses on the accompanying consolidated statement of income. From the acquisition date of May 25, 2017 through December 31, 2017, revenue and net income included in the accompanying consolidated statement of income for the year ended December 31, 2017 attributable to Paymetric is not material.
Under the terms of the Paymetric transaction agreement, the Company replaced employee stock options held by certain employees of Paymetric. The number of replacement awards was based on options outstanding at the acquisition date. The weighted average fair value of the replacement awards was $8.0 million and was calculated on the acquisition date using the Black-Scholes option pricing model. The portion of the fair value of the replacement awards related to the services provided
68
prior to the acquisition of $5.9 million was part of the consideration transferred to acquire Paymetric. The remaining portion of the fair value is associated with future service and will be recognized as expense over the future service period.
The pro forma results of the Company reflecting the acquisition of Paymetric were not material to the Company’s financial results and therefore have not been presented.
Acquisition of Moneris Solutions, Inc.
On December 21, 2016, the Company completed the acquisition of Moneris Solutions, Inc. (“Moneris USA”) by acquiring 100% of the issued and outstanding shares. Moneris USA is a provider of payment processing solutions offering credit, debit, wireless and online payment services for merchants in virtually every industry segment. This acquisition helps to further accelerate the Company’s growth.
The acquisition was accounted for as a business combination under ASC 805. The purchase price was allocated to the assets acquired and the liabilities assumed based on the estimated fair value at the date of acquisition. The excess of the purchase price over the fair value of the net assets acquired was allocated to goodwill, of which approximately $14.0 million is deductible for tax purposes. Goodwill, assigned to Merchant Services, consists primarily of the acquired workforce and growth opportunities, none of which qualify as an intangible asset. The final purchase price allocation is as follows (in thousands):
Cash acquired | $ | 22,851 | |
Current assets | 44,047 | ||
Property, equipment and software | 22 | ||
Intangible assets | 72,000 | ||
Goodwill | 372,464 | ||
Current liabilities | (61,369 | ) | |
Deferred tax liability | (17,506 | ) | |
Non-current liabilities | (2,881 | ) | |
Total purchase price | $ | 429,628 | |
Intangible assets consist of customer relationship assets of $72.0 million with a weighted average estimated useful life of 5 years.
The pro forma results of the Company reflecting the acquisition of Moneris USA were not material to our financial results and therefore have not been presented.
3. PROPERTY, EQUIPMENT AND SOFTWARE
A summary of the Company’s property, equipment and software is as follows (in thousands):
Estimated Useful Life | December 31, 2017 | December 31, 2016 | ||||||||
Land | N/A | $ | 6,401 | $ | 6,401 | |||||
Building and improvements | 15 - 40 years | 34,398 | 34,298 | |||||||
Furniture and equipment | 2 - 10 years | 197,524 | 171,104 | |||||||
Software | 3 - 8 years | 557,484 | 412,490 | |||||||
Leasehold improvements | 3 - 10 years | 12,665 | 8,846 | |||||||
Work in progress | 37,358 | 25,094 | ||||||||
Accumulated depreciation | (372,107 | ) | (309,680 | ) | ||||||
Property, equipment and software - net | $ | 473,723 | $ | 348,553 | ||||||
Depreciation and amortization expense related to property, equipment and software for the years ended December 31, 2017, 2016 and 2015 was $95.9 million, $70.5 million and $76.6 million, respectively.
69
4. GOODWILL AND INTANGIBLE ASSETS
Changes in the carrying amount of goodwill, by business segment, are as follows (in thousands):
Merchant Services | Financial Institution Services | Total | ||||||||||
Balance as of December 31, 2015 | $ | 2,791,678 | $ | 574,850 | $ | 3,366,528 | ||||||
Goodwill attributable to acquisition of Moneris USA | 372,061 | — | 372,061 | |||||||||
Balance as of December 31, 2016 | $ | 3,163,739 | $ | 574,850 | $ | 3,738,589 | ||||||
Goodwill attributable to acquisition of Moneris USA(1) | 403 | — | 403 | |||||||||
Goodwill attributable to acquisition of Paymetric Solutions, Inc. | 433,972 | — | 433,972 | |||||||||
Balance as of December 31, 2017 | $ | 3,598,114 | $ | 574,850 | $ | 4,172,964 | ||||||
(1) Amount represents adjustments to goodwill associated with the acquisition of Moneris as a result of the finalization of purchase accounting.
Intangible assets consist of acquired customer relationships and customer portfolios and related assets. The useful lives of customer relationships are determined based on forecasted cash flows, which include estimates for customer attrition associated with the underlying portfolio of customers acquired. The customer relationships acquired in conjunction with acquisitions are amortized based on the pattern of cash flows expected to be realized taking into consideration expected revenues and customer attrition, which are based on historical data and the Company's estimates of future performance. These estimates result in accelerated amortization on certain acquired intangible assets.
As of December 31, 2017 and 2016, the Company’s finite lived intangible assets consisted of the following (in thousands):
December 31, 2017 | December 31, 2016 | |||||||
Customer relationship intangible assets | $ | 1,712,681 | $ | 1,671,581 | ||||
Customer portfolios and related assets | 249,829 | 178,480 | ||||||
Patents | 1,553 | 955 | ||||||
1,964,063 | 1,851,016 | |||||||
Less accumulated amortization on: | ||||||||
Customer relationship intangible assets | 1,156,379 | 980,595 | ||||||
Customer portfolios and related assets | 129,152 | 82,601 | ||||||
1,285,531 | 1,063,196 | |||||||
Intangible assets, net | $ | 678,532 | $ | 787,820 | ||||
Customer portfolios and related assets acquired during the years ended December 31, 2017 and 2016 have weighted-average amortization periods of 4.8 years and 4.4 years, respectively. Amortization expense on intangible assets for the years ended December 31, 2017, 2016 and 2015 was $222.6 million, $199.6 million and $200.4 million, respectively.
The estimated amortization expense of intangible assets for the next five years is as follows (in thousands):
2018 | $ | 209,724 | ||
2019 | 193,503 | |||
2020 | 112,855 | |||
2021 | 63,407 | |||
2022 | 41,595 | |||
70
5. CAPITAL LEASES
The Company has various lease agreements for equipment that are classified as capital leases. The cost and accumulated depreciation of equipment under capital leases included in the accompanying statements of financial position within property and equipment were $35.7 million and $21.4 million, respectively, as of December 31, 2017 and $36.6 million and $12.7 million, respectively, as of December 31, 2016. Depreciation expense associated with capital leases for the years ended December 31, 2017, 2016, and 2015 was $9.6 million, $8.3 million and $7.8 million, respectively.
The future minimum lease payments required under capital leases and the present value of net minimum lease payments as of December 31, 2017 are as follows (in thousands):
Amount | ||||
2018 | $ | 8,221 | ||
2019 | 4,484 | |||
Total minimum lease payments | 12,705 | |||
Less: Amount representing interest | (205 | ) | ||
Present value of minimum lease payments | 12,500 | |||
Less: Current maturities of capital lease obligations | (8,044 | ) | ||
Long-term capital lease obligations | $ | 4,456 | ||
6. LONG-TERM DEBT
As of December 31, 2017 and 2016, the Company’s long-term debt consisted of the following (in thousands):
December 31, 2017 | December 31, 2016 | ||||||
Term A loan, maturing in October 2021(1) | $ | 2,345,907 | $ | 2,469,375 | |||
Term B loan, maturing in October 2023(2) | 757,350 | 765,000 | |||||
Incremental Term B loan, maturing in August 2024(3) | 1,270,000 | — | |||||
Senior Unsecured Dollar Notes, maturing in November 2025 | 500,000 | — | |||||
Senior Unsecured Sterling Notes, maturing in November 2025 | 635,205 | — | |||||
Leasehold mortgage, expiring on August 10, 2021(4) | 10,131 | 10,131 | |||||
Revolving credit facility, expiring in October 2021(5) | 225,000 | — | |||||
Less: Current portion of notes payable and current portion of note payable to related party | (107,897 | ) | (131,119 | ) | |||
Less: Original issue discount | (3,052 | ) | (3,631 | ) | |||
Less: Debt issuance costs | (46,296 | ) | (20,153 | ) | |||
Notes payable and note payable to related party | $ | 5,586,348 | $ | 3,089,603 | |||
(1) | Interest at a variable base rate (LIBOR) plus a spread rate (200 basis points) (total rate of 3.48% at December 31, 2017 and 2.70% at December 31, 2016) and amortizing on a basis of 1.25% per quarter during each of the first twelve quarters (March 2017 through December 2019), 1.875% per quarter during the next four quarters (March 2020 through December 2020) and 2.50% per quarter during the next three quarters (March 2021 through September 2021) with a balloon payment due at maturity. |
(2) | Interest at a variable base rate (LIBOR) plus a spread rate (200 basis points at December 31, 2017 and 250 basis points at December 31, 2016) (total rate of 3.48% at December 31, 2017 and 3.25% at December 31, 2016) and amortizing on a basis of 0.25% per quarter, with a balloon payment due at maturity. |
(3) | Interest payable at a variable base rate (LIBOR) plus a spread rate (200 basis points) (total rate of 3.48% at December 31, 2017) and amortizing on a basis of 0.25% per quarter, with a balloon payment due at maturity. |
(4) | Interest payable monthly at a fixed rate of 6.22%. |
(5) | $225 million revolving credit facility borrowing interest at a variable base rate (LIBOR) plus a spread rate (200 basis points) (total rate of 3.49% at December 31, 2017). |
71
2017 Debt Activity
On August 7, 2017, the Company funded the Fifth Third share purchase discussed in Note 9 - Controlling and Non-controlling Interests, by amending the Second Amended Loan Agreement to permit Vantiv LLC to obtain approximately $1.27 billion of additional seven-year term B loans. As a result of this borrowing, the Company capitalized approximately $23.1 million of deferred financing fees during the year ended December 31, 2017.
In connection with the Worldpay acquisition as discussed in Note 21 - Subsequent Events, on December 7, 2017, the Company priced an offering of $500 million aggregate principal amount of 4.375% senior unsecured notes due 2025 and £470 million aggregate principal amount of 3.875% senior unsecured notes due 2025, listed in the table above. The spot rate of 1.3515 U.S. dollars per Pound Sterling at December 31, 2017 was used to translate the Senior Unsecured Sterling Notes to U.S. dollars. The proceeds received in the connection with the senior unsecured notes offering are held in escrow and restricted as of December 31, 2017 pending the consummation of the acquisition, which subsequently took place on January 16, 2018.
As of December 31, 2017, Fifth Third held $163.7 million of the term A loans and the revolving credit facility, which is presented as note payable to related party on the consolidated statements of financial position.
2016 Debt Refinancing
In October 2016, Vantiv, LLC completed a debt refinancing by entering into a second amended and restated loan agreement (“Second Amended Loan Agreement”). The Second Amended Loan Agreement provides for senior secured credit facilities comprised of a $2.5 billion term A loan, a $765.0 million term B loan and a $650.0 million revolving credit facility. The prior revolving credit facility was also terminated. The maturity date and debt service requirements relating to the new term A and term B loans are listed in the table above. The new revolving credit facility matures in October 2021 and includes a $100 million swing line facility and a $40 million letter of credit facility. The commitment fee rate for the unused portion of the revolving credit facility was 0.375% based on the Company’s leverage ratio at December 31, 2017. During the year ended December 31, 2017, the Company periodically borrowed under its revolving credit facility and repaid the amounts prior to year-end. There were outstanding borrowings on the revolving credit facility of $225.0 million at December 31, 2017. There were no outstanding borrowings on the revolving credit facility at December 31, 2016.
As a result of the Company's 2016 debt refinancing, the Company expensed approximately $16.6 million, which consisted primarily of the write-offs of unamortized deferred financing fees and original issue discount (“OID”) associated with the component of the refinancing accounted for as a debt extinguishment and certain third party costs incurred in connection with the refinancing. Amounts expensed in connection with the refinancing are recorded as a component of non-operating expenses in the accompanying consolidated statement of income for the year ended December 31, 2016.
As of December 31, 2016, Fifth Third held $151.1 million, of the term A loans, which is presented as note payable to related party on the consolidated statements of financial position.
On January 6, 2015, the Company made an early principal payment of $200 million on the term B loan. The Company expensed approximately $1.8 million in non-operating expenses related to the write-off of deferred financing fees and OID in connection with the early principal payments.
The closing of the Legacy Worldpay acquisition on January 16, 2018 resulted in the effectiveness of several debt amendments described in Note 21- Subsequent Events.
Guarantees and Security
The Company’s debt obligations at December 31, 2017 are unconditional and are guaranteed by Vantiv Holding and certain of Vantiv Holding’s existing and subsequently acquired or organized domestic subsidiaries. The refinanced debt and related guarantees are secured on a first-priority basis (subject to liens permitted under the Second Amended Loan Agreement) by substantially all the capital stock (subject to a 65% limitation on pledges of capital stock of foreign subsidiaries and domestic holding companies of foreign subsidiaries) and personal property of Vantiv Holding and any obligors as well as any real property in excess of $25 million in the aggregate held by Vantiv Holding or any obligors (other than Vantiv Holding), subject to certain exceptions.
72
Covenants
There are certain financial and non-financial covenants contained in the Second Amended Loan Agreement for the refinanced debt, which are tested on a quarterly basis. The financial covenants require maintenance of certain leverage and interest coverage ratios. At December 31, 2017, the Company was in compliance with these financial covenants.
7. TAX RECEIVABLE AGREEMENTS
As of December 31, 2017, the Company is party to several TRAs in which the Company agrees to make payments to various parties of 85% of the federal, state, local and foreign income tax benefits realized by the Company as a result of certain tax deductions. Unless amended as discussed below, payments under the TRAs will be based on the tax reporting positions of the Company and are only required to the extent the Company realizes cash savings as a result of the underlying tax attributes. The cash savings realized by the Company are computed by comparing the actual income tax liability of the Company to the amount of such taxes the Company would have been required to pay had there been no deductions related to the tax attributes. Under the agreement between the Company and Fifth Third dated August 7, 2017, in certain specified circumstances, the Company may be required to make payments in excess of such cash savings.
Obligations recorded pursuant to the TRAs are based on estimates of future deductions and future tax rates. On an annual basis, the Company evaluates the assumptions underlying the TRA obligations.
On December 22, 2017 the President of the United States signed into law Tax Reform, which amends the Internal Revenue Code to reduce tax rates and modify policies, credits and deductions for businesses. The changes to the federal tax rate and other modifications of the tax code have a material impact on TRA benefits related to the 2018 and future tax years. As a result of Tax Reform, the Company reduced its TRA liability to reflect the impact of the lower rate for tax years beginning after December 31, 2017 by $418.9 million.
In connection with the acquisition of Mercury, the Company entered into the Mercury TRA and recorded a liability of $192.5 million for the Mercury TRA and non-operating expenses of $14.0 million, $19.5 million and $28.9 million related to the change in fair value of the Mercury TRA during the years ended December 31, 2017, 2016 and 2015, respectively.
From time to time, the Company enters into repurchase addendums providing for the early settlement of certain obligations. The following table presents the Company’s TRA settlements and the impact of these settlements on the Company’s consolidated statement of financial position (in thousands):
TRA | Settlement Date | Cash Buyout Payment | Balance Sheet Obligation Prior to Settlement | Deferred Taxes and Other | Net Gain Recorded in Equity | |||||||||||||
Fifth Third 2017 call/put options | 2017 | $ | (63,355 | ) | $ | 157,626 | $ | 34,471 | $ | 59,800 | ||||||||
Mercury | June 2017 | (38,100 | ) | 38,100 | — | — | ||||||||||||
Fifth Third | July 2016 | (116,294 | ) | 330,711 | 84,099 | 130,318 | ||||||||||||
Mercury | June 2016 | (41,400 | ) | 41,400 | — | — | ||||||||||||
Fifth Third | October 2015 | (48,866 | ) | 140,024 | 32,967 | 58,191 | ||||||||||||
Mercury | July 2015 | (44,800 | ) | 44,800 | — | — | ||||||||||||
The Company is granted call options (collectively, the “Fifth Third Call Options”) pursuant to which certain additional obligations of the Company under the Fifth Third TRA and the NPC TRA would be terminated and settled in consideration for cash payments. If the Fifth Third Call Option is not exercised, Fifth Third is granted Put Options pursuant to which certain these obligations would also be terminated in consideration for cash payments with similar amounts to the Fifth Third Call Options. During 2017 and 2016, we made payments of $63.4 million and $116.3 million, respectively, to exercise the call/put options pursuant to the Fifth Third TRA Addendum, as presented in the table above. The remaining call/put options, if exercised, require payments of $25.6 million, $26.4 million, $27.2 million and $28.1 million, effectively due on March 31, 2018, June 30, 2018, September 30, 2018 and December 31, 2018 respectively.
The full carrying amount of the Fifth Third callable/puttable TRA obligations for the options exercisable within 12 months of the balance sheet date have been classified as current obligations in the accompanying statement of financial position ($145.9 million).
73
Since Fifth Third was a significant stockholder of the Company in 2016, a special committee of the Company’s board of directors comprised of independent, disinterested directors authorized the TRA Addendum.
During 2015, the Company entered into the Mercury TRA Addendum with each of the pre-acquisition owners of Mercury ("Mercury TRA Holders"). The Company has exercised all previous eligible options. The Company has two remaining options that can be exercised beginning December 1st of each 2017 and 2018, and ending June 30th of 2018 and 2019, pursuant to which certain additional obligations of the Company under the Mercury TRA would be terminated in consideration for cash payments of $38.0 million and $43.0 million, respectively. In the unlikely event the Company does not exercise the relevant Mercury Call Option, the Mercury TRA Holders are granted put options to which certain of these obligations of the Company would also be terminated in consideration for cash payments with similar amounts to the Mercury Call Options.
The Company’s President, Integrated Payments, is a Mercury TRA Holder. Pursuant to the initial payment under the Mercury TRA Addendum, this individual is entitled to receive an aggregate of $0.6 million, and could receive as much as an additional $2.2 million with respect to payments made pursuant to the Mercury TRA Addendum.
Except to the extent the Company’s obligations under the Mercury TRA, the Fifth Third TRA and NPC TRA have been terminated and settled in full in accordance with the terms of the Mercury TRA and Fifth Third TRA Addendums, the Mercury TRA, Fifth Third TRA and NPC TRA will remain in effect, and the parties thereto will continue to have all rights and obligations thereunder.
All TRA obligations are recorded based on the full and undiscounted amount of the expected future payments, except for the Mercury TRA which represents contingent consideration relating to an acquired business, and is recorded at fair value for financial reporting purposes (see Note 15 - Fair Value Measurements). The following table reflects TRA activity and balances for the years ended December 31, 2017, 2016 and 2015 (in thousands):
Balance as of December 31, 2014 | 2015 TRA Payment | 2015 TRA Settlements | 2015 Secondary Offering | Purchase Accounting Adjustment | Change in Value | Balance as of December 31, 2015 | |||||||||||||||||||||
TRA with Fifth Third Bank | $ | 620,062 | $ | (22,805 | ) | $ | (140,024 | ) | $ | 376,597 | $ | — | $ | (769 | ) | $ | 833,061 | ||||||||||
Mercury TRA | 152,420 | — | (44,800 | ) | — | 54,647 | 28,940 | 191,207 | |||||||||||||||||||
Total | $ | 772,482 | $ | (22,805 | ) | $ | (184,824 | ) | $ | 376,597 | $ | 54,647 | $ | 28,171 | $ | 1,024,268 | |||||||||||
Balance as of December 31, 2015 | 2016 TRA Payment | 2016 TRA Settlements | 2016 Secondary Offering | Change in Value | Balance as of December 31, 2016 | ||||||||||||||||||
TRA with Fifth Third Bank | $ | 833,061 | $ | (31,233 | ) | $ | (330,711 | ) | $ | 171,162 | $ | 53 | $ | 642,332 | |||||||||
Mercury TRA | 191,207 | (22,241 | ) | (41,400 | ) | — | 19,474 | 147,040 | |||||||||||||||
Total | $ | 1,024,268 | $ | (53,474 | ) | $ | (372,111 | ) | $ | 171,162 | $ | 19,527 | $ | 789,372 | |||||||||
Balance as of December 31, 2016 | 2017 TRA Payment | 2017 TRA Settlements | 2017 Fifth Third Share Purchase | Change in Value (1) | Balance as of December 31, 2017 | ||||||||||||||||||
TRA with Fifth Third Bank | $ | 642,332 | $ | (33,355 | ) | $ | (157,626 | ) | $ | 647,507 | $ | (418,858 | ) | $ | 680,000 | ||||||||
Mercury TRA | 147,040 | (22,340 | ) | (38,100 | ) | — | 13,971 | 100,571 | |||||||||||||||
Total | $ | 789,372 | $ | (55,695 | ) | $ | (195,726 | ) | $ | 647,507 | $ | (404,887 | ) | $ | 780,571 | ||||||||
(1) Change in TRA with Fifth Third bank is due to Tax Reform.
As a result of a Fifth Third share repurchase, secondary offerings and exchange of units of Vantiv Holding by Fifth Third Bank discussed in Note 12 - Capital Stock, the Company recorded the following (in thousands):
74
Share Repurchase and Secondary Offerings by Year | TRA Liability | Deferred Tax Asset | Net Equity | |||||||||
2017 | $ | 647,507 | $ | 627,792 | $ | 19,715 | ||||||
2016 | 171,162 | 175,279 | (4,117 | ) | ||||||||
2015 | 376,597 | 355,430 | 21,167 | |||||||||
The timing and/or amount of aggregate payments due under the TRAs outside of the call/put structures may vary based on a number of factors, including the amount and timing of the taxable income the Company generates in the future and the tax rate then applicable, the use of loss carryovers and amortizable basis. Payments under the TRAs, if necessary, are required to be made no later than January 5th of the second year immediately following the taxable year in which the obligation occurred. The contractually obligated payments under the TRA obligations paid in January 2015, 2016 and 2017 are in the tables above. The Company made a payment under the TRA obligations of approximately $61.7 million in January 2018. The January 2018 payment is recorded as current portion of tax receivable agreement obligations on the accompanying consolidated statement of financial position. Unless settled under the terms of the repurchase addenda, the term of the TRAs will continue until all the underlying tax benefits have been utilized or expired.
8. DERIVATIVES AND HEDGING ACTIVITIES
Risk Management Objective of Using Derivatives
The Company enters into derivative financial instruments to manage differences in the amount, timing and duration of its known or expected cash payments related to its variable-rate debt. As of December 31, 2017 and 2016, the Company’s interest rate derivative instruments for this purpose consist of interest rate swaps and interest rate cap agreements. The interest rate swaps hedge the variable rate debt by effectively converting floating-rate payments to fixed-rate payments. The interest rate cap agreements cap a portion of the Company’s variable rate debt if interest rates rise above the strike rate on the contract. As of December 31, 2017 the interest rate cap agreements had a fair value of $24.4 million, classified within other current and non-current assets on the Company’s consolidated statements of financial position. The interest rate swaps and caps (collectively “interest rate contracts”) are designated as cash flow hedges for accounting purposes.
Additionally, during the year ended December 31, 2017, the Company entered into a deal contingent foreign currency forward contract. The foreign currency forward serves as an economic hedge of the pound sterling denominated portion of the purchase price relating to the Worldpay acquisition. As of December 31, 2017, the foreign currency forward had a fair value of approximately $33.1 million, classified within other current assets on the Company’s consolidated statements of financial position. The foreign currency forward has not been designated as a hedge for accounting purposes.
Accounting for Derivative Instruments
The Company recognizes derivatives in other current and non-current assets or liabilities in the accompanying consolidated statements of financial position at their fair values. Refer to Note 15 - Fair Value Measurements for a detailed discussion of the fair value of its derivatives. The Company designates its interest rate contracts as cash flow hedges of forecasted interest rate payments related to its variable-rate debt.
The Company formally documents all relationships between hedging instruments and underlying hedged transactions, as well as its risk management objective and strategy for undertaking hedge transactions. This process includes linking all derivatives that are designated as cash flow hedges to forecasted transactions. A formal assessment of hedge effectiveness is performed both at inception of the hedge and on an ongoing basis to determine whether the hedge is highly effective in offsetting changes in cash flows of the underlying hedged item. Hedge effectiveness is assessed using a regression analysis. If it is determined that a derivative ceases to be highly effective during the term of the hedge, the Company will discontinue hedge accounting for such derivative.
The Company’s interest rate contracts qualify for hedge accounting under ASC 815, Derivatives and Hedging. Therefore, the effective portion of changes in fair value were recorded in AOCI and will be reclassified into earnings in the same period during which the hedged transactions affect earnings.
75
Cash Flow Hedges of Interest Rate Risk
The Company’s objectives in using interest rate derivatives are to add stability to interest expense and to manage its exposure to interest rate movements. To accomplish these objectives, the Company uses a combination of interest rate swaps and caps as part of its interest rate risk management strategy. As of December 31, 2017, the Company had a total of 4 outstanding interest rate swaps covering an exposure period from January 2017 through January 2019 with a combined notional balance of $500.0 million. Fifth Third is the counterparty to 2 of the 4 outstanding interest rate swaps with a $250.0 million notional balance for January 2017 to January 2018 and another $250.0 million notional balance for January 2018 to January 2019. Additionally, as of December 31, 2017, the Company had a total of 6 interest rate cap agreements with a combined notional balance of $1.0 billion, cap strike rate of 0.75%, covering an exposure period from January 2017 to January 2020.
The Company does not offset derivative positions in the accompanying consolidated financial statements. The table below presents the fair value of the Company’s derivative financial instruments designated as cash flow hedges included within the accompanying consolidated statements of financial position (in thousands):
Consolidated Statement of Financial Position Location | December 31, 2017 | December 31, 2016 | |||||||
Interest rate contracts | Other current assets | $ | 9,709 | $ | 2,144 | ||||
Interest rate contracts | Other long-term assets | 14,697 | 21,085 | ||||||
Interest rate contracts | Other current liabilities | 4,152 | 9,551 | ||||||
Interest rate contracts | Other long-term liabilities | 245 | 5,507 | ||||||
Any ineffectiveness associated with such derivative instruments will be recorded immediately as interest expense in the accompanying consolidated statements of income. As of December 31, 2017, the Company estimates that $1.3 million will be reclassified from accumulated other comprehensive income as an increase to interest expense during the next 12 months.
The table below presents the pre-tax effect of the Company’s interest rate contracts on the accompanying consolidated statements of comprehensive income for the years ended December 31, 2017, 2016 and 2015 (in thousands):
Year Ended December 31, | |||||||||||
2017 | 2016 | 2015 | |||||||||
Derivatives in cash flow hedging relationships: | |||||||||||
Amount of gain (loss) recognized in OCI (effective portion) (1) | $ | 6,661 | $ | (6,858 | ) | $ | (18,836 | ) | |||
Amount of loss reclassified from accumulated OCI into earnings (effective portion) | (9,416 | ) | (12,735 | ) | (6,990 | ) | |||||
Amount of loss recognized in earnings (2) | (625 | ) | — | — | |||||||
(1) | “OCI” represents other comprehensive income. |
(2) | For the year ended December 31, 2017, amount represents hedge ineffectiveness. |
Credit Risk Related Contingent Features
As of December 31, 2017, the fair value of derivatives in a net liability position, which includes accrued interest but excludes any adjustment for nonperformance risk, related to these agreements was $4.6 million.
The Company has agreements with each of its derivative counterparties that contain a provision where if the Company defaults on any of its indebtedness, then the Company could also be declared in default on its derivative obligations. As of December 31, 2017, the Company had not posted any collateral related to these agreements. If the Company had breached any of these provisions at December 31, 2017, it could have been required to settle its obligations under the agreements at their termination value of $4.6 million.
76
Deal Contingent Forward
On August 9, 2017, the Company entered into a 1.150 billion pounds sterling notional deal contingent forward to economically hedge a portion of the purchase price relating to the Legacy Worldpay acquisition (see Note 21 - Subsequent Events for further discussion). The change in fair value of the deal contingent forward is reported in non-operating income (expense) in the Company’s consolidated statements of income, which is an unrealized gain of approximately $33.1 million for the year ended December 31, 2017. The deal contingent forward settled upon the closing of the Legacy Worldpay acquisition in January 2018 and the Company recorded a related realized gain of approximately $56 million.
9. CONTROLLING AND NON-CONTROLLING INTERESTS
The Company has various non-controlling interests that are accounted for in accordance with ASC 810, Consolidation (“ASC 810”). As discussed in Note 1 - Basis of Presentation and Summary of Significant Accounting Policies, Worldpay, Inc. owns a controlling interest in Vantiv Holding, and therefore consolidates the financial results of Vantiv Holding and its subsidiaries and records non-controlling interest for the economic interests in Vantiv Holding held by Fifth Third. The Exchange Agreement entered into prior to the IPO provides for a 1 to 1 ratio between the units of Vantiv Holding and the common stock of Worldpay, Inc.
In May 2014, the Company entered into a joint venture with a bank partner which provides customers a comprehensive suite of payment solutions. Vantiv Holding owns 51% and the bank partner owns 49% of the joint venture. The joint venture is consolidated by the Company in accordance with ASC 810, with the associated non-controlling interest included in “Net income attributable to non-controlling interests” in the consolidated statements of income.
As of December 31, 2017, Worldpay, Inc.’s interest in Vantiv Holding was 91.42%. Changes in units and related ownership interest in Vantiv Holding are summarized as follows:
Worldpay, Inc. | Fifth Third | Total | ||||||
As of December 31, 2015 | 155,488,326 | 35,042,826 | 190,531,152 | |||||
% of ownership | 81.61 | % | 18.39 | % | ||||
Fifth Third exchange of Class C units of Vantiv Holding for shares of Class A common stock in connection with partial warrant exercise | 5,651,432 | — | 5,651,432 | |||||
Share repurchases | (1,406,600 | ) | — | (1,406,600 | ) | |||
Equity plan activity (1) | 1,401,673 | — | 1,401,673 | |||||
As of December 31, 2016 | 161,134,831 | 35,042,826 | 196,177,657 | |||||
% of ownership | 82.14 | % | 17.86 | % | ||||
Fifth Third exchange of Vantiv Holding units for shares of Class A common stock | 19,790,000 | (19,790,000 | ) | — | ||||
Purchase and cancellation of Class A common stock | (19,790,000 | ) | — | (19,790,000 | ) | |||
Equity plan activity (1) | 1,461,150 | — | 1,461,150 | |||||
As of December 31, 2017 | 162,595,981 | 15,252,826 | 177,848,807 | |||||
% of ownership | 91.42 | % | 8.58 | % | ||||
(1) | Includes stock issued under the equity plans less Class A common stock withheld to satisfy employee tax withholding obligations upon vesting or exercise of employee equity awards and forfeitures of restricted Class A common stock awards. |
On August 7, 2017, the Company entered into a transaction agreement with Fifth Third Bank pursuant to which Fifth Third Bank agreed to exercise its right to exchange 19,790,000 Class B Units in Vantiv Holding, LLC for 19,790,000 of the Company’s Class A common stock and immediately thereafter, the Company purchased those newly issued shares of Class A common stock directly from Fifth Third Bank at a price of $64.04 per share, the closing share price of the Company’s Class A common stock on the New York Stock Exchange on August 4, 2017. The purchased shares were cancelled and are no longer outstanding.
77
As a result of the changes in ownership interests in Vantiv Holding, periodic adjustments are made in order to reflect the portion of net assets of Vantiv Holding attributable to non-controlling unit holders based on changes in the proportionate ownership interests in Vantiv Holding during those periods.
The table below provides a reconciliation of net income attributable to non-controlling interests based on relative ownership interests as discussed above (in thousands):
Year Ended December 31, | |||||||||||
2017 | 2016 | 2015 | |||||||||
Net income | $ | 182,692 | $ | 280,871 | $ | 209,229 | |||||
Items not allocable to non-controlling interests: | |||||||||||
Worldpay, Inc. expenses (1) | 215,828 | 81,059 | 55,111 | ||||||||
Vantiv Holding net income | $ | 398,520 | $ | 361,930 | $ | 264,340 | |||||
Net income attributable to non-controlling interests of Fifth Third (2) | $ | 49,850 | $ | 65,789 | $ | 58,938 | |||||
Net income attributable to joint venture non-controlling interest (3) | 2,732 | 1,874 | 2,345 | ||||||||
Total net income attributable to non-controlling interests | $ | 52,582 | $ | 67,663 | $ | 61,283 | |||||
(1) Primarily represents income tax expense and TRA revaluation adjustments related to Worldpay, Inc.
(2) Net income attributable to non-controlling interests of Fifth Third reflects the allocation of Vantiv Holding’s net income based on the proportionate ownership interests in Vantiv Holding held by the non-controlling unit holders. The net income attributable to non-controlling unit holders reflects the changes in ownership interests summarized in the table above.
(3) | Reflects net income attributable to the non-controlling interest of the joint venture. |
In connection with the separation from Fifth Third, Fifth Third received a warrant that allows for the purchase of up to 20.4 million Class C Non-Voting Units of Vantiv Holding at an exercise price of $15.98 per unit. The warrant was valued at approximately $65.4 million at June 30, 2009 and was recorded as a component of non-controlling interest on the accompanying statements of financial position.
On December 2, 2015, the Company entered into a warrant cancellation agreement (the "Warrant Cancellation Agreement") with Fifth Third to cancel a portion of the warrant. The Warrant Cancellation Agreement cancelled the rights under the warrant to purchase 4.8 million Class C Units of Vantiv Holding for aggregate consideration of $200 million paid by the Company to Fifth Third. Following the effectiveness of the Warrant Cancellation Agreement, Fifth Third net exercised a portion of the warrants it held to purchase 5.4 million Class C Units of Vantiv Holding. As of December 31, 2015, Fifth Third held the rights to purchase 7.8 million Class C Units of Vantiv Holding which are exchangeable for Class A common stock. The remaining warrant held by Fifth Third in the amount of $25 million was recorded as a component of non-controlling interest on the accompanying statements of financial position as of December 31, 2015.
On November 28, 2016, Fifth Third net exercised the remaining warrant it held to purchase approximately 5.7 million Class C Units of Vantiv Holding. The value of the warrant exercised in the amount of $25 million was reclassified out of non-controlling interests to additional paid-in capital on the accompanying statements of financial position.
78
10. COMMITMENTS, CONTINGENCIES AND GUARANTEES
Leases
The Company leases office space under non-cancelable operating leases that expire between May 2018 and December 2045. Future minimum commitments under these leases are as follows (in thousands):
Year Ended December 31, | ||||
2018 | $ | 8,652 | ||
2019 | 6,706 | |||
2020 | 4,977 | |||
2021 | 4,398 | |||
2022 | 2,725 | |||
Thereafter | 10,964 | |||
Total | $ | 38,422 | ||
Rent expense for the years ended December 31, 2017, 2016 and 2015 was approximately $9.3 million, $9.4 million and $11.6 million, respectively.
Legal Reserve
From time to time, the Company is involved in various litigation matters arising in the ordinary course of its business. While it is impossible to ascertain the ultimate resolution or range of financial liability with respect to these contingent matters, management believes none of these matters, either individually or in the aggregate, would have a material effect upon the Company’s consolidated financial statements, except as described below.
On April 17, 2017, the Company entered into a preliminary settlement agreement (the “Agreement”) to settle class action litigation filed by plaintiffs in the United States District Court for the Northern District of Georgia (the “Court”) under the caption Champs Sports Bar & Grill Co.et al. v. Mercury Payment Systems, LLC et al. regarding certain legacy business practices of the defendants, Mercury Payment Systems, LLC (“Mercury”) and Global Payments Direct, Inc., dating back to 2009. The Company acquired Mercury on June 13, 2014.
Under the terms of the Agreement, in exchange for a release from all claims relating to such legacy business practices from the beginning of the applicable settlement class period through the date of preliminary approval of the settlement, the Company incurred a charge of $41.5 million for the settlement. On August 29, 2017, a final approval hearing took place and the Agreement was approved.
While the agreement contains no admission of wrongdoing and the Company believes it has meritorious defenses to the claims, the Company agreed to the structure of the settlement, in order to save costs and avoid the risks of on-going litigation.
11. EMPLOYEE BENEFIT PLANS
The Company offers a defined contribution savings plan to virtually all Company employees. The plan provides for elective, pre-tax or after tax participant contributions and Company matching contributions. Expenses associated with the defined contribution savings plan for the years ended December 31, 2017, 2016 and 2015 were $10.8 million, $10.1 million and $9.1 million, respectively.
12. CAPITAL STOCK
Common Stock
Under the Company’s amended and restated certificate of incorporation, the Company is authorized to issue 890,000,000 shares of Class A common stock with a par value of $0.00001 per share and 100,000,000 shares of Class B common stock with no par value per share. The Class A and Class B common stock each provide holders with one vote on all matters submitted to a vote of stockholders; however, the holders of shares of Class B common stock shall be limited to voting
79
power, including voting power associated with any Class A common stock held, of 18.5% at any time other than in connection with a stockholder vote with respect to a change of control. Also, holders of Class B common stock do not have any of the economic rights (including rights to dividends and distributions upon liquidation) provided to the holders of Class A common stock. The holders of Class B common stock hold one share of Class B common stock for each Vantiv Holding Class B unit they hold. The Class B units of Vantiv Holding may be exchanged for shares of Class A common stock on a one-for-one basis or, at the Company’s option, for cash equal to the fair value of the shares tendered for exchange. Upon exchange of any Class B units of Vantiv Holding, an equal number of shares of Class B common stock automatically will be cancelled. The Class A common stock and Class B common stock vote together as a single class, except that the holders of Class B common stock are entitled to elect a number of the Company’s directors equal to the percentage of the voting power of all of the outstanding common stock represented by the Class B common stock but not exceeding 18.5% of the board of directors. Fifth Third holds all of the issued and outstanding Class B common stock.
As of December 31, 2017, 162,595,981 shares of Class A common stock and 15,252,826 shares of Class B common stock were issued and outstanding.
Secondary Offerings
On December 8, 2015, subsequent to the Warrant Cancellation Agreement and the Partial Warrant Exercise on December 2, 2015 as discussed in Note 9 - Controlling and Non-Controlling Interests, a secondary offering took place in which Fifth Third sold 13.4 million shares of the Company’s Class A common stock.
On November 28, 2016, subsequent to Fifth Third’s exercise of the remaining warrant, a secondary offering took place in which Fifth Third sold approximately 4.8 million shares of the Company’s Class A common stock.
The Company did not receive any proceeds from the sales noted above.
Share Repurchases
On February 12, 2014, the Company's board of directors approved a program to repurchase up to $300 million of the Company’s Class A common stock. As of December 31, 2014, approximately $275 million was available under the February 2014 authorization. During the year ended December 31, 2015, approximately 4.4 million shares were repurchased for approximately $200 million.
On October 25, 2016, the board of directors authorized a program to repurchase up to an additional $250 million of the Company's Class A common stock. In connection with Fifth Third’s net exercise of the remaining warrant discussed in Note 9 - Controlling and Non-controlling Interests, the Company repurchased approximately 850,000 shares of its Class A common stock from Fifth Third for approximately $50.8 million. During the year ended December 31, 2016, approximately 1.4 million shares were repurchased under the programs for approximately $81.4 million, which completed the repurchases under the February 2014 authorization and resulted in approximately $243 million available for repurchase under the October 2016 authorization, which is the amount available for repurchases as of December 31, 2017. The repurchased shares were immediately retired.
On August 7, 2017, the Company entered into a transaction agreement with Fifth Third Bank pursuant to which Fifth Third Bank agreed to exercise its right to exchange 19,790,000 Class B Units in Vantiv Holding, LLC for 19,790,000 of the Company’s Class A common stock and immediately thereafter, the Company purchased those newly issued shares of Class A common stock directly from Fifth Third Bank at a price of $64.04 per share, the closing share price of the Company’s Class A common stock on the New York Stock Exchange on August 4, 2017. The purchased shares were cancelled and are no longer outstanding.
Purchases under the programs may be made from time to time in the open market, in privately negotiated transactions, or otherwise. The manner, timing and amount of any purchases will be determined by management based on an evaluation of market conditions, stock price and other factors. The Company’s share repurchase program does not obligate it to acquire any specific number or amount of shares, there is no guarantee as to the exact number or amount of shares that may be repurchased, if any, and the Company may discontinue purchases at any time that it determines additional purchases are not warranted.
80
Preferred Stock
Under the Company’s amended and restated certificate of incorporation, the Company is authorized to issue 10,000,000 shares of preferred stock with a par value of $0.00001 per share. As of December 31, 2017, there was no preferred stock outstanding.
Dividend Restrictions
The Company does not intend to pay cash dividends on its Class A common stock in the foreseeable future. Worldpay, Inc. is a holding company that does not conduct any business operations of its own. As a result, Worldpay, Inc.’s ability to pay cash dividends on its common stock, if any, is dependent upon cash dividends and distributions and other transfers from Vantiv Holding. The amounts available to Worldpay, Inc. to pay cash dividends are subject to the covenants and distribution restrictions in its subsidiaries’ loan agreements. As a result of the restrictions on distributions from Vantiv Holding and its subsidiaries, essentially all of the Company’s consolidated net assets are held at the subsidiary level and are restricted as of December 31, 2017.
13. SHARE-BASED COMPENSATION PLANS
The company accounts for share-based compensation plans in accordance with ASC 718, Compensation-Stock Compensation, which requires compensation expense for the grant-date fair value of share-based payments to be recognized over the requisite service period.
2012 Equity Incentive Plan
The 2012 Equity Incentive Plan was adopted by the Company’s board of directors in March 2012. The 2012 Equity Incentive Plan provides for grants of stock options, stock appreciation rights, restricted stock and restricted stock units, performance awards and other stock-based awards. The maximum number of shares of Class A common stock available for issuance pursuant to the 2012 Equity Incentive Plan is 35.5 million shares. In 2017, the Compensation Committee of the Company’s Board of Directors approved a resolution that new grants of stock options, restricted shares and restricted stock units shall vest or become exercisable in three equal annual installments beginning on the first anniversary of the grant date.
Restricted Stock Awards
The Company grants restricted stock awards to certain employees which vest based on the recipient’s continued employment or service to the Company (“Time Awards”).
The Company also grants restricted stock awards to certain employees subject to the achievement of certain financial performance measures ("Performance Awards"). These Performance Awards typically vest on the third anniversary of the grant date. Participants have the right to earn 0% to 200% of the target number of shares of the Company’s Class A common stock, determined by the level of achievement of the financial performance measures during the performance period.
The grant date fair value of the restricted stock awards is based on the quoted fair market value of our common stock on the grant date. The weighted-average grant date fair value of restricted stock awards granted during the years ended 2017, 2016 and 2015 was $63.86, $50.08 and $38.10, respectively. The total fair value of restricted stock awards vested was $8.3 million, $1.2 million and $47.2 million in 2017, 2016 and 2015, respectively.
81
The following table presents the number and weighted-average grant date fair value of the restricted stock awards for the year ended December 31, 2017:
Restricted Class A Common Stock - Time Awards | Weighted Average Grant Date Fair Value | Restricted Class A Common Stock - Performance Awards | Weighted Average Grant Date Fair Value | ||||||||||
Non-vested at December 31, 2016 | 161,310 | $ | 40.57 | 546,738 | $ | 43.02 | |||||||
Granted | 145,501 | 63.09 | 236,550 | 64.34 | |||||||||
Vested | (70,733 | ) | 39.69 | (47,169 | ) | 37.10 | |||||||
Forfeited | — | — | — | — | |||||||||
Non-vested at December 31, 2017 | 236,078 | $ | 54.72 | 736,119 | $ | 50.25 | |||||||
During the year ended December 31, 2017, under the terms of the Paymetric transaction agreement, the Company replaced employee stock options held by certain employees of Paymetric with restricted stock awards. The number of replacement awards was based on options outstanding at the acquisition date. The weighted average fair value was calculated on the acquisition date using the Black-Scholes option pricing model. The $2.1 million of fair value associated with future service will be recognized as expense over a one year period.
Restricted Stock Units
The Company issues restricted stock units to directors and certain employees which typically vest on the first anniversary of the grant date (for directors) and in equal annual increments over three years beginning on the first anniversary of the date of grant (for employees). The grant date fair value of the restricted stock units is based on the quoted fair market value of our common stock at the award date. The weighted-average grant date fair value of restricted stock units granted during the years ended 2017, 2016 and 2015 was $64.16, $51.75 and $38.42, respectively. The total fair value of restricted stock units vested was $18.8 million, $18.3 million and $10.5 million in 2017, 2016 and 2015, respectively.
Additionally, associated with the acquisition of Paymetric in May 2017, the Company issued restricted stock awards to certain employees subject to the achievement of certain financial and non-financial performance measures through 2020. See Note 2 - Business Combinations for additional information.
The following table presents the number and weighted-average grant date fair value of the restricted stock units for the year ended December 31, 2017:
Restricted Stock Units | Weighted Average Grant Date Fair Value | |||||
Non-vested at December 31, 2016 | 923,282 | $ | 40.98 | |||
Granted | 373,889 | 64.16 | ||||
Vested | (286,050 | ) | 36.72 | |||
Forfeited | (101,827 | ) | 50.25 | |||
Non-vested at December 31, 2017 | 909,294 | $ | 50.35 | |||
Stock Options
The Company grants stock options to certain key employees. All stock options are nonqualified stock options and expire on the tenth anniversary of the grant date.
82
The following table summarizes stock option activity for the year ended December 31, 2017:
Stock Options | Weighted Average Exercise Price | Weighted Average Remaining Contractual Term (Years) | Aggregate Intrinsic Value (in thousands) | |||||||||
Outstanding options at December 31, 2016 | 2,201,442 | $ | 35.21 | 7.72 | $ | 53,738 | ||||||
Granted | 604,008 | 64.34 | ||||||||||
Exercised | (331,438 | ) | 27.54 | 12,484 | ||||||||
Expired | (3,423 | ) | 16.79 | |||||||||
Forfeited | (46,980 | ) | 49.00 | |||||||||
Outstanding options at December 31, 2017 | 2,423,609 | $ | 43.28 | 7.41 | $ | 73,370 | ||||||
Options exercisable at December 31, 2017 | 933,783 | $ | 30.72 | 6.26 | $ | 39,997 | ||||||
For the years ended December 31, 2017, 2016, and 2015 the total aggregate intrinsic value of options exercised was $12.5 million, $18.4 million, and $17.5 million, respectively. The weighted-average grant date fair value was estimated by the Company using the Black-Scholes option pricing model with the assumptions below:
2017 | 2016 | 2015 | ||||
Number of options granted | 604,008 | 695,666 | 707,738 | |||
Weighted average exercise price | $64.34 | $50.01 - $52.04 | $37.10 | |||
Expected option life at grant (in years) | 6.25 | 6.25 | 6.25 | |||
Expected volatility | 23.91% | 24.77% | 26.33% | |||
Expected dividend yield | —% | —% | —% | |||
Risk-free interest rate | 2.02% | 1.41% - 1.45% | 1.67% | |||
Fair value | $18.34 | $13.92 - $14.43 | $11.04 | |||
The expected option life represents the period of time the stock options are expected to be outstanding and is based on the “simplified method” allowed under SEC guidance. The Company used the “simplified method” due to the lack of sufficient historical exercise data to provide a reasonable basis upon which to otherwise estimate the expected life of the stock options. Since the Company’s publicly traded stock history is relatively short, expected volatility is based on the Company’s historical volatility and the historical volatility of a group of peer companies. The Company does not intend to pay cash dividends in the foreseeable future. Consequently, the Company used an expected dividend yield of zero. The risk-free interest rate was based on the U.S. Treasury yield curve in effect at the time of the grant.
Performance Share Units
The Company issues performance share units to certain employees subject to the achievement of certain financial performance measures. These performance share units vest on the third anniversary of the grant date. Participants have the right to earn 0% to 200% of the target number of shares of the Company’s Class A common stock, determined by the level of achievement of the financial performance measures during the three year performance period. In 2015 the Company also issued performance share units to certain employees subject to the achievement of certain financial and non-financial performance measures through 2018.
The grant date fair value of the performance share units is based on the quoted fair market value of our common stock on the grant date. For the years ended December 31, 2017, 2016 and 2015, the weighted-average grant date fair value of performance share units granted was $63.34, $50.04, and $39.16, respectively, and the total fair value of performance share units vested was $19.9 million, $17.1 million, and $1.2 million, respectively.
83
The following table presents the number and weighted-average grant date fair value of the performance share units for the year ended December 31, 2017:
Performance Share Units | Weighted Average Grant Date Fair Value | |||||
Non-vested at December 31, 2016 | 316,701 | $ | 37.70 | |||
Granted | 181,033 | 63.34 | ||||
Incremental shares upon completion of performance goals | 150,739 | 31.02 | ||||
Vested | (306,805 | ) | 31.30 | |||
Forfeited | (13,756 | ) | 51.19 | |||
Non-vested at December 31, 2017 | 327,912 | $ | 54.21 | |||
The share-based compensation expense related to the performance share units granted in 2015 ("2015 PSUs") was initially estimated based on target performance and was adjusted as appropriate throughout the performance period based on the shares expected to be earned at that time. The 2015 PSUs are included in the table above as non-vested at December 31, 2017 at target, or 100%. On February 21, 2018, the Compensation Committee of the Company’s Board of Directors certified the achievement of the performance goals for the 2015 PSUs, which had a performance period of January 1, 2015 to December 31, 2017, at the maximum 200% of the target number of shares (69,875 shares incremental to those included in the table above for the 2015 PSUs).
Employee Share Purchase Plan
In 2016 the Company began offering an Employee Stock Purchase Plan (“ESPP”). The ESPP has 2.5 million shares of common stock reserved for issuance. Full-time and benefits-eligible part-time employees who have completed at least one year of service are eligible to participate. Temporary, seasonal and employees subject to Section 16 reporting are excluded. Shares may be purchased at 85% of the market value at the end of the offering period through accumulation of payroll deductions. The ESPP provides for six month offerings commencing on January 1 and July 1 of each year with purchases on June 30 and December 31 of each year. For the years ended December 31, 2017 and 2016, the expense related to the ESPP’s 15% discount is included in total share-based compensation expense disclosed below.
For the years ended December 31, 2017, 2016 and 2015, total share-based compensation expense was $47.9 million, $35.9 million and $30.5 million, respectively. Related tax benefits recorded in the accompanying consolidated statements of income totaled $15.6 million in 2017, $10.9 million in 2016 and $8.8 million in 2015. At December 31, 2017, there was approximately $71.0 million of unrecognized share-based compensation expense, which is expected to be recognized over a remaining weighted-average period of approximately 2.0 years.
14. INCOME TAXES
In accordance with ASC Topic 740, Income Taxes, income taxes are recognized for the amount of taxes payable for the current year and for the impact of deferred tax liabilities and assets, which represent future tax consequences of events that have been recognized differently in the financial statements than for tax purposes. Deferred tax assets and liabilities are established using the enacted statutory tax rates and are adjusted for any changes in such rates in the period of change. Worldpay, Inc. is taxed as a C Corporation, which is subject to both federal and state taxation at a corporate level. Therefore, tax expense and deferred tax assets and liabilities reflect such status.
The Company uses the asset and liability method of accounting for income taxes. Under this method, deferred tax assets and liabilities are recognized for the future tax consequences attributable to differences between the financial statement carrying amounts of existing assets and liabilities and their respective tax basis. Deferred tax assets and liabilities are measured using enacted tax rates expected to apply to taxable income in the years in which those temporary differences are expected to be recovered or settled.
On December 22, 2017, the President of the United States signed into law Tax Reform. Tax Reform amends the Internal Revenue Code to reduce tax rates and modify policies, credits, and deductions as well as reduces the corporate federal tax rate from a maximum of 35% to a flat 21% rate with an effective date of January 1, 2018. The Company’s net deferred tax asset prior to Tax Reform was based on a combined federal and state rate using the Company’s then-current enacted federal tax rate of 35%. As a result of the reduction in the corporate income tax rate from 35% to 21% under Tax Reform, the Company
84
has adjusted its net deferred tax asset. The Company estimates that this will result in a reduction in the value of its net deferred tax asset of approximately $363.6 million, which is recorded as additional income tax expense in the Company’s consolidated statement of income for the year ended December 31, 2017. The Company’s revaluation of its deferred tax asset is subject to further clarification of Tax Reform through anticipated additional guidance and technical corrections. As a result, the actual impact on the net deferred tax asset as well as the impact on net income may vary from the estimated amount due to uncertainties in the Company’s preliminary review.
The following is a summary of applicable income taxes (in thousands):
Year Ended December 31, | ||||||||||||
2017 | 2016 | 2015 | ||||||||||
Current income tax expense: | ||||||||||||
U.S. income taxes | $ | 27,852 | $ | 57,966 | $ | 28,586 | ||||||
State and local income taxes | 6,366 | 4,219 | 4,311 | |||||||||
Total current tax expense | 34,218 | 62,185 | 32,897 | |||||||||
Deferred income tax expense (benefit): | ||||||||||||
U.S. income taxes | 575,629 | 70,786 | 55,553 | |||||||||
State and local income taxes | 21,173 | 8,882 | (273 | ) | ||||||||
Total deferred tax expense | 596,802 | 79,668 | 55,280 | |||||||||
Applicable income tax expense | $ | 631,020 | $ | 141,853 | $ | 88,177 | ||||||
A reconciliation of the U.S. income tax rate and the Company’s effective tax rate for all periods is provided below:
Year Ended December 31, | |||||||||
2017 | 2016 | 2015 | |||||||
Federal statutory tax rate | 35.0 | % | 35.0 | % | 35.0 | % | |||
State taxes-net of federal benefit | 2.9 | 2.8 | 2.7 | ||||||
Effect of changes in deferred tax rates | 44.0 | 0.1 | (1.9 | ) | |||||
Non-controlling interest | (1.6 | ) | (4.6 | ) | (5.9 | ) | |||
Other-net | (0.7 | ) | 0.3 | (0.3 | ) | ||||
Excess tax benefit from share-based compensation | (2.1 | ) | — | — | |||||
Effective tax rate | 77.5 | % | 33.6 | % | 29.6 | % | |||
Deferred income tax assets and liabilities are comprised of the following as of December 31, 2017 and 2016 (in thousands):
December 31, 2017 | December 31, 2016 | |||||||
Deferred tax assets | ||||||||
Net operating losses | $ | 29,387 | $ | 14,085 | ||||
Employee benefits | 1,247 | 69 | ||||||
Other assets | 2,691 | 2,236 | ||||||
Other accruals and reserves | 59,229 | 89,239 | ||||||
Partnership basis | 732,956 | 771,311 | ||||||
Deferred tax assets | 825,510 | 876,940 | ||||||
Deferred tax liabilities | ||||||||
Property and equipment | (31,439 | ) | (13,677 | ) | ||||
Goodwill and intangible assets | (120,164 | ) | (150,687 | ) | ||||
Deferred tax liability | (151,603 | ) | (164,364 | ) | ||||
Deferred tax asset-net | $ | 673,907 | $ | 712,576 | ||||
85
As part of certain acquisitions, the Company acquired federal and state tax loss carryforwards. As of December 31, 2017, the cumulative federal and state tax loss carryforwards were approximately $111.1 million and $144.8 million, respectively. Federal tax loss carryforwards will expire between 2030 and 2037 and state tax loss carryforwards will expire between 2020 and 2037.
The partnership basis included in the above table is the result of a difference between the tax basis and book basis of Worldpay, Inc.’s investment in Vantiv Holding. Vantiv Holding, a partnership for tax purposes, has an Internal Revenue Code election in place to adjust the tax basis of partnership property to fair market value related to the portion of the partnership interest transferred, through an exchange of units of Vantiv Holding by its members. Included in partnership basis in the table above are deferred tax assets resulting from the increase in tax basis generated by the exchange of units of Vantiv Holding by the Bank. See Note 7 - Tax Receivable Agreements for discussion of deferred tax assets as a result of the secondary offerings and exchange of units of Vantiv Holding.
Deferred tax assets are reviewed to determine whether the available evidence allows the Company to recognize the tax benefits. To the extent that a tax asset is not expected to be realized, the Company records a valuation allowance against the deferred tax assets. The Company has recorded no valuation allowance during the years ended December 31, 2017 or 2016.
A provision for federal, state and local income taxes has been recorded on the statements of income for the amounts of such taxes the Company is obligated to pay or amounts refundable to the Company. At December 31, 2017 and 2016, the Company had an income tax receivable of approximately $23.1 million and $8.3 million, respectively, which is included in other current assets on the Company’s consolidated statements of financial position.
The Company accounts for uncertainty in income taxes under ASC 740, Income Taxes. As of December 31, 2017 and 2016, the Company had no material uncertain tax positions. If a future liability does arise related to uncertainty in income taxes, the Company has elected an accounting policy to classify interest and penalties, if any, as income tax expense.
15. FAIR VALUE MEASUREMENTS
Fair value is defined as the price that would be received to sell an asset or paid to transfer a liability in an orderly transaction between market participants at the measurement date. The Company uses the hierarchy prescribed in ASC 820, Fair Value Measurement, based upon the available inputs to the valuation and the degree to which they are observable or not observable in the market. The three levels in the hierarchy are as follows:
• | Level 1 Inputs—Quoted prices (unadjusted) for identical assets or liabilities in active markets that are accessible as of the measurement date. |
• | Level 2 Inputs—Inputs other than quoted prices within Level 1 that are observable either directly or indirectly, including but not limited to quoted prices in markets that are not active, quoted prices in active markets for similar assets or liabilities and observable inputs other than quoted prices such as interest rates or yield curves. |
• | Level 3 Inputs—Unobservable inputs reflecting the Company’s own assumptions about the assumptions that market participants would use in pricing the asset or liability, including assumptions about risk. |
The following table summarizes assets and liabilities measured at fair value on a recurring basis as of December 31, 2017 and 2016 (in thousands):
2017 | 2016 | ||||||||||||||||||||||
Fair Value Measurements Using | |||||||||||||||||||||||
Level 1 | Level 2 | Level 3 | Level 1 | Level 2 | Level 3 | ||||||||||||||||||
Assets: | |||||||||||||||||||||||
Interest rate contracts | $ | — | $ | 24,406 | $ | — | $ | — | $ | 23,229 | $ | — | |||||||||||
Deal contingent foreign currency forward | — | 33,108 | — | — | — | — | |||||||||||||||||
Liabilities: | |||||||||||||||||||||||
Interest rate contracts | $ | — | $ | 4,397 | $ | — | $ | — | $ | 15,058 | $ | — | |||||||||||
Mercury TRA | — | 100,571 | — | — | — | 147,040 | |||||||||||||||||
86
Interest Rate Contracts
The Company uses interest rate contracts to manage interest rate risk. The fair value of interest rate swaps is determined using the market standard methodology of netting the discounted future fixed cash receipts (or payments) and the discounted expected variable cash payments (or receipts). The variable cash payments (or receipts) are based on the expectation of future interest rates (forward curves) derived from observed market interest rate curves. The fair value of the interest rate caps is determined using widely accepted valuation techniques including discounted cash flow analysis on the expected future cash flows of each interest rate cap. This analysis reflects the contractual terms of the interest rate caps, including the period to maturity, and uses observable market inputs including interest rate curves and implied volatilities. In addition, to comply with the provisions of ASC 820, Fair Value Measurement, credit valuation adjustments, which consider the impact of any credit enhancements to the contracts, are incorporated in the fair values to account for potential nonperformance risk. In adjusting the fair value of its interest rate contracts for the effect of nonperformance risk, the Company has considered any applicable credit enhancements such as collateral postings, thresholds, mutual puts, and guarantees.
Although the Company determined that the majority of the inputs used to value its interest rate contracts fell within Level 2 of the fair value hierarchy, the credit valuation adjustments associated with its interest rate contracts utilized Level 3 inputs, such as estimates of current credit spreads to evaluate the likelihood of default by itself and its counterparties. However, as of December 31, 2017 and 2016, the Company assessed the significance of the impact of the credit valuation adjustments on the overall valuation of its interest rate contracts and determined that the credit valuation adjustment was not significant to the overall valuation of its interest rate contracts. As a result, the Company classified its interest rate contract valuations in Level 2 of the fair value hierarchy. See Note 8 - Derivatives and Hedging Activities for further discussion of the Company’s interest rate contracts.
Deal Contingent Forward
The Company uses a foreign currency contract to manage its foreign currency exposure relating to the Worldpay transaction (see Note 8 - Derivatives and Hedging Activities). The fair value of the foreign currency forward is determined using the market standard methodology of discounting the projected settlement value of the instrument. The projected settlement value is based on the expectation of future foreign currency rates derived from observed market interest rate curves. In addition, to comply with the provisions of ASC 820, credit valuation adjustments are incorporated in the fair values to account for potential nonperformance risk. In adjusting the fair value of its foreign currency forward contract for the effect of nonperformance risk, the Company has considered any applicable credit enhancements such as collateral postings, thresholds, mutual puts, and guarantees.
Although the Company determined that the majority of the inputs used to value its foreign currency contract fell within Level 2 of the fair value hierarchy, certain Level 3 inputs were utilized, including the probability of successfully closing the Worldpay merger and certain other estimates required to compute the credit valuation analysis, such as the estimates of current credit spreads to evaluate the likelihood of default by itself and its counterparties. However, as of December 31, 2017, the Company assessed the significance of the impact of the Level 3 inputs on the overall valuation of its foreign currency contract and determined that those inputs were in the aggregate not significant to the overall valuation of its foreign currency contract. As a result, the Company classified its foreign currency contract valuation in Level 2 of the fair value hierarchy. See Note 8 - Derivatives and Hedging Activities for further discussion of the Company’s foreign currency contract.
87
Mercury TRA
The Mercury TRA is considered contingent consideration as it is part of the consideration payable to the former owners of Mercury. Such contingent consideration is measured at fair value and is based on significant inputs not observable in the market, which is classified in Level 3 of the fair value hierarchy. The Mercury TRA is recorded at fair value based on estimates of discounted future cash flows associated with the estimated payments to the Mercury TRA Holders. The significant unobservable input used in the fair value measurement of the Mercury TRA as of December 31, 2016 is the discount rate, which was approximately 14%. As of that date, any significant increase (decrease) in this input could potentially result in a significantly lower (higher) fair value measurement. Due to the passage of time, the discount rate is no longer a significant input at December 31, 2017. The liability recorded is re-measured at fair value at each reporting period with the change in fair value recognized in earnings as a non-operating expense. The change in value of the Mercury TRA from December 31, 2016 to December 31, 2017 consists of the increase in fair value of $14.0 million and the decrease from payments of $60.4 million related to the Mercury TRA obligations and the exercised call options. The Company recorded non-operating expenses of $14.0 million and $19.5 million related to the change in fair value during the years ended December 31, 2017 and 2016, respectively. See Note 7 - Tax Receivable Agreements for further discussion of the Mercury TRA including the roll forward of the fair value.
The following table summarizes carrying amounts and estimated fair values for the Company’s financial instrument liabilities that are not reported at fair value in our consolidated statements of financial position as of December 31, 2017 and 2016 (in thousands):
2017 | 2016 | ||||||||||||||
Carrying Amount | Fair Value | Carrying Amount | Fair Value | ||||||||||||
Liabilities: | |||||||||||||||
Notes payable | $ | 5,694,245 | $ | 5,772,055 | $ | 3,220,722 | $ | 3,250,025 | |||||||
We consider that the carrying value of cash and cash equivalents, receivables, accounts payable and accrued expenses approximates fair value (level 1) given the short-term nature of these items. The fair value of the Company’s notes payable was estimated based on rates currently available to the Company for bank loans with similar terms and maturities and is classified in Level 2 of the fair value hierarchy.
16. NET INCOME PER SHARE
Basic net income per share is calculated by dividing net income attributable to Worldpay, Inc. by the weighted-average shares of Class A common stock outstanding during the period.
Diluted net income per share is calculated assuming that Vantiv Holding is a wholly-owned subsidiary of Worldpay, Inc., therefore eliminating the impact of Fifth Third’s non-controlling interest. Pursuant to the Exchange Agreement, the Class B units of Vantiv Holding (“Class B units”), which are held by Fifth Third and represent the non-controlling interest in Vantiv Holding, are convertible into shares of Class A common stock on a one-for-one basis. Based on this conversion feature, diluted net income per share is calculated assuming the conversion of the Class B units on an “if-converted” basis. Due to the Company’s structure as a C corporation and Vantiv Holding’s structure as a pass-through entity for tax purposes, the numerator in the calculation of diluted net income per share is adjusted accordingly to reflect the Company’s income tax expense assuming the conversion of the Fifth Third non-controlling interest into Class A common stock. During the year ended December 31, 2017 and 2016, approximately 27.2 million and 35.0 million, respectively, weighted-average Class B units of Vantiv Holding were excluded in computing diluted net income per share because including them would have had an antidilutive effect. As the Class B units of Vantiv Holding were not included, the numerator used in the calculation of diluted net income per share was equal to the numerator used in the calculation of basic net income per share for the year ended December 31, 2017 and 2016. As of December 31, 2017 there were approximately 15.3 million Class B units outstanding and 35.0 million Class B units outstanding as of December 31, 2016 and 2015, respectively.
In addition to the Class B units discussed above, potentially dilutive securities during the years ended December 31, 2017 and 2016 included restricted stock awards, restricted stock units, stock options, performance share awards and ESPP purchase rights. Potentially dilutive securities for the year ended December 31, 2015 includes restricted stock awards, restricted stock units, stock options and performance awards. Additionally, potentially dilutive securities during the years ended December 31, 2016 and 2015 also included the warrant held by Fifth Third which allows for the purchase of Class C units of Vantiv Holding. During the year ended December 31, 2017, 2016 and 2015, approximately 738,520, 660,204 and 472,518,
88
respectively, performance awards have been excluded as the applicable performance metrics had not been met as of the reporting dates.
The shares of Class B common stock do not share in the earnings or losses of the Company and are therefore not participating securities. Accordingly, basic and diluted net income per share of Class B common stock have not been presented.
The following table sets forth the computation of basic and diluted net income per share (in thousands, except share data):
Year Ended December 31, | |||||||||||
2017 | 2016 | 2015 | |||||||||
Basic: | |||||||||||
Net income attributable to Worldpay, Inc. | $ | 130,110 | $ | 213,208 | $ | 147,946 | |||||
Shares used in computing basic net income per share: | |||||||||||
Weighted-average Class A common shares | 161,293,062 | 156,043,636 | 145,044,577 | ||||||||
Basic net income per share | $ | 0.81 | $ | 1.37 | $ | 1.02 | |||||
Diluted: | |||||||||||
Consolidated income before applicable income taxes | $ | — | $ | — | $ | 297,406 | |||||
Income tax expense excluding impact of non-controlling interest | — | — | 107,066 | ||||||||
Net income attributable to Worldpay, Inc. | $ | 130,110 | $ | 213,208 | $ | 190,340 | |||||
Shares used in computing diluted net income per share: | |||||||||||
Weighted-average Class A common shares | 161,293,062 | 156,043,636 | 145,044,577 | ||||||||
Weighted-average Class B units of Vantiv Holding | — | — | 42,521,087 | ||||||||
Warrant | — | 4,959,501 | 11,866,595 | ||||||||
Stock options | 729,138 | 531,165 | 545,180 | ||||||||
Restricted stock awards, restricted stock units and employee stock purchase plan | 663,663 | 510,694 | 696,273 | ||||||||
Performance awards | 121,283 | 70,553 | 260,730 | ||||||||
Diluted weighted-average shares outstanding | 162,807,146 | 162,115,549 | 200,934,442 | ||||||||
Diluted net income per share | $ | 0.80 | $ | 1.32 | $ | 0.95 | |||||
89
17. ACCUMULATED OTHER COMPREHENSIVE INCOME (LOSS)
The activity of the components of accumulated other comprehensive income (loss) related to cash flow hedging and other activities for the years ended December 31, 2017, 2016 and 2015 is presented below (in thousands):
Total Other Comprehensive Income (Loss) | ||||||||||||||||||||||||||||
AOCI Beginning Balance | Pretax Activity | Tax Effect | Net Activity | Attributable to non-controlling interests | Attributable to Worldpay, Inc. | AOCI Ending Balance | ||||||||||||||||||||||
Year Ended December 31, 2017 | ||||||||||||||||||||||||||||
Net change in fair value recorded in accumulated OCI | $ | (17,819 | ) | $ | 6,661 | $ | (2,295 | ) | $ | 4,366 | $ | (340 | ) | $ | 4,026 | $ | (13,793 | ) | ||||||||||
Net realized loss reclassified into earnings (a) | 11,622 | 9,416 | (2,873 | ) | 6,543 | (1,480 | ) | 5,063 | 16,685 | |||||||||||||||||||
Net change | $ | (6,197 | ) | $ | 16,077 | $ | (5,168 | ) | $ | 10,909 | $ | (1,820 | ) | $ | 9,089 | $ | 2,892 | |||||||||||
Year Ended December 31, 2016 | ||||||||||||||||||||||||||||
Net change in fair value recorded in accumulated OCI | $ | (14,336 | ) | $ | (6,858 | ) | $ | 2,106 | $ | (4,752 | ) | $ | 1,269 | $ | (3,483 | ) | $ | (17,819 | ) | |||||||||
Net realized loss reclassified into earnings (a) | 5,132 | 12,735 | (3,930 | ) | 8,805 | (2,315 | ) | 6,490 | 11,622 | |||||||||||||||||||
Net change | $ | (9,204 | ) | $ | 5,877 | $ | (1,824 | ) | $ | 4,053 | $ | (1,046 | ) | $ | 3,007 | $ | (6,197 | ) | ||||||||||
Year Ended December 31, 2015 | ||||||||||||||||||||||||||||
Net change in fair value recorded in accumulated OCI | $ | (5,288 | ) | $ | (18,836 | ) | $ | 5,490 | $ | (13,346 | ) | $ | 4,298 | $ | (9,048 | ) | $ | (14,336 | ) | |||||||||
Net realized loss reclassified into earnings (a) | 1,732 | 6,990 | (2,065 | ) | 4,925 | (1,525 | ) | 3,400 | 5,132 | |||||||||||||||||||
Other | (212 | ) | 212 | — | 212 | — | 212 | — | ||||||||||||||||||||
Net change | $ | (3,768 | ) | $ | (11,634 | ) | $ | 3,425 | $ | (8,209 | ) | $ | 2,773 | $ | (5,436 | ) | $ | (9,204 | ) | |||||||||
(a) The reclassification adjustment on cash flow hedge derivatives affected the following lines in the accompanying consolidated statements of income:
OCI Component | Affected line in the accompanying consolidated statements of income | ||||||||||
Pretax activity(1) | Interest expense-net | ||||||||||
Tax effect | Income tax expense | ||||||||||
OCI attributable to non-controlling interests | Net income attributable to non-controlling interests | ||||||||||
(1) The years ended December 31, 2017, 2016 and 2015, reflect amounts of losses reclassified from AOCI into earnings, representing the effective portion of the hedging relationships, and are recorded in interest expense-net. | |||||||||||
18. RELATED PARTY TRANSACTIONS
In connection with the Company’s separation from Fifth Third on June 30, 2009, the Company entered into various agreements which provide for services provided to or received from Fifth Third. Subsequent to the separation from Fifth Third, the Company continues to enter into various business agreements with Fifth Third. Transactions under these agreements are discussed below and throughout these notes to the accompanying consolidated financial statements. As discussed in Note 1 - Basis of Presentation and Summary of Significant Accounting Policies, Fifth Third currently holds 15,252,826 shares of Class B common stock representing 8.6% of the voting interests in Worldpay, Inc. and 15,252,826 Class B units of Vantiv Holding representing an 8.6% ownership interest in Vantiv Holding.
90
Debt Agreements
As discussed in Note 6 - Long-Term Debt, Fifth Third held $163.7 million and $151.1 million as of December 31, 2017 and 2016, respectively, of the Company’s outstanding debt. For the years ended December 31, 2017, 2016 and 2015, interest expense associated with these arrangements was $4.9 million, $4.2 million and $4.4 million, respectively, and commitment fees were $0.1 million, $0.1 million and $0.2 million, respectively.
Lease Agreement
The Company leases or subleases a number of office and/or data center locations with Fifth Third. For the years ended December 31, 2017, 2016 and 2015, related party rent expense was approximately $3.7 million, $3.7 million and $3.8 million.
Service Processing and Other Service Agreements
In July 2016, the Company amended and extended its Master Services Agreement with Fifth Third (the “EFT Service Agreement”), expiring in June 2019, through December 2024. The EFT Service Agreement is exclusive and provides Fifth Third and its subsidiary depository institutions with various electronic fund transfer, or EFT, services including debit card processing and ATM terminal driving services. Revenue for the EFT Service Agreement and other services is in the related party revenues line on the Company’s consolidated statement of income.
Referral Agreement
In July 2016, the Company amended and extended its exclusive referral arrangement with Fifth Third, expiring in June 2019, through December 2024. Commercial and retail merchant clients of Fifth Third and its subsidiary depository institutions that request merchant (credit or debit card) acceptance services are referred exclusively to us. In return for these referrals and the resulting merchant relationships, we make ongoing incentive payments to Fifth Third. Costs associated with this agreement totaled $2.1 million, $0.7 million and $0.3 million for the years ended December 31, 2017, 2016 and 2015, respectively.
Clearing, Settlement and Sponsorship Agreement and Treasury Management Agreement
As discussed in Note 1 - Basis of Presentation and Summary of Significant Accounting Policies, Fifth Third is a member of the Visa, Mastercard and other payment network associations. Fifth Third is the Company’s primary sponsor into the respective card associations. In July 2016, the Company amended and extended its agreement with Fifth Third, expiring in June 2019, through December 2024. Fifth Third also provides access to certain cash and treasury management services to the Company. For the years ended December 31, 2017, 2016 and 2015, the Company paid Fifth Third approximately $2.3 million, $2.9 million and $2.3 million, respectively, for these services. As discussed in Note 1 - Basis of Presentation and Summary of Significant Accounting Policies, the Company holds certain cash and cash equivalents on deposit at Fifth Third. At December 31, 2017 and 2016, approximately $81.0 million and $90.5 million, respectively, was held on deposit at Fifth Third. Interest income on deposits held at Fifth Third during the years ended December 31, 2017, 2016 and 2015 was immaterial.
Other Non-material Services
The Company continues to receive certain other non-material services from Fifth Third. The total expense for other services provided by Fifth Third for the years ended December 31, 2017, 2016 and 2015 was $0.2 million, $0.3 million and $0.4 million, respectively.
19. SEGMENT INFORMATION
The Company’s segments consist of the Merchant Services segment and the Financial Institution Services segment, which are organized by the products and services the Company provides. The Company’s Chief Executive Officer (“CEO”), who is the chief operating decision maker (“CODM”), evaluates the performance and allocates resources based on the operating results of each segment. The Company’s reportable segments are the same as the Company’s operating segments and there is no aggregation of the Company’s operating segments. Below is a summary of each segment:
91
• | Merchant Services—Provides merchant acquiring and payment processing services to large national merchants, regional and small-to-mid sized businesses. Merchant services are sold to small to large businesses through diverse distribution channels. Merchant Services includes all aspects of card processing including authorization and settlement, customer service, chargeback and retrieval processing and interchange management. |
• | Financial Institution Services—Provides card issuer processing, payment network processing, fraud protection, card production, prepaid program management, ATM driving and network gateway and switching services that utilize the Company’s proprietary Jeanie debit payment network to a diverse set of financial institutions, including regional banks, community banks, credit unions and regional personal identification number (“PIN”) networks. Financial Institution Services also provides statement production, collections and inbound/outbound call centers for credit transactions, and other services such as credit card portfolio analytics, program strategy and support, fraud and security management and chargeback and dispute services. |
Segment operating results are presented below (in thousands). The results reflect revenues and expenses directly related to each segment. The Company does not evaluate performance or allocate resources based on segment asset data, and therefore such information is not presented.
Segment profit reflects total revenue less network fees and other costs and sales and marketing costs of the segment. The Company’s CODM evaluates this metric in analyzing the results of operations for each segment.
Year Ended December 31, 2017 | |||||||||||
Merchant Services | Financial Institution Services | Total | |||||||||
Total revenue | $ | 3,567,533 | $ | 458,944 | $ | 4,026,477 | |||||
Network fees and other costs | 1,780,179 | 122,986 | 1,903,165 | ||||||||
Sales and marketing | 646,479 | 23,027 | 669,506 | ||||||||
Segment profit | $ | 1,140,875 | $ | 312,931 | $ | 1,453,806 | |||||
Year Ended December 31, 2016 | |||||||||||
Merchant Services | Financial Institution Services | Total | |||||||||
Total revenue | $ | 3,082,951 | $ | 496,040 | $ | 3,578,991 | |||||
Network fees and other costs | 1,537,072 | 137,158 | 1,674,230 | ||||||||
Sales and marketing | 557,942 | 24,309 | 582,251 | ||||||||
Segment profit | $ | 987,937 | $ | 334,573 | $ | 1,322,510 | |||||
Year Ended December 31, 2015 | |||||||||||
Merchant Services | Financial Institution Services | Total | |||||||||
Total revenue | $ | 2,656,906 | $ | 503,032 | $ | 3,159,938 | |||||
Network fees and other costs | 1,321,312 | 156,890 | 1,478,202 | ||||||||
Sales and marketing | 478,736 | 25,213 | 503,949 | ||||||||
Segment profit | $ | 856,858 | $ | 320,929 | $ | 1,177,787 | |||||
92
A reconciliation of total segment profit to the Company’s income before applicable income taxes is as follows (in thousands):
Year Ended December 31, | |||||||||||
2017 | 2016 | 2015 | |||||||||
Total segment profit | $ | 1,453,806 | $ | 1,322,510 | $ | 1,177,787 | |||||
Less: Other operating costs | (318,665 | ) | (294,235 | ) | (284,066 | ) | |||||
Less: General and administrative | (295,101 | ) | (189,707 | ) | (182,369 | ) | |||||
Less: Depreciation and amortization | (318,493 | ) | (270,054 | ) | (276,942 | ) | |||||
Less: Interest expense—net | (140,661 | ) | (109,534 | ) | (105,736 | ) | |||||
Less: Non-operating income (expense) | 432,826 | (36,256 | ) | (31,268 | ) | ||||||
Income before applicable income taxes | $ | 813,712 | $ | 422,724 | $ | 297,406 | |||||
20. QUARTERLY CONSOLIDATED RESULTS OF OPERATIONS (UNAUDITED)
The following table sets forth our unaudited results of operations on a quarterly basis for the years ended December 31, 2017 and 2016.
Dec 31, 2017 | Sep 30, 2017 | Jun 30, 2017 | Mar 31, 2017 | Dec 31, 2016 | Sep 30, 2016 | Jun 30, 2016 | Mar 31, 2016 | ||||||||||||||||||||||||
(dollars in thousands) | |||||||||||||||||||||||||||||||
Revenue | $ | 1,065,746 | $ | 1,033,765 | $ | 998,764 | $ | 928,202 | $ | 955,132 | $ | 914,019 | $ | 891,217 | $ | 818,623 | |||||||||||||||
Network fees and other costs | 496,807 | 479,533 | 468,733 | 458,092 | 452,720 | 423,361 | 410,736 | 387,413 | |||||||||||||||||||||||
Net revenue | 568,939 | 554,232 | 530,031 | 470,110 | 502,412 | 490,658 | 480,481 | 431,210 | |||||||||||||||||||||||
Sales and marketing | 172,424 | 173,779 | 168,263 | 155,040 | 148,521 | 153,248 | 144,844 | 135,638 | |||||||||||||||||||||||
Other operating costs | 84,318 | 79,482 | 78,941 | 75,924 | 74,771 | 72,162 | 73,599 | 73,703 | |||||||||||||||||||||||
General and administrative | 105,469 | 49,607 | 50,727 | 89,298 | 55,876 | 40,727 | 49,120 | 43,984 | |||||||||||||||||||||||
Depreciation and amortization | 81,529 | 82,500 | 78,378 | 76,086 | 70,504 | 66,086 | 65,234 | 68,230 | |||||||||||||||||||||||
Income from operations | $ | 125,199 | $ | 168,864 | $ | 153,722 | $ | 73,762 | $ | 152,740 | $ | 158,435 | $ | 147,684 | $ | 109,655 | |||||||||||||||
Net (loss) income | $ | (46,368 | ) | $ | 106,905 | $ | 86,854 | $ | 35,301 | $ | 62,958 | $ | 87,004 | $ | 78,461 | $ | 52,448 | ||||||||||||||
Net income (loss) attributable to Worldpay, Inc. | $ | (59,670 | ) | $ | 92,118 | $ | 68,777 | $ | 28,885 | $ | 47,847 | $ | 66,296 | $ | 59,327 | $ | 39,738 | ||||||||||||||
Net income (loss) per share attributable to Worldpay, Inc. Class A common stock: | |||||||||||||||||||||||||||||||
Basic | $ | (0.37 | ) | $ | 0.57 | $ | 0.43 | $ | 0.18 | $ | 0.30 | $ | 0.43 | $ | 0.38 | $ | 0.26 | ||||||||||||||
Diluted | $ | (0.37 | ) | $ | 0.57 | $ | 0.42 | $ | 0.17 | $ | 0.29 | $ | 0.41 | $ | 0.38 | $ | 0.25 | ||||||||||||||
Our results of operations are subject to seasonal fluctuations in our revenue as a result of consumer spending patterns. Historically our revenues have been the strongest in the fourth quarter and weakest in our first quarter.
93
21. SUBSEQUENT EVENT
Acquisition of Legacy Worldpay
On January 16, 2018, the Company completed the acquisition of Legacy Worldpay by acquiring 100% of the issued and outstanding shares. The approximately $11.9 billion purchase price consisted of Legacy Worldpay shareholders receiving 55 pence in cash and 0.0672 new shares of the Company’s Class A common stock for each Legacy Worldpay ordinary share held. As of the closing of the acquisition, Legacy Worldpay had 2,000,000,000 shares outstanding, thus resulting in an approximately $1.5 billion cash payment and 134.4 million shares of the Company’s Class A common stock being issued to fund the acquisition.
On January 16, 2018, the Company’s Class A common stock began trading on the New York Stock Exchange under the new symbol “WP” and on the London Stock Exchange via a secondary standard listing under the symbol “WPY.” Legacy Worldpay shares were delisted from the London Stock Exchange on the same day.
The acquisition creates a leading global integrated payment technology and international eCommerce payment provider and will enable the Company to take advantage of strategic and innovative opportunities to provide differentiated and diversified solutions to address clients’ needs.
Financing Arrangements
As of the completion of the Legacy Worldpay acquisition, the Company’s outstanding debt consisted of the following (in thousands):
January 16, 2018 | |||
Term A-5 loan, maturing in January 2023(1) | $ | 3,771,731 | |
Term A-3 loan, maturing in October 2021(2) | 179,175 | ||
Term B-4 loan, maturing in August 2024(3) | 1,805,000 | ||
Term B-3 loan, maturing in October 2023(4) | 757,350 | ||
Senior Unsecured Dollar Notes, maturing in November 2025(5) | 500,000 | ||
Senior Unsecured Sterling Notes, maturing in November 2025(6) | 648,859 | ||
Senior Unsecured Euro Note, expiring in November 2022(7) | 613,175 | ||
Leasehold mortgage, expiring on August 10, 2021(8) | 10,131 | ||
Notes payable and note payable to related party | $ | 8,285,421 | |
(1) | Interest at a variable base rate (LIBOR) plus a spread rate (225 basis points) (total rate of 3.81% at January 16, 2018) and amortizing on a basis of 1.25% per quarter during each of the first twelve quarters (June 2018 through March 2021), 1.875% per quarter during the next four quarters (June 2021 through March 2022) and 2.50% per quarter during the next three quarters (June 2022 through December 2022) with a balloon payment due at maturity. |
(2) | Interest at a variable base rate (LIBOR) plus a spread rate (200 basis points) (total rate of 3.56% at January 16, 2018) and amortizing on a basis of 1.32% per quarter during each of the first eight quarters (March 2018 through December 2019), 1.97% per quarter during the next four quarters (March 2020 through December 2020) and 2.63% per quarter during the next three quarters (March 2021 through September 2021) with a balloon payment due at maturity. |
(3) | Interest at a variable base rate (LIBOR) plus a spread rate (200 basis points) (total rate of 3.56% at January 16, 2018) and amortizing on a basis of 0.25% per quarter, with a balloon payment due at maturity. |
(4) | Interest at a variable base rate (LIBOR) plus a spread rate (200 basis points) (total rate of 3.56% at January 16, 2018) and amortizing on a basis of 0.25% per quarter, with a balloon payment due at maturity. |
(5) | $500 million principal senior unsecured notes with interest payable semi-annually at a fixed rate of 4.375% and principal due upon maturity |
(6) | £470 million principal senior unsecured notes with interest payable semi-annually at a fixed rate of 3.875% and principal due upon maturity. The spot rate of 1.3806 U.S. dollars per Pound Sterling at January 16, 2018 was used to translate the Note to U.S. dollars. |
(7) | €500 million principal senior unsecured note with interest payable semi-annually at a fixed rate of 3.75% and principal due upon maturity. The spot rate of 1.2264 U.S. dollars per Euro at January 16, 2018 was used to translate the Note to U.S. dollars. |
(8) | Interest payable monthly at a fixed rate of 6.22%. |
94
Prior to the closing of the Legacy Worldpay acquisition, the Company entered into multiple amendments to the Existing Loan Agreement, which became effective at the closing of the acquisition. The resulting incremental funding is as follows:
• | $1.605 billion of additional five-year term Tranche A-5 loans (included in table above) |
• | $535.0 million of additional seven-year term Tranche B-4 loans (included in table above) |
• | $600.0 million of additional revolving credit commitments, resulting in total available revolving credit of $1.25 billion (no outstanding balance at January 16, 2018) |
• | $594.5 million backstop Tranche B-2 (no outstanding balance at January 16, 2018) |
Fifth Third Ownership
As a result of the 134.4 million shares of Class A common stock issued to fund the Legacy Worldpay acquisition, Fifth Third’s ownership percentage in Vantiv Holding decreases from 8.58% as of December 31, 2017 to approximately 4.9% as of January 16, 2018.
Deal Contingent Forward
Upon the closing of the acquisition, the Company settled its deal contingent forward discussed in Note 8 - Derivatives and Hedging Activities, which resulted in the Company recording a related realized gain of approximately $56 million.
Unaudited Pro Forma Results Giving Effect to the Legacy Worldpay Acquisition
The following unaudited pro forma combined financial information presents the Company’s results of operations for the year ended December 31, 2017 as if the acquisition had occurred on January 1, 2017.
December 31, 2017 | ||||
(in thousands, except per share amounts) | ||||
Total revenue | $ | 6,171,838 | ||
Net income attributable to Worldpay, Inc. | 84,073 | |||
Net income per share attributable to Worldpay, Inc. Class A common stock: | ||||
Basic | $ | 0.28 | ||
Diluted | $ | 0.28 | ||
Shares used in computing net income per share of Class A common stock: | ||||
Basic | 295,693,062 | |||
Diluted | 297,207,146 | |||
The unaudited pro forma results include certain pro forma adjustments that were directly attributable to the acquisition as follows:
• | additional amortization expense that would have been recognized relating to the acquired intangible assets; and |
• | adjustment to interest expense to reflect the additional borrowings of the Company in conjunction with the acquisition and removal of Legacy Worldpay debt. |
******
95
Item 9. Changes in and Disagreements with Accountants on Accounting and Financial Disclosure
None
Item 9A. Controls and Procedures
Evaluation of Disclosure Controls and Procedures
Our management, with the participation of our Chief Executive Officer and Chief Financial Officer, evaluated the effectiveness of our disclosure controls and procedures as of December 31, 2017. The term “disclosure controls and procedures,” as defined in Rules 13a-15(e) and 15d-15(e) under the Securities Exchange Act of 1934, means controls and other procedures of a company that are designed to ensure that information required to be disclosed by a company in the reports that it files or submits under the Securities Exchange Act of 1934 is recorded, processed, summarized and reported within the time periods specified in the SEC’s rules and forms. Disclosure controls and procedures include, without limitation, controls and procedures designed to ensure that information required to be disclosed by a company in the reports it files or submits under the Securities Exchange Act of 1934 is accumulated and communicated to the company’s management, including its principal executive and principal financial officers, as appropriate to allow timely decisions regarding required disclosure. Management recognizes that any controls and procedures, no matter how well designed and operated, can provide only reasonable assurance of achieving their objectives. Based on the evaluation of our disclosure controls and procedures as of December 31, 2017, our Chief Executive Officer and Chief Financial Officer concluded that, as of such date, our disclosure controls and procedures were effective.
Management’s Report on Internal Control Over Financial Reporting
Management is responsible for establishing and maintaining adequate internal control over financial reporting as defined in Rule 13a-15(f) under the Exchange Act. Our internal control system is designed to provide reasonable assurance regarding the reliability of financial reporting and the preparation of financial statements for external purposes in accordance with generally accepted accounting principles. Because of its inherent limitations, internal control over financial reporting may not prevent or detect misstatements. Also controls deemed effective now may become inadequate in the future because of changes in conditions, or because compliance with the policies or procedures has deteriorated or been circumvented.
Under the supervision and with the participation of our Chief Executive Officer and Chief Financial Officer, our management assessed the effectiveness of our internal control over financial reporting as of December 31, 2017. In making this assessment, management used the criteria established in the Internal Control-Integrated Framework (2013) issued by the Committee of Sponsoring Organizations of the Treadway Commission (the “COSO criteria”). Based on management’s assessment and the COSO criteria, management believes that our internal control over financial reporting was effective as of December 31, 2017. In accordance with Sarbanes Oxley rules and regulations, which allow for a one year integration period, management has not conducted an assessment of internal control over financial reporting at Paymetric Holdings, Inc. (“Paymetric”), which was acquired on May 25, 2017. Paymetric had approximately 6.8% of the Company’s total assets and less than 1% of the Company’s total revenue, of the related consolidated financial statement amounts as of and for the year ended December 31, 2017. Paymetric will be included in the Company’s risk assessment and testing of internal controls in 2018.
Deloitte & Touche LLP, an independent registered public accounting firm, has audited the consolidated financial statements included in this Form 10-K and, as part of the audit, has issued a report, included herein, on the effectiveness of our internal control over financial reporting as of December 31, 2017.
Changes in Internal Control over Financial Reporting
There were no changes in our internal control over financial reporting that occurred during the three months ended December 31, 2017 that have materially affected, or are reasonably likely to materially affect, our internal control over financial reporting.
96
REPORT OF INDEPENDENT REGISTERED PUBLIC ACCOUNTING FIRM
To the Stockholders and the Board of Directors of Worldpay, Inc.
Opinion on Internal Control over Financial Reporting
We have audited the internal control over financial reporting of Worldpay, Inc. (formerly Vantiv, Inc.) and subsidiaries (the “Company”) as of December 31, 2017, based on criteria established in Internal Control - Integrated Framework (2013) issued by the Committee of Sponsoring Organizations of the Treadway Commission (COSO). In our opinion, the Company maintained, in all material respects, effective internal control over financial reporting as of December 31, 2017, based on criteria established in Internal Control - Integrated Framework (2013) issued by COSO.
We have also audited, in accordance with the standards of the Public Company Accounting Oversight Board (United States) (PCAOB), the consolidated financial statements and financial statement schedule as of and for the year ended December 31, 2017 of the Company and our report dated February 28, 2018 expressed an unqualified opinion on those financial statements.
As described in Management’s Report on Internal Control Over Financial Reporting, management excluded from its assessment the internal control over financial reporting at Paymetric Holdings, Inc., which was acquired on May 25, 2017 and whose financial statements constitute approximately 6.8% of total assets and less than 1% of total revenue of the consolidated financial statement amounts as of and for the year ended December 31, 2017. Accordingly, our audit did not include the internal control over financial reporting at Paymetric Holdings, Inc.
Basis for Opinion
The Company’s management is responsible for maintaining effective internal control over financial reporting and for its assessment of the effectiveness of internal control over financial reporting, included in the accompanying Management’s Report on Internal Control Over Financial Reporting. Our responsibility is to express an opinion on the Company’s internal control over financial reporting based on our audit. We are a public accounting firm registered with the PCAOB and are required to be independent with respect to the Company in accordance with the U.S. federal securities laws and the applicable rules and regulations of the Securities and Exchange Commission and the PCAOB.
We conducted our audit in accordance with the standards of the PCAOB. Those standards require that we plan and perform the audit to obtain reasonable assurance about whether effective internal control over financial reporting was maintained in all material respects. Our audit included obtaining an understanding of internal control over financial reporting, assessing the risk that a material weakness exists, testing and evaluating the design and operating effectiveness of internal control based on the assessed risk, and performing such other procedures as we considered necessary in the circumstances. We believe that our audit provides a reasonable basis for our opinion.
Definition and Limitations of Internal Control over Financial Reporting
A company’s internal control over financial reporting is a process designed to provide reasonable assurance regarding the reliability of financial reporting and the preparation of financial statements for external purposes in accordance with generally accepted accounting principles. A company’s internal control over financial reporting includes those policies and procedures that (1) pertain to the maintenance of records that, in reasonable detail, accurately and fairly reflect the transactions and dispositions of the assets of the company; (2) provide reasonable assurance that transactions are recorded as necessary to permit preparation of financial statements in accordance with generally accepted accounting principles, and that receipts and expenditures of the company are being made only in accordance with authorizations of management and directors of the company; and (3) provide reasonable assurance regarding prevention or timely detection of unauthorized acquisition, use, or disposition of the company’s assets that could have a material effect on the financial statements.
Because of its inherent limitations, internal control over financial reporting may not prevent or detect misstatements. Also, projections of any evaluation of effectiveness to future periods are subject to the risk that controls may become inadequate because of changes in conditions, or that the degree of compliance with the policies or procedures may deteriorate.
/s/ DELOITTE & TOUCHE LLP
Cincinnati, Ohio
February 28, 2018
97
Item 9B. Other Information
None
98
PART III
Item 10. Directors, Executive Officers and Corporate Governance
The information required by this item to be disclosed under is incorporated by reference to the Company’s Proxy Statement for its 2018 Annual Meeting of Stockholders to be filed with the SEC within 120 days after the end of the fiscal year ended December 31, 2017.
As a company incorporated in the United States and listed on the New York Stock Exchange, the Company is not subject to the requirements of the UK Corporate Governance Code. The Company follows and complies with the NYSE Listed Company Manual, which is the NYSE’s comprehensive rulebook for listed companies, including publishing an annual confirmation statement. In accordance with the NYSE Listed Company Manual, we have adopted a Code of Business Conduct and Ethics that applies to all of our directors, officers and employees, including our principal executive officer and principal financial officer. The Code of Business Conduct and Ethics is available on our website (http://investors.Worldpay.com) under “Corporate Governance.” We will also provide a copy of these documents to any person, without charge, upon request, by writing to us at Worldpay, Inc., Investor Relations Department, 8500 Governor’s Hill Drive, Symmes Township, Ohio 45249. We intend to satisfy the disclosure requirement under Item 5.05 of Form 8-K regarding an amendment to, or waiver from, a provision of our Code of Business Conduct and Ethics by posting such information on our website at the address and the location specified above.
Item 11. Executive Compensation
The information required by this item will be set forth in the Proxy Statement and is incorporated herein by reference.
Item 12. Securities Ownership of Certain Beneficial Owners and Management and Related Stockholder Matters
Except as included below regarding equity compensation plan information, the information required by this item will be set forth in the Proxy Statement and is incorporated herein by reference.
Equity Compensation Plan Information
The following table sets forth information as of December 31, 2017 regarding the Company’s equity compensation plans.
[a] | [b] | [c] | |||||
Number of securities to be issued upon exercise of outstanding options, warrants and rights (1) | Weighted-average exercise price of outstanding options, warrants and rights (2) | Number of securities remaining available for future issuance under equity compensation plans (excluding securities reflected in column [a]) | |||||
Plan category | |||||||
Equity compensation plans approved by stockholders | 3,538,173 | $44.68 | 25,641,429 | (3) | |||
Equity compensation plans not approved by stockholders | — | — | — | ||||
Total | 3,538,173 | $44.68 | 25,641,429 | (3)(4) | |||
(1) | Column [a] includes the following outstanding equity-based awards: |
• | 2,300,967 stock options; |
• | 909,294 restricted stock units; and |
• | 327,912 performance share units. |
(2) | The weighted-average exercise price set forth in this column is calculated without regard to restricted stock units and performance share units, which do not have any exercise price. |
(3) | Equity compensation plans consist of the Worldpay, Inc. 2012 Equity Incentive Plan (the “2012 Equity Incentive Plan”) and the Worldpay, Inc. Employee Stock Purchase Plan (the “ESPP”). The 2012 Equity Incentive Plan had 35.5 million shares initially authorized for issuance. In addition to these 35.5 million shares, the following shares will become available for grant under the 2012 Equity Incentive Plan, and, to the extent such shares became available as of |
99
December 31, 2017, they are included in the table above as available for grant: (i) shares covered by outstanding awards under the 2012 Equity Incentive Plan that are forfeited or otherwise terminated or settled in cash or other property rather than settled through the issuance of shares; and (ii) shares that are used to pay the exercise price of stock options and shares used to pay withholding taxes on equity awards generally. The ESPP had 2.5 million shares initially authorized for issuance. As of December 31, 2017, 2.3 million shares remain available for issuance under the ESPP.
(4) | Additionally, at the time of the acquisition of Mercury Payment Systems, LLC, the Company registered and issued 1.8 million shares under the Mercury Payment Systems, LLC 2010 Unit Incentive Plan, as Restated and Assumed by Worldpay, Inc. The awards issued were stock options, which have been excluded in the table above. As of December 31, 2017 there were 122,642 outstanding options remaining with a weighted-average exercise price of $17.02 and 315,761 awards available to be issued due to forfeitures subsequent to the acquisition. |
Item 13. Certain Relationships and Related Transactions and Director Independence
The information required by this item will be set forth in the Proxy Statement and is incorporated herein by reference.
Item 14. Principal Accountant Fees and Services
The information required by this item will be set forth in the Proxy Statement and is incorporated herein by reference.
100
PART IV
Item 15. Exhibits and Financial Statement Schedules
(a)(1) Consolidated Financial Statements
Our consolidated financial statements are set forth in “Item 8 - Financial Statements and Supplementary Data” of this report.
(a)(2) Financial Statement Schedules
Schedule I - Condensed Financial Information of Registrant
All other financial statement schedules have been omitted because they are not applicable, not material or the required information is presented in the financial statements or the notes thereto.
(a)(3) Exhibits
See the Exhibit Index immediately following the signature page of this Annual Report on Form 10-K, which is incorporated herein by reference.
101
SCHEDULE I - Condensed Financial Information of Registrant
Worldpay, Inc.
CONDENSED STATEMENTS OF INCOME (PARENT COMPANY ONLY)
(In thousands)
Year Ended December 31, | |||||||||||
2017 | 2016 | 2015 | |||||||||
General and administrative | $ | 24,722 | $ | 366 | $ | 745 | |||||
Loss from operations | (24,722 | ) | (366 | ) | (745 | ) | |||||
Non-operating income (expense), net | 418,859 | (58 | ) | (359 | ) | ||||||
Income (loss) before income taxes and equity in net income of subsidiaries | 394,137 | (424 | ) | (1,104 | ) | ||||||
Income tax expense | 609,966 | 80,635 | 54,007 | ||||||||
Loss before equity in net income of subsidiaries | (215,829 | ) | (81,059 | ) | (55,111 | ) | |||||
Equity in net income of subsidiaries | 345,939 | 294,267 | 203,057 | ||||||||
Net income attributable to Worldpay, Inc. | $ | 130,110 | $ | 213,208 | $ | 147,946 | |||||
See Notes to Condensed Consolidated Financial Statements (Parent Company only).
102
SCHEDULE I - Condensed Financial Information of Registrant
Worldpay, Inc.
CONDENSED STATEMENTS OF COMPREHENSIVE INCOME (PARENT COMPANY ONLY)
(In thousands)
Year Ended December 31, | ||||||||||||
2017 | 2016 | 2015 | ||||||||||
Net income attributable to Worldpay, Inc. | $ | 130,110 | $ | 213,208 | $ | 147,946 | ||||||
Other comprehensive income (loss), net of tax | 9,089 | 3,007 | (5,436 | ) | ||||||||
Comprehensive income attributable to Worldpay, Inc. | $ | 139,199 | $ | 216,215 | $ | 142,510 | ||||||
See Notes to Condensed Consolidated Financial Statements (Parent Company only).
103
SCHEDULE I - Condensed Financial Information of Registrant
Worldpay, Inc.
CONDENSED STATEMENTS OF FINANCIAL POSITION (PARENT COMPANY ONLY)
(In thousands)
December 31, 2017 | December 31, 2016 | ||||||
Assets | |||||||
Current assets: | |||||||
Tax refund receivable | $ | 18,391 | $ | 1,452 | |||
Total current assets | 18,391 | 1,452 | |||||
Investment in subsidiaries | 549,570 | 1,260,427 | |||||
Deferred taxes | 738,281 | 769,365 | |||||
Total assets | $ | 1,306,242 | $ | 2,031,244 | |||
Liabilities and equity | |||||||
Current liabilities: | |||||||
Accounts payable and accrued expenses | $ | 23,557 | $ | 2,548 | |||
Payable to subsidiaries | 70,146 | 70,699 | |||||
Current portion of tax receivable agreement obligations to related parties | 190,220 | 191,014 | |||||
Total current liabilities | 283,923 | 264,261 | |||||
Long-term liabilities: | |||||||
Tax receivable agreement obligations to related parties | 489,780 | 451,318 | |||||
Total long-term liabilities | 489,780 | 451,318 | |||||
Total liabilities | 773,703 | 715,579 | |||||
Equity: | |||||||
Total Worldpay, Inc. equity | 532,539 | 1,315,665 | |||||
Total liabilities and equity | $ | 1,306,242 | $ | 2,031,244 | |||
See Notes to Condensed Consolidated Financial Statements (Parent Company only).
104
SCHEDULE I - Condensed Financial Information of Registrant
Worldpay, Inc.
CONDENSED STATEMENTS OF CASH FLOWS (PARENT COMPANY ONLY)
(In thousands)
Year Ended December 31, | |||||||||||
2017 | 2016 | 2015 | |||||||||
Operating Activities: | |||||||||||
Net income attributable to Worldpay, Inc. | $ | 130,110 | $ | 213,208 | $ | 147,946 | |||||
Adjustments to reconcile net income to net cash provided by (used in) operating activities: | |||||||||||
Equity in net income of subsidiaries | (345,939 | ) | (294,267 | ) | (203,057 | ) | |||||
Deferred taxes | 621,206 | 54,540 | 24,662 | ||||||||
Tax receivable agreements non-cash items | (418,858 | ) | 53 | (769 | ) | ||||||
Distributions from subsidiaries | 32,233 | 84,844 | 68,892 | ||||||||
Excess tax benefit from share-based compensation | — | (12,167 | ) | (16,707 | ) | ||||||
Change in operating assets and liabilities, net | 7,812 | 20,030 | 28,834 | ||||||||
Net cash provided by operating activities | 26,564 | 66,241 | 49,801 | ||||||||
Investing Activities: | |||||||||||
Proceeds from sale of Class A units in Vantiv Holding | 1,278,149 | 87,617 | 216,933 | ||||||||
Purchase of Class A units in Vantiv Holding | (14,486 | ) | (15,389 | ) | (13,630 | ) | |||||
Net cash provided by investing activities | 1,263,663 | 72,228 | 203,303 | ||||||||
Financing Activities: | |||||||||||
Advances from subsidiaries, net | 70,146 | 70,699 | 5,519 | ||||||||
Proceeds from exercise of Class A common stock options | 14,486 | 15,389 | 13,630 | ||||||||
Repurchase of Class A common stock | (1,268,057 | ) | (81,369 | ) | (200,406 | ) | |||||
Repurchase of Class A common stock (to satisfy tax withholding obligations) | (10,092 | ) | (6,248 | ) | (16,527 | ) | |||||
Settlement of certain tax receivable agreements | (63,355 | ) | (117,874 | ) | (49,222 | ) | |||||
Payments under tax receivable agreements | (33,355 | ) | (31,233 | ) | (22,805 | ) | |||||
Excess tax benefit from share-based compensation | — | 12,167 | 16,707 | ||||||||
Net cash used in financing activities | (1,290,227 | ) | (138,469 | ) | (253,104 | ) | |||||
Net decrease in cash and cash equivalents | — | — | — | ||||||||
Cash and cash equivalents—Beginning of period | — | — | — | ||||||||
Cash and cash equivalents—End of period | $ | — | $ | — | $ | — | |||||
Cash Payments: | |||||||||||
Taxes | $ | 5,636 | $ | 6,843 | $ | 2,323 | |||||
Non-cash Items: | |||||||||||
Issuance of tax receivable agreements | $ | 647,507 | $ | 171,162 | $ | 376,597 | |||||
See Notes to Condensed Consolidated Financial Statements (Parent Company only).
105
SCHEDULE I - Condensed Financial Information of Registrant
Worldpay, Inc.
NOTES TO CONDENSED FINANCIAL STATEMENTS (PARENT COMPANY ONLY)
1. BASIS OF PRESENTATION
For Worldpay, Inc.’s presentation (Parent Company only), the investment in subsidiaries is accounted for using the equity method. The condensed parent company financial statements and notes should be read in conjunction with the consolidated financial statements and notes of Worldpay, Inc. appearing in this Annual Report on Form 10-K.
Worldpay, Inc. is a holding company that does not conduct any business operations of its own and therefore its assets consist primarily of investments in subsidiaries. Worldpay Inc.’s cash inflows are primarily from cash dividends and distributions and other transfers from Vantiv Holding. Worldpay, Inc. may not be able to access cash generated by its subsidiaries in order to fulfill cash commitments or to pay cash dividends on its common stock. The amounts available to Worldpay, Inc. to fulfill cash commitments or to pay cash dividends are also subject to the covenants and distribution restrictions in its subsidiaries’ loan agreements. For a discussion on the tax receivable agreements, see Note 7- Tax Receivable Agreements in the consolidated financial statements and notes of Worldpay, Inc. appearing in this Annual Report on Form 10-K.
106
EXHIBIT INDEX
Exhibit | Incorporated by Reference | |||||||||
Number | Exhibit Description | Form | File No. | Exhibit | Filing Date | |||||
2.1 | 10-K | 001-35462 | 2.1 | February 8, 2017 | ||||||
2.2 | 8-K | 001-35462 | 2.1 | August 9, 2017 | ||||||
2.3 | 8-K | 001-35462 | 2.1 | August 11, 2017 | ||||||
3.1 | S-3ASR | 333-211645 | 4.1 | May 26, 2016 | ||||||
3.1.1 | 8-K | 001-35462 | 3.1 | January 16, 2018 | ||||||
3.2 | 8-K | 001-35462 | 3.2 | January 16, 2018 | ||||||
4.1 | 8-K | 001-35462 | 4.1 | December 21, 2017 | ||||||
4.2 | 8-K | 001-35462 | 4.1 | January 16, 2018 | ||||||
10.1 | 10-Q | 001-35462 | 10.1 | May 8, 2012 | ||||||
10.2 | 10-Q | 001-35462 | 10.2 | May 8, 2012 | ||||||
10.3 | 10-Q | 001-35462 | 10.3 | May 8, 2012 | ||||||
10.4 | 10-Q | 001-35462 | 10.4 | May 8, 2012 | ||||||
10.5 | 10-Q | 001-35462 | 10.6 | May 8, 2012 | ||||||
10.6 | 10-Q | 001-35462 | 10.9 | May 8, 2012 | ||||||
10.7 | 8-K | 001-35462 | 10.1 | October 18, 2016 | ||||||
10.8 | 8-K | 001-35462 | 10.2 | October 18, 2016 | ||||||
10.9 | 8-K | 001-35462 | 10.1 | August 9, 2017 | ||||||
10.10 | 8-K | 001-35462 | 10.1 | August 9, 2017 | ||||||
10.11 | 8-K | 001-35462 | 10.2 | August 9, 2017 | ||||||
10.12 | 8-K | 001-35462 | 10.3 | August 9, 2017 | ||||||
10.13 | 8-K | 001-35462 | 10.1 | September 11, 2017 | ||||||
107
Exhibit | Incorporated by Reference | |||||||||
Number | Exhibit Description | Form | File No. | Exhibit | Filing Date | |||||
10.14 | 8-K | 001-35462 | 10.1 | October 4, 2017 | ||||||
10.15+ | S-1/A | 333-177875 | 10.24 | March 5, 2012 | ||||||
10.16.1+ | 10-Q | 001-35462 | 10.1 | May 6, 2013 | ||||||
10.16.2+ | 10-Q | 001-35462 | 10.2 | May 6, 2013 | ||||||
10.16.3+ | 10-Q | 001-35462 | 10.3 | April 30, 2015 | ||||||
10.16.4+ | 10-Q | 001-35462 | 10.4 | April 30, 2015 | ||||||
10.16.5+ | 10-Q | 001-35462 | 10.3 | May 6, 2013 | ||||||
10.16.6+ | 10-K | 001-35462 | 10.12.7 | February 10, 2016 | ||||||
10.16.7+ | ||||||||||
10.16.8+ | ||||||||||
10.16.9+ | ||||||||||
10.16.10+ | ||||||||||
10.16.11+ | ||||||||||
10.16.12+ | ||||||||||
10.16.13+ | ||||||||||
10.16.14+ | ||||||||||
10.16.15+ | ||||||||||
10.16.16+ | ||||||||||
10.16.17+ | ||||||||||
10.16.18+ | ||||||||||
10.16.19+ | ||||||||||
10.16.20+ | ||||||||||
10.16.21+ | ||||||||||
10.16.22+ | ||||||||||
10.17+ | S-1/A | 333-177875 | 10.26 | March 16, 2012 | ||||||
108
Exhibit | Incorporated by Reference | |||||||||
Number | Exhibit Description | Form | File No. | Exhibit | Filing Date | |||||
10.18+ | S-1/A | 333-177875 | 10.27 | March 8, 2012 | ||||||
10.19+ | S-1/A | 333-177875 | 10.35 | March 8, 2012 | ||||||
10.20+ | 10-K | 001-35462 | 10.17 | February 10, 2016 | ||||||
10.21.1+ | 10-K | 001-35462 | 10.17.1 | February 10, 2016 | ||||||
10.21.2+ | 10-Q | 001-35462 | 10.1 | April 27, 2016 | ||||||
10.22+ | ||||||||||
10.23+ | ||||||||||
10.24+ | ||||||||||
10.25† | ||||||||||
10.26+ | S-1/A | 333-177875 | 10.28 | March 5, 2012 | ||||||
10.27+ | S-1/A | 333-177875 | 10.29 | March 5, 2012 | ||||||
10.28+ | S-1/A | 333-177875 | 10.37 | March 16, 2012 | ||||||
10.29† | 10-Q | 001-35462 | 10.1 | July 28, 2016 | ||||||
10.30† | 10-Q | 001-35462 | 10.2 | July 28, 2016 | ||||||
10.31 | 8-K | 001-35462 | 10.3 | June 19, 2014 | ||||||
10.32+ | S-8 | 333-196911 | 4.3 | June 19, 2014 | ||||||
10.33 | 10-Q | 001-35462 | 10.1 | July 29, 2015 | ||||||
10.34 | 10-Q | 001-35462 | 10.1 | October 28, 2015 | ||||||
10.34.1 | 10-Q | 001-35462 | 10.3 | July 28, 2016 | ||||||
10.35 | 8-K | 001-35462 | 10.1 | December 3, 2015 | ||||||
10.36 | 8-K | 001-35462 | 10.1 | November 23, 2016 | ||||||
10.37 | 8-K | 001-35462 | 10.1 | August 8, 2017 | ||||||
10.38+ | 10-K | 001-35462 | 10.32 | February 10, 2016 | ||||||
10.39+ | 10-K | 001-35462 | 10.33 | February 10, 2016 | ||||||
10.40+ | ||||||||||
11.1 | ||||||||||
21.1 | ||||||||||
109
Exhibit | Incorporated by Reference | |||||||||
Number | Exhibit Description | Form | File No. | Exhibit | Filing Date | |||||
23.1 | ||||||||||
24.1 | ||||||||||
31.1.1 | ||||||||||
31.1.2 | ||||||||||
31.2 | ||||||||||
32 | ||||||||||
101 | Interactive Data Files. | |||||||||
† | Confidential treatment granted as to certain portions by the SEC. |
+ | Indicates a management contract or compensatory plan. |
110
SIGNATURES
Pursuant to the requirements of Section 13 or 15(d) of the Securities Exchange Act of 1934, the registrant has duly caused this report to be signed on its behalf by the undersigned, thereunto duly authorized.
WORLDPAY, INC. | |||
Dated: | February 28, 2018 | By: | /s/ CHARLES D. DRUCKER |
Name: Charles D. Drucker | |||
Title: Executive Chairman and Co-Chief Executive Officer | |||
Dated: | February 28, 2018 | By: | /s/ PHILIP JANSEN |
Name: Philip Jansen | |||
Title: Co-Chief Executive Officer | |||
Dated: | February 28, 2018 | By: | /s/ STEPHANIE L. FERRIS |
Name: Stephanie L. Ferris | |||
Title: Chief Financial Officer | |||
Dated: | February 28, 2018 | By: | /s/ CHRISTOPHER THOMPSON |
Name: Christopher Thompson | |||
Title: SVP, Controller and Chief Accounting Officer | |||
111
Exhibit 24.1
POWER OF ATTORNEY
Each person whose signature appears below hereby constitutes and appoints Charles D. Drucker, Mark L. Heimbouch and Nelson F. Greene, and each of them, as his or her true and lawful attorneys-in-fact and agents, with full power of substitution and resubstitution and full power to act without the other, for him or her and in his or her name, place and stead, in any and all capacities, to sign any and all amendments to this Annual Report on Form 10-K, and to file the same, with all exhibits thereto, and other documents in connection therewith, with the Securities and Exchange Commission, granting unto said attorneys-in-fact and agents, and each of them, full power and authority to do and perform each and every act and thing requisite and necessary to be done in connection therewith, as fully to all intents and purposes as he or she might or could do in person, hereby ratifying and confirming that all said attorneys-in-fact and agents, or any of them or their or his or her substitute or substitutes, may lawfully do or cause to be done by virtue hereof.
Pursuant to the requirements of the Securities Exchange Act of 1934, this report has been signed below by the following persons on behalf of the registrant and in the capacities and on the dates indicated:
112
Signature | Title | Date | ||
/s/ CHARLES D. DRUCKER | Executive Chairman, Co-Chief Executive Officer and Director | February 28, 2018 | ||
Charles D. Drucker | (Co-Principal Executive Officer) | |||
/s/ PHILIP JANSEN | Co-Chief Executive Officer and Director | February 28, 2018 | ||
Philip Jansen | (Co-Principal Executive Officer) | |||
/s/ SIR MICHAEL RAKE | Lead Director | February 28, 2018 | ||
Sir Michael Rake | ||||
/s/ MARK L. HEIMBOUCH | Chief Operating Officer and Director | February 28, 2018 | ||
Mark L. Heimbouch | ||||
/s/ ROHINTON KALIFA | Executive Director | February 28, 2018 | ||
Rohinton Kalifa | ||||
/s/ LEE ADREAN | Director | February 28, 2018 | ||
Lee Adrean | ||||
/s/ KEVIN COSTELLO | Director | February 28, 2018 | ||
Kevin Costello | ||||
/s/ LISA HOOK | Director | February 28, 2018 | ||
Lisa Hook | ||||
/s/ GARY L. LAUER | Director | February 28, 2018 | ||
Gary L. Lauer | ||||
/s/ KAREN RICHARDSON | Director | February 28, 2018 | ||
Karen Richardson | ||||
/s/ BOON SIM | Director | February 28, 2018 | ||
Boon Sim | ||||
/s/ JEFFREY STIEFLER | Director | February 28, 2018 | ||
Jeffrey Stiefler | ||||
113