Attached files
| file | filename |
|---|---|
| 8-K - 8-K - Univar Solutions Inc. | form8-kearningsreleaseq420.htm |
| EX-99.1 - EXHIBIT 99.1 - Univar Solutions Inc. | ex991-enr_q42017.htm |

Fourth Quarter
2017 Earnings Call
February 28, 2018
Forward-Looking Statements
This presentation includes certain statements relating to future events and our intentions, beliefs, expectations,
and predictions for the future which are “forward-looking statements” within the meaning of Section 27A of the
Securities Act of 1933 and Section 21E of the Securities Exchange Act of 1934, as amended. Forward-looking
statements are subject to known and unknown risks and uncertainties, many of which may be beyond our
control. We caution you that the forward-looking information presented in this presentation is not a guarantee of
future events or results, and that actual events or results may differ materially from those made in or suggested
by the forward-looking information contained in this presentation. In addition, forward-looking statements
generally can be identified by the use of forward-looking terminology such as "outlook," "guidance," “may,”
“plan,” “seek,” “comfortable with,” “will,” “expect,” “intend,” “estimate,” “anticipate,” “believe” or “continue” or the
negatives or variations of these terms. Forward-looking information contained in this presentation is made only
as of the date of this presentation, and we do not undertake any obligation to update or revise any forward-
looking information to reflect changes in assumptions, the occurrence of unanticipated events, or otherwise.
Regulation G: Non-GAAP Measures
The information presented herein regarding certain unaudited non-GAAP measures does not conform to
generally accepted accounting principles in the United States (U.S. GAAP) and should not be construed as an
alternative to the reported results determined in accordance with U.S. GAAP. Univar has included this non-
GAAP information to assist in understanding the operating performance of the company and its operating
segments. The non-GAAP information provided may not be consistent with the methodologies used by other
companies. All non-GAAP information related to previous Univar filings with the SEC has been reconciled with
reported U.S. GAAP results.
2
Fourth Quarter 2017 Highlights
Strong 2017 Finish
(1) Variances to Q4 2016.
(2) Adjusted Net Income / Diluted Weighted Average Shares Outstanding. Adjusted net income excludes the same items as Adjusted
EBITDA, except for stock-based compensation expense.
(3) Adjusted EBITDA plus cash flows from changes in accounts receivable, inventory, and accounts payable, less capital expenditures.
(4) Adjusted Operating Cash Flow / Adjusted EBITDA.
(5) Adjusted Operating Cash Flow / Sales.
3
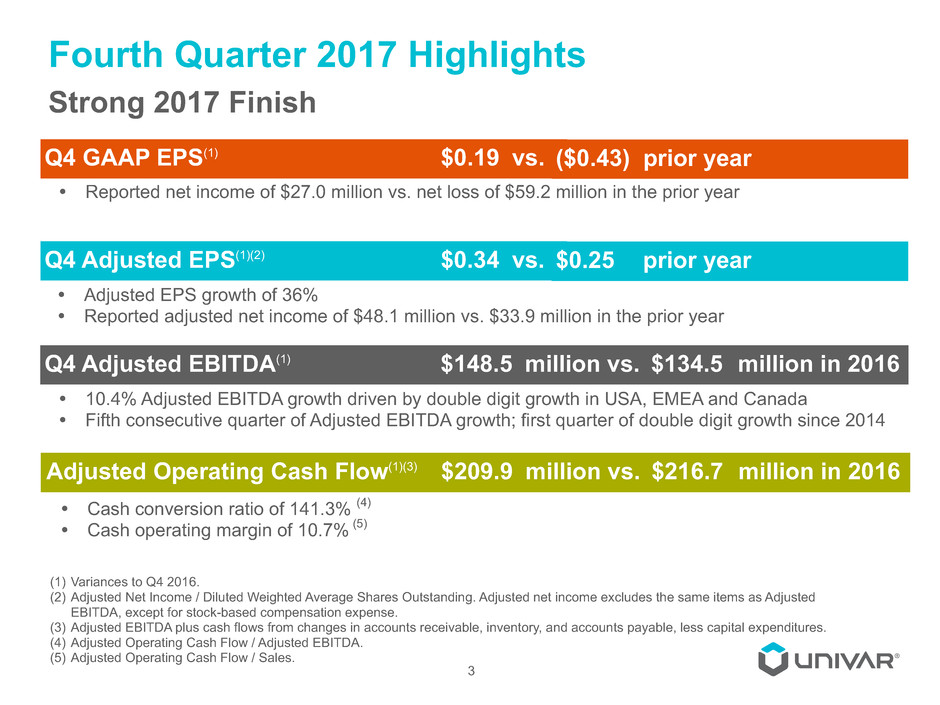
Q4 GAAP EPS(1)
Q4 Adjusted EBITDA(1)
Ÿ Reported net income of $27.0 million vs. net loss of $59.2 million in the prior year
$0.19
Ÿ 10.4% Adjusted EBITDA growth driven by double digit growth in USA, EMEA and Canada
Ÿ Fifth consecutive quarter of Adjusted EBITDA growth; first quarter of double digit growth since 2014
vs.
Adjusted Operating Cash Flow(1)(3)
Ÿ Cash conversion ratio of 141.3% (4)
Ÿ Cash operating margin of 10.7% (5)
($0.43) prior year
$148.5 million vs. $134.5 million in 2016
$209.9 million vs. $216.7 million in 2016
Q4 Adjusted EPS(1)(2) $0.34 vs. $0.25 prior year
Ÿ Adjusted EPS growth of 36%
Ÿ Reported adjusted net income of $48.1 million vs. $33.9 million in the prior year
Univar – Consolidated Highlights
Profitability growth
from solid execution of
strategic initiatives
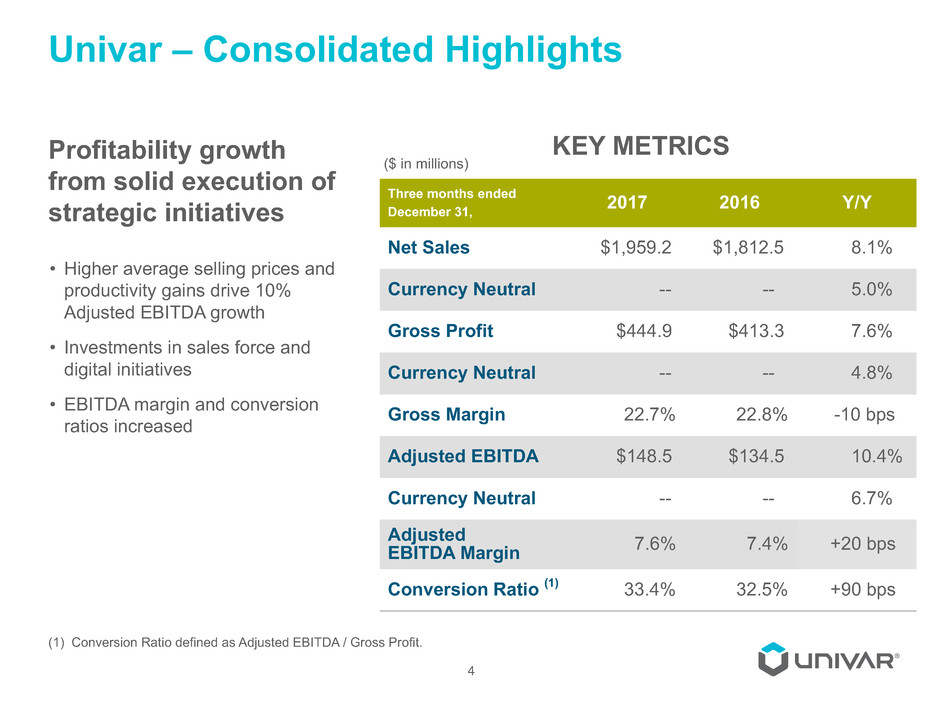
• Higher average selling prices and
productivity gains drive 10%
Adjusted EBITDA growth
• Investments in sales force and
digital initiatives
• EBITDA margin and conversion
ratios increased
KEY METRICS
($ in millions)
(1) Conversion Ratio defined as Adjusted EBITDA / Gross Profit.
Three months ended
December 31, 2017 2016 Y/Y
Net Sales $1,959.2 $1,812.5 8.1%
Currency Neutral -- -- 5.0%
Gross Profit $444.9 $413.3 7.6%
Currency Neutral -- -- 4.8%
Gross Margin 22.7% 22.8% -10 bps
Adjusted EBITDA $148.5 $134.5 10.4%
Currency Neutral -- -- 6.7%
Adjusted
EBITDA Margin 7.6% 7.4% +20 bps
Conversion Ratio (1) 33.4% 32.5% +90 bps
4

USA – Highlights
Sales force execution and
mix improvement drive
profitability growth
• 11% Adjusted EBITDA growth driven
by sales force execution, mix
improvement and strong operating
expense management
• Gross margin, Adjusted EBITDA
margin and conversion ratio all
increased
• First quarter of sales growth in 3 years
5
Three months ended
December 31, 2017 2016 Y/Y
Net Sales $1,130.1 $1,084.3 4.2%
Gross Profit $260.2 $246.1 5.7%
Gross Margin 23.0% 22.7% +30 bps
Adjusted EBITDA $86.7 $78.3 10.7%
Adjusted
EBITDA Margin 7.7% 7.2% +50 bps
KEY METRICS
($ in millions)

CANADA – Highlights
Market gains and strong
cost management boosts
profit
• 13% Adjusted EBITDA growth driven by
strong operating expense management
and FX
• Win-loss ratio improving
• Adjusted EBITDA margin and
conversion ratio expanded
6
Three months ended
December 31, 2017 2016 Y/Y
Net Sales $271.9 $242.1 12.3%
Currency Neutral -- -- 5.8%
Gross Profit $58.1 $55.1 5.4%
Currency Neutral -- -- 0.4%
Gross Margin 21.4% 22.8% -140 bps
Adjusted EBITDA $28.1 $24.8 13.3%
Currency Neutral -- -- 7.7%
Adjusted
EBITDA Margin 10.3% 10.2% +10 bps
KEY METRICS
($ in millions)
EMEA – Highlights
Strong execution and
favorable FX
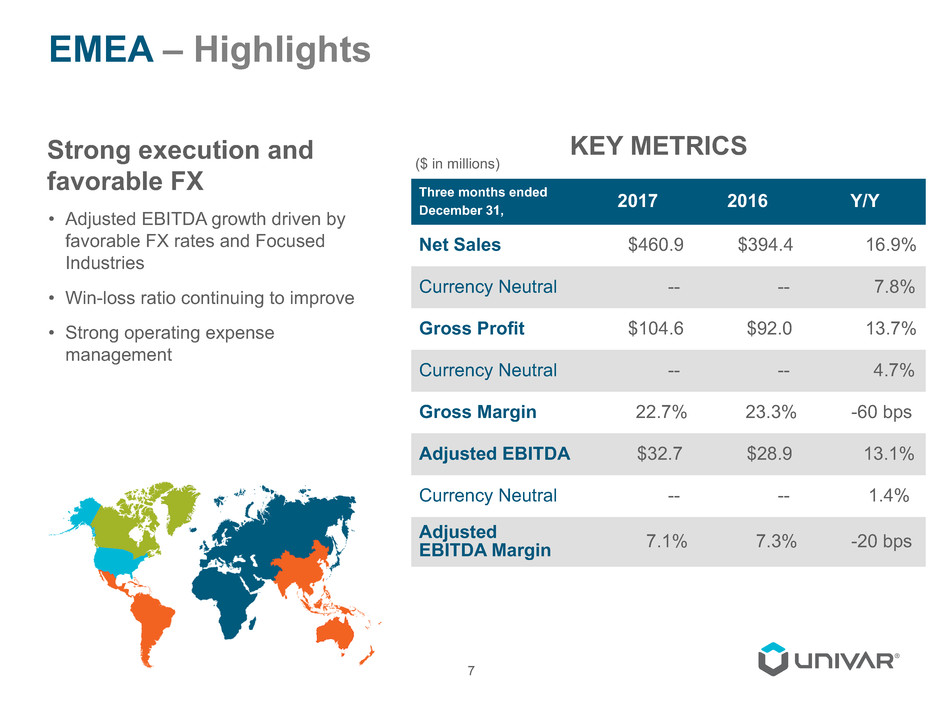
• Adjusted EBITDA growth driven by
favorable FX rates and Focused
Industries
• Win-loss ratio continuing to improve
• Strong operating expense
management
7
Three months ended
December 31, 2017 2016 Y/Y
Net Sales $460.9 $394.4 16.9%
Currency Neutral -- -- 7.8%
Gross Profit $104.6 $92.0 13.7%
Currency Neutral -- -- 4.7%
Gross Margin 22.7% 23.3% -60 bps
Adjusted EBITDA $32.7 $28.9 13.1%
Currency Neutral -- -- 1.4%
Adjusted
EBITDA Margin 7.1% 7.3% -20 bps
KEY METRICS
($ in millions)
REST OF WORLD – Highlights
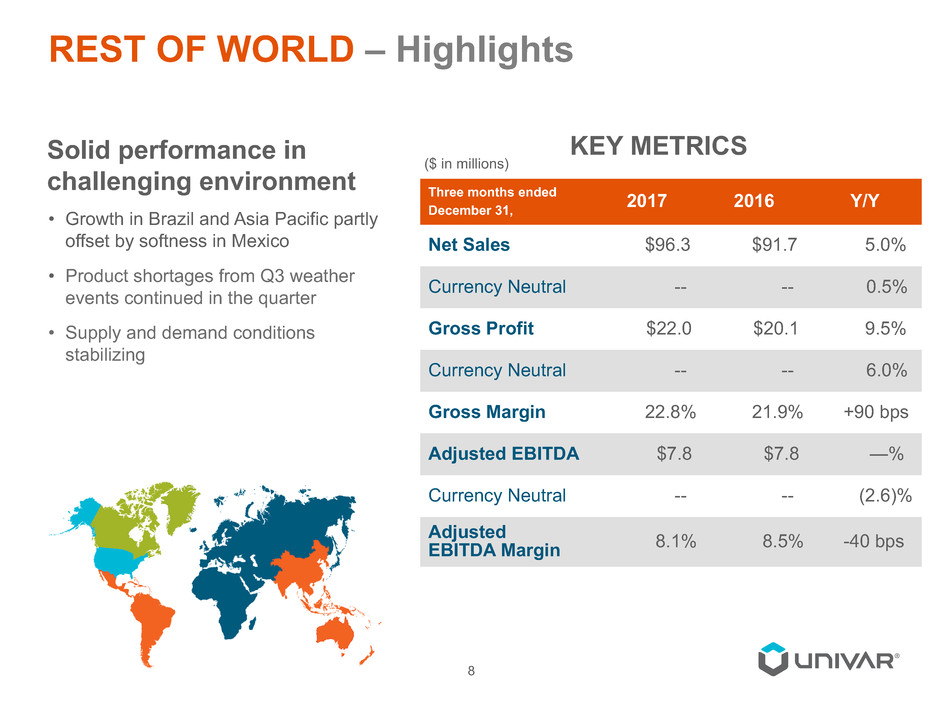
Solid performance in
challenging environment
• Growth in Brazil and Asia Pacific partly
offset by softness in Mexico
• Product shortages from Q3 weather
events continued in the quarter
• Supply and demand conditions
stabilizing
8
Three months ended
December 31, 2017 2016 Y/Y
Net Sales $96.3 $91.7 5.0%
Currency Neutral -- -- 0.5%
Gross Profit $22.0 $20.1 9.5%
Currency Neutral -- -- 6.0%
Gross Margin 22.8% 21.9% +90 bps
Adjusted EBITDA $7.8 $7.8 —%
Currency Neutral -- -- (2.6)%
Adjusted
EBITDA Margin 8.1% 8.5% -40 bps
KEY METRICS
($ in millions)
Cash Flow Highlights
9
(1) Adjusted Operating Cash Flow equals Adjusted EBITDA plus cash flows from changes in accounts
receivable, inventory, and accounts payable, less capital expenditures.
(2) Excludes additions from capital leases.
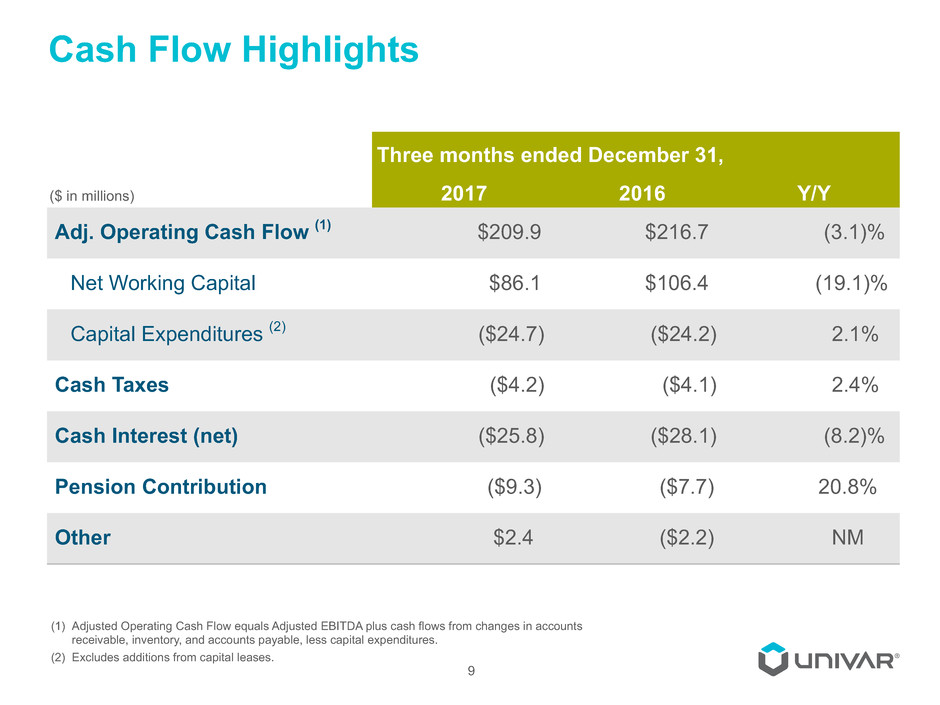
Three months ended December 31,
2017 2016 Y/Y
Adj. Operating Cash Flow (1) $209.9 $216.7 (3.1)%
Net Working Capital $86.1 $106.4 (19.1)%
Capital Expenditures (2) ($24.7) ($24.2) 2.1%
Cash Taxes ($4.2) ($4.1) 2.4%
Cash Interest (net) ($25.8) ($28.1) (8.2)%
Pension Contribution ($9.3) ($7.7) 20.8%
Other $2.4 ($2.2) NM
($ in millions)
Balance Sheet Highlights
10
(1) Net Debt defined as Total Debt (Long term debt, inclusive of debt discount and unamortized debt issuance costs, plus short term financing) less cash and
cash equivalents.
(2) Net Debt divided by last 12 months (LTM) of Adjusted EBITDA.
(3) Interest coverage defined as LTM Adjusted EBITDA / LTM Cash Interest (net of interest income).
(4) LTM Earnings before Interest, Taxes and Amortization (EBITA) divided by trailing 13 month average of net PP&E plus net working capital (accounts
receivable plus inventory less accounts payable).
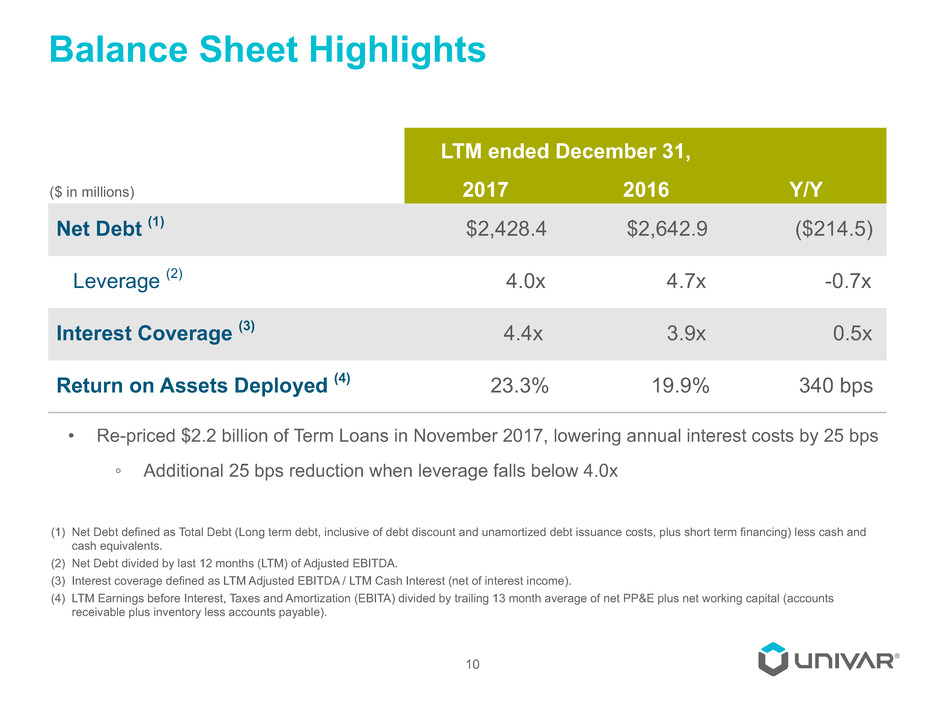
LTM ended December 31,
2017 2016 Y/Y
Net Debt (1) $2,428.4 $2,642.9 ($214.5)
Leverage (2) 4.0x 4.7x -0.7x
Interest Coverage (3) 4.4x 3.9x 0.5x
Return on Assets Deployed (4) 23.3% 19.9% 340 bps
• Re-priced $2.2 billion of Term Loans in November 2017, lowering annual interest costs by 25 bps
◦ Additional 25 bps reduction when leverage falls below 4.0x
($ in millions)
11
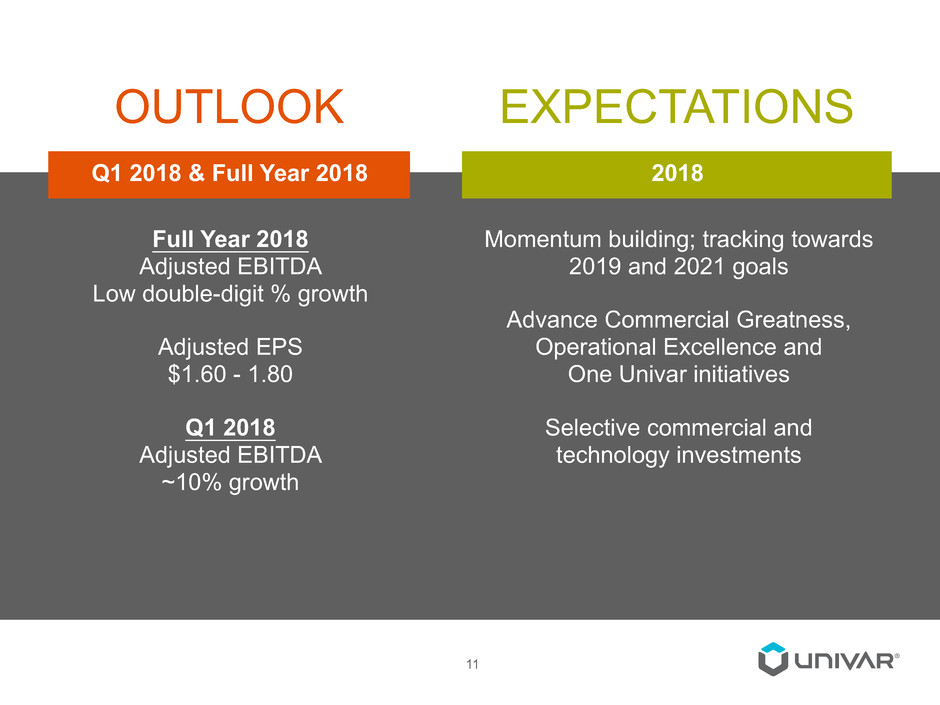
Full Year 2018
Adjusted EBITDA
Low double-digit % growth
Adjusted EPS
$1.60 - 1.80
Q1 2018
Adjusted EBITDA
~10% growth
Momentum building; tracking towards
2019 and 2021 goals
Advance Commercial Greatness,
Operational Excellence and
One Univar initiatives
Selective commercial and
technology investments
Q1 2018 & Full Year 2018
OUTLOOK
2018
EXPECTATIONS
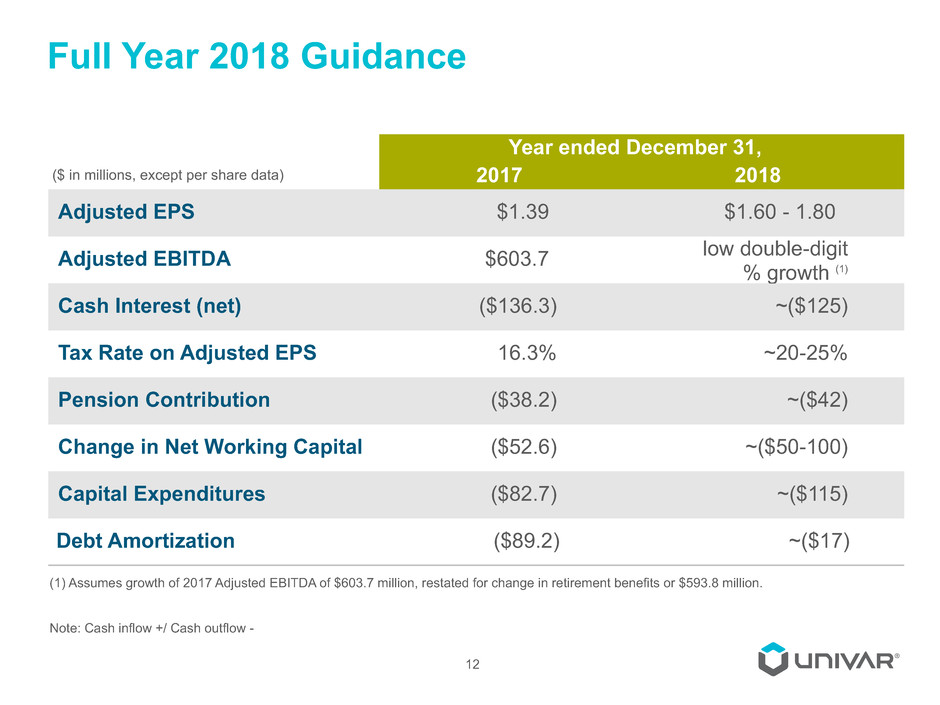
Full Year 2018 Guidance
12
Year ended December 31,
2017 2018
Adjusted EPS $1.39 $1.60 - 1.80
Adjusted EBITDA $603.7 low double-digit% growth (1)
Cash Interest (net) ($136.3) ~($125)
Tax Rate on Adjusted EPS 16.3% ~20-25%
Pension Contribution ($38.2) ~($42)
Change in Net Working Capital ($52.6) ~($50-100)
Capital Expenditures ($82.7) ~($115)
Debt Amortization ($89.2) ~($17)
(1) Assumes growth of 2017 Adjusted EBITDA of $603.7 million, restated for change in retirement benefits or $593.8 million.
Note: Cash inflow +/ Cash outflow -
($ in millions, except per share data)
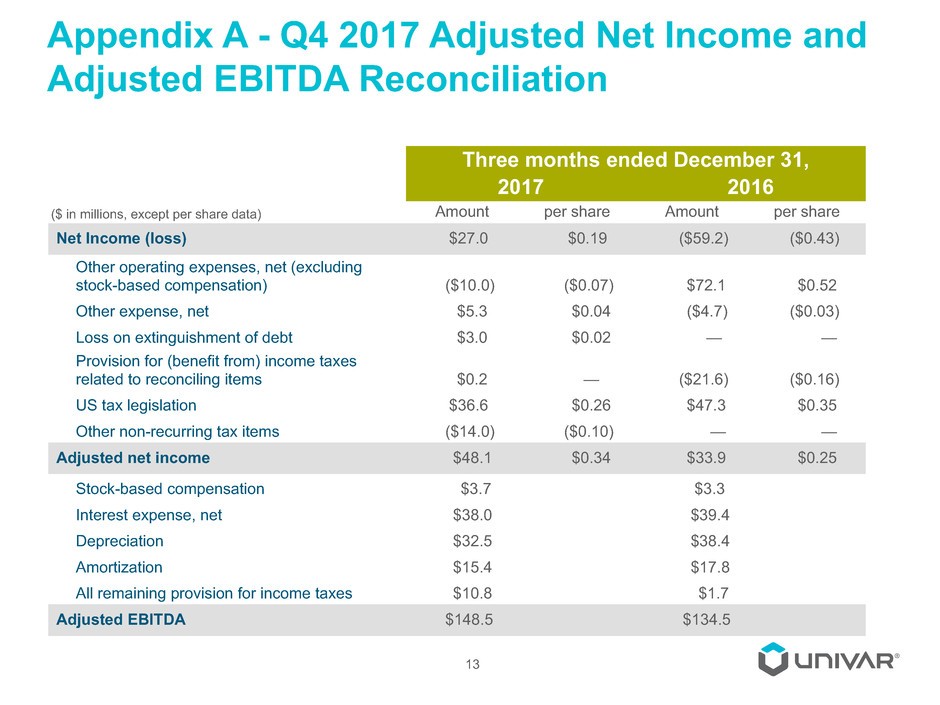
Appendix A - Q4 2017 Adjusted Net Income and
Adjusted EBITDA Reconciliation
13
Three months ended December 31,
2017 2016
Amount per share Amount per share
Net Income (loss) $27.0 $0.19 ($59.2) ($0.43)
Other operating expenses, net (excluding
stock-based compensation) ($10.0) ($0.07) $72.1 $0.52
Other expense, net $5.3 $0.04 ($4.7) ($0.03)
Loss on extinguishment of debt $3.0 $0.02 — —
Provision for (benefit from) income taxes
related to reconciling items $0.2 — ($21.6) ($0.16)
US tax legislation $36.6 $0.26 $47.3 $0.35
Other non-recurring tax items ($14.0) ($0.10) — —
Adjusted net income $48.1 $0.34 $33.9 $0.25
Stock-based compensation $3.7 $3.3
Interest expense, net $38.0 $39.4
Depreciation $32.5 $38.4
Amortization $15.4 $17.8
All remaining provision for income taxes $10.8 $1.7
Adjusted EBITDA $148.5 $134.5
($ in millions, except per share data)
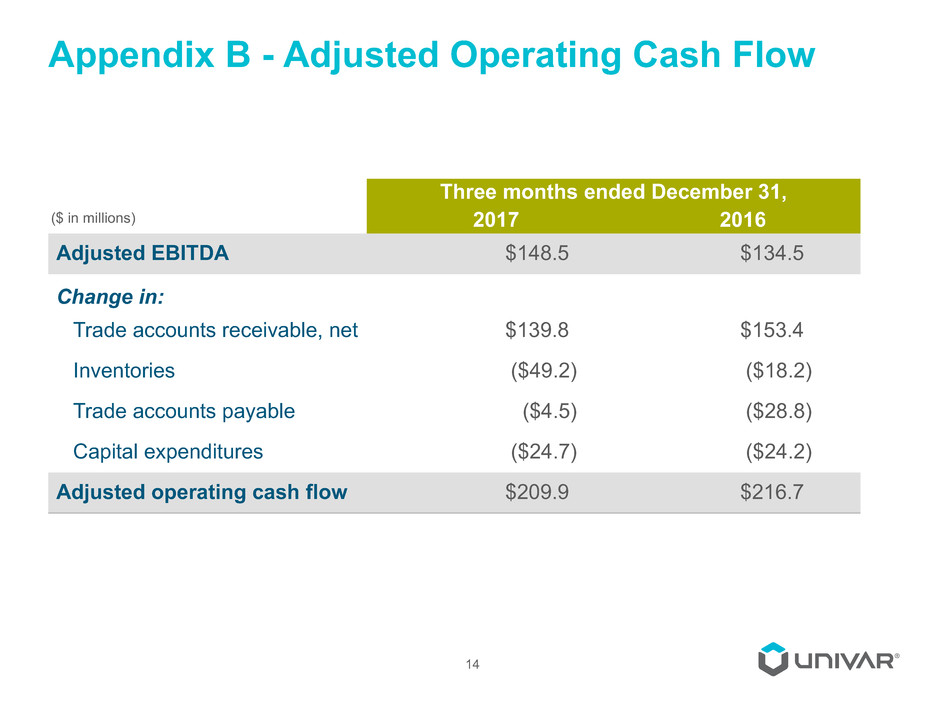
Appendix B - Adjusted Operating Cash Flow
14
Three months ended December 31,
2017 2016
Adjusted EBITDA $148.5 $134.5
Change in:
Trade accounts receivable, net $139.8 $153.4
Inventories ($49.2) ($18.2)
Trade accounts payable ($4.5) ($28.8)
Capital expenditures ($24.7) ($24.2)
Adjusted operating cash flow $209.9 $216.7
($ in millions)

15
