Attached files
| file | filename |
|---|---|
| EX-32.2 - EX-32.2 - UNIVERSAL HEALTH SERVICES INC | uhs-ex322_10.htm |
| EX-32.1 - EX-32.1 - UNIVERSAL HEALTH SERVICES INC | uhs-ex321_7.htm |
| EX-31.2 - EX-31.2 - UNIVERSAL HEALTH SERVICES INC | uhs-ex312_8.htm |
| EX-31.1 - EX-31.1 - UNIVERSAL HEALTH SERVICES INC | uhs-ex311_6.htm |
| EX-23.1 - EX-23.1 - UNIVERSAL HEALTH SERVICES INC | uhs-ex231_469.htm |
| EX-21 - EX-21 - UNIVERSAL HEALTH SERVICES INC | uhs-ex21_11.htm |
| EX-10.3 - EX-10.3 - UNIVERSAL HEALTH SERVICES INC | uhs-ex103_12.htm |
UNITED STATES
SECURITIES AND EXCHANGE COMMISSION
Washington, D.C. 20549
FORM 10-K
(MARK ONE)
|
☒ |
ANNUAL REPORT PURSUANT TO SECTION 13 OR 15(d) OF THE SECURITIES EXCHANGE ACT OF 1934 |
For the fiscal year ended December 31, 2017
OR
|
☐ |
TRANSITION REPORT PURSUANT TO SECTION 13 OR 15(d) OF THE SECURITIES EXCHANGE ACT OF 1934 |
For the transition period from to
Commission File No. 1-10765
UNIVERSAL HEALTH SERVICES, INC.
(Exact name of registrant as specified in its charter)
|
Delaware |
|
23-2077891 |
|
(State or other jurisdiction of incorporation or organization) |
|
(I.R.S. Employer Identification Number) |
|
|
|
|
|
UNIVERSAL CORPORATE CENTER |
|
|
|
367 South Gulph Road P.O. Box 61558 King of Prussia, Pennsylvania |
|
19406-0958 |
|
(Address of principal executive offices) |
|
(Zip Code) |
Registrant’s telephone number, including area code: (610) 768-3300
Securities registered pursuant to Section 12(b) of the Act:
|
Title of each Class |
|
Name of each exchange on which registered |
|
Class B Common Stock, $.01 par value |
|
New York Stock Exchange |
Securities registered pursuant to Section 12(g) of the Act:
Class D Common Stock, $.01 par value
(Title of each Class)
Indicate by check mark if the registrant is a well-known seasoned issuer, as defined in Rule 405 of the Securities Act. Yes ☒ No ☐
Indicate by check mark if the registrant is not required to file reports pursuant to Section 13 or Section 15(d) of the Exchange Act. Yes ☐ No ☒
Indicate by check mark whether the registrant (1) has filed all reports required to be filed by Section 13 or 15(d) of the Securities Exchange Act of 1934 during the preceding 12 months (or for such shorter period that the registrant was required to file such reports), and (2) has been subject to such filing requirements for the past 90 days. Yes ☒ No ☐
Indicate by check mark whether the registrant has submitted electronically and posted on its corporate Web site, if any, every Interactive Data File required to be submitted and posted pursuant to Rule 405 of Regulation S-T during the preceding 12 months (or for such shorter period that the registrant was required to submit and post such files). Yes ☒ No ☐
Indicate by check mark if disclosure of delinquent filers pursuant to Item 405 of Regulation S-K is not contained herein, and will not be contained, to the best of registrant’s knowledge, in definitive proxy or information statements incorporated by reference in Part III of this Form 10-K or any amendment to this Form 10-K. ☒
Indicate by check mark whether the registrant is a large accelerated filer, an accelerated filer, a non-accelerated filer, a smaller reporting company or an emerging growth company. See the definitions of “large accelerated filer,” “accelerated filer”, “smaller reporting company” and “emerging growth company” in Rule 12b-2 of the Exchange Act (check one):
|
|
|
|
|
|
|
|
|
Large accelerated filer |
|
☒ |
|
Accelerated filer |
|
☐ |
|
|
|
|
|
|||
|
Non-accelerated filer |
|
☐ |
|
Smaller reporting company |
|
☐ |
|
|
|
|
|
Emerging growth company |
|
☐ |
If an emerging growth company, indicate by check mark if the registrant has elected not to use the extended transition period for complying with any new or revised financial accounting standards provided pursuant to Section 13(a) of the Exchange Act. ☐
Indicate by check mark whether the registrant is a shell company (as defined in Rule 12b-2 of the Exchange Act). Yes ☐ No ☒
The aggregate market value of voting stock held by non-affiliates at June 30, 2017 was $10.6 billion. (For the purpose of this calculation, it was assumed that Class A, Class C, and Class D Common Stock, which are not traded but are convertible share-for-share into Class B Common Stock, have the same market value as Class B Common Stock. Also, for purposes of this calculation only, all directors are deemed to be affiliates.)
The number of shares of the registrant’s Class A Common Stock, $.01 par value, Class B Common Stock, $.01 par value, Class C Common Stock, $.01 par value, and Class D Common Stock, $.01 par value, outstanding as of January 31, 2018, were 6,595,308; 86,990,759; 663,940 and 20,616, respectively.
DOCUMENTS INCORPORATED BY REFERENCE:
Portions of the registrant’s definitive proxy statement for our 2018 Annual Meeting of Stockholders, which will be filed with the Securities and Exchange Commission within 120 days after December 31, 2017 (incorporated by reference under Part III).
UNIVERSAL HEALTH SERVICES, INC.
2017 FORM 10-K ANNUAL REPORT
TABLE OF CONTENTS
|
PART I |
|
||
|
Item 1 |
|
1 |
|
|
Item 1A |
|
12 |
|
|
Item 1B |
|
24 |
|
|
Item 2 |
|
24 |
|
|
Item 3 |
|
33 |
|
|
Item 4 |
|
36 |
|
|
|
|
||
|
PART II |
|
||
|
Item 5 |
|
37 |
|
|
Item 6 |
|
40 |
|
|
Item 7 |
|
Management’s Discussion and Analysis of Financial Condition and Results of Operations |
41 |
|
Item 7A |
|
76 |
|
|
Item 8 |
|
77 |
|
|
Item 9 |
|
Changes in and Disagreements with Accountants on Accounting and Financial Disclosure |
77 |
|
Item 9A |
|
77 |
|
|
Item 9B |
|
78 |
|
|
|
|
||
|
PART III |
|
||
|
Item 10 |
|
79 |
|
|
Item 11 |
|
79 |
|
|
Item 12 |
|
Security Ownership of Certain Beneficial Owners and Management and Related Stockholder Matters |
79 |
|
Item 13 |
|
Certain Relationships and Related Transactions, and Director Independence |
79 |
|
Item 14 |
|
79 |
|
|
|
|
||
|
PART IV |
|
||
|
Item 15 |
|
80 |
|
|
Item 16 |
|
84 |
|
|
|
|
|
|
|
85 |
|||
This Annual Report on Form 10-K is for the year ended December 31, 2017. This Annual Report modifies and supersedes documents filed prior to this Annual Report. Information that we file with the Securities and Exchange Commission (the “SEC”) in the future will automatically update and supersede information contained in this Annual Report.
In this Annual Report, “we,” “us,” “our” “UHS” and the “Company” refer to Universal Health Services, Inc. and its subsidiaries. UHS is a registered trademark of UHS of Delaware, Inc., the management company for, and a wholly-owned subsidiary of Universal Health Services, Inc. Universal Health Services, Inc. is a holding company and operates through its subsidiaries including its management company, UHS of Delaware, Inc. All healthcare and management operations are conducted by subsidiaries of Universal Health Services, Inc. To the extent any reference to “UHS” or “UHS facilities” in this report including letters, narratives or other forms contained herein relates to our healthcare or management operations it is referring to Universal Health Services, Inc.’s subsidiaries including UHS of Delaware, Inc. Further, the terms “we,” “us,” “our” or the “Company” in such context similarly refer to the operations of Universal Health Services Inc.’s subsidiaries including UHS of Delaware, Inc. Any reference to employees or employment contained herein refers to employment with or employees of the subsidiaries of Universal Health Services, Inc. including UHS of Delaware, Inc.
Our principal business is owning and operating, through our subsidiaries, acute care hospitals and outpatient facilities and behavioral health care facilities.
As of February 28, 2018, we owned and/or operated 326 inpatient facilities and 32 outpatient and other facilities including the following located in 37 states, Washington, D.C., the United Kingdom, Puerto Rico and the U.S. Virgin Islands:
Acute care facilities located in the U.S.:
|
|
• |
26 inpatient acute care hospitals; |
|
|
• |
4 free-standing emergency departments, and; |
|
|
• |
4 outpatient surgery/cancer care centers & 1 surgical hospital. |
Behavioral health care facilities (300 inpatient facilities and 23 outpatient facilities):
Located in the U.S.:
|
|
• |
188 inpatient behavioral health care facilities, and; |
|
|
• |
20 outpatient behavioral health care facilities. |
Located in the U.K.:
|
|
• |
108 inpatient behavioral health care facilities, and; |
|
|
• |
2 outpatient behavioral health care facilities. |
Located in Puerto Rico and the U.S. Virgin Islands:
|
|
• |
4 inpatient behavioral health care facilities, and; |
|
|
• |
1 outpatient behavioral health care facility. |
As a percentage of our consolidated net revenues, net revenues from our acute care hospitals, outpatient facilities and commercial health insurer accounted for 53% during 2017, 52% during 2016 and 51% during 2015. Net revenues from our behavioral health care facilities and commercial health insurer accounted for 47% of our consolidated net revenues during 2017, 48% during 2016 and 49% during 2015.
Our behavioral health care facilities located in the U.K. generated net revenues amounting to approximately $429 million in 2017, $241 million in 2016 and $203 million in 2015. Total assets at our U.K. behavioral health care facilities were approximately $1.098 billion as of December 31, 2017, $965 million as of December 31, 2016 and $521 million as of December 31, 2015.
Services provided by our hospitals include general and specialty surgery, internal medicine, obstetrics, emergency room care, radiology, oncology, diagnostic care, coronary care, pediatric services, pharmacy services and/or behavioral health services. We provide capital resources as well as a variety of management services to our facilities, including central purchasing, information services, finance and control systems, facilities planning, physician recruitment services, administrative personnel management, marketing and public relations.
2017 and 2018 Acquisitions of Assets and Businesses:
2017 Acquisitions:
During 2017 we spent $23 million to acquire various property assets.
2018 Acquisitions:
In January, 2018, we acquired Gulfport Behavioral Health System, a 109-bed behavioral health care facility located in Gulfport, Mississippi.
Available Information
We are a Delaware corporation that was organized in 1979. Our principal executive offices are located at Universal Corporate Center, 367 South Gulph Road, P.O. Box 61558, King of Prussia, PA 19406. Our telephone number is (610) 768-3300.
1
Our website is located at http://www.uhsinc.com. Copies of our annual, quarterly and current reports that we file with the SEC, and any amendments to those reports, are available free of charge on our website. The information posted on our website is not incorporated into this Annual Report. Our Board of Directors’ committee charters (Audit Committee, Compensation Committee and Nominating & Governance Committee), Code of Business Conduct and Corporate Standards applicable to all employees, Code of Ethics for Senior Financial Officers, Corporate Governance Guidelines and our Code of Conduct, Corporate Compliance Manual and Compliance Policies and Procedures are available free of charge on our website. Copies of such reports and charters are available in print to any stockholder who makes a request. Such requests should be made to our Secretary at our King of Prussia, PA corporate headquarters. We intend to satisfy the disclosure requirement under Item 5.05 of Form 8-K relating to amendments to or waivers of any provision of our Code of Ethics for Senior Financial Officers by promptly posting this information on our website.
In accordance with Section 303A.12(a) of the New York Stock Exchange Listed Company Manual, we submitted our CEO’s certification to the New York Stock Exchange in 2016. Additionally, contained in Exhibits 31.1 and 31.2 of this Annual Report on Form 10-K, are our CEO’s and CFO’s certifications regarding the quality of our public disclosures under Section 302 of the Sarbanes-Oxley Act of 2002.
Our Mission
Our company mission is:
To provide superior quality healthcare services that
PATIENTS recommend to families and friends,
PHYSICIANS prefer for their patients,
PURCHASERS select for their clients,
EMPLOYEES are proud of, and
INVESTORS seek for long-term returns.
To achieve this, we have a commitment to:
|
|
• |
service excellence |
|
|
• |
continuous improvement in measurable ways |
|
|
• |
employee development |
|
|
• |
ethical and fair treatment of all |
|
|
• |
teamwork |
|
|
• |
compassion |
|
|
• |
innovation in service delivery |
Business Strategy
We believe community-based hospitals will remain the focal point of the healthcare delivery network and we are committed to a philosophy of self-determination for both the company and our hospitals.
Acquisition of Additional Hospitals. We selectively seek opportunities to expand our base of operations by acquiring, constructing or leasing additional hospital facilities. We are committed to a program of rational growth around our core businesses, while retaining the missions of the hospitals we manage and the communities we serve. Such expansion may provide us with access to new markets and new healthcare delivery capabilities. We also continue to examine our facilities and consider divestiture of those facilities that we believe do not have the potential to contribute to our growth or operating strategy.
Improvement of Operations of Existing Hospitals and Services. We also seek to increase the operating revenues and profitability of owned hospitals by the introduction of new services, improvement of existing services, physician recruitment and the application of financial and operational controls.
We are involved in continual development activities for the benefit of our existing facilities. From time to time applications are filed with state health planning agencies to add new services in existing hospitals in states which require certificates of need, or CONs.
2
Although we expect that some of these applications will result in the addition of new facilities or services to our operations, no assurances can be made for ultimate success by us in these efforts.
Quality and Efficiency of Services. Pressures to contain healthcare costs and technological developments allowing more procedures to be performed on an outpatient basis have led payors to demand a shift to ambulatory or outpatient care wherever possible. We are responding to this trend by emphasizing the expansion of outpatient services. In addition, in response to cost containment pressures, we continue to implement programs at our facilities designed to improve financial performance and efficiency while continuing to provide quality care, including more efficient use of professional and paraprofessional staff, monitoring and adjusting staffing levels and equipment usage, improving patient management and reporting procedures and implementing more efficient billing and collection procedures. In addition, we will continue to emphasize innovation in our response to the rapid changes in regulatory trends and market conditions while fulfilling our commitment to patients, physicians, employees, communities and our stockholders.
In addition, our aggressive recruiting of highly qualified physicians and developing provider networks help to establish our facilities as an important source of quality healthcare in their respective communities.
Hospital Utilization
We believe that the most important factors relating to the overall utilization of a hospital include the quality and market position of the hospital and the number, quality and specialties of physicians providing patient care within the facility. Generally, we believe that the ability of a hospital to meet the health care needs of its community is determined by its breadth of services, level of technology, emphasis on quality of care and convenience for patients and physicians. Other factors that affect utilization include general and local economic conditions, market penetration of managed care programs, the degree of outpatient use, the availability of reimbursement programs such as Medicare and Medicaid, and demographic changes such as the growth in local populations. Utilization across the industry also is being affected by improvements in clinical practice, medical technology and pharmacology. Current industry trends in utilization and occupancy have been significantly affected by changes in reimbursement policies of third party payors. We are also unable to predict the extent to which these industry trends will continue or accelerate. In addition, our acute care services business is typically subject to certain seasonal fluctuations, such as higher patient volumes and net patient service revenues in the first and fourth quarters of the year.
The following table sets forth certain operating statistics for hospitals operated by us for the years indicated. Accordingly, information related to hospitals acquired during the five-year period has been included from the respective dates of acquisition, and information related to hospitals divested during the five year period has been included up to the respective dates of divestiture.
|
|
|
2017 |
|
|
2016 |
|
|
2015 |
|
|
2014 |
|
|
2013 |
|
|||||
|
Average Licensed Beds: |
|
|
|
|
|
|
|
|
|
|
|
|
|
|
|
|
|
|
|
|
|
Acute Care Hospitals |
|
|
6,127 |
|
|
|
5,934 |
|
|
|
5,832 |
|
|
|
5,776 |
|
|
|
5,652 |
|
|
Behavioral Health Centers |
|
|
23,151 |
|
|
|
21,829 |
|
|
|
21,202 |
|
|
|
20,231 |
|
|
|
19,975 |
|
|
Average Available Beds (1): |
|
|
|
|
|
|
|
|
|
|
|
|
|
|
|
|
|
|
|
|
|
Acute Care Hospitals |
|
|
5,954 |
|
|
|
5,759 |
|
|
|
5,656 |
|
|
|
5,571 |
|
|
|
5,429 |
|
|
Behavioral Health Centers |
|
|
23,068 |
|
|
|
21,744 |
|
|
|
21,116 |
|
|
|
20,131 |
|
|
|
19,876 |
|
|
Admissions: |
|
|
|
|
|
|
|
|
|
|
|
|
|
|
|
|
|
|
|
|
|
Acute Care Hospitals |
|
|
297,390 |
|
|
|
274,074 |
|
|
|
261,727 |
|
|
|
251,165 |
|
|
|
246,160 |
|
|
Behavioral Health Centers |
|
|
467,822 |
|
|
|
456,052 |
|
|
|
447,007 |
|
|
|
426,510 |
|
|
|
402,088 |
|
|
Average Length of Stay (Days): |
|
|
|
|
|
|
|
|
|
|
|
|
|
|
|
|
|
|
|
|
|
Acute Care Hospitals |
|
|
4.4 |
|
|
|
4.6 |
|
|
|
4.7 |
|
|
|
4.6 |
|
|
|
4.5 |
|
|
Behavioral Health Centers |
|
|
13.6 |
|
|
|
13.2 |
|
|
|
13.1 |
|
|
|
12.9 |
|
|
|
13.3 |
|
|
Patient Days (2): |
|
|
|
|
|
|
|
|
|
|
|
|
|
|
|
|
|
|
|
|
|
Acute Care Hospitals (1) |
|
|
1,312,265 |
|
|
|
1,251,511 |
|
|
|
1,218,991 |
|
|
|
1,167,726 |
|
|
|
1,112,541 |
|
|
Behavioral Health Centers |
|
|
6,381,756 |
|
|
|
6,004,066 |
|
|
|
5,835,134 |
|
|
|
5,518,660 |
|
|
|
5,365,734 |
|
|
Occupancy Rate-Licensed Beds (3): |
|
|
|
|
|
|
|
|
|
|
|
|
|
|
|
|
|
|
|
|
|
Acute Care Hospitals |
|
|
59 |
% |
|
|
58 |
% |
|
|
57 |
% |
|
|
55 |
% |
|
|
54 |
% |
|
Behavioral Health Centers |
|
|
76 |
% |
|
|
75 |
% |
|
|
75 |
% |
|
|
75 |
% |
|
|
74 |
% |
|
Occupancy Rate-Available Beds (3): |
|
|
|
|
|
|
|
|
|
|
|
|
|
|
|
|
|
|
|
|
|
Acute Care Hospitals |
|
|
60 |
% |
|
|
59 |
% |
|
|
59 |
% |
|
|
57 |
% |
|
|
56 |
% |
|
Behavioral Health Centers |
|
|
76 |
% |
|
|
75 |
% |
|
|
76 |
% |
|
|
75 |
% |
|
|
74 |
% |
3
|
(1) |
“Average Available Beds” is the number of beds which are actually in service at any given time for immediate patient use with the necessary equipment and staff available for patient care. A hospital may have appropriate licenses for more beds than are in service for a number of reasons, including lack of demand, incomplete construction, and anticipation of future needs. |
|
(2) |
“Patient Days” is the sum of all patients for the number of days that hospital care is provided to each patient. |
|
(3) |
“Occupancy Rate” is calculated by dividing average patient days (total patient days divided by the total number of days in the period) by the number of average beds, either available or licensed. |
Sources of Revenue
We receive payments for services rendered from private insurers, including managed care plans, the federal government under the Medicare program, state governments under their respective Medicaid programs and directly from patients. See Item 7. Management’s Discussion and Analysis of Financial Condition and Results of Operations—Sources of Revenue for additional disclosure. Other information related to our revenues, income and other operating information for each reporting segment of our business is provided in Note 11 to our Consolidated Financial Statements, Segment Reporting.
Regulation and Other Factors
Overview: The healthcare industry is subject to numerous laws, regulations and rules including, among others, those related to government healthcare participation requirements, various licensure and accreditations, reimbursement for patient services, health information privacy and security rules, and Medicare and Medicaid fraud and abuse provisions (including, but not limited to, federal statutes and regulations prohibiting kickbacks and other illegal inducements to potential referral sources, false claims submitted to federal health care programs and self-referrals by physicians). Providers that are found to have violated any of these laws and regulations may be excluded from participating in government healthcare programs, subjected to significant fines or penalties and/or required to repay amounts received from the government for previously billed patient services. Although we believe our policies, procedures and practices comply with governmental regulations, no assurance can be given that we will not be subjected to additional governmental inquiries or actions, or that we would not be faced with sanctions, fines or penalties if so subjected. Even if we were to ultimately prevail, a significant governmental inquiry or action under one of the above laws, regulations or rules could have a material adverse impact on us.
Licensing, Certification and Accreditation: All of our U.S. hospitals are subject to compliance with various federal, state and local statutes and regulations in the U.S. and receive periodic inspection by state licensing agencies to review standards of medical care, equipment and cleanliness. Our hospitals must also comply with the conditions of participation and licensing requirements of federal, state and local health agencies, as well as the requirements of municipal building codes, health codes and local fire departments. Various other licenses and permits are also required in order to dispense narcotics, operate pharmacies, handle radioactive materials and operate certain equipment. Our facilities in the United Kingdom are also subject to various laws and regulations.
All of our eligible hospitals have been accredited by The Joint Commission. All of our acute care hospitals and most of our behavioral health centers in the U.S. are certified as providers of Medicare and Medicaid services by the appropriate governmental authorities.
If any of our facilities were to lose its Joint Commission accreditation or otherwise lose its certification under the Medicare and Medicaid programs, the facility may be unable to receive reimbursement from the Medicare and Medicaid programs and other payors. We believe our facilities are in substantial compliance with current applicable federal, state, local and independent review body regulations and standards. The requirements for licensure, certification and accreditation are subject to change and, in order to remain qualified, it may become necessary for us to make changes in our facilities, equipment, personnel and services in the future, which could have a material adverse impact on operations.
Certificates of Need: Many of the states in which we operate hospitals have enacted certificates of need (“CON”) laws as a condition prior to hospital capital expenditures, construction, expansion, modernization or initiation of major new services. Failure to obtain necessary state approval can result in our inability to complete an acquisition, expansion or replacement, the imposition of civil or, in some cases, criminal sanctions, the inability to receive Medicare or Medicaid reimbursement or the revocation of a facility’s license, which could harm our business. In addition, significant CON reforms have been proposed in a number of states that would increase the capital spending thresholds and provide exemptions of various services from review requirements. In the past, we have not experienced any material adverse effects from those requirements, but we cannot predict the impact of these changes upon our operations.
Conversion Legislation: Many states have enacted or are considering enacting laws affecting the conversion or sale of not-for-profit hospitals to for-profit entities. These laws generally require prior approval from the attorney general, advance notification and
4
community involvement. In addition, attorneys general in states without specific conversion legislation may exercise discretionary authority over these transactions. Although the level of government involvement varies from state to state, the trend is to provide for increased governmental review and, in some cases, approval of a transaction in which a not-for-profit entity sells a health care facility to a for-profit entity. The adoption of new or expanded conversion legislation and the increased review of not-for-profit hospital conversions may limit our ability to grow through acquisitions of not-for-profit hospitals.
Utilization Review: Federal regulations require that admissions and utilization of facilities by Medicare and Medicaid patients must be reviewed in order to ensure efficient utilization of facilities and services. The law and regulations require Peer Review Organizations (“PROs”) to review the appropriateness of Medicare and Medicaid patient admissions and discharges, the quality of care provided, the validity of diagnosis related group (“DRG”) classifications and the appropriateness of cases of extraordinary length of stay. PROs may deny payment for services provided, assess fines and also have the authority to recommend to the Department of Health and Human Services (“HHS”) that a provider that is in substantial non-compliance with the standards of the PRO be excluded from participating in the Medicare program. We have contracted with PROs in each state where we do business to perform the required reviews.
Audits: Most hospitals are subject to federal audits to validate the accuracy of Medicare and Medicaid program submitted claims. If these audits identify overpayments, we could be required to pay a substantial rebate of prior years’ payments subject to various administrative appeal rights. The federal government contracts with third-party “recovery audit contractors” (“RACs”) and “Medicaid integrity contractors” (“MICs”), on a contingent fee basis, to audit the propriety of payments to Medicare and Medicaid providers. Similarly, Medicare zone program integrity contractors (“ZPICs”) target claims for potential fraud and abuse. Additionally, Medicare administrative contractors (“MACs”) must ensure they pay the right amount for covered and correctly coded services rendered to eligible beneficiaries by legitimate providers. The Centers for Medicare and Medicaid Services (“CMS”) announced its intent to consolidate many of these Medicare and Medicaid program integrity functions into new unified program integrity contractors (“UPICs”), though it remains unclear what effect, if any, this proposed consolidation may have. We have undergone claims audits related to our receipt of federal healthcare payments during the last three years, the results of which have not required material adjustments to our consolidated results of operations. However, potential liability from future federal or state audits could ultimately exceed established reserves, and any excess could potentially be substantial. Further, Medicare and Medicaid regulations also provide for withholding Medicare and Medicaid overpayments in certain circumstances, which could adversely affect our cash flow.
Self-Referral and Anti-Kickback Legislation
The Stark Law: The Social Security Act includes a provision commonly known as the “Stark Law.” This law prohibits physicians from referring Medicare and Medicaid patients to entities with which they or any of their immediate family members have a financial relationship, unless an exception is met. These types of referrals are known as “self-referrals.” Sanctions for violating the Stark Law include civil penalties up to $24,253 for each violation, and up to $161,692 for sham arrangements. There are a number of exceptions to the self-referral prohibition, including an exception for a physician’s ownership interest in an entire hospital as opposed to an ownership interest in a hospital department unit, service or subpart. However, federal laws and regulations now limit the ability of hospitals relying on this exception to expand aggregate physician ownership interest or to expand certain hospital facilities. This regulation also places a number of compliance requirements on physician-owned hospitals related to reporting of ownership interest. There are also exceptions for many of the customary financial arrangements between physicians and providers, including employment contracts, leases and recruitment agreements that adhere to certain enumerated requirements.
We monitor all aspects of our business and have developed a comprehensive ethics and compliance program that is designed to meet or exceed applicable federal guidelines and industry standards. Nonetheless, because the law in this area is complex and constantly evolving, there can be no assurance that federal regulatory authorities will not determine that any of our arrangements with physicians violate the Stark Law.
Anti-kickback Statute: A provision of the Social Security Act known as the “anti-kickback statute” prohibits healthcare providers and others from directly or indirectly soliciting, receiving, offering or paying money or other remuneration to other individuals and entities in return for using, referring, ordering, recommending or arranging for such referrals or orders of services or other items covered by a federal or state health care program. However, changes to the anti-kickback statute have reduced the intent required for violation; one is no longer required to “have actual knowledge or specific intent to commit a violation of” the anti-kickback statute in order to be found in violation of such law.
The anti-kickback statute contains certain exceptions, and the Office of the Inspector General of the Department of Health and Human Services (“OIG”) has issued regulations that provide for “safe harbors,” from the federal anti-kickback statute for various activities. These activities, which must meet certain requirements, include (but are not limited to) the following: investment interests, space rental, equipment rental, practitioner recruitment, personnel services and management contracts, sale of practice, referral services, warranties, discounts, employees, group purchasing organizations, waiver of beneficiary coinsurance and deductible amounts, managed care arrangements, obstetrical malpractice insurance subsidies, investments in group practices, freestanding
5
surgery centers, donation of technology for electronic health records and referral agreements for specialty services. The fact that conduct or a business arrangement does not fall within a safe harbor or exception does not automatically render the conduct or business arrangement illegal under the anti-kickback statute. However, such conduct and business arrangements may lead to increased scrutiny by government enforcement authorities.
Although we believe that our arrangements with physicians and other referral sources have been structured to comply with current law and available interpretations, there can be no assurance that all arrangements comply with an available safe harbor or that regulatory authorities enforcing these laws will determine these financial arrangements do not violate the anti-kickback statute or other applicable laws. Violations of the anti-kickback statute may be punished by a criminal fine of up to $25,000 for each violation or imprisonment, however, under 18 U.S.C. Section 3571, this fine may be increased to $250,000 for individuals and $500,000 for organizations. Civil money penalties may include fines of up to $50,000 per violation and damages of up to three times the total amount of the remuneration and/or exclusion from participation in Medicare and Medicaid.
Similar State Laws: Many of the states in which we operate have adopted laws that prohibit payments to physicians in exchange for referrals similar to the anti-kickback statute and the Stark Law, some of which apply regardless of the source of payment for care. These statutes typically provide criminal and civil penalties as well as loss of licensure. In many instances, the state statutes provide that any arrangement falling in a federal safe harbor will be immune from scrutiny under the state statutes. However, in most cases, little precedent exists for the interpretation or enforcement of these state laws.
These laws and regulations are extremely complex and, in many cases, we don’t have the benefit of regulatory or judicial interpretation. It is possible that different interpretations or enforcement of these laws and regulations could subject our current or past practices to allegations of impropriety or illegality or could require us to make changes in our facilities, equipment, personnel, services, capital expenditure programs and operating expenses. A determination that we have violated one or more of these laws, or the public announcement that we are being investigated for possible violations of one or more of these laws (see Item 3. Legal Proceedings), could have a material adverse effect on our business, financial condition or results of operations and our business reputation could suffer significantly. In addition, we cannot predict whether other legislation or regulations at the federal or state level will be adopted, what form such legislation or regulations may take or what their impact on us may be.
If we are deemed to have failed to comply with the anti-kickback statute, the Stark Law or other applicable laws and regulations, we could be subjected to liabilities, including criminal penalties, civil penalties (including the loss of our licenses to operate one or more facilities), and exclusion of one or more facilities from participation in the Medicare, Medicaid and other federal and state health care programs. The imposition of such penalties could have a material adverse effect on our business, financial condition or results of operations.
Federal False Claims Act and Similar State Regulations: A current trend affecting the health care industry is the increased use of the federal False Claims Act, and, in particular, actions being brought by individuals on the government’s behalf under the False Claims Act’s qui tam, or whistleblower, provisions. Whistleblower provisions allow private individuals to bring actions on behalf of the government by alleging that the defendant has defrauded the Federal government.
When a defendant is determined by a court of law to have violated the False Claims Act, the defendant may be liable for up to three times the actual damages sustained by the government, plus mandatory civil penalties of between $11,181 to $22,363 for each separate false claim. There are many potential bases for liability under the False Claims Act. Liability often arises when an entity knowingly submits a false claim for reimbursement to the federal government. The Fraud Enforcement and Recovery Act of 2009 (“FERA”) has expanded the number of actions for which liability may attach under the False Claims Act, eliminating requirements that false claims be presented to federal officials or directly involve federal funds. FERA also clarifies that a false claim violation occurs upon the knowing retention, as well as the receipt, of overpayments. In addition, recent changes to the anti-kickback statute have made violations of that law punishable under the civil False Claims Act. Further, a number of states have adopted their own false claims provisions as well as their own whistleblower provisions whereby a private party may file a civil lawsuit on behalf of the state in state court. Recent changes to the False Claims Act require that federal healthcare program overpayments be returned within 60 days from the date the overpayment was identified, or by the date any corresponding cost report was due, whichever is later. Failure to return an overpayment within this period may result in additional civil False Claims Act liability.
Other Fraud and Abuse Provisions: The Social Security Act also imposes criminal and civil penalties for submitting false claims to Medicare and Medicaid. False claims include, but are not limited to, billing for services not rendered, billing for services without prescribed documentation, misrepresenting actual services rendered in order to obtain higher reimbursement and cost report fraud. Like the anti-kickback statute, these provisions are very broad.
Further, the Health Insurance Portability and Accountability Act of 1996 (“HIPAA”) broadened the scope of the fraud and abuse laws by adding several criminal provisions for health care fraud offenses that apply to all health benefit programs, whether or not payments under such programs are paid pursuant to federal programs. HIPAA also introduced enforcement mechanisms to prevent
6
fraud and abuse in Medicare. There are civil penalties for prohibited conduct, including, but not limited to billing for medically unnecessary products or services.
HIPAA Administrative Simplification and Privacy Requirements: The administrative simplification provisions of HIPAA, as amended by the Health Information Technology for Economic and Clinical Health Act (“HITECH”), require the use of uniform electronic data transmission standards for health care claims and payment transactions submitted or received electronically. These provisions are intended to encourage electronic commerce in the health care industry. HIPAA also established federal rules protecting the privacy and security of personal health information. The privacy and security regulations address the use and disclosure of individual health care information and the rights of patients to understand and control how such information is used and disclosed. Violations of HIPAA can result in both criminal and civil fines and penalties.
We believe that we are in material compliance with the privacy regulations of HIPAA, as we continue to develop training and revise procedures to address ongoing compliance. The HIPAA security regulations require health care providers to implement administrative, physical and technical safeguards to protect the confidentiality, integrity and availability of patient information. HITECH has since strengthened certain HIPAA rules regarding the use and disclosure of protected health information, extended certain HIPAA provisions to business associates, and created new security breach notification requirements. HITECH has also extended the ability to impose civil money penalties on providers not knowing that a HIPAA violation has occurred. We believe that we have been in substantial compliance with HIPAA and HITECH requirements to date. Recent changes to the HIPAA regulations may result in greater compliance requirements for healthcare providers, including expanded obligations to report breaches of unsecured patient data, as well as create new liabilities for the actions of parties acting as business associates on our behalf.
Red Flags Rule: In addition, the Federal Trade Commission (“FTC”) Red Flags Rule requires financial institutions and businesses maintaining accounts to address the risk of identity theft. The Red Flag Program Clarification Act of 2010, signed on December 18, 2010, appears to exclude certain healthcare providers from the Red Flags Rule, but permits the FTC or relevant agencies to designate additional creditors subject to the Red Flags Rule through future rulemaking if the agencies determine that the person in question maintains accounts subject to foreseeable risk of identity theft. Compliance with any such future rulemaking may require additional expenditures in the future.
Patient Safety and Quality Improvement Act of 2005: On July 29, 2005, the Patient Safety and Quality Improvement Act of 2005 was enacted, which has the goal of reducing medical errors and increasing patient safety. This legislation establishes a confidential reporting structure in which providers can voluntarily report “Patient Safety Work Product” (“PSWP”) to “Patient Safety Organizations” (“PSOs”). Under the system, PSWP is made privileged, confidential and legally protected from disclosure. PSWP does not include medical, discharge or billing records or any other original patient or provider records but does include information gathered specifically in connection with the reporting of medical errors and improving patient safety. This legislation does not preempt state or federal mandatory disclosure laws concerning information that does not constitute PSWP. PSOs are certified by the Secretary of the HHS for three-year periods and analyze PSWP, provide feedback to providers and may report non-identifiable PSWP to a database. In addition, PSOs are expected to generate patient safety improvement strategies.
Environmental Regulations: Our healthcare operations generate medical waste that must be disposed of in compliance with federal, state and local environmental laws, rules and regulations. Infectious waste generators, including hospitals, face substantial penalties for improper disposal of medical waste, including civil penalties of up to $25,000 per day of noncompliance, criminal penalties of up to $50,000 per day, imprisonment, and remedial costs. In addition, our operations, as well as our purchases and sales of facilities are subject to various other environmental laws, rules and regulations. We believe that our disposal of such wastes is in material compliance with all state and federal laws.
Corporate Practice of Medicine: Several states, including Florida, Nevada, California and Texas, have laws and/or regulations that prohibit corporations and other entities from employing physicians and practicing medicine for a profit or that prohibit certain direct and indirect payments or fee-splitting arrangements between health care providers that are designed to induce or encourage the referral of patients to, or the recommendation of, particular providers for medical products and services. Possible sanctions for violation of these restrictions include loss of license and civil and criminal penalties. In addition, agreements between the corporation and the physician may be considered void and unenforceable. These statutes and/or regulations vary from state to state, are often vague and have seldom been interpreted by the courts or regulatory agencies. We do not expect these state corporate practice of medicine proscriptions to significantly affect our operations. Many states have laws and regulations which prohibit payments for referral of patients and fee-splitting with physicians. We do not make any such payments or have any such arrangements.
EMTALA: All of our hospitals are subject to the Emergency Medical Treatment and Active Labor Act (“EMTALA”). This federal law generally requires hospitals that are certified providers under Medicare to conduct a medical screening examination of every person who visits the hospital’s emergency room for treatment and, if the patient is suffering from a medical emergency, to either stabilize the patient’s condition or transfer the patient to a facility that can better handle the condition. Our obligation to screen and stabilize emergency medical conditions exists regardless of a patient’s ability to pay for treatment. There are severe penalties
7
under EMTALA if a hospital fails to screen or appropriately stabilize or transfer a patient or if the hospital delays appropriate treatment in order to first inquire about the patient’s ability to pay. Penalties for violations of EMTALA include civil monetary penalties and exclusion from participation in the Medicare program. In addition to any liabilities that a hospital may incur under EMTALA, an injured patient, the patient’s family or a medical facility that suffers a financial loss as a direct result of another hospital’s violation of the law can bring a civil suit against the hospital unrelated to the rights granted under that statute.
The federal government broadly interprets EMTALA to cover situations in which patients do not actually present to a hospital’s emergency room, but present for emergency examination or treatment to the hospital’s campus, generally, or to a hospital-based clinic that treats emergency medical conditions or are transported in a hospital-owned ambulance, subject to certain exceptions. EMTALA does not generally apply to patients admitted for inpatient services; however, CMS has recently sought industry comments on the potential applicability of EMTALA to hospital inpatients and the responsibilities of hospitals with specialized capabilities, respectively. CMS has not yet issued regulations or guidance in response to that request for comments. The government also has expressed its intent to investigate and enforce EMTALA violations actively in the future. We believe that we operate in substantial compliance with EMTALA.
Health Care Industry Investigations: We are subject to claims and suits in the ordinary course of business, including those arising from care and treatment afforded by our hospitals and are party to various government investigations and litigation. Please see Item 3. Legal Proceedings included herein for additional disclosure. In addition, currently, and from time to time, some of our facilities are subjected to inquiries and/or actions and receive notices of potential non-compliance of laws and regulations from various federal and state agencies. Providers that are found to have violated these laws and regulations may be excluded from participating in government healthcare programs, subjected to potential licensure, certification, and/or accreditation revocation, subjected to fines or penalties or required to repay amounts received from the government for previously billed patient services.
We monitor all aspects of our business and have developed a comprehensive ethics and compliance program that is designed to meet or exceed applicable federal guidelines and industry standards. Because the law in this area is complex and constantly evolving, governmental investigation or litigation may result in interpretations that are inconsistent with industry practices, including ours. Although we believe our policies, procedures and practices comply with governmental regulations, no assurance can be given that we will not be subjected to inquiries or actions, or that we will not be faced with sanctions, fines or penalties in connection with the investigations. Even if we were to ultimately prevail, the government’s inquiry and/or action in connection with these matters could have a material adverse effect on our future operating results.
Our substantial Medicare, Medicaid and other governmental billings may result in heightened scrutiny of our operations. It is possible that governmental entities could initiate additional investigations or litigation in the future and that such matters could result in significant penalties as well as adverse publicity. It is also possible that our executives and/or managers could be included as targets or witnesses in governmental investigations or litigation and/or named as defendants in private litigation.
Revenue Rulings 98-15 and 2004-51: In March 1998 and May 2004, the IRS issued guidance regarding the tax consequences of joint ventures between for-profit and not-for-profit hospitals. As a result of the tax rulings, the IRS has proposed, and may in the future propose, to revoke the tax-exempt or public charity status of certain not-for-profit entities which participate in such joint ventures or to treat joint venture income as unrelated business taxable income to them. The tax rulings have limited development of joint ventures and any adverse determination by the IRS or the courts regarding the tax-exempt or public charity status of a not-for-profit partner or the characterization of joint venture income as unrelated business taxable income could further limit joint venture development with not-for-profit hospitals, and/or require the restructuring of certain existing joint ventures with not-for-profits.
State Rate Review: Some states where we operate hospitals have adopted legislation mandating rate or budget review for hospitals or have adopted taxes on hospital revenues, assessments or licensure fees to fund indigent health care within the state. In the aggregate, state rate reviews and indigent tax provisions have not materially, adversely affected our results of operations.
Medical Malpractice Tort Law Reform: Medical malpractice tort law has historically been maintained at the state level. All states have laws governing medical liability lawsuits. Over half of the states have limits on damages awards. Almost all states have eliminated joint and several liability in malpractice lawsuits, and many states have established limits on attorney fees. Many states had bills introduced in their legislative sessions to address medical malpractice tort reform. Proposed solutions include enacting limits on non-economic damages, malpractice insurance reform, and gathering lawsuit claims data from malpractice insurance companies and the courts for the purpose of assessing the connection between malpractice settlements and premium rates. Reform legislation has also been proposed, but not adopted, at the federal level that could preempt additional state legislation in this area.
Compliance Program: Our company-wide compliance program has been in place since 1998. Currently, the program’s elements include a Code of Conduct, risk area specific policies and procedures, employee education and training, an internal system for reporting concerns, auditing and monitoring programs, and a means for enforcing the program’s policies.
8
Since its initial adoption, the compliance program continues to be expanded and developed to meet the industry’s expectations and our needs. Specific written policies, procedures, training and educational materials and programs, as well as auditing and monitoring activities have been prepared and implemented to address the functional and operational aspects of our business. Specific areas identified through regulatory interpretation and enforcement activities have also been addressed in our program. Claims preparation and submission, including coding, billing, and cost reports, comprise the bulk of these areas. Financial arrangements with physicians and other referral sources, including compliance with anti-kickback and Stark laws and emergency department treatment and transfer requirements are also the focus of policy and training, standardized documentation requirements, and review and audit.
United Kingdom Regulation: Our operations in the United Kingdom are also subject to a high level of regulation relating to registration and licensing requirements, employee regulation, clinical standards, environmental rules as well as other areas. We are also subject to a highly regulated business environment, and failure to comply with the various laws and regulations applicable to us could lead to substantial penalties and other adverse effects on our business.
Employees and Medical Staff
Our facilities located in the U.S. had approximately 76,600 employees as of December 31, 2017, of whom approximately 55,000 were employed full-time. In addition, our facilities located in the U.K. had approximately 6,500 employees as of December 31, 2017. Our hospitals are staffed by licensed physicians who have been admitted to the medical staff of individual hospitals. In a number of our markets, physicians may have admitting privileges at other hospitals in addition to ours. Within our acute care division, approximately 240 physicians are employed by physician practice management subsidiaries of ours either directly or through contracts with affiliated group practices structured as 501A corporations. Members of the medical staffs of our hospitals also serve on the medical staffs of hospitals not owned by us and may terminate their affiliation with our hospitals at any time. In addition, within our behavioral health division, approximately 490 psychiatrists are employed by subsidiaries of ours either directly or through contracts with affiliated group practices structured as 501A corporations. Each of our hospitals is managed on a day-to-day basis by a managing director employed by a subsidiary of ours. In addition, a Board of Governors, including members of the hospital’s medical staff, governs the medical, professional and ethical practices at each hospital. We believe that our relations with our employees are satisfactory.
Approximately 765 of our employees at six of our hospitals are unionized. At Valley Hospital Medical Center, unionized employees belong to the Culinary Workers and Bartenders Union and the International Union of Operating Engineers. Engineers at Desert Springs Hospital are represented by the International Union of Operating Engineers. At The George Washington University Hospital, dietary and housekeeping employees are represented by the Service Employees International Union (“SEIU”). At the Psychiatric Institute of Washington, clinical, clerical, support and maintenance employees are represented by the Communication Workers of America (AFL-CIO). Registered Nurses, Licensed Practical Nurses, certain technicians and therapists and some clerical employees at HRI Hospital in Boston are represented by the SEIU. At Brooke Glen Behavioral Hospital, unionized employees are represented by the Teamsters and the Northwestern Nurses Association/Pennsylvania Association of Staff Nurses and Allied Professionals.
Competition
The health care industry is highly competitive. In recent years, competition among healthcare providers for patients has intensified in the United States due to, among other things, regulatory and technological changes, increasing use of managed care payment systems, cost containment pressures and a shift toward outpatient treatment. In all of the geographical areas in which we operate, there are other hospitals that provide services comparable to those offered by our hospitals. In addition, some of our competitors include hospitals that are owned by tax-supported governmental agencies or by nonprofit corporations and may be supported by endowments and charitable contributions and exempt from property, sale and income taxes. Such exemptions and support are not available to us.
In some markets, certain of our competitors may have greater financial resources, be better equipped and offer a broader range of services than us. Certain hospitals that are located in the areas served by our facilities are specialty or large hospitals that provide medical, surgical and behavioral health services, facilities and equipment that are not available at our hospitals. The increase in outpatient treatment and diagnostic facilities, outpatient surgical centers and freestanding ambulatory surgical also increases competition for us. In addition, some of our hospitals face competition from hospitals or surgery centers that are physician owned.
The number and quality of the physicians on a hospital’s staff are important factors in determining a hospital’s success and competitive advantage. Typically, physicians are responsible for making hospital admissions decisions and for directing the course of patient treatment. We believe that physicians refer patients to a hospital primarily on the basis of the patient’s needs, the quality of other physicians on the medical staff, the location of the hospital and the breadth and scope of services offered at the hospital’s
9
facilities. We strive to retain and attract qualified doctors by maintaining high ethical and professional standards and providing adequate support personnel, technologically advanced equipment and facilities that meet the needs of those physicians.
In addition, we depend on the efforts, abilities, and experience of our medical support personnel, including our nurses, pharmacists and lab technicians and other health care professionals. We compete with other health care providers in recruiting and retaining qualified hospital management, nurses and other medical personnel. Our acute care and behavioral health care facilities are experiencing the effects of a shortage of skilled nursing staff nationwide, which has caused and may continue to cause an increase in salaries, wages and benefits expense in excess of the inflation rate. In addition, in some markets like California, there are requirements to maintain specified nurse-staffing levels. To the extent we cannot meet those levels, we may be required to limit the healthcare services provided in these markets which would have a corresponding adverse effect on our net operating revenues.
Many states in which we operate hospitals have CON laws. The application process for approval of additional covered services, new facilities, changes in operations and capital expenditures is, therefore, highly competitive in these states. In those states that do not have CON laws or which set relatively high levels of expenditures before they become reviewable by state authorities, competition in the form of new services, facilities and capital spending is more prevalent. See “Regulation and Other Factors.”
Our ability to negotiate favorable service contracts with purchasers of group health care services also affects our competitive position and significantly affects the revenues and operating results of our hospitals. Managed care plans attempt to direct and control the use of hospital services and to demand that we accept lower rates of payment. In addition, employers and traditional health insurers are increasingly interested in containing costs through negotiations with hospitals for managed care programs and discounts from established charges. In return, hospitals secure commitments for a larger number of potential patients. Generally, hospitals compete for service contracts with group health care service purchasers on the basis of price, market reputation, geographic location, quality and range of services, quality of the medical staff and convenience. The importance of obtaining contracts with managed care organizations varies from market to market depending on the market strength of such organizations.
A key element of our growth strategy is expansion through the acquisition of additional hospitals in select markets. The competition to acquire hospitals is significant. We face competition for acquisition candidates primarily from other for-profit health care companies, as well as from not-for-profit entities. Some of our competitors have greater resources than we do. We intend to selectively seek opportunities to expand our base of operations by adhering to our disciplined program of rational growth, but may not be successful in accomplishing acquisitions on favorable terms.
Relationship with Universal Health Realty Income Trust
At December 31, 2017, we held approximately 5.7% of the outstanding shares of Universal Health Realty Income Trust (the “Trust”). We serve as Advisor to the Trust under an annually renewable advisory agreement, which is scheduled to expire on December 31st of each year, pursuant to the terms of which we conduct the Trust’s day-to-day affairs, provide administrative services and present investment opportunities. In December, 2017, the advisory agreement was renewed by the Trust for 2018 pursuant to the same terms in place during each of the last three years. During 2017, 2016 and 2015, the advisory fee was computed at 0.70% of the Trust’s average invested real estate assets. In addition, certain of our officers and directors are also officers and/or directors of the Trust. Management believes that it has the ability to exercise significant influence over the Trust, therefore we account for our investment in the Trust using the equity method of accounting. We earned an advisory fee from the Trust, which is included in net revenues in the accompanying consolidated statements of income, of approximately $3.6 million during 2017, $3.3 million during 2016 and $2.8 million during 2015.
Our pre-tax share of income from the Trust was $2.6 million during 2017, $1.0 million during 2016 and $1.4 million during 2015, and is included in net revenues in the accompanying consolidated statements of income for each year. Included in our share of the Trust’s income was approximately $1.7 million in 2017 related to our share of a gain recorded resulting from a property transaction, as well as insurance proceeds in excess of damaged Trust property. During 2015, our share of the Trust’s income included $500,000 related to our share of a gain on an exchange transaction recorded by the Trust. We received dividends from the Trust amounting to $2.1 million during 2017 and $2.0 million during each of 2016 and 2015.
The carrying value of our investment in the Trust was $8.2 million and $7.7 million at December 31, 2017 and 2016, respectively, and is included in other assets in the accompanying consolidated balance sheets. The market value of our investment in the Trust was $59.2 million at December 31, 2017 and $51.7 million at December 31, 2016, based on the closing price of the Trust’s stock on the respective dates.
The Trust commenced operations in 1986 by purchasing certain hospital properties from us and immediately leasing the properties back to our respective subsidiaries. Most of the leases were entered into at the time the Trust commenced operations and provided for initial terms of 13 to 15 years with up to six additional 5-year renewal terms. Each hospital lease also provided for additional or bonus rental, as discussed below. The base rents are paid monthly and the bonus rents are computed and paid on a
10
quarterly basis, based upon a computation that compares current quarter revenue to a corresponding quarter in the base year. The leases with those subsidiaries are unconditionally guaranteed by us and are cross-defaulted with one another.
Total rent expense under the operating leases on the three hospital facilities with the Trust during 2017, 2016 and 2015 was $16.0 million, $15.9 million, and $15.6 million, respectively. Pursuant to the terms of the three hospital leases with the Trust, we have the option to renew the leases at the lease terms described above by providing notice to the Trust at least 90 days prior to the termination of the then current term. We also have the right to purchase the respective leased hospitals at the end of the lease terms or any renewal terms at their appraised fair market value as well as purchase any or all of the three leased hospital properties at the appraised fair market value upon one month’s notice should a change of control of the Trust occur. In addition, we have rights of first refusal to: (i) purchase the respective leased facilities during and for 180 days after the lease terms at the same price, terms and conditions of any third-party offer, or; (ii) renew the lease on the respective leased facility at the end of, and for 180 days after, the lease term at the same terms and conditions pursuant to any third-party offer.
The table below details the renewal options and terms for each of our three hospital facilities leased from the Trust:
|
Hospital Name |
|
Type of Facility |
|
Annual Minimum Rent |
|
|
End of Lease Term |
|
Renewal Term (years) |
|
|
||
|
McAllen Medical Center |
|
Acute Care |
|
$ |
5,485,000 |
|
|
December, 2021 |
|
|
10 |
|
(a) |
|
Wellington Regional Medical Center |
|
Acute Care |
|
$ |
3,030,000 |
|
|
December, 2021 |
|
|
10 |
|
(b) |
|
Southwest Healthcare System, Inland Valley Campus |
|
Acute Care |
|
$ |
2,648,000 |
|
|
December, 2021 |
|
|
10 |
|
(b) |
|
(a) |
We have two 5-year renewal options at existing lease rates (through 2031). |
|
(b) |
We have two 5-year renewal options at fair market value lease rates (2022 through 2031). |
In addition, certain of our subsidiaries are tenants in various medical office buildings and two free-standing emergency departments (“FEDs”) owned by the Trust or by limited liability companies in which the Trust holds 95% to 100% of the ownership interest. During the first quarter of 2015, wholly-owned subsidiaries of ours sold to and leased back from the Trust, two newly constructed FEDs located in Texas which were completed and opened during the first quarter of 2015. In conjunction with these transactions, ten-year lease agreements with six, five-year renewal options have been executed with the Trust. We have the option to purchase the properties upon the expiration of the fixed terms and each five-year renewal terms at the fair market value of the property. The aggregate construction cost/sales proceeds of these facilities was approximately $13 million, and the aggregate rent expense paid to the Trust at the commencement of the leases was approximately $900,000 annually.
Executive Officers of the Registrant
The executive officers, whose terms will expire at such time as their successors are elected, are as follows:
|
Name and Age |
|
Present Position with the Company |
|
Alan B. Miller (80) |
|
Chairman of the Board and Chief Executive Officer |
|
Marc D. Miller (47) |
|
President and Director |
|
Steve G. Filton (60) |
|
Executive Vice President, Chief Financial Officer and Secretary |
|
Debra K. Osteen (62) |
|
Executive Vice President, President of Behavioral Health Care Division |
|
Marvin G. Pember (64) |
|
Executive Vice President, President of Acute Care Division |
Mr. Alan B. Miller has been Chairman of the Board and Chief Executive Officer since inception and also served as President from inception until May, 2009. Prior thereto, he was President, Chairman of the Board and Chief Executive Officer of American Medicorp, Inc. He currently serves as Chairman of the Board, Chief Executive Officer and President of Universal Health Realty Income Trust. He is the father of Marc D. Miller, our President and Director.
Mr. Marc D. Miller was elected President in May, 2009 and prior thereto served as Senior Vice President and co-head of our Acute Care Hospitals since 2007. He was elected a Director in May, 2006 and Vice President in 2005. He has served in various capacities related to our acute care division since 2000. He was elected to the Board of Trustees of Universal Health Realty Income Trust in December, 2008. In August, 2015, he was appointed to the Board of Directors of Premier, Inc., a publicly traded healthcare performance improvement alliance. See Note 9 to the Consolidated Financial Statements-Relationship with Universal Health Realty Income Trust and Other Related Party Transactions for additional disclosure regarding the Company’s group purchasing organization agreement with Premier, Inc. Marc D. Miller is the son of Alan B. Miller, our Chairman of the Board and Chief Executive Officer.
11
Mr. Filton was elected Executive Vice President in 2017 and continues to serve as Chief Financial Officer since his appointment in 2003. He has also served as Secretary since 1999. He had served as Senior Vice President since 2003, as Vice President and Controller since 1991, and as Director of Corporate Accounting since 1985.
Ms. Osteen was elected Executive Vice President in 2017 and continues to serve as President of our Behavioral Health Care Division since her appointment in 2009. She has served as Senior Vice President since 2005, as Vice President since 2000, and in various capacities related to our Behavioral Health Care Division since 1984.
Mr. Pember was elected Executive Vice President in 2017 and continues to serve as President of our Acute Care Division since commencement of his employment with us in 2011. He had served as Senior Vice President since 2011. He was formerly employed for 12 years at Indiana University Health, Inc. (formerly known as Clarian Health Partners, Inc.), a nonprofit hospital system that operates multiple facilities in Indiana, where he served as Executive Vice President and Chief Financial Officer.
We are subject to numerous known and unknown risks, many of which are described below and elsewhere in this Annual Report. Any of the events described below could have a material adverse effect on our business, financial condition and results of operations. Additional risks and uncertainties that we are not aware of, or that we currently deem to be immaterial, could also impact our business and results of operations.
A significant portion of our revenue is produced by facilities located in Texas, Nevada and California.
Texas: We own 7 inpatient acute care hospitals and 22 inpatient behavioral healthcare facilities as listed in Item 2. Properties. On a combined basis, these facilities contributed 15% in 2017, 16% in 2016 and 17% in 2015 of our consolidated net revenues. On a combined basis, after deducting an allocation for corporate overhead expense, these facilities generated 11% in 2017, 7% in 2016 and 11% in 2015, of our income from operations after net income attributable to noncontrolling interest.
Nevada: We own 8 inpatient acute care hospitals and 4 inpatient behavioral healthcare facilities as listed in Item 2. Properties. On a combined basis, these facilities contributed 17% in 2017, 16% in 2016 and 15% in 2015, of our consolidated net revenues. On a combined basis, after deducting an allocation for corporate overhead expense, these facilities generated 20% in 2017, 13% in 2016 and 10% in 2015, of our income from operations after net income attributable to noncontrolling interest.
California: We own 5 inpatient acute care hospitals and 8 inpatient behavioral healthcare facilities as listed in Item 2. Properties. On a combined basis, these facilities contributed 11% in 2017, 11% in 2016 and 11% in 2015, of our consolidated net revenues. On a combined basis, after deducting an allocation for corporate overhead expense, these facilities generated 13% in 2017, 15% in 2016 and 11% in 2015, of our income from operations after net income attributable to noncontrolling interest.
The significant portion of our revenues and earnings derived from these facilities makes us particularly sensitive to legislative, regulatory, economic, environmental and competition changes in Texas, Nevada and California. Any material change in the current payment programs or regulatory, economic, environmental or competitive conditions in these states could have a disproportionate effect on our overall business results.
Our revenues and results of operations are significantly affected by payments received from the government and other third party payors.
We derive a significant portion of our revenue from third-party payors, including the Medicare and Medicaid programs. Changes in these government programs in recent years have resulted in limitations on reimbursement and, in some cases, reduced levels of reimbursement for healthcare services. Payments from federal and state government programs are subject to statutory and regulatory changes, administrative rulings, interpretations and determinations, requirements for utilization review, and federal and state funding restrictions, all of which could materially increase or decrease program payments, as well as affect the cost of providing service to patients and the timing of payments to facilities. We are unable to predict the effect of recent and future policy changes on our operations. In addition, the uncertainty and fiscal pressures placed upon federal and state governments as a result of, among other things, deterioration in general economic conditions and the funding requirements from the federal healthcare reform legislation, may affect the availability of taxpayer funds for Medicare and Medicaid programs. In addition, the vast majority of the net revenues generated at our behavioral health facilities located in the United Kingdom are derived from governmental payors. If the rates paid or the scope of services covered by governmental payors in the United States or United Kingdom are reduced, there could be a material adverse effect on our business, financial position and results of operations.
12
We receive Medicaid revenues in excess of $100 million annually from each of Texas, California, Nevada, Washington, D.C., Pennsylvania and Illinois, making us particularly sensitive to reductions in Medicaid and other state based revenue programs as well as regulatory, economic, environmental and competitive changes in those states.
In addition to changes in government reimbursement programs, our ability to negotiate favorable contracts with private payors, including managed care providers, significantly affects the revenues and operating results of our hospitals. Private payors, including managed care providers, increasingly are demanding that we accept lower rates of payment.
We expect continued third-party efforts to aggressively manage reimbursement levels and cost controls. Reductions in reimbursement amounts received from third-party payors could have a material adverse effect on our financial position and our results of operations.
Reductions or changes in Medicare and Medicaid funding could have a material adverse effect on our future results of operations.
On January 3, 2013, President Obama signed into law the American Taxpayer Relief Act of 2012 (the “2012 Act”). The 2012 Act postponed for two months sequestration cuts mandated under the Budget Control Act of 2011. The postponed sequestration cuts include a 2% annual reduction over ten years in Medicare spending to providers. Medicaid is exempt from sequestration. In order to offset the costs of the legislation, the 2012 Act reduces payments to other providers totaling almost $26 billion over ten years. Approximately half of those funds will come from reductions in Medicare reimbursement to hospitals. Although the Bipartisan Budget Act of 2013 has reduced certain sequestration-related budgetary cuts, spending reductions related to the Medicare program remain in place. On December 26, 2013, President Obama signed into law H.J. Res. 59, the Bipartisan Budget Act of 2013, which includes the Pathway for SGR Reform Act of 2013 (“the Act”). In addition, on February 15, 2014, Public Law 113-082 was enacted. The 2012 Act and subsequent federal legislation achieves new savings by extending sequestration for mandatory programs—including Medicare— through 2027. Please see Item 7. Management’s Discussion and Analysis of Financial Condition and Results of Operations, Sources of Revenue-Medicare, for additional disclosure.
The 2012 Act includes a document and coding (“DCI”) adjustment and a reduction in Medicaid disproportionate share hospital (“DSH”) payments. Expected to save $10.5 billion over 10 years, the DCI adjustment decreases projected Medicare hospital payments for inpatient and overnight care through a downward adjustment in annual base payment increases. These reductions are meant to recoup what Medicare authorities consider to be “overpayments” to hospitals that occurred as a result of the transition to Medicare Severity Diagnosis Related Groups. The reduction in Medicaid DSH payments was expected to save $4.2 billion over 10 years. This provision extends the changes regarding DSH payments established by the Legislation and determines future allotments off of the rebased level. On February 9, 2018, President Trump signed into law H.R. 1892, the Bipartisan Budget Act of 2018, which eliminated the DSH cuts scheduled for 2018 and 2019 but added additional DSH reductions of $4 billion in 2020 and $8 billion a year between 2021 and 2025.
We are subject to uncertainties regarding health care reform.
On March 23, 2010, President Obama signed into law the Patient Protection and Affordable Care Act (the “PPACA”). The Healthcare and Education Reconciliation Act of 2010 (the “Reconciliation Act”), which contains a number of amendments to the PPACA, was signed into law on March 30, 2010. Two primary goals of the PPACA, combined with the Reconciliation Act (collectively referred to as the “Legislation”), are to provide for increased access to coverage for healthcare and to reduce healthcare-related expenses.
Although it was expected that as a result of the Legislation there would be a reduction in uninsured patients, which would reduce our expense from uncollectible accounts receivable, the Legislation makes a number of other changes to Medicare and Medicaid which we believe may have an adverse impact on us. It has been projected that the Legislation will result in a net reduction in Medicare and Medicaid payments to hospitals totaling $155 billion over 10 years. The Legislation revises reimbursement under the Medicare and Medicaid programs to emphasize the efficient delivery of high quality care and contains a number of incentives and penalties under these programs to achieve these goals. The Legislation provides for decreases in the annual market basket update for federal fiscal years 2010 through 2019, a productivity offset to the market basket update beginning October 1, 2011 for Medicare Part B reimbursable items and services and beginning October 1, 2012 for Medicare inpatient hospital services. The Legislation and subsequent revisions provide for reductions to both Medicare DSH and Medicaid DSH payments. The Medicare DSH reductions began in October, 2013 while the Medicaid DSH reductions are scheduled to begin in 2020. The Legislation implements a value-based purchasing program, which will reward the delivery of efficient care. Conversely, certain facilities will receive reduced reimbursement for failing to meet quality parameters; such hospitals will include those with excessive readmission or hospital-acquired condition rates.
13
A 2012 U.S. Supreme Court ruling limited the federal government’s ability to expand health insurance coverage by holding unconstitutional sections of the Legislation that sought to withdraw federal funding for state noncompliance with certain Medicaid coverage requirements. Pursuant to that decision, the federal government may not penalize states that choose not to participate in the Medicaid expansion program by reducing their existing Medicaid funding. Therefore, states can choose to accept or not to participate without risking the loss of federal Medicaid funding. As a result, many states, including Texas, have not expanded their Medicaid programs without the threat of loss of federal funding. CMS has granted, and is expected to grant additional, section 1115 demonstration waivers providing for work and community engagement requirements for certain Medicaid eligible individuals. It is anticipated this will lead to reductions in coverage, and likely increases in uncompensated care, in states where these demonstration waivers are granted.
The various provisions in the Legislation that directly or indirectly affect Medicare and Medicaid reimbursement are scheduled to take effect over a number of years. The impact of the Legislation on healthcare providers will be subject to implementing regulations, interpretive guidance and possible future legislation or legal challenges. Certain Legislation provisions, such as that creating the Medicare Shared Savings Program creates uncertainty in how healthcare may be reimbursed by federal programs in the future. Thus, we cannot predict the impact of the Legislation on our future reimbursement at this time and we can provide no assurance that the Legislation will not have a material adverse effect on our future results of operations.
The Legislation also contained provisions aimed at reducing fraud and abuse in healthcare. The Legislation amends several existing laws, including the federal Anti-Kickback Statute and the False Claims Act, making it easier for government agencies and private plaintiffs to prevail in lawsuits brought against healthcare providers. While Congress had previously revised the intent requirement of the Anti-Kickback Statute to provide that a person is not required to “have actual knowledge or specific intent to commit a violation of” the Anti-Kickback Statute in order to be found in violation of such law, the Legislation also provides that any claims for items or services that violate the Anti-Kickback Statute are also considered false claims for purposes of the federal civil False Claims Act. The Legislation provides that a healthcare provider that retains an overpayment in excess of 60 days is subject to the federal civil False Claims Act, although final regulations implementing this statutory requirement remain pending. The Legislation also expands the Recovery Audit Contractor program to Medicaid. These amendments also make it easier for severe fines and penalties to be imposed on healthcare providers that violate applicable laws and regulations.
We have partnered with local physicians in the ownership of certain of our facilities. These investments have been permitted under an exception to the physician self-referral law. The Legislation permits existing physician investments in a hospital to continue under a “grandfather” clause if the arrangement satisfies certain requirements and restrictions, but physicians are prohibited from increasing the aggregate percentage of their ownership in the hospital. The Legislation also imposes certain compliance and disclosure requirements upon existing physician-owned hospitals and restricts the ability of physician-owned hospitals to expand the capacity of their facilities. As discussed below, should the Legislation be repealed in its entirety, this aspect of the Legislation would also be repealed restoring physician ownership of hospitals and expansion right to its position and practice as it existed prior to the Legislation.
The impact of the Legislation on each of our hospitals may vary. Because Legislation provisions are effective at various times over the next several years, we anticipate that many of the provisions in the Legislation may be subject to further revision. Initiatives to repeal the Legislation, in whole or in part, to delay elements of implementation or funding, and to offer amendments or supplements to modify its provisions have been persistent. The ultimate outcomes of legislative attempts to repeal or amend the Legislation and legal challenges to the Legislation are unknown. Legislation has already been enacted that has repealed the individual mandate to obtain health insurance penalty that was part of the original Legislation. In addition, Congress is considering legislation that would, in material part: (i) eliminate the large employer mandate to obtain or provide health insurance coverage, respectively; (ii) permit insurers to impose a surcharge up to 30 percent on individuals who go uninsured for more than two months and then purchase coverage; (iii) provide tax credits towards the purchase of health insurance, with a phase-out of tax credits accordingly to income level; (iv) expand health savings accounts; (v) impose a per capita cap on federal funding of state Medicaid programs, or, if elected by a state, transition federal funding to block grants, and; (vi) permit states to seek a waiver of certain federal requirements that would allow such state to define essential health benefits differently from federal standards and that would allow certain commercial health plans to take health status, including pre-existing conditions, into account in setting premiums.
In addition to legislative changes, the Legislation can be significantly impacted by executive branch actions. In relevant part, President Trump has already taken executive actions: (i) requiring all federal agencies with authorities and responsibilities under the Legislation to “exercise all authority and discretion available to them to waiver, defer, grant exemptions from, or delay” parts of the Legislation that place “unwarranted economic and regulatory burdens” on states, individuals or health care providers; (ii) the issuance of a proposed rule by the Department of Labor to enable the formation of health plans that would be exempt from certain Legislation essential health benefits requirements, and; (iii) eliminating cost-sharing reduction payments to insurers that would otherwise offset deductibles and other out-of-pocket expenses for health plan enrollees at or below 250 percent of the federal poverty level. The uncertainty resulting from these Executive Branch policies has led to reduced Exchange enrollment in 2018 and is expected to further
14
worsen the individual and small group market risk pools in future years. It is also anticipated that these and future policies may create additional cost and reimbursement pressures on hospitals.
It remains unclear what portions of the Legislation may remain, or whether any replacement or alternative programs may be created by any future legislation. Any such future repeal or replacement may have significant impact on the reimbursement for healthcare services generally, and may create reimbursement for services competing with the services offered by our hospitals. Accordingly, there can be no assurance that the adoption of any future federal or state healthcare reform legislation will not have a negative financial impact on our hospitals, including their ability to compete with alternative healthcare services funded by such potential legislation, or for our hospitals to receive payment for services.
We are required to treat patients with emergency medical conditions regardless of ability to pay.
In accordance with our internal policies and procedures, as well as the Emergency Medical Treatment and Active Labor Act, or EMTALA, we provide a medical screening examination to any individual who comes to one of our hospitals while in active labor and/or seeking medical treatment (whether or not such individual is eligible for insurance benefits and regardless of ability to pay) to determine if such individual has an emergency medical condition. If it is determined that such person has an emergency medical condition, we provide such further medical examination and treatment as is required to stabilize the patient’s medical condition, within the facility’s capability, or arrange for transfer of such individual to another medical facility in accordance with applicable law and the treating hospital’s written procedures. Our obligations under EMTALA may increase substantially going forward; CMS has sought stakeholder comments concerning the potential applicability of EMTALA to hospital inpatients and the responsibilities of hospitals with specialized capabilities, respectively, but has yet to issue further guidance in response to that request. If the number of indigent and charity care patients with emergency medical conditions we treat increases significantly, or if regulations expanding our obligations to inpatients under EMTALA is proposed and adopted, our results of operations will be harmed.
If we are not able to provide high quality medical care at a reasonable price, patients may choose to receive their health care from our competitors.
In recent years, the number of quality measures that hospitals are required to report publicly has increased. CMS publishes performance data related to quality measures and data on patient satisfaction surveys that hospitals submit in connection with the Medicare program. Federal law provides for the future expansion of the number of quality measures that must be reported. Additionally, the Legislation requires all hospitals to annually establish, update and make public a list of their standard charges for products and services. If any of our hospitals achieve poor results on the quality measures or patient satisfaction surveys (or results that are lower than our competitors) or if our standard charges are higher than our competitors, our patient volume could decline because patients may elect to use competing hospitals or other health care providers that have better metrics and pricing. This circumstance could harm our business and results of operations.
An increase in uninsured and underinsured patients in our acute care facilities or the deterioration in the collectability of the accounts of such patients could harm our results of operations.
Collection of receivables from third-party payors and patients is our primary source of cash and is critical to our operating performance. Our primary collection risks relate to uninsured patients and the portion of the bill that is the patient’s responsibility, which primarily includes co-payments and deductibles. However, we also have substantial receivables due to us from certain state-based funding programs. We estimate our provisions for doubtful accounts based on general factors such as payor mix, the agings of the receivables, historical collection experience and assessment of probability of future collections. We routinely review accounts receivable balances in conjunction with these factors and other economic conditions that might ultimately affect the collectability of the patient accounts and make adjustments to our allowances as warranted. Significant changes in business office operations, payor mix, economic conditions or trends in federal and state governmental health coverage could affect our collection of accounts receivable, cash flow and results of operations. If we experience unexpected increases in the growth of uninsured and underinsured patients or in bad debt expenses, our results of operations will be harmed.
Our hospitals face competition for patients from other hospitals and health care providers.
The healthcare industry is highly competitive, and competition among hospitals, and other healthcare providers for patients and physicians has intensified in recent years. In all of the geographical areas in which we operate, there are other hospitals that provide services comparable to those offered by our hospitals. Some of our competitors include hospitals that are owned by tax-supported governmental agencies or by nonprofit corporations and may be supported by endowments and charitable contributions and exempt from property, sales and income taxes. Such exemptions and support are not available to us.
15
In some markets, certain of our competitors may have greater financial resources, be better equipped and offer a broader range of services than we. The number of inpatient facilities, as well as outpatient surgical and diagnostic centers, many of which are fully or partially owned by physicians, in the geographic areas in which we operate has increased significantly. As a result, most of our hospitals operate in an increasingly competitive environment.
We also operate health care facilities in the United Kingdom where the National Health Service (the “NHS”) is the principal provider of healthcare services. In addition to the NHS, we face competition in the United Kingdom from independent sector providers and other publicly funded entities for patients.
If our competitors are better able to attract patients, recruit physicians and other healthcare professionals, expand services or obtain favorable managed care contracts at their facilities, we may experience a decline in patient volume and our business may be harmed.
Our performance depends on our ability to recruit and retain quality physicians.
Typically, physicians are responsible for making hospital admissions decisions and for directing the course of patient treatment. As a result, the success and competitive advantage of our hospitals depends, in part, on the number and quality of the physicians on the medical staffs of our hospitals, the admitting practices of those physicians and our maintenance of good relations with those physicians. Physicians generally are not employees of our hospitals, and, in a number of our markets, physicians have admitting privileges at other hospitals in addition to our hospitals. They may terminate their affiliation with us at any time. If we are unable to provide high ethical and professional standards, adequate support personnel and technologically advanced equipment and facilities that meet the needs of those physicians, they may be discouraged from referring patients to our facilities and our results of operations may decline.
It may become difficult for us to attract and retain an adequate number of physicians to practice in certain of the non-urban communities in which our hospitals are located. Our failure to recruit physicians to these communities or the loss of physicians in these communities could make it more difficult to attract patients to our hospitals and thereby may have a material adverse effect on our business, financial condition and results of operations.
Generally, the top ten attending physicians within each of our facilities represent a large share of our inpatient revenues and admissions. The loss of one or more of these physicians, even if temporary, could cause a material reduction in our revenues, which could take significant time to replace given the difficulty and cost associated with recruiting and retaining physicians.
If we do not continually enhance our hospitals with the most recent technological advances in diagnostic and surgical equipment, our ability to maintain and expand our markets will be adversely affected.
The technology used in medical equipment and related devices is constantly evolving and, as a result, manufacturers and distributors continue to offer new and upgraded products to health care providers. To compete effectively, we must continually assess our equipment needs and upgrade when significant technological advances occur. If our facilities do not stay current with technological advances in the health care industry, patients may seek treatment from other providers and/or physicians may refer their patients to alternate sources, which could adversely affect our results of operations and harm our business.
If we fail to continue to meet the meaningful use criteria related to electronic health record systems (“EHR”), our operations could be harmed.
Pursuant to HITECH regulations, hospitals that did not qualify as a meaningful user of EHR by 2015 were subject to a reduced market basket update to the inpatient prospective payment system (“IPPS”) standardized amount in 2015 and each subsequent fiscal year. We believe that all of our acute care hospitals have met the applicable meaningful use criteria and therefore are not subject to a reduced market basked update to the IPPS standardized amount. However, under the HITECH Act, hospitals must continue to meet the applicable meaningful use criteria in each fiscal year or they will be subject to a market basket update reduction in a subsequent fiscal year. Failure of our acute care hospitals to continue to meet the applicable meaningful use criteria would have an adverse effect on our future net revenues and results of operations.
Our performance depends on our ability to attract and retain qualified nurses and medical support staff and we face competition for staffing that may increase our labor costs and harm our results of operations.
We depend on the efforts, abilities, and experience of our medical support personnel, including our nurses, pharmacists and lab technicians and other healthcare professionals. We compete with other healthcare providers in recruiting and retaining qualified hospital management, nurses and other medical personnel.
16
The nationwide shortage of nurses and other medical support personnel has been a significant operating issue facing us and other healthcare providers. This shortage may require us to enhance wages and benefits to recruit and retain nurses and other medical support personnel or require us to hire expensive temporary personnel. In addition, in some markets like California, there are requirements to maintain specified nurse-staffing levels. To the extent we cannot meet those levels, we may be required to limit the healthcare services provided in these markets, which would have a corresponding adverse effect on our net operating revenues.
We cannot predict the degree to which we will be affected by the future availability or cost of attracting and retaining talented medical support staff. If our general labor and related expenses increase, we may not be able to raise our rates correspondingly. Our failure to either recruit and retain qualified hospital management, nurses and other medical support personnel or control our labor costs could harm our results of operations.
Increased labor union activity is another factor that could adversely affect our labor costs. Union organizing activities and certain potential changes in federal labor laws and regulations could increase the likelihood of employee unionization in the future, to the extent a greater portion of our employee base unionized, it is possible our labor costs could increase materially.
If we fail to comply with extensive laws and government regulations, we could suffer civil or criminal penalties or be required to make significant changes to our operations that could reduce our revenue and profitability.
The healthcare industry is required to comply with extensive and complex laws and regulations at the federal, state and local government levels relating to, among other things: hospital billing practices and prices for services; relationships with physicians and other referral sources; adequacy of medical care and quality of medical equipment and services; ownership of facilities; qualifications of medical and support personnel; confidentiality, maintenance, privacy and security issues associated with health-related information and patient medical records; the screening, stabilization and transfer of patients who have emergency medical conditions; certification, licensure and accreditation of our facilities; operating policies and procedures, and; construction or expansion of facilities and services.
Among these laws are the federal False Claims Act, the Health Insurance Portability and Accountability Act of 1996, (“HIPAA”), the federal anti-kickback statute and the provision of the Social Security Act commonly known as the “Stark Law.” These laws, and particularly the anti-kickback statute and the Stark Law, impact the relationships that we may have with physicians and other referral sources. We have a variety of financial relationships with physicians who refer patients to our facilities, including employment contracts, leases and professional service agreements. We also provide financial incentives, including minimum revenue guarantees, to recruit physicians into communities served by our hospitals. The Office of the Inspector General of the Department of Health and Human Services, or OIG, has enacted safe harbor regulations that outline practices that are deemed protected from prosecution under the anti-kickback statute. A number of our current arrangements, including financial relationships with physicians and other referral sources, may not qualify for safe harbor protection under the anti-kickback statute. Failure to meet a safe harbor does not mean that the arrangement necessarily violates the anti-kickback statute, but may subject the arrangement to greater scrutiny. We cannot assure that practices that are outside of a safe harbor will not be found to violate the anti-kickback statute. CMS published a Medicare self-referral disclosure protocol, which is intended to allow providers to self-disclose actual or potential violations of the Stark law. Because there are only a few judicial decisions interpreting the Stark law, there can be no assurance that our hospitals will not be found in violation of the Stark Law or that self-disclosure of a potential violation would result in reduced penalties.
Federal regulations issued under HIPAA contain provisions that require us to implement and, in the future, may require us to implement additional costly electronic media security systems and to adopt new business practices designed to protect the privacy and security of each of our patient’s health and related financial information. Such privacy and security regulations impose extensive administrative, physical and technical requirements on us, restrict our use and disclosure of certain patient health and financial information, provide patients with rights with respect to their health information and require us to enter into contracts extending many of the privacy and security regulatory requirements to third parties that perform duties on our behalf. Additionally, recent changes to HIPAA regulations may result in greater compliance requirements, including obligations to report breaches of unsecured patient data, as well as create new liabilities for the actions of parties acting as business associates on our behalf.
These laws and regulations are extremely complex, and, in many cases, we do not have the benefit of regulatory or judicial interpretation. In the future, it is possible that different interpretations or enforcement of these laws and regulations could subject our current or past practices to allegations of impropriety or illegality or could require us to make changes in our facilities, equipment, personnel, services, capital expenditure programs and operating expenses. A determination that we have violated one or more of these laws (see Item 3—Legal Proceedings), or the public announcement that we are being investigated for possible violations of one or more of these laws, could have a material adverse effect on our business, financial condition or results of operations and our business reputation could suffer significantly. In addition, we cannot predict whether other legislation or regulations at the federal or state level will be adopted, what form such legislation or regulations may take or what their impact on us may be. See Item 1 Business—Self-Referral and Anti-Kickback Legislation.
17
If we are deemed to have failed to comply with the anti-kickback statute, the Stark Law or other applicable laws and regulations, we could be subjected to liabilities, including criminal penalties, civil penalties (including the loss of our licenses to operate one or more facilities), and exclusion of one or more facilities from participation in the Medicare, Medicaid and other federal and state healthcare programs. The imposition of such penalties could have a material adverse effect on our business, financial condition or results of operations.
We also operate health care facilities in the United Kingdom and have operations and commercial relationships with companies in other foreign jurisdictions and, as a result, are subject to certain U.S. and foreign laws applicable to businesses generally, including anti-corruption laws. The Foreign Corrupt Practices Act regulates U.S. companies in their dealings with foreign officials, prohibiting bribes and similar practices, and requires that they maintain records that fairly and accurately reflect transactions and appropriate internal accounting controls. In addition, the United Kingdom Bribery Act has wide jurisdiction over certain activities that affect the United Kingdom.
Our operations in the United Kingdom are also subject to a high level of regulation relating to registration and licensing requirements employee regulation, clinical standards, environmental rules as well as other areas. We are also subject to a highly regulated business environment, and failure to comply with the various laws and regulations, applicable to us could lead to substantial penalties, and other adverse effects on our business.
We are subject to occupational health, safety and other similar regulations and failure to comply with such regulations could harm our business and results of operations.
We are subject to a wide variety of federal, state and local occupational health and safety laws and regulations. Regulatory requirements affecting us include, but are not limited to, those covering: (i) air and water quality control; (ii) occupational health and safety (e.g., standards regarding blood-borne pathogens and ergonomics, etc.); (iii) waste management; (iv) the handling of asbestos, polychlorinated biphenyls and radioactive substances; and (v) other hazardous materials. If we fail to comply with those standards, we may be subject to sanctions and penalties that could harm our business and results of operations.
We may be subject to liabilities from claims brought against our facilities.
We are subject to medical malpractice lawsuits, product liability lawsuits, class action lawsuits and other legal actions in the ordinary course of business. Some of these actions may involve large claims, as well as significant defense costs. We cannot predict the outcome of these lawsuits or the effect that findings in such lawsuits may have on us. In an effort to resolve one or more of these matters, we may choose to negotiate a settlement. Amounts we pay to settle any of these matters may be material. All professional and general liability insurance we purchase is subject to policy limitations. We believe that, based on our past experience and actuarial estimates, our insurance coverage is adequate considering the claims arising from the operations of our hospitals. While we continuously monitor our coverage, our ultimate liability for professional and general liability claims could change materially from our current estimates. If such policy limitations should be partially or fully exhausted in the future, or payments of claims exceed our estimates or are not covered by our insurance, it could have a material adverse effect on our operations.
We may be subject to governmental investigations, regulatory actions and whistleblower lawsuits.
The federal False Claims Act permits private parties to bring qui tam, or whistleblower, lawsuits against companies. Whistleblower provisions allow private individuals to bring actions on behalf of the government alleging that the defendant has defrauded the federal government. These private parties are entitled to share in any amounts recovered by the government, and, as a result, the number of whistleblower lawsuits that have been filed against providers has increased significantly in recent years. Because qui tam lawsuits are filed under seal, we could be named in one or more such lawsuits of which we are not aware. Please see Item 3. Legal Proceedings for disclosure of current related matters.
The failure of certain employers, or the closure of certain facilities, could have a disproportionate impact on our hospitals.
The economies in the communities in which our hospitals operate are often dependent on a small number of large employers. Those employers often provide income and health insurance for a disproportionately large number of community residents who may depend on our hospitals and other health care facilities for their care. The failure of one or more large employer or the closure or substantial reduction in the number of individuals employed at facilities located in or near the communities where our hospitals operate, could cause affected employees to move elsewhere to seek employment or lose insurance coverage that was otherwise available to them. The occurrence of these events could adversely affect our revenue and results of operations, thereby harming our business.
18
If any of our existing health care facilities lose their accreditation or any of our new facilities fail to receive accreditation, such facilities could become ineligible to receive reimbursement under Medicare or Medicaid.
The construction and operation of healthcare facilities are subject to extensive federal, state and local regulation relating to, among other things, the adequacy of medical care, equipment, personnel, operating policies and procedures, fire prevention, rate-setting and compliance with building codes and environmental protection. Additionally, such facilities are subject to periodic inspection by government authorities to assure their continued compliance with these various standards.
All of our hospitals are deemed certified, meaning that they are accredited, properly licensed under the relevant state laws and regulations and certified under the Medicare program. The effect of maintaining certified facilities is to allow such facilities to participate in the Medicare and Medicaid programs. We believe that all of our healthcare facilities are in material compliance with applicable federal, state, local and other relevant regulations and standards. However, should any of our healthcare facilities lose their deemed certified status and thereby lose certification under the Medicare or Medicaid programs, such facilities would be unable to receive reimbursement from either of those programs and our business could be materially adversely effected.
Our growth strategy depends, in part, on acquisitions, and we may not be able to continue to acquire hospitals that meet our target criteria. We may also have difficulties acquiring hospitals from not-for-profit entities due to regulatory scrutiny.
Acquisitions of hospitals in select markets are a key element of our growth strategy. We face competition for acquisition candidates primarily from other for-profit healthcare companies, as well as from not-for-profit entities. Some of our competitors have greater resources than we do. Also, suitable acquisitions may not be accomplished due to unfavorable terms.
In addition, many states have enacted, or are considering enacting, laws that affect the conversion or sale of not-for-profit hospitals to for-profit entities. These laws generally require prior approval from the state attorney general, advance notification and community involvement. In addition, attorneys general in states without specific conversion legislation may exercise discretionary authority over such transactions. Although the level of government involvement varies from state to state, the trend is to provide for increased governmental review and, in some cases, approval of a transaction in which a not-for-profit entity sells a healthcare facility to a for-profit entity. The adoption of new or expanded conversion legislation, increased review of not-for-profit hospital conversions or our inability to effectively compete against other potential purchasers could make it more difficult for us to acquire additional hospitals, increase our acquisition costs or make it difficult for us to acquire hospitals that meet our target acquisition criteria, any of which could adversely affect our growth strategy and results of operations.
Further, the cost of an acquisition could result in a dilutive effect on our results of operations, depending on various factors, including the amount paid for the acquisition, the acquired hospital’s results of operations, allocation of the purchase price, effects of subsequent legislation and limits on rate increases.
We may fail to improve or integrate the operations of the hospitals we acquire, which could harm our results of operations and adversely affect our growth strategy.
We may be unable to timely and effectively integrate the hospitals that we acquire with our ongoing operations. We may experience delays in implementing operating procedures and systems in newly acquired hospitals. Integrating a new hospital could be expensive and time consuming and could disrupt our ongoing business, negatively affect cash flow and distract management and other key personnel. In addition, acquisition activity requires transitions from, and the integration of, operations and, usually, information systems that are used by acquired hospitals. In addition, some of the hospitals we acquire had significantly lower operating margins than the hospitals we operate prior to the time of our acquisition. If we fail to improve the operating margins of the hospitals we acquire, operate such hospitals profitably or effectively integrate the operations of acquired hospitals, our results of operations could be harmed.
The trend toward value-based purchasing may negatively impact our revenues.
We believe that value-based purchasing initiatives of both governmental and private payers tying financial incentives to quality and efficiency of care will increasingly affect the results of operations of our hospitals and other healthcare facilities and may negatively impact our revenues if we are unable to meet expected quality standards. The Affordable Care Act contains a number of provisions intended to promote value-based purchasing in federal healthcare programs. Medicare now requires providers to report certain quality measures in order to receive full reimbursement increases for inpatient and outpatient procedures that were previously awarded automatically. In addition, hospitals that meet or exceed certain quality performance standards will receive increased reimbursement payments, and hospitals that have “excess readmissions” for specified conditions will receive reduced reimbursement. Furthermore, Medicare no longer pays hospitals additional amounts for the treatment of certain hospital-acquired conditions unless the conditions were present at admission. Beginning in federal fiscal year 2015, hospitals that rank in the worst 25% of all hospitals nationally for hospital acquired conditions in the previous year were subject to reduced Medicare reimbursements. The ACA also
19
prohibits the use of federal funds under the Medicaid program to reimburse providers for treating certain provider-preventable conditions.
There is a trend among private payers toward value-based purchasing of healthcare services, as well. Many large commercial payers require hospitals to report quality data, and several of these payers will not reimburse hospitals for certain preventable adverse events. We expect value-based purchasing programs, including programs that condition reimbursement on patient outcome measures, to become more common and to involve a higher percentage of reimbursement amounts. We are unable at this time to predict how this trend will affect our results of operations, but it could negatively impact our revenues if we are unable to meet quality standards established by both governmental and private payers.
If we acquire hospitals with unknown or contingent liabilities, we could become liable for material obligations.
Hospitals that we acquire may have unknown or contingent liabilities, including, but not limited to, liabilities for failure to comply with applicable laws and regulations. Although we typically attempt to exclude significant liabilities from our acquisition transactions and seek indemnification from the sellers of such hospitals for these matters, we could experience difficulty enforcing those obligations or we could incur material liabilities for the past activities of hospitals we acquire. Such liabilities and related legal or other costs and/or resulting damage to a facility’s reputation could harm our business.
We are subject to pending legal actions, purported stockholder class actions, governmental investigations and regulatory actions.
We, our subsidiaries, PSI, and its subsidiaries, are subject to pending legal actions, governmental investigations and regulatory actions (see Item 3-Legal Proceedings).
Defending ourselves against the allegations in the lawsuits and governmental investigations, or similar matters and any related publicity, could potentially entail significant costs and could require significant attention from our management. We are unable to predict the outcome of these matters or to reasonably estimate the amount or range of any such loss; however, these lawsuits could have a material adverse effect on our business, financial condition, results of operations and/or cash flows.
We are and may become subject to other loss contingencies, both known and unknown, which may relate to past, present and future facts, events, circumstances and occurrences. Should an unfavorable outcome occur in some or all of our legal proceedings or other loss contingencies, or if successful claims and other actions are brought against us in the future, there could be a material adverse impact on our financial position, results of operations and liquidity.
In particular, government investigations, as well as qui tam lawsuits, may lead to material fines, penalties, damages payments or other sanctions, including exclusion from government healthcare programs. Settlements of lawsuits involving Medicare and Medicaid issues routinely require both monetary payments and corporate integrity agreements, each of which could have a material adverse effect on our business, financial condition, results of operations and/or cash flows.
State efforts to regulate the construction or expansion of health care facilities could impair our ability to expand.
Many of the states in which we operate hospitals have enacted Certificates of Need, or (“CON”), laws as a condition prior to hospital capital expenditures, construction, expansion, modernization or initiation of major new services. Our failure to obtain necessary state approval could result in our inability to complete a particular hospital acquisition, expansion or replacement, make a facility ineligible to receive reimbursement under the Medicare or Medicaid programs, result in the revocation of a facility’s license or impose civil or criminal penalties on us, any of which could harm our business.
In addition, significant CON reforms have been proposed in a number of states that would increase the capital spending thresholds and provide exemptions of various services from review requirements. In the past, we have not experienced any material adverse effects from those requirements, but we cannot predict the impact of these changes upon our operations.
Controls designed to reduce inpatient services may reduce our revenues.
Controls imposed by third-party payors designed to reduce admissions and lengths of stay, commonly referred to as “utilization review,” have affected and are expected to continue to affect our facilities. Utilization review entails the review of the admission and course of treatment of a patient by managed care plans. Inpatient utilization, average lengths of stay and occupancy rates continue to be negatively affected by payor-required preadmission authorization and utilization review and by payor pressure to maximize outpatient and alternative healthcare delivery services for less acutely ill patients. Efforts to impose more stringent cost controls are expected to continue. Although we cannot predict the effect these changes will have on our operations, significant limits on the scope
20
of services reimbursed and on reimbursement rates and fees could have a material adverse effect on our business, financial position and results of operations.
Our revenues and volume trends may be adversely affected by certain factors over which we have no control.
Our revenues and volume trends are dependent on many factors, including physicians’ clinical decisions and availability, payor programs shifting to a more outpatient-based environment, whether or not certain services are offered, seasonal and severe weather conditions, including the effects of extreme low temperatures, hurricanes and tornados, earthquakes, current local economic and demographic changes. In addition, technological developments and pharmaceutical improvements may reduce the demand for healthcare services or the profitability of the services we offer.
A pandemic, epidemic or outbreak of a contagious disease in the markets in which we operate or that otherwise impacts our facilities could adversely impact our business.
If a pandemic or other public health crisis were to affect our markets, our business could be adversely affected. Such a crisis could diminish the public trust in healthcare facilities, especially hospitals that fail to accurately or timely diagnose, or that are treating (or have treated) patients affected by contagious diseases. If any of our facilities were involved in treating patients for such a contagious disease, other patients might cancel elective procedures or fail to seek needed care at our facilities. Further, a pandemic might adversely impact our business by causing a temporary shutdown or diversion of patients, by disrupting or delaying production and delivery of materials and products in the supply chain or by causing staffing shortages in our facilities. Although we have disaster plans in place and operate pursuant to infectious disease protocols, the potential impact of a pandemic, epidemic or outbreak of a contagious disease with respect to our markets or our facilities is difficult to predict and could adversely impact our business.
A worsening of the economic and employment conditions in the United States could materially affect our business and future results of operations.
Our patient volumes, revenues and financial results depend significantly on the universe of patients with health insurance, which to a large extent is dependent on the employment status of individuals in our markets. Worsening of economic conditions may result in a higher unemployment rate which may increase the number of individuals without health insurance. As a result, our facilities may experience a decrease in patient volumes, particularly in less intense, more elective service lines, or an increase in services provided to uninsured patients. These factors could have a material unfavorable impact on our future patient volumes, revenues and operating results.
In addition, as of December 31, 2017, we had approximately $3.8 billion of goodwill recorded on our consolidated balance sheet. Should the revenues and financial results of our acute care and/or behavioral health care facilities be materially, unfavorably impacted due to, among other things, a worsening of the economic and employment conditions in the United States that could negatively impact our patient volumes and reimbursement rates, a continued rise in the unemployment rate and continued increases in the number of uninsured patients treated at our facilities, we may incur future charges to recognize impairment in the carrying value of our goodwill and other intangible assets, which could have a material adverse effect on our financial results.
Legal uncertainty or a worsening of the economic conditions in the United Kingdom could materially affect our business and future results of operations.
On June 23, 2016, the United Kingdom affirmatively voted in a non-binding referendum in favor of the exit of the United Kingdom from the European Union (the “Brexit”) and it has been approved by vote of the British legislature. On March 29, 2017, the United Kingdom triggered Article 50 of the Lisbon Treaty formally starting negotiations regarding its exit from the European Union. The United Kingdom has two years from that date to complete these negotiations. The future relationship between the United Kingdom and the European Union remains uncertain, including the terms of trade between the United Kingdom and the European Union. The effects of Brexit will depend on any agreements the United Kingdom makes to retain access to European Union markets either during a transitional period or more permanently. Brexit could lead to legal and regulatory uncertainty as the United Kingdom determines which European Union laws to replace or replicate.
The announcement of Brexit also created (and the actual exit of the United Kingdom from the European Union may create future) economic uncertainty, both in the United Kingdom and globally. The actual exit of the United Kingdom from the European Union could cause disruptions to and create uncertainty surrounding our business. Any of these effects of Brexit (and the announcement thereof), and others we cannot anticipate, could harm our business, financial condition or results of operations.
21
Fluctuations in our operating results, quarter to quarter earnings and other factors may result in decreases in the price of our common stock.
The stock markets have experienced volatility that has often been unrelated to operating performance. These broad market fluctuations may adversely affect the trading price of our common stock and, as a result, there may be significant volatility in the market price of our common stock. If we are unable to operate our hospitals as profitably as we have in the past or as our stockholders expect us to in the future, the market price of our common stock will likely decline as stockholders could sell shares of our common stock when it becomes apparent that the market expectations may not be realized.
In addition to our operating results, many economic and seasonal factors outside of our control could have an adverse effect on the price of our common stock and increase fluctuations in our quarterly earnings. These factors include certain of the risks discussed herein, demographic changes, operating results of other hospital companies, changes in our financial estimates or recommendations of securities analysts, speculation in the press or investment community, the possible effects of war, terrorist and other hostilities, adverse weather conditions, the level of seasonal illnesses, managed care contract negotiations and terminations, changes in general conditions in the economy or the financial markets, or other developments affecting the health care industry.
Our financial results may be adversely affected by fluctuations in foreign currency exchange rates.
We are exposed to currency exchange risk with respect to the U.S. Dollar in relation to the Pound sterling, because a portion of our revenue and expenses are denominated in Pounds. We monitor changes in our exposure to exchange rate risk. While we may elect to enter into hedging arrangements to protect our business against certain currency fluctuations, these hedging arrangements do not provide comprehensive protection, and our results of operations could be adversely affected by foreign exchange fluctuations.
We are subject to significant corporate regulation as a public company and failure to comply with all applicable regulations could subject us to liability or negatively affect our stock price.
As a publicly traded company, we are subject to a significant body of regulation, including the Sarbanes-Oxley Act of 2002. While we have developed and instituted a corporate compliance program based on what we believe are the current best practices in corporate governance and continue to update this program in response to newly implemented or changing regulatory requirements, we cannot provide assurance that we are or will be in compliance with all potentially applicable corporate regulations. For example, we cannot provide assurance that, in the future, our management will not find a material weakness in connection with its annual review of our internal control over financial reporting pursuant to Section 404 of the Sarbanes-Oxley Act. We also cannot provide assurance that we could correct any such weakness to allow our management to assess the effectiveness of our internal control over financial reporting as of the end of our fiscal year in time to enable our independent registered public accounting firm to state that such assessment will have been fairly stated in our Annual Report on Form 10-K or state that we have maintained effective internal control over financial reporting as of the end of our fiscal year. If we fail to comply with any of these regulations, we could be subject to a range of regulatory actions, fines or other sanctions or litigation. If we must disclose any material weakness in our internal control over financial reporting, our stock price could decline.
A cyber security incident could cause a violation of HIPAA, breach of member privacy, or other negative impacts.
We rely extensively on our information technology (“IT”) systems to manage clinical and financial data, communicate with our patients, payors, vendors and other third parties and summarize and analyze operating results. In addition, we have made significant investments in technology to adopt and utilize electronic health records and to become meaningful users of health information technology pursuant to the American Recovery and Reinvestment Act of 2009. A cyber-attack that bypasses our IT security systems causing an IT security breach, loss of protected health information or other data subject to privacy laws, loss of proprietary business information, or a material disruption of our IT business systems, could have a material adverse impact on our business and result of operations. In addition, our future results of operations, as well as our reputation, could be adversely impacted by theft, destruction, loss, or misappropriation of public health information, other confidential data or proprietary business information.
Different interpretations of accounting principles could have a material adverse effect on our results of operations or financial condition.
Generally accepted accounting principles are complex, continually evolving and may be subject to varied interpretation by us, our independent registered public accounting firm and the SEC. Such varied interpretations could result from differing views related to specific facts and circumstances. Differences in interpretation of generally accepted accounting principles could have a material adverse effect on our financial position or results of operations.
22
We continue to see rising costs in construction materials and labor. Such increased costs could have an adverse effect on the cash flow return on investment relating to our capital projects.
The cost of construction materials and labor has significantly increased. As we continue to invest in modern technologies, emergency rooms and operating room expansions, the construction of medical office buildings for physician expansion and reconfiguring the flow of patient care, we spend large amounts of money generated from our operating cash flow or borrowed funds. Although we evaluate the financial feasibility of such projects by determining whether the projected cash flow return on investment exceeds our cost of capital, such returns may not be achieved if the cost of construction continues to rise significantly or the expected patient volumes are not attained.
The deterioration of credit and capital markets may adversely affect our access to sources of funding and we cannot be certain of the availability and terms of capital to fund the growth of our business when needed.
We require substantial capital resources to fund our acquisition growth strategy and our ongoing capital expenditure programs for renovation, expansion, construction and addition of medical equipment and technology. We believe that our capital expenditure program is adequate to expand, improve and equip our existing hospitals. We cannot predict, however, whether financing for our growth plans and capital expenditure programs will be available to us on satisfactory terms when needed, which could harm our business.
To fund all or a portion of our future financing needs, we rely on borrowings from various sources including fixed rate, long-term debt as well as borrowings pursuant to our revolving credit facility and accounts receivable securitization program. If any of the lenders were unable to fulfill their future commitments, our liquidity could be impacted, which could have a material unfavorable impact our results of operations and financial condition.
In addition, global capital markets have experienced volatility that has tightened access to capital markets and other sources of funding. In the event we need to access the capital markets or other sources of financing, there can be no assurance that we will be able to obtain financing on acceptable terms or within an acceptable time. Our inability to obtain financing on terms acceptable to us could have a material unfavorable impact on our results of operations, financial condition and liquidity.
We depend heavily on key management personnel and the departure of one or more of our key executives or a significant portion of our local hospital management personnel could harm our business.
The expertise and efforts of our senior executives and key members of our local hospital management personnel are critical to the success of our business. The loss of the services of one or more of our senior executives or of a significant portion of our local hospital management personnel could significantly undermine our management expertise and our ability to provide efficient, quality healthcare services at our facilities, which could harm our business.
The number of outstanding shares of our Class B Common Stock is subject to potential increases or decreases.
At December 31, 2017, 26.1 million shares of Class B Common Stock were reserved for issuance upon conversion of shares of Class A, C and D Common Stock outstanding, for issuance upon exercise of options to purchase Class B Common Stock and for issuance of stock under other incentive plans. Class A, C and D Common Stock are convertible on a share for share basis into Class B Common Stock. To the extent that these shares were converted into or exercised for shares of Class B Common Stock, the number of shares of Class B Common Stock available for trading in the public market place would increase substantially and the current holders of Class B Common Stock would own a smaller percentage of that class.
In addition, from time-to-time our Board of Directors approve stock repurchase programs authorizing us to purchase shares of our Class B Common Stock on the open market at prevailing market prices or in negotiated transactions off the market. Such repurchases decrease the number of outstanding shares of our Class B Common Stock. Conversely, as a potential means of generating additional funds to operate and expand our business, we may from time-to-time issue equity through the sale of stock which would increase the number of outstanding shares of our Class B Common Stock. Based upon factors such as, but not limited to, the market price of our stock, interest rate on borrowings and uses or potential uses for cash, repurchase or issuance of our stock could have a dilutive effect on our future basic and diluted earnings per share.
23
The right to elect the majority of our Board of Directors and the majority of the general shareholder voting power resides with the holders of Class A and C Common Stock, the majority of which is owned by Alan B. Miller, our Chief Executive Officer and Chairman of our Board of Directors.
Our Restated Certificate of Incorporation provides that, with respect to the election of directors, holders of Class A Common Stock vote as a class with the holders of Class C Common Stock, and holders of Class B Common Stock vote as a class with holders of Class D Common Stock, with holders of all classes of our Common Stock entitled to one vote per share.
As of March 21, 2017, the shares of Class A and Class C Common Stock constituted 7.5% of the aggregate outstanding shares of our Common Stock, had the right to elect five members of the Board of Directors and constituted 86.5% of our general voting power as of that date. As of March 21, 2017, the shares of Class B and Class D Common Stock (excluding shares issuable upon exercise of options) constituted 92.5% of the outstanding shares of our Common Stock, had the right to elect two members of the Board of Directors and constituted 13.5% of our general voting power as of that date.
As to matters other than the election of directors, our Restated Certificate of Incorporation provides that holders of Class A, Class B, Class C and Class D Common Stock all vote together as a single class, except as otherwise provided by law.
Each share of Class A Common Stock entitles the holder thereof to one vote; each share of Class B Common Stock entitles the holder thereof to one-tenth of a vote; each share of Class C Common Stock entitles the holder thereof to 100 votes (provided the holder of Class C Common Stock holds a number of shares of Class A Common Stock equal to ten times the number of shares of Class C Common Stock that holder holds); and each share of Class D Common Stock entitles the holder thereof to ten votes (provided the holder of Class D Common Stock holds a number of shares of Class B Common Stock equal to ten times the number of shares of Class D Common Stock that holder holds).
In the event a holder of Class C or Class D Common Stock holds a number of shares of Class A or Class B Common Stock, respectively, less than ten times the number of shares of Class C or Class D Common Stock that holder holds, then that holder will be entitled to only one vote for every share of Class C Common Stock, or one-tenth of a vote for every share of Class D Common Stock, which that holder holds in excess of one-tenth the number of shares of Class A or Class B Common Stock, respectively, held by that holder. The Board of Directors, in its discretion, may require beneficial owners to provide satisfactory evidence that such owner holds ten times as many shares of Class A or Class B Common Stock as Class C or Class D Common Stock, respectively, if such facts are not apparent from our stock records.
Since a substantial majority of the Class A shares and Class C shares are controlled by Mr. Alan B. Miller and members of his family, one of whom (Marc D. Miller) is also a director and officer of our company, and they can elect a majority of our company’s directors and effect or reject most actions requiring approval by stockholders without the vote of any other stockholders, there are potential conflicts of interest in overseeing the management of our company.
In addition, because this concentrated control could discourage others from initiating any potential merger, takeover or other change of control transaction that may otherwise be beneficial to our businesses, our business and prospects and the trading price of our securities could be adversely affected.
None.
Executive and Administrative Offices and Commercial Health Insurer
We own various office buildings in King of Prussia and Wayne, Pennsylvania, Brentwood, Tennessee, Denton, Texas and Reno, Nevada.
24
The following tables set forth the name, location, type of facility and, for acute care hospitals and behavioral health care facilities, the number of licensed beds:
Acute Care Hospitals
|
|
|
|
|
|
Name of Facility
|
Location
|
Number of
|
Real
|
|
Aiken Regional Medical Centers |
Aiken, South Carolina |
197 |
Owned |
|
Aurora Pavilion |
Aiken, South Carolina |
62 |
Owned |
|
Centennial Hills Hospital Medical Center |
Las Vegas, Nevada |
250 |
Owned |
|
Corona Regional Medical Center |
Corona, California |
238 |
Owned |
|
Desert Springs Hospital |
Las Vegas, Nevada |
293 |
Owned |
|
Desert View Hospital |
Pahrump, Nevada |
25 |
Owned |
|
Doctors’ Hospital of Laredo (7) |
Laredo, Texas |
183 |
Owned |
|
Doctor’s Hospital ER South |
Laredo, Texas |
— |
Leased |
|
Fort Duncan Regional Medical Center |
Eagle Pass, Texas |
101 |
Owned |
|
The George Washington University Hospital (1) |
Washington, D.C. |
385 |
Leased |
|
Henderson Hospital |
Henderson, Nevada |
130 |
Owned |
|
Lakewood Ranch Medical Center |
Bradenton, Florida |
120 |
Owned |
|
Manatee Memorial Hospital |
Bradenton, Florida |
295 |
Owned |
|
Northern Nevada Medical Center |
Sparks, Nevada |
108 |
Owned |
|
Northwest Texas Healthcare System |
Amarillo, Texas |
405 |
Owned |
|
The Pavilion at Northwest Texas Healthcare System |
Amarillo, Texas |
90 |
Owned |
|
NWTH FED |
Amarillo, Texas |
— |
Owned |
|
Palmdale Regional Medical Center |
Palmdale, California |
184 |
Owned |
|
South Texas Health System (3) |
|
|
|
|
Edinburg Regional Medical Center/Children’s Hospital |
Edinburg, Texas |
235 |
Owned |
|
McAllen Medical Center (2) |
McAllen, Texas |
441 |
Leased |
|
McAllen Heart Hospital |
McAllen, Texas |
60 |
Owned |
|
South Texas Behavioral Health Center |
McAllen, Texas |
134 |
Owned |
|
STHS ER at Mission |
Mission, Texas |
— |
Leased |
|
STHS ER at Weslaco |
Weslaco, Texas |
— |
Leased |
|
Southwest Healthcare System |
|
|
|
|
Inland Valley Campus (2) |
Wildomar, California |
130 |
Leased |
|
Rancho Springs Campus |
Murrieta, California |
120 |
Owned |
|
Spring Valley Hospital Medical Center |
Las Vegas, Nevada |
292 |
Owned |
|
St. Mary’s Regional Medical Center |
Enid, Oklahoma |
229 |
Owned |
|
Summerlin Hospital Medical Center |
Las Vegas, Nevada |
454 |
Owned |
|
Temecula Valley Hospital |
Temecula, California |
140 |
Owned |
|
Texoma Medical Center |
Denison, Texas |
266 |
Owned |
|
TMC Behavioral Health Center |
Denison, Texas |
60 |
Owned |
|
Valley Hospital Medical Center |
Las Vegas, Nevada |
301 |
Owned |
|
Wellington Regional Medical Center (2) |
West Palm Beach, Florida |
233 |
Leased |
Inpatient Behavioral Health Care Facilities
|
United States: |
|
|
|
|
Name of Facility
|
Location
|
Number of
|
Real
|
|
Alabama Clinical Schools |
Birmingham, Alabama |
80 |
Owned |
|
Alhambra Hospital |
Rosemead, California |
109 |
Owned |
|
Alliance Health Center |
Meridian, Mississippi |
214 |
Owned |
25
|
United States: |
|
|
|
|
Name of Facility
|
Location
|
Number of
|
Real
|
|
Boston, Massachusetts |
136 |
Owned |
|
|
Arbour-Fuller Hospital |
South Attleboro, Massachusetts |
102 |
Owned |
|
Arbour-HRI Hospital |
Brookline, Massachusetts |
62 |
Owned |
|
Arrowhead Behavioral Health |
Maumee, Ohio |
48 |
Owned |
|
Austin Lakes Hospital |
Austin, Texas |
58 |
Leased |
|
Austin Oaks Hospitals |
Austin, Texas |
80 |
Owned |
|
Behavioral Hospital of Bellaire |
Houston, Texas |
124 |
Leased |
|
Belmont Pines Hospital |
Youngstown, Ohio |
102 |
Owned |
|
Benchmark Behavioral Health System |
Woods Cross, Utah |
94 |
Owned |
|
Black Bear Treatment Center |
Sautee, Georgia |
115 |
Owned |
|
Bloomington Meadows Hospital |
Bloomington, Indiana |
78 |
Owned |
|
Boulder Creek Academy |
Bonners Ferry, Idaho |
105 |
Owned |
|
Brentwood Behavioral Health of Mississippi |
Flowood, Mississippi |
121 |
Owned |
|
Brentwood Hospital |
Shreveport, Louisiana |
200 |
Owned |
|
The Bridgeway |
North Little Rock, Arkansas |
127 |
Owned |
|
Brook Hospital—Dupont |
Louisville, Kentucky |
88 |
Owned |
|
Brook Hospital—KMI |
Louisville, Kentucky |
110 |
Owned |
|
Brooke Glen Behavioral Hospital |
Fort Washington, Pennsylvania |
146 |
Owned |
|
Brynn Marr Hospital |
Jacksonville, North Carolina |
102 |
Owned |
|
Calvary Addiction Recovery Center |
Phoenix, Arizona |
68 |
Owned |
|
The Canyon at Peace Park |
Malibu, California |
16 |
Leased |
|
Canyon Ridge Hospital |
Chino, California |
106 |
Owned |
|
The Carolina Center for Behavioral Health |
Greer, South Carolina |
130 |
Owned |
|
Cedar Creek |
St. Johns, Michigan |
34 |
Owned |
|
Cedar Grove Residential Treatment Center |
Murfreesboro, Tennessee |
40 |
Owned |
|
Cedar Hills Hospital (8) |
Beaverton, Oregon |
94 |
Owned |
|
Cedar Ridge |
Oklahoma City, Oklahoma |
60 |
Owned |
|
Cedar Ridge Residential Treatment Center |
Oklahoma City, Oklahoma |
56 |
Owned |
|
Cedar Ridge Bethany |
Bethany, Oklahoma |
56 |
Owned |
|
Cedar Springs Behavioral Health |
Colorado Springs, Colorado |
110 |
Owned |
|
Centennial Peaks (8) |
Louisville, Colorado |
104 |
Owned |
|
Center for Change |
Orem, Utah |
58 |
Owned |
|
Central Florida Behavioral Hospital |
Orlando, Florida |
126 |
Owned |
|
Chicago Children’s Center for Behavioral Health |
Chicago, Illinois |
40 |
Leased |
|
Chris Kyle Patriots Hospital |
Anchorage, Alaska |
36 |
Owned |
|
Clarion Psychiatric Center |
Clarion, Pennsylvania |
76 |
Owned |
|
Coastal Behavioral Health |
Savannah, Georgia |
50 |
Owned |
|
Coastal Harbor Treatment Center |
Savannah, Georgia |
145 |
Owned |
|
Columbus Behavioral Center for Children and Adolescents |
Columbus, Indiana |
57 |
Owned |
|
Compass Intervention Center |
Memphis, Tennessee |
108 |
Owned |
|
Copper Hills Youth Center |
West Jordan, Utah |
197 |
Owned |
|
Coral Shores |
Stuart, Florida |
80 |
Owned |
|
Cumberland Hall |
Hopkinsville, Kentucky |
97 |
Owned |
|
Cumberland Hospital |
New Kent, Virginia |
118 |
Owned |
|
Cypress Creek Hospital |
Houston, Texas |
128 |
Owned |
|
Del Amo Hospital |
Torrance, California |
166 |
Owned |
|
Diamond Grove Center |
Louisville, Mississippi |
55 |
Owned |
|
Dover Behavioral Health |
Dover, Delaware |
88 |
Owned |
|
El Paso Behavioral Health System |
El Paso, Texas |
163 |
Owned |
|
Emerald Coast Behavioral Hospital |
Panama City, Florida |
86 |
Owned |
|
Fairmount Behavioral Health System |
Philadelphia, Pennsylvania |
239 |
Owned |
26
|
United States: |
|
|
|
|
Name of Facility
|
Location
|
Number of
|
Real
|
|
|
|
|
|
|
Fairfax Hospital |
Kirkland, Washington |
157 |
Owned |
|
Fairfax Hospital—Everett |
Everett, Washington |
30 |
Leased |
|
Fairfax Hospital—Monroe |
Monroe, Washington |
34 |
Leased |
|
Forest View Hospital |
Grand Rapids, Michigan |
108 |
Owned |
|
Fort Lauderdale Hospital |
Fort Lauderdale, Florida |
100 |
Leased |
|
Foundations Behavioral Health |
Doylestown, Pennsylvania |
108 |
Leased |
|
Foundations for Living |
Mansfield, Ohio |
84 |
Owned |
|
Fox Run Hospital |
St. Clairsville, Ohio |
100 |
Owned |
|
Fremont Hospital |
Fremont, California |
148 |
Owned |
|
Friends Hospital |
Philadelphia, Pennsylvania |
219 |
Owned |
|
Garfield Park Hospital |
Chicago, Illinois |
88 |
Owned |
|
Garland Behavioral Health |
Garland, Texas |
72 |
Leased |
|
Glen Oaks Hospital |
Greenville, Texas |
54 |
Owned |
|
Gulf Coast Youth Services |
Fort Walton Beach, Florida |
24 |
Owned |
|
Gulfport Behavioral Health System |
Gulfport, Mississippi |
109 |
Owned |
|
Hampton Behavioral Health Center |
Westhampton, New Jersey |
120 |
Owned |
|
Harbour Point (Pines) |
Portsmouth, Virginia |
186 |
Owned |
|
Hartgrove Hospital |
Chicago, Illinois |
160 |
Owned |
|
Havenwyck Hospital |
Auburn Hills, Michigan |
243 |
Owned |
|
Heartland Behavioral Health Services |
Nevada, Missouri |
151 |
Owned |
|
Hermitage Hall |
Nashville, Tennessee |
100 |
Owned |
|
Heritage Oaks Hospital |
Sacramento, California |
125 |
Owned |
|
Hickory Trail Hospital |
DeSoto, Texas |
86 |
Owned |
|
Highlands Behavioral Health System |
Highlands Ranch, Colorado |
86 |
Owned |
|
Hill Crest Behavioral Health Services |
Birmingham, Alabama |
219 |
Owned |
|
Holly Hill Hospital |
Raleigh, North Carolina |
228 |
Owned |
|
The Horsham Clinic |
Ambler, Pennsylvania |
206 |
Owned |
|
Hughes Center |
Danville, Virginia |
56 |
Owned |
|
Intermountain Hospital |
Boise, Idaho |
155 |
Owned |
|
Kempsville Center of Behavioral Health |
Norfolk, Virginia |
82 |
Owned |
|
KeyStone Center |
Wallingford, Pennsylvania |
153 |
Owned |
|
Kingwood Pines Hospital |
Kingwood, Texas |
116 |
Owned |
|
La Amistad Behavioral Health Services |
Maitland, Florida |
85 |
Owned |
|
Lakeside Behavioral Health System |
Memphis, Tennessee |
345 |
Owned |
|
Laurel Heights Hospital |
Atlanta, Georgia |
108 |
Owned |
|
Laurel Oaks Behavioral Health Center |
Dothan, Alabama |
124 |
Owned |
|
Laurel Ridge Treatment Center |
San Antonio, Texas |
250 |
Owned |
|
Liberty Point Behavioral Health |
Stauton, Virginia |
56 |
Owned |
|
Lighthouse Care Center of Augusta |
Augusta, Georgia |
115 |
Owned |
|
Lighthouse Care Center of Conway |
Conway, South Carolina |
87 |
Owned |
|
Lincoln Prairie Behavioral Health Center |
Springfield, Illinois |
97 |
Owned |
|
Lincoln Trail Behavioral Health System |
Radcliff, Kentucky |
140 |
Owned |
|
Mayhill Hospital |
Denton, Texas |
59 |
Leased |
|
McDowell Center for Children |
Dyersburg, Tennessee |
32 |
Owned |
|
The Meadows Psychiatric Center |
Centre Hall, Pennsylvania |
117 |
Owned |
|
Meridell Achievement Center |
Austin, Texas |
134 |
Owned |
|
Mesilla Valley Hospital |
Las Cruces, New Mexico |
120 |
Owned |
|
Michael’s House |
Palm Springs, California |
87 |
Owned |
|
Michiana Behavioral Health Center |
Plymouth, Indiana |
80 |
Owned |
|
Midwest Center for Youth and Families |
Kouts, Indiana |
74 |
Owned |
27
|
United States: |
|
|
|
|
Name of Facility
|
Location
|
Number of
|
Real
|
|
Arlington, Texas |
128 |
Leased |
|
|
Mountain Youth Academy |
Mountain City, Tennessee |
90 |
Owned |
|
Natchez Trace Youth Academy |
Waverly, Tennessee |
115 |
Owned |
|
Newport News Behavioral Health Center |
Newport News, Virginia |
132 |
Owned |
|
North Spring Behavioral Healthcare |
Leesburg, Virginia |
103 |
Leased |
|
North Star Hospital |
Anchorage, Alaska |
74 |
Owned |
|
North Star Bragaw |
Anchorage, Alaska |
30 |
Owned |
|
North Star DeBarr Residential Treatment Center |
Anchorage, Alaska |
30 |
Owned |
|
North Star Palmer Residential Treatment Center |
Palmer, Alaska |
30 |
Owned |
|
Northwest Academy |
Bonners Perry, Idaho |
102 |
Owned |
|
Oak Plains Academy |
Ashland City, Tennessee |
90 |
Owned |
|
The Oaks Treatment Center |
Memphis, Tennessee |
71 |
Owned |
|
Okaloosa Youth Academy |
Crestview, Florida |
75 |
Leased |
|
Old Vineyard Behavioral Health |
Winston-Salem, North Carolina |
164 |
Owned |
|
Palmetto Lowcountry Behavioral Health |
North Charleston, South Carolina |
108 |
Owned |
|
Palmetto Pee Dee Behavioral Health |
Florence, South Carolina |
59 |
Leased |
|
Palmetto Summerville |
Summerville, South Carolina |
64 |
Leased |
|
Palm Shores Behavioral Health Center |
Bradenton, Florida |
64 |
Owned |
|
Palo Verde Behavioral Health |
Tucson, Arizona |
84 |
Leased |
|
Parkwood Behavioral Health System |
Olive Branch, Mississippi |
148 |
Owned |
|
The Pavilion |
Champaign, Illinois |
106 |
Owned |
|
Peachford Behavioral Health System of Atlanta |
Atlanta, Georgia |
246 |
Owned |
|
Pembroke Hospital |
Pembroke, Massachusetts |
120 |
Owned |
|
Pinnacle Pointe Hospital |
Little Rock, Arkansas |
124 |
Owned |
|
Poplar Springs Hospital |
Petersburg, Virginia |
208 |
Owned |
|
Prairie St John’s |
Fargo, North Dakota |
158 |
Owned |
|
Pride Institute |
Eden Prairie, Minnesota |
42 |
Owned |
|
Provo Canyon School |
Provo, Utah |
274 |
Owned |
|
Provo Canyon Behavioral Hospital |
Orem, Utah |
80 |
Owned |
|
Psychiatric Institute of Washington |
Washington, D.C. |
130 |
Owned |
|
Quail Run Behavioral Health |
Phoenix, Arizona |
102 |
Owned |
|
The Recovery Center |
Wichita Falls, Texas |
34 |
Leased |
|
The Ridge Behavioral Health System |
Lexington, Kentucky |
110 |
Owned |
|
Rivendell Behavioral Health Services of Arkansas |
Benton, Arkansas |
80 |
Owned |
|
Rivendell Behavioral Health Services of Kentucky |
Bowling Green, Kentucky |
125 |
Owned |
|
River Crest Hospital |
San Angelo, Texas |
80 |
Owned |
|
Riveredge Hospital |
Forest Park, Illinois |
210 |
Owned |
|
River Oaks Hospital |
New Orleans, Louisiana |
126 |
Owned |
|
River Park Hospital |
Huntington, West Virginia |
187 |
Owned |
|
River Point Behavioral Health |
Jacksonville, Florida |
84 |
Owned |
|
Rockford Center |
Newark, Delaware |
128 |
Owned |
|
Rolling Hills Hospital |
Franklin, Tennessee |
130 |
Owned |
|
Roxbury |
Shippensburg, Pennsylvania |
112 |
Owned |
|
Salt Lake Behavioral Health |
Salt Lake City, Utah |
118 |
Leased |
|
San Marcos Treatment Center |
San Marcos, Texas |
265 |
Owned |
|
Sandy Pines Hospital |
Tequesta, Florida |
140 |
Owned |
|
Schick Shadel Hospital |
Burin, Washington |
60 |
Owned |
|
Shadow Mountain Behavioral Health System |
Tulsa, Oklahoma |
249 |
Owned |
|
Sierra Vista Hospital |
Sacramento, California |
171 |
Owned |
|
Southern Crescent Behavioral Health |
|
|
|
|
Anchor Hospital |
Atlanta, Georgia |
122 |
Owned |
28
|
United States: |
|
|
|
|
Name of Facility
|
Location
|
Number of
|
Real
|
|
Stockbridge, Georgia |
50 |
Owned |
|
|
St. Simons by the Sea |
St. Simons, Georgia |
101 |
Owned |
|
Skywood Recovery |
Augusta, Michigan |
100 |
Owned |
|
Spring Mountain Sahara |
Las Vegas, Nevada |
30 |
Owned |
|
Spring Mountain Treatment Center |
Las Vegas, Nevada |
110 |
Owned |
|
Springwoods |
Fayetteville, Arkansas |
80 |
Owned |
|
Stonington Institute |
North Stonington, Connecticut |
68 |
Owned |
|
Streamwood Behavioral Health |
Streamwood, Illinois |
178 |
Owned |
|
Summit Oaks Hospital |
Summit, New Jersey |
126 |
Owned |
|
SummitRidge |
Lawrenceville, Georgia |
96 |
Owned |
|
Suncoast Behavioral Health Center |
Bradenton, Florida |
60 |
Owned |
|
Texas NeuroRehab Center |
Austin, Texas |
151 |
Owned |
|
Three Rivers Behavioral Health |
West Columbia, South Carolina |
122 |
Owned |
|
Three Rivers Residential Treatment-Midlands Campus |
West Columbia, South Carolina |
64 |
Owned |
|
Turning Point Hospital |
Moultrie, Georgia |
69 |
Owned |
|
Two Rivers Psychiatric Hospital |
Kansas City, Missouri |
105 |
Owned |
|
University Behavioral Center |
Orlando, Florida |
112 |
Owned |
|
University Behavioral Health of Denton |
Denton, Texas |
104 |
Owned |
|
Valle Vista Hospital |
Greenwood, Indiana |
132 |
Owned |
|
Valley Hospital |
Phoenix, Arizona |
122 |
Owned |
|
The Vines Hospital |
Ocala, Florida |
98 |
Owned |
|
Virginia Beach Psychiatric Center |
Virginia Beach, Virginia |
100 |
Owned |
|
Wekiva Springs |
Jacksonville, Florida |
120 |
Owned |
|
Wellstone Regional Hospital |
Jeffersonville, Indiana |
100 |
Owned |
|
West Hills Hospital |
Reno, Nevada |
95 |
Owned |
|
West Oaks Hospital |
Houston, Texas |
160 |
Owned |
|
Willow Springs Center |
Reno, Nevada |
116 |
Owned |
|
Windmoor Healthcare |
Clearwater, Florida |
144 |
Owned |
|
Windsor—Laurelwood Center |
Willoughby, Ohio |
159 |
Leased |
|
Wyoming Behavioral Institute |
Casper, Wyoming |
129 |
Owned |
|
United Kingdom: |
|
|
|
|
Name of Facility
|
Location
|
Number of
|
Real
|
|
Acer Clinic (9) |
Chestherfield, UK |
14 |
Owned |
|
Acer Clinic 2 (9) |
Chestherfield, UK |
14 |
Owned |
|
Amberwood Lodge (9) |
Dorset, UK |
9 |
Owned |
|
Ashfield House (9) |
Huddersfield, UK |
6 |
Owned |
|
Aspen House (9) |
South Yorkshire, UK |
20 |
Owned |
|
Aspen Lodge (9) |
Rotherham, UK |
16 |
Owned |
|
Beacon Lower (9) |
Bradford, UK |
8 |
Owned |
|
Beacon Upper (9) |
Bradford, UK |
8 |
Owned |
|
Beckly House (9) |
Halifax, UK |
12 |
Owned |
|
Bury Hospital |
Bury, UK |
167 |
Owned |
|
Broughton House (9) |
Lincolnshire, UK |
34 |
Owned |
|
Broughton Lodge (9) |
Cheshire, UK |
20 |
Owned |
|
Cambian Alders (9) |
Gloucester, UK |
20 |
Owned |
|
Cambian Ansel Clinic (9) |
Nottingham, UK |
24 |
Owned |
|
Cambian Appletree (9) |
Durham, UK |
26 |
Owned |
|
Cambian Beeches (9) |
Nottinghamshire, UK |
12 |
Owned |
29
|
United Kingdom: |
|
|
|
|
Name of Facility
|
Location
|
Number of
|
Real
|
|
Notts, UK |
6 |
Owned |
|
|
Cambian Cedars (9) |
Birmingham, UK |
24 |
Owned |
|
Cambian Churchill (9) |
London, UK |
57 |
Owned |
|
Cambian Conifers (9) |
Derby, UK |
7 |
Owned |
|
Cambian Elms (9) |
Birmingham, UK |
10 |
Owned |
|
Cambian Grange (9) |
Nottinghamshire, UK |
8 |
Owned |
|
Cambian Heathers (9) |
West Bromwich, UK |
20 |
Owned |
|
Cambian Lodge (9) |
Nottinghamshire, UK |
8 |
Owned |
|
Cambian Manor (9) |
Central Drive, UK |
20 |
Owned |
|
Cambian Nightingale (9) |
Dorset, UK |
10 |
Owned |
|
Cambian Oaks (9) |
Barnsley, UK |
36 |
Owned |
|
Cambian Pines (9) |
Woodhouse, UK |
7 |
Owned |
|
Cambian Views (9) |
Matlock, UK |
10 |
Owned |
|
Cambian Woodside (9) |
Bradford, UK |
9 |
Owned |
|
CAS Brunel (9) |
Henbury, UK |
32 |
Owned |
|
Chaseways |
Sawbridgeworth, UK |
6 |
Owned |
|
Cherry Court (9) |
Essex, UK |
11 |
Owned |
|
Coventry |
Coventry, UK |
56 |
Owned |
|
Cygnet Hospital—Beckton |
Beckton, UK |
62 |
Owned |
|
Cygnet Hospital—Bierley |
Bierley, UK |
63 |
Owned |
|
Cygnet Wing—Blackheath |
Blackheath, UK |
32 |
Leased |
|
Cygnet Lodge—Brighouse |
Brighouse, UK |
25 |
Owned |
|
Cygnet Hospital—Derby |
Derby, UK |
50 |
Owned |
|
Cygnet Hospital—Ealing |
Ealing, UK |
26 |
Owned |
|
Cygnet Hospital—Godden Green |
Godden Green, UK |
39 |
Owned |
|
Cygnet Hospital—Harrogate |
Harrogate, UK |
36 |
Owned |
|
Cygnet Hospital—Harrow |
Harrow, UK |
61 |
Owned |
|
Cygnet Hospital—Kewstoke |
Kewstoke, UK |
72 |
Owned |
|
Cygnet Lodge—Lewisham |
Lewisham, UK |
17 |
Owned |
|
Cygnet Hospital—Stevenage |
Stevenage, UK |
88 |
Owned |
|
Cygnet Hospital—Taunton |
Taunton, UK |
46 |
Owned |
|
Cygnet Lodge – Kenton |
Westlands, UK |
15 |
Owned |
|
Cygnet Hospital—Wyke |
Wyke, UK |
56 |
Owned |
|
Cygnet Lodge – Woking |
Knaphill, UK |
29 |
Owned |
|
Delfryn House (9) |
Flintshire, UK |
28 |
Owned |
|
Delfryn Lodge (9) |
Flintshire, UK |
24 |
Owned |
|
Dene Brook (9) |
Dalton Parva, UK |
13 |
Owned |
|
Devon Lodge (9) |
Southampton, UK |
12 |
Owned |
|
Eleni House (9) |
Essex, UK |
8 |
Owned |
|
Elm Court (9) |
Essex, UK |
10 |
Owned |
|
Elston House (9) |
Nottinghamshire, UK |
8 |
Owned |
|
Fairways (9) |
Suffolk, UK |
8 |
Owned |
|
Farm Lodge |
Rainham, UK |
5 |
Owned |
|
The Fields (9) |
Sheffield, UK |
54 |
Owned |
|
The Fountains (9) |
Blackburn, UK |
32 |
Owned |
|
The Gables (9) |
Essex, UK |
7 |
Owned |
|
Gledcliffe Road (9) |
Huddersfield, UK |
6 |
Owned |
|
Gledholt (9) |
Huddersfield, UK |
9 |
Owned |
|
Hawkstone (9) |
Utley, UK |
10 |
Owned |
|
Kirkside House (9) |
Leeds, UK |
7 |
Owned |
|
Kirkside Lodge (9) |
Leeds, UK |
8 |
Owned |
30
|
United Kingdom: |
|
|
|
|
Name of Facility
|
Location
|
Number of
|
Real
|
|
Huddersfield, UK |
8 |
Owned |
|
|
Langdale Coach House (9) |
Huddersfield, UK |
3 |
Owned |
|
Larch Court (9) |
Essex, UK |
4 |
Owned |
|
Laurel Court (9) |
Essex, UK |
11 |
Owned |
|
The Limes (9) |
Nottinghamshire, UK |
18 |
Owned |
|
Limes Houses (9) |
Nottinghamshire, UK |
6 |
Owned |
|
Longfield House (9) |
Bradford, UK |
9 |
Owned |
|
Lowry House (9) |
Hyde, UK |
12 |
Owned |
|
Meadows Mews (9) |
Tipton, UK |
10 |
Owned |
|
Norcott House (9) |
Liversedge, UK |
11 |
Owned |
|
Norcott Lodge (9) |
Liversedge, UK |
9 |
Owned |
|
Oak Court (9) |
Essex, UK |
12 |
Owned |
|
Oakhurst Lodge (9) |
Hampshire, UK |
8 |
Owned |
|
The Outwood (9) |
Leeds, UK |
10 |
Owned |
|
Oxley Lodge (9) |
Huddersfield, UK |
4 |
Owned |
|
Oxley Woodhouse (9) |
Huddersfield, UK |
13 |
Owned |
|
Portland Road 45 (9) |
Edgbaston, UK |
4 |
Leased |
|
Raglan House (9) |
West Midlands, UK |
25 |
Owned |
|
Redwood Court (9) |
Essex, UK |
9 |
Owned |
|
Rhyd Alyn (9) |
Flintshire, UK |
6 |
Owned |
|
Sedgley House (9) |
Wolverhampton, UK |
20 |
Owned |
|
Sedgley Lodge (9) |
Wolverhampton, UK |
14 |
Owned |
|
Shear Meadow (9) |
Hemel Hempstead, UK |
4 |
Owned |
|
Sheffield Hospital |
Sheffield, UK |
55 |
Owned |
|
Sherwood House (9) |
Mansfield, UK |
30 |
Owned |
|
Sherwood Lodge (9) |
Mansfield, UK |
18 |
Owned |
|
Sherwood Lodge Step Down (9) |
Mansfield, UK |
8 |
Owned |
|
The Squirrels (9) |
Hampshire, UK |
9 |
Owned |
|
St. Augustine's (9) |
Stoke on Trent, UK |
32 |
Owned |
|
St. Teilo House (9) |
Gwent, UK |
23 |
Owned |
|
Storthfields (9) |
Derby, UK |
22 |
Owned |
|
Sycamore Court (9) |
Essex, UK |
6 |
Owned |
|
The Sycamores (9) |
Derbyshire, UK |
6 |
Owned |
|
Tabley Nursing Home—Tabley |
Tabley, UK |
51 |
Leased |
|
Thornfield House (9) |
Bradford, UK |
7 |
Owned |
|
Tupwood Gate Nursing Home |
Caterham, UK |
30 |
Owned |
|
Victoria House (9) |
Durham, UK |
32 |
Owned |
|
Vincent Court (9) |
Lancashire, UK |
5 |
Owned |
|
Walkern Lodge (9) |
Stevenage, UK |
4 |
Owned |
|
Woking Hospital |
Woking, UK |
57 |
Owned |
|
Woodcross Street (9) |
Wolverhampton, UK |
8 |
Owned |
31
|
Puerto Rico and Virgin Islands: |
|
|
|
|
Name of Facility
|
Location
|
Number of
|
Real
|
|
First Hospital Panamericano—Cidra |
Cidra, Puerto Rico |
165 |
Owned |
|
First Hospital Panamericano—San Juan |
San Juan, Puerto Rico |
45 |
Owned |
|
First Hospital Panamericano—Ponce |
Ponce, Puerto Rico |
30 |
Owned |
|
Virgin Islands Behavioral Services |
St. Croix, Virgin Islands |
30 |
Owned |
Outpatient Behavioral Health Care Facilities
|
United States: |
|
|
|
Name of Facility
|
Location
|
Real
|
|
Arbour Counseling Services |
Rockland, Massachusetts |
Owned |
|
Arbour Senior Care |
Rockland, Massachusetts |
Owned |
|
Behavioral Educational Services |
Riverdale, Florida |
Leased |
|
The Canyon at Santa Monica |
Santa Monica, California |
Leased |
|
First Home Care (PA) |
Philadelphia, PA |
Leased |
|
First Home Care (VA) |
Portsmouth, Virginia |
Leased |
|
Foundations Atlanta |
Atlanta, Georgia |
Leased |
|
Foundations Chicago |
Chicago, Illinois |
Leased |
|
Foundations Detroit |
Bingham Farms, Michigan |
Leased |
|
Foundations Los Angeles |
Los Angeles, California |
Leased |
|
Foundations Memphis |
Memphis, Tennessee |
Leased |
|
Foundations Nashville |
Nashville, Tennessee |
Leased |
|
Foundations Roswell |
Roswell, Georgia |
Leased |
|
Foundations San Diego |
San Diego, California |
Leased |
|
Foundations San Francisco |
San Francisco, California |
Leased |
|
Good Samaritan Counseling Center |
Anchorage, Alaska |
Owned |
|
Michael’s House Outpatient |
Palm Springs, California |
Leased |
|
The Point |
Arkansas |
Leased |
|
St. Louis Behavioral Medicine Institute |
St. Louis, Missouri |
Owned |
|
Talbott Recovery |
Atlanta, Georgia |
Owned |
|
United Kingdom: |
|
|
|
Name of Facility
|
Location
|
Real
|
|
Long Eaton Day Services (9) |
Nottingham, UK |
Owned |
|
Sheffield Day Services (9) |
Sheffield, UK |
Owned |
|
Puerto Rico and Virgin Islands: |
|
|
|
Name of Facility
|
Location
|
Real
|
|
Community Cornerstones |
Rio Piedras, Puerto Rico |
Leased |
|
Surgical Hospitals, Ambulatory Surgery Centers and Radiation Oncology Centers |
||
32
|
|
Location
|
Real
|
|
Cancer Care Institute of Carolina |
Aiken, South Carolina |
Owned |
|
Cornerstone Regional Hospital (4) |
Edinburg, Texas |
Leased |
|
Palms Westside Clinic ASC (6) |
Royal Palm Beach, Florida |
Leased |
|
Quail Surgical and Pain Management Center |
Reno, Nevada |
Leased |
|
Temecula Valley Day Surgery and Pain Therapy Center (5) |
Murrieta, California |
Leased |
|
(1) |
We hold an 80% ownership interest in this facility through a general partnership interest in a limited partnership. The remaining 20% ownership interest is held by an unaffiliated third-party which leases the property to the partnership for nominal rent. The term of the partnership is scheduled to expire in July, 2047, and we have five, five-year extension options. The term of the lease is coterminous with the partnership term with a fair market value rental of the property during the extension term. |
|
(2) |
Real property leased from Universal Health Realty Income Trust. |
|
(3) |
Edinburg Regional Medical Center/Children’s Hospital, McAllen Medical Center, McAllen Heart Hospital, South Texas Behavioral Health Center, STHS ER at Mission and STHS ER at Weslaco are consolidated under one license operating as the South Texas Health System. |
|
(4) |
We manage and own a noncontrolling interest of approximately 50% in the entity that operates this facility. |
|
(5) |
We own minority interests in an LLC that owns and operates this center which is managed by us. |
|
(6) |
We own a noncontrolling ownership interest of approximately 50% in the entity that operates this facility that is managed by a third-party. |
|
(7) |
We hold an 89% ownership interest in this facility through both general and limited partnership interests. The remaining 11% ownership interest is held by unaffiliated third parties. |
|
(8) |
Land of this facility is leased. |
|
(9) |
These facilities were acquired in late December, 2016, upon our completion of the acquisition of Cambian Group, PLC’s adult services’ division (the “Cambian Adult Services”). At the time of acquisition, the Cambian Adult Services consisted of 79 inpatient and 2 outpatient behavioral health facilities located in the U.K. The Competition and Markets Authority (“CMA”) in the U.K. reviewed our acquisition of the Cambian Adult Services. In April, 2017, the CMA notified us that they identified potential competition concerns in certain markets and announced its decision to refer our acquisition of Cambian Group, PLC’s Adult Services division for a Phase 2 investigation. In October, 2017, the CMA provided the final ruling regarding the Phase 2 investigation requiring us to divest a facility which was subsequently designated to be The Limes, an 18-bed facility which generates less than $1 million in annual income before income taxes. |
We own or lease medical office buildings adjoining some of our hospitals. We believe that the leases on the facilities, medical office buildings and other real estate leased or owned by us do not impose any material limitation on our operations. The aggregate lease payments on facilities leased by us were $80 million in 2017, $74 million in 2016 and $69 million in 2015.
We operate in a highly regulated and litigious industry which subjects us to various claims and lawsuits in the ordinary course of business as well as regulatory proceedings and government investigations. These claims or suits include claims for damages for personal injuries, medical malpractice, commercial/contractual disputes, wrongful restriction of, or interference with, physicians’ staff privileges, and employment related claims. In addition, health care companies are subject to investigations and/or actions by various state and federal governmental agencies or those bringing claims on their behalf. Government action has increased with respect to investigations and/or allegations against healthcare providers concerning possible violations of fraud and abuse and false claims statutes as well as compliance with clinical and operational regulations. Currently, and from time to time, we and some of our facilities are subjected to inquiries in the form of subpoenas, Civil Investigative Demands, audits and other document requests from various federal and state agencies. These inquiries can lead to notices and/or actions including repayment obligations from state and federal government agencies associated with potential non-compliance with laws and regulations. Further, the federal False Claim Act allows private individuals to bring lawsuits (qui tam actions) against healthcare providers that submit claims for payments to the government. Various states have also adopted similar statutes. When such a claim is filed, the government will investigate the matter and decide if they are going to intervene in the pending case. These qui tam lawsuits are placed under seal by the court to comply with the False Claims Act’s requirements. If the government chooses not to intervene, the private individual(s) can proceed independently on behalf of the government. Health care providers that are found to violate the False Claims Act may be subject to substantial monetary fines/penalties as well as face potential exclusion from participating in government health care programs or be required to comply with Corporate Integrity Agreements as a condition of a settlement of a False Claim Act matter. In September 2014, the Criminal Division of the Department of Justice (“DOJ”) announced that all qui tam cases will be shared with their Division to determine if a parallel criminal investigation should be opened. The DOJ has also announced an intention to pursue civil and criminal actions against individuals within a company as well as the corporate entity or entities. In addition, health care facilities are subject to monitoring by
33
state and federal surveyors to ensure compliance with program Conditions of Participation. In the event a facility is found to be out of compliance with a Condition of Participation and unable to remedy the alleged deficiency(s), the facility faces termination from the Medicare and Medicaid programs or compliance with a System Improvement Agreement to remedy deficiencies and ensure compliance.
The laws and regulations governing the healthcare industry are complex covering, among other things, government healthcare participation requirements, licensure, certification and accreditation, privacy of patient information, reimbursement for patient services as well as fraud and abuse compliance. These laws and regulations are constantly evolving and expanding. Further, the Affordable Care Act has added additional obligations on healthcare providers to report and refund overpayments by government healthcare programs and authorizes the suspension of Medicare and Medicaid payments “pending an investigation of a credible allegation of fraud.” We monitor our business and have developed an ethics and compliance program with respect to these complex laws, rules and regulations. Although we believe our policies, procedures and practices comply with government regulations, there is no assurance that we will not be faced with the sanctions referenced above which include fines, penalties and/or substantial damages, repayment obligations, payment suspensions, licensure revocation, and expulsion from government healthcare programs. Even if we were to ultimately prevail in any action brought against us or our facilities or in responding to any inquiry, such action or inquiry could have a material adverse effect on us.
Certain legal matters are described below:
Government Investigations:
UHS Behavioral Health
In February, 2013, the Office of Inspector General for the United States Department of Health and Human Services (“OIG”) served a subpoena requesting various documents from January, 2008 to the date of the subpoena directed at Universal Health Services, Inc. (“UHS”) concerning it and UHS of Delaware, Inc., and certain UHS owned behavioral health facilities including: Keys of Carolina, Old Vineyard Behavioral Health, The Meadows Psychiatric Center, Streamwood Behavioral Health, Hartgrove Hospital, Rock River Academy and Residential Treatment Center, Roxbury Treatment Center, Harbor Point Behavioral Health Center, f/k/a The Pines Residential Treatment Center, including the Crawford, Brighton and Kempsville campuses, Wekiva Springs Center and River Point Behavioral Health. Prior to receipt of this subpoena, some of these facilities had received independent subpoenas from state or federal agencies. Subsequent to the February 2013 subpoenas, some of the facilities above have received additional, specific subpoenas or other document and information requests. In addition to the OIG, the DOJ and various U.S. Attorneys’ and state Attorneys’ General Offices are also involved in this matter. Since February 2013, additional facilities have also received subpoenas and/or document and information requests or we have been notified are included in the omnibus investigation. Those facilities include: National Deaf Academy, Arbour-HRI Hospital, Behavioral Hospital of Bellaire, St. Simons By the Sea, Turning Point Care Center, Salt Lake Behavioral Health, Central Florida Behavioral Hospital, University Behavioral Center, Arbour Hospital, Arbour-Fuller Hospital, Pembroke Hospital, Westwood Lodge, Coastal Harbor Health System, Shadow Mountain Behavioral Health, Cedar Hills Hospital, Mayhill Hospital, Southern Crescent Behavioral Health (Anchor Hospital and Crescent Pines campuses), Valley Hospital (AZ), Peachford Behavioral Health System of Atlanta, University Behavioral Health of Denton, and El Paso Behavioral Health System.
In October, 2013, we were advised that the DOJ’s Criminal Frauds Section had opened an investigation of River Point Behavioral Health and Wekiva Springs Center. Since that time, we have been notified that the Criminal Frauds section has opened investigations of National Deaf Academy, Hartgrove Hospital and UHS as a corporate entity. In April 2017, the DOJ’s Criminal Division issued a subpoena requesting documentation from Shadow Mountain Behavioral Health. In August 2017, Kempsville Center of Behavioral Health (a part of Harbor Point Behavioral Health previously identified above) received a subpoena requesting documentation.
In April, 2014, the Centers for Medicare and Medicaid Services (“CMS”) instituted a Medicare payment suspension at River Point Behavioral Health in accordance with federal regulations regarding suspension of payments during certain investigations. The Florida Agency for Health Care Administration (“AHCA”) subsequently issued a Medicaid payment suspension for the facility. River Point Behavioral Health submitted a rebuttal statement disputing the basis of the suspension and requesting revocation of the suspension. Notwithstanding, CMS continued the payment suspension. River Point Behavioral Health provided additional information to CMS in an effort to obtain relief from the payment suspension but the Medicare suspension remains in effect. In June 2017, AHCA advised that while they were maintaining the suspension for dual eligible and cross-over Medicare beneficiaries, the Medicaid payment suspension was lifted effective June 27, 2017. We cannot predict if and/or when the facility’s remaining suspended payments will resume in total. From inception through December 31, 2017, the aggregate funds withheld from us in connection with the River Point Behavioral Health payment suspension amounted to approximately $10 million. Although the operating results of River Point Behavioral Health did not have a material impact on our consolidated results of operations during 2017, 2016 or 2015, the payment suspension has had a material adverse effect on the facility’s results of operations and financial condition.
The DOJ has advised us that the civil aspect of the coordinated investigation referenced above is a False Claims Act investigation focused on billings submitted to government payers in relation to services provided at those facilities. Based upon our initial discussions with the DOJ, our financial statements as of December 31, 2017 include a $22 million reserve established in
34
connection with the civil aspects of these matters. However, changes in the reserve may be required in future periods as discussions continue and additional information becomes available. We cannot predict the ultimate resolution of these matters and therefore can provide no assurance that final amounts paid in settlement or otherwise, if any, or associated costs, will not differ materially from our established reserve.
Litigation:
U.S. ex rel Escobar v. Universal Health Services, Inc. et.al.
This is a False Claims Act case filed against Universal Health Services, Inc., UHS of Delaware, Inc. and HRI Clinics, Inc. d/b/a Arbour Counseling Services in U.S. District Court for the District of Massachusetts. This qui tam action primarily alleges that Arbour Counseling Services failed to appropriately supervise certain clinical providers in contravention of regulatory requirements and the submission of claims to Medicaid were subsequently improper. Relators make other claims of improper billing to Medicaid associated with alleged failures of Arbour Counseling to comply with state regulations. The U.S. Attorney’s Office and the Massachusetts Attorney General’s Office initially declined to intervene. UHS filed a motion to dismiss and the trial court originally granted the motion dismissing the case. The First Circuit Court of Appeals (“First Circuit”) reversed the trial court’s dismissal of the case. The United States Supreme Court subsequently vacated the First Circuit’s opinion and remanded the case for further consideration under the new legal standards established by the Supreme Court for False Claims Act cases. During the 4th quarter of 2016, the First Circuit issued a revised opinion upholding their reversal of the trial court’s dismissal. The case was then remanded to the trial court for further proceedings. In January 2017, the U.S. Attorney’s Office and Massachusetts Attorney General’s Office advised of the potential for intervention in the case. The Massachusetts Attorney General’s Office subsequently filed its motion to intervene which was granted and, in April 2017, filed their Complaint in Intervention. We are defending this case vigorously. At this time, we are uncertain as to potential liability or financial exposure, if any, which may be associated with this matter.
Shareholder Class Action
In December 2016 a purported shareholder class action lawsuit was filed in U.S. District Court for the Central District of California against UHS, and certain UHS officers alleging violations of the federal securities laws. Plaintiff alleges that defendants violated federal securities laws relating to the disclosures made in public filings associated with practices at our behavioral health facilities. The case was originally filed as Heed v. Universal Health Services, Inc. et. al. (Case No. 2:16-CV-09499-PSG-JC). The court subsequently appointed Teamsters Local 456 Pension Fund and Teamsters Local 456 Annuity Fund to serve as lead plaintiffs. The case has been transferred to the U.S. District Court for the Eastern District of Pennsylvania and the style of the case has been changed to Teamsters Local 456 Pension Fund, et. al. v. Universal Health Services, Inc. et. al. (Case No. 2:17-CV-02817-LS). In September, 2017, Teamsters Local 456 Pension Fund filed an amended complaint. In December 2017, we filed a motion to dismiss the amended complaint. We deny liability and intend to defend ourselves vigorously. At this time, we are uncertain as to potential liability or financial exposure, if any, which may be associated with this matter.
Shareholder Derivative Cases
In March 2017, a shareholder derivative suit was filed by plaintiff David Heed in the Court of Common Pleas of Philadelphia County. A notice of removal to the United States District Court for the Eastern District of Pennsylvania was filed (Case No. 2:17-cv-01476-LS). Plaintiff filed a motion to remand. In December 2017, the Court denied plaintiff’s motion to remand and has retained the case in federal court. The suit alleges breaches of fiduciary duties and other allegedly wrongful conduct by the members of the Board of Directors and certain officers of Universal Health Services, Inc. relating to practices at our behavioral health facilities. UHS has been named as a nominal defendant in the case. In May, June and July 2017, additional shareholder derivative suits were filed in the United States District Court for the Eastern District of Pennsylvania. The plaintiffs in those cases are: Central Laborers’ Pension Fund (Case No. 17-cv-02187-LS); Firemen’s Retirement System of St. Louis (Case No. 17—cv-02317-LS); Waterford Township Police & Fire Retirement System (Case No. 17-cv-02595-LS); and Amalgamated Bank Longview Funds (Case No. 17-cv-03404-LS). The Fireman’s Retirement System case has since been voluntarily dismissed. In addition, a shareholder derivative case was filed in Chancery Court in Delaware by the Delaware County Employees’ Retirement Fund (Case No. 2017-0475-JTL). In December 2017, the Chancery Court stayed this case pending resolution of other contemporaneous matters. These additional cases make substantially similar allegations and claims based upon alleged violations of federal securities laws as well common law causes of action against the individual defendants. All of these additional cases have also named all members of the UHS Board of Directors as well as certain officers of the Company. The defendants deny liability and intend to defend these cases vigorously. At this time, we are uncertain as to potential liability or financial exposure, if any, which may be associated with these matters.
Chowdary v. Universal Health Services, Inc., et. al.
This is a lawsuit filed in 1999 in state court in Hidalgo County, Texas by a physician and his professional associations alleging tortious interference with contractual relationships and retaliation against McAllen Medical Center in McAllen, Texas as well as Universal Health Services, Inc. The state court has entered a summary judgment order awarding plaintiff $3.85 million in damages. With prejudgment interest, the total amount of the order amounts to approximately $9 million, for which a reserve is included in our financial statements as of December 31, 2017. A trial on punitive damages, emotional distress and attorneys’ fees remains to be conducted if the summary judgment order is not vacated. The case has been removed to federal court. Plaintiffs filed a motion to
35
remand. In February 2018, the federal court denied plaintiffs’ motion to remand and retained the case in federal court. Plaintiffs have filed a writ of mandamus with the 5th Circuit Court of Appeals seeking to overturn the federal court’s decision denying remand. We have filed a motion for reconsideration of state court’s summary judgment order in the federal court proceeding.
Disproportionate Share Hospital Payment Matter:
In late September, 2015, many hospitals in Pennsylvania, including seven of our behavioral health care hospitals located in the state, received letters from the Pennsylvania Department of Human Services (the “Department”) demanding repayment of allegedly excess Medicaid Disproportionate Share Hospital payments (“DSH”) for the federal fiscal year 2011 (“FFY2011”) amounting to approximately $4 million in the aggregate. Since that time, we have received similar requests for repayment for alleged DSH overpayments for FFYs 2012 and 2013 aggregating to approximately $11 million. We filed administrative appeals for all of our facilities contesting the recoupment efforts for FFYs 2011 through 2013 as we believe the Department’s calculation methodology is inaccurate and conflicts with applicable federal and state laws and regulations. The Department has agreed to postpone the recoupment of the state’s share of the DSH payments until all hospital appeals are resolved but started recoupment of the federal share. The Department will likely make similar repayment demand for FFY 2014. Due to a change in the Pennsylvania Medicaid State Plan and implementation of a CMS-approved Medicaid Section 1115 Waiver, we do not believe the methodology applied by the Department to FFYs 2011 through 2013 is applicable to reimbursements received for Medicaid services provided after January 1, 2015 by our behavioral health care facilities located in Pennsylvania. We can provide no assurance that we will ultimately be successful in our legal and administrative appeals related to the Department’s repayment demands. If our legal and administrative appeals are unsuccessful, our future consolidated results of operations and financial condition could be adversely impacted by these repayments.
Matters Relating to Psychiatric Solutions, Inc. (“PSI”):
The following matters pertain to PSI or former PSI facilities (owned by subsidiaries of PSI) which were in existence prior to the acquisition of PSI and for which we have assumed the defense as a result of our acquisition which was completed in November, 2010:
Department of Justice Investigation of Riveredge Hospital
In 2008, Riveredge Hospital in Chicago, Illinois received a subpoena from the DOJ requesting certain information from the facility. Additional requests for documents were also received from the DOJ in 2009 and 2010. The requested documents have been provided to the DOJ. All documents requested and produced pertained to the operations of the facility while under PSI’s ownership prior to our acquisition. At present, we are uncertain as to the focus, scope or extent of the investigation, liability of the facility and/or potential financial exposure, if any, in connection with this matter.
Department of Justice Investigation of Friends Hospital
In October, 2010, Friends Hospital in Philadelphia, Pennsylvania, received a subpoena from the DOJ requesting certain documents from the facility. The requested documents were collected and provided to the DOJ for review and examination. Another subpoena was issued to the facility in July, 2011 requesting additional documents, which have also been delivered to the DOJ. All documents requested and produced pertained to the operations of the facility while under PSI’s ownership prior to our acquisition. At present, we are uncertain as to the focus, scope or extent of the investigation, liability of the facility and/or potential financial exposure, if any, in connection with this matter.
Other Matters:
Various other suits, claims and investigations, including government subpoenas, arising against, or issued to, us are pending and additional such matters may arise in the future. Management will consider additional disclosure from time to time to the extent it believes such matters may be or become material. The outcome of any current or future litigation or governmental or internal investigations, including the matters described above, cannot be accurately predicted, nor can we predict any resulting penalties, fines or other sanctions that may be imposed at the discretion of federal or state regulatory authorities. We record accruals for such contingencies to the extent that we conclude it is probable that a liability has been incurred and the amount of the loss can be reasonably estimated. No estimate of the possible loss or range of loss in excess of amounts accrued, if any, can be made at this time regarding the matters described above or that are otherwise pending because the inherently unpredictable nature of legal proceedings may be exacerbated by various factors, including, but not limited to: (i) the damages sought in the proceedings are unsubstantiated or indeterminate; (ii) discovery is not complete; (iii) the matter is in its early stages; (iv) the matters present legal uncertainties; (v) there are significant facts in dispute; (vi) there are a large number of parties, or; (vii) there is a wide range of potential outcomes. It is possible that the outcome of these matters could have a material adverse impact on our future results of operations, financial position, cash flows and, potentially, our reputation.
Not applicable.
36
|
ITEM 5. |
Market for Registrant’s Common Equity, Related Stockholder Matters and Issuer Purchases of Equity Securities |
Our Class B Common Stock is traded on the New York Stock Exchange. Shares of our Class A, Class C and Class D Common Stock are not traded in any public market, but are each convertible into shares of our Class B Common Stock on a share-for-share basis.
The table below sets forth, for the quarters indicated, the high and low reported closing sales prices per share reported on the New York Stock Exchange for our Class B Common Stock for the years ended December 31, 2017 and 2016:
|
|
|
2017 |
|
2016 |
|
|
|
High-Low Sales Price |
|
High-Low Sales Price |
|
Quarter: |
|
|
|
|
|
1st |
|
$126.65-$106.71 |
|
$125.33-$101.65 |
|
2nd |
|
$125.07-$112.33 |
|
$138.74-$121.74 |
|
3rd |
|
$125.00-$105.37 |
|
$138.28-$118.82 |
|
4th |
|
$115.06-$95.77 |
|
$128.06-$101.55 |
The number of stockholders of record as of January 31, 2017, were as follows:
|
Class A Common |
|
|
16 |
|
|
Class B Common |
|
|
222 |
|
|
Class C Common |
|
|
3 |
|
|
Class D Common |
|
|
102 |
|
Stock Repurchase Programs
In July, 2014, our Board of Directors authorized a stock repurchase program whereby, from time to time as conditions allow, we may spend up to $400 million to purchase shares of our Class B Common Stock on the open market at prevailing market prices or in negotiated private transactions. In February, 2016, our Board of Directors authorized a $400 million increase to our stock repurchase program, which increased the aggregate authorization to $800 million from the previous $400 million mentioned above. In November, 2017, our Board of Directors authorized an additional $400 million increase to our stock repurchase program, which increased the aggregate authorization to $1.2 billion from the previous $800 million authorization approved in 2016 and 2014 as mentioned above. There is no expiration date for our stock repurchase programs. As reflected below, during the three-month period ended December 31, 2017, we have repurchased approximately 1.0 million shares at an aggregate cost of approximately $100.8 million pursuant to the terms of our stock repurchase program. In addition, 193,806 shares were repurchased in connection with income tax withholding obligations resulting from the exercise of stock options and the vesting of restricted stock grants.
During the period of October 1, 2017 through December 31, 2017, we repurchased the following shares:
|
|
|
Additional Dollars Authorized For Repurchase (in thousands) |
|
|
Total number of shares purchased |
|
|
Total number of shares cancelled |
|
|
Average price paid per share for forfeited restricted shares |
|
|
Total Number of shares purchased as part of publicly announced programs |
|
|
Average price paid per share for shares purchased as part of publicly announced program |
|
|
Aggregate purchase price paid (in thousands) |
|
|
Maximum number of dollars that may yet be purchased under the program (in thousands) |
|
||||||||
|
October, 2017 |
|
|
— |
|
|
|
63,009 |
|
|
|
— |
|
|
N/A |
|
|
|
60,000 |
|
|
$ |
102.27 |
|
|
$ |
6,136 |
|
|
$ |
58,305 |
|
|
|
November, 2017 |
|
$ |
400,000 |
|
|
|
877,923 |
|
|
|
— |
|
|
N/A |
|
|
|
778,482 |
|
|
$ |
99.10 |
|
|
$ |
77,147 |
|
|
$ |
381,158 |
|
|
|
December, 2017 |
|
|
— |
|
|
|
255,869 |
|
|
|
4,666 |
|
|
$ |
0.01 |
|
|
|
164,513 |
|
|
$ |
106.36 |
|
|
$ |
17,498 |
|
|
$ |
363,660 |
|
|
Total October through December |
|
$ |
400,000 |
|
|
|
1,196,801 |
|
|
|
4,666 |
|
|
$ |
0.01 |
|
|
|
1,002,995 |
|
|
$ |
100.48 |
|
|
$ |
100,781 |
|
|
|
|
|
37
During the two years ending December 31, 2017, dividends per share were declared and paid as follows:
|
|
|
2017 |
|
|
2016 |
|
||
|
First quarter |
|
$ |
.10 |
|
|
$ |
.10 |
|
|
Second quarter |
|
$ |
.10 |
|
|
$ |
.10 |
|
|
Third quarter |
|
$ |
.10 |
|
|
$ |
.10 |
|
|
Fourth quarter |
|
$ |
.10 |
|
|
$ |
.10 |
|
|
Total |
|
$ |
.40 |
|
|
$ |
.40 |
|
Our Credit Agreement contains covenants that include limitations on, among other things, dividends and stock repurchases (see below in Capital Resources-Credit Facilities and Outstanding Debt Securities).
Equity Compensation
Refer to Item 12. Security Ownership of Certain Beneficial Owners and Management and Related Stockholder Matters, of this report for information regarding securities authorized for issuance under our equity compensation plans.
Stock Price Performance Graph
The following graph compares the cumulative total stockholder return on our common stock with the cumulative total return on the stock included in the Standard & Poor’s 500 Index and a Peer Group Index during the five year period ended December 31, 2017. The graph assumes an investment of $100 made in our common stock and each Index as of January 1, 2013 and has been weighted based on market capitalization. Note that our common stock price performance shown below should not be viewed as being indicative of future performance.
Companies in the peer group, which consist of companies in the S&P 500 Index or S&P MidCap 400 Index are as follows: Community Health Systems, Inc., Health Management Associates, Inc. (included until January, 2014 when it was acquired by Community Health Systems, Inc.), LifePoint Health, Inc., Tenet Healthcare Corporation, Acadia Healthcare Company, Inc. and HCA Healthcare, Inc.
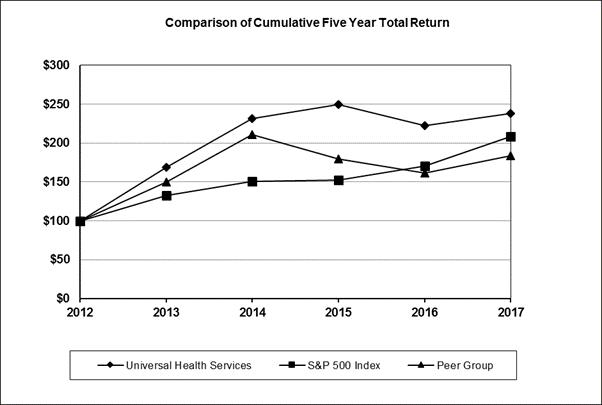
38
|
|
2012 Base |
|
|
2013 |
|
|
2014 |
|
|
2015 |
|
|
2016 |
|
|
2017 |
|
|||||||
|
Universal Health Services, Inc. |
|
$ |
100.00 |
|
|
$ |
168.56 |
|
|
$ |
231.48 |
|
|
$ |
249.41 |
|
|
$ |
222.77 |
|
|
$ |
238.21 |
|
|
S&P 500 Index |
|
$ |
100.00 |
|
|
$ |
132.39 |
|
|
$ |
150.51 |
|
|
$ |
152.59 |
|
|
$ |
170.84 |
|
|
$ |
208.14 |
|
|
Peer Group |
|
$ |
100.00 |
|
|
$ |
149.80 |
|
|
$ |
211.11 |
|
|
$ |
179.26 |
|
|
$ |
161.61 |
|
|
$ |
183.46 |
|
39
The following table contains our selected financial data for, or as of the end of, each of the five years ended December 31, 2017. You should read this table in conjunction with the consolidated financial statements and related notes included elsewhere in this report and in Part II, Item 7, Management’s Discussion and Analysis of Financial Condition and Results of Operations.
|
|
|
Year Ended December 31, |
|
|||||||||||||||||
|
|
|
2017 |
|
|
2016 |
|
|
2015 |
|
|
2014 |
|
|
2013 |
|
|||||
|
Summary of Operations (in thousands) |
|
|
|
|
|
|
|
|
|
|
|
|
|
|
|
|
|
|
|
|
|
Net revenues |
|
$ |
10,409,865 |
|
|
$ |
9,766,210 |
|
|
$ |
9,043,451 |
|
|
$ |
8,205,088 |
|
|
$ |
7,367,873 |
|
|
Income before income taxes |
|
$ |
1,135,009 |
|
|
$ |
1,156,358 |
|
|
$ |
1,145,901 |
|
|
$ |
929,667 |
|
|
$ |
869,332 |
|
|
Net income attributable to UHS |
|
$ |
752,303 |
|
|
$ |
702,409 |
|
|
$ |
680,528 |
|
|
$ |
545,343 |
|
|
$ |
510,733 |
|
|
Net margin |
|
|
7.2 |
% |
|
|
7.2 |
% |
|
|
7.5 |
% |
|
|
6.6 |
% |
|
|
6.9 |
% |
|
Return on average equity |
|
|
15.5 |
% |
|
|
16.0 |
% |
|
|
16.6 |
% |
|
|
15.3 |
% |
|
|
16.8 |
% |
|
Financial Data (in thousands) |
|
|
|
|
|
|
|
|
|
|
|
|
|
|
|
|
|
|
|
|
|
Cash provided by operating activities |
|
$ |
1,182,581 |
|
|
$ |
1,333,693 |
|
|
$ |
1,068,262 |
|
|
$ |
1,069,788 |
|
|
$ |
904,362 |
|
|
Capital expenditures, net (1) |
|
$ |
557,506 |
|
|
$ |
519,939 |
|
|
$ |
379,321 |
|
|
$ |
391,150 |
|
|
$ |
358,493 |
|
|
Total assets |
|
$ |
10,761,828 |
|
|
$ |
10,317,802 |
|
|
$ |
9,615,444 |
|
|
$ |
8,974,443 |
|
|
$ |
8,311,723 |
|
|
Current maturities of long-term debt |
|
$ |
545,619 |
|
|
$ |
105,895 |
|
|
$ |
62,722 |
|
|
$ |
68,319 |
|
|
$ |
99,312 |
|
|
Long-term debt |
|
$ |
3,494,390 |
|
|
$ |
4,030,230 |
|
|
$ |
3,368,634 |
|
|
$ |
3,210,215 |
|
|
$ |
3,209,762 |
|
|
UHS’s common stockholders’ equity |
|
$ |
4,989,514 |
|
|
$ |
4,533,220 |
|
|
$ |
4,249,647 |
|
|
$ |
3,735,946 |
|
|
$ |
3,249,979 |
|
|
Percentage of total debt to total capitalization |
|
|
45 |
% |
|
|
48 |
% |
|
|
45 |
% |
|
|
47 |
% |
|
|
51 |
% |
|
Operating Data—Acute Care Hospitals (2) |
|
|
|
|
|
|
|
|
|
|
|
|
|
|
|
|
|
|
|
|
|
Average licensed beds |
|
|
6,127 |
|
|
|
5,934 |
|
|
|
5,832 |
|
|
|
5,776 |
|
|
|
5,652 |
|
|
Average available beds |
|
|
5,954 |
|
|
|
5,759 |
|
|
|
5,656 |
|
|
|
5,571 |
|
|
|
5,429 |
|
|
Inpatient admissions |
|
|
297,390 |
|
|
|
274,074 |
|
|
|
261,727 |
|
|
|
251,165 |
|
|
|
246,160 |
|
|
Average length of patient stay |
|
|
4.4 |
|
|
|
4.6 |
|
|
|
4.7 |
|
|
|
4.6 |
|
|
|
4.5 |
|
|
Patient days |
|
|
1,312,265 |
|
|
|
1,251,511 |
|
|
|
1,218,969 |
|
|
|
1,167,726 |
|
|
|
1,112,541 |
|
|
Occupancy rate for licensed beds |
|
|
59 |
% |
|
|
58 |
% |
|
|
57 |
% |
|
|
55 |
% |
|
|
54 |
% |
|
Occupancy rate for available beds |
|
|
60 |
% |
|
|
59 |
% |
|
|
59 |
% |
|
|
57 |
% |
|
|
56 |
% |
|
Operating Data—Behavioral Health Facilities (2) |
|
|
|
|
|
|
|
|
|
|
|
|
|
|
|
|
|
|
|
|
|
Average licensed beds |
|
|
23,151 |
|
|
|
21,829 |
|
|
|
21,202 |
|
|
|
20,231 |
|
|
|
19,940 |
|
|
Average available beds |
|
|
23,068 |
|
|
|
21,744 |
|
|
|
21,116 |
|
|
|
20,131 |
|
|
|
19,841 |
|
|
Inpatient admissions |
|
|
467,822 |
|
|
|
456,052 |
|
|
|
447,007 |
|
|
|
426,510 |
|
|
|
401,565 |
|
|
Average length of patient stay |
|
|
13.6 |
|
|
|
13.2 |
|
|
|
13.1 |
|
|
|
12.9 |
|
|
|
13.3 |
|
|
Patient days |
|
|
6,381,756 |
|
|
|
6,004,066 |
|
|
|
5,835,134 |
|
|
|
5,518,660 |
|
|
|
5,354,334 |
|
|
Occupancy rate for licensed beds |
|
|
76 |
% |
|
|
75 |
% |
|
|
75 |
% |
|
|
75 |
% |
|
|
74 |
% |
|
Occupancy rate for available beds |
|
|
76 |
% |
|
|
75 |
% |
|
|
76 |
% |
|
|
75 |
% |
|
|
74 |
% |
|
Per Share Data |
|
|
|
|
|
|
|
|
|
|
|
|
|
|
|
|
|
|
|
|
|
Net income attributable to UHS—basic |
|
$ |
7.86 |
|
|
$ |
7.22 |
|
|
$ |
6.89 |
|
|
$ |
5.52 |
|
|
$ |
5.21 |
|
|
Net income attributable to UHS—diluted |
|
$ |
7.81 |
|
|
$ |
7.14 |
|
|
$ |
6.76 |
|
|
$ |
5.42 |
|
|
$ |
5.14 |
|
|
Dividends declared |
|
$ |
0.40 |
|
|
$ |
0.40 |
|
|
$ |
0.40 |
|
|
$ |
0.30 |
|
|
$ |
0.20 |
|
|
Other Information (in thousands) |
|
|
|
|
|
|
|
|
|
|
|
|
|
|
|
|
|
|
|
|
|
Weighted average number of shares outstanding—basic |
|
|
95,652 |
|
|
|
97,208 |
|
|
|
98,797 |
|
|
|
98,826 |
|
|
|
98,033 |
|
|
Weighted average number of shares and share equivalents outstanding—diluted |
|
|
96,325 |
|
|
|
98,380 |
|
|
|
100,694 |
|
|
|
100,544 |
|
|
|
99,361 |
|
|
(1) |
Amounts exclude non-cash capital lease obligations, if any. |
|
(2) |
Excludes statistical information related to divested facilities. |
40
Overview
Our principal business is owning and operating, through our subsidiaries, acute care hospitals and outpatient facilities and behavioral health care facilities.
As of February 28, 2018, we owned and/or operated 326 inpatient facilities and 32 outpatient and other facilities including the following located in 37 states, Washington, D.C., the United Kingdom, Puerto Rico and the U.S. Virgin Islands:
Acute care facilities located in the U.S.:
|
|
• |
26 inpatient acute care hospitals; |
|
|
• |
4 free-standing emergency departments, and; |
|
|
• |
4 outpatient surgery/cancer care centers & 1 surgical hospital. |
Behavioral health care facilities (300 inpatient facilities and 23 outpatient facilities):
Located in the U.S.:
|
|
• |
188 inpatient behavioral health care facilities, and; |
|
|
• |
20 outpatient behavioral health care facilities. |
Located in the U.K.:
|
|
• |
108 inpatient behavioral health care facilities, and; |
|
|
• |
2 outpatient behavioral health care facilities. |
Located in Puerto Rico and the U.S. Virgin Islands:
|
|
• |
4 inpatient behavioral health care facilities, and; |
|
|
• |
1 outpatient behavioral health care facility. |
As a percentage of our consolidated net revenues, net revenues from our acute care hospitals, outpatient facilities and commercial health insurer accounted for 53% during 2017, 52% during 2016 and 51% during 2015. Net revenues from our behavioral health care facilities and commercial health insurer accounted for 47% of our consolidated net revenues during 2017, 48% during 2016 and 49% during 2015.
Our behavioral health care facilities located in the U.K. generated net revenues amounting to approximately $429 million in 2017, $241 million in 2016 and $203 million in 2015. Total assets at our U.K. behavioral health care facilities were approximately $1.098 billion as of December 31, 2017, $965 million as of December 31, 2016 and $521 million as of December 31, 2015.
Services provided by our hospitals include general and specialty surgery, internal medicine, obstetrics, emergency room care, radiology, oncology, diagnostic care, coronary care, pediatric services, pharmacy services and/or behavioral health services. We provide capital resources as well as a variety of management services to our facilities, including central purchasing, information services, finance and control systems, facilities planning, physician recruitment services, administrative personnel management, marketing and public relations.
Forward-Looking Statements and Risk Factors
You should carefully review the information contained in this Annual Report, and should particularly consider any risk factors that we set forth in this Annual Report and in other reports or documents that we file from time to time with the Securities and Exchange Commission (the “SEC”). In this Annual Report, we state our beliefs of future events and of our future financial performance. This Annual Report contains “forward-looking statements” that reflect our current estimates, expectations and projections about our future results, performance, prospects and opportunities. Forward-looking statements include, among other things, the information concerning our possible future results of operations, business and growth strategies, financing plans, expectations that regulatory developments or other matters will not have a material adverse effect on our business or financial condition, our competitive position and the effects of competition, the projected growth of the industry in which we operate, and the benefits and synergies to be obtained from our completed and any future acquisitions, and statements of our goals and objectives, and other similar expressions concerning matters that are not historical facts. Words such as “may,” “will,” “should,” “could,” “would,” “predicts,” “potential,” “continue,” “expects,” “anticipates,” “future,” “intends,” “plans,” “believes,” “estimates,” “appears,” “projects” and similar expressions, as well as statements in future tense, identify forward-looking statements. In evaluating those statements, you should specifically consider various factors, including the risks related to healthcare industry trends and those set forth herein in Item 1A. Risk Factors.
41
Forward-looking statements should not be read as a guarantee of future performance or results, and will not necessarily be accurate indications of the times at, or by which, such performance or results will be achieved. Forward-looking information is based on information available at the time and/or our good faith belief with respect to future events, and is subject to risks and uncertainties that could cause actual performance or results to differ materially from those expressed in the statements. Such factors include, among other things, the following:
|
|
• |
our ability to comply with the existing laws and government regulations, and/or changes in laws and government regulations; |
|
|
• |
an increasing number of legislative initiatives have been passed into law that may result in major changes in the health care delivery system on a national or state level. No assurances can be given that the implementation of these laws will not have a material adverse effect on our business, financial condition or results of operations. See below in Sources of Revenue and Health Care Reform for additional disclosure; |
|
|
• |
possible unfavorable changes in the levels and terms of reimbursement for our charges by third party payors or government based payors, including Medicare or Medicaid in the United States, and government based payors in the United Kingdom; |
|
|
• |
our ability to enter into managed care provider agreements on acceptable terms and the ability of our competitors to do the same, including contracts with United/Sierra Healthcare in Las Vegas, Nevada; |
|
|
• |
the outcome of known and unknown litigation, government investigations, false claim act allegations, and liabilities and other claims asserted against us and other matters as disclosed in Item 3. Legal Proceedings; |
|
|
• |
the potential unfavorable impact on our business of deterioration in national, regional and local economic and business conditions, including a worsening of unfavorable credit market conditions; |
|
|
• |
competition from other healthcare providers (including physician owned facilities) in certain markets; |
|
|
• |
technological and pharmaceutical improvements that increase the cost of providing, or reduce the demand for healthcare; |
|
|
• |
our ability to attract and retain qualified personnel, nurses, physicians and other healthcare professionals and the impact on our labor expenses resulting from a shortage of nurses and other healthcare professionals; |
|
|
• |
demographic changes; |
|
|
• |
our ability to successfully integrate and improve our recent acquisitions and the availability of suitable acquisitions and divestiture opportunities; |
|
|
• |
the impact of severe weather conditions, including the effects of hurricanes; |
|
|
• |
as discussed below in Sources of Revenue, we receive revenues from various state and county based programs, including Medicaid in all the states in which we operate (we receive Medicaid revenues in excess of $100 million annually from each of Texas, California, Nevada, Washington, D.C., Pennsylvania and Illinois); CMS-approved Medicaid supplemental programs in certain states including Texas, Mississippi, Illinois, Oklahoma, Nevada, Arkansas, California and Indiana, and; state Medicaid disproportionate share hospital payments in certain states including Texas and South Carolina. We are therefore particularly sensitive to potential reductions in Medicaid and other state based revenue programs as well as regulatory, economic, environmental and competitive changes in those states. We can provide no assurance that reductions to revenues earned pursuant to these programs, particularly in the above-mentioned states, will not have a material adverse effect on our future results of operations; |
|
|
• |
our ability to continue to obtain capital on acceptable terms, including borrowed funds, to fund the future growth of our business; |
|
|
• |
our inpatient acute care and behavioral health care facilities may experience decreasing admission and length of stay trends; |
|
|
• |
our financial statements reflect large amounts due from various commercial and private payors and there can be no assurance that failure of the payors to remit amounts due to us will not have a material adverse effect on our future results of operations; |
42
|
|
• |
uninsured and self-pay patients treated at our acute care facilities unfavorably impact our ability to satisfactorily and timely collect our self-pay patient accounts; |
|
|
• |
changes in our business strategies or development plans; |
|
|
• |
fluctuations in the value of our common stock, and; |
|
|
• |
other factors referenced herein or in our other filings with the Securities and Exchange Commission. |
Given these uncertainties, risks and assumptions, as outlined above, you are cautioned not to place undue reliance on such forward-looking statements. Our actual results and financial condition could differ materially from those expressed in, or implied by, the forward-looking statements. Forward-looking statements speak only as of the date the statements are made. We assume no obligation to publicly update any forward-looking statements to reflect actual results, changes in assumptions or changes in other factors affecting forward-looking information, except as may be required by law. All forward-looking statements attributable to us or persons acting on our behalf are expressly qualified in their entirety by this cautionary statement.
Critical Accounting Policies and Estimates
The preparation of financial statements in conformity with accounting principles generally accepted in the United States requires us to make estimates and assumptions that affect the amounts reported in our consolidated financial statements and accompanying notes.
A summary of our significant accounting policies is outlined in Note 1 to the financial statements. We consider our critical accounting policies to be those that require us to make significant judgments and estimates when we prepare our financial statements, including the following:
Revenue Recognition: We record revenues and related receivables for health care services at the time the services are provided. Medicare and Medicaid revenues represented 30% of our net patient revenues during 2017, 32% during 2016 and 34% during 2015. Revenues from managed care entities, including health maintenance organizations and managed Medicare and Medicaid programs accounted for 56% of our net patient revenues during each of 2017 and 2016 and 54% during 2015.
We report net patient service revenue at the estimated net realizable amounts from patients and third-party payors and others for services rendered. We have agreements with third-party payors that provide for payments to us at amounts different from our established rates. Payment arrangements include prospectively determined rates per discharge, reimbursed costs, discounted charges and per diem payments. Estimates of contractual allowances under managed care plans are based upon the payment terms specified in the related contractual agreements. We closely monitor our historical collection rates, as well as changes in applicable laws, rules and regulations and contract terms, to assure that provisions are made using the most accurate information available. However, due to the complexities involved in these estimations, actual payments from payors may be different from the amounts we estimate and record.
We estimate our Medicare and Medicaid revenues using the latest available financial information, patient utilization data, government provided data and in accordance with applicable Medicare and Medicaid payment rules and regulations. The laws and regulations governing the Medicare and Medicaid programs are extremely complex and subject to interpretation and as a result, there is at least a reasonable possibility that recorded estimates will change by material amounts in the near term. Certain types of payments by the Medicare program and state Medicaid programs (e.g. Medicare Disproportionate Share Hospital, Medicare Allowable Bad Debts and Inpatient Psychiatric Services) are subject to retroactive adjustment in future periods as a result of administrative review and audit and our estimates may vary from the final settlements. Such amounts are included in accounts receivable, net, on our Consolidated Balance Sheets. The funding of both federal Medicare and state Medicaid programs are subject to legislative and
43
regulatory changes. As such, we cannot provide any assurance that future legislation and regulations, if enacted, will not have a material impact on our future Medicare and Medicaid reimbursements. Adjustments related to the final settlement of these retrospectively determined amounts did not materially impact our results in 2017, 2016 or 2015. If it were to occur, each 1% adjustment to our estimated net Medicare revenues that are subject to retrospective review and settlement as of December 31, 2017, would change our after-tax net income by approximately $1 million.
We provide care to patients who meet certain financial or economic criteria without charge or at amounts substantially less than our established rates. Because we do not pursue collection of amounts determined to qualify as charity care, they are not reported in net revenues or in accounts receivable, net. See additional disclosure below in Charity Care, Uninsured Discounts and Provision for Doubtful Accounts for our estimated uncompensated care provided and estimated cost of providing uncompensated care.
Charity Care, Uninsured Discounts and Provision for Doubtful Accounts: Collection of receivables from third-party payers and patients is our primary source of cash and is critical to our operating performance. Our primary collection risks relate to uninsured patients and the portion of the bill which is the patient’s responsibility, primarily co-payments and deductibles. We estimate our provisions for doubtful accounts based on general factors such as payer mix, the agings of the receivables and historical collection experience. We routinely review accounts receivable balances in conjunction with these factors and other economic conditions which might ultimately affect the collectability of the patient accounts and make adjustments to our allowances as warranted. At our acute care hospitals, third party liability accounts are pursued until all payment and adjustments are posted to the patient account. For those accounts with a patient balance after third party liability is finalized or accounts for uninsured patients, the patient receives statements and collection letters. Our hospitals establish a partial reserve for self-pay accounts in the allowance for doubtful accounts for both unbilled balances and those that have been billed and are under 90 days old. All self-pay accounts are fully reserved at 90 days from the date of discharge. Third party liability accounts are fully reserved in the allowance for doubtful accounts when the balance ages past 180 days from the date of discharge. Patients that express an inability to pay are reviewed for potential sources of financial assistance including our charity care policy. If the patient is deemed unwilling to pay, the account is written-off as bad debt and transferred to an outside collection agency for additional collection effort.
Historically, a significant portion of the patients treated throughout our portfolio of acute care hospitals are uninsured patients which, in part, has resulted from patients who are employed but do not have health insurance or who have policies with relatively high deductibles. Generally, patients treated at our hospitals for non-elective services, who have gross income less than 400% of the federal poverty guidelines, are deemed eligible for charity care. The federal poverty guidelines are established by the federal government and are based on income and family size. Effective January 1, 2016, our hospitals in certain states in which we operate reduced the charity care eligibility threshold to less than the federal poverty guidelines. Because we do not pursue collection of amounts that qualify as charity care, they are not reported in our net revenues or in our accounts receivable, net.
A portion of the accounts receivable at our acute care facilities are comprised of Medicaid accounts that are pending approval from third-party payers but we also have smaller amounts due from other miscellaneous payers such as county indigent programs in certain states. Our patient registration process includes an interview of the patient or the patient’s responsible party at the time of registration. At that time, an insurance eligibility determination is made and an insurance plan code is assigned. There are various pre-established insurance profiles in our patient accounting system which determine the expected insurance reimbursement for each patient based on the insurance plan code assigned and the services rendered. Certain patients may be classified as Medicaid pending at registration based upon a screening evaluation if we are unable to definitively determine if they are currently Medicaid eligible. When a patient is registered as Medicaid eligible or Medicaid pending, our patient accounting system records net revenues for services provided to that patient based upon the established Medicaid reimbursement rates, subject to the ultimate disposition of the patient’s Medicaid eligibility. When the patient’s ultimate eligibility is determined, reclassifications may occur which impacts the reported amounts in future periods for the provision for doubtful accounts and other accounts such as Medicaid pending. Although the patient’s ultimate eligibility determination may result in amounts being reclassified among these accounts from period to period, these reclassifications did not have a material impact on our results of operations in 2017, 2016 or 2015 since our facilities make estimates at each financial reporting period to reserve for amounts that are deemed to be uncollectible.
We also provide discounts to uninsured patients (included in “uninsured discounts” amounts below) who do not qualify for Medicaid or charity care. Because we do not pursue collection of amounts classified as uninsured discounts, they are not reported in our net revenues or in our net accounts receivable. In implementing the discount policy, we first attempt to qualify uninsured patients for governmental programs, charity care or any other discount program. If an uninsured patient does not qualify for these programs, the uninsured discount is applied. Our accounts receivable are recorded net of allowance for doubtful accounts of $480 million and $410 million at December 31, 2017 and 2016, respectively.
44
Approximately 87% during 2017 and 85% during 2016 of our consolidated provision for doubtful accounts, was incurred by our acute care hospitals. Shown below is our payor mix concentrations and related aging of our billed accounts receivable, net of contractual allowances, for our acute care hospitals as of December 31, 2017 and 2016:
As of December 31, 2017:
|
|
|
Days |
|
|||||||||||||
|
Payor |
|
0-60 |
|
|
61-120 |
|
|
121-180 |
|
|
over 180 |
|
||||
|
Medicare |
|
$ |
86,024 |
|
|
$ |
5,884 |
|
|
$ |
1,776 |
|
|
$ |
5,632 |
|
|
Medicaid |
|
|
15,951 |
|
|
|
5,746 |
|
|
|
2,858 |
|
|
|
7,108 |
|
|
Commercial insurance and other |
|
|
373,386 |
|
|
|
120,497 |
|
|
|
60,637 |
|
|
|
135,917 |
|
|
Private pay |
|
|
136,473 |
|
|
|
86,375 |
|
|
|
29,399 |
|
|
|
63,664 |
|
|
Total |
|
$ |
611,834 |
|
|
$ |
218,502 |
|
|
$ |
94,670 |
|
|
$ |
212,321 |
|
As of December 31, 2016:
|
|
|
Days |
|
|||||||||||||
|
Payor |
|
0-60 |
|
|
61-120 |
|
|
121-180 |
|
|
over 180 |
|
||||
|
Medicare |
|
$ |
71,213 |
|
|
$ |
4,519 |
|
|
$ |
1,385 |
|
|
$ |
4,225 |
|
|
Medicaid |
|
|
15,659 |
|
|
|
6,654 |
|
|
|
4,256 |
|
|
|
8,966 |
|
|
Commercial insurance and other |
|
|
336,346 |
|
|
|
117,919 |
|
|
|
62,806 |
|
|
|
164,143 |
|
|
Private pay |
|
|
114,382 |
|
|
|
67,316 |
|
|
|
16,689 |
|
|
|
26,881 |
|
|
Total |
|
$ |
537,600 |
|
|
$ |
196,408 |
|
|
$ |
85,136 |
|
|
$ |
204,215 |
|
Self-Insured/Other Insurance Risks: We provide for self-insured risks including general and professional liability claims, workers’ compensation claims and healthcare and dental claims. Our estimated liability for self-insured professional and general liability claims is based on a number of factors including, among other things, the number of asserted claims and reported incidents, estimates of losses for these claims based on recent and historical settlement amounts, estimate of incurred but not reported claims based on historical experience, and estimates of amounts recoverable under our commercial insurance policies. All relevant information, including our own historical experience is used in estimating the expected amount of claims. While we continuously monitor these factors, our ultimate liability for professional and general liability claims could change materially from our current estimates due to inherent uncertainties involved in making this estimate. Our estimated self-insured reserves are reviewed and changed, if necessary, at each reporting date and changes are recognized currently as additional expense or as a reduction of expense. In addition, we also: (i) own commercial health insurers headquartered in Reno, Nevada, and Puerto Rico and; (ii) maintain self-insured employee benefits programs for employee healthcare and dental claims. The ultimate costs related to these programs/operations include expenses for claims incurred and paid in addition to an accrual for the estimated expenses incurred in connection with claims incurred but not yet reported. Given our significant insurance-related exposure, there can be no assurance that a sharp increase in the number and/or severity of claims asserted against us will not have a material adverse effect on our future results of operations.
See Note 8 to the Consolidated Financial Statements-Commitments and Contingencies, for additional disclosure related to our professional and general liability, workers’ compensation liability and property insurance.
Long-Lived Assets: We review our long-lived assets, including intangible assets, for impairment whenever events or circumstances indicate that the carrying value of these assets may not be recoverable. The assessment of possible impairment is based on our ability to recover the carrying value of our asset based on our estimate of its undiscounted future cash flow. If the analysis indicates that the carrying value is not recoverable from future cash flows, the asset is written down to its estimated fair value and an impairment loss is recognized. Fair values are determined based on estimated future cash flows using appropriate discount rates.
Goodwill and Intangible Assets: Goodwill and indefinite-lived intangible assets are reviewed for impairment at the reporting unit level on an annual basis or sooner if the indicators of impairment arise. Our judgments regarding the existence of impairment indicators are based on market conditions and operational performance of each reporting unit. We have designated October 1st as our annual impairment assessment date and performed an impairment assessment as of October 1, 2017 which indicated no impairment of goodwill or indefinite-lived intangible assets. There were also no impairments during 2016 or 2015. During 2015, we changed our annual goodwill and indefinite-lived intangibles testing date from September 1st to October 1st. Management believes that this voluntary change in accounting method is preferable as it aligns the annual impairment testing date with our annual budgeting process. The 2015 change in annual testing date did not delay, accelerate or avoid an impairment charge. Future changes in the
45
estimates used to conduct the impairment review, including profitability and market value projections, could indicate impairment in future periods potentially resulting in a write-off of a portion or all of our goodwill or indefinite-lived intangible assets.
Income Taxes: Deferred tax assets and liabilities are recognized for the amount of taxes payable or deductible in future years as a result of differences between the tax bases of assets and liabilities and their reported amounts in the financial statements. We believe that future income will enable us to realize our deferred tax assets net of recorded valuation allowances relating to state and foreign net operating loss carry-forwards.
On December 22, 2017, the President of the United States signed into law comprehensive tax legislation commonly referred to as the Tax Cuts and Jobs Act of 2017 (the “TCJA-17”). The TCJA-17 makes broad and complex changes to the U.S. tax code, including, but not limited to, (1) reducing the U.S. federal corporate tax rate from 35 percent to 21 percent; (2) requiring companies to pay a one-time transition tax on certain unrepatriated earnings of foreign subsidiaries; (3) generally eliminating U.S. federal income taxes on dividends from foreign subsidiaries; (4) requiring a current inclusion in U.S. federal taxable income of certain earnings of controlled foreign corporations through the implementation of a territorial tax system; and (5) creating a new limitation on deductible interest expense. The SEC staff issued Staff Accounting Bulletin No. 118 (“SAB 118”) to address the application of U.S. GAAP in situations when a registrant has not obtained, prepared, or analyzed (including computations) all of the information needed in order to complete the accounting for certain income tax effects of the TCJA-17. To the extent that a company’s accounting for certain income tax effects of the TCJA-17 is incomplete, a reasonable estimate should be recorded as a provisional amount in the financial statements. We were able to make reasonable estimates of the effects of elements for which our analysis is not yet complete. We recorded the following provisional adjustments:
Reduction of U.S. federal corporate tax rate: The TCJA-17 reduces the corporate tax rate to 21 percent, effective January 1, 2018. Deferred income taxes are based on the estimated future tax effects of differences between the financial statement carrying amounts and the tax bases of assets and liabilities under the provisions of the enacted laws. For certain of our deferred tax assets and deferred tax liabilities, we have recorded a provisional decrease of $97 million and $127 million, respectively, with a corresponding net adjustment to deferred tax benefit of $30 million for the year ended December 31, 2017. While we are able to make a reasonable estimate of the impact of the reduction in corporate rate, it may be affected by other analyses related to the TCJA-17, including, but not limited to, our calculation of deemed repatriation of deferred foreign income and the state tax effect of adjustments made to federal temporary differences.
Deemed Repatriation Transition Tax: The Deemed Repatriation Transition Tax (“Transition Tax”) is a tax on previously untaxed accumulated and current earnings and profits (“E&P”) of certain of our foreign subsidiaries. To determine the amount of the Transition Tax, we must determine, in addition to other factors, the amount of post-1986 E&P of the relevant subsidiaries, as well as the amount of non-U.S. income taxes paid on such earnings. We are able to make a reasonable estimate of the Transition Tax and recorded a provisional Transition Tax obligation of $11.3 million. However, we are continuing to gather additional information to more precisely compute the amount of the Transition Tax.
Valuation allowances: We must assess whether valuation allowance analyses are affected by various aspects of the TCJA-17 (e.g., deemed repatriation of deferred foreign income). Since, as discussed herein, we have recorded provisional amounts related to certain portions of the TCJA-17, any corresponding determination of the need for or change in valuation allowances is also provisional.
The accounting for the above provisional amounts is expected to be complete when our 2017 U.S. Corporate Income Tax return is filed in 2018.
The decrease in our effective tax rate for the year ended December 31, 2017, as compared to 2016 and 2015, is due to the tax benefit resulting from our January 1, 2017 adoption of ASU 2016-09, the net favorable impact of the enactment of the TCJA-17 as discussed above, and the tax effects of our foreign operations in connection with our acquisition of Cambian Group, PLC’s adult services division (acquired in late December, 2016). We expect our 2018 effective tax rate to be significantly lower than our current year effective tax rate, excluding the impacts of the new federal tax reform legislation, attributable to the reduction of the federal corporate income tax rate included in the TCJA-17.
We operate in multiple jurisdictions with varying tax laws. We are subject to audits by any of these taxing authorities. Our tax returns have been examined by the Internal Revenue Service (“IRS”) through the year ended December 31, 2006. We believe that adequate accruals have been provided for federal, foreign and state taxes.
See Provision for Income Taxes and Effective Tax Rates below for discussion of our effective tax rates during each of the last three years.
46
Recent Accounting Pronouncements: For a summary of recent accounting pronouncements, please see Note 1 to the Consolidated Financial Statements-Accounting Standards as included in this Report on Form 10-K for the year ended December 31, 2017.
Results of Operations
The following table summarizes our results of operations, and is used in the discussion below, for the years ended December 31, 2017, 2016 and 2015 (dollar amounts in thousands):
|
|
|
Year Ended December 31, |
|
|||||||||||||||||||||
|
|
|
2017 |
|
|
2016 |
|
|
2015 |
|
|||||||||||||||
|
|
|
|
|
|
|
% of Net |
|
|
|
|
|
|
% of Net |
|
|
|
|
|
|
% of Net |
|
|||
|
|
|
Amount |
|
|
Revenues |
|
|
Amount |
|
|
Revenues |
|
|
Amount |
|
|
Revenues |
|
||||||
|
Net revenues before provision for doubtful accounts |
|
$ |
11,278,942 |
|
|
|
|
|
|
$ |
10,507,788 |
|
|
|
|
|
|
$ |
9,784,724 |
|
|
|
|
|
|
Less: Provision for doubtful accounts |
|
|
869,077 |
|
|
|
|
|
|
|
741,578 |
|
|
|
|
|
|
|
741,273 |
|
|
|
|
|
|
Net revenues |
|
|
10,409,865 |
|
|
|
100.0 |
% |
|
|
9,766,210 |
|
|
|
100.0 |
% |
|
|
9,043,451 |
|
|
|
100.0 |
% |
|
Operating charges: |
|
|
|
|
|
|
|
|
|
|
|
|
|
|
|
|
|
|
|
|
|
|
|
|
|
Salaries, wages and benefits |
|
|
4,980,637 |
|
|
|
47.8 |
% |
|
|
4,585,530 |
|
|
|
47.0 |
% |
|
|
4,212,387 |
|
|
|
46.6 |
% |
|
Other operating expenses |
|
|
2,493,062 |
|
|
|
23.9 |
% |
|
|
2,359,339 |
|
|
|
24.2 |
% |
|
|
2,119,805 |
|
|
|
23.4 |
% |
|
Supplies expense |
|
|
1,105,096 |
|
|
|
10.6 |
% |
|
|
1,031,337 |
|
|
|
10.6 |
% |
|
|
974,088 |
|
|
|
10.8 |
% |
|
Depreciation and amortization |
|
|
447,765 |
|
|
|
4.3 |
% |
|
|
416,608 |
|
|
|
4.3 |
% |
|
|
398,618 |
|
|
|
4.4 |
% |
|
Lease and rental expense |
|
|
103,127 |
|
|
|
1.0 |
% |
|
|
97,324 |
|
|
|
1.0 |
% |
|
|
94,973 |
|
|
|
1.1 |
% |
|
Electronic health records incentive income |
|
|
0 |
|
|
|
0.0 |
% |
|
|
(5,339 |
) |
|
|
-0.1 |
% |
|
|
(15,815 |
) |
|
|
-0.2 |
% |
|
Subtotal-operating expenses |
|
|
9,129,687 |
|
|
|
87.7 |
% |
|
|
8,484,799 |
|
|
|
86.9 |
% |
|
|
7,784,056 |
|
|
|
86.1 |
% |
|
Income from operations |
|
|
1,280,178 |
|
|
|
12.3 |
% |
|
|
1,281,411 |
|
|
|
13.1 |
% |
|
|
1,259,395 |
|
|
|
13.9 |
% |
|
Interest expense, net |
|
|
145,169 |
|
|
|
1.4 |
% |
|
|
125,053 |
|
|
|
1.3 |
% |
|
|
113,494 |
|
|
|
1.3 |
% |
|
Income before income taxes |
|
|
1,135,009 |
|
|
|
10.9 |
% |
|
|
1,156,358 |
|
|
|
11.8 |
% |
|
|
1,145,901 |
|
|
|
12.7 |
% |
|
Provision for income taxes |
|
|
363,697 |
|
|
|
3.5 |
% |
|
|
409,187 |
|
|
|
4.2 |
% |
|
|
395,203 |
|
|
|
4.4 |
% |
|
Net income |
|
|
771,312 |
|
|
|
7.4 |
% |
|
|
747,171 |
|
|
|
7.7 |
% |
|
|
750,698 |
|
|
|
8.3 |
% |
|
Less: Net income attributable to noncontrolling interests |
|
|
19,009 |
|
|
|
0.2 |
% |
|
|
44,762 |
|
|
|
0.5 |
% |
|
|
70,170 |
|
|
|
0.8 |
% |
|
Net income attributable to UHS |
|
$ |
752,303 |
|
|
|
7.2 |
% |
|
$ |
702,409 |
|
|
|
7.2 |
% |
|
$ |
680,528 |
|
|
|
7.5 |
% |
Year Ended December 31, 2017 as compared to the Year Ended December 31, 2016:
Net revenues increased 6.6% or $644 million to $10.41 billion during 2017 as compared to $9.77 billion during 2016. The increase was primarily attributable to:
|
|
• |
a $313 million or 3.3% increase in net revenues generated from our acute care and behavioral health care operations owned during both periods (which we refer to as “same facility”), and; |
|
|
• |
$331 million of other combined revenue consisting primarily of the revenues generated at the facilities acquired in December, 2016 in connection with our acquisition of Cambian Adult Services, and the revenues generated at Henderson Hospital, a newly constructed acute care hospital that was completed and opened during the fourth quarter of 2016. |
Income before income taxes (before deduction for income attributable to noncontrolling interests) decreased $21 million to $1.14 billion during 2017 as compared to $1.16 billion during 2016. The net decrease in our income before income taxes during 2017, as compared to 2016, was due to the following:
|
|
• |
an increase of $84 million as discussed below in Acute Care Hospital Services; |
|
|
• |
a decrease of $62 million as discussed below in Behavioral Health Services; |
|
|
• |
a decrease of $20 million resulting from an increase in interest expense, as discussed below in Other Operating Results, and; |
|
|
• |
$23 million of other combined net decreases, including an aggregate of approximately $20 million recording during 2017 in connection certain matters as discussed in Item 3 – Legal Proceedings. |
47
Net income attributable to UHS increased $50 million to $752 million during 2017 as compared to $702 million during 2016.
The increase consisted of:
|
|
• |
a decrease of $21 million in income before income taxes, as discussed above; |
|
|
• |
an increase of $26 million resulting from a decrease in the income attributable to noncontrolling interests due primarily to the May, 2016, purchase of the minority ownership interests held by a third-party in six acute care hospitals located in Las Vegas, Nevada, and; |
|
|
• |
an increase of $45 million resulting from a decrease in the provision for income taxes resulting from: |
|
|
o |
a decrease of $30 million due to a reduction in our net deferred income tax liability resulting from a lower federal income tax rate beginning January 1, 2018 pursuant to the Tax Cuts and Jobs Act of 2017; |
|
|
o |
an increase of $11 million due to the repatriation tax incurred pursuant to the Tax Cuts and Jobs Act of 2017 (in connection with our behavioral health care facilities located in the U.K.); |
|
|
o |
a decrease of $22 million resulting from our January 1, 2017 adoption of ASU 2016-09, as discussed herein; |
|
|
o |
a decrease caused by lower effective rates applicable to the income generated during 2017 in connection with our acquisition of Cambian Group, PLC’s adult services division. |
Year Ended December 31, 2016 as compared to the Year Ended December 31, 2015:
Net revenues increased 8% or $723 million to $9.77 billion during 2016 as compared to $9.04 billion during 2015. The increase was primarily attributable to:
|
|
• |
a $542 million or 6% increase in net revenues generated from our acute care and behavioral health care operations owned during both periods, and; |
|
|
• |
other combined net increase of $181 million consisting primarily of the revenues generated at 4 behavioral health care hospitals acquired in the U.K. in connection with our acquisition of Alpha Hospital Holdings Limited (“Alpha”) during the third quarter of 2015, and 4 inpatient facilities and 8 outpatient centers acquired during the fourth quarter of 2015 as result of our acquisition of Foundations Recovery Network, LLC (“Foundations”). |
Income before income taxes (before deduction for income attributable to noncontrolling interests) increased $10 million to $1.16 billion during 2016 as compared to $1.15 billion during 2015. The net increase in our income before income taxes during 2016, as compared to 2015, was due to the following:
|
|
• |
an increase of $38 million as discussed below in Acute Care Hospital Services; |
|
|
• |
an increase of $9 million as discussed below in Behavioral Health Services; |
|
|
• |
a decrease of $12 million resulting from an increase in interest expense due primarily to increased aggregate average outstanding borrowings, and; |
|
|
• |
$25 million of other combined net decreases. |
Net income attributable to UHS increased $22 million to $702 million during 2016 as compared to $681 million during 2015.
The increase consisted of:
|
|
• |
an increase of $10 million in income before income taxes, as discussed above; |
|
|
• |
an increase of $26 million resulting from a decrease in the income attributable to noncontrolling interests which was due primarily to our May, 2016, purchase of the minority ownership interests held by a third-party in six acute care hospitals located in Las Vegas, Nevada, and; |
|
|
• |
a decrease of $14 million resulting from an increase in the provision for income taxes recorded on the $36 million increase in pre-tax income ($10 million increase in income before income taxes plus the $26 million increase in income resulting from a decrease in the income attributable to noncontrolling interests). |
48
Year Ended December 31, 2017 as compared to the Year Ended December 31, 2016:
Acute Care Hospital Services-Same Facility Basis
We believe that providing our results on a “Same Facility” basis (which is a non-GAAP measure), which includes the operating results for facilities and businesses operated in both the current year and prior year periods, is helpful to our investors as a measure of our operating performance. Our Same Facility results also neutralize (if applicable) the impact of the EHR applications, the effect of items that are non-operational in nature including items such as, but not limited to, gains/losses on sales of assets and businesses, impacts of settlements, legal judgments and lawsuits, impairments of long-lived assets and other amounts that may be reflected in the current or prior year financial statements that relate to prior periods. Our Same Facility basis results reflected on the tables below also exclude from net revenues and other operating expenses, provider tax assessments incurred in each period as discussed below Sources of Revenue-Various State Medicaid Supplemental Payment Programs. However, these provider tax assessments are included in net revenues and other operating expenses as reflected in the table below under All Acute Care Hospital Services. The provider tax assessments had no impact on the income before income taxes as reflected on the tables below since the amounts offset between net revenues and other operating expenses. To obtain a complete understanding of our financial performance, the Same Facility results should be examined in connection with our net income as determined in accordance with GAAP and as presented in the condensed consolidated financial statements and notes thereto as contained in this Annual Report on Form 10-K.
The following table summarizes the results of operations for our acute care hospital services on a same facility basis and is used in the discussions below for the years ended December 31, 2017 and 2016 (dollar amounts in thousands):
|
|
|
Year Ended |
|
|
Year Ended |
|
||||||||||
|
|
|
December 31, 2017 |
|
|
December 31, 2016 |
|
||||||||||
|
|
|
|
|
|
|
% of Net |
|
|
|
|
|
|
% of Net |
|
||
|
|
|
Amount |
|
|
Revenues |
|
|
Amount |
|
|
Revenues |
|
||||
|
Net revenues before provision for doubtful accounts |
|
$ |
5,983,425 |
|
|
|
|
|
|
$ |
5,649,163 |
|
|
|
|
|
|
Less: Provision for doubtful accounts |
|
|
728,438 |
|
|
|
|
|
|
|
627,827 |
|
|
|
|
|
|
Net revenues |
|
|
5,254,987 |
|
|
|
100.0 |
% |
|
|
5,021,336 |
|
|
|
100.0 |
% |
|
Operating charges: |
|
|
|
|
|
|
|
|
|
|
|
|
|
|
|
|
|
Salaries, wages and benefits |
|
|
2,187,390 |
|
|
|
41.6 |
% |
|
|
2,083,357 |
|
|
|
41.5 |
% |
|
Other operating expenses |
|
|
1,225,494 |
|
|
|
23.3 |
% |
|
|
1,215,144 |
|
|
|
24.2 |
% |
|
Supplies expense |
|
|
886,829 |
|
|
|
16.9 |
% |
|
|
836,399 |
|
|
|
16.7 |
% |
|
Depreciation and amortization |
|
|
252,365 |
|
|
|
4.8 |
% |
|
|
237,658 |
|
|
|
4.7 |
% |
|
Lease and rental expense |
|
|
55,915 |
|
|
|
1.1 |
% |
|
|
52,582 |
|
|
|
1.0 |
% |
|
Subtotal-operating expenses |
|
|
4,607,993 |
|
|
|
87.7 |
% |
|
|
4,425,140 |
|
|
|
88.1 |
% |
|
Income from operations |
|
|
646,994 |
|
|
|
12.3 |
% |
|
|
596,196 |
|
|
|
11.9 |
% |
|
Interest expense, net |
|
|
2,683 |
|
|
|
0.1 |
% |
|
|
3,277 |
|
|
|
0.1 |
% |
|
Income before income taxes |
|
$ |
644,311 |
|
|
|
12.3 |
% |
|
$ |
592,919 |
|
|
|
11.8 |
% |
On a same facility basis during 2017, as compared to 2016, net revenues from our acute care services increased $234 million or 4.7%. Income before income taxes increased $51 million or 9% to $644 million or 12.3% of net revenues during 2017 as compared to $593 million or 11.8% of net revenues during 2016.
Inpatient admissions to our acute care hospitals owned during both years increased 6.2% during 2017, as compared to 2016, while patient days increased 3.4%. Adjusted admissions (adjusted for outpatient activity) increased 5.5% and adjusted patient days increased 2.8% during 2017, as compared to 2016. The average length of inpatient stay at these facilities was 4.4 days during 2017 and 4.6 days during 2016. The occupancy rate, based on the average available beds at these facilities, was 61% during 2017 and 60% during 2016. On a same facility basis, net revenue per adjusted admission at these facilities decreased 0.3% during 2017, as compared to 2016, and net revenue per adjusted patient day increased 2.4% during 2017, as compared to 2016.
All Acute Care Hospital Services
The following table summarizes the results of operations for all our acute care operations during 2017 and 2016. These amounts include: (i) our acute care results on a same facility basis, as indicated above; (ii) the impact of the implementation of EHR applications at our acute care hospitals; (iii) the impact of provider tax assessments which increased net revenues and other operating expenses but had no impact on income before income taxes, and; (iv) certain other amounts including the results of a 25-bed acute care hospital located in Pahrump, Nevada that was acquired in August, 2016, the results of a newly constructed, 130-bed acute care hospital located in Henderson, Nevada that was completed and opened during the fourth quarter of 2016 and the favorable impact of
49
Medicaid settlements relating to prior years that is included in our results of operations during 2017. Dollar amounts below are reflected in thousands.
|
|
|
Year Ended |
|
|
Year Ended |
|
||||||||||
|
|
|
December 31, 2017 |
|
|
December 31, 2016 |
|
||||||||||
|
|
|
|
|
|
|
% of Net |
|
|
|
|
|
|
% of Net |
|
||
|
|
|
Amount |
|
|
Revenues |
|
|
Amount |
|
|
Revenues |
|
||||
|
Net revenues before provision for doubtful accounts |
|
$ |
6,240,302 |
|
|
|
|
|
|
$ |
5,740,777 |
|
|
|
|
|
|
Less: Provision for doubtful accounts |
|
|
755,619 |
|
|
|
|
|
|
|
627,827 |
|
|
|
|
|
|
Net revenues |
|
|
5,484,683 |
|
|
|
100.0 |
% |
|
|
5,112,950 |
|
|
|
100.0 |
% |
|
Operating charges: |
|
|
|
|
|
|
|
|
|
|
|
|
|
|
|
|
|
Salaries, wages and benefits |
|
|
2,241,527 |
|
|
|
40.9 |
% |
|
|
2,086,986 |
|
|
|
40.8 |
% |
|
Other operating expenses |
|
|
1,350,741 |
|
|
|
24.6 |
% |
|
|
1,308,293 |
|
|
|
25.6 |
% |
|
Supplies expense |
|
|
905,165 |
|
|
|
16.5 |
% |
|
|
836,481 |
|
|
|
16.4 |
% |
|
Depreciation and amortization |
|
|
285,501 |
|
|
|
5.2 |
% |
|
|
273,176 |
|
|
|
5.3 |
% |
|
Lease and rental expense |
|
|
57,208 |
|
|
|
1.0 |
% |
|
|
52,604 |
|
|
|
1.0 |
% |
|
Electronic health records incentive income |
|
|
0 |
|
|
|
0.0 |
% |
|
|
(5,339 |
) |
|
|
-0.1 |
% |
|
Subtotal-operating expenses |
|
|
4,840,142 |
|
|
|
88.2 |
% |
|
|
4,552,201 |
|
|
|
89.0 |
% |
|
Income from operations |
|
|
644,541 |
|
|
|
11.8 |
% |
|
|
560,749 |
|
|
|
11.0 |
% |
|
Interest expense, net |
|
|
2,684 |
|
|
|
0.0 |
% |
|
|
3,277 |
|
|
|
0.1 |
% |
|
Income before income taxes |
|
$ |
641,857 |
|
|
|
11.7 |
% |
|
$ |
557,472 |
|
|
|
10.9 |
% |
During 2017, as compared to 2016, net revenues generated from our acute care hospital services increased $372 million or 7.3% to $5.48 billion due primarily to: (i) a $234 million, or 4.7%, increase same facility revenues, as discussed above, and; (ii) other combined net increase of $138 million due primarily to the net revenues generated at the two above-mentioned acute care hospitals located in Nevada that were acquired or opened during 2016.
Income before income taxes increased $84 million to $642 million or 11.7% of net revenues during 2017 as compared to $557 million or 10.9% of net revenues during 2016.
Included in these results are the following:
|
|
• |
the $51 million increase in income before income taxes from our acute care hospital services, on a same facility basis, as discussed above; |
|
|
• |
a net increase of $6 million resulting from: (i) the income recorded in connection with Medicaid settlements relating to prior years ($15 million), partially offset by; (ii) increased professional and general liability expense recorded during 2017 related to prior years, based upon a reserve analysis ($9 million), and; |
|
|
• |
other combined net increase of $27 million consisting primarily of the income generated at the two above-mentioned acute care hospitals located in Nevada that were acquired or opened during 2016. |
Uncompensated care (charity care and uninsured discounts):
The following table shows the amounts recorded at our acute care hospitals for charity care and uninsured discounts, based on charges at established rates, for the years ended December 31, 2017, 2016 and 2015:
|
|
|
(dollar amounts in thousands) |
|
|||||||||||||||||||||
|
|
|
2017 |
|
|
2016 |
|
|
2015 |
|
|||||||||||||||
|
|
|
Amount |
|
|
% |
|
|
Amount |
|
|
% |
|
|
Amount |
|
|
% |
|
||||||
|
Charity care |
|
$ |
887,136 |
|
|
|
50 |
% |
|
$ |
733,585 |
|
|
|
50 |
% |
|
$ |
506,571 |
|
|
|
42 |
% |
|
Uninsured discounts |
|
|
881,265 |
|
|
|
50 |
% |
|
|
720,205 |
|
|
|
50 |
% |
|
|
696,463 |
|
|
|
58 |
% |
|
Total uncompensated care |
|
$ |
1,768,401 |
|
|
|
100 |
% |
|
$ |
1,453,790 |
|
|
|
100 |
% |
|
$ |
1,203,034 |
|
|
|
100 |
% |
Generally, patients treated at our hospitals for non-elective services, who have gross income less than 400% of the federal poverty guidelines, are deemed eligible for charity care. The federal poverty guidelines are established by the federal government and are based on income and family size. Effective January 1, 2016, our hospitals in certain states in which we operate reduced the charity care eligibility threshold to less than the federal poverty guidelines. During 2017 and 2016, as compared to 2015, this change resulted in an increase in the charity care component of our total uncompensated care and a decrease in the uninsured discount component.
50
The provision for doubtful accounts at our acute care hospitals was approximately $756 million during 2017, $628 million during 2016 and $631 million during 2015.
The estimated cost of providing uncompensated care:
The estimated costs of providing uncompensated care as reflected below were based on a calculation which multiplied the percentage of operating expenses for our acute care hospitals to gross charges for those hospitals by the above-mentioned total uncompensated care amounts. Amounts included in the provision for doubtful accounts, as mentioned above, are not included in the calculation of estimated costs of providing uncompensated care. The percentage of cost to gross charges is calculated based on the total operating expenses for our acute care facilities divided by gross patient service revenue for those facilities.
|
|
|
(amounts in thousands) |
|
|||||||||
|
|
|
2017 |
|
|
2016 |
|
|
2015 |
|
|||
|
Estimated cost of providing charity care |
|
$ |
120,208 |
|
|
$ |
107,887 |
|
|
$ |
77,557 |
|
|
Estimated cost of providing uninsured discounts related care |
|
|
119,412 |
|
|
|
105,920 |
|
|
|
106,630 |
|
|
Estimated cost of providing uncompensated care |
|
$ |
239,620 |
|
|
$ |
213,807 |
|
|
$ |
184,187 |
|
Year Ended December 31, 2016 as compared to the Year Ended December 31, 2015:
Acute Care Hospital Services-Same Facility Basis
The following table summarizes the results of operations for our acute care hospital services on a same facility basis and is used in the discussions below for the years ended December 31, 2016 and 2015 (dollar amounts in thousands):
|
|
|
Year Ended |
|
|
Year Ended |
|
||||||||||
|
|
|
December 31, 2016 |
|
|
December 31, 2015 |
|
||||||||||
|
|
|
|
|
|
|
% of Net |
|
|
|
|
|
|
% of Net |
|
||
|
|
|
Amount |
|
|
Revenues |
|
|
Amount |
|
|
Revenues |
|
||||
|
Net revenues before provision for doubtful accounts |
|
$ |
5,611,838 |
|
|
|
|
|
|
$ |
5,187,677 |
|
|
|
|
|
|
Less: Provision for doubtful accounts |
|
|
625,170 |
|
|
|
|
|
|
|
631,013 |
|
|
|
|
|
|
Net revenues |
|
|
4,986,668 |
|
|
|
100.0 |
% |
|
|
4,556,664 |
|
|
|
100.0 |
% |
|
Operating charges: |
|
|
|
|
|
|
|
|
|
|
|
|
|
|
|
|
|
Salaries, wages and benefits |
|
|
2,064,928 |
|
|
|
41.4 |
% |
|
|
1,895,040 |
|
|
|
41.6 |
% |
|
Other operating expenses |
|
|
1,208,037 |
|
|
|
24.2 |
% |
|
|
1,058,673 |
|
|
|
23.2 |
% |
|
Supplies expense |
|
|
832,158 |
|
|
|
16.7 |
% |
|
|
780,019 |
|
|
|
17.1 |
% |
|
Depreciation and amortization |
|
|
233,430 |
|
|
|
4.7 |
% |
|
|
229,517 |
|
|
|
5.0 |
% |
|
Lease and rental expense |
|
|
51,336 |
|
|
|
1.0 |
% |
|
|
50,121 |
|
|
|
1.1 |
% |
|
Subtotal-operating expenses |
|
|
4,389,889 |
|
|
|
88.0 |
% |
|
|
4,013,370 |
|
|
|
88.1 |
% |
|
Income from operations |
|
|
596,779 |
|
|
|
12.0 |
% |
|
|
543,294 |
|
|
|
11.9 |
% |
|
Interest expense, net |
|
|
3,275 |
|
|
|
0.1 |
% |
|
|
4,214 |
|
|
|
0.1 |
% |
|
Income before income taxes |
|
$ |
593,504 |
|
|
|
11.9 |
% |
|
$ |
539,080 |
|
|
|
11.8 |
% |
On a same facility basis during 2016, as compared to 2015, net revenues from our acute care services increased $430 million or 9.4%. Income before income taxes increased $54 million or 10% to $594 million or 11.9% of net revenues during 2016 as compared to $539 million or 11.8% of net revenues during 2015.
Inpatient admissions to our acute care hospitals owned during both years increased 4.3% during 2016, as compared to 2015, while patient days increased 2.4%. Adjusted admissions (adjusted for outpatient activity) increased 5.2% and adjusted patient days increased 3.3% during 2016, as compared to 2015. The average length of inpatient stay at these facilities was 4.6 days during 2016 and 4.7 days during 2015. The occupancy rate, based on the average available beds at these facilities, was 60% during 2016 and 59% during 2015. On a same facility basis, net revenue per adjusted admission at these facilities increased 2.7% during 2016, as compared to 2015, and net revenue per adjusted patient day increased 4.6% during 2016, as compared to 2015.
All Acute Care Hospital Services
The following table summarizes the results of operations for all our acute care operations during 2016 and 2015. These amounts include: (i) our acute care results on a same facility basis, as indicated above; (ii) the impact of the implementation of EHR applications at our acute care hospitals; (iii) the impact of provider tax assessments which increased net revenues and other operating expenses but had no impact on income before income taxes, and; (iv) certain other amounts including the results of a 25-bed acute care hospital located in Pahrump, Nevada that was acquired in August, 2016 and the results of a newly constructed, 130-bed acute care
51
hospital located in Henderson, Nevada that was completed and opened during the fourth quarter of 2016. Dollar amounts below are reflected in thousands.
|
|
|
Year Ended |
|
|
Year Ended |
|
||||||||||
|
|
|
December 31, 2016 |
|
|
December 31, 2015 |
|
||||||||||
|
|
|
|
|
|
|
% of Net |
|
|
|
|
|
|
% of Net |
|
||
|
|
|
Amount |
|
|
Revenues |
|
|
Amount |
|
|
Revenues |
|
||||
|
Net revenues before provision for doubtful accounts |
|
$ |
5,740,777 |
|
|
|
|
|
|
$ |
5,263,577 |
|
|
|
|
|
|
Less: Provision for doubtful accounts |
|
|
627,827 |
|
|
|
|
|
|
|
631,013 |
|
|
|
|
|
|
Net revenues |
|
|
5,112,950 |
|
|
|
100.0 |
% |
|
|
4,632,564 |
|
|
|
100.0 |
% |
|
Operating charges: |
|
|
|
|
|
|
|
|
|
|
|
|
|
|
|
|
|
Salaries, wages and benefits |
|
|
2,086,986 |
|
|
|
40.8 |
% |
|
|
1,896,002 |
|
|
|
40.9 |
% |
|
Other operating expenses |
|
|
1,308,293 |
|
|
|
25.6 |
% |
|
|
1,131,481 |
|
|
|
24.4 |
% |
|
Supplies expense |
|
|
836,481 |
|
|
|
16.4 |
% |
|
|
780,019 |
|
|
|
16.8 |
% |
|
Depreciation and amortization |
|
|
273,176 |
|
|
|
5.3 |
% |
|
|
266,912 |
|
|
|
5.8 |
% |
|
Lease and rental expense |
|
|
52,604 |
|
|
|
1.0 |
% |
|
|
50,121 |
|
|
|
1.1 |
% |
|
Electronic health records incentive income |
|
|
(5,339 |
) |
|
|
-0.1 |
% |
|
|
(15,815 |
) |
|
|
-0.3 |
% |
|
Subtotal-operating expenses |
|
|
4,552,201 |
|
|
|
89.0 |
% |
|
|
4,108,720 |
|
|
|
88.7 |
% |
|
Income from operations |
|
|
560,749 |
|
|
|
11.0 |
% |
|
|
523,844 |
|
|
|
11.3 |
% |
|
Interest expense, net |
|
|
3,277 |
|
|
|
0.1 |
% |
|
|
4,214 |
|
|
|
0.1 |
% |
|
Income before income taxes |
|
$ |
557,472 |
|
|
|
10.9 |
% |
|
$ |
519,630 |
|
|
|
11.2 |
% |
During 2016, as compared to 2015, net revenues generated from our acute care hospital services increased $480 million or 10.4% to $5.11 billion due primarily to: (i) a $430 million, or 9.4%, increase same facility revenues, as discussed above, and; (ii) other combined net increase of $50 million due primarily to the net revenues generated at the two above-mentioned acute care hospitals located in Nevada that were acquired or opened during 2016, and an increase in provider tax assessments.
Income before income taxes increased $37 million to $557 million or 10.9% of net revenues during 2016 as compared to $520 million or 11.2% of net revenues during 2015.
Included in these results are the following:
|
|
• |
the $54 million increase in income before income taxes from our acute care hospital services, on a same facility basis, as discussed above; |
|
|
• |
a net decrease of $9 million related to the incentive income ($5 million in 2016 and $16 million in 2015), net of related depreciation and amortization expense ($35 million in 2016 and $37 million in 2015), recorded in connection with the implementation of EHR applications at our acute care hospitals, and; |
|
|
• |
a net other combined decrease of $8 million consisting primarily of the operating losses incurred at the newly constructed, 130-bed acute care hospital located in Henderson, Nevada, that was completed and opened during the fourth quarter of 2016. |
52
Behavioral Health Care Services
Year Ended December 31, 2017 as compared to the Year Ended December 31, 2016
Behavioral Health Care Services-Same Facility Basis
Our Same Facility basis results (which is a non-GAAP measure), which include the operating results for facilities and businesses operated in both the current year and prior year period, neutralize (if applicable) the effect of items that are non-operational in nature including items such as, but not limited to, gains/losses on sales of assets and businesses, impacts of settlements, legal judgments and lawsuits, impairments of long-lived assets and other amounts that may be reflected in the current or prior year financial statements that relate to prior periods. Our Same Facility basis results reflected on the tables below also exclude from net revenues and other operating expenses, provider tax assessments incurred in each period as discussed below Sources of Revenue-Various State Medicaid Supplemental Payment Programs. However, these provider tax assessments are included in net revenues and other operating expenses as reflected in the table below under All Behavioral Health Care Services. The provider tax assessments had no impact on the income before income taxes as reflected on the tables below since the amounts offset between net revenues and other operating expenses. To obtain a complete understanding of our financial performance, the Same Facility results should be examined in connection with our net income as determined in accordance with GAAP and as presented in the condensed consolidated financial statements and notes thereto as contained in this Annual Report on Form 10-K.
The following table summarizes the results of operations for our behavioral health care services, on a same facility basis, and is used in the discussions below for the years ended December 31, 2017 and 2016 (dollar amounts in thousands):
|
|
|
Year Ended |
|
|
Year Ended |
|
||||||||||
|
|
|
December 31, 2017 |
|
|
December 31, 2016 |
|
||||||||||
|
|
|
|
|
|
|
% of Net |
|
|
|
|
|
|
% of Net |
|
||
|
|
|
Amount |
|
|
Revenues |
|
|
Amount |
|
|
Revenues |
|
||||
|
Net revenues before provision for doubtful accounts |
|
$ |
4,743,340 |
|
|
|
|
|
|
$ |
4,666,633 |
|
|
|
|
|
|
Less: Provision for doubtful accounts |
|
|
111,277 |
|
|
|
|
|
|
|
113,455 |
|
|
|
|
|
|
Net revenues |
|
|
4,632,063 |
|
|
|
100.0 |
% |
|
|
4,553,178 |
|
|
|
100.0 |
% |
|
Operating charges: |
|
|
|
|
|
|
|
|
|
|
|
|
|
|
|
|
|
Salaries, wages and benefits |
|
|
2,361,545 |
|
|
|
51.0 |
% |
|
|
2,257,512 |
|
|
|
49.6 |
% |
|
Other operating expenses |
|
|
921,991 |
|
|
|
19.9 |
% |
|
|
885,574 |
|
|
|
19.4 |
% |
|
Supplies expense |
|
|
195,291 |
|
|
|
4.2 |
% |
|
|
193,901 |
|
|
|
4.3 |
% |
|
Depreciation and amortization |
|
|
136,000 |
|
|
|
2.9 |
% |
|
|
131,231 |
|
|
|
2.9 |
% |
|
Lease and rental expense |
|
|
44,259 |
|
|
|
1.0 |
% |
|
|
44,975 |
|
|
|
1.0 |
% |
|
Subtotal-operating expenses |
|
|
3,659,086 |
|
|
|
79.0 |
% |
|
|
3,513,193 |
|
|
|
77.2 |
% |
|
Income from operations |
|
|
972,977 |
|
|
|
21.0 |
% |
|
|
1,039,985 |
|
|
|
22.8 |
% |
|
Interest expense, net |
|
|
2,006 |
|
|
|
0.0 |
% |
|
|
1,728 |
|
|
|
0.0 |
% |
|
Income before income taxes |
|
$ |
970,971 |
|
|
|
21.0 |
% |
|
$ |
1,038,257 |
|
|
|
22.8 |
% |
On a same facility basis during 2017, as compared to 2016, net revenues generated from our behavioral health care services increased $79 million or 1.7% to $4.63 billion during 2017 as compared to $4.55 billion during 2016. Income before income taxes decreased $67 million or 7% to $971 million or 21.0% of net revenues during 2017 as compared to $1.04 billion or 22.8% of net revenues during 2016.
Inpatient admissions to our behavioral health care facilities owned during both years increased 2.5% during 2017, as compared to 2016, while patient days increased 0.3%. Adjusted admissions increased 2.4% and adjusted patient days increased 0.2% during 2017, as compared to 2016. The average length of inpatient stay at these facilities were 12.8 days and 13.1 days during 2017 and 2016, respectively. The occupancy rate, based on the average available beds at these facilities, were 75% and 76% during 2017 and 2016, respectively. On a same facility basis, net revenue per adjusted admission at these facilities decreased 0.4% during 2017, as compared to 2016, and net revenue per adjusted patient day increased 1.9% during 2017, as compared to 2016.
In certain markets in which we operate, the ability of our behavioral health facilities to fully meet the demand for their services has been unfavorably impacted by a shortage of clinicians which includes psychiatrists, nurses and mental health technicians which has, at times, caused the closure of a portion of available bed capacity. As a result, we have instituted certain initiatives at the impacted facilities designed to enhance recruitment and retention of clinical staff. Although we believe the impact on these facilities is temporary, we can provide no assurance that these factors will not continue to unfavorably impact our patient volumes.
All Behavioral Health Care Services
The following table summarizes the results of operations for all our behavioral health care services during 2017 and 2016. These amounts include: (i) our behavioral health care results on a same facility basis, as indicated above; (ii) the impact of provider tax
53
assessments which increased net revenues and other operating expenses but had no impact on income before income taxes, and; (iii) certain other amounts including the results of facilities acquired or opened during the past year including the behavioral health care facilities acquired in the U.K. in connection with our acquisition of Cambian Group, PLC’s adult services division which was acquired in late December, 2016. Dollar amounts below are reflected in thousands.
|
|
|
Year Ended |
|
|
Year Ended |
|
||||||||||
|
|
|
December 31, 2017 |
|
|
December 31, 2016 |
|
||||||||||
|
|
|
|
|
|
|
% of Net |
|
|
|
|
|
|
% of Net |
|
||
|
|
|
Amount |
|
|
Revenues |
|
|
Amount |
|
|
Revenues |
|
||||
|
Net revenues before provision for doubtful accounts |
|
$ |
5,020,177 |
|
|
|
|
|
|
$ |
4,758,761 |
|
|
|
|
|
|
Less: Provision for doubtful accounts |
|
|
113,458 |
|
|
|
|
|
|
|
113,754 |
|
|
|
|
|
|
Net revenues |
|
|
4,906,719 |
|
|
|
100.0 |
% |
|
|
4,645,007 |
|
|
|
100.0 |
% |
|
Operating charges: |
|
|
|
|
|
|
|
|
|
|
|
|
|
|
|
|
|
Salaries, wages and benefits |
|
|
2,496,236 |
|
|
|
50.9 |
% |
|
|
2,271,967 |
|
|
|
48.9 |
% |
|
Other operating expenses |
|
|
1,042,056 |
|
|
|
21.2 |
% |
|
|
965,873 |
|
|
|
20.8 |
% |
|
Supplies expense |
|
|
199,936 |
|
|
|
4.1 |
% |
|
|
194,872 |
|
|
|
4.2 |
% |
|
Depreciation and amortization |
|
|
152,067 |
|
|
|
3.1 |
% |
|
|
134,487 |
|
|
|
2.9 |
% |
|
Lease and rental expense |
|
|
45,445 |
|
|
|
0.9 |
% |
|
|
45,346 |
|
|
|
1.0 |
% |
|
Subtotal-operating expenses |
|
|
3,935,740 |
|
|
|
80.2 |
% |
|
|
3,612,545 |
|
|
|
77.8 |
% |
|
Income from operations |
|
|
970,979 |
|
|
|
19.8 |
% |
|
|
1,032,462 |
|
|
|
22.2 |
% |
|
Interest expense, net |
|
|
2,005 |
|
|
|
0.0 |
% |
|
|
1,728 |
|
|
|
0.0 |
% |
|
Income before income taxes |
|
$ |
968,974 |
|
|
|
19.7 |
% |
|
$ |
1,030,734 |
|
|
|
22.2 |
% |
During 2017, as compared to 2016, net revenues generated from our behavioral health care services increased 5.6% or $262 million to $4.91 billion during 2017 as compared to $4.65 billion during 2016. The increase in net revenues was attributable to: (i) $79 million or 1.7% increase in same facility revenues, as discussed above, and; (ii) $183 million of other combined net increases consisting primarily of the revenues generated at the facilities acquired in the U.K. in late December, 2016 in connection with our acquisition of Cambian Group, PLC’s Adult Services division.
Income before income taxes decreased $62 million or 6% to $969 million or 19.7% of net revenues during 2017 as compared to $1.03 billion or 22.2% of net revenues during 2016. The decrease in income before income taxes at our behavioral health facilities was attributable to:
|
|
• |
a $67 million decrease at our behavioral health facilities on a same facility basis, as discussed above; |
|
|
• |
a $13 million decrease due to the following which were recorded during 2017: (i) a prior year Medicaid disproportionate shares hospital revenue adjustment related to a certain state ($7 million), and; (ii) increased professional and general liability expense related to prior years, based upon a reserve analysis ($6 million), and; |
|
|
• |
other combined net increase of $18 million consisting primarily of the income generated during 2017 at the facilities acquired in the Cambian Group, PLC’s adult services division transaction in December, 2016, partially offset by other unfavorable changes. |
54
Year Ended December 31, 2016 as compared to the Year Ended December 31, 2015
Behavioral Health Care Services-Same Facility Basis
The following table summarizes the results of operations for our behavioral health care services, on a same facility basis, and is used in the discussions below for the years ended December 31, 2016 and 2015 (dollar amounts in thousands):
|
|
|
Year Ended |
|
|
Year Ended |
|
||||||||||
|
|
|
December 31, 2016 |
|
|
December 31, 2015 |
|
||||||||||
|
|
|
|
|
|
|
% of Net |
|
|
|
|
|
|
% of Net |
|
||
|
|
|
Amount |
|
|
Revenues |
|
|
Amount |
|
|
Revenues |
|
||||
|
Net revenues before provision for doubtful accounts |
|
$ |
4,537,418 |
|
|
|
|
|
|
$ |
4,422,803 |
|
|
|
|
|
|
Less: Provision for doubtful accounts |
|
|
112,061 |
|
|
|
|
|
|
|
109,734 |
|
|
|
|
|
|
Net revenues |
|
|
4,425,357 |
|
|
|
100.0 |
% |
|
|
4,313,069 |
|
|
|
100.0 |
% |
|
Operating charges: |
|
|
|
|
|
|
|
|
|
|
|
|
|
|
|
|
|
Salaries, wages and benefits |
|
|
2,187,896 |
|
|
|
49.4 |
% |
|
|
2,084,152 |
|
|
|
48.3 |
% |
|
Other operating expenses |
|
|
854,174 |
|
|
|
19.3 |
% |
|
|
838,732 |
|
|
|
19.4 |
% |
|
Supplies expense |
|
|
189,245 |
|
|
|
4.3 |
% |
|
|
191,001 |
|
|
|
4.4 |
% |
|
Depreciation and amortization |
|
|
127,060 |
|
|
|
2.9 |
% |
|
|
121,524 |
|
|
|
2.8 |
% |
|
Lease and rental expense |
|
|
41,584 |
|
|
|
0.9 |
% |
|
|
42,513 |
|
|
|
1.0 |
% |
|
Subtotal-operating expenses |
|
|
3,399,959 |
|
|
|
76.8 |
% |
|
|
3,277,922 |
|
|
|
76.0 |
% |
|
Income from operations |
|
|
1,025,398 |
|
|
|
23.2 |
% |
|
|
1,035,147 |
|
|
|
24.0 |
% |
|
Interest expense, net |
|
|
1,753 |
|
|
|
0.0 |
% |
|
|
1,854 |
|
|
|
0.0 |
% |
|
Income before income taxes |
|
$ |
1,023,645 |
|
|
|
23.1 |
% |
|
$ |
1,033,293 |
|
|
|
24.0 |
% |
On a same facility basis during 2016, as compared to 2015, net revenues generated from our behavioral health care services increased $112 million or 2.6% to $4.43 billion during 2016 as compared to $4.31 billion during 2015. Income before income taxes decreased $10 million or 1% to $1.02 billion or 23.1% of net revenues during 2016 as compared to $1.03 billion or 24.0% of net revenues during 2015.
Inpatient admissions to our behavioral health care facilities owned during both years increased 1.3% during 2016, as compared to 2015, while patient days increased 1.2%. Adjusted admissions increased 1.0% and adjusted patient days increased 0.9% during 2016, as compared to 2015. The average length of inpatient stay at these facilities was 13.0 days during each of 2016 and 2015. The occupancy rate, based on the average available beds at these facilities, was 76% during each of 2016 and 2015. On a same facility basis, net revenue per adjusted admission at these facilities increased 1.4% during 2016, as compared to 2015, and net revenue per adjusted patient day increased 1.5% during 2016, as compared to 2015.
All Behavioral Health Care Services
The following table summarizes the results of operations for all our behavioral health care services during 2016 and 2015 which includes our behavioral health results on a same facility basis, the impact of the facilities acquired or opened within the previous twelve months, and the impact of provider tax assessments which increased net revenues and other operating expenses but had no impact on income before income taxes (dollar amounts in thousands):
|
|
|
Year Ended |
|
|
Year Ended |
|
||||||||||
|
|
|
December 31, 2016 |
|
|
December 31, 2015 |
|
||||||||||
|
|
|
|
|
|
|
% of Net |
|
|
|
|
|
|
% of Net |
|
||
|
|
|
Amount |
|
|
Revenues |
|
|
Amount |
|
|
Revenues |
|
||||
|
Net revenues before provision for doubtful accounts |
|
$ |
4,758,761 |
|
|
|
|
|
|
$ |
4,510,477 |
|
|
|
|
|
|
Less: Provision for doubtful accounts |
|
|
113,754 |
|
|
|
|
|
|
|
110,142 |
|
|
|
|
|
|
Net revenues |
|
|
4,645,007 |
|
|
|
100.0 |
% |
|
|
4,400,335 |
|
|
|
100.0 |
% |
|
Operating charges: |
|
|
|
|
|
|
|
|
|
|
|
|
|
|
|
|
|
Salaries, wages and benefits |
|
|
2,271,967 |
|
|
|
48.9 |
% |
|
|
2,105,206 |
|
|
|
47.8 |
% |
|
Other operating expenses |
|
|
965,873 |
|
|
|
20.8 |
% |
|
|
910,741 |
|
|
|
20.7 |
% |
|
Supplies expense |
|
|
194,872 |
|
|
|
4.2 |
% |
|
|
192,387 |
|
|
|
4.4 |
% |
|
Depreciation and amortization |
|
|
134,487 |
|
|
|
2.9 |
% |
|
|
124,205 |
|
|
|
2.8 |
% |
|
Lease and rental expense |
|
|
45,346 |
|
|
|
1.0 |
% |
|
|
44,119 |
|
|
|
1.0 |
% |
|
Subtotal-operating expenses |
|
|
3,612,545 |
|
|
|
77.8 |
% |
|
|
3,376,658 |
|
|
|
76.7 |
% |
|
Income from operations |
|
|
1,032,462 |
|
|
|
22.2 |
% |
|
|
1,023,677 |
|
|
|
23.3 |
% |
|
Interest expense, net |
|
|
1,728 |
|
|
|
0.0 |
% |
|
|
1,854 |
|
|
|
0.0 |
% |
|
Income before income taxes |
|
$ |
1,030,734 |
|
|
|
22.2 |
% |
|
$ |
1,021,823 |
|
|
|
23.2 |
% |
55
During 2016, as compared to 2015, net revenues generated from our behavioral health care services increased 5.6% or $245 million to $4.65 billion during 2016 as compared to $4.40 billion during 2015. The increase in net revenues was attributable to: (i) $112 million or 2.6% increase in same facility revenues, as discussed above, and; (ii) $133 million of other combined increases consisting primarily of the revenues generated at the facilities acquired in the Alpha and Foundations transactions.
Income before income taxes increased $9 million or 1% to $1.03 billion or 22.2% of net revenues during 2016 as compared to $1.02 billion or 23.2% of net revenues during 2015. The increase in income before income taxes at our behavioral health facilities was attributable to:
|
|
• |
a $10 million decrease at our behavioral health facilities on a same facility basis, as discussed above, and; |
|
|
• |
a combined net increase of $19 million related primarily to the income generated at the facilities acquired in the Alpha and Foundations transactions. |
Sources of Revenue
Overview: We receive payments for services rendered from private insurers, including managed care plans, the federal government under the Medicare program, state governments under their respective Medicaid programs and directly from patients.
Hospital revenues depend upon inpatient occupancy levels, the medical and ancillary services and therapy programs ordered by physicians and provided to patients, the volume of outpatient procedures and the charges or negotiated payment rates for such services. Charges and reimbursement rates for inpatient routine services vary depending on the type of services provided (e.g., medical/surgical, intensive care or behavioral health) and the geographic location of the hospital. Inpatient occupancy levels fluctuate for various reasons, many of which are beyond our control. The percentage of patient service revenue attributable to outpatient services has generally increased in recent years, primarily as a result of advances in medical technology that allow more services to be provided on an outpatient basis, as well as increased pressure from Medicare, Medicaid and private insurers to reduce hospital stays and provide services, where possible, on a less expensive outpatient basis. We believe that our experience with respect to our increased outpatient levels mirrors the general trend occurring in the health care industry and we are unable to predict the rate of growth and resulting impact on our future revenues.
Patients are generally not responsible for any difference between customary hospital charges and amounts reimbursed for such services under Medicare, Medicaid, some private insurance plans, and managed care plans, but are responsible for services not covered by such plans, exclusions, deductibles or co-insurance features of their coverage. The amount of such exclusions, deductibles and co-insurance has generally been increasing each year. Indications from recent federal and state legislation are that this trend will continue. Collection of amounts due from individuals is typically more difficult than from governmental or business payers which unfavorably impacts the collectability of our patient accounts.
Sources of Revenues and Health Care Reform: Given increasing budget deficits, the federal government and many states are currently considering additional ways to limit increases in levels of Medicare and Medicaid funding, which could also adversely affect future payments received by our hospitals. In addition, the uncertainty and fiscal pressures placed upon the federal government as a result of, among other things, economic recovery stimulus packages, responses to natural disasters, and the federal budget deficit in general may affect the availability of federal funds to provide additional relief in the future. We are unable to predict the effect of future policy changes on our operations.
On March 23, 2010, President Obama signed into law the Patient Protection and Affordable Care Act (the “PPACA”). The Healthcare and Education Reconciliation Act of 2010 (the “Reconciliation Act”), which contains a number of amendments to the PPACA, was signed into law on March 30, 2010. Two primary goals of the PPACA, combined with the Reconciliation Act (collectively referred to as the “Legislation”), are to provide for increased access to coverage for healthcare and to reduce healthcare-related expenses.
Although it is expected that as a result of the Legislation there may be a reduction in uninsured patients, which should reduce our expense from uncollectible accounts receivable, the Legislation makes a number of other changes to Medicare and Medicaid which we believe may have an adverse impact on us. It has been projected that the Legislation will result in a net reduction in Medicare and Medicaid payments to hospitals totaling $155 billion over 10 years. The Legislation revises reimbursement under the Medicare and Medicaid programs to emphasize the efficient delivery of high quality care and contains a number of incentives and penalties under these programs to achieve these goals. The Legislation provides for decreases in the annual market basket update for federal fiscal years 2010 through 2019, a productivity offset to the market basket update beginning October 1, 2011 for Medicare Part B reimbursable items and services and beginning October 1, 2012 for Medicare inpatient hospital services. The Legislation and subsequent revisions provide for reductions to both Medicare DSH and Medicaid DSH payments. The Medicare DSH reductions began in October, 2013 while the Medicaid DSH reductions are scheduled to begin in 2020. The Legislation implements a value-based
56
purchasing program, which will reward the delivery of efficient care. Conversely, certain facilities will receive reduced reimbursement for failing to meet quality parameters; such hospitals will include those with excessive readmission or hospital-acquired condition rates.
A 2012 U.S. Supreme Court ruling limited the federal government’s ability to expand health insurance coverage by holding unconstitutional sections of the Legislation that sought to withdraw federal funding for state noncompliance with certain Medicaid coverage requirements. Pursuant to that decision, the federal government may not penalize states that choose not to participate in the Medicaid expansion program by reducing their existing Medicaid funding. Therefore, states can choose to accept or not to participate without risking the loss of federal Medicaid funding. As a result, many states, including Texas, have not expanded their Medicaid programs without the threat of loss of federal funding. CMS has granted, and is expected to grant additional, section 1115 demonstration waivers providing for work and community engagement requirements for certain Medicaid eligible individuals. It is anticipated this will lead to reductions in coverage, and likely increases in uncompensated care, in states where these demonstration waivers are granted.
The various provisions in the Legislation that directly or indirectly affect Medicare and Medicaid reimbursement are scheduled to take effect over a number of years. The impact of the Legislation on healthcare providers will be subject to implementing regulations, interpretive guidance and possible future legislation or legal challenges. Certain Legislation provisions, such as that creating the Medicare Shared Savings Program creates uncertainty in how healthcare may be reimbursed by federal programs in the future. Thus, we cannot predict the impact of the Legislation on our future reimbursement at this time and we can provide no assurance that the Legislation will not have a material adverse effect on our future results of operations.
The Legislation also contained provisions aimed at reducing fraud and abuse in healthcare. The Legislation amends several existing laws, including the federal Anti-Kickback Statute and the False Claims Act, making it easier for government agencies and private plaintiffs to prevail in lawsuits brought against healthcare providers. While Congress had previously revised the intent requirement of the Anti-Kickback Statute to provide that a person is not required to “have actual knowledge or specific intent to commit a violation of” the Anti-Kickback Statute in order to be found in violation of such law, the Legislation also provides that any claims for items or services that violate the Anti-Kickback Statute are also considered false claims for purposes of the federal civil False Claims Act. The Legislation provides that a healthcare provider that retains an overpayment in excess of 60 days is subject to the federal civil False Claims Act, although final regulations implementing this statutory requirement remain pending. The Legislation also expands the Recovery Audit Contractor program to Medicaid. These amendments also make it easier for severe fines and penalties to be imposed on healthcare providers that violate applicable laws and regulations.
We have partnered with local physicians in the ownership of certain of our facilities. These investments have been permitted under an exception to the physician self-referral law. The Legislation permits existing physician investments in a hospital to continue under a “grandfather” clause if the arrangement satisfies certain requirements and restrictions, but physicians are prohibited from increasing the aggregate percentage of their ownership in the hospital. The Legislation also imposes certain compliance and disclosure requirements upon existing physician-owned hospitals and restricts the ability of physician-owned hospitals to expand the capacity of their facilities. As discussed below, should the Legislation be repealed in its entirety, this aspect of the Legislation would also be repealed restoring physician ownership of hospitals and expansion right to its position and practice as it existed prior to the Legislation.
The impact of the Legislation on each of our hospitals may vary. Because Legislation provisions are effective at various times over the next several years, we anticipate that many of the provisions in the Legislation may be subject to further revision. Initiatives to repeal the Legislation, in whole or in part, to delay elements of implementation or funding, and to offer amendments or supplements to modify its provisions have been persistent. The ultimate outcomes of legislative attempts to repeal or amend the Legislation and legal challenges to the Legislation are unknown. Legislation has already been enacted that has repealed the individual mandate to obtain health insurance penalty that was part of the original Legislation. In addition, Congress is considering legislation that would, in material part: (i) eliminate the large employer mandate to obtain or provide health insurance coverage, respectively; (ii) permit insurers to impose a surcharge up to 30 percent on individuals who go uninsured for more than two months and then purchase coverage; (iii) provide tax credits towards the purchase of health insurance, with a phase-out of tax credits accordingly to income level; (iv) expand health savings accounts; (v) impose a per capita cap on federal funding of state Medicaid programs, or, if elected by a state, transition federal funding to block grants, and; (vi) permit states to seek a waiver of certain federal requirements that would allow such state to define essential health benefits differently from federal standards and that would allow certain commercial health plans to take health status, including pre-existing conditions, into account in setting premiums.
In addition to legislative changes, the Legislation can be significantly impacted by executive branch actions. In relevant part, President Trump has already taken executive actions: (i) requiring all federal agencies with authorities and responsibilities under the Legislation to “exercise all authority and discretion available to them to waiver, defer, grant exemptions from, or delay” parts of the Legislation that place “unwarranted economic and regulatory burdens” on states, individuals or health care providers; (ii) the issuance of a proposed rule by the Department of Labor to enable the formation of health plans that would be exempt from certain Legislation
57
essential health benefits requirements, and; (iii) eliminating cost-sharing reduction payments to insurers that would otherwise offset deductibles and other out-of-pocket expenses for health plan enrollees at or below 250 percent of the federal poverty level. The uncertainty resulting from these Executive Branch policies has led to reduced Exchange enrollment in 2018 and is expected to further worsen the individual and small group market risk pools in future years. It is also anticipated that these and future policies may create additional cost and reimbursement pressures on hospitals.
It remains unclear what portions of the Legislation may remain, or whether any replacement or alternative programs may be created by any future legislation. Any such future repeal or replacement may have significant impact on the reimbursement for healthcare services generally, and may create reimbursement for services competing with the services offered by our hospitals. Accordingly, there can be no assurance that the adoption of any future federal or state healthcare reform legislation will not have a negative financial impact on our hospitals, including their ability to compete with alternative healthcare services funded by such potential legislation, or for our hospitals to receive payment for services.
The following tables show the approximate percentages of net patient revenue during the past three years for: (i) our Acute Care and Behavioral Health Care Facilities Combined; (ii) our Acute Care Facilities, and; (iii) our Behavioral Health Care Facilities. Net patient revenue is defined as revenue from all sources after deducting contractual allowances and discounts from established billing rates, which we derived from various sources of payment for the years indicated.
|
|
|
Percentage of Net Patient Revenues |
|
|||||||||
|
Acute Care and Behavioral Health Care Facilities Combined |
|
2017 |
|
|
2016 |
|
|
2015 |
|
|||
|
Third Party Payors: |
|
|
|
|
|
|
|
|
|
|
|
|
|
Medicare |
|
|
19 |
% |
|
|
20 |
% |
|
|
21 |
% |
|
Medicaid |
|
|
11 |
% |
|
|
12 |
% |
|
|
13 |
% |
|
Managed Care (HMO and PPOs) |
|
|
56 |
% |
|
|
56 |
% |
|
|
54 |
% |
|
Other Sources |
|
|
14 |
% |
|
|
12 |
% |
|
|
12 |
% |
|
Total |
|
|
100 |
% |
|
|
100 |
% |
|
|
100 |
% |
|
|
|
Percentage of Net Patient Revenues |
|
|||||||||
|
Acute Care Facilities |
|
2017 |
|
|
2016 |
|
|
2015 |
|
|||
|
Third Party Payors: |
|
|
|
|
|
|
|
|
|
|
|
|
|
Medicare |
|
|
25 |
% |
|
|
25 |
% |
|
|
26 |
% |
|
Medicaid |
|
|
7 |
% |
|
|
7 |
% |
|
|
7 |
% |
|
Managed Care (HMO and PPOs) |
|
|
64 |
% |
|
|
63 |
% |
|
|
64 |
% |
|
Other Sources |
|
|
4 |
% |
|
|
5 |
% |
|
|
3 |
% |
|
Total |
|
|
100 |
% |
|
|
100 |
% |
|
|
100 |
% |
|
|
|
Percentage of Net Patient Revenues |
|
|||||||||
|
Behavioral Health Care Facilities |
|
2017 |
|
|
2016 |
|
|
2015 |
|
|||
|
Third Party Payors: |
|
|
|
|
|
|
|
|
|
|
|
|
|
Medicare |
|
|
13 |
% |
|
|
15 |
% |
|
|
16 |
% |
|
Medicaid |
|
|
15 |
% |
|
|
16 |
% |
|
|
19 |
% |
|
Managed Care (HMO and PPOs) |
|
|
48 |
% |
|
|
48 |
% |
|
|
45 |
% |
|
Other Sources |
|
|
24 |
% |
|
|
21 |
% |
|
|
20 |
% |
|
Total |
|
|
100 |
% |
|
|
100 |
% |
|
|
100 |
% |
Medicare: Medicare is a federal program that provides certain hospital and medical insurance benefits to persons aged 65 and over, some disabled persons and persons with end-stage renal disease. All of our acute care hospitals and many of our behavioral health centers are certified as providers of Medicare services by the appropriate governmental authorities. Amounts received under the Medicare program are generally significantly less than a hospital’s customary charges for services provided. Since a substantial portion of our revenues will come from patients under the Medicare program, our ability to operate our business successfully in the future will depend in large measure on our ability to adapt to changes in this program.
Under the Medicare program, for inpatient services, our general acute care hospitals receive reimbursement under the inpatient prospective payment system (“IPPS”). Under the IPPS, hospitals are paid a predetermined fixed payment amount for each hospital discharge. The fixed payment amount is based upon each patient’s Medicare severity diagnosis related group (“MS-DRG”). Every
58
MS-DRG is assigned a payment rate based upon the estimated intensity of hospital resources necessary to treat the average patient with that particular diagnosis. The MS-DRG payment rates are based upon historical national average costs and do not consider the actual costs incurred by a hospital in providing care. This MS-DRG assignment also affects the predetermined capital rate paid with each MS-DRG. The MS-DRG and capital payment rates are adjusted annually by the predetermined geographic adjustment factor for the geographic region in which a particular hospital is located and are weighted based upon a statistically normal distribution of severity. While we generally will not receive payment from Medicare for inpatient services, other than the MS-DRG payment, a hospital may qualify for an “outlier” payment if a particular patient’s treatment costs are extraordinarily high and exceed a specified threshold. MS-DRG rates are adjusted by an update factor each federal fiscal year, which begins on October 1. The index used to adjust the MS-DRG rates, known as the “hospital market basket index,” gives consideration to the inflation experienced by hospitals in purchasing goods and services. Generally, however, the percentage increases in the MS-DRG payments have been lower than the projected increase in the cost of goods and services purchased by hospitals.
In August, 2017, CMS published its IPPS 2018 final payment rule which provides for a 2.9% market basket increase to the base Medicare MS-DRG blended rate. When statutorily mandated budget neutrality factors, annual geographic wage index updates, documenting and coding adjustments and Health Care Reform mandated adjustments are considered, without consideration for the decreases related to the required Medicare Disproportionate Share Hospital (“DSH”) payment changes and increase to the Medicare Outlier threshold, the overall increase in IPPS payments would approximate 2.3%. Including the estimated decrease to our DSH payments (approximating 0.1%) and certain other adjustments, we estimate our overall increase from the final IPPS 2018 rule (covering the period of October 1, 2017 through September 30, 2018) will approximate 1.8%. This projected impact from the IPPS 2018 final rule includes an increase of approximately 0.5% to partially restore cuts made as a result of the American Taxpayer Relief Act of 2012, as required by the 21st Century Cures Act but excludes the impact of the sequestration reductions related to the Budget Control Act of 2011, Bipartisan Budget Act of 2015, and Bipartisan Budget Act of 2018, as discussed below. CMS will also begin using uncompensated care data from the 2014 hospital cost report Worksheet S-10, one-third weighting as part of the proxy methodology to allocate approximately $7 billion in the DSH Uncompensated Care Pool. This final rule change will result in wide variations among all hospitals nationwide in the distribution of these DSH funds compared to previous years. As a result of this final change by CMS, we could incur a material decrease in our DSH payments in federal fiscal year 2019 and forward if CMS increases the weighting of the Worksheet S-10 data in the DSH Pool allocation methodology.
In August, 2016, CMS published its IPPS 2017 final payment rule which provides for a 2.7% market basket increase to the base Medicare MS-DRG blended rate. When statutorily mandated budget neutrality factors, annual geographic wage index updates, documenting and coding adjustments and Health Care Reform mandated adjustments are considered, without consideration for the decreases related to the required DSH payment changes and increase to the Medicare Outlier threshold, the overall increase in IPPS payments would approximate 0.95%. Including the estimated decreases to our DSH payments (approximating -0.8%) and certain other adjustments, we estimate our overall decrease from the final IPPS 2017 rule (covering the period of October 1, 2016 through September 30, 2017) would approximate -0.2%. This projected impact from the IPPS 2017 final rule includes both the impact of the American Taxpayer Relief Act of 2012 documentation and coding adjustment and the required changes to the DSH payments related to the traditional Medicare fee for service, however, it excludes the impact of the sequestration reductions related to the Budget Control Act of 2011, and Bipartisan Budget Act of 2015, as discussed below.
In July, 2015, CMS published its IPPS 2016 final payment rule which provided for a 2.4% market basket increase to the base Medicare MS-DRG blended rate. When statutorily mandated budget neutrality factors, annual geographic wage index updates, documenting and coding adjustments and Health Care Reform mandated adjustments are considered, without consideration for the decreases related to the required Medicare DSH payment changes and decrease to the Medicare Outlier threshold, the overall increase in IPPS payments approximated 1.1%. Including the decreases to our Medicare DSH payments (approximating 1.6%) and certain other adjustments, our overall decrease from the final IPPS 2016 rule (covering the period of October 1, 2015 through September 30, 2016) was approximately -0.1%. The impact from the IPPS 2016 final rule includes both the impact of the American Taxpayer Relief Act of 2012 documentation and coding adjustment and the required changes to the DSH payments related to the traditional Medicare fee for service, however, it excludes the impact of the sequestration reductions related to the Budget Control Act of 2011, and Bipartisan Budget Act of 2015, as discussed below.
In August, 2013, CMS published its final IPPS 2014 payment rule which expanded CMS’s policy under which it defines inpatient admissions to include the use of an objective time of care standard. Specifically, it would require Medicare’s external review contractors to presume that hospital inpatient admissions are reasonable and necessary when beneficiaries receive a physician order for admission and receive medically necessary services for at least two midnights (the “Two Midnight” rule). In October, 2015 as part of the 2016 Medicare Outpatient Prospective Payment System (“OPPS”) final rule (additional related disclosure below), CMS will allow payment for one-midnight stays under the Medicare Part A benefit on a case-by case basis for rare and unusual exceptions based the presence of certain clinical factors. CMS also announced in the final rule that, effective October 1, 2015, Quality Improvement Organizations (“QIOs”) will conduct reviews of short inpatient stay reviews rather than Medicare Administrative Contractors. Additionally, CMS also announced that Recovery Audit Contractors (“RACs”) resumed patient status reviews for claims with
59
admission dates of January 1, 2016 or later, and the agency indicates that RACs will conduct these reviews focused on providers with high denial rates that are referred by the QIOs. In its IPPS 2017 final payment rule, CMS: (i) reversed the Two-Midnight rule’s 0.2% reduction in hospital payments, and; (ii) implemented a temporary one-time increase of 0.8% in FFY2017 payments to offset cuts in the preceding fiscal years affected by the prior 0.2% reduction.
In August, 2011, the Budget Control Act of 2011 (the “2011 Act”) was enacted into law. Included in this law are the imposition of annual spending limits for most federal agencies and programs aimed at reducing budget deficits by $917 billion between 2012 and 2021, according to a report released by the Congressional Budget Office. Among its other provisions, the law established a bipartisan Congressional committee, known as the Joint Committee, which was responsible for developing recommendations aimed at reducing future federal budget deficits by an additional $1.5 trillion over 10 years. The Joint Committee was unable to reach an agreement by the November 23, 2011 deadline and, as a result, across-the-board cuts to discretionary, national defense and Medicare spending were implemented on March 1, 2013 resulting in Medicare payment reductions of up to 2% per fiscal year. The Bipartisan Budget Act of 2015, enacted on November 2, 2015, and the Bipartisan Budget Act of 2018, enacted on February 9, 2018, continued the 2% reductions to Medicare reimbursement imposed under the 2011 Act.
On January 2, 2013 ATRA was enacted which, among other things, includes a requirement for CMS to recoup $11 billion from hospitals from Medicare IPPS rates during federal fiscal years 2014 to 2017. The recoupment relates to IPPS documentation and coding adjustments for the period 2008 to 2013 for which adjustments were not previously applied by CMS. Both the 2014 and 2015 IPPS final rules include a -0.8% recoupment adjustment. CMS has included the same 0.8% recoupment adjustment in fiscal year 2016, a 1.5% recoupment adjustment in federal fiscal year 2017, and a 0.45% positive adjustment in fiscal year 2018 in order to recover the entire $11 billion. This adjustment is reflected in the IPPS estimated impact amounts noted above. On April 16, 2015, the Medicare Access and CHIP Reauthorization Act of 2015 was enacted and an anticipated 3.2% payment increase in 2018 is scheduled to be phased in at approximately 0.5% per year over 6 years beginning in fiscal year 2018.
Inpatient services furnished by psychiatric hospitals under the Medicare program are paid under a Psychiatric Prospective Payment System (“Psych PPS”). Medicare payments to psychiatric hospitals are based on a prospective per diem rate with adjustments to account for certain facility and patient characteristics. The Psych PPS also contains provisions for outlier payments and an adjustment to a psychiatric hospital’s base payment if it maintains a full-service emergency department.
In August, 2017, CMS published its Psych PPS final rule for the federal fiscal year 2018. Under this final rule, payments to our psychiatric hospitals and units are estimated to increase by 1.25% compared to federal fiscal year 2017. This amount includes the effect of the 2.6% market basket update less a 0.75% adjustment as required by the ACA and a 0.6% productivity adjustment.
In July, 2016, CMS published its Psych PPS final rule for the federal fiscal year 2017. Under this final rule, payments to psychiatric hospitals and units are estimated to increase by 2.3% compared to federal fiscal year 2016. This amount includes the effect of the 2.8% market basket update less a 0.2% adjustment as required by the ACA and a 0.3% productivity adjustment.
In July, 2015, CMS published its Psych PPS final rule for the federal fiscal year 2016. Under this final rule, payments to psychiatric hospitals and units increased by approximately 1.7% compared to federal fiscal year 2015. This amount includes the effect of the 2.4% market basket update less a 0.2% adjustment as required by the ACA and a 0.5% productivity adjustment. The final rule also updates the Inpatient Psychiatric Quality Reporting Program, which requires psychiatric facilities to report on quality measures or incur a reduction in their annual payment update.
In November, 2017, CMS published its OPPS final rule for 2018. The hospital market basket increase is 2.7%. The Medicare statute requires a productivity adjustment reduction of 0.6% and 0.75% reduction to the 2017 OPPS market basket resulting in a 2018 OPPS market basket update at 1.35%. When other statutorily required adjustments and hospital patient service mix are considered, we estimate that our overall Medicare OPPS update for 2018 will aggregate to a net increase of 4.2% which includes a 0.8% increase to behavioral health division partial hospitalization rates. When the behavioral health division’s partial hospitalization rate impact is excluded, we estimate that our Medicare 2018 OPPS payments will result in a 4.8% increase in payment levels for our acute care division, as compared to 2017. Additionally, the Medicare inpatient-only (IPO) list includes procedures that are only paid under the Hospital Inpatient Prospective Payment System. Each year, CMS uses established criteria to review the IPO list and determine whether or not any procedures should be removed from the list. CMS is removing total knee arthroplasty (TKA) from the IPO list effective January 1, 2018. Additionally, CMS will redistribute $1.6 billion in cost savings within the OPPS system attributable to changes in the federal 340B hospital drug pricing payment methodology in 2018. The impact of these IPO and 340B changes are reflected in the above noted estimated acute care division percentage change in OPPS reimbursement.
In November, 2016, CMS published its OPPS final rule for 2017. The hospital market basket increase is 2.7%. The Medicare statute requires a productivity adjustment reduction of 0.3% and 0.75% reduction to the 2017 OPPS market basket resulting in a 2017
60
OPPS market basket update at 1.65%. When other statutorily required adjustments and hospital patient service mix are considered, we estimate that our overall Medicare OPPS update for 2017 resulted in a net increase of 1.5% which included a -1.3% decrease to behavioral health division partial hospitalization rates. When the behavioral health division’s partial hospitalization rate impact is excluded, we estimate that our Medicare 2017 OPPS payments resulted in a 2.1% increase in payment levels for our acute care division, as compared to 2016.
In October, 2015, CMS published its OPPS final rule for 2016. The hospital market basket increase is 2.8%. The Medicare statute requires a productivity adjustment reduction of 0.5% and 0.2% reduction to the 2016 OPPS market basket. Additionally, CMS also included a reduction of 2.0%, which the CMS claimed was necessary to eliminate $1 billion in excess laboratory payments that CMS packaged into OPPS payment rates in 2014 resulting in a 2016 OPPS market basket update at -0.3%. When other statutorily required adjustments and hospital patient service mix are considered, our overall Medicare OPPS update for 2016 aggregated to a net decrease of approximately -0.2% which includes a 7.0% increase to behavioral health division partial hospitalization rates. When the behavioral health division’s partial hospitalization rate impact is excluded, our Medicare 2016 OPPS payments resulted in a -1.6% decrease in payment levels for our acute care division, as compared to 2015.
In October, 2014, CMS published its OPPS final rule for 2015. The hospital market basket increase is 2.9%. The Medicare statute requires a productivity adjustment reduction of 0.5% and 0.2% reduction to the 2015 OPPS market basket resulting in a 2015 OPPS market basket update at 2.2%. In the final rule, CMS will reduce the 2015 Medicare rates for both hospital-based and community mental health center partial hospitalization programs. When other statutorily required adjustments, hospital patient service mix and the aforementioned partial hospitalization rates are considered, our overall Medicare OPPS for 2015 aggregated to a net increase of approximately 0.2%. Excluding the behavioral health division partial hospitalization rate impact, our Medicare OPPS payment increase for 2015 was approximately 1.5%.
Medicaid: Medicaid is a joint federal-state funded health care benefit program that is administered by the states to provide benefits to qualifying individuals who are unable to afford care. Most state Medicaid payments are made under a PPS-like system, or under programs that negotiate payment levels with individual hospitals. Amounts received under the Medicaid program are generally significantly less than a hospital’s customary charges for services provided. In addition to revenues received pursuant to the Medicare program, we receive a large portion of our revenues either directly from Medicaid programs or from managed care companies managing Medicaid. All of our acute care hospitals and most of our behavioral health centers are certified as providers of Medicaid services by the appropriate governmental authorities.
We receive revenues from various state and county based programs, including Medicaid in all the states in which we operate (we receive Medicaid revenues in excess of $100 million annually from each of Texas, California, Nevada, Washington, D.C., Pennsylvania and Illinois); CMS-approved Medicaid supplemental programs in certain states including Texas, Mississippi, Illinois, Oklahoma, Nevada, Arkansas, California and Indiana, and; state Medicaid disproportionate share hospital payments in certain states including Texas and South Carolina. We are therefore particularly sensitive to potential reductions in Medicaid and other state based revenue programs as well as regulatory, economic, environmental and competitive changes in those states. We can provide no assurance that reductions to revenues earned pursuant to these programs, particularly in the above-mentioned states, will not have a material adverse effect on our future results of operations.
The ACA substantially increases the federally and state-funded Medicaid insurance program, and authorizes states to establish federally subsidized non-Medicaid health plans for low-income residents not eligible for Medicaid starting in 2014. However, the Supreme Court has struck down portions of the ACA requiring states to expand their Medicaid programs in exchange for increased federal funding. Accordingly, many states in which we operate have not expanded Medicaid coverage to individuals at 133% of the federal poverty level. Facilities in states not opting to expand Medicaid coverage under the ACA may be additionally penalized by corresponding reductions to Medicaid disproportionate share hospital payments beginning in 2020, as discussed below. We can provide no assurance that further reductions to Medicaid revenues, particularly in the above-mentioned states, will not have a material adverse effect on our future results of operations.
Various State Medicaid Supplemental Payment Programs:
We incur health-care related taxes (“Provider Taxes”) imposed by states in the form of a licensing fee, assessment or other mandatory payment which are related to: (i) healthcare items or services; (ii) the provision of, or the authority to provide, the health care items or services, or; (iii) the payment for the health care items or services. Such Provider Taxes are subject to various federal regulations that limit the scope and amount of the taxes that can be levied by states in order to secure federal matching funds as part of their respective state Medicaid programs. As outlined below, we derive a related Medicaid reimbursement benefit from assessed Provider Taxes in the form of Medicaid claims based payment increases and/or lump sum Medicaid supplemental payments.
61
Included in these Provider Tax programs are reimbursements received in connection with Texas Uncompensated Care/Upper Payment Limit program (“UC/UPL”) and Texas Delivery System Reform Incentive Payments program (“DSRIP”). Additional disclosure related to the Texas UC/UPL and DSRIP programs is provided below.
Texas Uncompensated Care/Upper Payment Limit Payments:
Certain of our acute care hospitals located in various counties of Texas (Grayson, Hidalgo, Maverick, Potter and Webb) participate in Medicaid supplemental payment Section 1115 Waiver indigent care programs. Section 1115 Waiver Uncompensated Care (“UC”) payments replace the former Upper Payment Limit (“UPL”) payments. These hospitals also have affiliation agreements with third-party hospitals to provide free hospital and physician care to qualifying indigent residents of these counties. Our hospitals receive both supplemental payments from the Medicaid program and indigent care payments from third-party, affiliated hospitals. The supplemental payments are contingent on the county or hospital district making an Inter-Governmental Transfer (“IGT”) to the state Medicaid program while the indigent care payment is contingent on a transfer of funds from the applicable affiliated hospitals. However, the county or hospital district is prohibited from entering into an agreement to condition any IGT on the amount of any private hospital’s indigent care obligation.
For state fiscal year 2017, Texas Medicaid continues to operate under a CMS-approved Section 1115 five-year Medicaid waiver demonstration program extended by CMS for fifteen months to December 31, 2017. During the first five years of this program that started in state fiscal year 2012, the THHSC transitioned away from UPL payments to new waiver incentive payment programs, UC and DSRIP payments. During demonstration periods ending December 31, 2017, THHSC continued to, make incentive payments under the program after certain qualifying criteria were met by hospitals. Supplemental payments are also subject to aggregate statewide caps based on CMS approved Medicaid waiver amounts.
On December 21, 2017, CMS approved the 1115 Waiver for the period January 1, 2018 to September 30, 2022. The Waiver continued to include UC and DSRIP payment pools with modifications and new state specific reporting deadlines that if not met by THHSC will result in material decreases in the size of the UC and DSRIP pools. For UC during the initial two years of this renewal, the UC program will remain relatively the same in size and allocation methodology. For year three of this waiver renewal, FFY 2020, and through FFY 2022, the size and distribution of the UC pool will be determined based on charity care costs reported to HHSC in accordance with Medicare cost report Worksheet S-10 principles. For FFY2020 and forward, we are unable to estimate the impact on of these UC program changes on our future operating results.
Texas Delivery System Reform Incentive Payments:
In addition, the Texas Medicaid Section 1115 Waiver includes a DSRIP pool to incentivize hospitals and other providers to transform their service delivery practices to improve quality, health status, patient experience, coordination, and cost-effectiveness. DSRIP pool payments are incentive payments to hospitals and other providers that develop programs or strategies to enhance access to health care, increase the quality of care, the cost-effectiveness of care provided and the health of the patients and families served. In May, 2014, CMS formally approved specific DSRIP projects for certain of our hospitals for demonstration years 3 to 5 (our facilities did not materially participate in the DSRIP pool during demonstration years 1 or 2). DSRIP payments are contingent on the hospital meeting certain pre-determined milestones, metrics and clinical outcomes. Additionally, DSRIP payments are contingent on a governmental entity providing an IGT for the non-federal share component of the DSRIP payment. THHSC generally approves DSRIP reported metrics, milestones and clinical outcomes on a semi-annual basis in June and December. Under the CMS approval noted above, the Waiver renewal requires the transition of the DSRIP program to one focused on "health system performance measurement and improvement." THHSC must submit a transition plan describing "how it will further develop its delivery system reforms without DSRIP funding and/or phase out DSRIP funded activities and meet mutually agreeable milestones to demonstrate its ongoing progress." The size of the DSRIP pool will remain unchanged for the initial two years of the waiver renewal with unspecified decreases in years three and four of the renewal, FFY 2020 and 2021, respectively. In FFY 2022, DSRIP funding under the waiver is eliminated. For FFY2020 and 2021, we are unable to estimate the impact of these DSRIP program changes on its operating results. For FFY 2022, we will no longer receive DSRIP funds due to the elimination of this funding source by CMS in the Waiver renewal.
Summary of Amounts Related To The Above-Mentioned Various State Medicaid Supplemental Payment Programs:
The following table summarizes the revenues, Provider Taxes and net benefit related to each of the above-mentioned Medicaid supplemental programs for the years ended December 31, 2017, 2016 and 2015. The Provider Taxes are recorded in other operating expenses on the Condensed Consolidated Statements of Income as included herein.
62
|
(amounts in millions) |
|
||||||||
|
|
2017 |
|
2016 |
|
2015 |
|
|||
|
Texas UC/UPL: |
|
|
|
|
|
|
|
|
|
|
Revenues |
$ |
88 |
|
$ |
56 |
|
$ |
69 |
|
|
Provider Taxes |
|
(25 |
) |
|
(10 |
) |
|
(8 |
) |
|
Net benefit |
$ |
63 |
|
$ |
46 |
|
$ |
61 |
|
|
|
|
|
|
|
|
|
|
|
|
|
Texas DSRIP: |
|
|
|
|
|
|
|
|
|
|
Revenues |
$ |
46 |
|
$ |
47 |
|
$ |
39 |
|
|
Provider Taxes |
|
(19 |
) |
|
(20 |
) |
|
(15 |
) |
|
Net benefit |
$ |
27 |
|
$ |
27 |
|
$ |
24 |
|
|
|
|
|
|
|
|
|
|
|
|
|
Various other state programs: |
|
|
|
|
|
|
|
|
|
|
Revenues |
$ |
223 |
|
$ |
224 |
|
$ |
199 |
|
|
Provider Taxes |
|
(127 |
) |
|
(136 |
) |
|
(114 |
) |
|
Net benefit |
$ |
96 |
|
$ |
88 |
|
$ |
85 |
|
|
|
|
|
|
|
|
|
|
|
|
|
Total all Provider Tax programs: |
|
|
|
|
|
|
|
|
|
|
Revenues |
$ |
357 |
|
$ |
327 |
|
$ |
307 |
|
|
Provider Taxes |
|
(171 |
) |
|
(166 |
) |
|
(137 |
) |
|
Net benefit |
$ |
186 |
|
$ |
161 |
|
$ |
170 |
|
We estimate that our aggregate net benefit from the Texas and various other state Medicaid supplemental payment programs will approximate $156 million (net of Provider Taxes of $172 million) during the year ended December 31, 2018. This estimate is based upon various terms and conditions that are out of our control including, but not limited to, the states’/CMS’s continued approval of the programs and the applicable hospital district or county making IGTs consistent with 2016 levels. Future changes to these terms and conditions could materially reduce our net benefit derived from the programs which could have a material adverse impact on our future consolidated results of operations. In addition, Provider Taxes are governed by both federal and state laws and are subject to future legislative changes that, if reduced from current rates in several states, could have a material adverse impact on our future consolidated results of operations.
Texas and South Carolina Medicaid Disproportionate Share Hospital Payments:
Hospitals that have an unusually large number of low-income patients (i.e., those with a Medicaid utilization rate of at least one standard deviation above the mean Medicaid utilization, or having a low income patient utilization rate exceeding 25%) are eligible to receive a DSH adjustment. Congress established a national limit on DSH adjustments. Although this legislation and the resulting state broad-based provider taxes have affected the payments we receive under the Medicaid program, to date the net impact has not been materially adverse.
Upon meeting certain conditions and serving a disproportionately high share of Texas’ and South Carolina’s low income patients, five of our facilities located in Texas and one facility located in South Carolina received additional reimbursement from each state’s DSH fund. The South Carolina and Texas DSH programs were renewed for each state’s 2018 DSH fiscal year (covering the period of October 1, 2017 through September 30, 2018).
In connection with these DSH programs, included in our financial results was an aggregate of approximately $34 million during 2017, $39 million during 2016 and $36 million during 2015. We expect the aggregate reimbursements to our hospitals pursuant to the Texas and South Carolina 2018 fiscal year programs to be approximately $36 million.
The ACA and subsequent federal legislation provides for a significant reduction in Medicaid disproportionate share payments beginning in federal fiscal year 2020 (see below in Sources of Revenues and Health Care Reform-Medicaid Revisions for additional disclosure). The U.S. Department of Health and Human Services is to determine the amount of Medicaid DSH payment cuts imposed on each state based on a defined methodology. As Medicaid DSH payments to states will be cut, consequently, payments to Medicaid-participating providers, including our hospitals in Texas and South Carolina, will be reduced in the coming years. Based on the CMS proposed rule published in July, 2017, Medicaid DSH payments in South Carolina and Texas could be reduced by approximately 20% and 14%, respectively, over the prior federal fiscal year.
Nevada SPA:
63
In Nevada, CMS approved a state plan amendment (“SPA”) in August, 2014 that implemented a hospital supplemental payment program retroactive to January 1, 2014. This SPA has been approved for additional state fiscal years including the 2018 fiscal year covering the period of July 1, 2017 through June 30, 2018.
In connection with this program, included in our financial results was approximately $21 million during 2017, $14 million during 2016 and $10 million during 2015. Assuming the program is approved for the state’s 2019 fiscal year, we estimate that our reimbursements pursuant to this program will approximate $22 million during the year ended December 31, 2018.
California SPA:
In California, CMS issued formal approval of the 2017-19 Hospital Fee Program in December, 2017 retroactive to January 1, 2017 through June 30, 2019. This approval included the Medicaid inpatient and outpatient fee-for-service supplemental payments and the overall provider tax structure but did not yet include the approval of the managed care payment component. Upon approval by CMS, the managed care payment component will consist of two categories of payments, “pass-through” payments and “directed” payments. The pass-through payments will be similar in nature to the prior Hospital Fee Program payment method whereas the directed payment method will be based on actual concurrent hospital Medicaid managed care in-network patient volume. The timing of CMS approval of the managed care payment component is uncertain. We are unable to estimate the impact of the managed care component of the Hospital Fee program but it could result in a material favorable impact on our operating results in 2018 and 2019. The 2017 impact of the California supplemental payment program is included in the above State Medicaid Supplemental Payment Program table.
Risk Factors Related To State Supplemental Medicaid Payments:
As outlined above, we receive substantial reimbursement from multiple states in connection with various supplemental Medicaid payment programs. The states include, but are not limited to, Texas, Mississippi, Illinois, Nevada, Arkansas, California and Indiana. Failure to renew these programs beyond their scheduled termination dates, failure of the public hospitals to provide the necessary IGTs for the states’ share of the DSH programs, failure of our hospitals that currently receive supplemental Medicaid revenues to qualify for future funds under these programs, or reductions in reimbursements, could have a material adverse effect on our future results of operations.
In April, 2016, CMS published its final Medicaid Managed Care Rule which explicitly permits but phases out the use of pass-through payments (including supplemental payments) by Medicaid Managed Care Organizations (“MCO”) to hospitals over ten years but allows for a transition of the pass-through payments into value-based payment structures, delivery system reform initiatives or payments tied to services under a MCO contract. Since we are unable to determine the financial impact of this aspect of the final rule, we can provide no assurance that the final rule will not have a material adverse effect on our future results of operations.
Massachusetts Health Safety Net Care Pool (“SNCP”)
Included in our 2017 financial results was a $7 million pre-tax charge incurred to establish a reserve related to Massachusetts Health SNCP payments received by certain of our behavioral health facilities during the period October, 2014 through December, 2016. SNCP payments are made by Massachusetts under the current CMS approved Section 1115 Medicaid Waiver available to Institutions of Medical Disease. During the second quarter of 2017, we received notification that such payments are subject to a retroactively applied uncompensated care cost limit protocol.
HITECH Act: In July 2010, the Department of Health and Human Services (“HHS”) published final regulations implementing the health information technology (“HIT”) provisions of the American Recovery and Reinvestment Act (referred to as the “HITECH Act”). The final regulation defines the “meaningful use” of Electronic Health Records (“EHR”) and establishes the requirements for the Medicare and Medicaid EHR payment incentive programs. The final rule established an initial set of standards and certification criteria. The implementation period for these new Medicare and Medicaid incentive payments started in federal fiscal year 2011 and can end as late as 2016 for Medicare and 2021 for the state Medicaid programs. State Medicaid program participation in this federally funded incentive program is voluntary but all of the states in which our eligible hospitals operate have chosen to participate. Our acute care hospitals may qualify for these EHR incentive payments upon implementation of the EHR application assuming they meet the “meaningful use” criteria. The government’s ultimate goal is to promote more effective (quality) and efficient healthcare delivery through the use of technology to reduce the total cost of healthcare for all Americans and utilizing the cost savings to expand access to the healthcare system.
Pursuant to HITECH Act regulations, hospitals that do not qualify as a meaningful user of EHR by 2015 are subject to a reduced market basket update to the IPPS standardized amount in 2015 and each subsequent fiscal year. We believe that all of our acute care hospitals have met the applicable meaningful use criteria and therefore are not subject to a reduced market basked update to the IPPS standardized amount in federal fiscal year 2015. However, under the HITECH Act, hospitals must continue to meet the applicable
64
meaningful use criteria in each fiscal year or they will be subject to a market basket update reduction in a subsequent fiscal year. Failure of our acute care hospitals to continue to meet the applicable meaningful use criteria would have an adverse effect on our future net revenues and results of operations.
In connection with the implementation of EHR applications at our acute care hospitals, our consolidated results of operations include net pre-tax charges of $22 million during 2017, $28 million during 2016 and $18 million during 2015. These net pre-tax charges consisted of depreciation and amortization expense related to the costs incurred for the purchase and development of the application, net of EHR incentive income (as reflected in 2016 and 2015 on our Consolidated Statements of Income) and net of the portion of the net expense that was attributable to noncontrolling interests.
Federal regulations require that Medicare EHR incentive payments be computed based on the Medicare cost report that begins in the federal fiscal period in which a hospital meets the applicable “meaningful use” requirements. Since the annual Medicare cost report periods for each of our acute care hospitals ends on December 31st, we will recognize Medicare EHR incentive income for each hospital during the fourth quarter of the year in which the facility meets the “meaningful use” criteria and during the fourth quarter of each applicable subsequent year.
Managed Care: A significant portion of our net patient revenues are generated from managed care companies, which include health maintenance organizations, preferred provider organizations and managed Medicare (referred to as Medicare Part C or Medicare Advantage) and Medicaid programs. In general, we expect the percentage of our business from managed care programs to continue to grow. The consequent growth in managed care networks and the resulting impact of these networks on the operating results of our facilities vary among the markets in which we operate. Typically, we receive lower payments per patient from managed care payors than we do from traditional indemnity insurers, however, during the past few years we have secured price increases from many of our commercial payors including managed care companies.
Commercial Insurance: Our hospitals also provide services to individuals covered by private health care insurance. Private insurance carriers typically make direct payments to hospitals or, in some cases, reimburse their policy holders, based upon the particular hospital’s established charges and the particular coverage provided in the insurance policy. Private insurance reimbursement varies among payors and states and is generally based on contracts negotiated between the hospital and the payor.
Commercial insurers are continuing efforts to limit the payments for hospital services by adopting discounted payment mechanisms, including predetermined payment or DRG-based payment systems, for more inpatient and outpatient services. To the extent that such efforts are successful and reduce the insurers’ reimbursement to hospitals and the costs of providing services to their beneficiaries, such reduced levels of reimbursement may have a negative impact on the operating results of our hospitals.
Other Sources: Our hospitals provide services to individuals that do not have any form of health care coverage. Such patients are evaluated, at the time of service or shortly thereafter, for their ability to pay based upon federal and state poverty guidelines, qualifications for Medicaid or other state assistance programs, as well as our local hospitals’ indigent and charity care policy. Patients without health care coverage who do not qualify for Medicaid or indigent care write-offs are offered substantial discounts in an effort to settle their outstanding account balances.
Health Care Reform: Listed below are the Medicare, Medicaid and other health care industry changes which are have been, or are scheduled to be, implemented as a result of the ACA.
Implemented Medicare Reductions and Reforms:
|
|
• |
The Reconciliation Act reduced the market basket update for inpatient and outpatient hospitals and inpatient behavioral health facilities by 0.25% in each of 2010 and 2011, by 0.10% in each of 2012 and 2013, 0.30% in 2014, 0.20% in each of 2015 and 2016 and 0.75% in each of 2017 and 2018. |
||||
|
|
• |
The ACA implemented certain reforms to Medicare Advantage payments, effective in 2011. |
||||
|
|
• |
A Medicare shared savings program, effective in 2012. |
||||
|
|
• |
A hospital readmissions reduction program, effective in 2012. |
||||
|
|
• |
A value-based purchasing program for hospitals, effective in 2012. |
||||
|
|
• |
A national pilot program on payment bundling, effective in 2013. |
||||
65
Medicaid Revisions:
|
|
• |
Expanded Medicaid eligibility and related special federal payments, effective in 2014. |
|
|
|
• |
The ACA (as amended by subsequent federal legislation) requires annual aggregate reductions in federal DSH funding from federal fiscal year (“FFY”) 2020 through FFY 2025. The aggregate annual reduction amounts are $4.0 billion for FFY 2020 and $8.0 billion for FFY 2021 through FFY 2025. |
|
Health Insurance Revisions:
|
|
• |
Large employer insurance reforms, effective in 2015. |
||
|
|
• |
Individual insurance mandate and related federal subsidies, effective in 2014. As noted above in Health Care Reform, the Tax Cuts and Jobs Act enacted into law in December, 2017 will remove the individual insurance federal mandate after December 31, 2018. |
||
|
|
• |
Federally mandated insurance coverage reforms, effective in 2010 and forward. |
||
The ACA seeks to increase competition among private health insurers by providing for transparent federal and state insurance exchanges. The ACA also prohibits private insurers from adjusting insurance premiums based on health status, gender, or other specified factors. We cannot provide assurance that these provisions will not adversely affect the ability of private insurers to pay for services provided to insured patients, or that these changes will not have a negative material impact on our results of operations going forward.
Value-Based Purchasing:
There is a trend in the healthcare industry toward value-based purchasing of healthcare services. These value-based purchasing programs include both public reporting of quality data and preventable adverse events tied to the quality and efficiency of care provided by facilities. Governmental programs including Medicare and Medicaid currently require hospitals to report certain quality data to receive full reimbursement updates. In addition, Medicare does not reimburse for care related to certain preventable adverse events. Many large commercial payers currently require hospitals to report quality data, and several commercial payers do not reimburse hospitals for certain preventable adverse events.
The ACA contains a number of provisions intended to promote value-based purchasing. The ACA prohibits the use of federal funds under the Medicaid program to reimburse providers for medical assistance provided to treat hospital acquired conditions (“HAC”). Beginning in FFY 2015, hospitals that fall into the top 25% of national risk-adjusted HAC rates for all hospitals in the previous year will receive a 1% reduction in their total Medicare payments. Additionally, hospitals with excessive readmissions for conditions designated by HHS will receive reduced payments for all inpatient discharges, not just discharges relating to the conditions subject to the excessive readmission standard.
The ACA also required HHS to implement a value-based purchasing program for inpatient hospital services which became effective on October 1, 2012. The ACA requires HHS to reduce inpatient hospital payments for all discharges by a percentage beginning at 1% in FFY 2013 and increasing by 0.25% each fiscal year up to 2% in FFY 2017 and subsequent years. HHS will pool the amount collected from these reductions to fund payments to reward hospitals that meet or exceed certain quality performance standards established by HHS. HHS will determine the amount each hospital that meets or exceeds the quality performance standards will receive from the pool of dollars created by these payment reductions. In its fiscal year 2016 IPPS final rule, CMS funded the value-based purchasing program by reducing base operating DRG payment amounts to participating hospitals by 1.75%. For FFY 2017, this reduction was increased to its maximum of 2%.
Readmission Reduction Program:
In the ACA, Congress also mandated implementation of the hospital readmission reduction program (“HRRP”). The HRRP currently assesses penalties on hospitals having excess readmission rates for heart failure, myocardial infarction, pneumonia, acute exacerbation of chronic obstructive pulmonary disease (COPD) and elective total hip arthroplasty (THA) and total knee arthroplasty (TKA), excluding planned readmissions, when compared to expected rates. In the fiscal year 2015 IPPS final rule, CMS added readmissions for coronary artery bypass graft (CABG) surgical procedures beginning in fiscal year 2017. The impact of HRRP has not had a material adverse effect on our results of operations.
Accountable Care Organizations:
66
The ACA requires HHS to establish a Medicare Shared Savings Program that promotes accountability and coordination of care through the creation of accountable care organizations (“ACOs”). The ACO program allows providers (including hospitals), physicians and other designated professionals and suppliers to voluntarily work together to invest in infrastructure and redesign delivery processes to achieve high quality and efficient delivery of services. The program is intended to produce savings as a result of improved quality and operational efficiency. ACOs that achieve quality performance standards established by HHS will be eligible to share in a portion of the amounts saved by the Medicare program.
In addition to statutory and regulatory changes to the Medicare and each of the state Medicaid programs, our operations and reimbursement may be affected by administrative rulings, new or novel interpretations and determinations of existing laws and regulations, post-payment audits, requirements for utilization review and new governmental funding restrictions, all of which may materially increase or decrease program payments as well as affect the cost of providing services and the timing of payments to our facilities. The final determination of amounts we receive under the Medicare and Medicaid programs often takes many years, because of audits by the program representatives, providers’ rights of appeal and the application of numerous technical reimbursement provisions. We believe that we have made adequate provisions for such potential adjustments. Nevertheless, until final adjustments are made, certain issues remain unresolved and previously determined allowances could become either inadequate or more than ultimately required.
Finally, we expect continued third-party efforts to aggressively manage reimbursement levels and cost controls. Reductions in reimbursement amounts received from third-party payors could have a material adverse effect on our financial position and our results.
Other Operating Results
Interest Expense
Below is a schedule of our interest expense during 2017, 2016 and 2015 (amounts in thousands):
|
|
|
2017 |
|
|
2016 |
|
|
2015 |
|
|||
|
Revolving credit & demand notes (a.) |
|
$ |
10,933 |
|
|
$ |
4,577 |
|
|
$ |
3,355 |
|
|
$400 million, 7.125% Senior Notes due 2016 (b.) |
|
|
— |
|
|
|
12,031 |
|
|
|
28,496 |
|
|
$300 million, 3.75% Senior Notes due 2019 |
|
|
11,250 |
|
|
|
11,250 |
|
|
|
11,250 |
|
|
$700 million, 4.75% Senior Notes due 2022 (c.) |
|
|
32,280 |
|
|
|
24,628 |
|
|
|
14,250 |
|
|
$400 million, 5.00% Senior Notes due 2026 (d.) |
|
|
20,000 |
|
|
|
11,556 |
|
|
|
— |
|
|
Term loan facility A |
|
|
47,745 |
|
|
|
36,578 |
|
|
|
30,175 |
|
|
Accounts receivable securitization program (e.) |
|
|
7,987 |
|
|
|
4,739 |
|
|
|
3,074 |
|
|
Subtotal-revolving credit, demand notes, Senior Notes, term loan facility and accounts receivable securitization program |
|
|
130,195 |
|
|
|
105,359 |
|
|
|
90,600 |
|
|
Interest rate swap expense, net |
|
|
2,403 |
|
|
|
8,488 |
|
|
|
10,206 |
|
|
Amortization of financing fees |
|
|
8,932 |
|
|
|
8,208 |
|
|
|
7,134 |
|
|
Other combined interest expense |
|
|
4,740 |
|
|
|
5,064 |
|
|
|
6,137 |
|
|
Capitalized interest on major projects |
|
|
(1,020 |
) |
|
|
(1,916 |
) |
|
|
(304 |
) |
|
Interest income |
|
|
(81 |
) |
|
|
(150 |
) |
|
|
(279 |
) |
|
Interest expense, net |
|
$ |
145,169 |
|
|
$ |
125,053 |
|
|
$ |
113,494 |
|
67
|
|
(b.) |
The $400 million, 7.125% Senior Notes matured and were repaid in June, 2016 utilizing a portion of the funds generated from the debt issuances described in (a.), (c.) and (d.). |
|
|
(c.) |
In June, 2016, we completed the offering of an additional $400 million aggregate principal amount of 4.75% Senior Notes due in 2022 (issued at a yield of 4.35%), the terms of which were identical to the terms of our $300 million aggregate principal amount of 4.75% Senior Notes due in 2022, issued in August, 2014. These Senior Notes, combined, are referred to as $700 million, 4.75% Senior Notes due in 2022. |
|
|
(d.) |
In June, 2016, we completed the offering of $400 million aggregate principal amount of 5.00% Senior Notes due in 2026. |
|
|
(e.) |
In July, 2017, we amended our accounts receivable securitization program, which is scheduled to expire on December 21, 2018, to increase the borrowing limit to $440 million from $400 million ($420 million outstanding as of December 31, 2017). |
Interest expense increased $20 million during 2017 to $145 million as compared to $125 million during 2016. The increase was due primarily to: (i) a $25 million increase in aggregate interest expense on our revolving credit, demand notes, senior notes, term loan facility and accounts receivable securitization program resulting from an increase in the average outstanding borrowings ($4.02 billion during 2017, as compared to $3.54 billion during 2016), as well as an increase in our aggregate average cost of borrowings pursuant to these facilities (3.2% during 2017, as compared to 3.0% during 2016); (ii) a $1 million decrease in capitalized interest on major projects, partially offset by; (iii) a $6 million decrease in our interest rate swap expense.
Interest expense increased $12 million during 2016 to $125 million as compared to $113 million during 2015. The increase was due primarily to: (i) a $15 million increase in aggregate interest expense on our revolving credit, demand notes, senior notes, term loan facility and accounts receivable securitization program due to an increase in the aggregate average outstanding borrowings ($3.54 billion during 2016 as compared to $3.14 billion during 2015), as well as an increase in our aggregate average cost of borrowings pursuant to these facilities (3.0% during 2016 as compared to 2.9% during 2015); (ii) a $2 million decrease in interest rate swap expense, resulting primarily from the 2015 maturities of previously outstanding interest rate swaps, and; (iii) other combined net decrease of $1 million.
The aggregate average outstanding borrowings under our revolving credit, demand notes, senior notes, term loan facilities and accounts receivable securitization program were approximately $4.02 billion during 2017, $3.54 billion during 2016 and $3.14 billion during 2015. The average effective interest rate on these facilities, including amortization of deferred financing costs and original issue discounts and designated interest rate swap expense was 3.5% during 2017 and 3.4% during each of 2016 and 2015.
Provision for Income Taxes and Effective Tax Rates
The effective tax rates, as calculated by dividing the provision for income taxes by income before income taxes, were as follows for each of the years ended December 31, 2017, 2016 and 2015 (dollar amounts in thousands):
|
|
|
2017 |
|
|
2016 |
|
|
2015 |
|
|||
|
Provision for income taxes |
|
$ |
363,697 |
|
|
$ |
409,187 |
|
|
$ |
395,203 |
|
|
Income before income taxes |
|
|
1,135,009 |
|
|
|
1,156,358 |
|
|
|
1,145,901 |
|
|
Effective tax rate |
|
|
32.0 |
% |
|
|
35.4 |
% |
|
|
34.5 |
% |
In May, 2016, we purchased third-party minority ownership interests in six acute care hospitals located in Las Vegas, Nevada. Prior to that date, outside owners held various noncontrolling, minority ownership interests in eight of our acute care facilities and one behavioral health care facility. Each of these facilities are owned and operated by limited liability companies (“LLC”) or limited partnerships (“LP”). As a result, since there is no income tax liability incurred at the LLC/LP level (since it passes through to the members/partners), the net income attributable to noncontrolling interests does not include any income tax provision/benefit. When computing the provision for income taxes, as reflected on our consolidated statements of income, the net income attributable to noncontrolling interests is deducted from income before income taxes since it represents the third-party members’/partners’ share of the income generated by the joint-venture entities. In addition to providing the effective tax rates, as indicated above (as calculated from dividing the provision for income taxes by the income before income taxes as reflected on the consolidated statements of income), we believe it is helpful to our investors that we also provide our effective tax rate as calculated after giving effect to the portion of our pre-tax income that is attributable to the third-party members/partners.
68
The effective tax rates, as calculated by dividing the provision for income taxes by the difference in income before income taxes, minus net income attributable to noncontrolling interests, were as follows for each of the years ended December 31, 2017, 2016 and 2015 (dollar amounts in thousands):
|
|
|
2017 |
|
|
2016 |
|
|
2015 |
|
|||
|
Provision for income taxes |
|
$ |
363,697 |
|
|
$ |
409,187 |
|
|
$ |
395,203 |
|
|
|
|
|
|
|
|
|
|
|
|
|
|
|
|
Income before income taxes |
|
|
1,135,009 |
|
|
|
1,156,358 |
|
|
|
1,145,901 |
|
|
Less: Net income attributable to noncontrolling interests |
|
|
(19,009 |
) |
|
|
(44,762 |
) |
|
|
(70,170 |
) |
|
Income before income taxes and after net income attributable to noncontrolling interests |
|
|
1,116,000 |
|
|
|
1,111,596 |
|
|
|
1,075,731 |
|
|
Effective tax rate |
|
|
32.6 |
% |
|
|
36.8 |
% |
|
|
36.7 |
% |
The decrease in the effective tax rate during 2017, as compared to 2016 and 2015, was due primarily to the following that increased or decreased our provision for income taxes in 2017:
|
|
• |
a decrease of $30 million resulting from a reduction in our net deferred income tax liability recorded in connection with the TCJA-17 which reduced the U.S. federal corporate tax rate to 21% from 35%, effective January 1, 2018; |
|
|
• |
an increase of $11 million due to a one-time repatriation tax incurred pursuant to the TCJA-17 (in connection with our behavioral health care facilities located in the U.K. and Puerto Rico); |
|
|
• |
a decrease of $22 million resulting from our January 1, 2017 adoption of ASU 2016-09, as discussed herein, and; |
|
|
• |
a decrease caused by lower effective rates applicable to the income generated during 2017 in connection with our acquisition of Cambian Group, PLC’s adult services division (acquired in late December, 2016). |
The impact of discrete tax items did not have a material impact on our provision for income taxes during 2016 or 2015.
Previously, in 2016 and 2015, we had provided no deferred taxes related to unremitted earnings from foreign subsidiaries. As a result of the mandatory repatriation tax provisions in the TCJA-17, we recorded an accrued tax provision of $11 million as of December 31, 2017. Going forward, we anticipate repatriating only previously taxed foreign income subject to the mandatory repatriation tax and any future earnings that would qualify for a full dividend received deduction permitted under the TCJA-17 for distributions after December 31, 2017. At this time, there are no material tax effects related to future cash repatriation of our previously taxed foreign income. As such, we have not recognized a deferred tax liability related to existing undistributed earnings.
Effects of Inflation and Seasonality
Seasonality —Our acute care services business is typically seasonal, with higher patient volumes and net patient service revenue in the first and fourth quarters of the year. This seasonality occurs because, generally, more people become ill during the winter months, which results in significant increases in the number of patients treated in our hospitals during those months.
Inflation —Inflation has not had a material impact on our results of operations over the last three years. However, since the healthcare industry is very labor intensive and salaries and benefits are subject to inflationary pressures, as are supply and other costs, we cannot predict the impact that future economic conditions may have on our ability to contain future expense increases. Our ability to pass on increased costs associated with providing healthcare to Medicare and Medicaid patients is limited due to various federal, state and local laws which have been enacted that, in certain cases, limit our ability to increase prices. We believe, however, that through adherence to cost containment policies, labor management and reasonable price increases, the effects of inflation on future operating margins should be manageable.
69
Year ended December 31, 2017 as compared to December 31, 2016:
Net cash provided by operating activities
Net cash provided by operating activities was $1.183 billion during 2017 as compared to $1.334 billion during 2016. The net decrease of $151 million was primarily attributable to the following:
|
|
• |
an unfavorable change of $144 million in cash flows from forward exchange contracts related to our investments in the United Kingdom; |
|
|
• |
an unfavorable change of $90 million in other working capital accounts resulting primarily from changes in accounts payable and accrued expenses due to timing of disbursements; |
|
|
• |
a favorable change of $64 million due to an increase in net income plus depreciation and amortization and stock-based compensation expense; |
|
|
• |
a favorable change of $63 million in accounts receivable; |
|
|
• |
an unfavorable change of $28 million in accrued and deferred income taxes, and; |
|
|
• |
$16 million of other combined net unfavorable changes. |
Days sales outstanding (“DSO”): Our DSO are calculated by dividing our net revenue by the number of days in the year. The result is divided into the accounts receivable balance the end of the year. Our DSO were 53 days at each of December 31, 2017, 2016 and 2015.
Our accounts receivable as of December 31, 2017 and December 31, 2016 include amounts due from Illinois of approximately $25 million and $38 million, respectively. Collection of the outstanding receivables continues to be delayed due to state budgetary and funding pressures. Approximately $8 million as of December 31, 2017 and $25 million as of December 31, 2016, of the receivables due from Illinois were outstanding in excess of 60 days, as of each respective date. Although the accounts receivable due from Illinois could remain outstanding for the foreseeable future, since we expect to eventually collect all amounts due to us, no related reserves have been established in our consolidated financial statements. However, we can provide no assurance that we will eventually collect all amounts due to us from Illinois. Failure to ultimately collect all outstanding amounts due to us from Illinois would have an adverse impact on our future consolidated results of operations and cash flows.
Net cash used in investing activities
Net cash used in investing activities was $624 million during 2017 and $1.187 billion during 2016
2017:
The $624 million of net cash used in investing activities during 2017 consisted of:
|
|
• |
$557 million spent on capital expenditures including capital expenditures for equipment, renovations and new projects at various existing facilities; |
|
|
• |
$29 million spent on the purchase and implementation of information technology applications; |
|
|
• |
$23 million spent to acquire businesses and property; |
|
|
• |
$8 million spent to fund construction costs of a new behavioral health care facility which will be jointly owned by us and a third-party, and; |
|
|
• |
$7 million spent to increase the statutorily required capital reserves of our commercial insurance subsidiary. |
2016:
The $1.187 billion of net cash used in investing activities during 2016 consisted of:
|
|
• |
$614 million spent related to the acquisition of businesses and property including the acquisition of the adult services division of Cambian Group, PLC consisting of 79 inpatient and 2 outpatient behavioral health facilities located in the U.K., the acquisition of Desert View Hospital, a 25-bed acute care facility located in Pahrump, Nevada, and the acquisition of various other businesses and real property assets; |
|
|
• |
$520 million spent on capital expenditures; |
|
|
• |
$32 million spent to increase the statutorily required capital reserves of our commercial insurance subsidiary, and; |
70
Net cash used in financing activities
Net cash used in financing activities was $519 million during 2017 and $171 million during 2016.
2017:
The $519 million of net cash used in financing activities during 2017 consisted of the following:
|
|
• |
spent $143 million on net repayment of debt as follows: (i) $89 million related to our term loan A facility; (ii) $52 million related to our revolving credit facility, and; (iii) $2 million related to other debt facilities; |
|
|
• |
generated $41 million of proceeds related to new borrowings pursuant to our accounts receivable securitization program ($21 million) and short-term, on-demand credit facility ($20 million); |
|
|
• |
spent $364 million to repurchase shares of our Class B Common Stock in connection with: (i) open market purchases pursuant to our $1.2 billion stock repurchase program ($330 million), and; (ii) income tax withholding obligations related to stock-based compensation programs ($34 million); |
|
|
• |
spent $38 million to pay dividends (paid quarterly at $.10 per share); |
|
|
• |
spent $25 million to pay profit distributions related to noncontrolling interests in majority owned businesses, and; |
|
|
• |
generated $10 million from the issuance of shares of our Class B Common Stock pursuant to the terms of employee stock purchase plans. |
2016:
The $171 million of net cash used in financing activities during 2016 consisted of the following:
|
|
• |
spent $459 million on net repayment of debt as follows: (i) $400 million related to the 7.125% senior secured notes that matured in June, 2016; (ii) $55 million related to our term loan A facility; (iii) $1 million related to our accounts receivable securitization program, and; (iv) $3 million related to other debt facilities; |
|
|
• |
generated $1.171 billion of proceeds related to new borrowings as follows: (i) $406 million received in connection with the issuance of additional 4.75% senior secured notes due in 2022; (ii) $400 million received from the issuance of 5.0% senior secured notes due in 2026; (iii) $200 million of additional borrowings pursuant to our term loan A facility; (iv) $155 million of additional borrowings pursuant to our revolving credit facility, and; (v) $10 million of proceeds from new borrowings pursuant to a short-term, on-demand credit facility; |
|
|
• |
spent $418 million to purchase third-party minority ownership interests in our six acute care hospitals located in Las Vegas, Nevada; |
|
|
• |
spent $353 million to repurchase shares of our Class B Common Stock in connection with: (i) open market purchases pursuant to our stock repurchase program ($296 million), and; (ii) income tax withholding obligations related to stock-based compensation programs ($57 million); |
|
|
• |
spent $70 million to pay profit distributions related to noncontrolling interests in majority owned businesses |
|
|
• |
spent $39 million to pay dividends (paid quarterly at $.10 per share); |
|
|
• |
generated $10 million from the issuance of shares of our Class B Common Stock pursuant to the terms of employee stock purchase plans, and; |
|
|
• |
spent $12 million in financing costs. |
71
Year ended December 31, 2016 as compared to December 31, 2015:
Net cash provided by operating activities
Net cash provided by operating activities was $1.334 billion during 2016 as compared to $1.068 billion during 2015. The net increase of $266 million was primarily attributable to the following:
|
|
• |
a favorable change of $26 million due to an increase in net income plus/minus depreciation and amortization expense, stock-based compensation expense and net gains on sales of assets and businesses; |
|
|
• |
$200 million favorable change in other working capital accounts due primarily to favorable changes in accrued compensation and accounts payable resulting from the timing of disbursements; |
|
|
• |
$56 million favorable change in cash flows from forward exchange contracts related to our investment in foreign operations; |
|
|
• |
$42 million unfavorable change in accounts receivable; |
|
|
• |
$56 million favorable change in accrued and deferred income taxes; |
|
|
• |
$32 million unfavorable change in other assets and deferred charges, and; |
|
|
• |
$2 million of other combined net favorable changes. |
Net cash used in investing activities
Net cash used in investing activities was $1.187 billion during 2016 and $913 million during 2015. The factors contributing to the $1.187 billion of net cash used in investing activities during 2016 are detailed above.
2015:
The $913 million of net cash used in investing activities during 2015 consisted of:
|
|
• |
$534 million spent related to the acquisition of businesses and property including a 46-bed behavioral health care facility located in the U.K., Alpha Hospitals Holdings Limited consisting of four behavioral health care hospitals located in the U.K., Foundations Recovery Network, LLC consisting of 4 inpatient facilities as well as 8 outpatient centers and various other businesses, a management contract and real property assets; |
|
|
• |
$379 million spent on capital expenditures |
|
|
• |
$3 million spent to increase investments of insurance subsidiary, and; |
|
|
• |
$3 million received from the sale of assets and businesses consisting primarily of divestiture of a small operator of behavioral health care services. |
Net cash used in financing activities
Net cash used in financing activities was $171 million during 2016 and $125 million during 2015. The factors contributing to the $171 million of net cash used in financing activities during 2016 are detailed above.
2015:
The $125 million of net cash used in financing activities during 2015 consisted of the following:
|
|
• |
generated $234 million of proceeds from additional borrowings consisting of: (i) $160 million of proceeds from new borrowings pursuant to our revolving credit facility; (ii) $70 million of proceeds from new borrowings pursuant to our accounts receivable securitization program, and; (iii) $4 million of proceeds from new borrowings pursuant to a short-term, on-demand credit facility; |
|
|
• |
spent $68 million on net repayments of debt due primarily to repayments pursuant to our term loan A facility ($44 million) and various other combined debt facilities ($24 million); |
|
|
• |
spent $210 million to repurchase shares of our Class B Common Stock in connection with: (i) open market purchases pursuant to our stock repurchase program ($152 million), and; (ii) income tax withholding obligations related to stock-based compensation programs ($58 million); |
72
|
|
• |
spent $62 million to pay profit distributions related to noncontrolling interests in majority owned businesses; |
|
|
• |
generated $8 million from the issuance of shares of our Class B Common Stock pursuant to the terms of employee stock purchase plans; |
|
|
• |
generated $13 million from the from the sale/leaseback of two free-standing emergency departments, and; |
|
|
• |
spent $1 million in financing costs. |
2018 Expected Capital Expenditures:
During 2018, we expect to spend approximately $600 million to $625 million on capital expenditures which includes expenditures for capital equipment, renovations and new projects at existing hospitals. Approximately $280 million of our 2018 expected capital expenditures relates to completion of projects that are in progress as of December 31, 2017. We believe that our capital expenditure program is adequate to expand, improve and equip our existing hospitals. We expect to finance all capital expenditures and acquisitions with internally generated funds and/or additional funds, as discussed below.
Capital Resources
Credit Facilities and Outstanding Debt Securities
On June 7, 2016, we entered into a Fifth Amendment (the “Fifth Amendment”) to our credit agreement dated as of November 15, 2010, as amended on March 15, 2011, September 21, 2012, May 16, 2013 and August 7, 2014, among UHS, as borrower, the several banks and other financial institutions from time to time parties thereto, as lenders (“Credit Agreement”). The Fifth Amendment increased the size of the term loan A facility by $200 million and those proceeds were utilized to repay outstanding borrowings under the revolving credit facility of the Credit Agreement. The Credit Agreement, as amended, which is scheduled to mature in August, 2019, consists of: (i) an $800 million revolving credit facility ($403 million of borrowings outstanding as of December 31, 2017), and; (ii) a term loan A facility with $1.775 billion of borrowings outstanding as of December 31, 2017.
Borrowings under the Credit Agreement bear interest at our election at either (1) the ABR rate which is defined as the rate per annum equal to the greatest of (a) the lender’s prime rate, (b) the weighted average of the federal funds rate, plus 0.5% and (c) one month LIBOR rate plus 1%, in each case, plus an applicable margin based upon our consolidated leverage ratio at the end of each quarter ranging from 0.50% to 1.25% for revolving credit and term loan-A borrowings, or (2) the one, two, three or six month LIBOR rate (at our election), plus an applicable margin based upon our consolidated leverage ratio at the end of each quarter ranging from 1.50% to 2.25% for revolving credit and term loan-A borrowings. As of December 31, 2017, the applicable margins were 0.50% for ABR-based loans and 1.50% for LIBOR-based loans under the revolving credit and term loan-A facilities.
As of December 31, 2017, we had $403 million of borrowings outstanding pursuant to the terms of our $800 million revolving credit facility and we had $329 million of available borrowing capacity net of $33 million of outstanding letters of credit and $35 million of outstanding borrowings pursuant to a short-term, on-demand credit facility. The revolving credit facility includes a $125 million sub-limit for letters of credit. The Credit Agreement is collateralized by certain assets of the Company (which generally excludes asset classes such as substantially all of the patient-related accounts receivable of our acute care hospitals, certain real estate assets and assets held in joint-ventures with third-parties) and our material subsidiaries and guaranteed by our material subsidiaries.
Pursuant to the terms of the Credit Agreement, term loan-A installment payments of approximately $22 million per quarter commenced during the fourth quarter of 2016 and are scheduled through June, 2019. Previously, approximately $11 million of quarterly installment payments were made from the fourth quarter of 2014 through the third quarter of 2016.
In July, 2017, we amended our accounts receivable securitization program (“Securitization”) with a group of conduit lenders and liquidity banks to increase the borrowing capacity to $440 million from $400 million previously. Pursuant to the terms of our Securitization program, on which the scheduled maturity date of December, 2018 remained unchanged, substantially all of the patient-related accounts receivable of our acute care hospitals (“Receivables”) serve as collateral for the outstanding borrowings. We have accounted for this Securitization as borrowings. We maintain effective control over the Receivables since, pursuant to the terms of the Securitization, the Receivables are sold from certain of our subsidiaries to special purpose entities that are wholly-owned by us. The Receivables, however, are owned by the special purpose entities, can be used only to satisfy the debts of the wholly-owned special purpose entities, and thus are not available to us except through our ownership interest in the special purpose entities. The wholly-owned special purpose entities use the Receivables to collateralize the loans obtained from the group of third-party conduit lenders and liquidity banks. The group of third-party conduit lenders and liquidity banks do not have recourse to us beyond the assets of the wholly-owned special purpose entities that securitize the loans. At December 31, 2017, we had $420 million of outstanding borrowings pursuant to the terms of the Securitization, which are included in current maturities of long-term debt as of that date, and $20 million of available borrowing capacity.
73
As of December 31, 2017, we had combined aggregate principal of $1.4 billion from the following senior secured notes:
|
|
• |
$300 million aggregate principal amount of 3.75% senior secured notes due in August, 2019 (“2019 Notes”) which were issued on August 7, 2014. |
|
|
• |
$700 million aggregate principal amount of 4.75% senior secured notes due in August, 2022 (“2022 Notes”) which were issued as follows: |
|
|
o |
$300 million aggregate principal amount issued on August 7, 2014 at par. |
|
|
o |
$400 million aggregate principal amount issued on June 3, 2016 at 101.5% to yield 4.35%. |
|
|
• |
$400 million aggregate principal amount of 5.00% senior secured notes due in June, 2026 (“2026 Notes”) which were issued on June 3, 2016. |
Interest is payable on the 2019 Notes and the 2022 Notes on February 1 and August 1 of each year until the maturity date of August 1, 2019 for the 2019 Notes and August 1, 2022 for the 2022 Notes. Interest on the 2026 Notes is payable on June 1 and December 1 until the maturity date of June 1, 2026. The 2019 Notes, 2022 Notes and 2026 Notes were offered only to qualified institutional buyers under Rule 144A and to non-U.S. persons outside the United States in reliance on Regulation S under the Securities Act of 1933, as amended (the “Securities Act”). The 2019 Notes, 2022 Notes and 2026 Notes have not been registered under the Securities Act and may not be offered or sold in the United States absent registration or an applicable exemption from registration requirements.
In June, 2016, we repaid the $400 million, 7.125% senior secured notes which matured on June 30, 2016.
The average amounts outstanding during each of years 2017, 2016 and 2015 under the current and prior Credit Agreements, demand notes and accounts receivable securitization programs was $2.6 billion, $2.3 billion and $2.1 billion, respectively, with corresponding interest rates of 2.5%, 2.0% and 1.7%, respectively, including commitment and facility fees. The maximum amounts outstanding at any month-end were $2.7 billion in 2017, $2.7 billion in 2016 and $2.3 billion in 2015. The effective interest rate on our current and prior Credit Agreements, accounts receivable securitization programs, and demand notes, which includes the respective interest expense, commitment and facility fees, designated interest rate swaps expense and amortization of deferred financing costs and original issue discounts, was 2.8% in 2017, 2.6% in 2016 and 2.4% in 2015.
Our Credit Agreement includes a material adverse change clause that must be represented at each draw. The Credit Agreement contains covenants that include a limitation on sales of assets, mergers, change of ownership, liens and indebtedness, transactions with affiliates, dividends and stock repurchases; and requires compliance with financial covenants including maximum leverage and minimum interest coverage ratios. We are in compliance with all required covenants as of December 31, 2017.
At December 31, 2017, the net carrying value and fair value of our debt were approximately $4.0 billion and $4.1 billion, respectively. At December 31, 2016, the carrying value and fair value of our debt were each approximately $4.1 billion. The fair value of our debt was computed based upon quotes received from financial institutions. We consider these to be “level 2” in the fair value hierarchy as outlined in the authoritative guidance for disclosures in connection with debt instruments.
Our total debt as a percentage of total capitalization was 45% at December 31, 2017 and 48% at December 31, 2016.
We expect to finance all capital expenditures and acquisitions, pay dividends and potentially repurchase shares of our common stock utilizing internally generated and additional funds. Additional funds may be obtained through: (i) borrowings under our existing revolving credit facility or through refinancing the existing revolving credit agreement; (ii) the issuance of other long-term debt, and/or; (iii) the issuance of equity. We believe that our operating cash flows, cash and cash equivalents, available borrowing capacity under our $800 million revolving credit facility and $440 million accounts receivable securitization program, as well as access to the capital markets, provide us with sufficient capital resources to fund our operating, investing and financing requirements for the next twelve months. However, in the event we need to access the capital markets or other sources of financing, there can be no assurance that we will be able to obtain financing on acceptable terms or within an acceptable time. Our inability to obtain financing on terms acceptable to us could have a material unfavorable impact on our results of operations, financial condition and liquidity.
Contractual Obligations and Off-Balance Sheet Arrangements
As of December 31, 2017 we were party to certain off balance sheet arrangements consisting of standby letters of credit and surety bonds which totaled $120 million consisting of: (i) $113 million related to our self-insurance programs, and; (ii) $7 million of other debt and public utility guarantees.
Obligations under operating leases for real property, real property master leases and equipment amount to $402 million as of December 31, 2017. The real property master leases are leases for buildings on or near hospital property for which we guarantee a
74
certain level of rental income. We sublease space in these buildings and any amounts received from these subleases are offset against the expense. In addition, we lease three hospital facilities from Universal Health Realty Trust (the “Trust”) with terms expiring in 2021. These leases contain up to two 5-year renewal options. We also lease two free-standing emergency departments and space in certain medical office buildings which are owned by the Trust. In addition, we lease the real property of certain other facilities from non-related parties as indicated in Item 2. Properties, as included herein.
The following represents the scheduled maturities of our contractual obligations as of December 31, 2017:
|
|
|
Payments Due by Period (dollars in thousands) |
|
|||||||||||||||||
|
|
|
|
|
|
|
Less than |
|
|
2-3 |
|
|
4-5 |
|
|
After |
|
||||
|
|
|
Total |
|
|
1 year |
|
|
years |
|
|
years |
|
|
5 years |
|
|||||
|
Long-term debt obligations (a) |
|
$ |
4,059,238 |
|
|
$ |
545,885 |
|
|
$ |
2,392,683 |
|
|
$ |
708,166 |
|
|
$ |
412,504 |
|
|
Estimated future interest payments on debt outstanding as of December 31, 2017 (b) |
|
|
495,757 |
|
|
|
164,903 |
|
|
|
156,733 |
|
|
|
97,005 |
|
|
|
77,116 |
|
|
Construction commitments (c) |
|
|
30,062 |
|
|
|
30,062 |
|
|
|
0 |
|
|
|
0 |
|
|
|
0 |
|
|
Purchase and other obligations (d) |
|
|
315,399 |
|
|
|
72,070 |
|
|
|
108,279 |
|
|
|
93,100 |
|
|
|
41,950 |
|
|
Operating leases (e) |
|
|
402,417 |
|
|
|
73,310 |
|
|
|
114,104 |
|
|
|
67,038 |
|
|
|
147,965 |
|
|
Estimated future payments for defined benefit pension plan, and other retirement plan (f) |
|
|
205,896 |
|
|
|
13,114 |
|
|
|
14,764 |
|
|
|
16,931 |
|
|
|
161,087 |
|
|
Health and dental unpaid claims (g) |
|
|
85,527 |
|
|
|
85,527 |
|
|
|
0 |
|
|
|
0 |
|
|
|
0 |
|
|
Total contractual cash obligations |
|
$ |
5,594,296 |
|
|
$ |
984,871 |
|
|
$ |
2,786,563 |
|
|
$ |
982,240 |
|
|
$ |
840,622 |
|
|
(a) |
Reflects borrowings outstanding as of December 31, 2017 as discussed in Note 4 to the Consolidated Financial Statements. |
|
(b) |
Assumes that all debt outstanding as of December 31, 2017, including borrowings under our Credit Agreement, demand note and accounts receivable securitization program, remain outstanding until the final maturity of the debt agreements at the same interest rates (some of which are floating) which were in effect as of December 31, 2017. We have the right to repay borrowings upon short notice and without penalty, pursuant to the terms of the Credit Agreement, demand note and accounts receivable securitization program. Also includes the impact of various interest rate swap and cap agreements in effect as of December 31, 2017, as calculated to maturity dates utilizing the applicable floating interest rates in effect as of December 31, 2017. |
|
(c) |
Our share of the remaining estimated construction cost of two newly constructed behavioral health care facilities located in Pennsylvania and Washington that are scheduled to be completed and opened 2018. We are required to build these facilities pursuant to joint-venture agreements with third parties. In addition, we had various other projects under construction as of December 31, 2017. Because we can terminate substantially all of the construction contracts related to the various other projects at any time without paying a termination fee, these costs are excluded from the table above. |
|
(d) |
Consists of: (i) $73 million related to long-term contracts with third-parties consisting primarily of certain revenue cycle data processing services for our acute care facilities; (ii) $240 million related to the future expected costs to be paid to a third-party vendor in connection with the ongoing operation of an electronic health records application and purchase and implementation of a revenue cycle and other applications for our acute care facilities, and; (iii) a $2 million liability for physician commitments expected to be paid in the future. |
|
(e) |
Reflects our future minimum operating lease payment obligations related to our operating lease agreements outstanding as of December 31, 2017 as discussed in Note 7 to the Consolidated Financial Statements. Some of the lease agreements provide us with the option to renew the lease and our future lease obligations would change if we exercised these renewal options. |
|
(f) |
Consists of $188 million of estimated future payments related to our non-contributory, defined benefit pension plan (estimated through 2089), as disclosed in Note 8 to the Consolidated Financial Statements, and $18 million of estimated future payments related to another retirement plan liability ($15 million liability recorded in other non-current liabilities as of December 31, 2017 in connection with this retirement plan). |
|
(g) |
Consists of accrued and unpaid estimated claims expense incurred in connection with our commercial health insurers and self-insured employee benefit plans. |
As of December 31, 2017, the total accrual for our professional and general liability claims was $229 million, of which $54 million is included in other current liabilities and $175 million is included in other non-current liabilities. We exclude the $229 million for professional and general liability claims from the contractual obligations table because there are no significant contractual obligations associated with these liabilities and because of the uncertainty of the dollar amounts to be ultimately paid as well as the timing of such payments. Please see Self-Insured/Other Insurance Risks above for additional disclosure related to our professional and general liability claims and reserves.
75
We manage our ratio of fixed and floating rate debt with the objective of achieving a mix that management believes is appropriate. To manage this risk in a cost-effective manner, we, from time to time, enter into interest rate swap agreements in which we agree to exchange various combinations of fixed and/or variable interest rates based on agreed upon notional amounts. We account for our derivative and hedging activities using the Financial Accounting Standard Board’s (“FASB”) guidance which requires all derivative instruments, including certain derivative instruments embedded in other contracts, to be carried at fair value on the balance sheet. For derivative transactions designated as hedges, we formally document all relationships between the hedging instrument and the related hedged item, as well as its risk-management objective and strategy for undertaking each hedge transaction.
Derivative instruments designated in a hedge relationship to mitigate exposure to variability in expected future cash flows, or other types of forecasted transactions, are considered cash flow hedges. Cash flow hedges are accounted for by recording the fair value of the derivative instrument on the balance sheet as either an asset or liability, with a corresponding amount recorded in accumulated other comprehensive income (“AOCI”) within shareholders’ equity. Amounts are reclassified from AOCI to the income statement in the period or periods the hedged transaction affects earnings. We use interest rate derivatives in our cash flow hedge transactions. Such derivatives are designed to be highly effective in offsetting changes in the cash flows related to the hedged liability. For derivative instruments designated as cash flow hedges, the ineffective portion of the change in expected cash flows of the hedged item are recognized currently in the income statement.
For hedge transactions that do not qualify for the short-cut method, at the hedge’s inception and on a regular basis thereafter, a formal assessment is performed to determine whether changes in the fair values or cash flows of the derivative instruments have been highly effective in offsetting changes in cash flows of the hedged items and whether they are expected to be highly effective in the future.
The fair value of interest rate swap agreements approximates the amount at which they could be settled, based on estimates obtained from the counterparties. We assess the effectiveness of our hedge instruments on a quarterly basis. We performed periodic assessments of the cash flow hedge instruments during 2017 and 2016 and determined the hedges to be highly effective. We also determined that any portion of the hedges deemed to be ineffective was de minimis and therefore there was no material effect on our consolidated financial position, operations or cash flows. The counterparties to the interest rate swap agreements expose us to credit risk in the event of nonperformance. We do not anticipate nonperformance by our counterparties. We do not hold or issue derivative financial instruments for trading purposes.
Seven interest rate swaps on a total notional amount of $825 million matured in May, 2015. Four of these swaps, with a total notional amount of $600 million, became effective in December, 2011 and provided that we receive three-month LIBOR while the average fixed rate payable was 2.38%. The remaining three swaps, with a total notional amount of $225 million, became effective in March, 2011 and provided that we receive three-month LIBOR while the average fixed rate payable was 1.91%.
During 2015, we entered into nine forward starting interest rate swaps whereby we pay a fixed rate on a total notional amount of $1.0 billion and receive one-month LIBOR. The average fixed rate payable on these swaps, which are scheduled to mature on April 15, 2019, is 1.31%. These interest rates swaps consist of:
•Four forward starting interest rate swaps, entered into during the second quarter of 2015, whereby we pay a fixed rate on a total notional amount of $500 million and receive one-month LIBOR. Each of the four swaps became effective on July 15, 2015 and are scheduled to mature on April 15, 2019. The average fixed rate payable on these swaps is 1.40%;
•Four forward starting interest rate swaps, entered into during the third quarter of 2015, whereby we pay a fixed rate on a total notional amount of $400 million and receive one-month LIBOR. One swap on a notional amount of $100 million became effective on July 15, 2015, two swaps on a total notional amount of $200 million became effective on September 15, 2015 and another swap on a notional amount of $100 million became effective on December 15, 2015. All of these swaps are scheduled to mature on April 15, 2019. The average fixed rate payable on these four swaps is 1.23%, and;
•One interest rate swap, entered into during the fourth quarter of 2015, whereby we pay a fixed rate on a total notional amount of $100 million and receive one-month LIBOR. The swap became effective on December 15, 2015 and is scheduled to mature on April 15, 2019. The fixed rate payable on this swap is 1.21%.
We measure our interest rate swaps at fair value on a recurring basis. The fair value of our interest rate swaps is based on quotes from our counterparties. We consider those inputs to be “level 2” in the fair value hierarchy as outlined in the authoritative guidance for disclosures in connection with derivative instruments and hedging activities. At December 31, 2017, the fair value of our interest rate swaps was a net asset of $7 million, $4 million of which is included in net accounts receivable and $3 million of which is included in other assets on the accompanying balance sheet. At December 31, 2016, the fair value of our interest rate swaps was de minimis on
76
a net basis comprised of a $4 million asset which is included in other assets offset by a $4 million liability which in included in other current liabilities on the accompanying consolidated balance sheet.
The table below presents information about our long-term financial instruments that are sensitive to changes in interest rates as of December 31, 2017. For debt obligations, the table presents principal cash flows and related weighted-average interest rates by contractual maturity dates.
Maturity Date, Fiscal Year Ending December 31
(dollars in thousands)
|
|
|
2018 |
|
|
2019 |
|
|
2020 |
|
|
2021 |
|
|
2022 |
|
|
Thereafter |
|
|
Total |
|
|||||||
|
Long-term debt: |
|
|
|
|
|
|
|
|
|
|
|
|
|
|
|
|
|
|
|
|
|
|
|
|
|
|
|
|
|
Fixed rate: |
|
|
|
|
|
|
|
|
|
|
|
|
|
|
|
|
|
|
|
|
|
|
|
|
|
|
|
|
|
Debt |
|
$ |
2,636 |
|
|
$ |
300,286 |
|
|
$ |
1,650 |
|
|
$ |
1,696 |
|
|
$ |
698,835 |
|
|
$ |
407,491 |
|
|
$ |
1,412,594 |
|
|
Average interest rates |
|
|
4.7 |
% |
|
|
4.7 |
% |
|
|
5.0 |
% |
|
|
5.0 |
% |
|
|
4.9 |
% |
|
|
4.0 |
% |
|
|
4.7 |
% |
|
Variable rate: |
|
|
|
|
|
|
|
|
|
|
|
|
|
|
|
|
|
|
|
|
|
|
|
|
|
|
|
|
|
Debt |
|
$ |
542,983 |
|
|
$ |
2,084,432 |
|
|
|
|
|
|
|
|
|
|
|
|
|
|
|
|
|
|
$ |
2,627,415 |
|
|
Average interest rates |
|
|
2.9 |
% |
|
|
3.0 |
% |
|
|
|
|
|
|
|
|
|
|
|
|
|
|
|
|
|
|
2.2 |
% |
|
Interest rate swaps: |
|
|
|
|
|
|
|
|
|
|
|
|
|
|
|
|
|
|
|
|
|
|
|
|
|
|
|
|
|
Notional amount |
|
|
|
|
|
$ |
1,000,000 |
|
|
|
|
|
|
|
|
|
|
|
|
|
|
|
|
|
|
$ |
1,000,000 |
|
|
Average interest rates |
|
|
|
|
|
|
1.3 |
% |
|
|
|
|
|
|
|
|
|
|
|
|
|
|
|
|
|
|
1.3 |
% |
As calculated based upon our variable rate debt outstanding as of December 31, 2017 that is subject to interest rate fluctuations, each 1% change in interest rates would impact our pre-tax income by approximately $16 million.
Our Consolidated Balance Sheets, Consolidated Statements of Income, Consolidated Statements of Changes in Equity and Consolidated Statements of Cash Flows, together with the reports of PricewaterhouseCoopers LLP, independent registered public accounting firm, are included elsewhere herein. Reference is made to the “Index to Financial Statements and Financial Statement Schedule.”
None.
As of December 31, 2017, under the supervision and with the participation of our management, including our Chief Executive Officer (“CEO”) and Chief Financial Officer (“CFO”), we performed an evaluation of the effectiveness of our disclosure controls and procedures as defined in Rule 13a-15(e) or Rule 15d-15(e) of the Securities Exchange Act of 1934, as amended. Based on this evaluation, the CEO and CFO have concluded that our disclosure controls and procedures are effective to ensure that material information is recorded, processed, summarized and reported by management on a timely basis in order to comply with our disclosure obligations under the Securities Exchange Act of 1934, as amended, and the SEC rules thereunder.
Changes in Internal Control Over Financial Reporting
There have been no changes in our internal control over financial reporting or in other factors during the fourth quarter of 2017 that have materially affected, or are reasonably likely to materially affect, our internal control over financial reporting.
Management’s Report on Internal Control Over Financial Reporting
Management is responsible for establishing and maintaining an adequate system of internal control over our financial reporting. In order to evaluate the effectiveness of internal control over financial reporting, as required by Section 404 of the Sarbanes-Oxley Act, management has conducted an assessment, including testing, using the criteria on Internal Control—Integrated Framework (2013), issued by the Committee of Sponsoring Organizations of the Treadway Commission (COSO). Our system of internal control over financial reporting is designed to provide reasonable assurance regarding the reliability of financial reporting and the preparation and fair presentation of financial statements for external purposes in accordance with U.S. generally accepted accounting principles. Because of its inherent limitations, internal control over financial reporting may not prevent or detect misstatements. Also, projections
77
of any evaluation of effectiveness of internal control over financial reporting to future periods are subject to the risk that controls may become inadequate because of changes in conditions, or that the degree of compliance with the policies or procedures may deteriorate.
Based on its assessment, management has concluded that we maintained effective internal control over financial reporting as of December 31, 2017, based on criteria in Internal Control—Integrated Framework (2013), issued by the COSO. The effectiveness of the Company’s internal control over financial reporting as of December 31, 2017 has been audited by PricewaterhouseCoopers LLP, an independent registered public accounting firm as stated in its report which appears herein.
None.
78
There is hereby incorporated by reference the information to appear under the captions “Election of Directors”, “Section 16(a) Beneficial Ownership Reporting Compliance” and “Corporate Governance” in our Proxy Statement, to be filed with the Securities and Exchange Commission within 120 days after December 31, 2017. See also “Executive Officers of the Registrant” appearing in Item 1 hereof.
There is hereby incorporated by reference the information to appear under the caption “Executive Compensation” in our Proxy Statement to be filed with the Securities and Exchange Commission within 120 days after December 31, 2017.
|
ITEM 12. |
Security Ownership of Certain Beneficial Owners and Management and Related Stockholder Matters |
There is hereby incorporated by reference the information to appear under the caption “Security Ownership of Certain Beneficial Owners and Management” and “Executive Compensation” in our Proxy Statement, to be filed with the Securities and Exchange Commission within 120 days after December 31, 2017.
There is hereby incorporated by reference the information to appear under the captions “Certain Relationships and Related Transactions” and “Corporate Governance” in our Proxy Statement, to be filed with the Securities and Exchange Commission within 120 days after December 31, 2017.
There is hereby incorporated by reference the information to appear under the caption “Relationship with Independent Auditors” in our Proxy Statement, to be filed with the Securities and Exchange Commission within 120 days after December 31, 2017.
79
(a) Documents filed as part of this report:
(1) Financial Statements:
See “Index to Financial Statements and Financial Statement Schedule.”
(2) Financial Statement Schedules:
See “Index to Financial Statements and Financial Statement Schedule.”
(3) Exhibits:
|
No. |
|
Description |
|
3.1 |
|
Registrant’s Restated Certificate of Incorporation, and Amendments thereto, previously filed as Exhibit 3.1 to the Company’s Quarterly Report on Form 10-Q for the quarter ended June 30, 1997, are incorporated herein by reference (P). |
|
|
|
|
|
3.2 |
|
Bylaws of Registrant, as amended, previously filed as Exhibit 3.2 to the Company’s Annual Report on Form 10-K for the year ended December 31, 1987, is incorporated herein by reference (P). |
|
|
|
|
|
3.3 |
|
|
|
|
|
|
|
4.1 |
|
|
|
|
|
|
|
4.2 |
|
|
|
|
|
|
|
4.3 |
|
|
|
|
|
|
|
4.4 |
|
|
|
|
|
|
|
10.1* |
|
|
|
|
|
|
|
10.2 |
|
Advisory Agreement, dated as of December 24, 1986, between Universal Health Realty Income Trust and UHS of Delaware, Inc., previously filed as Exhibit 10.2 to the Company’s Current Report on Form 8-K dated December 24, 1986, is incorporated herein by reference (P). |
|
|
|
|
|
10.3 |
|
|
|
|
|
|
|
10.4 |
|
Form of Leases, including Form of Master Lease Document for Leases, between certain subsidiaries of the Company and Universal Health Realty Income Trust, filed as Exhibit 10.3 to Amendment No. 3 of the Registration Statement on Form S-11 and Form S-2 of Registrant and Universal Health Realty Income Trust (Registration No. 33-7872), is incorporated herein by reference (P). |
|
|
|
|
80
|
No. |
|
Description |
|
|
Corporate Guaranty of Obligations of Subsidiaries Pursuant to Leases and Contract of Acquisition, dated December 24, 1986, issued by the Company in favor of Universal Health Realty Income Trust, previously filed as Exhibit 10.5 to the Company’s Current Report on Form 8-K dated December 24, 1986, is incorporated herein by reference (P). |
|
|
|
|
|
|
10.6 |
|
|
|
|
|
|
|
10.7 |
|
Asset Purchase Agreement dated as of February 6, 1996, among Amarillo Hospital District, UHS of Amarillo, Inc. and Universal Health Services, Inc., previously filed as Exhibit 10.28 to the Company’s Annual Report on Form 10-K for the year ended December 31, 1995, is incorporated herein by reference (P). |
|
|
|
|
|
10.8 |
|
Agreement of Limited Partnership of District Hospital Partners, L.P. (a District of Columbia limited partnership) by and among UHS of D.C., Inc. and The George Washington University, previously filed as Exhibit 10.1 to the Company’s Quarterly Report on Form 10-Q for the quarters ended March 30, 1997, and June 30, 1997, is incorporated herein by reference (P). |
|
|
|
|
|
10.9 |
|
Contribution Agreement between The George Washington University (a congressionally chartered institution in the District of Columbia) and District Hospital Partners, L.P. (a District of Columbia limited partnership), previously filed as Exhibit 10.3 to the Company’s Quarterly Report on Form 10-Q for the quarter ended June 30, 1997, is incorporated herein by reference (P). |
|
|
|
|
|
10.10 |
|
|
|
|
|
|
|
10.11* |
|
|
|
|
|
|
|
10.12* |
|
|
|
|
|
|
|
10.13* |
|
|
|
|
|
|
|
10.14* |
|
|
|
|
|
|
|
10.15 |
|
|
|
|
|
|
|
10.16* |
|
|
|
|
|
|
|
10.17* |
|
|
|
|
|
|
|
10.18 |
|
|
|
|
|
|
|
10.19 |
|
|
|
|
|
|
|
10.20 |
|
81
|
No. |
|
Description |
|
|
|
|
|
10.21 |
|
|
|
|
|
|
|
10.22 |
|
|
|
|
|
|
|
10.23
|
|
|
|
|
|
|
|
10.24 |
|
|
|
|
|
|
|
10.25 |
|
|
|
|
|
|
|
10.26 |
|
|
|
|
|
|
|
10.27 |
|
|
|
|
|
|
|
10.28 |
|
|
|
|
|
|
|
10.29 |
|
|
|
|
|
|
|
10.30 |
|
|
|
|
|
|
82
|
No. |
|
Description |
|
10.31 |
|
Fifth Amendment to the Credit Agreement, dated as of November 15, 2010, as amended on March 15, 2011, September 21, 2012, May 16, 2013 and August 7, 2014, among the Company, as borrower, the several banks and other financial institutions from time to time parties thereto, as lenders, JPMorgan Chase Bank, N.A., as administrative agent, and the other agents party thereto, previously filed as Exhibit 10.1 to the Company’s Current Report on Form 8-K dated June 8, 2016, is incorporated herein by reference. |
|
|
|
|
|
10.32 |
|
|
|
|
|
|
|
10.33* |
|
|
|
|
|
|
|
10.34* |
|
|
|
|
|
|
|
10.35* |
|
|
|
|
|
|
|
10.36* |
|
|
|
|
|
|
|
10.37 |
|
|
|
|
|
|
|
11 |
|
|
|
|
|
|
|
21 |
|
|
|
|
|
|
|
23.1 |
|
Consent of Independent Registered Public Accounting Firm-PricewaterhouseCoopers LLP. |
|
|
|
|
|
31.1 |
|
|
|
|
|
|
|
31.2 |
|
|
|
|
|
|
|
32.1 |
|
|
|
|
|
|
|
32.2 |
|
|
|
|
|
|
|
101 |
|
INS XBRL Instance Document |
|
|
|
|
|
101 |
|
SCH XBRL Taxonomy Extension Schema Document |
|
|
|
|
|
101 |
|
CAL XBRL Taxonomy Extension Calculation Linkbase Document |
|
|
|
|
83
|
No. |
|
Description |
|
|
DEF XBRL Taxonomy Extension Definition Linkbase Document |
|
|
|
|
|
|
101 |
|
LAB XBRL Taxonomy Extension Label Linkbase Document |
|
|
|
|
|
101 |
|
PRE XBRL Taxonomy Extension Presentation Linkbase Document |
*Management contract or compensatory plan or arrangement.
Exhibits, other than those incorporated by reference, have been included in copies of this Annual Report filed with the Securities and Exchange Commission. Stockholders of the Company will be provided with copies of those exhibits upon written request to the Company.
None.
84
Pursuant to the requirements of Section 13 or 15(d) of the Securities Exchange Act of 1934, the Registrant has duly caused this report to be signed on its behalf by the undersigned, thereunto duly authorized.
|
|
|
|
|
UNIVERSAL HEALTH SERVICES, INC. |
||
|
|
|
|
|
By: |
|
/s/ ALAN B. MILLER |
|
|
|
Alan B. Miller Chairman of the Board and Chief Executive Officer |
February 28, 2018
Pursuant to the requirements of the Securities Exchange Act of 1934, this report has been signed below by the following persons on behalf of the Registrant and in the capacities and on the dates indicated.
|
|
|
|
|
|
|||||||
|
|
Signatures |
|
|
|
Title |
|
|
|
Date |
|
|
|
|
|
|
|||||||||
|
/s/ ALAN B. MILLER Alan B. Miller |
|
Chairman of the Board and Chief Executive Officer (Principal Executive Officer) |
|
February 28, 2018 |
|||||||
|
|
|
|
|||||||||
|
/s/ MARC D. MILLER Marc D. Miller |
|
Director and President |
|
February 28, 2018 |
|||||||
|
|
|
|
|||||||||
|
/s/ LAWRENCE S. GIBBS Lawrence S. Gibbs |
|
Director |
|
February 28, 2018 |
|||||||
|
|
|
|
|||||||||
|
/s/ JOHN H. HERRELL John H. Herrell |
|
Director |
|
February 28, 2018 |
|||||||
|
|
|
|
|||||||||
|
/s/ ROBERT H. HOTZ Robert H. Hotz |
|
Director |
|
February 28, 2018 |
|||||||
|
|
|
|
|||||||||
|
/s/ EILEEN C. MCDONNELL Eileen C. McDonnell |
|
Director |
|
February 28, 2018 |
|||||||
|
|
|
|
|||||||||
|
/s/ WARREN J. NIMETZ Warren J. Nimetz |
|
Director |
|
February 28, 2018 |
|||||||
|
|
|
|
|||||||||
|
/s/ STEVE FILTON Steve Filton |
|
Executive Vice President, Chief Financial Officer and Secretary (Principal Financial and Accounting Officer) |
|
February 28, 2018 |
|||||||
85
UNIVERSAL HEALTH SERVICES, INC.
INDEX TO FINANCIAL STATEMENTS
AND FINANCIAL STATEMENT SCHEDULE
86
REPORT OF INDEPENDENT REGISTERED PUBLIC ACCOUNTING FIRM
To the Board of Directors and Stockholders of Universal Health Services, Inc.:
Opinions on the Financial Statements and Internal Control over Financial Reporting
We have audited the accompanying consolidated financial statements, including the related notes and financial statement schedule, of Universal Health Services, Inc. and its subsidiaries as listed in the accompanying index (collectively referred to as the “consolidated financial statements”). We also have audited the Company's internal control over financial reporting as of December 31, 2017 based on criteria established in Internal Control - Integrated Framework (2013) issued by the Committee of Sponsoring Organizations of the Treadway Commission (COSO).
In our opinion, the consolidated financial statements referred to above present fairly, in all material respects, the financial position of the Company as of December 31, 2017 and 2016, and the results of their operations and their cash flows for each of the three years in the period ended December 31, 2017 in conformity with accounting principles generally accepted in the United States of America. Also in our opinion, the Company maintained, in all material respects, effective internal control over financial reporting as of December 31, 2017, based on criteria established in Internal Control - Integrated Framework (2013) issued by the COSO.
Basis for Opinions
The Company's management is responsible for these consolidated financial statements, for maintaining effective internal control over financial reporting, and for its assessment of the effectiveness of internal control over financial reporting, included in the accompanying Management's Report on Internal Control over Financial Reporting. Our responsibility is to express opinions on the Company’s consolidated financial statements and on the Company's internal control over financial reporting based on our audits. We are a public accounting firm registered with the Public Company Accounting Oversight Board (United States) ("PCAOB") and are required to be independent with respect to the Company in accordance with the U.S. federal securities laws and the applicable rules and regulations of the Securities and Exchange Commission and the PCAOB.
We conducted our audits in accordance with the standards of the PCAOB. Those standards require that we plan and perform the audits to obtain reasonable assurance about whether the consolidated financial statements are free of material misstatement, whether due to error or fraud, and whether effective internal control over financial reporting was maintained in all material respects.
Our audits of the consolidated financial statements included performing procedures to assess the risks of material misstatement of the consolidated financial statements, whether due to error or fraud, and performing procedures that respond to those risks. Such procedures included examining, on a test basis, evidence regarding the amounts and disclosures in the consolidated financial statements. Our audits also included evaluating the accounting principles used and significant estimates made by management, as well as evaluating the overall presentation of the consolidated financial statements. Our audit of internal control over financial reporting included obtaining an understanding of internal control over financial reporting, assessing the risk that a material weakness exists, and testing and evaluating the design and operating effectiveness of internal control based on the assessed risk. Our audits also included performing such other procedures as we considered necessary in the circumstances. We believe that our audits provide a reasonable basis for our opinions.
Definition and Limitations of Internal Control over Financial Reporting
A company’s internal control over financial reporting is a process designed to provide reasonable assurance regarding the reliability of financial reporting and the preparation of financial statements for external purposes in accordance with generally accepted accounting principles. A company’s internal control over financial reporting includes those policies and procedures that (i) pertain to the maintenance of records that, in reasonable detail, accurately and fairly reflect the transactions and dispositions of the assets of the company; (ii) provide reasonable assurance that transactions are recorded as necessary to permit preparation of financial statements in accordance with generally accepted accounting principles, and that receipts and expenditures of the company are being made only in accordance with authorizations of management and directors of the company; and (iii) provide reasonable assurance regarding prevention or timely detection of unauthorized acquisition, use, or disposition of the company’s assets that could have a material effect on the financial statements.
Because of its inherent limitations, internal control over financial reporting may not prevent or detect misstatements. Also, projections of any evaluation of effectiveness to future periods are subject to the risk that controls may become inadequate because of changes in conditions, or that the degree of compliance with the policies or procedures may deteriorate.
/s/ PricewaterhouseCoopers LLP
Philadelphia, Pennsylvania
February 28, 2018
We have served as the Company’s auditor since 2007.
87
UNIVERSAL HEALTH SERVICES, INC. AND SUBSIDIARIES
CONSOLIDATED STATEMENTS OF INCOME
|
|
|
Year Ended December 31, |
|
|||||||||
|
|
|
2017 |
|
|
2016 |
|
|
2015 |
|
|||
|
|
|
(in thousands, except per share data) |
|
|||||||||
|
Net revenues before provision for doubtful accounts |
|
$ |
11,278,942 |
|
|
$ |
10,507,788 |
|
|
$ |
9,784,724 |
|
|
Less: Provision for doubtful accounts |
|
|
869,077 |
|
|
|
741,578 |
|
|
|
741,273 |
|
|
Net revenues |
|
|
10,409,865 |
|
|
|
9,766,210 |
|
|
|
9,043,451 |
|
|
Operating charges: |
|
|
|
|
|
|
|
|
|
|
|
|
|
Salaries, wages and benefits |
|
|
4,980,637 |
|
|
|
4,585,530 |
|
|
|
4,212,387 |
|
|
Other operating expenses |
|
|
2,493,062 |
|
|
|
2,359,339 |
|
|
|
2,119,805 |
|
|
Supplies expense |
|
|
1,105,096 |
|
|
|
1,031,337 |
|
|
|
974,088 |
|
|
Depreciation and amortization |
|
|
447,765 |
|
|
|
416,608 |
|
|
|
398,618 |
|
|
Lease and rental expense |
|
|
103,127 |
|
|
|
97,324 |
|
|
|
94,973 |
|
|
Electronic health records incentive income |
|
|
0 |
|
|
|
(5,339 |
) |
|
|
(15,815 |
) |
|
|
|
|
9,129,687 |
|
|
|
8,484,799 |
|
|
|
7,784,056 |
|
|
Income from operations |
|
|
1,280,178 |
|
|
|
1,281,411 |
|
|
|
1,259,395 |
|
|
Interest expense, net |
|
|
145,169 |
|
|
|
125,053 |
|
|
|
113,494 |
|
|
Income before income taxes |
|
|
1,135,009 |
|
|
|
1,156,358 |
|
|
|
1,145,901 |
|
|
Provision for income taxes |
|
|
363,697 |
|
|
|
409,187 |
|
|
|
395,203 |
|
|
Net income |
|
|
771,312 |
|
|
|
747,171 |
|
|
|
750,698 |
|
|
Less: Net income attributable to noncontrolling interests |
|
|
19,009 |
|
|
|
44,762 |
|
|
|
70,170 |
|
|
Net income attributable to UHS |
|
$ |
752,303 |
|
|
$ |
702,409 |
|
|
$ |
680,528 |
|
|
Basic earnings per share attributable to UHS |
|
$ |
7.86 |
|
|
$ |
7.22 |
|
|
$ |
6.89 |
|
|
Diluted earnings per share attributable to UHS |
|
$ |
7.81 |
|
|
$ |
7.14 |
|
|
$ |
6.76 |
|
|
Weighted average number of common shares—basic |
|
|
95,652 |
|
|
|
97,208 |
|
|
|
98,797 |
|
|
Add: Other share equivalents |
|
|
673 |
|
|
|
1,172 |
|
|
|
1,897 |
|
|
Weighted average number of common shares and equivalents—diluted |
|
|
96,325 |
|
|
|
98,380 |
|
|
|
100,694 |
|
The accompanying notes are an integral part of these consolidated financial statements.
88
UNIVERSAL HEALTH SERVICES, INC. AND SUBSIDIARIES
CONSOLIDATED STATEMENTS OF COMPREHENSIVE INCOME
|
|
|
Year Ended December 31, |
|
|||||||||
|
|
|
2017 |
|
|
2016 |
|
|
2015 |
|
|||
|
Net income |
|
$ |
771,312 |
|
|
$ |
747,171 |
|
|
$ |
750,698 |
|
|
Other comprehensive income (loss): |
|
|
|
|
|
|
|
|
|
|
|
|
|
Unrealized derivative gains on cash flow hedges |
|
|
6,679 |
|
|
|
1,438 |
|
|
|
4,970 |
|
|
Amortization of terminated hedge |
|
|
0 |
|
|
|
(167 |
) |
|
|
(336 |
) |
|
Minimum pension liability |
|
|
4,070 |
|
|
|
13,356 |
|
|
|
2,177 |
|
|
Unrealized loss on marketable security |
|
|
(2,169 |
) |
|
|
(2,229 |
) |
|
|
0 |
|
|
Foreign currency translation adjustment |
|
|
26,678 |
|
|
|
(10,038 |
) |
|
|
(1,728 |
) |
|
Other comprehensive income before tax |
|
|
35,258 |
|
|
|
2,360 |
|
|
|
5,083 |
|
|
Income tax expense related to items of other comprehensive income |
|
|
2,664 |
|
|
|
4,648 |
|
|
|
2,980 |
|
|
Total other comprehensive income (loss), net of tax |
|
|
32,594 |
|
|
|
(2,288 |
) |
|
|
2,103 |
|
|
Comprehensive income |
|
|
803,906 |
|
|
|
744,883 |
|
|
|
752,801 |
|
|
Less: Comprehensive income attributable to noncontrolling interests |
|
|
19,009 |
|
|
|
44,762 |
|
|
|
70,170 |
|
|
Comprehensive income attributable to UHS |
|
$ |
784,897 |
|
|
$ |
700,121 |
|
|
$ |
682,631 |
|
The accompanying notes are an integral part of these consolidated financial statements.
89
UNIVERSAL HEALTH SERVICES, INC. AND SUBSIDIARIES
|
|
|
December 31, |
|
|||||
|
|
|
2017 |
|
|
2016 |
|
||
|
|
|
(Dollar amounts in thousands) |
|
|||||
|
Assets |
|
|
|
|
|
|
|
|
|
Current assets: |
|
|
|
|
|
|
|
|
|
Cash and cash equivalents |
|
$ |
74,423 |
|
|
$ |
33,747 |
|
|
Accounts receivable, net |
|
|
1,500,898 |
|
|
|
1,439,553 |
|
|
Supplies |
|
|
136,177 |
|
|
|
125,365 |
|
|
Other current assets |
|
|
86,504 |
|
|
|
82,706 |
|
|
Total current assets |
|
|
1,798,002 |
|
|
|
1,681,371 |
|
|
Property and Equipment |
|
|
|
|
|
|
|
|
|
Land |
|
|
520,447 |
|
|
|
492,731 |
|
|
Buildings and improvements |
|
|
4,952,856 |
|
|
|
4,676,752 |
|
|
Equipment |
|
|
2,000,305 |
|
|
|
1,820,468 |
|
|
Property under capital lease |
|
|
44,740 |
|
|
|
45,768 |
|
|
|
|
|
7,518,348 |
|
|
|
7,035,719 |
|
|
Accumulated depreciation |
|
|
(3,349,289 |
) |
|
|
(2,983,481 |
) |
|
|
|
|
4,169,059 |
|
|
|
4,052,238 |
|
|
Construction-in-progress |
|
|
402,778 |
|
|
|
278,718 |
|
|
|
|
|
4,571,837 |
|
|
|
4,330,956 |
|
|
Other assets: |
|
|
|
|
|
|
|
|
|
Goodwill |
|
|
3,825,157 |
|
|
|
3,784,106 |
|
|
Deferred income taxes |
|
|
3,007 |
|
|
|
1,234 |
|
|
Deferred charges |
|
|
9,787 |
|
|
|
13,520 |
|
|
Other |
|
|
554,038 |
|
|
|
506,615 |
|
|
|
|
|
4,391,989 |
|
|
|
4,305,475 |
|
|
Total Assets |
|
$ |
10,761,828 |
|
|
$ |
10,317,802 |
|
|
Liabilities and Stockholders’ Equity |
|
|
|
|
|
|
|
|
|
Current liabilities: |
|
|
|
|
|
|
|
|
|
Current maturities of long-term debt |
|
$ |
545,619 |
|
|
$ |
105,895 |
|
|
Accounts payable |
|
|
441,984 |
|
|
|
439,672 |
|
|
Accrued liabilities |
|
|
|
|
|
|
|
|
|
Compensation and related benefits |
|
|
304,668 |
|
|
|
275,288 |
|
|
Interest |
|
|
23,755 |
|
|
|
23,050 |
|
|
Taxes other than income |
|
|
85,800 |
|
|
|
68,199 |
|
|
Other |
|
|
427,874 |
|
|
|
403,120 |
|
|
Current federal and state income taxes |
|
|
18,334 |
|
|
|
2,149 |
|
|
Total current liabilities |
|
|
1,848,034 |
|
|
|
1,317,373 |
|
|
Other noncurrent liabilities |
|
|
306,304 |
|
|
|
275,167 |
|
|
Long-term debt |
|
|
3,494,390 |
|
|
|
4,030,230 |
|
|
Deferred income taxes |
|
|
54,962 |
|
|
|
88,119 |
|
|
Commitments and contingencies (Note 8) |
|
|
|
|
|
|
|
|
|
Redeemable noncontrolling interest |
|
|
6,702 |
|
|
|
9,319 |
|
|
Equity: |
|
|
|
|
|
|
|
|
|
Class A Common Stock, voting, $.01 par value; authorized 12,000,000 shares: issued and outstanding 6,595,308 shares in 2017 and 6,595,308 shares in 2016 |
|
|
66 |
|
|
|
66 |
|
|
Class B Common Stock, limited voting, $.01 par value; authorized 150,000,000 shares: issued and outstanding 86,947,407 shares in 2017 and 89,348,958 shares in 2016 |
|
|
869 |
|
|
|
893 |
|
|
Class C Common Stock, voting, $.01 par value; authorized 1,200,000 shares: issued and outstanding 663,940 shares in 2017 and 663,940 shares in 2016 |
|
|
7 |
|
|
|
7 |
|
|
Class D Common Stock, limited voting, $.01 par value; authorized 5,000,000 shares: issued and outstanding 20,868 shares in 2017 and 22,100 shares in 2016 |
|
|
0 |
|
|
|
0 |
|
|
Cumulative dividends |
|
|
(371,814 |
) |
|
|
(333,603 |
) |
|
Retained earnings |
|
|
5,353,209 |
|
|
|
4,891,274 |
|
|
Accumulated other comprehensive income (loss) |
|
|
7,177 |
|
|
|
(25,417 |
) |
|
Universal Health Services, Inc. common stockholders’ equity |
|
|
4,989,514 |
|
|
|
4,533,220 |
|
|
Noncontrolling interest |
|
|
61,922 |
|
|
|
64,374 |
|
|
Total Equity |
|
|
5,051,436 |
|
|
|
4,597,594 |
|
|
Total Liabilities and Stockholders’ Equity |
|
$ |
10,761,828 |
|
|
$ |
10,317,802 |
|
The accompanying notes are an integral part of these consolidated financial statements.
90
UNIVERSAL HEALTH SERVICES, INC. AND SUBSIDIARIES
CONSOLIDATED STATEMENTS OF CHANGES IN EQUITY
For the Years Ended December 31, 2017, 2016 and 2015
(in thousands)
|
|
|
|
|
|
|
|
|
|
|
|
|
|
|
|
|
|
|
|
|
|
|
|
|
|
|
|
|
|
|
Accumulated |
|
|
UHS |
|
|
|
|
|
|
|
|
|
||
|
|
|
Redeemable |
|
|
|
|
|
|
|
|
|
|
|
|
|
|
|
|
|
|
|
|
|
|
|
|
|
|
Other |
|
|
Common |
|
|
|
|
|
|
|
|
|
|||
|
|
|
Noncontrolling |
|
|
Class A |
|
|
Class B |
|
|
Class C |
|
|
Class D |
|
|
Cumulative |
|
|
Retained |
|
|
Comprehensive |
|
|
Stockholders' |
|
|
Noncontrolling |
|
|
|
|
|
||||||||||
|
|
|
Interest |
|
|
Common |
|
|
Common |
|
|
Common |
|
|
Common |
|
|
Dividends |
|
|
Earnings |
|
|
Income (Loss) |
|
|
Equity |
|
|
Interest |
|
|
Total |
|
|||||||||||
|
Balance, January 1, 2015 |
|
$ |
239,552 |
|
|
$ |
66 |
|
|
$ |
914 |
|
|
$ |
7 |
|
|
$ |
0 |
|
|
$ |
(255,196 |
) |
|
$ |
4,015,387 |
|
|
$ |
(25,232 |
) |
|
$ |
3,735,946 |
|
|
$ |
55,134 |
|
|
$ |
3,791,080 |
|
|
Common Stock |
|
|
|
|
|
|
|
|
|
|
|
|
|
|
|
|
|
|
|
|
|
|
|
|
|
|
|
|
|
|
|
|
|
|
|
|
|
|
|
|
|
|
|
|
|
Issued/(converted) including tax benefits from exercise of stock options |
|
|
— |
|
|
|
— |
|
|
|
14 |
|
|
|
— |
|
|
|
— |
|
|
|
— |
|
|
|
56,473 |
|
|
|
— |
|
|
|
56,487 |
|
|
|
— |
|
|
|
56,487 |
|
|
Repurchased |
|
|
— |
|
|
|
— |
|
|
|
(18 |
) |
|
|
— |
|
|
|
— |
|
|
|
— |
|
|
|
(224,242 |
) |
|
|
— |
|
|
|
(224,260 |
) |
|
|
— |
|
|
|
(224,260 |
) |
|
Restricted share-based compensation expense |
|
|
— |
|
|
|
— |
|
|
|
— |
|
|
|
— |
|
|
|
— |
|
|
|
— |
|
|
|
393 |
|
|
|
— |
|
|
|
393 |
|
|
|
— |
|
|
|
393 |
|
|
Dividends paid |
|
|
— |
|
|
|
— |
|
|
|
— |
|
|
|
— |
|
|
|
— |
|
|
|
(39,532 |
) |
|
|
— |
|
|
|
— |
|
|
|
(39,532 |
) |
|
|
— |
|
|
|
(39,532 |
) |
|
Stock option expense |
|
|
— |
|
|
|
— |
|
|
|
— |
|
|
|
— |
|
|
|
— |
|
|
|
— |
|
|
|
37,982 |
|
|
|
— |
|
|
|
37,982 |
|
|
|
— |
|
|
|
37,982 |
|
|
Distributions to noncontrolling interests |
|
|
(51,106 |
) |
|
|
— |
|
|
|
— |
|
|
|
— |
|
|
|
— |
|
|
|
— |
|
|
|
— |
|
|
|
— |
|
|
|
— |
|
|
|
(11,114 |
) |
|
|
(11,114 |
) |
|
Other |
|
|
— |
|
|
|
— |
|
|
|
— |
|
|
|
— |
|
|
|
— |
|
|
|
— |
|
|
|
— |
|
|
|
— |
|
|
|
— |
|
|
|
(613 |
) |
|
|
(613 |
) |
|
Comprehensive income: |
|
|
|
|
|
|
|
|
|
|
|
|
|
|
|
|
|
|
|
|
|
|
|
|
|
|
|
|
|
|
|
|
|
|
|
|
|
|
|
|
|
|
|
|
|
Net income to UHS / noncontrolling interests |
|
|
54,063 |
|
|
|
— |
|
|
|
— |
|
|
|
— |
|
|
|
— |
|
|
|
— |
|
|
|
680,528 |
|
|
|
— |
|
|
|
680,528 |
|
|
|
16,107 |
|
|
|
696,635 |
|
|
Foreign currency translation adjustments |
|
|
— |
|
|
|
— |
|
|
|
— |
|
|
|
— |
|
|
|
— |
|
|
|
— |
|
|
|
— |
|
|
|
(1,728 |
) |
|
|
(1,728 |
) |
|
|
— |
|
|
|
(1,728 |
) |
|
Amortization of terminated hedge (net of income tax effect of $120) |
|
|
— |
|
|
|
— |
|
|
|
— |
|
|
|
— |
|
|
|
— |
|
|
|
— |
|
|
|
— |
|
|
|
(216 |
) |
|
|
(216 |
) |
|
|
— |
|
|
|
(216 |
) |
|
Unrealized derivative gains on cash flow hedges (net of income tax effect of $2,283) |
|
|
— |
|
|
|
— |
|
|
|
— |
|
|
|
— |
|
|
|
— |
|
|
|
— |
|
|
|
— |
|
|
|
2,687 |
|
|
|
2,687 |
|
|
|
— |
|
|
|
2,687 |
|
|
Minimum pension liability (net of income tax effect of $817) |
|
|
— |
|
|
|
— |
|
|
|
— |
|
|
|
— |
|
|
|
— |
|
|
|
— |
|
|
|
— |
|
|
|
1,360 |
|
|
|
1,360 |
|
|
|
— |
|
|
|
1,360 |
|
|
Subtotal |
|
|
54,063 |
|
|
|
— |
|
|
|
— |
|
|
|
— |
|
|
|
— |
|
|
|
— |
|
|
|
680,528 |
|
|
|
2,103 |
|
|
|
682,631 |
|
|
|
16,107 |
|
|
|
698,738 |
|
|
Balance, December 31, 2015 |
|
$ |
242,509 |
|
|
$ |
66 |
|
|
$ |
910 |
|
|
$ |
7 |
|
|
$ |
— |
|
|
$ |
(294,728 |
) |
|
$ |
4,566,521 |
|
|
$ |
(23,129 |
) |
|
$ |
4,249,647 |
|
|
$ |
59,514 |
|
|
$ |
4,309,161 |
|
91
UNIVERSAL HEALTH SERVICES, INC. AND SUBSIDIARIES
CONSOLIDATED STATEMENTS OF CHANGES IN EQUITY—(Continued)
For the Years Ended December 31, 2017, 2016 and 2015
(in thousands)
|
|
|
|
|
|
|
|
|
|
|
|
|
|
|
|
|
|
|
|
|
|
|
|
|
|
|
|
|
|
|
Accumulated |
|
|
UHS |
|
|
|
|
|
|
|
|
|
||
|
|
|
Redeemable |
|
|
|
|
|
|
|
|
|
|
|
|
|
|
|
|
|
|
|
|
|
|
|
|
|
|
Other |
|
|
Common |
|
|
|
|
|
|
|
|
|
|||
|
|
|
Noncontrolling |
|
|
Class A |
|
|
Class B |
|
|
Class C |
|
|
Class D |
|
|
Cumulative |
|
|
Retained |
|
|
Comprehensive |
|
|
Stockholders' |
|
|
Noncontrolling |
|
|
|
|
|
||||||||||
|
|
|
Interest |
|
|
Common |
|
|
Common |
|
|
Common |
|
|
Common |
|
|
Dividends |
|
|
Earnings |
|
|
Income (Loss) |
|
|
Equity |
|
|
Interest |
|
|
Total |
|
|||||||||||
|
Common Stock |
|
|
|
|
|
|
|
|
|
|
|
|
|
|
|
|
|
|
|
|
|
|
|
|
|
|
|
|
|
|
|
|
|
|
|
|
|
|
|
|
|
|
|
|
|
Issued/(converted) including tax benefits from exercise of stock options |
|
|
— |
|
|
|
— |
|
|
|
13 |
|
|
|
— |
|
|
|
— |
|
|
|
— |
|
|
|
54,840 |
|
|
|
— |
|
|
|
54,853 |
|
|
|
— |
|
|
|
54,853 |
|
|
Repurchased |
|
|
— |
|
|
|
— |
|
|
|
(30 |
) |
|
|
— |
|
|
|
— |
|
|
|
— |
|
|
|
(346,860 |
) |
|
|
— |
|
|
|
(346,890 |
) |
|
|
— |
|
|
|
(346,890 |
) |
|
Restricted share-based compensation expense |
|
|
— |
|
|
|
— |
|
|
|
— |
|
|
|
— |
|
|
|
— |
|
|
|
— |
|
|
|
1,439 |
|
|
|
— |
|
|
|
1,439 |
|
|
|
— |
|
|
|
1,439 |
|
|
Dividends paid |
|
|
— |
|
|
|
— |
|
|
|
— |
|
|
|
— |
|
|
|
— |
|
|
|
(38,875 |
) |
|
|
— |
|
|
|
— |
|
|
|
(38,875 |
) |
|
|
— |
|
|
|
(38,875 |
) |
|
Stock option expense |
|
|
— |
|
|
|
— |
|
|
|
— |
|
|
|
— |
|
|
|
— |
|
|
|
— |
|
|
|
45,777 |
|
|
|
— |
|
|
|
45,777 |
|
|
|
— |
|
|
|
45,777 |
|
|
Distributions to noncontrolling interests |
|
|
(51,847 |
) |
|
|
— |
|
|
|
— |
|
|
|
— |
|
|
|
— |
|
|
|
— |
|
|
|
— |
|
|
|
— |
|
|
|
— |
|
|
|
(17,735 |
) |
|
|
(17,735 |
) |
|
Acquisition of noncontrolling interests in majority owned businesses |
|
|
(206,200 |
) |
|
|
— |
|
|
|
— |
|
|
|
— |
|
|
|
— |
|
|
|
— |
|
|
|
(132,852 |
) |
|
|
— |
|
|
|
(132,852 |
) |
|
|
— |
|
|
|
(132,852 |
) |
|
Other |
|
|
— |
|
|
|
— |
|
|
|
— |
|
|
|
— |
|
|
|
— |
|
|
|
— |
|
|
|
— |
|
|
|
— |
|
|
|
— |
|
|
|
2,690 |
|
|
|
2,690 |
|
|
Comprehensive income: |
|
|
|
|
|
|
|
|
|
|
|
|
|
|
|
|
|
|
|
|
|
|
|
|
|
|
|
|
|
|
|
|
|
|
|
|
|
|
|
|
|
|
|
|
|
Net income to UHS / noncontrolling interests |
|
|
24,857 |
|
|
|
— |
|
|
|
— |
|
|
|
— |
|
|
|
— |
|
|
|
— |
|
|
|
702,409 |
|
|
|
— |
|
|
|
702,409 |
|
|
|
19,905 |
|
|
|
722,314 |
|
|
Foreign currency translation adjustments |
|
|
— |
|
|
|
— |
|
|
|
— |
|
|
|
— |
|
|
|
— |
|
|
|
— |
|
|
|
— |
|
|
|
(10,038 |
) |
|
|
(10,038 |
) |
|
|
— |
|
|
|
(10,038 |
) |
|
Amortization of terminated hedge (net of income tax effect of $60) |
|
|
— |
|
|
|
— |
|
|
|
— |
|
|
|
— |
|
|
|
— |
|
|
|
— |
|
|
|
— |
|
|
|
(107 |
) |
|
|
(107 |
) |
|
|
— |
|
|
|
(107 |
) |
|
Unrealized loss on marketable security (net of income tax effect of $831) |
|
|
— |
|
|
|
— |
|
|
|
— |
|
|
|
— |
|
|
|
— |
|
|
|
— |
|
|
|
— |
|
|
|
(1,398 |
) |
|
|
(1,398 |
) |
|
|
— |
|
|
|
(1,398 |
) |
|
Unrealized derivative gains on cash flow hedges (net of income tax effect of $536) |
|
|
— |
|
|
|
— |
|
|
|
— |
|
|
|
— |
|
|
|
— |
|
|
|
— |
|
|
|
— |
|
|
|
902 |
|
|
|
902 |
|
|
|
— |
|
|
|
902 |
|
|
Minimum pension liability (net of income tax effect of $5,003) |
|
|
— |
|
|
|
— |
|
|
|
— |
|
|
|
— |
|
|
|
— |
|
|
|
— |
|
|
|
— |
|
|
|
8,353 |
|
|
|
8,353 |
|
|
|
— |
|
|
|
8,353 |
|
|
Subtotal |
|
|
24,857 |
|
|
|
— |
|
|
|
— |
|
|
|
— |
|
|
|
— |
|
|
|
— |
|
|
|
702,409 |
|
|
|
(2,288 |
) |
|
|
700,121 |
|
|
|
19,905 |
|
|
|
720,026 |
|
|
Balance, December 31, 2016 |
|
$ |
9,319 |
|
|
$ |
66 |
|
|
$ |
893 |
|
|
$ |
7 |
|
|
$ |
— |
|
|
$ |
(333,603 |
) |
|
$ |
4,891,274 |
|
|
$ |
(25,417 |
) |
|
$ |
4,533,220 |
|
|
$ |
64,374 |
|
|
$ |
4,597,594 |
|
92
UNIVERSAL HEALTH SERVICES, INC. AND SUBSIDIARIES
CONSOLIDATED STATEMENTS OF CHANGES IN EQUITY—(Continued)
For the Years Ended December 31, 2017, 2016 and 2015
(in thousands)
|
|
|
|
|
|
|
|
|
|
|
|
|
|
|
|
|
|
|
|
|
|
|
|
|
|
|
|
|
|
|
Accumulated |
|
|
UHS |
|
|
|
|
|
|
|
|
|
||
|
|
|
Redeemable |
|
|
|
|
|
|
|
|
|
|
|
|
|
|
|
|
|
|
|
|
|
|
|
|
|
|
Other |
|
|
Common |
|
|
|
|
|
|
|
|
|
|||
|
|
|
Noncontrolling |
|
|
Class A |
|
|
Class B |
|
|
Class C |
|
|
Class D |
|
|
Cumulative |
|
|
Retained |
|
|
Comprehensive |
|
|
Stockholders' |
|
|
Noncontrolling |
|
|
|
|
|
||||||||||
|
|
|
Interest |
|
|
Common |
|
|
Common |
|
|
Common |
|
|
Common |
|
|
Dividends |
|
|
Earnings |
|
|
Income (Loss) |
|
|
Equity |
|
|
Interest |
|
|
Total |
|
|||||||||||
|
Common Stock |
|
|
|
|
|
|
|
|
|
|
|
|
|
|
|
|
|
|
|
|
|
|
|
|
|
|
|
|
|
|
|
|
|
|
|
|
|
|
|
|
|
|
|
|
|
Issued/(converted) including tax benefits from exercise of stock options |
|
|
— |
|
|
|
— |
|
|
|
9 |
|
|
|
— |
|
|
|
— |
|
|
|
— |
|
|
|
10,370 |
|
|
|
— |
|
|
|
10,379 |
|
|
|
— |
|
|
|
10,379 |
|
|
Repurchased |
|
|
— |
|
|
|
— |
|
|
|
(33 |
) |
|
|
— |
|
|
|
— |
|
|
|
— |
|
|
|
(356,380 |
) |
|
|
— |
|
|
|
(356,413 |
) |
|
|
— |
|
|
|
(356,413 |
) |
|
Restricted share-based compensation expense |
|
|
— |
|
|
|
— |
|
|
|
— |
|
|
|
— |
|
|
|
— |
|
|
|
— |
|
|
|
1,377 |
|
|
|
— |
|
|
|
1,377 |
|
|
|
— |
|
|
|
1,377 |
|
|
Dividends paid |
|
|
— |
|
|
|
— |
|
|
|
— |
|
|
|
— |
|
|
|
— |
|
|
|
(38,211 |
) |
|
|
— |
|
|
|
— |
|
|
|
(38,211 |
) |
|
|
— |
|
|
|
(38,211 |
) |
|
Stock option expense |
|
|
— |
|
|
|
— |
|
|
|
— |
|
|
|
— |
|
|
|
— |
|
|
|
— |
|
|
|
54,265 |
|
|
|
— |
|
|
|
54,265 |
|
|
|
— |
|
|
|
54,265 |
|
|
Distributions to noncontrolling interests |
|
|
(1,781 |
) |
|
|
— |
|
|
|
— |
|
|
|
— |
|
|
|
— |
|
|
|
— |
|
|
|
— |
|
|
|
— |
|
|
|
— |
|
|
|
(22,932 |
) |
|
|
(22,932 |
) |
|
Other |
|
|
— |
|
|
|
— |
|
|
|
— |
|
|
|
— |
|
|
|
— |
|
|
|
— |
|
|
|
— |
|
|
|
— |
|
|
|
— |
|
|
|
635 |
|
|
|
635 |
|
|
Comprehensive income: |
|
|
|
|
|
|
|
|
|
|
|
|
|
|
|
|
|
|
|
|
|
|
|
|
|
|
|
|
|
|
|
|
|
|
|
|
|
|
|
|
|
|
|
|
|
Net income to UHS / noncontrolling interests |
|
|
(836 |
) |
|
|
— |
|
|
|
— |
|
|
|
— |
|
|
|
— |
|
|
|
— |
|
|
|
752,303 |
|
|
|
— |
|
|
|
752,303 |
|
|
|
19,845 |
|
|
|
772,148 |
|
|
Foreign currency translation adjustments |
|
|
— |
|
|
|
— |
|
|
|
— |
|
|
|
— |
|
|
|
— |
|
|
|
— |
|
|
|
— |
|
|
|
26,678 |
|
|
|
26,678 |
|
|
|
— |
|
|
|
26,678 |
|
|
Unrealized loss on marketable security (net of income tax effect of $809) |
|
|
— |
|
|
|
— |
|
|
|
— |
|
|
|
— |
|
|
|
— |
|
|
|
— |
|
|
|
— |
|
|
|
(1,360 |
) |
|
|
(1,360 |
) |
|
|
— |
|
|
|
(1,360 |
) |
|
Unrealized derivative gains on cash flow hedges (net of income tax effect of $2,490) |
|
|
— |
|
|
|
— |
|
|
|
— |
|
|
|
— |
|
|
|
— |
|
|
|
— |
|
|
|
— |
|
|
|
4,189 |
|
|
|
4,189 |
|
|
|
— |
|
|
|
4,189 |
|
|
Minimum pension liability (net of income tax effect of $983) |
|
|
— |
|
|
|
— |
|
|
|
— |
|
|
|
— |
|
|
|
— |
|
|
|
— |
|
|
|
— |
|
|
|
3,087 |
|
|
|
3,087 |
|
|
|
— |
|
|
|
3,087 |
|
|
Subtotal |
|
|
(836 |
) |
|
|
— |
|
|
|
— |
|
|
|
— |
|
|
|
— |
|
|
|
— |
|
|
|
752,303 |
|
|
|
32,594 |
|
|
|
784,897 |
|
|
|
19,845 |
|
|
|
804,742 |
|
|
Balance, December 31, 2017 |
|
$ |
6,702 |
|
|
$ |
66 |
|
|
$ |
869 |
|
|
$ |
7 |
|
|
$ |
0 |
|
|
$ |
(371,814 |
) |
|
$ |
5,353,209 |
|
|
$ |
7,177 |
|
|
$ |
4,989,514 |
|
|
$ |
61,922 |
|
|
$ |
5,051,436 |
|
The accompanying notes are an integral part of these consolidated financial statements.
93
UNIVERSAL HEALTH SERVICES, INC. AND SUBSIDIARIES
CONSOLIDATED STATEMENTS OF CASH FLOWS
|
|
|
Year Ended December 31, |
|
|||||||||
|
|
|
2017 |
|
|
2016 |
|
|
2015 |
|
|||
|
|
|
(Amounts in thousands) |
|
|||||||||
|
Cash Flows from Operating Activities: |
|
|
|
|
|
|
|
|
|
|
|
|
|
Net income |
|
$ |
771,312 |
|
|
$ |
747,171 |
|
|
$ |
750,698 |
|
|
Adjustments to reconcile net income to net cash provided by operating activities: |
|
|
|
|
|
|
|
|
|
|
|
|
|
Depreciation & amortization |
|
|
447,883 |
|
|
|
416,608 |
|
|
|
398,618 |
|
|
Gains on sales of assets and businesses, net of losses |
|
|
0 |
|
|
|
0 |
|
|
|
(3,615 |
) |
|
Stock-based compensation expense |
|
|
56,738 |
|
|
|
48,109 |
|
|
|
39,971 |
|
|
Changes in assets & liabilities, net of effects from acquisitions and dispositions: |
|
|
|
|
|
|
|
|
|
|
|
|
|
Accounts receivable |
|
|
(24,719 |
) |
|
|
(87,881 |
) |
|
|
(45,814 |
) |
|
Accrued interest |
|
|
705 |
|
|
|
9,766 |
|
|
|
(693 |
) |
|
Accrued and deferred income taxes |
|
|
(6,405 |
) |
|
|
22,068 |
|
|
|
(34,394 |
) |
|
Other working capital accounts |
|
|
(15,165 |
) |
|
|
74,489 |
|
|
|
(125,556 |
) |
|
Other assets and deferred charges |
|
|
(28,607 |
) |
|
|
(25,671 |
) |
|
|
6,631 |
|
|
Other |
|
|
(42,564 |
) |
|
|
81,139 |
|
|
|
23,295 |
|
|
Excess income tax benefits related to stock-based compensation |
|
|
0 |
|
|
|
45,219 |
|
|
|
47,364 |
|
|
Accrued insurance expense, net of commercial premiums paid |
|
|
102,595 |
|
|
|
84,638 |
|
|
|
90,895 |
|
|
Payments made in settlement of self-insurance claims |
|
|
(79,192 |
) |
|
|
(81,962 |
) |
|
|
(79,138 |
) |
|
Net cash provided by operating activities |
|
|
1,182,581 |
|
|
|
1,333,693 |
|
|
|
1,068,262 |
|
|
Cash Flows from Investing Activities: |
|
|
|
|
|
|
|
|
|
|
|
|
|
Property and equipment additions, net of disposals |
|
|
(557,506 |
) |
|
|
(519,939 |
) |
|
|
(379,321 |
) |
|
Acquisition of property and businesses |
|
|
(22,878 |
) |
|
|
(613,803 |
) |
|
|
(533,655 |
) |
|
Proceeds received from sales of assets and businesses |
|
|
108 |
|
|
|
0 |
|
|
|
3,391 |
|
|
Costs incurred for purchase and implementation of information technology applications |
|
|
(29,047 |
) |
|
|
(21,475 |
) |
|
|
0 |
|
|
Increase in capital reserves of commercial insurance subsidiary |
|
|
(7,100 |
) |
|
|
(32,000 |
) |
|
|
(3,300 |
) |
|
Investment in, and advances to, joint venture |
|
|
(7,976 |
) |
|
|
0 |
|
|
|
0 |
|
|
Net cash used in investing activities |
|
|
(624,399 |
) |
|
|
(1,187,217 |
) |
|
|
(912,885 |
) |
|
Cash Flows from Financing Activities: |
|
|
|
|
|
|
|
|
|
|
|
|
|
Reduction of long-term debt |
|
|
(143,106 |
) |
|
|
(459,183 |
) |
|
|
(68,166 |
) |
|
Additional borrowings |
|
|
41,100 |
|
|
|
1,170,800 |
|
|
|
234,400 |
|
|
Acquisition of noncontrolling interests in majority owned businesses |
|
|
0 |
|
|
|
(418,000 |
) |
|
|
0 |
|
|
Financing costs |
|
|
(76 |
) |
|
|
(12,449 |
) |
|
|
(515 |
) |
|
Repurchase of common shares |
|
|
(364,401 |
) |
|
|
(353,380 |
) |
|
|
(209,782 |
) |
|
Dividends paid |
|
|
(38,211 |
) |
|
|
(38,875 |
) |
|
|
(39,532 |
) |
|
Issuance of common stock |
|
|
10,254 |
|
|
|
9,503 |
|
|
|
8,441 |
|
|
Profit distributions to noncontrolling interests |
|
|
(24,713 |
) |
|
|
(69,583 |
) |
|
|
(62,220 |
) |
|
Proceeds received from sale/leaseback of real property |
|
|
0 |
|
|
|
0 |
|
|
|
12,765 |
|
|
Net cash used in financing activities |
|
|
(519,153 |
) |
|
|
(171,167 |
) |
|
|
(124,609 |
) |
|
Effect of exchange rate changes on cash and cash equivalents |
|
|
1,647 |
|
|
|
(2,790 |
) |
|
|
(1,609 |
) |
|
Increase (decrease) in cash and cash equivalents |
|
|
40,676 |
|
|
|
(27,481 |
) |
|
|
29,159 |
|
|
Cash and cash equivalents, beginning of period |
|
|
33,747 |
|
|
|
61,228 |
|
|
|
32,069 |
|
|
Cash and cash equivalents, end of period |
|
$ |
74,423 |
|
|
$ |
33,747 |
|
|
$ |
61,228 |
|
|
Supplemental Disclosures of Cash Flow Information: |
|
|
|
|
|
|
|
|
|
|
|
|
|
Interest paid |
|
$ |
135,533 |
|
|
$ |
107,079 |
|
|
$ |
107,054 |
|
|
Income taxes paid, net of refunds |
|
$ |
370,855 |
|
|
$ |
344,611 |
|
|
$ |
380,658 |
|
|
Noncash purchases of property and equipment |
|
$ |
82,496 |
|
|
$ |
65,702 |
|
|
$ |
49,086 |
|
The accompanying notes are an integral part of these consolidated financial statements.
94
NOTES TO CONSOLIDATED FINANCIAL STATEMENTS
1) BUSINESS AND SUMMARY OF SIGNIFICANT ACCOUNTING POLICIES
Services provided by our hospitals, all of which are operated by subsidiaries of ours, include general and specialty surgery, internal medicine, obstetrics, emergency room care, radiology, oncology, diagnostic care, coronary care, pediatric services, pharmacy services and/or behavioral health services. We, through our subsidiaries, provide capital resources as well as a variety of management services to our facilities, including central purchasing, information services, finance and control systems, facilities planning, physician recruitment services, administrative personnel management, marketing and public relations.
The more significant accounting policies follow:
A) Principles of Consolidation: The consolidated financial statements include the accounts of our majority-owned subsidiaries and partnerships controlled by us or our subsidiaries as the managing general partner. All significant intercompany accounts and transactions have been eliminated.
B) Revenue Recognition: We record revenues and related receivables for health care services at the time the services are provided. Medicare and Medicaid revenues represented 30% of our net patient revenues during 2017, 32% during 2016 and 34% during 2015. Revenues from managed care entities, including health maintenance organizations and managed Medicare and Medicaid programs accounted for 56% of our net patient revenues during 2017 and 2016 and 54% during 2015.
We report net patient service revenue at the estimated net realizable amounts from patients and third-party payors and others for services rendered. We have agreements with third-party payors that provide for payments to us at amounts different from our established rates. Payment arrangements include prospectively determined rates per discharge, reimbursed costs, discounted charges and per diem payments. Estimates of contractual allowances under managed care plans are based upon the payment terms specified in the related contractual agreements. We closely monitor our historical collection rates, as well as changes in applicable laws, rules and regulations and contract terms, to assure that provisions are made using the most accurate information available. However, due to the complexities involved in these estimations, actual payments from payors may be different from the amounts we estimate and record.
We estimate our Medicare and Medicaid revenues using the latest available financial information, patient utilization data, government provided data and in accordance with applicable Medicare and Medicaid payment rules and regulations. The laws and regulations governing the Medicare and Medicaid programs are extremely complex and subject to interpretation and as a result, there is at least a reasonable possibility that recorded estimates will change by material amounts in the near term. Certain types of payments by the Medicare program and state Medicaid programs (e.g. Medicare Disproportionate Share Hospital, Medicare Allowable Bad Debts and Inpatient Psychiatric Services) are subject to retroactive adjustment in future periods as a result of administrative review and audit and our estimates may vary from the final settlements. Such amounts are included in accounts receivable, net, on our Consolidated Balance Sheets. The vast majority of the net revenues generated at our behavioral health facilities located in the United Kingdom are derived from government based payors. The funding of both federal Medicare and state Medicaid programs, and the government based payor programs in the United Kingdom, are subject to legislative and regulatory changes. As such, we cannot provide any assurance that future legislation and regulations, if enacted, will not have a material impact on our future government based reimbursements. Adjustments related to the final settlement of these retrospectively determined amounts did not materially impact our results in 2017, 2016 and 2015. We provide care to patients who meet certain financial or economic criteria without charge or at amounts substantially less than our established rates. Because we do not pursue collection of amounts determined to qualify as charity care, they are not reported in net revenues or in accounts receivable, net. See additional disclosure below in Charity Care, Uninsured Discounts and Provision for Doubtful Accounts for our estimated uncompensated care provided and estimated cost of providing uncompensated care.
C) Charity Care, Uninsured Discounts and Provision for Doubtful Accounts: Collection of receivables from third-party payers and patients is our primary source of cash and is critical to our operating performance. Our primary collection risks relate to uninsured patients and the portion of the bill which is the patient’s responsibility, primarily co-payments and deductibles. We estimate our provisions for doubtful accounts based on general factors such as payer mix, the agings of the receivables and historical collection experience. We routinely review accounts receivable balances in conjunction with these factors and other economic conditions which might ultimately affect the collectability of the patient accounts and make adjustments to our allowances as warranted. At our acute care hospitals, third party liability accounts are pursued until all payment and adjustments are posted to the patient account. For those accounts with a patient balance after third party liability is finalized or accounts for uninsured patients, the patient receives statements and collection letters. Our hospitals establish a partial reserve for self-pay accounts in the allowance for doubtful accounts for both unbilled balances and those that have been billed and are under 90 days old. All self-pay accounts are fully reserved at 90 days from the date of discharge. Third party liability accounts are fully reserved in the allowance for doubtful accounts when the balance ages past 180 days from the date of discharge. Patients that express an inability to pay are reviewed for potential sources of financial
95
assistance including our charity care policy. If the patient is deemed unwilling to pay, the account is written-off as bad debt and transferred to an outside collection agency for additional collection effort.
Historically, a significant portion of the patients treated throughout our portfolio of acute care hospitals are uninsured patients which, in part, has resulted from patients who are employed but do not have health insurance or who have policies with relatively high deductibles. Patients treated at our hospitals for non-elective services, who have gross income less than 400% of the federal poverty guidelines, are deemed eligible for charity care. The federal poverty guidelines are established by the federal government and are based on income and family size. Because we do not pursue collection of amounts that qualify as charity care, they are not reported in our net revenues or in our accounts receivable, net.
A portion of the accounts receivable at our acute care facilities are comprised of Medicaid accounts that are pending approval from third-party payers but we also have smaller amounts due from other miscellaneous payers such as county indigent programs in certain states. Our patient registration process includes an interview of the patient or the patient’s responsible party at the time of registration. At that time, an insurance eligibility determination is made and an insurance plan code is assigned. There are various pre-established insurance profiles in our patient accounting system which determine the expected insurance reimbursement for each patient based on the insurance plan code assigned and the services rendered. Certain patients may be classified as Medicaid pending at registration based upon a screening evaluation if we are unable to definitively determine if they are currently Medicaid eligible. When a patient is registered as Medicaid eligible or Medicaid pending, our patient accounting system records net revenues for services provided to that patient based upon the established Medicaid reimbursement rates, subject to the ultimate disposition of the patient’s Medicaid eligibility. When the patient’s ultimate eligibility is determined, reclassifications may occur which impacts the reported amounts in future periods for the provision for doubtful accounts and other accounts such as Medicaid pending. Although the patient’s ultimate eligibility determination may result in amounts being reclassified among these accounts from period to period, these reclassifications did not have a material impact on our results of operations in 2017, 2016 or 2015 since our facilities make estimates at each financial reporting period to reserve for amounts that are deemed to be uncollectible.
We also provide discounts to uninsured patients (included in “uninsured discounts” amounts below) who do not qualify for Medicaid or charity care. Because we do not pursue collection of amounts classified as uninsured discounts, they are not reported in our net revenues or in our net accounts receivable. In implementing the discount policy, we first attempt to qualify uninsured patients for governmental programs, charity care or any other discount program. If an uninsured patient does not qualify for these programs, the uninsured discount is applied.
On a consolidated basis, we monitor our total self-pay receivables to ensure that the total allowance for doubtful accounts provides adequate coverage based on historical collection experience. Our accounts receivable are recorded net of allowance for doubtful accounts of $480 million and $410 million at December 31, 2017 and 2016, respectively.
Uncompensated care (charity care and uninsured discounts):
The following table shows the amounts recorded at our acute care hospitals for charity care and uninsured discounts, based on charges at established rates, for the years ended December 31, 2017, 2016 and 2015:
|
|
|
(dollar amounts in thousands) |
|
|||||||||||||||||||||
|
|
|
2017 |
|
|
2016 |
|
|
2015 |
|
|||||||||||||||
|
|
|
Amount |
|
|
% |
|
|
Amount |
|
|
% |
|
|
Amount |
|
|
% |
|
||||||
|
Charity care |
|
$ |
887,136 |
|
|
|
50 |
% |
|
$ |
733,585 |
|
|
|
50 |
% |
|
$ |
506,571 |
|
|
|
42 |
% |
|
Uninsured discounts |
|
|
881,265 |
|
|
|
50 |
% |
|
|
720,205 |
|
|
|
50 |
% |
|
|
696,463 |
|
|
|
58 |
% |
|
Total uncompensated care |
|
$ |
1,768,401 |
|
|
|
100 |
% |
|
$ |
1,453,790 |
|
|
|
100 |
% |
|
$ |
1,203,034 |
|
|
|
100 |
% |
The provision for doubtful accounts at our acute care hospitals was approximately $756 million during 2017, $628 million during 2016 and $631 million during 2015.
96
The estimated cost of providing uncompensated care:
The estimated cost of providing uncompensated care, as reflected below, were based on a calculation which multiplied the percentage of operating expenses for our acute care hospitals to gross charges for those hospitals by the above-mentioned total uncompensated care amounts. The percentage of cost to gross charges is calculated based on the total operating expenses for our acute care facilities divided by gross patient service revenue for those facilities. An increase in the level of uninsured patients to our facilities and the resulting adverse trends in the provision for doubtful accounts and uncompensated care provided could have a material unfavorable impact on our future operating results.
|
|
|
(amounts in thousands) |
|
|||||||||
|
|
|
2017 |
|
|
2016 |
|
|
2015 |
|
|||
|
Estimated cost of providing charity care |
|
$ |
120,208 |
|
|
$ |
107,887 |
|
|
$ |
77,557 |
|
|
Estimated cost of providing uninsured discounts related care |
|
|
119,412 |
|
|
|
105,920 |
|
|
|
106,630 |
|
|
Estimated cost of providing uncompensated care |
|
$ |
239,620 |
|
|
$ |
213,807 |
|
|
$ |
184,187 |
|
Our accounts receivable as of December 31, 2017 and December 31, 2016 include amounts due from Illinois of approximately $25 million and $38 million, respectively. Collection of the outstanding receivables continues to be delayed due to state budgetary and funding pressures. Approximately $8 million as of December 31, 2017 and $25 million as of December 31, 2016, of the receivables due from Illinois were outstanding in excess of 60 days, as of each respective date. Although the accounts receivable due from Illinois could remain outstanding for the foreseeable future, since we expect to eventually collect all amounts due to us, no related reserves have been established in our consolidated financial statements. However, we can provide no assurance that we will eventually collect all amounts due to us from Illinois. Failure to ultimately collect all outstanding amounts due to us from Illinois would have an adverse impact on our future consolidated results of operations and cash flows.
D) Concentration of Revenues: Our six acute care hospitals in the Las Vegas, Nevada market contributed, on a combined basis, 15% in 2017, 14% in 2016 and 13% in 2015 of our consolidated net revenues.
E) Cash and Cash Equivalents: We consider all highly liquid investments purchased with maturities of three months or less to be cash equivalents.
F) Property and Equipment: Property and equipment are stated at cost. Expenditures for renewals and improvements are charged to the property accounts. Replacements, maintenance and repairs which do not improve or extend the life of the respective asset are expensed as incurred. We remove the cost and the related accumulated depreciation from the accounts for assets sold or retired and the resulting gains or losses are included in the results of operations. Construction-in-progress includes both construction projects and equipment not yet placed into service.
While in progress, we capitalized interest on major construction projects and the development and implementation of information technology applications amounting to $1.0 million during 2017, $1.9 million during 2016 and $304,000 during 2015.
Depreciation is provided on the straight-line method over the estimated useful lives of buildings and improvements (twenty to forty years) and equipment (three to fifteen years). Depreciation expense was $388.4 million during 2017, $350.8 million during 2016 and $337.5 million during 2015.
G) Long-Lived Assets: We review our long-lived assets, including intangible assets, for impairment whenever events or circumstances indicate that the carrying value of these assets may not be recoverable. The assessment of possible impairment is based on our ability to recover the carrying value of our asset based on our estimate of its undiscounted future cash flow. If the analysis indicates that the carrying value is not recoverable from future cash flows, the asset is written down to its estimated fair value and an impairment loss is recognized. Fair values are determined based on estimated future cash flows using appropriate discount rates.
H) Goodwill: Goodwill and indefinite-lived intangible assets are reviewed for impairment at the reporting unit level on an annual basis or sooner if the indicators of impairment arise. Our judgments regarding the existence of impairment indicators are based on market conditions and operational performance of each reporting unit. We have designated October 1st as our annual impairment assessment date and performed impairment assessments as of October 1, 2017 which indicated no impairment of goodwill or indefinite-lived intangible assets. There were also no impairments during 2016 or 2015. Future changes in the estimates used to conduct the impairment reviews, including profitability and market value projections, could indicate impairment in future periods potentially resulting in a write-off of a portion or all of our goodwill or indefinite-lived intangible assets.
97
Changes in the carrying amount of goodwill for the two years ended December 31, 2017 were as follows (in thousands):
|
|
|
Acute Care Services |
|
|
Behavioral Health Services |
|
|
Total Consolidated |
|
|||
|
Balance, January 1, 2016 |
|
$ |
389,507 |
|
|
$ |
3,206,607 |
|
|
$ |
3,596,114 |
|
|
Goodwill acquired during the period |
|
|
50,897 |
|
|
|
183,761 |
|
|
|
234,658 |
|
|
Adjustments to goodwill (a) |
|
|
(110 |
) |
|
|
(46,556 |
) |
|
|
(46,666 |
) |
|
Balance, December 31, 2016 |
|
|
440,294 |
|
|
|
3,343,812 |
|
|
|
3,784,106 |
|
|
Goodwill acquired during the period |
|
|
80 |
|
|
|
0 |
|
|
|
80 |
|
|
Adjustments to goodwill (a) |
|
|
1,137 |
|
|
|
39,834 |
|
|
|
40,971 |
|
|
Balance, December 31, 2017 |
|
$ |
441,511 |
|
|
$ |
3,383,646 |
|
|
$ |
3,825,157 |
|
|
(a) |
The increase/(decrease) in the Behavioral Health Services’ goodwill consists primarily of foreign currency translation adjustments. |
I) Other Assets: Other assets consist primarily of amounts related to: (i) intangible assets acquired in connection with our acquisitions of Cambian Group, PLC’s adult services’ division, Foundations Recovery Network, LLC during 2015, Ascend Health Corporation during 2012 and Psychiatric Solutions, Inc. during 2010; (ii) prepaid fees for various software and other applications used by our hospitals; (iii) costs incurred in connection with the purchase and implementation of an electronic health records application for each of our acute care facilities; (iv) statutorily required capital reserves related to our commercial insurance subsidiary ($110 million as of December 31, 2017); (v) deposits; (vi) investments in various businesses, including Universal Health Realty Income Trust ($8 million as of December 31, 2017) and Premier, Inc. ($33 million as of December 31, 2017); (vii) the invested assets related to a deferred compensation plan that is held by an independent trustee in a rabbi-trust and that has a related payable included in other noncurrent liabilities; (viii) the estimated future payments related to physician-related contractual commitments, as discussed below, and; (ix) other miscellaneous assets.
The following table shows the amounts recorded as net intangible assets for the years ended December 31, 2017 and 2016:
|
|
|
(amounts in millions) |
|
|||||
|
|
|
2017 |
|
|
2016 |
|
||
|
Tradenames |
|
$ |
124 |
|
|
$ |
124 |
|
|
Medicare licenses |
|
|
57 |
|
|
|
57 |
|
|
Certificates of need |
|
|
12 |
|
|
|
12 |
|
|
Contract relationships and other (net of $44 and $34 of accumulated amortization for 2017 and 2016, respectively) |
|
|
27 |
|
|
|
35 |
|
|
Net Intangible Assets |
|
$ |
220 |
|
|
$ |
228 |
|
J) Physician Guarantees and Commitments: Our accrued liabilities-other, and our other assets included approximately $2 million of estimated future payments related to physician-related contractual commitments as of each of December 31, 2017 and 2016. Substantially all of the $2 million of potential future financial obligations outstanding as of December 31, 2017 are potential 2018 obligations.
K) Self-Insured/Other Insurance Risks: We provide for self-insured risks, primarily general and professional liability claims and workers’ compensation claims. Our estimated liability for self-insured professional and general liability claims is based on a number of factors including, among other things, the number of asserted claims and reported incidents, estimates of losses for these claims based on recent and historical settlement amounts, estimate of incurred but not reported claims based on historical experience, and estimates of amounts recoverable under our commercial insurance policies. All relevant information, including our own historical experience is used in estimating the expected amount of claims. While we continuously monitor these factors, our ultimate liability for professional and general liability claims could change materially from our current estimates due to inherent uncertainties involved in making this estimate. Our estimated self-insured reserves are reviewed and changed, if necessary, at each reporting date and changes are recognized currently as additional expense or as a reduction of expense. See Note 8 - Commitments and Contingencies for discussion of adjustments to our prior year reserves for claims related to our self-insured general and professional liability and workers’ compensation liability.
In addition, we also: (i) own commercial health insurers headquartered in Nevada and Puerto Rico, and; (ii) maintain self-insured employee benefits programs for employee healthcare and dental claims. The ultimate costs related to these programs/operations include expenses for claims incurred and paid in addition to an accrual for the estimated expenses incurred in connection with claims incurred but not yet reported. Given our significant insurance-related exposure, there can be no assurance that a sharp increase in the number and/or severity of claims asserted against us will not have a material adverse effect on our future results of operations.
98
L) Income Taxes: Deferred tax assets and liabilities are recognized for the amount of taxes payable or deductible in future years as a result of differences between the tax bases of assets and liabilities and their reported amounts in the financial statements. We believe that future income will enable us to realize our deferred tax assets net of recorded valuation allowances relating to state net operating loss carry-forwards.
We operate in multiple jurisdictions with varying tax laws. We are subject to audits by any of these taxing authorities. Our tax returns have been examined by the Internal Revenue Service (“IRS”) through the year ended December 31, 2006. We believe that adequate accruals have been provided for federal, foreign and state taxes. See Note 6 - Income Taxes, for additional disclosure.
M) Other Noncurrent Liabilities: Other noncurrent liabilities include the long-term portion of our professional and general liability, workers’ compensation reserves, pension and deferred compensation liabilities, and liabilities incurred in connection with split-dollar life insurance agreements on the lives of our chief executive officer and his wife.
N) Redeemable Noncontrolling Interests and Noncontrolling Interest: As of December 31, 2017, outside owners held noncontrolling, minority ownership interests of: (i) 20% in an acute care facility located in Washington, D.C.; (ii) approximately 11% in an acute care facility located in Texas; (iii) 20% and 30% in two behavioral health care facilities located in Pennsylvania and Ohio, respectively, and; (iv) approximately 5% in an acute care facility located in Nevada. The noncontrolling interest and redeemable noncontrolling interest balances of $62 million and $7 million, respectively, as of December 31, 2017, consist primarily of the third-party ownership interests in these hospitals.
In May, 2016, we purchased the minority ownership interests held by a third-party in our six acute care hospitals located in Las Vegas, Nevada, for an aggregate cash payment of $445 million which included both the purchase price ($418 million) and the return of reserve capital ($27 million). The ownership interests purchased ranged from 26.1% to 27.5%.
In connection with the two behavioral health care facilities located in Pennsylvania and Ohio, the minority ownership interests of which are reflected as redeemable noncontrolling interests on our Consolidated Balance Sheet, the outside owners have “put options” to put their entire ownership interest to us at any time. If exercised, the put option requires us to purchase the minority member’s interest at fair market value.
O) Accumulated Other Comprehensive Income: The accumulated other comprehensive income (“AOCI”) component of stockholders’ equity includes: net unrealized gains and losses on effective cash flow hedges, foreign currency translation adjustments and the net minimum pension liability of a non-contributory defined benefit pension plan which covers employees at one of our subsidiaries. See Note 10 - Pension Plan for additional disclosure regarding the defined benefit pension plan.
The amounts recognized in AOCI for the two years ended December 31, 2017 were as follows (in thousands):
|
|
|
Net Unrealized Gains (Losses) on Effective Cash Flow Hedges |
|
|
Foreign Currency Translation Adjustment |
|
|
Unrealized loss on marketable security |
|
|
Minimum Pension Liability |
|
|
Total AOCI |
|
|||||
|
Balance, January 1, 2016, net of income tax |
|
$ |
(776 |
) |
|
$ |
(4,159 |
) |
|
$ |
— |
|
|
$ |
(18,194 |
) |
|
$ |
(23,129 |
) |
|
2016 activity: |
|
|
|
|
|
|
|
|
|
|
|
|
|
|
|
|
|
|
|
|
|
Pretax amount |
|
|
1,271 |
|
|
|
(10,038 |
) |
|
|
(2,229 |
) |
|
|
13,356 |
|
|
|
2,360 |
|
|
Income tax effect |
|
|
(476 |
) |
|
|
— |
|
|
|
831 |
|
|
|
(5,003 |
) |
|
|
(4,648 |
) |
|
Change, net of income tax |
|
|
795 |
|
|
|
(10,038 |
) |
|
|
(1,398 |
) |
|
|
8,353 |
|
|
|
(2,288 |
) |
|
Balance, January 1, 2017, net of income tax |
|
|
19 |
|
|
|
(14,197 |
) |
|
|
(1,398 |
) |
|
|
(9,841 |
) |
|
|
(25,417 |
) |
|
2017 activity: |
|
|
|
|
|
|
|
|
|
|
|
|
|
|
|
|
|
|
|
|
|
Pretax amount |
|
|
6,679 |
|
|
|
26,678 |
|
|
|
(2,169 |
) |
|
|
4,070 |
|
|
|
35,258 |
|
|
Income tax effect |
|
|
(2,490 |
) |
|
|
— |
|
|
|
809 |
|
|
|
(983 |
) |
|
|
(2,664 |
) |
|
Change, net of income tax |
|
|
4,189 |
|
|
|
26,678 |
|
|
|
(1,360 |
) |
|
|
3,087 |
|
|
|
32,594 |
|
|
Balance, December 31, 2017, net of income tax |
|
$ |
4,208 |
|
|
$ |
12,481 |
|
|
$ |
(2,758 |
) |
|
$ |
(6,754 |
) |
|
$ |
7,177 |
|
P) Accounting for Derivative Financial Investments and Hedging Activities and Foreign Currency Forward Exchange Contracts: We manage our ratio of fixed to floating rate debt with the objective of achieving a mix that management believes is appropriate. To manage this risk in a cost-effective manner, we, from time to time, enter into interest rate swap agreements in which we agree to exchange various combinations of fixed and/or variable interest rates based on agreed upon notional amounts.
We account for our derivative and hedging activities using the Financial Accounting Standard Board’s (“FASB”) guidance which requires all derivative instruments, including certain derivative instruments embedded in other contracts, to be carried at fair
99
value on the balance sheet. For derivative transactions designated as hedges, we formally document all relationships between the hedging instrument and the related hedged item, as well as its risk-management objective and strategy for undertaking each hedge transaction.
Derivative instruments designated in a hedge relationship to mitigate exposure to variability in expected future cash flows, or other types of forecasted transactions, are considered cash flow hedges. Cash flow hedges are accounted for by recording the fair value of the derivative instrument on the balance sheet as either an asset or liability, with a corresponding amount recorded in accumulated other comprehensive income (“AOCI”) within stockholders’ equity. Amounts are reclassified from AOCI to the income statement in the period or periods the hedged transaction affects earnings.
We use interest rate derivatives in our cash flow hedge transactions. Such derivatives are designed to be highly effective in offsetting changes in the cash flows related to the hedged liability. For derivative instruments designated as cash flow hedges, the ineffective portion of the change in expected cash flows of the hedged item are recognized currently in the income statement.
Derivative instruments designated in a hedge relationship to mitigate exposure to changes in the fair value of an asset, liability, or firm commitment attributable to a particular risk, such as interest rate risk, are considered fair value hedges. Fair value hedges are accounted for by recording the changes in the fair value of both the derivative instrument and the hedged item in the income statement.
For hedge transactions that do not qualify for the short-cut method, at the hedge’s inception and on a regular basis thereafter, a formal assessment is performed to determine whether changes in the fair values or cash flows of the derivative instruments have been highly effective in offsetting changes in cash flows of the hedged items and whether they are expected to be highly effective in the future.
We use forward exchange contracts to hedge our net investment in foreign operations against movements in exchange rates. The effective portion of the unrealized gains or losses on these contracts is recorded in foreign currency translation adjustment within accumulated other comprehensive income and remains there until either the sale or liquidation of the subsidiary. The cash flows from these contracts are reported as operating activities in the Consolidated Statements of Cash Flows.
Q) Stock-Based Compensation: At December 31, 2017, we have a number of stock-based employee compensation plans. Pursuant to the FASB’s guidance, we expense the grant-date fair value of stock options and other equity-based compensation pursuant to the straight-line method over the stated vesting period of the award using the Black-Scholes option-pricing model.
The expense associated with share-based compensation arrangements is a non-cash charge. In the Consolidated Statements of Cash Flows, share-based compensation expense is an adjustment to reconcile net income to cash provided by operating activities.
R) Earnings per Share: Basic earnings per share are based on the weighted average number of common shares outstanding during the year. Diluted earnings per share are based on the weighted average number of common shares outstanding during the year adjusted to give effect to common stock equivalents.
100
The following table sets forth the computation of basic and diluted earnings per share, for the periods indicated:
|
|
|
Twelve Months Ended December 31, |
|
|||||||||
|
|
|
2017 |
|
|
2016 |
|
|
2015 |
|
|||
|
Basic and diluted: |
|
|
|
|
|
|
|
|
|
|
|
|
|
Net Income |
|
$ |
771,312 |
|
|
$ |
747,171 |
|
|
$ |
750,698 |
|
|
Less: Net income attributable to noncontrolling interest |
|
|
(19,009 |
) |
|
|
(44,762 |
) |
|
|
(70,170 |
) |
|
Less: Net income attributable to unvested restricted share grants |
|
|
(362 |
) |
|
|
(314 |
) |
|
|
(281 |
) |
|
Net income attributable to UHS—basic and diluted |
|
$ |
751,941 |
|
|
$ |
702,095 |
|
|
$ |
680,247 |
|
|
Basic earnings per share attributable to UHS: |
|
|
|
|
|
|
|
|
|
|
|
|
|
Weighted average number of common shares—basic |
|
|
95,652 |
|
|
|
97,208 |
|
|
|
98,797 |
|
|
Total basic earnings per share |
|
$ |
7.86 |
|
|
$ |
7.22 |
|
|
$ |
6.89 |
|
|
Diluted earnings per share attributable to UHS: |
|
|
|
|
|
|
|
|
|
|
|
|
|
Weighted average number of common shares |
|
|
95,652 |
|
|
|
97,208 |
|
|
|
98,797 |
|
|
Net effect of dilutive stock options and grants based on the treasury stock method |
|
|
673 |
|
|
|
1,172 |
|
|
|
1,897 |
|
|
Weighted average number of common shares and equivalents—diluted |
|
|
96,325 |
|
|
|
98,380 |
|
|
|
100,694 |
|
|
Total diluted earnings per share |
|
$ |
7.81 |
|
|
$ |
7.14 |
|
|
$ |
6.76 |
|
The “Net effect of dilutive stock options and grants based on the treasury stock method”, for all years presented above, excludes certain outstanding stock options applicable to each year since the effect would have been anti-dilutive. The excluded weighted-average stock options totaled approximately 6.2 million during 2017, 2.2 million during 2016 and 765,000 during 2015.
S) Fair Value of Financial Instruments: The fair values of our registered debt and investments are based on quoted market prices. The fair values of other long-term debt, including capital lease obligations, are estimated by discounting cash flows using period-end interest rates and market conditions for instruments with similar maturities and credit quality. The carrying amounts reported in the balance sheet for cash, accounts receivable, accounts payable, and short-term borrowings approximates their fair values due to the short-term nature of these instruments. Accordingly, these items have been excluded from the fair value disclosures included elsewhere in these notes to consolidated financial statements.
T) Use of Estimates: The preparation of financial statements in conformity with U.S. generally accepted accounting principles requires us to make estimates and assumptions that affect the reported amounts of assets and liabilities and disclosure of contingent assets and liabilities at the date of the financial statements and the reported amounts of revenues and expenses during the reporting period. Actual results could differ from those estimates.
U) Mergers and Acquisitions: The acquisition method of accounting for business combinations requires that the assets acquired and liabilities assumed be recorded at the date of acquisition at their respective fair values with limited exceptions. Fair value is defined as the exchange price that would be received for an asset or paid to transfer a liability (an exit price) in the principal or most advantageous market for the asset or liability in an orderly transaction between market participants on the measurement date. Any excess of the purchase price (consideration transferred) over the estimated fair values of net assets acquired is recorded as goodwill. Transaction costs and costs to restructure the acquired company are expensed as incurred. The fair value of intangible assets, including Medicare licenses, certificates of need, tradenames and certain contracts, is based on significant judgments made by our management, and accordingly, for significant items we typically obtain assistance from third party valuation specialists.
V) GPO Agreement/Minority Ownership Interest: During 2013, we entered into a new group purchasing organization agreement (“GPO”) with Premier, Inc. (“Premier), a healthcare performance improvement alliance, and acquired a minority interest in the GPO for a nominal amount. During the fourth quarter of 2013, in connection with the completion of an initial public offering of the stock of Premier, we received cash proceeds for the sale of a portion of our ownership interest in the GPO, which were recorded as deferred income, on a pro rata basis, as a reduction to our supplies expense over the initial expected life of the GPO agreement. Also in connection with this GPO agreement, we received shares of restricted stock in Premier which vest ratably over a seven-year period (2014 through 2020), contingent upon our continued participation and minority ownership interest in the GPO. We recognize the fair value of this restricted stock, as a reduction to our supplies expense, in our consolidated statements of income, on a pro rata basis, over the vesting period. We have elected to retain of portion of the previously vested shares of Premier, the value of which is included in other assets on our consolidated balance sheet. Premier shares held by us after the restrictions have lapsed are adjusted, through accumulated other comprehensive income/loss, to the then current market value as of each respective balance sheet date amounting to $33 million and $23 million as of December 31, 2017 and 2016, respectively.
101
W) Provider Taxes: We incur health-care related taxes (“Provider Taxes”) imposed by states in the form of a licensing fee, assessment or other mandatory payment which are related to: (i) healthcare items or services; (ii) the provision of, or the authority to provide, the health care items or services, or; (iii) the payment for the health care items or services. Such Provider Taxes are subject to various federal regulations that limit the scope and amount of the taxes that can be levied by states in order to secure federal matching funds as part of their respective state Medicaid programs. We derive a related Medicaid reimbursement benefit from assessed Provider Taxes in the form of Medicaid claims based payment increases and/or lump sum Medicaid supplemental payments.
Under these programs, including the impact of the Texas Uncompensated Care and Upper Payment Limit program, the Texas Delivery System Reform Incentive program, and various other state programs, we earned revenues (before Provider Taxes) of approximately $357 million during 2017, $327 million during 2016 and $307 million during 2015. These revenues were offset by Provider Taxes of approximately $171 million during 2017, $166 million during 2016, $137 million during 2015, which are recorded in other operating expenses on the Consolidated Statements of Income as included herein. The aggregate net benefit from these programs was $186 million during 2017, $161 million during 2016 and $170 million during 2015. The aggregate net benefit pursuant to these programs is earned from multiple states and therefore no particular state’s portion is individually material to our consolidated financial statements. In addition, under various disproportionate share hospital payment programs and the Nevada state plan amendment program, we earned revenues of $55 million in 2017, $53 million in 2016 and $46 million in 2015.
X) Recent Accounting Standards: In August, 2016, the FASB issued ASU No. 2016-15, Classification of Certain Cash Receipts and Cash Payments, which adds or clarifies guidance of the classification of certain cash receipts and payments in the statement of cash flows with the intent to alleviate diversity in practice for classifying various types of cash flows. This ASU is effective for annual and interim reporting periods beginning after December 15, 2017, with early adoption permitted. We are currently evaluating the impact of this ASU on our statement of cash flows.
In March, 2016, the FASB issued ASU 2016-09, “Compensation – Stock Compensation (Topic 718): Improvements to Employee Share-Based Payment Accounting”, which amends the accounting for employee share-based payment transactions to require recognition of the tax effects resulting from the settlement of stock-based awards as income tax expense or benefit in the income statement in the reporting period in which they occur. We have adopted this new standard, which is effective for annual reporting periods beginning after December 15, 2016, as of January 1, 2017. The impact of ASU 2016-09 to date is explained in Note 10-Income Taxes. Since the impact of ASU 2016-09 on our future Condensed Consolidated Statements of Income and Condensed Consolidated Statements of Cash Flows is dependent upon the timing of stock option exercises, and the market price of our stock at the time of exercise, we are unable to estimate the impact this adoption will have on our future financial statements.
In May 2014 and March 2016, the FASB issued ASU 2014-09 and ASU 2016-08, “Revenue from Contracts with Customers (Topic 606)” and “Revenue from Contracts with Customers: Principal versus Agent Considerations (Reporting Revenue Gross versus Net)”, respectively, which provides guidance for revenue recognition. The standard’s core principle is that a company will recognize revenue when it transfers promised goods or services to customers in an amount that reflects the consideration to which the company expects to be entitled in exchange for those goods or services. This ASU also requires additional disclosures. The FASB updated the new revenue standard by clarifying the principal versus agent implementation guidance, but does not change the core principle of the new standard. ASU 2014-09 is effective for annual reporting periods beginning after December 15, 2016; however, in July 2015, the FASB approved a one-year deferral of this standard, with a new effective date for fiscal years beginning after December 15, 2017. We are currently in the process of assessing and analyzing the various sources of revenue and plan to use a portfolio approach as a practical expedient to account for patient contracts. We have a team in place to lead the implementation of the new standard, including the evaluation of our systems and internal controls to ensure adequacy of data and information needed for adoption, as well as assessing the potential impact of the new standard on various reimbursement programs in which our hospitals participate. The team, consisting of representatives across the organization is progressing towards the completion of their evaluation and began drafting required disclosures and updates to our policies and practices in the fourth quarter of 2017. We are planning to adopt the standard using the modified retrospective approach. We anticipate the most significant change will be how the estimate for the allowance for doubtful accounts will be recognized under the new standards. Under the current standards, our estimate for amounts not expected to be collected based upon our historical experience have been included within net revenue. Under the new standards, our estimate for amounts not expected to be collected based on historical experience will continue to be recognized as a reduction to net revenue. However, subsequent changes in estimate of collectability due to a change in the financial status of a payor, for example a bankruptcy, will be recognized as bad debt expense in operating charges. Although we continue to evaluate the impact of this ASU, we do not expect the adoption to have a material impact on our consolidated financial statements and related disclosures.
In February, 2016, the FASB issued ASU 2016-02, “Leases (Topic 842): Amendments to the FASB Accounting Standards Codification (“Update 2016-02”), which requires an entity to recognize lease assets and lease liabilities on the balance sheet and to disclose key qualitative and quantitative information about the entity’s leasing arrangements. This update is effective for annual reporting periods beginning after December 15, 2018 with early adoption permitted. A modified retrospective approach is required. Upon adoption of this new standard, we will recognize significant right of use assets and lease obligation liabilities on the consolidated balance sheet as a result of our operating lease obligations. Operating lease expense will still be recognized on a straight-
102
line basis over the remaining life of the lease within lease and rental expense in the consolidated statements of income. We are currently evaluating the effect that ASU 2016-02 will have on our consolidated financial statements and related disclosures.
In January, 2017, the FASB issued ASU No. 2017-04, “Intangibles-Goodwill and Other (Topic 350): Simplifying the Accounting for Goodwill Impairment” (“ASU 2017-04”), which removes the requirement to perform a hypothetical purchase price allocation to measure goodwill impairment. A goodwill impairment will now be the amount by which a reporting unit’s carrying value exceeds its fair value, not to exceed the carrying amount of goodwill. ASU 2017-04 is effective for the annual and interim periods beginning January 1, 2020 with early adoption permitted, and applied prospectively. We do not expect ASU 2017-04 to have a material impact on our financial statements.
In January, 2017, the FASB issued ASU 2017-01, “Business Combinations (Topic 805) - Clarifying the Definition of a Business” to clarify the definition of a business in order to allow for the evaluation of whether transactions should be accounted for as acquisitions or disposals of assets or businesses. ASU 2017-01 is effective for fiscal years beginning after December 15, 2017, including interim periods within those fiscal years. Early adoption is permitted. The future impact of ASU 2017-01 will be dependent upon the nature of future acquisitions or dispositions made by us, if any.
In August, 2017, the FASB issued ASU 2017-12, “Targeted Improvements to Accounting for Hedging Activities", which amends the accounting and presentation of certain hedging activities outlined in ASC 815 and is intended to more accurately present economic results of hedging activities. This update is effective for annual reporting periods beginning after December 15, 2018 with early adoption permitted. The adoption is required prospectively with a cumulative-effect adjustment. We are currently evaluating the impact of this ASU on our financial statements.
From time to time, new accounting guidance is issued by the FASB or other standard setting bodies that is adopted by the Company as of the effective date or, in some cases where early adoption is permitted, in advance of the effective date. The Company has assessed the recently issued guidance that is not yet effective and, unless otherwise indicated above, believes the new guidance will not have a material impact on our results of operations, cash flows or financial position.
Y) Foreign Currency Translation: Assets and liabilities of our U.K. subsidiaries are denominated in pound sterling and translated into U.S. dollars at: (i) the rates of exchange at the balance sheet date, and; (ii) average rates of exchange prevailing during the year for revenues and expenses. The currency translation adjustments are reported as a component of accumulated other comprehensive income. See Note 3 - Financial Instruments, Foreign Currency Forward Exchange Contracts for additional disclosure.
Z) Supplies: Supplies, which consist primarily of medical supplies, are stated at the lower of cost (first-in, first-out basis) or market.
2) ACQUISITIONS AND DIVESTITURES
2018 Acquisitions:
In January, 2018, we acquired Gulfport Behavioral Health System, a 109-bed behavioral health care facility located in Gulfport, Mississippi.
Year ended December 31, 2017:
2017 Acquisitions of Assets and Businesses:
During 2017 we spent $23 million to acquire businesses and property.
2017 Divestiture of Assets and Businesses:
There were no significant divestitures during 2017.
103
Year ended December 31, 2016:
2016 Acquisitions of Assets and Businesses:
During 2016 we spent $614 million to:
|
|
• |
acquire the adult services division of Cambian Group, PLC consisting of 79 inpatient and 2 outpatient behavioral health facilities located in the U.K. (acquired late in the fourth quarter); |
|
|
• |
acquire Desert View Hospital, a 25-bed acute care facility located in Pahrump, Nevada (acquired during the third quarter), and; |
|
|
• |
acquire various other businesses and real property assets. |
The aggregate net purchase price of the facilities, which were acquired to enhance and expand our existing operations in the U.S. and the U.K., was allocated to assets and liabilities based on their preliminary estimated fair values as follows:
|
|
|
Amount (000s) |
|
|
|
|
Working capital, net |
|
$ |
6,680 |
|
|
|
Property & equipment |
|
|
343,846 |
|
|
|
Goodwill |
|
|
234,658 |
|
|
|
Other assets (includes $18 million of contract-based relationships intangible assets) |
|
|
19,910 |
|
|
|
Income tax assets, net of deferred tax liabilities |
|
|
11,551 |
|
|
|
Debt |
|
|
(152 |
) |
|
|
Noncontrolling interest |
|
|
(2,690 |
) |
|
|
Cash paid in 2016 for acquisitions |
|
$ |
613,803 |
|
|
Goodwill of the facilities acquired during each of the last 3 years is computed, pursuant to the residual method, by deducting the fair value of the acquired assets and liabilities from the total purchase price. The factors that contribute to the recognition of goodwill, which may also influence the purchase price, include the following for each of the acquired facilities: (i) the historical cash flows and income levels; (ii) the reputations in their respective markets; (iii) the nature of the respective operations, and; (iv) the future cash flows and income growth projections. The vast majority of the goodwill resulting from these transactions is not deductible for federal income tax purposes (see Note 6 - Income Taxes).
On December 28, 2016, we completed the acquisition of Cambian Group, PLC’s adult services’ division (the “Cambian Adult Services”) for a total purchase price of approximately $473 million. At the time of acquisition, the Cambian Adult Services consisted of 79 inpatient and 2 outpatient behavioral health facilities located in the U.K. The Competition and Markets Authority (“CMA”) in the U.K. reviewed our acquisition of the Cambian Adult Services. In April, 2017, the CMA notified us that they identified potential competition concerns in certain markets and announced its decision to refer our acquisition of Cambian Group, PLC’s Adult Services division for a Phase 2 investigation. In October, 2017, the CMA provided the final ruling regarding the Phase 2 investigation requiring us to divest a facility which was subsequently designated to be The Limes, an 18-bed facility. The operating results for The Limes are reflected as discontinued operations during 2017. Since the aggregate income from discontinued operations before income tax expense for this facility is not material to our 2017 consolidated financial statements, it is included as a reduction to our operating expenses. For the twelve-month period ended December 31, 2017, The Limes generated approximately $3 million of net revenues, $953,000 of income before income taxes and $770,000 of after-tax income.
Our consolidated statement of income for the year ended December 31, 2016 was not impacted by our acquisition of the Cambian Adult Services business since the acquisition occurred in late December, 2016. Our consolidated net revenues for the year ended December 31, 2016 included approximately $12 million of net revenues generated at the above-mentioned Desert View Hospital representing the facility’s net revenues from the date of acquisition through December 31, 2016. The earnings generated by the hospital since its date of acquisition was not material to our 2016 consolidated net income attributable to UHS and net income attributable to UHS per diluted share.
Assuming the acquisition of the Cambian Adult Services business and Desert View Hospital occurred on January 1, 2016, our 2016 unaudited pro forma net revenues would have been approximately $9.98 billion and our unaudited pro forma net income attributable to UHS would have been approximately $730 million, or $7.25 per diluted share. Assuming the above-mentioned acquisitions occurred on January 1, 2015, our 2015 unaudited pro forma net revenues would have been approximately $9.28 billion and our unaudited pro forma net income attributable to UHS would have been approximately $708 million and $7.03 per diluted share.
104
2016 Divestiture of Assets and Businesses:
There were no divestitures during 2016.
Year ended December 31, 2015:
2015 Acquisitions of Assets and Businesses:
During 2015 we spent $534 million to:
|
|
• |
acquire a 46-bed behavioral health care facility located in the U.K. (acquired during the first quarter); |
|
|
• |
acquire Alpha Hospitals Holdings Limited consisting of four behavioral health care hospitals with 305 beds located in the U.K. (acquired during the third quarter); |
|
|
• |
acquire Foundations Recovery Network, LLC (“Foundations”) consisting of 4 inpatient facilities (322 beds) as well as 8 outpatient centers (during the fourth quarter), and; |
|
|
• |
various other businesses, a management contract and real property assets. |
The aggregate net purchase price of the facilities was allocated to assets and liabilities based on their preliminary estimated fair values as follows:
|
|
|
Amount (000s) |
|
|
|
Working capital, net |
|
$ |
(7,000 |
) |
|
Property & equipment |
|
|
116,000 |
|
|
Goodwill |
|
|
319,000 |
|
|
Other assets |
|
|
128,000 |
|
|
Income tax assets, net of deferred tax liabilities |
|
|
(22,000 |
) |
|
Cash paid in 2015 for acquisitions |
|
$ |
534,000 |
|
Other assets includes an indefinite lived tradename for $124 million recorded in connection with the Foundations acquisition.
Included in our consolidated net revenues for the year ended December 31, 2015 was an aggregate of approximately $30 million representing the net revenues generated at the newly acquired facilities from their respective dates of acquisition through December 31, 2015. The aggregate effect of the earnings generated by these facilities since the dates of acquisition, less the cost on the borrowings utilized to finance the acquisition, was not material to our 2015 net income attributable to UHS and net income attributable to UHS per diluted share.
Assuming the acquisitions occurred on January 1, 2015, our 2015 unaudited pro forma net revenues would have been approximately $9.17 billion and our unaudited pro forma net income attributable to UHS would have been approximately $690 million, or $6.85 per diluted share. Assuming the above-mentioned acquisitions occurred on January 1, 2014, our 2014 unaudited pro forma net revenues would have been approximately $8.35 billion and our unaudited pro forma net income attributable to UHS would have been approximately $545 million and $5.42 per diluted share.
2015 Divestiture of Assets and Businesses:
During 2015 we received $3 million in connection with the divestiture of a small operator of behavioral health care services.
3) FINANCIAL INSTRUMENTS
Fair Value Hedges:
During 2017, 2016 and 2015, we had no fair value hedges outstanding.
Cash Flow Hedges:
We manage our ratio of fixed and floating rate debt with the objective of achieving a mix that management believes is appropriate. To manage this risk in a cost-effective manner, we, from time to time, enter into interest rate swap agreements in which we agree to exchange various combinations of fixed and/or variable interest rates based on agreed upon notional amounts. We account
105
for our derivative and hedging activities using the Financial Accounting Standard Board’s (“FASB”) guidance which requires all derivative instruments, including certain derivative instruments embedded in other contracts, to be carried at fair value on the balance sheet. For derivative transactions designated as hedges, we formally document all relationships between the hedging instrument and the related hedged item, as well as its risk-management objective and strategy for undertaking each hedge transaction.
Derivative instruments designated in a hedge relationship to mitigate exposure to variability in expected future cash flows, or other types of forecasted transactions, are considered cash flow hedges. Cash flow hedges are accounted for by recording the fair value of the derivative instrument on the balance sheet as either an asset or liability, with a corresponding amount recorded in accumulated other comprehensive income (“AOCI”) within shareholders’ equity. Amounts are reclassified from AOCI to the income statement in the period or periods the hedged transaction affects earnings. We use interest rate derivatives in our cash flow hedge transactions. Such derivatives are designed to be highly effective in offsetting changes in the cash flows related to the hedged liability. For derivative instruments designated as cash flow hedges, the ineffective portion of the change in expected cash flows of the hedged item are recognized currently in the income statement.
For hedge transactions that do not qualify for the short-cut method, at the hedge’s inception and on a regular basis thereafter, a formal assessment is performed to determine whether changes in the fair values or cash flows of the derivative instruments have been highly effective in offsetting changes in cash flows of the hedged items and whether they are expected to be highly effective in the future.
The fair value of interest rate swap agreements approximates the amount at which they could be settled, based on estimates obtained from the counterparties. We assess the effectiveness of our hedge instruments on a quarterly basis. We performed periodic assessments of the cash flow hedge instruments during 2017 and 2016 and determined the hedges to be highly effective. We also determined that any portion of the hedges deemed to be ineffective was de minimis and therefore there was no material effect on our consolidated financial position, operations or cash flows. The counterparties to the interest rate swap agreements expose us to credit risk in the event of nonperformance. We do not anticipate nonperformance by our counterparties. We do not hold or issue derivative financial instruments for trading purposes.
Seven interest rate swaps on a total notional amount of $825 million matured in May, 2015. Four of these swaps, with a total notional amount of $600 million, became effective in December, 2011 and provided that we receive three-month LIBOR while the average fixed rate payable was 2.38%. The remaining three swaps, with a total notional amount of $225 million, became effective in March, 2011 and provided that we receive three-month LIBOR while the average fixed rate payable was 1.91%.
During 2015, we entered into nine forward starting interest rate swaps whereby we pay a fixed rate on a total notional amount of $1.0 billion and receive one-month LIBOR. The average fixed rate payable on these swaps, which are scheduled to mature on April 15, 2019, is 1.31%. These interest rates swaps consist of:
•Four forward starting interest rate swaps, entered into during the second quarter of 2015, whereby we pay a fixed rate on a total notional amount of $500 million and receive one-month LIBOR. Each of the four swaps became effective on July 15, 2015 and are scheduled to mature on April 15, 2019. The average fixed rate payable on these swaps is 1.40%;
•Four forward starting interest rate swaps, entered into during the third quarter of 2015, whereby we pay a fixed rate on a total notional amount of $400 million and receive one-month LIBOR. One swap on a notional amount of $100 million became effective on July 15, 2015, two swaps on a total notional amount of $200 million became effective on September 15, 2015 and another swap on a notional amount of $100 million became effective on December 15, 2015. All of these swaps are scheduled to mature on April 15, 2019. The average fixed rate payable on these four swaps is 1.23%, and;
•One interest rate swap, entered into during the fourth quarter of 2015, whereby we pay a fixed rate on a total notional amount of $100 million and receive one-month LIBOR. The swap became effective on December 15, 2015 and is scheduled to mature on April 15, 2019. The fixed rate payable on this swap is 1.21%.
We measure our interest rate swaps at fair value on a recurring basis. The fair value of our interest rate swaps is based on quotes from our counterparties. We consider those inputs to be “level 2” in the fair value hierarchy as outlined in the authoritative guidance for disclosures in connection with derivative instruments and hedging activities. At December 31, 2017, the fair value of our interest rate swaps was a net asset of $7 million, $4 million of which is included in net accounts receivable and $3 million of which is included in other assets on the accompanying balance sheet. At December 31, 2016, the fair value of our interest rate swaps was de minimis on a net basis comprised of a $4 million asset which is included in other assets offset by a $4 million liability which is included in other current liabilities on the accompanying consolidated balance sheet.
106
Foreign Currency Forward Exchange Contracts:
We use forward exchange contracts to hedge our net investment in foreign operations against movements in exchange rates. The effective portion of the unrealized gains or losses on these contracts is recorded in foreign currency translation adjustment within accumulated other comprehensive income and remains there until either the sale or liquidation of the subsidiary. The cash flows from these contracts are reported as operating activities in the consolidated statements of cash flows. During 2017, we recorded net cash outflows of $64 million while during 2016 and 2015, we recorded net cash inflows of $79 million and $23 million, respectively, associated with these forward exchange contracts.
4) LONG-TERM DEBT
A summary of long-term debt follows:
|
|
|
December 31, |
|
|||||
|
|
|
2017 |
|
|
2016 |
|
||
|
|
|
(amounts in thousands) |
|
|||||
|
Long-term debt: |
|
|
|
|
|
|
|
|
|
Notes payable and Mortgages payable (including obligations under capitalized leases of $21,780 in 2017 and $23,446 in 2016) and term loans with varying maturities through 2027; weighted average interest rates of 9.1% in 2017 and 8.9% in 2016 (see Note 7 regarding capitalized leases) |
|
$ |
22,794 |
|
|
$ |
25,246 |
|
|
Revolving credit and on-demand credit facility |
|
|
438,100 |
|
|
|
469,700 |
|
|
Term Loan A, net of unamortized discount of $708 in 2017 and $1,151 in 2016 |
|
|
1,774,607 |
|
|
|
1,862,915 |
|
|
Accounts receivable securitization program |
|
|
419,500 |
|
|
|
398,700 |
|
|
3.75% Senior Secured Notes due 2019, net of unamortized discount of $69 in 2017 and $112 in 2016 |
|
|
299,931 |
|
|
|
299,888 |
|
|
4.75% Senior Secured Notes due 2022, including unamortized premium of $4,430 in 2017 and $5,400 in 2016 and net of unamortized discount of $124 in 2017 and $150 in 2016 |
|
|
704,306 |
|
|
|
705,250 |
|
|
5.00% Senior Secured Notes due 2026 |
|
|
400,000 |
|
|
|
400,000 |
|
|
Total debt before unamortized financing costs |
|
|
4,059,238 |
|
|
|
4,161,699 |
|
|
Less-Unamortized financing costs |
|
|
(19,229 |
) |
|
|
(25,574 |
) |
|
Total debt after unamortized financing costs |
|
|
4,040,009 |
|
|
|
4,136,125 |
|
|
Less-Amounts due within one year (net of unamortized financing costs) |
|
|
(545,619 |
) |
|
|
(105,895 |
) |
|
Long-term debt |
|
$ |
3,494,390 |
|
|
$ |
4,030,230 |
|
On June 7, 2016, we entered into a Fifth Amendment (the “Fifth Amendment”) to our credit agreement dated as of November 15, 2010, as amended on March 15, 2011, September 21, 2012, May 16, 2013 and August 7, 2014, among UHS, as borrower, the several banks and other financial institutions from time to time parties thereto, as lenders (“Credit Agreement”). The Fifth Amendment increased the size of the term loan A facility by $200 million and those proceeds were utilized to repay outstanding borrowings under the revolving credit facility of the Credit Agreement. The Credit Agreement, as amended, which is scheduled to mature in August, 2019, consists of: (i) an $800 million revolving credit facility ($403 million of borrowings outstanding as of December 31, 2017), and; (ii) a term loan A facility with $1.775 billion of borrowings outstanding as of December 31, 2017.
Borrowings under the Credit Agreement bear interest at either (1) the ABR rate which is defined as the rate per annum equal to, at our election: the greatest of (a) the lender’s prime rate, (b) the weighted average of the federal funds rate, plus 0.5% and (c) one month LIBOR rate plus 1%, in each case, plus an applicable margin based upon our consolidated leverage ratio at the end of each quarter ranging from 0.50% to 1.25% for revolving credit and term loan-A borrowings, or (2) the one, two, three or six month LIBOR rate (at our election), plus an applicable margin based upon our consolidated leverage ratio at the end of each quarter ranging from 1.50% to 2.25% for revolving credit and term loan-A borrowings. As of December 31, 2017, the applicable margins were 0.50% for ABR-based loans and 1.50% for LIBOR-based loans under the revolving credit and term loan-A facilities.
As of December 31, 2017, we had $403 million of borrowings outstanding pursuant to the terms of our $800 million revolving credit facility and we had $329 million of available borrowing capacity net of $33 million of outstanding letters of credit and $35 million of outstanding borrowings pursuant to a short-term, on-demand credit facility. The revolving credit facility includes a $125 million sub-limit for letters of credit. The Credit Agreement is collateralized by certain assets of the Company (which generally excludes asset classes such as substantially all of the patient-related accounts receivable of our acute care hospitals, certain real estate assets and assets held in joint-ventures with third-parties) and our material subsidiaries and guaranteed by our material subsidiaries.
107
Pursuant to the terms of the Credit Agreement, term loan-A installment payments of approximately $22 million per quarter commenced during the fourth quarter of 2016 and are scheduled through June, 2019. Previously, approximately $11 million of quarterly installment payments were made from the fourth quarter of 2014 through the third quarter of 2016.
In July, 2017, we amended our accounts receivable securitization program (“Securitization”) with a group of conduit lenders and liquidity banks to increase the borrowing capacity to $440 million from $400 million previously. Pursuant to the terms of our Securitization program, on which the scheduled maturity date of December, 2018 remained unchanged, substantially all of the patient-related accounts receivable of our acute care hospitals (“Receivables”) serve as collateral for the outstanding borrowings. We have accounted for this Securitization as borrowings. We maintain effective control over the Receivables since, pursuant to the terms of the Securitization, the Receivables are sold from certain of our subsidiaries to special purpose entities that are wholly-owned by us. The Receivables, however, are owned by the special purpose entities, can be used only to satisfy the debts of the wholly-owned special purpose entities, and thus are not available to us except through our ownership interest in the special purpose entities. The wholly-owned special purpose entities use the Receivables to collateralize the loans obtained from the group of third-party conduit lenders and liquidity banks. The group of third-party conduit lenders and liquidity banks do not have recourse to us beyond the assets of the wholly-owned special purpose entities that securitize the loans. At December 31, 2017, we had $420 million of outstanding borrowings pursuant to the terms of the Securitization, which are included in current maturities of long-term debt as of that date, and $20 million of available borrowing capacity.
As of December 31, 2017, we had combined aggregate principal of $1.4 billion from the following senior secured notes:
|
|
• |
$300 million aggregate principal amount of 3.75% senior secured notes due in 2019 (“2019 Notes”) which were issued on August 7, 2014. |
|
|
• |
$700 million aggregate principal amount of 4.75% senior secured notes due in 2022 (“2022 Notes”) which were issued as follows: |
|
|
o |
$300 million aggregate principal amount issued on August 7, 2014 at par. |
|
|
o |
$400 million aggregate principal amount issued on June 3, 2016 at 101.5% to yield 4.35%. |
|
|
• |
$400 million aggregate principal amount of 5.00% senior secured notes due in 2026 (“2026 Notes”) which were issued on June 3, 2016. |
Interest is payable on the 2019 Notes and the 2022 Notes on February 1 and August 1 of each year until the maturity date of August 1, 2019 for the 2019 Notes and August 1, 2022 for the 2022 Notes. Interest on the 2026 Notes is payable on June 1 and December 1 until the maturity date of June 1, 2026. The 2019 Notes, 2022 Notes and 2026 Notes were offered only to qualified institutional buyers under Rule 144A and to non-U.S. persons outside the United States in reliance on Regulation S under the Securities Act of 1933, as amended (the “Securities Act”). The 2019 Notes, 2022 Notes and 2026 Notes have not been registered under the Securities Act and may not be offered or sold in the United States absent registration or an applicable exemption from registration requirements.
In June, 2016, we repaid the $400 million, 7.125% senior secured notes which matured on June 30, 2016.
The average amounts outstanding during each of years 2017, 2016 and 2015 under the current and prior Credit Agreements, demand notes and accounts receivable securitization programs was $2.6 billion, $2.3 billion and $2.1 billion, respectively, with corresponding interest rates of 2.5%, 2.0% and 1.7%, respectively, including commitment and facility fees. The maximum amounts outstanding at any month-end were $2.7 billion in 2017, $2.7 billion in 2016 and $2.3 billion in 2015. The effective interest rate on our current and prior Credit Agreements, accounts receivable securitization programs, and demand notes, which includes the respective interest expense, commitment and facility fees, designated interest rate swaps expense and amortization of deferred financing costs and original issue discounts, was 2.8% in 2017, 2.6% in 2016 and 2.4% in 2015.
Our Credit Agreement includes a material adverse change clause that must be represented at each draw. The Credit Agreement contains covenants that include a limitation on sales of assets, mergers, change of ownership, liens and indebtedness, transactions with affiliates, dividends and stock repurchases; and requires compliance with financial covenants including maximum leverage and minimum interest coverage ratios. We are in compliance with all required covenants as of December 31, 2017.
108
At December 31, 2017, the net carrying value and fair value of our debt were each approximately $4.0 billion and $4.1 billion, respectively. At December 31, 2016, the carrying value and fair value of our debt were each approximately $4.1 billion. The fair value of our debt was computed based upon quotes received from financial institutions. We consider these to be “level 2” in the fair value hierarchy as outlined in the authoritative guidance for disclosures in connection with debt instruments.
The aggregate scheduled maturities of our total debt outstanding as of December 31, 2017 are as follows:
|
|
|
(000s) |
|
|
|
2018 |
|
$ |
545,885 |
|
|
2019 |
|
|
2,391,033 |
|
|
2020 |
|
|
1,650 |
|
|
2021 |
|
|
1,696 |
|
|
2022 |
|
|
706,470 |
|
|
Later |
|
|
412,504 |
|
|
Total maturities before unamortized financing costs |
|
|
4,059,238 |
|
|
Less-Unamortized financing costs |
|
|
(19,229 |
) |
|
Total |
|
$ |
4,040,009 |
|
5) COMMON STOCK
Dividends
Cash dividends of $0.40 per share ($38.2 million in the aggregate) were declared and paid during 2017, $0.40 per share ($38.9 million in the aggregate) were declared and paid during 2016, and $.40 per share ($39.5 million in the aggregate) were declared and paid during 2015. All classes of our common stock have similar economic rights.
Stock Repurchase Programs
In July, 2014, our Board of Directors authorized a stock repurchase program whereby, from time to time as conditions allow, we may spend up to $400 million to purchase shares of our Class B Common Stock on the open market at prevailing market prices or in negotiated private transactions. In February, 2016, our Board of Directors authorized a $400 million increase to our stock repurchase program, which then increased the aggregate authorization to $800 million from the previous $400 million mentioned above. In November, 2017, our Board of Directors again authorized an additional $400 million increase in our stock purchase program, which increased the aggregate authorization to $1.2 billion from the previous $800 million authorization approved in 2016 and 2014, as mentioned above. There is no expiration date for our stock repurchase programs.
109
The following schedule provides information related to our stock repurchase program for each of the three years ended December 31, 2017. During 2017, 2,960,843 shares ($322.2 million) were repurchased pursuant to the terms of our stock repurchase program, 305,278 shares ($34.2 million in the aggregate) were repurchased in connection with the income tax withholding obligations resulting from the exercise of stock options and the vesting of restricted stock grants and 10,791 shares were repurchased as a result of forfeited restricted shares. During 2016, 2,512,592 shares ($289.9 million) were repurchased pursuant to the terms of our stock repurchase program, 468,228 shares ($57.0 million in the aggregate) were repurchased in connection with the income tax withholding obligations resulting from the exercise of stock options and the vesting of restricted stock grants and 2,500 shares were repurchased as a result of forfeited restricted shares. During 2015, 1,326,207 shares ($166.2 million) were repurchased pursuant to the terms of our stock repurchase program and 493,296 shares ($58.0 million in the aggregate) were repurchased in connection with the income tax withholding obligations resulting from the exercise of stock options and the vesting of restricted stock grants.
|
|
|
Additional dollars authorized for repurchase (in thousands) |
|
|
Total number of shares purchased (a.) |
|
|
Total number of shares cancelled |
|
|
Average price paid per share for forfeited restricted shares |
|
|
Total number of shares purchased as part of publicly announced programs |
|
|
Average price paid per share for shares purchased as part of publicly announced program |
|
|
Aggregate purchase price paid (in thousands) |
|
|
Aggregate purchase price paid for shares purchased as part of publicly announced program |
|
|
Maximum number of dollars that may yet be purchased under the program (in thousands) |
|
|||||||||
|
Balance as of January 1, 2015 |
|
|
|
|
|
|
|
|
|
|
|
|
|
|
|
|
|
|
|
|
|
|
|
|
|
|
|
|
|
|
|
|
|
$ |
342,050 |
|
|
2015 |
|
$ |
— |
|
|
|
1,819,503 |
|
|
|
— |
|
|
N/A |
|
|
|
1,326,207 |
|
|
$ |
125.34 |
|
|
$ |
224,260 |
|
|
$ |
166,222 |
|
|
$ |
175,828 |
|
|
|
2016 |
|
$ |
400,000 |
|
|
|
2,983,320 |
|
|
|
2,500 |
|
|
$ |
0.01 |
|
|
|
2,512,592 |
|
|
$ |
115.39 |
|
|
$ |
346,890 |
|
|
$ |
289,937 |
|
|
$ |
285,891 |
|
|
2017 |
|
$ |
400,000 |
|
|
|
3,266,121 |
|
|
|
10,791 |
|
|
$ |
0.01 |
|
|
|
2,960,843 |
|
|
$ |
108.83 |
|
|
$ |
356,413 |
|
|
$ |
322,231 |
|
|
$ |
363,660 |
|
|
Total for three year period ended December 31, 2017 |
|
$ |
800,000 |
|
|
|
8,068,944 |
|
|
|
13,291 |
|
|
$ |
0.01 |
|
|
|
6,799,642 |
|
|
$ |
114.48 |
|
|
$ |
927,563 |
|
|
$ |
778,390 |
|
|
|
|
|
|
|
(a.) |
Includes 10,791 and 2,500 of restricted shares that were forfeited by former employees pursuant to the terms of our restricted stock purchase plan during 2017 and 2016, respectively. |
Stock-based Compensation Plans
At December 31, 2017, we have a number of stock-based employee compensation plans. Pursuant to the FASB’s guidance, we expense the grant-date fair value of stock options and other equity-based compensation pursuant to the straight-line method over the stated vesting period of the award using the Black-Scholes option-pricing model.
Pre-tax compensation costs of $54.3 million during 2017, $45.8 million during 2016 and $38.0 million during 2015 were recognized related to outstanding stock options. In addition, pre-tax compensation costs of $2.5 million during 2017, $2.3 million during 2016 and $2.0 million during 2015 were recognized related to amortization of restricted stock and discounts provided in connection with shares purchased pursuant to our 2005 Employee Stock Purchase Plan. As of December 31, 2017, there was approximately $98.2 million of unrecognized compensation cost related to unvested stock options and restricted stock which is expected to be recognized over the remaining average vesting period of 2.6 years.
The expense associated with stock-based compensation arrangements is a non-cash charge. In the Consolidated Statements of Cash Flows, stock-based compensation expense is an adjustment to reconcile net income to cash provided by operating activities and aggregated to $56.7 million in 2017, $48.1 million in 2016 and $40.0 million in 2015.
Effective January 1, 2017, we adopted ASU 2016-09, “Compensation – Stock Compensation (Topic 718): Improvements to Employee Share-Based Payment Accounting”, which amends the accounting for employee share-based payment transactions to require recognition of the tax effects resulting from the settlement of stock-based awards as income tax expense or benefit in the income statement in the reporting period in which they occur. For the year ended December 31, 2017, our provision for income taxes and our net income attributable to UHS were each favorably impacted by $22.1 million resulting from our adoption of ASU 2016-09. Additionally, effective with our modified retrospective adoption of ASU 2016-09 on January 1, 2017, excess income tax benefits related to stock based compensation, amounting to $45.2 million during 2016 and $47.4 million during 2015, are reflected as cash inflows from operating activities in our Consolidated Statement of Cash Flows. Prior to the adoption of ASU 2016-09, excess income tax benefits related to stock based compensation were reflected as cash inflows from financings activities in our Consolidated Statement of Cash Flows.
110
In 2005, we adopted the 2005 Stock Incentive Plan which was amended in 2008, 2010, 2015 and 2017 (the “Stock Incentive Plan”). An aggregate of 35.6 million shares of Class B Common Stock has been reserved under the Stock Incentive Plan. During 2017, 2016 and 2015, stock options, net of cancellations, of approximately 2.9 million, 2.7 million and 2.7 million, respectively, were granted. The per option weighted-average grant-date fair value of options granted during 2017, 2016 and 2015 was $27.05, $23.80 and $21.37, respectively. Stock options to purchase Class B Common Stock have been granted to our officers, key employees and members of our Board of Directors. All stock options were granted with an exercise price equal to the fair market value on the date of the grant. Options are exercisable ratably over a four-year period beginning one year after the date of the grant. All outstanding options expire five years after the date of the grant. As of December 31, 2017, approximately 7.8 million shares of Class B Common Stock remain available for issuance pursuant to the Stock Incentive Plan.
The fair value of each option grant was estimated on the date of grant using the Black-Scholes option-pricing model. The following weighted average assumptions were derived from averaging the number of options granted during the most recent five-year period. The weighted-average assumptions reflected below were based upon twenty-seven option grants for the five-year period ending December 31, 2017, twenty-seven option grants for the five-year period ending December 31, 2016 and twenty-five option grants for the five-year period ending December 31, 2015.
|
Year Ended December 31, |
|
2017 |
|
|
2016 |
|
|
2015 |
|
|||
|
Volatility |
|
|
28 |
% |
|
|
31 |
% |
|
|
33 |
% |
|
Interest rate |
|
|
1 |
% |
|
|
1 |
% |
|
|
1 |
% |
|
Expected life (years) |
|
|
3.4 |
|
|
|
3.4 |
|
|
|
3.4 |
|
|
Forfeiture rate |
|
|
10 |
% |
|
|
10 |
% |
|
|
10 |
% |
|
Dividend yield |
|
|
0.4 |
% |
|
|
0.4 |
% |
|
|
0.4 |
% |
The risk-free rate is based on the U.S. Treasury zero coupon four year yield in effect at the time of grant. The expected life of the stock options granted was estimated using the historical behavior of employees. Expected volatility was based on historical volatility for a period equal to the stock option’s expected life. Expected dividend yield is based on our dividend yield at the time of grant. The forfeiture rate is based upon the actual historical forfeitures utilizing the 5-year term of the option.
The table below summarizes our stock option activity during each of the last three years:
|
Outstanding Options |
|
Number of Shares |
|
|
Average Option Price |
|
|
Range (High-Low) |
||
|
Balance, January 1, 2015 |
|
|
7,897,451 |
|
|
$ |
57.29 |
|
|
$102.21-$36.95 |
|
Granted |
|
|
3,039,350 |
|
|
$ |
117.70 |
|
|
$142.43-$108.29 |
|
Exercised |
|
|
(2,256,454 |
) |
|
$ |
48.97 |
|
|
$102.21-$36.95 |
|
Cancelled |
|
|
(280,164 |
) |
|
$ |
83.63 |
|
|
$134.70-$36.95 |
|
Balance, January 1, 2016 |
|
|
8,400,183 |
|
|
$ |
80.50 |
|
|
$142.43-$36.95 |
|
Granted |
|
|
2,945,550 |
|
|
$ |
118.72 |
|
|
$138.00-$107.39 |
|
Exercised |
|
|
(2,162,850 |
) |
|
$ |
53.02 |
|
|
$117.29-$36.95 |
|
Cancelled |
|
|
(412,750 |
) |
|
$ |
103.01 |
|
|
$130.32-$36.95 |
|
Balance, January 1, 2017 |
|
|
8,770,133 |
|
|
$ |
99.06 |
|
|
$142.43-$36.95 |
|
Granted |
|
|
3,061,725 |
|
|
$ |
124.38 |
|
|
$124.56-$110.15 |
|
Exercised |
|
|
(1,734,409 |
) |
|
$ |
64.41 |
|
|
$118.62-$36.95 |
|
Cancelled |
|
|
(457,500 |
) |
|
$ |
118.65 |
|
|
$142.43-$53.38 |
|
Balance, December 31, 2017 |
|
|
9,639,949 |
|
|
$ |
112.40 |
|
|
$138.00-$53.38 |
|
Outstanding options vested and exercisable as of December 31, 2017 |
|
|
2,869,346 |
|
|
$ |
100.51 |
|
|
$138.00-$53.38 |
111
The following table provides information about unvested options for the year December 31, 2017:
|
|
|
Shares |
|
|
Weighted Average Grant Date Fair Value |
|
||
|
Unvested options as of January 1, 2017 |
|
|
6,695,266 |
|
|
$ |
20.94 |
|
|
Granted |
|
|
3,061,725 |
|
|
$ |
27.05 |
|
|
Vested |
|
|
(2,555,013 |
) |
|
$ |
19.21 |
|
|
Cancelled |
|
|
(431,375 |
) |
|
$ |
24.02 |
|
|
Unvested options as of December 31, 2017 |
|
|
6,770,603 |
|
|
$ |
24.16 |
|
The following table provides information regarding all options outstanding at December 31, 2017:
|
|
|
Options Outstanding |
|
|
Options Exercisable |
|
||
|
Number of options outstanding |
|
|
9,639,949 |
|
|
|
2,869,346 |
|
|
Weighted average exercise price |
|
$ |
112.40 |
|
|
$ |
100.51 |
|
|
Aggregate intrinsic value as of December 31, 2017 |
|
$ |
65,133,533 |
|
|
$ |
44,588,121 |
|
|
Weighted average remaining contractual life |
|
|
2.9 |
|
|
|
2.0 |
|
The total in-the-money value of all stock options exercised during the years ended December 31, 2017, 2016 and 2015 were $85.5 million, $149.4 million and $154.1 million, respectively.
The weighted average remaining contractual life for options outstanding and weighted average exercise price per share for exercisable options at December 31, 2017 were as follows:
|
Exercise Price |
|
Options Outstanding |
|
|
Weighted Average Exercise Price Per Share |
|
|
Weighted Average Remaining Contractual Life (in Years) |
|
|
Exercisable Options |
|
|
Weighted Average Exercise Price Per Share |
|
|
Expected to Vest Options (a) |
|
|
Weighted Average Exercise Price Per Share |
|
|||||||
|
|
|
Shares |
|
|
|
|
|
|
|
|
|
|
Shares |
|
|
|
|
|
|
Shares |
|
|
|
|
|
|||
|
$53.38 – $79.79 |
|
|
1,752,085 |
|
|
$ |
76.37 |
|
|
|
1.1 |
|
|
|
1,173,671 |
|
|
$ |
75.48 |
|
|
|
565,589 |
|
|
$ |
78.17 |
|
|
$96.98 – $117.29 |
|
|
2,384,488 |
|
|
|
117.06 |
|
|
|
2.2 |
|
|
|
1,070,813 |
|
|
|
117.12 |
|
|
|
1,152,681 |
|
|
|
117.05 |
|
|
$118.60 – $124.44 |
|
|
2,583,401 |
|
|
|
118.65 |
|
|
|
3.2 |
|
|
|
605,862 |
|
|
|
118.65 |
|
|
|
1,549,346 |
|
|
|
118.65 |
|
|
$124.56 – $138.00 |
|
|
2,919,975 |
|
|
|
124.69 |
|
|
|
4.2 |
|
|
|
19,000 |
|
|
|
131.62 |
|
|
|
1,763,506 |
|
|
|
124.67 |
|
|
Total |
|
|
9,639,949 |
|
|
$ |
112.40 |
|
|
|
2.9 |
|
|
|
2,869,346 |
|
|
$ |
100.51 |
|
|
|
5,031,122 |
|
|
$ |
118.17 |
|
|
(a) |
Assumes a weighted average forfeiture rate of 9.64%. |
In addition to the Stock Incentive Plan, we have the following stock incentive and purchase plans: (i) the 2010 Employees’ Restricted Stock Purchase Plan, as amended in 2015, (“2010 Plan”) which allows eligible participants to purchase shares of Class B Common Stock at par value, subject to certain restrictions, and; (ii) a 2005 Employee Stock Purchase Plan which allows eligible employees to purchase shares of Class B Common Stock at a ten percent discount. There were 23,557, 14,146 and 17,789 shares of restricted stock granted pursuant to the 2010 Plan during 2017, 2016 and 2015, respectively, with various ratable vesting periods ranging up to five years from the date of grant. There were 86,693, 75,792 and 68,213 and shares issued pursuant to the Employee Stock Purchase Plan during 2017, 2016 and 2015, respectively.
We have reserved 2.8 million shares of Class B Common Stock for issuance under these various plans (excluding terminated plans and including a reserve reduction during 2015) and have issued approximately 1.5 million shares, net of cancellations, pursuant to the terms of these plans (excluding terminated plans) as of December 31, 2017. As of December 31, 2017, approximately 1.3 million shares of Class B Common Stock remain available for issuance pursuant to these various plans.
At December 31, 2017, 26,069,031 shares of Class B Common Stock were reserved for issuance upon conversion of shares of Class A, C and D Common Stock outstanding, for issuance upon exercise of options to purchase Class B Common Stock and for issuance of stock under other incentive plans. Class A, C and D Common Stock are convertible on a share for share basis into Class B Common Stock.
112
Components of income tax expense/(benefit) are as follows (amounts in thousands):
|
|
|
Year Ended December 31, |
|
|||||||||
|
|
|
2017 |
|
|
2016 |
|
|
2015 |
|
|||
|
Current |
|
|
|
|
|
|
|
|
|
|
|
|
|
Federal |
|
$ |
352,433 |
|
|
$ |
368,957 |
|
|
$ |
363,734 |
|
|
Foreign |
|
|
10,625 |
|
|
|
8,513 |
|
|
|
3,151 |
|
|
State |
|
|
37,421 |
|
|
|
42,166 |
|
|
|
38,987 |
|
|
|
|
|
400,479 |
|
|
|
419,636 |
|
|
|
405,872 |
|
|
Deferred |
|
|
|
|
|
|
|
|
|
|
|
|
|
Federal |
|
|
(36,998 |
) |
|
|
(12,092 |
) |
|
|
(15,912 |
) |
|
Foreign |
|
|
24 |
|
|
|
2,463 |
|
|
|
5,545 |
|
|
State |
|
|
192 |
|
|
|
(820 |
) |
|
|
(302 |
) |
|
|
|
|
(36,782 |
) |
|
|
(10,449 |
) |
|
|
(10,669 |
) |
|
Total |
|
$ |
363,697 |
|
|
$ |
409,187 |
|
|
$ |
395,203 |
|
On December 22, 2017, the President of the United States signed into law comprehensive tax legislation commonly referred to as the Tax Cuts and Jobs Act of 2017 (the “TCJA-17”). The TCJA-17 makes broad and complex changes to the U.S. tax code, including, but not limited to, (1) reducing the U.S. federal corporate tax rate from 35 percent to 21 percent; (2) requiring companies to pay a one-time transition tax on certain unrepatriated earnings of foreign subsidiaries; (3) generally eliminating U.S. federal income taxes on dividends from foreign subsidiaries; (4) requiring a current inclusion in U.S. federal taxable income of certain earnings of controlled foreign corporations through the implementation of a territorial tax system; and (5) creating a new limitation on deductible interest expense. The SEC staff issued Staff Accounting Bulletin No. 118 (“SAB 118”) to address the application of U.S. GAAP in situations when a registrant has not obtained, prepared, or analyzed (including computations) all of the information needed in order to complete the accounting for certain income tax effects of the TCJA-17. To the extent that a company’s accounting for certain income tax effects of the TCJA-17 is incomplete, a reasonable estimate should be recorded as a provisional amount in the financial statements.
We were able to make reasonable estimates of the effects of elements for which our analysis is not yet complete. We recorded the following provisional adjustments:
Reduction of U.S. federal corporate tax rate: The TCJA-17 reduces the corporate tax rate to 21 percent, effective January 1, 2018. Deferred income taxes are based on the estimated future tax effects of differences between the financial statement carrying amounts and the tax bases of assets and liabilities under the provisions of the enacted tax laws. For certain of our deferred tax assets and deferred tax liabilities, we have recorded a provisional decrease of $97 million and $127 million, respectively, with a corresponding net adjustment to deferred tax benefit of $30 million for the year ended December 31, 2017. While we are able to make a reasonable estimate of the impact of the reduction in corporate rate, it may be affected by other analyses related to the TCJA-17, including, but not limited to, our calculation of deemed repatriation of deferred foreign income and the state tax effect of adjustments made to federal temporary differences.
Deemed Repatriation Transition Tax: The Deemed Repatriation Transition Tax (“Transition Tax”) is a tax on previously untaxed accumulated and current earnings and profits (“E&P”) of certain of our foreign subsidiaries. To determine the amount of the Transition Tax, we must determine, in addition to other factors, the amount of post-1986 E&P of the relevant subsidiaries, as well as the amount of non-U.S. income taxes paid on such earnings. We are able to make a reasonable estimate of the Transition Tax and recorded a provisional Transition Tax obligation of $11.3 million. However, we are continuing to gather additional information to more precisely compute the amount of the Transition Tax.
Valuation allowances: We must assess whether valuation allowance analyses are affected by various aspects of the TCJA-17 (e.g., deemed repatriation of deferred foreign income). Since, as discussed herein, we have recorded provisional amounts related to certain portions of the TCJA-17, any corresponding determination of the need for a change in valuation allowance is also provisional.
The accounting for the above provisional amounts is expected to be complete when our 2017 U.S. Corporate Income Tax return is filed in 2018.
The TCJA-17 contains two new anti-base erosion tax provisions, (1) the global intangible low-taxed income (“GILTI”) provisions and (2) the base erosion and anti-abuse tax (“BEAT”) provisions:
113
GILTI: The GILTI provisions require the inclusion of the earnings of certain foreign subsidiaries in excess of an acceptable rate of return on certain assets of the respective subsidiaries in our U.S. tax return for tax years beginning after December 31, 2017. Due to complexities around the calculation we have not recorded any provisional deferred tax effects related to the GILTI tax and will not make an accounting policy election at this time with respect to GILTI for our consolidated financial statements for the year ended December 31, 2017.
BEAT: The BEAT provisions limit the deduction for U.S. tax base erosion related payments made by U.S. operations to related foreign affiliates. We do not expect any BEAT tax for our U.S. operations; therefore, we have not recorded any tax expense related to BEAT tax in our consolidated financial statements.
The foreign provision for income taxes is based on foreign pre-tax earnings of $70 million in 2017, $58 million in 2016 and $41 million in 2015. Previously, in 2016 and 2015, we had provided no deferred taxes related to unremitted earnings from foreign subsidiaries. As a result of the mandatory repatriation tax provisions in the TCJA-17, we recorded an accrued tax provision of $11.3 million as of December 31, 2017. Going forward, we anticipate repatriating only previously taxed foreign income subject to the mandatory repatriation tax and any future earnings that would qualify for a full dividend received deduction permitted under the TCJA-17 for distributions after December 31, 2017. At this time, there are no material tax effects related to future cash repatriation of our previously taxed foreign income. As such, we have not recognized a deferred tax liability related to existing undistributed earnings.
Our provision for income taxes for the year ended December 31, 2017 included tax benefits of $22 million related to the adoption of ASU 2016-09, which changes how companies account for certain aspects of share-based payments to employees. Under ASU 2016-09, we no longer record excess tax benefits (when the deductible amount related to the settlement of employee equity awards for tax purposes exceeds the cumulative compensation cost recognized for financial reporting purposes) in equity. Instead, we recognize these tax benefits (and deficiencies, if applicable) as a component of our tax provision. This reporting change is applied prospectively and prior period amounts are not restated (the excess tax benefit for the years ending December 31, 2016 and 2015, related to the settlement of employee equity awards, were $45 million and $47 million, respectively, and were recorded in equity). ASU 2016-09 requires companies to present excess tax benefits as an operating activity on the Consolidated Statement of Cash Flows rather than as a financing activity, as previously required. We have elected to apply the change to the Consolidated Statement of Cash Flows on a modified retrospective basis resulting in a reclassification of the 2016 and 2015 excess income tax benefits related to stock-based compensation from financing activities to operating activities.
A reconciliation between the federal statutory rate and the effective tax rate is as follows:
|
|
|
Year Ended December 31, |
|
|||||||||
|
|
|
2017 |
|
|
2016 |
|
|
2015 |
|
|||
|
Federal statutory rate |
|
|
35.0 |
% |
|
|
35.0 |
% |
|
|
35.0 |
% |
|
State taxes, net of federal income tax benefit |
|
|
2.2 |
% |
|
|
2.4 |
% |
|
|
2.3 |
% |
|
Tax effects of foreign operations |
|
|
-1.2 |
% |
|
|
-0.8 |
% |
|
|
-0.9 |
% |
|
Tax benefit from settlement of employee equity awards |
|
|
-1.9 |
% |
|
|
0.0 |
% |
|
|
0.0 |
% |
|
Enactment of the TCJA-17 |
|
|
-1.7 |
% |
|
|
0.0 |
% |
|
|
0.0 |
% |
|
Other items |
|
|
0.2 |
% |
|
|
0.2 |
% |
|
|
0.3 |
% |
|
Impact of income attributable to noncontrolling interests |
|
|
-0.6 |
% |
|
|
-1.4 |
% |
|
|
-2.2 |
% |
|
Effective tax rate |
|
|
32.0 |
% |
|
|
35.4 |
% |
|
|
34.5 |
% |
Our effective tax rates were 32.0%, 35.4% and 34.5% for the years ended December 31, 2017, 2016 and 2015, respectively. The decrease in our effective tax rate for the year ended December 31, 2017, as compared to 2016 and 2015, is due to the tax benefit resulting from our January 1, 2017 adoption of ASU 2016-09, the net favorable impact of the enactment of the TCJA-17 as discussed above, and the tax effects of our foreign operations in connection with our acquisition of Cambian Group, PLC's adult services division (acquired in late December, 2016). The increase in our effective tax rate for the year ended December 31, 2016 is primarily impacted by the decrease in net income attributable to noncontrolling interests due to our purchase of the minority ownership interests held by a third-party in our six acute care hospitals located in Las Vegas, Nevada, which is not tax effected in the statement of income. Including the expense related to income attributable to noncontrolling interests, the effective tax rate for the years ended December 31, 2017, 2016 and 2015 were 32.6%, 36.8% and 36.7%, respectively.
Included in “Other current assets” on our Consolidated Balance Sheet are prepaid federal and state income taxes amounting to approximately $5 million and $10 million as of December 31, 2017 and 2016, respectively.
114
As a result of the reduction in the U.S. corporate income tax rate from 35% to 21% effective January 1, 2018 under the TCJA-17, we revalued our ending deferred tax assets and deferred tax liabilities at December 31, 2017 and we have recorded a provisional decrease of $97 million and $127 million, respectively, with a corresponding net adjustment to deferred tax benefit of $30 million in the consolidated statement of income for the year ended December 31, 2017. The components of deferred taxes are as follows (amounts in thousands):
|
|
|
Year Ended December 31, |
|
||||||||||||||||
|
|
|
2017 |
|
|
|
2016 |
|
||||||||||||
|
|
|
Assets |
|
|
|
Liabilities |
|
|
|
Assets |
|
|
|
Liabilities |
|
||||
|
Self-insurance reserves |
$ |
|
64,181 |
|
|
$ |
|
|
|
|
$ |
|
85,940 |
|
|
$ |
|
|
|
|
Compensation accruals |
|
|
63,021 |
|
|
|
|
|
|
|
|
|
83,328 |
|
|
|
|
|
|
|
Doubtful accounts and other reserves |
|
|
20,809 |
|
|
|
|
|
|
|
|
|
38,017 |
|
|
|
|
|
|
|
Other currently non-deductible accrued liabilities |
|
|
19,759 |
|
|
|
|
|
|
|
|
|
24,058 |
|
|
|
|
|
|
|
Depreciable and amortizable assets |
|
|
|
|
|
|
|
226,389 |
|
|
|
|
|
|
|
|
|
332,326 |
|
|
State and foreign net operating loss carryforwards and other state and foreign deferred tax assets |
|
|
76,439 |
|
|
|
|
|
|
|
|
|
66,639 |
|
|
|
|
|
|
|
Net pension liabilities – OCI only |
|
|
2,825 |
|
|
|
|
|
|
|
|
|
5,926 |
|
|
|
|
|
|
|
Other combined items – OCI only |
|
|
|
|
|
|
|
550 |
|
|
|
|
815 |
|
|
|
|
|
|
|
Other liabilities |
|
|
|
|
|
|
|
1,824 |
|
|
|
|
|
|
|
|
|
2,949 |
|
|
|
$ |
|
247,034 |
|
|
$ |
|
228,763 |
|
|
$ |
|
304,723 |
|
|
$ |
|
335,275 |
|
|
Valuation Allowance |
|
|
(70,227 |
) |
|
|
|
0 |
|
|
|
|
(56,333 |
) |
|
|
|
0 |
|
|
Total deferred income taxes |
$ |
|
176,807 |
|
|
$ |
|
228,763 |
|
|
$ |
|
248,390 |
|
|
$ |
|
335,275 |
|
At December 31, 2017, state net operating loss carryforwards (expiring in years 2018 through 2037), and credit carryforwards available to offset future taxable income approximated $1.09 billion representing approximately $70 million in deferred state tax benefit (net of the federal benefit). At December 31, 2017, there were foreign net operating losses and credit carryforwards of approximately $26 million, most of which are carried forward indefinitely, representing approximately $6 million in deferred foreign tax benefit.
A valuation allowance is required when it is more likely than not that some portion of the deferred tax assets will not be realized. Based on available evidence, it is more likely than not that certain of our state tax benefits will not be realized. Therefore, valuation allowances of approximately $66 million and $52 million have been reflected as of December 31, 2017 and 2016, respectively. During 2017, the valuation allowance on these state tax benefits increased by $2 million due to additional net operating losses incurred and by $12 million due to the reduction of the federal benefit due to the change in U.S. corporate income tax rates. In addition, valuation allowances of approximately $4 million have been reflected as of December 31, 2017 and 2016 related to foreign net operating losses and credit carryforwards.
During 2017 and 2016, the estimated liabilities for uncertain tax positions (including accrued interest and penalties) were increased less than $1 million due to tax positions taken in the current and prior years. The balance at each of December 31, 2017 and 2016, if subsequently recognized, that would favorably affect the effective tax rate and the provision for income taxes is approximately $1 million as of each date.
115
We recognize accrued interest and penalties associated with uncertain tax positions as part of the tax provision. As of December 31, 2017 and 2016, we have accrued interest and penalties of less than $1 million as of each date. The U.S. federal statute of limitations remains open for the 2014 and subsequent years. Foreign and U.S. state and local jurisdictions have statutes of limitations generally ranging for 3 to 4 years. The statute of limitations on certain jurisdictions could expire within the next twelve months. It is reasonably possible that the amount of unrecognized tax benefits will change during the next 12 months, however, it is anticipated that any such change, if it were to occur, would not have a material impact on our results of operations.
The tabular reconciliation of unrecognized tax benefits for the years ended December 31, 2017, 2016 and 2015 is as follows (amounts in thousands).
|
|
|
As of December 31, |
|
|||||||||
|
|
|
2017 |
|
|
2016 |
|
|
2015 |
|
|||
|
Balance at January 1, |
|
$ |
1,259 |
|
|
$ |
1,982 |
|
|
$ |
2,402 |
|
|
Additions based on tax positions related to the current year |
|
|
500 |
|
|
|
50 |
|
|
|
50 |
|
|
Additions for tax positions of prior years |
|
|
47 |
|
|
|
74 |
|
|
|
111 |
|
|
Reductions for tax positions of prior years |
|
|
0 |
|
|
|
(94 |
) |
|
|
(524 |
) |
|
Settlements |
|
|
(710 |
) |
|
|
(753 |
) |
|
|
(57 |
) |
|
Balance at December 31, |
|
$ |
1,096 |
|
|
$ |
1,259 |
|
|
$ |
1,982 |
|
7) LEASE COMMITMENTS
Three of our hospital facilities are held under operating leases with Universal Health Realty Income Trust with terms expiring in 2021 (see Note 9 for additional disclosure). We also lease the real property of certain facilities (see Item 2. Properties for additional disclosure).
A summary of property under capital lease follows (amounts in thousands):
|
|
|
As of December 31, |
|
|||||
|
|
|
2017 |
|
|
2016 |
|
||
|
Land, buildings and equipment |
|
$ |
44,740 |
|
|
$ |
45,768 |
|
|
Less: accumulated amortization |
|
|
(29,628 |
) |
|
|
(28,864 |
) |
|
|
|
$ |
15,112 |
|
|
$ |
16,904 |
|
Future minimum rental payments under lease commitments with a term of more than one year as of December 31, 2017, are as follows (amounts in thousands):
|
Year |
|
Capital Leases |
|
|
Operating Leases |
|
||
|
2018 |
|
$ |
3,899 |
|
|
$ |
73,310 |
|
|
2019 |
|
|
4,003 |
|
|
|
63,156 |
|
|
2020 |
|
|
3,345 |
|
|
|
50,948 |
|
|
2021 |
|
|
3,227 |
|
|
|
42,167 |
|
|
2022 |
|
|
3,508 |
|
|
|
24,871 |
|
|
Later years |
|
|
15,694 |
|
|
|
147,965 |
|
|
Total minimum rental |
|
$ |
33,676 |
|
|
$ |
402,417 |
|
|
Less: Amount representing interest |
|
|
(11,891 |
) |
|
|
|
|
|
Present value of minimum rental commitments |
|
|
21,785 |
|
|
|
|
|
|
Less: Current portion of capital lease obligations |
|
|
(1,837 |
) |
|
|
|
|
|
Long-term portion of capital lease obligations |
|
$ |
19,948 |
|
|
|
|
|
We assumed no capital lease obligations in 2017 and assumed capital lease obligations of approximately $152,000 in 2016 and $7 million in 2015, in connection with the leases on certain real estate assets. In the ordinary course of business, our facilities routinely lease equipment pursuant to new lease arrangements that will likely result in future lease and rental expense in excess of amounts indicated above.
116
8) COMMITMENTS AND CONTINGENCIES
Professional and General Liability, Workers’ Compensation Liability
Effective January, 2017, the vast majority of our subsidiaries are self-insured for professional and general liability exposure up to $5 million and $3 million per occurrence, respectively, subject to certain aggregate limitations. Prior to January, 2017, the vast majority of our subsidiaries were self-insured for professional and general liability exposure up to $10 million and $3 million per occurrence, respectively. These subsidiaries are provided with several excess policies through commercial insurance carriers which provide for coverage in excess of the applicable per occurrence self-insured retention or underlying policy limits up to $250 million per occurrence and in the aggregate for claims incurred after 2013 and up to $200 million per occurrence and in the aggregate for claims incurred from 2011 through 2013. We remain liable for 10%, up to an annual aggregate limitation of $5 million, of the claims paid pursuant to the commercially insured excess coverage. In addition, from time to time based upon marketplace conditions, we may elect to purchase additional commercial coverage for certain of our facilities or businesses. Our behavioral health care facilities located in the U.K. have policies through a commercial insurance carrier located in the U.K. that provides for £10 million of professional liability coverage and £25 million of general liability coverage. The coverage for the facilities located in the U.K. acquired in late December, 2016 in connection with our acquisition of the Cambian Group, PLC’s adult services division is similar to the above-mentioned U.K. insurance program.
As of December 31, 2017, the total accrual for our professional and general liability claims was $229 million, of which $54 million was included in current liabilities. As of December 31, 2016, the total accrual for our professional and general liability claims was $207 million, of which $48 million was included in current liabilities. During 2017, based upon a reserve analysis of our estimated future claims payments, we recorded an increase to our professional and general liability self-insurance reserves (relating to prior years) of $15 million. Our consolidated results of operations during 2016 and 2015 were not materially impacted by adjustments to our prior year reserves for professional and general liability claims.
As of December 31, 2017, the total accrual for our workers’ compensation liability claims was $70 million, of which $35 million is included in current liabilities. As of December 31, 2016, the total accrual for our workers’ compensation liability claims was $67 million, of which $33 million is included in current liabilities. Our consolidated results of operations during 2017, 2016 and 2015 were not materially impacted by adjustments to our prior year reserves for workers’ compensation claims.
Below is a schedule showing the changes in our general and professional liability and workers’ compensation reserves during the three years ended December 31, 2017 (amount in thousands):
|
|
|
General and |
|
|
|
|
|
|
|
|
|
|
|
|
|
Professional |
|
|
Workers’ |
|
|
|
|
|
||
|
|
|
Liability |
|
|
Compensation |
|
|
Total |
|
|||
|
Balance at January 1, 2015 |
|
$ |
192,904 |
|
|
$ |
66,814 |
|
|
$ |
259,718 |
|
|
Plus: Accrued insurance expense, net of commercial premiums paid |
|
|
58,460 |
|
|
|
32,435 |
|
|
|
90,895 |
|
|
Less: Payments made in settlement of self-insured claims |
|
|
(47,391 |
) |
|
|
(31,746 |
) |
|
|
(79,137 |
) |
|
Balance at January 1, 2016 |
|
|
203,973 |
|
|
|
67,503 |
|
|
|
271,476 |
|
|
Liabilities assumed in acquisition |
|
|
0 |
|
|
|
661 |
|
|
|
661 |
|
|
Plus: Accrued insurance expense, net of commercial premiums paid |
|
|
54,671 |
|
|
|
29,967 |
|
|
|
84,638 |
|
|
Less: Payments made in settlement of self-insured claims |
|
|
(51,185 |
) |
|
|
(30,775 |
) |
|
|
(81,960 |
) |
|
Balance at January 1, 2017 |
|
|
207,459 |
|
|
|
67,356 |
|
|
|
274,815 |
|
|
Plus: Accrued insurance expense, net of commercial premiums paid |
|
|
65,049 |
|
|
|
37,546 |
|
|
|
102,595 |
|
|
Less: Payments made in settlement of self-insured claims |
|
|
(43,817 |
) |
|
|
(35,371 |
) |
|
|
(79,188 |
) |
|
Balance at December 31, 2017 |
|
$ |
228,691 |
|
|
$ |
69,531 |
|
|
$ |
298,222 |
|
Our estimated liability for self-insured professional and general liability claims is based on a number of factors including, among other things, the number of asserted claims and reported incidents, estimates of losses for these claims based on recent and historical settlement amounts, estimates of incurred but not reported claims based on historical experience, and estimates of amounts recoverable under our commercial insurance policies. While we continuously monitor these factors, our ultimate liability for professional and general liability claims could change materially from our current estimates due to inherent uncertainties involved in making this estimate. Given our significant self-insured exposure for professional and general liability claims, there can be no assurance that a sharp increase in the number and/or severity of claims asserted against us will not have a material adverse effect on our future results of operations. Although we are unable to predict whether or not our future financial statements will include adjustments to our prior year reserves for self-insured general and professional and workers’ compensation claims, given the relatively
117
unpredictable nature of the these potential liabilities and the factors impacting these reserves, as discussed above, it is reasonably likely that our future financial results may include material adjustments to prior period reserves.
Property Insurance:
We have commercial property insurance policies for our properties covering catastrophic losses, including windstorm damage, up to a $1 billion policy limit, subject to a deductible ranging from $50,000 to $250,000 per occurrence. Losses resulting from named windstorms are subject to deductibles between 3% and 5% of the total insurable value of the property. In addition, we have commercial property insurance policies covering catastrophic losses resulting from earthquake and flood damage, each subject to aggregated loss limits (as opposed to per occurrence losses). Commercially insured earthquake coverage for our facilities is subject to various deductibles and limitations including: (i) $500 million limitation for our facilities located in Nevada; (ii) $130 million limitation for our facilities located in California; (iii) $100 million limitation for our facilities located in fault zones within the United States; (iv) $40 million limitation for our facility located in Puerto Rico, and; (v) $250 million limitation for many of our facilities located in other states. Deductibles for flood losses vary in amount, up to a maximum of $500,000, based upon location of the facility. Since certain of our facilities have been designated by our insurer as flood prone, we have elected to purchase policies from The National Flood Insurance Program. Property insurance for our behavioral health facilities located in the U.K. are provided on an all risk basis up to a £1.29 billion policy limit, with coverage caps per location, that includes coverage for real and personal property as well as business interruption losses.
Other Contractual Commitments:
In addition to our long-term debt obligations as discussed in Note 4 - Long-Term Debt and our operating lease obligations as discussed in Note 7 - Lease Commitments, we have various other contractual commitments outstanding as of December 31, 2017 as follows: (i) other combined estimated future purchase obligations of $315 million related to a long-term contract with third-parties consisting primarily of certain revenue cycle data processing services for our acute care facilities ($73 million), expected future costs to be paid to a third-party vendor in connection with the ongoing operation of an electronic health records application and purchase implementation of a revenue cycle and other applications for our acute care facilities ($240 million) and estimated minimum liabilities for physician commitments expected to be paid in the future ($2 million); (ii) estimated construction commitment of $30 million representing our share of the construction costs of two new behavioral health care facilities located in Pennsylvania and Washington that we are required to build pursuant to joint-venture agreements with third-parties; (iii) combined estimated future payments of $206 million related to our non-contributory, defined benefit pension plan ($188 million consisting of estimated payments through 2089) and other retirement plan liabilities ($18 million), and; (iv) accrued and unpaid estimated claims expense incurred in connection with our commercial health insurers and self-insured employee benefit plans ($86 million).
Legal Proceedings
We operate in a highly regulated and litigious industry which subjects us to various claims and lawsuits in the ordinary course of business as well as regulatory proceedings and government investigations. These claims or suits include claims for damages for personal injuries, medical malpractice, commercial/contractual disputes, wrongful restriction of, or interference with, physicians’ staff privileges, and employment related claims. In addition, health care companies are subject to investigations and/or actions by various state and federal governmental agencies or those bringing claims on their behalf. Government action has increased with respect to investigations and/or allegations against healthcare providers concerning possible violations of fraud and abuse and false claims statutes as well as compliance with clinical and operational regulations. Currently, and from time to time, we and some of our facilities are subjected to inquiries in the form of subpoenas, Civil Investigative Demands, audits and other document requests from various federal and state agencies. These inquiries can lead to notices and/or actions including repayment obligations from state and federal government agencies associated with potential non-compliance with laws and regulations. Further, the federal False Claim Act allows private individuals to bring lawsuits (qui tam actions) against healthcare providers that submit claims for payments to the government. Various states have also adopted similar statutes. When such a claim is filed, the government will investigate the matter and decide if they are going to intervene in the pending case. These qui tam lawsuits are placed under seal by the court to comply with the False Claims Act’s requirements. If the government chooses not to intervene, the private individual(s) can proceed independently on behalf of the government. Health care providers that are found to violate the False Claims Act may be subject to substantial monetary fines/penalties as well as face potential exclusion from participating in government health care programs or be required to comply with Corporate Integrity Agreements as a condition of a settlement of a False Claim Act matter. In September 2014, the Criminal Division of the Department of Justice (“DOJ”) announced that all qui tam cases will be shared with their Division to determine if a parallel criminal investigation should be opened. The DOJ has also announced an intention to pursue civil and criminal actions against individuals within a company as well as the corporate entity or entities. In addition, health care facilities are subject to monitoring by state and federal surveyors to ensure compliance with program Conditions of Participation. In the event a facility is found to be out of compliance with a Condition of Participation and unable to remedy the alleged deficiency(s), the facility faces termination from the Medicare and Medicaid programs or compliance with a System Improvement Agreement to remedy deficiencies and ensure compliance.
118
The laws and regulations governing the healthcare industry are complex covering, among other things, government healthcare participation requirements, licensure, certification and accreditation, privacy of patient information, reimbursement for patient services as well as fraud and abuse compliance. These laws and regulations are constantly evolving and expanding. Further, the Affordable Care Act has added additional obligations on healthcare providers to report and refund overpayments by government healthcare programs and authorizes the suspension of Medicare and Medicaid payments “pending an investigation of a credible allegation of fraud.” We monitor our business and have developed an ethics and compliance program with respect to these complex laws, rules and regulations. Although we believe our policies, procedures and practices comply with government regulations, there is no assurance that we will not be faced with the sanctions referenced above which include fines, penalties and/or substantial damages, repayment obligations, payment suspensions, licensure revocation, and expulsion from government healthcare programs. Even if we were to ultimately prevail in any action brought against us or our facilities or in responding to any inquiry, such action or inquiry could have a material adverse effect on us.
Certain legal matters are described below:
Government Investigations:
UHS Behavioral Health
In February, 2013, the Office of Inspector General for the United States Department of Health and Human Services (“OIG”) served a subpoena requesting various documents from January, 2008 to the date of the subpoena directed at Universal Health Services, Inc. (“UHS”) concerning it and UHS of Delaware, Inc., and certain UHS owned behavioral health facilities including: Keys of Carolina, Old Vineyard Behavioral Health, The Meadows Psychiatric Center, Streamwood Behavioral Health, Hartgrove Hospital, Rock River Academy and Residential Treatment Center, Roxbury Treatment Center, Harbor Point Behavioral Health Center, f/k/a The Pines Residential Treatment Center, including the Crawford, Brighton and Kempsville campuses, Wekiva Springs Center and River Point Behavioral Health. Prior to receipt of this subpoena, some of these facilities had received independent subpoenas from state or federal agencies. Subsequent to the February 2013 subpoenas, some of the facilities above have received additional, specific subpoenas or other document and information requests. In addition to the OIG, the DOJ and various U.S. Attorneys’ and state Attorneys’ General Offices are also involved in this matter. Since February 2013, additional facilities have also received subpoenas and/or document and information requests or we have been notified are included in the omnibus investigation. Those facilities include: National Deaf Academy, Arbour-HRI Hospital, Behavioral Hospital of Bellaire, St. Simons By the Sea, Turning Point Care Center, Salt Lake Behavioral Health, Central Florida Behavioral Hospital, University Behavioral Center, Arbour Hospital, Arbour-Fuller Hospital, Pembroke Hospital, Westwood Lodge, Coastal Harbor Health System, Shadow Mountain Behavioral Health, Cedar Hills Hospital, Mayhill Hospital, Southern Crescent Behavioral Health (Anchor Hospital and Crescent Pines campuses), Valley Hospital (AZ), Peachford Behavioral Health System of Atlanta, University Behavioral Health of Denton, and El Paso Behavioral Health System.
In October, 2013, we were advised that the DOJ’s Criminal Frauds Section had opened an investigation of River Point Behavioral Health and Wekiva Springs Center. Since that time, we have been notified that the Criminal Frauds section has opened investigations of National Deaf Academy, Hartgrove Hospital and UHS as a corporate entity. In April 2017, the DOJ’s Criminal Division issued a subpoena requesting documentation from Shadow Mountain Behavioral Health. In August 2017, Kempsville Center of Behavioral Health (a part of Harbor Point Behavioral Health previously identified above) received a subpoena requesting documentation.
In April, 2014, the Centers for Medicare and Medicaid Services (“CMS”) instituted a Medicare payment suspension at River Point Behavioral Health in accordance with federal regulations regarding suspension of payments during certain investigations. The Florida Agency for Health Care Administration (“AHCA”) subsequently issued a Medicaid payment suspension for the facility. River Point Behavioral Health submitted a rebuttal statement disputing the basis of the suspension and requesting revocation of the suspension. Notwithstanding, CMS continued the payment suspension. River Point Behavioral Health provided additional information to CMS in an effort to obtain relief from the payment suspension but the Medicare suspension remains in effect. In June 2017, AHCA advised that while they were maintaining the suspension for dual eligible and cross-over Medicare beneficiaries, the Medicaid payment suspension was lifted effective June 27, 2017. We cannot predict if and/or when the facility’s remaining suspended payments will resume in total. From inception through December 31, 2017, the aggregate funds withheld from us in connection with the River Point Behavioral Health payment suspension amounted to approximately $10 million. Although the operating results of River Point Behavioral Health did not have a material impact on our consolidated results of operations during 2017, 2016 or 2015, the payment suspension has had a material adverse effect on the facility’s results of operations and financial condition.
The DOJ has advised us that the civil aspect of the coordinated investigation referenced above is a False Claims Act investigation focused on billings submitted to government payers in relation to services provided at those facilities. Based upon our initial discussions with the DOJ, our financial statements as of December 31, 2017 include a $22 million reserve established in connection with the civil aspects of these matters. However, changes in the reserve may be required in future periods as discussions continue and additional information becomes available. We cannot predict the ultimate resolution of these matters and therefore can provide no assurance that final amounts paid in settlement or otherwise, if any, or associated costs, will not differ materially from our established reserve.
119
U.S. ex rel Escobar v. Universal Health Services, Inc. et.al.
This is a False Claims Act case filed against Universal Health Services, Inc., UHS of Delaware, Inc. and HRI Clinics, Inc. d/b/a Arbour Counseling Services in U.S. District Court for the District of Massachusetts. This qui tam action primarily alleges that Arbour Counseling Services failed to appropriately supervise certain clinical providers in contravention of regulatory requirements and the submission of claims to Medicaid were subsequently improper. Relators make other claims of improper billing to Medicaid associated with alleged failures of Arbour Counseling to comply with state regulations. The U.S. Attorney’s Office and the Massachusetts Attorney General’s Office initially declined to intervene. UHS filed a motion to dismiss and the trial court originally granted the motion dismissing the case. The First Circuit Court of Appeals (“First Circuit”) reversed the trial court’s dismissal of the case. The United States Supreme Court subsequently vacated the First Circuit’s opinion and remanded the case for further consideration under the new legal standards established by the Supreme Court for False Claims Act cases. During the 4th quarter of 2016, the First Circuit issued a revised opinion upholding their reversal of the trial court’s dismissal. The case was then remanded to the trial court for further proceedings. In January 2017, the U.S. Attorney’s Office and Massachusetts Attorney General’s Office advised of the potential for intervention in the case. The Massachusetts Attorney General’s Office subsequently filed its motion to intervene which was granted and, in April 2017, filed their Complaint in Intervention. We are defending this case vigorously. At this time, we are uncertain as to potential liability or financial exposure, if any, which may be associated with this matter.
Shareholder Class Action
In December 2016 a purported shareholder class action lawsuit was filed in U.S. District Court for the Central District of California against UHS, and certain UHS officers alleging violations of the federal securities laws. Plaintiff alleges that defendants violated federal securities laws relating to the disclosures made in public filings associated with practices at our behavioral health facilities. The case was originally filed as Heed v. Universal Health Services, Inc. et. al. (Case No. 2:16-CV-09499-PSG-JC). The court subsequently appointed Teamsters Local 456 Pension Fund and Teamsters Local 456 Annuity Fund to serve as lead plaintiffs. The case has been transferred to the U.S. District Court for the Eastern District of Pennsylvania and the style of the case has been changed to Teamsters Local 456 Pension Fund, et. al. v. Universal Health Services, Inc. et. al. (Case No. 2:17-CV-02817-LS). In September, 2017, Teamsters Local 456 Pension Fund filed an amended complaint. In December 2017, we filed a motion to dismiss the amended complaint. We deny liability and intend to defend ourselves vigorously. At this time, we are uncertain as to potential liability or financial exposure, if any, which may be associated with this matter.
Shareholder Derivative Cases
In March 2017, a shareholder derivative suit was filed by plaintiff David Heed in the Court of Common Pleas of Philadelphia County. A notice of removal to the United States District Court for the Eastern District of Pennsylvania was filed (Case No. 2:17-cv-01476-LS). Plaintiff filed a motion to remand. In December 2017, the Court denied plaintiff’s motion to remand and has retained the case in federal court. The suit alleges breaches of fiduciary duties and other allegedly wrongful conduct by the members of the Board of Directors and certain officers of Universal Health Services, Inc. relating to practices at our behavioral health facilities. UHS has been named as a nominal defendant in the case. In May, June and July 2017, additional shareholder derivative suits were filed in the United States District Court for the Eastern District of Pennsylvania. The plaintiffs in those cases are: Central Laborers’ Pension Fund (Case No. 17-cv-02187-LS); Firemen’s Retirement System of St. Louis (Case No. 17—cv-02317-LS); Waterford Township Police & Fire Retirement System (Case No. 17-cv-02595-LS); and Amalgamated Bank Longview Funds (Case No. 17-cv-03404-LS). The Fireman’s Retirement System case has since been voluntarily dismissed. In addition, a shareholder derivative case was filed in Chancery Court in Delaware by the Delaware County Employees’ Retirement Fund (Case No. 2017-0475-JTL). In December 2017, the Chancery Court stayed this case pending resolution of other contemporaneous matters. These additional cases make substantially similar allegations and claims based upon alleged violations of federal securities laws as well common law causes of action against the individual defendants. All of these additional cases have also named all members of the UHS Board of Directors as well as certain officers of the Company. The defendants deny liability and intend to defend these cases vigorously. At this time, we are uncertain as to potential liability or financial exposure, if any, which may be associated with these matters.
Chowdary v. Universal Health Services, Inc., et. al.
This is a lawsuit filed in 1999 in state court in Hidalgo County, Texas by a physician and his professional associations alleging tortious interference with contractual relationships and retaliation against McAllen Medical Center in McAllen, Texas as well as Universal Health Services, Inc. The state court has entered a summary judgment order awarding plaintiff $3.85 million in damages. With prejudgment interest, the total amount of the order amounts to approximately $9 million, for which a reserve is included in our financial statements as of December 31, 2017. A trial on punitive damages, emotional distress and attorneys’ fees remains to be conducted if the summary judgment order is not vacated. The case has been removed to federal court. Plaintiffs filed a motion to remand. In February 2018, the federal court denied plaintiffs’ motion to remand and retained the case in federal court. Plaintiffs have filed a writ of mandamus with the 5th Circuit Court of Appeals seeking to overturn the federal court’s decision denying remand. We have filed a motion for reconsideration of state court’s summary judgment order in the federal court proceeding.
120
Disproportionate Share Hospital Payment Matter:
In late September, 2015, many hospitals in Pennsylvania, including seven of our behavioral health care hospitals located in the state, received letters from the Pennsylvania Department of Human Services (the “Department”) demanding repayment of allegedly excess Medicaid Disproportionate Share Hospital payments (“DSH”) for the federal fiscal year 2011 (“FFY2011”) amounting to approximately $4 million in the aggregate. Since that time, we have received similar requests for repayment for alleged DSH overpayments for FFYs 2012 and 2013 aggregating to approximately $11 million. We filed administrative appeals for all of our facilities contesting the recoupment efforts for FFYs 2011 through 2013 as we believe the Department’s calculation methodology is inaccurate and conflicts with applicable federal and state laws and regulations. The Department has agreed to postpone the recoupment of the state’s share of the DSH payments until all hospital appeals are resolved but started recoupment of the federal share. The Department will likely make similar repayment demand for FFY 2014. Due to a change in the Pennsylvania Medicaid State Plan and implementation of a CMS-approved Medicaid Section 1115 Waiver, we do not believe the methodology applied by the Department to FFYs 2011 through 2013 is applicable to reimbursements received for Medicaid services provided after January 1, 2015 by our behavioral health care facilities located in Pennsylvania. We can provide no assurance that we will ultimately be successful in our legal and administrative appeals related to the Department’s repayment demands. If our legal and administrative appeals are unsuccessful, our future consolidated results of operations and financial condition could be adversely impacted by these repayments.
Matters Relating to Psychiatric Solutions, Inc. (“PSI”):
The following matters pertain to PSI or former PSI facilities (owned by subsidiaries of PSI) which were in existence prior to the acquisition of PSI and for which we have assumed the defense as a result of our acquisition which was completed in November, 2010:
Department of Justice Investigation of Riveredge Hospital
In 2008, Riveredge Hospital in Chicago, Illinois received a subpoena from the DOJ requesting certain information from the facility. Additional requests for documents were also received from the DOJ in 2009 and 2010. The requested documents have been provided to the DOJ. All documents requested and produced pertained to the operations of the facility while under PSI’s ownership prior to our acquisition. At present, we are uncertain as to the focus, scope or extent of the investigation, liability of the facility and/or potential financial exposure, if any, in connection with this matter.
Department of Justice Investigation of Friends Hospital
In October, 2010, Friends Hospital in Philadelphia, Pennsylvania, received a subpoena from the DOJ requesting certain documents from the facility. The requested documents were collected and provided to the DOJ for review and examination. Another subpoena was issued to the facility in July, 2011 requesting additional documents, which have also been delivered to the DOJ. All documents requested and produced pertained to the operations of the facility while under PSI’s ownership prior to our acquisition. At present, we are uncertain as to the focus, scope or extent of the investigation, liability of the facility and/or potential financial exposure, if any, in connection with this matter.
Other Matters:
Various other suits, claims and investigations, including government subpoenas, arising against, or issued to, us are pending and additional such matters may arise in the future. Management will consider additional disclosure from time to time to the extent it believes such matters may be or become material. The outcome of any current or future litigation or governmental or internal investigations, including the matters described above, cannot be accurately predicted, nor can we predict any resulting penalties, fines or other sanctions that may be imposed at the discretion of federal or state regulatory authorities. We record accruals for such contingencies to the extent that we conclude it is probable that a liability has been incurred and the amount of the loss can be reasonably estimated. No estimate of the possible loss or range of loss in excess of amounts accrued, if any, can be made at this time regarding the matters described above or that are otherwise pending because the inherently unpredictable nature of legal proceedings may be exacerbated by various factors, including, but not limited to: (i) the damages sought in the proceedings are unsubstantiated or indeterminate; (ii) discovery is not complete; (iii) the matter is in its early stages; (iv) the matters present legal uncertainties; (v) there are significant facts in dispute; (vi) there are a large number of parties, or; (vii) there is a wide range of potential outcomes. It is possible that the outcome of these matters could have a material adverse impact on our future results of operations, financial position, cash flows and, potentially, our reputation.
9) RELATIONSHIP WITH UNIVERSAL HEALTH REALTY INCOME TRUST AND OTHER RELATED PARTY TRANSACTIONS
Relationship with Universal Health Realty Income Trust:
At December 31, 2017, we held approximately 5.7% of the outstanding shares of Universal Health Realty Income Trust (the “Trust”). We serve as Advisor to the Trust under an annually renewable advisory agreement, which is scheduled to expire on December 31st of each year, pursuant to the terms of which we conduct the Trust’s day-to-day affairs, provide administrative services
121
and present investment opportunities. In December, 2017, the advisory agreement was renewed by the Trust for 2018 pursuant to the same terms in place during each of the last three years. During 2017, 2016 and 2015, the advisory fee was computed at 0.70% of the Trust’s average invested real estate assets. In addition, certain of our officers and directors are also officers and/or directors of the Trust. Management believes that it has the ability to exercise significant influence over the Trust, therefore we account for our investment in the Trust using the equity method of accounting. We earned an advisory fee from the Trust, which is included in net revenues in the accompanying consolidated statements of income, of approximately $3.6 million during 2017, $3.3 million during 2016 and $2.8 million during 2015.
Our pre-tax share of income from the Trust was $2.6 million during 2017, $1.0 million during 2016 and $1.4 million during 2015, and is included in net revenues in the accompanying consolidated statements of income for each year. Included in our share of the Trust’s income was approximately $1.7 million in 2017 related to our share of a gain recorded resulting from a property transaction, as well as insurance proceeds in excess of damaged Trust property. During 2015, our share of the Trust’s income included $500,000 related to our share of a gain on an exchange transaction recorded by the Trust. We received dividends from the Trust amounting to $2.1 million during 2017 and $2.0 million during each of 2016 and 2015.
The carrying value of our investment in the Trust was $8.2 million and $7.7 million at December 31, 2017 and 2016, respectively, and is included in other assets in the accompanying consolidated balance sheets. The market value of our investment in the Trust was $59.2 million at December 31, 2017 and $51.7 million at December 31, 2016, based on the closing price of the Trust’s stock on the respective dates.
The Trust commenced operations in 1986 by purchasing certain hospital properties from us and immediately leasing the properties back to our respective subsidiaries. Most of the leases were entered into at the time the Trust commenced operations and provided for initial terms of 13 to 15 years with up to six additional 5-year renewal terms. Each hospital lease also provided for additional or bonus rental, as discussed below. The base rents are paid monthly and the bonus rents are computed and paid on a quarterly basis, based upon a computation that compares current quarter revenue to a corresponding quarter in the base year. The leases with those subsidiaries are unconditionally guaranteed by us and are cross-defaulted with one another.
Total rent expense under the operating leases on the three hospital facilities with the Trust during 2017, 2016 and 2015 was $16.0 million, $15.9 million, and $15.6 million, respectively. Pursuant to the terms of the three hospital leases with the Trust, we have the option to renew the leases at the lease terms described above by providing notice to the Trust at least 90 days prior to the termination of the then current term. We also have the right to purchase the respective leased hospitals at the end of the lease terms or any renewal terms at their appraised fair market value as well as purchase any or all of the three leased hospital properties at the appraised fair market value upon one month’s notice should a change of control of the Trust occur. In addition, we have rights of first refusal to: (i) purchase the respective leased facilities during and for 180 days after the lease terms at the same price, terms and conditions of any third-party offer, or; (ii) renew the lease on the respective leased facility at the end of, and for 180 days after, the lease term at the same terms and conditions pursuant to any third-party offer.
The table below details the renewal options and terms for each of our three hospital facilities leased from the Trust:
|
Hospital Name |
|
Type of Facility |
|
Annual Minimum Rent |
|
|
End of Lease Term |
|
Renewal Term (years) |
|
|
||
|
McAllen Medical Center |
|
Acute Care |
|
$ |
5,485,000 |
|
|
December, 2021 |
|
|
10 |
|
(a) |
|
Wellington Regional Medical Center |
|
Acute Care |
|
$ |
3,030,000 |
|
|
December, 2021 |
|
|
10 |
|
(b) |
|
Southwest Healthcare System, Inland Valley Campus |
|
Acute Care |
|
$ |
2,648,000 |
|
|
December, 2021 |
|
|
10 |
|
(b) |
|
(a) |
We have two 5-year renewal options at existing lease rates (through 2031). |
|
(b) |
We have two 5-year renewal options at fair market value lease rates (2022 through 2031). |
In addition, certain of our subsidiaries are tenants in various medical office buildings and two free-standing emergency departments (“FEDs”) owned by the Trust or by limited liability companies in which the Trust holds 95% to 100% of the ownership interest. During the first quarter of 2015, wholly-owned subsidiaries of ours sold to and leased back from the Trust, two newly constructed FEDs located in Texas which were completed and opened during the first quarter of 2015. In conjunction with these transactions, ten-year lease agreements with six, five-year renewal options have been executed with the Trust. We have the option to purchase the properties upon the expiration of the fixed terms and each five-year renewal terms at the fair market value of the property. The aggregate construction cost/sales proceeds of these facilities was approximately $13 million, and the aggregate rent expense paid to the Trust at the commencement of the leases was approximately $900,000 annually.
122
Other Related Party Transactions:
In December, 2010, our Board of Directors approved the Company’s entering into supplemental life insurance plans and agreements on the lives of our chief executive officer (“CEO”) and his wife. As a result of these agreements, as amended in October, 2016, based on actuarial tables and other assumptions, during the life expectancies of the insureds, we would pay approximately $28 million in premiums, and certain trusts owned by our CEO, would pay approximately $9 million in premiums. Based on the projected premiums mentioned above, and assuming the policies remain in effect until the death of the insureds, we will be entitled to receive death benefit proceeds of no less than approximately $37 million representing the $28 million of aggregate premiums paid by us as well as the $9 million of aggregate premiums paid by the trusts. In connection with these policies, we paid approximately $1.2 million and $1.3 million in premium payments during 2017 and 2016.
In August, 2015, Marc D. Miller, our President and member of our Board of Directors, was appointed to the Board of Directors of Premier, Inc. (“Premier”), a healthcare performance improvement alliance. During 2013, we entered into a new group purchasing organization agreement (“GPO”) with Premier. In conjunction with the GPO agreement, we acquired a minority interest in Premier for a nominal amount. During the fourth quarter of 2013, in connection with the completion of an initial public offering of the stock of Premier, we received cash proceeds for the sale of a portion of our ownership interest in the GPO. Also in connection with this GPO agreement, we received shares of restricted stock of Premier which vest ratably over a seven-year period (2014 through 2020), contingent upon our continued participation and minority ownership interest in the GPO. We have elected to retain a portion of the previously vested shares of Premier, the market value of which is included in other assets on our consolidated balance sheet. Based upon the closing price of Premier’s stock on each respective date, the market value of our shares of Premier on which the restrictions have lapsed was $33 million as of December 31, 2017 and $23 million as of December 31, 2016. See Note 1 to the Consolidated Financial Statements-Business and Summary of Significant Accounting Policies, V) GPO Agreement/Minority Ownership Interest for additional disclosure related to this agreement.
In January, 2018, our Board of Directors elected a new member to fill a vacancy created by the retirement of another member. The retired Director was a member of the Executive Committee and Finance Committee of our Board of Directors, was Of Counsel to Norton Rose Fulbright US LLP, and was also the trustee of certain trusts for the benefit of our Chief Executive Officer (“CEO”) and his family. The newly elected Director, who is a Partner in Norton Rose Fulbright US LLP, will serve as a member of the Executive Committee and Finance Committee and acts as a trustee of certain trusts for the benefit of our CEO and his family. We engage Norton Rose Fulbright US LLP for a variety of legal services and the law firm also provides personal legal services to our CEO.
10) PENSION PLAN
We maintain contributory and non-contributory retirement plans for eligible employees. Our contributions to the contributory plan amounted to $50.1 million, $45.7 million and $40.7 million in 2017, 2016 and 2015, respectively. The non-contributory plan is a defined benefit pension plan which covers employees of one of our subsidiaries. The benefits are based on years of service and the employee’s highest compensation for any five years of employment. Our funding policy is to contribute annually at least the minimum amount that should be funded in accordance with the provisions of ERISA.
123
For defined benefit pension plans, the benefit obligation is the “projected benefit obligation”, the actuarial present value, as of December 31 measurement date, of all benefits attributed by the pension benefit formula to employee service rendered to that date. The amount of benefit to be paid depends on a number of future events incorporated into the pension benefit formula, including estimates of the average life of employees/survivors and average years of service rendered. It is measured based on assumptions concerning future interest rates and future compensation levels. The following table shows the reconciliation of the defined benefit pension plan as of December 31, 2017 and 2016:
|
|
|
2017 |
|
|
2016 |
|
||
|
|
|
(000s) |
|
|||||
|
Change in plan assets: |
|
|
|
|
|
|
|
|
|
Fair value of plan assets at beginning of year |
|
$ |
109,677 |
|
|
$ |
106,839 |
|
|
Actual return (loss) on plan assets |
|
|
15,533 |
|
|
|
8,858 |
|
|
Benefits paid |
|
|
(5,846 |
) |
|
|
(5,651 |
) |
|
Administrative expenses |
|
|
(697 |
) |
|
|
(369 |
) |
|
Fair value of plan assets at end of year |
|
$ |
118,667 |
|
|
$ |
109,677 |
|
|
Change in benefit obligation: |
|
|
|
|
|
|
|
|
|
Benefit obligation at beginning of year |
|
$ |
110,949 |
|
|
$ |
118,180 |
|
|
Service cost |
|
|
721 |
|
|
|
926 |
|
|
Interest cost |
|
|
4,465 |
|
|
|
4,997 |
|
|
Benefits paid |
|
|
(5,846 |
) |
|
|
(5,651 |
) |
|
Actuarial (gain) loss |
|
|
5,767 |
|
|
|
(7,503 |
) |
|
Benefit obligation at end of year |
|
$ |
116,056 |
|
|
$ |
110,949 |
|
|
Amounts recognized in the Consolidated Balance Sheet: |
|
|
|
|
|
|
|
|
|
Other non-current assets |
|
|
2,611 |
|
|
|
|
|
|
Other non-current liabilities |
|
|
|
|
|
|
1,272 |
|
|
Total amounts recognized at end of year |
|
$ |
2,611 |
|
|
$ |
1,272 |
|
|
|
|
2017 |
|
|
2016 |
|
|
2015 |
|
|||
|
|
|
(000s) |
|
|||||||||
|
Components of net periodic cost (benefit) |
|
|
|
|
|
|
|
|
|
|
|
|
|
Service cost |
|
$ |
721 |
|
|
$ |
926 |
|
|
$ |
1,051 |
|
|
Interest cost |
|
|
4,465 |
|
|
|
4,997 |
|
|
|
4,912 |
|
|
Expected return on plan assets |
|
|
(5,862 |
) |
|
|
(5,708 |
) |
|
|
(6,254 |
) |
|
Amortization of actuarial loss |
|
|
863 |
|
|
|
3,072 |
|
|
|
3,164 |
|
|
Net periodic cost |
|
$ |
187 |
|
|
$ |
3,287 |
|
|
$ |
2,873 |
|
|
|
|
2017 |
|
2016 |
|
Measurement Dates |
|
|
|
|
|
Benefit obligations |
|
12/31/2017 |
|
12/31/2016 |
|
Fair value of plan assets |
|
12/31/2017 |
|
12/31/2016 |
|
|
|
2017 |
|
|
2016 |
|
||
|
Weighted average assumptions as of December 31 |
|
|
|
|
|
|
|
|
|
Discount rate |
|
|
3.60 |
% |
|
|
4.14 |
% |
|
Rate of compensation increase |
|
|
4.00 |
% |
|
|
4.00 |
% |
|
|
|
2017 |
|
|
2016 |
|
|
2015 |
|
|||
|
Weighted-average assumptions for net periodic benefit cost calculations |
|
|
|
|
|
|
|
|
|
|
|
|
|
Discount rate |
|
|
4.14 |
% |
|
|
4.34 |
% |
|
|
3.95 |
% |
|
Expected long-term rate of return on plan assets |
|
|
5.50 |
% |
|
|
5.50 |
% |
|
|
5.50 |
% |
|
Rate of compensation increase |
|
|
4.00 |
% |
|
|
4.00 |
% |
|
|
4.00 |
% |
The accumulated benefit obligation for our pension plan represents the actuarial present value of benefits based on employee service and compensation as of a certain date and does not include an assumption about future compensation levels. The accumulated benefit obligation for our plan was $115.9 million and $110.6 million as of December 31, 2017 and 2016, respectively. As of December 31, 2017, the fair value of plan assets exceed the accumulated benefit obligation by $2.7 million. As of December 31, 2016, the accumulated benefit obligation exceeded the fair value of plan assets by $0.9 million.
124
We estimate that there will be no net loss or prior service cost amortized from accumulated other comprehensive income during 2018.
In May, 2015, the FASB issued ASU No. 2015-07, "Disclosures for Investments in Certain Entities That Calculate Net Asset Value per Share (or its Equivalent)," which is effective for annual reporting periods beginning after December 15, 2015. The standard removes the requirement to categorize investments for which fair value is measured using the net asset value (NAV) per share practical expedient within the fair value hierarchy. We have adopted this standard effective January 1, 2016, and applied the guidance retrospectively. This standard impacts financial statement disclosure only. In previous reporting periods, we disclosed the full fair value hierarchy and disclosed our pension assets as level 2 within the hierarchy. Going forward, we will disclose our pension assets by asset category reported using NAV as a practical expedient for comparative years.
The market values of our pension plan assets at December 31, 2017 and December 31, 2016, reported using net asset value as a practical expedient, by asset category are as follows:
|
|
|
2017 |
|
|
2016 |
|
||
|
Equities: |
|
|
|
|
|
|
|
|
|
U.S. Large Cap |
|
$ |
9,393 |
|
|
$ |
8,547 |
|
|
U.S. Mid Cap |
|
|
2,937 |
|
|
|
2,651 |
|
|
U.S. Small Cap |
|
|
3,005 |
|
|
|
2,669 |
|
|
International Developed |
|
|
7,213 |
|
|
|
6,534 |
|
|
Emerging Markets |
|
|
4,792 |
|
|
|
4,360 |
|
|
Fixed income: |
|
|
|
|
|
|
|
|
|
Core Fixed Income |
|
|
25,915 |
|
|
|
23,719 |
|
|
Long Duration Fixed Income |
|
|
62,522 |
|
|
|
58,312 |
|
|
Real Estate: |
|
|
|
|
|
|
|
|
|
REIT Fund |
|
|
2,370 |
|
|
|
2,216 |
|
|
Cash/Currency: |
|
|
|
|
|
|
|
|
|
Cash Equivalents |
|
|
520 |
|
|
|
669 |
|
|
Total market value |
|
$ |
118,667 |
|
|
$ |
109,677 |
|
To develop the expected long-term rate of return on plan assets assumption, we considered the historical returns and the future expectations for returns for each asset class, as well as the target asset allocation of the pension portfolio.
The following table shows expected benefit payments for the years ended December 31, 2018 through 2027 for our defined pension plan. There will be benefit payments under this plan beyond 2027.
|
Estimated Future Benefit Payments (000s) |
|
|
|
|
|
2018 |
|
$ |
6,376 |
|
|
2019 |
|
|
6,578 |
|
|
2020 |
|
|
6,705 |
|
|
2021 |
|
|
6,789 |
|
|
2022 |
|
|
6,841 |
|
|
2023-2027 |
|
|
34,230 |
|
|
Total |
|
$ |
67,519 |
|
|
|
|
2017 |
|
|
2016 |
|
||
|
Plan Assets |
|
|
|
|
|
|
|
|
|
Asset Category |
|
|
|
|
|
|
|
|
|
Equity securities |
|
|
23 |
% |
|
|
23 |
% |
|
Fixed income securities |
|
|
75 |
% |
|
|
75 |
% |
|
Other |
|
|
2 |
% |
|
|
2 |
% |
|
Total |
|
|
100 |
% |
|
|
100 |
% |
Investment Policy, Guidelines and Objectives have been established for the defined benefit pension plan. The investment policy is in keeping with the fiduciary requirements under existing federal laws and managed in accordance with the Prudent Investor Rule. Total portfolio risk is regularly evaluated and compared to that of the plan’s policy target allocation and judged on a relative basis over
125
a market cycle. The following asset allocation policy and ranges have been established in accordance with the overall risk and return objectives of the portfolio:
|
|
|
As of 12/31/2017 |
|
|
Permitted Range |
|
|
Total Equity |
|
|
23 |
% |
|
10-30% |
|
Total Fixed Income |
|
|
75 |
% |
|
70-90% |
|
Other |
|
|
2 |
% |
|
0-10% |
In accordance with the investment policy, the portfolio will invest in high quality, large and small capitalization companies traded on national exchanges, and investment grade securities. The investment managers will not write or buy options for speculative purposes; securities may not be margined or sold short. The manager may employ futures or options for the purpose of hedging exposure, and will not purchase unregistered sectors, private placements, partnerships or commodities.
11) SEGMENT REPORTING
Our reportable operating segments consist of acute care hospital services and behavioral health care services. The “Other” segment column below includes centralized services including, but not limited to, information technology, purchasing, reimbursement, accounting and finance, taxation, legal, advertising and design and construction. The chief operating decision making group for our acute care services and behavioral health care services is comprised of our Chief Executive Officer, the President and the Presidents of each operating segment. The Presidents for each operating segment also manage the profitability of each respective segment’s various facilities. The operating segments are managed separately because each operating segment represents a business unit that offers different types of healthcare services or operates in different healthcare environments. The accounting policies of the operating segments are the same as those described in the summary of significant accounting policies included in this Annual Report on Form 10-K for the year ended December 31, 2017. The corporate overhead allocations, as reflected below, are utilized for internal reporting purposes and are comprised of each period’s projected corporate-level operating expenses (excluding interest expense). The overhead expenses are captured and allocated directly to each segment, to the extent possible, based upon each segment’s respective percentage of total operating expenses.
|
2017 |
|
Acute Care Hospital Services |
|
|
Behavioral Health Services (a.) |
|
|
Other |
|
|
Total Consolidated |
|
||||
|
|
|
(Dollar amounts in thousands) |
|
|||||||||||||
|
Gross inpatient revenues |
|
$ |
21,888,207 |
|
|
$ |
8,949,984 |
|
|
$ |
— |
|
|
$ |
30,838,191 |
|
|
Gross outpatient revenues |
|
$ |
13,115,881 |
|
|
$ |
993,409 |
|
|
$ |
— |
|
|
$ |
14,109,290 |
|
|
Total net revenues |
|
$ |
5,484,683 |
|
|
$ |
4,906,719 |
|
|
$ |
18,463 |
|
|
$ |
10,409,865 |
|
|
Income (loss) before allocation of corporate overhead and income taxes |
|
$ |
641,857 |
|
|
$ |
968,974 |
|
|
$ |
(475,822 |
) |
|
$ |
1,135,009 |
|
|
Allocation of corporate overhead |
|
$ |
(182,713 |
) |
|
$ |
(158,735 |
) |
|
$ |
341,448 |
|
|
$ |
0 |
|
|
Income (loss) after allocation of corporate overhead and before income taxes |
|
$ |
459,144 |
|
|
$ |
810,239 |
|
|
$ |
(134,374 |
) |
|
$ |
1,135,009 |
|
|
Total assets |
|
$ |
3,849,214 |
|
|
$ |
6,648,818 |
|
|
$ |
263,796 |
|
|
$ |
10,761,828 |
|
|
2016 |
|
Acute Care Hospital Services |
|
|
Behavioral Health Services (a.) |
|
|
Other |
|
|
Total Consolidated |
|
||||
|
|
|
(Dollar amounts in thousands) |
|
|||||||||||||
|
Gross inpatient revenues |
|
$ |
19,042,627 |
|
|
$ |
8,017,585 |
|
|
$ |
— |
|
|
$ |
27,060,212 |
|
|
Gross outpatient revenues |
|
$ |
11,374,098 |
|
|
$ |
902,102 |
|
|
$ |
— |
|
|
$ |
12,276,200 |
|
|
Total net revenues |
|
$ |
5,112,950 |
|
|
$ |
4,645,007 |
|
|
$ |
8,253 |
|
|
$ |
9,766,210 |
|
|
Income (loss) before allocation of corporate overhead and income taxes |
|
$ |
557,472 |
|
|
$ |
1,030,734 |
|
|
$ |
(431,848 |
) |
|
$ |
1,156,358 |
|
|
Allocation of corporate overhead |
|
$ |
(170,767 |
) |
|
$ |
(154,843 |
) |
|
$ |
325,610 |
|
|
$ |
0 |
|
|
Income (loss) after allocation of corporate overhead and before income taxes |
|
$ |
386,705 |
|
|
$ |
875,891 |
|
|
$ |
(106,238 |
) |
|
$ |
1,156,358 |
|
|
Total assets |
|
$ |
3,723,075 |
|
|
$ |
6,440,195 |
|
|
$ |
154,532 |
|
|
$ |
10,317,802 |
|
126
|
|
Acute Care Hospital Services |
|
|
Behavioral Health Services (a.) |
|
|
Other |
|
|
Total Consolidated |
|
|||||
|
|
|
(Dollar amounts in thousands) |
|
|||||||||||||
|
Gross inpatient revenues |
|
$ |
16,847,944 |
|
|
$ |
7,456,397 |
|
|
$ |
— |
|
|
$ |
24,304,341 |
|
|
Gross outpatient revenues |
|
$ |
9,604,952 |
|
|
$ |
839,884 |
|
|
$ |
15,794 |
|
|
$ |
10,460,630 |
|
|
Total net revenues |
|
$ |
4,632,564 |
|
|
$ |
4,400,335 |
|
|
$ |
10,552 |
|
|
$ |
9,043,451 |
|
|
Income (loss) before allocation of corporate overhead and income taxes |
|
$ |
519,630 |
|
|
$ |
1,021,823 |
|
|
$ |
(395,552 |
) |
|
$ |
1,145,901 |
|
|
Allocation of corporate overhead |
|
$ |
(197,699 |
) |
|
$ |
(117,203 |
) |
|
$ |
314,902 |
|
|
$ |
0 |
|
|
Income (loss) after allocation of corporate overhead and before income taxes |
|
$ |
321,931 |
|
|
$ |
904,620 |
|
|
$ |
(80,650 |
) |
|
$ |
1,145,901 |
|
|
Total assets |
|
$ |
3,413,879 |
|
|
$ |
5,867,088 |
|
|
$ |
334,477 |
|
|
$ |
9,615,444 |
|
|
|
(a.) |
Includes net revenues generated from our behavioral health care facilities located in the U.K. amounting to approximately $429 million in 2017, $241 million in 2016 and $203 million in 2015. Total assets at our U.K. behavioral health care facilities were approximately $1.098 billion as of December 31, 2017, $965 million as of December 31, 2016 and $521 million as of December 31, 2015. |
12) QUARTERLY RESULTS (unaudited)
The following tables summarize the quarterly financial data for the two years ended December 31, 2017 and 2016:
|
2017 |
|
First Quarter |
|
|
Second Quarter |
|
|
Third Quarter |
|
|
Fourth Quarter |
|
|
Total |
|
|||||
|
|
|
(amounts in thousands, except per share amounts) |
|
|||||||||||||||||
|
Net revenues |
|
$ |
2,612,858 |
|
|
$ |
2,612,356 |
|
|
$ |
2,541,864 |
|
|
$ |
2,642,787 |
|
|
$ |
10,409,865 |
|
|
Net income |
|
$ |
210,527 |
|
|
$ |
190,388 |
|
|
$ |
145,362 |
|
|
$ |
225,035 |
|
|
$ |
771,312 |
|
|
Less: Net income attributable to noncontrolling interests |
|
$ |
4,472 |
|
|
$ |
4,994 |
|
|
$ |
4,117 |
|
|
$ |
5,426 |
|
|
$ |
19,009 |
|
|
Net income attributable to UHS |
|
$ |
206,055 |
|
|
$ |
185,394 |
|
|
$ |
141,245 |
|
|
$ |
219,609 |
|
|
$ |
752,303 |
|
|
Earnings per share attributable to UHS-Basic: |
|
|
|
|
|
|
|
|
|
|
|
|
|
|
|
|
|
|
|
|
|
Total basic earnings per share |
|
$ |
2.13 |
|
|
$ |
1.93 |
|
|
$ |
1.48 |
|
|
$ |
2.32 |
|
|
$ |
7.86 |
|
|
Earnings per share attributable to UHS-Diluted: |
|
|
|
|
|
|
|
|
|
|
|
|
|
|
|
|
|
|
|
|
|
Total diluted earnings per share |
|
$ |
2.12 |
|
|
$ |
1.91 |
|
|
$ |
1.47 |
|
|
$ |
2.31 |
|
|
$ |
7.81 |
|
The 2017 quarterly financial data presented above includes the following:
First Quarter:
|
|
• |
an unfavorable $8.1 million pre-tax impact ($5.1 million, or $.05 per diluted share, net of taxes) recorded in connection with the implementation of EHR applications; |
|
|
• |
a favorable after-tax impact of $6.8 million, or $.07 per diluted share, resulting from our January 1, 2017 adoption of ASU 2016-09, “Compensation – Stock Compensation (Topic 718): Improvements to Employee Share-Based Payment Accounting” (“ASU 2016-09”). |
Second Quarter:
|
|
• |
an unfavorable $6.4 million pre-tax impact ($4.0 million, or $.04 per diluted share, net of taxes) recorded in connection with the implementation of EHR applications; |
|
|
• |
a favorable after-tax impact of $1.4 million, or $.01 per diluted share, resulting from our January 1, 2017 adoption of ASU 2016-09. |
127
|
|
• |
an unfavorable $4.2 million pre-tax impact ($2.6 million, or $.03 per diluted share, net of taxes) recorded in connection with the implementation of EHR application; |
|
|
• |
a favorable after-tax impact of $487,000, or $.01 per diluted share, resulting from our January 1, 2017 adoption of ASU 2016-09. |
Fourth Quarter:
|
|
• |
an unfavorable $3.6 million pre-tax impact ($2.3 million, or $.03 per diluted share, net of taxes) recorded in connection with the implementation of EHR applications; |
|
|
• |
a favorable after-tax impact of $13.5 million, or $.14 per diluted share, resulting from our January 1, 2017 adoption of ASU 2016-09; |
|
|
• |
a favorable after-tax impact of $30.0 million, or $.32 per diluted share, resulting from a reduction in our net deferred income tax liability resulting from lower federal income tax rates beginning January 1, 2018 pursuant to the Tax Cuts and Jobs Act of 2017; |
|
|
• |
an unfavorable after-tax impact of $11.3 million, or $.12 per diluted share, resulting from the one-time repatriation tax incurred pursuant to the Tax Cuts and Jobs Act of 2017 (in connection with our behavioral health care facilities located in the U.K. and Puerto Rico). |
|
2016 |
|
First Quarter |
|
|
Second Quarter |
|
|
Third Quarter |
|
|
Fourth Quarter |
|
|
Total |
|
|||||
|
|
|
(amounts in thousands, except per share amounts) |
|
|||||||||||||||||
|
Net revenues |
|
$ |
2,449,798 |
|
|
$ |
2,430,855 |
|
|
$ |
2,409,872 |
|
|
$ |
2,475,685 |
|
|
$ |
9,766,210 |
|
|
Net income |
|
$ |
215,719 |
|
|
$ |
195,449 |
|
|
$ |
157,265 |
|
|
$ |
178,738 |
|
|
$ |
747,171 |
|
|
Less: Net income attributable to noncontrolling interests |
|
$ |
24,960 |
|
|
$ |
9,872 |
|
|
$ |
5,400 |
|
|
$ |
4,530 |
|
|
$ |
44,762 |
|
|
Net income attributable to UHS |
|
$ |
190,759 |
|
|
$ |
185,577 |
|
|
$ |
151,865 |
|
|
$ |
174,208 |
|
|
$ |
702,409 |
|
|
Earnings per share attributable to UHS-Basic: |
|
|
|
|
|
|
|
|
|
|
|
|
|
|
|
|
|
|
|
|
|
Total basic earnings per share |
|
$ |
1.95 |
|
|
$ |
1.91 |
|
|
$ |
1.56 |
|
|
$ |
1.80 |
|
|
$ |
7.22 |
|
|
Earnings per share attributable to UHS-Diluted: |
|
|
|
|
|
|
|
|
|
|
|
|
|
|
|
|
|
|
|
|
|
Total diluted earnings per share |
|
$ |
1.93 |
|
|
$ |
1.89 |
|
|
$ |
1.54 |
|
|
$ |
1.78 |
|
|
$ |
7.14 |
|
The 2016 quarterly financial data presented above includes the following:
First Quarter:
|
|
• |
an unfavorable $8.3 million pre-tax impact ($5.2 million, or $.05 per diluted share, net of taxes) recorded in connection with the implementation of EHR applications; |
Second Quarter:
|
|
• |
an unfavorable $8.7 million pre-tax impact ($5.5 million, or $.05 per diluted share, net of taxes) recorded in connection with the implementation of EHR applications. |
Third Quarter:
|
|
• |
an unfavorable $8.5 million pre-tax impact ($5.3 million, or $.06 per diluted share, net of taxes) recorded in connection with the implementation of EHR applications. |
Fourth Quarter:
|
|
• |
an unfavorable $2.8 million pre-tax impact ($1.8 million, or $.02 per diluted share, net of taxes) recorded in connection with the implementation of EHR applications. |
128
SCHEDULE II—VALUATION AND QUALIFYING ACCOUNTS
(amounts in thousands)
|
|
|
Balance at |
|
|
Charges to |
|
|
|
|
|
|
Write-off of |
|
|
Balance |
|
||||
|
|
|
beginning |
|
|
costs and |
|
|
Acquisitions |
|
|
uncollectible |
|
|
at end |
|
|||||
|
Allowance for Doubtful Accounts Receivable: |
|
of period |
|
|
expenses |
|
|
of business |
|
|
accounts |
|
|
of period |
|
|||||
|
Year ended December 31, 2017 |
|
$ |
410,374 |
|
|
$ |
869,077 |
|
|
$ |
- |
|
|
$ |
(799,162 |
) |
|
$ |
480,289 |
|
|
Year ended December 31, 2016 |
|
$ |
398,797 |
|
|
$ |
741,578 |
|
|
$ |
- |
|
|
$ |
(730,001 |
) |
|
$ |
410,374 |
|
|
Year ended December 31, 2015 |
|
$ |
324,648 |
|
|
$ |
741,273 |
|
|
$ |
- |
|
|
$ |
(667,124 |
) |
|
$ |
398,797 |
|
|
|
|
Balance at |
|
|
Charges to |
|
|
|
|
|
|
|
|
|
|
Balance |
|
|||
|
|
|
beginning |
|
|
costs and |
|
|
Acquisitions |
|
|
|
|
|
|
at end |
|
||||
|
Valuation Allowance for Deferred Tax Assets: |
|
of period |
|
|
expenses |
|
|
of business |
|
|
Write-offs |
|
|
of period |
|
|||||
|
Year ended December 31, 2017 |
|
$ |
56,333 |
|
|
$ |
13,894 |
|
|
$ |
- |
|
|
$ |
- |
|
|
$ |
70,227 |
|
|
Year ended December 31, 2016 |
|
$ |
52,567 |
|
|
$ |
3,766 |
|
|
$ |
- |
|
|
$ |
- |
|
|
$ |
56,333 |
|
|
Year ended December 31, 2015 |
|
$ |
52,764 |
|
|
$ |
(197 |
) |
|
$ |
- |
|
|
$ |
- |
|
|
$ |
52,567 |
|
129