Attached files
| file | filename |
|---|---|
| EX-31.1 - RULE 13A-14(A) CERTIFICATION OF THE PRINCIPAL EXECUTIVE OFFICER - SOUTHERN FIRST BANCSHARES INC | sfb3384821-ex311.htm |
| EX-32 - SECTION 1350 CERTIFICATIONS OF THE PRINCIPAL EXECUTIVE OFFICER - SOUTHERN FIRST BANCSHARES INC | sfb3384821-ex32.htm |
| EX-31.2 - RULE 13A-14(A) CERTIFICATION OF THE PRINCIPAL FINANCIAL OFFICER - SOUTHERN FIRST BANCSHARES INC | sfb3384821-ex312.htm |
| EX-23 - CONSENT OF INDEPENDENT PUBLIC ACCOUNTANTS - SOUTHERN FIRST BANCSHARES INC | sfb3384821-ex23.htm |
| EX-21 - SUBSIDIARIES - SOUTHERN FIRST BANCSHARES INC | sfb3384821-ex21.htm |
UNITED STATES
SECURITIES AND EXCHANGE COMMISSION
Washington, D.C. 20549
FORM 10-K
☒ Annual Report Pursuant To Section 13 Or 15(d) of The Securities Exchange Act of 1934
For The Fiscal Year December 31, 2017.
Or
☐ Transition Report Pursuant To Section 13 Or 15(d) of The Securities Exchange Act of 1934
For the Transition Period from ___________ to ________________
Commission file number 000-27719
|
Southern First Bancshares, Inc. |
|
(Exact name of registrant as specified in its charter) |
| South Carolina | 58-2459561 | |
| (State of Incorporation) | (I.R.S. Employer Identification No.) | |
| 100 Verdae Boulevard, Greenville, SC | 29607 | |
| (Address of principal executive offices) | (Zip Code) | |
| 864-679-9000 |
| (Telephone Number) |
Securities registered pursuant to Section 12(b) of the Act:
| Title of class | Name of each exchange on which registered | |
| Common Stock | The NASDAQ Global Market |
Securities registered pursuant to Section 12(g) of the Act: None
Indicate by check mark if the registrant is a well-known seasoned issuer, as defined in Rule 405 of the Securities Act. Yes ☐ No ☒
Indicate by check mark if the registrant is not required to file reports pursuant to Section 13 or Section 15(d) of the Exchange Act. Yes ☐ No ☒
Indicate by check mark whether the registrant (1) has filed all reports required to be filed by Section 13 or 15(d) of the Securities Exchange Act of 1934 during the preceding 12 months (or for such shorter period that the registrant was required to file such reports), and (2) has been subject to such filing requirements for the past 90 days. Yes ☒ No ☐
Indicate by check mark whether the registrant has submitted electronically and posted on its corporate Web site, if any, every Interactive Data File required to be submitted and posted pursuant to Rule 405 of Regulation S-T (§ 232.405 of this chapter) during the preceding 12 months (or for such shorter period that the registrant was required to submit and post such files). Yes ☒ No ☐
Indicate by check mark if disclosure of delinquent filers pursuant to Item 405 of Regulation S-K is not contained herein, and will not be contained, to the best of registrant’s knowledge, in definitive proxy or information statements incorporated by reference in Part III of this Form 10-K or any amendment to this Form 10-K. ☐
Indicate by check mark whether the registrant is a large accelerated filer, an accelerated filer, a non-accelerated filer, a smaller reporting company, or emerging growth company. See definitions of “large accelerated filer,” “accelerated filer,” “smaller reporting company,” and “emerging growth company” in Rule 12b-2 of the Exchange Act.
Large accelerated filer ☐ Accelerated filer ☒ Non-accelerated filer ☐ Smaller reporting company ☐ Emerging growth company ☐
If an emerging growth company, indicate by check mark if the registrant has elected not to use the extended transition period for complying with any new or revised financial accounting standards provided pursuant to Section 13(a) of the Exchange Act. ☐
Indicate by check mark whether the registrant is a shell company (as defined in Rule 12b-2 of the Exchange Act). Yes ☐ No ☒
The aggregate market value of the common equity held by non-affiliates of the registrant as of June 30, 2017 (based on the average bid and ask price of the Common Stock as quoted on the NASDAQ Global Market on June 30, 2017), was $249,565,415.
7,364,613 shares of the registrant’s common stock were outstanding as of February 23, 2018.
DOCUMENTS INCORPORATED BY REFERENCE
Portions of the registrant’s Proxy Statement relating to the Annual Meeting of Shareholders to be held on May 15, 2018 are incorporated by reference into Part III of this Annual Report on Form 10-K where indicated.
Southern First Bancshares, Inc.
Index to Form 10-K
2
CAUTIONARY NOTE REGARDING
FORWARD-LOOKING STATEMENTS
This Annual Report on Form 10-K, including information included or incorporated by reference in this document, contains statements which constitute forward-looking statements within the meaning of Section 27A of the Securities Act of 1933 and Section 21E of the Securities Exchange Act of 1934, as amended (the “Exchange Act”). Forward-looking statements may relate to our financial condition, results of operation, plans, objectives, or future performance. These statements are based on many assumptions and estimates and are not guarantees of future performance. Our actual results may differ materially from those anticipated in any forward-looking statements, as they will depend on many factors about which we are unsure, including many factors which are beyond our control. The words “may,” “would,” “could,” “should,” “will,” “expect,” “anticipate,” “predict,” “project,” “potential,” “believe,” “continue,” “assume,” “intend,” “plan,” and “estimate,” as well as similar expressions, are meant to identify such forward-looking statements. Potential risks and uncertainties that could cause our actual results to differ from those anticipated in any forward-looking statements include, but are not limited to, those described below under Item 1A- Risk Factors and the following:
| ● |
Restrictions or conditions imposed by our regulators on our operations; |
| ● |
Increases in competitive pressure in the banking and financial services industries; |
| ● |
Changes in access to funding or increased regulatory requirements with regard to funding; |
| ● |
Changes in deposit flows; |
| ● |
Credit losses as a result of declining real estate values, increasing interest rates, increasing unemployment, changes in payment behavior or other factors; |
| ● |
Credit losses due to loan concentration; |
| ● |
Changes in the amount of our loan portfolio collateralized by real estate and weaknesses in the real estate market; |
| ● |
Our ability to successfully execute our business strategy; |
| ● |
Our ability to attract and retain key personnel; |
| ● |
The success and costs of our expansion into the Raleigh, North Carolina and Atlanta, Georgia markets; |
| ● |
Changes in the interest rate environment which could reduce anticipated or actual margins; |
| ● |
Changes in political conditions or the legislative or regulatory environment, including governmental initiatives affecting the financial services industry; |
| ● |
Changes in economic conditions resulting in, among other things, a deterioration in credit quality; |
| ● |
Changes occurring in business conditions and inflation; |
| ● |
Increased cybersecurity risk, including potential business disruptions or financial losses; |
| ● |
Changes in technology; |
| ● |
The adequacy of the level of our allowance for loan losses and the amount of loan loss provisions required in future periods; |
| ● |
Examinations by our regulatory authorities, including the possibility that the regulatory authorities may, among other things, require us to increase our allowance for loan losses or write-down assets; |
| ● |
Changes in monetary and tax policies; |
| ● |
The rate of delinquencies and amounts of loans charged-off; |
| ● |
The rate of loan growth in recent years and the lack of seasoning of a portion of our loan portfolio; |
| ● |
Our ability to maintain appropriate levels of capital and to comply with our capital ratio requirements; |
| ● |
Adverse changes in asset quality and resulting credit risk-related losses and expenses; |
| ● |
Changes in accounting policies and practices; and |
| ● |
Other risks and uncertainties detailed in this Annual Report on Form 10-K and, from time to time, in our other filings with the Securities and Exchange Commission (“SEC”). |
3
If any of these risks or uncertainties materialize, or if any of the assumptions underlying such forward-looking statements proves to be incorrect, our results could differ materially from those expressed in, implied or projected by, such forward-looking statements. For information with respect to factors that could cause actual results to differ from the expectations stated in the forward-looking statements, see “Risk Factors” under Part I, Item 1A of this Annual Report on Form 10-K. We urge investors to consider all of these factors carefully in evaluating the forward-looking statements contained in this Annual Report on Form 10-K. We make these forward-looking as of the date of this document and we do not intend, and assume no obligation, to update the forward-looking statements or to update the reasons why actual results could differ from those expressed in, or implied or projected by, the forward-looking statements.
General
Southern First Bancshares, Inc. (the “Company”) was incorporated in March 1999 under the laws of South Carolina and is a bank holding company registered under the Bank Holding Company Act of 1956. Our primary business is to serve as the holding company for Southern First Bank (the “Bank”), a South Carolina state bank. The Bank is a commercial bank with nine retail offices located in the Greenville, Columbia, and Charleston markets of South Carolina, one location in Raleigh, North Carolina and one location in Atlanta, Georgia.
The Bank is primarily engaged in the business of accepting demand deposits and savings deposits insured by the Federal Deposit Insurance Corporation (the “FDIC”), and providing commercial, consumer and mortgage loans to the general public.
Our Competitive Strengths
We believe that the following business strengths have been instrumental to the success of our core operations. These attributes will enable us to continue profitable growth, while remaining fundamentally sound and driving value to our shareholders.
Simple and Efficient ClientFIRST Model. We operate our Bank using a simple and efficient style of banking that is focused on providing core banking products and services to our clients through a team of talented and experienced bankers. We refer to this model as “ClientFIRST” and it is structured to deliver superior client service via “relationship teams,” which provide each client with a specific banker contact and a consistent support team responsible for all of the client’s banking needs. We believe this model results in a consistent and superior level of professional service that provides us with a distinct competitive advantage by enabling us to build and maintain long-term relationships with desirable clients, enhancing the quality and stability of our funding and lending operations and positioning us to take advantage of future growth opportunities in our existing markets. We also believe that this client focused culture has led to our successful expansion into new markets in the past, and will enable us to be successful if we seek to expand into new markets in the future.
Our ClientFIRST model focuses on achieving cost efficiencies by diligently managing the growth of our number of employees and banking offices. We have historically insisted that the identification of talented bankers drives our growth strategy, as opposed to a more general desire to enter a specific geography or market. This strategy translates into a smaller number of brick and mortar offices relative to our size and compared to peer banks, but larger overall deposit balances in our offices as compared to peers. As a result, our offices average approximately $123 million in total deposits. We believe this style of banking allows us to deliver exceptional client service, while achieving lower efficiency ratios relative to our local competitors, as evidenced by our 57% efficiency ratio for the year ended December 31, 2017.
We continue to make significant investments in our IT systems and technology offerings to our clients that we believe will continue to drive low-cost deposit growth. For example, we launched our new mobile banking platform in early 2014 and have successfully registered 8,200 mobile devices, with the expectation that our active users will continue to increase in the coming years. We believe that our current mobile banking, on-line banking and cash management offerings are industry-leading solutions amongst community banks, and we will continue to invest in the latest technology solutions to ensure we meet the evolving needs of our clients and maintain this competitive advantage over other community banks.
4
Attractive South Carolina, North Carolina and Georgia Markets. We have nine banking offices located in Greenville, Columbia and Charleston, South Carolina, which are the three largest markets in South Carolina, one banking office located in Raleigh, North Carolina, opened in January 2017, which is the second largest market in North Carolina and one banking office located in Atlanta, Georgia, opened in August 2017, which is the largest market in Georgia. The following table illustrates our market share, by insured deposits as of the dates indicated, in these five markets:
| Our Market Deposits | |||||||||||
| June 30, | Total Market | ||||||||||
| Market(1) | Total Offices | 2017 | Deposits(2) | ||||||||
| (Dollars in thousands) | |||||||||||
| Greenville | 4 | $ | 781,279 | $ | 16,742,172 | ||||||
| Columbia | 3 | 264,004 | 19,942,997 | ||||||||
| Charleston | 2 | 243,648 | 13,248,832 | ||||||||
| Raleigh | 1 | 15,390 | 27,143,033 | ||||||||
| Atlanta | 1 | N/A | 166,887,814 | ||||||||
| (1) | Represents the metropolitan statistical area (“MSA”) for each market. | |
| (2) | The total market deposits data displayed are as of June 30, 2017 as reported by the FDIC. |
Greenville. The city of Greenville is located in Greenville County, South Carolina approximately midway between Atlanta and Charlotte on the heavily traveled I-85 business corridor. The Greenville-Anderson-Mauldin MSA is the most populous market in South Carolina with an estimated 886,300 residents as reported in October 2017. The median household income for the Greenville-Anderson-Mauldin MSA was $50,797 for 2017. A large and diverse metropolitan area, the Greenville-Anderson-Mauldin MSA is one of the southeast region’s premier areas for business, serving as headquarters for Michelin and Hubbell Lighting as well as hosting significant operations for BMW and Lockheed Martin.
Columbia. The city of Columbia is located in Richland County, South Carolina and its surrounding suburban areas expand into adjoining Lexington County. Columbia is the state capital, the largest city in the state and the home of the University of South Carolina and Fort Jackson, the Army’s largest Initial Entry Training Center. The Columbia MSA is the second most populous market in the state with an estimated population of 819,200 residents as reported in October 2017. The median household income for the Columbia MSA was $54,035 for 2017.
Charleston. The city of Charleston is located in Charleston County, South Carolina. The Charleston-North Charleston MSA is the third most populous market in the state with an estimated population of 762,300 residents as reported in October 2017. Charleston is home to the deepest port in the Southeast and boasts top companies in the aerospace, biomedical and technology fields such as Boeing, the Medical University of South Carolina (MUSC) and Blackbaud. The median household income for the Charleston-North Charleston MSA was approximately $59,534 for 2017. One of our retail offices in the Charleston market is located in the city of Mount Pleasant, which is located just north of Charleston in Charleston County and ranks as the fourth largest city in South Carolina.
Raleigh. The city of Raleigh is the second largest city in the state and is located in Wake County, North Carolina. The Raleigh MSA is one of the most populous markets in the state of North Carolina with an estimated population of 1.31 million residents as reported in October 2017. Raleigh is the state capital and is home to North Carolina State University and is part of the Research Triangle area, together with Durham, North Carolina (home of Duke University) and Chapel Hill, North Carolina (home of the University of North Carolina at Chapel Hill). The median household income for the Raleigh MSA was approximately $68,126 for 2017. We opened our first retail office in Raleigh in January 2017.
Atlanta. The Atlanta-Sandy Springs-Roswell MSA has the ninth largest population in the U.S. with 5.80 million residents as reported in October 2017. Atlanta is the state capital of, and largest city in, Georgia and is the world headquarters of corporations such as Coca-Cola, Home Depot, UPS, Delta Airlines and Turner Broadcasting. The median household income for the Atlanta MSA is $62,437 for 2017. We opened our first retail office in Atlanta in August 2017.
We believe that the demographics and growth characteristics of these five markets will provide us with significant opportunities to further develop existing client relationships and expand our client base.
5
Experienced Management Team, Dedicated Board of Directors and Talented Employees. Our senior management team is led by R. Arthur Seaver, Jr., F. Justin Strickland, and Michael D. Dowling, whose biographies are included below. These executives lead a team of 32 additional senior team members which we believe compares favorably to any community bank management team assembled in South Carolina.
R. Arthur “Art” Seaver, Jr. has served as the Chief Executive Officer of our Company and our Bank since 1999. He has over 30 years of banking experience. From 1986 until 1992, Mr. Seaver held various positions with The Citizens & Southern National Bank of South Carolina. From 1992 until February 1999, he was with Greenville National Bank, which was acquired by Regions Bank in 1998. He was the Senior Vice President in lending and was also responsible for managing Greenville National Bank’s deposit strategies prior to leaving to form the Bank. Mr. Seaver is a 1986 graduate of Clemson University with a bachelor’s degree in Financial Management and a 1999 graduate of the BAI Graduate School of Community Bank Management.
F. Justin Strickland has served as President of our Company and our Bank since 2006. He has over 30 years of banking experience. From 1985 until 1993, Mr. Strickland held various positions with The Citizens & Southern National Bank of South Carolina. From 1993 until November 2006, he was with Carolina First Bank. From 1999 until November 2006, he held the position of South Carolina Midlands Market President. Mr. Strickland is a 1985 graduate of the University of South Carolina with a bachelor’s degree in Finance and the LSU Graduate School of Banking of the South in Baton Rouge, Louisiana in 1996.
Michael D. Dowling has served as an Executive Vice President and the Chief Financial Officer of our Company and our Bank since 2011. He has over 23 years of experience in the banking industry. Mr. Dowling was previously employed with KPMG LLP from 1994 until 2011, including most recently as an Audit Partner (2005-2011) and a member of KPMG’s Financial Services practice. Mr. Dowling has extensive experience working with public companies and financial institutions. He is a 1993 graduate of Clemson University, with a degree in Accounting and is a CPA in South Carolina and North Carolina.
Our entire executive management team brings an average of 23 years of experience in the banking industry and consists of the following in addition to Messrs. Seaver, Strickland and Dowling:
| Name | Position |
Years of | ||
| Richard E. S. Bowen | Executive Vice President and Atlanta Regional Executive | 28 | ||
| Frederick Gilmer III | Executive Vice President and Senior Lending Officer | 30 | ||
| Lenwood B. Howell | Executive Vice President and Charleston Regional Executive | 31 | ||
| Tricia P. Springfield | Executive Vice President and Chief Retail Officer | 25 | ||
| Jason E. Starnes | Executive Vice President and Chief Information Officer | 18 | ||
| Jonathan H. Taylor | Executive Vice President and Raleigh Regional Executive | 21 | ||
| Robert B. Thompson III | Executive Vice President and Greenville Regional Executive | 22 | ||
| Emily V. Watrous | Executive Vice President and Human Resource Executive | 6 |
The management team is complemented by a dedicated board of directors with extensive local market knowledge and a wide range of experience including accounting, business, banking, manufacturing, insurance, management and finance. We believe that our management’s and board’s incentives are closely aligned with our shareholders through the ownership of a substantial amount of our stock. As of December 31, 2017, our executive officers and board of directors owned an aggregate of 873,217 shares of our common stock, including options to purchase shares of our common stock, which represented approximately 11.30% of the fully-diluted amount of our common stock outstanding. We believe that our officers’ and directors’ experience and local market knowledge are valuable assets and will enable them to guide us successfully in the future.
In addition, we believe that we have assembled a group of highly talented employees by being an employer of choice in the markets we serve. We employed a total of 198 full-time equivalent employees as of December 31, 2017. Our employees are skilled in the areas of banking, information technology, management, sales, advertising and marketing, among others. We strive to provide an “umbrella for great talent,” characterized by a culture of transparency and collaboration which permeates all levels of the organization. To drive our culture of transparency and collaboration, our employees engage in a series of weekly meetings to understand the goals and plan for each week. These meetings are intended to remind our employees of our vision, strategy and ClientFIRST service, and provide our employees with information regarding monthly and quarterly goals and client or prospect needs. In addition, each week is started with a meeting of all Senior and Executive Vice Presidents to ensure that all team members are informed on the latest developments of our Company. Our employees and their ClientFIRST approach to service have been instrumental to our success.
6
Our Business Strategy
We are focused on growing business relationships and building core deposits, profitable loans and noninterest income. We believe that we have built a dynamic franchise that meets the financial needs of our clients by providing an array of personalized products and services delivered by seasoned banking professionals with knowledge of our local markets. Our overall strategic goal is to provide the highest level of service to our clients while achieving high-performance metrics within the community banking market that drive franchise and shareholder value. Our specific business strategies include:
Focus on Profitable and Efficient Growth. Our executive management team and board of directors are dedicated to producing profits and returns for our shareholders. We actively manage the mix of assets and liabilities on our balance sheet to optimize our net interest margin while also maintaining expense controls and developing noninterest income streams. By constantly striving to build a well-structured balance sheet, we seek to increase profitability and improve our return on average assets, return on average equity and efficiency ratio. We believe that, as the economy continues to improve, our focus on maximizing our net interest margin and minimizing our efficiency ratio while maintaining credit quality controls will translate into continued and improved profitability and shareholder returns. We are committed to enhancing these levels of profitability by focusing on our core competencies of commercial lending and core deposit gathering. We believe that we have the infrastructure currently in place, such as technology, support staff and administration, to support expansion with limited associated noninterest expense increases.
Provide a Distinctive Client Experience. Our markets have been subject to consolidation of local community banks primarily by larger, out-of-state financial institutions. We believe there is a large client base in our markets that prefers doing business with a local institution and may be dissatisfied with the service offered by national and larger regional banks. We believe that the exceptional level of professional service provided to our clients as a result of our ClientFIRST model provides us with a distinct competitive advantage over our local competitors. We also believe that technology innovation will continue to play a critical role in retaining clients and winning new business. We believe that our current mobile banking, on-line banking and cash management offerings are industry-leading solutions amongst community banks. During 2017, 76% of deposits were acquired through our office network, 22% came through the commercial remote deposit capture channel and the remaining 2% came through consumer mobile deposits. We believe that the volume in remote deposit capture and mobile deposit channels will continue to increase over time as more clients become acquainted with the convenience these services provide. By delivering superior professional service through our ClientFIRST model, coupled with our deep understanding of our markets and our commitment to providing the latest technology solutions to meet our clients’ banking needs, we believe that we can attract new clients and expand our total loans and deposits.
Maintain a Rigorous Risk Management Infrastructure. As we grow, one of our top priorities is to continue to build a robust enterprise risk management infrastructure. We believe effective risk management requires a culture of risk management and governance throughout the Company. The legislative and regulatory landscape continues to quickly evolve, so we are continually performing risk assessments throughout the organization and re-allocating resources where appropriate. We will continue to add new resources and technology investments to help enhance all of our risk management processes throughout the Bank. Our risk management success is exemplified by our historic credit risk management and disciplined underwriting practices, which have enabled us to successfully grow our balance sheet while maintaining strong credit quality metrics. We do not reduce our credit standards or pricing discipline to generate new loans. In addition, we are heavily focused on compliance risk and cybersecurity risk, as both of these risks have increased since our inception. Our management team continually analyzes emerging fraud and security risks and utilizes tools, strategies and policies to manage risk while delivering an optimal and appropriate client experience. We believe our risk management structure allows our board and senior management to maintain effective oversight of our risks to ensure that our personnel are following prudent and appropriate risk management practices resulting in strong loan quality and minimal loan losses.
Attract Talented Banking Professionals With A “ClientFIRST” Focus. We believe that our ability to attract and retain banking professionals with strong community relationships and significant knowledge of our markets will continue to drive our success and grow our business in an efficient manner. By focusing on experienced, established bankers who deliver exceptional client service through our ClientFIRST model, we believe we can enhance our market position and add profitable growth opportunities. We believe that the strength of our exceptional client service and relationship banking approach will continue to help us attract these established bankers. In recent years, we have invested in our internal infrastructure, including support and back office personnel, and we believe that we can continue to add experienced frontline bankers to our existing markets, which will drive our efficient growth.
7
We will continue to expand our franchise, but only in a controlled manner. We may choose to open new locations, but only after rigorous due diligence and substantial quantitative analysis regarding the financial and capital impacts of such investments. We may also choose to enter new metropolitan markets contiguous to, or nearby, our current South Carolina footprint, such as our recently opened expansions in Raleigh, North Carolina and Atlanta, Georgia, but only after careful study and the identification and vetting of a local, senior level banking team with significant experience and reputational strength in that market. We have not yet supplemented our historic strategy of organic deposit and loan growth with traditional mergers or acquisitions. We evaluate potential acquisition opportunities that we believe would be complementary to our business as part of our growth strategy. However, we have not yet identified any specific acquisition opportunity that meets our strict requirements and do not have any immediate plans, arrangements or understandings relating to any acquisition. Furthermore, we do not believe an acquisition is necessary to successfully drive our growth and execute our ClientFIRST model.
Lending Activities
General. We emphasize a range of lending services, including real estate, commercial, and equity-line consumer loans to individuals and small- to medium-sized businesses and professional firms that are located in or conduct a substantial portion of their business in our market area. Our underwriting standards vary for each type of loan, as described below. Because loans typically provide higher interest yields than other types of interest-earning assets, we invest a substantial percentage of our earning assets in our loan portfolio. At December 31, 2017, we had net loans of $1.37 billion, representing 84.4% of our total assets.
We have focused our lending activities primarily on the professional markets in Greenville, Columbia, Charleston, Raleigh and Atlanta including doctors, dentists, and small business owners. By focusing on this client base and by serving each client with a consistent relationship team of bankers, we have generated a loan portfolio with larger average loan amounts than we believe is typical for a community bank. As of December 31, 2017, our average loan size was approximately $266,000. Excluding home equity lines of credit, the average loan size was approximately $318,000. At the same time, we have strived to maintain a diversified loan portfolio and limit the amount of our loans to any single client. As of December 31, 2017, our 10 largest client loan relationships represented approximately $144.7 million, or 10.4%, of our loan portfolio.
Loan Approval. Certain credit risks are inherent in making loans. These include prepayment risks, risks resulting from uncertainties in the future value of collateral, risks resulting from changes in economic and industry conditions, and risks inherent in dealing with individual borrowers. We attempt to mitigate repayment risks by adhering to internal credit policies and procedures. These policies and procedures include officer and client lending limits, a multi-layered approval process for larger loans, documentation examination, and follow-up procedures for any exceptions to credit policies. Our loan approval policies provide for various levels of officer lending authority. When the amount of aggregate loans to a single borrower exceeds an individual officer’s lending authority, the loan request will be considered for approval by a team of officers led by a senior lender, or by the voting members of the officers’ loan committee, based on the loan amount. The officers’ loan committee, which is comprised of a group of our senior commercial lenders, bank president, and chief executive officer, has pre-determined lending limits, and any loans in excess of this lending limit will be submitted for approval by the finance committee of our board or by the full board. We do not make any loans to any director or executive officer of the Bank unless the loan is approved by the board of directors of the Bank and all loans to directors, officers and employees are on terms not more favorable to such person than would be available to a person not affiliated with the Bank, consistent with federal banking regulations.
Management monitors exposure to credit risk from potential concentrations of loans to particular borrowers or groups of borrowers, industries and geographic regions, as well as concentrations of lending products and practices such as loans that subject borrowers to substantial payment increases (e.g. principal deferral periods, loans with initial interest-only periods, etc.), and loans with high loan-to-value ratios. As of December 31, 2017, approximately $97.7 million, or 7.0% of our loans had loan-to-value ratios which exceeded regulatory supervisory limits, of which 76 loans totaling approximately $40.5 million had loan-to-value ratios of 100% or more. These types of loans are subject to strict underwriting standards and are more closely monitored than a loan with a low loan-to-value ratio. Furthermore, there are industry practices that could subject the Company to increased credit risk should economic conditions change over the course of a loan’s life. For example, the Company makes variable rate loans and fixed rate principal-amortizing loans with maturities prior to the loan being fully paid (i.e. balloon payment loans). The various types of loans are individually underwritten and monitored to manage the associated risks.
Credit Administration and Loan Review. We maintain a continuous loan review system. We also apply a credit grading system to each loan, and we use an independent process to review the loan files on a test basis to assess the grading of each loan. The Bank periodically reviews performance benchmarks established by management in the areas of nonperforming assets, charge-offs, past dues, and loan documentation. Each loan officer is responsible for each loan he or she makes, regardless of whether other individuals or committees joined in the approval. This responsibility continues until the loan is repaid or until the loan is officially assigned to another officer.
8
Lending Limits. Our lending activities are subject to a variety of lending limits imposed by federal and state laws and regulations. In general, the Bank is subject to a legal limit on loans to a single borrower equal to 15% of the Bank’s capital and unimpaired surplus. Based upon the capitalization of the Bank at December 31, 2017, the maximum amount we could lend to one borrower is $26.3 million. However, to mitigate concentration risk, our internal lending limit at December 31, 2017 is $18.4 million and may vary based on our assessment of the lending relationship. The board of directors will adjust the internal lending limit as deemed necessary to continue to mitigate risk and serve the Bank’s clients. The Bank’s legal lending limit will increase or decrease in response to increases or decreases in the Bank’s level of capital. We are able to sell participations in our larger loans to other financial institutions, which allow us to manage the risk involved in these loans and to meet the lending needs of our clients requiring extensions of credit in excess of these limits.
Loan Portfolio Segments. Our loan portfolio is comprised of commercial and consumer loans made to small businesses and individuals for various business and personal purposes. While our loan portfolio is not concentrated in loans to any single borrower or a relatively small number of borrowers, the principal component of our loan portfolio is loans secured by real estate mortgages on either commercial or residential property. These loans will generally fall into one of the following six categories: commercial owner occupied real estate, commercial non-owner occupied real estate, commercial construction, consumer real estate, consumer construction, and home equity loans. We obtain a security interest in real estate whenever possible, in addition to any other available collateral, in order to increase the likelihood of the ultimate repayment of the loan. At December 31, 2017, loans secured by first or second mortgages on commercial and consumer real estate made up approximately 82.1% of our loan portfolio. In addition to loans secured by real estate, our loan portfolio includes commercial business loans and other consumer loans which comprised 16.3% and 1.6%, respectively, of our total loan portfolio at December 31, 2017.
Interest rates for all real estate loan categories may be fixed or adjustable, and will more likely be fixed for shorter-term loans. We generally charge an origination fee for each loan which is taken into income over the life of the loan as an adjustment to the loan yield. Other loan fees consist primarily of late charge fees. Real estate loans are subject to the same general risks as other loans and are particularly sensitive to fluctuations in the value of real estate. Fluctuations in the value of real estate, as well as other factors arising after a loan has been made, could negatively affect a borrower’s cash flow, creditworthiness, and ability to repay the loan. Although, the loans are collateralized by real estate, the primary source of repayment may not be the sale of real estate.
The following describes the types of loans in our loan portfolio.
| ● | Commercial Real Estate Loans (Commercial Owner Occupied and Commercial Non-owner Occupied Real Estate Loans). At December 31, 2017, commercial owner occupied and non-owner occupied real estate loans (other than construction loans) amounted to $629.6 million, or approximately 45.4% of our loan portfolio. Of our commercial real estate loan portfolio, $312.8 million in loans were non-owner occupied properties, representing 34.5% of our commercial real estate portfolio and 22.6% of our total loan portfolio. The remainder of our commercial real estate loan portfolio, $316.8 million in loans or 34.9% of the commercial loan portfolio, were owner occupied. Owner occupied loans represented 22.8% of our total loan portfolio. At December 31, 2017, our individual commercial real estate loans ranged in size from approximately $10,000 to $17.1 million, with an average loan size of approximately $610,000. These loans generally have terms of five years or less, although payments may be structured on a longer amortization basis. We evaluate each borrower on an individual basis and attempt to determine the business risks and credit profile of each borrower. We attempt to reduce credit risk in the commercial real estate portfolio by emphasizing loans on owner-occupied office and retail buildings where the loan-to-value ratio, established by independent appraisals, does not exceed 85%. We also generally require that a borrower’s cash flow exceeds 115% of monthly debt service obligations. In order to ensure secondary sources of payment and liquidity to support a loan request, we typically review all of the personal financial statements of the principal owners and require their personal guarantees. |
9
| ● | Construction Real Estate Loans. We offer adjustable and fixed rate construction real estate loans for commercial and consumer projects, typically to builders and developers and to consumers who wish to build their own homes. At December 31, 2017, total commercial and consumer construction loans amounted to $79.5 million, or 5.7% of our loan portfolio. Commercial construction loans represented $51.2 million, or 3.7%, of our total loan portfolio, while consumer construction loans represented $28.4 million, or 2.0% of our total loan portfolio. At December 31, 2017, our commercial construction real estate loans ranged in size from approximately $50,000 to $6.3 million, with an average loan balance of approximately $805,000. At December 31, 2017, our consumer or residential construction loans ranged in size from approximately $30,000 to $1.8 million, with an average loan size of approximately $309,000. The duration of our construction loans generally is limited to 18 months, although payments may be structured on a longer amortization basis. Commercial construction loans generally carry a higher degree of risk than long-term financing of existing properties because repayment depends on the ultimate completion of the project and sometimes on the sale of the property. Specific risks include: |
| ● | cost overruns; |
| ● | mismanaged construction; |
| ● | inferior or improper construction techniques; |
| ● | economic changes or downturns during construction; |
| ● | a downturn in the real estate market; |
| ● | rising interest rates which may prevent sale of the property; and |
| ● | failure to sell completed projects in a timely manner. |
| We attempt to reduce the risk associated with construction loans by obtaining personal guarantees where possible and by keeping the loan-to-value ratio of the completed project at or below 80%. | |
| ● | Commercial Business Loans. We make loans for commercial purposes in various lines of businesses, including the manufacturing, service industry, and professional service areas. At December 31, 2017, commercial business loans amounted to $226.2 million, or 16.3% of our loan portfolio, and ranged in size from approximately $5,000 to $4.7 million, with an average loan size of approximately $174,000. Commercial loans are generally considered to have greater risk than first or second mortgages on real estate because commercial loans may be unsecured, or if they are secured, the value of the collateral may be difficult to assess and more likely to decrease than real estate. |
| We are eligible to offer small business loans utilizing government enhancements such as the Small Business Administration’s (“SBA”) 7(a) program and SBA’s 504 programs. These loans typically are partially guaranteed by the government, which helps to reduce their risk. Government guarantees of SBA loans do not exceed, and are generally less than, 80% of the loan. As of December 31, 2017, we had originated one loan utilizing government enhancements. | |
| ● | Consumer Real Estate Loans and Home Equity Loans. At December 31, 2017, consumer real estate loans (other than construction loans) amounted to $429.2 million, or 31.0% of our loan portfolio. Included in the consumer real estate loans was $273.1 million, or 19.7% of our loan portfolio, in first and second mortgages on individuals’ homes, while home equity loans represented $156.1 million, or 11.3% of our total loan portfolio. At December 31, 2017, our individual residential real estate loans ranged in size from $5,000 to $6.3 million, with an average loan size of approximately $383,000. Generally, we limit the loan-to-value ratio on our consumer real estate loans to 85%. We offer fixed and adjustable rate consumer real estate loans with terms of up to 30 years. We typically offer these long-term fixed rate loans through a third party rather than originating and retaining these loans ourselves. Consumer real estate and home equity loans that we retain on our balance sheet typically have terms of 10 years or less. We also offer home equity lines of credit. At December 31, 2017, our individual home equity lines of credit ranged in size from $5,000 to $1.9 million, with an average of approximately $91,000. Our underwriting criteria and the risks associated with home equity loans and lines of credit are generally the same as those for first mortgage loans. Home equity lines of credit typically have terms of ten years or less. We generally limit the extension of credit to 90% of the market value of each property, although we may extend up to 100% of the market value. |
| ● | Other Consumer Loans. We make a variety of loans to individuals for personal and household purposes, including secured and unsecured installment loans and revolving lines of credit. These consumer loans are underwritten based on the borrower’s income, current debt level, past credit history, and the availability and value of collateral. Consumer rates are both fixed and variable, with negotiable terms. At December 31, 2017, consumer loans other than real estate amounted to $22.6 million, or 1.6% of our loan portfolio, and ranged in size from $5,000 to $1.5 million, with an average loan size of approximately $13,000. Our installment loans typically amortize over periods up to 60 months. We will offer consumer loans with a single maturity date when a specific source of repayment is available. We typically require monthly payments of interest and a portion of the principal on our revolving loan products. Consumer loans are generally considered to have greater risk than first or second mortgages on real estate because they may be unsecured, or, if they are secured, the value of the collateral may be difficult to assess and more likely to decrease in value than real estate. |
10
Deposit Services
Our principal source of funds is core deposits. We offer a full range of deposit services, including checking accounts, commercial checking accounts, savings accounts, and other time deposits of various types, ranging from daily money market accounts to long-term certificates of deposit. Our out-of-market, or wholesale, certificates of deposits represented $28.1 million, or 2.0%, of total deposits at December 31, 2017. In an effort to obtain lower costing deposits, we have focused on expanding our retail deposit program. We currently have eleven retail offices which assist us in obtaining low cost transaction accounts that are less affected by rising rates. Deposit rates are reviewed regularly by senior management of the Bank. We believe that the rates we offer are competitive with those offered by other financial institutions in our area. We focus on client service and our ClientFIRST culture to attract and retain deposits.
Other Banking Services
In addition to deposit and loan services, we offer other bank services such as internet banking, cash management, safe deposit boxes, direct deposit, automatic drafts, bill payment and mobile banking services. We earn fees for most of these services, including debit and credit card transactions, sales of checks, and wire transfers. We also receive ATM transaction fees from transactions performed by our clients. We are associated with the NYCE, Pulse, STAR, and Cirrus networks, which are available to our clients throughout the country. Since we outsource our ATM services, we are charged related transaction fees from our ATM service provider. We have contracted with Fidelity National Information Systems, an outside computer service company, to provide our core data processing services and our ATM processing. By outsourcing these services, we believe we are able to reduce our overhead by matching the expense in each period to the transaction volume that occurs during the period, as a significant portion of the fee charged is directly related to the number of loan and deposit accounts and the related number of transactions we have during the period. We believe that by being associated with a shared network of ATMs, we are better able to serve our clients and are able to attract clients who are accustomed to the convenience of using ATMs, although we do not believe that maintaining this association is critical to our success. We also offer Internet banking services, bill payment services, and cash management and mobile banking services.
Competition
The banking business is highly competitive, and we experience competition in our market from many other financial institutions. Competition among financial institutions is based upon interest rates offered on deposit accounts, interest rates charged on loans, other credit and service charges relating to loans, the quality and scope of the services rendered, the convenience of banking facilities, and, in the case of loans to commercial borrowers, relative lending limits. We compete with commercial banks, credit unions, savings and loan associations, mortgage banking firms, consumer finance companies, securities brokerage firms, insurance companies, money market funds, and other mutual funds, as well as other super-regional, national, and international financial institutions that operate offices in Greenville, Columbia and Charleston, South Carolina, Raleigh, North Carolina, Atlanta, Georgia and elsewhere.
As of June 30, 2017, the most recent date for which market data is available, there were 31 financial institutions in our primary market of Greenville County, 22 financial institutions in the Columbia market, 28 financial institutions in the Charleston market, 32 financial institutions in the Raleigh market, and 47 financial institutions in the Atlanta market. We compete with other financial institutions in our market areas both in attracting deposits and in making loans. In addition, we have to attract our client base from other existing financial institutions and from new residents. Many of our competitors are well-established, larger financial institutions with substantially greater resources and lending limits, such as BB&T, Bank of America, Wells Fargo, and SunTrust. These institutions offer some services, such as extensive and established branch networks and trust services that we do not provide. In addition, many of our non-bank competitors are not subject to the same extensive federal regulations that govern bank holding companies and federally insured banks. Because larger competitors have advantages in attracting business from larger corporations, we do not generally compete for that business. Instead, we concentrate our efforts on attracting the business of individuals and small and medium-size businesses. With regard to such accounts, we generally compete on the basis of client service and responsiveness to client needs, the convenience of our offices and hours, and the availability and pricing of our products and services.
We believe our commitment to quality and personalized banking services through our ClientFIRST culture is a factor that contributes to our competitiveness and success.
11
Employees
At December 31, 2017, we employed a total of 198 full-time equivalent employees. We provide our full-term employees and certain part-time employees with a comprehensive program of benefits, including medical benefits, life insurance, long-term disability coverage and a 401(k) plan. Our employees are not represented by a collective bargaining agreement. Management considers its employee relations to be excellent.
SUPERVISION AND REGULATION
Both the Company and the Bank are subject to extensive state and federal banking laws and regulations that impose specific requirements or restrictions on and provide for general regulatory oversight of virtually all aspects of our operations. These laws and regulations are generally intended to protect depositors, not shareholders. Changes in applicable laws or regulations may have a material effect on our business and prospects.
The following discussion is not intended to be a complete list of all the activities regulated by the banking laws or of the impact of such laws and regulations on our operations. It is intended only to briefly summarize some material provisions. The following summary is qualified by reference to the statutory and regulatory provisions discussed.
Recent Legislative and Regulatory Developments
Although the financial crisis has now passed, two legislative and regulatory responses – the Dodd-Frank Wall Street Reform and Consumer Protection Act (the “Dodd-Frank Act”) and the Basel III-based capital rules – will continue to have an impact on our operations.
The Dodd-Frank Wall Street Reform and Consumer Protection Act
The Dodd-Frank Act was signed into law in July 2010 and impacts financial institutions in numerous ways, including:
| ● | The creation of a Financial Stability Oversight Council responsible for monitoring and managing systemic risk, |
| ● | Granting additional authority to the Board of Governors of the Federal Reserve (the “Federal Reserve”) to regulate certain types of nonbank financial companies, |
| ● | Granting new authority to the FDIC as liquidator and receiver, |
| ● | Changing the manner in which deposit insurance assessments are made, |
| ● | Requiring regulators to modify capital standards, |
| ● | Establishing the Consumer Financial Protection Bureau (the “CFPB”), |
| ● | Capping interchange fees that banks charge merchants for debit card transactions, |
| ● | Imposing more stringent requirements on mortgage lenders, and |
| ● | Limiting banks’ proprietary trading activities. |
There are many provisions in the Dodd-Frank Act mandating regulators to adopt new regulations and conduct studies upon which future regulation may be based. While some have been issued, many remain to be issued. Governmental intervention and new regulations could materially and adversely affect our business, financial condition and results of operations.
Basel Capital Standards
Regulatory capital rules released in July 2013 to implement capital standards referred to as Basel III and developed by an international body known as the Basel Committee on Banking Supervision, impose higher minimum capital requirements for bank holding companies and banks. The rules apply to all national and state banks and savings associations regardless of size and bank holding companies and savings and loan holding companies with more than $1 billion in total consolidated assets. More stringent requirements are imposed on “advanced approaches” banking organizations-those organizations with $250 billion or more in total consolidated assets, $10 billion or more in total foreign exposures, or that have opted in to the Basel II capital regime. The requirements in the rule began to phase in on January 1, 2015, for us and will be fully phased in by January 1, 2019.
The rule includes certain new and higher risk-based capital and leverage requirements than those currently in place. Specifically, the following minimum capital requirements apply to us:
| ● | a new common equity Tier 1 risk-based capital ratio of 4.5%; |
| ● | a Tier 1 risk-based capital ratio of 6% (increased from the former 4% requirement); |
| ● | a total risk-based capital ratio of 8% (unchanged from the former requirement); and |
| ● | a leverage ratio of 4% (also unchanged from the former requirement). |
12
Under the rule, Tier 1 capital is redefined to include two components: Common Equity Tier 1 capital and additional Tier 1 capital. The new and highest form of capital, Common Equity Tier 1 capital, consists solely of common stock (plus related surplus), retained earnings, accumulated other comprehensive income, and limited amounts of minority interests that are in the form of common stock. Additional Tier 1 capital includes other perpetual instruments historically included in Tier 1 capital, such as noncumulative perpetual preferred stock. Tier 2 capital consists of instruments that currently qualify in Tier 2 capital plus instruments that the rule has disqualified from Tier 1 capital treatment. Cumulative perpetual preferred stock, formerly includable in Tier 1 capital, is now included only in Tier 2 capital. Accumulated other comprehensive income (AOCI) is presumptively included in Common Equity Tier 1 capital and often would operate to reduce this category of capital. The rule provided a one-time opportunity at the end of the first quarter of 2015 for covered banking organizations to opt out of much of this treatment of AOCI. We made this opt-out election and, as a result, will retain the pre-existing treatment for AOCI.
In addition, in order to avoid restrictions on capital distributions or discretionary bonus payments to executives, a covered banking organization must maintain a “capital conservation buffer” on top of its minimum risk-based capital requirements. This buffer must consist solely of Tier 1 Common Equity, but the buffer applies to all three measurements (Common Equity Tier 1, Tier 1 capital and total capital). The capital conservation buffer will be phased in incrementally over time, becoming fully effective on January 1, 2019, and will consist of an additional amount of common equity equal to 2.5% of risk-weighted assets. As of January 1, 2018, we are required to hold a capital conservation buffer of 1.875%, to 2.5% effective as of January 1, 2019.
In general, the rules have had the effect of increasing capital requirements by increasing the risk weights on certain assets, including high volatility commercial real estate, certain loans past due 90 days or more or in nonaccrual status, mortgage servicing rights not includable in Common Equity Tier 1 capital, equity exposures, and claims on securities firms, that are used in the denominator of the three risk-based capital ratios.
It is management’s belief that, as of December 31, 2017, the Company and the Bank would have met all capital adequacy requirements under Basel III on a fully phased-in basis if such requirements were currently effective.
Volcker Rule
Section 619 of the Dodd-Frank Act, known as the “Volcker Rule,” prohibits any bank, bank holding company, or affiliate (referred to collectively as “banking entities”) from engaging in two types of activities: “proprietary trading” and the ownership or sponsorship of private equity or hedge funds that are referred to as “covered funds.” Proprietary trading is, in general, trading in securities on a short-term basis for a banking entity's own account. Funds subject to the ownership and sponsorship prohibition are those not required to register with the SEC because they have only accredited investors or no more than 100 investors. In December 2013, our primary federal regulators, the Federal Reserve and the FDIC, together with other federal banking agencies, the SEC and the Commodity Futures Trading Commission, finalized a regulation to implement the Volcker Rule. At December 31, 2017, the Company has evaluated our securities portfolio and has determined that we do not hold any covered funds.
Tax Cuts and Jobs Act
On December 22, 2017, the Tax Cuts and Jobs Act (the “Tax Act”) was signed into law. The Tax Act includes a number of provisions that impact us, including the following:
| ● | Tax Rate. The Tax Act replaces the graduated corporate tax rates applicable under prior law, which imposed a maximum tax rate of 35%, with a reduced 21% flat tax rate. Although the reduced tax rate generally should be favorable to us by resulting in increased earnings and capital, it will decrease the value of our existing deferred tax assets. Generally accepted accounting principles ("GAAP") requires that the impact of the provisions of the Tax Act be accounted for in the period of enactment. Accordingly, the incremental income tax expense recorded by the Company in the fourth quarter of 2017 related to the Tax Act was $2.4 million, resulting primarily from a remeasurement of deferred tax assets of $17.4 million. |
| ● | Employee Compensation. A “publicly held corporation” is not permitted to deduct compensation in excess of $1 million per year paid to certain employees. The Tax Act eliminates certain exceptions to the $1 million limit applicable under prior to law related to performance-based compensation, such as equity grants and cash bonuses that are paid only on the attainment of performance goals. As a result, our ability to deduct certain compensation paid to our most highly compensated employees will now be limited. |
13
| ● | Business Asset Expensing. The Tax Act allows taxpayers immediately to expense the entire cost (instead of only 50%, as under prior law) of certain depreciable tangible property and real property improvements acquired and placed in service after September 27, 2017 and before January 1, 2023 (with an additional year for certain property). This 100% “bonus” depreciation is phased out proportionately for property placed in service on or after January 1, 2023 and before January 1, 2027 (with an additional year for certain property). |
| ● | Interest Expense. The Tax Act limits a taxpayer’s annual deduction of business interest expense to the sum of (i) business interest income and (ii) 30% of “adjusted taxable income,” defined as a business’s taxable income without taking into account business interest income or expense, net operating losses, and, for 2018 through 2021, depreciation, amortization and depletion. Because we generate significant amounts of net interest income, we do not expect to be impacted by this limitation. |
Proposed Legislation and Regulatory Action
From time to time, various legislative and regulatory initiatives are introduced in Congress and state legislatures, as well as by regulatory agencies. Such initiatives may include proposals to expand or contract the powers of bank holding companies and depository institutions or proposals to substantially change the financial institution regulatory system. Such legislation could change banking statutes and the operating environment of the Company in substantial and unpredictable ways. If enacted, such legislation could increase or decrease the cost of doing business, limit or expand permissible activities or affect the competitive balance among banks, savings associations, credit unions, and other financial institutions. We cannot predict whether any such legislation will be enacted, and, if enacted, the effect that it, or any implementing regulations, would have on the financial condition or results of operations of the Company. A change in statutes, regulations or regulatory policies applicable to the Company or the Bank could have a material effect on the business of the Company.
The Financial CHOICE Act of 2017
In June 2017, the U.S. House of Representatives passed the Financial CHOICE Act of 2017 (the “CHOICE Act”), which is intended to repeal or amend many of the provisions of the Dodd-Frank Act. The CHOICE Act contains a broad range of legislation that primarily affect larger banks. It also contains a range of provisions that would facilitate capital raising by community banks in both mutual and stock form, and simplify the regulation and examination of community banks and mutual holding companies.
Significant provisions of the CHOICE Act, as it relates to community banks, include the following: (i) a bank of any size that maintains a leverage capital ratio of at least 10% may elect to be regulated as a “qualifying banking organization,” and thereby would be exempt from laws and regulations that address capital and liquidity requirements, capital distributions to stockholders, and the enhanced prudential standards of the Dodd-Frank Act including mandatory stress testing, resolution plans and short-term debt and leverage limit requirements, as well as other laws and regulations. Qualifying banking organizations would also be considered “well capitalized” for purposes of the prompt corrective action rules, restrictions on brokered deposits, restrictions on interstate branching and merger transactions, and other laws and regulations; (ii) the small bank holding company exemption would be increased from $1.0 billion to $10.0 billion; (iii) mutual and stock federal savings banks would be able to elect to exercise the same powers as national banks without converting charters; and (iv) the establishment of a safe-harbor from “ability to repay” requirements for mortgage loans held by a depository institution since their origination.
With respect to SEC and corporate governance compliance, the CHOICE Act reverses a number of changes required by the Dodd-Frank Act. These include: prohibiting universal proxy ballots in proxy contests; modernizing stockholder proposal thresholds; repealing the requirement that publicly traded companies disclose the ratio of median employee versus chief executive officer pay; and increasing the exemption from complying with an outside auditor’s attestation of a company’s internal financial controls to issuers with market capitalizations of up to $500 million.
Management believes that, if enacted, the CHOICE Act would provide substantial benefits to community banks and their holding companies. There can be no assurance, however, that the CHOICE Act or any of its provisions, will be enacted into law.
Southern First Bancshares, Inc.
We own 100% of the outstanding capital stock of the Bank, and therefore we are considered to be a bank holding company under the federal Bank Holding Company Act of 1956 (the “Bank Holding Company Act”). As a result, we are primarily subject to the supervision, examination and reporting requirements of the Federal Reserve under the Bank Holding Company Act and its regulations promulgated thereunder. Moreover, as a bank holding company of a bank located in South Carolina, we also are subject to the South Carolina Banking and Branching Efficiency Act.
14
Permitted Activities. Under the Bank Holding Company Act, a bank holding company is generally permitted to engage in, or acquire direct or indirect control of more than 5% of the voting shares of any company engaged in, the following activities:
| ● |
banking or managing or controlling banks; |
| ● | furnishing services to or performing services for our subsidiaries; and |
| ● | any activity that the Federal Reserve determines to be so closely related to banking as to be a proper incident to the business of banking. |
Activities that the Federal Reserve has found to be so closely related to banking as to be a proper incident to the business of banking include:
| ● | factoring accounts receivable; |
| ● | making, acquiring, brokering or servicing loans and usual related activities; |
| ● | leasing personal or real property; |
| ● | operating a non-bank depository institution, such as a savings association; |
| ● | trust company functions; |
| ● | financial and investment advisory activities; |
| ● | conducting discount securities brokerage activities; |
| ● | underwriting and dealing in government obligations and money market instruments; |
| ● | providing specified management consulting and counseling activities; |
| ● | performing selected data processing services and support services; |
| ● | acting as agent or broker in selling credit life insurance and other types of insurance in connection with credit transactions; and |
| ● | performing selected insurance underwriting activities. |
As a bank holding company we also can elect to be treated as a “financial holding company,” which would allow us to engage in a broader array of activities. In summary, a financial holding company can engage in activities that are financial in nature or incidental or complimentary to financial activities, including insurance underwriting, sales and brokerage activities, providing financial and investment advisory services, underwriting services and limited merchant banking activities. We have not sought financial holding company status, but may elect such status in the future as our business matures. If we were to elect financial holding company status, each insured depository institution we control would have to be well capitalized, well managed and have at least a satisfactory rating under the Community Reinvestment Act as discussed below.
The Federal Reserve has the authority to order a bank holding company or its subsidiaries to terminate any of these activities or to terminate its ownership or control of any subsidiary when it has reasonable cause to believe that the Bank holding company’s continued ownership, activity or control constitutes a serious risk to the financial safety, soundness or stability of it or any of its bank subsidiaries.
Change in Control. Two statutes, the Bank Holding Company Act and the Change in Bank Control Act, together with regulations promulgated under them, require some form of regulatory review before any company may acquire “control” of a bank or a bank holding company. Under the Bank Holding Company Act, control is deemed to exist if a company acquires 25% or more of any class of voting securities of a bank holding company; controls the election of a majority of the members of the board of directors; or exercises a controlling influence over the management or policies of a bank or bank holding company. In guidance issued in 2008, the Federal Reserve has stated that it would not expect control to exist if a person acquires, in aggregate, less than 33% of the total equity of a bank or bank holding company (voting and nonvoting equity), provided such person’s ownership does not include 15% or more of any class of voting securities. Prior Federal Reserve approval is necessary before an entity acquires sufficient control to become a bank holding company. Natural persons, certain non-business trusts, and other entities are not treated as companies (or bank holding companies), and their acquisitions are not subject to review under the Bank Holding Company Act. State laws generally, including South Carolina law, require state approval before an acquirer may become the holding company of a state bank.
Under the Change in Bank Control Act, a person or company is required to file a notice with the Federal Reserve if it will, as a result of the transaction, own or control 10% or more of any class of voting securities or direct the management or policies of a bank or bank holding company and either if the bank or bank holding company has registered securities or if the acquirer would be the largest holder of that class of voting securities after the acquisition. For a change in control at the holding company level, both the Federal Reserve and the subsidiary bank's primary federal regulator must approve the change in control; at the bank level, only the bank's primary federal regulator is involved. Transactions subject to the Bank Holding Company Act are exempt from Change in Control Act requirements. For state banks, state laws, including that of South Carolina, typically require approval by the state bank regulator as well.
15
Source of Strength. There are a number of obligations and restrictions imposed by law and regulatory policy on bank holding companies with regard to their depository institution subsidiaries that are designed to minimize potential loss to depositors and to the FDIC insurance funds in the event that the depository institution becomes in danger of defaulting under its obligations to repay deposits. Under a policy of the Federal Reserve, a bank holding company is required to serve as a source of financial strength to its subsidiary depository institutions and to commit resources to support such institutions in circumstances where it might not do so absent such policy. Under the Federal Deposit Insurance Corporation Improvement Act of 1991, to avoid receivership of its insured depository institution subsidiary, a bank holding company is required to guarantee the compliance of any insured depository institution subsidiary that may become “undercapitalized” within the terms of any capital restoration plan filed by such subsidiary with its appropriate federal banking agency up to the lesser of (i) an amount equal to 5% of the institution’s total assets at the time the institution became undercapitalized, or (ii) the amount which is necessary (or would have been necessary) to bring the institution into compliance with all applicable capital standards as of the time the institution fails to comply with such capital restoration plan.
The Federal Reserve also has the authority under the Bank Holding Company Act to require a bank holding company to terminate any activity or relinquish control of a nonbank subsidiary (other than a nonbank subsidiary of a bank) upon the Federal Reserve's determination that such activity or control constitutes a serious risk to the financial soundness or stability of any subsidiary depository institution of the bank holding company. Further, federal law grants federal bank regulatory authorities’ additional discretion to require a bank holding company to divest itself of any bank or nonbank subsidiary if the agency determines that divestiture may aid the depository institution's financial condition.
In addition, the “cross guarantee” provisions of the Federal Deposit Insurance Act (the “FDIA”) require insured depository institutions under common control to reimburse the FDIC for any loss suffered or reasonably anticipated by the FDIC as a result of the default of a commonly controlled insured depository institution or for any assistance provided by the FDIC to a commonly controlled insured depository institution in danger of default. The FDIC’s claim for damages is superior to claims of shareholders of the insured depository institution or its holding company, but is subordinate to claims of depositors, secured creditors and holders of subordinated debt (other than affiliates) of the commonly controlled insured depository institutions.
The FDIA also provides that amounts received from the liquidation or other resolution of any insured depository institution by any receiver must be distributed (after payment of secured claims) to pay the deposit liabilities of the institution prior to payment of any other general or unsecured senior liability, subordinated liability, general creditor or shareholder. This provision would give depositors a preference over general and subordinated creditors and shareholders in the event a receiver is appointed to distribute the assets of our Bank.
Any capital loans by a bank holding company to any of its subsidiary banks are subordinate in right of payment to deposits and to certain other indebtedness of such subsidiary bank. In the event of a bank holding company’s bankruptcy, any commitment by the bank holding company to a federal bank regulatory agency to maintain the capital of a subsidiary bank will be assumed by the bankruptcy trustee and entitled to a priority of payment.
Capital Requirements. The Federal Reserve imposes certain capital requirements on the bank holding company under the Bank Holding Company Act, including a minimum leverage ratio and a minimum ratio of “qualifying” capital to risk-weighted assets. These requirements are described below under “Southern First Bank - Capital Regulations.” Subject to our capital requirements and certain other restrictions, we are able to borrow money to make capital contributions to the Bank, and these loans may be repaid from dividends paid from the Bank to the Company.
We are also able to raise capital for contribution to the Bank by issuing securities without having to receive regulatory approval, subject to compliance with federal and state securities laws.
Dividends. Since the Company is a bank holding company, its ability to declare and pay dividends is dependent on certain federal and state regulatory considerations, including the guidelines of the Federal Reserve. The Federal Reserve has issued a policy statement regarding the payment of dividends by bank holding companies. In general, the Federal Reserve’s policies provide that dividends should be paid only out of current earnings and only if the prospective rate of earnings retention by the bank holding company appears consistent with the organization’s capital needs, asset quality and overall financial condition. The Federal Reserve’s policies also require that a bank holding company serve as a source of financial strength to its subsidiary banks by standing ready to use available resources to provide adequate capital funds to those banks during periods of financial stress or adversity and by maintaining the financial flexibility and capital-raising capacity to obtain additional resources for assisting its subsidiary banks where necessary. Further, under the prompt corrective action regulations, the ability of a bank holding company to pay dividends may be restricted if a subsidiary bank becomes undercapitalized. These regulatory policies could affect the ability of the Company to pay dividends or otherwise engage in capital distributions.
16
In addition, since the Company is a legal entity separate and distinct from the Bank and does not conduct stand-alone operations, its ability to pay dividends depends on the ability of the Bank to pay dividends to it, which is also subject to regulatory restrictions as described below in “Southern First Bank – Dividends.”
South Carolina State Regulation. As a South Carolina bank holding company under the South Carolina Banking and Branching Efficiency Act, we are subject to limitations on sale or merger and to regulation by the South Carolina Board of Financial Institutions (the “S.C. Board”). We are not required to obtain the approval of the S.C. Board prior to acquiring the capital stock of a national bank, but we must notify them at least 15 days prior to doing so. We must receive the S.C. Board’s approval prior to engaging in the acquisition of a South Carolina state chartered bank or another South Carolina bank holding company.
Southern First Bank
As a South Carolina bank, deposits in the Bank are insured by the FDIC up to a maximum amount, which is currently $250,000 per depositor. The S.C. Board and the FDIC regulate or monitor virtually all areas of the Bank’s operations, including;
| ● | security devices and procedures; |
| ● | adequacy of capitalization and loss reserves; |
| ● | loans; |
| ● | investments; |
| ● | borrowings; |
| ● | deposits; |
| ● | mergers; |
| ● | issuances of securities; |
| ● | payment of dividends; |
| ● | interest rates payable on deposits; |
| ● | interest rates or fees chargeable on loans; |
| ● | establishment of branches; |
| ● | corporate reorganizations; |
| ● | maintenance of books and records; and |
| ● | adequacy of staff training to carry on safe lending and deposit gathering practices. |
These agencies, and the federal and state laws applicable to the Bank’s operations, extensively regulate various aspects of our banking business, including, among other things, permissible types and amounts of loans, investments and other activities, capital adequacy, branching, interest rates on loans and on deposits, the maintenance of reserves on demand deposit liabilities, and the safety and soundness of our banking practices.
All insured institutions must undergo regular on-site examinations by their appropriate banking agency. The cost of examinations of insured depository institutions and any affiliates may be assessed by the appropriate federal banking agency against each institution or affiliate as it deems necessary or appropriate. Insured institutions are required to submit annual reports to the FDIC, their federal regulatory agency, and state supervisor when applicable. The FDIC has developed a method for insured depository institutions to provide supplemental disclosure of the estimated fair market value of assets and liabilities, to the extent feasible and practicable, in any balance sheet, financial statement, report of condition or any other report of any insured depository institution. The FDIC and the other federal banking regulatory agencies also have issued standards for all insured depository institutions relating, among other things, to the following:
| ● | internal controls; |
| ● | information systems and audit systems; |
| ● | loan documentation; |
| ● | credit underwriting; |
| ● | interest rate risk exposure; and |
| ● | asset quality. |
17
Prompt Corrective Action. As an insured depository institution, the Bank is required to comply with the capital requirements promulgated under the Federal Deposit Insurance Act and the prompt corrective action regulations thereunder, which set forth five capital categories, each with specific regulatory consequences. Under these regulations, the categories are:
| ● |
Well Capitalized — The institution exceeds the required minimum level for each relevant capital measure. A well capitalized institution (i) has a total risk-based capital ratio of 10% or greater, (ii) has a Tier 1 risk-based capital ratio of 8% or greater, (iii) has a common equity Tier 1 risk-based capital ratio of 6.5% or greater, (iv) has a leverage capital ratio of 5% or greater, and (v) is not subject to any order or written directive to meet and maintain a specific capital level for any capital measure. |
| ● |
Adequately Capitalized — The institution meets the required minimum level for each relevant capital measure. No capital distribution may be made that would result in the institution becoming undercapitalized. An adequately capitalized institution (i) has a total risk-based capital ratio of 8% or greater, (ii) has a Tier 1 risk-based capital ratio of 6% or greater, (iii) has a common equity Tier 1 risk-based capital ratio of 4.5% or greater, and (iv) has a leverage capital ratio of 4% or greater. |
| ● | Undercapitalized — The institution fails to meet the required minimum level for any relevant capital measure. An undercapitalized institution (i) has a total risk-based capital ratio of less than 8%, (ii) has a Tier 1 risk-based capital ratio of less than 6%, (iii) has a common equity Tier 1 risk-based capital ratio of less than 4.5% or greater, or (iv) has a leverage capital ratio of less than 4%. |
| ● | Significantly Undercapitalized — The institution is significantly below the required minimum level for any relevant capital measure. A significantly undercapitalized institution (i) has a total risk-based capital ratio of less than 6%, (ii) has a Tier 1 risk-based capital ratio of less than 4%, (iii) has a common equity Tier 1 risk-based capital ratio of less than 3% or greater, or (iv) has a leverage capital ratio of less than 3%. |
| ● | Critically Undercapitalized — The institution fails to meet a critical capital level set by the appropriate federal banking agency. A critically undercapitalized institution has a ratio of tangible equity to total assets that is equal to or less than 2%. |
If the FDIC determines, after notice and an opportunity for hearing, that the Bank is in an unsafe or unsound condition, the regulator is authorized to reclassify the Bank to the next lower capital category (other than critically undercapitalized) and require the submission of a plan to correct the unsafe or unsound condition.
If a bank is not well capitalized, it cannot accept brokered deposits without prior regulatory approval. In addition, a bank that is not well capitalized cannot offer an effective yield in excess of 75 basis points over interest paid on deposits of comparable size and maturity in such institution’s normal market area for deposits accepted from within its normal market area, or national rate paid on deposits of comparable size and maturity for deposits accepted outside the bank’s normal market area. Moreover, the FDIC generally prohibits a depository institution from making any capital distributions (including payment of a dividend) or paying any management fee to its parent holding company if the depository institution would thereafter be categorized as undercapitalized. Undercapitalized institutions are subject to growth limitations (an undercapitalized institution may not acquire another institution, establish additional branch offices or engage in any new line of business unless determined by the appropriate federal banking agency to be consistent with an accepted capital restoration plan, or unless the FDIC determines that the proposed action will further the purpose of prompt corrective action) and are required to submit a capital restoration plan. The agencies may not accept a capital restoration plan without determining, among other things, that the plan is based on realistic assumptions and is likely to succeed in restoring the depository institution’s capital. In addition, for a capital restoration plan to be acceptable, the depository institution’s parent holding company must guarantee that the institution will comply with the capital restoration plan. The aggregate liability of the parent holding company is limited to the lesser of an amount equal to 5.0% of the depository institution’s total assets at the time it became categorized as undercapitalized or the amount that is necessary (or would have been necessary) to bring the institution into compliance with all capital standards applicable with respect to such institution as of the time it fails to comply with the plan. If a depository institution fails to submit an acceptable plan, it is categorized as significantly undercapitalized.
Significantly undercapitalized categorized depository institutions may be subject to a number of requirements and restrictions, including orders to sell sufficient voting stock to become categorized as adequately capitalized, requirements to reduce total assets, and cessation of receipt of deposits from correspondent banks. The appropriate federal banking agency may take any action authorized for a significantly undercapitalized institution if an undercapitalized institution fails to submit an acceptable capital restoration plan or fails in any material respect to implement a plan accepted by the agency. A critically undercapitalized institution is subject to having a receiver or conservator appointed to manage its affairs and for loss of its charter to conduct banking activities.
18
An insured depository institution may not pay a management fee to a bank holding company controlling that institution or any other person having control of the institution if, after making the payment, the institution would be undercapitalized. In addition, an institution cannot make a capital distribution, such as a dividend or other distribution, that is in substance a distribution of capital to the owners of the institution if following such a distribution the institution would be undercapitalized. Thus, if payment of such a management fee or the making of such would cause a bank to become undercapitalized, it could not pay a management fee or dividend to the bank holding company.
As of December 31, 2017, the Bank was deemed to be “well capitalized.”
Standards for Safety and Soundness. The FDIA also requires the federal banking regulatory agencies to prescribe, by regulation or guideline, operational and managerial standards for all insured depository institutions relating to: (i) internal controls, information systems and internal audit systems; (ii) loan documentation; (iii) credit underwriting; (iv) interest rate risk exposure; and (v) asset growth. The agencies also must prescribe standards for asset quality, earnings, and stock valuation, as well as standards for compensation, fees and benefits. The federal banking agencies have adopted regulations and Interagency Guidelines Prescribing Standards for Safety and Soundness to implement these required standards. These guidelines set forth the safety and soundness standards that the federal banking agencies use to identify and address problems at insured depository institutions before capital becomes impaired. Under the regulations, if the FDIC determines that the Bank fails to meet any standards prescribed by the guidelines, the agency may require the Bank to submit to the agency an acceptable plan to achieve compliance with the standard, as required by the FDIC. The final regulations establish deadlines for the submission and review of such safety and soundness compliance plans.
Insurance of Accounts and Regulation by the FDIC. The Bank’s deposits are insured up to applicable limits by the Deposit Insurance Fund of the FDIC. As insurer, the FDIC imposes deposit insurance premiums and is authorized to conduct examinations of and to require reporting by FDIC insured institutions. It also may prohibit any FDIC insured institution from engaging in any activity the FDIC determines by regulation or order to pose a serious risk to the insurance fund. The FDIC also has the authority to initiate enforcement actions against savings institutions, after giving the bank’s regulatory authority an opportunity to take such action, and may terminate the deposit insurance if it determines that the institution has engaged in unsafe or unsound practices or is in an unsafe or unsound condition.
As an FDIC-insured bank, the Bank must pay deposit insurance assessments to the FDIC based on its average total assets minus its average tangible equity. The Bank’s assessment rates are currently based on its risk classification (i.e., the level of risk it poses to the FDIC’s deposit insurance fund). Institutions classified as higher risk pay assessments at higher rates than institutions that pose a lower risk. In addition, following the fourth consecutive quarter (and any applicable phase-in period) where an institution’s total consolidated assets equal or exceed $10 billion, the FDIC will use a performance score and a loss-severity score to calculate an initial assessment rate. In calculating these scores, the FDIC uses an institution’s capital level and regulatory supervisory ratings and certain financial measures to assess an institution’s ability to withstand asset-related stress and funding-related stress. The FDIC also has the ability to make discretionary adjustments to the total score based upon significant risk factors that are not adequately captured in the calculations. In addition to ordinary assessments described above, the FDIC has the ability to impose special assessments in certain instances.
The FDIC’s deposit insurance fund is currently underfunded, and the FDIC has raised assessment rates and imposed special assessments on certain institutions during recent years to raise funds. Under the Dodd-Frank Act, the minimum designated reserve ratio for the deposit insurance fund is 1.35% of the estimated total amount of insured deposits. In October 2010, the FDIC adopted a restoration plan to ensure that the fund reserve ratio reaches 1.35% by September 30, 2020, as required by the Dodd-Frank Act. At least semi-annually, the FDIC will update its loss and income projections for the fund and, if needed, will increase or decrease assessment rates, following notice-and-comment rulemaking if required.
In addition, FDIC insured institutions are required to pay a Financing Corporation assessment to fund the interest on bonds issued to resolve thrift failures in the 1980s. These assessments, which may be revised based upon the level of deposits, will continue until the bonds mature in the years 2017 through 2019. The amount assessed on individual institutions is in addition to the amount, if any, paid for deposit insurance according to the FDIC’s risk-related assessment rate schedules. Assessment rates may be adjusted quarterly to reflect changes in the assessment base.
The FDIC may terminate the deposit insurance of any insured depository institution, including the Bank, if it determines after a hearing that the institution has engaged in unsafe or unsound practices, is in an unsafe or unsound condition to continue operations or has violated any applicable law, regulation, rule, order or condition imposed by the FDIC. It also may suspend deposit insurance temporarily during the hearing process for the permanent termination of insurance if the institution has no tangible capital. If insurance of accounts is terminated, the accounts at the institution at the time of the termination, less subsequent withdrawals, shall continue to be insured for a period of six months to two years, as determined by the FDIC. Management is not aware of any practice, condition or violation that might lead to termination of the Bank’s deposit insurance.
19
Transactions with Affiliates and Insiders. The Company is a legal entity separate and distinct from the Bank and its other subsidiaries. Various legal limitations restrict the Bank from lending or otherwise supplying funds to the Company or its non-bank subsidiaries. The Company and the Bank are subject to Sections 23A and 23B of the Federal Reserve Act and Federal Reserve Regulation W.
Section 23A of the Federal Reserve Act places limits on the amount of loans or extensions of credit by a bank to any affiliate, including its holding company, and on a bank’s investments in, or certain other transactions with, affiliates and on the amount of advances to third parties collateralized by the securities or obligations of any affiliates of the bank. Section 23A also applies to derivative transactions, repurchase agreements and securities lending and borrowing transactions that cause a bank to have credit exposure to an affiliate. The aggregate of all covered transactions is limited in amount, as to any one affiliate, to 10% of the Bank’s capital and surplus and, as to all affiliates combined, to 20% of the Bank’s capital and surplus. Furthermore, within the foregoing limitations as to amount, each covered transaction must meet specified collateral requirements. The Bank is forbidden to purchase low quality assets from an affiliate.
Section 23B of the Federal Reserve Act, among other things, prohibits an institution from engaging in certain transactions with certain affiliates unless the transactions are on terms substantially the same, or at least as favorable to such institution or its subsidiaries, as those prevailing at the time for comparable transactions with nonaffiliated companies. If there are no comparable transactions, a bank’s (or one of its subsidiaries’) affiliate transaction must be on terms and under circumstances, including credit standards, that in good faith would be offered to, or would apply to, nonaffiliated companies. These requirements apply to all transactions subject to Section 23A as well as to certain other transactions.
The affiliates of a bank include any holding company of the bank, any other company under common control with the bank (including any company controlled by the same shareholders who control the bank), any subsidiary of the bank that is itself a bank, any company in which the majority of the directors or trustees also constitute a majority of the directors or trustees of the bank or holding company of the bank, any company sponsored and advised on a contractual basis by the bank or an affiliate, and any mutual fund advised by a bank or any of the bank’s affiliates. Regulation W generally excludes all non-bank and non-savings association subsidiaries of banks from treatment as affiliates, except to the extent that the Federal Reserve decides to treat these subsidiaries as affiliates.
The Bank is also subject to certain restrictions on extensions of credit to executive officers, directors, certain principal stockholders, and their related interests. Extensions of credit include derivative transactions, repurchase and reverse repurchase agreements, and securities borrowing and lending transactions to the extent that such transactions cause a bank to have credit exposure to an insider. Any extension of credit to an insider (i) must be made on substantially the same terms, including interest rates and collateral requirements, as those prevailing at the time for comparable transactions with unrelated third parties and (ii) must not involve more than the normal risk of repayment or present other unfavorable features.
Dividends. The Company’s principal source of cash flow, including cash flow to pay dividends to its shareholders, is dividends it receives from the Bank. Statutory and regulatory limitations apply to the Bank’s payment of dividends to the Company. As a South Carolina chartered bank, the Bank is subject to limitations on the amount of dividends that it is permitted to pay. Unless otherwise instructed by the S.C. Board, the Bank is generally permitted under South Carolina state banking regulations to pay cash dividends of up to 100% of net income in any calendar year without obtaining the prior approval of the S.C. Board. The FDIC also has the authority under federal law to enjoin a bank from engaging in what in its opinion constitutes an unsafe or unsound practice in conducting its business, including the payment of a dividend under certain circumstances.
Branching. Under current South Carolina law, the Bank may open branch offices throughout South Carolina with the prior approval of the S.C. Board. In addition, with prior regulatory approval, the Bank is able to acquire existing banking operations in South Carolina. Furthermore, federal legislation permits interstate branching, including out-of-state acquisitions by bank holding companies, interstate branching by banks, and interstate merging by banks. The Dodd-Frank Act removes previous state law restrictions on de novo interstate branching in states such as South Carolina. This change permits out-of-state banks to open de novo branches in states where the laws of the state where the de novo branch to be opened would permit a bank chartered by that state to open a de novo branch.
20
Community Reinvestment Act. The Community Reinvestment Act (“CRA”) requires that the FDIC evaluate the record of the Bank in meeting the credit needs of its local community, including low and moderate income neighborhoods. These factors are also considered in evaluating mergers, acquisitions, and applications to open a branch or facility. Failure to adequately meet these criteria could impose additional requirements and limitations on our Bank.
The Gramm Leach Bliley Act (the “GLBA”) made various changes to the CRA. Among other changes, CRA agreements with private parties must be disclosed and annual CRA reports must be made available to a bank’s primary federal regulator. A bank holding company will not be permitted to become a financial holding company and no new activities authorized under the GLBA may be commenced by a holding company or by a bank financial subsidiary if any of its bank subsidiaries received less than a satisfactory CRA rating in its latest CRA examination.
On March 16, 2015, the date of the most recent examination report, the Bank received a satisfactory CRA rating.
Consumer Protection Regulations. Activities of the Bank are subject to a variety of statutes and regulations designed to protect consumers. Interest and other charges collected or contracted for by the Bank are subject to state usury laws and federal laws concerning interest rates. The Bank’s loan operations are also subject to federal laws applicable to credit transactions, such as:
| ● | the Truth-In-Lending Act, governing disclosures of credit terms to consumer borrowers; |
| ● | the Home Mortgage Disclosure Act of 1975, requiring financial institutions to provide information to enable the public and public officials to determine whether a financial institution is fulfilling its obligation to help meet the housing needs of the community it serves; |
| ● | the Equal Credit Opportunity Act, prohibiting discrimination on the basis of race, creed or other prohibited factors in extending credit; |
| ● | the Fair Credit Reporting Act of 1978, as amended by the Fair and Accurate Credit Transactions Act, governing the use and provision of information to credit reporting agencies, certain identity theft protections, and certain credit and other disclosures; |
| ● | the Fair Debt Collection Act, governing the manner in which consumer debts may be collected by collection agencies; and |
| ● | the rules and regulations of the various federal agencies charged with the responsibility of implementing such federal laws. |
The deposit operations of the Bank also are subject to:
| ● |
the Federal Deposit Insurance Act, which, among other things, limits the amount of deposit insurance available per account to $250,000 and imposes other limits on deposit-taking; |
| ● | the Right to Financial Privacy Act, which imposes a duty to maintain confidentiality of consumer financial records and prescribes procedures for complying with administrative subpoenas of financial records; |
| ● | the Electronic Funds Transfer Act and Regulation E, which governs automatic deposits to and withdrawals from deposit accounts and customers’ rights and liabilities arising from the use of automated teller machines and other electronic banking services; and |
| ● | the Truth in Savings Act and Regulation DD, which requires depository institutions to provide disclosures so that consumers can make meaningful comparisons about depository institutions and accounts. |
Anti-Money Laundering. Financial institutions must maintain anti-money laundering programs that include established internal policies, procedures, and controls; a designated compliance officer; an ongoing employee training program; and testing of the program by an independent audit function. The Company and the Bank are also prohibited from entering into specified financial transactions and account relationships and must meet enhanced standards for due diligence and “knowing your customer” in their dealings with foreign financial institutions and foreign customers. Financial institutions must take reasonable steps to conduct enhanced scrutiny of account relationships to guard against money laundering and to report any suspicious transactions, and recent laws provide law enforcement authorities with increased access to financial information maintained by banks. Anti-money laundering obligations have been substantially strengthened as a result of the Uniting and Strengthening America by Providing Appropriate Tools Required to Intercept and Obstruct Terrorism Act of 2001 (which we refer to as the “USA PATRIOT Act”), enacted in 2001 and renewed through 2019. Bank regulators routinely examine institutions for compliance with these obligations and are required to consider compliance in connection with the regulatory review of applications. The regulatory authorities have been active in imposing “cease and desist” orders and money penalty sanctions against institutions that have not complied with these requirements.
21
USA PATRIOT Act. The USA PATRIOT Act became effective on October 26, 2001, amended, in part, the Bank Secrecy Act and provides, in part, for the facilitation of information sharing among governmental entities and financial institutions for the purpose of combating terrorism and money laundering by enhancing anti-money laundering and financial transparency laws, as well as enhanced information collection tools and enforcement mechanics for the U.S. government, including: (i) requiring standards for verifying customer identification at account opening; (ii) rules to promote cooperation among financial institutions, regulators, and law enforcement entities in identifying parties that may be involved in terrorism or money laundering; (iii) reports by nonfinancial trades and businesses filed with the Treasury Department’s Financial Crimes Enforcement Network for transactions exceeding $10,000; and (iv) filing suspicious activities reports by brokers and dealers if they believe a customer may be violating U.S. laws and regulations and requires enhanced due diligence requirements for financial institutions that administer, maintain, or manage private bank accounts or correspondent accounts for non-U.S. persons. Bank regulators routinely examine institutions for compliance with these obligations and are required to consider compliance in connection with the regulatory review of applications.
Under the USA PATRIOT Act, the Federal Bureau of Investigation (“FBI”) can send our banking regulatory agencies lists of the names of persons suspected of involvement in terrorist activities. The Bank can be requested, to search its records for any relationships or transactions with persons on those lists. If the Bank finds any relationships or transactions, it must file a suspicious activity report and contact the FBI.
The Office of Foreign Assets Control (“OFAC”), which is a division of the U.S. Treasury, is responsible for helping to insure that U.S. entities do not engage in transactions with “enemies” of the U.S., as defined by various Executive Orders and Acts of Congress. OFAC has sent, and will send, our banking regulatory agencies lists of names of persons and organizations suspected of aiding, harboring or engaging in terrorist acts. If the Bank finds a name on any transaction, account or wire transfer that is on an OFAC list, it must freeze such account, file a suspicious activity report and notify the FBI. The Bank has appointed an OFAC compliance officer to oversee the inspection of its accounts and the filing of any notifications. The Bank actively checks high-risk OFAC areas such as new accounts, wire transfers and customer files. The Bank performs these checks utilizing software, which is updated each time a modification is made to the lists provided by OFAC and other agencies of Specially Designated Nationals and Blocked Persons.
Privacy, Data Security and Credit Reporting. Financial institutions are required to disclose their policies for collecting and protecting confidential information. Customers generally may prevent financial institutions from sharing nonpublic personal financial information with nonaffiliated third parties except under narrow circumstances, such as the processing of transactions requested by the consumer. Additionally, financial institutions generally may not disclose consumer account numbers to any nonaffiliated third party for use in telemarketing, direct mail marketing or other marketing to consumers. It is the Bank’s policy not to disclose any personal information unless required by law.
Recent cyber attacks against banks and other institutions that resulted in unauthorized access to confidential customer information have prompted the Federal banking agencies to issue several warnings and extensive guidance on cyber security. The agencies are likely to devote more resources to this part of their safety and soundness examination than they have in the past.
In addition, pursuant to the Fair and Accurate Credit Transactions Act of 2003 (the “FACT Act”) and the implementing regulations of the federal banking agencies and Federal Trade Commission, the Bank is required to have in place an “identity theft red flags” program to detect, prevent and mitigate identity theft. The Bank has implemented an identity theft red flags program designed to meet the requirements of the FACT Act and the joint final rules. Additionally, the FACT Act amends the Fair Credit Reporting Act to generally prohibit a person from using information received from an affiliate to make a solicitation for marketing purposes to a consumer, unless the consumer is given notice and a reasonable opportunity and a reasonable and simple method to opt out of the making of such solicitations.
Federal Home Loan Bank System. The Bank is a member of the Federal Home Loan Bank ("FHLB") of Atlanta, which is one of 12 regional FHLBs that administer home financing credit for depository institutions. Each FHLB serves as a reserve or central bank for its members within its assigned region. It is funded primarily from proceeds derived from the sale of consolidated obligations of the FHLB System. It makes loans or advances to members in accordance with policies and procedures established by the Board of Directors of the FHLB, which are subject to the oversight of the Federal Housing Financing Board. All advances from the FHLB, which are subject to the oversight of the Federal Housing Finance Board. All advances from the FHLB are required to be fully secured by sufficient collateral as determined by the FHLB.
22
Effect of Governmental Monetary Policies. Our earnings are affected by domestic economic conditions and the monetary and fiscal policies of the U.S. government and its agencies. The Federal Reserve’s monetary policies have had, and are likely to continue to have, an important impact on the operating results of commercial banks through its power to implement national monetary policy in order, among other things, to curb inflation or combat a recession. The monetary policies of the Federal Reserve have major effects upon the levels of bank loans, investments and deposits through its open market operations in U.S. government securities and through its regulation of the discount rate on borrowings of member banks and the reserve requirements against member bank deposits. It is not possible to predict the nature or impact of future changes in monetary and fiscal policies. On March 15, 2017, June 14, 2017 and December 13, 2017, the Federal Open Market Committee raised the federal funds target rate by 25 basis points, as expected from the previous year. Further increases may occur in 2018, but, if so, there is no announced timetable.
Incentive Compensation. The Dodd-Frank Act requires the federal bank regulators and the SEC to establish joint regulations or guidelines prohibiting incentive-based payment arrangements at specified regulated entities having at least $1 billion in total assets that encourage inappropriate risks by providing an executive officer, employee, director or principal stockholder with excessive compensation, fees, or benefits or that could lead to material financial loss to the entity. In addition, these regulators must establish regulations or guidelines requiring enhanced disclosure to regulators of incentive-based compensation arrangements. The agencies proposed such regulations in April 2011. However, the 2011 proposal was replaced with a new proposal in May 2016, which makes explicit that the involvement of risk management and control personnel includes not only compliance, risk management and internal audit, but also legal, human resources, accounting, financial reporting and finance roles responsible for identifying, measuring, monitoring or controlling risk-taking. A final rule had not been adopted as of December 31, 2017.
In June 2010, the Federal Reserve, the FDIC and the Office of the Comptroller of the Currency issued a comprehensive final guidance on incentive compensation policies intended to ensure that the incentive compensation policies of banking organizations do not undermine the safety and soundness of such organizations by encouraging excessive risk-taking. The guidance, which covers all employees that have the ability to materially affect the risk profile of an organization, either individually or as part of a group, is based upon the key principles that a banking organization’s incentive compensation arrangements should (i) provide incentives that do not encourage risk-taking beyond the organization’s ability to effectively identify and manage risks, (ii) be compatible with effective internal controls and risk management, and (iii) be supported by strong corporate governance, including active and effective oversight by the organization’s board of directors.
The Federal Reserve will review, as part of the regular, risk-focused examination process, the incentive compensation arrangements of banking organizations, such as the Company, that are not “large, complex banking organizations.” These reviews will be tailored to each organization based on the scope and complexity of the organization’s activities and the prevalence of incentive compensation arrangements. The findings of the supervisory initiatives will be included in reports of examination. Deficiencies will be incorporated into the organization’s supervisory ratings, which can affect the organization’s ability to make acquisitions and take other actions. Enforcement actions may be taken against a banking organization if its incentive compensation arrangements, or related risk-management control or governance processes, pose a risk to the organization’s safety and soundness and the organization is not taking prompt and effective measures to correct the deficiencies.
The Dodd-Frank Act required the federal banking agencies, the SEC, and certain other federal agencies to jointly issue a regulation on incentive compensation. The agencies proposed such a rule in 2011, which reflected the 2010 guidance. However, the 2011 proposal was replaced with a new proposal rule in May 2016, which makes explicit that the involvement of risk management and control personnel includes not only compliance, risk management and internal audit, but also legal, human resources, accounting, financial reporting and finance roles responsible for identifying, measuring, monitoring or controlling risk-taking. A final rule had not been adopted as of December 31, 2017.
Concentrations in Commercial Real Estate. Concentration risk exists when FDIC-insured institutions deploy too many assets to any one industry or segment. A concentration in commercial real estate is one example of regulatory concern. The interagency Concentrations in Commercial Real Estate Lending, Sound Risk Management Practices guidance (“CRE Guidance”) provides supervisory criteria, including the following numerical indicators, to assist bank examiners in identifying banks with potentially significant commercial real estate loan concentrations that may warrant greater supervisory scrutiny: (i) commercial real estate loans exceeding 300% of capital and increasing 50% or more in the preceding three years or (ii) construction and land development loans exceeding 100% of capital. The CRE Guidance does not limit banks’ levels of commercial real estate lending activities, but rather guides institutions in developing risk management practices and levels of capital that are commensurate with the level and nature of their commercial real estate concentrations. On December 18, 2015, the federal banking agencies issued a statement to reinforce prudent risk-management practices related to commercial real estate lending, having observed substantial growth in many commercial real estate asset and lending markets, increased competitive pressures, rising commercial real estate concentrations in banks, and an easing of commercial real estate underwriting standards. The federal bank agencies reminded FDIC-insured institutions to maintain underwriting discipline and exercise prudent risk-management practices to identify, measure, monitor and manage the risks arising from commercial real estate lending. In addition, FDIC-insured institutions must maintain capital commensurate with the level and nature of their commercial real estate concentration risk.
23
Based on the Bank’s loan portfolio as of December 31, 2017, it did not exceed the 300% and 100% guidelines for commercial real estate loans. The Bank will continue to monitor it’s portfolio to manage this increased risk.
The following risk factors and other information included in this Annual Report on Form 10-K should be carefully considered. The risks and uncertainties described below are not the only ones we face. Additional risks and uncertainties not presently known to us or that we currently deem immaterial also may adversely impact our business operations. If any of the following risks occur, our business, financial condition, operating results, and cash flows could be materially adversely affected.
Risks Related to our Business
Liquidity needs could adversely affect our financial condition and results of operations.
Dividends from the Bank provide the primary source of funds for the Company. The primary sources of funds of the Bank are client deposits and loan repayments. While scheduled loan repayments are a relatively stable source of funds, they are subject to the ability of borrowers to repay the loans. The ability of borrowers to repay loans can be adversely affected by a number of factors, including changes in economic conditions, adverse trends or events affecting business industry groups, reductions in real estate values or markets, business closings or lay-offs, inclement weather, natural disasters and international instability.
Additionally, deposit levels may be affected by a number of factors, including rates paid by competitors, general interest rate levels, regulatory capital requirements, returns available to clients on alternative investments and general economic conditions. Accordingly, we may be required from time to time to rely on secondary sources of liquidity to meet withdrawal demands or otherwise fund operations. Such sources include proceeds from FHLB advances, sales of investment securities and loans, and federal funds lines of credit from correspondent banks, as well as out-of-market time deposits. While we believe that these sources are currently adequate, there can be no assurance they will be sufficient to meet future liquidity demands, particularly if we continue to grow and experience increasing loan demand. We may be required to slow or discontinue loan growth, capital expenditures or other investments or liquidate assets should such sources not be adequate.
The Company is a stand-alone entity with its own liquidity needs to service its debt or other obligations. Other than dividends from the Bank, the Company does not have additional means of generating liquidity without obtaining additional debt or equity funding. If we are unable to receive dividends from the Bank or obtain additional funding, we may be unable to pay our debt or other obligations.
Changes in prevailing interest rates may reduce our profitability.
Our results of operations depend in large part upon the level of our net interest income, which is the difference between interest income from interest-earning assets, such as loans and investment securities, and interest expense on interest-bearing liabilities, such as deposits and other borrowings. Depending on the terms and maturities of our assets and liabilities, a significant change in interest rates could have a material adverse effect on our profitability. Many factors cause changes in interest rates, including governmental monetary policies and domestic and international economic and political conditions. As of December 31, 2017, approximately 75% of our loan portfolio was in fixed rate loans, while only 25% was in variable rate loans. In a rising rate environment, the higher percentage of fixed rate loans could have an adverse effect on our profitability. While we intend to manage the effects of changes in interest rates by adjusting the terms, maturities, and pricing of our assets and liabilities, our efforts may not be effective and our financial condition and results of operations could suffer.
We may not be able to adequately anticipate and respond to changes in market interest rates.
We may be unable to anticipate changes in market interest rates, which are affected by many factors beyond our control including but not limited to inflation, recession, unemployment, money supply, monetary policy, and other changes that affect financial markets both domestic and foreign. Our net interest income is affected not only by the level and direction of interest rates, but also by the shape of the yield curve and relationships between interest sensitive instruments and key driver rates, as well as balance sheet growth, client loan and deposit preferences, and the timing of changes in these variables. In the event rates increase, our interest costs on liabilities may increase more rapidly than our income on interest earning assets, resulting in a deterioration of net interest margins. As such, fluctuations in interest rates could have significant adverse effects on our financial condition and results of operations.
24
In addition, our mortgage operations provide a portion of our noninterest income. We generate mortgage revenues primarily from gains on the sale of residential mortgage loans pursuant to programs currently offered by Fannie Mae, Ginnie Mae or Freddie Mac. In a rising or higher interest rate environment, our originations of mortgage loans may decrease, resulting in fewer loans that are available to be sold to investors, which would decrease mortgage revenues in noninterest income. In addition, our results of operations are affected by the amount of noninterest expenses associated with mortgage activities, such as salaries and employee benefits, other loan expense, and other costs. During periods of reduced loan demand, our results of operations may be adversely affected to the extent that we are unable to reduce expenses commensurate with the decline in loan originations.
Our business may be adversely affected by conditions in the financial markets and economic conditions generally.
Our financial performance generally, and in particular the ability of borrowers to pay interest on and repay principal of outstanding loans and the value of collateral securing those loans, as well as demand for loans and other products and services we offer, is highly dependent upon the business environment in the primary markets where we operate and in the U.S. as a whole. Unfavorable or uncertain economic and market conditions can be caused by declines in economic growth, business activity or investor or business confidence; limitations on the availability or increases in the cost of credit and capital; increases in inflation or interest rates; high unemployment, natural disasters; or a combination of these or other factors. While economic conditions in our local markets have improved since the end of the economic recession, economic growth has been slow and uneven and concerns still exist over the federal deficit, government spending, and economic risks. A return of recessionary conditions and/or negative developments in the domestic and international credit markets may significantly affect the markets in which we do business, the value of our loans and investments, and our ongoing operations, costs and profitability. Declines in real estate value and sales volumes and high unemployment levels may result in higher than expected loan delinquencies and a decline in demand for our products and services. These negative events may cause us to incur losses and may adversely affect our capital, liquidity, and financial condition.
Furthermore, the Federal Reserve, in an attempt to help the overall economy, has among other things, kept interest rates low through its targeted federal funds rate and the purchase of U.S. Treasury and mortgage-backed securities. The Federal Reserve increased the target range for the federal funds rate by 25 basis points in March, June and December 2017 and has indicated the potential for further gradual increases in the target rate depending on the economic outlook. As the federal funds rate increases, market interest rates will likely rise, which may negatively impact the housing markets and the U.S. economic recovery.
Our small- to medium-sized business target markets may have fewer financial resources to weather a downturn in the economy.
We target the banking and financial services needs of small- and medium-sized businesses. These businesses generally have fewer financial resources in terms of capital borrowing capacity than larger entities. If general economic conditions negatively affect these businesses in the markets in which we operate, our business, financial condition, and results of operations may be adversely affected.
Competition with other financial institutions may have an adverse effect on our ability to retain and grow our client base, which could have a negative effect on our financial condition or results of operations.
The banking and financial services industry is very competitive and includes services offered from other banks, savings and loan associations, credit unions, mortgage companies, other lenders, and institutions offering uninsured investment alternatives. Legal and regulatory developments have made it easier for new and sometimes unregulated competitors to compete with us. The financial services industry has and is experiencing an ongoing trend towards consolidation in which fewer large national and regional banks and other financial institutions are replacing many smaller and more local banks. These larger banks and other financial institutions hold a large accumulation of assets and have significantly greater resources and a wider geographic presence or greater accessibility. In some instances, these larger entities operate without the traditional brick and mortar facilities that restrict geographic presence. Some competitors have more aggressive marketing campaigns and better brand recognition, and are able to offer more services, more favorable pricing or greater customer convenience than the Bank. In addition, competition has increased from new banks and other financial services providers that target our existing or potential clients. As consolidation continues among large banks, we expect other smaller institutions to try to compete in the markets we serve. This competition could reduce our net income by decreasing the number and size of the loans that we originate and the interest rates we charge on these loans. Additionally, these competitors may offer higher interest rates, which could decrease the deposits we attract or require us to increase rates to retain existing deposits or attract new deposits. Increased deposit competition could adversely affect our ability to generate the funds necessary for lending operations which could increase our cost of funds.
25
The financial services industry could become even more competitive as a result of legislative, regulatory and technological changes and continued consolidation. Banks, securities firms and insurance companies can merge as part of a financial holding company, which can offer virtually any type of financial service, including banking, securities underwriting, insurance (both agency and underwriting) and merchant banking. Technological developments have allowed competitors, including some non-depository institutions, to compete more effectively in local markets and have expanded the range of financial products, services and capital available to our target clients. If we are unable to implement, maintain and use such technologies effectively, we may not be able to offer products or achieve cost-efficiencies necessary to compete in the industry. In addition, some of these competitors have fewer regulatory constraints and lower cost structures.
We are dependent on key individuals and the loss of one or more of these key individuals could curtail our growth and adversely affect our prospects.
R. Arthur Seaver, Jr., our chief executive officer, F. Justin Strickland, our president, and Michael D. Dowling, our chief financial officer, each has extensive and long-standing ties within our primary market area and substantial experience with our operations, and each has contributed significantly to our growth. If we lose the services of any of these individuals, they would be difficult to replace and our business and development could be materially and adversely affected.
Our success also depends, in part, on our continued ability to attract and retain experienced loan originators, as well as other management personnel, including our other executive vice presidents. Competition for personnel is intense, and we may not be successful in attracting or retaining qualified personnel. Our failure to compete for these personnel, or the loss of the services of several of such key personnel, could adversely affect our growth strategy and seriously harm our business, results of operations, and financial condition.
The success of our growth strategy depends on our ability to identify and retain individuals with experience and relationships in the markets in which we intend to expand.
To expand our franchise successfully, we must identify and retain experienced key management members with local expertise and relationships in these markets. We expect that competition for qualified management in the markets in which we may expand will be intense and that there will be a limited number of qualified persons with knowledge of and experience in the community banking industry in these markets. Even if we identify individuals that we believe could assist us in establishing a presence in a new market, we may be unable to recruit these individuals away from more established financial institutions. In addition, the process of identifying and recruiting individuals with the combination of skills and attributes required to carry out our strategy requires both management and financial resources and is often lengthy. Our inability to identify, recruit, and retain talented personnel to manage new offices effectively would limit our growth and could materially adversely affect our business, financial condition, and results of operations.
We will face risks with respect to future expansion.
We may expand into new markets, as we did in Columbia, South Carolina in 2007, Charleston, South Carolina in 2012, Raleigh, North Carolina in January 2017, and Atlanta, Georgia in August 2017. We may also expand our lines of business or offer new products or services as well as seek to acquire other financial institutions or parts of those institutions. These activities would involve a number of risks, including:
| ● | the time and costs of evaluating new markets, hiring or retaining experienced local management, and opening new offices and the time lags between these activities and the generation of sufficient assets and deposits to support the costs of the expansion; |
| ● | the incurrence and possible impairment of goodwill associated with an acquisition and possible adverse effects on our results of operations; |
| ● | the potential inaccuracy of the estimates and judgments used to evaluate credit, operations, management, and market risks with respect to a target institution; |
| ● | the risk that we may be unsuccessful in attracting and retaining deposits and originating high quality loans in these new markets; and |
| ● | the risk of loss of key employees and clients. |
26
A significant portion of our loan portfolio is secured by real estate, and events that negatively affect the real estate market could hurt our business.
As of December 31, 2017, approximately 82.1% of our loans had real estate as a primary or secondary component of collateral. The real estate collateral in each case provides an alternate source of repayment in the event of default by the borrower and may deteriorate in value during the time the credit is extended. A weakening of the real estate market in our primary market areas could result in an increase in the number of borrowers who default on their loans and a reduction in the value of the collateral securing their loans, which in turn could have an adverse effect on our profitability and asset quality. If we are required to liquidate the collateral securing a loan to satisfy the debt during a period of reduced real estate values, our earnings and capital could be adversely affected. Acts of nature, including hurricanes, tornados, earthquakes, fires and floods, which may cause uninsured damage and other loss of value to real estate that secures these loans, may also negatively affect our financial condition.
Our loan portfolio contains a number of real estate loans with relatively large balances.
Because our loan portfolio contains a number of real estate loans with relatively large balances, the deterioration of one or a few of these loans could cause a significant increase in nonperforming loans, which could result in a net loss of earnings, an increase in the provision for loan losses and an increase in loan charge-offs, all of which could have a material adverse effect on our financial condition and results of operations.
Commercial real estate loans increase our exposure to credit risk.
At December 31, 2017, 49.1% of our loan portfolio was secured by commercial real estate. Loans secured by commercial real estate are generally viewed as having more risk of default than loans secured by residential real estate or consumer loans because repayment of the loans often depends on the successful operation of the property, the income stream of the borrowers, the accuracy of the estimate of the property’s value at completion of construction, and the estimated cost of construction. Such loans are generally more risky than loans secured by residential real estate or consumer loans because those loans are typically not secured by real estate collateral. An adverse development with respect to one lending relationship can expose us to a significantly greater risk of loss compared with a single-family residential mortgage loan because we typically have more than one loan with such borrowers. Additionally, these loans typically involve larger loan balances to single borrowers or groups of related borrowers compared with single-family residential mortgage loans. Therefore, the deterioration of one or a few of these loans could cause a significant decline in the related asset quality. While economic conditions and real estate in our local markets have improved since the end of the economic recession, a return of recessionary conditions could result in a sharp increase in loans charged-off and could require us to significantly increase our allowance for loan losses, which could have a material adverse impact on our business, financial condition, results of operations, and cash flows.
Imposition of limits by the bank regulators on commercial and multi-family real estate lending activities could curtail our growth and adversely affect our earnings.
In 2006, the FDIC, the Federal Reserve and the Office of the Comptroller of the Currency issued joint guidance entitled “Concentrations in Commercial Real Estate Lending, Sound Risk Management Practices” (the “CRE Guidance”). Although the CRE Guidance did not establish specific lending limits, it provides that a bank’s commercial real estate lending exposure could receive increased supervisory scrutiny where total non-owner occupied commercial real estate loans, including loans secured by apartment buildings, investor commercial real estate, and construction and land loans, represent 300% or more of an institution’s total risk-based capital, and the outstanding balance of the commercial real estate loan portfolio has increased by 50% or more during the preceding 36 months. Our level of commercial real estate and multi-family loans represents 203.5% of the Bank’s total risk-based capital at December 31, 2017.
In December 2015, the regulatory agencies released a new statement on prudent risk management for commercial real estate lending (the “2015 Statement”). In the 2015 Statement, the regulatory agencies, among other things, indicate the intent to continue “to pay special attention” to commercial real estate lending activities and concentrations going forward. If the FDIC, our primary federal regulator, were to impose restrictions on the amount of commercial real estate loans we can hold in our portfolio, for reasons noted above or otherwise, our earnings would be adversely affected.
Repayment of our commercial business loans is often dependent on the cash flows of the borrower, which may be unpredictable, and the collateral securing these loans may fluctuate in value.
At December 31, 2017, commercial business loans comprised 16.3% of our total loan portfolio. Our commercial business loans are originated primarily based on the identified cash flow and general liquidity of the borrower and secondarily on the underlying collateral provided by the borrower and/or repayment capacity of any guarantor. The borrower’s cash flow may be unpredictable, and collateral securing these loans may fluctuate in value. Although commercial business loans are often collateralized by equipment, inventory, accounts receivable, or other business assets, the liquidation of collateral in the event of default is often an insufficient source of repayment because accounts receivable may be uncollectible and inventories may be obsolete or of limited use. In addition, business assets may depreciate over time, may be difficult to appraise, and may fluctuate in value based on the success of the business. Accordingly, the repayment of commercial business loans depends primarily on the cash flow and credit worthiness of the borrower and secondarily on the underlying collateral value provided by the borrower and liquidity of the guarantor. If these borrowers do not have sufficient cash flows or resources to pay these loans as they come due or the value of the underlying collateral is insufficient to fully secure these loans, we may suffer losses on these loans that exceed our allowance for loan losses.
27
We may have higher loan losses than we have allowed for in our allowance for loan losses.
Our actual loans losses could exceed our allowance for loan losses and therefore our historic allowance for loan losses may not be adequate. As of December 31, 2017, 49.1% of our loan portfolio was secured by commercial real estate. Repayment of such loans is generally considered more subject to market risk than residential mortgage loans. Industry experience shows that a portion of loans will become delinquent and a portion of loans will require partial or entire charge-off. Regardless of the underwriting criteria utilized, losses may be experienced as a result of various factors beyond our control, including among other things, changes in market conditions affecting the value of loan collateral, the cash flows of our borrowers and problems affecting borrower credit. If we suffer loan losses that exceed our allowance for loans losses, our financial condition, liquidity or results of operations could be materially and adversely affected.
Our decisions regarding allowance for loan losses and credit risk may materially and adversely affect our business.
Making loans and other extensions of credit is an essential element of our business. Although we seek to mitigate risks inherent in lending by adhering to specific underwriting practices, our loans and other extensions of credit may not be repaid. The risk of nonpayment is affected by a number of factors, including:
| ● | the duration of the credit; |
| ● | credit risks of a particular client; |
| ● | changes in economic and industry conditions; and |
| ● | in the case of a collateralized loan, risks resulting from uncertainties about the future value of the collateral. |
We attempt to maintain an appropriate allowance for loan losses to provide for probable losses in our loan portfolio. We periodically determine the amount of the allowance based on consideration of several factors, including but not limited to:
| ● | an ongoing review of the quality, mix, and size of our overall loan portfolio; |
| ● | our historical loan loss experience; |
| ● | evaluation of economic conditions; |
| ● | regular reviews of loan delinquencies and loan portfolio quality; |
| ● | ongoing review of financial information provided by borrowers; and |
| ● | the amount and quality of collateral, including guarantees, securing the loans. |
The determination of the appropriate level of the allowance for loan losses inherently involves a high degree of subjectivity and requires us to make significant estimates of current credit risks and future trends, all of which may undergo material changes. Continuing deterioration in economic conditions affecting borrowers, new information regarding existing loans, identification of additional problem loans and other factors, both within and outside of our control, may require an increase in the allowance for loan losses. In addition, regulatory agencies periodically review our allowance for loan losses and may require an increase in the provision for loan losses or the recognition of further loan charge-offs, based on judgments different than those of management. In addition, if charge-offs in future periods exceed the allowance for loan losses, we will need additional provisions to increase the allowance for loan losses. Any increases in the allowance for loan losses will result in a decrease in net income and, possibly, capital, and may have a material adverse effect on our financial condition and results of operations.
Lack of seasoning of our loan portfolio may increase the risk of credit defaults in the future.
Due to the growth of the Bank and expansion into new markets over the past several years, a portion of the loans in our loan portfolio and our lending relationships are of relatively recent origin. In general, loans do not begin to show signs of credit deterioration or default until they have been outstanding for some period of time, a process we refer to as “seasoning.” As a result, a portfolio of older loans will usually behave more predictably than a newer portfolio. Because our loan portfolio is relatively new, the current level of delinquencies and defaults may not be representative of the level that will prevail when the portfolio becomes more seasoned, which may be higher than current levels. If delinquencies and defaults increase, we may be required to increase our provision for loan losses, which would adversely affect our results of operations and financial condition.
28
We rely on other companies to provide key components of our business infrastructure.
Third parties provide key components of our business operations such as data processing, recording and monitoring transactions, online banking interfaces and services, internet connections and network access. While we have selected these third party vendors carefully, we do not control their actions. Any problem caused by these third parties, including poor performance of services, data breaches, failure to provide services, disruptions in communication services provided by a vendor and failure to handle current or higher volumes, could adversely affect our ability to deliver products and services to our clients and otherwise conduct our business, and may harm our reputation. Financial or operational difficulties of a third party vendor could also hurt our operations if those difficulties interfere with the vendor’s ability to serve us. Replacing these third party vendors could also create significant delay and expense. Accordingly, use of such third parties creates an unavoidable inherent risk to our business operations.
We may be adversely affected by the soundness of other financial institutions.
Financial services institutions are interrelated as a result of trading, clearing, counterparty, or other relationships. We have exposure to many different industries and counterparties, and routinely execute transactions with counterparties in the financial services industry, including commercial banks, brokers and dealers, investment banks, and other institutional clients. Many of these transactions expose us to credit risk in the event of a default by a counterparty or client. In addition, our credit risk may be exacerbated when the collateral held by the Bank cannot be realized upon or is liquidated at prices not sufficient to recover the full amount of the credit or derivative exposure due to the Bank. Any such losses could have a material adverse effect on our financial condition and results of operations.
We are subject to losses due to errors, omissions or fraudulent behavior by our employees, clients, counterparties or other third parties.
We are exposed to many types of operational risk, including the risk of fraud by employees and third parties, clerical recordkeeping errors and transactional errors. Our business is dependent on our employees as well as third-party service providers to process a large number of increasingly complex transactions. We could be materially and adversely affected if employees, clients, counterparties or other third parties caused an operational breakdown or failure, either as a result of human error, fraudulent manipulation or purposeful damage to any of our operations or systems.
In deciding whether to extend credit or to enter into other transactions with clients and counterparties, we may rely on information furnished to us by or on behalf of clients and counterparties, including financial statements and other financial information, which we do not independently verify. We also may rely on representations of clients and counterparties as to the accuracy and completeness of that information and, with respect to financial statements, on reports of independent auditors. For example, in deciding whether to extend credit to clients, we may assume that a client’s audited financial statements conform with U.S. GAAP and present fairly, in all material respects, the financial condition, results of operations and cash flows of the client. Our financial condition and results of operations could be negatively affected to the extent we rely on financial statements that do not comply with GAAP or are materially misleading, any of which could be caused by errors, omissions, or fraudulent behavior by our employees, clients, counterparties, or other third parties.
A percentage of the loans in our portfolio currently include exceptions to our loan policies and supervisory guidelines.
All of the loans that we make are subject to written loan policies adopted by our board of directors and to supervisory guidelines imposed by our regulators. Our loan policies are designed to reduce the risks associated with the loans that we make by requiring our loan officers to take certain steps that vary depending on the type and amount of the loan, prior to closing a loan. These steps include, among other things, making sure the proper liens are documented and perfected on property securing a loan, and requiring proof of adequate insurance coverage on property securing loans. Loans that do not fully comply with our loan policies are known as “exceptions.” We categorize exceptions as policy exceptions, financial statement exceptions and document exceptions. As a result of these exceptions, such loans may have a higher risk of loan loss than the other loans in our portfolio that fully comply with our loan policies. In addition, we may be subject to regulatory action by federal or state banking authorities if they believe the number of exceptions in our loan portfolio represents an unsafe banking practice.
29
Our operational or security systems may experience an interruption or breach in security, including as a result of cyber-attacks.
We rely heavily on communications and information systems to conduct our business. Any failure, interruption or breach in security of these systems, including as a result of cyber-attacks, could result in failures or disruptions in our client relationship management, deposit, loan, and other systems and also the disclosure or misuse of confidential or proprietary information. While we have systems, policies and procedures designed to prevent or limit the effect of the failure, interruption or security breach of our information systems, there can be no assurance that any such failures, interruptions or security breaches will not occur or, if they do occur, that they will be adequately addressed. The occurrence of any failures, interruptions or security breaches of our information systems could damage our reputation, result in a loss of client business, subject us to additional regulatory scrutiny, or expose us to civil litigation and possible financial liability, any of which could have a material adverse effect on our business, financial condition and results of operations.
Furthermore, information security risks for financial institutions have generally increased in recent years in part because of the proliferation of new technologies, the use of the Internet and telecommunications technologies to conduct financial transactions, and the increased sophistication and activities of organized crime, hackers, terrorists, activists, and other external parties. Our technologies, systems, networks, and our customers’ devices may become the target of cyber-attacks or information security breaches that could result in the unauthorized release, gathering, monitoring, misuse, loss or destruction of our or our customers’ confidential, proprietary and other information, or otherwise disrupt our or our customers’ or other third parties’ business operations. As cyber threats continue to evolve, we may also be required to expend significant additional resources to continue to modify or enhance our protective measures or to investigate and remediate any information security vulnerabilities.
While we have not experienced any material losses relating to cyber-attacks or other information security breaches to date, we may suffer such losses in the future and any information security breach could result in significant costs to us, which may include fines and penalties, potential liabilities from governmental or third party investigations, proceedings or litigation, legal, forensic and consulting fees and expenses, costs and diversion of management attention required for investigation and remediation actions, and the negative impact on our reputation and loss of confidence of our customers and others, any of which could have a material adverse impact on our business, financial condition and operating results.
Our controls and procedures may fail or be circumvented.
We regularly review and update our internal controls, disclosure controls and procedures, and corporate governance policies and procedures. Any system of controls, however well designed and operated, is based in part on certain assumptions and can provide only reasonable, not absolute, assurances that the objectives of the system are met. Any failure or circumvention of our controls and procedures or failure to comply with regulations related to controls and procedures could have a material adverse effect on our business, results of operations and financial condition.
Negative public opinion surrounding the Company and the financial institutions industry generally could damage our reputation and adversely impact our earnings.
Reputation risk, or the risk to our business, earnings and capital from negative public opinion surrounding the Company and the financial institutions industry generally, is inherent in our business. Negative public opinion can result from our actual or alleged conduct in any number of activities, including lending practices, corporate governance and acquisitions, and from actions taken by government regulators and community organizations in response to those activities. Negative public opinion can adversely affect our ability to keep and attract clients and employees and can expose us to litigation and regulatory action. Although we take steps to minimize reputation risk in dealing with our clients and communities, this risk will always be present given the nature of our business.
Consumers may decide not to use banks to complete their financial transactions.
Technology and other changes are allowing parties to complete financial transactions through alternative methods that historically have involved banks. For example, consumers can now maintain funds that would have historically been held as bank deposits in brokerage accounts, mutual funds or general-purpose reloadable prepaid cards. Consumers can also complete transactions such as paying bills and/or transferring funds directly without the assistance of banks. The process of eliminating banks as intermediaries, known as “disintermediation,” could result in the loss of fee income, as well as the loss of customer deposits and the related income generated from those deposits. The loss of these revenue streams and the lower cost of deposits as a source of funds could have a material adverse effect on our financial condition and results of operations.
30
Failure to keep pace with technological change could adversely affect our business.
The financial services industry is continually undergoing rapid technological change with frequent introductions of new technology-driven products and services. The effective use of technology increases efficiency and enables financial institutions to better serve customers and to reduce costs. Our future success depends, in part, upon our ability to address the needs of our customers by using technology to provide products and services that will satisfy customer demands, as well as to create additional efficiencies in our operations. Many of our competitors have substantially greater resources to invest in technological improvements. We may not be able to effectively implement new technology-driven products and services or be successful in marketing these products and services to our customers. Failure to successfully keep pace with technological change affecting the financial services industry could have a material adverse impact on our business and, in turn, our financial condition and results of operations.
New lines of business or new products and services may subject us to additional risk.
From time to time, we may implement new lines of business or offer new products and services within existing lines of business. There are substantial risks and uncertainties associated with these efforts, particularly in instances where the markets are not fully developed. In developing and marketing new lines of business and/or new products and services, we may invest significant time and resources. Initial timetables for the introduction and development of new lines of business and/or new products or services may not be achieved and price and profitability targets may not prove feasible. External factors, such as compliance with regulations, competitive alternatives, and shifting market preferences, may also impact the successful implementation of a new line of business and/or a new product or service. Furthermore, any new line of business and/or new product or service could have a significant impact on the effectiveness of our system of internal controls. Failure to successfully manage these risks in the development and implementation of new lines of business and/or new products or services could have a material adverse effect on our business and, in turn, our financial condition and results of operations.
Our profitability is dependent on our banking activities.
Because we are a bank holding company, our profitability is directly attributable to the success of the Bank. Our banking activities compete with other banking institutions on the basis of products, service, convenience and price, among others. Due in part to both regulatory changes and consumer demands, banks have experienced increased competition from other entities offering similar products and services. We rely on the profitability of the Bank and dividends received from the Bank for payment of our operating expenses and satisfaction of our obligations. As is the case with other similarly situated financial institutions, our profitability will be subject to the fluctuating cost and availability of funds, changes in the prime lending rate and other interest rates, changes in economic conditions in general, and other factors.
Regulatory and Legal Risks
We are subject to extensive regulation that could restrict our activities, have an adverse impact on our operations, and impose financial requirements or limitations on the conduct of our business.
We operate in a highly regulated industry and are subject to examination, supervision, and comprehensive regulation by various regulatory agencies. We are subject to regulation by the Federal Reserve. The Bank is subject to extensive regulation, supervision, and examination by our primary federal regulator, the FDIC, the regulating authority that insures client deposits, and by our primary state regulator, the S.C. Board. Also, as a member of the Federal Home Loan Bank, the Bank must comply with applicable regulations of the Federal Housing Finance Board and the Federal Home Loan Bank. Regulation by these agencies is intended primarily for the protection of our depositors and the deposit insurance fund and not for the benefit of our shareholders. The Bank’s activities are also regulated under consumer protection laws applicable to our lending, deposit, and other activities. A sufficient claim against us under these laws could have a material adverse effect on our results of operations.
Further, changes in laws, regulations and regulatory practices affecting the financial services industry could subject us to additional costs, limit the types of financial services and products we may offer and/or increase the ability of non-banks to offer competing financial services and products, among other things. Failure to comply with laws, regulations or policies could also result in heightened regulatory scrutiny and in sanctions by regulatory agencies (such as a memorandum of understanding, a written supervisory agreement or a cease and desist order), civil money penalties and/or reputation damage. Any of these consequences could restrict our ability to expand our business or could require us to raise additional capital or sell assets on terms that are not advantageous to us or our shareholders and could have a material adverse effect on our business, financial condition and results of operations. While we have policies and procedures designed to prevent any such violations, such violations may occur despite our best efforts.
31
Failure to comply with government regulation and supervision could result in sanctions by regulatory agencies, civil money penalties, and damage to our reputation.
Our operations are subject to extensive regulation by federal, state, and local governmental authorities. Given the recent disruption in the financial markets, we expect that the government will continue to pass new regulations and laws that will impact us. Compliance with such regulations may increase our costs and limit our ability to pursue business opportunities. Failure to comply with laws, regulations, and policies could result in sanctions by regulatory agencies, civil money penalties, and damage to our reputation. While we have policies and procedures in place that are designed to prevent violations of these laws, regulations, and policies, there can be no assurance that such violations will not occur.
The final Basel III capital rules generally require insured depository institutions and their holding companies to hold more capital, which could adversely affect our financial condition and operations.
In July 2013, the federal bank regulatory agencies issued a final rule that will revise their risk based capital requirements and the method for calculating risk weighted assets to make them consistent with agreements that were reached by Basel III and certain provisions of the Dodd Frank Act. This rule substantially amended the regulatory risk based capital rules applicable to us. The requirements in the rule began to phase in on January 1, 2015 for the Company and the Bank. The requirements in the rule will be fully phased in by January 1, 2019.
The rule includes certain new and higher risk-based capital and leverage requirements than those currently in place. Specifically, the following minimum capital requirements apply to us:
| ● | a new common equity Tier 1 risk-based capital ratio of 4.5%; |
| ● | a Tier 1 risk-based capital ratio of 6% (increased from the former 4% requirement); |
| ● | a total risk-based capital ratio of 8% (unchanged from the former requirement); and |
| ● | a leverage ratio of 4% (also unchanged from the former requirement). |
Under the rule, Tier 1 capital is redefined to include two components: Common Equity Tier 1 capital and additional Tier 1 capital. The new and highest form of capital, Common Equity Tier 1 capital, consists solely of common stock (plus related surplus), retained earnings, accumulated other comprehensive income, and limited amounts of minority interests that are in the form of common stock. Additional Tier 1 capital includes other perpetual instruments historically included in Tier 1 capital, such as noncumulative perpetual preferred stock. Tier 2 capital consists of instruments that currently qualify in Tier 2 capital plus instruments that the rule has disqualified from Tier 1 capital treatment. Cumulative perpetual preferred stock, formerly includable in Tier 1 capital, is now included only in Tier 2 capital. Accumulated other comprehensive income (AOCI) is presumptively included in Common Equity Tier 1 capital and often would operate to reduce this category of capital. The rule provided a one-time opportunity at the end of the first quarter of 2015 for covered banking organizations to opt out of much of this treatment of AOCI. We made this opt-out election and, as a result, will retain the pre-existing treatment for AOCI.
In order to avoid restrictions on capital distributions or discretionary bonus payments to executives, a covered banking organization must maintain a “capital conservation buffer” on top of its minimum risk-based capital requirements. This buffer must consist solely of Tier 1 Common Equity, but the buffer applies to all three measurements (Common Equity Tier 1, Tier 1 capital and total capital). The capital conservation buffer will be phased in incrementally over time, becoming fully effective on January 1, 2019, and will consist of an additional amount of common equity equal to 2.5% of risk-weighted assets. As of January 1, 2017, we are required to hold a capital conservation buffer of 1.25%, increasing by 0.625% each successive year until 2019.
In general, the rules have had the effect of increasing capital requirements by increasing the risk weights on certain assets, including high volatility commercial real estate, certain loans past due 90 days or more or in nonaccrual status, mortgage servicing rights not includable in Common Equity Tier 1 capital, equity exposures, and claims on securities firms, that are used in the denominator of the three risk-based capital ratios.
In addition, in the current economic and regulatory environment, bank regulators may impose capital requirements that are more stringent than those required by applicable existing regulations. The application of more stringent capital requirements for us could, among other things, result in lower returns on equity, require the raising of additional capital, and result in regulatory actions if we are unable to comply with such requirements. Implementation of changes to asset risk weightings for risk based capital calculations, items included or deducted in calculating regulatory capital or additional capital conservation buffers, could result in management modifying our business strategy and could limit our ability to make distributions, including paying dividends or buying back our shares.
32
Higher FDIC deposit insurance premiums and assessments could adversely affect our financial condition.
Our deposits are insured up to applicable limits by the Deposit Insurance Fund of the FDIC and are subject to deposit insurance assessments to maintain deposit insurance. As an FDIC-insured institution, we are required to pay quarterly deposit insurance premium assessments to the FDIC. Although we cannot predict what the insurance assessment rates will be in the future, either deterioration in our risk-based capital ratios or adjustments to the base assessment rates could have a material adverse impact on our business, financial condition, results of operations, and cash flows.
We face a risk of noncompliance and enforcement action with the Bank Secrecy Act and other anti-money laundering statutes and regulations.
The federal Bank Secrecy Act, the USA Patriot Act and other laws and regulations require financial institutions, among other duties, to institute and maintain effective anti-money laundering programs and file suspicious activity and currency transaction reports as appropriate. The federal Financial Crimes Enforcement Network, established by the U.S. Treasury to administer the Bank Secrecy Act, is authorized to impose significant civil money penalties for violations of those requirements and has recently engaged in coordinated enforcement efforts with the individual federal banking regulators, as well as the U.S. Department of Justice, Drug Enforcement Administration and Internal Revenue Service. There is also increased scrutiny of compliance with the rules enforced by OFAC. Federal and state bank regulators also have begun to focus on compliance with Bank Secrecy Act and anti-money laundering regulations. If our policies, procedures and systems are deemed deficient or the policies, procedures and systems of the financial institutions that we have already acquired or may acquire in the future are deficient, we would be subject to liability, including fines and regulatory actions such as restrictions on our ability to pay dividends and the necessity to obtain regulatory approvals to proceed with certain aspects of our business plan, including our acquisition plans, which would negatively affect our business, financial condition and results of operations. Failure to maintain and implement adequate programs to combat money laundering and terrorist financing could also have serious reputational consequences for us.
Federal, state and local consumer lending laws may restrict our ability to originate certain mortgage loans or increase our risk of liability with respect to such loans and could increase our cost of doing business.
Federal, state and local laws have been adopted that are intended to eliminate certain lending practices considered “predatory.” These laws prohibit practices such as steering borrowers away from more affordable products, selling unnecessary insurance to borrowers, repeatedly refinancing loans and making loans without a reasonable expectation that the borrowers will be able to repay the loans irrespective of the value of the underlying property. Loans with certain terms and conditions and that otherwise meet the definition of a “qualified mortgage” may be protected from liability to a borrower for failing to make the necessary determinations. In either case, we may find it necessary to tighten our mortgage loan underwriting standards in response to the CFPB rules, which may constrain our ability to make loans consistent with our business strategies. It is our policy not to make predatory loans and to determine borrowers' ability to repay, but the law and related rules create the potential for increased liability with respect to our lending and loan investment activities. They increase our cost of doing business and, ultimately, may prevent us from making certain loans and cause us to reduce the average percentage rate or the points and fees on loans that we do make.
We are subject to federal and state fair lending laws, and failure to comply with these laws could lead to material penalties.
Federal and state fair lending laws and regulations, such as the Equal Credit Opportunity Act and the Fair Housing Act, impose nondiscriminatory lending requirements on financial institutions. The Department of Justice, CFPB and other federal and state agencies are responsible for enforcing these laws and regulations. Private parties may also have the ability to challenge an institution's performance under fair lending laws in private class action litigation. A successful challenge to our performance under the fair lending laws and regulations could adversely impact our rating under the Community Reinvestment Act and result in a wide variety of sanctions, including the required payment of damages and civil money penalties, injunctive relief, imposition of restrictions on merger and acquisition activity and restrictions on expansion activity, which could negatively affect our reputation, business, financial condition and results of operations.
The Federal Reserve may require us to commit capital resources to support the Bank.
The Federal Reserve requires a bank holding company to act as a source of financial and managerial strength to a subsidiary bank and to commit resources to support such subsidiary bank. Under the “source of strength” doctrine, the Federal Reserve may require a bank holding company to make capital injections into a troubled subsidiary bank and may charge the bank holding company with engaging in unsafe and unsound practices for failure to commit resources to such a subsidiary bank. In addition, the Dodd-Frank Act directs the federal bank regulators to require that all companies that directly or indirectly control an insured depository institution serve as a source of strength for the institution. Under these requirements, in the future, we could be required to provide financial assistance to the Bank if the Bank experiences financial distress.
33
A capital injection may be required at times when we do not have the resources to provide it, and therefore we may be required to borrow the funds. In the event of a bank holding company's bankruptcy, the bankruptcy trustee will assume any commitment by the holding company to a federal bank regulatory agency to maintain the capital of a subsidiary bank. Moreover, bankruptcy law provides that claims based on any such commitment will be entitled to a priority of payment over the claims of the holding company's general unsecured creditors, including the holders of its note obligations. Thus, any borrowing that must be done by the holding company in order to make the required capital injection becomes more difficult and expensive and will adversely impact the holding company's cash flows, financial condition, results of operations and prospects.
We may be subject to claims and litigation asserting lender liability.
From time to time, clients and others make claims and take legal action pertaining to our performance of fiduciary responsibilities. These claims are often referred to as “lender liability” claims and are sometimes brought in an effort to produce or increase leverage against us in workout negotiations or debt collection proceedings. Lender liability claims frequently assert one or more of the following allegations: breach of fiduciary duties, fraud, economic duress, breach of contract, breach of the implied covenant of good faith and fair dealing, and similar claims. Whether customer claims and legal action related to the performance of our responsibilities are founded or unfounded, if such claims and legal actions are not resolved in a favorable manner, they may result in significant financial liability and/or adversely affect our market reputation, products and services, as well as potentially affecting customer demand for those products and services. Any financial liability or reputation damage could have a material adverse effect on our business, which, in turn, could have a material adverse effect on our financial condition, results of operations and liquidity.
The effects of the Tax Cuts and Jobs Act on our business have not yet been fully analyzed and could have an adverse effect on our net income.
On December 22, 2017, the Tax Cuts and Jobs Act (the “Tax Act”) was signed into law. We are in the process of analyzing the Tax Act and its possible effects on the Company and the Bank. The Tax Act reduces the corporate tax rate to 21% from 35%, among other things. We cannot determine at this time the full effects of the Tax Act on our business and financial results.
There is uncertainty surrounding the potential legal, regulatory and policy changes by the current presidential administration in the U.S. that may directly affect financial institutions and the global economy.
The current presidential administration has indicated that it would like to see changes made to certain financial reform regulations, including the Dodd-Frank Act, which has resulted in increased regulatory uncertainty, and we are assessing the potential impact on financial and economic markets and on our business. Changes in federal policy and at regulatory agencies are expected to occur over time through policy and personnel changes, which could lead to changes involving the level of oversight and focus on the financial services industry. The nature, timing and economic and political effects of potential changes to the current legal and regulatory framework affecting financial institutions remain highly uncertain. At this time, it is unclear what laws, regulations and policies may change and whether future changes or uncertainty surrounding future changes will adversely affect our operating environment and, therefore, our business, financial condition and results of operations.
Risks Related to Our Common Stock
Our ability to pay cash dividends is limited, and we may be unable to pay future dividends even if we desire to do so.
The Federal Reserve has issued a policy statement regarding the payment of dividends by bank holding companies. In general, the Federal Reserve’s policies provide that dividends should be paid only out of current earnings and only if the prospective rate of earnings retention by the bank holding company appears consistent with the organization’s capital needs, asset quality and overall financial condition. The Federal Reserve’s policies also require that a bank holding company serve as a source of financial strength to its subsidiary banks by standing ready to use available resources to provide adequate capital funds to those banks during periods of financial stress or adversity and by maintaining the financial flexibility and capital-raising capacity to obtain additional resources for assisting its subsidiary banks where necessary. Further, under the prompt corrective action regulations, the ability of a bank holding company to pay dividends may be restricted if a subsidiary bank becomes undercapitalized. These regulatory policies could affect the ability of the Company to pay dividends or otherwise engage in capital distributions.
34
Statutory and regulatory limitations apply to the Bank’s payment of dividends to the Company. As a South Carolina chartered bank, the Bank is subject to limitations on the amount of dividends that it is permitted to pay. Unless otherwise instructed by the S.C. Board, the Bank is generally permitted under South Carolina state banking regulations to pay cash dividends of up to 100% of net income in any calendar year without obtaining the prior approval of the S.C. Board. The FDIC also has the authority under federal law to enjoin a bank from engaging in what in its opinion constitutes an unsafe or unsound practice in conducting its business, including the payment of a dividend under certain circumstances. If the Bank is not permitted to pay cash dividends to the Company, it is unlikely that we would be able to pay cash dividends on our common stock. Moreover, holders of our common stock are entitled to receive dividends only when, and if declared by our board of directors.
Our stock price may be volatile, which could result in losses to our investors and litigation against us.
Our stock price has been volatile in the past and several factors could cause the price to fluctuate substantially in the future. These factors include but are not limited to: actual or anticipated variations in earnings, changes in analysts’ recommendations or projections, our announcement of developments related to our businesses, operations and stock performance of other companies deemed to be peers, new technology used or services offered by traditional and non-traditional competitors, news reports of trends, irrational exuberance on the part of investors, new federal banking regulations, and other issues related to the financial services industry. Our stock price may fluctuate significantly in the future, and these fluctuations may be unrelated to our performance. General market declines or market volatility in the future, especially in the financial institutions sector, could adversely affect the price of our common stock, and the current market price may not be indicative of future market prices. Stock price volatility may make it more difficult for you to resell your common stock when you want and at prices you find attractive. Moreover, in the past, securities class action lawsuits have been instituted against some companies following periods of volatility in the market price of its securities. We could in the future be the target of similar litigation. Securities litigation could result in substantial costs and divert management’s attention and resources from our normal business.
Future sales of our stock by our shareholders or the perception that those sales could occur may cause our stock price to decline.
Although our common stock is listed for trading on The NASDAQ Global Market, the trading volume in our common stock is lower than that of other larger financial services companies. A public trading market having the desired characteristics of depth, liquidity and orderliness depends on the presence in the marketplace of willing buyers and sellers of our common stock at any given time. This presence depends on the individual decisions of investors and general economic and market conditions over which we have no control. Given the relatively low trading volume of our common stock, significant sales of our common stock in the public market, or the perception that those sales may occur, could cause the trading price of our common stock to decline or to be lower than it otherwise might be in the absence of those sales or perceptions.
Economic and other circumstances may require us to raise capital at times or in amounts that are unfavorable to us. If we have to issue shares of common stock, they will dilute the percentage ownership interest of existing shareholders and may dilute the book value per share of our common stock and adversely affect the terms on which we may obtain additional capital.
We may need to incur additional debt or equity financing in the future to make strategic acquisitions or investments or to strengthen our capital position. Our ability to raise additional capital, if needed, will depend on, among other things, conditions in the capital markets at that time, which are outside of our control and our financial performance. We cannot provide assurance that such financing will be available to us on acceptable terms or at all, or if we do raise additional capital that it will not be dilutive to existing shareholders.
If we determine, for any reason, that we need to raise capital, subject to applicable NASDAQ rules, our board generally has the authority, without action by or vote of the shareholders, to issue all or part of any authorized but unissued shares of stock for any corporate purpose, including issuance of equity-based incentives under or outside of our equity compensation plans. Additionally, we are not restricted from issuing additional common stock or preferred stock, including any securities that are convertible into or exchangeable for, or that represent the right to receive, common stock or preferred stock or any substantially similar securities. The market price of our common stock could decline as a result of sales by us of a large number of shares of common stock or preferred stock or similar securities in the market or from the perception that such sales could occur. If we issue preferred stock that has a preference over the common stock with respect to the payment of dividends or upon liquidation, dissolution or winding-up, or if we issue preferred stock with voting rights that dilute the voting power of the common stock, the rights of holders of the common stock or the market price of our common stock could be adversely affected. Any issuance of additional shares of stock will dilute the percentage ownership interest of our shareholders and may dilute the book value per share of our common stock.
35
Shares we issue in connection with any such offering will increase the total number of shares and may dilute the economic and voting ownership interest of our existing shareholders.
Provisions of our articles of incorporation and bylaws, South Carolina law, and state and federal banking regulations, could delay or prevent a takeover by a third party.
Our articles of incorporation and bylaws could delay, defer, or prevent a third party takeover, despite possible benefit to the shareholders, or otherwise adversely affect the price of our common stock. Our governing documents:
| ● |
authorize a class of preferred stock that may be issued in series with terms, including voting rights, established by the board of directors without shareholder approval; |
| ● |
authorize 10,000,000 shares of common stock and 10,000,000 shares of preferred stock that may be issued by the board of directors without shareholder approval; |
| ● |
classify our board with staggered three year terms, preventing a change in a majority of the board at any annual meeting; |
| ● |
require advance notice of proposed nominations for election to the board of directors and business to be conducted at a shareholder meeting; |
| ● |
grant the board of directors the discretion, when considering whether a proposed merger or similar transaction is in the best interests of the Company and our shareholders, to take into account the effect of the transaction on the employees, clients and suppliers of the Company and upon the communities in which offices of the Company are located, to the extent permitted by South Carolina law; |
| ● |
provide that the number of directors shall be fixed from time to time by resolution adopted by a majority of the directors then in office, but may not consist of fewer than five nor more than 25 members; and |
| ● |
provide that no individual who is or becomes a "business competitor" or who is or becomes affiliated with, employed by, or a representative of any individual, corporation, or other entity which the board of directors, after having such matter formally brought to its attention, determines to be in competition with us or any of our subsidiaries (any such individual, corporation, or other entity being a "business competitor") shall be eligible to serve as a director if the board of directors determines that it would not be in our best interests for such individual to serve as a director (any financial institution having branches or affiliates within Greenville County, South Carolina is presumed to be a business competitor unless the board of directors determines otherwise). |
In addition, the South Carolina business combinations statute provides that a 10% or greater shareholder of a resident domestic corporation cannot engage in a "business combination" (as defined in the statute) with such corporation for a period of two years following the date on which the 10% shareholder became such, unless the business combination or the acquisition of shares is approved by a majority of the disinterested members of such corporation's board of directors before the 10% shareholder's share acquisition date. This statute further provides that at no time (even after the two-year period subsequent to such share acquisition date) may the 10% shareholder engage in a business combination with the relevant corporation unless certain approvals of the board of directors or disinterested shareholders are obtained or unless the consideration given in the combination meets certain minimum standards set forth in the statute. The law is very broad in its scope and is designed to inhibit unfriendly acquisitions but it does not apply to corporations whose articles of incorporation contain a provision electing not to be covered by the law. Our articles of incorporation do not contain such a provision. An amendment of our articles of incorporation to that effect would, however, permit a business combination with an interested shareholder even though that status was obtained prior to the amendment.
Finally, the Change in Bank Control Act and the Bank Holding Company Act generally require filings and approvals prior to certain transactions that would result in a party acquiring control of the Company or the Bank.
Our common stock is not an insured deposit.
Shares of our common stock are not a bank deposit and, therefore, losses in value are not insured by the FDIC, any other deposit insurance fund or by any other public or private entity. Investment in shares of our common stock is inherently risky for the reasons described in this “Risk Factors” section of this Annual Report on Form 10-K and is subject to the same market forces and investment risks that affect the price of common stock in any other company, including the possible loss of some or all principal invested.
Item 1B. Unresolved Staff Comments.
None.
36
Our principal executive offices and the Bank's main office is located at 100 Verdae Boulevard, Suite 100, Greenville, South Carolina 29607. In addition, we currently operate eight additional offices located in Greenville, Columbia and Charleston, South Carolina, one office in Raleigh, North Carolina, and one office in Atlanta, Georgia. We lease three of our offices and own the remaining locations. Management believes the terms of the various leases are consistent with market standards and were arrived at through arm's-length bargaining.
In the ordinary course of operations, we may be a party to various legal proceedings from time to time. We do not believe that there is any pending or threatened proceeding against us, which, if determined adversely, would have a material effect on our business, results of operations, or financial condition.
Item 4. Mine Safety Disclosures.
None.
Item 5. Market for Common Equity, Related Shareholder Matters and Issuer Purchases of Equity Securities.
Market Information and Holders of Record
Our common stock is currently traded on the NASDAQ Global Market under the symbol “SFST.” We had approximately 1,700 shareholders of record on February 23, 2018.
The following table shows the reported high and low common stock prices reported by the NASDAQ Global Market for 2017 and 2016.
| 2017 | High | Low | ||||
| First Quarter | $ | 37.20 | $ | 32.30 | ||
| Second Quarter | 37.05 | 31.75 | ||||
| Third Quarter | 37.45 | 33.50 | ||||
| Fourth Quarter | 42.90 | 36.75 | ||||
| 2016 | ||||||
| First Quarter | $ | 25.74 | $ | 21.66 | ||
| Second Quarter | 25.81 | 23.71 | ||||
| Third Quarter | 29.21 | 24.94 | ||||
| Fourth Quarter | 36.15 | 26.00 | ||||
Dividends
We have not declared or paid any cash dividends on our common stock since our inception. For the foreseeable future, we do not intend to declare cash dividends. We intend to retain earnings to grow our business and strengthen our capital base. Our ability to pay cash dividends depends primarily on the ability of our subsidiary, the Bank to pay dividends to us. As a South Carolina chartered bank, the Bank is subject to limitations on the amount of dividends that it is permitted to pay. Unless otherwise instructed by the S.C. Board, the Bank is generally permitted under South Carolina state banking regulations to pay cash dividends of up to 100% of net income in any calendar year without obtaining the prior approval of the S.C. Board. The FDIC also has the authority under federal law to enjoin a bank from engaging in what in its opinion constitutes an unsafe or unsound practice in conducting its business, including the payment of a dividend under certain circumstances.
Equity Compensation Plan Information
The following table sets forth equity compensation plan information at December 31, 2017. The number of shares and the exercise prices for options and warrants has been adjusted for the 3 for 2 stock split in 2003 and the subsequent 10% stock dividends in 2006, 2011, 2012, and 2013.
37
| Number of securities | |||||||
| remaining available for | |||||||
| Number of securities | future issuance under | ||||||
| to be issued upon | Weighted-average | equity compensation | |||||
| exercise of | exercise price of | plans (c) (excluding | |||||
| outstanding options, | outstanding options, | securities reflected in | |||||
| Plan Category | warrants and rights (a) | warrants and rights (b) | column(a)) | ||||
| Equity compensation plans approved by security holders | |||||||
| 2000 Stock options (1) | 197,806 | $ | 5.65 | - | |||
| 2010 Stock Incentive Plan – options | 410,350 | 17.96 | 14,375 | ||||
| 2010 Stock Incentive Plan – restricted stock | - | - | 9,424 | ||||
| 2016 Equity Incentive Plan – options | 54,685 | 35.02 | 345,315 | ||||
| 2016 Equity Incentive Plan – restricted stock | - | - | 50,000 | ||||
| Total | 662,841 | $ | 15.70 | 419,114 | |||
| (1) | Under the terms of the 2000 Plan no further incentive stock option awards may be granted, effective March 2010; however, the Plan will remain in effect until all awards have been exercised or forfeited and we determine to terminate the Plan. As of March 2010, any options that expire or are forfeited are eligible to be reissued as non-qualified stock option awards. |
Stock Performance Graph
The performance graph below compares the Company’s cumulative total return over the most recent five-year period with the SNL Southeast Bank Index, a banking industry performance index for the southeastern United States, and the Russell 2000 Index, a small-cap stock market index which the Company was added to in June 2016. Returns are shown on a total return basis, assuming the reinvestment of dividends and a beginning stock index value of $100 per share.
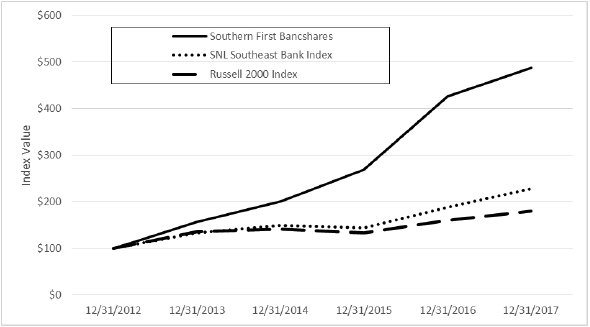
| Period Ending | ||||||||||||||||||
| 12/31/2012 | 12/31/2013 | 12/31/2014 | 12/31/2015 | 12/31/2016 | 12/31/2017 | |||||||||||||
| Southern First Bancshares | $ | 100.00 | $ | 157.08 | $ | 201.31 | $ | 268.49 | $ | 425.81 | $ | 487.90 | ||||||
| SNL Southeast Bank Index | $ | 100.00 | $ | 134.15 | $ | 149.21 | $ | 144.55 | $ | 188.21 | $ | 228.93 | ||||||
| Russell 2000 Index | $ | 100.00 | $ | 137.00 | $ | 141.84 | $ | 133.74 | $ | 159.78 | $ | 180.79 | ||||||
38
Item 6. Selected Financial Data
The following table sets forth our selected historical consolidated financial information for the periods and as of the dates indicated. We derived our balance sheet and income statement data for the years ended December 31, 2017, 2016, 2015, 2014 and 2013 from our audited consolidated financial statements. You should read this information together with “Management’s Discussion and Analysis of Financial Condition and Results of Operations” and our audited consolidated financial statements and the related notes thereto, which are included elsewhere in this Annual Report on Form 10-K.
| Years Ended December 31, | ||||||||||||
| (dollars in thousands, except per share data) | 2017 | 2016 | 2015 | 2014 | 2013 | |||||||
| BALANCE SHEET DATA | ||||||||||||
| Total assets | $ | 1,624,625 | 1,340,908 |
1,217,293 |
1,029,865 | 890,831 | ||||||
| Investment securities | 72,065 | 70,222 | 95,471 | 61,546 | 73,556 | |||||||
| Loans (1) | 1,387,070 | 1,163,644 | 1,004,944 | 871,446 | 733,656 | |||||||
| Allowance for loan losses | 15,523 | 14,855 | 13,629 | 11,752 | 10,213 | |||||||
| Deposits | 1,381,123 | 1,091,151 | 985,733 | 788,907 | 680,319 | |||||||
| FHLB advances and other borrowings | 67,200 | 115,200 | 115,200 | 135,200 | 124,100 | |||||||
| Junior subordinated debentures | 13,403 | 13,403 | 13,403 | 13,403 | 13,403 | |||||||
| Common equity | 149,686 | 109,872 | 94,240 | 82,992 | 50,366 | |||||||
| Preferred stock | - | - | - | - | 15,299 | |||||||
| Shareholders’ equity | 149,686 | 109,872 | 94,240 | 82,992 | 65,665 | |||||||
| SELECTED RESULTS OF OPERATIONS DATA | ||||||||||||
| Interest income | $ | 61,209 | 51,191 | 46,030 | 39,948 | 36,118 | ||||||
| Interest expense | 10,333 | 8,192 | 7,501 | 6,908 | 7,097 | |||||||
| Net interest income | 50,876 | 42,999 | 38,529 | 33,040 | 29,021 | |||||||
| Provision for loan losses | 2,000 | 2,300 | 3,200 | 4,175 | 3,475 | |||||||
| Net interest income after provision for loan losses | 48,876 | 40,699 | 35,329 | 28,865 | 25,546 | |||||||
| Noninterest income | 9,337 | 10,846 | 8,416 | 5,780 | 3,802 | |||||||
| Noninterest expenses | 34,552 | 31,176 | 28,209 | 24,907 | 21,812 | |||||||
| Income before income tax expense | 23,661 | 20,369 | 15,536 | 9,738 | 7,536 | |||||||
| Income tax expense | 10,616 | 7,333 | 5,369 | 3,113 | 2,416 | |||||||
| Net income | 13,045 | 13,036 | 10,167 | 6,625 | 5,120 | |||||||
| Preferred stock dividends | - | - | - | 915 | 771 | |||||||
| Redemption of preferred stock | - | - | - | - | (20 | ) | ||||||
| Net income available to common shareholders | $ | 13,045 | 13,036 | 10,167 | 5,710 | 4,369 | ||||||
| PER COMMON SHARE DATA | ||||||||||||
| Basic | $ | 1.86 | 2.06 | 1.64 | 1.15 | 1.02 | ||||||
| Diluted | 1.76 | 1.94 | 1.55 | 1.10 | 0.98 | |||||||
| Book value | 20.37 | 17.00 | 14.98 | 13.34 | 11.66 | |||||||
| Weighted average number of common shares outstanding: | ||||||||||||
| Basic, in thousands | 7,006 | 6,318 | 6,205 | 4,981 | 4,280 | |||||||
| Diluted, in thousands | 7,393 | 6,721 | 6,561 | 5,201 | 4,459 | |||||||
| SELECTED FINANCIAL RATIOS | ||||||||||||
| Performance Ratios: | ||||||||||||
| Return on average assets | 0.87% | 1.04% | 0.90% | 0.69% | 0.61% | |||||||
| Return on average equity | 9.66% | 12.73% | 11.42% | 8.92% | 7.88% | |||||||
| Return on average common equity | 9.66% | 12.73% | 11.42% | 12.03% | 8.81% | |||||||
| Net interest margin, tax equivalent(2) | 3.57% | 3.63% | 3.63% | 3.68% | 3.71% | |||||||
| Efficiency ratio (3) | 57.38% | 57.90% | 60.09% | 64.16% | 66.45% | |||||||
| Asset Quality Ratios: | ||||||||||||
| Nonperforming assets to total loans (1) | 0.54% | 0.53% | 0.90% | 1.14% | 1.29% | |||||||
| Nonperforming assets to total assets | 0.46% | 0.46% | 0.75% | 0.97% | 1.07% | |||||||
| Net charge-offs to average total loans | 0.10% | 0.10% | 0.14% | 0.33% | 0.34% | |||||||
| Allowance for loan losses to nonperforming loans | 212.60% | 270.95% | 205.98% | 176.72% | 122.50% | |||||||
| Allowance for loan losses to total loans | 1.12% | 1.28% | 1.36% | 1.35% | 1.39% | |||||||
| Holding Company Capital Ratios: | ||||||||||||
| Total risk-based capital ratio | 13.27% | 12.11% | 11.95% | 12.51% | 12.22% | |||||||
| Tier 1 risk-based capital ratio | 12.11% | 10.86% | 10.70% | 11.25% | 10.96% | |||||||
| Leverage ratio | 10.26% | 9.42% | 8.78% | 9.52% | 9.13% | |||||||
| Common equity tier 1 ratio(4) | 11.15% | 9.71% | 9.40% | 7.76% | 7.09% | |||||||
| Tangible common equity(5) | 9.21% | 8.19% | 7.74% | 8.06% | 5.65% | |||||||
| Growth Ratios: | ||||||||||||
| Change in assets | 21.16% | 10.15% | 18.20% | 15.61% | 11.63% | |||||||
| Change in loans | 19.20% | 15.79% | 15.32% | 18.78% | 13.94% | |||||||
| Change in deposits | 26.57% | 10.69% | 24.95% | 15.96% | 18.05% | |||||||
| Change in net income to common shareholders | 0.07% | 28.22% | 78.06% | 30.69% | 58.41% | |||||||
| Change in earnings per common share - diluted | -9.28% | 25.16% | 40.91% | 12.24% | 53.13% | |||||||
|
Footnotes to table: | ||
| (1) |
Excludes loans held for sale. | |
| (2) |
The tax-equivalent adjustment to net interest income adjusts the yield for assets earning tax-exempt income to a comparable yield on a taxable basis. | |
| (3) |
Noninterest expense divided by the sum of net interest income and noninterest income. | |
| (4) |
The common equity tier 1 ratio is calculated as the sum of common equity divided by risk-weighted assets. | |
| (5) |
The common equity ratio is calculated as total equity less preferred stock divided by total assets. | |
39
Item 7. Management’s Discussion and Analysis of Financial Condition and Results of Operations
The following discussion and analysis also identifies significant factors that have affected our financial position and operating results during the periods included in the accompanying financial statements. We encourage you to read this discussion and analysis in conjunction with the financial statements and the related notes and the other statistical information also included in this Annual Report on Form 10-K.
OVERVIEW
Our business model continues to be client-focused, utilizing relationship teams to provide our clients with a specific banker contact and support team responsible for all of their banking needs. The purpose of this structure is to provide a consistent and superior level of professional service, and we believe it provides us with a distinct competitive advantage. We consider exceptional client service to be a critical part of our culture, which we refer to as "ClientFIRST."
At December 31, 2017, we had total assets of $1.62 billion, a 21.2% increase from total assets of $1.34 billion at December 31, 2016. The largest components of our total assets are loans and securities which were $1.39 billion and $72.1 million, respectively, at December 31, 2017. Comparatively, our loans and securities totaled $1.16 billion and $70.2 million, respectively, at December 31, 2016. Our liabilities and shareholders’ equity at December 31, 2017 totaled $1.47 billion and $149.7 million, respectively, compared to liabilities of $1.23 billion and shareholders’ equity of $109.9 million at December 31, 2016. The principal component of our liabilities is deposits which were $1.38 billion and $1.09 billion at December 31, 2017 and 2016, respectively.
Like most community banks, we derive the majority of our income from interest received on our loans and investments. Our primary source of funds for making these loans and investments is our deposits, on which we pay interest. Consequently, one of the key measures of our success is our amount of net interest income, or the difference between the income on our interest-earning assets, such as loans and investments, and the expense on our interest-bearing liabilities, such as deposits and borrowings. Another key measure is the difference between the yield we earn on these interest-earning assets and the rate we pay on our interest-bearing liabilities, which is called our net interest spread. In addition to earning interest on our loans and investments, we earn income through fees and other charges to our clients.
Our net income available to common shareholders for the years ended December 31, 2017 and 2016 was $13.0 million, or diluted earnings per share (“EPS”) of $1.76 and $1.94 for the years ended December 31, 2017 and 2016, respectively. While our net income remained consistent from the prior year, net income for the year ended December 31, 2017 includes a $2.4 million expense due to the revaluation of our deferred tax asset resulting from the passing of the Tax Cuts and Jobs Act (the “Tax Act”) in December 2017. In addition, our net income available to stockholders increased by $2.9 million, or 28.2%, during the year ended December 31, 2016 as compared to $10.2 million for the year ended December 31, 2015.
Economic conditions, competition, and the monetary and fiscal policies of the federal government significantly affect most financial institutions, including the Bank. Lending and deposit activities and fee income generation are influenced by levels of business spending and investment, consumer income, consumer spending and savings, capital market activities, and competition among financial institutions, as well as client preferences, interest rate conditions and prevailing market rates on competing products in our market areas.
CRITICAL ACCOUNTING POLICIES
We have adopted various accounting policies that govern the application of accounting principles generally accepted in the U.S. and with general practices within the banking industry in the preparation of our financial statements. Our significant accounting policies are described in Note 1 to our Consolidated Financial Statements as of December 31, 2017.
Certain accounting policies involve significant judgments and assumptions by us that have a material impact on the carrying value of certain assets and liabilities. We consider these accounting policies to be critical accounting policies.
40
The judgment and assumptions we use are based on historical experience and other factors, which we believe to be reasonable under the circumstances. Because of the nature of the judgment and assumptions we make, actual results could differ from these judgments and estimates that could have a material impact on the carrying values of our assets and liabilities and our results of operations. Management has reviewed and approved these critical accounting policies and has discussed these policies with the Company’s Audit Committee.
Allowance for Loan Losses
The allowance for loan loss is management’s estimate of credit losses inherent in the loan portfolio. The allowance for loan losses is established as losses are estimated to have occurred through a provision for loan losses charged to earnings. Loan losses are charged against the allowance when management believes the uncollectibility of a loan balance is confirmed. Subsequent recoveries, if any, are credited to the allowance. The allowance for loan losses is evaluated on a regular basis by management and is based upon management’s periodic review of the collectability of the loans in light of historical experience, the nature and volume of the loan portfolio, adverse situations that may affect the borrower’s ability to repay, estimated value of any underlying collateral and prevailing economic conditions. This evaluation is inherently subjective as it requires estimates that are susceptible to significant revision as more information becomes available.
We have an established process to determine the adequacy of the allowance for loan losses that assesses the losses inherent in our portfolio. While we attribute portions of the allowance to specific portfolio segments, the entire allowance is available to absorb credit losses inherent in the total loan portfolio. Our process involves procedures to appropriately consider the unique risk characteristics of our commercial and consumer loan portfolio segments. For each portfolio segment, impairment is measured individually for each impaired loan. Our allowance levels are influenced by loan volume, loan grade or delinquency status, historic loss experience and other economic conditions.
The allowance consists of general and specific components.
Commercial loans are assessed for estimated losses by grading each loan using various risk factors identified through periodic reviews. We apply historic grade-specific loss factors to each loan class. In the development of our statistically derived loan grade loss factors, we observe historical losses over 20 quarters for each loan grade. These loss estimates are adjusted as appropriate based on additional analysis of external loss data or other risks identified from current economic conditions and credit quality trends. For consumer loans, we determine the allowance on a collective basis utilizing historical losses over 20 quarters to represent our best estimate of inherent loss. We pool loans, generally by loan class with similar risk characteristics.
Included in the general component of the allowance for loan losses for both portfolio segments is a margin of imprecision inherent in the underlying assumptions used in the methodologies for estimating general losses in the portfolio. Uncertainties and subjective issues such as changes in the lending policies and procedures, changes in the local/national economy, changes in volume or type of credits, changes in volume/severity or problem loans, quality of loan review and board of director oversight, concentrations of credit, and peer group comparisons are qualitative and environmental factors considered.
The specific component relates to loans that are classified as impaired. For loans that are classified as impaired, an allowance is established when the value of the impaired loan is lower than the carrying value of that loan. A loan is considered impaired when, based on current information and events, it is probable that the Company will be unable to collect the scheduled payments of principal or interest when due according to the contractual terms of the loan agreement. Factors considered by management in determining impairment include payment status, collateral value, and the probability of collecting scheduled principal and interest payments when due. Impairment is measured on a loan by loan basis for commercial and consumer loans by either the present value of expected future cash flows discounted at the loan’s effective interest rate, the loan’s obtainable market price, or the fair value of the collateral if the loan is collateral dependent. The specific component also includes an amount for the estimated impairment on commercial and consumer loans modified in a troubled debt restructuring (“TDR”), whether on accrual or nonaccrual status.
While management uses available information to recognize losses on loans, future additions to the allowance may be necessary based on changes in local economic conditions. In addition, regulatory agencies, as an integral part of their examination process, periodically review our allowance for loan losses. Such agencies may require us to recognize additions to the allowances based on their judgments about information available to them at the time of their examination.
41
Derivatives
Derivative instruments are used in relation to our mortgage banking activities and require significant judgment and estimates in determining their fair value. We hold derivative instruments, which consist of rate lock agreements related to expected funding of fixed-rate mortgage loans to customers (“interest rate lock commitments”) and forward commitments to sell mortgage-backed securities and individual fixed-rate mortgage loans (“forward commitments”). Our objective in obtaining the forward commitments is to mitigate the interest rate risk associated with the interest rate lock commitments and the mortgage loans that are held for sale. Derivatives related to these commitments are recorded as either a derivative asset or a derivative liability in the balance sheet and are measured at fair value. Both the interest rate lock commitments and the forward commitments are reported at fair value, with adjustments recorded in current period earnings in mortgage banking within the noninterest income section of the consolidated statements of income.
Fair Valuation of Financial Instruments
We use fair value measurements to record fair value adjustments to certain financial instruments and to determine fair value disclosures. Additionally, we may be required to record other assets at fair value on a nonrecurring basis. These nonrecurring fair value adjustments typically involve application of lower-of-cost-or-market accounting or write-downs of individual assets. Further, we include in the Notes to the Consolidated Financial Statements information about the extent to which fair value is used to measure assets and liabilities, the valuation methodologies used, and the related impact to income. Additionally, for financial instruments not recorded at fair value, we disclose the estimate of their fair value.
Fair value is defined as the price that would be received to sell the asset or paid to transfer the liability in an orderly transaction between market participants at the measurement date. Accounting standards establish a three-level hierarchy for disclosure of assets and liabilities recorded at fair value. The classification of assets and liabilities within the hierarchy is based on whether the inputs to the valuation methodology used for measurement are observable or unobservable. Observable inputs reflect market-derived or market-based information obtained from independent sources, while unobservable inputs reflect our estimates about market data. The three levels of inputs that are used to classify fair value measurements are as follows:
| ● |
Level 1 — Valuation is based upon quoted prices for identical instruments traded in active markets. Level 1 instruments generally include securities traded on active exchange markets, such as the New York Stock Exchange, as well as securities that are traded by dealers or brokers in active over-the-counter markets. Instruments we classify as Level 1 are instruments that have been priced directly from dealer trading desks and represent actual prices at which such securities have traded within active markets. |
| ● |
Level 2 — Valuation is based upon quoted prices for similar instruments in active markets, quoted prices for identical or similar instruments in markets that are not active, and model-based valuation techniques, such as matrix pricing, for which all significant assumptions are observable in the market. Instruments we classify as Level 2 include securities that are valued based on pricing models that use relevant observable information generated by transactions that have occurred in the market place that involve similar securities. |
| ● |
Level 3 — Valuation is generated from model-based techniques that use significant assumptions not observable in the market. These unobservable assumptions reflect the Company’s estimates of assumptions market participants would use in pricing the asset or liability. Valuation techniques include use of option pricing models, discounted cash flow models, and similar techniques. |
We attempt to maximize the use of observable inputs and minimize the use of unobservable inputs when developing fair value measurements. When available, we use quoted market prices to measure fair value. Specifically, we use independent pricing services to obtain fair values based on quoted prices. Quoted prices are subject to our internal price verification procedures. If market prices are not available, fair value measurement is based upon models that use primarily market-based or independently-sourced market parameters. Most of our financial instruments use either of the foregoing methodologies, collectively Level 1 and Level 2 measurements, to determine fair value adjustments recorded to our financial statements. However, in certain cases, when market observable inputs for model-based valuation techniques may not be readily available, we are required to make judgments about assumptions market participants would use in estimating the fair value of the financial instrument.
The degree of management judgment involved in determining the fair value of an instrument is dependent upon the availability of quoted market prices or observable market parameters. For instruments that trade actively and have quoted market prices or observable market parameters, there is minimal subjectivity involved in measuring fair value.
42
When observable market prices and parameters are not fully available, management’s judgment is necessary to estimate fair value. In addition, changes in market conditions may reduce the availability of quoted prices or observable data. For example, reduced liquidity in the capital markets or changes in secondary market activities could result in observable market inputs becoming unavailable. When significant adjustments are required to available observable inputs, it may be appropriate to utilize an estimate based primarily on unobservable inputs. When an active market for a security does not exist, the use of management estimates that incorporate current market participant expectations of future cash flows, and include appropriate risk premiums, is acceptable.
Significant judgment may be required to determine whether certain assets measured at fair value are included in Level 2 or Level 3. If fair value measurement is based upon recent observable market activity of such assets or comparable assets (other than forced or distressed transactions) that occur in sufficient volume and do not require significant adjustment using unobservable inputs, those assets are classified as Level 2. If not, they are classified as Level 3. Making this assessment requires significant judgment.
Other-Than-Temporary Impairment Analysis
Our debt securities are classified as securities available for sale and reported at fair value. Unrealized gains and losses, after applicable taxes, are reported in shareholders’ equity. We conduct other-than-temporary impairment (“OTTI”) analysis on a quarterly basis or more often if a potential loss-triggering event occurs. The initial indicator of OTTI for debt securities is a decline in market value below the amount recorded for an investment and the severity and duration of the decline. For a debt security for which there has been a decline in the fair value below amortized cost basis, we recognize OTTI if we (1) have the intent to sell the security, (2) it is more likely than not that we will be required to sell the security before recovery of its amortized cost basis, or (3) we do not expect to recover the entire amortized cost basis of the security.
Other Real Estate Owned
Real estate acquired through foreclosure is initially recorded at the lower of cost or estimated fair value less selling costs. Subsequent to the date of acquisition, it is carried at the lower of cost or fair value, adjusted for net selling costs. Fair values of real estate owned are reviewed regularly and write-downs are recorded when it is determined that the carrying value of real estate exceeds the fair value less estimated costs to sell. Costs relating to the development and improvement of such property are capitalized, whereas those costs relating to holding the property are expensed.
Income Taxes
The financial statements have been prepared on the accrual basis. When income and expenses are recognized in different periods for financial reporting purposes versus for the purposes of computing income taxes currently payable, deferred taxes are provided on such temporary differences. Deferred tax assets and liabilities are recognized for the expected future tax consequences of events that have been recognized in the consolidated financial statements or tax returns. Deferred tax assets and liabilities are measured using the enacted tax rates expected to apply to taxable income in the years in which those temporary differences are expected to be realized or settled. The Company believes that its income tax filing positions taken or expected to be taken on its tax returns will more likely than not be sustained upon audit by the taxing authorities and does not anticipate any adjustments that will result in a material adverse impact on the Company's financial condition, results of operations, or cash flow. Therefore, no reserves for uncertain income tax positions have been recorded.
On December 22, 2017, the Tax Cuts and Jobs Act (the “Tax Act”) was signed into law. The legislation significantly changes U.S. tax law by, among other things, lowering corporate income tax rates from a maximum of 35% to a flat 21% rate, effective January 1, 2018. The SEC staff issued Staff Accounting Bulletin No. 118 (“SAB 118”) to address the application of U.S. GAAP in situations when a registrant does not have the necessary information available, prepared, or analyzed (including computations) in reasonable detail to complete the accounting for certain income tax effects of the Tax Act. The Company has recognized the provisional tax impacts related to the revaluation of deferred tax assets and liabilities and included these amounts in its consolidated financial statements for the year ended December 31, 2017. The ultimate impact may differ from these provisional amounts, possible materially, due to among other things, additional analysis, changes in interpretations and assumptions the Company has made, additional regulatory guidance that may be issued, and actions the Company may take as a result of the Tax act. The accounting is expected to be complete when the 2017 U.S. corporate income tax return is filed in 2018.
43
RESULTS OF OPERATIONS
Net Interest Income and Margin
Our level of net interest income is determined by the level of earning assets and the management of our net interest margin. For the years ended December 31, 2017, 2016, and 2015, our net interest income was $50.9 million, $43.0 million, and $38.5 million, respectively. The $7.9 million, or 18.3%, increase in net interest income during 2017 was driven by a $238.3 million increase in average earning assets, partially offset by a $167.3 million increase in our average interest-bearing liabilities. The increase in average earning assets is primarily related to an increase in average loans, while the increase in average interest-bearing liabilities is driven by an increase in interest-bearing deposits. During 2016, our net interest income increased $4.5 million, or 11.6%, while average interest-earning assets increased $125.6 million and average interest-bearing liabilities increased by $75.8 million.
Interest income for the years ended December 31, 2017, 2016, and 2015 was $61.2 million, $51.2 million, and $46.0 million, respectively. A significant portion of our interest income relates to our strategy to maintain a large portion of our assets in higher earning loans compared to lower yielding investments and federal funds sold. As such, 96.1% of our interest income related to interest on loans during 2017, 96.3% during 2016 and 96.3% during 2015. Also, included in interest income on loans was $950,000, $816,000 and $1.1 million related to the net amortization of loan fees and capitalized loan origination costs for the years ended December 31, 2017, 2016 and 2015, respectively.
Interest expense was $10.3 million, $8.2 million, and $7.5 million for the years ended December 31, 2017, 2016, and 2015, respectively. Interest expense on deposits for the years ended December 31, 2017, 2016 and 2015 represented 71.4%, 48.1%, and 47.8% of total interest expense, respectively, while interest expense on borrowings represented 28.6%, 51.9%, and 52.2% of total interest expense, respectively. The increase in interest expense on deposits during 2017 occurred as a result of a $290.0 million increase in our deposit balances which assisted in replacing $48.0 million of FHLB advances and other borrowings, as they matured during the year.
We have included a number of tables to assist in our description of various measures of our financial performance. For example, the “Average Balances, Income and Expenses, Yields and Rates” table shows the average balance of each category of our assets and liabilities as well as the yield we earned or the rate we paid with respect to each category during 2017, 2016, and 2015. Similarly, the “Rate/Volume Analysis” table demonstrates the effect of changing interest rates and changing volume of assets and liabilities on our financial condition during the periods shown. We also track the sensitivity of our various categories of assets and liabilities to changes in interest rates, and we have included tables to illustrate our interest rate sensitivity with respect to interest-earning and interest-bearing accounts.
The following table sets forth information related to our average balance sheet, average yields on assets, and average costs of liabilities at December 31, 2017, 2016 and 2015. We derived these yields or costs by dividing income or expense by the average balance of the corresponding assets or liabilities. We derived average balances from the daily balances throughout the periods indicated. During the same periods, we had no securities purchased with agreements to resell. All investments were owned at an original maturity of over one year. Nonaccrual loans are included in earning assets in the following tables. Loan yields have been reduced to reflect the negative impact on our earnings of loans on nonaccrual status. The net of capitalized loan costs and fees are amortized into interest income on loans.
44
Average Balances, Income and Expenses, Yields and Rates
| For the Year Ended December 31, | ||||||||||||||||||||||||||||
| 2017 | 2016 | 2015 | ||||||||||||||||||||||||||
| Average | Income/ | Yield/ | Average | Income/ | Yield/ | Average | Income/ | Yield/ | ||||||||||||||||||||
| (dollars in thousands) | Balance | Expense | Rate | Balance | Expense | Rate | Balance | Expense | Rate | |||||||||||||||||||
| Interest-earning assets | ||||||||||||||||||||||||||||
| Federal funds sold | $ | 66,924 | $ | 784 | 1.17% | $ | 28,325 | $ | 165 | 0.58% | $ | 44,299 | $ | 137 | 0.31% | |||||||||||||
| Investment securities, taxable | 57,008 | 1,150 | 2.02% | 61,410 | 1,196 | 1.95% | 48,029 | 1,119 | 2.33% | |||||||||||||||||||
| Investment securities, nontaxable (1) | 19,331 | 753 | 3.90% | 20,550 | 832 | 4.05% | 16,477 | 739 | 4.48% | |||||||||||||||||||
| Loans (2) | 1,289,033 | 58,808 | 4.56% | 1,083,676 | 49,315 | 4.55% | 959,531 | 44,316 | 4.62% | |||||||||||||||||||
| Total earning assets | 1,432,296 | 61,495 | 4.29% | 1,193,961 | 51,508 | 4.31% | 1,068,336 | 46,311 | 4.33% | |||||||||||||||||||
| Nonearning assets | 71,352 | 61,033 | 55,313 | |||||||||||||||||||||||||
| Total assets | $ | 1,503,648 | $ | 1,254,994 | $ | 1,123,649 | ||||||||||||||||||||||
| Interest-bearing liabilities | ||||||||||||||||||||||||||||
| NOW accounts | $ | 218,355 | 391 | 0.18% | $ | 204,613 | 323 | 0.16% | $ | 171,161 | 294 | 0.17% | ||||||||||||||||
| Savings & money market | 479,012 | 3,744 | 0.78% | 330,237 | 1,394 | 0.42% | 271,439 | 1,085 | 0.40% | |||||||||||||||||||
| Time deposits | 309,546 | 3,238 | 1.05% | 270,356 | 2,224 | 0.82% | 286,526 | 2,206 | 0.77% | |||||||||||||||||||
| Total interest-bearing deposits | 1,006,913 | 7,373 | 0.73% | 805,206 | 3,941 | 0.49% | 729,126 | 3,585 | 0.49% | |||||||||||||||||||
| FHLB advances and other borrowings | 82,810 | 2,510 | 3.03% | 117,251 | 3,869 | 3.30% | 117,556 | 3,587 | 3.05% | |||||||||||||||||||
| Junior subordinated debt | 13,403 | 450 | 3.36% | 13,403 | 382 | 2.85% | 13,403 | 329 | 2.45% | |||||||||||||||||||
| Total interest-bearing liabilities | 1,103,126 | 10,333 | 0.94% | 935,860 | 8,192 | 0.88% | 860,085 | 7,501 | 0.87% | |||||||||||||||||||
| Noninterest-bearing liabilities | 265,498 | 216,727 | 174,497 | |||||||||||||||||||||||||
| Shareholders’ equity | 135,024 | 102,407 | 89,067 | |||||||||||||||||||||||||
| Total liabilities and shareholders’ equity | $ | 1,503,648 | $ | 1,254,994 | $ | 1,123,649 | ||||||||||||||||||||||
| Net interest spread | 3.35% | 3.43% | 3.46% | |||||||||||||||||||||||||
| Net interest income(tax equivalent)/margin | $ | 51,162 | 3.57% | $ | 43,316 | 3.63% | $ | 38,810 | 3.63% | |||||||||||||||||||
| Less: tax-equivalent adjustment (1) | (286 | ) | (317 | ) | (281 | ) | ||||||||||||||||||||||
| Net interest income | $ | 50,876 | $ | 42,999 | $ | 38,529 | ||||||||||||||||||||||
| (1) | The tax-equivalent adjustment to net interest income adjusts the yield for assets earning tax-exempt income to a comparable yield on a taxable basis. | |
| (2) | Includes loans held for sale. |
Our net interest margin, on a tax-equivalent basis, was 3.57% for the twelve months ended December 31, 2017 and 3.63% for 2016 and 2015. The main driver of the six basis point decrease in net interest margin during the 2017 period was a 24 basis point increase in the cost of our interest-bearing deposits, primarily money market and time deposits. During 2016, our net interest margin remained consistent when compared to the year ended 2015, although the yield on our interest earning assets declined by two basis points, driven by a seven basis point decline in loan yield. In addition, the cost of our interest-bearing liabilities increased one basis point during the 2016 period due primarily to an increase in the cost of our variable rate borrowings.
Our average interest-earning assets increased by $238.3 million during the year ended December 31, 2017 compared to the year ended December 31, 2016, while the related yield on our interest-earning assets decreased by two basis points. The increase in average interest earning assets was driven by a $205.4 million increase in average loan balances during 2017 compared to 2016. In addition, our average federal funds sold balances increased by $38.6 million during the 2017 period while our average investment balances decreased by $5.6 million. The two basis point decline in yield during the 2017 period was driven by the increase in average federal funds sold at yields much lower than the remainder of our interest earning assets. During the year ended December 31, 2016, our average interest-earning assets increased by $125.6 million compared to the year ended December 31, 2015, while the yield on our interest-earning assets decreased by two basis points during the 2016 period. Our average loan balances increased by $124.1 million during 2016 compared to 2015, while our loan yield decreased by seven basis points during the same period. In addition, our average federal funds sold balances decreased by $16.0 million during the 2016 period. The decline in the yield on our interest-earning assets during 2016 was driven primarily by reduced yields on our loan portfolio, combined with a higher level of federal funds sold which have a lower yield than the rest of our interest-earning assets.
Our average interest-bearing liabilities increased by $167.3 million during 2017 as compared to 2016, while the cost of our interest-bearing liabilities increased by six basis points. The increase in average interest-bearing liabilities was driven by a $201.7 million increase in average interest-bearing deposits during the 2017 period, while the cost related to our deposits increased 24 basis points when compared with the prior year. In addition, our average FHLB advances and other borrowings decreased by $34.4 million during the year, partially offsetting the increase in cost of our interest-bearing deposits as these borrowings were at rates much higher than those of our interest-bearing deposits. During 2016, our average interest-bearing liabilities increased by $75.8 million as compared to 2015, while the cost of our interest-bearing liabilities increased by one basis point during the 2016 period.
45
Our net interest spread was 3.35% for the year ended December 31, 2017 compared to 3.43% for the same period in 2016 and 3.46% for 2015. The net interest spread is the difference between the yield we earn on our interest-earning assets and the rate we pay on our interest-bearing liabilities. The two basis point reduction in yield on our interest-earning assets and the six basis point increase in the cost of our interest-bearing liabilities, resulted in an eight basis point decrease in our net interest spread for the 2017 period.
Rate/Volume Analysis
Net interest income can be analyzed in terms of the impact of changing interest rates and changing volume. The following tables set forth the effect which the varying levels of interest-earning assets and interest-bearing liabilities and the applicable rates have had on changes in net interest income for the periods presented.
| Years Ended | ||||||||||||||||||||||||
| December 31, 2017 vs. 2016 | December 31, 2016 vs. 2015 | |||||||||||||||||||||||
| Increase (Decrease) Due to Change in | Increase (Decrease) Due to Change in | |||||||||||||||||||||||
| Rate/ | Rate/ | |||||||||||||||||||||||
| (dollars in thousands) | Volume | Rate | Volume | Total | Volume | Rate | Volume | Total | ||||||||||||||||
| Interest income | ||||||||||||||||||||||||
| Loans | $ | 9,345 | 124 | 24 | 9,493 | 5,583 | (517 | ) | (67 | ) | 4,999 | |||||||||||||
| Investment securities | (117 | ) | 25 | (2 | ) | (94 | ) | 412 | (219 | ) | (59 | ) | 134 | |||||||||||
| Federal funds sold | 225 | 167 | 227 | 619 | (49 | ) | 120 | (43 | ) | 28 | ||||||||||||||
| Total interest income | 9,453 | 316 | 249 | 10,018 | 5,946 | (616 | ) | (169 | ) | 5,161 | ||||||||||||||
| Interest expense | ||||||||||||||||||||||||
| Deposits | 1,011 | 1,927 | 494 | 3,432 | 453 | (86 | ) | (11 | ) | 356 | ||||||||||||||
| FHLB advances and other borrowings | (1,494 | ) | 219 | (84 | ) | (1,359 | ) | (9 | ) | 292 | (1 | ) | 282 | |||||||||||
| Junior subordinated debt | - | 68 | - | 68 | - | 53 | - | 53 | ||||||||||||||||
| Total interest expense | (483 | ) | 2,214 | 410 | 2,141 | 444 | 259 | (12 | ) | 691 | ||||||||||||||
| Net interest income | $ | 9,936 | (1,898 | ) | (161 | ) | 7,877 | 5,502 | (875 | ) | (157 | ) | 4,470 | |||||||||||
Net interest income, the largest component of our income, was $50.9 million for the year ended December 31, 2017, a $7.9 million increase from net interest income of $43.0 million for the year ended December 31, 2016. The increase in net interest income is due to a $10.0 million increase in interest income partially offset by a $2.1 million increase in interest expense. During 2017, our average interest-earning assets increased $238.3 million as compared to 2016, resulting in $9.5 million of additional interest income, while higher rates on our interest-earning assets also increased interest income by $316,000 from the prior year. Overall, our average interest-bearing deposits increased by $201.7 million while our average FHLB advances and other borrowings decreased by $34.4 million. While the growth in interest-bearing deposits resulted in additional interest expense, the reduction in FHLB advances and other borrowings reduced our interest expense, resulting in a net decrease in interest expense of $483,000. However, higher rates on all of our interest-bearing liabilities increased interest expense by $2.2 million from the prior year.
During 2016, our average interest-earning assets increased $125.6 million as compared to 2015, resulting in $5.9 million of additional interest income; however, lower rates on our interest-earning assets reduced interest income by $616,000 from the prior year. In addition, interest-bearing liabilities increased by $75.8 million during 2016, resulting in $444,000 of additional interest expense. In addition, higher rates on our interest-bearing liabilities increased interest expense by $259,000 from the prior year.
Provision for Loan Losses
We have established an allowance for loan losses through a provision for loan losses charged as an expense on our statements of income. We review our loan portfolio periodically to evaluate our outstanding loans and to measure both the performance of the portfolio and the adequacy of the allowance for loan losses. Please see the discussion below under “Results of Operations – Allowance for Loan Losses” for a description of the factors we consider in determining the amount of the provision we expense each period to maintain this allowance.
46
Following is a summary of the activity in the allowance for loan losses.
| December 31, | ||||||||||
| (dollars in thousands) | 2017 | 2016 | 2015 | |||||||
| Balance, beginning of period | $ | 14,855 | 13,629 | 11,752 | ||||||
| Provision | 2,000 | 2,300 | 3,200 | |||||||
| Loan charge-offs | (1,638 | ) | (1,648 | ) | (1,508 | ) | ||||
| Loan recoveries | 306 | 574 | 185 | |||||||
| Net loan charge-offs | (1,332 | ) | (1,074 | ) | (1,323 | ) | ||||
| Balance, end of period | $ | 15,523 | 14,855 | 13,629 | ||||||
For the year ended December 31, 2017, we incurred a noncash expense related to the provision for loan losses of $2.0 million, bringing the allowance for loan losses to $15.5 million, or 1.12% of gross loans, as of December 31, 2017. In comparison, we added $2.3 million and $3.2 million to the provision for loan losses during the years ended December 31, 2016 and 2015, respectively, resulting in an allowance for loan losses of $14.9 million, or 1.28% of gross loans, as of December 31, 2016, and an allowance for loan losses of $13.6 million, or 1.36% of gross loans, as of December 31, 2015. The lesser provision expense of $2.0 million during 2017 relates primarily to the continued improvement in the credit quality of our loan portfolio.
During the twelve months ended December 31, 2017, our net charge-offs were $1.3 million, representing 0.10% of average loans, and consisted of $1.6 million in loans charged-off, partially offset by $306,000 of recoveries on loans previously charged-off. In addition, nonperforming assets remained at 0.46% of total assets while our level of classified assets declined to 9.7% at December 31, 2017 from 13.2% at December 31, 2016. Factors such as these are also considered in determining the amount of loan loss provision necessary to maintain our allowance for loan losses at an adequate level. The continued improvement in these credit quality factors is the primary driver of the reduction in the allowance for loan losses as a percentage of our total loans.
We reported net charge-offs of $1.1 million and $1.3 million for the years ended December 31, 2016 and 2015, respectively, including recoveries of $574,000 and $185,000 in 2016 and 2015, respectively. The net charge-offs of $1.1 million and $1.3 million during 2016 and 2015, respectively, represented 0.10% and 0.14% of the average outstanding loan portfolios for the respective years.
Noninterest Income
The following tables set forth information related to our noninterest income.
| Year ended December 31, | |||||||
| (dollars in thousands) | 2017 | 2016 | 2015 | ||||
| Mortgage banking income | $ | 5,152 | 6,837 | 4,963 | |||
| Service fees on deposit accounts | 1,168 | 1,002 | 893 | ||||
| Income from bank owned life insurance | 811 | 736 | 685 | ||||
| Gain on sale of investment securities | 4 | 431 | 297 | ||||
| Other income | 2,202 | 1,840 | 1,578 | ||||
| Total noninterest income | $ | 9,337 | 10,846 | 8,416 | |||
Noninterest income was $9.3 million for the year ended December 31, 2017, a $1.5 million, or 13.9%, decrease compared to noninterest income of $10.8 million for the year ended December 31, 2016. The change in total noninterest income during 2017 resulted primarily from the following:
| ● |
Mortgage banking income decreased $1.7 million, or 24.6%, driven by lower origination volume during 2017 due to an overall increase in the average market rate for new mortgage loan originations. |
| ● |
Service fees on deposit accounts increased $167,000, or 16.7%, and include service charges and other fees such as non-sufficient funds (“NSF”), stop payment fees, overdraft fee income and returned item fees. |
| ● |
Other income increased by $361,000, or 19.6%, due primarily to increased income on our ATM and debit cards and wire fees, both of which are driven by an increase in transaction volume, as well as increased loan fee income, which includes late fees, appraisal review fees, and line of credit fees. |
47
Noninterest income was $10.8 million for the year ended December 31, 2016, a $2.4 million, or 28.9%, increase over noninterest income of $8.4 million for the year ended December 31, 2015. The increase in total noninterest income during 2016 resulted primarily from the following:
| ● |
Mortgage banking income increased $1.9 million, or 37.8%, driven primarily by a transition to mandatory delivery of mortgage loans to the secondary market in April 2016 (which traditionally results in a higher profit margin upon sale) combined with an increased volume of loans originated. |
| ● |
Service fees on deposit accounts increased $109,000, or 12.2%, and include service charges such as non-sufficient funds (“NSF”), stop payment fees, overdraft fee income and returned item fees. |
| ● |
Other income increased by $262,000, or 16.6%, due primarily to increased loan fee income, which includes late fees, appraisal review fees, and line of credit fees, as well as increased income on our ATM and debit cards and wire fees, both of which are driven by an increase in transaction volume. |
Noninterest Expenses
The following tables set forth information related to our noninterest expenses.
| Years ended December 31, | |||||||
| (dollars in thousands) | 2017 | 2016 | 2015 | ||||
|
Compensation and benefits |
$ | 21,791 | 18,969 | 17,048 | |||
| Occupancy | 4,121 | 3,582 | 3,310 | ||||
| Other real estate owned expenses | 228 | 1,215 | 1,142 | ||||
| Outside service and data processing costs | 3,158 | 2,654 | 2,447 | ||||
| Insurance | 1,146 | 962 | 855 | ||||
| Professional fees | 1,362 | 1,208 | 987 | ||||
| Marketing | 737 | 807 | 870 | ||||
| Other | 2,009 | 1,779 | 1,550 | ||||
| Total noninterest expenses | $ | 34,552 | 31,176 | 28,209 | |||
Noninterest expense was $34.6 million for the year ended December 31, 2017, a $3.4 million, or 10.8%, increase from noninterest expense of $31.2 million for 2016.
The increase in total noninterest expenses resulted primarily from the following:
| ● |
Compensation and benefits expense increased $2.8 million, or 14.9%, during 2017 relating primarily to increases in base and incentive compensation as well as benefits expense. Base compensation expense increased by $1.9 million driven by the cost of 19 additional employees compared to the prior year, three of which were hired in relation to our new office in Atlanta, Georgia; five of which were hired as additional team leaders or mortgage executives in our existing markets; and the remainder of which were hired to support loan and deposit growth. Benefits expense, which includes insurance and 401k expenses, increased by $826,000. Incentive compensation, which is based on certain targeted financial performance goals met by management, increased by $166,000. |
| ● |
Occupancy expenses increased $539,000, or 15.0%, driven by increased rent expense as well as additional insurance, property taxes and maintenance expenses related to our new properties in Charleston, South Carolina and Raleigh, North Carolina. |
| ● |
Other real estate owned expenses decreased $987,000, or 81.2%, and includes $184,000 of write-downs related to seven properties and $44,000 of expenses related to the management of properties we own. |
| ● |
Outside services and data processing costs increased $504,000, or 19.0%, related primarily to increased software licensing and maintenance costs as well as ATM/Debit card-related expenses and FHLB letter of credit fees. |
| ● |
Professional fees increased by $154,000, or 12.7%, due to increased legal and accounting costs primarily related to the increased size of our institution as well as professional service fees related to our mortgage operations. |
| ● |
Other noninterest expenses increased by $230,000, or 12.9%, driven by an increase in travel and entertainment expenses, business meals, dues and subscriptions and bank staff expense. |
Noninterest expense was $31.2 million for the year ended December 31, 2016, a $3.0 million, or 10.5%, increase from noninterest expense of $28.2 million for 2015.
48
The increase in total noninterest expenses resulted primarily from the following:
| ● |
Compensation and benefits expense increased $1.9 million, or 11.3%, during 2016 relating primarily to increases in base and incentive compensation. Base compensation expense increased by $1.8 million driven by the cost of 12 additional employees, six of whom were hired in relation to our new office in Raleigh, North Carolina, with the remainder being hired to support our growth in loans and deposits, combined with annual salary increases. Incentive compensation, which is based on certain targeted financial performance goals met by management, increased by $332,000. |
| ● |
Occupancy expenses increased $272,000, or 8.2%, driven by increased rent expense as well as additional insurance, property taxes and maintenance expenses on our properties. |
| ● |
Other real estate owned expenses increased $73,000, or 6.4%, and includes $428,000 of losses on sales of four properties, $466,000 of write-downs related to six properties, and $321,000 of expenses related to the management of properties we own. |
| ● |
Outside services and data processing costs increased $207,000, or 8.5%, related primarily to increased software licensing and maintenance costs as well as ATM/Debit card-related expenses and FHLB letter of credit fees. |
| ● |
Professional fees increased by $221,000, or 22.4%, due to increased legal and accounting costs primarily related to the increased size of our institution as well as professional service fees related to our mortgage operations. |
| ● |
Other noninterest expenses increased by $229,000, or 14.8%, driven by an increase in travel and entertainment expenses, business meals, and deposit account losses. |
Our efficiency ratio was 57.4% for 2017 compared to 57.9% for 2016. The efficiency ratio represents the percentage of one dollar of expense required to be incurred to earn a full dollar of revenue and is computed by dividing noninterest expense by the sum of net interest income and noninterest income. The slightly improved efficiency ratio during 2017 relates primarily to the increase in net interest income due to significant loan growth and increased loan yields.
Income tax expense was $10.6 million, $7.3 million and $5.4 million for the years ended December 31, 2017, 2016 and 2015, respectively. Our effective tax rate was 44.9% for the year ended December 31, 2017, and 36.0% and 34.6% for the years ended December 31, 2016 and 2015, respectively. Included in income tax expense for the 2017 period is $2.4 million of income tax expense related to the revaluation of our deferred tax asset as a result of the reduction in the U.S. federal statutory income tax rate to 21% under the Tax Act enacted on December 22, 2017.
Investment Securities
At December 31, 2017, the $72.1 million in our investment securities portfolio represented approximately 4.4% of our total assets. Our available for sale investment portfolio included U.S. agency securities, SBA securities, state and political subdivisions, and mortgage-backed securities with a fair value of $67.6 million and amortized cost of $68.2 million for an unrealized loss of $578,000.
The amortized costs and the fair value of our investments are as follows.
| December 31, | |||||||||||||
| 2017 | 2016 | 2015 | |||||||||||
| Amortized | Fair | Amortized | Fair | Amortized | Fair | ||||||||
| (dollars in thousands) | Cost | Value | Cost | Value | Cost | Value | |||||||
| Available for Sale | |||||||||||||
| US government agencies | $ | 8,749 | 8,653 | 6,271 | 6,159 | 14,711 | 14,599 | ||||||
| SBA securities | 4,087 | 4,063 | 1,453 | 1,437 | 6,410 | 6,277 | |||||||
| State and political subdivisions | 11,242 | 11,396 | 20,625 | 20,474 | 21,771 | 22,259 | |||||||
| Mortgage-backed securities | 44,103 | 43,491 | 36,895 | 36,410 | 47,053 | 46,804 | |||||||
| Total | $ | 68,181 | 67,603 | 65,244 | 64,480 | 89,945 | 89,939 | ||||||
49
Contractual maturities and yields on our investments are shown in the following table. Expected maturities may differ from contractual maturities because issuers may have the right to call or prepay obligations with or without call or prepayment penalties.
| December 31, 2017 | |||||||||||||||||||||||||
| Less Than One Year | One to Five Years | Five to Ten Years | Over Ten Years | Total | |||||||||||||||||||||
| (dollars in thousands) | Amount | Yield | Amount | Yield | Amount | Yield | Amount | Yield | Amount | Yield | |||||||||||||||
| Available for Sale | |||||||||||||||||||||||||
| US government agencies | $ | 995 | 1.15% | $ | 1,503 | 2.04% | $ | 6,155 | 2.40% | $ | - | - | $ | 8,653 | 2.20% | ||||||||||
| SBA securities | - | - | - | - | - | - | 4,063 | 2.45% | 4,063 | 2.45% | |||||||||||||||
| State and political subdivisions | - | - | 1,163 | 1.96% | 7,162 | 2.84% | 3,071 | 2.76% | 11,396 | 2.73% | |||||||||||||||
| Mortgage-backed securities | 432 | 0.99% | - | - | 11,328 | 1.84% | 31,731 | 2.06% | 43,491 | 1.99% | |||||||||||||||
| Total | $ | 1,427 | 1.10% | $ | 2,666 | 1.59% | $ | 24,645 | 2.27% | $ | 38,865 | 2.15% | $ | 67,603 | 2.17% | ||||||||||
Other investments are comprised of the following and are recorded at cost which approximates fair value.
| December 31, | |||||
| (dollars in thousands) | 2017 | 2016 | |||
| Federal Home Loan Bank stock | $ | 3,754 | 5,173 | ||
| Other investments | 305 | 166 | |||
| Investment in Trust Preferred subsidiaries | 403 | 403 | |||
| Total | $ | 4,462 | 5,742 | ||
Loans
Since loans typically provide higher interest yields than other types of interest-earning assets, a substantial percentage of our earning assets are invested in our loan portfolio. Average loans for the years ended December 31, 2017 and 2016 were $1.3 billion and $1.1 billion, respectively. Before allowance for loan losses, total loans outstanding at December 31, 2017 and 2016 were $1.4 billion and $1.2 billion, respectively.
The principal component of our loan portfolio is loans secured by real estate mortgages. As of December 31, 2017, our loan portfolio included $1.1 billion, or 82.1%, of real estate loans. As of December 31, 2016, loans secured by real estate made up 81.1% of our loan portfolio and totaled $943.5 million. Most of our real estate loans are secured by residential or commercial property. We obtain a security interest in real estate, in addition to any other available collateral. This collateral is taken to increase the likelihood of the ultimate repayment of the loan. Generally, we limit the loan-to-value ratio on loans to coincide with the appropriate regulatory guidelines. We attempt to maintain a relatively diversified loan portfolio to help reduce the risk inherent in concentration in certain types of collateral and business types. We do not generally originate traditional long term residential mortgages to hold in our loan portfolio, but we do issue traditional second mortgage residential real estate loans and home equity lines of credit. Home equity lines of credit totaled $156.1 million as of December 31, 2017, of which approximately 40% were in a first lien position, while the remaining balance was second liens, compared to $137.1 million as of December 31, 2016, of which approximately 39% were in first lien positions and the remaining balance was in second liens. The average loan had a balance of approximately $89,000 and a loan to value of approximately 71% as of December 31, 2017, compared to an average loan balance of $91,000 and a loan to value of approximately 73% as of December 31, 2016. Further, 0.8% and 0.3% of our total home equity lines of credit were over 30 days past due as of December 31, 2017 and 2016, respectively.
Following is a summary of our loan composition for each of the five years ended December 31, 2017. Of the $223.4 million in loan growth in 2017, $77.9 million of growth was in consumer related loans, while $145.5 million of growth was in commercial related loans. In addition, the $72.9 million increase in consumer real estate loans is related to our focus to continue to originate high quality 1-4 family consumer real estate loans. Our average consumer real estate loan currently has a principal balance of $375,000, a term of ten years, and an average rate of 4.30%.
50
| December 31, | ||||||||||||||||||||||||||||||
| 2017 | 2016 | 2015 | 2014 | 2013 | ||||||||||||||||||||||||||
| %of | %of | %of | %of | %of | ||||||||||||||||||||||||||
| (dollars in thousands) | Amount | Total | Amount | Total | Amount | Total | Amount | Total | Amount | Total | ||||||||||||||||||||
| Commercial | ||||||||||||||||||||||||||||||
| Owner occupied RE | $ | 316,818 | 22.8% | $ | 285,938 | 24.6% | $ | 236,083 | 23.5% | $ | 191,061 | 21.9% | $ | 185,129 | 25.1% | |||||||||||||||
| Non-owner occupied RE | 312,798 | 22.6% | 239,574 | 20.6% | 205,604 | 20.5% | 183,440 | 21.1% | 166,016 | 22.5% | ||||||||||||||||||||
| Construction | 51,179 | 3.7% | 33,393 | 2.9% | 41,751 | 4.1% | 50,995 | 5.8% | 30,906 | 4.2% | ||||||||||||||||||||
| Business | 226,158 | 16.3% | 202,552 | 17.4% | 171,743 | 17.1% | 149,986 | 17.2% | 129,687 | 17.6% | ||||||||||||||||||||
| Total commercial loans | 906,953 | 65.4% | 761,457 | 65.5% | 655,181 | 65.2% | 575,482 | 66.0% | 511,738 | 69.4% | ||||||||||||||||||||
| Consumer | ||||||||||||||||||||||||||||||
| Real estate | 273,050 | 19.7% | 215,588 | 18.5% | 174,802 | 17.4% | 146,859 | 16.9% | 110,590 | 15.5% | ||||||||||||||||||||
| Home equity | 156,141 | 11.3% | 137,105 | 11.8% | 116,563 | 11.6% | 95,629 | 11.0% | 78,479 | 10.6% | ||||||||||||||||||||
| Construction | 28,351 | 2.0% | 31,922 | 2.7% | 43,318 | 4.3% | 39,226 | 4.5% | 19,888 | 2.7% | ||||||||||||||||||||
| Other | 22,575 | 1.6% | 17,572 | 1.5% | 15,080 | 1.5% | 14,250 | 1.6% | 12,961 | 1.8% | ||||||||||||||||||||
| Total consumer loans | 480,117 | 34.6% | 402,187 | 34.5% | 349,763 | 34.8% | 295,964 | 34.0% | 221,918 | 30.6% | ||||||||||||||||||||
| Total gross loans, net of deferred fees | 1,387,070 | 100.0% | 1,163,644 | 100.0% | 1,004,944 | 100.0% | 871,446 | 100.0% | 733,656 | 100.0% | ||||||||||||||||||||
| Less – allowance for loan losses | (15,523 | ) | (14,855 | ) | (13,629 | ) | (11,752 | ) | (10,213 | ) | ||||||||||||||||||||
| Total loans, net | $ | 1,371,547 | $ | 1,148,789 | $ | 991,315 | $ | 859,694 | $ | 723,443 | ||||||||||||||||||||
Maturities and Sensitivity of Loans to Changes in Interest Rates
The information in the following table is based on the contractual maturities of individual loans, including loans which may be subject to renewal at their contractual maturity. Renewal of such loans is subject to review and credit approval, as well as modification of terms upon maturity. Actual repayments of loans may differ from the maturities reflected below because borrowers have the right to prepay obligations with or without prepayment penalties.
The following table summarizes the loan maturity distribution by type and related interest rate characteristics.
| December 31, 2017 | ||||||||||
| After one | ||||||||||
| One year | but within | After five | ||||||||
| (dollars in thousands) | or less | five years | years | Total | ||||||
| Commercial | ||||||||||
| Owner occupied RE | $ | 24,171 | 167,425 | 125,222 | 316,818 | |||||
| Non-owner occupied RE | 39,519 | 165,764 | 107,515 | 312,798 | ||||||
| Construction | 13,086 | 12,796 | 25,297 | 51,179 | ||||||
| Business | 73,588 | 107,584 | 44,986 | 226,158 | ||||||
| Total commercial loans | 150,364 | 453,569 | 303,020 | 906,953 | ||||||
| Consumer | ||||||||||
| Real estate | 30,172 | 61,809 | 181,069 | 273,050 | ||||||
| Home equity | 13,331 | 25,807 | 117,003 | 156,141 | ||||||
| Construction | 14,943 | 1,737 | 11,671 | 28,351 | ||||||
| Other | 7,203 | 11,371 | 4,001 | 22,575 | ||||||
| Total consumer loans | 65,649 | 100,724 | 313,744 | 480,117 | ||||||
| Total gross loan, net of deferred fees | $ | 216,013 | 554,293 | 616,764 | 1,387,070 | |||||
| Loans maturing – after one year with | ||||||||||
| Fixed interest rates | $ | 875,991 | ||||||||
| Floating interest rates | 295,066 | |||||||||
Nonperforming Assets
Nonperforming assets include real estate acquired through foreclosure or deed taken in lieu of foreclosure and loans on nonaccrual status. The following table shows the nonperforming assets and the related percentage of nonperforming assets to total assets and gross loans for the five years ended December 31, 2017. Generally, a loan is placed on nonaccrual status when it becomes 90 days past due as to principal or interest, or when we believe, after considering economic and business conditions and collection efforts, that the borrower’s financial condition is such that collection of the loan is doubtful. A payment of interest on a loan that is classified as nonaccrual is recognized as a reduction in principal when received. Our policy with respect to nonperforming loans requires the borrower to make a minimum of six consecutive payments in accordance with the loan terms before that loan can be placed back on accrual status. Further, the borrower must show capacity to continue performing into the future prior to restoration of accrual status. As of December 31, 2017 and 2016, we had no loans 90 days past due and still accruing.
51
| December 31, | |||||||||||
| (dollars in thousands) | 2017 | 2016 | 2015 | 2014 | 2013 | ||||||
| Commercial | |||||||||||
| Owner occupied RE | $ | - | 276 | 704 | 322 | 1,199 | |||||
| Non-owner occupied RE | 1,581 | 2,711 | 4,170 | 2,344 | 373 | ||||||
| Construction | - | - | - | 783 | 914 | ||||||
| Business | 910 | 686 | 779 | 1,408 | 712 | ||||||
| Consumer | |||||||||||
| Real estate | 992 | 550 | - | 457 | 76 | ||||||
| Home equity | 1,144 | 256 | 258 | 188 | 77 | ||||||
| Construction | - | - | - | - | - | ||||||
| Other | 1 | 13 | 5 | 1 | 3 | ||||||
| Nonaccruing troubled debt restructurings | 2,673 | 990 | 701 | 1,147 | 4,983 | ||||||
| Total nonaccrual loans, including nonaccruing TDRs | 7,301 | 5,482 | 6,617 | 6,650 | 8,337 | ||||||
| Other real estate owned | 242 | 639 | 2,475 | 3,307 | 1,198 | ||||||
| Total nonperforming assets | $ | 7,543 | 6,121 | 9,092 | 9,957 | 9,535 | |||||
| Nonperforming assets as a percentage of: | |||||||||||
| Total assets | 0.46% | 0.46% | 0.75% | 0.97% | 1.07% | ||||||
| Gross loans | 0.54% | 0.53% | 0.90% | 1.14% | 1.30% | ||||||
| Total loans over 90 days past due (1) | $ | 2,027 | 1,984 | 4,547 | 5,735 | 6,493 | |||||
| Loans over 90 days past due and still accruing | - | - | - | - | - | ||||||
| Accruing troubled debt restructurings | 5,145 | 5,675 | 7,266 | 8,562 | 8,045 | ||||||
| (1) |
Loans over 90 days are included in nonaccrual loans |
At December 31, 2017, nonperforming assets were $7.5 million, or 0.46% of total assets and 0.54% of gross loans. Comparatively, nonperforming assets were $6.1 million, or 0.46% of total assets and 0.53% of gross loans, at December 31, 2016. Nonaccrual loans increased $1.8 million to $7.3 million at December 31, 2017 from $5.5 million at December 31, 2016. During 2017, we added $3.8 million constituting 10 new loans to nonaccrual, while transferring four properties totaling $300,000 to real estate acquired in settlement of loans and charging off $555,000 on nonaccrual loans. The amount of foregone interest income on the nonaccrual loans for the years ended December 31, 2017 and 2016 was approximately $309,000 and $439,000, respectively.
Nonperforming assets include other real estate owned which decreased by $397,000 to $242,000 at December 31, 2017 from $639,000 at December 31, 2016. During 2017, we added three properties to other real estate owned for $288,000 and sold three properties for approximately $498,000 and recognized a $3,000 loss on the sales. In addition, we recorded write-downs on seven properties of $184,000. The balance at December 31, 2017 includes three commercial properties for $242,000. We believe that these properties are appropriately valued at the lower of cost or market as of December 31, 2017.
At December 31, 2017, 2016 and 2015, the allowance for loan losses represented 212.6%, 271.0%, and 206.0% of the amount of nonaccrual loans, respectively. A significant portion, or 85.1%, of nonaccrual loans at December 31, 2017 are secured by real estate. Our nonaccrual loans have been charged down to approximately 61% of their original nonperforming balance. We have evaluated the underlying collateral on these loans and believe that the collateral on these loans is sufficient to minimize future losses. As a result of this level of coverage on nonaccrual loans, we believe the allowance for loan losses of $15.5 million for the year ended December 31, 2017 to be adequate.
As a general practice, most of our loans are originated with relatively short maturities of less than 10 years. As a result, when a loan reaches its maturity we frequently renew the loan and thus extend its maturity using similar credit standards as those used when the loan was first originated. Due to these loan practices, we may, at times, renew loans which are classified as nonaccrual after evaluating the loan’s collateral value and financial strength of its guarantors. Nonaccrual loans are renewed at terms generally consistent with the ultimate source of repayment and rarely at reduced rates. In these cases the Bank will seek additional credit enhancements, such as additional collateral or additional guarantees to further protect the loan. When a loan is no longer performing in accordance with its stated terms, the Bank will typically seek performance under the guarantee.
52
In addition, approximately 82% of our loans are collateralized by real estate and approximately 80% of our impaired loans are secured by real estate. The Bank utilizes third party appraisers to determine the fair value of collateral dependent loans. Our current loan and appraisal policies require the Bank to obtain updated appraisals on an annual basis, either through a new external appraisal or an internal appraisal evaluation. Impaired loans are individually reviewed on a quarterly basis to determine the level of impairment. As of December 31, 2017, we do not have any impaired loans carried at a value in excess of the appraised value. We typically charge-off a portion or create a specific reserve for impaired loans when we do not expect repayment to occur as agreed upon under the original terms of the loan agreement.
At December 31, 2017, impaired loans totaled approximately $12.4 million for which $8.0 million of these loans have a reserve of approximately $3.7 million allocated in the allowance. During 2017, the average recorded investment in impaired loans was approximately $13.0 million. At December 31, 2016, impaired loans totaled approximately $11.2 million for which $7.5 million of these loans had a reserve of approximately $2.6 million allocated in the allowance. During 2016, the average recorded investment in impaired loans was approximately $11.6 million.
The Company considers a loan to be a TDR when the debtor experiences financial difficulties and the Company provides concessions such that we will not collect all principal and interest in accordance with the original terms of the loan agreement. Concessions can relate to the contractual interest rate, maturity date, or payment structure of the note. As part of our workout plan for individual loan relationships, we may restructure loan terms to assist borrowers facing challenges in the current economic environment. As of December 31, 2017, we determined that we had loans totaling $7.8 million, which we considered TDRs. As of December 31, 2016, we had loans totaling $6.7 million, which we considered TDRs. See Notes 1 and 5 to the Consolidated Financial Statements for additional information on TDRs.
In addition, potential problem loans, which are loans rated substandard and not included in nonperforming loans or TDRs, amounted to approximately $4.5 million, or 0.33% of gross loans at December 31, 2017, compared to $7.0 million, or 0.60% of gross loans at December 31, 2016. Potential problem loans represent those loans with a well-defined weakness and where information about possible credit problems of borrowers has caused management to have serious doubts about the borrower’s ability to comply with present repayment terms. The decrease in potential problem loans since December 31, 2016 is primarily the result of one individual commercial loan which was paid off during 2017, thus reducing total problem loans by approximately $2.3 million.
Allowance for Loan Losses
At December 31, 2017 and December 31, 2016, the allowance for loan losses was $15.5 million and $14.9 million, respectively, or 1.12% and 1.28% of outstanding loans, respectively. The allowance for loan losses as a percentage of our outstanding loan portfolio declined from the prior year as a result of the consistent credit quality of our loan portfolio during 2017, improved economic conditions and other qualitative factors. While our nonperforming assets increased by $1.8 million during the year ended December 31, 2017, our nonperforming assets as a percentage of total assets remained consistent at 0.46% and our classified assets declined to 9.7% of capital, as compared to 12.7% of capital for the year ended December 31, 2016. See Note 4 to the Consolidated Financial Statements for more information on our allowance for loan losses.
53
The following table summarizes the activity related to our allowance for loan losses for the five years ended December 31, 2017.
| Year ended December 31, | ||||||||||||||||
| (dollars in thousands) | 2017 | 2016 | 2015 | 2014 | 2013 | |||||||||||
| Balance, beginning of period | $ | 14,855 | 13,629 | 11,752 | 10,213 | 9,091 | ||||||||||
| Provision for loan losses | 2,000 | 2,300 | 3,200 | 4,175 | 3,475 | |||||||||||
| Loan charge-offs: | ||||||||||||||||
| Commercial | ||||||||||||||||
| Owner occupied RE | - | (5 | ) | (48 | ) | - | (390 | ) | ||||||||
| Non-owner occupied RE | (589 | ) | (100 | ) | (258 | ) | (2,069 | ) | (249 | ) | ||||||
| Construction | - | (42 | ) | (50 | ) | - | - | |||||||||
| Business | (638 | ) | (1,031 | ) | (881 | ) | (645 | ) | (1,664 | ) | ||||||
| Total commercial | (1,227 | ) | (1,178 | ) | (1,237 | ) | (2,714 | ) | (2,303 | ) | ||||||
| Consumer | ||||||||||||||||
| Real estate | - | (194 | ) | (173 | ) | (51 | ) | (22 | ) | |||||||
| Home equity | (400 | ) | (66 | ) | (93 | ) | (87 | ) | (106 | ) | ||||||
| Construction | - | - | - | - | - | |||||||||||
| Other | (11 | ) | (210 | ) | (5 | ) | (35 | ) | (47 | ) | ||||||
| Total consumer | (411 | ) | (470 | ) | (271 | ) | (173 | ) | (175 | ) | ||||||
| Total loan charge-offs | (1,638 | ) | (1,648 | ) | (1,508 | ) | (2,887 | ) | (2,478 | ) | ||||||
| Loan recoveries: | ||||||||||||||||
| Commercial | ||||||||||||||||
| Owner occupied RE | - | - | - | - | 1 | |||||||||||
| Non-owner occupied RE | 119 | 155 | 10 | 2 | 1 | |||||||||||
| Construction | - | - | - | 127 | - | |||||||||||
| Business | 86 | 403 | 129 | 117 | 115 | |||||||||||
| Total commercial | 205 | 558 | 139 | 246 | 117 | |||||||||||
| Consumer | ||||||||||||||||
| Real estate | 86 | 10 | - | - | - | |||||||||||
| Home equity | 13 | 1 | 46 | 5 | 8 | |||||||||||
| Construction | - | - | - | - | - | |||||||||||
| Other | 2 | 5 | - | - | - | |||||||||||
| Total consumer | 101 | 16 | 46 | 5 | 8 | |||||||||||
| Total recoveries | 306 | 574 | 185 | 251 | 125 | |||||||||||
| Net loan charge-offs | (1,332 | ) | (1,074 | ) | (1,323 | ) | (2,636 | ) | (2,353 | ) | ||||||
| Balance, end of period | $ | 15,523 | 14,855 | 13,629 | 11,752 | 10,213 | ||||||||||
| Allowance for loan losses to gross loans | 1.12% | 1.28% | 1.36% | 1.35% | 1.39% | |||||||||||
| Net charge-offs to average loans | 0.10% | 0.10% | 0.14% | 0.33% | 0.34% | |||||||||||
Deposits and Other Interest-Bearing Liabilities
Our primary source of funds for loans and investments is our deposits, advances from the FHLB, and structured repurchase agreements. In the past, we have chosen to obtain a portion of our certificates of deposits from areas outside of our market in order to obtain longer term deposits than are readily available in our local market. We have adopted guidelines regarding our use of brokered certificates of deposit that limit our brokered certificates of deposit to 20% of total deposits and dictate that our current interest rate risk profile determines the terms. In addition, we do not obtain time deposits of $100,000 or more through the Internet. These guidelines allow us to take advantage of the attractive terms that wholesale funding can offer while mitigating the related inherent risk.
Our retail deposits represented $1.4 billion, or 98.0% of total deposits at December 31, 2017, while our out-of-market, or brokered, deposits represented $28.1 million, or 2.0% of our total deposits at December 31, 2017. At December 31, 2016, retail deposits represented $1.0 billion, or 94.6% of our total deposits, and brokered deposits were $59.1 million, representing 5.4% of our total deposits, at December 31, 2016. Our loan-to-deposit ratio was 100%, 107%, and 102% at December 31, 2017, 2016, and 2015, respectively.
54
The following table shows the average balance amounts and the average rates paid on deposits held by us.
| December 31, | |||||||||||||||
| 2017 | 2016 | 2015 | |||||||||||||
| (dollars in thousands) | Amount | Rate | Amount | Rate | Amount | Rate | |||||||||
| Noninterest bearing demand deposits | $ | 264,162 | -% | $ | 206,401 | -% | $ | 165,847 | -% | ||||||
| Interest bearing demand deposits | 218,355 | 0.18% | 204,613 | 0.16% | 171,161 | 0.17% | |||||||||
| Money market accounts | 463,314 | 0.81% | 317,260 | 0.44% | 262,218 | 0.41% | |||||||||
| Savings accounts | 15,698 | 0.05% | 12,982 | 0.05% | 9,221 | 0.06% | |||||||||
| Time deposits less than $100,000 | 51,470 | 0.87% | 54,746 | 0.72% | 61,374 | 0.76% | |||||||||
| Time deposits greater than $100,000 | 258,076 | 1.08% | 215,605 | 0.85% | 225,152 | 0.77% | |||||||||
| Total deposits | $ | 1,271,075 | 0.58% | $ | 1,011,607 | 0.39% | $ | 894,973 | 0.40% | ||||||
During the 12 months ended December 31, 2017, our average transaction account balances increased by $220.3 million, or 29.7%, while our average time deposit balances increased by $39.2 million, or 14.5%. Core deposits exclude out-of-market deposits and time deposits of $250,000 or more and provide a relatively stable funding source for our loan portfolio and other earning assets. Our core deposits were $1.2 billion, $937.5 million, and $840.2 million at December 31, 2017, 2016 and 2015, respectively.
All of our time deposits are certificates of deposits. The maturity distribution of our time deposits of $100,000 or more is as follows:
| December 31, | |||||
| (dollars in thousands) | 2017 | 2016 | |||
| Three months or less | $ | 70,480 | 39,379 | ||
| Over three through six months | 42,327 | 30,964 | |||
| Over six through twelve months | 59,988 | 78,741 | |||
| Over twelve months | 65,915 | 62,883 | |||
| Total | $ | 238,710 | 211,967 | ||
Included in time deposits of $100,000 or more at December 31, 2017 is $28.1 million of wholesale CDs scheduled to mature within the next 12 months at a weighted average rate of 1.10%. Time deposits that meet or exceed the FDIC insurance limit of $250,000 at December 31, 2017 and December 31, 2016 were $131.7 million and $153.7 million, respectively.
Liquidity and Capital Resources
Liquidity represents the ability of a company to convert assets into cash or cash equivalents without significant loss, and the ability to raise additional funds by increasing liabilities. Liquidity management involves monitoring our sources and uses of funds in order to meet our day-to-day cash flow requirements while maximizing profits. Liquidity management is made more complicated because different balance sheet components are subject to varying degrees of management control. For example, the timing of maturities of our investment portfolio is fairly predictable and subject to a high degree of control at the time investment decisions are made. However, net deposit inflows and outflows are far less predictable and are not subject to the same degree of control.
At December 31, 2017 and 2016, our cash and cash equivalents amounted to $92.2 million and $46.6 million, or 5.7% and 3.5% of total assets, respectively. Our investment securities at December 31, 2017 and 2016 amounted to $72.1 million and $70.2 million, or 4.4% and 5.2% of total assets, respectively. Investment securities traditionally provide a secondary source of liquidity since they can be converted into cash in a timely manner. However, $11.4 million of these securities are pledged against outstanding debt. Therefore, the related debt would need to be repaid prior to the securities being sold in order for these securities to be converted to cash.
Our ability to maintain and expand our deposit base and borrowing capabilities serves as our primary source of liquidity. We plan to meet our future cash needs through the liquidation of temporary investments, the generation of deposits, and from additional borrowings. In addition, we will receive cash upon the maturity and sale of loans and the maturity of investment securities. We maintain four federal funds purchased lines of credit with correspondent banks totaling $72.0 million for which there were no borrowings against the lines at December 31, 2017.
55
We are also a member of the FHLB of Atlanta, from which applications for borrowings can be made. The FHLB requires that securities, qualifying mortgage loans, and stock of the FHLB owned by the Bank be pledged to secure any advances from the FHLB. The unused borrowing capacity currently available from the FHLB at December 31, 2017 was $242.2 million, based on the Bank’s $3.8 million investment in FHLB stock, as well as qualifying mortgages available to secure any future borrowings. However, we are able to pledge additional securities to the FHLB in order to increase our available borrowing capacity. In addition, at December 31, 2017 we had $165.1 million of letters of credit outstanding with the FHLB to secure client deposits.
We also have a line of credit with another financial institution for $15.0 million, which was unused at December 31, 2017. The line of credit bears interest at LIBOR plus 2.50% and matures on June 30, 2020.
We believe that our existing stable base of core deposits, federal funds purchased lines of credit with correspondent banks, and borrowings from the FHLB will enable us to successfully meet our long-term liquidity needs. However, as short-term liquidity needs arise, we have the ability to sell a portion of our investment securities portfolio to meet those needs.
Total shareholders’ equity was $149.7 million at December 31, 2017 and $109.9 million at December 31, 2016. The $39.8 million increase during 2017 is due primarily to the issuance of 805,000 shares of common stock on May 2, 2017 in a public offering. The common stock was issued at $32.75 per share for net proceeds of $24.8 million. Proceeds from the offering were used to improve our capital structure, including to repay our former $10.0 million line of credit with another financial institution, to fund future organic growth, and for working capital and other general corporate purposes. Net income to common shareholders of $13.0 million combined with $1.9 million in proceeds from the exercise of stock options and issuance of restricted stock also contributed to the increase in shareholders’ equity.
The following table shows the return on average assets (net income divided by average total assets), return on average equity (net income divided by average equity), and equity to assets ratio (average equity divided by average total assets) for the three years ended December 31, 2017. Since our inception, we have not paid cash dividends.
| December 31, | ||||||
| (dollars in thousands) | 2017 | 2016 | 2015 | |||
| Return on average assets | 0.87% | 1.04% | 0.90% | |||
| Return on average equity | 9.66% | 12.73% | 11.42% | |||
| Return on average common equity | 9.66% | 12.73% | 11.42% | |||
| Average equity to average assets ratio | 8.98% | 8.16% | 7.93% | |||
| Common equity to assets ratio | 9.21% |
8.19% |
7.74% | |||
Under the capital adequacy guidelines, regulatory capital is classified into two tiers. These guidelines require an institution to maintain a certain level of Tier 1 and Tier 2 capital to risk-weighted assets. Tier 1 capital consists of common shareholders’ equity, excluding the unrealized gain or loss on securities available for sale, minus certain intangible assets. In determining the amount of risk-weighted assets, all assets, including certain off-balance sheet assets, are multiplied by a risk-weight factor of 0% to 100% based on the risks believed to be inherent in the type of asset. Tier 2 capital consists of Tier 1 capital plus the general reserve for loan losses, subject to certain limitations. We are also required to maintain capital at a minimum level based on total average assets, which is known as the Tier 1 leverage ratio.
At both the holding company and Bank level, we are subject to various regulatory capital requirements administered by the federal banking agencies. To be considered “well-capitalized,” we must maintain total risk-based capital of at least 10%, Tier 1 capital of at least 6%, and a leverage ratio of at least 5%. To be considered “adequately capitalized” under these capital guidelines, we must maintain a minimum total risk-based capital of 8%, with at least 4% being Tier 1 capital. In addition, we must maintain a minimum Tier 1 leverage ratio of at least 4%. As of December 31, 2017, our capital ratios exceed these ratios and we remain “well capitalized.”
56
The following table summarizes the capital amounts and ratios of the Bank and the regulatory minimum requirements. See Note 22 to the Consolidated Financial Statements for ratios of the Company.
| To be well capitalized | |||||||||||||||
| under prompt | |||||||||||||||
| For capital | corrective | ||||||||||||||
| adequacy purposes | action provisions | ||||||||||||||
| Actual | minimum | minimum | |||||||||||||
| (dollars in thousands) | Amount | Ratio | Amount | Ratio | Amount | Ratio | |||||||||
| As of December 31, 2017 | |||||||||||||||
| Total Capital (to risk weighted assets) | $ | 175,016 | 12.99% | $ | 107,749 | 8.00% | $ | 134,686 | 10.00% | ||||||
| Tier 1 Capital (to risk weighted assets) | 159,493 | 11.84% | 80,812 | 6.00% | 107,749 | 8.00% | |||||||||
| Common Equity Tier 1 (to risk weighted assets) | 159,493 | 11.84% | 60,609 | 4.50% | 87,546 | 6.50% | |||||||||
| Tier 1 Capital (to average assets) | 159,493 | 10.04% | 63,573 | 4.00% | 79,466 | 5.00% | |||||||||
| As of December 31, 2016 | |||||||||||||||
| Total Capital (to risk weighted assets) | 132,839 | 11.69% | 90,910 | 8.00% | 113,638 | 10.00% | |||||||||
| Tier 1 Capital (to risk weighted assets) | 118,626 | 10.44% | 68,183 | 6.00% | 90,910 | 8.00% | |||||||||
| Common Equity Tier 1 (to risk weighted assets) | 118,626 | 10.44% | 51,137 | 4.50% | 73,864 | 6.50% | |||||||||
| Tier 1 Capital (to average assets) | 118,626 | 9.08% | 52,273 | 4.00% | 65,342 | 5.00% | |||||||||
| As of December 31, 2015 | |||||||||||||||
| Total Capital (to risk weighted assets) | 116,992 | 11.67% | 80,166 | 8.00% | 100,208 | 10.00% | |||||||||
| Tier 1 Capital (to risk weighted assets) | 104,452 | 10.42% | 60,125 | 6.00% | 80,166 | 8.00% | |||||||||
| Common Equity Tier 1 (to risk weighted assets) | 104,452 | 10.42% | 45,094 | 4.50% | 65,135 | 6.50% | |||||||||
| Tier 1 Capital (to average assets) | 104,452 | 8.57% | 48,753 | 4.00% | 60,941 | 5.00% | |||||||||
The ability of the Company to pay cash dividends is dependent upon receiving cash in the form of dividends from the Bank. The dividends that may be paid by the Bank to the Company are subject to legal limitations and regulatory capital requirements.
Effect of Inflation and Changing Prices
The effect of relative purchasing power over time due to inflation has not been taken into account in our consolidated financial statements. Rather, our financial statements have been prepared on an historical cost basis in accordance with generally accepted accounting principles.
Unlike most industrial companies, our assets and liabilities are primarily monetary in nature. Therefore, the effect of changes in interest rates will have a more significant impact on our performance than will the effect of changing prices and inflation in general. In addition, interest rates may generally increase as the rate of inflation increases, although not necessarily in the same magnitude. As discussed previously, we seek to manage the relationships between interest sensitive assets and liabilities in order to protect against wide rate fluctuations, including those resulting from inflation.
Off-Balance Sheet Risk
Commitments to extend credit are agreements to lend to a client as long as the client has not violated any material condition established in the contract. Commitments generally have fixed expiration dates or other termination clauses and may require the payment of a fee. At December 31, 2017, unfunded commitments to extend credit were approximately $345.9 million, of which $96.4 million is at fixed rates and $249.5 million is at variable rates. At December 31, 2016, unfunded commitments to extend credit were $226.6 million, of which approximately $57.8 million was at fixed rates and $168.8 million was at variable rates. A significant portion of the unfunded commitments related to consumer equity lines of credit. Based on historical experience, we anticipate that a significant portion of these lines of credit will not be funded. We evaluate each client’s credit worthiness on a case-by-case basis. The amount of collateral obtained, if deemed necessary by us upon extension of credit, is based on our credit evaluation of the borrower. The type of collateral varies but may include accounts receivable, inventory, property, plant and equipment, and commercial and residential real estate.
At December 31, 2017 and 2016, there was a $6.3 million and $4.4 million commitment under letters of credit, respectively. The credit risk and collateral involved in issuing letters of credit is essentially the same as that involved in extending loan facilities to clients. Since most of the letters of credit are expected to expire without being drawn upon, they do not necessarily represent future cash requirements.
57
Except as disclosed in this document, we are not involved in off-balance sheet contractual relationships, unconsolidated related entities that have off-balance sheet arrangements or transactions that could result in liquidity needs or other commitments that significantly impact earnings.
Market Risk and Interest Rate Sensitivity
Market risk is the risk of loss from adverse changes in market prices and rates, which principally arises from interest rate risk inherent in our lending, investing, deposit gathering, and borrowing activities. Other types of market risks, such as foreign currency exchange rate risk and commodity price risk, do not generally arise in the normal course of our business.
We actively monitor and manage our interest rate risk exposure in order to control the mix and maturities of our assets and liabilities utilizing a process we call asset/liability management. The essential purposes of asset/liability management are to ensure adequate liquidity and to maintain an appropriate balance between interest sensitive assets and liabilities in order to minimize potentially adverse impacts on earnings from changes in market interest rates. Our asset/liability management committee (“ALCO”) monitors and considers methods of managing exposure to interest rate risk. We have both an internal ALCO consisting of senior management that meets at various times during each month and a board ALCO that meets monthly. The ALCOs are responsible for maintaining the level of interest rate sensitivity of our interest sensitive assets and liabilities within board-approved limits.
As of December 31, 2017, the following table summarizes the forecasted impact on net interest income using a base case scenario given upward and downward movements in interest rates of 100, 200, and 300 basis points based on forecasted assumptions of prepayment speeds, nominal interest rates and loan and deposit repricing rates. Estimates are based on current economic conditions, historical interest rate cycles and other factors deemed to be relevant. However, underlying assumptions may be impacted in future periods which were not known to management at the time of the issuance of the Consolidated Financial Statements. Therefore, management’s assumptions may or may not prove valid. No assurance can be given that changing economic conditions and other relevant factors impacting our net interest income will not cause actual occurrences to differ from underlying assumptions. In addition, this analysis does not consider any strategic changes to our balance sheet which management may consider as a result of changes in market conditions.
| Change in net interest | |
| Interest rate scenario | income from base |
| Up 300 basis points | 1.77% |
| Up 200 basis points | 1.93% |
| Up 100 basis points | 1.48% |
| Base | - |
| Down 100 basis points | (4.84)% |
| Down 200 basis points | (5.75)% |
| Down 300 basis points | (7.82)% |
Contractual Obligations
We utilize a variety of short-term and long-term borrowings to supplement our supply of lendable funds, to assist in meeting deposit withdrawal requirements, and to fund growth of interest-earning assets in excess of traditional deposit growth. Certificates of deposit, structured repurchase agreements, FHLB advances, and junior subordinate debentures serve as our primary sources of such funds.
Obligations under noncancelable operating lease agreements are payable over several years with the longest obligation expiring in 2028. We do not feel that any existing noncancelable operating lease agreements are likely to materially impact the Company’s financial condition or results of operations in an adverse way. Contractual obligations relative to these agreements are noted in the table below. Option periods that we have not yet exercised are not included in this analysis as they do not represent contractual obligations until exercised.
58
The following table provides payments due by period for obligations under long-term borrowings and operating lease obligations as of December 31, 2017.
| December 31, 2017 | |||||||||||||
| Payments Due by Period | |||||||||||||
| Over One | Over Two | Over Three | After | ||||||||||
| Within | to Two | to Three | to Five | Five | |||||||||
| (dollars in thousands) | One Year | Years | Years | Years | Years | Total | |||||||
| Certificates of deposit | $ | 213,562 | 54,669 | 16,702 | 1,207 | 8,031 | 294,171 | ||||||
| FHLB advances and other borrowings | 42,200 | - | - | 10,000 | 15,000 | 67,200 | |||||||
| Junior subordinated debentures | - | - | - | - | 13,403 | 13,403 | |||||||
| Operating lease obligations | 1,635 | 1,763 | 1,798 | 2,950 | 5,642 | 13,788 | |||||||
| Total | $ | 257,397 | 56,432 | 18,500 | 14,157 | 42,076 | 388,562 | ||||||
Accounting, Reporting, and Regulatory Matters
The following is a summary of recent authoritative pronouncements that could impact the accounting, reporting, and/or disclosure of financial information by the Company.
The following is a summary of recent authoritative pronouncements that could impact the accounting, reporting, and/or disclosure of financial information by the Company.
In May 2014, the FASB issued guidance to change the recognition of revenue from contracts with customers. The core principle of the new guidance is that an entity should recognize revenue to reflect the transfer of goods and services to customers in an amount equal to the consideration the entity receives or expects to receive. The guidance will be effective for the Company for reporting periods beginning after December 15, 2017.
The Company’s revenue is comprised of net interest income and noninterest income. The scope of the guidance explicitly excludes net interest income as well as many other revenues for financial assets and liabilities including loans, leases, securities, and derivatives. Accordingly, the majority of our revenues will not be affected. The Company is currently assessing our revenue contracts related to revenue streams that are within the scope of the standard. Our accounting policies will not change materially since the principles of revenue recognition from the ASU are largely consistent with existing guidance and current practices applied by our businesses. We have not identified material changes to the timing or amount of revenue recognition. Based on the updated guidance, we do anticipate changes in our disclosures associated with our revenues.
In January 2016, the FASB amended the Financial Instruments topic of the ASC to address certain aspects of recognition, measurement, presentation, and disclosure of financial instruments. The amendments will be effective for fiscal years beginning after December 15, 2017, including interim periods within those fiscal years. The Company will apply the guidance by means of a cumulative-effect adjustment to the balance sheet as of the beginning of the fiscal year of adoption. The amendments related to equity securities without readily determinable fair values will be applied prospectively to equity investments that exist as of the date of adoption of the amendments. The Company does not expect these amendments to have a material effect on its financial statements.
In February 2016, the FASB amended the Leases topic of the Accounting Standards Codification to revise certain aspects of recognition, measurement, presentation, and disclosure of leasing transactions. The amendments will be effective for fiscal years beginning after December 15, 2018, including interim periods within those fiscal years
We expect to adopt the guidance using the modified retrospective method and practical expedients for transition. The practical expedients allow us to largely account for our existing leases consistent with current guidance except for the incremental balance sheet recognition for lessees. We have started an initial evaluation of our leasing contracts and activities. We have also started developing our methodology to estimate the right-of use assets and lease liabilities, which is based on the present value of lease payments (the December 31, 2017 future minimum lease payments were $13.8 million). We do not expect a material change to the timing of expense recognition, but we are early in the implementation process and will continue to evaluate the impact. We are evaluating our existing disclosures and may need to provide additional information as a result of adoption of the ASU.
In March 2016, the FASB issued guidance to simplify several aspects of the accounting for share-based payment award transactions including the income tax consequences, the classification of awards as either equity or liabilities, and the classification on the statement of cash flows. Additionally, the guidance simplifies two areas specific to entities other than public business entities allowing them to apply a practical expedient to estimate the expected term for all awards with performance or service conditions that have certain characteristics and also allowing them to make a one-time election to switch from measuring all liability-classified awards at fair value to measuring them at intrinsic value. The amendments will be effective for the Company for annual periods beginning after December 15, 2016 and interim periods within those annual periods. These amendments did not have a material effect on the Company’s financial statements.
59
In June 2016, the FASB issued guidance to change the accounting for credit losses and modify the impairment model for certain debt securities. The amendments will be effective for the Company for reporting periods beginning after December 15, 2019. Early adoption is permitted for all organizations for periods beginning after December 15, 2018.
The Company will apply the amendments to the ASU through a cumulative-effect adjustment to retained earnings as of the beginning of the year of adoption. While early adoption is permitted beginning in first quarter 2019, we do not expect to elect that option. We are evaluating the impact of the ASU on our consolidated financial statements. In addition to our allowance for loan losses, we will also record an allowance for credit losses on debt securities instead of applying the impairment model currently utilized. The amount of the adjustments will be impacted by each portfolio’s composition and credit quality at the adoption date as well as economic conditions and forecasts at that time.
In August 2016, the FASB amended the Statement of Cash Flows topic of the Accounting Standards Codification to clarify how certain cash receipts and cash payments are presented and classified in the statement of cash flows. The amendments will be effective for the Company for fiscal years beginning after December 15, 2017 including interim periods within those fiscal years. The Company does not expect these amendments to have a material effect on its financial statements.
In November 2016, the FASB amended the Statement of Cash Flows topic of the Accounting Standards Codification to clarify how restricted cash is presented and classified in the statement of cash flows. The amendments will be effective for the Company for fiscal years beginning after December 15, 2017 including interim periods within those fiscal years. Early adoption is permitted. The Company does not expect these amendments to have a material effect on its financial statements.
In March 2017, the FASB amended the requirement in the Receivables-Nonrefundable Fees and Other Costs Topic of the Accounting Standards Codification related to the amortization period for certain purchased callable debt securities held at a premium. The amendments shorten the amortization period for the premium to the earliest call date. The amendments will be effective for the Company for interim and annual periods beginning after December 15, 2018. The Company does not expect these amendments to have a material effect on its financial statements.
In May 2017, the FASB amended the requirements in the Compensation—Stock Compensation Topic of the Accounting Standards Codification related to changes to the terms or conditions of a share-based payment award. The amendments provide guidance about which changes to the terms or conditions of a share-based payment award require an entity to apply modification accounting. The amendments will be effective for the Company for annual periods, and interim periods within those annual periods, beginning after December 15, 2017. Early adoption is permitted. The Company does not expect these amendments to have a material effect on its financial statements.
In February 2018, the FASB Issued (ASU 2018-02), Income Statement (Topic 220): Reclassification of Certain Tax Effects from Accumulated Other Comprehensive Income, which requires Companies to reclassify the stranded effects in other comprehensive income to retained earnings as a result of the change in the tax rates under the Tax Cuts and Jobs Act. The Company has opted to early adopt this pronouncement by retrospective application to each period (or periods) in which the effect of the change in the tax rate under the Tax Act is recognized. The impact of the reclassification from other comprehensive income to retained earnings did not have a material effect on the Company’s financial statements.
Other accounting standards that have been issued or proposed by the FASB or other standards-setting bodies that do not require adoption until a future date are not expected to have a material impact on the consolidated financial statements upon adoption.
Item 7A. Quantitative and Qualitative Disclosures about Market Risk
See Item 7. Management’s Discussion and Analysis of Financial Condition and Results of Operations – Market Risk and Interest Rate Sensitivity and – Liquidity and Capital Resources.
60
Item 8. Financial Statements and Supplementary Data
MANAGEMENT’S REPORT ON INTERNAL CONTROL OVER FINANCIAL REPORTING
Management of Southern First Bancshares, Inc. is responsible for establishing and maintaining adequate internal control over financial reporting as defined in Rule 13a-15(f) of the Securities Exchange Act of 1934, as amended. The Company’s internal control over financial reporting is a process designed to provide reasonable assurance regarding the reliability of financial reporting and the preparation of financial statements for external purposes in accordance with accounting principles generally accepted in the U.S. The Company’s internal control over financial reporting includes those policies and procedures that (1) pertain to the maintenance of records, that in reasonable detail, accurately and fairly reflect the transactions and disposition of the Company’s assets; (2) provide reasonable assurance that transactions are recorded as necessary to permit the preparation of the financial statements in accordance with generally accepted accounting principles and that receipts and expenditures of the Company are being made only in accordance with the authorizations of the Company’s management and directors; and (3) provide reasonable assurance regarding prevention or timely detection of unauthorized acquisition, use or disposition of the Company’s assets that could have a material impact on the financial statements.
Because of its inherent limitations, internal control over financial reporting may not prevent or detect misstatements. Also, projections of any evaluation of effectiveness to future periods are subject to the risk that controls may become inadequate due to changes in conditions, or that the degree of compliance with the policies and procedures may deteriorate.
Management conducted an evaluation of the effectiveness of the internal control over financial reporting based on the framework in Internal Control — Integrated Framework issued by the Committee of Sponsoring Organizations of the Treadway Commission (“COSO”) in 2013. Based on this evaluation under the COSO criteria, management concluded that the internal control over financial reporting was effective as of December 31, 2017.
The effectiveness of the internal control structure over financial reporting as of December 31, 2017 has been audited by Elliott Davis, LLC, an independent registered public accounting firm, as stated in their report included in this Annual Report on Form 10-K, which expresses an unqualified opinion on the effectiveness of the Company’s internal control over financial reporting as of December 31, 2017.
| /s/ R. Arthur Seaver, Jr. | /s/ Michael D. Dowling |
| Chief Executive Officer | Chief Financial Officer |
| Southern First Bancshares, Inc. | Southern First Bancshares, Inc. |
61
Report of Independent Registered Public Accounting Firm
To the Shareholders and Board of Directors of
Southern First Bancshares, Inc. and Subsidiary
Greenville, South Carolina
Opinion on the Internal Control Over Financial Reporting
We have audited Southern First Bancshares, Inc. and Subsidiary's (the “Company”) internal control over financial reporting as of December 31, 2017, based on criteria established in Internal Control — Integrated Framework issued by the Committee of Sponsoring Organizations of the Treadway Commission in 2013 (the “COSO criteria”). In our opinion, the Company maintained, in all material respects, effective internal control over financial reporting as of December 31, 2017, based on the COSO criteria.
We have also audited, in accordance with the standards of the Public Company Accounting Oversight Board (United States) (“PCAOB”), the consolidated balance sheets of the Company as of December 31, 2017 and 2016 and the related consolidated statements of income, comprehensive income, shareholders’ equity, and cash flows for each of the three years in the period ended December 31, 2017 of the Company and our report dated February 28, 2018 expressed an unqualified opinion.
Basis for Opinion
The Company’s management is responsible for maintaining effective internal control over financial reporting and for its assessment of the effectiveness of internal control over financial reporting in the accompanying Report of Management. Our responsibility is to express an opinion on the Company’s internal control over financial reporting based on our audit. We are a public accounting firm registered with the PCAOB and are required to be independent with respect to the Company in accordance with U.S. federal securities laws and the applicable rules and regulations of the Securities and Exchange Commission and the PCAOB.
We conducted our audit in accordance with the standards of the PCAOB. Those standards require that we plan and perform the audit to obtain reasonable assurance about whether effective internal control over financial reporting was maintained in all material respects. Our audit included obtaining an understanding of internal control over financial reporting, assessing the risk that a material weakness exists, and testing and evaluating the design and operating effectiveness of internal control based on the assessed risk. Our audit also included performing such other procedures as we considered necessary in the circumstances. We believe that our audit provides a reasonable basis for our opinion.
Definition and Limitations of Internal Control Over Financial Reporting
A company's internal control over financial reporting is a process designed to provide reasonable assurance regarding the reliability of financial reporting and the preparation of financial statements for external purposes in accordance with generally accepted accounting principles. A company's internal control over financial reporting includes those policies and procedures that (1) pertain to the maintenance of records that, in reasonable detail, accurately and fairly reflect the transactions and dispositions of the assets of the company; (2) provide reasonable assurance that transactions are recorded as necessary to permit preparation of financial statements in accordance with generally accepted accounting principles, and that receipts and expenditures of the company are being made only in accordance with authorizations of management and directors of the company; and (3) provide reasonable assurance regarding prevention or timely detection of unauthorized acquisition, use or disposition of the company's assets that could have a material effect on the financial statements.
Because of its inherent limitations, internal control over financial reporting may not prevent or detect misstatements. Also, projections of any evaluation of effectiveness to future periods are subject to the risk that controls may become inadequate because of changes in conditions, or that the degree of compliance with the policies or procedures may deteriorate.
/s/ Elliott Davis, LLC
Greenville, South Carolina
February 28, 2018
62
Report of Independent Registered Public Accounting Firm
To the Shareholders and Board of Directors of
Southern First Bancshares, Inc. and Subsidiary
Greenville, South Carolina
Opinion on the Financial Statements
We have audited the accompanying consolidated balance sheets of Southern First Bancshares, Inc. and Subsidiary (the “Company”) as of December 31, 2017 and 2016, the related consolidated statements of income, comprehensive income, shareholders’ equity, and cash flows for each of the three years in the period ended December 31, 2017, and the related notes to the consolidated financial statements and schedules (collectively, the “financial statements”). In our opinion, the financial statements present fairly, in all material respects, the financial position of the Company as of December 31, 2017 and 2016, and the results of its operations and its cash flows for each of the three years in the period ended December 31, 2017, in conformity with accounting principles generally accepted in the United States of America.
We have also audited, in accordance with the standards of the Public Company Accounting Oversight Board (United States) (“PCAOB”), the Company's internal control over financial reporting as of December 31, 2017, based on criteria established in Internal Control — Integrated Framework issued by the Committee of Sponsoring Organizations of the Treadway Commission in 2013, and our report dated February 28, 2018 expressed an unqualified opinion on the effectiveness of the Company's internal control over financial reporting.
Basis for Opinion
These financial statements are the responsibility of the Company’s management. Our responsibility is to express an opinion on the Company’s financial statements based on our audits. We are a public accounting firm registered with the PCAOB and are required to be independent with respect to the Company in accordance with U.S. federal securities laws and the applicable rules and regulations of the Securities and Exchange Commission and the PCAOB.
We conducted our audits in accordance with the standards of the PCAOB. Those standards require that we plan and perform the audits to obtain reasonable assurance about whether the financial statements are free of material misstatement, whether due to error or fraud. Our audits included performing procedures to assess the risks of material misstatement of the financial statements, whether due to error or fraud, and performing procedures that respond to those risks. Such procedures included examining, on a test basis, evidence regarding the amounts and disclosures in the financial statements. Our audits also included evaluating the accounting principles used and significant estimates made by management, as well as evaluating the overall presentation of the financial statements. We believe that our audits provide a reasonable basis for our opinion.
/s/ Elliott Davis, LLC
We have served as the Company's auditor since 1999.
Greenville, South Carolina
February 28, 2018
63
SOUTHERN FIRST BANCSHARES, INC. AND SUBSIDIARY
CONSOLIDATED BALANCE SHEETS
| December 31, | |||||||
| (dollars in thousands, except share data) | 2017 | 2016 | |||||
| ASSETS | |||||||
| Cash and cash equivalents: | |||||||
| Cash and due from banks | $ | 17,171 | 11,574 | ||||
| Federal funds sold | 49,148 | 24,039 | |||||
| Interest-bearing deposits with banks | 25,846 | 10,939 | |||||
| Total cash and cash equivalents | 92,165 | 46,552 | |||||
| Investment securities: | |||||||
| Investment securities available for sale | 67,603 | 64,480 | |||||
| Other investments | 4,462 | 5,742 | |||||
| Total investment securities | 72,065 | 70,222 | |||||
| Mortgage loans held for sale | 11,790 | 7,801 | |||||
| Loans | 1,387,070 | 1,163,644 | |||||
| Less allowance for loan losses | (15,523 | ) | (14,855 | ) | |||
| Loans, net | 1,371,547 | 1,148,789 | |||||
| Bank owned life insurance | 33,132 | 25,471 | |||||
| Property and equipment, net | 32,234 | 28,362 | |||||
| Deferred income taxes, net | 3,782 | 6,825 | |||||
| Other assets | 7,910 | 6,886 | |||||
| Total assets | $ | 1,624,625 | 1,340,908 | ||||
| LIABILITIES | |||||||
| Deposits | $ | 1,381,123 | 1,091,151 | ||||
| Federal Home Loan Bank advances and other borrowings | 67,200 | 115,200 | |||||
| Junior subordinated debentures | 13,403 | 13,403 | |||||
| Other liabilities | 13,213 | 11,282 | |||||
| Total liabilities | 1,474,939 | 1,231,036 | |||||
| SHAREHOLDERS’ EQUITY | |||||||
| Preferred stock, par value $.01 per share, 10,000,000 shares authorized | - | - | |||||
| Common stock, par value $.01 per share, 10,000,000 shares authorized, 7,347,851 and 6,463,789 shares issued and outstanding at December 31, 2017 and 2016, respectively | 73 | 65 | |||||
| Nonvested restricted stock | (502 | ) | (600 | ) | |||
| Additional paid-in capital | 99,986 | 73,371 | |||||
| Accumulated other comprehensive income (loss) | (456 | ) | (504 | ) | |||
| Retained earnings | 50,585 | 37,540 | |||||
| Total shareholders’ equity | 149,686 | 109,872 | |||||
| Total liabilities and shareholders’ equity | $ | 1,624,625 | 1,340,908 |
See notes to consolidated financial statements that are an integral part of these consolidated statements.
64
SOUTHERN FIRST BANCSHARES, INC. AND SUBSIDIARY
CONSOLIDATED STATEMENTS OF INCOME
| For the years ended December 31, | |||||||
| (dollars in thousands, except per share data) | 2017 | 2016 | 2015 | ||||
| Interest income | |||||||
| Loans | $ | 58,808 | 49,315 | 44,316 | |||
| Investment securities | 1,617 | 1,711 | 1,577 | ||||
| Federal funds sold | 784 | 165 | 137 | ||||
| Total interest income | 61,209 | 51,191 | 46,030 | ||||
| Interest expense | |||||||
| Deposits | 7,373 | 3,941 | 3,585 | ||||
| Borrowings | 2,960 | 4,251 | 3,916 | ||||
| Total interest expense | 10,333 | 8,192 | 7,501 | ||||
| Net interest income | 50,876 | 42,999 | 38,529 | ||||
| Provision for loan losses | 2,000 | 2,300 | 3,200 | ||||
| Net interest income after provision for loan losses | 48,876 | 40,699 | 35,329 | ||||
| Noninterest income | |||||||
| Mortgage banking income | 5,152 | 6,837 | 4,963 | ||||
| Service fees on deposit accounts | 1,168 | 1,002 | 893 | ||||
| Income from bank owned life insurance | 811 | 736 | 685 | ||||
| Gain on sale of investment securities | 4 | 431 | 297 | ||||
| Other income | 2,202 | 1,840 | 1,578 | ||||
| Total noninterest income | 9,337 | 10,846 | 8,416 | ||||
| Noninterest expenses | |||||||
| Compensation and benefits | 21,791 | 18,969 | 17,048 | ||||
| Occupancy | 4,121 | 3,582 | 3,310 | ||||
| Other real estate owned expenses | 228 | 1,215 | 1,142 | ||||
| Outside service and data processing costs | 3,158 | 2,654 | 2,447 | ||||
| Insurance | 1,146 | 962 | 855 | ||||
| Professional fees | 1,362 | 1,208 | 987 | ||||
| Marketing | 737 | 807 | 870 | ||||
| Other | 2,009 | 1,779 | 1,550 | ||||
| Total noninterest expenses | 34,552 | 31,176 | 28,209 | ||||
| Income before income tax expense | 23,661 | 20,369 | 15,536 | ||||
| Income tax expense | 10,616 | 7,333 | 5,369 | ||||
| Net income available to common shareholders | $ | 13,045 | 13,036 | 10,167 | |||
| Earnings per common share | |||||||
| Basic | $ | 1.86 | 2.06 | 1.64 | |||
| Diluted | $ | 1.76 | 1.94 | 1.55 | |||
| Weighted average common shares outstanding | |||||||
| Basic | 7,005,703 | 6,318,322 | 6,204,518 | ||||
| Diluted | 7,393,377 | 6,720,888 | 6,560,739 | ||||
See notes to consolidated financial statements that are an integral part of these consolidated statements.
65
SOUTHERN FIRST BANCSHARES, INC. AND SUBSIDIARY
CONSOLIDATED STATEMENTS OF COMPREHENSIVE INCOME
| For the years ended December 31, | ||||||||||
| (dollars in thousands) | 2017 | 2016 | 2015 | |||||||
| Net income | $ | 13,045 | 13,036 | 10,167 | ||||||
| Other comprehensive income: | ||||||||||
| Unrealized gain (loss) on securities available for sale: | ||||||||||
| Unrealized holding gain (loss) arising during the period, pretax | 191 | (327 | ) | (167 | ) | |||||
| Tax (expense) benefit | (140 | ) | 111 | 57 | ||||||
| Reclassification of realized gain | (4 | ) | (431 | ) | (297 | ) | ||||
| Tax expense | 1 | 147 | 101 | |||||||
| Other comprehensive income (loss) | 48 | (500 | ) | (306 | ) | |||||
| Comprehensive income | $ | 13,093 | 12,536 | 9,861 | ||||||
See notes to consolidated financial statements that are an integral part of these consolidated statements.
66
SOUTHERN FIRST BANCSHARES, INC. AND SUBSIDIARY
CONSOLIDATED STATEMENTS OF SHAREHOLDERS’ EQUITY
FOR THE YEARS ENDED DECEMBER 31, 2017, 2016 AND 2015
| Accumulated | |||||||||||||||||||
| other | |||||||||||||||||||
| Nonvested | Additional | comprehensive | |||||||||||||||||
| Common stock | Preferred stock | restricted | paid-in | income | Retained | ||||||||||||||
| (dollars in thousands, except share data) | Shares | Amount | Shares | Amount |
stock |
capital |
(loss) |
Earnings | Total | ||||||||||
| December 31, 2014 | 6,219,002 | $ | 62 | - | $ - | $ | (494 | ) | $ | 68,785 |
$ |
302 | $ | 14,337 | $ | 82,992 | |||
| Net income | - | - | - | - | - | - | - | 10,167 | 10,167 | ||||||||||
| Proceeds from exercise of stock options | 67,036 | 1 | - | - | - | 627 | - | - | 628 | ||||||||||
| Issuance of restricted stock | 3,000 | - | - | - | (69 | ) | 69 | - | - | - | |||||||||
| Compensation expense related to restricted stock, net of tax | - | - | - | - | 203 | - | - | - | 203 | ||||||||||
| Compensation expense related to stock options, net of tax | - | - | - | - | - | 556 | - | - | 556 | ||||||||||
| Other comprehensive loss | - | - | - | - | - | - | (306 | ) | - | (306 | ) | ||||||||
| December 31, 2015 | 6,289,038 | 63 | - | - | (360 | ) | 70,037 | (4 | ) | 24,504 | 94,240 | ||||||||
| Net income | - | - | - | - | - | - | - | 13,036 | 13,036 | ||||||||||
| Proceeds from exercise of stock options | 152,751 | 2 | - | - | - | 1,096 | - | - | 1,098 | ||||||||||
| Issuance of restricted stock | 22,000 | - | - | - | (526 | ) | 526 | - | - | - | |||||||||
| Compensation expense related to restricted stock, net of tax | - | - | - | - | 286 | 183 | - | - | 469 | ||||||||||
| Compensation expense related to stock options, net of tax | - | - | - | - | - | 1,529 | - | - | 1,529 | ||||||||||
| Other comprehensive loss | - | - | - | - | - | - | (500 | ) | - | (500 | ) | ||||||||
| December 31, 2016 | 6,463,789 | 65 | - | - | (600 | ) | 73,371 | (504 | ) | 37,540 | 109,872 | ||||||||
| Net income | - | - | - | - | - | - | - | 13,045 | 13,045 | ||||||||||
| Net issuance of common stock | 805,000 | 8 | - | - | - | 24,750 | - | - | 24,758 | ||||||||||
| Proceeds from exercise of stock options | 74,437 | - | - | - | - | 705 | - | - | 705 | ||||||||||
| Issuance of restricted stock | 4,625 | - | - | - | (201 | ) | 201 | - | - | - | |||||||||
| Compensation expense related to restricted stock, net of tax | - | - | - | - | 299 | - | - | - | 299 | ||||||||||
| Compensation expense related to stock options, net of tax | - | - | - | - | - | 959 | - | - | 959 | ||||||||||
| Other comprehensive income | - | - | - | - | - | - | 48 | - | 48 | ||||||||||
| December 31, 2017 | 7,347,851 | $ | 73 | - | $ - | $ | (502 | ) | $ | 99,986 |
$ |
(456 | ) | $ | 50,585 | $ | 149,686 | ||
See notes to consolidated financial statements that are an integral part of these consolidated statements.
67
SOUTHERN FIRST BANCSHARES, INC. AND SUBSIDIARY
CONSOLIDATED STATEMENTS OF CASH FLOWS
| For the years ended December 31, | |||||||||||
| (dollars in thousands) | 2017 | 2016 | 2015 | ||||||||
| Operating activities | |||||||||||
| Net income | $ | 13,045 | $ | 13,036 | 10,167 | ||||||
| Adjustments to reconcile net income to cash provided by operating activities: | |||||||||||
| Provision for loan losses | 2,000 | 2,300 | 3,200 | ||||||||
| Depreciation and other amortization | 1,460 | 1,251 | 1,310 | ||||||||
| Accretion and amortization of securities discounts and premiums, net | 582 | 581 | 353 | ||||||||
| Gain on sale of investment securities available for sale | (4 | ) | (431 | ) | (297 | ) | |||||
| Loss on sale of fixed assets | 50 | - | - | ||||||||
| (Gain) loss on sale of other real estate owned | 3 | 428 | (63 | ) | |||||||
| Write-down of other real estate owned | 185 | 466 | 937 | ||||||||
| Compensation expense related to stock options and restricted stock grants | 1,258 | 1,998 | 759 | ||||||||
| Gain on sale of loans held for sale | (5,752 | ) | (6,553 | ) | (4,963 | ) | |||||
| Loans originated and held for sale | (192,347 | ) | (251,397 | ) | (201,842 | ) | |||||
| Proceeds from sale of loans held for sale | 194,110 | 255,092 | 213,627 | ||||||||
| Increase in cash surrender value of bank owned life insurance | (811 | ) | (736 | ) | (685 | ) | |||||
| (Increase) decrease in deferred tax asset | 2,904 | 356 | (1,256 | ) | |||||||
| Increase in other assets, net | (1,421 | ) | (1,867 | ) | (495 | ) | |||||
| Increase (decrease) in other liabilities, net | 1,931 | 2,565 | (646 | ) | |||||||
| Net cash provided by operating activities | 17,193 | 17,089 | 20,106 | ||||||||
| Investing activities | |||||||||||
| Increase (decrease) in cash realized from: | |||||||||||
| Increase in loans, net | (225,047 | ) | (160,019 | ) | (135,294 | ) | |||||
| Purchase of property and equipment | (5,381 | ) | (5,428 | ) | (4,650 | ) | |||||
| Purchase of investment securities: | |||||||||||
| Available for sale | (21,972 | ) | (17,976 | ) | (57,219 | ) | |||||
| Other investments | (3,086 | ) | (806 | ) | (149 | ) | |||||
| Proceeds from maturities, calls and repayments of investment securities: | |||||||||||
| Available for sale | 9,644 | 20,341 | 11,711 | ||||||||
| Other investments | 4,366 | 596 | 1,140 | ||||||||
| Proceeds from sale of investment securities: | |||||||||||
| Available for sale | 8,813 | 22,186 | 10,072 | ||||||||
| Purchase of life insurance policies | (6,850 | ) | - | (2,000 | ) | ||||||
| Proceeds from sale of other real estate owned | 498 | 1,187 | 431 | ||||||||
| Net cash used for investing activities | (239,015 | ) | (139,919 | ) | (175,958 | ) | |||||
| Financing activities | |||||||||||
| Increase (decrease) in cash realized from: | |||||||||||
| Increase in deposits, net | 289,972 | 105,418 | 196,826 | ||||||||
| Decrease in Federal Home Loan Bank advances and other borrowings | (48,000 | ) | - | (20,000 | ) | ||||||
| Issuance of common stock | 24,758 | - | - | ||||||||
| Proceeds from the exercise of stock options | 705 | 1,098 | 628 | ||||||||
| Net cash provided by financing activities | 267,435 | 106,516 | 177,454 | ||||||||
| Net increase (decrease) in cash and cash equivalents | 45,613 | (16,314 | ) | 21,602 | |||||||
| Cash and cash equivalents, beginning of year | 46,552 | 62,866 | 41,264 | ||||||||
| Cash and cash equivalents, end of year | $ | 92,165 | $ | 46,552 | 62,866 | ||||||
| Supplemental information | |||||||||||
| Cash paid for | |||||||||||
| Interest | $ | 9,987 | $ | 8,311 | 7,293 | ||||||
| Income taxes | 8,390 | 6,680 | 6,625 | ||||||||
| Schedule of non-cash transactions | |||||||||||
| Foreclosure of other real estate | 288 | 245 | 473 | ||||||||
| Unrealized (gain) loss on securities, net of income taxes | (126 | ) | 216 | 110 | |||||||
See notes to consolidated financial statements that are an integral part of these consolidated statements.
68
NOTE 1 – Summary of Significant Accounting Policies and Activities
Southern First Bancshares, Inc. (the "Company") is a South Carolina corporation that owns all of the capital stock of Southern First Bank (the "Bank") and all of the stock of Greenville First Statutory Trust I and II (collectively, the "Trusts"). The Trusts are special purpose non-consolidated entities organized for the sole purpose of issuing trust preferred securities. The Bank's primary federal regulator is the Federal Deposit Insurance Corporation (the "FDIC"). The Bank is also regulated and examined by the South Carolina Board of Financial Institutions. The Bank is primarily engaged in the business of accepting demand deposits and savings deposits insured by the FDIC, and providing commercial, consumer and mortgage loans to the general public.
Basis of Presentation
The accompanying consolidated financial statements include the accounts of the Company and its wholly owned subsidiary, Southern First Bank. We have no additional reportable operating segments under Accounting Standards Codification (“ASC”) 280 “Segment Reporting.” In consolidation, all significant intercompany transactions have been eliminated. The accounting and reporting policies conform to accounting principles generally accepted in the United States of America. In accordance with guidance issued by the Financial Accounting Standards Board (“FASB”), the operations of the Trusts have not been consolidated in these financial statements.
Use of Estimates
The preparation of consolidated financial statements in conformity with accounting principles generally accepted in the United States of America requires management to make estimates and assumptions that affect the reported amounts of assets and liabilities and disclosure of contingent assets and liabilities as of the date of the consolidated financial statements and the reported amount of income and expenses during the reporting periods. Actual results could differ from those estimates. Material estimates that are particularly susceptible to significant change in the near term relate to the determination of the allowance for loan losses, derivatives, real estate acquired in settlement of loans, fair value of financial instruments, evaluating other-than-temporary-impairment of investment securities and valuation of deferred tax assets.
Risks and Uncertainties
In the normal course of its business, the Company encounters two significant types of risks: economic and regulatory. There are three main components of economic risk: interest rate risk, credit risk and market risk. The Company is subject to interest rate risk to the degree that its interest-bearing liabilities mature or reprice at different speeds, or on different bases, than its interest-earning assets. Credit risk is the risk of default within the Company’s loan portfolio that results from borrowers’ inability or unwillingness to make contractually required payments. Market risk reflects changes in the value of collateral underlying loans receivable and the valuation of real estate held by the Company.
The Company is subject to the regulations of various governmental agencies. These regulations can and do change significantly from period to period. The Company also undergoes periodic examinations by the regulatory agencies, which may subject it to changes with respect to valuation of assets, amount of required loan loss allowance and operating restrictions resulting from the regulators’ judgments based on information available to them at the time of their examinations.
The Bank makes loans to individuals and businesses in the Upstate, Midlands, and Lowcountry regions of South Carolina as well as the Triangle region of North Carolina and Atlanta, Georgia for various personal and commercial purposes. The Bank’s loan portfolio has a concentration of real estate loans. As of December 31, 2017 and 2016, real estate loans represented 82.1% and 81.1%, respectively, of total loans. However, borrowers’ ability to repay their loans is not dependent upon any specific economic sector.
Subsequent Events
Subsequent events are events or transactions that occur after the balance sheet date but before financial statements are issued. Recognized subsequent events are events or transactions that provide additional evidence about conditions that existed at the date of the balance sheet, including the estimates inherent in the process of preparing financial statements. Non-recognized subsequent events are events that provide evidence about conditions that did not exist at the date of the balance sheet but arose after that date. Management performed an evaluation to determine whether there have been any subsequent events since the balance sheet date and determined that no subsequent events occurred requiring accrual or disclosure.
69
Initial Adoption of Fair Value Option
In accordance with ASC 825-10 – Financial Instruments, the Company adopted the fair value option for mortgage loans held for sale beginning on April 1, 2016. ASC 825-10 allows the Company to measure eligible financial assets and liabilities at fair value that are not otherwise required to be measured at fair value and to offset changes in the fair values of derivative instruments and the related hedged item by selecting the fair value option for the hedged item. Unrealized gains and losses on items for which the fair value option has been elected are reported in earnings at each subsequent reporting date. Prior to adoption, mortgage loans held for sale were carried at the lower of cost or fair value.
Reclassifications
Certain amounts, previously reported, have been reclassified to state all periods on a comparable basis and had no effect on shareholders’ equity or net income.
Cash and Cash Equivalents
Cash and cash equivalents include cash and due from banks, interest bearing deposits and federal funds sold. Cash and cash equivalents have original maturities of three months or less, and federal funds sold are generally purchased and sold for one-day periods. Accordingly, the carrying value of these instruments is deemed to be a reasonable estimate of fair value. At December 31, 2017 and 2016, included in cash and cash equivalents was $7.3 million and $5.0 million, respectively, on deposit with the Federal Reserve Bank.
Investment Securities
We classify our investment securities as held to maturity securities, trading securities and available for sale securities as applicable.
Debt securities are designated as held to maturity if we have the intent and the ability to hold the securities to maturity. Held to maturity securities are carried at amortized cost, adjusted for the amortization of any related premiums or the accretion of any related discounts into interest income using a methodology which approximates a level yield of interest over the estimated remaining period until maturity. Unrealized losses on held to maturity securities, reflecting a decline in value judged by us to be other than temporary, are charged to income in the Consolidated Statements of Income.
Debt and equity securities that are purchased and held principally for the purpose of selling in the near term are reported as trading securities. Trading securities are carried at fair value with unrealized holding gains and losses included in earnings.
We classify debt and equity securities as available for sale when at the time of purchase we determine that such securities may be sold at a future date or if we do not have the intent or ability to hold such securities to maturity. Securities designated as available for sale are recorded at fair value. Changes in the fair value of debt and equity securities available for sale are included in shareholders’ equity as unrealized gains or losses, net of the related tax effect. Unrealized losses on available for sale securities, reflecting a decline in value judged to be other than temporary, are charged to income in the Consolidated Statements of Income. Realized gains or losses on available for sale securities are computed on the specific identification basis.
Other Investments
The Bank, as a member institution, is required to own a stock investment in the Federal Home Loan Bank of Atlanta (“FHLB”). This stock is generally pledged against any borrowings from the FHLB and cash dividends on our FHLB stock are recorded in investment income. No ready market exists for these stocks and they have no quoted market value. However, redemption of this stock has historically been at par value. Other investments also include a $403,000 investment in the Trusts.
Loans
Loans are stated at the principal balance outstanding. Unamortized net loan fees and the allowance for possible loan losses are deducted from total loans on the balance sheets. Interest income is recognized over the term of the loan based on the principal amount outstanding. The net of loan origination fees received and direct costs incurred in the origination of loans is deferred and amortized to interest income over the contractual life of the loans adjusted for actual principal prepayments using a method approximating the interest method.
70
Nonaccrual and Past Due Loans
Loans are generally placed on nonaccrual status when principal or interest becomes 90 days past due, or when payment in full is not anticipated. When a loan is placed on nonaccrual status, interest accrued but not received is generally reversed against interest income. Cash receipts on nonaccrual loans are not recorded as interest income, but are used to reduce the loan’s principal balance. A nonaccrual loan is generally returned to accrual status and accrual of interest is resumed when payments have been made according to the terms and conditions of the loan for a continuous six month period. Our loans are considered past due when contractually required principal or interest payments have not been made on the due dates.
Nonperforming Assets
Nonperforming assets include real estate acquired through foreclosure or deed taken in lieu of foreclosure, loans on nonaccrual status and loans past due 90 days or more and still accruing interest. Loans are placed on nonaccrual status when, in the opinion of management, the collection of additional interest is uncertain. Thereafter no interest is taken into income until such time as the borrower demonstrates the ability to pay both principal and interest.
Impaired Loans
Our impaired loans include loans on nonaccrual status and loans modified in a troubled debt restructuring (“TDR”), whether on accrual or nonaccrual status. For loans that are classified as impaired, an allowance is established when the fair value (discounted cash flows, collateral value, or observable market price) of the impaired loan less costs to sell, are lower than the carrying value of that loan. A loan is considered impaired when, based on current information and events, it is probable that the Company will be unable to collect the scheduled payments of principal or interest when due according to the contractual terms of the loan agreement. Factors considered by management in determining impairment include payment status, collateral value, and the probability of collecting scheduled principal and interest payments when due, among other factors. Loans that experience insignificant payment delays and payment shortfalls generally are not classified as impaired. Management determines the significance of payment delays and payment shortfalls on a case-by-case basis, taking into consideration all of the circumstances surrounding the loan and the borrower, including, without limitation, the length of the delay, the reasons for the delay, the borrower's prior payment record, and the amount of the shortfall in relation to the principal and interest owed. Impairment is measured on a loan by loan basis for commercial and construction loans by either the present value of expected future cash flows discounted at the loan's effective interest rate, the loan's obtainable market price, or the fair value of the collateral if the loan is collateral dependent. Prior to this change, large groups of smaller balance homogeneous consumer loans were collectively evaluated for impairment, and we did not separately identify individual consumer loans for impairment disclosures.
Loan Charge-off Policy
For commercial loans, we generally fully charge off or charge collateralized loans down to net realizable value when management determines the loan to be uncollectible; repayment is deemed to be projected beyond reasonable time frames; the loan has been classified as a loss by either our internal loan review process or our banking regulatory agencies; the client has filed bankruptcy and the loss becomes evident owing to a lack of assets; or the loan is 120 days past due unless both well-secured and in the process of collection. For consumer loans, we generally charge down to net realizable value when the loan is 180 days past due.
Troubled Debt Restructuring (TDRs)
The Company considers a loan to be a TDR when the debtor experiences financial difficulties and the Company provides concessions such that we will not collect all principal and interest in accordance with the original terms of the loan agreement. Concessions can relate to the contractual interest rate, maturity date, or payment structure of the note. As part of our workout plan for individual loan relationships, we may restructure loan terms to assist borrowers facing challenges in the current economic environment.
71
Our policy with respect to accrual of interest on loans restructured in a TDR follows relevant supervisory guidance. That is, if a borrower has demonstrated performance under the previous loan terms and shows capacity to perform under the restructured loan terms; continued accrual of interest at the restructured interest rate is likely. If a borrower was materially delinquent on payments prior to the restructuring, but shows capacity to meet the restructured loan terms, the loan will likely continue as nonaccrual going forward. Lastly, if the borrower does not perform under the restructured terms, the loan is placed on nonaccrual status. We will continue to closely monitor these loans and will cease accruing interest on them if management believes that the borrowers may not continue performing based on the restructured note terms. If, after previously being classified as a TDR, a loan is restructured a second time and the borrower continues to experience financial difficulties, then that loan is automatically placed on nonaccrual status. Our policy with respect to nonperforming loans requires the borrower to make a minimum of six consecutive payments of principal and interest in accordance with the loan terms before that loan can be placed back on accrual status. Further, the borrower must show capacity to continue performing into the future prior to restoration of accrual status. In addition, our policy, in accordance with supervisory guidance, also provides for a loan to be removed from TDR status if the loan is modified or renewed at terms consistent with current market rates and the loan has been performing under modified terms for an extended period of time or under certain circumstances.
In the determination of the allowance for loan losses, management considers TDRs on commercial and consumer loans and subsequent defaults in these restructurings by measuring impairment, on a loan by loan basis, based on either the present value of expected future cash flows discounted at the loan's effective interest rate, the loan's obtainable market price, or the fair value of the collateral, less costs to sell, if the loan is collateral dependent.
Allowance for Loan Losses
The allowance for loan losses is management’s estimate of credit losses inherent in the loan portfolio. The allowance for loan losses is established as losses are estimated to have occurred through a provision for loan losses charged to earnings. Loan losses are charged against the allowance when management believes the uncollectibility of a loan balance is confirmed. Subsequent recoveries, if any, are credited to the allowance. The allowance for loan losses is evaluated on a regular basis by management and is based upon management’s periodic review of the collectability of the loans in light of historical experience, the nature and volume of the loan portfolio, adverse situations that may affect the borrower’s ability to repay, the estimated value of any underlying collateral and prevailing economic conditions. This evaluation is inherently subjective as it requires estimates that are susceptible to significant revision as more information becomes available.
We have an established process to determine the adequacy of the allowance for loan losses that assesses the losses inherent in our portfolio. While we attribute portions of the allowance to specific portfolio segments, the entire allowance is available to absorb credit losses inherent in the total loan portfolio. Our process involves procedures to appropriately consider the unique risk characteristics of our commercial and consumer loan portfolio segments. For each portfolio segment, impairment is measured individually for each impaired loan. Our allowance levels are influenced by loan volume, loan grade or delinquency status, historic loss experience and other economic conditions. See Note 4 to the Consolidated Financial Statements for additional information on the allowance for loan losses.
Other Real Estate Owned
Real estate acquired through foreclosure is initially recorded at the lower of cost or estimated fair value less selling costs. Subsequent to the date of acquisition, it is carried at the lower of cost or fair value, adjusted for net selling costs. Fair values of real estate owned are reviewed regularly and write-downs are recorded when it is determined that the carrying value of real estate exceeds the fair value less estimated costs to sell. Costs relating to the development and improvement of such property are capitalized, whereas those costs relating to holding the property are expensed.
Property and Equipment
Property and equipment are stated at cost. Major repairs are charged to operations, while major improvements are capitalized. Depreciation is computed using the straight-line method over the estimated useful lives of the related assets. Upon retirement, sale, or other disposition of property and equipment, the cost and accumulated depreciation are eliminated from the accounts, and gain or loss is included in income from operations.
Construction in progress is stated at cost, which includes the cost of construction and other direct costs attributable to the construction. No provision for depreciation is made on construction in progress until such time as the relevant assets are completed and put into use.
Bank Owned Life Insurance Policies
Bank owned life insurance policies represent the cash value of policies on certain officers of the Company.
72
Securities Sold Under Agreements to Repurchase
The Bank enters into sales of securities under agreements to repurchase (reverse repurchase agreements). Repurchase agreements are treated as financing, with the obligation to repurchase securities sold being reflected as a liability and the securities underlying the agreements remaining as assets in the Consolidated Balance Sheets.
Comprehensive Income
Comprehensive income (loss) consists of net income and net unrealized gains (losses) on securities and is presented in the statements of shareholders’ equity and comprehensive income. The statement requires only additional disclosures in the consolidated financial statements; it does not affect our results of operations.
Income Taxes
The financial statements have been prepared on the accrual basis. When income and expenses are recognized in different periods for financial reporting purposes versus for the purposes of computing income taxes currently payable, deferred taxes are provided on such temporary differences. Deferred tax assets and liabilities are recognized for the expected future tax consequences of events that have been recognized in the consolidated financial statements or tax returns. Deferred tax assets and liabilities are measured using the enacted tax rates expected to apply to taxable income in the years in which those temporary differences are expected to be realized or settled. The Company believes that its income tax filing positions taken or expected to be taken on its tax returns will more likely than not be sustained upon audit by the taxing authorities and does not anticipate any adjustments that will result in a material adverse impact on the Company’s financial condition, results of operations, or cash flow. Therefore, no reserves for uncertain income tax positions have been recorded. The Company’s federal and state income tax returns are open and subject to examination from the 2014 tax return year and forward.
On December 22, 2017, the Tax Cuts and Jobs Act (the “Tax Act”) was signed into law. The legislation significantly changes U.S. tax law by, among other things, lowering corporate income tax rates from a maximum of 35% to a flat 21% rate, effective January 1, 2018. The SEC staff issued Staff Accounting Bulletin No. 118 (“SAB 118”) to address the application of U.S. GAAP in situations when a registrant does not have the necessary information available, prepared, or analyzed (including computations) in reasonable detail to complete the accounting for certain income tax effects of the Tax Act. The Company has recognized the provisional tax impacts related to the revaluation of deferred tax assets and liabilities and included these amounts in its consolidated financial statements for the year ended December 31, 2017. The ultimate impact may differ from these provisional amounts, possible materially, due to among other things, additional analysis, changes in interpretations and assumptions the Company has made, additional regulatory guidance that may be issued, and actions the Company may take as a result of the Tax act. The accounting is expected to be complete when the 2017 U.S. corporate income tax return is filed in 2018.
Stock-Based Compensation
The Company has a stock-based employee compensation plan. Compensation cost is recognized for all stock options granted and for any outstanding unvested awards as if the fair value method had been applied to those awards as of the date of grant.
Recently Issued Accounting Pronouncements
The following is a summary of recent authoritative pronouncements that could impact the accounting, reporting, and/or disclosure of financial information by the Company.
In May 2014, the FASB issued guidance to change the recognition of revenue from contracts with customers. The core principle of the new guidance is that an entity should recognize revenue to reflect the transfer of goods and services to customers in an amount equal to the consideration the entity receives or expects to receive. The guidance will be effective for the Company for reporting periods beginning after December 15, 2017. The Company’s revenue is comprised of net interest income and noninterest income. The scope of the guidance explicitly excludes net interest income as well as many other revenues for financial assets and liabilities including loans, leases, securities, and derivatives. Accordingly, the majority of our revenues will not be affected. The Company is currently assessing our revenue contracts related to revenue streams that are within the scope of the standard. Our accounting policies will not change materially since the principles of revenue recognition from the ASU are largely consistent with existing guidance and current practices applied by our businesses. We have not identified material changes to the timing or amount of revenue recognition. Based on the updated guidance, we do anticipate changes in our disclosures associated with our revenues.
73
In January 2016, the FASB amended the Financial Instruments topic of the ASC to address certain aspects of recognition, measurement, presentation, and disclosure of financial instruments. The amendments will be effective for fiscal years beginning after December 15, 2017, including interim periods within those fiscal years. The Company will apply the guidance by means of a cumulative-effect adjustment to the balance sheet as of the beginning of the fiscal year of adoption. The amendments related to equity securities without readily determinable fair values will be applied prospectively to equity investments that exist as of the date of adoption of the amendments. The Company does not expect these amendments to have a material effect on its financial statements.
In February 2016, the FASB amended the Leases topic of the Accounting Standards Codification to revise certain aspects of recognition, measurement, presentation, and disclosure of leasing transactions. The amendments will be effective for fiscal years beginning after December 15, 2018, including interim periods within those fiscal years. We expect to adopt the guidance using the modified retrospective method and practical expedients for transition. The practical expedients allow us to largely account for our existing leases consistent with current guidance except for the incremental balance sheet recognition for lessees. We have started an initial evaluation of our leasing contracts and activities. We have also started developing our methodology to estimate the right-of use assets and lease liabilities, which is based on the present value of lease payments (the December 31, 2017 future minimum lease payments were $13.8 million). We do not expect a material change to the timing of expense recognition, but we are early in the implementation process and will continue to evaluate the impact. We are evaluating our existing disclosures and may need to provide additional information as a result of adoption of the ASU.
In March 2016, the FASB issued guidance to simplify several aspects of the accounting for share-based payment award transactions including the income tax consequences, the classification of awards as either equity or liabilities, and the classification on the statement of cash flows. Additionally, the guidance simplifies two areas specific to entities other than public business entities allowing them to apply a practical expedient to estimate the expected term for all awards with performance or service conditions that have certain characteristics and also allowing them to make a one-time election to switch from measuring all liability-classified awards at fair value to measuring them at intrinsic value. The amendments will be effective for the Company for annual periods beginning after December 15, 2016 and interim periods within those annual periods. These amendments did not have a material effect on the Company’s financial statements.
In June 2016, the FASB issued guidance to change the accounting for credit losses and modify the impairment model for certain debt securities. The amendments will be effective for the Company for reporting periods beginning after December 15, 2019. Early adoption is permitted for all organizations for periods beginning after December 15, 2018. The Company will apply the amendments to the ASU through a cumulative-effect adjustment to retained earnings as of the beginning of the year of adoption. While early adoption is permitted beginning in first quarter 2019, we do not expect to elect that option. We are evaluating the impact of the ASU on our consolidated financial statements. In addition to our allowance for loan losses, we will also record an allowance for credit losses on debt securities instead of applying the impairment model currently utilized. The amount of the adjustments will be impacted by each portfolio’s composition and credit quality at the adoption date as well as economic conditions and forecasts at that time.
In August 2016, the FASB amended the Statement of Cash Flows topic of the Accounting Standards Codification to clarify how certain cash receipts and cash payments are presented and classified in the statement of cash flows. The amendments will be effective for the Company for fiscal years beginning after December 15, 2017 including interim periods within those fiscal years. The Company does not expect these amendments to have a material effect on its financial statements.
In November 2016, the FASB amended the Statement of Cash Flows topic of the Accounting Standards Codification to clarify how restricted cash is presented and classified in the statement of cash flows. The amendments will be effective for the Company for fiscal years beginning after December 15, 2017 including interim periods within those fiscal years. Early adoption is permitted. The Company does not expect these amendments to have a material effect on its financial statements.
In March 2017, the FASB amended the requirement in the Receivables-Nonrefundable Fees and Other Costs Topic of the Accounting Standards Codification related to the amortization period for certain purchased callable debt securities held at a premium. The amendments shorten the amortization period for the premium to the earliest call date. The amendments will be effective for the Company for interim and annual periods beginning after December 15, 2018. The Company does not expect these amendments to have a material effect on its financial statements.
74
In May 2017, the FASB amended the requirements in the Compensation—Stock Compensation Topic of the Accounting Standards Codification related to changes to the terms or conditions of a share-based payment award. The amendments provide guidance about which changes to the terms or conditions of a share-based payment award require an entity to apply modification accounting. The amendments will be effective for the Company for annual periods, and interim periods within those annual periods, beginning after December 15, 2017. Early adoption is permitted. The Company does not expect these amendments to have a material effect on its financial statements.
In February 2018, the FASB Issued (ASU 2018-02), Income Statement (Topic 220): Reclassification of Certain Tax Effects from Accumulated Other Comprehensive Income, which requires Companies to reclassify the stranded effects in other comprehensive income to retained earnings as a result of the change in the tax rates under the Tax Cuts and Jobs Act. The Company has opted to early adopt this pronouncement by retrospective application to each period (or periods) in which the effect of the change in the tax rate under the Tax Act is recognized. The impact of the reclassification from other comprehensive income to retained earnings did not have a material effect on the Company’s financial statements.
Other accounting standards that have been issued or proposed by the FASB or other standards-setting bodies that do not require adoption until a future date are not expected to have a material impact on the consolidated financial statements upon adoption.
NOTE 2 – Investment Securities
The amortized costs and fair value of investment securities are as follows:
| December 31, 2017 | |||||||||
| Amortized | Gross Unrealized | Fair | |||||||
| (dollars in thousands) | Cost | Gains | Losses | Value | |||||
| Available for sale | |||||||||
| US government agencies | $ | 8,749 | 1 | 97 | 8,653 | ||||
| SBA securities | 4,087 | - | 24 | 4,063 | |||||
| State and political subdivisions | 11,242 | 179 | 25 | 11,396 | |||||
| Mortgage-backed securities | |||||||||
| FHLMC | 9,102 | - | 149 | 8,953 | |||||
| FNMA | 29,383 | 3 | 386 | 29,000 | |||||
| GNMA | 5,618 | 2 | 82 | 5,538 | |||||
| Total mortgage-backed securities | 44,103 | 5 | 617 | 43,491 | |||||
| Total | $ | 68,181 | 185 | 763 | 67,603 | ||||
| December 31, 2016 | |||||||||
| Amortized | Gross Unrealized | Fair | |||||||
| Cost | Gains | Losses | Value | ||||||
| Available for sale | |||||||||
| US government agencies | $ | 6,271 | 1 | 113 | 6,159 | ||||
| SBA securities | 1,453 | - | 16 | 1,437 | |||||
| State and political subdivisions | 20,625 | 141 | 292 | 20,474 | |||||
| Mortgage-backed securities | |||||||||
| FHLMC | 10,922 | - | 185 | 10,737 | |||||
| FNMA | 24,827 | 19 | 277 | 24,569 | |||||
| GNMA | 1,146 | 2 | 44 | 1,104 | |||||
| Total mortgage-backed securities | 36,895 | 21 | 506 | 36,410 | |||||
| Total | $ | 65,244 | 163 | 927 | 64,480 | ||||
During 2017, approximately $9.7 million of investment securities were either sold or called, subsequently resulting in a gain on sale of investment securities of $4,500. In comparison, the Company sold $33.5 million of its investment securities during 2016, recording a gain on sale of investment securities of $431,000.
The amortized costs and fair values of investment securities available for sale at December 31, 2017 and 2016, by contractual maturity, are shown below. Expected maturities may differ from contractual maturities because issuers have the right to prepay the obligations.
75
| December 31, | |||||||||
| 2017 | 2016 | ||||||||
| Amortized | Fair | Amortized | Fair | ||||||
| (dollars in thousands) | Cost | Value | Cost | Value | |||||
| Available for sale | |||||||||
| Due within one year | $ | 1,435 | 1,427 | - | - | ||||
| Due after one through five years | 2,677 | 2,666 | 3,303 | 3,268 | |||||
| Due after five through ten years | 24,796 | 24,645 | 26,234 | 25,976 | |||||
| Due after ten years | 39,273 | 38,865 | 35,707 | 35,236 | |||||
| $ | 68,181 | 67,603 | 65,244 | 64,480 | |||||
The tables below summarize gross unrealized losses on investment securities and the fair market value of the related securities, aggregated by investment category and length of time that individual securities have been in a continuous unrealized loss position, at December 31, 2017 and 2016.
| Less than 12 months | 12 months or longer | Total | ||||||||||||||||||||||
| Fair | Unrealized | Fair | Unrealized | Fair | Unrealized | |||||||||||||||||||
| (dollars in thousands) | # | value | losses | # | value | losses | # | value | losses | |||||||||||||||
| As of December 31, 2017 | ||||||||||||||||||||||||
| Available for sale | ||||||||||||||||||||||||
| US government agencies | 5 | $ | 4,184 | $ | 22 | 4 | $ | 3,968 | $ | 75 | 9 | $ | 8,152 | $ | 97 | |||||||||
| SBA securities | 1 | 2,936 | 13 | 1 | 1,127 | 11 | 2 | 4,063 | 24 | |||||||||||||||
| State and political subdivisions | 3 | 1,214 | 9 | 2 | 792 | 16 | 5 | 2,006 | 25 | |||||||||||||||
| Mortgage-backed | ||||||||||||||||||||||||
| FHLMC | 3 | 2,897 | 26 | 7 | 6,056 | 123 | 10 | 8,953 | 149 | |||||||||||||||
| FNMA | 11 | 14,345 | 135 | 13 | 14,597 | 251 | 24 | 29,940 | 386 | |||||||||||||||
| GNMA | 2 | 2,270 | 40 | 1 | 971 | 42 | 3 | 2,243 | 82 | |||||||||||||||
| 25 | $ | 27,846 | $ | 245 | 28 | $ | 27,511 | $ | 518 | 53 | $ | 55,357 | $ | 763 | ||||||||||
| Less than 12 months | 12 months or longer | Total | ||||||||||||||||||||||
| Fair | Unrealized | Fair | Unrealized | Fair | Unrealized | |||||||||||||||||||
| # | value | losses | # | value | losses | # | value | losses | ||||||||||||||||
| As of December 31, 2016 | ||||||||||||||||||||||||
| Available for sale | ||||||||||||||||||||||||
| US government agencies | 5 | $ | 5,144 | $ | 113 | - | $ | - | $ | - | 5 | $ | 5,144 | $ | 113 | |||||||||
| SBA securities | 1 | 1,437 | 16 | - | - | - | 1 | 1,437 | 16 | |||||||||||||||
| State and political subdivisions | 32 | 13,936 | 292 | - | - | - | 32 | 13,936 | 292 | |||||||||||||||
| Mortgage-backed | ||||||||||||||||||||||||
| FHLMC | 10 | 10,737 | 185 | - | - | - | 10 | 10,737 | 185 | |||||||||||||||
| FNMA | 14 | 15,478 | 247 | 2 | 3,991 | 30 | 16 | 19,469 | 277 | |||||||||||||||
| GNMA | 1 | 1,077 | 44 | - | - | - | 1 | 1,077 | 44 | |||||||||||||||
| 63 | $ | 47,809 | $ | 897 | 2 | $ | 3,991 | $ | 30 | 65 | $ | 51,800 | $ | 927 | ||||||||||
At December 31, 2017, the Company had 25 individual investments with a fair market value of $27.8 million that were in an unrealized loss position for less than 12 months and 28 individual investments with a fair market value of $27.5 million that were in an unrealized loss position for 12 months or longer. The unrealized losses were primarily attributable to changes in interest rates, rather than deterioration in credit quality. The individual securities are each investment grade securities. The Company considers the length of time and extent to which the fair value of available-for-sale debt securities have been less than cost to conclude that such securities were not other-than-temporarily impaired. We also consider other factors such as the financial condition of the issuer including credit ratings and specific events affecting the operations of the issuer, volatility of the security, underlying assets that collateralize the debt security, and other industry and macroeconomic conditions. As the Company has no intent to sell securities with unrealized losses and it is not more-likely-than-not that the Company will be required to sell these securities before recovery of amortized cost, we have concluded that the securities are not impaired on an other-than-temporary basis.
76
Other investments are comprised of the following and are recorded at cost which approximates fair value:
| December 31, | |||||
| (dollars in thousands) | 2017 | 2016 | |||
| Federal Home Loan Bank stock | $ | 3,754 | 5,173 | ||
| Other investments | 305 | 166 | |||
| Investment in Trust Preferred subsidiaries | 403 | 403 | |||
| $ | 4,462 | 5,742 | |||
The Company has evaluated the FHLB stock for impairment and determined that the investment in FHLB stock is not other than temporarily impaired as of December 31, 2017 and ultimate recoverability of the par value of this investment is probable. All of the FHLB stock is used to collateralize advances with the FHLB.
At December 31, 2017 and 2016, $7.7 million and $21.0 million, respectively, of securities were pledged as collateral for repurchase agreements from brokers. In addition, approximately $21.1 million was pledged to secure client deposits at December 31, 2016.
NOTE 3 – Mortgage Loans Held for Sale
Mortgage loans originated and intended for sale in the secondary market are reported as loans held for sale and carried at fair value under the fair value option, which was adopted by the Company on April 1, 2016, with changes in fair value recognized in current period earnings. Loans held for sale include mortgage loans which are saleable into the secondary mortgage markets and their fair values are estimated using observable quoted market or contracted prices or market price equivalents, which would be used by other market participants. At the date of funding of the mortgage loan held for sale, the funded amount of the loan, the related derivative asset or liability of the associated interest rate lock commitment, less direct loan costs becomes the initial recorded investment in the loan held for sale. Such amount approximates the fair value of the loan. At December 31, 2017, mortgage loans held for sale totaled $11.8 million compared to $7.8 million at December 31, 2016.
Mortgage loans held for sale are considered de-recognized, or sold, when the Company surrenders control over the financial assets. Control is considered to have been surrendered when the transferred assets have been isolated from the Company, beyond the reach of the Company and its creditors; the purchaser obtains the right (free of conditions that constrain it from taking advantage of that right) to pledge or exchange the transferred assets; and the Company does not maintain effective control over the transferred assets through an agreement that both entitles and obligates the Company to repurchase or redeem the transferred assets before their maturity or the ability to unilaterally cause the holder to return specific assets.
Gains and losses from the sale of mortgage loans are recognized based upon the difference between the sales proceeds and carrying value of the related loans upon sale and are recorded in mortgage banking income in the statement of income. Mortgage banking income also includes the unrealized gains and losses associated with the loans held for sale and the realized and unrealized gains and losses from derivatives.
Mortgage loans sold to investors by the Company, and which were believed to have met investor and agency underwriting guidelines at the time of sale, may be subject to repurchase or indemnification in the event of specific default by the borrower or subsequent discovery that underwriting standards were not met. The Company may, upon mutual agreement, agree to repurchase the loans or indemnify the investor against future losses on such loans. In such cases, the Company bears any subsequent credit loss on the loans.
The Company establishes mortgage repurchase reserves related to various representations and warranties that reflect management’s estimate of losses based on a combination of factors. The Company establishes a reserve at the time loans are sold and quarterly updates the reserve estimate during the estimated loan life.
NOTE 4 – Loans and Allowance for Loan Losses
The Company makes loans to individuals and small businesses for various personal and commercial purposes primarily in the Upstate, Midlands, and Lowcountry regions of South Carolina, the Triangle region of North Carolina as well as Atlanta, Georgia. The Company’s loan portfolio is not concentrated in loans to any single borrower or a relatively small number of borrowers. The Company focuses its lending activities primarily on the professional markets in Greenville, Columbia, Charleston, Raleigh and Atlanta including doctors, dentists, and small business owners. The principal component of the loan portfolio is loans secured by real estate mortgages which account for 82.1% of total loans at December 31, 2017. Commercial loans comprise 59.8% of total real estate loans and consumer loans account for 40.2%. Commercial real estate loans are further categorized into owner occupied which represents 22.8% of total loans and non-owner occupied loans represent 22.6%. Commercial construction loans represent only 3.7% of the total loan portfolio.
77
In addition to monitoring potential concentrations of loans to particular borrowers or groups of borrowers, industries and geographic regions, management monitors exposure to credit risk from concentrations of lending products and practices such as loans that subject borrowers to substantial payment increases (e.g. principal deferral periods, loans with initial interest-only periods, etc.), and loans with high loan-to-value ratios. As of December 31, 2017, approximately $97.7 million, or 7.0% of our loans had loan-to-value ratios which exceeded regulatory supervisory limits, of which 76 loans totaling approximately $40.5 million had loan-to-value ratios of 100% or more. Additionally, there are industry practices that could subject the Company to increased credit risk should economic conditions change over the course of a loan’s life. For example, the Company makes variable rate loans and fixed rate principal-amortizing loans with maturities prior to the loan being fully paid (i.e. balloon payment loans). The various types of loans are individually underwritten and monitored to manage the associated risks.
The allowance for loan losses is management's estimate of credit losses inherent in the loan portfolio at the balance sheet date. We have an established process to determine the adequacy of the allowance for loan losses that assesses the losses inherent in our portfolio. While we attribute portions of the allowance to specific portfolio segments, the entire allowance is available to absorb credit losses inherent in the total loan portfolio. Our process involves procedures to appropriately consider the unique risk characteristics of our commercial and consumer loan portfolio segments. For each portfolio segment, impairment is measured individually for each impaired loan. Our allowance levels are influenced by loan volume, loan grade or delinquency status, historic loss experience and other economic conditions.
Portfolio Segment Methodology
Commercial
Commercial loans are assessed for estimated losses by grading each loan using various risk factors identified through periodic reviews. The Company applies historic grade-specific loss factors to each loan class. In the development of statistically derived loan grade loss factors, the Company observes historical losses over 20 quarters for each loan grade. These loss estimates are adjusted as appropriate based on additional analysis of external loss data or other risks identified from current economic conditions and credit quality trends. The allowance also includes an amount for the estimated impairment on nonaccrual commercial loans and commercial loans modified in a TDR, whether on accrual or nonaccrual status.
Consumer
For consumer loans, the Company determines the allowance on a collective basis utilizing historical losses over 20 quarters to represent its best estimate of inherent loss. The Company pools loans, generally by loan class with similar risk characteristics. The allowance also includes an amount for the estimated impairment on nonaccrual consumer loans and consumer loans modified in a TDR, whether on accrual or nonaccrual status.
The following table summarizes the composition of our loan portfolio. Total gross loans are recorded net of deferred loan fees and costs, which totaled $2.3 million and $2.0 million as of December 31, 2017 and December 31, 2016, respectively.
78
| December 31, | |||||||||||
| (dollars in thousands) | 2017 | 2016 | |||||||||
| Commercial | |||||||||||
| Owner occupied RE | $ | 316,818 | 22.8% | 285,938 | 24.6% | ||||||
| Non-owner occupied RE | 312,798 | 22.6% | 239,574 | 20.6% | |||||||
| Construction | 51,179 | 3.7% | 33,393 | 2.9% | |||||||
| Business | 226,158 | 16.3% | 202,552 | 17.4% | |||||||
| Total commercial loans | 906,953 | 65.4% | 761,457 | 65.5% | |||||||
| Consumer | |||||||||||
| Real estate | 273,050 | 19.7% | 215,588 | 18.5% | |||||||
| Home equity | 156,141 | 11.3% | 137,105 | 11.8% | |||||||
| Construction | 28,351 | 2.0% | 31,922 | 2.7% | |||||||
| Other | 22,575 | 1.6% | 17,572 | 1.5% | |||||||
| Total consumer loans | 480,117 | 34.6% | 402,187 | 34.5% | |||||||
| Total gross loans, net of deferred fees | 1,387,070 | 100.0% | 1,163,644 | 100.0% | |||||||
| Less – allowance for loan losses | (15,523 | ) | (14,855 | ) | |||||||
| Total loans, net | $ | 1,371,547 | 1,148,789 | ||||||||
The composition of gross loans by rate type is as follows:
| December 31, | |||||
| (dollars in thousands) | 2017 | 2016 | |||
| Variable rate loans | $ | 349,493 | 290,462 | ||
| Fixed rate loans | 1,037,577 | 873,182 | |||
| $ | 1,387,070 | 1,163,644 | |||
At December 31, 2017, approximately $487.0 million of the Company’s mortgage loans were pledged as collateral for advances from the FHLB, as set forth in Note 9.
Credit Quality Indicators
Commercial
We manage a consistent process for assessing commercial loan credit quality by monitoring our loan grading trends and past due statistics. All loans are subject to individual risk assessment. Our risk categories include Pass, Special Mention, Substandard, and Doubtful, each of which is defined by banking regulatory agencies. Delinquency statistics are also an important indicator of credit quality in the establishment of our allowance for credit losses.
We categorize our loans into risk categories based on relevant information about the ability of the borrower to service their debt such as current financial information, historical payment experience, credit documentation, public information, and current economic trends, among other factors. A description of the general characteristics of the risk grades is as follows:
| ● |
Pass—These loans range from minimal credit risk to average however still acceptable credit risk. |
| ● |
Special mention—A special mention loan has potential weaknesses that deserve management’s close attention. If left uncorrected, these potential weaknesses may result in deterioration of the repayment prospects for the loan or the institution’s credit position at some future date. |
| ● |
Substandard—A substandard loan is inadequately protected by the current sound worth and paying capacity of the obligor or of the collateral pledged, if any. Loans so classified must have a well-defined weakness, or weaknesses, that may jeopardize the liquidation of the debt. A substandard loan is characterized by the distinct possibility that the Bank will sustain some loss if the deficiencies are not corrected. |
| ● |
Doubtful—A doubtful loan has all of the weaknesses inherent in one classified as substandard with the added characteristic that the weaknesses make collection or liquidation in full, on the basis of the currently existing facts, conditions and values, highly questionable and improbable. |
79
The following tables provide past due information for outstanding commercial loans and include loans on nonaccrual status.
| December 31, 2017 | |||||||||||
| Owner | Non-owner | ||||||||||
| (dollars in thousands) | occupied RE | occupied RE | Construction | Business | Total | ||||||
| Current | $ | 316,818 | 312,477 | 51,179 | 224,861 | 905,335 | |||||
| 30-59 days past due | - | 129 | - | 416 | 545 | ||||||
| 60-89 days past due | - | - | - | - | - | ||||||
| Greater than 90 days | - | 192 | - | 881 | 1,073 | ||||||
| $ | 316,818 | 312,798 | 51,179 | 226,158 | 906,953 | ||||||
| December 31, 2016 | |||||||||||
| Owner | Non-owner | ||||||||||
| occupied RE | occupied RE | Construction | Business | Total | |||||||
| Current | $ | 284,700 | 238,346 | 33,393 | 200,624 | 757,063 | |||||
| 30-59 days past due | 981 | - | - | 1,423 | 2,404 | ||||||
| 60-89 days past due | 257 | 56 | - | - | 313 | ||||||
| Greater than 90 days | - | 1,172 | - | 505 | 1,677 | ||||||
| $ | 285,938 | 239,574 | 33,393 | 202,552 | 761,457 | ||||||
As of December 31, 2017 and 2016, loans 30 days or more past due represented 0.34% and 0.55% of our total loan portfolio, respectively. Commercial loans 30 days or more past due were 0.12% and 0.38% as of December 31, 2017 and 2016, respectively.
The tables below provide a breakdown of outstanding commercial loans by risk category.
| December 31, 2017 | |||||||||||
| Owner | Non-owner | ||||||||||
| (dollars in thousands) | occupied RE | occupied RE | Construction | Business | Total | ||||||
| Pass | $ | 312,628 | 306,965 | 51,179 | 215,729 | 886,501 | |||||
| Special Mention | 1,770 | 2,082 | - | 5,540 | 9,392 | ||||||
| Substandard | 2,420 | 3,751 | - | 4,889 | 11,060 | ||||||
| Doubtful | - | - | - | - | - | ||||||
| $ | 316,818 | 312,798 | 51,179 | 226,158 | 906,953 | ||||||
| December 31, 2016 | |||||||||||
| Owner | Non-owner | ||||||||||
| occupied RE | occupied RE | Construction | Business | Total | |||||||
| Pass | $ | 282,055 | 234,957 | 33,393 | 193,517 | 743,922 | |||||
| Special Mention | 1,097 | 975 | - | 2,489 | 4,561 | ||||||
| Substandard | 2,786 | 3,642 | - | 6,546 | 12,974 | ||||||
| Doubtful | - | - | - | - | - | ||||||
| $ | 285,938 | 239,574 | 33,393 | 202,552 | 761,457 | ||||||
Consumer
We manage a consistent process for assessing consumer loan credit quality by monitoring our loan grading trends and past due statistics. All loans are subject to individual risk assessment. Our risk categories include Pass, Special Mention, Substandard, and Doubtful, which are defined above. Delinquency statistics are also an important indicator of credit quality in the establishment of our allowance for loan losses.
80
The following tables provide past due information for outstanding consumer loans and include loans on nonaccrual status.
| December 31, 2017 | |||||||||||
| (dollars in thousands) | Real estate | Home equity | Construction | Other | Total | ||||||
| Current | $ | 271,284 | 154,821 | 28,351 | 22,506 | 476,962 | |||||
| 30-59 days past due | 681 | 325 | - | 69 | 1,075 | ||||||
| 60-89 days past due | 131 | 995 | - | - | 1,126 | ||||||
| Greater than 90 days | 954 | - | - | - | 954 | ||||||
| $ | 273,050 | 156,141 | 28,351 | 22,575 | 480,117 | ||||||
| December 31, 2016 | |||||||||||
| Real estate | Home equity | Construction | Other | Total | |||||||
| Current | $ | 214,228 | 136,638 | 31,922 | 17,427 | 400,215 | |||||
| 30-59 days past due | 1,041 | 210 | - | 126 | 1,377 | ||||||
| 60-89 days past due | 282 | - | - | 6 | 288 | ||||||
| Greater than 90 days | 37 | 257 | - | 13 | 307 | ||||||
| $ | 215,588 | 137,105 | 31,922 | 17,572 | 402,187 | ||||||
Consumer loans 30 days or more past due were 0.23% and 0.17% as of December 31, 2017 and 2016, respectively.
The tables below provide a breakdown of outstanding consumer loans by risk category.
| December 31, 2017 | |||||||||||
| (dollars in thousands) | Real estate | Home equity | Construction | Other | Total | ||||||
| Pass | $ | 269,422 | 152,545 | 28,351 | 22,367 | 472,685 | |||||
| Special Mention | 715 | 1,025 | - | 88 | 1,828 | ||||||
| Substandard | 2,913 | 2,571 | - | 120 | 5,604 | ||||||
| Doubtful | - | - | - | - | - | ||||||
| Loss | - | - | - | - | - | ||||||
| $ | 273,050 | 156,141 | 28,351 | 22,575 | 480,117 | ||||||
| December 31, 2016 | |||||||||||
| Real estate | Home equity | Construction | Other | Total | |||||||
| Pass | $ | 211,563 | 134,124 | 31,922 | 17,485 | 395,094 | |||||
| Special Mention | 1,064 | 2,109 | - | 16 | 3,189 | ||||||
| Substandard | 2,961 | 872 | - | 71 | 3,904 | ||||||
| Doubtful | - | - | - | - | - | ||||||
| Loss | - | - | - | - | - | ||||||
| $ | 215,588 | 137,105 | 31,922 | 17,572 | 402,187 | ||||||
Nonperforming assets
The following table shows the nonperforming assets and the related percentage of nonperforming assets to total assets and gross loans. Generally, a loan is placed on nonaccrual status when it becomes 90 days past due as to principal or interest, or when we believe, after considering economic and business conditions and collection efforts, that the borrower’s financial condition is such that collection of the contractual principal or interest on the loan is doubtful. A payment of interest on a loan that is classified as nonaccrual is recognized as a reduction in principal when received.
81
| December 31, | |||||
| (dollars in thousands) | 2017 | 2016 | |||
| Commercial | |||||
| Owner occupied RE | $ | - | 276 | ||
| Non-owner occupied RE | 1,581 | 2,711 | |||
| Construction | - | - | |||
| Business | 910 | 686 | |||
| Consumer | |||||
| Real estate | 992 | 550 | |||
| Home equity | 1,144 | 256 | |||
| Construction | - | - | |||
| Other | 1 | 13 | |||
| Nonaccruing troubled debt restructurings | 2,673 | 990 | |||
| Total nonaccrual loans, including nonaccruing TDRs | 7,301 | 5,482 | |||
| Other real estate owned | 242 | 639 | |||
| Total nonperforming assets | $ | 7,543 | 6,121 | ||
| Nonperforming assets as a percentage of: | |||||
| Total assets | 0.46% | 0.46% | |||
| Gross loans | 0.54% | 0.53% | |||
| Total loans over 90 days past due | $ | 2,027 | 1,984 | ||
| Loans over 90 days past due and still accruing | - | - | |||
| Accruing TDRs | 5,145 | 5,675 | |||
Foregone interest income on the nonaccrual loans for the year ended December 31, 2017 was approximately $309,000 and approximately $439,000 for the same period in 2016.
Impaired Loans
The table below summarizes key information for impaired loans. Our impaired loans include loans on nonaccrual status and loans modified in a TDR, whether on accrual or nonaccrual status. These impaired loans may have estimated impairment which is included in the allowance for loan losses. Our commercial and consumer impaired loans are evaluated individually to determine the related allowance for loan losses.
| December 31, 2017 | |||||||||
| Recorded investment | |||||||||
| Impaired loans | |||||||||
| Unpaid | with related | Related | |||||||
| Principal | Impaired | allowance for | allowance for | ||||||
| (dollars in thousands) | Balance | loans | loan losses | loan losses | |||||
| Commercial | |||||||||
| Owner occupied RE | $ | 2,281 | 2,235 | 464 | 179 | ||||
| Non-owner occupied RE | 6,827 | 3,665 | 2,646 | 750 | |||||
| Construction | - | - | - | - | |||||
| Business | 3,735 | 2,764 | 1,993 | 1,061 | |||||
| Total commercial | 12,843 | 8,664 | 5,103 | 1,990 | |||||
| Consumer | |||||||||
| Real estate | 2,062 | 2,037 | 2,037 | 1,379 | |||||
| Home equity | 2,010 | 1,575 | 680 | 286 | |||||
| Construction | - | - | - | - | |||||
| Other | 171 | 170 | 170 | 22 | |||||
| Total consumer | 4,243 | 3,782 | 2,887 | 1,687 | |||||
| Total | $ | 17,086 | 12,446 | 7,990 | 3,677 | ||||
82
| December 31, 2016 | |||||||||
| Recorded investment | |||||||||
| Impaired loans | |||||||||
| Unpaid | with related | Related | |||||||
| Principal | Impaired | allowance for | allowance for | ||||||
| (dollars in thousands) | Balance | loans | loan losses | loan losses | |||||
| Commercial | |||||||||
| Owner occupied RE | $ | 2,284 | 2,243 | 2,224 | 263 | ||||
| Non-owner occupied RE | 7,238 | 4,031 | 1,638 | 457 | |||||
| Construction | - | - | - | - | |||||
| Business | 3,699 | 2,593 | 1,610 | 1,154 | |||||
| Total commercial | 13,221 | 8,867 | 5,472 | 1,874 | |||||
| Consumer | |||||||||
| Real estate | 1,853 | 1,843 | 1,843 | 682 | |||||
| Home equity | 207 | 257 | - | - | |||||
| Construction | - | - | - | - | |||||
| Other | 261 | 190 | 177 | 88 | |||||
| Total consumer | 2,321 | 2,290 | 2,020 | 770 | |||||
| Total | $ | 15,542 | 11,157 | 7,492 | 2,644 | ||||
The following table provides the average recorded investment in impaired loans and the amount of interest income recognized on impaired loans after impairment by portfolio segment and class.
| Year ended December 31, | |||||||||||||
| 2017 | 2016 | 2015 | |||||||||||
| Average | Recognized | Average | Recognized | Average | Recognized | ||||||||
| recorded | interest | recorded | interest | recorded | interest | ||||||||
| (dollars in thousands) | investment | income | investment | income | investment | income | |||||||
| Commercial | |||||||||||||
| Owner occupied RE | $ | 2,255 | 104 | 2,263 | 112 | 884 | 6 | ||||||
| Non-owner occupied RE | 4,144 | 199 | 4,106 | 200 | 6,137 | 128 | |||||||
| Construction | - | - | - | - | 1,888 | 74 | |||||||
| Business | 2,823 | 162 | 2,873 | 135 | 4,067 | 148 | |||||||
| Total commercial | 9,222 | 465 | 9,242 | 447 | 12,976 | 356 | |||||||
| Consumer | |||||||||||||
| Real estate | 2,047 | 69 | 1,854 | 81 | 1,112 | 46 | |||||||
| Home equity | 1,576 | 97 | 257 | 2 | 252 | 7 | |||||||
| Construction | - | - | - | - | - | - | |||||||
| Other | 174 | 6 | 203 | 6 | 208 | 7 | |||||||
| Total consumer | 3,797 | 172 | 2,314 | 89 | 1,572 | 60 | |||||||
| Total | $ | 13,019 | 637 | 11,556 | 536 | 14,548 | 416 | ||||||
83
Allowance for Loan Losses
The following table summarizes the activity related to our allowance for loan losses:
| Year ended December 31, | ||||||||||
| (dollars in thousands) | 2017 | 2016 | 2015 | |||||||
| Balance, beginning of period | $ | 14,855 | 13,629 | 11,752 | ||||||
| Provision for loan losses | 2,000 | 2,300 | 3,200 | |||||||
| Loan charge-offs: | ||||||||||
| Commercial | ||||||||||
| Owner occupied RE | - | (5 | ) | (48 | ) | |||||
| Non-owner occupied RE | (589 | ) | (100 | ) | (258 | ) | ||||
| Construction | - | (42 | ) | (50 | ) | |||||
| Business | (638 | ) | (1,031 | ) | (881 | ) | ||||
| Total commercial | (1,227 | ) | (1,178 | ) | (1,237 | ) | ||||
| Consumer | ||||||||||
| Real estate | - | (194 | ) | (173 | ) | |||||
| Home equity | (400 | ) | (66 | ) | (93 | ) | ||||
| Construction | - | - | - | |||||||
| Other | (11 | ) | (210 | ) | (5 | ) | ||||
| Total consumer | (411 | ) | (470 | ) | (271 | ) | ||||
| Total loan charge-offs | (1,638 | ) | (1,648 | ) | (1,508 | ) | ||||
| Loan recoveries: | ||||||||||
| Commercial | ||||||||||
| Owner occupied RE | - | - | - | |||||||
| Non-owner occupied RE | 119 | 155 | 10 | |||||||
| Construction | - | - | - | |||||||
| Business | 86 | 403 | 129 | |||||||
| Total commercial | 205 | 558 | 139 | |||||||
| Consumer | ||||||||||
| Real estate | 86 | 10 | - | |||||||
| Home equity | 13 | 1 | 46 | |||||||
| Construction | - | - | - | |||||||
| Other | 2 | 5 | - | |||||||
| Total consumer | 101 | 16 | 46 | |||||||
| Total recoveries | 306 | 574 | 185 | |||||||
| Net loan charge-offs | (1,332 | ) | (1,074 | ) | (1,323 | ) | ||||
| Balance, end of period | $ | 15,523 | 14,855 | 13,629 | ||||||
The following tables summarize the activity in the allowance for loan losses by our commercial and consumer portfolio segments.
| Year ended December 31, 2017 | ||||||||||||
| (dollars in thousands) | Commercial | Consumer | Unallocated | Total | ||||||||
| Balance, beginning of period | $ | 10,039 | 4,816 | - | 14,855 | |||||||
| Provision | 920 | 1,080 | - | 2,000 | ||||||||
| Loan charge-offs | (1,227 | ) | (411 | ) | - | (1,638 | ) | |||||
| Loan recoveries | 205 | 101 | - | 306 | ||||||||
| Net loan charge-offs | (1,022 | ) | (310 | ) | - | (1,332 | ) | |||||
| Balance, end of period | $ | 9,937 | 5,586 | - | 15,523 | |||||||
| Year ended December 31, 2016 | ||||||||||||
| Commercial | Consumer | Unallocated | Total | |||||||||
| Balance, beginning of period | $ | 9,672 | 3,957 | - | 13,629 | |||||||
| Provision | 987 | 1,313 | - | 2,300 | ||||||||
| Loan charge-offs | (1,178 | ) | (470 | ) | - | (1,648 | ) | |||||
| Loan recoveries | 558 | 16 | - | 574 | ||||||||
| Net loan charge-offs | (620 | ) | (454 | ) | - | (1,074 | ) | |||||
| Balance, end of period | $ | 10,039 | 4,816 | - | 14,855 | |||||||
84
The following table disaggregates our allowance for loan losses and recorded investment in loans by method of impairment evaluation.
| December 31, 2017 | |||||||||||||
| Allowance for loan losses | Recorded investment in loans | ||||||||||||
| (dollars in thousands) | Commercial | Consumer | Total | Commercial | Consumer | Total | |||||||
| Individually evaluated | $ | 1,990 | 1,687 | 3,677 | 8,664 | 3,782 | 12,446 | ||||||
| Collectively evaluated | 7,947 | 3,899 | 11,846 | 898,289 | 476,335 | 1,374,624 | |||||||
| Total | $ | 9,937 | 5,586 | 15,523 | 906,953 | 480,117 | 1,387,070 | ||||||
| December 31, 2016 | |||||||||||||
| Allowance for loan losses | Recorded investment in loans | ||||||||||||
| Commercial | Consumer | Total | Commercial | Consumer | Total | ||||||||
| Individually evaluated | $ | 1,874 | 770 | 2,644 | 8,867 | 2,290 | 11,157 | ||||||
| Collectively evaluated | 8,165 | 4,046 | 12,211 | 752,590 | 399,897 | 1,152,487 | |||||||
| Total | $ | 10,039 | 4,816 | 14,855 | 761,457 | 402,187 | 1,163,644 | ||||||
NOTE 5 – Troubled Debt Restructurings
At December 31, 2017, we had 21 loans totaling $7.8 million and at December 31, 2016 we had 17 loans totaling $6.7 million, which we considered as TDRs. The Company considers a loan to be a TDR when the debtor experiences financial difficulties and the Company grants a concession to the debtor that it would not normally consider. Concessions can relate to the contractual interest rate, maturity date, or payment structure of the note. As part of our workout plan for individual loan relationships, we may restructure loan terms to assist borrowers facing challenges in the current economic environment. During 2017, we have added five commercial and three consumer loan totaling $2.6 million as TDRs and removed four loans from TDR status due to pay-offs or in accordance with our nonperforming loans and TDR policies. To date, we have restored four nonaccrual commercial loans previously classified as TDRs to accrual status.
The following table summarizes the concession at the time of modification and the recorded investment in our TDRs before and after their modification.
| For the year ended December 31, 2017 | ||||||||||||||||
| Pre- | Post- | |||||||||||||||
| modification | modification | |||||||||||||||
| Renewals | Reduced | Converted | Maturity | Total | outstanding | outstanding | ||||||||||
| deemed a | or deferred | to interest | date | number | recorded | recorded | ||||||||||
| (dollars in thousands) | concession | payments | only | extensions | of loans | investment | Investment | |||||||||
| Commercial | ||||||||||||||||
| Owner occupied RE | 1 | - | - | - | 1 | $ | 254 | $ | 310 | |||||||
| Non-owner occupied RE | 1 | - | - | - | 1 | 976 | 976 | |||||||||
| Business | 2 | 1 | - | - | 3 | 591 | 600 | |||||||||
| Consumer | ||||||||||||||||
| Real estate | 1 | - | - | - | 1 | 281 | 270 | |||||||||
| Home equity | 1 | 1 | - | - | 2 | 363 | 456 | |||||||||
| Total loans | 6 | 2 | - | - | 8 | $ | 2,465 | $ | 2,612 | |||||||
| For the year ended December 31, 2016 | ||||||||||||||||
| Pre- | Post- | |||||||||||||||
| modification | modification | |||||||||||||||
| Renewals | Reduced | Converted | Maturity | Total | outstanding | outstanding | ||||||||||
| deemed a | or deferred | to interest | date | number | recorded | recorded | ||||||||||
| concession | payments | only | extensions | of loans | investment | Investment | ||||||||||
| Commercial | ||||||||||||||||
| Owner occupied RE | 1 | - | - | - | 1 | $ | 477 | $ | 478 | |||||||
| Consumer | ||||||||||||||||
| Real estate | 1 | - | - | - | 1 | 188 | 188 | |||||||||
| Total loans | 2 | - | - | - | 2 | $ | 665 | $ | 666 | |||||||
85
As of December 31, 2017 there were no loans modified as TDRs for which there was a payment default (60 days past due) within 12 months of the restructuring date. As of December 31, 2016, there were no loans modified as TDRs for which there was a payment default (60 days past due) within 12 months of the restructuring date.
NOTE 6 – Property and Equipment
Property and equipment are stated at cost less accumulated depreciation. Components of property and equipment included in the consolidated balance sheets are as follows:
| December 31, | |||||||
| (dollars in thousands) | 2017 | 2016 | |||||
| Land | $ | 6,827 | 6,827 | ||||
| Buildings | 23,990 | 14,833 | |||||
| Leasehold Improvements | 2,220 | 2,020 | |||||
| Furniture and equipment | 8,075 | 7,410 | |||||
| Software | 306 | 421 | |||||
| Construction in process | 40 | 6,225 | |||||
| 41,458 | 37,736 | ||||||
| Accumulated depreciation | (9,224 | ) | (9,374 | ) | |||
| Total property and equipment | $ | 32,234 | 28,362 | ||||
Construction in process at December 31, 2017 included costs associated with the upfit of leased office space in Atlanta, Georgia, while the balance at December 31, 2016 included costs associated with the construction of a new regional office in Charleston, South Carolina. Depreciation and amortization expense for the years ended December 31, 2017 and 2016 was $1.5 million and $1.3 million, respectively. Depreciation is charged to operations utilizing a straight-line method over the estimated useful lives of the assets. The estimated useful lives for the principal items follow:
| Type of Asset | Life in Years | |
| Software | 3 | |
| Furniture and equipment | 5 to 7 | |
| Leasehold improvements | 5 to 15 | |
| Buildings | 40 |
NOTE 7 – Other Real Estate Owned
Other real estate owned is comprised of real estate acquired in settlement of loans and is included in other assets on the balance sheet. At December 31, 2017, other real estate owned included three properties totaling $242,000, compared to eight properties totaling $639,000 at December 31, 2016. The following summarizes the activity in the real estate acquired in settlement of loans portion of other real estate owned:
| For the year ended December 31, | ||||||||
| (dollars in thousands) | 2017 | 2016 | ||||||
| Balance, beginning of year | $ | 639 | $ | 2,475 | ||||
| Additions | 289 | 245 | ||||||
| Sales | (501 | ) | (1,615 | ) | ||||
| Write-downs, net | (185 | ) | (466 | ) | ||||
| Balance, end of year | $ | 242 | $ | 639 | ||||
86
NOTE 8 – Deposits
The following is a detail of the deposit accounts:
| December 31, | |||||
| (dollars in thousands) | 2017 | 2016 | |||
| Noninterest bearing | $ | 295,680 | 235,538 | ||
| Interest bearing: | |||||
| NOW accounts | 229,945 | 234,949 | |||
| Money market accounts | 545,029 | 345,117 | |||
| Savings | 16,298 | 14,942 | |||
| Time, less than $100,000 | 55,461 | 48,638 | |||
| Time, $100,000 and over | 238,710 | 211,967 | |||
| Total deposits | $ | 1,381,123 | 1,091,151 | ||
At December 31, 2017 and 2016, time deposits greater than $250,000 were $131.7 million and $153.7 million, respectively.
Also, at December 31, 2017 and 2016, the Company had approximately $28.1 million and $59.1 million, respectively, of time deposits that were obtained outside of the Company’s primary market. Interest expense on time deposits greater than $100,000 was $2.7 million for the year ended December 31, 2017, $1.8 million for the year ended December 31, 2016, and $1.7 million for the year ended December 31, 2015.
At December 31, 2017 the scheduled maturities of certificates of deposit are as follows:
| (dollars in thousands) | |||
| 2018 | $ | 213,562 | |
| 2019 | 54,669 | ||
| 2020 | 16,702 | ||
| 2021 | 1,207 | ||
| 2022 and after | 8,031 | ||
| $ | 294,171 |
NOTE 9 – Federal Home Loan Bank Advances and Other Borrowings
At December 31, 2017 and 2016, the Company had $67.2 million and $115.2 million, respectively, in FHLB advances and other borrowings. Of the $67.2 million outstanding at December 31, 2017, FHLB advances represented $60.0 million and securities sold under structured agreements to repurchase represented $7.2 million. Of the $115.2 million outstanding at December 31, 2016, FHLB advances represented $96.0 million and securities sold under structured agreements to repurchase represented $19.2 million.
The FHLB advances are secured with approximately $487.0 million of mortgage loans and $3.8 million of stock in the FHLB. During the third quarter of 2017, the Company restructured two FHLB advances totaling $25.0 million. In accordance with accounting guidance, we determined that the present value of the cash flows of the modified advance did not change by more than 10% from the present value of the cash flows of the original advances. Therefore, the modified FHLB advance was considered to be a restructuring and no gain or loss was recorded in the transaction. The original FHLB advances had a weighted rate of 4.39% and an average remaining life of 8 months. Under the modified arrangement, the FHLB advances had a weighted average rate of 3.36% and an average remaining life of 22 months.
Listed below is a summary of the terms and maturities of the advances outstanding at December 31, 2017 and 2016. As of December 31, 2017, $55.0 million, or 91.7%, of the Company’s advances were at fixed rates, while $5.0 million, or 8.3%, were at floating rates.
87
| December 31, | ||||||||||
| (dollars in thousands) | 2017 | 2016 | ||||||||
| Maturity | Amount | Rate | Amount | Rate | ||||||
| February 13, 2017 | $ | - | - % | $ | 7,500 | 4.38% | ||||
| April 18, 2017 | - | - % | 7,000 | 2.73% | ||||||
| April 18, 2017 | - | - % | 7,500 | 2.91% | ||||||
| April 19, 2017 | - | - % | 20,000 | 2.16% | ||||||
| April 19, 2017 | - | - % | 10,000 | 2.54% | ||||||
| July 11, 2017 | - | - % | 9,000 | 4.49% | ||||||
| July 24, 2017 | - | - % | 5,000 | 4.25% | ||||||
| January 30, 2018 | 5,000 | 4.06% | 5,000 | 3.57% | ||||||
| December 31, 2018 | 30,000 | 1.59% | - | - % | ||||||
| February 15, 2019 | - | - % | 10,000 | 4.47% | ||||||
| October 10, 2019 | - | - % | 15,000 | 4.06% | ||||||
| July 7, 2022 | 10,000 | 3.11% | - | - % | ||||||
| July 7, 2023 | 15,000 | 3.53% | - | - % | ||||||
| $ | 60,000 | 2.53% | $ | 96,000 | 3.41% | |||||
At December 31, 2017, the Company had two structured debt agreements secured by approximately $7.7 million of various investment securities. At December 31, 2016, the Company had four structured debt agreements secured by approximately $21.0 million of various investment securities. While these agreements are at fixed rates, they each have callable features and are subject to repricing at the option of the seller. Listed below is a summary of the terms and maturities of these structured agreements to repurchase that are in place at December 31, 2017:
| (dollars in thousands) | |||||
| Maturity | Amount | Rate | |||
| March 14, 2018 | $ | 3,600 | 2.75% | ||
| September 15, 2018 | 3,600 | 2.55% | |||
| $ | 7,200 | 2.65% | |||
The Company also has an unsecured, interest only line of credit for $15 million with another financial institution which was unused at December 31, 2017. The line of credit bears interest at LIBOR plus 2.50% and matures on June 30, 2020. The loan agreement contains various financial covenants related to capital, earnings and asset quality.
NOTE 10 – Junior Subordinated Debentures
On June 26, 2003, Greenville First Statutory Trust I (a non-consolidated subsidiary) issued $6.0 million floating rate trust preferred securities with a maturity of June 26, 2033. At December 31, 2017, the interest rate was 4.77% and is indexed to the 3-month LIBOR rate and adjusted quarterly. The Company received from the Trust the $6.0 million proceeds from the issuance of the securities and the $186,000 initial proceeds from the capital investment in the Trust, and accordingly has shown the funds due to the Trust as $6.2 million junior subordinated debentures.
On December 22, 2005, Greenville First Statutory Trust II (a non-consolidated subsidiary) issued $7.0 million floating rate trust preferred securities with a maturity of December 22, 2035. At December 31, 2017, the interest rate was 3.13% and is indexed to the 3-month LIBOR rate and adjusted quarterly. The Company received from the Trust the $7.0 million proceeds from the issuance of the securities and the $217,000 initial proceeds from the capital investment in the Trust, and accordingly has shown the funds due to the Trust as $7.2 million junior subordinated debentures.
The current regulatory rules allow certain amounts of junior subordinated debentures to be included in the calculation of regulatory capital. However, provisions within the Dodd-Frank Act prohibit institutions that had more than $15 billion in assets on December 31, 2009 from including trust preferred securities as Tier 1 capital beginning in 2013, with one-third phased out over the two years ending in 2015. Financial institutions with less than $15 billion in total assets, such as the Bank, may continue to include their trust preferred securities issued prior to May 19, 2010 in Tier 1 capital, but cannot include in Tier 1 capital trust preferred securities issued after such date.
88
NOTE 11 – Unused Lines of Credit
At December 31, 2017, the Company had four lines of credit to purchase federal funds that totaled $72.0 million which were unused at December 31, 2017. The lines of credit are available on a one to 14 day basis for general corporate purposes of the Company. The lender has reserved the right to withdraw the line at their option. The Company has an additional line of credit with the FHLB to borrow funds, subject to a pledge of qualified collateral. The Company has collateral that would support approximately $261.9 million in additional borrowings at December 31, 2017.
NOTE 12 – Derivative Financial Instruments
The Company utilizes derivative financial instruments primarily to hedge its exposure to changes in interest rates. All derivative financial instruments are recognized as either assets or liabilities and measured at fair value. The Company accounts for all of its derivatives as free-standing derivatives and does not designate any of these instruments for hedge accounting. Therefore, the gain or loss resulting from the change in the fair value of the derivative is recognized in the Company’s statement of income during the period of change.
The Company enters into commitments to originate residential mortgage loans held for sale, at specified interest rates and within a specified period of time, with clients who have applied for a loan and meet certain credit and underwriting criteria (interest rate lock commitments). These interest rate lock commitments (“IRLCs”) meet the definition of a derivative financial instrument and are reflected in the balance sheet at fair value with changes in fair value recognized in current period earnings. Unrealized gains and losses on the IRLCs are recorded as derivative assets and derivative liabilities, respectively, and are measured based on the value of the underlying mortgage loan, quoted mortgage-backed securities (“MBS”) prices and an estimate of the probability that the mortgage loan will fund within the terms of the interest rate lock commitment, net of estimated commission expenses.
The Company manages the interest rate and price risk associated with its outstanding IRLCs and mortgage loans held for sale by entering into derivative instruments such as forward sales of MBS. Management expects these derivatives will experience changes in fair value opposite to changes in fair value of the IRLCs and mortgage loans held for sale, thereby reducing earnings volatility. The Company takes into account various factors and strategies in determining the portion of the mortgage pipeline (IRLCs and mortgage loans held for sale) it wants to economically hedge.
The following table summarizes the Company’s outstanding financial derivative instruments at December 31, 2017 and December 31, 2016.
| December 31, 2017 | |||||||||
| Fair Value | |||||||||
| (dollars in thousands) | Notional | Balance Sheet Location | Asset/(Liability) | ||||||
| Mortgage loan interest rate lock commitments | $ | 15,430 | Other assets | $ | 196 | ||||
| MBS forward sales commitments | 10,750 | Other liabilities | (28 | ) | |||||
| Total derivative financial instruments | $ | 26,180 | $ | 168 | |||||
| December 31, 2016 | |||||||||
| Fair Value | |||||||||
| Notional | Balance Sheet Location | Asset/(Liability) | |||||||
| Mortgage loan interest rate lock commitments | $ | 17,986 | Other assets | $ | 256 | ||||
| MBS forward sales commitments | 14,250 | Other liabilities | (3 | ) | |||||
| Total derivative financial instruments | $ | 32,236 | $ | 253 | |||||
89
NOTE 13 – Fair Value Accounting
FASB ASC 820, “Fair Value Measurement and Disclosures Topic,” defines fair value as the exchange price that would be received for an asset or paid to transfer a liability (an exit price) in the principal or most advantageous market for the asset or liability in an orderly transaction between market participants on the measurement date. FASB ASC 820 also establishes a fair value hierarchy which requires an entity to maximize the use of observable inputs and minimize the use of unobservable inputs when measuring fair value. The standard describes three levels of inputs that may be used to measure fair value:
Level 1 – Quoted market price in active markets
Quoted prices in active markets for identical assets or liabilities. Level 1 assets and liabilities include certain debt and equity securities that are traded in an active exchange market.
Level 2 – Significant other observable inputs
Observable inputs other than Level 1 prices such as quoted prices for similar assets or liabilities; quoted prices in markets that are not active; or other inputs that are observable or can be corroborated by observable market data for substantially the full term of the assets or liabilities. Level 2 assets and liabilities include fixed income securities and mortgage-backed securities that are held in the Company’s available-for-sale portfolio and valued by a third-party pricing service, as well as certain impaired loans.
Level 3 – Significant unobservable inputs
Unobservable inputs that are supported by little or no market activity and that are significant to the fair value of the assets or liabilities. Level 3 assets and liabilities include financial instruments whose value is determined using pricing models, discounted cash flow methodologies, or similar techniques, as well as instruments for which the determination of fair value requires significant management judgment or estimation. These methodologies may result in a significant portion of the fair value being derived from unobservable data.
Following is a description of valuation methodologies used for assets recorded at fair value.
Investment Securities
Securities available for sale are valued on a recurring basis at quoted market prices where available. If quoted market prices are not available, fair values are based on quoted market prices of comparable securities. Level 1 securities include those traded on an active exchange, such as the New York Stock Exchange or U.S. Treasury securities that are traded by dealers or brokers in active over-the-counter markets and money market funds. Level 2 securities include mortgage-backed securities and debentures issued by government sponsored entities, municipal bonds and corporate debt securities. In certain cases where there is limited activity or less transparency around inputs to valuations, securities are classified as Level 3 within the valuation hierarchy. Securities held to maturity are valued at quoted market prices or dealer quotes similar to securities available for sale. The carrying value of Other Investments, such as Federal Reserve Bank and FHLB stock, approximates fair value based on their redemption provisions.
Mortgage Loans Held for Sale
Loans held for sale include mortgage loans which are saleable into the secondary mortgage markets and their fair values are estimated using observable quoted market or contracted prices or market price equivalents, which would be used by other market participants. These saleable loans are considered Level 2.
Loans
The Company does not record loans at fair value on a recurring basis. However, from time to time, a loan may be considered impaired and an allowance for loan losses may be established. Loans for which it is probable that payment of interest and principal will not be made in accordance with the contractual terms of the loan agreement are considered impaired. Once a loan is identified as individually impaired, management measures the impairment in accordance with FASB ASC 310, “Receivables.” The fair value of impaired loans is estimated using one of several methods, including collateral value, market value of similar debt, enterprise value, liquidation value and discounted cash flows. Those impaired loans not requiring an allowance represent loans for which the fair value of the expected repayments or collateral exceed the recorded investments in such loans. In accordance with FASB ASC 820, “Fair Value Measurement and Disclosures,” impaired loans where an allowance is established based on the fair value of collateral require classification in the fair value hierarchy. When the fair value of the collateral is based on an observable market price or a current appraised value, the Company considers the impaired loan as nonrecurring Level 2. The Company’s current loan and appraisal policies require the Company to obtain updated appraisals on an “as is” basis at renewal, or in the case of an impaired loan, on an annual basis, either through a new external appraisal or an appraisal evaluation. When an appraised value is not available or management determines the fair value of the collateral is further impaired below the appraised value and there is no observable market price, the Company considers the impaired loan as nonrecurring Level 3. The fair value of impaired loans may also be estimated using the present value of expected future cash flows to be realized on the loan, which is also considered a Level 3 valuation. These fair value estimates are subject to fluctuations in assumptions about the amount and timing of expected cash flows as well as the choice of discount rate used in the present value calculation.
90
Other Real Estate Owned
OREO, consisting of properties obtained through foreclosure or in satisfaction of loans, is reported at the lower of cost or fair value, determined on the basis of current appraisals, comparable sales, and other estimates of value obtained principally from independent sources, adjusted for estimated selling costs (Level 2). At the time of foreclosure, any excess of the loan balance over the fair value of the real estate held as collateral is treated as a charge against the allowance for loan losses. Gains or losses on sale and generally any subsequent adjustments to the value are recorded as a component of real estate owned activity. When an appraised value is not available or management determines the fair value of the collateral is further impaired below the appraised value and there is no observable market price, the Company considers the OREO as nonrecurring Level 3.
Derivative Financial Instruments
The Company estimates the fair value of IRLCs based on the value of the underlying mortgage loan, quoted MBS prices and an estimate of the probability that the mortgage loan will fund within the terms of the IRLC, net of commission expenses (Level 2). The Company estimates the fair value of forward sales commitments based on quoted MBS prices (Level 2).
Assets and Liabilities Recorded at Fair Value on a Recurring Basis
The tables below present the recorded amount of assets and liabilities measured at fair value on a recurring basis.
| December 31, 2017 | |||||||||
| (dollars in thousands) | Level 1 | Level 2 | Level 3 | Total | |||||
| Assets | |||||||||
| Securities available for sale: | |||||||||
| US government agencies | $ | - | 8,653 | - | 8,653 | ||||
| SBA securities | - | 4,063 | - | 4,063 | |||||
| State and political subdivisions | - | 11,396 | - | 11,396 | |||||
| Mortgage-backed securities | - | 43,491 | - | 43,491 | |||||
| Mortgage loans held for sale | - | 11,790 | - | 11,790 | |||||
| Mortgage loan interest rate lock commitments | - | 196 | - | 196 | |||||
| Total assets measured at fair value on a recurring basis | $ | - | 79,589 | - | 79,589 | ||||
| Liabilities | |||||||||
| MBS forward sales commitments | $ | - | 28 | - | 28 | ||||
| Total liabilities measured at fair value on a recurring basis | $ | - | 28 | - | 28 | ||||
| December 31, 2016 | |||||||||
| Level 1 | Level 2 | Level 3 | Total | ||||||
| Assets | |||||||||
| Securities available for sale: | |||||||||
| US government agencies | $ | - | 6,159 | - | 6,159 | ||||
| SBA securities | - | 1,437 | - | 1,437 | |||||
| State and political subdivisions | - | 20,474 | - | 20,474 | |||||
| Mortgage-backed securities | - | 36,410 | - | 36,410 | |||||
| Mortgage loans held for sale | - | 7,801 | - | 7,801 | |||||
| Mortgage loan interest rate lock commitments | - | 256 | - | 256 | |||||
| Total assets measured at fair value on a recurring basis | $ | - | 72,537 | - | 72,537 | ||||
| Liabilities | |||||||||
| MBS forward sales commitments | $ | - | 3 | - | 3 | ||||
| Total liabilities measured at fair value on a recurring basis | $ | - | 3 | - | 3 | ||||
Assets and Liabilities Recorded at Fair Value on a Nonrecurring Basis
The Company is predominantly an asset based lender with real estate serving as collateral on more than 80% of loans as of December 31, 2017. Loans which are deemed to be impaired are valued net of the allowance for loan losses, and other real estate owned is valued at the lower of cost or net realizable value of the underlying real estate collateral. Such market values are generally obtained using independent appraisals, which the Company considers to be level 2 inputs. The tables below present the recorded amount of assets and liabilities measured at fair value on a nonrecurring basis.
91
| December 31, 2017 | |||||||||
| (dollars in thousands) | Level 1 | Level 2 | Level 3 | Total | |||||
| Assets | |||||||||
| Impaired loans | $ | - | 2,685 | 6,084 | 8,769 | ||||
| Other real estate owned | - | 148 | 94 | 242 | |||||
| Total assets measured at fair value on a nonrecurring basis | $ | - | 2,833 | 6,178 | 9,011 | ||||
| December 31, 2016 | |||||||||
| Level 1 | Level 2 | Level 3 | Total | ||||||
| Assets | |||||||||
| Impaired loans | $ | - | 4,075 | 4,438 | 8,513 | ||||
| Other real estate owned | - | 526 | 113 | 639 | |||||
| Total assets measured at fair value on a nonrecurring basis | $ | - | 4,601 | 4,551 | 9,152 | ||||
The Company had no liabilities carried at fair value or measured at fair value on a nonrecurring basis.
For Level 3 assets and liabilities measured at fair value on a recurring or nonrecurring basis as of December 31, 2017, the significant unobservable inputs used in the fair value measurements were as follows:
| Valuation Technique | Significant Unobservable Inputs | Range of Inputs | ||||
| Impaired loans | Appraised Value/ Discounted Cash Flows |
Discounts to appraisals or cash flows for estimated holding and/or selling costs or age of appraisal | 0-25% | |||
| Other real estate owned | Appraised Value/ Comparable Sales |
Discounts to appraisals for estimated holding or selling costs | 0-25% |
Fair Value of Financial Instruments
Financial instruments require disclosure of fair value information, whether or not recognized in the consolidated balance sheets, when it is practical to estimate the fair value. A financial instrument is defined as cash, evidence of an ownership interest in an entity or a contractual obligation which requires the exchange of cash. Certain items are specifically excluded from the disclosure requirements, including the Company’s common stock, premises and equipment and other assets and liabilities.
The following is a description of valuation methodologies used to estimate fair value for certain other financial instruments.
Fair value approximates carrying value for the following financial instruments due to the short-term nature of the instrument: cash and due from banks, federal funds sold, other investments, federal funds purchased, and securities sold under agreement to repurchase.
Deposits – Fair value for demand deposit accounts and interest-bearing accounts with no fixed maturity date is equal to the carrying value. The fair value of certificate of deposit accounts are estimated by discounting cash flows from expected maturities using current interest rates on similar instruments.
FHLB Advances and Other Borrowings – Fair value for FHLB advances and other borrowings are estimated by discounting cash flows from expected maturities using current interest rates on similar instruments.
Junior subordinated debentures – Fair value for junior subordinated debentures are estimated by discounting cash flows from expected maturities using current interest rates on similar instruments.
The Company has used management’s best estimate of fair value based on the above assumptions. Thus, the fair values presented may not be the amounts that could be realized in an immediate sale or settlement of the instrument. In addition, any income taxes or other expenses, which would be incurred in an actual sale or settlement, are not taken into consideration in the fair value presented.
92
The estimated fair values of the Company’s financial instruments at December 31, 2017 and 2016 are as follows:
| December 31, 2017 | |||||||||||
| (dollars in thousands) | Carrying | Fair | Level 1 | Level 2 | Level 3 | ||||||
| Financial Assets: | |||||||||||
| Other investments, at cost | $ | 4,462 | 4,462 | - | - | 4,462 | |||||
| Loans, net | 1,371,547 | 1,372,684 | - | 2,685 | 1,369,999 | ||||||
| Financial Liabilities: | |||||||||||
| Deposits | 1,381,123 | 1,269,462 | - | 1,269,462 | - | ||||||
| FHLB and other borrowings | 67,200 | 67,890 | - | 67,890 | - | ||||||
| Junior subordinated debentures | 13,403 | 13,166 | - | 13,166 | - | ||||||
| December 31, 2016 | |||||||||||
| Carrying | Fair | Level 1 | Level 2 | Level 3 | |||||||
| Financial Assets: | |||||||||||
| Other investments, at cost | $ | 5,742 | 5,742 | - | - | 5,742 | |||||
| Loans, net | 1,148,789 | 1,149,527 | - | 4,075 | 1,145,452 | ||||||
| Financial Liabilities: | |||||||||||
| Deposits | 1,091,151 | 1,004,923 | - | 1,004,923 | - | ||||||
| FHLB and other borrowings | 115,200 | 115,825 | - | 115,825 | - | ||||||
| Junior subordinated debentures | 13,403 | 12,026 | - | 12,026 | - | ||||||
NOTE 14 – Earnings Per Common Share
The following schedule reconciles the numerators and denominators of the basic and diluted earnings per share computations for the years ended December 31, 2017, 2016 and 2015. Dilutive common shares arise from the potentially dilutive effect of the Company’s stock options and warrants that are outstanding. The assumed conversion of stock options and warrants can create a difference between basic and dilutive net income per common share.
At December 31, 2017, 2016 and 2015, options totaling 107,015, 108,315, and 93,500, respectively, were anti-dilutive in the calculation of earnings per share as their exercise price exceeded the fair market value. These options were therefore excluded from the diluted earnings per share calculation.
| December 31, | |||||||
| (dollars in thousands, except share data) | 2017 | 2016 | 2015 | ||||
| Numerator: | |||||||
| Net income | $ | 13,045 | 13,036 | 10,167 | |||
| Net income available to common shareholders | $ | 13,045 | 13,036 | 10,167 | |||
| Denominator: | |||||||
| Weighted-average common shares outstanding - basic | 7,005,703 | 6,318,322 | 6,204,518 | ||||
| Common stock equivalents | 387,674 | 402,566 | 356,221 | ||||
| Weighted-average common shares outstanding - diluted | 7,393,377 | 6,720,888 | 6,560,739 | ||||
| Earnings per common share: | |||||||
| Basic | $ | 1.86 | 2.06 | 1.64 | |||
| Diluted | $ | 1.76 | 1.94 | 1.55 | |||
NOTE 15 – Commitments and Contingencies
The Company has entered into a three year employment agreement with its chief executive officer and a two year employment agreement with its president and with 12 executive vice presidents. These agreements also include a) an incentive program, b) a stock option plan, c) a one-year non-compete agreement upon termination and a severance payment equal to one year of compensation. The total estimated aggregate salary commitment is approximately $2.8 million.
The Company has an agreement with a data processor which expires in 2023 to provide certain item processing, electronic banking, and general ledger processing services. Components of this contract vary based on transaction and account volume, including a base monthly charge of approximately $102,000 and certain termination fees.
93
The Company has occupied land and banking office space under leases expiring on various dates through 2028. The estimated future minimum lease payments under these noncancelable operating leases are summarized as follows:
| (dollars in thousands) | For the years ended December 31, | |||
| 2018 | $ | 1,635 | ||
| 2019 | 1,763 | |||
| 2020 | 1,798 | |||
| 2021 | 1,831 | |||
| 2022 | 1,119 | |||
| Thereafter | 5,642 | |||
| $ | 13,788 | |||
Lease expense for the years ended December 31, 2017, 2016, and 2015, totaled $1.3 million, $1.2 million, and $954,000, respectively.
The Company may be subject to litigation and claims in the normal course of business. As of December 31, 2017, management believes there is no material litigation pending.
NOTE 16 – Income Taxes
The components of income tax expense were as follows:
| For the years ended December 31, | ||||||||
| (dollars in thousands) | 2017 | 2016 | 2015 | |||||
| Current income taxes: | ||||||||
| Federal | $ | 7,139 | 6,429 | 6,184 | ||||
| State | 573 | 548 | 441 | |||||
| Total current tax expense | 7,712 | 6,977 | 6,625 | |||||
| Deferred income tax expense (benefit) | 2,904 | 356 | (1,256 | ) | ||||
| Income tax expense | $ | 10,616 | 7,333 | 5,369 | ||||
The following is a summary of the items that caused recorded income taxes to differ from taxes computed using the statutory tax rate:
| For the years ended December 31, | ||||||||||
| (dollars in thousands) | 2017 | 2016 | 2015 | |||||||
| Tax expense at statutory rate | $ | 8,281 | 7,129 | 5,438 | ||||||
| Effect of state income taxes, net of federal benefit | 372 | 356 | 287 | |||||||
| Exempt income | (146 | ) | (162 | ) | (151 | ) | ||||
| Effect of change in federal tax rate | 2,441 | - | - | |||||||
| Other | (332 | ) | 10 | (205 | ) | |||||
| Income tax expense | $ | 10,616 | 7,333 | 5,369 | ||||||
Income tax expense for the year ended December 31, 2017 was impacted by the adjustment of our deferred tax assets and liabilities related to the reduction in the U.S. federal statutory income tax rate to 21% under the Tax Act, which was enacted on December 22, 2017. As a result of the new law, we recognized a provisional net tax expense totaling $2.4 million, as noted in the table above.
As a result of the Tax Act, deferred taxes as of December 31, 2017 are based on the newly enacted U.S. statutory federal income tax rate of 21%, while deferred taxes as of December 31, 2016 are based on the previous federal income tax rate of 35%. The components of the deferred tax assets and liabilities are as follows:
94
| December 31, | |||||
| (dollars in thousands) | 2017 | 2016 | |||
| Deferred tax assets: | |||||
| Allowance for loan losses | $ | 3,260 | 5,199 | ||
| Unrealized loss on securities available for sale | 121 | 260 | |||
| Net deferred loan fees | 480 | 691 | |||
| Deferred compensation | 1,124 | 1,597 | |||
| Sale of real estate owned | 104 | 262 | |||
| Accrued expenses | 16 | 401 | |||
| Other | 136 | 250 | |||
| 5,241 | 8,660 | ||||
| Deferred tax liabilities: | |||||
| Property and equipment | 1,208 | 1,467 | |||
| Hedging transactions | 88 | - | |||
| Other | 163 | 368 | |||
| 1,459 | 1,835 | ||||
| Net deferred tax asset | $ | 3,782 | 6,825 | ||
The Company has analyzed the tax positions taken or expected to be taken in its tax returns and concluded it has no liability related to uncertain tax positions.
NOTE 17 – Related Party Transactions
Certain directors, executive officers, and companies with which they are affiliated, are clients of and have banking transactions with the Company in the ordinary course of business. These loans were made on substantially the same terms, including interest rates and collateral, as those prevailing at the time for comparable transactions with persons not related to the lender.
A summary of loan transactions with directors and executive officers, including their affiliates is as follows:
| For the years ended December 31, | |||||||
| (dollars in thousands) | 2017 | 2016 | |||||
| Balance, beginning of year | $ | 14,825 | 12,868 | ||||
| New loans | 6,843 | 5,103 | |||||
| Less loan payments | (6,392 | ) | (3,146 | ) | |||
| Balance, end of year | $ | 15,276 | 14,825 | ||||
Deposits by executive officers and directors and their related interests at December 31, 2017 and 2016, were $3.5 million and $6.3 million, respectively.
The Company has a land lease with a director on the property for a branch office, with monthly payments of $5,388. In addition, the Company periodically enters into various consulting agreements with the director for development, administration and advisory services related to the purchase of property and construction of current and future branch office sites. Also, the Company contracts with the director on an annual basis to provide property management services for its four offices in the Greenville market. The Company paid the director approximately $38,000, $29,000, and $31,000 for these services during 2017, 2016, and 2015, respectively.
The Company also utilizes employment recruiting services from a vendor for which one of the Company’s directors is an owner and serves as the chairman of the board. The Company paid approximately $87,000 to the vendor for the year ended December 31, 2017.
The Company is of the opinion that the lease payments, consulting fees, and signage costs represent market costs that could have been obtained in similar “arms length” transactions.
95
NOTE 18 – Financial Instruments With Off-Balance Sheet Risk
In the ordinary course of business, and to meet the financing needs of its clients, the Company is a party to various financial instruments with off-balance sheet risk. These financial instruments, which include commitments to extend credit and standby letters of credit, involve, to varying degrees, elements of credit and interest rate risk in excess of the amounts recognized in the balance sheets. The contract amount of those instruments reflects the extent of involvement the Company has in particular classes of financial instruments.
The Company’s exposure to credit loss in the event of nonperformance by the other party to the financial instrument for commitments to extend credit and standby letters of credit is represented by the contractual amounts of those instruments. The Company uses the same credit policies in making commitments and conditional obligations as it does for on-balance sheet instruments.
Commitments to extend credit are agreements to lend to a client as long as there is no violation of any material condition established in the contract. Commitments generally have fixed expiration dates or other termination clauses and may require the payment of a fee. At December 31, 2017, unfunded commitments to extend credit were approximately $345.9 million, of which $96.4 million is at fixed rates and $249.5 million is at variable rates. At December 31, 2016, unfunded commitments to extend credit were approximately $226.6 million, of which $57.8 million is at fixed rates and $168.8 million is at variable rates. The Company evaluates each client’s credit-worthiness on a case-by-case basis. The amount of collateral obtained, if deemed necessary by the Company upon extension of credit, is based on management’s credit evaluation of the borrower. Collateral varies but may include accounts receivable, inventory, property, plant and equipment, and commercial and residential real estate.
At December 31, 2017 and 2016, there was a $6.3 million and $4.4 million commitment, respectively, under letters of credit. The credit risk involved in issuing letters of credit is essentially the same as that involved in extending loan facilities to clients. Collateral varies but may include accounts receivable, inventory, equipment, marketable securities and property. Since most of the letters of credit are expected to expire without being drawn upon, they do not necessarily represent future cash requirements. The fair value of off balance sheet lending commitments are based on fees currently charged to enter into similar agreements, taking into account the remaining terms of the agreements and the counterparties credit standing. The total fair value of such instruments is not material.
NOTE 19 – Employee Benefit Plan
On January 1, 2000, the Company adopted the Southern First Bancshares, Inc. Profit Sharing and 401(k) Plan for the benefit of all eligible employees. The Company contributes to the Plan annually upon approval by the Board of Directors. Contributions made to the Plan for the years ended December 31, 2017, 2016, and 2015 amounted to $476,000, $356,000, and $326,000, respectively.
The Company also provides a nonqualified deferred compensation plan for 20 executive officers in the form of a Supplemental Executive Retirement Plan (“SERP”). The SERP provides retirement income for these officers. As of December 31, 2017 and 2016, the Company had an accrued benefit obligation of $5.4 million and $4.6 million, respectively. The Company incurred expenses related to this plan of $792,000, $782,000, and $978,000 in 2017, 2016, and 2015, respectively.
NOTE 20 – Stock-Based Compensation
Compensation cost is recognized for stock options and restricted stock awards issued to employees and non-employee directors. Compensation cost is measured as the fair value of these awards on their date of grant. A Black-Scholes model is utilized to estimate the fair value of stock options, while the market price of the Company’s common stock at the date of grant is used as the fair value of restricted stock awards. Compensation cost is recognized over the required service period, generally defined as the vesting period for stock option and restricted stock awards.
The Company’s stock incentive programs are long-term retention programs intended to attract, retain, and provide incentives for key employees and non-employee directors in the form of incentive and non-qualified stock options and restricted stock.
96
Stock-based compensation expense was recorded as follows:
| For the years ended December 31, | |||||||
| (dollars in thousands) | 2017 | 2016 | 2015 | ||||
| Stock option expense | $ | 959 | 746 | 556 | |||
| Restricted stock grant expense | 299 | 286 | 203 | ||||
| Total stock-based compensation expense | $ | 1,258 | 1,032 | 759 | |||
Stock Options
On March 21, 2000, the Company adopted a stock option plan under which the board of directors could grant up to 436,424 options at an exercise price per share not less than the fair market value on the date of grant. The options expire 10 years from the grant date, but expired or forfeited options may be reissued. Under the terms of the 2000 stock option plan any awards remaining and granted after March 2010 are accounted for as non-qualified stock options. As of January 2011, all available options under the 2000 stock option plan had been granted.
On May 18, 2010, the Company adopted the 2010 Incentive Plan, making available for issuance 366,025 stock options (adjusted for the 10% stock dividends in 2013, 2012, and 2011). The options may be exercised at an exercise price per share based on the fair market value and determined on the date of grant and expire 10 years from the grant date. On May 20, 2014, the Company amended the 2010 Incentive Plan to add an additional 200,000 shares of common stock to be issuable as stock options, for a total of 566,025 shares. As of December 31, 2017, there were 14,375 options available for grant under the 2010 Incentive Plan.
On May 17, 2016, the Company adopted the 2016 Equity Incentive Plan, making available for issuance 400,000 stock options. The options may be exercised at an exercise price per share based on the fair market value and determined on the date of grant and expire 10 years from the grant date. As of December 31, 2017, there were 345,315 options available for grant under the 2016 Equity Incentive Plan.
A summary of the status of the stock option plan and changes for the period is presented below:
| For the years ended December 31, | ||||||||||||||||||||||||
| 2017 | 2016 | 2015 | ||||||||||||||||||||||
| Shares | Weighted average exercise price |
Weighted Average Remaining Contractual Life |
Shares | Weighted average exercise price |
Weighted Average Remaining Contractual Life |
Shares | Weighted average exercise price |
Weighted Average Remaining Contractual Life | ||||||||||||||||
| Outstanding at beginning of year | 642,203 | $ | 11.77 | 693,954 | $ | 8.94 | 667,479 | $ | 7.83 | |||||||||||||||
| Granted | 110,950 | 35.34 | 109,500 | 23.65 | 93,511 | 17.15 | ||||||||||||||||||
| Exercised | (74,437 | ) | 9.48 | (152,751 | ) | 7.19 | (67,036 | ) | 9.36 | |||||||||||||||
| Forfeited or expired | (15,875 | ) | 23.49 | (8,500 | ) | 15.69 | - | - | ||||||||||||||||
| Outstanding at end of year | 662,841 | $ | 15.70 | 5.6 years | 642,203 | $ | 11.77 | 5.9 years | 693,954 | $ | 8.94 | 6.0 years | ||||||||||||
| Options exercisable at year-end | 419,766 | $ | 9.20 | 4.1 years | 399,256 | $ | 7.62 | 4.4 years | 457,895 | $ | 6.74 | 4.9 years | ||||||||||||
| Weighted average fair value of options granted during the year | $ | 14.14 | $ | 10.96 | $ | 9.09 | ||||||||||||||||||
| Shares available for grant | 359,690 | 454,765 | 155,767 | |||||||||||||||||||||
The aggregate intrinsic value (the difference between the Company’s closing stock price on the last trading day of the year and the exercise price, multiplied by the number of in-the-money options) of 662,841 and 642,203 stock options outstanding at December 31, 2017 and 2016 was $16.9 million and $15.6 million, respectively. The aggregate intrinsic value of 419,766 and 399,256 stock options exercisable at December 31, 2017 and 2016 was $13.5 million and $11.4 million, respectively.
97
The fair value of the option grant is estimated on the date of grant using the Black-Scholes option-pricing model. The following assumptions were used for grants:
| 2017 | 2016 | 2015 | ||||
| Dividend yield | - | - | - | |||
| Expected life | 7 years | 7 years | 7 years | |||
| Expected volatility | 34.63% | 43.22% | 51.24% | |||
| Risk-free interest rate | 2.04% | 1.65% | 1.63% |
At December 31, 2017, there was $2.0 million of total unrecognized compensation cost related to nonvested stock option grants. The cost is expected to be recognized over a weighted-average period of 2.6 years. The fair value of stock option grants that vested during 2017, 2016, and 2015 was $775,000, $593,000 and $491,000, respectively.
Restricted Stock Grants
In 2006, the Company adopted a restricted stock plan for the benefit of the directors, officers and employees. Under the restricted stock plan, 13,310 shares of restricted stock (adjusted for the stock dividends in 2011 and 2012) were authorized for issuance. As of December 31, 2012 all shares of restricted stock, authorized under the plan had been granted.
In May 2010, the Company adopted the 2010 Incentive Plan which included a provision for the issuance of 79,860 shares of restricted stock (adjusted for all subsequent stock dividends). On May 19, 2015, the Company amended the 2010 Incentive Plan to add an additional 25,000 shares of common stock to be issuable as restricted stock grants, for a total of 104,860 shares. As of December 31, 2017, there were 9,424 shares of restricted stock available for grant.
On May 17, 2016, the Company adopted the 2016 Equity Incentive Plan which included a provision for the issuance of 50,000 shares of common stock to be issuable as restricted stock grants. As of December 31, 2017, all shares of restricted stock were available for grant.
Shares of restricted stock granted to employees under the stock plans are subject to restrictions as to continuous employment for a specified time period following the date of grant. During this period, the holder is entitled to full voting rights and dividends.
A summary of the status of the Company’s nonvested restricted stock and changes for the years ended December 31, 2017, 2016, and 2015 is as follows:
| December 31, | ||||||||||||||||||
| 2017 | 2016 | 2015 | ||||||||||||||||
| Weighted | Weighted | Weighted | ||||||||||||||||
| Average | Average | Average | ||||||||||||||||
| Restricted | Grant-Date | Restricted | Grant-Date | Restricted | Grant-Date | |||||||||||||
| Shares | Fair Value | Shares | Fair Value | Shares | Fair Value | |||||||||||||
| Nonvested at beginning of year | 36,125 | $ | 20.13 | 33,749 | $ | 12.92 | 49,000 | $ | 11.83 | |||||||||
| Granted | 6,500 | 35.14 | 22,000 | 23.91 | 3,000 | 20.65 | ||||||||||||
| Vested | (17,625 | ) | 16.73 | (17,749 | ) | 11.68 | (18,251 | ) | 11.28 | |||||||||
| Forfeited | - | - | (1,875 | ) | 14.72 | - | - | |||||||||||
| Nonvested at end of year | 25,000 | $ | 26.43 | 36,125 | $ | 20.13 | 33,749 | $ | 12.92 | |||||||||
At December 31, 2017, there was $502,000 of total unrecognized compensation cost related to nonvested restricted stock grants. The cost is expected to be recognized over a weighted-average period of 2.6 years.
NOTE 21 – Dividends
The ability of the Company to pay cash dividends is dependent upon receiving cash in the form of dividends from the Bank. The dividends that may be paid by the Bank to the Company are subject to legal limitations and regulatory capital requirements.
Also, the payment of cash dividends on the Company's common stock by the Company in the future will be subject to certain other legal and regulatory limitations (including the requirement that the Company’s capital be maintained at certain minimum levels) and will be subject to ongoing review by banking regulators. The Federal Reserve has issued a policy statement regarding the payment of dividends by bank holding companies. In general, the Federal Reserve’s policies provide that dividends should be paid only out of current earnings and only if the prospective rate of earnings retention by the bank holding company appears consistent with the organization’s capital needs, asset quality and overall financial condition.
98
NOTE 22 – Regulatory Matters
The Company and the Bank are subject to various regulatory capital requirements administered by the federal banking agencies. Failure to meet minimum capital requirements can initiate certain mandatory and possible additional discretionary actions by regulators that, if undertaken, could have a direct material effect on the Company and Bank’s financial statements. Under capital adequacy guidelines and the regulatory framework for prompt corrective action, the Bank must meet specific capital guidelines that involve quantitative measures of the assets, liabilities, and certain off balance sheet items as calculated under regulatory accounting practices. The Bank’s capital amounts and classification are also subject to qualitative judgments by the regulators about components, risk weightings, and other factors.
Quantitative measures established by regulation to ensure capital adequacy require the Company and Bank to maintain minimum amounts and ratios (set forth in the table below) of Total and Tier 1 capital to risk-weighted assets, and of Tier 1 capital to average assets. Total capital includes Tier 1 and Tier 2 capital. Tier 2 capital consists of the allowance for loan losses subject to certain limitations. Management believes, as of December 31, 2017, that the Company and Bank exceed all well capitalized requirements to which they are subject.
The following table summarizes the capital amounts and ratios of the Bank and the Company and the regulatory minimum requirements at December 31, 2017 and 2016.
| To be well | |||||||||||||||
| capitalized | |||||||||||||||
| For capital | under prompt | ||||||||||||||
| adequacy purposes | corrective action | ||||||||||||||
| Actual | minimum | provisions minimum | |||||||||||||
| (dollars in thousands) | Amount | Ratio | Amount | Ratio | Amount | Ratio | |||||||||
| As of December 31, 2017 | |||||||||||||||
| The Bank | |||||||||||||||
| Total Capital (to risk weighted assets) | $ | 175,016 | 12.99% | $ | 107,749 | 8.00% | $ | 134,686 | 10.00% | ||||||
| Tier 1 Capital (to risk weighted assets) | 159,493 | 11.84% | 80,812 | 6.00% | 107,749 | 8.00% | |||||||||
| Common Equity Tier 1 Capital (to risk weighted assets) | 159,493 | 11.84% | 60,609 | 4.50% | 87,546 | 6.50% | |||||||||
| Tier 1 Capital (to average assets) | 159,493 | 10.04% | 63,573 | 4.00% | 79,466 | 5.00% | |||||||||
| The Company | |||||||||||||||
| Total Capital (to risk weighted assets) | 178,665 | 13.27% | 107,749 | 8.00% | n/a | n/a | |||||||||
| Tier 1 Capital (to risk weighted assets) | 163,142 | 12.11% | 80,812 | 6.00% | n/a | n/a | |||||||||
| Common Equity Tier 1 Capital (to risk weighted assets) | 150,142 | 11.15% | 60,609 | 4.50% | n/a | n/a | |||||||||
| Tier 1 Capital (to average assets) | 163,142 | 10.26% | 63,573 | 4.00% | n/a | n/a | |||||||||
99
| To be well | ||||||||||||||||
| capitalized | ||||||||||||||||
| For capital | under prompt | |||||||||||||||
| adequacy purposes | corrective action | |||||||||||||||
| Actual | minimum | provisions minimum | ||||||||||||||
| (dollars in thousands) | Amount | Ratio | Amount | Ratio | Amount | Ratio | ||||||||||
| As of December 31, 2016 | ||||||||||||||||
| The Bank | ||||||||||||||||
| Total Capital (to risk weighted assets) | $ | 132,839 | 11.69 | % | $90,910 | 8.00 | % | $113,628 | 10.00 | % | ||||||
| Tier 1 Capital (to risk weighted assets) | 118,626 | 10.44 | % | 68,183 | 6.00 | % | 90,910 | 8.00 | % | |||||||
| Common Equity Tier 1 Capital (to risk weighted assets) | 118,626 | 10.44 | % | 51,137 | 4.50 | % | 73,864 | 6.50 | % | |||||||
| Tier 1 Capital (to average assets) | 118,626 | 9.08 | % | 52,273 | 4.00 | % | 65,342 | 5.00 | % | |||||||
| The Company | ||||||||||||||||
| Total Capital (to risk weighted assets) | 137,588 | 12.11 | % | 90,910 | 8.00 | % | n/a | n/a | ||||||||
| Tier 1 Capital (to risk weighted assets) | 123,375 | 10.86 | % | 68,183 | 6.00 | % | n/a | n/a | ||||||||
| Common Equity Tier 1 Capital (to risk weighted assets) | 110,375 | 9.71 | % | 51,137 | 4.50 | % | n/a | n/a | ||||||||
| Tier 1 Capital (to average assets) | 123,375 | 9.42 | % | 52,392 | 4.00 | % | n/a | n/a | ||||||||
NOTE 23 – Reportable Segments
The Company’s reportable segments represent the distinct product lines the Company offers and are viewed separately for strategic planning purposes by management. The three segments include Commercial and Retail Banking, Mortgage Banking, and Corporate. The following schedule presents financial information for each reportable segment.
| Year ended December 31, 2017 | ||||||||||||||||
| Commercial | ||||||||||||||||
| and Retail | Mortgage | |||||||||||||||
| (dollars in thousands) | Banking | Banking | Corporate | Eliminations | Consolidated | |||||||||||
| Interest income | $ | 60,895 | 314 | 11 | (11 | ) | 61,209 | |||||||||
| Interest expense | 9,830 | - | 514 | (11 | ) | 10,333 | ||||||||||
| Net interest income (loss) | 51,065 | 314 | (503 | ) | - | 50,876 | ||||||||||
| Provision for loan losses | 2,000 | - | - | - | 2,000 | |||||||||||
| Noninterest income | 4,185 | 5,152 | - | - | 9,337 | |||||||||||
| Noninterest expense | 30,568 | 3,738 | 246 | - | 34,552 | |||||||||||
| Net income (loss) before taxes | 22,682 | 1,728 | (749 | ) | - | 23,661 | ||||||||||
| Income tax expense (benefit) | 10,239 | 639 | (262 | ) | - | 10,616 | ||||||||||
| Net income (loss) | $ | 12,443 | 1,089 | (487 | ) | - | 13,045 | |||||||||
| Total assets | $ | 1,615,960 | 8,230 | 163,095 | (162,660 | ) | 1,624,625 | |||||||||
| Year ended December 31, 2016 | ||||||||||||||||
| Commercial | ||||||||||||||||
| and Retail | Mortgage | |||||||||||||||
| Banking | Banking | Corporate | Eliminations | Consolidated | ||||||||||||
| Interest income | $ | 50,851 | 340 | 2 | (2 | ) | 51,191 | |||||||||
| Interest expense | 7,792 | - | 402 | (2 | ) | 8,192 | ||||||||||
| Net interest income (loss) | 43,059 | 340 | (400 | ) | - | 42,999 | ||||||||||
| Provision for loan losses | 2,300 | - | - | - | 2,300 | |||||||||||
| Noninterest income | 4,009 | 6,837 | - | - | 10,846 | |||||||||||
| Noninterest expense | 26,482 | 4,451 | 243 | - | 31,176 | |||||||||||
| Net income (loss) before taxes | 18,286 | 2,726 | (643 | ) | - | 20,369 | ||||||||||
| Income tax expense (benefit) | 6,496 | 1,009 | (172 | ) | - | 7,333 | ||||||||||
| Net income (loss) | $ | 11,790 | 1,717 | (471 | ) | - | 13,036 | |||||||||
| Total assets | $ | 1,331,224 | 6,477 | 123,279 | (120,072 | ) | 1,340,908 | |||||||||
Commercial and retail banking. The Company’s primary business is to provide traditional deposit and lending products and services to its commercial and retail banking clients.
100
Mortgage banking. The mortgage banking segment provides mortgage loan origination services for loans that will be sold in the secondary market to investors.
Corporate. Corporate is comprised primarily of compensation and benefits for certain members of management and interest on parent company debt.
NOTE 24 – Parent Company Financial Information
Following is condensed financial information of Southern First Bancshares, Inc. (parent company only):
Condensed Balance Sheets
| December 31, | |||||
| (dollars in thousands) | 2017 | 2016 | |||
| Assets | |||||
| Cash and cash equivalents | $ | 3,623 | 1,949 | ||
| Investment in subsidiaries | 159,440 | 118,526 | |||
| Other assets | 32 | 2,804 | |||
| Total assets | $ | 163,095 | 123,279 | ||
| Liabilities and Shareholders’ Equity | |||||
| Accounts payable and accrued expenses | $ | 6 | 4 | ||
| Junior subordinated debentures | 13,403 | 13,403 | |||
| Shareholders’ equity | 149,686 | 109,872 | |||
| Total liabilities and shareholders’ equity | $ | 163,095 | 123,279 | ||
Condensed Statements of Income
| For the years ended December 31, | ||||||||||
| (dollars in thousands) | 2017 | 2016 | 2015 | |||||||
| Revenues | ||||||||||
| Interest income | $ | 11 | 2 | 4 | ||||||
| Total revenue | 11 | 2 | 4 | |||||||
| Expenses | ||||||||||
| Interest expense | 514 | 402 | 349 | |||||||
| Other expenses | 246 | 243 | 829 | |||||||
| Total expenses | 760 | 645 | 1,178 | |||||||
| Income tax benefit | 262 | 172 | 212 | |||||||
| Loss before equity in undistributed net income of subsidiaries | (487 | ) | (471 | ) | (962 | ) | ||||
| Equity in undistributed net income of subsidiaries | 13,532 | 13,507 | 11,129 | |||||||
| Net income | $ | 13,045 | 13,036 | 10,167 | ||||||
101
Condensed Statements of Cash Flows
| For the years ended December 31, | ||||||||||
| (dollars in thousands) | 2017 | 2016 | 2015 | |||||||
| Operating activities | ||||||||||
| Net income | $ | 13,045 | 13,036 | 10,167 | ||||||
| Adjustments to reconcile net income to cash provided by (used for) operating activities | ||||||||||
| Equity in undistributed net income of subsidiaries | (13,532 | ) | (13,507 | ) | (11,129 | ) | ||||
| Compensation expense related to stock options and restricted stock grants | 1,258 | 1,998 | 759 | |||||||
| (Increase) decrease in other assets | 2,772 | (449 | ) | (192 | ) | |||||
| Increase (decrease) in accounts payable and accrued expenses | 2 | (1 | ) | - | ||||||
| Net cash provided by (used for) operating activities | 3,545 | 1,077 | (395 | ) | ||||||
| Investing activities | ||||||||||
| Investment in subsidiaries, net | (27,334 | ) | (668 | ) | (2,250 | ) | ||||
| Net cash used for investing activities | (27,334 | ) | (668 | ) | (2,250 | ) | ||||
| Financing activities | ||||||||||
| Issuance of common stock | 24,758 | - | - | |||||||
| Proceeds from the exercise of stock options and warrants | 705 | 1,098 | 628 | |||||||
| Net cash provided by financing activities | 25,463 | 1,098 | 628 | |||||||
| Net increase (decrease) in cash and cash equivalents | 1,674 | 1,507 | (2,017 | ) | ||||||
| Cash and cash equivalents, beginning of year | 1,949 | 442 | 2,459 | |||||||
| Cash and cash equivalents, end of year | $ | 3,623 | 1,949 | 442 | ||||||
NOTE 25 – Selected Condensed Quarterly Financial Data (Unaudited)
| 2017 | |||||||||
| For the quarters ended | |||||||||
| (dollars in thousands, except share data) | March 31 | June 30 | September 30 | December 31 | |||||
| Interest income | $ | 13,959 | 14,931 | 15,955 | 16,364 | ||||
| Interest expense | 2,352 | 2,579 | 2,646 | 2,756 | |||||
| Net interest income | 11,607 | 12,352 | 13,309 | 13,608 | |||||
| Provision for loan losses | 500 | 500 | 500 | 500 | |||||
| Noninterest income | 2,051 | 2,563 | 2,542 | 2,181 | |||||
| Noninterest expenses | 8,360 | 8,763 | 8,806 | 8,623 | |||||
| Income before income tax expense | 4,798 | 5,652 | 6,545 | 6,666 | |||||
| Income tax expense | 1,687 | 2,048 | 2,295 | 4,586 | |||||
| Net income available to common shareholders | $ | 3,111 | 3,604 | 4,250 | 2,080 | ||||
| Earnings per common share | |||||||||
| Basic | $ | 0.48 | 0.52 | 0.58 | 0.28 | ||||
| Diluted | $ | 0.45 | 0.49 | 0.55 | 0.27 | ||||
| Weighted average common shares outstanding | |||||||||
| Basic | 6,437,231 | 6,986,948 | 7,281,594 | 7,304,478 | |||||
| Diluted | 6,829,590 | 7,366,208 | 7,668,476 | 7,696,684 | |||||
102
| 2016 | |||||||||
| For the quarters ended | |||||||||
| (dollars in thousands, except share data) | March 31 | June 30 | September 30 | December 31 | |||||
| Interest income | $ | 12,329 | 12,503 | 12,912 | 13,447 | ||||
| Interest expense | 2,022 | 1,990 | 2,032 | 2,148 | |||||
| Net interest income | 10,307 | 10,513 | 10,880 | 11,299 | |||||
| Provision for loan losses | 625 | 575 | 825 | 275 | |||||
| Noninterest income | 2,559 | 3,146 | 3,017 | 2,124 | |||||
| Noninterest expenses | 7,517 | 7,853 | 7,800 | 8,006 | |||||
| Income before income tax expense | 4,724 | 5,231 | 5,272 | 5,142 | |||||
| Income tax expense | 1,718 | 1,925 | 1,839 | 1,851 | |||||
| Net income available to common shareholders | $ | 3,006 | 3,306 | 3,433 | 3,291 | ||||
| Earnings per common share | |||||||||
| Basic | $ | 0.48 | 0.53 | 0.54 | 0.52 | ||||
| Diluted | $ | 0.45 | 0.49 | 0.51 | 0.49 | ||||
| Weighted average common shares outstanding | |||||||||
| Basic | 6,272,847 | 6,301,853 | 6,322,073 | 6,375,842 | |||||
| Diluted | 6,634,432 | 6,702,820 | 6,740,751 | 6,775,729 | |||||
Item 9. Changes in and Disagreements with Accountants on Accounting and Financial Disclosure
None.
Item 9A. Controls and Procedures
Evaluation of Disclosure Controls and Procedures
Based on our management’s evaluation (with the participation of our principal executive officer and principal financial officer), as of the end of the period covered by this report, our principal executive officer and principal financial officer have concluded that our disclosure controls and procedures (as defined in Rules 13a-15(e) and 15d-15(e) under the Securities Exchange Act of 1934, as amended, (the “Exchange Act”)) are effective to ensure that information required to be disclosed by us in reports that we file or submit under the Exchange Act is recorded, processed, summarized and reported within the time periods specified in Securities and Exchange Commission rules and forms and is accumulated and communicated to our management, including our principal executive officer and principal financial officer, as appropriate to allow timely decisions regarding required disclosure.
For management’s report on internal control over financial reporting and the attestation report thereon issued by our independent registered public accounting firm, see Item 8. Financial Statements and Supplementary Data.
Internal Control over Financial Reporting
There was no change in our internal control over financial reporting during our fourth quarter of fiscal 2017 that has materially affected, or is reasonably likely to materially affect, our internal control over financial reporting.
None
Item 10. Directors, Executive Officers and Corporate Governance.
In response to this Item, this information is contained in our Proxy Statement for the Annual Meeting of Shareholders to be held on May 15, 2018 and is incorporated herein by reference.
Item 11. Executive Compensation.
In response to this Item, this information is contained in our Proxy Statement for the Annual Meeting of Shareholders to be held on May 15, 2018 and is incorporated herein by reference.
103
Item 12. Security Ownership of Certain Beneficial Owners and Management and Related Shareholder Matters.
In response to this Item, the information required by Item 201(d) is contained in Item 5 of this report. The other information required by this item is contained in our Proxy Statement for the Annual Meeting of Shareholders to be held on May 15, 2018 and is incorporated herein by reference.
Item 13. Certain Relationships and Related Transactions, and Director Independence.
The information is contained in our Proxy Statement for the Annual Meeting of Shareholders to be held on May 15, 2018 is incorporated herein by reference.
Item 14. Principal Accounting Fees and Services.
In response to this Item, this information is contained in our Proxy Statement for the Annual Meeting of Shareholders to be held on May 15, 2018 and is incorporated herein by reference.
Item 15. Exhibits, Financial Statement Schedules
|
(a) |
(1) |
Financial Statements | ||
|
|
|
The following consolidated financial statements are located in Item 8 of this report. | ||
| (2) |
Financial Statement Schedules | |||
|
These schedules have been omitted because they are not required, are not applicable or have been included in our consolidated financial statements. | ||||
| (3) |
Exhibits | |||
|
See the “Exhibit Index” immediately following the signature page of this report. |
104
Pursuant to the requirements of Section 13 or 15(d) of the Securities Exchange Act of 1934, the registrant has duly caused this report to be signed on its behalf by the undersigned, thereunto duly authorized.
| SOUTHERN FIRST BANCSHARES, INC. | ||||
| Date: February 28, 2018 | By: | /s/R. Arthur Seaver, Jr. | ||
| Chief Executive Officer | ||||
KNOW ALL MEN BY THESE PRESENTS, that each person whose signature appears below constitutes and appoints R. Arthur Seaver, Jr., his true and lawful attorney-in-fact and agent, with full power of substitution and resubstitution, for him and in his name, place and stead, in any and all capacities, to sign any and all amendments to this Annual Report on Form 10-K, and to file the same, with all exhibits thereto, and other documents in connection therewith, with the Securities and Exchange Commission, granting unto the attorney-in-fact and agent full power and authority to do and perform each and every act and thing requisite or necessary to be done in and about the premises, as fully to all intents and purposes as he might or could do in person, hereby ratifying and confirming all that the attorney-in-fact and agent, or his substitute or substitutes, may lawfully do or cause to be done by virtue hereof.
Pursuant to the requirements of the securities Exchange Act of 1934, this report has been signed below by the following persons on behalf of the registrant in the capacities and on the dates indicated.
| Signature | Title | Date | ||
| /s/R. Arthur Seaver, Jr. | Director, Chief Executive Officer | February 28, 2018 | ||
| R. Arthur Seaver, Jr. | (Principal Executive Officer) | |||
| /s/Michael D. Dowling | Chief Financial Officer | February 28, 2018 | ||
| Michael D. Dowling | (Principal Financial and Accounting Officer) | |||
| /s/Andrew B. Cajka, Jr. | Director | February 28, 2018 | ||
| Andrew B. Cajka, Jr. | ||||
| /s/Mark A. Cothran | Director | February 28, 2018 | ||
| Mark A. Cothran | ||||
| /s/Leighton M. Cubbage | Director | February 28, 2018 | ||
| Leighton M. Cubbage | ||||
| /s/David G. Ellison | Director | February 28, 2018 | ||
| David G. Ellison | ||||
| /s/Anne S. Ellefson | Director | February 28, 2018 | ||
| Anne S. Ellefson | ||||
| /s/Fred Gilmer, Jr. | Director | February 28, 2018 | ||
| Fred Gilmer, Jr. | ||||
| /s/Tecumseh Hooper, Jr. | Director | February 28, 2018 | ||
| Tecumseh Hooper, Jr. | ||||
| /s/Rudolph G. Johnstone, III M.D. | Director | February 28, 2018 | ||
| Rudolph G. Johnstone, III, M.D. | ||||
| /s/James B. Orders, III | Director, Chairman | February 28, 2018 | ||
| James B. Orders, III | ||||
105
EXHIBIT INDEX
| 3.1 |
|
Amended and Restated Articles of Incorporation (incorporated by reference to Exhibit 3.1 of the Company’s Registration Statement on Form SB-2 filed on July 27, 1999, File No. 333-83851). |
|
| ||
| 3.2 |
Amended and Restated Bylaws dated March 18, 2008 (incorporated by reference to Exhibit 3.4 of the Company’s Form 10-K filed March 24, 2008). | |
|
| ||
| 4.1 |
See Exhibits 3.1 and 3.2 for provisions of the Amended and Restated Articles of Incorporation and Amended and Restated Bylaws, which define the rights of the shareholders. | |
|
| ||
| 4.2 |
Form of certificate of common stock (incorporated by reference to Exhibit 4.2 of the Company’s Registration Statement on Form SB-2, File No. 333-83851). | |
|
| ||
| 10.1 |
2000 Greenville First Bancshares, Inc. Stock Incentive Plan and Form of Option Agreement (incorporated by reference to Exhibit 10.7 to the Company’s Form 10-QSB for the period ended March 31, 2000).* | |
|
| ||
| 10.2 |
First Amendment to the Southern First Bancshares 2000 Stock Incentive Plan, adopted October 21, 2008 (incorporated by reference to Exhibit 10.1 of the Company’s Form 10-Q filed for the period ended September 30, 2008).* | |
|
| ||
| 10.3 |
Southern First Bancshares, Inc. 2010 Stock Incentive Plan (incorporated by reference to Appendix A of the Company’s Proxy Statement on Schedule 14A filed April 6, 2010).* | |
|
| ||
| 10.4 |
Amendment to Southern First Bancshares, Inc. 2010 Stock Incentive Plan (incorporated by reference to Appendix A of the Company’s Proxy Statement on Schedule 14A filed on April 15, 2014).* | |
|
| ||
| 10.5 |
Amendment to Southern First Bancshares, Inc. 2010 Stock Incentive Plan (incorporated by reference to Appendix A of the Company’s Proxy Statement on Schedule 14A filed on April 14, 2015).* | |
|
| ||
| 10.6 |
Form of Award Agreement for Stock Options (incorporated by reference to Exhibit 4.6 of the Company’s Form S-8 filed on August 12, 2010).* | |
|
| ||
| 10.7 |
Form of Award Agreement for Restricted Stock (incorporated by reference to Exhibit 4.7 of the Company’s Form S-8 filed on August 12, 2010).* | |
|
| ||
| 10.8 |
Sublease Agreement between Greenville First Bank, N.A. and Augusta Road Holdings, LLC dated February 26, 2004 (incorporated by reference to Exhibit 10.6 of the Company’s Form 10-QSB for the period ended June 30, 2004). | |
|
| ||
| 10.9 |
Bonaventure I Office Lease Agreement with Greenville First Bank, N.A., dated September 20, 2005 (incorporated by reference to Exhibit 10.1 of the Company’s Form 10-Q for the period ended September 30, 2005). | |
|
| ||
| 10.10 |
First Amendment to Office Lease Agreement with Greenville First Bank, N.A., dated September 20, 2005 (incorporated by reference to Exhibit 10.2 of the Company’s Form 10-Q for the period ended September 30, 2005). | |
|
| ||
| 10.11 |
R. Arthur Seaver, Jr. Amended and Restated Employment Agreement (incorporated by reference to Exhibit 10.5 of the Company’s Form 8-K filed October 3, 2013).* | |
|
| ||
| 10.12 |
F. Justin Strickland Amended and Restated Employment Agreement (incorporated by reference to Exhibit 10.6 of the Company’s Form 8-K filed October 3, 2013).* | |
|
| ||
| 10.13 |
Michael D. Dowling Amended and Restated Employment Agreement (incorporated by reference to Exhibit 10.8 of the Company’s Form 8-K filed October 3, 2013).* | |
|
| ||
| 10.14 |
Form of Split Dollar Agreement between certain executives and Southern First Bancshares, Inc. (incorporated by reference to Exhibit 10.1 of the Company’s Form 8-K filed February 18, 2009).* | |
| 10.15 |
Form of Southern First Bank, N.A. Salary Continuation Agreement dated December 17, 2008 (incorporated by reference to Exhibit 10.1 of the Company’s Form 8-K filed December 23, 2008).* |
| 10.16 |
|
Form of First Amendment to Southern First Bank, N.A. Salary Continuation Agreement dated December 17, 2008 (incorporated by reference to Exhibit 10.2 of the Company’s Form 8-K filed December 23, 2008).* |
|
| ||
| 10.17 |
Michael D. Dowling Salary Continuation Agreement (incorporated by reference to Exhibit 10.1 of the Company’s Form 8-K filed October 3, 2013).* | |
|
| ||
| 10.18 |
F. Justin Strickland First Amendment to Salary Continuation Agreement (incorporated by reference to Exhibit 10.2 of the Company’s Form 8-K filed October 3, 2013).* | |
|
| ||
| 10.19 |
R. Arthur Seaver, Jr. Second Amendment to Salary Continuation Agreement (incorporated by reference to Exhibit 10.4 of the Company’s Form 8-K filed October 3, 2013).* | |
|
| ||
| 10.20 |
Loan Agreement dated as of June 6, 2014 between Southern First Bancshares, Inc. and The Brand Banking Company (incorporated by reference to Exhibit 10.1 of the Company’s Form 8-K filed June 9, 2014). | |
|
| ||
| 10.21 |
Revolving Promissory Note dated as of June 6, 2014 between Southern First Bancshares, Inc. and The Brand Banking Company (incorporated by reference to Exhibit 10.2 of the Company’s Form 8-K filed June 9, 2014). | |
|
| ||
| 10.22 |
Stock Pledge Agreement dated as of June 6, 2014 between Southern First Bancshares, Inc. and The Brand Banking Company (incorporated by reference to Exhibit 10.3 of the Company’s Form 8-K filed June 9, 2014). | |
|
| ||
| 10.23 |
Southern First Bancshares, Inc. 2016 Equity Incentive Plan (incorporated by reference to Appendix A of the Company’s Proxy Statement on Schedule 14A filed on April 12, 2016).* | |
|
| ||
| 10.24 |
Form of Award Agreement for Stock Options (incorporated by reference to Exhibit 4.6 of the Company’s Form S-8 filed on August 18, 2016).* | |
|
| ||
| 10.25 |
Form of Award Agreement for Restricted Stock (incorporated by reference to Exhibit 4.7 of the Company’s Form S-8 filed on August 18, 2016).* | |
|
| ||
| 10.26 |
Loan and Security Agreement, dated as of June 30, 2017, by and between Southern First Bancshares, Inc. and CenterState Bank, National Association (incorporated by reference to Exhibit 10.1 of the Company’s Form 8-K filed on July 3, 2017). | |
|
| ||
| 10.27 |
Promissory Note, dated as of June 30, 2017, by and between Southern First Bancshares, Inc. and CenterState Bank, National Association (incorporated by reference to Exhibit 10.2 of the Company’s Form 8- K filed on July 3, 2017). | |
|
| ||
| 10.28 |
Pledge Agreement, dated as of June 30, 2017, by and between Southern First Bancshares, Inc. and CenterState Bank, National Association (incorporated by reference to Exhibit 10.3 of the Company’s Form 8- K filed on July 3, 2017). | |
|
| ||
| 21 | Subsidiaries. | |
|
| ||
| 23 | Consent of Independent Public Accountants. | |
|
| ||
| 24 |
Power of Attorney (contained herein as part of the signature pages). | |
|
| ||
| 31.1 | Rule 13a-14(a) Certification of the Principal Executive Officer. | |
|
| ||
| 31.2 | Rule 13a-14(a) Certification of the Principal Financial Officer. | |
|
| ||
| 32 | Section 1350 Certifications of the Principal Executive Officer and Principal Financial Officer. | |
|
| ||
| 101 |
|
The following materials from the Company’s Annual Report on Form 10-K for the year ended December 31, 2017, formatted in eXtensible Business Reporting Language (XBRL); (i) the Consolidated Balance Sheets at December 31, 2017 and December 31, 2016, (ii) Consolidated Statements of Income for the years ended December 31, 2017, 2016, and 2015, (iii) Consolidated Statements of Changes in Shareholders’ Equity and Comprehensive Income for the years ended December 31, 2017, 2016, and 2015, (iv) Consolidated Statements of Cash Flows for the years ended December 31, 2017, 2016, and 2015, and (iv) Notes to Consolidated Financial Statements. |
| * | Management contract or compensatory plan or arrangement |