Attached files
| file | filename |
|---|---|
| EX-32.1 - EXHIBIT 32.1 - QUANTA SERVICES, INC. | pwr-ex321x1231x2017.htm |
| EX-31.2 - EXHIBIT 31.2 - QUANTA SERVICES, INC. | pwr-ex312x1231x2017.htm |
| EX-31.1 - EXHIBIT 31.1 - QUANTA SERVICES, INC. | pwr-ex311x1231x2017.htm |
| EX-23.1 - EXHIBIT 23.1 - QUANTA SERVICES, INC. | pwr-ex231x12x31x2017.htm |
| EX-21.1 - EXHIBIT 21.1 - QUANTA SERVICES, INC. | pwr-ex211x12x31x2017.htm |
UNITED STATES SECURITIES AND EXCHANGE COMMISSION
Washington, D.C. 20549
_____________________________________________
Form 10-K
(Mark One) | ||
þ | ANNUAL REPORT PURSUANT TO SECTION 13 OR 15(d) OF THE SECURITIES EXCHANGE ACT OF 1934 | |
For the fiscal year ended December 31, 2017 | ||
¨ | TRANSITION REPORT PURSUANT TO SECTION 13 OR 15(d) OF THE SECURITIES EXCHANGE ACT OF 1934 | |
Commission file number 001-13831
Quanta Services, Inc.
(Exact name of registrant as specified in its charter)
Delaware | 74-2851603 | |
(State or other jurisdiction of incorporation or organization) | (I.R.S. Employer Identification No.) | |
2800 Post Oak Boulevard, Suite 2600
Houston, Texas 77056
(Address of principal executive offices, including zip code)
(713) 629-7600
(Registrant’s telephone number, including area code)
Securities registered pursuant to Section 12(b) of the Act:
Title of Each Class | Name of Exchange on Which Registered | |
Common Stock, $0.00001 par value | New York Stock Exchange | |
Securities registered pursuant to Section 12(g) of the Act:
Title of Each Class
None
Indicate by check mark if the Registrant is a well-known seasoned issuer, as defined in Rule 405 of the Securities Act. Yes þ No o
Indicate by check mark if the Registrant is not required to file reports pursuant to Section 13 or Section 15(d) of the Exchange Act. Yes o No þ
Indicate by check mark whether the Registrant (1) has filed all reports required to be filed by Section 13 or 15(d) of the Securities Exchange Act of 1934 during the preceding 12 months (or for such shorter period that the Registrant was required to file such reports), and (2) has been subject to such filing requirements for the past 90 days. Yes þ No o
Indicate by check mark whether the Registrant has submitted electronically and posted on its corporate web site, if any, every Interactive Data File required to be submitted and posted pursuant to Rule 405 of Regulation S-T (§ 232.405 of this chapter) during the preceding 12 months (or for such shorter period that the Registrant was required to submit and post such files). Yes þ No o
Indicate by check mark if disclosure of delinquent filers pursuant to Item 405 of Regulation S-K (§229.405 of this chapter) is not contained herein, and will not be contained, to the best of Registrant’s knowledge, in definitive proxy or information statements incorporated by reference in Part III of this Form 10-K or any amendment to this Form 10-K. þ
Indicate by check mark whether the Registrant is a large accelerated filer, an accelerated filer, a non-accelerated filer, a smaller reporting company, or an emerging growth company. See the definitions of “large accelerated filer,” “accelerated filer,” “smaller reporting company,” and “emerging growth company” in Rule 12b-2 of the Exchange Act. (Check one):
Large accelerated filer þ | Accelerated filer o | |||
Non-accelerated filer o | (Do not check if smaller reporting company) | Smaller reporting company o | ||
Emerging growth company o | ||||
If an emerging growth company, indicate by check mark if the registrant has elected not to use the extended transition period for complying with any new or revised financial accounting standards provided pursuant to Section 13(a) of the Exchange Act. o
Indicate by check mark whether the Registrant is a shell company (as defined in Rule 12b-2 of the Exchange Act). Yes o No þ
As of June 30, 2017 (the last business day of the Registrant’s most recently completed second fiscal quarter), the aggregate market value of the Common Stock of the Registrant held by non-affiliates of the Registrant, based on the last sale price of the Common Stock reported by the New York Stock Exchange on such date, was $4.9 billion.
As of February 21, 2018, the number of outstanding shares of Common Stock of the Registrant was 153,744,728. As of the same date, 449,929 exchangeable shares of a Canadian subsidiary of the Registrant associated with one share of Series G Preferred Stock of the Registrant were outstanding and an additional 36,183 exchangeable shares of certain other Canadian subsidiaries of the Registrant were outstanding.
DOCUMENTS INCORPORATED BY REFERENCE
Portions of the Registrant’s Definitive Proxy Statement for the 2018 Annual Meeting of Stockholders are incorporated by reference into Part III of this Form 10-K.
QUANTA SERVICES, INC.
ANNUAL REPORT ON FORM 10-K
For the Year Ended December 31, 2017
INDEX
Page | ||
Number | ||
PART I | ||
ITEM 1. | ||
ITEM 1A. | ||
ITEM 1B. | ||
ITEM 2. | ||
ITEM 3. | ||
ITEM 4. | ||
PART II | ||
ITEM 5. | ||
ITEM 6. | ||
ITEM 7. | ||
ITEM 7A. | ||
ITEM 8. | ||
ITEM 9. | ||
ITEM 9A. | ||
ITEM 9B. | ||
PART III | ||
ITEM 10. | ||
ITEM 11. | ||
ITEM 12. | ||
ITEM 13. | ||
ITEM 14. | ||
PART IV | ||
ITEM 15. | ||
ITEM 16. | ||
1
PART I
ITEM 1. | Business |
General
Quanta Services, Inc. (Quanta) is a leading provider of specialty contracting services, offering infrastructure solutions primarily to the electric power, oil and gas and communication industries in the United States, Canada, Australia, Latin America and select other international markets. The services we provide include the design, installation, upgrade, repair and maintenance of infrastructure within each of the industries we serve, such as electric power transmission and distribution networks, substation facilities, renewable energy facilities, pipeline transmission and distribution systems and facilities.
We report our results under two reportable segments: (1) Electric Power Infrastructure Services and (2) Oil and Gas Infrastructure Services. This structure is generally focused on broad end-user markets for our services. Our consolidated revenues for the year ended December 31, 2017 were $9.47 billion, of which 59% was attributable to the Electric Power Infrastructure Services segment and 41% was attributable to the Oil and Gas Infrastructure Services segment.
We have established a presence throughout the United States, Canada, Australia and Latin America with a workforce of approximately 32,800 employees as of December 31, 2017, which enables us to quickly and reliably serve a diversified customer base. We believe our reputation for responsiveness and performance, geographic reach, comprehensive service offering, safety leadership and financial strength have resulted in strong relationships with numerous customers, which include many of the leading companies in the industries we serve. Our ability to deploy services to customers throughout the United States, Canada, Australia and Latin America as a result of our broad geographic presence and significant scope and scale of services is particularly important to our customers who operate networks that span multiple states or regions. We believe these same factors also position us to continue to take advantage of other international opportunities. Representative customers include:
l | Ameren Corporation | l | ITC Holdings Corp. |
l | American Electric Power Company, Inc. | l | Nalcor Energy |
l | ATCO Electric | l | NextEra Energy, Inc. |
l | CenterPoint Energy, Inc. | l | NiSource Inc. |
l | Duke Energy Corporation | l | PG&E Corporation |
l | Enbridge Inc. | l | Puget Sound Energy, Inc. |
l | Entergy Corporation | l | San Diego Gas & Electric Company |
l | Enterprise Products Partners L.P. | l | Southern California Edison Company |
l | Exelon Corporation | l | TransCanada Corporation |
l | Eversource Energy | l | Valero Energy Corporation |
l | FirstEnergy Corp. | l | The Williams Companies, Inc. |
We were organized as a corporation in the state of Delaware in 1997, and since that time, we have grown organically and through strategic acquisitions. This growth has allowed us to expand our geographic presence and scope of services and develop new capabilities to meet our customers’ evolving needs.
We believe that our business strategies, along with our competitive and financial strengths, are key elements in differentiating us from our competition and position us to capitalize on future capital spending by our customers. We offer comprehensive and diverse solutions on a broad geographic scale and have a solid base of long-standing customer relationships in each of the industries we serve. We also have an experienced management team, both at the executive level and within our operating units, and various proprietary technologies that enhance our service offerings. Our strategies of expanding our portfolio of service offerings for existing and potential customers, increasing our geographic and technological capabilities, promoting best practices and cross-selling services to our existing customers, as well as continuing to maintain our financial strength, place us in the position to capitalize on opportunities and trends in the industries we serve and expand our operations to select international markets. We also continue to evaluate potential acquisitions of companies with strong management teams and good reputations and believe our financial strength and experienced management are attractive to potential acquisition targets.
2
Reportable Segments
The following is an overview of the types of services provided by each of our reportable segments.
Electric Power Infrastructure Services Segment
The Electric Power Infrastructure Services segment provides comprehensive network solutions to customers in the electric power industry. Services performed by the Electric Power Infrastructure Services segment generally include the design, installation, upgrade, repair and maintenance of electric power transmission and distribution infrastructure and substation facilities along with other engineering and technical services. This segment also provides emergency restoration services, including the repair of infrastructure damaged by inclement weather, the energized installation, maintenance and upgrade of electric power infrastructure utilizing unique bare hand and hot stick methods and our proprietary robotic arm technologies, and the installation of “smart grid” technologies on electric power networks. In addition, this segment designs, installs and maintains renewable energy generation facilities, consisting of solar, wind and certain types of natural gas generation facilities, and related switchyards and transmission infrastructure. To a lesser extent, the segment also provides comprehensive communications infrastructure services to wireline, fiber and wireless carrier customers within the communications industry; services in connection with the construction of electric power generation facilities; the design, installation, maintenance and repair of commercial and industrial wiring; and the installation of traffic networks and cable and control systems for light rail lines.
Oil and Gas Infrastructure Services Segment
The Oil and Gas Infrastructure Services segment provides comprehensive network solutions to customers involved in the development, transportation, storage and processing of natural gas, oil and other pipeline products. Services performed by the Oil and Gas Infrastructure Services segment generally include the design, installation, repair and maintenance of pipeline transmission and distribution systems, gathering systems, production systems, storage systems and compressor and pump stations, as well as related trenching, directional boring and mechanized welding services. In addition, this segment’s services include pipeline protection, integrity testing, rehabilitation and replacement, and fabrication of pipeline support systems and related structures and facilities. We also serve the offshore and inland water energy markets, primarily providing services to oil and gas exploration platforms, including mechanical installation (or “hook-ups”), electrical and instrumentation, pre-commissioning and commissioning, coatings, shallow water pipeline installation, fabrication and marine asset repair. To a lesser extent, this segment designs, installs and maintains fueling systems, as well as water and sewer infrastructure. Through a recent acquisition, we expanded our service offerings in this segment to include high-pressure and critical-path turnaround services to the downstream and midstream energy markets and enhanced our capabilities with respect to instrumentation and electrical services, piping, fabrication and storage tank services.
Financial Information Regarding Reportable Segments
For financial information about our reportable segments, refer to Note 16 of the Notes to Consolidated Financial Statements in Item 8. Financial Statements and Supplementary Data, which note is incorporated herein by reference.
Financial Information about Geographic Areas
We operate primarily in the United States; however, we derived $2.48 billion, $1.59 billion and $1.54 billion of our revenues from foreign operations during the years ended December 31, 2017, 2016 and 2015, respectively. Of our foreign revenues, 79%, 75% and 85% were earned in Canada during the years ended December 31, 2017, 2016 and 2015, respectively. In addition, we held property and equipment of $330.4 million and $320.7 million in foreign countries, primarily Canada, as of December 31, 2017 and 2016.
Our business, financial condition and results of operations in foreign countries may be adversely impacted by monetary and fiscal policies, currency fluctuations, regulatory requirements and other political, social and economic developments or instability. Refer to Item 1A. Risk Factors, Item 7. Management’s Discussion and Analysis of Financial Condition and Results of Operations and Item 7A. Quantitative and Qualitative Disclosures about Market Risk for additional information and discussion regarding the potential impact of currency rate fluctuations.
Customers, Strategic Alliances and Preferred Provider Relationships
Our customers include electric power, oil and gas and communications companies, as well as commercial, industrial and governmental entities. We have a large and diverse customer base, including many of the leading companies in the industries we serve. Our 10 largest customers accounted for 36% of our consolidated revenues during the year ended December 31, 2017. Our largest customer accounted for 9% of our consolidated revenues for the year ended December 31, 2017.
3
Although we have a centralized marketing and business development strategy, management at each of our operating units is responsible for developing and maintaining successful long-term relationships with customers. Our operating unit management teams build upon existing customer relationships to secure additional projects and increase revenues. Many of these customer relationships are long-standing and are maintained through a partnering approach with centralized account management, which includes project evaluation and consulting, quality performance, performance measurement and direct customer contact. Additionally, operating unit management focuses on pursuing growth opportunities with prospective customers. We also encourage operating unit management to cross-sell services of our other operating units to their customers and coordinate with our other operating units to pursue projects, especially those that are larger and more complex. Our corporate-level business development group supports these activities by promoting and marketing our services for existing and prospective large national accounts, as well as projects that would require services from multiple operating units.
We are a preferred service provider for many of our customers, which means we have met minimum standards for a specific category of service, maintained a high level of performance and agreed to certain payment terms and negotiated rates. We strive to maintain preferred status as we believe it provides us an advantage in the award of future work for the applicable customer. Furthermore, many of our strategic relationships with customers take the form of strategic alliance or long-term maintenance agreements, which typically extend for an initial term of approximately two to five years and may include renewal options to extend the initial term. Strategic alliance agreements also generally state an intention to work together over a period of time and/or on specific types of projects, and many provide us with preferential bidding procedures.
Backlog
Backlog is not a term recognized under United States generally accepted accounting principles (US GAAP); however, it is a common measurement used in our industry. Our methodology for determining backlog may not be comparable to the methodologies used by other companies.
Our backlog represents the amount of consolidated revenues that we expect to realize from future work under construction contracts, long-term maintenance contracts and master service agreements (MSAs). These estimates include revenues from the remaining portion of firm orders not yet completed and on which work has not yet begun, as well as revenues from change orders, renewal options, and funded and unfunded portions of government contracts to the extent that they are reasonably expected to occur. For purposes of calculating backlog, we include 100% of estimated revenues attributable to consolidated joint ventures and variable interest entities (VIEs). The following table presents our total backlog by reportable segment as of December 31, 2017 and 2016, along with an estimate of the backlog amounts expected to be realized within 12 months of each balance sheet date (in thousands):
Backlog as of | Backlog as of | ||||||||||||||
December 31, 2017 | December 31, 2016 | ||||||||||||||
12 Month | Total | 12 Month | Total | ||||||||||||
Electric Power Infrastructure Services | $ | 4,032,379 | $ | 7,359,237 | $ | 3,369,373 | $ | 6,657,431 | |||||||
Oil and Gas Infrastructure Services | 2,413,817 | 3,818,470 | 2,483,963 | 3,092,341 | |||||||||||
Total | $ | 6,446,196 | $ | 11,177,707 | $ | 5,853,336 | $ | 9,749,772 | |||||||
Revenue estimates included in our backlog can be subject to change as a result of project accelerations, cancellations or delays due to various factors, including but not limited to commercial issues, regulatory requirements and adverse weather. These factors can also cause revenue amounts to be realized in periods and at levels different than originally projected. For example, during the year ended December 31, 2017, we reduced our 12-month backlog for the Oil and Gas Infrastructure Services segment by approximately $100 million as a result of a cancellation of a natural gas pipeline project, for which we received a termination fee. Generally, our customers are not contractually committed to specific volumes of services under our MSAs, and most of our contracts may be terminated, typically upon 30 to 90 days notice, even if we are not in default under the contract. We determine the estimated amount of backlog for work under MSAs by using recurring historical trends inherent in current MSAs, factoring in seasonal demand and projected customer needs based upon ongoing communications with the customer. In addition, many of our MSAs are subject to renewal options. As of December 31, 2017 and 2016, MSAs accounted for 44% and 42% of our estimated 12-month backlog and 52% and 53% of total backlog. There can be no assurance as to our customers’ actual requirements or that our estimates are accurate. As discussed in Note 3 of the Notes to Consolidated Financial Statements in Item 8. Financial Statements and Supplementary Data, effective for the quarter ending March 31, 2018, we will adopt new revenue recognition guidance issued by the Financial Accounting Standards Board (FASB). Pursuant to the new guidance, we will also disclose the amount of remaining performance obligations at each period end as a separate component of backlog. We expect to continue to report total backlog on a basis consistent with our current definition.
4
Competition
The markets in which we operate are highly competitive. We compete with other contractors in most of the geographic markets in which we operate, and several of our competitors are large companies that have significant financial, technical and marketing resources. In addition, there are relatively few barriers to entry into some of the industries in which we operate and, as a result, any organization that has adequate financial resources and access to technical expertise may become a competitor. A significant portion of our revenues is currently derived from unit price or fixed price agreements, and price is often an important factor in the award of such agreements. Accordingly, we could be underbid by our competitors in an effort by them to procure such business. We believe that as demand for our services increases, customers often consider other factors in choosing a service provider, including technical expertise and experience, financial and operational resources, nationwide presence, industry reputation and dependability, which we expect to benefit larger contractors such as us. In addition, competition may lessen as industry resources, such as labor supplies, approach capacity. There can be no assurance, however, that our competitors will not develop the expertise, experience and resources to provide services that are superior in both price and quality to our services, or that we will be able to maintain or enhance our competitive position. We also face competition from the in-house service organizations of our existing or prospective customers, including electric power, oil and gas and engineering companies, which employ personnel who perform some of the same types of services we provide. Although these companies currently outsource a significant portion of these services, in particular services relating to larger energy transmission infrastructure projects, there can be no assurance that they will continue to do so in the future or that they will not acquire additional in-house capabilities.
Employees
As of December 31, 2017, we had approximately 32,800 employees, consisting of approximately 8,100 salaried employees, including executive officers, professional and administrative staff, project managers and engineers, job superintendents and clerical personnel, and approximately 24,700 hourly employees, the number of which fluctuates depending upon the number and size of the projects that are ongoing and planned at any particular time. Approximately 38% of our employees at December 31, 2017 were covered by collective bargaining agreements, which require the payment of specified wages to our union employees, the observance of certain workplace rules and the payment of certain amounts to multiemployer pension plans and employee benefit trusts. These collective bargaining agreements have varying terms and expiration dates, and the majority contain provisions that prohibit work stoppages or strikes, even during specified negotiation periods relating to agreement renewals, and provide for binding arbitration dispute resolution in the event of prolonged disagreement.
We provide health, welfare and benefit plans for employees who are not covered by collective bargaining agreements. We also have a 401(k) plan pursuant to which eligible employees who are not provided retirement benefits through a collective bargaining agreement may make contributions through a payroll deduction. We make matching cash contributions of 100% of each employee’s contribution up to 3% of that employee’s salary and 50% of each employee’s contribution between 3% and 6% of such employee’s salary, up to the maximum amount permitted by law.
Our industry is experiencing a shortage of journeyman linemen in certain geographic areas. In response to the shortage and to attract qualified employees, we support and utilize various training and educational programs and have developed additional company-wide and project-specific employee training and educational programs, as described in further detail below.
Training, Quality Assurance and Safety
Performance of our services requires the use of equipment and exposure to hazardous conditions. Although we are committed to a policy of operating safely and prudently, we have been and will continue to be subject to claims by employees, customers and third parties for property damage and personal injury. In response to these inherent hazards and as part of our commitment to employee safety, our operating units have established safety programs, policies and procedures requiring that employees complete prescribed training and service programs prior to starting work. Additionally, we have implemented an enterprise-wide Automated External Defibrillator (AED) program, which provides AEDs to all of our crews and training to enhance life safety response measures. Our operating units performing more sophisticated and technical jobs utilize, when applicable, training programs provided by the International Brotherhood of Electrical Workers/National Electrical Contractors Associations (IBEW/NECA) Apprenticeship Program, training programs sponsored by the four trade unions administered by the Pipe Line Contractors Association (PLCA), apprenticeship training programs sponsored by the Canadian Union of Skilled Workers (CUSW) or our equivalent programs. Under the IBEW/NECA Apprenticeship Program, all journeyman linemen are required to complete classroom education and on-the-job training, as well as extensive testing and certification. Certain of our operating units have established apprenticeship training programs approved by the U.S. Department of Labor that prescribe equivalent training requirements for employees who are not otherwise subject to the requirements of the IBEW/NECA Apprenticeship Program. Similarly, the CUSW offers apprenticeship training for construction and maintenance electricians and powerline technicians that requires classroom education and on-the-job training. In addition, the Laborers International Union of North America, the International Brotherhood of Teamsters, the United Association of Plumbers and Pipefitters and the International Union of Operating Engineers have training
5
programs specifically designed for developing and improving the skills of their members who work in the pipeline construction industry. Our operating units also share best practices for training and educational programs and safety policies.
We have also continued to invest in our internal education and training capabilities. We recently expanded our training facility to add training for beginning linemen, lead and cable splicing and directional drilling in addition to our existing energized electric power and pipeline training. This facility helps us facilitate classroom and on-the-job training programs and allows us to train employees in a controlled environment without the challenges of limited structure access and utility constraints. Additionally, we recently acquired Northwest Lineman College, which has four campuses across the United States and specializes in pre-apprenticeship training, apprenticeship training and specialized utility task training. We expect these capabilities to support future demand for qualified labor in the industries we serve and provide a platform for the development of additional educational and training programs.
Materials
Our customers typically supply most or all of the materials required for each job. However, for some of our contracts, we may procure all or part of the materials required. As we continue to expand our comprehensive engineering, procurement and construction offerings, the cost of materials may become a proportionately larger component of our consolidated cost of services. We do not anticipate experiencing any significant procurement difficulties, as we purchase our required materials from a variety of sources.
Regulation
Our operations are subject to various federal, state, local and international laws and regulations including:
• | licensing, permitting and inspection requirements applicable to contractors, electricians and engineers; |
• | regulations relating to worker safety and environmental protection; |
• | permitting and inspection requirements applicable to construction projects; |
• | wage and hour regulations; |
• | regulations relating to transportation of equipment and materials, including licensing and permitting requirements; |
• | building and electrical codes; and |
• | special bidding, procurement and other requirements on government projects. |
We believe that we have all the licenses required to conduct our operations and that we are in substantial compliance with applicable regulatory requirements. Our failure to comply with applicable regulations could result in substantial fines or revocation of our operating licenses, as well as give rise to termination or cancellation rights under our contracts or disqualify us from future bidding opportunities.
Environmental Matters and Climate Change Impacts
We are committed to the protection of the environment and train our employees to perform their duties accordingly. We are subject to numerous federal, state, local and international environmental laws and regulations governing our operations, including the handling, transportation and disposal of non-hazardous and hazardous substances and wastes, as well as emissions and discharges into the environment, including discharges to air, surface water, groundwater and soil. We also are subject to laws and regulations that impose liability and cleanup responsibility for releases of hazardous substances into the environment. Under certain of these laws and regulations, liability can be imposed for cleanup of previously owned or operated properties or currently owned properties at which hazardous substances or wastes were discharged or disposed of by a former owner or operator, regardless of whether we directly caused the contamination or violated any law at the time of discharge or disposal. The presence of contamination from such substances or wastes could also interfere with ongoing operations or adversely affect our ability to sell or lease the property or use it as collateral for financing. In addition, we could be held liable for significant penalties and damages under certain environmental laws and regulations or be subject to revocation of certain licenses or permits, which could materially and adversely affect our business, results of operations and cash flows. Our contracts with customers may also impose liability on us for environmental issues that arise through the performance of our services.
From time to time, we may incur costs and obligations for correcting environmental noncompliance matters and for remediation at or relating to certain of our properties. We believe that we are in substantial compliance with our environmental obligations and that any such obligations will not have a material adverse effect on our business or financial performance.
6
The potential impact of climate change on our operations is highly uncertain. Climate change may result in, among other things, changes in rainfall patterns, storm patterns and intensity and temperature levels. As discussed elsewhere in this Annual Report on Form 10-K, including in Item 1A. Risk Factors, our operating results are significantly influenced by weather, and significant changes in historical weather patterns could significantly impact our future operating results. For example, if climate change results in drier weather and more accommodating temperatures over a greater period of time, we may be able to increase our productivity, which could positively impact our revenues and gross margins. Conversely, if climate change results in a greater amount of rainfall, snow, ice or other less accommodating weather conditions, we could experience reduced productivity, which could negatively impact our revenues and gross margins. Further, while an increase in severe weather events, such as hurricanes, tropical storms, blizzards and ice storms, can create a greater amount of emergency restoration service work, it often also can result in delays or other negative consequences for our existing projects, which could negatively impact our financial results. Climate change could also have a negative impact on the demand for fossil fuels, which in turn could negatively impact demand for certain of our services.
Risk Management and Insurance
We are insured for employer’s liability, workers’ compensation, auto liability and general liability claims. Under these programs, the deductible for employer’s liability is $1.0 million per occurrence, the deductible for workers’ compensation is $5.0 million per occurrence, and the deductibles for auto liability and general liability are $10.0 million per occurrence. We manage and maintain a portion of our casualty risk through our wholly-owned captive insurance company, which insures all claims up to the amount of the applicable deductible of our third-party insurance programs. In connection with our casualty insurance programs, we are required to issue letters of credit to secure our obligations. We also have employee health care benefit plans for most employees not subject to collective bargaining agreements, of which the primary plan is subject to a deductible of $0.4 million per claimant per year.
Losses under all of these insurance programs are accrued based upon our estimate of the ultimate liability for claims reported and an estimate of claims incurred but not reported, with assistance from third-party actuaries. These insurance liabilities are difficult to assess and estimate due to unknown factors, including the severity of an injury, the extent of damage, the determination of our liability in proportion to other parties and the number of incidents not reported. The accruals are based upon known facts and historical trends, and management believes such accruals are adequate.
We renew our insurance policies on an annual basis, and therefore deductibles and levels of insurance coverage may change in future periods. In addition, insurers may cancel our coverage or determine to exclude certain items from coverage, or we may elect not to obtain certain types or incremental levels of insurance if we believe that the cost to obtain such coverage exceeds any additional benefits. In any such event, our overall risk exposure would increase, which could negatively affect our results of operations, financial condition and cash flows.
Seasonality and Cyclicality
Our revenues and results of operations can be subject to seasonal and other variations. These variations are influenced by weather, customer spending patterns, bidding seasons, receipt of required regulatory approvals, permits and rights of way, project timing and schedules, and holidays. Please read the section entitled Seasonality; Fluctuations of Results; Economic Conditions included in Item 7. Management’s Discussion and Analysis of Financial Condition and Results of Operations.
Website Access and Other Information
Our website address is www.quantaservices.com. Interested parties may obtain free electronic copies of our Annual Reports on Form 10-K, Quarterly Reports on Form 10-Q, Current Reports on Form 8-K, and any amendments to these reports through our website under the heading Investors & Media/Financial Info/SEC Filings or through the website of the Securities and Exchange Commission (the SEC) at www.sec.gov. These reports are available on our website as soon as reasonably practicable after we electronically file them with, or furnish them to, the SEC. In addition, our Corporate Governance Guidelines, Code of Ethics and Business Conduct and the charters of each of our Audit Committee, Compensation Committee, Governance and Nominating Committee and Investment Committee are posted on our website under the heading Investors & Media/Governance. We intend to disclose on our website any amendments or waivers to our Code of Ethics and Business Conduct that are required to be disclosed pursuant to Item 5.05 of Form 8-K. Free copies of these items may be obtained from our website. We will make available to any stockholder, without charge, copies of our Annual Report on Form 10-K as filed with the SEC. For copies of this or any other Quanta publication, stockholders may submit a request in writing to Quanta Services, Inc., Attn: Corporate Secretary, 2800 Post Oak Blvd., Suite 2600, Houston, TX 77056, or by phone at 713-629-7600.
Investors and others should note that we announce material financial information and make other public disclosures of information regarding Quanta through SEC filings, press releases, public conference calls, and our website. We also utilize social media to communicate this information, and it is possible that the information we post on social media could be deemed material.
7
Accordingly, we encourage investors, the media and others interested in our company to follow Quanta, and review the information we post, on the social media channels listed on our website in the Investors & Media/Social Media section.
This Annual Report on Form 10-K, our website and our social media channels contain information provided by other sources that we believe is reliable. We cannot provide assurance that the information obtained from other sources is accurate or complete. No information on our website or our social media channels is incorporated by reference herein.
ITEM 1A. | Risk Factors |
Our business is subject to a variety of risks and uncertainties, including, but not limited to, the risks and uncertainties described below. The matters described below are not the only risks and uncertainties facing our company. Additional risks and uncertainties not known to us or not described below also may impair our business operations. If any of the following risks actually occur, our business, financial condition, results of operations and cash flows could be negatively affected, and we may not be able to achieve our goals or expectations. This Annual Report on Form 10-K also includes statements reflecting assumptions, expectations, projections, intentions or beliefs about future events that are intended as “forward-looking statements” under the Private Securities Litigation Reform Act of 1995 and should be read in conjunction with the section entitled Uncertainty of Forward-Looking Statements and Information included in Item 7. Management’s Discussion and Analysis of Financial Condition and Results of Operations.
Our operating results may vary significantly from quarter to quarter.
Our business can be highly cyclical and subject to seasonal and other variations that can result in significant differences in operating results from quarter to quarter. For example, we typically experience lower gross and operating margins during winter months due to lower demand for our services and more difficult operating conditions in the Northern hemisphere. Additionally, our quarterly results may be materially and/or adversely affected by:
• | the timing and volume of work we perform and our performance with respect to ongoing projects; |
• | project delays, reductions in scope or cancellations, including as a result of permitting, regulatory or environmental processes, project performance, customer capital constraints, claimed force majeure events or protests or other political activity; |
• | adverse weather conditions or events; |
• | variations in the size, scope and margins of projects we perform and the mix of our customers, contracts and business during any particular quarter; |
• | increases in construction, design, engineering or procurement costs; |
• | fluctuations in regional, national or global economic, political and market conditions and demand for our services; |
• | pricing pressures resulting from competition; |
• | the budgetary spending patterns of customers and federal, state and local governments; |
• | disruptions in our customers’ strategic plans which could occur as a result of emerging technologies; |
• | the magnitude of work performed under change orders and the timing of their recognition; |
• | disputes with customers or delays relating to billing and payment terms under our contracts and change orders, and our ability to successfully negotiate and obtain payment or reimbursement under our contracts and change orders; |
• | the resolution of, or unexpected or increased costs associated with, pending or threatened litigation, indemnity obligations or other claims asserted against us; |
• | liabilities associated with multiemployer pension plans in which our employees participate, including with respect to any withdrawal therefrom; |
• | significant fluctuations in foreign currency exchange rates; |
8
• | changes in accounting pronouncements that require us to account for items differently; |
• | liabilities and costs experienced in our operations that are not covered by third-party insurance; |
• | payment risk associated with the financial condition of our customers, including those customers affected by the volatility of natural gas and oil prices; |
• | the termination or expiration of existing customer agreements; |
• | changes in bonding and lien requirements applicable to existing and new customer agreements; |
• | implementation of various information technology systems, which could temporarily disrupt day-to-day operations; |
• | the recognition of tax impacts related to changes in tax laws or uncertain tax positions; |
• | the timing and magnitude of costs we incur to support growth internally or through acquisitions or otherwise; |
• | the timing and integration of acquisitions and the magnitude of the related acquisition and integration costs; and |
• | estimates and assumptions in determining our financial results and backlog, including the timing and significance of impairments of long-lived assets, equity or other investments, receivables, goodwill or other intangible assets. |
Accordingly, our operating results in any particular quarter may not be indicative of the results that can be expected for any other quarter or for the entire year.
Negative economic and market conditions, including continued low oil and natural gas prices, may adversely impact our customers’ future spending as well as payment for our services and, as a result, our operations and growth.
Stagnant or declining economic conditions can adversely impact the demand for our services and result in the delay, reduction or cancellation of certain projects. In addition, economic and market conditions specifically affecting the industries we serve could adversely affect our business, financial condition, results of operations and cash flows. A number of factors, including financing conditions and potential bankruptcies in the industries we serve or a prolonged economic downturn or recession, could adversely affect our customers and their ability or willingness to fund capital expenditures in the future or pay for past services. Consolidation, competition, capital constraints or negative economic conditions in the electric power, oil and gas or communications industries may also result in reduced spending by, or the loss of, one or more of our customers.
Our Oil and Gas Infrastructure Services segment is exposed to risks associated with the oil and gas industry. These risks, which are not subject to our control, include the volatility and cyclical nature of natural gas and oil prices and the resulting effect on demand for the services we provide, and a slowdown in the development or discovery of natural gas and/or oil reserves. Specifically, lower natural gas and oil prices can result in decreased spending by our customers in our Oil and Gas Infrastructure Services segment. In particular, capital spending by exploration and production companies and midstream companies has generally declined in the last few years. Any future decline in prices, or perceived risk thereof, may result in our customers reducing or delaying capital spending on larger pipeline projects, gas gathering and compressor systems and related infrastructure, resulting in less demand for our services. If the profitability of our Oil and Gas Infrastructure Services segment were to decline, our overall financial position, results of operations and cash flows could also be adversely affected. Additionally, declines in natural gas and oil prices, and a resulting decline in the development of resource plays and oil and natural gas production, could negatively impact our Electric Power Infrastructure Services segment. For example, the low price of oil has had an adverse impact on the Canadian economy, which has impacted demand for some of our electric power services in Canada.
Further, many of our customers finance their projects through the incurrence of debt or the issuance of equity. During depressed markets, our customers may be unable to access capital markets or otherwise obtain financing for budgeted capital expenditures. A reduction in cash flow or the lack of availability of debt or equity financing for our customers could result in a reduction in our customers’ spending for our services and may also impact the ability of our customers to pay amounts owed to us, which could have a material adverse effect on our business, financial condition, results of operations, cash flows and our ability to grow.
9
A variety of issues outside of our control could affect the timing of and our performance on projects, which may result in additional costs to us, reductions or delays in revenues or the payment of liquidated damages.
Our business is dependent in part upon projects that can be cyclical in nature and are subject to risks of delay. The timing of or failure to obtain contracts, delays in awards of, start dates for or completion of projects and the cancellations of projects could result in significant periodic fluctuations in our business, financial condition, results of operations and cash flows.
Many projects involve challenging engineering, permitting, procurement and construction phases that may occur over extended time periods, sometimes several years. We may also encounter difficulties as a result of delays in design, engineering information or materials to be completed or procured by us, the customer or a third party; delays or difficulties in equipment and material delivery; schedule changes; delays due to our or our customers’ failure to timely obtain permits or rights of way or meet other regulatory requirements or permitting conditions; weather-related delays; protests, legal challenges or other political activity; and other factors. Projects where we provide engineering, procurement and construction services present additional performance risks due to the amount of work and complexity involved. The bidding processes for these projects can also be longer, often taking six to nine months, and regulatory and permitting delays on these projects tend to be more challenging and cause more timing uncertainty.
In addition, we contract with third-party suppliers and subcontractors to assist us with the completion of contracts. Any delay or failure by suppliers or by subcontractors in the completion of their portion of the project may result in delays in the overall progress of the project or cause us to incur additional costs. A failure by us to properly manage and invest in our equipment fleet could also negatively impact project performance and our financial condition, results of operations and cash flows. We also may encounter project delays due to local opposition to a project, which may include injunctive actions or other legal proceedings or public protests or other political activity.
Many of these difficulties and delays are beyond our control and could negatively impact our ability to complete the project in accordance with the original delivery schedule or achieve our anticipated margin on the project. Delays and additional costs may be substantial and not recoverable from third parties, and in some cases, we may be required to compensate the customer for such delays. In certain circumstances, we guarantee project completion or performance by a scheduled date. Failure to meet any of our schedules or performance requirements could also result in additional costs or penalties, including liquidated damages, and such amounts could exceed expected project profit. In extreme cases, the above-mentioned factors could cause project cancellations, and we may not be able to replace such projects with similar projects or at all. Such delays or cancellations may impact our reputation or relationships with customers, adversely affecting our ability to secure new contracts, and could have a material adverse effect on our business, financial condition, results of operations and cash flows.
Our business is labor intensive, and we may be unable to attract and retain qualified employees, or incur significant costs in the event we are unable to efficiently manage our workforce.
Our ability to maintain our productivity and profitability is limited by our ability to employ, train and retain the necessary skilled personnel. We may not be able to maintain an adequately skilled labor force necessary to operate efficiently and to support our growth strategy. For instance, we may experience shortages of qualified journeyman linemen, who are integral to the provision of transmission and distribution services under our Electric Power Infrastructure Services segment. The commencement of new, large-scale infrastructure projects or increased demand for infrastructure improvements, as well as the aging electric utility workforce, may also further reduce the pool of skilled workers available to us. In addition, in our Oil and Gas Infrastructure Services segment, there is limited availability of experienced supervisors and foremen that can oversee larger diameter pipe projects. A shortage in the supply of these skilled personnel, as well as equipment operators and welders, creates competitive hiring markets and may result in increased labor expenses. Additionally, if we are unable to hire employees with the requisite skills, we may also be forced to incur significant education and training expenses. Labor shortages or increased labor costs could impair our ability to maintain our business or grow our revenues or profitability.
Furthermore, the uncertainty of contract award timing and project delays can also present difficulties in managing our workforce size. Inability to efficiently manage our workforce may require us to incur costs resulting from excess staff, reductions in staff, or redundancies that could have a material adverse impact on our business, financial condition, results of operations and cash flows.
Our failure to adequately recover on contract change orders or claims brought by us against customers related to payment terms and costs could materially and adversely affect our financial position, results of operations and cash flows.
We have in the past brought, and may in the future bring, claims against our customers related to, among other things, the payment terms of our contracts and change orders relating to our contracts. These types of claims occur due to, among other things, customer- or third party-caused delays or changes in project scope, which may result in additional cost, which may or may not be recovered until the claim is resolved. Under these circumstances, we generally negotiate with the customer for additional
10
compensation; however, we are subject to the risk that we may be unable to obtain, through negotiation, arbitration, litigation or otherwise, adequate amounts to compensate us for the additional work or expenses incurred. Litigation or arbitration with respect to payment terms under contracts and change orders is generally lengthy and costly and may adversely affect our relationship with existing or potential customers, and it is often difficult to predict the timing or amount of any claim resolution. A failure to obtain adequate and prompt compensation for these matters could require us to record a reduction to revenues and gross profit recognized in prior periods under the percentage-of-completion accounting method. Any such adjustments could be substantial. We may also be required to invest significant working capital to fund cost overruns while the resolution of a claim is pending, which could adversely affect our business, financial condition, results of operations and cash flows.
Regulatory and environmental requirements affecting any of the industries we serve may lead to less demand for our services.
Because the vast majority of our revenue is derived from a few industries, the regulatory and environmental requirements affecting those industries have a material effect on our business, and increased regulatory and environmental requirements in those industries could adversely affect our business, financial condition, results of operations and cash flows. Customers in the industries we serve also face heightened regulatory and environmental requirements and stringent permitting processes that impact their projects, which could result in delays, reductions and cancellations of some of their projects. These regulatory factors have resulted in decreased demand for our services in the past, and they may continue to do so in the future, potentially impacting our business, financial condition, results of operations, cash flows and our ability to grow.
Our failure to accurately estimate project costs or successfully execute a project could result in reduced profits or losses that could adversely affect our business, financial condition, results of operations and cash flows.
We currently generate some of our revenues under fixed price contracts, including contracts for projects where we provide engineering, procurement and construction (EPC) services. We expect to generate a greater amount of revenues under these types of contracts in the future as anticipated larger and more complex projects, such as electric power transmission lines and mainline pipeline projects, become a more significant aspect of our business.
Under these contracts, we assume risks related to project estimates and execution, and project revenues, profitability and costs can vary, sometimes substantially, from our original projections due to a variety of factors, including:
• | unforeseen circumstances or project modifications not included in our cost estimates or covered by our contract for which we cannot obtain adequate compensation, including concealed or unknown environmental, geological or geographical conditions; |
• | failure to accurately estimate project costs; |
• | unanticipated technical problems, including design or engineering issues; |
• | inability to achieve guaranteed performance or quality standards with regard to engineering, construction or project management obligations; |
• | failure to properly make judgments in accordance with applicable professional standards, including engineering standards; |
• | changes in the cost of equipment, commodities, materials or labor; |
• | unanticipated costs or claims due to delays or failure to perform by customers, partners, subcontractors, suppliers or other third parties; |
• | contract termination or suspension and our inability to obtain reimbursement; |
• | delays or productivity issues caused by weather conditions or severe weather events; |
• | delays and additional costs associated with obtaining required permits or approvals; |
• | changes in laws or regulations; |
• | delays and additional costs attributable to legal challenges and protests and other political activity; and |
• | quality issues, including those requiring rework or replacement; |
11
Additionally, we may be required to pay liquidated damages under certain of our contracts if we fail to meet schedule or performance requirements. These factors and events may result in reputational harm or cause actual revenues and gross profits for a project to differ from what we originally estimated, resulting in reduced profitability or losses on projects. Such differences could be material and could have a significant impact on our business, financial condition, results of operations and cash flows.
Our use of percentage-of-completion accounting could result in a reduction or elimination of previously reported revenues and profits.
As discussed in Item 7. Management’s Discussion and Analysis of Financial Condition and Results of Operations — Critical Accounting Policies and in the notes to our consolidated financial statements included in Item 8. Financial Statements and Supplementary Data, a significant portion of our revenues are recognized using the percentage-of-completion method of accounting, utilizing the cost-to-cost method. This accounting method is generally accepted for fixed price contracts and is used because management considers expended costs to be the best available measure of progress on these contracts. The percentage-of-completion accounting practice we use results in the recognition of contract revenues and earnings ratably over the contract term in proportion to our incurrence of contract costs. The earnings or losses recognized on individual contracts are based on estimates of contract revenues, costs and profitability. Contract losses are recognized in full when losses are determined to be probable and can be reasonably estimated, and contract profit estimates are adjusted based on an ongoing review of contract performance and profitability. Further, a substantial portion of our contracts contain cost and performance incentives. Penalties are recorded when known or finalized, which generally occurs during the latter stages of the contract. In addition, we record cost recovery claims when we believe recovery is probable and the amounts can be reasonably estimated. Actual collection of claims could differ from estimated amounts and could result in a reduction or elimination of previously recognized revenues and earnings. In certain circumstances, it is possible that such adjustments could be significant.
Our revenues and profitability may be exposed to potential risk if a contract is terminated or canceled, our customers encounter financial difficulties or disputes arise with our customers.
Our contracts often require us to satisfy or achieve certain milestones in order to receive payment for the work performed, or in the case of cost-reimbursable contracts, provide support for billings in advance of receiving payment. As a result, we may incur significant costs or perform significant amounts of work prior to receipt of payment. If any of our customers do not proceed with the completion of projects, terminate or cancel a contract with us or default on their payment obligations, or if disputes arise with our customers with respect to the adequacy of billing support, we may face difficulties in collecting payment of amounts due to us for costs previously incurred. We have in the past brought, and may in the future bring, claims against our customers related to the payment terms of our contracts. A failure to promptly recover on these types of claims could have a negative impact on our financial condition, results of operations and cash flows. Additionally, any such claims may harm our future relationships with our customers.
In addition, many of our customers for larger projects are project-specific entities that do not have significant assets other than their interests in the project and may encounter financial difficulties relating to their businesses. It may be difficult to collect amounts owed to us by these customers, and if we are unable to do so, it could have an adverse effect on our future financial condition, results of operations and cash flows.
Our operating results could be negatively affected by weather conditions and the nature of our work environment.
We perform substantially all of our services outdoors. As a result, adverse weather conditions or events, such as extreme heat or cold, rainfall, snowfall, wind, an early thaw in Canada and the northern parts of the U.S., and hurricanes or other storms, may affect our productivity or may temporarily prevent us from performing services. The effect of weather delays on projects that are under fixed price arrangements may be greater if we are unable to adjust the project schedule for such delays. As a result, adverse weather conditions or events, such as extreme heat or cold, rainfall, snowfall, wind, an early thaw in Canada or the United States, and hurricanes or other storms, may affect our productivity or may temporarily prevent us from performing services. Furthermore, our work is performed under a variety of conditions, including but not limited to, difficult terrain and difficult site conditions where delivery of materials and availability of labor are impacted or where there is exposure to harsh and hazardous conditions. A reduction in our productivity and efficiency in any given period or our inability to meet guaranteed schedules may adversely affect our financial condition, results of operations and cash flows.
We may be unsuccessful at generating internal growth, which could adversely affect our financial condition, results of operations and cash flows.
Our ability to generate internal growth will be affected by, among other factors, our ability to:
12
• | expand the range of services we offer to customers to address their evolving infrastructure needs; |
• | attract new customers; |
• | increase the number of projects performed for existing customers; |
• | hire and retain qualified employees; |
• | expand geographically, including internationally; and |
• | address the challenges presented by stringent regulatory, environmental and permitting requirements and difficult economic or market conditions that may affect us or our customers. |
In addition, our customers may cancel, delay or reduce the number or size of projects available to us for a variety of reasons, including capital constraints or inability to meet regulatory requirements. Many of the factors affecting our ability to generate internal growth are beyond our control, and we cannot be certain that our strategies for achieving internal growth will be successful. Inability to successfully generate internal growth may adversely affect our financial condition, results of operations and cash flows.
Our business is highly competitive, and competitive pressures could affect our business, financial condition, results of operations and cash flows.
The specialty contracting business is served by numerous small, owner-operated private companies, some public companies and several large regional companies. Relatively few barriers prevent entry into some areas of our business, and as a result, any organization that has adequate financial resources and access to technical expertise may become one of our competitors.
In addition, some of our competitors have significant financial, technical and marketing resources. We cannot be certain that our competitors do not have or will not develop the expertise, experience and resources to provide services that are superior in both price and quality to our services. Similarly, we cannot be certain that we will be able to maintain or enhance our competitive position within the specialty contracting business or maintain our current customer base. Certain of our competitors may have lower overhead cost structures, and therefore may be able to provide the required services at lower rates than us. We also face competition from in-house service organizations of our existing or prospective customers. Service providers in the industries we serve are capable of performing, or acquiring businesses that perform, some of the same types of services we provide, and we cannot be certain that our existing or prospective customers will continue to outsource these services in the future.
Furthermore, a substantial portion of our revenues is directly or indirectly dependent on winning new contracts. The timing of project awards is unpredictable and often involves complex and lengthy negotiations and bidding processes. These processes could be impacted by a wide variety of factors, including price, governmental approvals, financing contingencies, commodity prices, environmental conditions and overall market and economic conditions. The competitive environment we operate in could also affect the timing of contract awards and the commencement or progress of work under awarded contracts. For example, based on rapidly changing competition dynamics, we have experienced, and may in the future experience, more competitive pricing in certain markets, such as the smaller scale transmission and distribution electric power market. Our bids also may not be successful due to, among other things, a potential customer’s perception of our ability to perform the work or the technological advantages held by our competitors. Additionally, changing competitive pressures could present difficulties in matching workforce size with available contract awards. As a result, the competitive environment we operate in could have a material adverse effect on our business, financial condition, results of operations and cash flows and could cause our results of operations and cash flows to fluctuate significantly from quarter to quarter.
Technological advancements that compete with our customers’ businesses or alter the services our customers require may also result in reduced demand for our services. For example, changes in technology, particularly with respect to efficient battery storage or the emergence of new, developing or alternative sources of power generation, may result in less demand for existing sources of power generation and for natural gas and oil, which could result in less demand for the services we provide.
Changes in government spending and legislative actions and initiatives relating to renewable energy and electric power may adversely affect demand for our services.
Demand for our services may not result from renewable energy initiatives. While many states currently have mandates in place that require specified percentages of power to be generated from renewable sources, those mandates could be reduced or made optional, thereby reducing, delaying or eliminating renewable energy development. Additionally, renewable energy is generally more expensive to produce than energy from traditional sources and may require additional power generation sources as backup. The locations of renewable energy projects are often remote and are not viable unless new or expanded transmission infrastructure to transport the power to demand centers is economically feasible. Furthermore, funding for renewable energy
13
initiatives is uncertain and in the past has been constrained by the availability of credit. These factors could result in fewer renewable energy projects than anticipated and a delay in the construction of these projects and related infrastructure, which could negatively impact our business.
Other current and potential legislative or regulatory initiatives may not result in increased demand for our services. Examples include legislation or regulations that require utilities to meet reliability standards, ease siting and right-of-way issues for the construction of transmission lines, and encourage installation of new electric power transmission and renewable energy generation facilities. It is not certain whether existing legislation will create sufficient incentives for new projects, when or if proposed legislative initiatives will be enacted or whether any potentially beneficial provisions will be included in the final legislation.
There are also a number of legislative and regulatory proposals and global, non-binding agreements that address greenhouse gas emissions, which are in various phases of discussion or implementation. The outcome of these pending federal and state proposals and possible future legislative and regulatory proposals resulting from any global agreement could negatively affect the operations of our customers through costs of compliance or restraints on projects, which could reduce their demand for our services.
Our business is subject to operational hazards, and we may not be insured against certain potential liabilities.
Our business is subject to significant operational hazards due to the nature of services provided by our workforce and the conditions in which they operate. These hazards include electricity, fires, explosions, mechanical failures and weather-related incidents. Our offshore operations are subject to additional risks, including blowouts, collisions, vessels sinking or capsizing and damage from severe weather conditions. In addition, we have significant operations in California and other locations that have recently experienced and have a higher risk of wildfires. These hazards could cause personal injury and severe damage to property, equipment and the environment and could lead to suspension of operations and/or legal liabilities. We also often operate in densely populated urban areas, which could increase the impact of any of these hazards or other accidents we experience. If we are not fully insured or indemnified against such liabilities or a counterparty fails to meet its indemnification obligations to us, it could materially and adversely affect our business, financial condition, results of operations and cash flows. Further, any such liabilities or accidents could adversely affect our safety record, which could impact our ability to bid on certain work.
We are insured for employer’s liability, workers’ compensation, auto liability and general liability claims, but such insurance is subject to deductibles and limits and may be canceled or may not cover all of our losses. Under these programs, the deductible for employer’s liability is $1.0 million per occurrence, the deductible for workers’ compensation is $5.0 million per occurrence, and the deductibles for auto liability and general liability are $10.0 million per occurrence. We manage and maintain a portion of our casualty risk through our wholly-owned captive insurance company, which insures all claims up to the amount of the applicable deductible of our third-party insurance programs. In connection with our casualty insurance programs, we are required to issue letters of credit to secure our obligations. We also have employee health care benefit plans for most employees not subject to collective bargaining agreements, of which the primary plan is subject to a deductible of $0.4 million per claimant per year. Our insurance policies include various coverage requirements, including the requirement to give appropriate notice. If we fail to comply with these requirements, our coverage could be denied.
Losses under all of these insurance programs are accrued based upon our estimate of the ultimate liability for claims reported and an estimate of claims incurred but not reported, with assistance from third-party actuaries. These insurance liabilities are difficult to assess and estimate due to unknown factors, including the severity of an injury, the extent of damage, the determination of our liability in proportion to other parties and the number of incidents not reported. The accruals are based upon known facts and historical trends, and management believes such accruals are adequate. If we were to experience insurance claims or costs significantly above our estimates, our business, financial condition, results of operations and cash flows could be materially and adversely affected.
Unavailability or cancellation of third-party insurance coverage would increase our overall risk exposure as well as disrupt our operations.
We maintain insurance coverage from third-party insurers as part of our overall risk management strategy and because some of our contracts require us to maintain specific insurance coverage limits. However, there can be no assurance that our insurance coverages will be sufficient or effective under all circumstances or against all claims and liabilities asserted against us. Additionally, we renew our insurance policies on an annual basis, and therefore deductibles and levels of coverage offered by third parties may change in future periods. There can be no assurance that any of our existing third party insurance coverage will be renewed upon the expiration of the coverage period or that future coverage will be affordable at the required limits. In addition, our third-party insurers could fail, suddenly cancel our coverage or otherwise be unable to provide us with adequate insurance coverage. For example, should our insurers determine to exclude coverage for wildfires in the future, we could be exposed to significant liabilities and a potential disruption of our operations. If our risk exposure increases as a result of adverse changes in our insurance coverage, we could be subject to increased claims and liabilities that could negatively affect our business, financial condition, results of operations and cash flows.
14
During the ordinary course of our business, we may become subject to lawsuits or indemnity claims, which could materially and adversely affect our business and results of operations.
We have in the past been, and may in the future be, named as a defendant in lawsuits, claims and other legal proceedings that arise in the ordinary course of our business. These actions may seek, among other things, compensation for alleged personal injury, workers’ compensation, employment discrimination and other employment-related damages, breach of contract, property damage, environmental liabilities, multiemployer pension plan withdrawal liabilities, punitive damages, consequential damages, and civil penalties or other losses or injunctive or declaratory relief. In addition, we generally indemnify our customers for claims related to the services we provide and actions we take under our contracts, and, in some instances, we may be allocated risk through our contract terms for actions by our customers, subcontractors or other third parties. Because our services in certain instances may be integral to the operation and performance of our customers’ infrastructure, we have been and may become subject to lawsuits or claims for any failure of the systems that we work on, even if our services are not the cause of such failures, and we could be subject to civil and criminal liabilities to the extent that our services contributed to any property damage, personal injury or system failure. Insurance coverage may not be available or may be insufficient for these lawsuits, claims or legal proceedings. The outcome of any of these lawsuits, claims or legal proceedings could result in significant costs and diversion of management’s attention from our business. Payments of significant amounts, even if reserved, could materially and adversely affect our business, reputation, financial condition, results of operations and cash flows. For details on our existing litigation and claims, refer to Note 15 of the Notes to Consolidated Financial Statements in Item 8. Financial Statements and Supplementary Data.
Many of our contracts may be canceled or suspended on short notice or may not be renewed upon completion or expiration, and we may be unsuccessful in replacing our contracts in such events, which may adversely affect our financial condition, results of operations and cash flows.
We could experience a decrease in our revenues, net income and liquidity if any of the following occur:
• | our customers cancel or suspend a significant number of contracts or contracts having significant value; |
• | we fail to renew a significant number of our existing contracts; |
• | we complete a significant number of non-recurring projects and cannot replace them with similar projects; or |
• | we fail to reduce operating and overhead expenses consistent with any decrease in our revenues. |
Many of our customers may cancel or suspend our contracts on short notice, typically 30 to 90 days, even if we are not in default under the contract. Certain of our customers assign work to us on a project-by-project basis under master service agreements. Under these agreements, our customers generally have no obligation to assign a specific amount of work to us. Our operations could decline significantly if the anticipated volume of work is not assigned to us, which will be more likely if customer spending decreases due to, for example, unfavorable economic conditions. Many of our contracts, including our master service agreements, are opened to public bid at the expiration of their terms. There can be no assurance that we will be the successful bidder on our existing contracts that are subject to re-bid in the future.
The nature of our business exposes us to potential liability for warranty, engineering and other claims, which could materially and adversely affect our business and results of operations.
Under our contracts with customers, we typically provide warranties for the services and materials we provide, guaranteeing the work performed against, among other things, defects in workmanship, and may agree to indemnify our customers for losses related to our services. The length of the warranty periods we agree to vary and may extend for several years. As much of the work we perform is inspected by our customers for any defects in construction prior to acceptance of the project, the warranty claims that we have historically received have not been substantial. Additionally, materials used in construction are often provided by the customer or are warranted against defects by the supplier. However, certain projects may have longer warranty periods and include facility performance warranties that may be broader than the warranties we generally provide. In these circumstances, if warranty claims occur, we are generally required to re-perform the services and/or repair or replace the warranted item and any other facilities impacted thereby, at our sole expense, and we could also be responsible for other damages if we are not able to adequately satisfy our warranty obligations. In addition, we may be required under contractual arrangements with our customers to warrant any defects or failures in materials we provide. While we generally require the materials suppliers to provide us warranties that are consistent with those we provide to our customers, if any of these suppliers default on their warranty obligations to us, we may incur costs to repair or replace the defective materials. Costs incurred as a result of warranty claims could adversely affect our business, financial condition, results of operations and cash flows.
Furthermore, our business involves professional judgments regarding the planning, design, development, construction, operations and management of electric power transmission, communications and pipeline infrastructure. Because our projects are
15
often technically complex, our failure to make judgments and recommendations in accordance with applicable professional standards, including engineering standards, could result in damages. A significantly adverse or catastrophic event at a project site or completed project resulting from the services we performed could result in significant professional or product liability or other claims against us, as well as reputational harm. These liabilities could exceed our insurance limits or could impact our ability to obtain third-party insurance in the future. In addition, customers, subcontractors or suppliers who have agreed to indemnify us against any such liabilities or losses might refuse or be unable to pay us. An uninsured claim, either in part or in whole, if successful and of a material magnitude, could have a substantial impact on our business, financial condition, results of operations and cash flows.
Our failure to adequately protect critical data, sensitive information and technology systems could materially affect our business, financial condition, results of operations and cash flows or result in harm to our reputation.
We use technology in substantially all aspects of our business operations. We rely heavily on computer, information, and communications technology and related systems to manage our operations and other business processes and to protect sensitive company information. Furthermore, we collect and retain personally identifiable and other sensitive information about our customers, stockholders and employees, all of which expect that we will adequately protect such information.
Cyber-attacks or acts of terrorism against us, our customers and/or our vendors or other breaches of our data security could cause service disruption or, in extreme circumstances, loss of control of our customers’ energy infrastructure systems, which could subject us to significant liabilities, cause damage to our reputation or customer relationships, or result in regulatory investigations or actions by governmental authorities. Further, strategic targets, such as energy-related assets, may be at greater risk of cyber-attacks or acts of terrorism than other targets. Cyber-attacks and physical security risks, such as storms or other natural phenomena, IT solution failures, network disruptions, theft and other breaches of data security, could also disrupt our operations by causing, among other things, delays in the processing of transactions or the reporting of financial results or the unintentional disclosure of company information (including confidential or proprietary information), and such cyber-attacks could go unnoticed for some period of time. A significant theft, loss, misappropriation, or inadvertent release of customer, stockholder or employee data by cyber-attack or otherwise could also adversely impact our reputation and could result in significant costs, fines and litigation.
While management has taken steps to address these concerns by implementing network security and internal control measures, there can be no assurance that the above events will not occur, and such events could have a material adverse effect on our business, financial condition, results of operations and cash flows. Furthermore, the continuing and evolving threat of cyber-attacks has resulted in increased regulatory focus on prevention. To the extent we face increased regulatory requirements, we may be required to expend significant additional resources to meet such requirements.
The loss of one or a few customers could have a material adverse effect on us.
A few customers have in the past and may in the future account for a significant portion of our revenues in any one year or over a period of several consecutive years. Although we have long-standing relationships with many of our significant customers, our customers may unilaterally reduce or discontinue their contracts with us at any time. The loss of business from a significant customer could have a material adverse effect on our business, financial condition, results of operations and cash flows.
Backlog may not be realized or may not result in profits.
Backlog is not a term recognized under US GAAP; however, it is a common measurement used in our industry. Our methodology for determining backlog may not be comparable to the methodologies used by other companies. For a discussion of how we calculate backlog for our business, please see Backlog in Item 1. Business.
Furthermore, backlog is difficult to determine with certainty. Customers often have no obligation under our contracts to assign or release work to us, and many contracts may be terminated on short notice. Reductions in backlog due to cancellation or reduction in scope of one or more contracts or projects by a customer or for other reasons could significantly reduce the revenues and profit we actually receive from contracts included in backlog. In the event of a project cancellation or reduction in scope, we may be reimbursed for certain costs but would not have a contractual right to the total revenues reflected in our backlog. The backlog we obtain in connection with companies we acquire may not be as large as we believed and may not result in the revenues or profits we expected at the time of acquisition. In addition, projects that are delayed may remain in backlog for extended periods of time. All of these uncertainties are heightened by negative economic conditions and their impact on our customers’ spending, as well as the effects of regulatory requirements and weather conditions. Consequently, our estimates of backlog may not be accurate, and we may not be able to realize our estimated backlog.
16
Our financial results are based upon estimates and assumptions that may differ from actual results.
In preparing our consolidated financial statements in conformity with US GAAP, several estimates and assumptions are used by management to report the assets, liabilities, revenues and expenses recognized during the periods presented and to determine the contingent assets and liabilities known to exist as of the date of the financial statements. These estimates and assumptions are necessary because certain information used in the preparation of our financial statements is dependent on future events, cannot be calculated with a high degree of precision from available data or cannot be readily calculated based on generally accepted methodologies. In some cases, these estimates are particularly difficult to determine, and we must exercise significant judgment. Estimates are used primarily in our assessment of the allowance for doubtful accounts, valuation of inventory, useful lives of assets, fair value assumptions in analyzing goodwill, other intangibles and long-lived asset impairments, equity and other investments, loan receivables, purchase price allocations, acquisition-related contingent consideration liabilities, liabilities for insurance and other claims and guarantees, multiemployer pension plan withdrawal liabilities, revenue recognition for construction contracts inclusive of contractual change orders and claims, share-based compensation, operating results of reportable segments, provision (benefit) for income taxes and the calculation of uncertain tax positions. Actual results for all estimates could differ materially from the estimates and assumptions that we use, which could have a material adverse effect on our financial condition, results of operations and cash flows.
Our inability to successfully execute our acquisition strategy may have an adverse impact on our growth strategy.
Our business strategy includes expanding our presence in the industries we serve through strategic acquisitions of companies that complement or enhance our business. The number of acquisition targets that meet our criteria may be limited. We may also face competition for acquisition opportunities, and other potential acquirers may offer more favorable terms or have greater financial resources available for potential acquisitions. This competition may further limit our acquisition opportunities and our ability to grow through acquisitions or could raise the prices of acquisitions and make them less accretive, or possibly not accretive, to us. Failure to consummate future acquisitions could negatively affect our growth strategies. Additionally, the acquisitions we complete may involve significant cash expenditures, the incurrence or assumption of debt or burdensome regulatory requirements, and any acquisition may ultimately have a negative impact on our business, financial condition, results of operations and cash flows.
We may be unsuccessful at integrating businesses that either we have acquired or that we may acquire in the future, which may reduce the anticipated benefit from acquired businesses.
As a part of our business strategy, we have acquired, and may seek to acquire in the future, companies that complement or enhance our business. The success of this strategy will depend on our ability to realize the anticipated benefits from the acquired businesses, such as the expansion of our existing operations, elimination of redundant costs and capitalizing on cross-selling opportunities. To realize these benefits, however, we must successfully integrate the operations of the acquired businesses with our existing operations. Integrating our acquired businesses involves a number of special risks, including:
• | failure of an acquired business to achieve the results we expect; |
• | diversion of our management’s attention from operational and other matters; |
• | difficulties integrating the operations and personnel of an acquired business; |
• | additional financial reporting and accounting challenges associated with integrating an acquired business; |
• | inability to retain key personnel of an acquired business; |
• | risks associated with unanticipated events or liabilities associated with the operations of an acquired business; |
• | loss of business due to customer overlap or other factors; |
• | risks and liabilities arising from the prior operations of an acquired business, such as performance, operational, safety, workforce compliance or tax issues, some of which we may not have discovered during our due diligence and may not be covered by indemnification obligations; and |
• | potential disruptions of our business. |
We cannot be sure that we will be able to successfully complete the integration process without substantial costs, delays, disruptions or other operational or financial problems. If we do not implement proper overall business controls, our decentralized operating strategy could result in inconsistent operating and financial practices at the companies we acquire. Additionally, failure
17
to successfully integrate acquired businesses could adversely impact our business, financial condition, results of operations and cash flows.
Our investments expose us to risks and may result in conflicts of interest that could adversely impact our business or result in reputational harm.
We have entered into strategic relationships and investment arrangements with various partners, including customers and infrastructure investors, through which we have invested and intend to invest in infrastructure assets. We expect this activity to continue in the future, both through direct investments by us and investments through the partnership structure we formed with select infrastructure investors that provides up to $1.0 billion of available capital, including approximately $80.0 million from Quanta. Wholly owned subsidiaries of Quanta serve as the general partner of this partnership and as a separately operated registered investment adviser that manages the invested capital.
These types of investments may expose us to increased risks, including poor performance by the infrastructure projects in which we have invested due to, among other things, difficult market or economic conditions or slowdowns (which may occur across one or more industries, sectors or geographies) or changes to the supply or demand and fluctuations in the price of commodities. That negative performance could result in lower investment returns for us and our customers and infrastructure investors, as well as a decline in value or total loss of our investments and the possible sale of our investments at values below our initial projections, including at a loss, all of which could adversely affect our business, financial condition, results of operations and cash flows. Additionally, poor performance by our investments, in particular investments through our capital partnership structure, could result in reputational harm to Quanta that impairs our ability to raise or participate in raising new funds for future investment opportunities, which in turn could adversely affect our ability to secure certain future projects. Further, our relationship with a customer that partners with us in a poorly performing investment could become impaired, which may negatively impact our ability to continue providing services to that customer.
Conflicts of interest may also exist or arise for us in relation to our investment partners as a result of our capital partnership structure or the structure of our other investment arrangements. For example, in these structures, Quanta may be the contractor for a project as well as an equity investor and the manager of investments in that project. In those instances, conflicts of interest may exist for such things as contractor pricing and the handling of contractor change orders and other claims. While we have taken certain actions that we believe minimize or address these and other anticipated conflicts of interest, including through internal management practices and the terms of our agreements with investment partners, our failure to properly manage such conflicts of interest could expose us to liability or harm our relationships with investment partners, which could impact our business, financial condition, results of operations and cash flows or cause reputational harm to Quanta.
Our results of operations could be adversely affected as a result of asset impairments.
Our results of operations and financial condition could be adversely affected by impairments to goodwill, other intangible assets, receivables, long-lived assets or investments. For example, when we acquire a business, we record goodwill in an amount equal to the amount we paid for the business minus the fair value of the net tangible assets and other intangible assets of the acquired business. Goodwill and other intangible assets that have indefinite useful lives cannot be amortized, but instead must be tested at least annually for impairment. For additional description on this impairment testing, please read Item 7. Management’s Discussion and Analysis of Financial Condition and Results of Operations - Critical Accounting Policies. We have recorded impairments in the past, and any future impairments, including impairments of goodwill, intangible assets, long-lived assets or investments, could have a material adverse effect on our financial condition and results of operations for the period in which the impairment is recognized.
In addition, we enter into various types of investment arrangements in the normal course of business, each having unique terms and conditions. These investments may include equity interests we hold in business entities, including general or limited partnerships, contractual joint ventures or other forms of equity or profit participation. These investments may also include our participation in different finance structures such as the extension of loans to project specific entities, the acquisition of convertible notes issued by project specific entities or other strategic financing arrangements. Our equity method investments are carried at original cost and are included in “Other assets, net” in our consolidated balance sheet and are adjusted for our proportionate share of the investees’ net income (loss) and distributions. Equity investments are reviewed for impairment by assessing whether there has been a decline in the fair value of the investment below the carrying amount and whether that decline is considered to be other than temporary. In making this determination, factors such as the ability to recover the carrying amount of the investment and the inability of the investee to sustain future earnings capacity are evaluated in determining whether an impairment has occurred and should be recognized.
18
We extend credit to customers for purchases of our services and may enter into longer-term deferred payment arrangements or provide other financing or investment arrangements with certain of our customers, which subjects us to potential credit or investment risk that could, if realized, adversely affect our financial condition, results of operations and cash flows.
We grant credit, generally without collateral, to our customers, which include electric power utilities, oil and gas companies, communications providers, governmental entities, general contractors, and builders, owners and managers of renewable energy facilities and commercial and industrial properties located primarily in the United States, Canada, Australia and Latin America. We may also agree to allow our customers to defer payment on projects until certain milestones have been met or until the projects are substantially completed, and customers typically withhold some portion of amounts due to us as retainage. In addition, we may provide other forms of financing to our customers or make investments in our customers’ projects, typically in situations where we also provide services in connection with the projects. Our payment arrangements subject us to potential credit risk related to changes in business and economic factors affecting our customers, including material changes in our customers’ revenues or cash flows. These changes may also reduce the value of any financing or equity investment arrangements we have with our customers. Many of our customers have been negatively impacted by uncertain economic conditions in recent years, and some may experience financial difficulties (including bankruptcies) that could impact our ability to collect amounts owed to us or impair the value of our investments in them.
If we are unable to collect amounts owed to us, our cash flows would be reduced, and we could experience losses if those amounts exceed current allowances. We would also recognize losses with respect to any investments that are impaired as a result of our customers’ financial difficulties. The risk of loss may increase for projects where we provide services and make a financing or equity investment. Losses experienced could materially and adversely affect our financial condition, results of operations and cash flows.
The loss of key personnel could disrupt our business.
We depend on the continued efforts of our executive officers and senior management, including the management at each of our operating units. Although we typically enter into employment agreements with our executive officers and other key employees for initial terms of one to three years and subsequent one-year renewal options, we cannot be certain that any individual will continue in such capacity for any particular period of time. The loss of key personnel, or the inability to hire and retain qualified employees, could negatively impact our ability to manage our business.
Our business growth could outpace the capability of our decentralized management infrastructure.
We cannot be certain that our management infrastructure will be adequate to support our operations as they expand. For example, the ability to internally communicate, coordinate and execute business strategies, plans and tactics may be negatively impacted by our increasing size and complexity. A decentralized structure places significant control and decision-making powers in the hands of our operating unit management. This contributes to the risk that we may be slower or less able to identify or react to problems affecting key business matters than we would in a more centralized environment. The lack of timely access to information may impact the quality of decision making by management. Our decentralized organization creates the possibility that our operating subsidiaries assume excessive risk without appropriate guidance from our centralized legal, accounting, tax, treasury and insurance functions as to the potential overall impact. Future growth could also impose significant additional responsibilities on members of our senior management, including the need to recruit and integrate new senior level managers and executives. We cannot be certain that we will be able to recruit and retain such additional managers and executives. To the extent that we are unable to manage our growth effectively, or are unable to attract and retain additional qualified management, we may not be able to expand our operations or execute our business plan.
We may be required to contribute cash to meet our underfunded obligations in certain multiemployer pension plans.
Our collective bargaining agreements generally require us to participate with other companies in multiemployer pension plans. To the extent those plans are underfunded, the Employee Retirement Income Security Act of 1974, as amended by the Multiemployer Pension Plan Amendments Act of 1980, may subject us to substantial liabilities under those plans if we withdraw from them or they are terminated or experience a mass withdrawal. For example, we have been involved in several litigation matters associated with our withdrawal from the Central States, Southeast and Southwest Areas Pension Plan (the Central States Plan), certain of which were settled in the fourth quarter of 2017. For additional information on the Central States Plan matters, please see Collective Bargaining Agreements in Note 15 of the Notes to Consolidated Financial Statements in Item 8. Financial Statements and Supplementary Data.
In addition, the Pension Protection Act of 2006 added special funding and operational rules generally applicable to plan years beginning after 2007 for multiemployer plans that are classified as “endangered,” “seriously endangered” or “critical” status based on multiple factors (including, for example, the plan’s funded percentage, cash flow position and whether it is projected to experience a minimum funding deficiency). Plans in these classifications must adopt measures to improve their funded status
19
through a funding improvement or rehabilitation plan, as applicable, which may require additional contributions from employers (which may take the form of a surcharge on benefit contributions) and/or modifications to retiree benefits. Certain plans to which we contribute or may contribute in the future are in “endangered,” “seriously endangered” or “critical” status. The amount of additional funds, if any, that we may be obligated to contribute to these plans in the future cannot be estimated due to uncertainty of the future levels of work that require the specific use of union employees covered by these plans, as well as the future contribution levels and possible surcharges on contributions applicable to these plans.
Our unionized workforce and related obligations could adversely affect our operations.
As of December 31, 2017, approximately 38% of our employees were covered by collective bargaining agreements. Although the majority of the collective bargaining agreements prohibit strikes and work stoppages, certain of our unionized employees have participated in strikes and work stoppages in the past, and we cannot be certain that strikes or work stoppages will not occur in the future. Strikes or work stoppages could adversely impact relationships with our customers and could cause us to lose business and experience a decline in revenues. Our ability to complete future acquisitions also could be adversely affected because of our union status for a variety of reasons. For instance, our union agreements may be incompatible with the union agreements of a business we want to acquire, and some businesses may not want to become affiliated with a union-based company. Additionally, we may increase our exposure to withdrawal liabilities for underfunded multiemployer pension plans to which an acquired company historically contributed or presently contributes.
Approximately 62% of our employees are not unionized. Certain of our customers require or prefer a non-union workforce, and they may reduce the amount of work assigned to us if our non-union labor crews become unionized, which could negatively affect our business, financial condition, results of operations and cash flows.
We may incur liabilities or suffer negative financial or reputational impacts relating to occupational health and safety matters.
Our operations are inherently dangerous and subject to extensive laws and regulations relating to the maintenance of safe conditions in the workplace. While we have invested, and will continue to invest, substantial resources in our occupational health and safety programs, our industry involves a high degree of operational risk, and there can be no assurance that we will avoid significant liability exposure. Although we have taken what we believe are appropriate precautions, we have suffered fatalities in the past and may suffer additional fatalities in the future. Serious accidents, including fatalities, may subject us to substantial penalties, civil litigation or criminal prosecution. Claims for damages to persons, including claims for bodily injury or loss of life, could result in substantial costs and liabilities. In addition, if our safety record were to substantially deteriorate over time or we were to suffer substantial penalties or criminal prosecution for violation of health and safety regulations, our customers could cancel our contracts and elect to procure future services from other providers. Unsafe work sites also have the potential to increase employee turnover, increase the costs of projects for our clients, and raise our operating costs. Any of the foregoing could result in financial loss, which could have a material adverse impact on our business, financial condition, results of operations and cash flows.
Risks associated with operating in international markets could restrict our ability to expand globally and harm our business and prospects.
Although our international operations are presently conducted primarily in Canada, Australia and Latin America, we also perform work in other foreign countries and expect that the number of countries in which we operate and the amount of work we perform in foreign countries could increase over the next few years. Economic conditions, including those resulting from wars, civil unrest, acts of terrorism and other conflicts or volatility in global markets, may adversely affect our customers, their demand for our services and their ability to pay for our services. In addition, our international operations include business and transactions for which we are paid in local currency. Payments to us in currencies other than the U.S. dollar may exceed our local currency needs, leading to the accumulation of excess local currency, which, in certain instances, may be subject to temporary blocking, costly taxes or tariffs, or other difficulties if we attempt to convert those amounts to U.S. dollars.
There are also numerous other risks inherent in conducting business internationally, including, but not limited to, potential instability in international markets, changes in applicable regulatory requirements, foreign currency fluctuations, political, economic and social conditions in foreign countries, expropriation or nationalization of our assets, foreign legal systems and cultural practices dissimilar from those we are familiar with, and complex U.S. and foreign tax regulations and other laws and international treaties. These risks could restrict our ability to provide services to international customers, operate our international business profitably or fund our strategic objectives, and our overall business, financial condition, results of operations and cash flows could be negatively impacted by our foreign activities.
20
Compliance with and changes in tax laws could adversely affect our performance.
We are subject to extensive tax liabilities imposed by multiple jurisdictions, including income taxes, indirect taxes (excise/duty, sales/use, gross receipts, and value-added taxes), payroll taxes, franchise taxes, withholding taxes, and ad valorem taxes. New tax laws, treaties and regulations and changes in existing tax laws, treaties and regulations are continuously being enacted or proposed and could result in significant changes to the tax rate on our earnings, which could have a material impact on our earnings and cash flows from operations. For example, the Tax Cuts and Jobs Act of 2017 (the Tax Act), enacted in December 2017, made numerous changes to U.S. federal corporate tax laws that are anticipated to impact our effective tax rate in future periods. In addition, significant judgment is required in determining our worldwide provision for income taxes. In the ordinary course of our business, there are many transactions and calculations where the ultimate tax determination is uncertain. We are regularly under audit by tax authorities, and our tax estimates and tax positions could be materially affected by many factors, including the final outcome of tax audits and related litigation, the introduction of new tax accounting standards, legislation, regulations and related interpretations, our global mix of earnings, the realizability of deferred tax assets and changes in uncertain tax positions. A significant increase in our tax rate could have a material adverse effect on our profitability and liquidity.
We could be adversely affected by our failure to comply with the laws applicable to our foreign activities, including the U.S. Foreign Corrupt Practices Act and other similar worldwide anti-bribery laws.
The U.S. Foreign Corrupt Practices Act (FCPA) and similar anti-bribery laws in other jurisdictions prohibit U.S.-based companies and their intermediaries from making improper payments to non-U.S. officials for the purpose of obtaining or retaining business. We pursue opportunities in certain parts of the world that experience government corruption, and in certain circumstances, compliance with anti-bribery laws may conflict with local customs and practices. Our policies mandate compliance with all applicable anti-bribery laws. Further, we require our partners, subcontractors, agents and others who work for us or on our behalf to comply with the FCPA and other anti-bribery laws. Although we have policies and procedures designed to ensure that we, our employees, our agents and others who work with us in foreign countries comply with the FCPA and other anti-bribery laws, there is no assurance that such policies or procedures will protect us against liability under the FCPA or other laws for actions taken by our agents, employees and intermediaries. If we are found to be liable for FCPA violations (either due to our own acts or inadvertence, or due to the acts or inadvertence of others), we could be subject to severe criminal or civil penalties or other sanctions, which could have a material adverse effect on our reputation, business, financial condition, results of operations, and cash flows. In addition, detecting, investigating and resolving actual or alleged FCPA violations is expensive and could consume significant time and attention of our senior management.
Our participation in joint ventures exposes us to liability and/or harm to our reputation for failures of our partners.
As part of our business, we have entered into joint venture arrangements and likely will continue to do so. The purpose of these joint ventures is typically to combine skills and resources to allow for the bidding and performance of particular projects. Success on these jointly performed projects can be adversely affected by the performance of our joint venture partners, over whom we may have little or no control. Differences in opinions or views between us and our joint venture partners could result in delayed decision-making or failure to agree on material issues that could adversely affect the business and operations of our joint ventures. Additionally, the failure by a joint venture partner to comply with applicable laws, regulations or client requirements could negatively impact our business.
We and our joint venture partners are generally jointly and severally liable for all liabilities and obligations of our joint ventures. If a joint venture partner fails to perform or is financially unable to bear its portion of required capital contributions or other obligations, including liabilities stemming from claims or lawsuits, we could be required to make additional investments, provide additional services or pay more than our proportionate share of a liability to make up for our partner’s shortfall. Further, if our partners experience cost overruns or project performance issues that we are unable to adequately address, the customer may terminate the project, which could result in legal liability to us, harm our reputation and reduce our profit or increase our loss on a project.
We are in the process of implementing information technology (IT) solutions, which could temporarily disrupt day-to-day operations at certain operating units.
We continue to implement comprehensive IT solutions that we believe will allow for the interface between functions such as accounting and finance, human resources, operations, and fleet management. Continued development and implementation of the IT solutions will require substantial financial and personnel resources. While the IT solutions are intended to improve and enhance our information systems, implementation of new information systems at each operating unit exposes us to the risks of start-up of the new system and integration of that system with our existing systems and processes, including possible disruption of our financial reporting. There is no guarantee that we will realize economic or other intended benefits from continued development and implementation of the IT solutions. Additionally, the IT solutions may not be developed or implemented as timely or as
21
accurately as planned. Failure to properly implement the IT solutions could result in substantial disruptions to our business, including coordinating and processing our normal business activities, testing and recording of certain data necessary to provide oversight over our disclosure controls and procedures and effective internal controls over our financial reporting, and other unforeseen problems.
Our dependence on suppliers, subcontractors and equipment manufacturers could expose us to risk of loss in our operations.
On certain projects, we rely on suppliers to obtain the necessary materials and subcontractors to perform portions of our services. We also rely on equipment manufacturers to provide us with the equipment required to conduct our operations. Limitations on the availability of suppliers, subcontractors or equipment manufacturers could negatively impact our operations, particularly in the event we rely on a single or small number of providers. The risk of a lack of available suppliers, subcontractors or equipment manufacturers may be heightened as a result of market and economic conditions. To the extent we cannot engage subcontractors or acquire equipment or materials, our operations could be negatively impacted. Additionally, successful completion of our contracts may depend on whether our subcontractors successfully fulfill their contractual obligations. If our subcontractors fail to perform their contractual obligations as a result of financial or other difficulties, or if our subcontractors fail to meet the expected completion dates or quality standards or fail to comply with applicable laws, we may be required to incur additional costs or provide additional services in order to make up such shortfall.
An increase in the prices of certain materials used in our business could adversely affect our business.
For certain contracts, including where we have assumed responsibility for procuring materials for a project, we are exposed to market risk of increases in certain commodity prices of materials, such as copper and steel, which are used as components of supplies or materials utilized in all of our operations. We are also exposed to increases in energy prices, particularly as they relate to gasoline prices for our rolling-stock fleet of approximately 40,000 units. While we believe we can increase our prices to adjust for some price increases in commodities, there can be no assurance that price increases of commodities, if they were to occur, would be recoverable. Additionally, some of our fixed price contracts do not allow us to adjust our prices and, as a result, increases in material or fuel costs could reduce our profitability with respect to such projects.
We may not have access in the future to sufficient funding to finance desired growth and operations.
If we cannot secure future funds or financing on acceptable terms, we may be unable to support our future operations or growth strategy. We use cash for acquisitions, investments and internal growth projects, and the timing and size of these efforts cannot be readily predicted and may be substantial. The use of cash on hand, cash from operations and cash from our current credit facility to fund these efforts limits our financial flexibility and may increase our need to seek capital through additional debt or equity financings. We also rely on financing companies to fund the leasing of certain of our trucks and trailers, support vehicles and specialty construction equipment. Credit market conditions may cause certain of these financing companies to restrict or withhold access to capital for us to fund the leasing of additional equipment. A widespread lack of available capital to fund the leasing of equipment could negatively impact our future operations.
Our credit agreement contains significant restrictions, including financial covenants and other restrictions on our ability to borrow amounts under the agreement and limitations on our ability to incur additional debt or conduct certain types of preferred equity financings. Our ability to increase the current commitments under our credit facility is also dependent upon additional commitments from our lenders. Furthermore, if we are permitted under our credit facility to seek additional debt or equity financings, we cannot be certain they will be available to us on acceptable terms or at all, as banks are often restrictive in their lending practices, and additional debt financing may include covenants that further limit our operational and financial flexibility. If we are unable to borrow under our current credit agreement or secure other financing or if our lenders become unable or unwilling to fund their commitments to us, we may not be able to access the capital needed to fund our growth and operations. For additional information on the terms of our credit facility, please read Item 7. Management’s Discussion and Analysis of Financial Condition and Results of Operations - Debt Instruments - Credit Facility.
Additionally, the market price of our common stock may change significantly in response to various factors, including events beyond our control, which could impact our ability to utilize capital markets to obtain funds. A variety of events may cause the market price of our common stock to fluctuate significantly, including overall market conditions or volatility, a shortfall in our operating results from those anticipated, negative financial results or other unfavorable information relating to our market peers or the other risks described in this Annual Report on Form 10-K.
22
Fluctuating foreign currency exchange rates may have a greater impact on our financial results as we expand into international markets.
For the year ended December 31, 2017, we derived $2.48 billion, or 26.2%, of our consolidated revenues from foreign operations, the substantial majority of which was earned in Canada, Australia and Latin America. The functional currencies for our foreign operations are typically the currency of the country in which the foreign operating unit is located. Accordingly, our financial performance is subject to fluctuation due to changes in foreign currency exchange rates relative to the U.S. dollar. As the U.S. dollar strengthens against foreign currencies, our translation of foreign currency denominated revenues or expenses will result in lower U.S. dollar denominated revenues and expenses. Conversely, if the U.S. dollar weakens against foreign currencies, the translation of these foreign currency denominated revenues or expenses will result in increased U.S. dollar denominated revenues and expenses. For example, during the year ended December 31, 2017, foreign revenues increased by approximately $53 million in comparison with the year ended December 31, 2016 as a result of more favorable foreign currency exchange rates due primarily to the U.S. dollar weakening against the Canadian and Australian dollars. Also, during the year ended December 31, 2016, foreign revenues decreased by approximately $41 million in comparison with the year ended December 31, 2015 as a result of less favorable foreign currency exchange rates due to the U.S. dollar strengthening against the Canadian and Australian dollars.
We intend to expand the volume of services that we provide internationally. As a result, our reported financial condition, results of operations and cash flows may be further exposed to the effects that fluctuating exchange rates have on the process of translating the financial statements of our international operations and the remeasurement of transactions which are not denominated in the reporting units’ functional currencies.
Our variable rate indebtedness subjects us to interest rate risk, which could cause our debt service obligations to increase significantly.
Borrowings under our credit facility are at variable rates of interest and expose us to interest rate risk. If interest rates increase, our debt service obligations on the variable rate indebtedness will increase even though the amount borrowed remains the same, and our net income and cash flows, including cash available for servicing our indebtedness, will correspondingly decrease. Our weighted average interest rate on our variable rate debt for the year ended December 31, 2017 was 2.7%. The annual effect on our pretax earnings of a hypothetical 50 basis point increase or decrease in variable interest rates would be approximately $3.3 million based on our December 31, 2017 balance of variable rate debt.
We may be unable to compete for or work on certain projects if we are not able to obtain surety bonds, letters of credit or bank guarantees.
A portion of our business depends on our ability to provide surety bonds, letters of credit, bank guarantees or other financial assurances. Current or future market conditions, including losses incurred in the construction industry or as a result of large corporate bankruptcies, as well as changes in our sureties’ assessment of our operating and financial risk, could cause our surety providers and lenders to decline to issue or renew, or substantially reduce the amount of, bid or performance bonds for our work and could increase our costs associated with collateral. These actions could be taken on short notice. If our surety providers or lenders were to limit or eliminate our access to bonding, letters of credit or guarantees, our alternatives would include seeking capacity from other sureties and lenders or finding more business that does not require bonds or that allows for other forms of collateral for project performance, such as cash. We may be unable to secure these alternatives in a timely manner, on acceptable terms, or at all, which could affect our ability to bid for or work on future projects requiring financial assurances.
We have also granted security interests in certain assets to collateralize our obligations to our sureties and lenders. Furthermore, under standard terms in the surety market, sureties issue or continue bonds on a project-by-project basis and can decline to issue bonds at any time or require the posting of additional collateral as a condition to issuing or renewing bonds. If we were to experience an interruption or reduction in the availability of bonding capacity as a result of these or other reasons, we may be unable to compete for or work on certain projects that require bonding.
Our failure to comply with environmental laws could result in significant liabilities.
Our operations are subject to various environmental laws and regulations, including those dealing with the handling and disposal of waste products, PCBs, fuel storage and air quality. We perform work in many different types of underground environments. If the field location maps supplied to us are not accurate, or if objects are present in the soil that are not indicated on the field location maps, our underground work could strike objects in the soil, some of which may contain pollutants. These objects may also rupture, resulting in the discharge of pollutants. In such circumstances, we may be liable for fines and damages, and we may be unable to obtain reimbursement from the parties providing the incorrect information. We perform work in and around environmentally sensitive areas such as rivers, lakes and wetlands. In addition, we perform directional drilling operations below certain environmentally sensitive terrains and water bodies. Due to the inconsistent nature of the terrain and water bodies, it is possible that such directional drilling may cause a surface fracture, resulting in the release of subsurface materials. These
23
subsurface materials may contain contaminants in excess of amounts permitted by law, potentially exposing us to remediation costs and fines. We also own and lease several facilities at which we store our equipment. Some of these facilities contain fuel storage tanks that are above or below ground. If these tanks were to leak, we could be responsible for the cost of remediation as well as potential fines.
In addition, new laws and regulations, stricter enforcement of existing laws and regulations, the discovery of previously unknown contamination or leaks, or the imposition of new clean-up requirements could require us to incur significant costs or become the basis for new or increased liabilities that could negatively impact our business, financial condition, results of operations and cash flows. In certain instances, we have obtained indemnification or covenants from third parties (including predecessors or lessors) for such clean-up and other obligations and liabilities. However, such third-party indemnities or covenants may not cover all of our costs and the indemnitors may not pay amounts owed to us, and such unanticipated obligations or liabilities, or future obligations and liabilities, may have a material adverse effect on our business, financial condition, results of operations and cash flows. Further, we cannot be certain that we will be able to identify or be indemnified for all potential environmental liabilities relating to any acquired business.
There are also other legislative and regulatory proposals to address greenhouse gas emissions. These proposals, if enacted, could result in potential new regulations, additional charges to fund energy efficiency activities, or other regulatory actions. Any of these actions could result in increased costs associated with our operations and impact the prices we charge our customers. For example, if new regulations are adopted regulating greenhouse gas emissions from mobile sources such as cars and trucks, we could experience a significant increase in environmental compliance costs in light of our large rolling-stock fleet. In addition, if our operations are perceived to result in high greenhouse gas emissions, our reputation could suffer.
Certain regulatory requirements applicable to us and our subsidiaries may result in significant compliance costs and liabilities.
We are subject to various regulatory regimes and requirements that could result in significant compliance costs and liabilities. As a public company, we are subject to the corporate governance and financial reporting requirements of The Sarbanes-Oxley Act of 2002, including requirements for management to report on our internal controls over financial reporting and for our independent registered public accounting firm to express an opinion on the operating effectiveness of our internal control over financial reporting. As of December 31, 2017, our internal control over financial reporting was effective; however, there can be no assurance that our internal control over financial reporting will be effective in future years. Failure to maintain effective internal controls or to identify significant internal control deficiencies in acquired businesses (both prior acquisitions and future acquisitions) could result in a decrease in the market value of our publicly traded securities, a reduced ability to obtain debt and equity financing, a loss of customers, or penalties and additional expenditures to meet the requirements.
One of our subsidiaries has registered as an investment adviser with the SEC under the U.S. Investment Advisers Act of 1940, as amended (the Advisers Act). The Advisers Act and the rules promulgated thereunder impose substantive and material restrictions and requirements on the operations of this subsidiary, including certain fiduciary duties that apply to its relationships with its advisory clients. The SEC has broad administrative powers to institute proceedings and impose sanctions for violations of the Advisers Act, ranging from fines and censures to termination of an adviser’s registration. This subsidiary is also subject to periodic SEC examinations and other requirements, including, among other things, maintaining an effective compliance program, recordkeeping and reporting requirements, disclosure requirements and complying with anti-fraud prohibitions. The failure of our subsidiary to comply with the requirements of the Advisers Act could result in fines, suspensions of individual employees or other sanctions against our subsidiary that could have a material adverse effect on us. Even if an investigation or proceeding does not result in a fine or sanction or if a fine or sanction imposed against our subsidiary or its employees were small in monetary amount, the adverse publicity relating to an investigation, proceeding or imposition of these fines or sanctions could harm our reputation and have a material adverse effect on us.
Our wholly-owned captive insurance company is a registered insurance broker with the Texas Department of Insurance, and therefore is subject to various rules and regulations and required to meet certain capital requirements, which can result in additional use of our resources.
We own and operate a postsecondary educational institution that provides pre-apprenticeship training as well as programs for experienced lineman. In order to operate, each of the institution’s campuses must be authorized by the state education agency where the campus is located, and the level of regulatory oversight varies substantially by state and can be extensive. If any of our campuses fail to comply with state licensing requirements, they may be unable to offer their programs and forced to close, which could result in harm to our reputation or negatively impact our ability to train skilled personnel that can be utilized to support our industry. Additionally, because our institution operates in a highly regulated industry, it is subject to compliance reviews and lawsuits or claims by government agencies and third parties. If the results of these reviews or proceedings are unfavorable to us,
24
we may be required to pay significant monetary damages or be subject to fines, limitations on the operations of the institution, injunctions or other penalties. The postsecondary educational institution is also accredited by the Accrediting Commission of Career Schools and Colleges. Accreditation is a non-governmental process through which a commission examines the academic quality of the instructional programs and is generally viewed as confirmation that the programs meet generally accepted academic standards and practices. If an institution fails to comply with accrediting commission requirements, the institution and/or its campuses are subject to loss of accreditation or may be placed on probation or a special monitoring or reporting status, which could ultimately result in loss of accreditation. Campus closure or loss of accreditation could result in reputational harm or student-initiated litigation or negatively impact our ability to train skilled personnel that can be utilized to support our business.
If we are unable to enforce our intellectual property rights or if our intellectual property rights become obsolete, our competitive position could be adversely impacted.
We utilize a variety of intellectual property rights while performing our services. We view our portfolio of proprietary energized services tools and techniques and other process and design technologies as our competitive strengths, which we believe differentiate our service offerings. We may not be able to successfully preserve these intellectual property rights in the future, and these rights could be invalidated, circumvented or challenged. In addition, the laws of some foreign countries in which our services may be sold do not protect intellectual property rights to the same extent as the laws of the United States. If we are unable to protect and maintain our intellectual property rights, or if intellectual property challenges or infringement proceedings succeed against us, our ability to differentiate our service offerings could be reduced. Further, if our intellectual property rights or work processes become obsolete, we may not be able to differentiate our service offerings and some of our competitors may be able to offer more attractive services to our customers, which could materially and adversely affect our business, financial condition, results of operations and cash flows. We may also license certain technologies from third parties, and there is a risk that our relationships with such licensors may terminate or expire or may be interrupted or harmed.
We may incur additional healthcare costs arising from federal healthcare reform legislation.
In March 2010, the Patient Protection and Affordable Care Act and the Health Care and Education Reconciliation Act of 2010 (collectively ACA) were signed into law in the United States. The status of the ACA and any repeal or replacement thereof, is currently uncertain. Changes to laws governing health insurance could have a substantial impact on our financial results. We continue to monitor developments under ACA, including any potential repeal or replacement thereof, and assess the extent to which any such change could result in long-term material cost increases for us.
Opportunities within the government arena could subject us to increased governmental regulation and costs.
Most government contracts are awarded through a regulated competitive bidding process, which can often be more time consuming than the bidding process for non-governmental projects. Additionally, involvement with government contracts could require a significant amount of costs to be incurred before any revenues are realized. As a government contractor, we are also subject to a number of procurement rules and other public sector regulations, any deemed violation of which could lead to fines or penalties or a loss of business. Government agencies routinely audit and investigate government contractors. Government agencies may review a contractor’s performance under its contracts, cost structure and compliance with applicable laws, regulations and standards. If a government agency determines that costs were improperly allocated to specific contracts, such costs will not be reimbursed or a refund of previously reimbursed costs may be required. If a government agency alleges or proves improper activity, civil and criminal penalties could be imposed and serious reputational harm could result. Many government contracts must be appropriated each year. If appropriations are not made in subsequent years, we would not realize all of the potential revenues from any awarded contracts.
Our sale or issuance of additional common stock or other equity-related securities could dilute each stockholder’s ownership interest or adversely affect the market price of our common stock.
We grow our business organically as well as through acquisitions. We often fund a significant portion of the consideration paid in connection with our acquisitions with the issuance of additional equity securities, including shares of our common stock and securities that are convertible into shares of our common stock.
We may issue additional equity securities in the future, including in connection with future acquisitions or other issuances of our common stock or convertible securities or otherwise. Our Restated Certificate of Incorporation provides that we may issue up to 600,000,000 shares of common stock, of which 153,342,326 shares were outstanding as of December 31, 2017. Additionally, former owners of certain acquired businesses own exchangeable shares, 486,112 of which were outstanding as of December 31, 2017 and included in the calculation of basic and diluted weighted average shares outstanding. These shares are exchangeable for shares of Quanta common stock on a one-for-one basis. Any additional issuances of common stock or exchangeable shares could have the effect of diluting our earnings per share and our existing stockholders’ individual ownership percentages and could lead
25
to volatility in the market price of our common stock. We cannot predict the effect that future issuances of our common stock or other equity-related securities would have on the market price of our common stock.
Certain provisions of our corporate governing documents could make an acquisition of our company more difficult.
The following provisions of our charter documents, as currently in effect, and Delaware law could discourage potential proposals to acquire us, delay or prevent a change in control of us or limit the price that investors may be willing to pay in the future for shares of our common stock:
• | our certificate of incorporation permits our board of directors to issue “blank check” preferred stock and to adopt amendments to our bylaws; |
• | our bylaws contain restrictions regarding the right of stockholders to nominate directors and to submit proposals to be considered at stockholder meetings; |
• | our certificate of incorporation and bylaws restrict the right of stockholders to call a special meeting of stockholders and to act by written consent; and |
• | we are subject to provisions of Delaware law which restrict us from engaging in any of a broad range of business transactions with an “interested stockholder” for a period of three years following the date such stockholder became classified as an interested stockholder. |
ITEM 1B. | Unresolved Staff Comments |
None.
ITEM 2. | Properties |
Facilities
We lease our corporate headquarters in Houston, Texas and own and lease other facilities throughout North America and in various foreign locations where we conduct business. Our facilities are used for offices, equipment yards, warehouses, storage and vehicle shops. As of December 31, 2017, we owned 55 of our facilities and leased the remainder. We believe that our existing facilities are sufficient for our current needs.
Equipment
We operate a fleet of owned and leased trucks and trailers, support vehicles and specialty construction equipment, such as backhoes, excavators, trenchers, generators, boring machines, cranes, robotic arms, wire pullers, tensioners, marine vessels and helicopters. Our owned equipment and the leasehold interests in our leased equipment are encumbered by a security interest granted under our credit agreement. As of December 31, 2017, the total size of the rolling-stock fleet was approximately 40,000 units. Most of our fleet is serviced by our own mechanics who work at various maintenance sites and facilities. We believe that our equipment is generally well maintained and adequate for our present operations.
ITEM 3. | Legal Proceedings |
We are from time to time party to various lawsuits, claims and other legal proceedings that arise in the ordinary course of business. These actions typically seek, among other things, compensation for alleged personal injury, breach of contract and/or property damages, employment-related damages, punitive damages, civil penalties or other losses, or injunctive or declaratory relief. With respect to all such lawsuits, claims and proceedings, we record a reserve when it is probable that a loss has been incurred and the amount of loss can be reasonably estimated. In addition, we disclose matters for which management believes a material loss is at least reasonably possible. See Legal Proceedings and Collective Bargaining Agreements in Note 15 of the Notes to Consolidated Financial Statements in Item 8. Financial Statements and Supplementary Data, which are incorporated by reference in this Item 3, for additional information regarding litigation, claims and other legal proceedings.
ITEM 4. | Mine Safety Disclosures |
Not applicable.
26
PART II
ITEM 5. | Market for Registrant’s Common Equity, Related Stockholder Matters and Issuer Purchases of Equity Securities |
Our common stock is listed on the New York Stock Exchange (NYSE) under the symbol “PWR.” The following table sets forth the high and low closing prices of our common stock per quarter, as reported by the NYSE, for the two most recent fiscal years.
High | Low | |||||||
Year Ended December 31, 2017 | ||||||||
4th Quarter | $ | 39.50 | $ | 35.35 | ||||
3rd Quarter | $ | 37.59 | $ | 32.67 | ||||
2nd Quarter | $ | 36.48 | $ | 30.66 | ||||
1st Quarter | $ | 38.47 | $ | 34.14 | ||||
Year Ended December 31, 2016 | ||||||||
4th Quarter | $ | 36.85 | $ | 27.29 | ||||
3rd Quarter | $ | 28.14 | $ | 22.58 | ||||
2nd Quarter | $ | 24.47 | $ | 21.60 | ||||
1st Quarter | $ | 22.87 | $ | 16.77 | ||||
On February 21, 2018, there were 670 holders of record of our common stock, four holders of record of exchangeable shares of Canadian subsidiaries of Quanta, and one holder of record of our Series G preferred stock. There is no established trading market for the exchangeable shares or the Series G preferred stock; however, the exchangeable shares may be exchanged at the option of the holder for Quanta common stock on a one-for-one basis. See Note 11 of the Notes to Consolidated Financial Statements in Item 8. Financial Statements and Supplementary Data for additional discussion of our equity securities.
Unregistered Sales of Securities During the Fourth Quarter of 2017
None. However, subsequent to the end of the fourth quarter of 2017, on January 19, 2018 and January 22, 2018, we completed acquisitions in which a portion of the consideration for each acquisition consisted of the unregistered issuance of shares of our common stock. The aggregate consideration paid at closing in these acquisitions included 379,817 shares of our common stock valued at approximately $13.6 million as of the acquisition dates. For additional information about these acquisitions, including additional consideration, see Note 19 of the Notes to Consolidated Financial Statements in Item 8. Financial Statements and Supplementary Data. The shares of common stock issued in these acquisitions were issued in reliance upon the exemption from registration provided by Section 4(a)(2) of the Securities Act of 1933, as amended, as the shares were issued to the owners of businesses acquired in privately negotiated transactions not involving any public offering or solicitation.
27
Issuer Purchases of Equity Securities During the Fourth Quarter of 2017
The following table contains information about our purchases of equity securities during the three months ended December 31, 2017.
Period | Total Number of Shares Purchased | Average Price Paid per Share | Total Number of Shares Purchased as Part of Publicly Announced Plans or Programs | Maximum Number (or Approximate Dollar Value) of Shares That May Yet be Purchased Under the Plans or Programs(2) | |||||||||
October 1 - 31, 2017 | |||||||||||||
Tax Withholdings (1) | 9,252 | $37.42 | — | ||||||||||
November 1 - 30, 2017 | |||||||||||||
Open Market Stock Repurchases (2017 Repurchase Program) (2) | 1,382,292 | $36.17 | 1,382,292 | $ | 250,000,000 | ||||||||
Tax Withholdings (1) | 1,692 | $36.16 | — | ||||||||||
December 1 - 31, 2017 | — | — | — | ||||||||||
Total | 1,393,236 | 1,382,292 | $ | 250,000,000 | |||||||||
_______________
(1) | Includes shares purchased from employees to satisfy tax withholding obligations in connection with the vesting of restricted stock unit awards and performance unit awards or the settlement of previously vested but deferred restricted stock unit awards. | |
(2) | On May 25, 2017, we issued a press release announcing that our board of directors approved a stock repurchase program that authorizes us to purchase, from time to time through June 30, 2020, up to $300.0 million of our outstanding common stock. Repurchases under this program can be made in open market and privately negotiated transactions, at our discretion, based on market and business conditions, applicable contractual and legal requirements and other factors. This program does not obligate us to acquire any specific amount of common stock and may be modified or terminated by our board of directors at any time at its sole discretion and without notice. As of December 31, 2017, we had repurchased 1.4 million shares of our common stock under this program at a cost of $50.0 million. Accordingly, $250.0 million remained available under the program. | |
Dividends
We did not declare any cash dividends on our common stock during the years ended December 31, 2017 or 2016, or in any previous periods. We currently intend to retain our future earnings, if any, to finance the growth, development and expansion of our business. Accordingly, we currently do not intend to declare or pay any cash dividends on our common stock in the immediate future. The declaration, payment and amount of future cash dividends, if any, will be at the discretion of our board of directors after taking into account various factors, including our financial condition, results of operations, cash flows from operations, current and anticipated capital requirements and expansion plans, the income tax laws then in effect and the requirements of Delaware law. In addition, as discussed in Liquidity and Capital Resources - Debt Instruments — Credit Facility in Item 7. Management’s Discussion and Analysis of Financial Condition and Results of Operations, our credit agreement restricts the payment of cash dividends unless certain conditions are met.
Performance Graph
The following Performance Graph and related information shall not be deemed “soliciting material” or to be “filed” with the Securities and Exchange Commission, nor shall such information be incorporated by reference into any future filing under the Securities Act of 1933 or Securities Exchange Act of 1934, each as amended, except to the extent that we specifically incorporate it by reference into such filing.
The following graph compares, for the period from December 31, 2012 to December 31, 2017, the cumulative stockholder return on our common stock with the cumulative total return of the Standard & Poor’s 500 Index (the S&P 500 Index) and a peer group selected by our management that includes public companies within our industries. The companies in the peer group were selected to represent a broad group of publicly held corporations with operations similar to ours. The peer group (the Peer Group) includes AECOM, Chicago Bridge & Iron Company N.V., EMCOR Group Inc., Fluor Corporation, Jacobs Engineering Group Inc., KBR, Inc., MasTec, Inc., MYR Group Inc. and Primoris Services Corporation.
28
The graph below assumes an investment of $100 (with reinvestment of all dividends) in our common stock, the Peer Group and the S&P 500 Index on December 31, 2012 and tracks their relative performance through December 31, 2017. The returns of each company in the Peer Group are weighted based on the market capitalization of that company at the beginning of the measurement period. The stock price performance reflected in the following graph is not necessarily indicative of future stock price performance.
COMPARISON OF 5 YEAR CUMULATIVE TOTAL RETURN
Among Quanta Services, Inc., the S&P 500 Index and the Peer Group
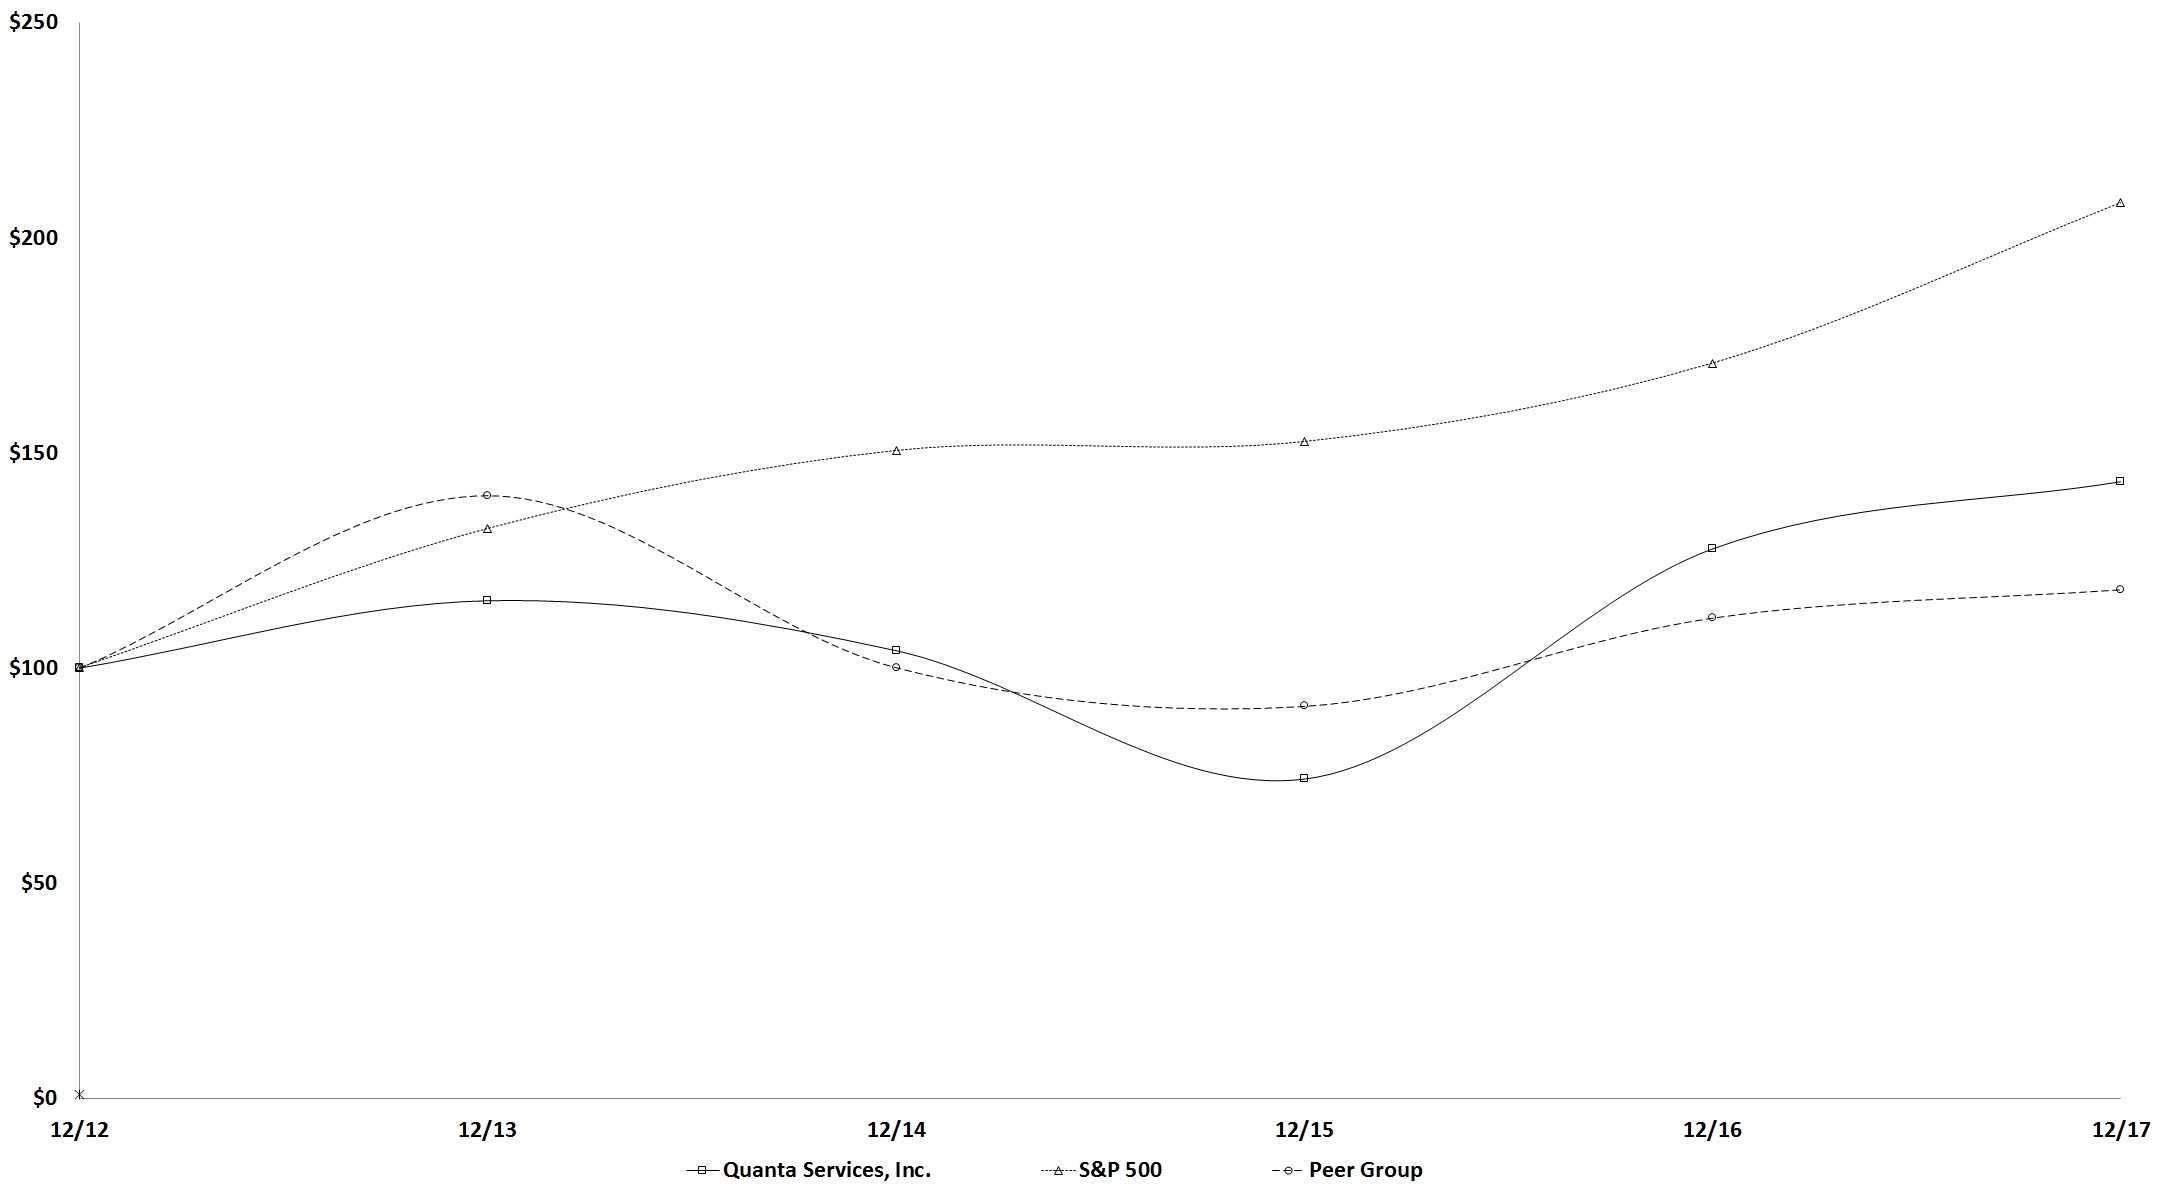
12/12 | 12/13 | 12/14 | 12/15 | 12/16 | 12/17 | |||||||||||||||||||
Quanta Services, Inc. | $ | 100.00 | $ | 115.65 | $ | 104.03 | $ | 74.20 | $ | 127.70 | $ | 143.31 | ||||||||||||
Peer Group | $ | 100.00 | $ | 140.12 | $ | 100.17 | $ | 91.17 | $ | 111.67 | $ | 118.25 | ||||||||||||
S&P 500 | $ | 100.00 | $ | 132.39 | $ | 150.51 | $ | 152.59 | $ | 170.84 | $ | 208.14 | ||||||||||||
29
ITEM 6. | Selected Financial Data |
The following historical selected financial data has been derived from our consolidated financial statements. See Note 5 of the Notes to Consolidated Financial Statements in Item 8. Financial Statements and Supplementary Data for information regarding certain acquisitions and the related impact on our results of operations as these acquisitions may affect the comparability of such results. Additionally, on August 4, 2015, we sold our fiber optic licensing operations. We have presented the results of operations, financial position and cash flows of such fiber optic licensing subsidiaries as discontinued operations for all applicable periods presented in this Annual Report on Form 10-K. The historical selected financial data should be read in conjunction with our Consolidated Financial Statements and related notes thereto included in Item 8. Financial Statements and Supplementary Data and Item 7. Management’s Discussion and Analysis of Financial Condition and Results of Operations.
Year Ended December 31, | |||||||||||||||||||||
2017 | 2016 | 2015 | 2014 | 2013 | |||||||||||||||||
(In thousands, except per share information) | |||||||||||||||||||||
Consolidated Statements of Operations Data: | |||||||||||||||||||||
Revenues | $ | 9,466,478 | $ | 7,651,319 | $ | 7,572,436 | $ | 7,747,229 | $ | 6,411,577 | |||||||||||
Cost of services (including depreciation) | 8,224,618 | 6,637,519 | 6,648,771 | 6,578,435 | 5,424,644 | ||||||||||||||||
Gross profit | 1,241,860 | 1,013,800 | 923,665 | 1,168,794 | 986,933 | ||||||||||||||||
Selling, general and administrative expenses | 777,920 | 653,338 | 592,863 | 705,477 | (c) | 485,069 | |||||||||||||||
Amortization of intangible assets | 32,205 | 31,685 | 34,848 | 34,257 | 25,865 | ||||||||||||||||
Asset impairment charges (a) | 58,057 | 7,964 | 58,451 | — | — | ||||||||||||||||
Change in fair value of contingent consideration liabilities | (5,171 | ) | — | — | — | — | |||||||||||||||
Operating income | 378,849 | 320,813 | 237,503 | 429,060 | 475,999 | ||||||||||||||||
Interest expense | (20,946 | ) | (14,887 | ) | (8,024 | ) | (4,765 | ) | (2,668 | ) | |||||||||||
Interest income | 832 | 2,423 | 1,493 | 3,736 | 3,378 | ||||||||||||||||
Other income (expense), net | (4,978 | ) | (663 | ) | (2,297 | ) | (1,432 | ) | 111,611 | (d) | |||||||||||
Income from continuing operations before income taxes | 353,757 | 307,686 | 228,675 | 426,599 | 588,320 | ||||||||||||||||
Provision for income taxes (b) | 35,532 | 107,246 | 97,472 | 139,007 | 196,875 | ||||||||||||||||
Net income from continuing operations | 318,225 | 200,440 | 131,203 | 287,592 | 391,445 | ||||||||||||||||
Net income (loss) from discontinued operations | — | (342 | ) | 190,621 | 27,490 | 29,864 | |||||||||||||||
Net income | 318,225 | 200,098 | 321,824 | 315,082 | 421,309 | ||||||||||||||||
Less: Net income attributable to non-controlling interests | 3,247 | 1,715 | 10,917 | 18,368 | 19,388 | ||||||||||||||||
Net income attributable to common stock | $ | 314,978 | $ | 198,383 | $ | 310,907 | $ | 296,714 | $ | 401,921 | |||||||||||
Amounts attributable to common stock: | |||||||||||||||||||||
Net income from continuing operations | $ | 314,978 | $ | 198,725 | $ | 120,286 | $ | 269,224 | $ | 372,057 | |||||||||||
Net income (loss) from discontinued operations | — | (342 | ) | 190,621 | 27,490 | 29,864 | |||||||||||||||
Net income attributable to common stock | $ | 314,978 | $ | 198,383 | $ | 310,907 | $ | 296,714 | $ | 401,921 | |||||||||||
Basic earnings per share attributable to common stock from continuing operations | $ | 2.02 | $ | 1.26 | $ | 0.62 | $ | 1.22 | $ | 1.73 | |||||||||||
Diluted earnings per share attributable to common stock from continuing operations | $ | 2.00 | $ | 1.26 | $ | 0.62 | $ | 1.22 | $ | 1.73 | |||||||||||
_______________________________________
(a) | In 2017, 2016 and 2015, we recorded asset impairment charges of $58.1 million ($36.6 million net of tax), $8.0 million ($7.1 million net of tax) and $58.5 million ($44.6 million net of tax). The charges recorded in 2017 related to goodwill and intangible assets, including a $57.0 million goodwill impairment and a $1.1 million impairment of a customer relationship intangible asset. The goodwill impairment is associated with two reporting units within our Oil and Gas Infrastructure Services Division. The charges recorded in 2016 primarily related to a pending disposition of certain international renewable energy services operations, which was completed in 2017. The charges recorded in 2015 related to goodwill, intangible assets and property and equipment, including a $39.8 million goodwill impairment and a $12.1 million impairment to customer relationship, trade name and non-compete agreement intangible assets. For a discussion of these charges, refer to Results of Operations - Consolidated Results - Asset impairment charges included in Item 7. Management’s Discussion and Analysis of Financial Condition and Results of Operations. |
30
(b) | The low effective tax rate in 2017 was primarily due to $70.1 million of tax benefits related to the enactment of the Tax Cuts and Jobs Act (Tax Act) on December 22, 2017. For more information and the status of our provisional analysis of the Tax Act, refer to Note 10 of the Notes to Consolidated Financial Statements in Item 8. Financial Statements and Supplementary Data. For more information on other items that impacted the effective tax rates in 2017, 2016 and 2015, refer to Results of Operations - Consolidated Results - Provision for income taxes included in Item 7. Management’s Discussion and Analysis of Financial Condition and Results of Operations. The effective tax rates in 2014 and 2013 were impacted by $8.1 million and $9.9 million in tax benefits primarily due to decreases in reserves for uncertain tax positions resulting from the expiration of federal and state statute of limitations periods. |
(c) | In 2014, selling, general and administrative expenses included a $102.5 million charge to provision for long-term contract receivable associated with an electric power infrastructure services project and a $38.8 million expense resulting from an arbitration decision associated with a contract dispute on a directional drilling project. |
(d) | In 2013, we recorded a pre-tax gain of approximately $112.7 million from the sale of all of our equity ownership interest in Howard Midstream Energy Partners, LLC. |
December 31, | ||||||||||||||||||||
2017 | 2016 | 2015 | 2014 | 2013 | ||||||||||||||||
(In thousands) | ||||||||||||||||||||
Balance Sheet Data: | ||||||||||||||||||||
Working capital | $ | 1,377,840 | $ | 1,083,517 | $ | 1,073,775 | $ | 1,389,393 | $ | 1,226,012 | ||||||||||
Goodwill | $ | 1,868,600 | $ | 1,603,169 | $ | 1,552,658 | $ | 1,596,695 | $ | 1,445,927 | ||||||||||
Total assets | $ | 6,480,154 | $ | 5,354,059 | $ | 5,213,543 | $ | 6,253,583 | $ | 5,731,982 | ||||||||||
Long-term debt, net of current maturities | $ | 670,721 | $ | 353,562 | $ | 475,364 | $ | 72,489 | $ | 1,053 | ||||||||||
Total stockholders’ equity | $ | 3,791,571 | $ | 3,339,427 | $ | 3,085,494 | $ | 4,514,473 | $ | 4,234,188 | ||||||||||
31
ITEM 7. | Management’s Discussion and Analysis of Financial Condition and Results of Operations |
The following discussion and analysis of our financial condition and results of operations should be read in conjunction with our historical consolidated financial statements and related notes included elsewhere in Item 8. Financial Statements and Supplementary Data. The discussion below contains forward-looking statements that are based upon our current expectations and are subject to uncertainty and changes in circumstances. Actual results may differ materially from these expectations due to inaccurate assumptions and known or unknown risks and uncertainties, including those identified in Uncertainty of Forward-Looking Statements and Information below and Item 1A. Risk Factors.
Introduction
We are a leading provider of specialty contracting services, offering infrastructure solutions primarily to the electric power, oil and gas and communications industries in the United States, Canada, Australia, Latin America and select other international markets. The services we provide include the design, installation, upgrade, repair and maintenance of infrastructure within each of the industries we serve, such as electric power transmission and distribution networks, substation facilities, renewable energy facilities, and pipeline transmission and distribution systems and facilities.
We report our results under two reportable segments: (1) Electric Power Infrastructure Services and (2) Oil and Gas Infrastructure Services. This structure is generally focused on broad end-user markets for our services. Our consolidated revenues for the year ended December 31, 2017 were $9.47 billion, of which 59% was attributable to the Electric Power Infrastructure Services segment and 41% was attributable to the Oil and Gas Infrastructure Services segment.
The Electric Power Infrastructure Services segment provides comprehensive network solutions to customers in the electric power industry. Services performed by the Electric Power Infrastructure Services segment generally include the design, installation, upgrade, repair and maintenance of electric power transmission and distribution infrastructure and substation facilities along with other engineering and technical services. This segment also provides emergency restoration services, including the repair of infrastructure damaged by inclement weather, the energized installation, maintenance and upgrade of electric power infrastructure utilizing unique bare hand and hot stick methods and our proprietary robotic arm technologies, and the installation of “smart grid” technologies on electric power networks. In addition, this segment designs, installs and maintains renewable energy generation facilities, consisting of solar, wind and certain types of natural gas generation facilities, and related switchyards and transmission infrastructure. To a lesser extent, the segment also provides comprehensive communications infrastructure services to wireline, fiber and wireless carrier customers within the communications industry; services in connection with the construction of electric power generation facilities; the design, installation, maintenance and repair of commercial and industrial wiring; and the installation of traffic networks and cable and control systems for light rail lines.
The Oil and Gas Infrastructure Services segment provides comprehensive network solutions to customers involved in the development, transportation, storage and processing of natural gas, oil and other pipeline products. Services performed by the Oil and Gas Infrastructure Services segment generally include the design, installation, repair and maintenance of pipeline transmission and distribution systems, gathering systems, production systems, storage systems and compressor and pump stations, as well as related trenching, directional boring and mechanized welding services. In addition, this segment’s services include pipeline protection, integrity testing, rehabilitation and replacement, and fabrication of pipeline support systems and related structures and facilities. We also serve the offshore and inland water energy markets, primarily providing services to oil and gas exploration platforms, including mechanical installation (or “hook-ups”), electrical and instrumentation, pre-commissioning and commissioning, coatings, shallow water pipeline installation, fabrication and marine asset repair. To a lesser extent, this segment designs, installs and maintains fueling systems, as well as water and sewer infrastructure. Through a recent acquisition discussed below, we expanded our service offerings in this segment to include high-pressure and critical-path turnaround services to the downstream and midstream energy markets and enhanced our capabilities with respect to instrumentation and electrical services, piping, fabrication and storage tank services.
For internal management purposes, we are also organized into two internal divisions, namely, the Electric Power Infrastructure Services Division and the Oil and Gas Infrastructure Services Division. These internal divisions are closely aligned with the reportable segments and are based on the predominant type of work provided by the operating units within each division.
Reportable segment information, including revenues and operating income by type of work, is gathered from each operating unit for the purpose of evaluating segment performance in support of our market strategies. These classifications of our operating unit revenues by type of work for segment reporting purposes can at times require judgment on the part of management. Our operating units may perform joint projects for customers in multiple industries, deliver multiple types of services under a single customer contract or provide services across industries. For example, we perform joint trenching projects to install distribution lines for electric power and natural gas customers. Our integrated operations and common administrative support at each of our operating units requires that certain allocations be made to determine segment profitability, including allocations of shared and indirect costs, such as facility costs, indirect operating expenses including depreciation, and general and administrative costs.
32
Corporate costs, such as payroll and benefits, employee travel expenses, facility costs, professional fees, acquisition costs and amortization related to intangible assets are not allocated.
Our customers include many of the leading companies in the industries we serve. We have developed strong strategic alliances with numerous customers and strive to develop and maintain our status as a preferred service provider to our customers. We enter into various types of contracts, including unit price, hourly rate, cost-plus (or time and materials basis), and fixed price (or lump sum basis), the final terms and prices of which are frequently negotiated with the customer. Although the terms of our contracts vary considerably, most are made on either a unit price or fixed price basis in which we agree to a price per unit of work performed (unit price) or a fixed amount for the entire project (fixed price). We complete a substantial majority of our fixed price projects, other than certain large transmission projects, within one year, while we frequently provide maintenance and repair work under open-ended unit price or cost-plus master service agreements that are renewable periodically.
We recognize revenues on our unit price and cost-plus contracts as units are completed or services are performed. For our fixed price contracts, we record revenues as work on the contract progresses on a percentage-of-completion basis. Under this method, revenues are recognized based on the percentage of total costs incurred to date in proportion to total estimated costs to complete the contract. Fixed price contracts generally include retainage provisions under which a percentage of the contract price is withheld until the project is complete and has been accepted by our customer.
We also enter into strategic partnerships and investment arrangements with customers and infrastructure investors to provide fully integrated infrastructure services on certain projects, including planning and feasibility analysis, engineering, design, procurement, construction and operation and maintenance, as well as project financing and investment. These projects include public-private partnerships, private infrastructure projects and concessions, along with build, own, operate and transfer and build to suit arrangements. As part of this strategy, during the year ended December 31, 2017, we formed a partnership with select infrastructure investors that provides up to $1.0 billion of capital, including approximately $80.0 million from us, available to invest in certain of these infrastructure projects through August 2024.
Recent Investments, Acquisitions and Divestitures
Acquisitions
In January 2018, we acquired an electrical infrastructure services business specializing in substation construction and relay services and a postsecondary educational institution that provides pre-apprenticeship training and programs for experienced lineman, both of which are located in the United States. The aggregate consideration for these acquisitions was $47.9 million in cash, subject to certain adjustments, and 379,817 shares of Quanta common stock, which had a fair value of approximately $13.6 million at the acquisition dates. Additionally, the acquisition of the postsecondary educational institution includes the potential payment of up to approximately $15.0 million of contingent consideration, payable if the acquired business achieves certain financial and operational objectives over a five-year period. The results of the acquired businesses will generally be included in our Electric Power Infrastructure Services segment and consolidated financial statements beginning on the acquisition dates.
On July 20, 2017, we acquired Stronghold, Ltd. and Stronghold Specialty, Ltd. (collectively Stronghold), a specialized services business located in the United States that provides high-pressure and critical-path solutions to the downstream and midstream energy markets. The aggregate consideration included $351.0 million in cash, subject to certain adjustments, and 2,693,680 shares of Quanta common stock, which had a value of $81.3 million at the acquisition date. Additionally, the acquisition includes the potential payment of up to $100.0 million of contingent consideration, payable if the acquired business achieves certain financial targets over a three-year period. Based on the estimated fair value of this contingent consideration, we recorded a $51.1 million liability as of the acquisition date. The results of the acquired business have generally been included in our Oil and Gas Infrastructure Services segment and consolidated financial statements since the acquisition date.
During the year ended December 31, 2017, we also acquired a communications infrastructure services contractor and an electrical and communications contractor, both of which are located in the United States. The aggregate consideration for these acquisitions consisted of $11.9 million paid or payable in cash, subject to certain adjustments, and 288,666 shares of Quanta common stock, with a value of $8.3 million as of the respective acquisition dates. The results of the acquired businesses have generally been included in our Electric Power Infrastructure Services segment and consolidated financial statements since the acquisition dates.
During 2016, we completed five acquisitions. The results of four of the acquired businesses are generally included in our Electric Power Infrastructure Services segment. These businesses included an electrical infrastructure services business located in Australia, a utility contracting business located in Canada, a full service medium- and high-voltage powerline contracting business located in the United States and a communications services business located in Canada. We also acquired a pipeline services contractor located in the United States, the results of which are generally included in our Oil and Gas Infrastructure Services segment. The aggregate consideration for these acquisitions consisted of $75.9 million paid or payable in cash, subject to certain adjustments, 70,840 shares of Quanta common stock valued at $1.5 million as of the settlement date of the applicable
33
acquisition, and contingent consideration payments of up to $39.5 million, payable if financial targets are achieved by certain of the acquired businesses. Based on the estimated fair value of this contingent consideration, we recorded a total of $18.7 million in liabilities as of the applicable acquisition dates. The results of the acquired businesses have been included in our consolidated financial statements since the acquisition dates.
During 2015, we completed 11 acquisitions. The results of eight of the acquired businesses are generally included in our Electric Power Infrastructure Services segment. These businesses included a foundation services business located in the United States, an electrical contracting business located in the United States, an electrical engineering business located in Australia, a powerline construction business located in the United States, an engineering business located in Canada, an engineering, procurement and construction services business based in the United States, an underground construction contracting business located in Canada and a supplier and material procurement specialist for the power and utility industry in Canada. The results of the remaining three acquired businesses are generally included in our Oil and Gas Infrastructure Services segment. These businesses include a business that services above-ground storage tanks in the United States, an underground utility distribution contractor that provides services to gas and electric utilities in Canada, and a business that specializes in the engineering, procurement, construction, and commissioning of compression and surface facilities for the high pressure gas industry in Australia. The aggregate consideration for these acquisitions consisted of $110.6 million paid or payable in cash, subject to certain adjustments, 461,037 shares of Quanta common stock valued at $10.1 million as of the settlement dates of the applicable acquisitions, and contingent consideration payments with an estimated fair value of $1.0 million as of the applicable acquisition date. The results of the acquired businesses have been included in our consolidated financial statements since the acquisition dates.
Disposition
On April 29, 2015, we entered into a stock purchase agreement with Crown Castle International Corp. pursuant to which we agreed to sell our fiber optic licensing operations. The purchase agreement contained customary representations and warranties, covenants and indemnities. On August 4, 2015, we completed the sale for a purchase price of $1.00 billion in cash, resulting in after-tax net proceeds of $848.2 million. In the third quarter of 2015, we recognized a net of tax gain of $171.0 million. We have presented the results of operations, financial position, cash flows and disclosures of the fiber optic licensing operations as discontinued operations for all periods in our consolidated financial statements.
Seasonality; Fluctuations of Results; Economic Conditions
Our revenues and results of operations can be subject to seasonal and other variations. These variations are influenced by weather, customer spending patterns, bidding seasons, receipt of required regulatory approvals, permits and rights of way, project timing and schedules, and holidays. Typically, our revenues are lowest in the first quarter of the year because cold, snowy or wet conditions can cause delays on projects. In addition, many of our customers develop their annual capital budgets during the first quarter, and therefore do not begin infrastructure projects in a meaningful way until their capital budgets are finalized. Second quarter revenues are typically higher than those in the first quarter, as some projects begin, but continued cold and wet weather can often impact second quarter productivity. Third quarter revenues are typically the highest of the year, as a greater number of projects are underway, and weather is normally more accommodating. Generally, revenues during the fourth quarter of the year are lower than the third quarter but higher than the second quarter. Many projects are completed in the fourth quarter, and revenues are often impacted positively by customers seeking to spend their capital budgets before the end of the year. However, the holiday season and inclement weather can sometimes cause delays during the fourth quarter, reducing revenues and increasing costs. Productivity and operating activity in any quarter may be positively or negatively affected by atypical weather patterns in the areas we serve, such as severe weather, excessive rainfall or unusual winter weather. The timing of project awards and unanticipated changes in project schedules as a result of delays or accelerations can also create variations in the level of operating activity from quarter to quarter.
These seasonal impacts are typical for our U.S. operations, but as our foreign operations grow, this pattern may have a lesser impact on our quarterly revenues. For example, revenues in Canada are often higher in the first quarter because projects are often accelerated in order to complete work prior to the break up, or seasonal thaw, as productivity is adversely affected by wet ground conditions during the warmer spring and summer months. Also, although revenues from Australia and other international operations have not been significant relative to our overall revenues to date, their seasonal patterns may differ from those in North America and may impact our seasonality more in the future.
Additionally, our industry can be highly cyclical. Our volume of business may be adversely affected by declines or delays in new projects due to cyclicality, which may vary by geographic region. Project schedules, particularly in connection with larger, longer-term projects, can also create fluctuations in the amount of work performed in a given period. For example, in connection with larger and more complicated projects, the timing of obtaining permits and other approvals may be delayed, and we may need to maintain a portion of our workforce and equipment in an underutilized capacity to ensure we are strategically positioned to deliver on such projects when they move forward. Examples of other items that may cause our results or demand for our services
34
to fluctuate materially from quarter to quarter include: the financial condition of our customers and their access to capital; margins of projects performed during any particular period; economic, political and market conditions on a regional, national or global scale; our customers’ capital spending, including on larger pipeline and electrical infrastructure projects; oil, natural gas and natural gas liquids prices; the timing of and costs associated with acquisitions; changes in the fair value of acquisition-related contingent consideration liabilities; dispositions; equity in earnings (losses) of unconsolidated affiliates; impairments of goodwill, intangible assets, long-lived assets or investments; effective tax rates; and interest rates. Accordingly, our operating results in any particular period may not be indicative of the results that can be expected for any other period. Please read Outlook and Understanding Margins for additional discussion of trends and challenges that may affect our financial condition, results of operations and cash flows.
Understanding Margins
Our gross margin is gross profit expressed as a percentage of revenues, and our operating margin is operating income expressed as a percentage of revenues. Cost of services, which is subtracted from revenues to obtain gross profit, consists primarily of salaries, wages and benefits to employees, depreciation, fuel and other equipment expenses, equipment rentals, subcontracted services, insurance, facilities expenses, materials and parts and supplies. Selling, general and administrative expenses and amortization of intangible assets are then subtracted from gross profit to obtain operating income. Various factors, only some of which are within our control, can impact our margins on a quarterly or annual basis.
Seasonal and geographical. Seasonal weather patterns can have a significant impact on margins. Generally, business is slower in the winter months versus the warmer months of the year, resulting in lower productivity and consequently reducing our ability to cover fixed costs. This can be offset somewhat by increased demand for electrical service and repair work resulting from severe weather. Additionally, project schedules, including when projects begin and are completed, may impact margins. The mix of business conducted in the areas we serve will also affect margins, as some areas offer the opportunity for higher margins due to their geographic characteristics. For example, margins may be negatively impacted by operations in an urban setting as opposed to a less populated rural setting or over mountainous or other difficult terrain as opposed to open terrain. Site conditions, including unforeseen underground conditions, can also impact margins.
Weather. Adverse or favorable weather conditions can impact gross margins in a given period. For example, snowfall, rainfall or other severe weather may negatively impact our revenues and margins due to reduced productivity, as projects may be terminated, deferred or delayed until weather conditions improve or an affected area recovers from a severe weather event. Conversely, in periods when weather remains dry and temperatures are accommodating, more work can be done, sometimes at a lower cost. In some cases, severe weather, such as hurricanes and ice storms, can provide us with emergency restoration service work, which typically yields higher margins due in part to better equipment utilization rates and absorption of fixed costs.
Revenue mix. The mix of revenues derived from the industries we serve and the types of services we provide within an industry will impact margins, as certain industries and services provide higher margin opportunities. Additionally, changes in our customers’ spending patterns can cause an imbalance in supply and demand and, therefore, affect margins and mix of revenues.
Service and maintenance versus installation. Installation work is often performed on a fixed price basis, while maintenance work is often performed under pre-established or negotiated prices or cost-plus pricing arrangements. Margins for installation work may vary from project to project, and may be higher than maintenance work, as work obtained on a fixed price basis has higher risk than other types of pricing arrangements. We typically derive approximately 30% of our annual revenues from maintenance work, but a higher portion of installation work in any given period may affect our gross margins for that period.
Subcontract work. Work that is subcontracted to other service providers generally yields lower margins. An increase in subcontract work in a given period may contribute to a decrease in margins. We typically subcontract approximately 20% to 25% of our work to other service providers.
Materials versus labor. Typically, our customers are responsible for supplying their own materials on projects; however, for some of our contracts we may agree to procure all or part of the required materials. Margins may be lower on projects where we furnish a significant amount of materials, including projects where we provide engineering, procurement and construction (EPC) services, as our mark-up on materials is generally lower than our mark-up on labor costs. In a given period, an increase in the percentage of work with higher materials procurement requirements may decrease our overall margins.
Size, scope and complexity of projects. We may experience a decrease or fluctuations in margins when larger, more complex electric transmission and pipeline projects experience significant delays. Larger projects with higher voltage capacities, larger diameter throughput capacities, increased engineering, design or construction complexities, more difficult terrain requirements or longer distance requirements typically yield opportunities for higher margins as we assume a greater degree of performance risk and allow for a higher degree of utilization of our resources for longer construction timeframes. Conversely, smaller or less complex electric transmission and pipeline projects typically provide lower margin opportunities as there are a greater number of competitors capable of performing in this market, and competitors at times may more aggressively pursue available volumes of work to absorb
35
fixed costs. A greater mix of smaller scale or less complex electric transmission and pipeline work also could negatively impact margins due to the inefficiency of transitioning between a greater number of smaller projects versus continuous production on fewer larger projects. Our margins may be further impacted by delays in the timing of larger projects, extended bidding procedures for more complex EPC projects or temporary decreases in capital spending by our customers. Also, during these periods we may choose to maintain a portion of our workforce and equipment in an underutilized capacity to ensure we are strategically positioned to deliver on larger, more complicated electric transmission or pipeline projects when they move forward.
Depreciation. We include depreciation in cost of services, which is common practice in our industry. However, this can make comparability of our margins to those of other companies difficult and must be taken into consideration when comparing us to other companies.
Insurance. As discussed in Contractual Obligations - Insurance, we are insured for employer’s liability, workers’ compensation, auto liability and general liability claims. We also have employee health care benefit plans for most employees not subject to collective bargaining agreements. Margins could be impacted by fluctuations in insurance accruals as additional claims arise and as circumstances and conditions of existing claims change.
Project Variability and Performance. Margins for a single project may fluctuate quarter to quarter due to changes in the volume or type of work performed, the pricing structure under the project contract or job productivity. Productivity can be influenced by many factors, including where the work is performed (e.g., rural versus urban area or mountainous or rocky area versus open terrain), whether the work is on an open or encumbered right of way, inclement weather, environmental restrictions or regulatory delays, protests or other political activity on a project, or the performance of third parties on a project. These types of factors are not practicable to quantify through accounting data, but may individually or in the aggregate have a direct impact on the gross margin of a specific project.
Foreign currency risk. Our financial performance is reported on a U.S. dollar-denominated basis but is partially subject to fluctuations in foreign currency exchange rates. Fluctuations in exchange rates relative to the U.S. dollar, primarily the Canadian and Australian dollars, could cause material fluctuations in comparisons of our results of operations between periods.
Change in fair value of contingent consideration liabilities. We anticipate fluctuations in operating income margins as a result of changes in the fair value of contingent consideration liabilities. See Note 2 to the Notes to Consolidated Financial Statements in Item 8. Financial Statements and Supplementary Data for more information about the valuation methodologies and assumptions related to the determination of the fair value of our contingent consideration liabilities.
Selling, General and Administrative Expenses
Selling, general and administrative expenses consist primarily of compensation and related benefits to management, administrative salaries and benefits, marketing, office rent and utilities, communications, professional fees, bad debt expense, acquisition costs, gains and losses on the sale of property and equipment, letter of credit fees and maintenance, training and conversion costs related to information technology systems.
36
Results of Operations
As previously discussed, the results of acquired businesses have been included in the following results of operations beginning on their respective acquisition dates. Additionally, the results of operations for our fiber optic licensing operations, which were disposed of on August 4, 2015, have been reclassified from continuing operations to net income (loss) from discontinued operations for all periods presented. The following table sets forth selected statements of operations data and such data as a percentage of revenues for the years indicated (dollars in thousands):
Consolidated Results
Year Ended December 31, | |||||||||||||||||||||
2017 | 2016 | 2015 | |||||||||||||||||||
Revenues | $ | 9,466,478 | 100.0 | % | $ | 7,651,319 | 100.0 | % | $ | 7,572,436 | 100.0 | % | |||||||||
Cost of services (including depreciation) | 8,224,618 | 86.9 | 6,637,519 | 86.7 | 6,648,771 | 87.8 | |||||||||||||||
Gross profit | 1,241,860 | 13.1 | 1,013,800 | 13.3 | 923,665 | 12.2 | |||||||||||||||
Selling, general and administrative expenses | 777,920 | 8.2 | 653,338 | 8.5 | 592,863 | 7.8 | |||||||||||||||
Amortization of intangible assets | 32,205 | 0.4 | 31,685 | 0.5 | 34,848 | 0.5 | |||||||||||||||
Asset impairment charges | 58,057 | 0.6 | 7,964 | 0.1 | 58,451 | 0.8 | |||||||||||||||
Change in fair value of contingent consideration liabilities | (5,171 | ) | (0.1 | ) | — | — | — | — | |||||||||||||
Operating income | 378,849 | 4.0 | 320,813 | 4.2 | 237,503 | 3.1 | |||||||||||||||
Interest expense | (20,946 | ) | (0.4 | ) | (14,887 | ) | (0.2 | ) | (8,024 | ) | (0.1 | ) | |||||||||
Interest income | 832 | — | 2,423 | — | 1,493 | — | |||||||||||||||
Other income (expense), net | (4,978 | ) | 0.1 | (663 | ) | — | (2,297 | ) | — | ||||||||||||
Income from continuing operations before income taxes | 353,757 | 3.7 | 307,686 | 4.0 | 228,675 | 3.0 | |||||||||||||||
Provision for income taxes | 35,532 | 0.3 | 107,246 | 1.4 | 97,472 | 1.3 | |||||||||||||||
Net income from continuing operations | 318,225 | 3.4 | 200,440 | 2.6 | 131,203 | 1.7 | |||||||||||||||
Net income (loss) from discontinued operations | — | — | (342 | ) | — | 190,621 | 2.5 | ||||||||||||||
Net income | 318,225 | 3.4 | 200,098 | 2.6 | 321,824 | 4.2 | |||||||||||||||
Less: Net income attributable to non-controlling interests | 3,247 | 0.1 | 1,715 | — | 10,917 | 0.1 | |||||||||||||||
Net income attributable to common stock | $ | 314,978 | 3.3 | % | $ | 198,383 | 2.6 | % | $ | 310,907 | 4.1 | % | |||||||||
Amounts attributable to common stock: | |||||||||||||||||||||
Net income from continuing operations | $ | 314,978 | 3.3 | % | $ | 198,725 | 2.6 | % | $ | 120,286 | 1.6 | % | |||||||||
Net income (loss) from discontinued operations | — | — | (342 | ) | — | 190,621 | 2.5 | ||||||||||||||
Net income attributable to common stock | $ | 314,978 | 3.3 | % | $ | 198,383 | 2.6 | % | $ | 310,907 | 4.1 | % | |||||||||
2017 compared to 2016
Revenues. Revenues increased $1.82 billion, or 23.7%, to $9.47 billion for the year ended December 31, 2017. Contributing to the increase was a $1.07 billion increase in revenues from oil and gas infrastructure services and a $749.3 million increase in revenues from electric power infrastructure services. The increase in revenues from oil and gas infrastructure services was primarily the result of increased capital spending by our customers on midstream gas pipeline transmission projects. Also contributing to the increase in oil and gas infrastructure services revenues were approximately $190 million in revenues from the acquisition of Stronghold. The increase in revenues from electric power infrastructure services was primarily due to increased customer spending associated with electric transmission projects and $143.8 million in additional emergency restoration services revenues primarily from Hurricanes Harvey and Irma and winter storms in the United States and Canada. Also contributing to the increase in revenues from electric power infrastructure services was approximately $40 million in revenues from acquired companies. Additionally, foreign currency exchange rates favorably impacted our international operations by approximately $53 million during the year ended December 31, 2017. This favorable impact was primarily attributable to the relationship between the U.S. dollar and the Canadian and Australian dollars.
37
Gross profit. Gross profit increased $228.1 million, or 22.5%, to $1.24 billion for the year ended December 31, 2017. Gross profit as a percentage of revenues decreased slightly to 13.1% for the year ended December 31, 2017 from 13.3% for the year ended December 31, 2016. Gross profit and gross profit as a percentage of revenues for the year ended December 31, 2017 were positively impacted by greater contributions from emergency restoration services and midstream gas pipeline transmission projects, which typically yield higher margins. However, these increases were partially offset by the negative impact of work disruptions, deferrals, cancellations and employee support costs due to Hurricanes Harvey and Irma. Gross profit and gross profit as a percentage of revenues for the year ended December 31, 2016 were negatively impacted by $54.8 million of project losses related to a power plant project in Alaska, which was substantially completed in the fourth quarter of 2016.
Selling, general and administrative expenses. Selling, general and administrative expenses increased $124.6 million, or 19.1%, to $777.9 million for the year ended December 31, 2017. This increase was primarily attributable to $62.8 million in higher compensation costs, largely associated with higher incentive compensation based on current year levels of profitability, annual compensation increases and increased personnel to support business growth; $38.3 million of incremental selling, general and administrative expenses associated with acquired businesses, including acquisition and integration costs; and $6.9 million in higher attorneys’ fees and related expenses, $4.2 million of which was associated with a matter involving our prior disposition of certain communications operations that was resolved in the first quarter of 2017. During the year ended December 31, 2016, selling, general and administrative expenses included $6.3 million in severance costs associated with the departure of our former president and chief executive officer and severance and restructuring costs primarily associated with certain operations within the Oil and Gas Infrastructure Services segment. Selling, general and administrative expenses as a percentage of revenues decreased to 8.2% for the year ended December 31, 2017 from 8.5% for the year ended December 31, 2016, primarily due to the increase in revenues described above.
Amortization of intangible assets. Amortization of intangible assets increased $0.5 million to $32.2 million for the year ended December 31, 2017. This increase was primarily due to increased amortization of intangible assets associated with recently acquired companies, partially offset by reduced amortization expense from previously acquired intangible assets as certain of these assets became fully amortized.
Asset impairment charges. Asset impairment charges were $58.1 million for the year ended December 31, 2017 compared to $8.0 million for the year ended December 31, 2016. During the fourth quarter of 2017, we recorded a $57.0 million goodwill impairment and a $1.1 million impairment related to a customer relationship intangible asset. The extended low commodity price environment has significantly impacted certain reporting units within our Oil and Gas Infrastructure Services Division. Specifically, a reporting unit that provides material handling services experienced lower operating margins and is expected to continue to face a highly competitive environment in its select markets and a reporting unit that provides marine and offshore services experienced prolonged periods of reduced revenues and operating margins and is expected to continue to experience lower levels of activity in the U.S. Gulf of Mexico and other offshore markets. During the fourth quarter of 2016, we recorded an asset impairment of $8.0 million related to certain international renewable energy services operations as a result of a pending disposition of these operations, which was completed in 2017.
Change in fair value of contingent consideration liabilities. A $5.2 million decrease in fair value of contingent consideration liabilities was recognized as of December 31, 2017, which resulted in a corresponding increase in operating income during 2017, as compared to no change in fair value in the year ended December 31, 2016. The decrease in fair value was primarily due to changes in the timing and amounts of forecasted operating results of certain acquired businesses. It is anticipated that changes in fair value will be recorded periodically until the contingent consideration liabilities are settled. See Contractual Obligations - Contingent Consideration Liabilities for more information.
Interest expense. Interest expense increased $6.1 million to $20.9 million for the year ended December 31, 2017 as compared to the year ended December 31, 2016 due to increased borrowing activity, primarily related to the acquisition of Stronghold, as well as a higher weighted average interest rate.
Provision for income taxes. The provision for income taxes was $35.5 million for the year ended December 31, 2017, with an effective tax rate of 10.0%. The provision for income taxes was $107.2 million for the year ended December 31, 2016, with an effective tax rate of 34.9%. The lower effective tax rate for the year ended December 31, 2017 was primarily due to a provisional benefit of $70.1 million related to the enactment of the Tax Act on December 22, 2017, which among other things, lowers the U.S. federal corporate tax rate from 35% to 21% effective January 1, 2018, requires payment of a one-time transition tax on earnings of certain foreign subsidiaries, limits and eliminates certain tax deductions and creates new taxes on certain foreign-sourced earnings. The 2017 provision for income taxes was also favorably impacted by $26.7 million associated with entity restructuring and recapitalization efforts, a $7.2 million decrease in reserves for uncertain tax positions resulting from the expiration of statute of limitation periods, a higher proportion of income before taxes from international jurisdictions, which are generally taxed at lower statutory rates, and a discrete income tax benefit of $5.1 million associated with the adoption of an accounting update addressing share-based payments, which is discussed further in Note 3 of the Notes to Consolidated Financial Statements in Item 8. Financial Statements and Supplementary Data - Adoption of New Accounting Pronouncements. Partially offsetting these benefits
38
was an $8.5 million decrease of the production activity related tax benefit due to the acceleration of certain deductions in 2017. Additionally, the effective tax rate for the year ended December 31, 2016 was impacted by $20.5 million in tax benefits due to decreases in reserves for uncertain tax positions resulting from the expiration of federal and state statute of limitations periods. As described above, the Tax Act significantly revised the U.S. corporate tax regime and is anticipated to significantly reduce our future effective tax rate, which we expect to be approximately 29% for 2018. For additional information on the status of our provisional analysis of the Tax Act, refer to Note 10 of the Notes to Consolidated Financial Statements in Item 8. Financial Statements and Supplementary Data.
Other comprehensive income. Other comprehensive income, net of taxes, was a gain of $68.3 million in the year ended December 31, 2017 compared to a gain of $23.0 million in the year ended December 31, 2016. These gains were due to a strengthening of foreign currencies associated with our international operations, primarily the Canadian and Australian dollars, against the U.S. dollar as of December 31, 2017 when compared to December 31, 2016 and as of December 31, 2016 when compared to December 31, 2015.
2016 compared to 2015
Revenues. Revenues increased $78.9 million, or 1.0%, to $7.65 billion for the year ended December 31, 2016. Contributing to the increase was a $165.7 million increase in revenues from oil and gas infrastructure services, partially offset by an $86.8 million decrease in revenues from electric power infrastructure services. The increase in revenues from oil and gas infrastructure services primarily resulted from increased capital spending by our customers associated with larger projects, certain of which moved into full construction during the second half of 2016, after experiencing regulatory and permitting delays in the first half of 2016, as well as from increased customer spending for natural gas distribution services. Consolidated revenues were also favorably impacted by approximately $125 million due to revenues generated by acquired companies, primarily in the Electric Power Infrastructure Services segment. The decrease in revenues from electric power infrastructure services resulted from reduced customer spending associated with larger electric transmission projects as customers continued to face heightened regulatory and environmental requirements from state and federal agencies and more stringent permitting processes with various regional system operators. This regulatory environment negatively impacted the timing of existing projects and delayed the development of other infrastructure projects, which resulted in decreased demand for our services. In addition, revenues contributed by our international operations were negatively impacted by approximately $41 million due to less favorable average foreign currency translation rates in 2016 as compared to 2015, primarily attributable to the strengthening of the U.S. dollar against the Canadian dollar throughout 2016.
Gross profit. Gross profit increased $90.1 million, or 9.8%, to $1.01 billion for the year ended December 31, 2016. Gross profit as a percentage of revenues increased to 13.3% for the year ended December 31, 2016 from 12.2% for the year ended December 31, 2015. These increases were primarily due to better utilization of certain larger transmission project resources, mainly in the second half of 2016, as compared to the utilization of similar resources during 2015. Also contributing to these increases was improved performance of ongoing larger pipeline and electric power projects, as we experienced increased productivity compared to the year ended December 31, 2015 which was negatively impacted by heavy snowfall and other unfavorable weather conditions in certain areas of Canada and the northern United States. Also contributing to these increases was the contribution of profits from higher overall revenues during 2016. Gross profit and gross profit as a percentage of revenues were adversely impacted during 2016 by project losses of $54.8 million related to a power plant construction project in Alaska, which are discussed further in the results of operations for the Electric Power Infrastructure Services segment, as compared to project losses of $66.1 million during 2015 related to the same project and an electric transmission project in Canada completed in the third quarter of 2015.
Selling, general and administrative expenses. Selling, general and administrative expenses increased $60.5 million, or 10.2%, to $653.3 million for the year ended December 31, 2016. This increase was primarily attributable to $9.8 million in incremental costs associated with acquired companies, net of reduced acquisition costs; $8.9 million in higher salaries and benefits from annual compensation increases and increased personnel; $8.6 million in higher incentive compensation costs associated with levels of profitability; $7.1 million in higher costs associated with ongoing technology and business development initiatives. Also contributing to the increase were $6.3 million in severance costs associated with the departure of Quanta’s former president and chief executive officer and severance and restructuring costs primarily associated with certain operations within the Oil and Gas Infrastructure Services segment; $2.5 million in higher legal costs related to ongoing litigation, which included $6.9 million of litigation costs related to our disposition of certain telecommunication operations; and $2.3 million contributed to a university endowment. Selling, general and administrative expenses as a percentage of revenues increased to 8.5% for the year ended December 31, 2016 from 7.8% for the year ended December 31, 2015.
Amortization of intangible assets. Amortization of intangible assets decreased $3.2 million to $31.7 million for the year ended December 31, 2016. This decrease was primarily due to reduced amortization expense from previously acquired intangible assets as certain of these assets became fully amortized, partially offset by increased amortization of intangible assets associated with acquired companies.
39
Asset impairment charges. Asset impairment charges were $8.0 million for the year ended December 31, 2016 compared to $58.5 million for the year ended December 31, 2015. During the fourth quarter of 2015, we recorded an asset impairment of $6.6 million related to certain international renewable energy services operations. These assets were further impaired during the fourth quarter of 2016 as a result of a pending disposition of these operations, which was completed in 2017. Additionally, during the fourth quarter of 2015, we recorded a $39.8 million goodwill impairment and a $12.1 million impairment of other intangible assets related to certain operations within our Oil and Gas Infrastructure Services Division, which were primarily attributable to lower levels of expected activity in the U.S. Gulf of Mexico and, to a lesser extent, the extended low commodity price environment for certain directional drilling operations in Australia.
Interest expense. Interest expense increased $6.9 million to $14.9 million for the year ended December 31, 2016 primarily due to increased borrowing activity and a higher weighted average interest rate during the year ended December 31, 2016.
Provision for income taxes. The provision for income taxes was $107.2 million for the year ended December 31, 2016, with an effective tax rate of 34.9%. The provision for income taxes was $97.5 million for the year ended December 31, 2015, with an effective tax rate of 42.6%. The lower effective tax rate for the year ended December 31, 2016 was primarily due to $20.5 million in tax benefits due to decreases in reserves for uncertain tax positions resulting from the expiration of federal and state statute of limitations periods, partially offset by the impact of a lower proportion of income before taxes from international operations, which are generally taxed at lower statutory rates. The provision for income taxes for the year ended December 31, 2015 included $5.0 million related to an increase in the Alberta provincial statutory income tax rate, effective as of June 1, 2015 and requiring a remeasurement of certain cumulative deferred tax assets and liabilities, which was partially offset by the realization of $4.2 million in tax benefits associated with the realization of a previously unrecognized deferred tax asset related to our investment in a foreign operating subsidiary. The effective tax rate for 2015 did not reflect a significant decrease in reserves for uncertain tax positions because the statute of limitations periods remained open for various tax years under audit.
Other comprehensive income (loss). Other comprehensive income (loss), net of taxes was a gain of $23.0 million in the year ended December 31, 2016 compared to a loss of $171.4 million in the year ended December 31, 2015. The gain in 2016 was due to a strengthening of foreign currencies associated with our international operations, primarily the Canadian dollar, against the U.S. dollar as of December 31, 2016 when compared to the exchange rates for those same currencies as of December 31, 2015. The loss in 2015 was due to weaker foreign currencies associated with our international operations, primarily the Canadian dollar, against the U.S. dollar as of December 31, 2015 when compared to the exchange rates for those same currencies as of December 31, 2014.
Segment Results
The following table sets forth segment revenues and segment operating income (loss) for the years indicated (dollars in thousands):
Year Ended December 31, | |||||||||||||||||||||
2017 | 2016 | 2015 | |||||||||||||||||||
Revenues: | |||||||||||||||||||||
Electric Power Infrastructure Services | $ | 5,599,836 | 59.2 | % | $ | 4,850,495 | 63.4 | % | $ | 4,937,289 | 65.2 | % | |||||||||
Oil and Gas Infrastructure Services | 3,866,642 | 40.8 | 2,800,824 | 36.6 | 2,635,147 | 34.8 | |||||||||||||||
Consolidated revenues from external customers | $ | 9,466,478 | 100.0 | % | $ | 7,651,319 | 100.0 | % | $ | 7,572,436 | 100.0 | % | |||||||||
Operating income (loss): | |||||||||||||||||||||
Electric Power Infrastructure Services | $ | 518,130 | 9.3 | % | $ | 395,745 | 8.2 | % | $ | 362,328 | 7.3 | % | |||||||||
Oil and Gas Infrastructure Services | 184,083 | 4.8 | 149,502 | 5.3 | 142,929 | 5.4 | |||||||||||||||
Corporate and non-allocated costs | (323,364 | ) | N/A | (224,434 | ) | N/A | (267,754 | ) | N/A | ||||||||||||
Consolidated operating income | $ | 378,849 | 4.0 | % | $ | 320,813 | 4.2 | % | $ | 237,503 | 3.1 | % | |||||||||
2017 compared to 2016
Electric Power Infrastructure Services Segment Results
Revenues for this segment increased $749.3 million, or 15.4%, to $5.60 billion for the year ended December 31, 2017. This increase was primarily due to increased customer spending associated with electric transmission projects, an increase of $143.8 million in emergency restoration services revenues and approximately $40 million in revenues from acquired companies. The increased customer spending associated with electric transmission projects primarily resulted from interconnections with new generation facilities and from modernization of the North American electric power grid. The increase is emergency restoration
40
services revenues primarily resulted from Hurricanes Harvey and Irma and winter storms across the United States and Canada. Also contributing to the increase were more favorable foreign currency exchange rates during the year ended December 31, 2017, which favorably impacted revenues by approximately $27 million, primarily attributable to the relationship between the U.S. dollar and the Canadian and Australian dollars. Partially offsetting these increases were delays on certain projects, including as a result of work disruptions, deferrals and cancellations due to Hurricanes Harvey and Irma, and a decrease in renewable energy services revenues due primarily to a lower volume of renewable energy projects and a reduction in revenues associated with a power plant project in Alaska that was substantially completed in the fourth quarter of 2016.
Operating income increased $122.4 million, or 30.9%, to $518.1 million for the year ended December 31, 2017. Operating income as a percentage of segment revenues increased to 9.3% for the year ended December 31, 2017 from 8.2% for the year ended December 31, 2016. These increases primarily resulted from the recognition of $54.8 million of project losses on a power plant project in Alaska during the year ended December 31, 2016, as well as incremental emergency restoration services revenues in the year ended December 31, 2017, which typically yield higher margins due in part to higher equipment utilization and absorption of fixed costs. Partially offsetting these increases was a loss of $17.3 million during the year ended December 31, 2017 on an electric transmission project that experienced road access, subcontractor and labor production issues. The project was approximately 90% complete as of December 31, 2017. Additionally, operating income and operating income as a percentage of revenues were negatively impacted by delays on certain projects, including as a result of work disruptions, deferrals, cancellations and employee support costs due to Hurricanes Harvey and Irma and expenses incurred to support the growth of our communications services operations.
Oil and Gas Infrastructure Services Segment Results
Revenues for this segment increased $1.07 billion, or 38.1%, to $3.87 billion for the year ended December 31, 2017. This increase was primarily the result of increased capital spending by our customers on midstream gas pipeline transmission projects. The timing of construction for pipeline transmission projects is highly variable due to delays associated with obtaining permits, as well as worksite access limitations related to environmental regulations and seasonality of weather patterns. Also contributing to this increase were approximately $190 million in revenues from acquired companies and more favorable foreign currency exchange rates during the year ended December 31, 2017, which favorably impacted our international operations by approximately $26 million, primarily attributable to the relationship between the U.S. dollar and the Canadian dollar. During the year ended December 31, 2016, revenues were negatively impacted by project delays due to forest fires in Alberta, Canada during mid-2016.
Operating income increased $34.6 million, or 23.1%, to $184.1 million for the year ended December 31, 2017. Operating income as a percentage of segment revenues decreased to 4.8% for the year ended December 31, 2017 from 5.3% for the year ended December 31, 2016. Operating income and operating income as a percentage of segment revenues were positively impacted by a higher proportion of midstream gas transmission work which typically yields higher margins. In addition, overall higher revenues in the segment allowed for better coverage of fixed and overhead costs. These increases were offset by higher costs associated with adverse weather conditions, delays and other production issues during the third and fourth quarters of 2017 on certain Canadian pipeline transmission projects. Additionally, several projects associated with our recent acquisition of Stronghold were temporarily suspended or deferred as a result of Hurricane Harvey, which negatively impacted operating income and operating income as a percentage of segment revenues.
Corporate and Non-allocated Costs
Certain selling, general and administrative expenses and amortization of intangible assets are not allocated to segments. Corporate and non-allocated costs for the year ended December 31, 2017 increased $98.9 million to $323.4 million compared to the year ended December 31, 2016. This increase was primarily due to the $58.1 million of goodwill and intangible asset impairment charges recorded in the year ended December 31, 2017 mentioned above. In addition, higher compensation costs, largely associated with higher incentive compensation based on profitability for 2017, as well as higher acquisition and integration costs and higher costs associated with ongoing technology and business development initiatives contributed to the 2017 increase. Also contributing to the increase were $4.2 million of attorneys’ fees and related expenses associated with a matter involving our prior disposition of certain communications operations that was resolved in the three months ended March 31, 2017 and $2.4 million in charitable contributions in connection with the formation of a non-profit line training school. These increases were partially offset by the favorable impact of a $5.2 million decrease in fair value of contingent consideration liabilities during the year ended December 31, 2017 and $4.0 million in costs associated with the departure of our former president and chief executive officer recognized in the year ended December 31, 2016.
2016 compared to 2015
Electric Power Infrastructure Services Segment Results
Revenues for this segment decreased $86.8 million, or 1.8%, to $4.85 billion for the year ended December 31, 2016. This decrease was primarily a result of reduced customer spending associated with larger electric transmission projects as customers
41
continued to face heightened regulatory and environmental requirements from state and federal agencies and more stringent permitting processes with various regional system operators. This regulatory environment negatively impacted the timing of existing projects and delayed the development of other infrastructure projects, which resulted in decreased demand for our services. Revenues also declined as a result of less favorable foreign currency exchange rates during the year ended December 31, 2016, which negatively impacted our international operations by approximately $23 million and were primarily attributable to the strengthening of the U.S. dollar against the Canadian dollar. Partially offsetting these decreases were approximately $95 million in revenues from acquired companies and $29.9 million in higher emergency restoration services revenues.
Operating income increased $33.4 million, or 9.2%, to $395.7 million for the year ended December 31, 2016. Operating income as a percentage of segment revenues increased to 8.2% for the year ended December 31, 2016 from 7.3% for the year ended December 31, 2015. These increases were primarily due to better utilization of certain larger transmission project resources as compared to the utilization of similar resources in 2015. Also contributing to these increases was improved performance of ongoing projects, as we experienced more favorable weather and increased productivity compared to the year ended December 31, 2015, which was negatively impacted by heavy snowfall and other unfavorable weather conditions in certain areas of Canada and the northern United States. Operating income and operating income as a percentage of revenues during 2016 were adversely impacted by project losses of $54.8 million related to performance issues on a power plant construction project in Alaska which compares to the 2015 impact of project losses of $66.1 million primarily associated with the same project in Alaska and an electric transmission project in Canada that was completed in the third quarter of 2015.
The project losses related to the Alaska power plant construction project recognized during the year ended December 31, 2016 were primarily due to performance issues and a claimed force majeure event that disrupted the commissioning phase of the project during the second quarter of 2016. These issues resulted in higher than expected production costs due to quality deficiencies and their impact on production sequencing. We provided the customer and its insurance providers with a notice of force majeure in order to seek schedule relief and cost recovery from the disruptions. We are also in the process of developing potential claims for damages that may have resulted from third-party engineering and other contractor performance issues; however, no revenues or cost recovery was reflected in the estimate of total project losses at December 31, 2017 or 2016. This project had a contract value of $202 million and was completed in 2017. However, we remain within the warranty period and are subject to potential warranty claims, for which we have provided an estimated warranty reserve.
Oil and Gas Infrastructure Services Segment Results
Revenues for this segment increased $165.7 million, or 6.3%, to $2.80 billion for the year ended December 31, 2016. This increase was primarily the result of increased capital spending by our customers on larger projects, certain of which moved into full construction during the second half of 2016, after experiencing regulatory and permitting delays in the first half of 2016, as well as increased customer spending for natural gas distribution services. In addition, revenues were favorably impacted by the contribution of approximately $30 million in revenues from acquired companies. The revenues contributed from our international operations were negatively impacted by approximately $18 million as a result of less favorable foreign currency exchange rates in the year ended December 31, 2016 as compared to the year ended December 31, 2015, primarily attributable to the strengthening of the U.S. dollar against the Canadian dollar.
Operating income increased $6.6 million, or 4.6%, to $149.5 million for the year ended December 31, 2016. Operating income as a percentage of segment revenues decreased to 5.3% for the year ended December 31, 2016 from 5.4% for the year ended December 31, 2015. The increase in operating income was primarily due to the increase in revenues described above. The decrease in operating income as a percentage of segment revenues was primarily due to the negative impact on resource utilization due to permitting delays on certain pipeline projects that were scheduled to begin in the first half of 2016 but did not start until the second half of 2016. Operating income as a percentage of revenues was also negatively impacted by approximately $2 million in severance and restructuring costs recognized during 2016. Partially offsetting these items that negatively impacted operating income as a percentage of revenues was improved performance on certain larger pipeline projects that moved into full construction during 2016.
Corporate and Non-allocated Costs
Certain selling, general and administrative expenses and amortization of intangible assets are not allocated to segments. Corporate and non-allocated costs for the year ended December 31, 2016 decreased $43.3 million to $224.4 million as compared to the year ended December 31, 2015. This decrease was primarily due to the $51.9 million previously described goodwill and intangible asset impairment charges recorded in the year ended December 31, 2015, partially offset by $4.6 million in higher costs related to ongoing litigation, which included $6.9 million of litigation costs related to our disposition of certain telecommunication operations, and $4.0 million in costs associated with the departure of Quanta’s former president and chief executive officer recognized during 2016.
42
Liquidity and Capital Resources
Cash Requirements
Our cash and cash equivalents totaled $138.3 million and $112.2 million as of December 31, 2017 and 2016. As of December 31, 2017 and 2016, cash and cash equivalents held in domestic bank accounts were $83.1 million and $19.5 million, and cash and cash equivalents held in foreign bank accounts were $55.2 million and $92.7 million. As of December 31, 2017 and 2016, cash and cash equivalents held by our joint ventures, which are either consolidated or proportionately consolidated, were $16.7 million and $11.5 million, of which $10.0 million and $10.0 million related to domestic joint ventures. Cash and cash equivalents held by the joint ventures are available to support joint venture operations, but we cannot utilize those assets to support our other operations. We generally have no right to a joint venture’s cash and cash equivalents other than participating in distributions and in the event of dissolution.
We were in compliance with the covenants under the credit agreement for our senior secured revolving credit facility at December 31, 2017. We anticipate that our cash and cash equivalents on hand, existing borrowing capacity under such credit facility, and our future cash flows from operations will provide sufficient funds to enable us to meet our future operating needs and our planned capital expenditures during 2018, as well as facilitate our ability to grow through acquisitions or otherwise in the foreseeable future.
Our industry is capital intensive, and we expect the need for substantial capital expenditures to continue into the foreseeable future to meet the anticipated demand for our services. Total capital expenditures are expected to be approximately $275 million for 2018.
We also evaluate opportunities for strategic acquisitions from time to time that may require cash, as well as opportunities to make investments in strategic partnerships with customers and infrastructure investors where we anticipate performing services such as project management, engineering, procurement or construction services. These investment opportunities exist in the markets and industries we serve and may require the use of cash to purchase debt or equity investments.
Management continues to monitor the financial markets and general national and global economic conditions for factors that may affect our liquidity and capital resources. We consider our cash and cash equivalents investment policies to be conservative in that we maintain a diverse portfolio of what we believe to be high-quality cash and cash equivalent investments with short-term maturities. Accordingly, we do not anticipate that any weakness in the capital markets will have a material impact on the principal amounts of our cash and cash equivalents or our ability to rely upon our senior secured revolving credit facility for funds. To date, we have not experienced a loss of or lack of access to our cash or cash equivalents or funds under our senior secured revolving credit facility; however, our access to invested cash and cash equivalents or availability under our senior secured revolving credit facility could be impacted in the future by adverse conditions in the financial markets.
We generally do not provide for taxes related to undistributed earnings of our foreign subsidiaries because such earnings either would not be taxable when remitted or they are considered to be indefinitely reinvested. We could also be subject to additional foreign withholding taxes if we were to repatriate cash that is indefinitely reinvested outside the United States, but we do not expect such amounts to be material.
Sources and Uses of Cash
As of December 31, 2017, we had cash and cash equivalents of $138.3 million and working capital of $1.38 billion. We also had $413.3 million of outstanding letters of credit and bank guarantees under our senior secured revolving credit facility, $228.6 million of which were denominated in U.S. dollars and $184.7 million of which were denominated in currencies other than the U.S. dollar, primarily in Australian or Canadian dollars. We also had $668.4 million of outstanding revolving loans under our senior secured revolving credit facility, $645.0 million of which were denominated in U.S. dollars and $23.4 million of which were denominated in Australian dollars. As of December 31, 2017, our $1.81 billion senior secured revolving credit facility had $728.3 million available for revolving loans or issuing new letters of credit or bank guarantees. As discussed in Debt Instruments - Credit Facility below, we entered into an amendment to our senior secured revolving credit facility that extended the maturity date to October 31, 2022 and adjusted the interest rates applicable to certain borrowings.
Operating Activities
Cash flow from operations is primarily influenced by demand for our services and operating margins but can also be influenced by working capital needs associated with the various types of services that we provide. In particular, working capital needs may increase when we commence large volumes of work under circumstances where project costs, primarily associated with labor, equipment and subcontractors, are required to be paid before the receivables resulting from the work performed are billed and collected. Accordingly, changes within working capital in accounts receivable, costs and estimated earnings in excess of billings
43
on uncompleted contracts, and billings in excess of costs and estimated earnings on uncompleted contracts are normally related and are typically affected on a collective basis by changes in revenue due to the timing and volume of work performed and variability in the timing of customer billings and payments. Additionally, working capital needs are generally higher during the summer and fall months due to increased demand for our services when favorable weather conditions exist in many of our operating regions. Conversely, working capital assets are typically converted to cash during the winter months. These seasonal trends can be offset by changes in the timing of projects due to delays or accelerations and other economic factors that may affect customer spending.
Operating activities of continuing operations provided net cash of $372.5 million during 2017 as compared to $390.2 million during 2016 and $628.6 million during 2015. Net cash provided by operating activities during 2017 and 2016, as compared to 2015, were favorably impacted by increases in earnings from continuing operations. However, for 2017, the higher earnings were offset by increased working capital requirements primarily related to variability in billing and payment terms across various projects and an increase in accounts receivable associated with emergency restoration services work performed late in 2017. Also contributing to the decrease in 2017 as compared to 2016 was the $25.5 million payment related to the settlement of the multiemployer pension plan withdrawal liabilities associated with the Central States Plan, partially offset by reduced cash tax payments due to the acceleration of tax deductions into 2017. The decrease in cash flow from operating activities of continuing operations for the year ended December 31, 2016 compared to the year ended December 31, 2015 was primarily due to additional working capital requirements associated with larger oil and gas infrastructure projects that moved into full construction during the second half of 2016 and invoicing challenges and billing delays on two related electric transmission projects located in remote regions of northeastern Canada, which resulted from extensive quality assurance documentation and administrative requirements. These invoicing and billing delays were substantially resolved during 2017. Operating activities of continuing operations for 2015 were positively impacted by the receipt of a $65 million cash payment associated with the settlement of a large project receivable, as well as a corresponding benefit due to the reduction in income tax payments that resulted from the prior year charge to selling, general and administrative expenses of $102.5 million associated with this settlement.
Days sales outstanding (DSO) as of December 31, 2017 was 76 days, as compared to 74 days as of December 31, 2016. This increase was primarily due to favorable billing terms for certain projects ongoing at December 31, 2016 as compared to projects ongoing at December 31, 2017, partially offset by the impact of invoicing challenges and billing delays on two related large electric transmission projects in remote regions of northeastern Canada as of December 31, 2016. DSO is calculated by using the sum of current accounts receivable, net of allowance (which includes retainage and unbilled balances), plus costs and estimated earnings in excess of billings on uncompleted contracts less billings in excess of costs and estimated earnings on uncompleted contracts, divided by average revenues per day during the quarter.
Investing Activities
During 2017, we used net cash in investing activities of continuing operations of $575.8 million as compared to $266.0 million and $307.1 million used in 2016 and 2015. Investing activities of continuing operations in 2017 included $361.2 million used for acquisitions, including $347.5 million associated with the Stronghold acquisition, and $244.7 million used for capital expenditures. These items were partially offset by $23.3 million of proceeds from the sale of property and equipment. Investing activities of continuing operations in 2016 included $212.6 million used for capital expenditures and $68.8 million used for acquisitions, partially offset by $22.0 million of proceeds from the sale of property and equipment. Investing activities of continuing operations in 2015 included $210.0 million used for capital expenditures and $112.9 million used for acquisitions, partially offset by $26.2 million of proceeds from the sale of property and equipment.
Additionally, our acquisition of Stronghold in 2017 includes the potential payment of up to approximately $100.0 million of contingent consideration, payable at the end of a three-year period if the acquired business achieves certain financial targets. Any contingent consideration that is earned will be paid at least 70% in cash, and we may elect to pay up to the full amount in cash. We recorded a $51.1 million liability as of the acquisition date based on the estimated fair value of the liability. The aggregate fair value of all of our contingent consideration liabilities totaled $65.7 million as of December 31, 2017. We also completed an acquisition in January 2018 that included contingent consideration of up to $15.0 million, payable if the acquired business achieves certain financial and operational objectives and which would be paid at least 70% in cash.
Our industry is capital intensive, and we expect the need for substantial capital expenditures to continue into the foreseeable future to meet the anticipated demand for our services. We also have various contractual obligations related to investments in unconsolidated affiliates and other capital commitments which are detailed in Contractual Obligations below. In addition, we expect to continue to pursue strategic acquisitions and investments, although we cannot predict the timing or magnitude of the potential cash outlays for these initiatives.
44
Financing Activities
During 2017, net cash provided by financing activities of continuing operations was $227.8 million as compared to net cash used in financing activities of continuing operations of $133.8 million and $1.23 billion in 2016 and 2015. Financing activities of continuing operations during 2017 included $307.9 million of net borrowings under our senior secured revolving credit facility, partially offset by $50.0 million of common stock repurchases under our stock repurchase program and $18.5 million of payments to satisfy tax withholding obligations associated with share-based compensation. Net borrowings during 2017 were primarily utilized to fund the cash portion of the consideration paid at closing for the Stronghold acquisition and additional working capital requirements associated with increases in emergency restoration services projects and the number and size of ongoing oil and gas infrastructure projects. Financing activities of continuing operations in 2016 included $116.2 million of net repayments under our senior secured revolving credit facility and $8.3 million of payments to satisfy tax withholding obligations associated with share-based compensation.
Financing activities of continuing operations in 2015 included $1.61 billion of common stock repurchases under our stock repurchase programs; $18.9 million of cash payments to non-controlling interests as distributions of joint venture profits, net of contributions received; and $9.8 million of payments to satisfy tax withholding obligations associated with share-based compensation, partially offset by $413.6 million of net borrowings under our senior secured revolving credit facility.
Additionally, on August 4, 2015, we completed the sale of our fiber optic licensing operations for a purchase price of $1.00 billion in cash, resulting in after-tax net proceeds of $848.2 million. We have presented the results of operations, financial position, cash flows and disclosures of the fiber optic licensing operations as discontinued operations for all periods in our consolidated financial statements. A cash tax payment of $134.3 million related to the gain was paid in the fourth quarter of 2015 and was included in net cash provided by (used in) investing activities from discontinued operations on our consolidated statement of cash flows for the year ended December 31, 2015.
Stock Repurchases
During the second quarter of 2017, our board of directors approved a stock repurchase program that authorizes us to purchase, from time to time through June 30, 2020, up to $300.0 million of our outstanding common stock (the 2017 Repurchase Program). Repurchases under the 2017 Repurchase Program can be made in open market and privately negotiated transactions. As of December 31, 2017, we had repurchased 1.4 million shares of our common stock at a cost of $50.0 million in the open market under the 2017 Repurchase Program.
During the third quarter of 2015, our board of directors approved a stock repurchase program that authorized us to purchase, from time to time through February 28, 2017, up to $1.25 billion of our outstanding common stock (the 2015 Repurchase Program). During 2015, we repurchased 19.2 million shares of our common stock at a cost of $449.9 million in the open market under the 2015 Repurchase Program. During the third quarter of 2015, we also entered into an accelerated share repurchase arrangement (the ASR) to repurchase $750.0 million of our common stock under the 2015 Repurchase Program. Pursuant to the terms of the ASR, based on the final volume-weighted average share price during the term of the ASR, minus a discount and subject to other adjustments, we paid $750.0 million to JPMorgan Chase Bank, National Association, London Branch (JPMorgan) and received 25.7 million shares of our common stock in the third quarter of 2015 and 9.4 million shares of our common stock in the second quarter of 2016. As a result, we repurchased a total of 54.3 million shares of our common stock at a cost of $1.20 billion under the 2015 Repurchase Program prior to its termination on February 28, 2017.
During the fourth quarter of 2013, our board of directors approved a stock repurchase program authorizing us to purchase from time to time through December 31, 2016, up to $500.0 million of our outstanding common stock (the 2013 Repurchase Program). During the year ended December 31, 2015, we repurchased 14.3 million shares of our common stock at a cost of $406.5 million in the open market and completed the 2013 Repurchase Program.
Debt Instruments
Senior Secured Revolving Credit Facility
On December 18, 2015, we entered into an amended and restated credit agreement with various lenders that provides for a $1.81 billion senior secured revolving credit facility. On October 31, 2017, we and the lenders entered into an amendment to the credit facility which, among other things, extended the maturity date from December 18, 2020 to October 31, 2022 and adjusted the interest rates applicable to certain borrowings. The entire amount available under the credit facility may be used by us for revolving loans and letters of credit in U.S. dollars and certain alternative currencies. Up to $600.0 million of the credit facility may be used by certain of our subsidiaries for revolving loans and letters of credit in certain alternative currencies. Up to $100.0 million of the credit facility may be used for swing line loans in U.S. dollars, up to $50.0 million of the credit facility may be used for swing line loans in Canadian dollars and up to $30.0 million of the credit facility may be used for swing line loans in Australian dollars. In addition, subject to the conditions specified in the credit agreement, we have the option to increase the revolving
45
commitments by up to $400.0 million from time to time upon receipt of additional commitments from new or existing lenders. Borrowings under the credit agreement are to be used to refinance existing indebtedness and for working capital, capital expenditures and other general corporate purposes.
As of December 31, 2017, we had $413.3 million of outstanding letters of credit and bank guarantees under our senior secured revolving credit facility, $228.6 million of which were denominated in U.S. dollars and $184.7 million of which were denominated in currencies other than the U.S. dollar, primarily in Australian or Canadian dollars. We also had $668.4 million of outstanding revolving loans under the credit facility, $645.0 million of which were denominated in U.S. dollars and $23.4 million of which were denominated in Australian dollars. The remaining $728.3 million was available for revolving loans or new letters of credit or bank guarantees.
Beginning on November 20, 2017, amounts borrowed in U.S. dollars bear interest, at our option, at a rate equal to either (i) the Eurocurrency Rate plus 1.125% to 2.000%, as determined based on our Consolidated Leverage Ratio, or (ii) the Base Rate plus 0.125% to 1.000%, as determined based on our Consolidated Leverage Ratio. Amounts borrowed as revolving loans under the credit agreement in any currency other than U.S. dollars bear interest at a rate equal to the Eurocurrency Rate plus 1.125% to 2.000%, as determined based on our Consolidated Leverage Ratio. Additionally, standby or commercial letters of credit issued under the credit agreement are subject to a letter of credit fee of 1.125% to 2.000%, based on our Consolidated Leverage Ratio, and Performance Letters of Credit issued under the credit agreement in support of certain contractual obligations are subject to a letter of credit fee of 0.675% to 1.150%, based on our Consolidated Leverage Ratio.
From December 18, 2015 through November 19, 2017, amounts borrowed in U.S. dollars bore interest, at our option, at a rate equal to either (i) the Eurocurrency Rate (as defined in the credit agreement) plus 1.125% to 2.125%, as determined based on our Consolidated Leverage Ratio (as described below), or (ii) the Base Rate (as described below) plus 0.125% to 1.125%, as determined based on our Consolidated Leverage Ratio. Amounts borrowed as revolving loans under the credit agreement in any currency other than U.S. dollars bore interest at a rate equal to the Eurocurrency Rate plus 1.125% to 2.125%, as determined based on our Consolidated Leverage Ratio. Standby or commercial letters of credit issued under the credit agreement were subject to a letter of credit fee of 1.125% to 2.125%, based on our Consolidated Leverage Ratio, and Performance Letters of Credit (as defined in the credit agreement) issued under the credit agreement in support of certain contractual obligations were subject to a letter of credit fee of 0.675% to 1.275%, based on our Consolidated Leverage Ratio.
We are also subject to a commitment fee of 0.20% to 0.40%, based on our Consolidated Leverage Ratio, on any unused availability under the credit agreement.
The Consolidated Leverage Ratio is the ratio of our Consolidated Funded Indebtedness to Consolidated EBITDA (as those terms are defined in the credit agreement). For purposes of calculating our Consolidated Leverage Ratio, Consolidated Funded Indebtedness is reduced by available cash and cash equivalents (as defined in the credit agreement) in excess of $25.0 million. The Base Rate equals the highest of (i) the Federal Funds Rate (as defined in the credit agreement) plus 0.5%, (ii) the prime rate publicly announced by Bank of America, N.A. and (iii) the Eurocurrency Rate plus 1.00%.
Subject to certain exceptions, the credit agreement is secured by substantially all of our assets and the assets of our wholly owned U.S. subsidiaries and by a pledge of all of the capital stock of our wholly owned U.S. subsidiaries and 65% of the capital stock of direct foreign subsidiaries of our wholly owned U.S. subsidiaries. Our wholly owned U.S. subsidiaries also guarantee the repayment of all amounts due under the credit agreement. Subject to certain conditions, all collateral will automatically be released from the liens at any time we maintain an Investment Grade Rating (defined in the credit agreement as two of the following three conditions being met: (i) a corporate credit rating that is BBB- or higher by Standard & Poor’s Rating Services, (ii) a corporate family rating that is Baa3 or higher by Moody’s Investors Services, Inc. or (iii) a corporate credit rating that is BBB- or higher by Fitch Ratings, Inc.).
The credit agreement contains certain covenants, including (1) a maximum Consolidated Leverage Ratio of 3.0 to 1.0 (provided that in connection with certain permitted acquisitions in excess of $200.0 million, such ratio is 3.5 to 1.0 for the fiscal quarter in which the acquisition is completed and the two subsequent fiscal quarters) and (2) a minimum Consolidated Interest Coverage Ratio (as defined in the credit agreement) of 3.0 to 1.0. As of December 31, 2017, we were in compliance with all of the covenants in the credit agreement.
The credit agreement also limits certain acquisitions, mergers and consolidations, indebtedness, asset sales and prepayments of indebtedness and, subject to certain exceptions, prohibits liens on our assets. The credit agreement allows cash payments for dividends and stock repurchases subject to compliance with the following requirements (after giving effect to the dividend or stock repurchase): (i) no default or event of default under the credit agreement; (ii) continued compliance with the financial covenants in the credit agreement; and (iii) at least $100.0 million of availability under the credit agreement and/or cash and cash equivalents on hand.
The credit agreement provides for customary events of default and contains cross-default provisions with our underwriting, continuing indemnity and security agreement with our sureties and all of our other debt instruments exceeding $100.0 million in borrowings or availability. If an Event of Default (as defined in the credit agreement) occurs and is continuing, on the terms and
46
subject to the conditions set forth in the credit agreement, the lenders may declare all amounts outstanding and accrued and unpaid interest immediately due and payable, require that we provide cash collateral for all outstanding letter of credit obligations, terminate the commitments under the credit agreement, and foreclose on the collateral.
Prior to the amendment and restatement of our credit agreement on December 18, 2015 and after April 1, 2014, amounts borrowed bore interest at the same rates as the period from December 18, 2015 through November 19, 2017 described above, and we were subject to the same commitment fees as above.
Other Facilities
We have also entered into bilateral credit agreements with various lenders that provide for up to $50.2 million in aggregate availability in both U.S. dollars and certain alternative currencies, primarily Australian dollars. We may utilize these facilities for, among other things, the issuance of letters of credit or bank guarantees and overdraft protection and had $2.8 million of letters of credit and bank guarantees outstanding under these facilities at December 31, 2017.
Off-Balance Sheet Transactions
As is common in our industry, we have entered into certain off-balance sheet arrangements in the ordinary course of business that result in risks not directly reflected in our balance sheets. Our significant off-balance sheet transactions include certain obligations relating to our investments and joint venture arrangements, liabilities associated with non-cancelable operating leases, letters of credit obligations, surety guarantees related to performance bonds, commitments to purchase equipment and certain multiemployer pension plan liabilities.
Investments in Affiliates and Other Entities
Certain joint venture structures involve risks not directly reflected in our balance sheets. For example, we have guaranteed all of the obligations of certain joint ventures under contracts with the customer. Additionally, other joint venture arrangements qualify as a general partnership, for which we are jointly and severally liable for all of the obligations of the joint venture. In our joint venture arrangements, typically each joint venture party indemnifies the other party for any liabilities incurred in excess of the liabilities such other party is obligated to bear under the respective joint venture agreement.
Leases
We enter into non-cancelable operating leases for many of our facility, vehicle and equipment needs. These leases allow us to conserve cash by paying a monthly lease rental fee for use of the facilities, vehicles and equipment rather than purchasing them. We may decide to cancel or terminate a lease before the end of its term, in which case we are typically liable to the lessor for the remaining lease payments under the term of the lease.
We have guaranteed the residual value of the underlying assets under certain of our equipment operating leases at the date of termination of such leases. We have agreed to pay any difference between this residual value and the fair market value of each underlying asset as of the lease termination date. As of December 31, 2017, the maximum guaranteed residual value was $626.8 million. We believe that no significant payments will be made as a result of the difference between the fair market value of the leased equipment and the guaranteed residual value. However, there can be no assurance that future significant payments will not be required.
Letters of Credit
Certain of our vendors require letters of credit to ensure reimbursement for amounts they disburse on our behalf, such as to beneficiaries under our insurance programs. In addition, from time to time, certain customers require us to post letters of credit to ensure payment of subcontractors and vendors and guarantee performance under our contracts. Such letters of credit are generally issued by a bank or similar financial institution, typically pursuant to our credit agreement. Each letter of credit commits the issuer to pay specified amounts to the holder of the letter of credit if the holder claims that we have failed to perform specified actions. If this were to occur, we would be required to reimburse the issuer of the letter of credit. Depending on the circumstances of such a reimbursement, we may also be required to record a charge to earnings for the reimbursement. We do not believe that it is likely that any material claims will be made under a letter of credit in the foreseeable future.
As of December 31, 2017, we had $413.3 million in outstanding letters of credit and bank guarantees under our senior secured revolving credit facility securing our casualty insurance program and various contractual commitments. These are irrevocable stand-by letters of credit with maturities generally expiring at various times throughout 2018. Upon maturity, it is expected that the majority of the letters of credit related to the casualty insurance program will be renewed for subsequent one-year periods.
47
Performance Bonds and Parent Guarantees
Many customers, particularly in connection with new construction, require us to post performance and payment bonds issued by a financial institution known as a surety. These bonds provide a guarantee to the customer that we will perform under the terms of a contract and that we will pay subcontractors and vendors. If we fail to perform, the customer may demand that the surety make payments or provide services under the bond. We must reimburse the surety for any expenses or outlays it incurs. Under our underwriting, continuing indemnity and security agreement with our sureties and with the consent of the lenders that are party to our credit agreement, we have granted security interests in certain of our assets to collateralize our obligations to the sureties. Subject to certain conditions and consistent with terms of our credit agreement, these security interests will be automatically released if we maintain a credit rating that meets two of the following three conditions: (i) a corporate credit rating that is BBB- or higher by Standard & Poor’s Rating Services, (ii) a corporate family rating that is Baa3 or higher by Moody’s Investors Services, Inc. or (iii) a corporate credit rating that is BBB- or higher by Fitch Ratings, Inc. We may be required to post letters of credit or other collateral in favor of the sureties or our customers in the future, which would reduce the borrowing availability under our senior secured revolving credit facility. To date, we have not been required to make any reimbursements to our sureties for bond-related costs. We believe that it is unlikely that we will have to fund significant claims under our surety arrangements in the foreseeable future.
As of December 31, 2017, the total amount of outstanding performance bonds was estimated to be approximately $3.0 billion. Our estimated maximum exposure as it relates to the value of performance bonds outstanding is lowered on each bonded project as the cost to complete is reduced, and each of our commitments under the performance bonds generally extinguishes concurrently with the expiration of our related contractual obligation. The estimated cost to complete these bonded projects was approximately $869 million as of December 31, 2017.
Additionally, from time to time, we guarantee the obligations of our wholly owned subsidiaries, including obligations in connection with certain contracts with customers, lease obligations, joint venture arrangements and, in some states, contractors’ licenses. We are not aware of any material obligations for performance or payment asserted against us under any of these guarantees.
Equipment Purchase Commitments
See Contractual Obligations - Equipment Purchase Obligations below for a description of these obligations.
Multiemployer Pension Plans
See Contractual Obligations - Multiemployer Pension Plans below for a description of these obligations.
48
Contractual Obligations
The following table summarizes our future contractual obligations as of December 31, 2017, excluding amounts related to certain capital commitments related to investments in unconsolidated affiliates, unrecognized tax benefits, multiemployer pension plan obligations, interest associated with letters of credit and bank guarantees, commitment fees under our senior secured revolving credit facility, commitments associated with our insurance liabilities and acquisition-related contingent consideration liabilities (in thousands):
Total | 2018 | 2019 | 2020 | 2021 | 2022 | Thereafter | ||||||||||||||||||||||
Long-term debt - principal (1) | $ | 670,237 | $ | 158 | $ | 1,652 | $ | — | $ | — | $ | 668,427 | $ | — | ||||||||||||||
Long-term debt - cash interest (2) | 49 | 43 | 6 | — | — | — | — | |||||||||||||||||||||
Operating lease obligations | 316,004 | 115,985 | 75,556 | 49,287 | 28,422 | 15,883 | 30,871 | |||||||||||||||||||||
Capital lease and related interest obligations (3) | 1,704 | 1,062 | 642 | — | — | — | — | |||||||||||||||||||||
Equipment purchase commitments | 14,633 | 14,633 | — | — | — | — | — | |||||||||||||||||||||
Capital commitment related to investments in unconsolidated affiliates | 39,988 | 14,793 | 25,195 | — | — | — | — | |||||||||||||||||||||
Total | $ | 1,042,615 | $ | 146,674 | $ | 103,051 | $ | 49,287 | $ | 28,422 | $ | 684,310 | $ | 30,871 | ||||||||||||||
_______________________________________
(1) | Amounts were recorded in our December 31, 2017 consolidated balance sheet and included $668.4 million of outstanding revolving loans under our senior secured revolving credit facility, which bear interest at variable market rates. Assuming the principal amount outstanding at December 31, 2017 remained outstanding and the interest rate in effect at December 31, 2017 remained the same, the annual cash interest expense with respect to our senior secured revolving credit facility would be approximately $19.9 million, payable for the remainder of the term of such credit facility, which matures in October 2022. |
(2) | Amounts relate to cash interest expense on our fixed-rate long-term debt, which excludes our senior secured revolving credit facility. |
(3) | Principal amounts of capital lease obligations were recorded in our December 31, 2017 consolidated balance sheet. |
Equipment Purchase Commitments
We have committed capital for the expansion of our vehicle fleet in order to accommodate manufacturer lead times on certain types of vehicles. As of December 31, 2017, $14.6 million of production orders were issued with expected delivery dates in 2018. Although we have committed to the purchase of these vehicles at the time of their delivery, we intend that these orders will be assigned to third party leasing companies and made available to us under certain of our master equipment lease agreements, which will release us from our capital commitment.
Capital Commitments Related to Investments in Unconsolidated Affiliates
During the year ended December 31, 2017, we formed a partnership with select investors that provides up to $1.0 billion of capital, including approximately $80.0 million from us, available to invest in certain specified types of infrastructure projects through August 2024. Because we are not obligated to invest this amount and are unable to determine the timing of any such investments, we have excluded this capital commitment from the Contractual Obligations table.
Unrecognized Tax Benefits
During 2016, the Internal Revenue Service (IRS) completed its examination related to tax years 2010, 2011 and 2012; however, certain subsidiaries remain under examination by various U.S. state, Canadian and other foreign tax authorities for multiple periods, and the amount of unrecognized tax benefits could therefore increase or decrease as a result of the expiration of certain statute of limitations periods or settlements of these examinations. We believe it is reasonably possible that within the next 12 months unrecognized tax benefits may decrease by up to $13.7 million due to the expiration of certain statute of limitations periods or settlements of the examinations.
Multiemployer Pension Plans
The previously presented table of estimated contractual obligations does not reflect the obligations under the multiemployer pension plans in which our union employees participate. Some of our operating units are parties to various collective bargaining agreements that require us to provide to the employees subject to these agreements specified wages and benefits, as well as to make contributions to multiemployer pension plans. Our multiemployer pension plan contribution rates generally are specified in the collective bargaining agreements (usually on an annual basis), and contributions are made to the plans on a “pay-as-you-go” basis based on our union employee payrolls. The location and number of union employees that we employ at any given time and
49
the plans in which they may participate vary depending on the projects we have ongoing at any time and the need for union resources in connection with those projects. Therefore, we are unable to accurately predict our union employee payroll and the amount of the resulting multiemployer pension plan contribution obligations for future periods.
We may also be required to make additional contributions to our multiemployer pension plans if they become underfunded, and these additional contributions will be determined based on our union employee payrolls. The Pension Protection Act of 2006 added special funding and operational rules generally applicable to plan years beginning after 2007 for multiemployer plans that are classified as “endangered,” “seriously endangered,” or “critical” status. Plans in these classifications must adopt measures to improve their funded status through a funding improvement or rehabilitation plan, as applicable, which may require additional contributions from employers (which may take the form of a surcharge on benefit contributions) and/or modifications to retiree benefits. A number of multiemployer plans to which our operating units contribute or may contribute in the future are in “endangered,” “seriously endangered,” or “critical” status. The amount of additional funds, if any, that we may be obligated to contribute to these plans in the future cannot be reasonably estimated and are not included in the above table due to uncertainty of the future levels of work that require the specific use of the union employees covered by these plans, as well as the future contribution levels and possible surcharges on contributions applicable to these plans.
We may also have additional liabilities imposed by law as a result of our participation in multiemployer defined benefit pension plans. The Employee Retirement Income Security Act of 1974, as amended by the Multiemployer Pension Plan Amendments Act of 1980, imposes certain liabilities upon employers who are contributors to a multiemployer plan if the employer withdraws from the plan or the plan is terminated or experiences a mass withdrawal. These liabilities include an allocable share of the unfunded vested benefits in the plan for all plan participants, not merely the benefits payable to a contributing employer’s own retirees. Other than as noted below, we are not aware of any material amounts of withdrawal liability that have been or are expected to be incurred as a result of a withdrawal by any of our operating units from any multiemployer defined benefit pension plans.
2011 Central States Plan Withdrawal Liability. In the fourth quarter of 2011, certain of our subsidiaries withdrew from the Central States Plan. This withdrawal event was the result of an amendment to a collective bargaining agreement with the International Brotherhood of Teamsters (Teamsters) that eliminated certain employers’ obligations to contribute to the Central States Plan, which was then in critical status and significantly underfunded as to its vested benefit obligations. The amendment was negotiated by the Pipe Line Contractors Association (PLCA) on behalf of its members, which include certain of our subsidiaries. Because certain of our other subsidiaries continued participation in the Central States Plan into 2012, the subsidiaries’ withdrawals in 2011 effected only a partial withdrawal on our behalf in 2011. We believed that the partial withdrawal was advantageous because it limited exposure to increased liability resulting from a future withdrawal event, at which point the Central States Plan could have been further underfunded. We and other PLCA members now contribute to a different multiemployer pension plan on behalf of the affected Teamsters employees.
The Central States Plan subsequently asserted that the withdrawal of the PLCA members, and thus our partial withdrawal, was not effective in 2011. The PLCA and Quanta believed at that time that a legally effective withdrawal had occurred during the fourth quarter of 2011, and this issue was litigated in the federal district court for the Northern District of Illinois, Eastern Division. In September 2013, the district court ruled in favor of the Central States Plan, and that decision was appealed by the PLCA. In July 2014, the Central States Plan provided us with a Notice and Demand claiming partial withdrawal liability in the amount of $39.6 million and requiring Quanta to make payments on this assessment while the dispute was ongoing. In September 2015, the United States Court of Appeals for the Seventh Circuit ruled in favor of the PLCA and reversed the district court’s previous ruling. Based on the outcome of the appeal, in January 2016, the Central States Plan issued a revised Notice and Demand claiming partial withdrawal liability in the amount of $32.9 million.
Separately, in December 2013, the Central States Plan filed lawsuits against two of our subsidiaries in connection with their withdrawal in 2012. In the first lawsuit, the Central States Plan alleged that the subsidiary elected to participate in the Central States Plan pursuant to the collective bargaining agreement under which it participated. We argued that no such election was made and that any payments made to the Central States Plan were made in error. In July 2014, the parties reached an agreement to settle the lawsuit, and the court dismissed the case with prejudice. In the second lawsuit, the Central States Plan alleged that contributions made by our subsidiary to a new industry fund created after we withdrew from the Central States Plan should have been made to the Central States Plan. This arguably would have extended our withdrawal date for this subsidiary to at least the end of 2013. We disputed these allegations on the basis that we properly paid contributions to the new industry fund based on the terms of the collective bargaining agreement under which we participated and asserted that we terminated our obligation to contribute to the Central States Plan by the end of 2012. The parties both moved for summary judgment, and in March 2015, the court entered judgment in our favor. The Central States Plan filed a notice of appeal in April 2015, and in December 2015, the Central States Plan agreed to dismiss the appeal with prejudice.
50
In December 2017, Quanta and the Central States Plan entered into a settlement agreement and release, whereby the parties agreed on a final settlement amount of $48.9 million, which included a final withdrawal liability of $44.1 million and retention of interest paid on the assessed amount of $4.8 million. This settlement addressed (i) the partial withdrawal liability assessed in the January 2016 Notice and Demand; (ii) an unassessed withdrawal liability in connection with a partial withdrawal in 2012; and (iii) an unassessed withdrawal liability in connection with a complete withdrawal in 2013 or 2014. Prior to settlement of the matter, we made monthly payments on the assessed partial withdrawal liability according to the terms of the January 2016 Notice and Demand, and the portion of those payments that was attributable to the principal amount of the assessed liability was offset against our final withdrawal liability. Accordingly, a final payment of $25.5 million was made in December 2017 in full satisfaction of this matter.
2013 Central States Plan Withdrawal Liability. On October 9, 2013, we acquired a business that experienced a complete withdrawal from the Central States Plan prior to the acquisition date. Prior to the acquisition, the Central States Plan issued a Notice and Demand to the acquired business claiming a withdrawal liability in the total amount of $6.9 million and requiring payments to be made on this assessment while the dispute is ongoing. In connection with the acquisition, we recorded an initial liability of $4.8 million related to this withdrawal liability, and a portion of the purchase price for the acquired business was deposited into an escrow account to fund any withdrawal obligation in excess of the initial liability recorded. In January 2016, the Central States Plan issued a revised Notice and Demand claiming a withdrawal liability in the amount of $4.8 million. Although we continue to dispute the total liability owed to the Central States Plan, we continue to make monthly payments according to the terms of this revised Notice and Demand while the parties determine the final withdrawal liability. As of December 31, 2017, payments totaling $4.2 million had been made toward the withdrawal liability assessment. The final amount of withdrawal liability payable in connection with this matter remains the subject of a pending arbitration proceeding and will ultimately depend on various factors, including the outcome of the arbitration. However, the acquired business’s withdrawal from the Central States Plan is not expected to have a material impact on our financial condition, results of operations or cash flows.
Letters of Credit and Bank Guarantee Fees and Commitment Fees
We have excluded from the Contractual Obligations table interest associated with letters of credit and bank guarantees and commitment fees under our senior secured revolving credit facility because the outstanding letters of credit and bank guarantees, availability and applicable interest rates and fees are variable. For additional information regarding our letters of credit and bank guarantees and the interest rates and fees associated with these items and our borrowings under our senior secured revolving credit facility, see Liquidity and Capital Resources - Debt Instruments - Credit Facility above.
Insurance
We are insured for employer’s liability, workers’ compensation, auto liability and general liability claims. Under these programs, the deductible for employer’s liability is $1.0 million per occurrence, the deductible for workers’ compensation is $5.0 million per occurrence, and the deductibles for auto liability and general liability are $10.0 million per occurrence. We manage and maintain a portion of our casualty risk through our wholly-owned captive insurance company, which insures all claims up to the amount of the applicable deductible of our third-party insurance programs. In connection with our casualty insurance programs, we are required to issue letters of credit to secure our obligations. We also have employee health care benefit plans for most employees not subject to collective bargaining agreements, of which the primary plan is subject to a deductible of $0.4 million per claimant per year.
Losses under all of these insurance programs are accrued based upon our estimate of the ultimate liability for claims reported and an estimate of claims incurred but not reported, with assistance from third-party actuaries. These insurance liabilities are difficult to assess and estimate due to unknown factors, including the severity of an injury, the extent of damage, the determination of our liability in proportion to other parties and the number of incidents not reported. The accruals are based upon known facts and historical trends, and management believes such accruals are adequate. As of December 31, 2017 and 2016, the gross amount accrued for insurance claims totaled $254.7 million and $218.2 million, with $200.0 million and $162.0 million considered to be long-term and included in “Insurance and other non-current liabilities.” Related insurance recoveries/receivables as of December 31, 2017 and 2016 were $50.4 million and $8.7 million, of which $0.4 million and $0.4 million were included in “Prepaid expenses and other current assets” and $50.0 million and $8.3 million were included in “Other assets, net.”
We renew our insurance policies on an annual basis, and therefore deductibles and levels of insurance coverage may change in future periods. In addition, insurers may cancel our coverage or determine to exclude certain items from coverage, or we may elect not to obtain certain types or incremental levels of insurance if we believe that the cost to obtain such coverage exceeds any additional benefits. In any such event, our overall risk exposure would increase, which could negatively affect our results of operations, financial condition and cash flows. The Contractual Obligations table excludes commitments associated with our insurance liabilities, as we are unable to determine the timing of payments related to these obligations.
51
Contingent Consideration Liabilities
We have excluded from the Contractual Obligations table acquisition-related contingent consideration liabilities, which represent the estimated fair value of future amounts payable to the former owners of acquired businesses, because the amounts have not been earned and we are unable to determine the portion of the liabilities that will be settled in cash and the exact timing of any such payments as of December 31, 2017. Payment of such consideration is contingent on the future financial performance of the acquired businesses, and the fair value of such consideration is estimated by management based on entity-specific assumptions that are evaluated on an ongoing basis. As of December 31, 2017 and 2016, the fair value of these contingent consideration liabilities totaled $65.7 million and $19.5 million, all of which was included in “Insurance and other non-current liabilities” on our consolidated balance sheets. Because acquisition-related contingent consideration liabilities are contingent upon future events, we include these liabilities in the Contractual Obligations table when the contingencies are resolved. We expect a significant portion of these liabilities to be settled by late 2020 or early 2021.
The fair values of the contingent consideration liabilities as of December 31, 2017 was determined using a Monte Carlo simulation valuation methodology based on probability-weighted financial performance projections and other inputs including a discount rate and an expected volatility factor for each acquisition. The discount rates ranged from 0.9% to 2.3% depending on the settlement methods available and are generally based on a risk-free rate and/or our cost of debt. The expected volatility factors ranged from 23.0% to 32.7% based on historical asset volatility of selected guideline public companies. The fair value determinations incorporate significant inputs not observable in the market. Accordingly, the level of inputs used for these fair value measurements is the lowest level (Level 3), as further described in Note 2 to our consolidated financial statements. Significant changes in any of these assumptions could result in a significantly higher or lower potential liability.
The majority of our contingent consideration liabilities are subject to a maximum payment amount, and the aggregate maximum amount of these liabilities was $139.5 million as of December 31, 2017. One contingent consideration liability is not subject to a maximum payout amount, and the fair value of that liability was $1.0 million as of December 31, 2017.
Our aggregate contingent consideration liabilities can change due to additional business acquisitions, payments to settle outstanding liabilities, changes in the fair value of amounts owed to former owners of the acquired businesses, and foreign currency translation gains or losses. During the years ended December 31, 2017, 2016 and 2015, acquisitions increased our contingent consideration liabilities by $51.1 million, $18.7 million and $1.0 million. We made no payments related to contingent consideration liabilities during the years ended December 31, 2017 and 2015 and a nominal payment during the year ended December 31, 2016. During the year ended December 31, 2017, we recognized a decrease in the fair value of contingent consideration liabilities of $5.2 million. No changes in fair value of contingent consideration liabilities were recognized in 2016 and 2015. Changes in fair value of contingent consideration liabilities are included in “Change in fair value of contingent consideration liabilities” on our consolidated statements of operations.
Concentrations of Credit Risk
We are subject to concentrations of credit risk related primarily to our cash and cash equivalents and our net receivable position with customers, which includes amounts related to billed and unbilled accounts receivable and costs and estimated earnings in excess of billings on uncompleted contracts net of advanced billings with the same customer. Substantially all of our cash and cash equivalents are managed by what we believe to be high credit quality financial institutions. In accordance with our investment policies, these institutions are authorized to invest cash and cash equivalents in a diversified portfolio of what we believe to be high quality investments, which primarily include interest-bearing demand deposits, money market investments, money market mutual funds and investment grade commercial paper with original maturities of three months or less. Although we do not currently believe the principal amount of these cash and cash equivalents is subject to any material risk of loss, changes in economic conditions could impact the interest income we receive from these investments. In addition, we grant credit under normal payment terms, generally without collateral, to our customers, which include electric power and oil and gas companies, governmental entities, general contractors, and builders, owners and managers of commercial and industrial properties located primarily in the United States, Canada, Australia and Latin America. Consequently, we are subject to potential credit risk related to changes in business and economic factors in these locations, which may be heightened as a result of uncertain economic and financial market conditions that have existed in recent years. However, we generally have certain statutory lien rights with respect to services provided. Historically, some of our customers have experienced significant financial difficulties, and others may experience financial difficulties in the future. These difficulties expose us to increased risk related to collectability of billed and unbilled receivables and costs and estimated earnings in excess of billings on uncompleted contracts for services we have performed.
At December 31, 2016, one customer within our Electric Power Infrastructure Services segment accounted for 16% of our consolidated net receivable position. Portions of this net receivable balance were related to invoicing challenges and billing delays on two electric transmission projects located in remote regions of northeastern Canada which resulted from changed site conditions requiring extensive quality assurance documentation and administrative requirements. During the second quarter of 2017, we and the customer reached a settlement and entered into a renegotiated contract, which eliminated the previous scheduling and billing
52
issues and settled outstanding change orders. No other customers represented 10% or more of our consolidated net receivable position as of December 31, 2017 and 2016, and no customers represented 10% or more of our consolidated revenues for the years ended December 31, 2017, 2016 and 2015.
Legal Proceedings
We are from time to time party to various lawsuits, claims and other legal proceedings that arise in the ordinary course of business. These actions typically seek, among other things, compensation for alleged personal injury, breach of contract and/or property damages, employment-related damages, punitive damages, civil penalties or other losses, or injunctive or declaratory relief. With respect to all such lawsuits, claims and proceedings, we record a reserve when it is probable that a loss has been incurred and the amount of loss can be reasonably estimated. In addition, we disclose matters for which management believes a material loss is at least reasonably possible. See Legal Proceedings and Collective Bargaining Agreements in Note 15 of the Notes to Consolidated Financial Statements in Item 8. Financial Statements and Supplementary Data for additional information regarding litigation, claims and other legal proceedings.
Related Party Transactions
In the normal course of business, we enter into transactions from time to time with related parties. Our significant related party transactions typically take the form of facility leases with prior owners of certain acquired companies.
Inflation
Due to relatively low levels of inflation experienced during the years ended December 31, 2017, 2016 and 2015, inflation did not have a significant effect on our results of operations, financial condition or cash flows.
Critical Accounting Policies
The discussion and analysis of our financial condition and results of operations are based on our consolidated financial statements, which have been prepared in accordance with US GAAP. The preparation of these consolidated financial statements requires us to make estimates and assumptions that affect the reported amounts of assets and liabilities, disclosures of contingent assets and liabilities known to exist as of the date the consolidated financial statements are published and the reported amounts of revenues and expenses recognized during the periods presented. We review all significant estimates affecting our consolidated financial statements on a recurring basis and record the effect of any necessary adjustments prior to their publication. Judgments and estimates are based on our beliefs and assumptions derived from information available at the time such judgments and estimates are made. Uncertainties with respect to such estimates and assumptions are inherent in the preparation of financial statements. There can be no assurance that actual results will not differ from those estimates. Management has reviewed its development and selection of critical accounting estimates with the audit committee of our board of directors. We believe the following accounting policies affect our more significant judgments and estimates used in the preparation of our consolidated financial statements:
Revenue Recognition
We provide services pursuant to master service agreements, repair and maintenance contracts and fixed price and non-fixed price installation contracts. Pricing under these contracts may be competitive unit price, cost-plus/hourly (or time and materials basis) or fixed price (or lump sum basis), and the final terms and prices of these contracts are frequently negotiated with the customer. Under unit-based contracts, the utilization of an output-based measurement is appropriate for revenue recognition, and we recognize revenue as units are completed based on pricing established with the customer for each delivered unit, which best reflects the pattern in which the obligation to the customer is fulfilled. Under our cost-plus/hourly and time and materials type contracts, we recognize revenue on an input basis, as labor hours are incurred and services are performed.
Revenues from fixed price contracts are recognized using the percentage-of-completion method, measured by the percentage of costs incurred to date to total estimated costs for each contract. Such contracts provide that the customer accept completion of progress to date and compensate us for services rendered, which may be measured in terms of units installed, hours expended, costs incurred to date compared to total estimated contract costs or some other measure of progress. Contract costs include all direct materials, labor and subcontract costs and those indirect costs related to contract performance, such as indirect labor, supplies, tools, repairs and depreciation costs. Much of the material associated with our work is owner-furnished and is therefore not included in contract revenues and costs. The cost estimation process is based on professional knowledge and experience of our engineers, project managers and financial professionals. Changes in job performance, job conditions and final contract settlements are factors that influence management’s assessment of contract value and estimated costs, and as a result, the profit recognized.
As discussed in Note 3 of the Notes to Consolidated Financial Statements in Item 8. Financial Statements and Supplementary Data, effective for the quarter ending March 31, 2018, we will adopt new revenue recognition guidance using the modified
53
retrospective transition method. The new guidance will be applied to contracts with customers that were not substantially complete as of January 1, 2018. Our financial results for reporting periods after January 1, 2018 will be presented under the new guidance, while our financial results for prior periods will continue to be reported in accordance with the prior guidance and our historical accounting policy. We have substantially completed our evaluation of the impact of the new guidance on our contracts with customers, including identification of differences that will result from the new requirements. Based on this evaluation, we estimate that the net cumulative adjustment to retained earnings from adoption as of January 1, 2018 will be less than $10.0 million. With respect to ongoing revenues generated from master service agreements, repair and maintenance contracts and fixed price and non-fixed price installation contracts, we do not anticipate any significant changes to the pattern of revenue recognition and do not believe that the guidance surrounding identification of contracts and performance obligations or measurement of variable consideration will have a material impact on the revenue recognition for these arrangements. We expect our disclosures related to revenue recognition will expand to address new quantitative and qualitative requirements regarding the nature, amount and timing of revenue from contracts with customers and additional information related to contract assets and liabilities.
Actual revenues and project costs can vary, sometimes substantially, from previous estimates due to changes in a variety of factors, including unforeseen or changed circumstances not included in our cost estimates or covered by our contracts for which we cannot obtain adequate compensation or reimbursement. Some of these include concealed or unknown environmental conditions; changes in the cost of equipment, commodities, materials or labor; unanticipated costs or claims due to delays caused by customers or third parties; customer failure to provide required materials or equipment; errors in engineering, specifications or designs; project modifications or contract termination; weather conditions; and quality issues requiring rework or replacement. These factors, along with other risks inherent in performing fixed price contracts, may cause actual revenues and gross profits for a project to differ from previous estimates and could result in reduced profitability or losses on projects. Changes in these factors may result in revisions to costs and income, and their effects are recognized in the period in which the revisions are determined. These factors are routinely evaluated on a project-by-project basis throughout the project term, and the impact of any such revisions in management’s estimates of contract value, contract cost and contract profit are recorded as necessary in the period in which the revisions are determined. Provisions for losses on uncompleted contracts are made in the period in which such losses are determined to be probable and the amount can be reasonably estimated.
Our operating results for the year ended December 31, 2017 were impacted by less than 5% as a result of aggregate changes in contract estimates related to projects that were in progress at December 31, 2016. Our operating results for the year ended December 31, 2016 were impacted by less than 5% as a result of aggregate changes in contract estimates related to projects that were in progress at December 31, 2015. However, operating results for the year ended December 31, 2016 included losses of $54.8 million on a power plant construction project in Alaska due to performance issues that increased the estimated costs of the project. This project was substantially completed during the fourth quarter of 2016. The losses on this project were partially offset by the aggregate positive impact of numerous individually immaterial changes in profitability generally due to better than expected performance for projects that were ongoing at December 31, 2015. Our operating results for the year ended December 31, 2015 were impacted by numerous individually immaterial changes in contract estimates related to projects that were in progress at December 31, 2014; however, the aggregate impact was less than 5% despite losses of $44.9 million recorded during 2015 on the same Alaska power plant construction project.
The current asset “Costs and estimated earnings in excess of billings on uncompleted contracts” represents revenues recognized in excess of amounts billed for contracts accounted for under the percentage-of-completion method. The current liability “Billings in excess of costs and estimated earnings on uncompleted contracts” represents billings in excess of revenues recognized for contracts accounted for under the percentage-of-completion method.
We may incur costs subject to change orders, whether approved or unapproved by the customer, and/or claims related to certain contracts. We determine the probability that such costs will be recovered based upon evidence such as past practices with the customer, specific discussions or preliminary negotiations with the customer or verbal approvals. We treat items as costs of contract performance in the period incurred if it is not probable that the costs will be recovered or will recognize additional revenue if it is probable that the contract price will be adjusted and can be reliably estimated.
As of December 31, 2017 and 2016, we recognized revenues of $144.0 million and $137.8 million related to change orders and/or claims that were in the process of being negotiated and approved in the normal course of business. These aggregate contract price adjustments represent management’s best estimate of additional contract revenues which have been earned and which management believes are probable of collection. The amounts ultimately realized by us upon final acceptance by our customers could be higher or lower than such estimated amounts; however, such amounts cannot currently be estimated.
Insurance
As discussed in Contractual Obligations - Insurance, we are insured for employer’s liability, workers’ compensation, auto liability, general liability, and group health claims.
54
Losses under all of these insurance programs are accrued based upon our estimate of the ultimate liability for claims reported and an estimate of claims incurred but not reported, with assistance from third-party actuaries. These insurance liabilities are difficult to assess and estimate due to unknown factors, including the severity of an injury, the extent of damage, the determination of our liability in proportion to other parties and the number of incidents not reported. The accruals are based upon known facts and historical trends, and management believes such accruals are adequate. As of December 31, 2017 and 2016, the gross amount accrued for insurance claims totaled $254.7 million and $218.2 million, with $200.0 million and $162.0 million considered to be long term and included in “Insurance and other non-current liabilities.” Related insurance recoveries/receivables as of December 31, 2017 and 2016 were $50.4 million and $8.7 million, of which $0.4 million and $0.4 million were included in “Prepaid expenses and other current assets” and $50.0 million and $8.3 million were included in “Other assets, net.”
Valuation of Goodwill
We have recorded goodwill in connection with our historical acquisitions of companies. Upon acquisition, these companies were either combined into one of our existing operating units or managed on a stand-alone basis as an individual operating unit. Goodwill recorded in connection with these acquisitions is subject to an annual assessment for impairment, which we perform at the operating unit level for each operating unit that carries a balance of goodwill. Each of our operating units is organized into one of two internal divisions: the Electric Power Infrastructure Services Division and the Oil and Gas Infrastructure Services Division. As most of the companies acquired by us provide multiple types of services for multiple types of customers, these divisional designations are based on the predominant type of work performed by each operating unit at the point in time the divisional designation is made. Goodwill is required to be measured for impairment at the reporting unit level, which represents the operating segment level or one level below the operating segment level for which discrete financial information is available. We have determined that our individual operating units represent our reporting units for the purpose of assessing goodwill impairments.
In January 2017, the Financial Accounting Standards Board issued an update intended to simplify the subsequent measurement of goodwill by eliminating the second step in the two-step goodwill impairment test. The update requires an entity to perform its annual, or interim, goodwill impairment test by comparing the fair value of a reporting unit with its carrying amount and to recognize an impairment charge for the amount by which the carrying amount exceeds the fair value. The income tax effect associated with an impairment of tax deductible goodwill is also considered in the measurement of the goodwill impairment. We elected to adopt the provisions of the update in connection with our annual impairment test performed in the fourth quarter of 2017.
We have the option to first assess qualitative factors to determine whether it is necessary to perform the quantitative fair value-based impairment test described below. If we believe that, as a result of our qualitative assessment, it is more likely than not that the fair value of a reporting unit is less than its carrying amount, the quantitative impairment test is required. We can choose to perform the qualitative assessment on none, some, or all of our reporting units. We can also bypass the qualitative assessment for any reporting unit in any period and proceed directly to the quantitative impairment test, and then resume the qualitative assessment in any subsequent period. Qualitative indicators including deterioration in macroeconomic conditions, declining financial performance, or a sustained decrease in share price, among other things, may trigger the need for annual or interim impairment testing of goodwill associated with one or all of our reporting units.
Our annual goodwill impairment assessment is performed in the fourth quarter of our fiscal year, or more frequently if events or circumstances arise which indicate that goodwill may be impaired. For instance, a decrease in our market capitalization below book value, a significant change in business climate or loss of a significant customer, as well as the qualitative indicators referenced above, may trigger the need for interim impairment testing of goodwill for a reporting unit. The quantitative impairment test involves comparing the fair value of each of our reporting units with its carrying amount, including goodwill. If the carrying amount of a reporting unit exceeds its fair value, an impairment loss is recorded as a reduction to goodwill with a corresponding charge to “Asset impairment charges.” Any goodwill impairment is limited to the total amount of goodwill allocated to that reporting unit.
We determine the fair value of our reporting units using a weighted combination of the discounted cash flow, market multiple and market capitalization valuation approaches, with heavier weighting on the discounted cash flow method because management believes this method results in the most accurate calculation of fair value. Determining the fair value of a reporting unit requires judgment and the use of significant estimates and assumptions, including revenue growth rates, operating margins, discount rates, weighted average costs of capital and future market conditions. We believe the estimates and assumptions used in our impairment assessments are reasonable and based on available market information, but variations in any of the assumptions could result in materially different calculations of fair value and determinations of whether or not an impairment is indicated.
Under the discounted cash flow method, we determine fair value based on the estimated future cash flows of each reporting unit, discounted to present value using risk-adjusted industry discount rates, which reflect the overall level of inherent risk of a reporting unit and the rate of return an outside investor would expect to earn. Cash flow projections are derived from budgeted
55
amounts and operating forecasts (typically a one-year model) plus an estimate of later period cash flows, all of which are evaluated by management. Subsequent period cash flows are developed for each reporting unit using growth rates that management believes are reasonably likely to occur, along with a terminal value derived from the reporting unit’s earnings before interest, taxes, depreciation and amortization (EBITDA). The EBITDA multiples for each reporting unit are based on trailing twelve-month comparable industry data.
Under the market multiple and market capitalization approaches, we determine the estimated fair value of each of our reporting units by applying transaction multiples to each reporting unit’s projected EBITDA and then averaging that estimate with similar historical calculations using either a one, two or three year average. For the market capitalization approach, we add a reasonable control premium, which is estimated as the premium that would be received in a sale of the reporting unit in an orderly transaction between market participants.
The projected cash flows and estimated levels of EBITDA by reporting unit were used to determine fair value under the three approaches discussed herein. The following table presents the significant estimates used by management in determining the fair values of our reporting units at December 31, 2017, 2016 and 2015:
2017 | 2016 | 2015 | ||||
Years of cash flows before terminal value | 5 years | 5 years | 5 years | |||
Discount rates | 12.0% to 14.0% | 12.5% to 14.5% | 12.0% to 16.0% | |||
EBITDA multiples | 5.5 to 7.0 | 5.5 to 7.0 | 5.0 to 6.5 | |||
Weighting of three approaches: | ||||||
Discounted cash flows | 70% | 70% | 70% | |||
Market multiple | 15% | 15% | 15% | |||
Market capitalization | 15% | 15% | 15% | |||
For recently acquired reporting units, a quantitative impairment test may indicate a fair value that is substantially similar to the reporting unit’s carrying amount. Such similarities in value are generally an indication that management’s estimates of future cash flows associated with the recently acquired reporting unit remain relatively consistent with the assumptions that were used to derive its initial fair value.
During the fourth quarter of 2017, a quantitative fair-value based goodwill impairment analysis was performed for each of our reporting units, and no reporting units were evaluated solely on a qualitative basis. The analysis indicated that the fair value of each of our reporting units, with the exception of two reporting units in our Oil and Gas Infrastructure Services Division, was in excess of its carrying amount. We recorded a $57.0 million non-cash charge in the fourth quarter of 2017 for the impairment of goodwill associated with the two reporting units. Specifically, a reporting unit that provides material handling services experienced lower operating margins and is expected to continue to face a highly competitive environment in its select markets and a reporting unit that provides marine and offshore services experienced prolonged periods of reduced revenues and operating margins and is expected to continue to experience lower levels of activity in the U.S. Gulf of Mexico and other offshore markets.
As discussed generally above, when evaluating the 2017 quantitative impairment test results, management considered many factors in determining whether an impairment of goodwill for any reporting unit was reasonably likely to occur in future periods, including future market conditions and the economic environment. Additionally, management considered the sensitivity of its fair value estimates to changes in certain valuation assumptions. After taking into account a 10% decrease in the fair value of each of our reporting units, one additional reporting unit within our Oil and Gas Infrastructure Services Division would have a fair value below its carrying amount. The fair value determined in 2017 for this reporting unit was consistent with the fair value determined in 2016. Circumstances such as market declines, unfavorable economic conditions, loss of a major customer or other factors could increase the risk of impairment of goodwill for this reporting unit in future periods.
If an operating unit experiences prolonged periods of declining revenues, operating margins or both, it may be at risk of failing the quantitative goodwill impairment test. In addition to the reporting units referenced above, certain operating units have experienced declines over the short-term due to challenging macroeconomic conditions in certain geographic areas and low oil and natural gas prices, which have negatively impacted customer spending and resulted in project cancellations and delays. Additionally, customer capital spending has been constrained as a result of an increasingly complex regulatory and permitting environment. Certain operating units within our Oil and Gas Infrastructure Services Division that primarily operate within the midstream and smaller-scale transmission market, including the reporting unit referenced above, have continued to be negatively impacted by these factors. Goodwill and intangible assets associated with these operating units were $50.1 million and $14.7 million at December 31, 2017. We monitor these conditions and others to determine if it is necessary to perform the quantitative fair-value based impairment test for one or more operating units prior to the annual impairment assessment. Although we are not
56
aware of circumstances that would lead to additional goodwill impairments at this time, circumstances such as a continued market decline, the loss of a major customer or other factors could impact the valuation of goodwill in the future.
The goodwill analysis performed for each reporting unit was based on estimates and comparisons obtained from the electric power and oil and gas industries. We assigned a higher weighting to the discounted cash flow approach in all periods to reflect increased expectations of market value being determined from a “held and used” model. As stated previously, cash flows are derived from budgeted amounts and operating forecasts that have been evaluated by management. In connection with the 2017 assessment, reporting unit annual compounded revenue growth rates during the cash flow projection period varied from negative 14% to positive 17%.
Estimating future cash flows requires significant judgment, and our projections may vary from cash flows eventually realized. Changes in our judgments and projections could result in a significantly different estimate of the fair values of reporting units and intangible assets and could result in an impairment. Variances in the assessment of market conditions, projected cash flows, cost of capital, growth rates and acquisition multiples applied could have an impact on the assessment of impairments and the amount of any goodwill impairment charges recorded. For example, lower growth rates, lower acquisition multiples or higher costs of capital assumptions would all individually lead to lower fair value assessments and potentially increased frequency or size of goodwill impairments. Goodwill impairments are included within “Asset impairment charges” on our consolidated statements of operations.
Based on the goodwill impairment analysis, we compared the sum of fair values of our reporting units to our market capitalization at December 31, 2017 and determined that the excess of the aggregate fair value of all reporting units to our market capitalization reflected a reasonable control premium. Our market capitalization at December 31, 2017 was approximately $6.02 billion, and our total stockholders’ equity was approximately $3.79 billion. If the price of our common stock were to decline to a level that causes our market capitalization to be lower than the value of our stockholders’ equity, this would be another factor that could increase the risk of further impairment of goodwill in future periods. Increases in the carrying amount of individual reporting units that may be indicated by our impairment tests are not recorded, therefore we may record goodwill impairments in the future, even when the aggregate fair value of our reporting units as a whole may increase.
Our goodwill is included in multiple reporting units. Due to the cyclical nature of our business, and the other factors described under Risk Factors in Item 1A, the profitability of our individual reporting units may suffer from downturns in customer demand and other factors. These factors may have a disproportionate impact on the individual reporting units as compared to Quanta as a whole and might adversely affect the fair value of individual reporting units. If material adverse conditions occur that impact our reporting units, our future estimates of fair value may not support the carrying amount of one or more of our reporting units, and the related goodwill would need to be written down to an amount considered recoverable.
During the fourth quarter of 2015, management concluded that goodwill was impaired at two reporting units in our Oil and Gas Infrastructure Services Division and recorded a $39.8 million non-cash charge for the impairment of goodwill, which primarily resulted from lower levels of expected activity in the U.S. Gulf of Mexico and, to a lesser extent, the extended low commodity price environment for certain directional drilling operations in Australia.
Valuation of Other Intangible Assets
Our intangible assets include customer relationships, backlog, trade names, non-compete agreements, patented rights and developed technology, all of which are subject to amortization. The value of customer relationships is estimated as of the date a business is acquired based on the value-in-use concept utilizing the income approach, specifically the excess earnings method. This analysis discounts to present value the projected cash flows attributable to the customer relationships, with consideration given to customer contract renewals and estimated customer attrition rates. The following table presents the significant estimates used by management in determining the fair values of customer relationships associated with acquisitions in the years ended December 31, 2017, 2016 and 2015:
2017 | 2016 | 2015 | ||||
Discount rates | 17% to 25% | 20% to 23% | 18% to 22% | |||
Customer attrition rates | 15% to 78% | 10% to 70% | 14% to 70% | |||
We value backlog for acquired businesses as of the acquisition date based upon the contractual nature of the backlog within each service line, discounted to present value. The value of trade names is estimated using the relief-from-royalty method of the income approach. This approach is based on the assumption that in lieu of ownership, a company would be willing to pay a royalty for use of the trade name.
We amortize intangible assets based upon the estimated consumption of their economic benefits, or on a straight-line basis if the pattern of economic benefit cannot otherwise be reliably estimated. Intangible assets subject to amortization are reviewed for impairment and tested for recoverability whenever events or changes in circumstances indicate that the carrying amount may
57
not be recoverable. For instance, a significant change in business climate or a loss of a significant customer, among other things, may trigger the need for interim impairment testing of intangible assets. An impairment loss is recognized if the carrying amount of an intangible asset is not recoverable and its carrying amount exceeds its fair value. Intangible asset impairments are included within “Asset impairment charges” on our consolidated statements of operations.
During the fourth quarter of 2017, we recorded an impairment charge of $1.1 million related to a customer relationship intangible asset, which primarily resulted from a strategic decision to restructure a business within a reporting unit in our Oil and Gas Infrastructure Services Division.
During the fourth quarter of 2015, we recorded an impairment charge of $12.1 million related to customer relationship, trade name and non-compete agreement intangible assets, which primarily resulted from lower levels of expected activity in the U.S. Gulf of Mexico and, to a lesser extent, the extended low commodity price environment for certain directional drilling operations in Australia. The two reporting units impacted also had related goodwill impairments, as discussed above, and are in our Oil and Gas Infrastructure Services Division.
Valuation of Long-Lived Assets
We review long-lived assets for impairment whenever events or changes in circumstances indicate that the carrying amount may not be realizable. If an evaluation is required, the estimated future undiscounted cash flows associated with the asset group are compared to the asset group’s carrying amount to determine if an impairment of such asset group is necessary. This requires us to make long-term forecasts of the future revenues and costs related to the asset group subject to review. Forecasts require assumptions about demand for our products and future market conditions. Estimating future cash flows requires significant judgment, and our projections may vary from the cash flows eventually realized. When an impairment exists, the difference between the fair value of such asset group and its carrying amount is expensed and reflected in operating income (loss) in our consolidated statements of operations. In addition, we estimate the useful lives of our long-lived assets and periodically review these estimates to determine whether they are appropriate.
We recorded asset impairments primarily related to certain international renewable energy services operations of $8.0 million in 2016 and $6.6 million in 2015. The 2016 impairment was primarily due to a pending disposition of certain international renewable energy services operations, which was completed in 2017, and the 2015 impairment was based on the estimated future undiscounted cash flows for the asset group as compared to their carrying amount.
Current and Long-Term Accounts and Notes Receivable and Allowance for Doubtful Accounts
We provide an allowance for doubtful accounts when collection of an account or note receivable is considered doubtful, and receivables are written off against the allowance when deemed uncollectible. Inherent in the assessment of the allowance for doubtful accounts are certain judgments and estimates regarding, among other factors, our customer’s access to capital, our customer’s willingness or ability to pay, general economic and market conditions, the ongoing relationship with the customer and uncertainties related to the resolution of disputed matters. We consider accounts receivable delinquent after 30 days but do not generally include delinquent accounts in our analysis of the allowance for doubtful accounts unless the accounts receivable have been outstanding for at least 90 days. We also include accounts receivable balances that relate to customers in bankruptcy or with other known difficulties in our analysis of the allowance for doubtful accounts. Material changes in our customers’ business or cash flows, which may be impacted by negative economic and market conditions, could affect our ability to collect amounts due. As of December 31, 2017 and 2016, we had allowances for doubtful accounts on current receivables of $4.5 million and $2.8 million. Long-term accounts receivable are included within “Other assets, net” on our consolidated balance sheets.
Should customers experience financial difficulties or file for bankruptcy, or should anticipated recoveries relating to receivables in existing bankruptcies or other workout situations fail to materialize, we could experience reduced cash flows and losses in excess of current allowances provided.
The balances billed but not paid by customers pursuant to retainage provisions in certain contracts are generally due upon completion of the contracts and acceptance by the customer. Based on our experience with similar contracts in recent years, the majority of the retainage balances at each balance sheet date are expected to be collected within the next twelve months. Current retainage balances as of December 31, 2017 and 2016 were $300.5 million and $231.0 million and were included in “Accounts receivable.” Retainage balances with settlement dates beyond the next twelve months were included in “Other assets, net,” and as of December 31, 2017 and 2016 were $41.9 million and $5.2 million.
Within accounts receivable, we recognize unbilled receivables in circumstances such as when revenues have been earned and recorded but the amount cannot be billed under the terms of the contract until a later date; costs have been incurred but are yet to be billed under cost-reimbursement type contracts; or amounts arise from routine lags in billing (for example, work completed one month but not billed until the next month). These balances do not include revenues accrued for work performed under fixed-price contracts as these amounts are recorded as “Costs and estimated earnings in excess of billings on uncompleted contracts.”
58
At December 31, 2017 and 2016, the balances of unbilled receivables included in “Accounts receivable” were $303.9 million and $206.8 million.
Contingent Consideration Liabilities
We have recorded liabilities related to contingent consideration associated with certain acquisitions, the payment of which is contingent upon the future financial performance of the acquired businesses and, if earned, would be payable to the former owners of the acquired businesses. The liabilities recorded represent the estimated fair values of future amounts payable to the former owners, and the fair values are estimated by management based on entity-specific assumptions that are evaluated on an ongoing basis. As of December 31, 2017 and 2016, the aggregate fair value of these outstanding and unearned contingent consideration liabilities totaled $65.7 million and $19.5 million, which was included in “Insurance and other non-current liabilities” on our consolidated balance sheets.
The fair values of each contingent consideration liability as of December 31, 2017 was determined using a Monte Carlo simulation valuation methodology based on probability-weighted financial performance projections and other inputs, including a discount rate and an expected volatility factor for each acquisition. The discount rates ranged from 0.9% to 2.3% depending on the settlement methods available and are generally based on a risk-free rate and/or our cost of debt. The expected volatility factors ranged from 23.0% to 32.7% based on historical asset volatility of selected guideline public companies. The fair value determinations incorporate significant inputs not observable in the market. Accordingly, the level of inputs used for these fair value measurements is the lowest level (Level 3). Significant changes in any of these assumptions could result in a significantly higher or lower potential liability. We expect a significant portion of these liabilities to be settled by late 2020 or early 2021.
Our aggregate contingent consideration liabilities can change due to additional business acquisitions, payments to settle outstanding liabilities, changes in the fair value of amounts owed and foreign currency translation gains or losses. During the year ended December 31, 2017, we recognized a decrease in the fair value of contingent consideration liabilities of $5.2 million. No changes in fair value of contingent consideration liabilities were recognized in 2016 and 2015. Changes in fair value of contingent consideration liabilities are included in “Change in fair value of contingent consideration liabilities” on our consolidated statements of operations.
Income Taxes
We follow the liability method of accounting for income taxes. Under this method, deferred tax assets and liabilities are recorded for future tax consequences of temporary differences between the financial reporting and tax bases of assets and liabilities and are measured using the enacted tax rates and laws that are expected to be in effect when the underlying assets or liabilities are recovered or settled.
We regularly evaluate valuation allowances established for deferred tax assets for which future realization is uncertain, including in connection with changes in tax laws affecting these assets. The estimation of required valuation allowances includes estimates of future taxable income. The ultimate realization of deferred tax assets is dependent upon the generation of future taxable income during the periods in which those temporary differences become deductible. We consider projected future taxable income and tax planning strategies in making this assessment. If actual future taxable income differs from our estimates, we may not realize deferred tax assets to the extent estimated.
We record reserves for income taxes related to certain tax positions in those instances where we consider it more likely than not that additional taxes may be due in excess of amounts reflected on income tax returns filed. When recording reserves for expected tax consequences of uncertain positions, we assume that taxing authorities have full knowledge of the position and all relevant facts. We continually review exposure to additional tax obligations, and as further information is known or events occur, changes in tax reserves may be recorded. To the extent interest and penalties may be assessed by taxing authorities on any underpayment of income tax, such amounts have been accrued and included in the provision for income taxes.
As of December 31, 2017, the total amount of unrecognized tax benefits relating to uncertain tax positions was $36.2 million, an increase from December 31, 2016 of $1.0 million. This increase resulted primarily from a $7.0 million increase in reserves for uncertain tax positions to be taken for 2017 and a $2.2 million increase for uncertain tax positions related to prior years, partially offset by an $8.3 million decrease in reserves for uncertain tax positions resulting from the expiration of statute of limitations periods. Although the IRS completed its examination related to tax years 2010, 2011 and 2012 during the year ended December 31, 2016, certain subsidiaries remain under examination by various U.S. state, Canadian and other foreign tax authorities for multiple periods. We believe it is reasonably possible that within the next 12 months unrecognized tax benefits may decrease by up to $13.7 million as a result of settlement of these examinations or as a result of the expiration of certain statute of limitations periods.
U.S. federal and state and foreign income tax laws and regulations are voluminous and are often ambiguous. As such, we are required to make many subjective assumptions and judgments regarding our tax positions that could materially affect amounts recognized in our future consolidated balance sheets, consolidated statements of operations and consolidated statements of
59
comprehensive income. For example, as previously described, the Tax Act significantly revised the U.S. corporate tax regime and resulted in a remeasurement of our deferred tax assets and liabilities and is anticipated to significantly reduce our future effective tax rate. For additional information on the status of our provisional analysis of the Tax Act, refer to Note 10 of the Notes to Consolidated Financial Statements in Item 8. Financial Statements and Supplementary Data.
Outlook
We believe there are growth opportunities across the industries we serve and continue to have a positive long-term outlook. Overall, favorable end-market drivers have spurred demand for infrastructure services in both our Electric Power Infrastructure Services and Oil and Gas Infrastructure Services segments, and we believe both segments are generally entering a renewed multi-year up-cycle. We are focused on long-term profitable growth and continuing to distinguish ourselves through safe execution and best-in-class field leadership. Though not without risks and challenges, including those discussed below and referenced in Item 1A. Risk Factors and Uncertainty of Forward-Looking Statements and Information, we believe we are well-positioned to capitalize on opportunities and trends in the industries we serve with our full-service operations, broad geographic reach, financial position and technical expertise.
Electric Power Infrastructure Services Segment
We expect demand for electricity in North America to grow over the long term and believe that certain segments of the North American electric power grid are not adequate to efficiently serve the power needs of the future. These factors have affected and will continue to affect reliability, requiring utilities to upgrade, modernize and expand their existing transmission and distribution systems. Furthermore, current federal legislation also requires the power industry to meet federal reliability standards for its transmission and distribution systems. In response to these dynamics, over the past several years, many utilities across North America have begun to implement plans to upgrade their transmission and distribution systems in order to improve reliability and reduce congestion.
As demand for power increases, we expect the need for new power generation facilities to also increase. The development of such facilities, expected to be powered by certain types of traditional energy sources and renewable energy sources such as solar and wind, would necessitate new or expanded transmission infrastructure to transport power to demand centers. Furthermore, we anticipate that the access to low cost natural gas resources from unconventional shale formations in the United States and Canada will continue to increase the amount of electricity generated by natural gas powered plants. To the extent this dynamic continues, transmission and substation infrastructure will be needed to interconnect new natural gas-fired generation facilities. We also anticipate that modification and reengineering of existing transmission and substation infrastructure will be required as existing coal and nuclear generation facilities are retired or shut down.
With respect to distribution systems, a number of utilities are implementing system upgrades or hardening programs in response to severe weather events that have occurred over the past several years, which is increasing distribution investment in some regions of the United States. We also anticipate that utilities will continue to integrate smart grid technologies into their distribution systems over time to improve grid management and create efficiencies. Further, to the extent adoption of electrical vehicle technology increases, we believe upgrades to distribution and other electrical infrastructure will be required to accommodate increased load demand.
We believe that several existing, pending or proposed legislative or regulatory actions may also positively impact long-term demand for the services we provide, particularly in connection with electric power infrastructure and renewable energy spending. For example, legislative or regulatory action that alleviates some of the siting and right-of-way challenges that impact transmission projects would potentially accelerate future construction, and federal reliability standards for transmission and distribution systems could create incentives for system investment and maintenance. We also consider renewable energy, including solar and wind generation facilities, to be an ongoing opportunity for our engineering, project management and installation services; however, the economic feasibility of these projects may depend on the availability of tax incentive programs and there is no assurance that existing incentive programs will be extended or that new incentive programs will be implemented.
Despite these positive trends, the regulatory and environmental permitting processes remain a hurdle for some proposed transmission and renewable energy projects, and these factors continue to create uncertainty as to timing of projects and customer spending. In the near term, margins for our electric power infrastructure services operations have been impacted by regulatory and permitting delays and unfavorable economic and market conditions, particularly for larger transmission projects. We anticipate many of these issues to be resolved over the long term, as a number of these projects are currently underway, and we expect this segment’s backlog to remain strong during 2018.
60
Our customers are also seeking additional specialized labor resources to address an aging utility workforce and labor availability issues, increasing pressure to reduce costs and improve reliability, and increasing duration and complexity of customer capital programs. We believe these trends will continue, possibly to the point where customer demand for labor resources will outpace the supply of industry resources. Our ability to take advantage of this opportunity is limited by our ability to employ, train and retain the necessary skilled personnel. We are taking proactive steps to develop our workforce, including through the establishment and expansion of our training facility, our recent acquisition of a postsecondary educational institution that provides pre-apprenticeship training and programs for experienced linemen, and other strategic relationships.
With respect to our communications service offerings, consumer and commercial demand in North America and Latin America for communication and data-intensive, high-bandwidth wireline and wireless services and applications is driving significant investment in infrastructure and the deployment of new technologies. In particular, we believe there is increasing demand to upgrade or build fiber optic networks that are closer or connected to the end user, and in North America there are plans for new wireless networks and improvements to existing wireless networks. As a result of these near- and longer-term industry trends, we believe there will be meaningful demand for our services.
Oil and Gas Infrastructure Services Segment
We continue to see growth opportunities in our Oil and Gas Infrastructure Services segment, primarily with respect to installation and maintenance of larger pipeline systems and related facilities and services related to pipeline integrity, natural gas distribution, horizontal directional drilling and downstream industrial services. A number of larger pipeline projects from the North American shale formations and Canadian oil sands to power plants, refineries and other demand centers are in various stages of development. While there is risk the projects will not move forward or could be delayed, we believe many of our customers remain committed to them given the cost and time required to move from conception to construction. We expect to continue to execute on a significant number of larger pipeline projects during 2018.
Due to its abundant supply and current low price, we believe the demand for North American natural gas will continue to increase in the future and that natural gas will be the fuel of choice for both primary power generation and backup power generation for renewable-driven power plants. In certain areas of North America, the existing pipeline system infrastructure is insufficient to support this expected future development. Furthermore, the abundance of low price natural gas in the United States, Canada and Australia has also resulted in efforts to develop liquefied natural gas (LNG) export facilities to serve higher-price international markets, which could provide pipeline and related facilities development opportunities for us. Although fluctuating commodity prices, regulatory issues and changing economic conditions may impact the number of projects that ultimately move forward, we believe our comprehensive service offerings and broad geographic presence enable us to competitively pursue opportunities that become available.
We also believe there are growth opportunities for some of our other pipeline services over the long term, including pipeline integrity, rehabilitation and replacement services. Regulatory measures have and could continue to increase the frequency or stringency of pipeline integrity testing requirements, which we expect to result in increased capital expenditures by our customers. We have also experienced an increase in demand for our natural gas distribution services as a result of improved economic conditions, lower natural gas prices and a significant need to upgrade and replace aging infrastructure.
Despite these positive trends, a challenging regulatory and permitting environment has caused the delay of some larger pipeline projects during the past several years. These dynamics resulted in a below average number of larger pipeline construction opportunities for us and the industry during that period, and negatively impacted our segment margins, in part as a result of our inability to adequately cover certain fixed costs. Margins for larger pipeline projects are also subject to significant performance risk, which can arise from adverse weather conditions, challenging geography, customer decisions and crew productivity. Specific opportunities for larger pipeline projects are also sometimes difficult to predict because of the seasonality of bidding and construction cycles.
Additionally, the oil and gas industry is highly cyclical and subject to volatility as a result of fluctuations in natural gas, natural gas liquids and oil prices. Certain of our end markets remain challenged as the broader energy market has not fully recovered from the significant decline in prices that began in mid-2014. Exploration and production companies and midstream companies significantly reduced capital spending in response to the decline, and demand in areas where the price of oil is influential, such as Australia, the Canadian Oil Sands, certain oil-driven U.S. shale formations and the Gulf of Mexico, has been adversely impacted by low oil prices. If oil and natural gas prices decline further or remain at lower levels over the long term, our outlook may change and demand for our services could be materially impacted.
We have also recently expanded our industrial services offerings, including high-pressure and critical-path turnaround services to the downstream and midstream energy markets, and enhanced our capabilities with respect to instrumentation and electrical services, piping, fabrication and storage tank services. While these services have been negatively impacted in the short term by historic adverse weather events in the U.S. Gulf Coast region, we believe, looking at trends and estimates for process
61
facility utilization rates and overall refining capacity, North America will be the largest downstream maintenance market in the world over the next several years. Furthermore, we believe processing facilities located along the U.S. Gulf Coast region should have certain strategic advantages due to their access and proximity to affordable hydrocarbon resources.
Overall, we remain optimistic about this segment’s operations. From a near- and medium-term perspective, we continue to believe that larger pipeline opportunities can provide significant profitability, although these projects are often subject to more cyclicality and execution risk than our other service offerings. We have also taken steps to diversify our operations in this segment through other services, such as pipeline integrity, pipeline logistics, and downstream industrial services.
Strategic Acquisitions and Investments
We continue to evaluate potential strategic acquisitions and investments to broaden our customer base, expand our geographic area of operations, grow our portfolio of services and increase opportunities across our operations. We believe that attractive growth opportunities exist primarily due to the highly fragmented and evolving nature of the industries in which we operate and adjacent industries, along with the inability of many companies to expand and modernize due to capital or liquidity constraints. We will pursue opportunities designed to enhance our core business and leadership position in the industries we serve and provide innovative solutions to our customers. We also believe our unique operating model and entrepreneurial mindset will continue to be attractive to acquisition candidates.
Uncertainty of Forward-Looking Statements and Information
This Annual Report on Form 10-K includes “forward-looking statements” reflecting assumptions, expectations, projections, intentions or beliefs about future events that are intended to qualify for the “safe harbor” from liability established by the Private Securities Litigation Reform Act of 1995. You can identify these statements by the fact that they do not relate strictly to historical or current facts. They use words such as “anticipate,” “estimate,” “project,” “forecast,” “may,” “will,” “should,” “could,” “expect,” “believe,” “plan,” “intend” and other words of similar meaning. In particular, these include, but are not limited to, statements relating to the following:
• | Projected revenues, net income, earnings per share, margins, weighted average shares outstanding, capital expenditures, tax rates and other projections of operating or financial results; |
• | Expectations regarding our business or financial outlook, growth, trends or opportunities in particular markets; |
• | The expected value of contracts or intended contracts with customers; |
• | Future capital allocation initiatives; |
• | The scope, services, term and results of any projects awarded or expected to be awarded for services to be provided by us; |
• | The development of larger electric transmission and oil and natural gas pipeline projects and the level of oil, natural gas and natural gas liquids prices and their impact on our business or demand for our services; |
• | The impact of existing or potential legislation or regulation, including the Tax Act; |
• | Potential opportunities that may be indicated by bidding activity or similar discussions with customers; |
• | The future demand for and availability of labor resources in the industries we serve; |
• | The potential benefits from investments or acquisitions, including Stronghold; |
• | The expected outcome of pending or threatened litigation; |
• | Beliefs and assumptions about the collectability of receivables; |
• | The business plans or financial condition of our customers; |
• | Our plans and strategies; |
62
• | Possible recovery on pending or contemplated change orders or other claims against customers or third parties; and |
• | The current economic and regulatory conditions and trends in the industries we serve. |
These forward-looking statements are not guarantees of future performance, involve or rely on a number of risks, uncertainties, and assumptions that are difficult to predict or beyond our control, and reflect management’s beliefs and assumptions based on information available at the time the statements are made. We caution you that actual outcomes and results may differ materially from what is expressed, implied or forecasted by our forward-looking statements and that any or all of our forward-looking statements may turn out to be inaccurate or incorrect. Those statements can be affected by inaccurate assumptions and by known or unknown risks and uncertainties, including the following:
• | Market conditions; |
• | The effects of industry, economic, financial or political conditions outside our control, including weakness in the capital markets; |
• | Quarterly variations in our operating results; |
• | Trends and growth opportunities in relevant markets; |
• | Delays, reductions in scope or cancellations of anticipated, pending or existing projects, including as a result of weather, regulatory or permitting issues, environmental processes, project performance issues, claimed force majeure events, protests, legal challenges or other political activity or our customers’ capital constraints; |
• | The successful negotiation, execution, performance and completion of anticipated, pending and existing contracts, including the ability to obtain awards of projects on which we bid or are otherwise discussing with customers; |
• | Our dependence on suppliers, subcontractors, equipment manufacturers and other third-party contractors; |
• | Our ability to attract and the potential shortage of skilled employees and our ability to retain key personnel and qualified employees; |
• | Our dependence on fixed price contracts and the potential to incur losses with respect to these contracts; |
• | Estimates relating to our use of percentage-of-completion accounting; |
• | Adverse weather conditions or events; |
• | Our ability to generate internal growth; |
• | Competition in our business, including our ability to effectively compete for new projects and market share; |
• | The effect of natural gas, natural gas liquids and oil prices on our operations and growth opportunities and on our customers’ capital programs and demand for our services; |
• | The future development of natural resources; |
• | The failure of existing or potential legislative actions and initiatives to result in demand for our services; |
• | Liabilities associated with multiemployer pension plans, including underfunding of liabilities and termination or withdrawal liabilities; |
• | Unexpected costs or liabilities that may arise from pending or threatened litigation, indemnity obligations or other claims asserted against us, including liabilities and costs for which we are not covered by third-party insurance; |
• | The outcome of pending or threatened litigation; |
• | Risks relating to the potential unavailability or cancellation of third-party insurance, the exclusion of coverage for certain losses, and potential increases in premiums for coverage deemed beneficial to us; |
63
• | Cancellation provisions within our contracts and the risk that contracts expire and are not renewed or are replaced on less favorable terms; |
• | Loss of customers with whom we have long-standing or significant relationships; |
• | The potential that participation in joint ventures or similar structures exposes us to liability and/or harm to our reputation for acts or omissions by our partners; |
• | Our inability or failure to comply with the terms of our contracts, which may result in additional costs, unexcused delays, warranty claims, failure to meet performance guarantees, damages or contract terminations; |
• | The inability or refusal of our customers to pay for services, including failure to collect our outstanding receivables; |
• | The failure to recover on payment claims against project owners or third-party contractors or to obtain adequate compensation for customer-requested change orders; |
• | The failure of our customers to comply with regulatory requirements applicable to their projects, which may result in project delays and cancellations; |
• | Budgetary or other constraints that may reduce or eliminate tax incentives or government funding for projects, which may result in project delays or cancellations; |
• | Estimates and assumptions in determining our financial results and backlog; |
• | Our ability to realize our backlog; |
• | Risks associated with operating in international markets, including instability of foreign governments, currency fluctuations, tax and investment strategies, as well as compliance with foreign legal systems and cultural practices, the U.S. Foreign Corrupt Practices Act and other applicable anti-bribery and anti-corruption laws; |
• | Our ability to successfully identify, complete, integrate and realize synergies from acquisitions, including Stronghold; |
• | The potential adverse impact resulting from uncertainty surrounding acquisitions, including the ability to retain key personnel from an acquired business and the potential increase in risks already existing in our operations; |
• | The adverse impact of impairments of goodwill, other intangible assets, receivables, long-lived assets or investments; |
• | Our growth outpacing our decentralized management and infrastructure; |
• | Requirements relating to governmental regulation and changes thereto; |
• | Inability to enforce our intellectual property rights or the obsolescence of such rights; |
• | Risks related to the implementation of new information technology solutions; |
• | The impact of our unionized workforce on our operations, including labor stoppages or interruptions due to strikes or lockouts; |
• | Potential liabilities and other adverse effects arising from occupational health and safety matters; |
• | The cost of borrowing, availability of cash and credit, fluctuations in the price and volume of our common stock, debt covenant compliance, interest rate fluctuations and other factors affecting our financing and investing activities; |
• | Fluctuations of prices of certain materials used in our business; |
• | The ability to access sufficient funding to finance desired growth and operations; |
• | Our ability to obtain performance bonds; |
64
• | Potential exposure to environmental liabilities; |
• | Our ability to meet the regulatory requirements applicable to us and our subsidiaries, including the Sarbanes-Oxley Act of 2002; |
• | Rapid technological and other structural changes that could reduce the demand for our services; |
• | New or changed tax laws, treaties or regulations; |
• | Increased healthcare costs arising from healthcare reform legislation or other legislative action; |
• | Regulatory changes that result in increased labor costs; |
• | Significant fluctuations in foreign currency exchange rates; and |
• | The other risks and uncertainties described elsewhere herein and in Item 1A. Risk Factors in this report on Form 10-K and as may be detailed from time to time in our other public filings with the SEC. |
All of our forward-looking statements, whether written or oral, are expressly qualified by these cautionary statements and any other cautionary statements that may accompany such forward-looking statements or that are otherwise included in this report. In addition, we do not undertake and expressly disclaim any obligation to update or revise any forward-looking statements to reflect events or circumstances after the date of this report or otherwise.
ITEM 7A. | Quantitative and Qualitative Disclosures about Market Risk |
Our primary exposure to market risk relates to unfavorable changes in concentration of credit risk, interest rates and currency exchange rates.
Credit Risk. We are subject to concentrations of credit risk related to our cash and cash equivalents and our net receivable position with customers, which includes amounts related to billed and unbilled accounts receivable and costs and estimated earnings in excess of billings on uncompleted contracts net of advanced billings with the same customer. Substantially all of our cash and cash equivalents are managed by what we believe to be high credit quality financial institutions. In accordance with our investment policies, these institutions are authorized to invest cash and cash equivalents in a diversified portfolio of what we believe to be high-quality investments, which primarily include interest-bearing demand deposits, money market investments and money market mutual funds with original maturities of three months or less. Although we do not currently believe the principal amounts of these cash and cash equivalents are subject to any material risk of loss, changes in economic conditions could impact the interest income we receive from these investments. In addition, as we grant credit under normal payment terms, generally without collateral, we are subject to potential credit risk related to our customers’ ability to pay for services provided. This risk may be heightened as a result of depressed economic and financial market conditions. However, we believe the concentration of credit risk related to billed and unbilled receivables and costs and estimated earnings in excess of billings on uncompleted contracts is limited because of the diversity of our customers. We perform ongoing credit risk assessments of our customers and financial institutions and in some cases we obtain collateral or other security from our customers.
Interest Rate Risk. As of December 31, 2017, we had no derivative financial instruments to manage interest rate risk. As such, we were exposed to earnings and fair value risk due to changes in interest rates with respect to our long-term obligations. As of December 31, 2017, the fair value of our variable rate debt of $668.4 million approximated book value. Our weighted average interest rate on our variable rate debt for the year ended December 31, 2017 was 2.7%. The annual effect on our pretax earnings of a hypothetical 50 basis point increase or decrease in variable interest rates would be approximately $3.3 million based on our December 31, 2017 balance of variable rate debt.
Foreign Currency Risk. The U.S. dollar is the functional currency for the majority of our operations, which are primarily located within the United States. The functional currency for our foreign operations, which are primarily located in Canada, Australia and Latin America, is typically the currency of the country in which the foreign operating unit is located. Accordingly, our financial performance is subject to fluctuation due to changes in foreign currency exchange rates relative to the U.S. dollar. During 2017, revenues from our foreign operations accounted for 26.2% of our consolidated revenues. Fluctuations in foreign exchange rates during the year ended December 31, 2017 caused an increase of approximately $53 million in foreign revenues compared to the year ended December 31, 2016. Fluctuations in foreign exchange rates during the year ended December 31, 2016 caused a decrease of approximately $41 million in foreign revenues compared to the year ended December 31, 2015.
We are also subject to foreign currency risk with respect to sales, purchases and borrowings that are denominated in a currency other than the respective functional currencies of our operating units. To minimize the risk from changes in foreign
65
currency exchange rates, we may enter into foreign currency derivative contracts to hedge our foreign currency risk on a cash flow basis. There were no outstanding foreign currency derivative contracts at December 31, 2017.
We also have foreign exchange risk related to cash and cash equivalents in foreign banks. Based on the balance of cash and cash equivalents in foreign banks of $55.2 million as of December 31, 2017, an assumed 5% adverse change to foreign exchange rates would result in a fair value decline of $2.8 million. Fluctuations in fair value are recorded in “Accumulated other comprehensive income (loss)”, a separate component of stockholders’ equity.
66
ITEM 8. | Financial Statements and Supplementary Data |
INDEX TO QUANTA SERVICES, INC.’S CONSOLIDATED FINANCIAL STATEMENTS
Page | |
67
REPORT OF MANAGEMENT
Management’s Report on Financial Information and Procedures
The accompanying financial statements of Quanta Services, Inc. and its subsidiaries were prepared by management. These financial statements were prepared in accordance with accounting principles generally accepted in the United States, applying certain estimates and judgments as required.
Our management, including our Chief Executive Officer and Chief Financial Officer, does not expect that our disclosure controls or our internal control over financial reporting will prevent or detect all errors and all fraud. A control system, no matter how well designed and operated, can provide only reasonable, not absolute, assurance that the control system’s objectives will be met. The design of a control system must reflect the fact that there are resource constraints, and the benefits of controls must be considered relative to their costs. Further, because of the inherent limitations in all control systems, no evaluation of controls can provide absolute assurance that misstatements due to error or fraud will not occur or that all control issues and instances of fraud, if any, within the company have been detected. These inherent limitations include the realities that judgments in decision-making can be faulty and that breakdowns can occur because of simple errors or mistakes. Controls can also be circumvented by the individual acts of some persons, by collusion of two or more people, or by management override of the controls. The design of any system of controls is based in part on certain assumptions about the likelihood of future events, and there can be no assurance that any design will succeed in achieving its stated goals under all potential future conditions. Over time, controls may become inadequate because of changes in conditions or deterioration in the degree of compliance with policies or procedures.
Management’s Report on Internal Control Over Financial Reporting
Our management is responsible for establishing and maintaining adequate internal control over financial reporting as defined in Rule 13a-15(f) under the Securities Exchange Act of 1934. Our internal control over financial reporting is a process designed to provide reasonable assurance regarding the reliability of financial reporting and the preparation of our consolidated financial statements for external purposes in accordance with U.S. generally accepted accounting principles. Internal control over financial reporting includes those policies and procedures that (i) pertain to the maintenance of records that in reasonable detail accurately and fairly reflect the transactions and dispositions of the assets of the company; (ii) provide reasonable assurance that transactions are recorded as necessary to permit preparation of financial statements in accordance with U.S. generally accepted accounting principles, and that receipts and expenditures of the company are being made only in accordance with authorizations of management and directors of the company; and (iii) provide reasonable assurance regarding prevention or timely detection of unauthorized acquisition, use or disposition of the company’s assets that could have a material effect on the financial statements.
Under the supervision and with the participation of our management, including our Chief Executive Officer and Chief Financial Officer, we have conducted an evaluation of the effectiveness of our internal control over financial reporting based upon the criteria established in Internal Control — Integrated Framework (2013) issued by the Committee of Sponsoring Organizations of the Treadway Commission. Based on this evaluation, our management has concluded that our internal control over financial reporting was effective as of December 31, 2017 to provide reasonable assurance regarding the reliability of financial reporting and the preparation of financial statements for external reporting purposes in accordance with U.S. generally accepted accounting principles.
Because of its inherent limitations, a system of internal control over financial reporting can provide only reasonable assurances and may not prevent or detect misstatements. Also, projections of any evaluation of effectiveness to future periods are subject to the risk that controls may become inadequate because of changes in conditions, or that the degree of compliance with policies and procedures may deteriorate.
The effectiveness of Quanta Services, Inc.’s internal control over financial reporting as of December 31, 2017 has been audited by PricewaterhouseCoopers LLP, an independent registered public accounting firm, as stated in its report which appears herein.
Management’s assessment of the effectiveness of our internal control over financial reporting as of December 31, 2017 excluded the three acquisitions we completed in 2017. Such exclusion was in accordance with SEC guidance that an assessment of recently acquired businesses may be omitted in management’s report on internal control over financial reporting, provided the acquisition took place within twelve months of management’s evaluation. These acquisitions comprised approximately 2.5% and 2.2% of our consolidated assets and revenues as of and for the year ended December 31, 2017.
68
REPORT OF INDEPENDENT REGISTERED PUBLIC ACCOUNTING FIRM
To the Board of Directors and Stockholders of Quanta Services, Inc.:
Opinions on the Financial Statements and Internal Control over Financial Reporting
We have audited the accompanying consolidated balance sheets of Quanta Services, Inc. and its subsidiaries as of December 31, 2017 and 2016, and the related consolidated statements of operations, comprehensive income, cash flows and equity for each of the three years in the period ended December 31, 2017, including the related notes (collectively referred to as the “consolidated financial statements”). We also have audited the Company’s internal control over financial reporting as of December 31, 2017, based on criteria established in Internal Control - Integrated Framework (2013) issued by the Committee of Sponsoring Organizations of the Treadway Commission (COSO).
In our opinion, the consolidated financial statements referred to above present fairly, in all material respects, the financial position of the Company as of December 31, 2017 and 2016, and the results of its operations and its cash flows for each of the three years in the period ended December 31, 2017 in conformity with accounting principles generally accepted in the United States of America. Also in our opinion, the Company maintained, in all material respects, effective internal control over financial reporting as of December 31, 2017, based on criteria established in Internal Control - Integrated Framework (2013) issued by the COSO.
Basis for Opinions
The Company’s management is responsible for these consolidated financial statements, for maintaining effective internal control over financial reporting, and for its assessment of the effectiveness of internal control over financial reporting, included in the accompanying Management’s Report on Internal Control over Financial Reporting. Our responsibility is to express opinions on the Company’s consolidated financial statements and on the Company’s internal control over financial reporting based on our audits. We are a public accounting firm registered with the Public Company Accounting Oversight Board (United States) ("PCAOB") and are required to be independent with respect to the Company in accordance with the U.S. federal securities laws and the applicable rules and regulations of the Securities and Exchange Commission and the PCAOB.
We conducted our audits in accordance with the standards of the PCAOB. Those standards require that we plan and perform the audits to obtain reasonable assurance about whether the consolidated financial statements are free of material misstatement, whether due to error or fraud, and whether effective internal control over financial reporting was maintained in all material respects.
Our audits of the consolidated financial statements included performing procedures to assess the risks of material misstatement of the consolidated financial statements, whether due to error or fraud, and performing procedures that respond to those risks. Such procedures included examining, on a test basis, evidence regarding the amounts and disclosures in the consolidated financial statements. Our audits also included evaluating the accounting principles used and significant estimates made by management, as well as evaluating the overall presentation of the consolidated financial statements. Our audit of internal control over financial reporting included obtaining an understanding of internal control over financial reporting, assessing the risk that a material weakness exists, and testing and evaluating the design and operating effectiveness of internal control based on the assessed risk. Our audits also included performing such other procedures as we considered necessary in the circumstances. We believe that our audits provide a reasonable basis for our opinions.
As described in Management’s Report on Internal Control over Financial Reporting, management has excluded its 2017 acquisitions from its assessment of internal control over financial reporting as of December 31, 2017 because they were acquired by the Company in purchase business combinations during 2017. We have also excluded the 2017 acquisitions from our audit of internal control over financial reporting. The 2017 acquisitions of the Company and its related subsidiaries are wholly-owned subsidiaries whose total assets and total revenues excluded from management’s assessment and our audit of internal control over financial reporting represent 2.5% and 2.2%, respectively, of the related consolidated financial statement amounts as of and for the year ended December 31, 2017.
Definition and Limitations of Internal Control over Financial Reporting
A company’s internal control over financial reporting is a process designed to provide reasonable assurance regarding the reliability of financial reporting and the preparation of financial statements for external purposes in accordance with generally accepted accounting principles. A company’s internal control over financial reporting includes those policies and procedures that (i) pertain to the maintenance of records that, in reasonable detail, accurately and fairly reflect the transactions and dispositions of the assets of the company; (ii) provide reasonable assurance that transactions are recorded as necessary to permit preparation of financial statements in accordance with generally accepted accounting principles, and that receipts and expenditures of the company are
69
being made only in accordance with authorizations of management and directors of the company; and (iii) provide reasonable assurance regarding prevention or timely detection of unauthorized acquisition, use, or disposition of the company’s assets that could have a material effect on the financial statements.
Because of its inherent limitations, internal control over financial reporting may not prevent or detect misstatements. Also, projections of any evaluation of effectiveness to future periods are subject to the risk that controls may become inadequate because of changes in conditions, or that the degree of compliance with the policies or procedures may deteriorate.
/s/ PricewaterhouseCoopers LLP
Houston, Texas
February 28, 2018
We have served as the Company’s auditor since 2002.
70
CONSOLIDATED BALANCE SHEETS
December 31, | ||||||||
2017 | 2016 | |||||||
(In thousands, except share information) | ||||||||
ASSETS | ||||||||
Current Assets: | ||||||||
Cash and cash equivalents | $ | 138,285 | $ | 112,183 | ||||
Accounts receivable, net of allowances of $4,465 and $2,752 | 1,985,077 | 1,500,115 | ||||||
Costs and estimated earnings in excess of billings on uncompleted contracts | 497,292 | 473,308 | ||||||
Inventories | 80,890 | 88,548 | ||||||
Prepaid expenses and other current assets | 168,363 | 114,591 | ||||||
Total current assets | 2,869,907 | 2,288,745 | ||||||
Property and equipment, net of accumulated depreciation of $981,275 and $862,825 | 1,288,602 | 1,174,094 | ||||||
Other assets, net | 189,866 | 101,028 | ||||||
Other intangible assets, net of accumulated amortization of $335,507 and $297,313 | 263,179 | 187,023 | ||||||
Goodwill | 1,868,600 | 1,603,169 | ||||||
Total assets | $ | 6,480,154 | $ | 5,354,059 | ||||
LIABILITIES AND EQUITY | ||||||||
Current Liabilities: | ||||||||
Current maturities of long-term debt and short-term debt | $ | 1,220 | $ | 7,563 | ||||
Accounts payable and accrued expenses | 1,057,460 | 922,819 | ||||||
Billings in excess of costs and estimated earnings on uncompleted contracts | 433,387 | 274,846 | ||||||
Total current liabilities | 1,492,067 | 1,205,228 | ||||||
Long-term debt and notes payable, net of current maturities | 670,721 | 353,562 | ||||||
Deferred income taxes | 179,381 | 192,834 | ||||||
Insurance and other non-current liabilities | 342,356 | 259,733 | ||||||
Total liabilities | 2,684,525 | 2,011,357 | ||||||
Commitments and Contingencies | ||||||||
Equity: | ||||||||
Common stock, $.00001 par value, 600,000,000 shares authorized, 155,219,154 and 144,710,773 shares issued, and 153,342,326 and 144,710,773 shares outstanding | 2 | 1 | ||||||
Exchangeable Shares, no par value, 486,112 and 6,515,453 shares issued and outstanding | — | — | ||||||
Series F Preferred Stock, $.00001 par value, 0 and 1 share authorized, issued and outstanding | — | — | ||||||
Series G Preferred Stock, $.00001 par value, 1 share authorized, issued and outstanding | — | — | ||||||
Additional paid-in capital | 1,889,356 | 1,749,306 | ||||||
Retained earnings | 2,191,059 | 1,876,081 | ||||||
Accumulated other comprehensive loss | (203,395 | ) | (271,673 | ) | ||||
Treasury stock, 1,876,828 and 0 common shares | (85,451 | ) | (14,288 | ) | ||||
Total stockholders’ equity | 3,791,571 | 3,339,427 | ||||||
Non-controlling interests | 4,058 | 3,275 | ||||||
Total equity | 3,795,629 | 3,342,702 | ||||||
Total liabilities and equity | $ | 6,480,154 | $ | 5,354,059 | ||||
The accompanying notes are an integral part of these consolidated financial statements.
71
CONSOLIDATED STATEMENTS OF OPERATIONS
Year Ended December 31, | ||||||||||||
2017 | 2016 | 2015 | ||||||||||
(In thousands, except per share information) | ||||||||||||
Revenues | $ | 9,466,478 | $ | 7,651,319 | $ | 7,572,436 | ||||||
Cost of services (including depreciation) | 8,224,618 | 6,637,519 | 6,648,771 | |||||||||
Gross profit | 1,241,860 | 1,013,800 | 923,665 | |||||||||
Selling, general and administrative expenses | 777,920 | 653,338 | 592,863 | |||||||||
Amortization of intangible assets | 32,205 | 31,685 | 34,848 | |||||||||
Asset impairment charges | 58,057 | 7,964 | 58,451 | |||||||||
Change in fair value of contingent consideration liabilities | (5,171 | ) | — | — | ||||||||
Operating income | 378,849 | 320,813 | 237,503 | |||||||||
Interest expense | (20,946 | ) | (14,887 | ) | (8,024 | ) | ||||||
Interest income | 832 | 2,423 | 1,493 | |||||||||
Other income (expense), net | (4,978 | ) | (663 | ) | (2,297 | ) | ||||||
Income from continuing operations before income taxes | 353,757 | 307,686 | 228,675 | |||||||||
Provision for income taxes | 35,532 | 107,246 | 97,472 | |||||||||
Net income from continuing operations | 318,225 | 200,440 | 131,203 | |||||||||
Net income (loss) from discontinued operations | — | (342 | ) | 190,621 | ||||||||
Net income | 318,225 | 200,098 | 321,824 | |||||||||
Less: Net income attributable to non-controlling interests | 3,247 | 1,715 | 10,917 | |||||||||
Net income attributable to common stock | $ | 314,978 | $ | 198,383 | $ | 310,907 | ||||||
Amounts attributable to common stock: | ||||||||||||
Net income from continuing operations | $ | 314,978 | $ | 198,725 | $ | 120,286 | ||||||
Net income (loss) from discontinued operations | — | (342 | ) | 190,621 | ||||||||
Net income attributable to common stock | $ | 314,978 | $ | 198,383 | $ | 310,907 | ||||||
Basic earnings per share attributable to common stock: | ||||||||||||
Continuing operations | $ | 2.02 | $ | 1.26 | $ | 0.62 | ||||||
Discontinued operations | — | — | 0.97 | |||||||||
Net income attributable to common stock | $ | 2.02 | $ | 1.26 | $ | 1.59 | ||||||
Weighted average basic shares outstanding | 156,124 | 157,287 | 195,113 | |||||||||
Diluted earnings per share attributable to common stock: | ||||||||||||
Continuing operations | $ | 2.00 | $ | 1.26 | $ | 0.62 | ||||||
Discontinued operations | — | — | 0.97 | |||||||||
Net income attributable to common stock | $ | 2.00 | $ | 1.26 | $ | 1.59 | ||||||
Weighted average diluted shares outstanding | 157,155 | 157,288 | 195,120 | |||||||||
The accompanying notes are an integral part of these consolidated financial statements.
72
CONSOLIDATED STATEMENTS OF COMPREHENSIVE INCOME
Year Ended December 31, | ||||||||||||
2017 | 2016 | 2015 | ||||||||||
(In thousands) | ||||||||||||
Net income | $ | 318,225 | $ | 200,098 | $ | 321,824 | ||||||
Other comprehensive income (loss), net of tax provision: | ||||||||||||
Foreign currency translation adjustment, net of tax of $0, $0 and $0 | 67,404 | 23,137 | (171,458 | ) | ||||||||
Other, net of tax of $(347), $46 and $(28) | 874 | (121 | ) | 59 | ||||||||
Other comprehensive income (loss) | 68,278 | 23,016 | (171,399 | ) | ||||||||
Comprehensive income | 386,503 | 223,114 | 150,425 | |||||||||
Less: Comprehensive income attributable to non-controlling interests | 3,247 | 1,715 | 10,917 | |||||||||
Total comprehensive income attributable to Quanta stockholders | $ | 383,256 | $ | 221,399 | $ | 139,508 | ||||||
The accompanying notes are an integral part of these consolidated financial statements.
73
CONSOLIDATED STATEMENTS OF CASH FLOWS
Year Ended December 31, | ||||||||||||
2017 | 2016 | 2015 | ||||||||||
(In thousands) | ||||||||||||
Cash Flows from Operating Activities of Continuing Operations: | ||||||||||||
Net income | $ | 318,225 | $ | 200,098 | $ | 321,824 | ||||||
Adjustments to reconcile net income to net cash provided by operating activities of continuing operations — | ||||||||||||
(Income) loss from discontinued operations | — | 342 | (190,621 | ) | ||||||||
Depreciation | 183,808 | 170,240 | 162,845 | |||||||||
Amortization of intangible assets | 32,205 | 31,685 | 34,848 | |||||||||
Asset impairment charges | 58,057 | 7,964 | 58,451 | |||||||||
Change in fair value of contingent consideration liabilities | (5,171 | ) | — | — | ||||||||
Equity in losses of unconsolidated affiliates | 10,945 | 979 | 466 | |||||||||
Amortization of debt issuance costs | 1,321 | 1,356 | 1,251 | |||||||||
Gain on sale of property and equipment | (549 | ) | (734 | ) | (2,773 | ) | ||||||
Foreign currency loss | 409 | 880 | 2,490 | |||||||||
Provision for (recovery of) doubtful accounts | 87 | (543 | ) | 224 | ||||||||
Deferred income tax benefit | (32,130 | ) | (15,695 | ) | (19,403 | ) | ||||||
Non-cash stock-based compensation | 46,448 | 42,843 | 36,939 | |||||||||
Changes in operating assets and liabilities, net of non-cash transactions | (241,180 | ) | (49,228 | ) | 222,108 | |||||||
Net cash provided by operating activities of continuing operations | 372,475 | 390,187 | 628,649 | |||||||||
Cash Flows from Investing Activities of Continuing Operations: | ||||||||||||
Proceeds from sale of property and equipment | 23,348 | 21,975 | 26,178 | |||||||||
Additions of property and equipment | (244,651 | ) | (212,555 | ) | (209,968 | ) | ||||||
Cash paid for acquisitions, net of cash acquired | (361,217 | ) | (68,788 | ) | (112,914 | ) | ||||||
Investments in and return of equity from unconsolidated affiliates | 8,986 | (10,309 | ) | (6,074 | ) | |||||||
Cash received from (paid for) other investments, net | 275 | 4,752 | (4,338 | ) | ||||||||
Cash withdrawn from (deposited to) restricted cash | (2,566 | ) | (1,119 | ) | 214 | |||||||
Cash paid for intangible assets | — | — | (211 | ) | ||||||||
Net cash used in investing activities of continuing operations | (575,825 | ) | (266,044 | ) | (307,113 | ) | ||||||
Cash Flows from Financing Activities of Continuing Operations: | ||||||||||||
Borrowings under credit facility | 2,932,338 | 2,744,453 | 3,349,385 | |||||||||
Payments under credit facility | (2,624,404 | ) | (2,860,673 | ) | (2,935,752 | ) | ||||||
Payments on other long-term debt | (5,361 | ) | (6,959 | ) | (2,683 | ) | ||||||
Borrowings of short-term debt | — | 2,754 | 4,872 | |||||||||
Payments on short-term debt | (2,783 | ) | (4,711 | ) | (5,170 | ) | ||||||
Debt issuance and amendment costs | (1,507 | ) | — | (3,795 | ) | |||||||
Distributions to non-controlling interests, net of contributions received | (2,001 | ) | (761 | ) | (18,915 | ) | ||||||
Payments related to tax withholding for share-based compensation | (18,543 | ) | (8,340 | ) | (9,797 | ) | ||||||
Exercise of stock options | 25 | 401 | 372 | |||||||||
Repurchase of common stock, including accelerated stock repurchases | (50,000 | ) | — | (1,606,361 | ) | |||||||
Net cash provided by (used in) financing activities of continuing operations | 227,764 | (133,836 | ) | (1,227,844 | ) | |||||||
Discontinued operations: | ||||||||||||
Net cash provided by (used in) operating activities | — | (1,035 | ) | 22,342 | ||||||||
Net cash provided by (used in) investing activities | — | (6,080 | ) | 825,376 | ||||||||
Net cash provided by (used in) discontinued operations | — | (7,115 | ) | 847,718 | ||||||||
Effect of foreign exchange rate changes on cash and cash equivalents | 1,688 | 220 | (3,154 | ) | ||||||||
Net increase (decrease) in cash and cash equivalents | 26,102 | (16,588 | ) | (61,744 | ) | |||||||
Cash and cash equivalents, beginning of year | 112,183 | 128,771 | 190,515 | |||||||||
Cash and cash equivalents, end of year | $ | 138,285 | $ | 112,183 | $ | 128,771 | ||||||
The accompanying notes are an integral part of these consolidated financial statements.
74
CONSOLIDATED STATEMENTS OF EQUITY
Accumulated | |||||||||||||||||||||||||||||||||||||||||||||||||||||||
Exchangeable | Series F | Series G | Additional | Other | Total | ||||||||||||||||||||||||||||||||||||||||||||||||||
Common Stock | Shares | Preferred Stock | Preferred Stock | Paid-In | Retained | Comprehensive | Treasury | Stockholders’ | Non-controlling | Total | |||||||||||||||||||||||||||||||||||||||||||||
Shares | Amount | Shares | Amount | Shares | Amount | Shares | Amount | Capital | Earnings | Income (Loss) | Stock | Equity | Interests | Equity | |||||||||||||||||||||||||||||||||||||||||
(In thousands, except share information) | |||||||||||||||||||||||||||||||||||||||||||||||||||||||
Balance, December 31, 2014 | 210,819,790 | $ | 2 | 7,325,971 | $ | — | 1 | $ | — | 1 | $ | — | $ | 3,592,906 | $ | 1,366,791 | $ | (123,290 | ) | $ | (321,936 | ) | $ | 4,514,473 | $ | 11,067 | $ | 4,525,540 | |||||||||||||||||||||||||||
Other comprehensive loss | — | — | — | — | — | — | — | — | — | — | (171,399 | ) | — | (171,399 | ) | — | (171,399 | ) | |||||||||||||||||||||||||||||||||||||
Acquisitions | 461,037 | — | — | — | — | — | — | — | 10,127 | — | — | — | 10,127 | (748 | ) | 9,379 | |||||||||||||||||||||||||||||||||||||||
Restricted stock and restricted stock unit activity | 395,427 | — | — | — | — | — | — | — | 37,309 | — | — | (10,368 | ) | 26,941 | — | 26,941 | |||||||||||||||||||||||||||||||||||||||
Stock options exercised | 32,390 | — | — | — | — | — | — | — | 431 | — | — | — | 431 | — | 431 | ||||||||||||||||||||||||||||||||||||||||
Exchange of exchangeable shares | 449,929 | — | (449,929 | ) | — | — | — | — | — | — | — | — | — | — | — | — | |||||||||||||||||||||||||||||||||||||||
Income tax impact from long-term incentive plans | — | — | — | — | — | — | — | — | 375 | — | — | — | 375 | — | 375 | ||||||||||||||||||||||||||||||||||||||||
Common stock repurchases | (59,251,407 | ) | — | — | — | — | — | — | — | — | — | — | (1,456,361 | ) | (1,456,361 | ) | — | (1,456,361 | ) | ||||||||||||||||||||||||||||||||||||
Accelerated stock repurchases not yet settled | — | — | — | — | — | — | — | — | (150,000 | ) | — | — | — | (150,000 | ) | — | (150,000 | ) | |||||||||||||||||||||||||||||||||||||
Vests in deferred compensation plan | — | — | — | — | — | — | — | — | 6,592 | — | — | (6,592 | ) | — | — | — | |||||||||||||||||||||||||||||||||||||||
Distributions to non-controlling interests, net of contributions received | — | — | — | — | — | — | — | — | — | — | — | — | — | (18,915 | ) | (18,915 | ) | ||||||||||||||||||||||||||||||||||||||
Net income | — | — | — | — | — | — | — | — | — | 310,907 | — | — | 310,907 | 10,917 | 321,824 | ||||||||||||||||||||||||||||||||||||||||
Balance, December 31, 2015 | 152,907,166 | 2 | 6,876,042 | — | 1 | — | 1 | — | 3,497,740 | 1,677,698 | (294,689 | ) | (1,795,257 | ) | 3,085,494 | 2,321 | 3,087,815 | ||||||||||||||||||||||||||||||||||||||
Other comprehensive income | — | — | — | — | — | — | — | — | — | — | 23,016 | — | 23,016 | — | 23,016 | ||||||||||||||||||||||||||||||||||||||||
Acquisitions | 70,840 | — | — | — | — | — | — | — | 1,508 | — | — | — | 1,508 | — | 1,508 | ||||||||||||||||||||||||||||||||||||||||
Restricted stock and restricted stock unit activity | 760,395 | — | — | — | — | — | — | — | 42,843 | — | — | (8,338 | ) | 34,505 | — | 34,505 | |||||||||||||||||||||||||||||||||||||||
Stock options exercised | 25,423 | — | — | — | — | — | — | — | 425 | — | — | — | 425 | — | 425 | ||||||||||||||||||||||||||||||||||||||||
Exchange of exchangeable shares | 360,589 | — | (360,589 | ) | — | — | — | — | — | — | — | — | — | — | — | — | |||||||||||||||||||||||||||||||||||||||
Income tax impact from long-term incentive plans | — | — | — | — | — | — | — | — | (3,904 | ) | — | — | — | (3,904 | ) | — | (3,904 | ) | |||||||||||||||||||||||||||||||||||||
Settlement of accelerated stock repurchases | (9,413,640 | ) | — | — | — | — | — | — | — | 150,000 | — | — | (150,000 | ) | — | — | — | ||||||||||||||||||||||||||||||||||||||
Vests in deferred compensation plan | — | — | — | — | — | — | — | — | 6,822 | — | — | (6,822 | ) | — | — | — | |||||||||||||||||||||||||||||||||||||||
Retirement of treasury stock | — | (1 | ) | — | — | — | — | — | — | (1,946,128 | ) | — | — | 1,946,129 | — | — | — | ||||||||||||||||||||||||||||||||||||||
Distributions to non-controlling interests | — | — | — | — | — | — | — | — | — | — | — | — | — | (761 | ) | (761 | ) | ||||||||||||||||||||||||||||||||||||||
Net income | — | — | — | — | — | — | — | — | — | 198,383 | — | — | 198,383 | 1,715 | 200,098 | ||||||||||||||||||||||||||||||||||||||||
Balance, December 31, 2016 | 144,710,773 | 1 | 6,515,453 | — | 1 | — | 1 | — | 1,749,306 | 1,876,081 | (271,673 | ) | (14,288 | ) | 3,339,427 | 3,275 | 3,342,702 | ||||||||||||||||||||||||||||||||||||||
Other comprehensive income | — | — | — | — | — | — | — | — | — | — | 68,278 | — | 68,278 | — | 68,278 | ||||||||||||||||||||||||||||||||||||||||
Acquisitions | 2,982,346 | — | — | — | — | — | — | — | 89,604 | — | — | — | 89,604 | — | 89,604 | ||||||||||||||||||||||||||||||||||||||||
Restricted stock unit activity | 1,000,935 | 1 | — | — | — | — | — | — | 47,825 | — | — | (18,567 | ) | 29,259 | — | 29,259 | |||||||||||||||||||||||||||||||||||||||
Stock options exercised | 1,223 | — | — | — | — | — | — | — | 25 | — | — | — | 25 | — | 25 | ||||||||||||||||||||||||||||||||||||||||
Exchange of exchangeable shares | 6,029,341 | — | (6,029,341 | ) | — | — | — | — | — | — | — | — | — | — | — | — | |||||||||||||||||||||||||||||||||||||||
Common stock repurchases | (1,382,292 | ) | — | — | — | — | — | — | — | — | — | — | (50,000 | ) | (50,000 | ) | — | (50,000 | ) | ||||||||||||||||||||||||||||||||||||
Vests in deferred compensation plan | — | — | — | — | — | — | — | — | 2,596 | — | — | (2,596 | ) | — | — | — | |||||||||||||||||||||||||||||||||||||||
Retirement of preferred stock | — | — | — | — | (1 | ) | — | — | — | — | — | — | — | — | — | — | |||||||||||||||||||||||||||||||||||||||
Distributions to non-controlling interests | — | — | — | — | — | — | — | — | — | — | — | — | — | (2,001 | ) | (2,001 | ) | ||||||||||||||||||||||||||||||||||||||
Buyout of a non-controlling interest | — | — | — | — | — | — | — | — | — | — | — | — | — | (463 | ) | (463 | ) | ||||||||||||||||||||||||||||||||||||||
Net income | — | — | — | — | — | — | — | — | — | 314,978 | — | — | 314,978 | 3,247 | 318,225 | ||||||||||||||||||||||||||||||||||||||||
Balance, December 31, 2017 | 153,342,326 | $ | 2 | 486,112 | $ | — | — | $ | — | 1 | $ | — | $ | 1,889,356 | $ | 2,191,059 | $ | (203,395 | ) | $ | (85,451 | ) | $ | 3,791,571 | $ | 4,058 | $ | 3,795,629 | |||||||||||||||||||||||||||
The accompanying notes are an integral part of these consolidated financial statements.
75
QUANTA SERVICES, INC. AND SUBSIDIARIES
NOTES TO CONSOLIDATED FINANCIAL STATEMENTS
1. | BUSINESS AND ORGANIZATION: |
Quanta Services, Inc. (Quanta) is a leading provider of specialty contracting services, offering infrastructure solutions primarily to the electric power, oil and gas and communication industries in the United States, Canada, Australia, Latin America and select other international markets. Quanta reports its results under two reportable segments: (1) Electric Power Infrastructure Services and (2) Oil and Gas Infrastructure Services.
Electric Power Infrastructure Services Segment
The Electric Power Infrastructure Services segment provides comprehensive network solutions to customers in the electric power industry. Services performed by the Electric Power Infrastructure Services segment generally include the design, installation, upgrade, repair and maintenance of electric power transmission and distribution infrastructure and substation facilities along with other engineering and technical services. This segment also provides emergency restoration services, including the repair of infrastructure damaged by inclement weather, the energized installation, maintenance and upgrade of electric power infrastructure utilizing unique bare hand and hot stick methods and Quanta’s proprietary robotic arm technologies, and the installation of “smart grid” technologies on electric power networks. In addition, this segment designs, installs and maintains renewable energy generation facilities, consisting of solar, wind and certain types of natural gas generation facilities, and related switchyards and transmission infrastructure. To a lesser extent, the segment also provides comprehensive communications infrastructure services to wireline, fiber and wireless carrier customers within the communications industry; services in connection with the construction of electric power generation facilities; the design, installation, maintenance and repair of commercial and industrial wiring; and the installation of traffic networks and cable and control systems for light rail lines.
Oil and Gas Infrastructure Services Segment
The Oil and Gas Infrastructure Services segment provides comprehensive network solutions to customers involved in the development, transportation, storage and processing of natural gas, oil and other pipeline products. Services performed by the Oil and Gas Infrastructure Services segment generally include the design, installation, repair and maintenance of pipeline transmission and distribution systems, gathering systems, production systems, storage systems and compressor and pump stations, as well as related trenching, directional boring and mechanized welding services. In addition, this segment’s services include pipeline protection, integrity testing, rehabilitation and replacement, and fabrication of pipeline support systems and related structures and facilities. Quanta also serves the offshore and inland water energy markets, primarily providing services to oil and gas exploration platforms, including mechanical installation (or “hook-ups”), electrical and instrumentation, pre-commissioning and commissioning, coatings, shallow water pipeline installation, fabrication and marine asset repair. To a lesser extent, this segment designs, installs and maintains fueling systems, as well as water and sewer infrastructure. Through a recent acquisition discussed below, Quanta expanded its service offerings in this segment to include high-pressure and critical-path turnaround services to the downstream and midstream energy markets and enhanced its capabilities with respect to instrumentation and electrical services, piping, fabrication and storage tank services.
Acquisitions
On July 20, 2017, Quanta acquired Stronghold, Ltd. and Stronghold Specialty, Ltd. (collectively Stronghold), a specialized services business located in the United States that provides high-pressure and critical-path solutions to the downstream and midstream energy markets. The results of the acquired business are generally included in Quanta’s Oil and Gas Infrastructure Services segment and have been included in Quanta’s consolidated financial statements beginning on the acquisition date.
During the year ended December 31, 2017, Quanta also acquired a communications infrastructure services contractor and an electrical and communications contractor, both of which are located in the United States. The results of these acquired businesses are generally included in Quanta’s Electric Power Infrastructure Services segment and have been included in Quanta’s consolidated financial statements beginning on the respective acquisition dates.
During 2016 and 2015, Quanta completed five and 11 acquisitions. The results have been included in Quanta’s consolidated financial statements beginning on the respective acquisition dates. See further discussion regarding these acquisitions in Note 5.
Disposition - Fiber Optic Licensing Operations
On April 29, 2015, Quanta entered into a stock purchase agreement with Crown Castle International Corp. (Crown Castle) pursuant to which Quanta agreed to sell its fiber optic licensing operations. The purchase agreement contained customary representations and warranties, covenants and indemnities. On August 4, 2015, Quanta completed the sale for a purchase price of
76
QUANTA SERVICES, INC. AND SUBSIDIARIES
NOTES TO CONSOLIDATED FINANCIAL STATEMENTS - (Continued)
$1.00 billion in cash, resulting in after-tax net proceeds of $848.2 million. In the third quarter of 2015, Quanta recognized a net of tax gain of $171.0 million. Quanta has presented the results of operations, financial position, cash flows and disclosures of the fiber optic licensing operations as discontinued operations for all periods in the accompanying consolidated financial statements. These results were included in Quanta’s Fiber Optic Licensing and Other segment prior to the second quarter of 2015.
2. | SUMMARY OF SIGNIFICANT ACCOUNTING POLICIES: |
Principles of Consolidation
The consolidated financial statements of Quanta include the accounts of Quanta Services, Inc. and its wholly owned subsidiaries, which are also referred to as its operating units. The consolidated financial statements also include the accounts of certain of Quanta’s investments in joint ventures, which are either consolidated or proportionately consolidated, as discussed in the following summary of significant accounting policies. Investments in affiliated entities in which Quanta does not have a controlling financial interest, but over which Quanta has significant influence, usually because Quanta holds a voting interest of between 20% and 50%, are accounted for using the equity method. All significant intercompany accounts and transactions have been eliminated in consolidation. Unless the context requires otherwise, references to Quanta include Quanta Services, Inc. and its consolidated subsidiaries.
Reclassifications
Quanta reclassified certain prior period amounts related to stock-based compensation in the accompanying consolidated statements of cash flows to conform to the current period presentation under a recently adopted accounting update. Additionally, certain reclassifications have been made to Quanta’s prior year’s consolidated statements of operations to conform to classifications in the current year.
Use of Estimates and Assumptions
The preparation of financial statements in conformity with US GAAP requires the use of estimates and assumptions by management in determining the reported amounts of assets and liabilities, disclosures of contingent assets and liabilities known to exist as of the date the financial statements are published, and the reported amounts of revenues and expenses recognized during the periods presented. Quanta reviews all significant estimates affecting its consolidated financial statements on a recurring basis and records the effect of any necessary adjustments prior to their publication. Judgments and estimates are based on Quanta’s beliefs and assumptions derived from information available at the time such judgments and estimates are made. Uncertainties with respect to such estimates and assumptions are inherent in the preparation of financial statements. Estimates are primarily used in Quanta’s assessment of the allowance for doubtful accounts, valuation of inventory, useful lives of assets, fair value assumptions in analyzing goodwill, other intangibles and long-lived asset impairments, equity and other investments, loan receivables, purchase price allocations, acquisition-related contingent consideration liabilities, liabilities for insurance and other claims and guarantees, multiemployer pension plan withdrawal liabilities, revenue recognition for construction contracts inclusive of contractual change orders and claims, share-based compensation, operating results of reportable segments, as well as the provision for income taxes and the calculation of uncertain tax positions.
Cash and Cash Equivalents
Quanta had cash and cash equivalents of $138.3 million and $112.2 million as of December 31, 2017 and 2016. Cash consisting of interest-bearing demand deposits is carried at cost, which approximates fair value. Quanta considers all highly liquid investments with an original maturity of three months or less at the time of purchase to be cash equivalents, which are carried at fair value. At December 31, 2017 and 2016, cash equivalents were $7.1 million and $8.8 million and consisted primarily of money market investments and money market mutual funds and are discussed further in Fair Value Measurements below. As of December 31, 2017 and 2016, cash and cash equivalents held in domestic bank accounts were $83.1 million and $19.5 million, and cash and cash equivalents held in foreign bank accounts were $55.2 million and $92.7 million.
As of December 31, 2017 and 2016, cash and cash equivalents held by joint ventures, which are either consolidated or proportionately consolidated, were $16.7 million and $11.5 million, of which $10.0 million and $10.0 million related to domestic joint ventures. Cash and cash equivalents held by the joint ventures are available to support joint venture operations, but Quanta cannot utilize those assets to support its other operations. Quanta generally has no right to the joint ventures’ cash and cash equivalents other than participating in distributions and in the event of dissolution.
77
QUANTA SERVICES, INC. AND SUBSIDIARIES
NOTES TO CONSOLIDATED FINANCIAL STATEMENTS - (Continued)
Current and Long-Term Accounts and Notes Receivable and Allowance for Doubtful Accounts
Quanta provides an allowance for doubtful accounts when collection of an account or note receivable is considered doubtful, and receivables are written off against the allowance when deemed uncollectible. Inherent in the assessment of the allowance for doubtful accounts are certain judgments and estimates regarding, among other factors, the customer’s access to capital, the customer’s willingness or ability to pay, general economic and market conditions, the ongoing relationship with the customer and uncertainties related to the resolution of disputed matters. Quanta considers accounts receivable delinquent after 30 days but does not generally include delinquent accounts in its analysis of the allowance for doubtful accounts unless the accounts receivable have been outstanding for at least 90 days. Quanta also includes accounts receivable balances that relate to customers in bankruptcy or with other known difficulties in its analysis of the allowance for doubtful accounts. Material changes in customers’ business or cash flows, which may be impacted by negative economic and market conditions, could affect Quanta’s ability to collect amounts due. As of December 31, 2017 and 2016, Quanta had allowances for doubtful accounts on current receivables of $4.5 million and $2.8 million. Long-term accounts receivable are included within “Other assets, net” in the accompanying consolidated balance sheets.
Should customers experience financial difficulties or file for bankruptcy, or should anticipated recoveries relating to receivables in existing bankruptcies or other workout situations fail to materialize, Quanta could experience reduced cash flows and losses in excess of current allowances provided.
The balances billed but not paid by customers pursuant to retainage provisions in certain contracts are generally due upon completion of the contracts and acceptance by the customer. Based on Quanta’s experience with similar contracts in recent years, the majority of the retainage balances at each balance sheet date are expected to be collected within the next twelve months. Current retainage balances as of December 31, 2017 and 2016 were $300.5 million and $231.0 million and were included in “Accounts receivable.” Retainage balances with settlement dates beyond the next twelve months were included in “Other assets, net,” and as of December 31, 2017 and 2016 were $41.9 million and $5.2 million.
Within accounts receivable, Quanta recognizes unbilled receivables in circumstances such as when revenues have been earned and recorded but the amount cannot be billed under the terms of the contract until a later date; costs have been incurred but are yet to be billed under cost-reimbursement type contracts; or amounts arise from routine lags in billing (for example, work completed one month but not billed until the next month). These balances do not include revenues accrued for work performed under fixed-price contracts as these amounts are recorded as “Costs and estimated earnings in excess of billings on uncompleted contracts.” At December 31, 2017 and 2016, the balances of unbilled receivables included in “Accounts receivable” were $303.9 million and $206.8 million.
Inventories
Inventories consist primarily of parts and supplies held for use in the ordinary course of business, which are valued by Quanta at the lower of cost or net realizable value. Cost is determined by using either the first-in, first-out (FIFO) method or the average costing method. Inventories also include certain job specific materials not yet installed which are valued using the specific identification method.
Property and Equipment
Property and equipment are stated at cost, and depreciation is computed using the straight-line method, net of estimated salvage values, over the estimated useful lives of the assets. Leasehold improvements are capitalized and amortized over the lesser of the life of the lease or the estimated useful life of the asset. Depreciation expense related to property and equipment was $183.8 million, $170.2 million and $162.8 million for the years ended December 31, 2017, 2016 and 2015, respectively.
Accrued capital expenditures were $9.6 million and $12.7 million as of December 31, 2017 and 2016. The impact of these items has been excluded from Quanta’s capital expenditures in the accompanying consolidated statements of cash flows due to their non-cash nature.
Expenditures for repairs and maintenance are charged to expense when incurred. Expenditures for major renewals and betterments, which extend the useful lives of existing equipment, are capitalized and depreciated over the adjusted remaining useful lives of the assets. Upon retirement or disposition of property and equipment, the cost and related accumulated depreciation are removed from the accounts and any resulting gain or loss is reflected in selling, general and administrative expenses.
Management reviews long-lived assets for impairment whenever events or changes in circumstances indicate that the carrying amount may not be realizable. Quanta also recorded asset impairments primarily related to certain international renewable energy services operations of $8.0 million in 2016 and $6.6 million in 2015. The 2016 impairment was primarily due to a pending
78
QUANTA SERVICES, INC. AND SUBSIDIARIES
NOTES TO CONSOLIDATED FINANCIAL STATEMENTS - (Continued)
disposition of certain international renewable energy services operations that was completed in 2017, and the 2015 impairment was based on the estimated future undiscounted cash flows for the asset group as compared to their carrying amount.
When an evaluation is required, the estimated future undiscounted cash flows associated with the asset group are compared to the asset group’s carrying amount to determine if an impairment of such asset group is necessary. The effect of any impairment involves expensing the difference between the fair value of such asset group and its carrying amount in the period incurred.
Other Assets, Net
Other assets, net consists primarily of long-term receivables, long-term retainage, deferred tax assets, debt issuance costs, equity and other investments, refundable security deposits for leased properties and insurance claims in excess of deductibles that are due from Quanta’s insurers.
Debt Issuance Costs
Capitalized debt issuance costs related to Quanta’s senior secured revolving credit facility and any other debt outstanding at a given balance sheet date are included in other assets, net and are amortized into interest expense on a straight-line basis over the terms of the respective agreements giving rise to the debt issuance costs, which Quanta believes approximates the effective interest rate method. During 2017 and 2015, Quanta incurred $1.5 million and $3.8 million of debt issuance costs related to amendments and a restatement of its credit agreement. In 2017 and 2015, Quanta recorded a nominal charge to interest expense for the write-off of a portion of the debt issuance costs related to the prior facility. As of December 31, 2017 and 2016, capitalized debt issuance costs were $12.9 million and $11.4 million, with accumulated amortization of $7.4 million and $6.0 million. For the years ended December 31, 2017, 2016 and 2015, amortization expense related to capitalized debt issuance costs was $1.3 million, $1.4 million and $1.3 million, respectively.
Goodwill
Quanta has recorded goodwill in connection with its historical acquisitions of companies. Upon acquisition, these companies were either combined into one of Quanta’s existing operating units or managed on a stand-alone basis as an individual operating unit. Goodwill recorded in connection with these acquisitions is subject to an annual assessment for impairment, which Quanta performs at the operating unit level for each operating unit that carries a balance of goodwill. Each of Quanta’s operating units is organized into one of two internal divisions: the Electric Power Infrastructure Services Division and the Oil and Gas Infrastructure Services Division. As most of the companies acquired by Quanta provide multiple types of services for multiple types of customers, these divisional designations are based on the predominant type of work performed by each operating unit at the point in time the divisional designation is made. Goodwill is required to be measured for impairment at the reporting unit level, which represents the operating segment level or one level below the operating segment level for which discrete financial information is available. Quanta has determined that its individual operating units represent its reporting units for the purpose of assessing goodwill impairments.
In January 2017, the Financial Accounting Standards Board (FASB) issued an update intended to simplify the subsequent measurement of goodwill by eliminating the second step in the two-step goodwill impairment test. The update requires an entity to perform its annual, or interim, goodwill impairment test by comparing the fair value of a reporting unit with its carrying amount and to recognize an impairment charge for the amount by which the carrying amount exceeds the fair value. The income tax effect associated with an impairment of tax deductible goodwill is also considered in the measurement of the goodwill impairment. Quanta elected to adopt the provisions of the update in connection with its annual impairment test performed in the fourth quarter of 2017.
Quanta has the option to first assess qualitative factors to determine whether it is necessary to perform the quantitative fair value-based impairment test described below. If Quanta believes that, as a result of its qualitative assessment, it is more likely than not that the fair value of a reporting unit is less than its carrying amount, the quantitative impairment test is required. Quanta can choose to perform the qualitative assessment on none, some, or all of its reporting units. Quanta can also bypass the qualitative assessment for any reporting unit in any period and proceed directly to the quantitative impairment test, and then resume the qualitative assessment in any subsequent period. Qualitative indicators including deterioration in macroeconomic conditions, declining financial performance, or a sustained decrease in share price, among other things, may trigger the need for annual or interim impairment testing of goodwill associated with one or all of the reporting units.
Quanta’s annual goodwill impairment assessment is performed in the fourth quarter of its fiscal year, or more frequently if events or circumstances arise which indicate that goodwill may be impaired. For instance, a decrease in Quanta’s market capitalization below book value, a significant change in business climate or loss of a significant customer, as well as the qualitative indicators referenced above, may trigger the need for interim impairment testing of goodwill for a reporting unit. The quantitative
79
QUANTA SERVICES, INC. AND SUBSIDIARIES
NOTES TO CONSOLIDATED FINANCIAL STATEMENTS - (Continued)
impairment test involves comparing the fair value of each of Quanta’s reporting units with its carrying amount, including goodwill. If the carrying amount of a reporting unit exceeds its fair value, an impairment loss is recorded as a reduction to goodwill with a corresponding charge to “Asset impairment charges” in the accompanying consolidated statements of operations. Any goodwill impairment is limited to the total amount of goodwill allocated to that reporting unit.
Quanta determines the fair value of its reporting units using a weighted combination of the discounted cash flow, market multiple and market capitalization valuation approaches, with heavier weighting on the discounted cash flow method because management believes this method results in the most accurate calculation of fair value. Determining the fair value of a reporting unit requires judgment and the use of significant estimates and assumptions, including revenue growth rates, operating margins, discount rates, weighted average costs of capital and future market conditions. Quanta believes the estimates and assumptions used in its impairment assessments are reasonable and based on available market information, but variations in any of the assumptions could result in materially different calculations of fair value and determinations of whether or not an impairment is indicated.
Under the discounted cash flow method, Quanta determines fair value based on the estimated future cash flows of each reporting unit, discounted to present value using risk-adjusted industry discount rates, which reflect the overall level of inherent risk of a reporting unit and the rate of return an outside investor would expect to earn. Cash flow projections are derived from budgeted amounts and operating forecasts (typically a one-year model) plus an estimate of later period cash flows, all of which are evaluated by management. Subsequent period cash flows are developed for each reporting unit using growth rates that management believes are reasonably likely to occur, along with a terminal value derived from the reporting unit’s earnings before interest, taxes, depreciation and amortization (EBITDA). The EBITDA multiples for each reporting unit are based on trailing twelve-month comparable industry data.
Under the market multiple and market capitalization approaches, Quanta determines the estimated fair value of each of its reporting units by applying transaction multiples to each reporting unit’s projected EBITDA and then averaging that estimate with similar historical calculations using either a one, two or three year average. For the market capitalization approach, Quanta adds a reasonable control premium, which is estimated as the premium that would be received in a sale of the reporting unit in an orderly transaction between market participants.
The projected cash flows and estimated levels of EBITDA by reporting unit were used to determine fair value under the three approaches discussed herein. The following table presents the significant estimates used by management in determining the fair values of Quanta’s reporting units at December 31, 2017, 2016 and 2015:
2017 | 2016 | 2015 | ||||
Years of cash flows before terminal value | 5 years | 5 years | 5 years | |||
Discount rates | 12.0% to 14.0% | 12.5% to 14.5% | 12.0% to 16.0% | |||
EBITDA multiples | 5.5 to 7.0 | 5.5 to 7.0 | 5.0 to 6.5 | |||
Weighting of three approaches: | ||||||
Discounted cash flows | 70% | 70% | 70% | |||
Market multiple | 15% | 15% | 15% | |||
Market capitalization | 15% | 15% | 15% | |||
For recently acquired reporting units, a quantitative impairment test may indicate a fair value that is substantially similar to the reporting unit’s carrying amount. Such similarities in value are generally an indication that management’s estimates of future cash flows associated with the recently acquired reporting unit remain relatively consistent with the assumptions that were used to derive its initial fair value.
During the fourth quarter of 2017, a quantitative fair-value based goodwill impairment analysis was performed for each of Quanta’s reporting units, and no reporting units were evaluated solely on a qualitative basis. The analysis indicated that the fair value of each of Quanta’s reporting units, with the exception of two reporting units in its Oil and Gas Infrastructure Services Division, was in excess of its carrying amount. Quanta recorded a $57.0 million non-cash charge in the fourth quarter of 2017 for the impairment of goodwill associated with the two reporting units. Specifically, a reporting unit that provides material handling services experienced lower operating margins and is expected to continue to face a highly competitive environment in its select markets and a reporting unit that provides marine and offshore services experienced prolonged periods of reduced revenues and operating margins and is expected to continue to experience lower levels of activity in the U.S. Gulf of Mexico and other offshore markets.
As discussed generally above, when evaluating the 2017 quantitative impairment test results, management considered many factors in determining whether an impairment of goodwill for any reporting unit was reasonably likely to occur in future periods,
80
QUANTA SERVICES, INC. AND SUBSIDIARIES
NOTES TO CONSOLIDATED FINANCIAL STATEMENTS - (Continued)
including future market conditions and the economic environment. Additionally, management considered the sensitivity of its fair value estimates to changes in certain valuation assumptions. After taking into account a 10% decrease in the fair value of each of Quanta’s reporting units, one additional reporting unit within Quanta’s Oil and Gas Infrastructure Services Division would have a fair value below its carrying amount. The fair value determined in 2017 for this reporting unit was consistent with the fair value determined in 2016. Circumstances such as market declines, unfavorable economic conditions, loss of a major customer or other factors could increase the risk of impairment of goodwill for this reporting unit in future periods.
If an operating unit experiences prolonged periods of declining revenues, operating margins or both, it may be at risk of failing the quantitative goodwill impairment test. In addition to the reporting units referenced above, certain operating units have experienced declines over the short-term due to challenging macroeconomic conditions in certain geographic areas and low oil and natural gas prices, which have negatively impacted customer spending and resulted in project cancellations and delays. Additionally, customer capital spending has been constrained as a result of an increasingly complex regulatory and permitting environment. Certain operating units within Quanta’s Oil and Gas Infrastructure Services Division that primarily operate within the midstream and smaller-scale transmission market, including the reporting unit referenced above, have continued to be negatively impacted by these factors. Goodwill and intangible assets associated with these operating units were $50.1 million and $14.7 million at December 31, 2017. Quanta monitors these conditions and others to determine if it is necessary to perform the quantitative fair-value based impairment test for one or more operating units prior to the annual impairment assessment. Although Quanta is not aware of circumstances that would lead to additional goodwill impairments at this time, circumstances such as a continued market decline, the loss of a major customer or other factors could impact the valuation of goodwill in the future.
The goodwill analysis performed for each reporting unit was based on estimates and comparisons obtained from the electric power and oil and gas industries. Quanta assigned a higher weighting to the discounted cash flow approach in all periods to reflect increased expectations of market value being determined from a “held and used” model. As stated previously, cash flows are derived from budgeted amounts and operating forecasts that have been evaluated by management. In connection with the 2017 assessment, reporting unit annual compounded revenue growth rates during the cash flow projection period varied from negative 14% to positive 17%.
Estimating future cash flows requires significant judgment, and Quanta’s projections may vary from cash flows eventually realized. Changes in Quanta’s judgments and projections could result in a significantly different estimate of the fair values of reporting units and intangible assets and could result in an impairment. Variances in the assessment of market conditions, projected cash flows, cost of capital, growth rates and acquisition multiples applied could have an impact on the assessment of impairments and the amount of any goodwill impairment charges recorded. For example, lower growth rates, lower acquisition multiples or higher costs of capital assumptions would all individually lead to lower fair value assessments and potentially increased frequency or size of goodwill impairments. Goodwill impairments are included within “Asset impairment charges” on Quanta’s consolidated statements of operations.
Based on the goodwill impairment analysis, Quanta compared the sum of fair values of its reporting units to its market capitalization at December 31, 2017 and determined that the excess of the aggregate fair value of all reporting units to its market capitalization reflected a reasonable control premium. Quanta’s market capitalization at December 31, 2017 was approximately $6.02 billion, and its total stockholders’ equity was approximately $3.79 billion. If the price of Quanta’s common stock were to decline to a level that causes its market capitalization to be lower than the value of its stockholders’ equity, this would be another factor that could increase the risk of further impairment of goodwill in future periods. Increases in the carrying amount of individual reporting units that may be indicated by Quanta’s impairment tests are not recorded, therefore Quanta may record goodwill impairments in the future, even when the aggregate fair value of its reporting units as a whole may increase.
During the fourth quarter of 2015, management concluded that goodwill was impaired at two reporting units in Quanta’s Oil and Gas Infrastructure Services Division and recorded a $39.8 million non-cash charge for the impairment of goodwill, which primarily resulted from lower levels of expected activity in the U.S. Gulf of Mexico and, to a lesser extent, the extended low commodity price environment for certain directional drilling operations in Australia.
81
QUANTA SERVICES, INC. AND SUBSIDIARIES
NOTES TO CONSOLIDATED FINANCIAL STATEMENTS - (Continued)
Other Intangible Assets
Quanta’s intangible assets include customer relationships, backlog, trade names, non-compete agreements, patented rights and developed technology, all of which are subject to amortization. The value of customer relationships is estimated as of the date a business is acquired based on the value-in-use concept utilizing the income approach, specifically the excess earnings method. This analysis discounts to present value the projected cash flows attributable to the customer relationships, with consideration given to customer contract renewals and estimated customer attrition rates. The following table presents the significant estimates used by management in determining the fair values of customer relationships associated with acquisitions in the years ended December 31, 2017, 2016 and 2015:
2017 | 2016 | 2015 | ||||
Discount rates | 17% to 25% | 20% to 23% | 18% to 22% | |||
Customer attrition rates | 15% to 78% | 10% to 70% | 14% to 70% | |||
Quanta values backlog for acquired businesses as of the acquisition date based upon the contractual nature of the backlog within each service line, discounted to present value. The value of trade names is estimated using the relief-from-royalty method of the income approach. This approach is based on the assumption that in lieu of ownership, a company would be willing to pay a royalty for use of the trade name.
Quanta amortizes intangible assets based upon the estimated consumption of their economic benefits, or on a straight-line basis if the pattern of economic benefit cannot otherwise be reliably estimated. Intangible assets subject to amortization are reviewed for impairment and tested for recoverability whenever events or changes in circumstances indicate that the carrying amount may not be recoverable. For instance, a significant change in business climate or a loss of a significant customer, among other things, may trigger the need for interim impairment testing of intangible assets. An impairment loss is recognized if the carrying amount of an intangible asset is not recoverable and its carrying amount exceeds its fair value. Intangible asset impairments are included within “Asset impairment charges” in the accompanying consolidated statements of operations.
During the fourth quarter of 2017, Quanta recorded an impairment charge of $1.1 million related to a customer relationship intangible asset, which primarily resulted from a strategic decision to restructure a business within a reporting unit in the Oil and Gas Infrastructure Services Division.
During the fourth quarter of 2015, Quanta recorded an impairment charge of $12.1 million related to customer relationship, trade name and non-compete agreement intangible assets, which primarily resulted from lower levels of expected activity in the U.S. Gulf of Mexico and, to a lesser extent, the extended low commodity price environment for certain directional drilling operations in Australia. The two reporting units impacted also had related goodwill impairments, as discussed above, and are in Quanta’s Oil and Gas Infrastructure Services Division.
Investments in Affiliates and Other Entities
In the normal course of business, Quanta enters into various types of investment arrangements, each having unique terms and conditions. These investments may include equity interests held by Quanta in business entities, including general or limited partnerships, contractual joint ventures, or other forms of equity or profit participation. These investments may also include Quanta’s participation in different financing structures, such as the extension of loans to project specific entities, the acquisition of convertible notes issued by project specific entities, or other strategic financing arrangements. Quanta also enters into strategic partnerships with customers and infrastructure investors to provide fully integrated infrastructure services on certain projects, including planning and feasibility analyses, engineering, design, procurement, construction and project operation and maintenance. These projects include public-private partnerships, private infrastructure projects and concessions, along with build, own, operate and transfer and build-to-suit arrangements. As part of this strategy, during the year ended December 31, 2017, Quanta formed a partnership with select investors that provides up to $1.0 billion of capital, including approximately $80.0 million from Quanta, available to invest in certain of these infrastructure projects through August 2024. Wholly owned subsidiaries of Quanta serve as the general partner of this partnership and as a separately operated registered investment adviser that manages the invested capital.
Quanta determines whether investments involve a variable interest entity (VIE) based on the characteristics of the subject entity. If the entity is determined to be a VIE, then management determines if Quanta is the primary beneficiary of the entity and whether or not consolidation of the VIE is required. The primary beneficiary consolidating the VIE must normally have both (i) the power to direct the activities that most significantly affect the VIE’s economic performance and (ii) the obligation to absorb significant losses of or the right to receive significant benefits from the VIE. When Quanta is deemed to be the primary beneficiary, the VIE is consolidated and the other party’s equity interest in the VIE is accounted for as a non-controlling interest. In cases where Quanta determines that it has an undivided interest in the assets, liabilities, revenues and profits of an unincorporated VIE (e.g.,
82
QUANTA SERVICES, INC. AND SUBSIDIARIES
NOTES TO CONSOLIDATED FINANCIAL STATEMENTS - (Continued)
a general partnership interest), such amounts are consolidated on a basis proportional to Quanta’s ownership interest in the unincorporated entity.
Investments in entities of which Quanta is not the primary beneficiary, but over which Quanta has the ability to exercise significant influence, are accounted for using the equity method of accounting. Quanta’s share of net income or losses from unconsolidated equity investments is reported as equity in earnings (losses) of unconsolidated affiliates, which is included in “Other income (expense)” in the accompanying consolidated statements of operations. Equity investments are reviewed for impairment by assessing whether any decline in the fair value of the investment below the carrying amount is other than temporary. In making this determination, factors such as the ability to recover the carrying amount of the investment and the inability of the investee to sustain an earnings capacity are evaluated in determining whether a loss in value should be recognized. Any impairment losses related to investments would be recognized in equity in earnings (losses) of unconsolidated affiliates. Equity method investments are carried at original cost and are included in “Other assets, net” in Quanta’s consolidated balance sheets and are adjusted for Quanta’s proportionate share of the investees’ income, losses and distributions.
Quanta has a minority ownership interest in a limited partnership that was selected during 2014 to build, own and operate a new electric transmission line and two substations in Alberta, Canada. The limited partnership contracted with a Quanta subsidiary to perform the engineering, procurement and construction (EPC) services for the project, and the Quanta subsidiary recognizes revenue and related cost of services as performance progresses on the project. However, due to Quanta’s ownership interest, a proportional amount of the EPC profit is deferred until the electric transmission line and related substations are constructed and ownership of the assets is deemed to be transferred to the third party customer. The profit deferral has been recorded as a decrease to the equity method investment included in “Other assets, net” in the accompanying consolidated balance sheets and as a component of equity in earnings (losses) of unconsolidated affiliates, which is included in “Other income (expense)” in the accompanying consolidated statements of operations. See Notes 11 and 15 for additional disclosures related to investments.
Revenue Recognition
Quanta provides its services pursuant to master service agreements, repair and maintenance contracts and fixed price and non-fixed price installation contracts. Pricing under these contracts may be competitive unit price, cost-plus/hourly (or time and materials basis) or fixed price (or lump sum basis), and the final terms and prices of these contracts are frequently negotiated with the customer. Under unit-based contracts, the utilization of an output-based measurement is appropriate for revenue recognition, and Quanta recognizes revenue as units are completed based on pricing established with the customer for each delivered unit, which best reflects the pattern in which the obligation to the customer is fulfilled. Under cost-plus/hourly and time and materials type contracts, Quanta recognizes revenue on an input basis, as labor hours are incurred and services are performed.
Revenues from fixed price contracts are recognized using the percentage-of-completion method, measured by the percentage of costs incurred to date to total estimated costs for each contract. Such contracts provide that the customer accept completion of progress to date and compensate Quanta for services rendered, which may be measured in terms of units installed, hours expended, costs incurred to date compared to total estimated contract costs or some other measure of progress. Contract costs include all direct materials, labor and subcontract costs and those indirect costs related to contract performance, such as indirect labor, supplies, tools, repairs and depreciation costs. Much of the material associated with Quanta’s work is owner-furnished and is therefore not included in contract revenues and costs. The cost estimation process is based on professional knowledge and experience of Quanta’s engineers, project managers and financial professionals. Changes in job performance, job conditions and final contract settlements are factors that influence management’s assessment of contract value and estimated costs, and as a result, the profit recognized.
As discussed in Note 3, Quanta will adopt new revenue recognition guidance using the modified retrospective transition method effective for the quarter ending March 31, 2018, applying the guidance to contracts with customers that were not substantially complete as of January 1, 2018. Quanta’s financial results for reporting periods after January 1, 2018 will be presented under the new guidance, while financial results for prior periods will continue to be reported in accordance with the prior guidance and Quanta’s historical accounting policy. Quanta has substantially completed its evaluation of the impact of the new guidance on its contracts with customers, including identification of differences that will result from the new requirements. Based on this evaluation, Quanta estimates that the net cumulative adjustment to retained earnings from adoption as of January 1, 2018, will be less than $10.0 million. With respect to ongoing revenues generated from master service agreements, repair and maintenance contracts and fixed price and non-fixed price installation contracts, Quanta does not anticipate any significant changes to the pattern of revenue recognition and does not believe that the guidance surrounding identification of contracts and performance obligations or measurement of variable consideration will have a material impact on the revenue recognition for these arrangements. Quanta expects its disclosures related to revenue recognition will expand to address new quantitative and qualitative requirements regarding the nature, amount and timing of revenue from contracts with customers and additional information related to contract assets and liabilities.
83
QUANTA SERVICES, INC. AND SUBSIDIARIES
NOTES TO CONSOLIDATED FINANCIAL STATEMENTS - (Continued)
Actual revenues and project costs can vary, sometimes substantially, from previous estimates due to changes in a variety of factors, including unforeseen or changed circumstances not included in Quanta’s cost estimates or covered by its contracts for which it cannot obtain adequate compensation or reimbursement. Some of them include concealed or unknown environmental conditions; changes in the cost of equipment, commodities, materials or labor; unanticipated costs or claims due to delays caused by customers or third parties; customer failure to provide required materials or equipment; errors in engineering, specifications or designs; project modifications or contract termination; weather conditions; and quality issues requiring rework or replacement. These factors, along with other risks inherent in performing fixed price contracts, may cause actual revenues and gross profits for a project to differ from previous estimates and could result in reduced profitability or losses on projects. Changes in these factors may result in revisions to costs and income, and their effects are recognized in the period in which the revisions are determined. These factors are routinely evaluated on a project-by-project basis throughout the project term, and the impact of any such revisions in management’s estimates of contract value, contract cost and contract profit are recorded as necessary in the period in which the revisions are determined. Provisions for losses on uncompleted contracts are made in the period in which such losses are determined to be probable and the amount can be reasonably estimated.
Quanta’s operating results for the year ended December 31, 2017 were impacted by less than 5% as a result of aggregate changes in contract estimates related to projects that were in progress at December 31, 2016. Quanta’s operating results for the year ended December 31, 2016 were impacted by less than 5% as a result of aggregate changes in contract estimates related to projects that were in progress at December 31, 2015. However, operating results for the year ended December 31, 2016 included losses of $54.8 million on a power plant construction project in Alaska due to performance issues that increased the estimated costs of the project. This project was substantially completed during the fourth quarter of 2016. The losses on this project were partially offset by the aggregate positive impact of numerous individually immaterial changes in profitability generally due to better than expected performance for projects that were ongoing at December 31, 2015. Quanta’s operating results for the year ended December 31, 2015 were impacted by numerous individually immaterial changes in contract estimates related to projects that were in progress at December 31, 2014; however, the aggregate impact was less than 5% despite losses of $44.9 million recorded during 2015 on the same Alaska power plant construction project.
The current asset “Costs and estimated earnings in excess of billings on uncompleted contracts” represents revenues recognized in excess of amounts billed for contracts accounted for under the percentage-of-completion method. The current liability “Billings in excess of costs and estimated earnings on uncompleted contracts” represents billings in excess of revenues recognized for contracts accounted for under the percentage-of-completion method.
Quanta may incur costs subject to change orders, whether approved or unapproved by the customer, and/or claims related to certain contracts. Quanta determines the probability that such costs will be recovered based upon evidence such as past practices with the customer, specific discussions or preliminary negotiations with the customer or verbal approvals. Quanta treats items as costs of contract performance in the period incurred if it is not probable that the costs will be recovered or will recognize additional revenue if it is probable that the contract price will be adjusted and can be reliably estimated.
As of December 31, 2017 and 2016, Quanta recognized revenues of $144.0 million and $137.8 million related to change orders and/or claims that were in the process of being negotiated and approved in the normal course of business. These aggregate contract price adjustments represent management’s best estimate of additional contract revenues which have been earned and which management believes are probable of collection. The amounts ultimately realized by Quanta upon final acceptance by its customers could be higher or lower than such estimated amounts; however, such amounts cannot currently be estimated.
Income Taxes
Quanta follows the liability method of accounting for income taxes. Under this method, deferred tax assets and liabilities are recorded for future tax consequences of temporary differences between the financial reporting and tax bases of assets and liabilities and are measured using the enacted tax rates and laws that are expected to be in effect when the underlying assets or liabilities are recovered or settled.
Quanta regularly evaluates valuation allowances established for deferred tax assets for which future realization is uncertain, including in connection with changes in tax laws affecting these assets. The estimation of required valuation allowances includes estimates of future taxable income. The ultimate realization of deferred tax assets is dependent upon the generation of future taxable income during the periods in which those temporary differences become deductible. Quanta considers projected future taxable income and tax planning strategies in making this assessment. If actual future taxable income differs from these estimates, Quanta may not realize deferred tax assets to the extent estimated.
Quanta records reserves for income taxes related to certain tax positions in those instances where Quanta considers it more likely than not that additional taxes may be due in excess of amounts reflected on income tax returns filed. When recording reserves for expected tax consequences of uncertain positions, Quanta assumes that taxing authorities have full knowledge of the position
84
QUANTA SERVICES, INC. AND SUBSIDIARIES
NOTES TO CONSOLIDATED FINANCIAL STATEMENTS - (Continued)
and all relevant facts. Quanta continually reviews exposure to additional tax obligations, and as further information is known or events occur, changes in tax reserves may be recorded. To the extent interest and penalties may be assessed by taxing authorities on any underpayment of income tax, such amounts have been accrued and included in the provision for income taxes.
As of December 31, 2017, the total amount of unrecognized tax benefits relating to uncertain tax positions was $36.2 million, an increase from December 31, 2016 of $1.0 million. This increase resulted primarily from a $7.0 million increase in reserves for uncertain tax positions to be taken for 2017 and a $2.2 million net increase for uncertain tax positions related to prior years, partially offset by an $8.3 million decrease in reserves for uncertain tax positions resulting from the expiration of statute of limitations periods. Although the Internal Revenue Service (IRS) completed its examination related to tax years 2010, 2011 and 2012 during the year ended December 31, 2016, certain subsidiaries remain under examination by various U.S. state, Canadian and other foreign tax authorities for multiple periods. Quanta believes it is reasonably possible that within the next 12 months unrecognized tax benefits may decrease by up to $13.7 million as a result of settlement of these examinations or as a result of the expiration of certain statute of limitations periods.
U.S. federal and state and foreign income tax laws and regulations are voluminous and are often ambiguous. As such, Quanta is required to make many subjective assumptions and judgments regarding its tax positions that could materially affect amounts recognized in its future consolidated balance sheets, consolidated statements of operations and consolidated statements of comprehensive income. For example, the Tax Cuts and Jobs Act of 2017 (the Tax Act) significantly revised the U.S. corporate tax regime and resulted in a remeasurement of Quanta’s deferred tax assets and liabilities and is anticipated to significantly reduce its future effective tax rate. For additional information on the status of Quanta’s provisional analysis of the Tax Act, refer to Note 10.
Earnings Per Share
Basic and diluted earnings per share attributable to common stock are computed using the weighted average number of common shares outstanding during the applicable period. Exchangeable shares that were issued pursuant to certain of Quanta’s historical acquisitions (as further discussed in Note 11), which are exchangeable on a one-for-one basis with shares of Quanta common stock, have been included in the calculation of weighted average shares outstanding for basic and diluted earnings per share attributable to common stock for the portion of the periods that they were outstanding. Additionally, unvested stock-based awards that contain non-forfeitable rights to dividends or dividend equivalents (participating) have been included in the calculation of basic and diluted earnings per share attributable to common stock for the portion of the periods that they were outstanding. Diluted earnings per share attributable to common stock is computed using the weighted average number of common shares outstanding during the period adjusted for all potentially dilutive common stock equivalents, except in cases where the effect of the common stock equivalents would be antidilutive.
Insurance
Quanta is insured for employer’s liability, workers’ compensation, auto liability and general liability claims. Under these programs, the deductible for employer’s liability is $1.0 million per occurrence, the deductible for workers’ compensation is $5.0 million per occurrence, and the deductibles for auto liability and general liability are $10.0 million per occurrence. Quanta manages and maintains a portion of its casualty risk through its wholly-owned captive insurance company, which insures all claims up to the amount of the applicable deductible of its third-party insurance programs. Quanta also has employee health care benefit plans for most employees not subject to collective bargaining agreements, of which the primary plan is subject to a deductible of $0.4 million per claimant per year.
Losses under all of these insurance programs are accrued based upon Quanta’s estimate of the ultimate liability for claims reported and an estimate of claims incurred but not reported, with assistance from third-party actuaries. These insurance liabilities are difficult to assess and estimate due to unknown factors, including the severity of an injury, the extent of damage, the determination of Quanta’s liability in proportion to other parties and the number of incidents not reported. The accruals are based upon known facts and historical trends, and management believes such accruals are adequate.
Collective Bargaining Agreements
Some of Quanta’s operating units are parties to various collective bargaining agreements with unions that represent certain of their employees. The collective bargaining agreements expire at various times and have typically been renegotiated and renewed on terms similar to those in the expiring agreements. The agreements require the operating units to pay specified wages, provide certain benefits to their union employees and contribute certain amounts to multiemployer pension plans and employee benefit trusts. Quanta’s multiemployer pension plan contribution rates generally are specified in the collective bargaining agreements (usually on an annual basis), and contributions are made to the plans on a “pay-as-you-go” basis based on its union employee payrolls. The location and number of union employees that Quanta employs at any given time and the plans in which they may participate vary depending on the projects Quanta has ongoing at that time and the need for union resources in connection with
85
QUANTA SERVICES, INC. AND SUBSIDIARIES
NOTES TO CONSOLIDATED FINANCIAL STATEMENTS - (Continued)
those projects. Therefore, Quanta is unable to accurately predict the union employee payroll and the amount of the resulting multiemployer pension plan contribution obligation for future periods.
Stock-Based Compensation
Quanta recognizes compensation expense for restricted stock, restricted stock units (RSUs) and performance units to be settled in common stock based on the fair value of the awards, net of estimated forfeitures. The fair value of these awards is generally determined based on the number of shares or units granted and the closing price of Quanta’s common stock on the date of grant; however, the fair value of performance units with market-based metrics is determined using a Monte Carlo simulation valuation methodology. An estimate of future forfeitures, based on historical data, is utilized to determine the period expense. Such estimates are subject to change and may impact the value that will ultimately be recognized as compensation expense. The resulting compensation expense for performance unit and time-based RSU awards is recognized on a straight-line basis over the requisite service period, which is generally the vesting period, and the resulting compensation expense for performance-based RSU awards is recognized using the graded vesting method over the requisite service period. The compensation expense related to performance units can also vary from period to period based on changes in the total number of performance units that Quanta anticipates will vest. Payments made by Quanta to satisfy employee tax withholding obligations associated with awards settled in common stock are classified as financing cash flows.
Compensation expense associated with liability-based awards, such as RSUs that are expected to or may settle in cash, is recognized based on a remeasurement of the fair value of the award at the end of each reporting period. Upon settlement, the holders receive for each RSU an amount in cash equal to the fair market value on the settlement date of one share of Quanta common stock, as specified in the applicable award agreement. For additional information on Quanta’s restricted stock, RSU, and performance unit awards, see Note 12.
Functional Currency and Translation of Financial Statements
The U.S. dollar is the functional currency for the majority of Quanta’s operations, which are primarily located within the United States. The functional currency for Quanta’s foreign operations, which are primarily located in Canada, Australia and Latin America, is typically the currency of the country where the foreign operating unit is located and transacts the majority of its activities, including billings, financing, payroll and other expenditures. The treatment of foreign currency translation gains or losses is dependent upon management’s determination of the functional currency, and when preparing its consolidated financial statements, Quanta translates the financial statements of its foreign operating units from their functional currency into U.S. dollars. Statements of operations, comprehensive income and cash flows are translated at average monthly rates, while balance sheets are translated at month-end exchange rates. The translation of the balance sheet results in translation gains or losses, which are included as a separate component of equity under “Accumulated other comprehensive income (loss).” Gains and losses arising from transactions not denominated in functional currencies are included within “Other income (expense)” in the accompanying consolidated statements of operations.
Comprehensive Income
Components of comprehensive income include all changes in equity during a period except those resulting from changes in Quanta’s capital related accounts. Quanta records other comprehensive income (loss) for foreign currency translation adjustments related to its foreign operations and for other revenues, expenses, gains and losses that are included in comprehensive income but excluded from net income.
Litigation Costs and Reserves
Quanta records reserves when the likelihood of incurring a loss is probable and the amount of loss can be reasonably estimated. Costs incurred for litigation are expensed as incurred. Further details are presented in Note 15.
Fair Value Measurements
For disclosure purposes, qualifying assets and liabilities are categorized into three broad levels based on the priority of the inputs used to determine their fair values. The fair value hierarchy gives the highest priority to quoted prices (unadjusted) in active markets for identical assets or liabilities (Level 1) and the lowest priority to unobservable inputs (Level 3). Certain assumptions and other information as they relate to these qualifying assets and liabilities are described below.
Contingent Consideration Liabilities. As of December 31, 2017 and 2016, financial instruments required to be measured at fair value on a recurring basis consisted primarily of Quanta’s liabilities related to contingent consideration associated with certain acquisitions, the payment of which is contingent upon the future financial performance of the acquired businesses and, if earned, would be payable to the former owners of the acquired businesses. The liabilities recorded represent the estimated fair values of
86
QUANTA SERVICES, INC. AND SUBSIDIARIES
NOTES TO CONSOLIDATED FINANCIAL STATEMENTS - (Continued)
future amounts payable to the former owners, and the fair values are estimated by management based on entity-specific assumptions that are evaluated on an ongoing basis. As of December 31, 2017 and 2016, the aggregate fair value of these outstanding and unearned contingent consideration liabilities totaled $65.7 million and $19.5 million, which was included in “Insurance and other non-current liabilities” in the accompanying consolidated balance sheets.
The fair values of each contingent consideration liability as of December 31, 2017 was determined using a Monte Carlo simulation valuation methodology based on probability-weighted financial performance projections and other inputs, including a discount rate and an expected volatility factor for each acquisition. The discount rates ranged from 0.9% to 2.3% depending on the settlement methods available and are generally based on a risk-free rate and/or Quanta’s cost of debt. The expected volatility factors ranged from 23.0% to 32.7% based on historical asset volatility of selected guideline public companies. The fair value determinations incorporate significant inputs not observable in the market. Accordingly, the level of inputs used for these fair value measurements is the lowest level (Level 3). Significant changes in any of these assumptions could result in a significantly higher or lower potential liability. Quanta expects a significant portion of these liabilities to be settled by late 2020 or early 2021.
The majority of Quanta’s contingent consideration liabilities are subject to a maximum payment amount, and the aggregate maximum payout amount for these liabilities was $139.5 million as of December 31, 2017. One contingent consideration liability is not subject to a maximum payout amount, and the fair value of that liability was $1.0 million as of December 31, 2017.
Quanta’s aggregate contingent consideration liabilities can change due to additional business acquisitions, payments to settle outstanding liabilities, changes in the fair value of amounts owed, and foreign currency translation gains or losses. During the years ended December 31, 2017, 2016 and 2015, acquisitions increased Quanta’s contingent consideration liabilities by $51.1 million, $18.7 million and $1.0 million. Quanta made no payments related to contingent consideration liabilities during the years ended December 31, 2017 and 2015 and a nominal payment during the year ended December 31, 2016. During the year ended December 31, 2017, Quanta recognized a decrease in the fair value of contingent consideration liabilities of $5.2 million. No changes in fair value of contingent consideration liabilities were recognized in 2016 and 2015. Changes in fair value of contingent consideration liabilities are included in “Change in fair value of contingent consideration liabilities” on Quanta’s consolidated statements of operations.
Goodwill and Other Intangible Assets. In connection with Quanta’s acquisitions, identifiable intangible assets acquired typically include goodwill, backlog, customer relationships, trade names, covenants not-to-compete, patented rights and developed technology. Quanta utilizes the fair value premise as the primary basis for its valuation procedures, which is a market-based approach to determine the price that would be received to sell an asset or paid to transfer a liability in an orderly transaction between market participants. Quanta periodically engages the services of an independent valuation firm when a new business is acquired to assist management with this valuation process, including assistance with the selection of appropriate valuation methodologies and the development of market-based valuation assumptions. Based on these considerations, management utilizes various valuation methods, including an income approach, a market approach and a cost approach, to determine the fair value of intangible assets acquired based on the appropriateness of each method in relation to the type of asset being valued. The assumptions used in these valuation methods are analyzed and compared, where possible, to available market data, such as industry-based weighted average costs of capital and discount rates, trade name royalty rates, public company valuation multiples and recent market acquisition multiples. In accordance with its annual impairment test during the quarter ended December 31, 2017, the carrying amounts of such assets, including goodwill, were compared to their fair values. The level of inputs used for these fair value measurements is the lowest level (Level 3). Quanta uses the assistance of third party specialists to develop valuation assumptions. Quanta believes that these valuation methods appropriately represent the methods that would be used by other market participants in determining fair value.
Investments and Financial Instruments. Quanta also uses fair value measurements in connection with the valuation of its investments in private company equity interests and financial instruments. These valuations require significant management judgment due to the absence of quoted market prices, the inherent lack of liquidity and the long-term nature of such assets. Typically, the initial costs of these investments are considered to represent fair market value, as such amounts are negotiated between willing market participants. On a quarterly basis, Quanta performs an evaluation of its investments to determine if an other-than-temporary decline in the value of each investment has occurred and whether the recorded amount of each investment will be realizable. If an other-than-temporary decline in the value of an investment occurs, a fair value analysis would be performed to determine the degree to which the investment was impaired and a corresponding charge to earnings would be recorded during the period. These types of fair market value assessments are similar to other nonrecurring fair value measures used by Quanta, which include the use of significant judgment and available relevant market data. Such market data may include observations of the valuation of comparable companies, risk adjusted discount rates and an evaluation of the expected performance of the underlying portfolio asset, including historical and projected levels of profitability or cash flows. In addition, a variety of additional factors may be reviewed by management, including, but not limited to, contemporaneous financing and sales transactions with third parties, changes in market outlook and the third-party financing environment.
87
QUANTA SERVICES, INC. AND SUBSIDIARIES
NOTES TO CONSOLIDATED FINANCIAL STATEMENTS - (Continued)
Other. The carrying amounts of cash equivalents, accounts receivable and accounts payable and accrued expenses approximate fair value due to the short-term nature of these instruments. The carrying amount of variable rate debt also approximates fair value. All of Quanta’s cash equivalents were categorized as Level 1 assets at December 31, 2017 and 2016, as all values were based on unadjusted quoted prices for identical assets in an active market that Quanta has the ability to access.
3. | NEW ACCOUNTING PRONOUNCEMENTS: |
Adoption of New Accounting Pronouncements
In July 2015, the FASB issued an update that requires inventory to be measured at the lower of either cost or net realizable value. When evidence exists that the net realizable value of inventory is lower than its cost, the difference will be recognized as a loss in earnings in the period in which it occurs. Quanta adopted this guidance effective January 1, 2017, and the adoption of the update did not have a significant impact on its consolidated financial statements or related disclosures.
In March 2016, the FASB issued an update that amends the accounting for share-based payments in several key areas, including the treatment and cash flow presentation of tax effects related to the settlement of share-based payments and the accounting for forfeitures of share-based awards. The new guidance requires companies with share-based payments to record all related tax effects at settlement (or expiration) through income tax expense on the statement of operations rather than through additional paid-in capital (APIC) within equity. This update also requires excess tax benefits to be classified as an operating activity on the statement of cash flows rather than classified as a financing activity and requires cash paid by an employer when withholding shares for the employee portion of taxes to be presented as a financing activity. The update also allows companies to either account for forfeitures of share-based payments as they occur or to estimate forfeitures. This guidance is required to be applied prospectively except for the classification of cash related to tax withholding, which requires retrospective application. Quanta adopted this guidance effective January 1, 2017 and will continue to estimate forfeitures of share-based payments. Quanta experienced increased volatility of income tax expense after adoption of this guidance and anticipates that trend to continue. During the year ended December 31, 2017, Quanta recorded income tax benefits of $5.1 million related to the settlement of share-based awards. APIC was not adjusted for amounts recorded prior to 2017, and therefore Quanta’s retained earnings were not affected by the adoption of this guidance. Additionally, $8.3 million and $9.8 million were reclassified from operating activities to financing activities on the statements of cash flows for the years ended December 31, 2016 and 2015 associated with cash paid by Quanta to satisfy tax withholding obligations for share-settled awards. Further, the presentation of excess tax benefits on the statements of cash flows is now shown as cash flows from operating activities rather than in financing activities. The excess tax benefits reclassified to operating activities for each of the years ended December 31, 2016 and 2015 was $0.7 million.
In October 2016, the FASB issued an update that amends the consolidation guidance related to how a reporting entity that is the single decision maker of a VIE should treat indirect interests in the VIE held through related parties that are under common control with the reporting entity when determining whether it is the primary beneficiary of a VIE. A reporting entity has an indirect interest in a VIE if it has a direct interest in a related party that, in turn, has a direct interest in the VIE. Quanta adopted this guidance effective January 1, 2017, and the adoption of the update did not have a significant impact on its consolidated financial statements or related disclosures.
In January 2017, the FASB issued an update intended to simplify the subsequent measurement of goodwill by eliminating the second step in the two-step goodwill impairment test. As permitted under this guidance, Quanta elected to adopt this guidance for its annual goodwill impairment test during the fourth quarter of 2017 (see Note 2 for further detail on this update and a description of the quantitative goodwill impairment test).
Accounting Standards Not Yet Adopted
To be adopted effective January 1, 2018:
In May 2014, the FASB issued an update that supersedes most current revenue recognition guidance, as well as certain cost recognition guidance. The update, together with other clarifying updates, requires that the recognition of revenue related to the transfer of goods or services to customers reflects the consideration to which the entity expects to be entitled in exchange for those goods or services. The update also requires new qualitative and quantitative disclosures about the nature, amount, timing and uncertainty of revenues and cash flows arising from customer contracts, including significant judgments and changes in judgments, information about contract balances and performance obligations, and assets recognized from costs incurred to obtain or fulfill a contract. The new guidance is effective for fiscal years beginning on or after December 15, 2017 and can be applied on a full retrospective or modified retrospective basis, whereby the entity records a cumulative effect of initially applying this update at the date of initial application.
88
QUANTA SERVICES, INC. AND SUBSIDIARIES
NOTES TO CONSOLIDATED FINANCIAL STATEMENTS - (Continued)
Quanta will adopt the new revenue recognition guidance using the modified retrospective transition method effective for the quarter ending March 31, 2018, applying the guidance to contracts that were not substantially complete as of January 1, 2018. Quanta’s financial results for reporting periods after January 1, 2018 will be presented under the new guidance, while financial results for prior periods will continue to be reported in accordance with the prior guidance and Quanta’s historical accounting policy. Quanta has substantially completed its evaluation of the impact of the new guidance on its contracts with customers, including identification of differences that will result from the new requirements. Based on this evaluation, we estimate that the net cumulative adjustment to retained earnings from adoption as of January 1, 2018, will be less than $10.0 million. With respect to ongoing revenues generated from master service agreements, repair and maintenance contracts and fixed price and non-fixed price installation contracts, Quanta does not anticipate any significant changes to the pattern of revenue recognition and does not believe that the guidance surrounding identification of contracts and performance obligations or measurement of variable consideration will have a material impact on the revenue recognition for these arrangements. Quanta expects its disclosures related to revenue recognition will expand to address new quantitative and qualitative requirements regarding the nature, amount and timing of revenue from contracts and additional information related to contract assets and liabilities.
In January 2016, the FASB issued an update that addresses certain aspects of recognition, measurement, presentation, and disclosure of financial instruments to provide users of financial statements with more decision-useful information. This update requires equity investments (except those accounted for under the equity method of accounting or those that result in consolidation of the investee) to be measured at fair value with changes in fair value recognized in net income. However, an entity may choose to measure equity investments that do not have readily determinable fair values at cost minus impairment, if any, plus or minus changes resulting from observable price changes in orderly transactions for the identical or a similar investment of the same issuer. The new standard is effective for interim and annual periods beginning after December 15, 2017, and Quanta will adopt the new standard effective January 1, 2018. Quanta’s equity investments that are within the scope of this update do not have readily determinable fair values. Accordingly, Quanta intends to continue to measure these investments at cost less any impairments and will also consider changes resulting from any observable price changes as described above. The new standard is not expected to have a material impact on Quanta’s consolidated financial statements in the near-term based on the equity investments it held as of December 31, 2017.
In August 2016, the FASB issued an update intended to standardize the classification of certain transactions on the statements of cash flows. These transactions include contingent consideration payments made after a business combination, proceeds from the settlement of insurance claims, proceeds from the settlement of corporate-owned life insurance policies and distributions received from equity method investments. The new standard is effective for interim and annual reporting periods beginning after December 15, 2017 and requires application using a retrospective transition method. Quanta will adopt this guidance effective January 1, 2018 and does not expect it to have a material impact on its consolidated financial statements.
In October 2016, the FASB issued an update that will require a reporting entity to recognize the tax expense from the sale of an asset in the seller’s tax jurisdiction when the transfer occurs, even though the pre-tax effects of that transaction are eliminated in consolidation. Any deferred tax asset that arises in the buyer’s jurisdiction would also be recognized at the time of the transfer. The new guidance will not apply to intra-entity transfers of inventory. The income tax consequences from the sale of inventory from one member of a consolidated entity to another will continue to be deferred until the inventory is sold to a third party. The new standard is effective for interim and annual reporting periods beginning after December 15, 2017. The modified retrospective method will be required for transition to the new guidance, with a cumulative-effect adjustment recorded in retained earnings as of the beginning of the period of adoption, if applicable. Quanta will adopt this guidance effective January 1, 2018 and does not expect it to have a material impact on its consolidated financial statements.
In November 2016, the FASB issued an update intended to standardize the classification of restricted cash and cash equivalents transactions on the statement of cash flows. The new guidance requires net cash withdrawn from (deposited to) restricted cash to be removed from investing activities of continuing operations. Additionally, restricted cash balances for each period will be included with “Cash and cash equivalents” in order to obtain beginning and ending balances for consolidated statement of cash flow purposes, and any activity between “Cash and cash equivalents” and restricted cash will no longer be reported on Quanta’s consolidated statements of cash flows. The new standard is effective for interim and annual reporting periods beginning after December 15, 2017. The retrospective transition method will be required for this new guidance. Quanta will adopt this guidance effective January 1, 2018 and does not expect it to have a material impact on its consolidated financial statements.
In January 2017, the FASB issued an update intended to clarify whether transactions should be accounted for as acquisitions or disposals of assets or businesses. When substantially all of the fair value of the gross assets acquired or disposed of is concentrated in a single identifiable asset or group of similar identifiable assets, the asset or group is not a business. The update will require, among other things, that to be considered a business, a set of assets and activities must include, at a minimum, an input and a substantive process that together significantly contribute to the ability to create output. Additionally, the update removes the
89
QUANTA SERVICES, INC. AND SUBSIDIARIES
NOTES TO CONSOLIDATED FINANCIAL STATEMENTS - (Continued)
evaluation of whether a market participant could replace missing elements in order to consider the set of assets and activities a business, provides more stringent criteria for sets without outputs and narrows the definition of output. The update is effective for interim and annual reporting periods beginning after December 15, 2017, and the prospective transition method will be required for this new guidance. Accordingly, Quanta will adopt this guidance effective January 1, 2018 and does not expect it to impact its consolidated financial statements prior to such date.
In May 2017, the FASB issued an update providing guidance about which changes to the terms or conditions of a share-based payment award require an entity to apply modification accounting. A modification should be accounted for unless the following characteristics of the award are unchanged: the fair value, the vesting conditions and the classification as an equity instrument or a liability instrument. The update is effective for interim and annual periods beginning after December 15, 2017 and is required to be applied prospectively. Accordingly, Quanta will adopt this guidance effective January 1, 2018 and does not expect it to impact its consolidated financial statements prior to such date.
To be adopted subsequent to January 1, 2018:
In February 2016, the FASB issued an update that requires companies to recognize on the balance sheet the contractual right to use assets and liabilities corresponding to the rights and obligations created by lease contracts. The new standard is effective for interim and annual periods beginning after December 15, 2018. While Quanta continues to evaluate the effect of the standard on its consolidated financial statements, it is anticipated that the adoption of the standard will materially impact its consolidated balance sheets. Quanta will adopt this guidance by January 1, 2019.
In June 2016, the FASB issued an update that will change the way companies measure credit losses for most financial assets and certain other instruments that are not measured at fair value through net income. The update will require companies to use an “expected loss” model for instruments measured at amortized cost and to record allowances for available-for-sale debt securities rather than reduce the carrying amounts. The update will also require disclosure of information regarding how a company developed its allowance, including changes in the factors that influenced management’s estimate of expected credit losses and the reasons for those changes. Companies will apply this standard’s provisions as a cumulative-effect adjustment to retained earnings as of the beginning of the first reporting period in which the guidance is effective. The new standard is effective for interim and annual reporting periods beginning after December 15, 2019. Quanta is currently evaluating the potential impact of this authoritative guidance on its consolidated financial statements and will adopt this guidance by January 1, 2020.
In August 2017, the FASB issued an update which amends and simplifies existing guidance for presenting the economic effects of risk management activities in the financial statements. The update is effective for interim and annual periods beginning after December 15, 2018. The amended presentation and disclosure guidance is required only prospectively, but certain amendments, if applicable, could require a cumulative-effect adjustment. Quanta is evaluating the impact of this new standard on its consolidated financial statements and will adopt the new standard by January 1, 2019; however, as of December 31, 2017, Quanta had no hedging relationships outstanding.
4. DISCONTINUED OPERATIONS:
On August 4, 2015, Quanta completed the sale of its fiber optic licensing operations to Crown Castle for an aggregate purchase price of $1.00 billion in cash, resulting in estimated after-tax net proceeds of $848.2 million. In the third quarter of 2015, Quanta recognized a pre-tax gain of $271.8 million and a corresponding tax expense of $100.8 million, which resulted in a gain on the sale, net of tax, of $171.0 million. Quanta remains liable for all taxes and insured claims associated with the fiber optic licensing operations arising on or before or outstanding as of August 4, 2015.
90
QUANTA SERVICES, INC. AND SUBSIDIARIES
NOTES TO CONSOLIDATED FINANCIAL STATEMENTS - (Continued)
Quanta has presented the results of operations, financial position, cash flows and disclosures related to its fiber optic licensing operations as discontinued operations in the accompanying consolidated financial statements. The results were included in Quanta’s Fiber Optic Licensing and Other segment prior to the second quarter of 2015. The following represents a reconciliation of the major classes of line items constituting income from discontinued operations primarily related to Quanta’s fiber optic licensing operations to the accompanying consolidated statements of operations (in thousands):
Year Ended December 31, | ||||||||
2016 | 2015 | |||||||
Major classes of line items constituting pretax income from discontinued operations: | ||||||||
Revenues | $ | — | $ | 59,998 | ||||
Expenses: | ||||||||
Cost of services (including depreciation) | — | 24,748 | ||||||
Selling, general and administrative expenses | (980 | ) | 12,047 | |||||
Amortization of intangible assets | — | 963 | ||||||
Other income (expense) items that are not major | — | 10 | ||||||
Net income before taxes of discontinued operations related to fiber optic licensing operations related to major classes of income before taxes | 980 | 22,250 | ||||||
Pretax gain on the disposal of the fiber optic licensing operations | — | 271,833 | ||||||
Total pretax gain on fiber optic licensing operations | 980 | 294,083 | ||||||
Provision for income taxes related to fiber optic licensing operations | 667 | 103,462 | ||||||
Net income from discontinued operations related to fiber optic licensing operations | 313 | 190,621 | ||||||
Net loss from discontinued operations related to telecommunication operations | (655 | ) | — | |||||
Net income (loss) from discontinued operations as presented in the accompanying consolidated statements of operations | $ | (342 | ) | $ | 190,621 | |||
There were no assets or liabilities associated with fiber optic licensing operations at December 31, 2017 or 2016.
Additionally, on December 3, 2012, Quanta sold substantially all of its domestic telecommunications infrastructure services operations and related subsidiaries. During the year ended December 31, 2016, legal fees of $1.0 million were recorded related to an ongoing legal matter associated with these discontinued operations. See Legal Proceedings — Lorenzo Benton v. Telecom Network Specialists, Inc., et al. in Note 15 for additional information. The aggregate net of tax impact of these legal fees was $0.7 million during the year ended December 31, 2016.
5. | ACQUISITIONS: |
2017 Acquisitions
On July 20, 2017, Quanta acquired Stronghold, a specialized services business located in the United States that provides high-pressure and critical-path solutions to the downstream and midstream energy markets. The aggregate consideration included $351.0 million in cash, subject to certain adjustments, and 2,693,680 shares of Quanta common stock, which had a fair value of $81.3 million at the acquisition date. Additionally, the acquisition includes the potential payment of up to $100.0 million of contingent consideration, payable if the acquired business achieves certain financial targets over a three-year period. Based on the estimated fair value of this contingent consideration, Quanta recorded a $51.1 million liability as of the acquisition date. The results of the acquired business have generally been included in Quanta’s Oil and Gas Infrastructure Services segment and consolidated financial statements since the acquisition date.
During the year ended December 31, 2017, Quanta also acquired a communications infrastructure services contractor and an electrical and communications contractor, both of which are located in the United States. The aggregate consideration for these acquisitions consisted of $11.9 million paid or payable in cash, subject to certain adjustments, and 288,666 shares of Quanta common stock, with a value of $8.3 million as of the respective acquisition dates. The results of the acquired businesses have generally been included in Quanta’s Electric Power Infrastructure Services segment and consolidated financial statements since the acquisition dates.
Quanta is in the process of finalizing its assessments of the fair values of the acquired assets and assumed liabilities related to businesses acquired during 2017, and further adjustments to the purchase price allocations may occur. As of December 31, 2017,
91
QUANTA SERVICES, INC. AND SUBSIDIARIES
NOTES TO CONSOLIDATED FINANCIAL STATEMENTS - (Continued)
the estimated fair values of the net assets acquired were preliminary, with possible updates primarily related to certain tax estimates. The aggregate purchase consideration of the businesses acquired during 2017 was preliminarily allocated to acquired assets and assumed liabilities, which resulted in an allocation of $97.4 million to net tangible assets, $103.8 million to identifiable intangible assets and $302.4 million to goodwill.
2016 Acquisitions
During 2016, Quanta completed five acquisitions. The results of four of the acquired businesses are generally included in Quanta’s Electric Power Infrastructure Services segment. These businesses included an electrical infrastructure services business located in Australia, a utility contracting business located in Canada, a full service medium- and high-voltage powerline contracting business located in the United States and a communications services business located in Canada. Quanta also acquired a pipeline services contractor located in the United States, the results of which are generally included in Quanta’s Oil and Gas Infrastructure Services segment. The aggregate consideration for these acquisitions consisted of $75.9 million paid or payable in cash, subject to certain adjustments, 70,840 shares of Quanta common stock valued at $1.5 million as of the settlement date of the applicable acquisition, and contingent consideration payments of up to $39.5 million, payable if financial targets are achieved by certain of the acquired businesses. Based on the estimated fair value of this contingent consideration, Quanta recorded a total of $18.7 million in liabilities as of the applicable acquisition dates. The results of the acquired businesses have been included in Quanta’s consolidated financial statements since the acquisition dates.
2015 Acquisitions
During 2015, Quanta acquired 11 businesses. The results of eight of the acquired businesses are generally included in Quanta’s Electric Power Infrastructure Services segment. These businesses included a foundation services business located in the United States, an electrical contracting business located in the United States, an electrical engineering business located in Australia, a powerline construction business located in the United States, an engineering business located in Canada, an engineering, procurement and construction services business based in the United States, an underground construction contracting business located in Canada, and a supplier and material procurement specialist for the power and utility industry in Canada. The results of the remaining three acquired businesses are generally included in Quanta’s Oil and Gas Infrastructure Services segment. These businesses include a business that services above-ground storage tanks in the United States, an underground utility distribution contractor that provides services to gas and electric utilities in Canada, and a business that specializes in the engineering, procurement, construction, and commissioning of compression and surface facilities for the high pressure gas industry in Australia. The aggregate consideration for these acquisitions consisted of $110.6 million paid or payable in cash, subject to certain adjustments, 461,037 shares of Quanta common stock valued at $10.1 million as of the settlement dates of the applicable acquisitions, and contingent consideration payments with an estimated fair value of $1.0 million as of the applicable acquisition date. The results of the acquired businesses have been included in Quanta’s consolidated financial statements since the acquisition dates.
92
QUANTA SERVICES, INC. AND SUBSIDIARIES
NOTES TO CONSOLIDATED FINANCIAL STATEMENTS - (Continued)
2017, 2016 and 2015 Acquisitions
The following table summarizes the aggregate consideration paid or payable as of December 31, 2017 for the 2017 and 2016 acquisitions and presents the allocation of these amounts to the net tangible and identifiable intangible assets based on their estimated fair values as of the respective acquisition dates, inclusive of any purchase price adjustments. This allocation requires a significant use of estimates and is based on information that was available to management at the time these consolidated financial statements were prepared. Quanta uses a variety of information to estimate fair values, including quoted market prices, carrying values and valuation techniques such as discounted cash flows. Third-party appraisal firms are engaged to assist in fair value determination of fixed assets, intangible assets and certain other assets and liabilities when appropriate (in thousands).
2017 | 2016 | |||||||||||
Stronghold | Other Acquisitions | All Acquisitions | ||||||||||
Consideration: | ||||||||||||
Cash paid or payable | $ | 351,014 | $ | 11,904 | $ | 75,941 | ||||||
Value of Quanta common stock issued | 81,337 | 8,267 | 1,508 | |||||||||
Contingent consideration | 51,084 | — | 18,683 | |||||||||
Fair value of total consideration transferred or estimated to be transferred | $ | 483,435 | $ | 20,171 | $ | 96,132 | ||||||
Accounts receivable | $ | 77,478 | $ | 7,157 | $ | 14,414 | ||||||
Costs and estimated earnings in excess of billings on uncompleted contracts | 11,913 | 193 | 1,237 | |||||||||
Other current assets | 20,914 | 170 | 8,582 | |||||||||
Property and equipment | 51,258 | 1,480 | 44,863 | |||||||||
Other assets | 1,513 | 12 | 2,553 | |||||||||
Identifiable intangible assets | 95,700 | 8,091 | 11,467 | |||||||||
Current liabilities | (71,835 | ) | (2,798 | ) | (12,097 | ) | ||||||
Deferred tax liabilities, net | — | — | (13,484 | ) | ||||||||
Other long-term liabilities | (48 | ) | — | (5,326 | ) | |||||||
Total identifiable net assets | 186,893 | 14,305 | 52,209 | |||||||||
Goodwill | 296,542 | 5,866 | 43,923 | |||||||||
$ | 483,435 | $ | 20,171 | $ | 96,132 | |||||||
Goodwill represents the excess of the purchase price over the net amount of the fair values assigned to assets acquired and liabilities assumed. The 2017, 2016 and 2015 acquisitions strategically expanded Quanta’s Canadian, Australian and domestic electric power, oil and gas and communications service offerings, which Quanta believes contributes to the recognition of the goodwill. In connection with the 2017 acquisitions, as of the acquisition dates and inclusive of purchase price adjustments, goodwill of $5.9 million was recorded for the acquired businesses that were included within Quanta’s Electric Power Infrastructure Services Division, and goodwill of $296.5 million was recorded for Stronghold, which was included within Quanta’s Oil and Gas Infrastructure Services Division. In connection with the 2016 acquisitions, as of the acquisition dates and inclusive of purchase price adjustments, goodwill of $23.6 million was recorded for the acquired businesses included within Quanta’s Electric Power Infrastructure Services Division and goodwill of $20.3 million was recorded for the acquired business included within Quanta’s Oil and Gas Infrastructure Services Division. In connection with the 2015 acquisitions, as of the acquisition dates and inclusive of purchase price adjustments, goodwill of $31.5 million was recorded for acquired businesses that were included within Quanta’s Electric Power Infrastructure Services Division, and goodwill of $20.4 million was recorded for the acquired businesses that were included within Quanta’s Oil and Gas Infrastructure Services Division. Goodwill of $302.4 million related to the 2017 acquisitions is expected to be deductible for income tax purposes, and goodwill of $2.0 million related to the 2016 acquisitions is expected to be deductible for income tax purposes.
93
QUANTA SERVICES, INC. AND SUBSIDIARIES
NOTES TO CONSOLIDATED FINANCIAL STATEMENTS - (Continued)
The following table summarizes the estimated fair values of identifiable intangible assets for the 2017 acquisitions as of the acquisition dates and the related weighted average amortization periods by type (in thousands, except for weighted average amortization periods, which are in years).
Estimated | Weighted Average | |||||
Fair Value | Amortization Period in Years | |||||
Customer relationships | $ | 76,213 | 6.8 | |||
Backlog | 333 | 2.0 | ||||
Trade names | 18,815 | 15.0 | ||||
Non-compete agreements | 8,430 | 5.0 | ||||
Total intangible assets subject to amortization acquired in 2017 acquisitions | $ | 103,791 | 8.1 | |||
The following unaudited supplemental pro forma results of operations have been provided for illustrative purposes only and do not purport to be indicative of the actual results that would have been achieved by the combined companies for the periods presented or that may be achieved by the combined companies in the future. Future results may vary significantly from the results reflected in the following pro forma financial information because of future events and transactions, as well as other factors (in thousands, except per share amounts):
Year Ended December 31, | ||||||||||||
2017 | 2016 | 2015 | ||||||||||
Revenues | $ | 9,712,820 | $ | 8,183,104 | $ | 7,770,744 | ||||||
Gross profit | $ | 1,301,322 | $ | 1,129,661 | $ | 956,925 | ||||||
Selling, general and administrative expenses | $ | 821,084 | $ | 734,900 | $ | 612,979 | ||||||
Amortization of intangible assets | $ | 40,356 | $ | 46,579 | $ | 39,947 | ||||||
Net income from continuing operations | $ | 320,768 | $ | 207,956 | $ | 136,608 | ||||||
Net income from continuing operations attributable to common stock | $ | 317,521 | $ | 206,241 | $ | 125,691 | ||||||
Earnings per share from continuing operations: | ||||||||||||
Basic | $ | 2.01 | $ | 1.29 | $ | 0.64 | ||||||
Diluted | $ | 2.00 | $ | 1.29 | $ | 0.64 | ||||||
The pro forma combined results of operations for the years ended December 31, 2017 and 2016 were prepared by adjusting the historical results of Quanta to include the historical results of the 2017 acquisitions as if they occurred January 1, 2016. The pro forma combined results of operations for the year ended December 31, 2016 have also been prepared by adjusting the historical results of Quanta to include the historical results of the 2016 acquisitions as if they occurred January 1, 2015. The pro forma combined results of operations for the year ended December 31, 2015 have been prepared by adjusting the historical results of Quanta to include the historical results of the 2016 acquisitions as if they occurred January 1, 2015 and the historical results of the 2015 acquisitions as if it occurred January 1, 2014. These pro forma combined historical results were adjusted for the following: a reduction of interest expense as a result of the repayment of outstanding indebtedness of the acquired businesses; a reduction of interest income or an increase in interest expense as a result of the cash consideration paid net of cash received; an increase in amortization expense due to the incremental intangible assets recorded; changes in depreciation expense within cost of services to adjust acquired property and equipment to the acquisition date fair value and to conform with Quanta’s accounting policies; an increase in the number of outstanding shares of Quanta common stock; and reclassifications to conform the acquired companies’ presentation to Quanta’s accounting policies. The pro forma results of operations do not include any adjustments to eliminate the impact of acquisition related costs or any cost savings or other synergies that resulted or may result from the acquisitions. As noted above, the pro forma results of operations do not purport to be indicative of the actual results that would have been achieved by the combined company for the periods presented or that may be achieved by the combined company in the future.
Revenues of approximately $207.4 million and a loss from continuing operations before income taxes of approximately $8.1 million, which included $5.4 million of acquisition-related costs, were included in Quanta’s consolidated results of operations for the year ended December 31, 2017 related to the 2017 acquisitions. Revenues of approximately $68.5 million and a loss from continuing operations before income taxes of approximately $5.6 million, which included $0.3 million of acquisition-related costs, were included in Quanta’s consolidated results of operations for the year ended December 31, 2016 related to the 2016 acquisitions. Additionally, revenues of approximately $104.6 million and income from continuing operations before income taxes of
94
QUANTA SERVICES, INC. AND SUBSIDIARIES
NOTES TO CONSOLIDATED FINANCIAL STATEMENTS - (Continued)
approximately $0.3 million, which included $3.6 million of acquisition-related costs, were included in Quanta’s consolidated results of operations for the year ended December 31, 2015 related to the 2015 acquisitions.
6. | GOODWILL AND OTHER INTANGIBLE ASSETS: |
A summary of changes in Quanta’s goodwill is as follows (in thousands):
Electric Power Infrastructure Services Division | Oil and Gas Infrastructure Services Division | Total | ||||||||||
Balance at December 31, 2015: | ||||||||||||
Goodwill | $ | 1,226,245 | $ | 366,306 | 1,592,551 | |||||||
Accumulated impairment | — | (39,893 | ) | (39,893 | ) | |||||||
1,226,245 | 326,413 | 1,552,658 | ||||||||||
Goodwill recorded related to 2016 acquisitions | 24,168 | 21,018 | 45,186 | |||||||||
Purchase price allocation adjustments | 229 | (214 | ) | 15 | ||||||||
Foreign currency translation adjustments | 3,337 | 1,973 | 5,310 | |||||||||
Balance at December 31, 2016: | ||||||||||||
Goodwill | 1,253,979 | 388,923 | 1,642,902 | |||||||||
Accumulated impairment | — | (39,733 | ) | (39,733 | ) | |||||||
1,253,979 | 349,190 | 1,603,169 | ||||||||||
Goodwill recorded related to 2017 acquisitions | 5,866 | 296,542 | 302,408 | |||||||||
Purchase price allocation adjustments | (619 | ) | (659 | ) | (1,278 | ) | ||||||
Goodwill impairment during 2017 | — | (57,011 | ) | (57,011 | ) | |||||||
Foreign currency translation adjustments | 13,301 | 8,011 | 21,312 | |||||||||
Balance at December 31, 2017: | ||||||||||||
Goodwill | 1,272,527 | 693,905 | 1,966,432 | |||||||||
Accumulated impairment | — | (97,832 | ) | (97,832 | ) | |||||||
$ | 1,272,527 | $ | 596,073 | $ | 1,868,600 | |||||||
Adjustments primarily represent changes in deferred tax liability estimates and would not have had a material impact on Quanta’s consolidated financial statements in prior periods had these adjustments been booked at the respective acquisition dates. The goodwill impairment in the year ended December 31, 2017 was associated with two reporting units within the Oil and Gas Infrastructure Services Division. Specifically, a reporting unit that provides material handling services experienced lower operating margins and is expected to continue to face a highly competitive environment in its select markets, and a reporting unit that provides marine and offshore services experienced prolonged periods of reduced revenues and operating margins and is expected to continue to experience lower levels of activity in the U.S. Gulf of Mexico and other offshore markets.
Also, as described in Note 2, Quanta’s operating units are organized into one of Quanta’s two internal divisions and, accordingly, the goodwill associated with the operating units has been aggregated on a divisional basis in the table above. These divisions are closely aligned with Quanta’s reportable segments and operating units are assigned to a division based on the predominant type of work performed. From time to time, an operating unit may be reorganized between divisions if its predominant business evolves.
95
QUANTA SERVICES, INC. AND SUBSIDIARIES
NOTES TO CONSOLIDATED FINANCIAL STATEMENTS - (Continued)
Quanta’s intangible assets subject to amortization and the remaining weighted average amortization periods related to such assets were as follows (in thousands except for weighted average amortization periods, which are in years):
As of | As of | As of | ||||||||||||||||||||||||
December 31, 2017 | December 31, 2016 | December 31, 2017 | ||||||||||||||||||||||||
Intangible Assets | Accumulated Amortization | Intangible Assets, Net | Intangible Assets | Accumulated Amortization | Intangible Assets, Net | Remaining Weighted Average Amortization Period in Years | ||||||||||||||||||||
Customer relationships | $ | 327,334 | $ | (137,333 | ) | $ | 190,001 | $ | 244,329 | $ | (110,640 | ) | $ | 133,689 | 7.3 | |||||||||||
Backlog | 136,266 | (135,847 | ) | 419 | 133,592 | (132,441 | ) | 1,151 | 1.1 | |||||||||||||||||
Trade names | 74,797 | (17,057 | ) | 57,740 | 54,723 | (12,855 | ) | 41,868 | 16.2 | |||||||||||||||||
Non-compete agreements | 37,760 | (27,659 | ) | 10,101 | 29,212 | (25,546 | ) | 3,666 | 3.9 | |||||||||||||||||
Patented rights and developed technology | 22,529 | (17,611 | ) | 4,918 | 22,480 | (15,831 | ) | 6,649 | 3.4 | |||||||||||||||||
Total intangible assets subject to amortization | $ | 598,686 | $ | (335,507 | ) | $ | 263,179 | $ | 484,336 | $ | (297,313 | ) | $ | 187,023 | 9.1 | |||||||||||
Amortization expense for intangible assets was $32.2 million, $31.7 million and $34.8 million for the years ended December 31, 2017, 2016 and 2015, respectively. During the year ended December 31, 2017, Quanta recorded an impairment charge of $1.1 million related to a customer relationships intangible asset, which primarily resulted from a strategic decision to restructure a business within a reporting unit in Quanta’s Oil and Gas Infrastructure Services Division. The impairment charge recognized in 2017 is reflected in the December 31, 2017 accumulated amortization balances above. Additionally, during the year ended December 31, 2015, Quanta recorded an impairment charge of $12.1 million related to customer relationship, trade name and non-compete agreement intangible assets. These intangible asset impairments primarily resulted from lower levels of expected activity in the U.S. Gulf of Mexico and, to a lesser extent, due to the extended low commodity price environment with respect to certain directional drilling operations in Australia. The two reporting units impacted are in Quanta’s Oil and Gas Infrastructure Services Division. The impairment charges recognized in 2015 are reflected in the December 31, 2017 and 2016 accumulated amortization balances above.
The estimated future aggregate amortization expense of intangible assets subject to amortization as of December 31, 2017 is set forth below (in thousands):
For the Fiscal Year Ending December 31, | ||||
2018 | $ | 39,188 | ||
2019 | 37,038 | |||
2020 | 35,639 | |||
2021 | 33,295 | |||
2022 | 29,764 | |||
Thereafter | 88,255 | |||
Total | $ | 263,179 | ||
96
QUANTA SERVICES, INC. AND SUBSIDIARIES
NOTES TO CONSOLIDATED FINANCIAL STATEMENTS - (Continued)
7. | PER SHARE INFORMATION: |
The amounts used to compute the basic and diluted earnings per share attributable to common stock for the years ended December 31, 2017, 2016 and 2015 are illustrated below (in thousands):
Year Ended December 31, | ||||||||||||
2017 | 2016 | 2015 | ||||||||||
Amounts attributable to common stock: | ||||||||||||
Net income from continuing operations | $ | 314,978 | $ | 198,725 | $ | 120,286 | ||||||
Net income (loss) from discontinued operations | — | (342 | ) | 190,621 | ||||||||
Net income attributable to common stock | $ | 314,978 | $ | 198,383 | $ | 310,907 | ||||||
Weighted average shares: | ||||||||||||
Weighted average shares outstanding for basic earnings per share attributable to common stock | 156,124 | 157,287 | 195,113 | |||||||||
Effect of dilutive unvested non-participating stock-based awards | 1,031 | 1 | 7 | |||||||||
Weighted average shares outstanding for diluted earnings per share attributable to common stock | 157,155 | 157,288 | 195,120 | |||||||||
For purposes of calculating diluted earnings per share attributable to common stock, there were no adjustments required to derive Quanta’s net income attributable to common stock. Exchangeable shares that were issued pursuant to certain of Quanta’s historical acquisitions (as further discussed in Note 11), which are exchangeable on a one-for-one basis with shares of Quanta common stock, have been included in the calculation of weighted average shares outstanding for basic and diluted earnings per share attributable to common stock for the portion of the periods that they were outstanding. Additionally, unvested stock-based awards that contain non-forfeitable rights to dividends or dividend equivalents (participating) have been included in the calculation of basic and diluted earnings per share attributable to common stock for the portion of the periods that they were outstanding. Diluted earnings per share attributable to common stock is computed using the weighted average number of common shares outstanding during the period adjusted for all potentially dilutive common stock equivalents, except in cases where the effect of the common stock equivalents would be antidilutive.
8. | DETAIL OF CERTAIN BALANCE SHEET ACCOUNTS: |
Activity in Quanta’s current and long-term allowance for doubtful accounts consisted of the following (in thousands):
December 31, | ||||||||
2017 | 2016 | |||||||
Balance at beginning of year | $ | 2,752 | $ | 5,226 | ||||
Charged to bad debt expense (recoveries of bad debt expense) | 87 | (543 | ) | |||||
Deductions for uncollectible receivables written off (recoveries of uncollectible receivables) | 1,626 | (1,931 | ) | |||||
Balance at end of year | $ | 4,465 | $ | 2,752 | ||||
97
QUANTA SERVICES, INC. AND SUBSIDIARIES
NOTES TO CONSOLIDATED FINANCIAL STATEMENTS - (Continued)
Contracts in progress were as follows (in thousands):
December 31, | ||||||||
2017 | 2016 | |||||||
Costs incurred on contracts in progress | $ | 7,912,999 | $ | 6,687,484 | ||||
Estimated earnings, net of estimated losses | 1,092,303 | 766,560 | ||||||
9,005,302 | 7,454,044 | |||||||
Less — Billings to date | (8,941,397 | ) | (7,255,582 | ) | ||||
$ | 63,905 | $ | 198,462 | |||||
Costs and estimated earnings in excess of billings on uncompleted contracts | $ | 497,292 | $ | 473,308 | ||||
Less — Billings in excess of costs and estimated earnings on uncompleted contracts | (433,387 | ) | (274,846 | ) | ||||
$ | 63,905 | $ | 198,462 | |||||
Property and equipment consisted of the following (in thousands):
Estimated Useful | December 31, | ||||||||
Lives in Years | 2017 | 2016 | |||||||
Land | N/A | $ | 48,832 | $ | 45,919 | ||||
Buildings and leasehold improvements | 5-30 | 155,628 | 137,515 | ||||||
Operating equipment and vehicles | 5-25 | 1,834,715 | 1,634,850 | ||||||
Office equipment, furniture and fixtures and information technology systems | 3-10 | 170,115 | 145,174 | ||||||
Construction work in progress | N/A | 60,587 | 73,461 | ||||||
2,269,877 | 2,036,919 | ||||||||
Less — Accumulated depreciation and amortization | (981,275 | ) | (862,825 | ) | |||||
Property and equipment, net | $ | 1,288,602 | $ | 1,174,094 | |||||
Accounts payable and accrued expenses consisted of the following (in thousands):
December 31, | ||||||||
2017 | 2016 | |||||||
Accounts payable, trade | $ | 632,931 | $ | 529,608 | ||||
Accrued compensation and related expenses | 225,193 | 194,056 | ||||||
Accrued insurance, current portion | 64,112 | 60,880 | ||||||
Deferred revenues, current portion | 15,967 | 15,512 | ||||||
Income and franchise taxes payable | 19,635 | 40,765 | ||||||
Other accrued expenses | 99,622 | 81,998 | ||||||
$ | 1,057,460 | $ | 922,819 | |||||
98
QUANTA SERVICES, INC. AND SUBSIDIARIES
NOTES TO CONSOLIDATED FINANCIAL STATEMENTS - (Continued)
9. | DEBT OBLIGATIONS: |
Quanta’s long-term debt obligations consisted of the following (in thousands):
December 31, | |||||||
2017 | 2016 | ||||||
Borrowings under credit facility | $ | 668,427 | $ | 351,341 | |||
Other long-term debt, interest rates ranging from 2.4% to 4.3% | 1,810 | 3,305 | |||||
Capital leases, interest rates ranging from 2.5% to 3.8% | 1,704 | 3,744 | |||||
Total long-term debt obligations | 671,941 | 358,390 | |||||
Less — Current maturities of long-term debt | 1,220 | 4,828 | |||||
Total long-term debt obligations, net of current maturities | $ | 670,721 | $ | 353,562 | |||
Quanta’s current maturities of long-term debt and short-term debt consisted of the following (in thousands):
December 31, | |||||||
2017 | 2016 | ||||||
Short-term debt | $ | — | $ | 2,735 | |||
Current maturities of long-term debt | 1,220 | 4,828 | |||||
Current maturities of long-term debt and short-term debt | $ | 1,220 | $ | 7,563 | |||
Senior Secured Revolving Credit Facility
On December 18, 2015, Quanta entered into an amended and restated credit agreement with various lenders that provides for a $1.81 billion senior secured revolving credit facility. On October 31, 2017, Quanta and the lenders entered into an amendment to the credit facility which, among other things, extended the maturity date from December 18, 2020 to October 31, 2022 and adjusted the interest rates applicable to certain borrowings. The entire amount available under the credit facility may be used by Quanta for revolving loans and letters of credit in U.S. dollars and certain alternative currencies. Up to $600.0 million of the credit facility may be used by certain subsidiaries of Quanta for revolving loans and letters of credit in certain alternative currencies. Up to $100.0 million of the credit facility may be used for swing line loans in U.S. dollars, up to $50.0 million of the credit facility may be used for swing line loans in Canadian dollars and up to $30.0 million of the credit facility may be used for swing line loans in Australian dollars. In addition, subject to the conditions specified in the credit agreement, Quanta has the option to increase the revolving commitments by up to $400.0 million from time to time upon receipt of additional commitments from new or existing lenders. Borrowings under the credit agreement are to be used to refinance existing indebtedness and for working capital, capital expenditures and other general corporate purposes.
As of December 31, 2017, Quanta had $413.3 million of outstanding letters of credit and bank guarantees under its senior secured revolving credit facility, $228.6 million of which were denominated in U.S. dollars and $184.7 million of which were denominated in currencies other than the U.S. dollar, primarily in Australian or Canadian dollars. Quanta also had $668.4 million of outstanding revolving loans under its credit facility, $645.0 million of which were denominated in U.S. dollars and $23.4 million of which were denominated in Australian dollars. The remaining $728.3 million was available for revolving loans or new letters of credit or bank guarantees. Borrowings under the credit facility and the applicable interest rates during the years ended December 31, 2017, 2016 and 2015 were as follows (dollars in thousands):
Year Ended December 31, | |||||||||||
2017 | 2016 | 2015 | |||||||||
Maximum amount outstanding under the credit facility during the period | $ | 917,895 | $ | 518,607 | $ | 606,753 | |||||
Average daily amount outstanding under the credit facility | $ | 613,130 | $ | 458,908 | $ | 258,815 | |||||
Weighted-average interest rate | 2.7 | % | 2.1 | % | 1.8 | % | |||||
Beginning on November 20, 2017, amounts borrowed in U.S. dollars bear interest, at Quanta’s option, at a rate equal to either (i) the Eurocurrency Rate plus 1.125% to 2.000%, as determined based on Quanta’s Consolidated Leverage Ratio, or (ii) the Base Rate plus 0.125% to 1.000%, as determined based on Quanta’s Consolidated Leverage Ratio. Amounts borrowed as revolving loans under the credit agreement in any currency other than U.S. dollars bear interest at a rate equal to the Eurocurrency Rate plus 1.125% to 2.000%, as determined based on Quanta’s Consolidated Leverage Ratio. Additionally, standby or commercial letters of credit issued under the credit agreement are subject to a letter of credit fee of 1.125% to 2.000%, based on Quanta’s
99
QUANTA SERVICES, INC. AND SUBSIDIARIES
NOTES TO CONSOLIDATED FINANCIAL STATEMENTS - (Continued)
Consolidated Leverage Ratio, and Performance Letters of Credit issued under the credit agreement in support of certain contractual obligations are subject to a letter of credit fee of 0.675% to 1.150%, based on Quanta’s Consolidated Leverage Ratio.
From December 18, 2015 through November 19, 2017, amounts borrowed in U.S. dollars bore interest, at Quanta’s option, at a rate equal to either (i) the Eurocurrency Rate (as defined in the credit agreement) plus 1.125% to 2.125%, as determined based on Quanta’s Consolidated Leverage Ratio (as described below), or (ii) the Base Rate (as described below) plus 0.125% to 1.125%, as determined based on Quanta’s Consolidated Leverage Ratio. Amounts borrowed as revolving loans under the credit agreement in any currency other than U.S. dollars bore interest at a rate equal to the Eurocurrency Rate plus 1.125% to 2.125%, as determined based on Quanta’s Consolidated Leverage Ratio. Standby letters of credit issued under the credit agreement were subject to a letter of credit fee of 1.125% to 2.125%, based on Quanta’s Consolidated Leverage Ratio, and Performance Letters of Credit (as defined in the credit agreement) issued under the credit agreement in support of certain contractual obligations were subject to a letter of credit fee of 0.675% to 1.275%, based on Quanta’s Consolidated Leverage Ratio.
Quanta is also subject to a commitment fee of 0.20% to 0.40%, based on its Consolidated Leverage Ratio, on any unused availability under the credit agreement.
The Consolidated Leverage Ratio is the ratio of Quanta’s Consolidated Funded Indebtedness to Consolidated EBITDA (as those terms are defined in the credit agreement). For purposes of calculating Quanta’s Consolidated Leverage Ratio, Consolidated Funded Indebtedness is reduced by available cash and cash equivalents (as defined in the credit agreement) in excess of $25.0 million. The Base Rate equals the highest of (i) the Federal Funds Rate (as defined in the credit agreement) plus 0.5%, (ii) the prime rate publicly announced by Bank of America, N.A. and (iii) the Eurocurrency Rate plus 1.00%.
Subject to certain exceptions, the credit agreement is secured by substantially all the assets of Quanta and Quanta’s wholly owned U.S. subsidiaries and by a pledge of all of the capital stock of Quanta’s wholly owned U.S. subsidiaries and 65% of the capital stock of direct foreign subsidiaries of Quanta’s wholly owned U.S. subsidiaries. Quanta’s wholly owned U.S. subsidiaries also guarantee the repayment of all amounts due under the credit agreement. Subject to certain conditions, all collateral will automatically be released from the liens at any time Quanta maintains an Investment Grade Rating (defined in the credit agreement as two of the following three conditions being met: (i) a corporate credit rating that is BBB- or higher by Standard & Poor’s Rating Services, (ii) a corporate family rating that is Baa3 or higher by Moody’s Investors Services, Inc. or (iii) a corporate credit rating that is BBB- or higher by Fitch Ratings, Inc.).
The credit agreement contains certain covenants, including (1) a maximum Consolidated Leverage Ratio of 3.0 to 1.0 (provided that in connection with certain permitted acquisitions in excess of $200.0 million, such ratio is 3.5 to 1.0 for the fiscal quarter in which the acquisition is completed and the two subsequent fiscal quarters) and (2) a minimum Consolidated Interest Coverage Ratio (as defined in the credit agreement) of 3.0 to 1.0. As of December 31, 2017, Quanta was in compliance with all of the covenants in the credit agreement.
The credit agreement also limits certain acquisitions, mergers and consolidations, indebtedness, asset sales and prepayments of indebtedness and, subject to certain exceptions, prohibits liens on Quanta’s assets. The credit agreement allows cash payments for dividends and stock repurchases subject to compliance with the following requirements (after giving effect to the dividend or stock repurchase): (i) no default or event of default under the credit agreement; (ii) continued compliance with the financial covenants in the credit agreement; and (iii) at least $100.0 million of availability under the credit agreement and/or cash and cash equivalents on hand.
The credit agreement provides for customary events of default and contains cross-default provisions with Quanta’s underwriting, continuing indemnity and security agreement with its sureties and all of Quanta’s other debt instruments exceeding $100.0 million in borrowings or availability. If an Event of Default (as defined in the credit agreement) occurs and is continuing, on the terms and subject to the conditions set forth in the credit agreement, the lenders may declare all amounts outstanding and accrued and unpaid interest immediately due and payable, require that Quanta provide cash collateral for all outstanding letter of credit obligations, terminate the commitments under the credit agreement, and foreclose on the collateral.
Prior to the amendment and restatement of Quanta’s credit agreement on December 18, 2015 and after April 1, 2014, amounts borrowed bore interest at the same rates as the period from December 18, 2015 through November 19, 2017 described above, and Quanta was subject to the same commitment fees as above.
Other Facilities
Quanta has also entered into bilateral credit agreements with various lenders that provide for up to $50.2 million in aggregate availability in both U.S. dollars and certain alternative currencies, primarily Australian dollars. Quanta may utilize these facilities for, among other things, the issuance of letters of credit or bank guarantees and overdraft protection and had $2.8 million of letters of credit and bank guarantees outstanding under these facilities at December 31, 2017.
100
QUANTA SERVICES, INC. AND SUBSIDIARIES
NOTES TO CONSOLIDATED FINANCIAL STATEMENTS - (Continued)
10. | INCOME TAXES: |
The Tax Act, among other things, lowers the U.S. corporate income tax rate from 35% to 21% effective January 1, 2018, requires companies to pay a one-time transition tax on earnings of certain foreign subsidiaries, limits and eliminates certain tax deductions and creates new taxes on certain foreign-sourced earnings. Consequently, during the year ended December 31, 2017, one-time net tax benefits of $70.1 million were recorded, including $85.3 million of tax benefits associated with the re-measurement of U.S. deferred tax assets and liabilities based on rates at which they are expected to reverse in future periods, which is generally 21%; partially offset by an estimated $15.2 million transition tax on post-1986 earnings and profits of certain foreign subsidiaries. Also during the year ended December 31, 2017, an additional one-time tax benefit of $26.7 million was recorded associated with entity restructuring and recapitalization efforts, partially offset by an $8.5 million decrease of the production activity related tax benefit due to the acceleration of certain deductions in 2017.
While Quanta has substantially completed its provisional analysis of the effects of the Tax Act and recorded a reasonable estimate of such effects, the net one-time benefits related to the Tax Act may differ, possibly materially, due to, among other things, further refinement of Quanta’s calculations, changes in interpretations and assumptions made, additional regulatory guidance, and actions and related accounting policy decisions resulting from the Tax Act. Quanta will complete its analysis over a one-year measurement period ending December 22, 2018, and any adjustments during the measurement period will be included within “Net income from continuing operations” as an adjustment to “Provision for income taxes” on Quanta’s consolidated statement of operations in the reporting period when such adjustments are determined.
The components of income (loss) from continuing operations before income taxes were as follows (in thousands):
Year Ended December 31, | |||||||||||
2017 | 2016 | 2015 | |||||||||
Income (loss) from continuing operations before income taxes: | |||||||||||
Domestic | $ | 291,031 | $ | 349,959 | $ | 244,955 | |||||
Foreign | 62,726 | (42,273 | ) | (16,280 | ) | ||||||
Total | $ | 353,757 | $ | 307,686 | $ | 228,675 | |||||
The components of the provision for income taxes for continuing operations were as follows (in thousands):
Year Ended December 31, | |||||||||||
2017 | 2016 | 2015 | |||||||||
Current: | |||||||||||
Federal | $ | 44,695 | $ | 106,316 | $ | 85,830 | |||||
State | 301 | 11,549 | 9,783 | ||||||||
Foreign | 22,666 | 5,076 | 21,262 | ||||||||
Total current tax provision | 67,662 | 122,941 | 116,875 | ||||||||
Deferred: | |||||||||||
Federal | (36,915 | ) | (264 | ) | (5,247 | ) | |||||
State | 14,951 | (923 | ) | 917 | |||||||
Foreign | (10,166 | ) | (14,508 | ) | (15,073 | ) | |||||
Total deferred tax benefit | (32,130 | ) | (15,695 | ) | (19,403 | ) | |||||
Total provision for income taxes from continuing operations | $ | 35,532 | $ | 107,246 | $ | 97,472 | |||||
101
QUANTA SERVICES, INC. AND SUBSIDIARIES
NOTES TO CONSOLIDATED FINANCIAL STATEMENTS - (Continued)
The actual income tax provision differed from the income tax provision computed by applying the U.S. federal statutory corporate rate to income from continuing operations before provision for income taxes as follows (in thousands):
Year Ended December 31, | |||||||||||
2017 | 2016 | 2015 | |||||||||
Provision at the statutory rate | $ | 123,815 | $ | 107,690 | $ | 80,036 | |||||
Increases (decreases) resulting from — | |||||||||||
Tax Cuts and Jobs Act | (70,129 | ) | — | — | |||||||
State taxes | 17,920 | 6,479 | 7,241 | ||||||||
Foreign taxes | (16,958 | ) | 1,860 | 1,239 | |||||||
Contingency reserves, net | 3,651 | (13,540 | ) | 4,438 | |||||||
Production activity deduction | (1,504 | ) | (8,586 | ) | (6,871 | ) | |||||
Employee per diems, meals and entertainment | 13,605 | 8,764 | 8,727 | ||||||||
Taxes on unincorporated joint ventures | (1,354 | ) | (656 | ) | (3,838 | ) | |||||
Asset impairments | — | 1,909 | 7,047 | ||||||||
Entity restructuring and recapitalization efforts | (26,668 | ) | — | — | |||||||
Equity compensation | (5,095 | ) | — | — | |||||||
Other | (1,751 | ) | 3,326 | (547 | ) | ||||||
Total provision for income taxes from continuing operations | $ | 35,532 | $ | 107,246 | $ | 97,472 | |||||
Deferred income taxes result from temporary differences in the recognition of income and expenses for financial reporting purposes and tax purposes. The tax effects of these temporary differences, representing deferred tax assets and liabilities, result principally from the following (in thousands):
December 31, | |||||||
2017 | 2016 | ||||||
Deferred income tax liabilities: | |||||||
Property and equipment | $ | (161,491 | ) | $ | (214,902 | ) | |
Goodwill | (49,407 | ) | (83,097 | ) | |||
Other intangibles | (26,676 | ) | (33,566 | ) | |||
Customer holdbacks | (36,218 | ) | (16,424 | ) | |||
Other book/tax accounting method differences | (15,154 | ) | (24,817 | ) | |||
Total deferred income tax liabilities | (288,946 | ) | (372,806 | ) | |||
Deferred income tax assets: | |||||||
Accruals and reserves | 21,419 | 21,681 | |||||
Accrued insurance | — | 79,630 | |||||
Stock and incentive compensation and pension withdrawal liabilities | 17,676 | 58,744 | |||||
Net operating loss carryforwards | 62,925 | 37,362 | |||||
Tax credits | 48,516 | 1,613 | |||||
Other | 4,747 | 5,933 | |||||
Subtotal | 155,283 | 204,963 | |||||
Valuation allowance | (19,328 | ) | (14,991 | ) | |||
Total deferred income tax assets | 135,955 | 189,972 | |||||
Total net deferred income tax liabilities | $ | (152,991 | ) | $ | (182,834 | ) | |
102
QUANTA SERVICES, INC. AND SUBSIDIARIES
NOTES TO CONSOLIDATED FINANCIAL STATEMENTS - (Continued)
The net deferred income tax assets and liabilities were comprised of the following in the accompanying consolidated balance sheets (in thousands):
December 31, | |||||||
2017 | 2016 | ||||||
Deferred income taxes: | |||||||
Assets | $ | 26,390 | $ | 10,000 | |||
Liabilities | (179,381 | ) | (192,834 | ) | |||
Total net deferred income tax liabilities | $ | (152,991 | ) | $ | (182,834 | ) | |
The valuation allowance for deferred income tax assets at December 31, 2017, 2016 and 2015 was $19.3 million, $15.0 million and $16.1 million, respectively. These valuation allowances relate to state and foreign net operating loss carryforwards. The net change in the total valuation allowance for each of the years ended December 31, 2017, 2016 and 2015 was an increase of $4.3 million, a decrease of $1.1 million and an increase of $3.1 million, respectively. The valuation allowance was established primarily as a result of uncertainty in Quanta’s outlook as to future taxable income in particular tax jurisdictions. Quanta believes it is more likely than not that it will realize the benefit of its deferred tax assets net of existing valuation allowances.
At December 31, 2017, Quanta had state and foreign net operating loss carryforwards, the tax effect of which was $67.9 million. These carryforwards will expire as follows: 2018, $0.2 million; 2019, $0.1 million; 2020, $1.9 million; 2021, $0.1 million; 2022, $0.2 million and $65.4 million thereafter. A valuation allowance of $17.8 million has been recorded against certain foreign and state net operating loss carryforwards.
Quanta generally does not provide for taxes related to undistributed earnings of its foreign subsidiaries because such earnings either would not be taxable when remitted or they are considered to be indefinitely reinvested. Quanta could also be subject to additional foreign withholding taxes if it were to repatriate cash that is indefinitely reinvested outside the United States, but it does not expect such amount to be material.
A reconciliation of unrecognized tax benefit balances is as follows (in thousands):
December 31, | |||||||||||
2017 | 2016 | 2015 | |||||||||
Balance at beginning of year | $ | 35,240 | $ | 54,541 | $ | 50,668 | |||||
Additions based on tax positions related to the current year | 7,040 | 4,227 | 5,340 | ||||||||
Additions for tax positions of prior years | 3,372 | 2,048 | 292 | ||||||||
Reductions for tax positions of prior years | (1,171 | ) | (1,948 | ) | (132 | ) | |||||
Reductions for audit settlements | — | (180 | ) | (1,345 | ) | ||||||
Reductions resulting from a lapse of the applicable statute of limitations periods | (8,252 | ) | (23,448 | ) | (282 | ) | |||||
Balance at end of year | $ | 36,229 | $ | 35,240 | $ | 54,541 | |||||
For the year ended December 31, 2017, the $8.3 million reduction was primarily due to the expiration of certain federal and state statute of limitations periods for the 2013 tax year. For the year ended December 31, 2016, the $23.4 million reduction was primarily due to the expiration of certain federal and state statute of limitations periods for the 2010 through 2012 tax years. For the year ended December 31, 2015, the $0.3 million reduction was primarily due to the expiration of certain federal and state statute of limitations periods for the 2004 tax year.
103
QUANTA SERVICES, INC. AND SUBSIDIARIES
NOTES TO CONSOLIDATED FINANCIAL STATEMENTS - (Continued)
The balances of unrecognized tax benefits, the amount of related interest and penalties and what Quanta believes to be the range of reasonably possible changes in the next 12 months are as follows (in thousands):
December 31, | |||||||||||
2017 | 2016 | 2015 | |||||||||
Unrecognized tax benefits | $ | 36,229 | $ | 35,240 | $ | 54,541 | |||||
Portion that, if recognized, would reduce tax expense and effective tax rate | 35,561 | 33,128 | 48,312 | ||||||||
Accrued interest on unrecognized tax benefits | 5,368 | 5,539 | 8,750 | ||||||||
Accrued penalties on unrecognized tax benefits | 631 | 650 | 673 | ||||||||
Reasonably possible reduction to the balance of unrecognized tax benefits in succeeding 12 months | $0 to $13,655 | $0 to $12,332 | $0 to $27,485 | ||||||||
Portion that, if recognized, would reduce tax expense and effective tax rate | $0 to $12,483 | $0 to $10,983 | $0 to $24,009 | ||||||||
Quanta classifies interest and penalties within the provision for income taxes. Quanta recognized interest income of $0.2 million, interest income of $3.2 million and interest expense of $2.4 million in the provision for income taxes for the years ended December 31, 2017, 2016 and 2015, respectively.
Although the IRS completed its examination related to tax years 2010, 2011 and 2012 during 2016, certain subsidiaries remain under examination by various U.S. state, Canadian and other foreign tax authorities for multiple periods. Quanta’s Canadian subsidiaries remain open to examination by the Canada Revenue Agency for tax years 2010 through 2014 as these statute of limitations periods have not yet expired. Quanta does not consider any state in which it does business to be a major tax jurisdiction.
11. | EQUITY: |
Exchangeable Shares and Series F and Series G Preferred Stock
In connection with certain Canadian acquisitions, the former owners of the acquired companies received exchangeable shares of certain Canadian subsidiaries of Quanta, which may be exchanged at the option of the holders for Quanta common stock on a one-for-one basis. The holders of exchangeable shares can make an exchange only once in any calendar quarter and must exchange a minimum of either 50,000 shares or, if less, the total number of remaining exchangeable shares registered in the name of the holder making the request. Additionally, in connection with two of such acquisitions, Quanta issued one share of Quanta Series F preferred stock and one share of Quanta Series G preferred stock to voting trusts on behalf of the respective holders of the exchangeable shares issued in such acquisitions. The one share of Quanta Series F preferred stock was subsequently redeemed and retired effective October 6, 2017.
The share of Quanta Series G preferred stock provides the holder of such exchangeable shares voting rights in Quanta common stock equivalent to the number of exchangeable shares outstanding. The holder of exchangeable shares associated with the Quanta Series G preferred stock has rights equivalent to Quanta common stockholders with respect to voting, dividends and other economic rights. The holders of exchangeable shares not associated with the Quanta Series G preferred stock have rights equivalent to Quanta common stockholders with respect to dividends and other economic rights but do not have voting rights.
During 2017, 2016 and 2015, 6.0 million, 0.4 million and 0.4 million exchangeable shares were exchanged for Quanta common stock. As of December 31, 2017, the Quanta Series G preferred stock remained outstanding and 0.5 million exchangeable shares remained outstanding, of which 0.4 million were associated with the Quanta Series G preferred stock.
Treasury Stock
General
Treasury stock is recorded at cost. Under Delaware corporate law, treasury stock is not counted for quorum purposes or entitled to vote.
Shares withheld for tax withholding obligations
Under the stock incentive plans described in Note 12, the tax withholding obligations of employees upon vesting of restricted stock, RSUs and performance units settled in common stock are typically satisfied by Quanta making such tax payments and withholding the number of vested shares having a value on the date of vesting equal to the tax withholding obligation. For the settlement of these employee tax liabilities, Quanta withheld 0.5 million shares of Quanta common stock during the year ended December 31, 2017, with a total market value of $18.6 million, 0.4 million shares of Quanta common stock during the year ended
104
QUANTA SERVICES, INC. AND SUBSIDIARIES
NOTES TO CONSOLIDATED FINANCIAL STATEMENTS - (Continued)
December 31, 2016 with a total market value of $8.3 million, and 0.4 million shares of Quanta common stock during the year ended December 31, 2015 with a total market value of $10.4 million. These shares and the related costs to acquire them were accounted for as adjustments to the balance of treasury stock.
Notional amounts recorded related to deferred compensation plans
For RSUs and performance units that vest but the settlement of which is deferred under Quanta’s deferred compensation plans, Quanta records an amount to treasury stock and an offsetting amount to APIC. No shares are recorded as treasury stock at vesting as the shares of Quanta common stock associated with deferred equity awards are not issued. Upon settlement of the deferred equity awards and issuance of the associated Quanta common stock, the original accounting entry is reversed. The net amounts recorded to treasury stock related to the deferred compensation plans during the years ended December 31, 2017, 2016 and 2015 were $2.6 million, $6.8 million and $6.6 million, respectively. An aggregate $16.9 million was included in treasury stock for notional amounts related to deferred compensation plans at December 31, 2017.
Retirement of Treasury Stock
Effective December 1, 2016, Quanta retired 84.8 million shares of treasury stock. These retired shares were restored to the status of authorized and unissued shares as permitted by Delaware law. The retired stock had a carrying amount of $1.95 billion. In accordance with Quanta’s policy, Quanta recorded the formal retirement of treasury stock by deducting the par value from common stock and the excess of cost over par value from APIC.
Stock repurchases
During the second quarter of 2017, Quanta’s board of directors approved a stock repurchase program that authorizes Quanta to purchase, from time to time through June 30, 2020, up to $300.0 million of its outstanding common stock (the 2017 Repurchase Program). Repurchases under the 2017 Repurchase Program can be made in open market and privately negotiated transactions. As of December 31, 2017, Quanta had repurchased 1.4 million shares of its common stock at a cost of $50.0 million in the open market under the 2017 Repurchase Program.
During the third quarter of 2015, Quanta’s board of directors approved a stock repurchase program that authorized Quanta to purchase, from time to time through February 28, 2017, up to $1.25 billion of its outstanding common stock (the 2015 Repurchase Program). During 2015, Quanta repurchased 19.2 million shares of its common stock at a cost of $449.9 million in the open market under the 2015 Repurchase Program. During the third quarter of 2015, Quanta also entered into an accelerated share repurchase arrangement (the ASR) to repurchase $750.0 million of its common stock under the 2015 Repurchase Program. Pursuant to the terms of the ASR, based on the final volume-weighted average share price during the term of the ASR, minus a discount and subject to other adjustments, Quanta paid $750.0 million to JPMorgan Chase Bank, National Association, London Branch (JPMorgan) and received 25.7 million shares of its common stock in the third quarter of 2015 and 9.4 million shares of its common stock in the second quarter of 2016. As a result, Quanta repurchased a total of 54.3 million shares of its common stock at a cost of $1.20 billion under the 2015 Repurchase Program prior to its termination on February 28, 2017.
During the fourth quarter of 2013, Quanta’s board of directors approved a stock repurchase program authorizing Quanta to purchase, from time to time through December 31, 2016, up to $500 million of its outstanding common stock (the 2013 Repurchase Program). During the year ended December 31, 2015, Quanta repurchased 14.3 million shares of its common stock at a cost of $406.5 million in the open market and completed the 2013 Repurchase Program.
Non-controlling Interests
Quanta holds investments in several joint ventures that provide infrastructure services under specific customer contracts. Quanta has determined that certain of these joint ventures are VIEs, with Quanta providing the majority of the infrastructure services to the joint venture, which management believes most significantly influences the economic performance of the joint venture. Management has concluded that Quanta is the primary beneficiary of each of the joint ventures determined to be VIEs and has accounted for each on a consolidated basis. The other parties’ equity interests in these joint ventures have been accounted for as “Non-controlling interests” in Quanta’s consolidated balance sheets. Net income attributable to the other joint venture members in the amounts of $3.2 million, $1.7 million and $10.9 million for the years ended December 31, 2017, 2016 and 2015, respectively, has been accounted for as a reduction of net income in deriving “Net income attributable to common stock” in Quanta’s consolidated statements of operations.
The carrying amount of the investments held by Quanta in all of its VIEs was $7.8 million and $3.3 million at December 31, 2017 and 2016. The carrying amount of investments held by the non-controlling interests in these VIEs at December 31, 2017 and 2016 was $4.1 million and $3.3 million. During the years ended December 31, 2017, 2016 and 2015, net distributions to non-controlling interests were $2.0 million, $0.8 million and $18.9 million. There were also a discharge of a note receivable from a
105
QUANTA SERVICES, INC. AND SUBSIDIARIES
NOTES TO CONSOLIDATED FINANCIAL STATEMENTS - (Continued)
joint venture partner of $0.5 million, which was accounted for as a “Buyout of a non-controlling interest” in the accompanying consolidated statement of equity for the year ended December 31, 2017. There were no other changes in equity as a result of transfers to/from the non-controlling interests during the years ended December 31, 2017, 2016 and 2015. See Note 15 for further disclosures related to Quanta’s joint venture arrangements.
12. | EQUITY-BASED COMPENSATION: |
Stock Incentive Plans
On May 19, 2011, Quanta’s stockholders approved the 2011 Omnibus Equity Incentive Plan (the 2011 Plan). The 2011 Plan provides for the award of non-qualified stock options, incentive (qualified) stock options, stock appreciation rights, restricted stock, RSUs, stock bonus awards, performance compensation awards (including performance units and cash bonus awards) or any combination of the foregoing. The purpose of the 2011 Plan is to attract and retain key personnel and provide participants with additional performance incentives by increasing their proprietary interest in Quanta. Employees, directors, officers, consultants or advisors of Quanta or its affiliates are eligible to participate in the 2011 Plan, as are prospective employees, directors, officers, consultants or advisors of Quanta who have agreed to serve Quanta in those capacities. An aggregate of 11,750,000 shares of Quanta common stock may be issued pursuant to awards granted under the 2011 Plan.
Quanta also has a Restricted Stock Unit Plan (the RSU Plan), pursuant to which RSUs may be awarded to certain employees and consultants of Quanta’s Canadian operations. The 2011 Plan and the RSU Plan are referred to as the Plans.
The Plans are administered by the Compensation Committee of the Board of Directors of Quanta. The Compensation Committee has, subject to applicable regulation and the terms of the Plans, the authority to grant awards under the Plans, to construe and interpret the Plans and to make all other determinations and take any and all actions necessary or advisable for the administration of the Plans. The Board also delegated to the Equity Grant Committee, a committee of the Board consisting of one or more directors, the authority to grant limited awards to eligible persons who are not executive officers or non-employee directors.
Restricted Stock and RSUs to be Settled in Common Stock
During the years ended December 31, 2017, 2016 and 2015, Quanta granted 1.5 million, 1.8 million and 1.3 million shares of RSUs to be settled in common stock under the 2011 Plan with weighted average grant date fair values of $37.06, $22.22 and $27.64 per share, respectively. The grant date fair value for RSUs to be settled in common stock is based on the market value of Quanta common stock on the date of grant. RSU awards to be settled in common stock are subject to forfeiture, restrictions on transfer and certain other conditions until vesting, which generally occurs in equal installments over a two-year, three-year or five-year period following the date of grant. Holders of RSUs to be settled in common stock are entitled to receive a cash dividend equivalent payment equal to any cash dividend payable on account of common shares.
During the years ended December 31, 2017, 2016 and 2015, vesting activity consisted of 1.5 million, 1.4 million and 1.3 million shares of restricted stock and RSUs settled in common stock with an approximate fair value at the time of vesting of $55.6 million, $28.9 million and $35.9 million, respectively. As of December 31, 2017, there was no restricted stock outstanding.
A summary of the activity for RSUs to be settled in common stock for the year ended December 31, 2017 is as follows (shares in thousands):
Shares | Weighted Average Grant Date Fair Value (Per share) | |||
Unvested at December 31, 2016 | 2,711 | $25.45 | ||
Granted | 1,459 | $37.06 | ||
Vested | (1,489 | ) | $28.03 | |
Forfeited | (81 | ) | $27.58 | |
Unvested at December 31, 2017 | 2,600 | $30.42 | ||
During the years ended December 31, 2017, 2016 and 2015, Quanta recognized $41.0 million, $39.6 million and $33.3 million of non-cash stock compensation expense related to restricted stock and RSUs to be settled in common stock. As of December 31, 2017, there was $38.2 million of total unrecognized compensation cost related to unvested RSUs to be settled in common stock granted to both employees and non-employees. This cost is expected to be recognized over a weighted average period of 1.61 years.
106
QUANTA SERVICES, INC. AND SUBSIDIARIES
NOTES TO CONSOLIDATED FINANCIAL STATEMENTS - (Continued)
Performance Units to be Settled in Common Stock
Performance units awarded pursuant to the 2011 Plan provide for the issuance of shares of common stock upon vesting. These performance units cliff-vest at the end of a three-year performance period based on achievement of certain performance metrics established by Quanta’s compensation committee, including company performance goals and, with respect to certain awards, Quanta’s total shareholder return as compared to a predetermined group of peer companies. The final number of earned and vested performance units can range from 0% to 200% of the initial award based on the level of achievement, as determined by Quanta’s compensation committee.
During the years ended December 31, 2017, 2016 and 2015, Quanta granted 0.3 million, 0.3 million and 0.2 million of performance units to be settled in common stock under the 2011 Plan with a weighted average grant date fair value of $17.63, $22.86 and $28.16 per unit. The grant date fair value for awards of performance units without market-based metrics was based on the market value of Quanta common stock on the date of grant applied to the total number of performance units that Quanta anticipates will vest. The grant date fair value for awards of performance units with market-based metrics, which were granted in the year ended December 31, 2017, was based on a fair value as determined using a Monte Carlo simulation valuation methodology using the following key inputs:
Valuation date stock price based on the March 22, 2017 closing stock price | $36.31 | |
Expected volatility | 36.00 | % |
Risk-free interest rate | 1.46 | % |
Term in years | 2.78 | |
This fair value is expensed ratably over the three-year performance period and is adjusted for changes in the expected probability of achievement of the underlying goals and the resulting number of performance units anticipated to vest, so that the expense recognized is equivalent to the proportion of the three-year period that has expired, multiplied by the fair value of the number of performance units anticipated to vest. During the years ended December 31, 2017, 2016 and 2015, Quanta recognized $5.4 million, $3.2 million and $3.6 million in compensation expense associated with performance units. During the year ended December 31, 2017, 0.1 million performance units vested, and 0.1 million shares of common stock were issued in connection with performance units. During the years ended December 31, 2016 and 2015, no performance units vested, and no shares of common stock were issued in connection with performance units.
RSUs to be Settled in Cash
Certain RSUs granted by Quanta under the Plans are settled solely in cash. These cash-settled RSUs are intended to provide plan participants with cash performance incentives that are substantially equivalent to the risks and rewards of equity ownership in Quanta, typically vest in equal installments over a two-year or three-year period following the date of grant, and are subject to forfeiture under certain conditions, primarily termination of service. Additionally, subject to certain restrictions, Quanta’s non-employee directors may elect to cash settle a portion of their RSU awards, which generally vest upon conclusion of the director service year. For RSUs settled in cash, the holders receive for each vested RSU an amount in cash equal to the fair market value of one share of Quanta common stock on the settlement date, as specified in the applicable award agreement.
Compensation expense related to RSUs to be settled in cash was $8.1 million, $7.0 million and $4.0 million for the years ended December 31, 2017, 2016 and 2015. Such expense is recorded in selling, general and administrative expenses. RSUs that are anticipated to be settled in cash are not included in the calculation of earnings per share, and the estimated earned value of such RSUs is classified as a liability. Quanta paid $8.6 million, $4.6 million and $4.2 million to settle liabilities related to cash-settled RSUs in the years ended December 31, 2017, 2016 and 2015, respectively. Accrued liabilities for the estimated earned value of outstanding RSUs to be settled in cash were $4.6 million and $5.1 million at December 31, 2017 and 2016.
13. | EMPLOYEE BENEFIT PLANS: |
Unions’ Multiemployer Pension Plans
Quanta contributes to a number of multiemployer defined benefit pension plans under the terms of collective bargaining agreements with various unions that represent certain of Quanta’s employees. Quanta’s multiemployer pension plan contribution rates generally are specified in the collective bargaining agreements (usually on an annual basis), and contributions are made to the plans on a “pay-as-you-go” basis based on its union employee payrolls. Quanta may also have additional liabilities imposed by law as a result of its participation in multiemployer defined benefit pension plans. The Employee Retirement Income Security Act of 1974, as amended by the Multiemployer Pension Plan Amendments Act of 1980, imposes certain liabilities upon an employer who is a contributor to a multiemployer pension plan if the employer withdraws from the plan or the plan is terminated or experiences a mass withdrawal. In the fourth quarter of 2011, Quanta recorded a partial withdrawal liability related to the withdrawal by certain
107
QUANTA SERVICES, INC. AND SUBSIDIARIES
NOTES TO CONSOLIDATED FINANCIAL STATEMENTS - (Continued)
Quanta subsidiaries from the Central States, Southeast and Southwest Areas Pension Plan (Central States Plan) following an amendment to the applicable collective bargaining agreement which eliminated their obligations to contribute to the Central States Plan. During the first quarter of 2014, Quanta recorded an adjustment to cost of services to increase the recognized withdrawal liability. Additional information regarding this withdrawal, as well as the withdrawal from the Central States Plan of a company acquired by Quanta in the fourth quarter of 2013, is provided in Collective Bargaining Agreements in Note 15.
The Pension Protection Act of 2006 (PPA) also added special funding and operational rules generally applicable to plan years beginning after 2007 for multiemployer plans in the United States that are classified as “endangered,” “seriously endangered” or “critical” status based on multiple factors (including, for example, the plan’s funded percentage, cash flow position and whether it is projected to experience a minimum funding deficiency). Plans in these classifications must adopt measures to improve their funded status through a funding improvement or rehabilitation plan, as applicable, which may require additional contributions from employers (which may take the form of a surcharge on benefit contributions) and/or modifications to retiree benefits. Certain plans to which Quanta contributes or may contribute in the future are in “endangered,” “seriously endangered” or “critical” status. The amount of additional funds, if any, that Quanta may be obligated to contribute to these plans in the future cannot be estimated due to uncertainty of the future levels of work that require the specific use of union employees covered by these plans, as well as the future contribution levels and possible surcharges on contributions applicable to these plans.
The following table summarizes plan information relating to Quanta’s participation in multiemployer defined benefit pension plans, including company contributions for the last three years, the status under the PPA of the plans and whether the plans are subject to a funding improvement or rehabilitation plan or contribution surcharges. The most recent PPA zone status available in 2017 and 2016 relates to the plan’s fiscal year-end in 2016 and 2015. Forms 5500 were not yet available for the plan years ending in 2017. The PPA zone status is based on information that Quanta received from the respective plans, as well as publicly available information on the U.S. Department of Labor website, and is certified by the plan’s actuary. Although multiple factors or tests may result in red zone or yellow zone status, plans in the red zone generally are less than 65 percent funded, plans in the yellow zone generally are less than 80 percent funded, and plans in the green zone generally are at least 80 percent funded. Under the PPA, red zone plans are classified as “critical” status, yellow zone plans are classified as “endangered” status and green zone plans are classified as neither “endangered” nor “critical” status. The “Subject to Financial Improvement/ Rehabilitation Plan” column indicates plans for which a financial improvement plan or a rehabilitation plan is either pending or has been implemented. The last column lists the expiration dates of Quanta’s collective-bargaining agreements to which the plans are subject. Total contributions to these plans correspond to the number of union employees employed at any given time and the plans in which they participate and vary depending upon the location and number of ongoing projects at a given time and the need for union resources in connection with such projects. Information has been presented separately for individually significant plans, based on PPA funding status classification, and in the aggregate for all other plans.
108
QUANTA SERVICES, INC. AND SUBSIDIARIES
NOTES TO CONSOLIDATED FINANCIAL STATEMENTS - (Continued)
Employee Identification Number/ Pension Plan Number | PPA Zone Status | Subject to Financial Improve- ment/ Reha- bilitation Plan | Contributions (in thousands) | Sur-charge Imposed | Expiration Date of Collective Bargaining Agreement | |||||||||||||||||||
Fund | 2017 | 2016 | 2017 | 2016 | 2015 | |||||||||||||||||||
National Electrical Benefit Fund | 53-0181657-001 | Green | Green | No | $ | 29,161 | $ | 22,912 | $ | 21,200 | No | Varies through May 2022 | ||||||||||||
Pipeline Industry Pension Fund | 73-6146433-001 | Green | Green | No | 13,585 | 6,954 | 6,087 | No | Varies through May 2020 | |||||||||||||||
Central Pension Fund of the IUOE & Participating Employers | 36-6052390-001 | Green | Green | No | 12,176 | 5,668 | 5,677 | No | Varies through December 2020 | |||||||||||||||
Teamsters National Pipe Line Pension Plan | 46-1102851-001 | Green | Green | No | 3,602 | 1,661 | 1,343 | No | Varies through December 2020 | |||||||||||||||
Laborers Pension Trust Fund for Northern California | 94-6277608-001 | Yellow | Yellow | Yes | 3,387 | 3,805 | 2,603 | Yes | Varies through May 2020 | |||||||||||||||
Eighth District Electrical Pension Fund | 84-6100393-001 | Green | Green | No | 3,208 | 3,089 | 2,544 | No | Varies through December 2020 | |||||||||||||||
Laborers National Pension Fund | 75-1280827-001 | Green | Green | No | 3,049 | 1,358 | 7,671 | No | Varies through December 2020 | |||||||||||||||
Alaska Electrical Pension Plan | 92-6005171-001 | Green | Green | No | 2,143 | 2,701 | 639 | No | Varies through December 2019 | |||||||||||||||
Operating Engineers Local 324 Pension Fund | 38-1900637-001 | Red | Red | Yes | 1,969 | 1,291 | 1,231 | Yes | Varies through December 2020 | |||||||||||||||
OE Pension Trust Fund | 94-6090764-001 | Red | Red | Yes | 1,703 | 1,508 | 1,264 | Yes | Varies through June 2020 | |||||||||||||||
Plumbers and Pipefitters National Pension Fund | 52-6152779-001 | Yellow | Yellow | Yes | 1,273 | 1,666 | 850 | No | Varies through March 2021 | |||||||||||||||
Alaska Laborers - Employers Retirement Fund | 91-6028298-001 | Yellow | Yellow | Yes | 536 | 1,216 | 181 | No | December 2018 | |||||||||||||||
Laborers District Council of W PA Pension Fund | 25-6135576-001 | Red | Red | Yes | 418 | 876 | 21 | Yes | May 2018 | |||||||||||||||
Alaska Teamster Employer Pension Plan | 92-6003463-024 | Red | Red | Yes | 255 | 659 | 513 | Yes | December 2018 | |||||||||||||||
Midwest Operating Engineers Pension Trust Fund | 36-6140097-001 | Yellow | Yellow | Yes | 106 | 793 | 3,294 | Yes | June 2019 | |||||||||||||||
All other plans - U.S. | 24,234 | 28,516 | 20,594 | |||||||||||||||||||||
All other plans - Canada (1) | 9,277 | 562 | 1,303 | |||||||||||||||||||||
Total | $ | 110,082 | $ | 85,235 | $ | 77,015 | ||||||||||||||||||
(1) | Multiemployer defined benefit pension plans in Canada are not subject to the reporting requirements under the PPA. Accordingly, certain information was not publicly available. |
109
QUANTA SERVICES, INC. AND SUBSIDIARIES
NOTES TO CONSOLIDATED FINANCIAL STATEMENTS - (Continued)
Quanta’s contributions to the following individually significant plans were five percent or more of the total contributions to these plans for the periods indicated based on the Forms 5500 for these plans for the years ended December 31, 2016 and 2015. Forms 5500 were not yet available for these plans for the year ended December 31, 2017.
Pension Fund | Plan Years in which Quanta Contributions Were Five Percent or More of Total Plan Contributions | |
Pipeline Industry Pension Fund | 2016 and 2015 | |
Eighth District Electrical Pension Fund | 2016 and 2015 | |
Local 697 IBEW and Electrical Industry Pension Fund | 2016 and 2015 | |
Local Union No. 9 IBEW and Outside Contractors Pension Fund | 2016 and 2015 | |
Alaska Plumbing and Pipefitting Industry Pension Fund | 2016 and 2015 | |
Teamsters National Pipe Line Pension Plan | 2016 and 2015 | |
Alaska Electrical Pension Plan | 2016 | |
IBEW Local 456 Pension Plan | 2016 | |
Michigan Electrical Employees’ Pension Plan | 2016 | |
Laborers National Pension Fund | 2015 | |
Michigan Upper Peninsula Intrl Brotherhood of Elec Workers Pension Plan | 2015 | |
In addition to the contributions made to multiemployer defined benefit pension plans noted above, Quanta also contributed to multiemployer defined contribution or other benefit plans on behalf of certain union employees. Contributions to union multiemployer defined contribution or other benefit plans by Quanta were $171.4 million, $139.3 million and $147.1 million for the years ended December 31, 2017, 2016 and 2015. Total contributions made to all of these multiemployer plans for the years ended December 31, 2017, 2016 and 2015 correspond to the number of union employees employed at any given time and the plans in which they participate and vary depending upon the location and number of ongoing projects at a given time and the need for union resources in connection with such projects.
Quanta 401(k) Plan
Quanta maintains a 401(k) plan pursuant to which employees who are not provided retirement benefits through a collective bargaining agreement may make contributions through a payroll deduction. Quanta makes matching cash contributions of 100% of each employee’s contribution up to 3% of that employee’s salary and 50% of each employee’s contribution between 3% and 6% of such employee’s salary, up to the maximum amount permitted by law. Contributions to the 401(k) plan by Quanta were $26.3 million, $21.9 million and $17.7 million for the years ended December 31, 2017, 2016 and 2015, respectively.
Deferred Compensation Plans
Quanta maintains nonqualified deferred compensation plans pursuant to which non-employee directors and certain key employees, independent contractors and consultants may defer receipt of some or all of their cash compensation and/or settlement of their equity-based awards, subject to certain limitations. The plan covering key employees provides for employer matching contributions for certain officers and employees whose benefits under the 401(k) plan are limited by federal tax law. Quanta may also make discretionary employer contributions to that plan. Matching contributions and discretionary employer contributions are subject to a vesting schedule, provided that vesting accelerates upon a change in control and the participant’s death or retirement. All matching and discretionary employer contributions, whether vested or not, are forfeited upon a participant’s termination of employment for cause or upon the participant engaging in competition with Quanta or any of its affiliates.
Quanta made contributions to the deferred compensation plans of $1.1 million, $1.0 million and $1.0 million during the years ended December 31, 2017, 2016 and 2015, respectively. At December 31, 2017 and 2016, obligations under these plans were$30.1 million and $19.1 million and were included in “Insurance and other non-current liabilities” in the accompanying consolidated balance sheets, and investments in company-owned life insurance policies of $28.7 million and $17.9 million were included in “Other assets, net” in the accompanying consolidated balance sheets. Individuals participating in these plans receive distributions of their respective balances based on predetermined payout schedules or other events and are also able to direct investments made on their behalf among investment alternatives permitted from time to time under the plan.
110
QUANTA SERVICES, INC. AND SUBSIDIARIES
NOTES TO CONSOLIDATED FINANCIAL STATEMENTS - (Continued)
14. | RELATED PARTY TRANSACTIONS: |
Certain of Quanta’s operating units have entered into related party lease arrangements for operational facilities, typically with prior owners of certain acquired businesses. These lease agreements generally have terms of up to approximately 5 years and include renewal options. Related party lease expense for the years ended December 31, 2017, 2016 and 2015 was $12.3 million, $8.7 million and $10.6 million, respectively.
15. | COMMITMENTS AND CONTINGENCIES: |
Investments in Affiliates and Other Entities
As described in Note 11, Quanta holds investments in certain joint ventures with third parties for the purpose of providing infrastructure services under certain customer contracts. Losses incurred by these joint ventures are generally shared ratably based on the percentage ownership of the joint venture members. However, each member of the joint venture typically is jointly and severally liable for all of the obligations of the joint venture under the contract with the customer, and therefore can be liable for full performance of the contract with the customer. In circumstances where Quanta’s participation in a joint venture qualifies as a general partnership, the joint venture partners are jointly and severally liable for all of the obligations of the joint venture, including obligations owed to the customer or any other person or entity. Quanta is not aware of circumstances that would lead to future claims against it for material amounts in connection with these joint and several liabilities.
In the joint venture arrangements entered into by Quanta, typically each joint venture party indemnifies the other party for any liabilities incurred in excess of the liabilities such other party is obligated to bear under the respective joint venture agreement. It is possible, however, that Quanta could be required to pay or perform obligations in excess of its share if the other party to the joint venture failed or refused to pay or perform its share of the obligations. Quanta is not aware of circumstances that would lead to future claims against it for material amounts that would not be indemnified.
During 2014, a limited partnership in which Quanta is a partner was selected for an engineering, procurement and construction (EPC) electric transmission project to construct approximately 500 kilometers of transmission line and two 500 kV substations. Quanta will provide turnkey EPC services for the entire project. As of December 31, 2017, Quanta made aggregate contributions to this unconsolidated affiliate of $66.7 million, received $64.4 million as a return of capital and had outstanding additional capital commitments associated with this project of $25.2 million, which are anticipated to be paid in 2019.
Additionally, as of December 31, 2017, Quanta had outstanding capital commitments associated with investments in unconsolidated affiliates related to planned oil and gas infrastructure projects of $16.9 million, of which $14.8 million is expected to be paid in 2018. The remaining $2.1 million of these capital commitments is anticipated to be paid by May 31, 2022. As described in Note 2, Quanta formed a partnership with select infrastructure investors that provides up to $1.0 billion of capital, including approximately $80.0 million from Quanta, available to invest in certain specified infrastructure projects through August 2024.
Leases
Quanta leases certain land, buildings and equipment under non-cancelable lease agreements, including related party leases as discussed in Note 14. The terms of these agreements vary from lease to lease, including some with renewal options and escalation clauses. The following schedule shows the future minimum lease payments under these leases as of December 31, 2017 (in thousands):
Operating Leases | |||
Year Ending December 31: | |||
2018 | $ | 115,985 | |
2019 | 75,556 | ||
2020 | 49,287 | ||
2021 | 28,422 | ||
2022 | 15,883 | ||
Thereafter | 30,871 | ||
Total minimum lease payments | $ | 316,004 | |
Rent expense related to operating leases was $276.2 million, $242.3 million and $208.5 million for the years ended December 31, 2017, 2016 and 2015, respectively.
Quanta has guaranteed the residual value on certain of its equipment operating leases. Quanta has agreed to pay any difference between this residual value and the fair market value of the underlying asset at the date of termination of the leases. At December 31,
111
QUANTA SERVICES, INC. AND SUBSIDIARIES
NOTES TO CONSOLIDATED FINANCIAL STATEMENTS - (Continued)
2017, the maximum guaranteed residual value was $626.8 million. Quanta believes that no significant payments will be made as a result of the difference between the fair market value of the leased equipment and the guaranteed residual value. However, there can be no assurance that significant payments will not be required in the future.
Contingent Consideration Liabilities
As discussed in further detail in Note 2, Quanta is obligated to pay contingent consideration amounts to the former owners of certain acquired businesses in the event that such acquired businesses achieve specified financial performance metrics. As of December 31, 2017 and 2016, the estimated fair value of Quanta’s contingent consideration liabilities totaled $65.7 million and $19.5 million.
Committed Expenditures
Quanta has capital commitments for the expansion of its vehicle fleet in order to accommodate manufacturer lead times on certain types of vehicles. As of December 31, 2017, Quanta issued $14.6 million of production orders with expected delivery dates in 2018. Although Quanta has committed to purchase these vehicles at the time of their delivery, Quanta anticipates that these orders will be assigned to third party leasing companies and made available to Quanta under certain of its master equipment lease agreements, thereby releasing Quanta from its capital commitments.
Legal Proceedings
Quanta is from time to time party to various lawsuits, claims and other legal proceedings that arise in the ordinary course of business. These actions typically seek, among other things, compensation for alleged personal injury, breach of contract and/or property damages, employment-related damages, punitive damages, civil penalties or other losses, or injunctive or declaratory relief. With respect to all such lawsuits, claims and proceedings, Quanta records a reserve when it is probable that a liability has been incurred and the amount of loss can be reasonably estimated. In addition, Quanta discloses matters for which management believes a material loss is at least reasonably possible. Except as otherwise stated below, none of these proceedings, separately or in the aggregate, are expected to have a material adverse effect on Quanta’s consolidated financial position, results of operations or cash flows. In all instances, management has assessed the matter based on current information and made a judgment concerning its potential outcome, giving due consideration to the nature of the claim, the amount and nature of damages sought and the probability of success. Management’s judgment may prove materially inaccurate, and such judgment is made subject to the known uncertainties of litigation.
Maurepas Project Dispute. During the third quarter of 2017, Maurepas Pipeline, LLC (Maurepas) notified QPS Engineering, LLC (QPS), a subsidiary of Quanta, of Maurepas’ assertion of a claim for liquidated damages allegedly arising from delay in mechanical completion of a project in Louisiana. Quanta disputes the claim and believes that QPS is not responsible for liquidated damages under the contract terms. The matter remains subject to contractual dispute resolution measures; however, either party may choose to institute a formal legal proceeding upon completion of such measures. If, upon final resolution of this matter, Quanta is unsuccessful, any such liquidated damages would be recorded by QPS as additional costs on the project, and Quanta believes the range of reasonably possible loss could be up to $22.0 million, which is the maximum liability for liquidated damages pursuant to the contract terms.
Lorenzo Benton v. Telecom Network Specialists, Inc., et al. In June 2006, plaintiff Lorenzo Benton filed a class action complaint in the Superior Court of California, County of Los Angeles, alleging various wage and hour violations against Telecom Network Specialists (TNS), a former subsidiary of Quanta. Quanta retained liability associated with this matter pursuant to the terms of Quanta’s sale of TNS in December 2012. Benton represents a class of workers that includes all persons who worked on certain TNS projects, including individuals that TNS retained through numerous staffing agencies. The plaintiff class in this matter is seeking damages for unpaid wages, penalties associated with the failure to provide meal and rest periods and overtime wages, interest and attorneys’ fees. In January 2017, the trial court granted a summary judgment motion filed by the plaintiff class and found that TNS was a joint employer of the class members and that it failed to provide adequate meal and rest breaks and failed to pay overtime wages. In February 2018, a hearing was held on a final motion for summary judgment on damages filed by the plaintiff class seeking approximately $11.1 million for its claims; however, a final determination regarding the amount of damages was not made. Quanta believes the court’s decision on liability is not supported by controlling law and continues to contest its liability and the damage calculation asserted by the plaintiff class in this matter.
Additionally, in November 2007, TNS filed cross complaints for indemnity and breach of contract against the staffing agencies, which employed many of the individuals in question. In December 2012, the trial court heard cross-motions for summary judgment filed by TNS and the staffing agencies pertaining to TNS’s demand for indemnity. The court denied TNS’s motion and
112
QUANTA SERVICES, INC. AND SUBSIDIARIES
NOTES TO CONSOLIDATED FINANCIAL STATEMENTS - (Continued)
granted the motions filed by the staffing agencies; however, the California Appellate Court reversed the trial court’s decision in part and instructed the trial court to reconsider its ruling. In February 2017, the court denied a new motion for summary judgment filed by the staffing companies and has since stated that the staffing companies would be liable to TNS for any damages owed to the class members that the staffing companies employed.
The final amount of liability, if any, payable in connection with this matter remains the subject of pending litigation and will ultimately depend on various factors, including the outcome of Quanta’s appeal of the trial court’s ruling on liability, the final determination with respect to any damages owed by Quanta, and the solvency of the staffing agencies. Based on review and analysis of the trial court’s rulings on liability, Quanta does not believe, at this time, that it is probable this matter will result in a material loss. However, if Quanta is unsuccessful in this litigation and the staffing agencies are unable to fund damages owed to class members, Quanta believes the range of reasonably possible loss to Quanta upon final resolution of this matter could be up to approximately $11.1 million, plus attorneys’ fees and expenses of the plaintiff class.
For additional information regarding other legal proceedings, see Collective Bargaining Agreements in this Note 15.
Concentrations of Credit Risk
Quanta is subject to concentrations of credit risk related primarily to its cash and cash equivalents and its net receivable position with customers, which includes amounts related to billed and unbilled accounts receivable and costs and estimated earnings in excess of billings on uncompleted contracts net of advanced billings with the same customer. Substantially all of Quanta’s cash and cash equivalents are managed by what it believes to be high credit quality financial institutions. In accordance with Quanta’s investment policies, these institutions are authorized to invest cash and cash equivalents in a diversified portfolio of what Quanta believes to be high quality cash and cash equivalent investments, which consist primarily of interest-bearing demand deposits, money market investments, money market mutual funds and investment grade commercial paper with original maturities of three months or less. Although Quanta does not currently believe the principal amount of these cash and cash equivalents is subject to any material risk of loss, changes in economic conditions could impact the interest income Quanta receives from these investments. In addition, Quanta grants credit under normal payment terms, generally without collateral, to its customers, which include electric power and oil and gas companies, governmental entities, general contractors, and builders, owners and managers of commercial and industrial properties located primarily in the United States, Canada, Australia and Latin America. Consequently, Quanta is subject to potential credit risk related to changes in business and economic factors throughout these locations, which may be heightened as a result of uncertain economic and financial market conditions that have existed in recent years. However, Quanta generally has certain statutory lien rights with respect to services provided. Historically, some of Quanta’s customers have experienced significant financial difficulties, and others may experience financial difficulties in the future. These difficulties expose Quanta to increased risk related to collectability of billed and unbilled receivables and costs and estimated earnings in excess of billings on uncompleted contracts for services Quanta has performed.
At December 31, 2016, one customer within Quanta’s Electric Power Infrastructure Services segment accounted for 16% of Quanta’s consolidated net receivable position. Portions of this net receivable balance were related to invoicing challenges and billing delays on two electric transmission projects located in remote regions of northeastern Canada, which resulted from changed site conditions requiring extensive quality assurance documentation and administrative requirements. During the second quarter of 2017, Quanta and the customer reached a settlement and entered into a renegotiated contract, which eliminated the previous scheduling and billing issues and settled outstanding change orders. No other customers represented 10% or more of Quanta’s consolidated net receivable position as of December 31, 2017 or 2016, and no customers represented 10% or more of Quanta’s consolidated revenues for the years ended December 31, 2017, 2016 or 2015.
Insurance
As discussed in Note 2, Quanta is insured for employer’s liability, workers’ compensation, auto liability, general liability and group health claims. As of December 31, 2017 and 2016, the gross amount accrued for insurance claims totaled $254.7 million and $218.2 million, with $200.0 million and $162.0 million considered to be long term and included in “Insurance and other non-current liabilities.” Related insurance recoveries/receivables as of December 31, 2017 and 2016 were $50.4 million and $8.7 million, of which $0.4 million and $0.4 million were included in “Prepaid expenses and other current assets” and $50.0 million and $8.3 million were included in “Other assets, net.”
Letters of Credit
Certain of Quanta’s vendors require letters of credit to ensure reimbursement for amounts they are disbursing on Quanta’s behalf, such as to beneficiaries under its insurance programs. In addition, from time to time, certain customers require Quanta to post letters of credit to ensure payment of subcontractors and vendors and guarantee performance under contracts. Such letters of
113
QUANTA SERVICES, INC. AND SUBSIDIARIES
NOTES TO CONSOLIDATED FINANCIAL STATEMENTS - (Continued)
credit are generally issued by a bank or similar financial institution, typically pursuant to Quanta’s senior secured revolving credit facility. Each letter of credit commits the issuer to pay specified amounts to the holder of the letter of credit if the holder demonstrates that Quanta has failed to perform specified actions. If this were to occur, Quanta would be required to reimburse the issuer of the letter of credit. Depending on the circumstances of such a reimbursement, Quanta may also be required to record a charge to earnings for the reimbursement. Quanta does not believe that it is likely that any material claims will be made under a letter of credit in the foreseeable future.
As of December 31, 2017, Quanta had $413.3 million in outstanding letters of credit and bank guarantees under its senior secured revolving credit facility securing its casualty insurance program and various contractual commitments. These are irrevocable stand-by letters of credit with maturities generally expiring at various times throughout 2018. Upon maturity, it is expected that the majority of the letters of credit related to the casualty insurance program will be renewed for subsequent one-year periods.
Performance Bonds and Parent Guarantees
In certain circumstances, Quanta is required to provide performance bonds in connection with its contractual commitments. Quanta has indemnified its sureties for any expenses paid out under these performance bonds. These performance bonds expire at various times ranging from mechanical completion of the related projects to a period extending beyond contract completion in certain circumstances, and as such a determination of maximum potential amounts outstanding requires the use of certain estimates and assumptions. Such amounts can also fluctuate from period to period based upon the mix and level of Quanta’s bonded operating activity. As of December 31, 2017, the total amount of the outstanding performance bonds was estimated to be approximately $3.0 billion. Quanta’s estimated maximum exposure as it relates to the value of the performance bonds outstanding is lowered on each bonded project as the cost to complete is reduced, and each of its commitments under the performance bonds generally extinguishes concurrently with the expiration of its related contractual obligation. The estimated cost to complete these bonded projects was approximately $869 million as of December 31, 2017.
Additionally, from time to time, Quanta guarantees the obligations of its wholly owned subsidiaries, including obligations in connection with certain contracts with customers, lease obligations, joint venture arrangements and, in some states, contractors’ licenses. Quanta is not aware of any material obligations for performance or payment asserted against it under any of these guarantees.
Employment Agreements
Quanta has various employment agreements with certain executives and other employees, which provide for compensation and certain other benefits and for severance payments under certain circumstances. Certain employment agreements also contain clauses that become effective upon a change in control of Quanta, and Quanta may be obligated to pay certain amounts to such employees upon the occurrence of any of the defined change in control events.
Collective Bargaining Agreements
Some of Quanta’s operating units are parties to various collective bargaining agreements with unions that represent certain of their employees. The collective bargaining agreements expire at various times and have typically been renegotiated and renewed on terms similar to those in the expiring agreements. From time to time, Quanta is a party to grievance actions based on claims arising out of the collective bargaining agreements. The agreements require the operating units to pay specified wages, provide certain benefits to their union employees and contribute certain amounts to multiemployer pension plans and employee benefit trusts. Quanta’s multiemployer pension plan contribution rates generally are specified in the collective bargaining agreements (usually on an annual basis), and contributions are made to the plans on a “pay-as-you-go” basis based on its union employee payrolls. The location and number of union employees that Quanta employs at any given time and the plans in which they may participate vary depending on the projects Quanta has ongoing at any time and the need for union resources in connection with those projects. Therefore, Quanta is unable to accurately predict its union employee payroll and the amount of the resulting multiemployer pension plan contribution obligation for future periods.
The PPA also added special funding and operational rules generally applicable to plan years beginning after 2007 for multiemployer plans that are classified as “endangered,” “seriously endangered” or “critical” status based on multiple factors (including, for example, the plan’s funded percentage, cash flow position and whether it is projected to experience a minimum funding deficiency). Plans in these classifications must adopt measures to improve their funded status through a funding improvement or rehabilitation plan, as applicable, which may require additional contributions from employers (which may take the form of a surcharge on benefit contributions) and/or modifications to retiree benefits. Certain plans to which Quanta contributes or may contribute in the future are in “endangered,” “seriously endangered” or “critical” status. The amount of additional funds, if any, that Quanta may be obligated to contribute to these plans in the future cannot be estimated due to uncertainty of the future
114
QUANTA SERVICES, INC. AND SUBSIDIARIES
NOTES TO CONSOLIDATED FINANCIAL STATEMENTS - (Continued)
levels of work that require the specific use of union employees covered by these plans, as well as the future contribution levels and possible surcharges on contributions applicable to these plans.
Quanta may be subject to additional liabilities imposed by law as a result of its participation in multiemployer defined benefit pension plans. For example, the Employee Retirement Income Security Act of 1974, as amended by the Multiemployer Pension Plan Amendments Act of 1980, imposes certain liabilities upon an employer who is a contributor to a multiemployer pension plan if the employer withdraws from the plan or the plan is terminated or experiences a mass withdrawal. These liabilities include an allocable share of the unfunded vested benefits in the plan for all plan participants, not merely the benefits payable to a contributing employer’s own retirees. As a result, participating employers may bear a higher proportion of liability for unfunded vested benefits if other participating employers cease to contribute or withdraw, with the reallocation of liability being more acute in cases when a withdrawn employer is insolvent or otherwise fails to pay its withdrawal liability. Other than as described below, Quanta is not aware of any material amounts of withdrawal liability that have been incurred as a result of a withdrawal by any of Quanta’s operating units from any multiemployer defined benefit pension plans.
2011 Central States Plan Withdrawal Liability. In the fourth quarter of 2011, certain Quanta subsidiaries withdrew from the Central States Plan. This withdrawal event was the result of an amendment to a collective bargaining agreement with the International Brotherhood of Teamsters (Teamsters) that eliminated certain employers’ obligations to contribute to the Central States Plan, which was then in critical status and significantly underfunded as to its vested benefit obligations. The amendment was negotiated by the Pipe Line Contractors Association (PLCA) on behalf of its members, which include certain Quanta subsidiaries. Because certain other Quanta subsidiaries continued participation in the Central States Plan into 2012, the Quanta subsidiaries’ withdrawals in 2011 effected only a partial withdrawal on behalf of Quanta for 2011. Quanta believed that the partial withdrawal was advantageous because it limited exposure to increased liability resulting from a future withdrawal event, at which point the Central States Plan could have been further underfunded. Quanta and other PLCA members now contribute to a different multiemployer pension plan on behalf of the affected Teamsters employees.
The Central States Plan subsequently asserted that the withdrawal of the PLCA members, and thus Quanta’s partial withdrawal, was not effective in 2011. The PLCA and Quanta believed at that time that a legally effective withdrawal had occurred during the fourth quarter of 2011, and this issue was litigated in the federal district court for the Northern District of Illinois, Eastern Division. In September 2013, the district court ruled in favor of the Central States Plan, and that decision was appealed by the PLCA. In July 2014, the Central States Plan provided Quanta with a Notice and Demand claiming partial withdrawal liability in the amount of $39.6 million and requiring Quanta to make payments on this assessment while the dispute was ongoing. In September 2015, the United States Court of Appeals for the Seventh Circuit ruled in favor of the PLCA and reversed the district court’s previous ruling. Based on the outcome of the appeal, in January 2016, the Central States Plan issued a revised Notice and Demand claiming a partial withdrawal liability in the amount of $32.9 million.
Separately, in December 2013, the Central States Plan filed lawsuits against two of Quanta’s other subsidiaries in connection with their withdrawal in 2012. In the first lawsuit, the Central States Plan alleged that the subsidiary elected to participate in the Central States Plan pursuant to the collective bargaining agreement under which it participated. Quanta argued that no such election was made and that any payments made to the Central States Plan were made in error. In July 2014, the parties reached an agreement to settle the lawsuit, and the court dismissed the case with prejudice. In the second lawsuit, the Central States Plan alleged that contributions made by the Quanta subsidiary to a new industry fund created after Quanta withdrew from the Central States Plan should have been made to the Central States Plan. This arguably would have extended the withdrawal date for this subsidiary to at least the end of 2013. Quanta disputed these allegations on the basis that it properly paid contributions to the new industry fund based on the terms of the collective bargaining agreement under which it participated and asserted that it terminated its obligation to contribute to the Central States Plan by the end of 2012. The parties both moved for summary judgment, and in March 2015, the court entered judgment in favor of Quanta. The Central States Plan filed a notice of appeal in April 2015, and in December 2015, the Central States Plan agreed to dismiss the appeal with prejudice.
In December 2017, Quanta and the Central States Plan entered into a settlement agreement and release, whereby the parties agreed on a final settlement amount of $48.9 million, which included a final withdrawal liability of $44.1 million and retention of interest paid on the assessed amount of $4.8 million. This settlement addressed (i) the partial withdrawal liability assessed in the January 2016 Notice and Demand; (ii) an unassessed withdrawal liability in connection with a partial withdrawal in 2012; and (iii) an unassessed withdrawal liability in connection with a complete withdrawal in 2013 or 2014. Prior to settlement of the matter, Quanta made monthly payments on the assessed partial withdrawal liability according to the terms of the January 2016 Notice and Demand, and the portion of those payments that was attributable to the principal amount of the assessed liability was offset against its final withdrawal liability. Accordingly, a final payment of $25.5 million was made in December 2017 as full satisfaction of this matter.
115
QUANTA SERVICES, INC. AND SUBSIDIARIES
NOTES TO CONSOLIDATED FINANCIAL STATEMENTS - (Continued)
2013 Central States Plan Withdrawal Liability. On October 9, 2013, Quanta acquired a company that experienced a complete withdrawal from the Central States Plan prior to the acquisition date. Prior to the acquisition, the Central States Plan issued a Notice and Demand to the acquired company claiming a withdrawal liability in the total amount of $6.9 million and requiring payments to be made on this assessment while the dispute is ongoing. In connection with the acquisition, Quanta recorded an initial liability of $4.8 million related to this withdrawal liability, and a portion of the purchase price for the acquired company was deposited into an escrow account to fund any withdrawal obligation in excess of the initial liability recorded. In January 2016, the Central States Plan issued a revised Notice and Demand claiming a withdrawal liability in the amount of $4.8 million. Although Quanta continues to dispute the total liability owed to the Central States Plan, it continues to make monthly payments according to the terms of this revised Notice and Demand while the parties determine the final withdrawal liability. As of December 31, 2017, payments totaling $4.2 million had been made toward the withdrawal liability assessment. The final amount of withdrawal liability payable in connection with this matter remains the subject of a pending arbitration proceeding and will ultimately depend on various factors, including the outcome of the arbitration. However, the acquired company’s withdrawal from the Central States Plan is not expected to have a material impact on Quanta’s financial condition, results of operations or cash flows.
Indemnities
Quanta generally indemnifies its customers for the services it provides under its contracts, as well as other specified liabilities, which may subject Quanta to indemnity claims and liabilities and related litigation. Additionally, in connection with certain acquisitions and dispositions, Quanta has indemnified various parties against specified liabilities that those parties might incur in the future. The indemnities under acquisition or disposition agreements are usually contingent upon the other party incurring liabilities that reach specified thresholds. As of December 31, 2017, except as otherwise set forth above in Legal Proceedings, Quanta does not believe any material liabilities for claims exist against it in connection with any of these indemnity obligations.
In the normal course of Quanta’s acquisition transactions, Quanta obtains rights to indemnification from the sellers or former owners of acquired companies for certain risks, liabilities and obligations arising from their prior operations, such as performance, operational, safety, workforce or tax issues, some of which Quanta may not have discovered during due diligence. However, the indemnities may not cover all of Quanta’s exposure for such pre-acquisition matters, and the indemnitors may be unwilling or unable to pay the amounts owed to Quanta. Accordingly, Quanta may incur expenses for which it is not reimbursed. Quanta is currently in the process of negotiating certain pre-acquisition obligations associated with non-U.S. payroll taxes that may be due from a business acquired by Quanta in 2013. As of December 31, 2017, Quanta had recorded $11.4 million as its estimate of the pre-acquisition tax obligations and a corresponding indemnification asset, as management expects to recover from the indemnity counterparties any amounts that Quanta may be required to pay in connection with any such obligations.
16. | SEGMENT INFORMATION: |
Quanta presents its operations under two reportable segments: (1) Electric Power Infrastructure Services and (2) Oil and Gas Infrastructure Services. This structure is generally based on the broad end-user markets for Quanta’s services. See Note 1 for additional information regarding Quanta’s reportable segments.
Quanta’s segment results are derived from the types of services provided across its operating units in each of the end user markets described above. Quanta’s entrepreneurial business model allows each of its operating units to serve the same or similar customers and to provide a range of services across end user markets. Quanta’s operating units are organized into one of two internal divisions, namely, the Electric Power Infrastructure Services Division and the Oil and Gas Infrastructure Services Division. These internal divisions are closely aligned with the reportable segments and are based on their operating units’ predominant type of work.
Reportable segment information, including revenues and operating income by type of work, is gathered from each operating unit for the purpose of evaluating segment performance in support of Quanta’s market strategies. These classifications of Quanta’s operating unit revenues by type of work for segment reporting purposes can at times require judgment on the part of management. Quanta’s operating units may perform joint projects for customers in multiple industries, deliver multiple types of services under a single customer contract or provide service across industries. For example, Quanta performs joint trenching projects to install distribution lines for electric power and natural gas customers.
In addition, Quanta’s integrated operations and common administrative support at each of its operating units require that certain allocations be made to determine segment profitability, including allocations of shared and indirect costs, such as facility costs, indirect operating expenses including depreciation, and general and administrative costs. Corporate costs, such as payroll and benefits, employee travel expenses, facility costs, professional fees, acquisition costs and amortization related to intangible assets are not allocated.
116
QUANTA SERVICES, INC. AND SUBSIDIARIES
NOTES TO CONSOLIDATED FINANCIAL STATEMENTS - (Continued)
Summarized financial information for Quanta’s reportable segments is presented in the following table (in thousands):
Year Ended December 31, | ||||||||||||
2017 | 2016 | 2015 | ||||||||||
Revenues: | ||||||||||||
Electric Power Infrastructure Services | $ | 5,599,836 | $ | 4,850,495 | $ | 4,937,289 | ||||||
Oil and Gas Infrastructure Services | 3,866,642 | 2,800,824 | 2,635,147 | |||||||||
Consolidated | $ | 9,466,478 | $ | 7,651,319 | $ | 7,572,436 | ||||||
Operating income (loss): | ||||||||||||
Electric Power Infrastructure Services | $ | 518,130 | $ | 395,745 | $ | 362,328 | ||||||
Oil and Gas Infrastructure Services | 184,083 | 149,502 | 142,929 | |||||||||
Corporate and non-allocated costs | (323,364 | ) | (224,434 | ) | (267,754 | ) | ||||||
Consolidated | $ | 378,849 | $ | 320,813 | $ | 237,503 | ||||||
Depreciation: | ||||||||||||
Electric Power Infrastructure Services | $ | 91,708 | $ | 91,269 | $ | 89,150 | ||||||
Oil and Gas Infrastructure Services | 76,355 | 67,374 | 65,315 | |||||||||
Corporate and non-allocated costs | 15,745 | 11,597 | 8,380 | |||||||||
Consolidated | $ | 183,808 | $ | 170,240 | $ | 162,845 | ||||||
Separate measures of Quanta’s assets and cash flows by reportable segment, including capital expenditures, are not produced or utilized by management to evaluate segment performance. Quanta’s fixed assets, which are held at the operating unit level, include operating machinery, equipment and vehicles, as well as office equipment, buildings and leasehold improvements, and are used on an interchangeable basis across its reportable segments. As such, for reporting purposes, total depreciation expense is allocated each quarter among Quanta’s reportable segments based on the ratio of each reportable segment’s revenue contribution to consolidated revenues.
Foreign Operations
During 2017, 2016, and 2015, Quanta derived $2.48 billion, $1.59 billion and $1.54 billion, respectively, of its revenues from foreign operations. Of Quanta’s foreign revenues, 79%, 75% and 85% were earned in Canada during the years ended December 31, 2017, 2016 and 2015, respectively. In addition, Quanta held property and equipment of $330.4 million and $320.7 million in foreign countries, primarily Canada, as of December 31, 2017 and 2016.
17. | SUPPLEMENTAL CASH FLOW INFORMATION: |
The net effect of changes in operating assets and liabilities, net of non-cash transactions, on cash flows from operating activities of continuing operations is as follows (in thousands):
Year Ended December 31, | ||||||||||||
2017 | 2016 | 2015 | ||||||||||
Accounts and notes receivable | $ | (425,313 | ) | $ | 144,877 | $ | 150,470 | |||||
Costs and estimated earnings in excess of billings on uncompleted contracts | 15,999 | (152,702 | ) | (49,358 | ) | |||||||
Inventories | 14,110 | (9,905 | ) | (33,524 | ) | |||||||
Prepaid expenses and other current assets | (32,079 | ) | 25,133 | 5,899 | ||||||||
Accounts payable and accrued expenses and other non-current liabilities | 29,722 | 81,792 | 7,311 | |||||||||
Billings in excess of costs and estimated earnings on uncompleted contracts | 139,114 | (124,680 | ) | 153,017 | ||||||||
Other, net | 17,267 | (13,743 | ) | (11,707 | ) | |||||||
Net change in operating assets and liabilities, net of non-cash transactions | $ | (241,180 | ) | $ | (49,228 | ) | $ | 222,108 | ||||
117
QUANTA SERVICES, INC. AND SUBSIDIARIES
NOTES TO CONSOLIDATED FINANCIAL STATEMENTS - (Continued)
Additional supplemental cash flow information is as follows (in thousands):
Year Ended December 31, | ||||||||||||
2017 | 2016 | 2015 | ||||||||||
Cash (paid) received during the period for - | ||||||||||||
Interest paid related to continuing operations | $ | (19,373 | ) | $ | (12,828 | ) | $ | (7,087 | ) | |||
Income taxes paid related to continuing operations | $ | (112,335 | ) | $ | (121,662 | ) | $ | (130,921 | ) | |||
Income taxes paid related to discontinued operations | $ | — | $ | (7,260 | ) | $ | (144,076 | ) | ||||
Income tax refunds related to continuing operations | $ | 9,845 | $ | 7,548 | $ | 23,788 | ||||||
During the year ended December 31, 2017, Quanta entered into a non-cash transaction whereby Quanta accepted title to a marine vessel in satisfaction and discharge of a $7.1 million note receivable.
18. | QUARTERLY FINANCIAL DATA (UNAUDITED): |
The table below sets forth the unaudited consolidated operating results by quarter for the years ended December 31, 2017 and 2016 (in thousands, except per share information).
For the Three Months Ended | ||||||||||||||||
March 31, | June 30, | September 30, | December 31, | |||||||||||||
2017: | ||||||||||||||||
Revenues | $ | 2,178,170 | $ | 2,200,374 | $ | 2,609,307 | $ | 2,478,627 | ||||||||
Gross profit | 266,188 | 302,165 | 350,631 | 322,876 | ||||||||||||
Net income | 48,440 | 64,360 | 89,849 | 115,576 | ||||||||||||
Net income attributable to common stock | 48,267 | 63,837 | 89,313 | 113,561 | ||||||||||||
Net income from continuing operations attributable to common stock | 48,267 | 63,837 | 89,313 | 113,561 | ||||||||||||
Basic earnings per share from continuing operations attributable to common stock | $ | 0.31 | $ | 0.41 | $ | 0.57 | $ | 0.72 | ||||||||
Diluted earnings per share from continuing operations attributable to common stock | $ | 0.31 | $ | 0.41 | $ | 0.56 | $ | 0.72 | ||||||||
2016: | ||||||||||||||||
Revenues | $ | 1,713,737 | $ | 1,792,430 | $ | 2,042,186 | $ | 2,102,966 | ||||||||
Gross profit | 203,313 | 200,217 | 302,582 | 307,688 | ||||||||||||
Net income | 20,859 | 16,729 | 74,152 | 88,358 | ||||||||||||
Net income attributable to common stock | 20,496 | 16,562 | 73,742 | 87,583 | ||||||||||||
Net income from continuing operations attributable to common stock | 20,496 | 16,562 | 73,137 | 88,530 | ||||||||||||
Basic earnings per share from continuing operations attributable to common stock | $ | 0.13 | $ | 0.11 | $ | 0.47 | $ | 0.57 | ||||||||
Diluted earnings per share from continuing operations attributable to common stock | $ | 0.13 | $ | 0.11 | $ | 0.47 | $ | 0.57 | ||||||||
During the fourth quarter of 2017, Quanta recorded one-time tax benefits as further described in Note 10 and asset impairment charges of $58.1 million ($36.6 million net of tax), which were primarily associated with two reporting units within its Oil and Gas Infrastructure Services Division. Specifically, a reporting unit that provides material handling services experienced lower operating margins and is expected to continue to face a highly competitive environment in its select markets, and a reporting unit that provides marine and offshore services experienced prolonged periods of reduced revenues and operating margins and is expected to continue to experience lower levels of activity in the U.S. Gulf of Mexico and other offshore markets. During the fourth quarter of 2016, Quanta recorded total asset impairment charges of $8.0 million ($7.1 million net of tax) primarily related to a pending disposition of certain international renewable energy services operations, which was completed in 2017.
The sum of the individual quarterly earnings per share amounts may not equal year-to-date earnings per share as each period’s computation is based on the weighted average number of shares outstanding during the period.
118
QUANTA SERVICES, INC. AND SUBSIDIARIES
NOTES TO CONSOLIDATED FINANCIAL STATEMENTS - (Continued)
19. SUBSEQUENT EVENTS:
Acquisitions
In January 2018, Quanta acquired an electrical infrastructure services business specializing in substation construction and relay services and a postsecondary educational institution that provides pre-apprenticeship training and programs for experienced lineman, both of which are located in the United States. The aggregate consideration for these acquisitions was $47.9 million in cash, subject to certain adjustments, and 379,817 shares of Quanta common stock, which had a fair value of approximately $13.6 million at the acquisition dates. Additionally, the acquisition of the postsecondary educational institution includes the potential payment of up to approximately $15.0 million, payable if the acquired business achieves certain financial and operational objectives over a five-year period. The results of the acquired businesses will generally be included in Quanta’s Electric Power Infrastructure Services segment and consolidated financial statements beginning on the acquisition dates. Due to the recent closing of these acquisitions, certain financial information related to these acquisitions, including the fair value of total consideration transferred or estimated to be transferred, is not yet finalized.
ITEM 9. | Changes in and Disagreements with Accountants on Accounting and Financial Disclosure |
There have been no changes in or disagreements with accountants on accounting and financial disclosure within the parameters of Item 304(b) of Regulation S-K.
ITEM 9A. | Controls and Procedures |
Attached as exhibits to this Annual Report on Form 10-K are certifications of Quanta’s Chief Executive Officer and Chief Financial Officer that are required in accordance with Rule 13a-14 of the Securities Exchange Act of 1934, as amended (the Exchange Act). This Item 9A. section includes information concerning the controls and controls evaluation referred to in the certifications, and it should be read in conjunction with the certifications for a more complete understanding of the topics presented.
Evaluation of Disclosure Controls and Procedures
Our management has established and maintains a system of disclosure controls and procedures that are designed to provide reasonable assurance that information required to be disclosed by us in the reports that we file or submit under the Exchange Act, such as this Annual Report on Form 10-K, is recorded, processed, summarized and reported within the time periods specified in the SEC rules and forms. The disclosure controls and procedures are also designed to provide reasonable assurance that such information is accumulated and communicated to our management, including our Chief Executive Officer and Chief Financial Officer, as appropriate to allow timely decisions regarding required disclosure.
As of the end of the period covered by this Annual Report, we evaluated the effectiveness of the design and operation of our disclosure controls and procedures pursuant to Rule 13a-15(b) of the Exchange Act. This evaluation was carried out under the supervision and with the participation of our management, including our Chief Executive Officer and Chief Financial Officer. Based on this evaluation, these officers have concluded that, as of December 31, 2017, our disclosure controls and procedures were effective to provide reasonable assurance of achieving their objectives.
Evaluation of Internal Control over Financial Reporting
Management’s report on internal control over financial reporting can be found in Item 8. Financial Statements and Supplementary Data under the heading Report of Management and is incorporated herein by reference. The report of PricewaterhouseCoopers LLP, an independent registered public accounting firm, on the financial statements, and its opinion on the effectiveness of internal control over financial reporting, can also be found in Item 8. Financial Statements and Supplementary Data under the heading Report of Independent Registered Public Accounting Firm and is incorporated herein by reference.
There has been no change in our internal control over financial reporting that occurred during the quarter ended December 31, 2017 that has materially affected, or is reasonably likely to materially affect, our internal control over financial reporting.
Design and Operation of Control Systems
Our management, including the Chief Executive Officer and Chief Financial Officer, does not expect that our disclosure controls and procedures or our internal control over financial reporting will prevent or detect all errors and all fraud. A control system, no matter how well designed and operated, can provide only reasonable, not absolute, assurance that the control system’s objectives will be met. The design of a control system must reflect the fact that there are resource constraints, and the benefits of controls must be considered relative to their costs. Further, because of the inherent limitations in all control systems, no evaluation of controls can provide absolute assurance that misstatements due to error or fraud will not occur or that all control issues and instances of fraud, if any, within the company have been detected. These inherent limitations include the realities that judgments
119
in decision-making can be faulty and breakdowns can occur because of simple errors or mistakes. Controls can be circumvented by the individual acts of some persons, by collusion of two or more people, or by management override of the controls. The design of any system of controls is based in part on certain assumptions about the likelihood of future events, and there can be no assurance that any design will succeed in achieving its stated goals under all potential future conditions. Over time, controls may become inadequate because of changes in conditions or deterioration in the degree of compliance with policies or procedures.
ITEM 9B. | Other Information |
None.
120
PART III
ITEM 10. | Directors, Executive Officers and Corporate Governance |
The information required by this Item 10 is incorporated by reference to our definitive proxy statement, which is to be filed with the SEC pursuant to the Exchange Act within 120 days following the end of our 2017 fiscal year.
ITEM 11. | Executive Compensation |
The information required by this Item 11 is incorporated by reference to our definitive proxy statement, which is to be filed with the SEC pursuant to the Exchange Act within 120 days following the end of our 2017 fiscal year.
ITEM 12. | Security Ownership of Certain Beneficial Owners and Management and Related Stockholder Matters |
The information required by this Item 12 is incorporated by reference to our definitive proxy statement, which is to be filed with the SEC pursuant to the Exchange Act within 120 days following the end of our 2017 fiscal year.
ITEM 13. | Certain Relationships and Related Transactions, and Director Independence |
The information required by this Item 13 is incorporated by reference to our definitive proxy statement, which is to be filed with the SEC pursuant to the Exchange Act within 120 days following the end of our 2017 fiscal year.
ITEM 14. | Principal Accounting Fees and Services |
The information required by this Item 14 is incorporated by reference to our definitive proxy statement, which is to be filed with the SEC pursuant to the Exchange Act within 120 days following the end of our 2017 fiscal year.
121
PART IV
ITEM 15. | Exhibits and Financial Statement Schedules |
The following financial statements, schedules and exhibits are filed as part of this Annual Report on Form 10-K:
(1) Consolidated financial statements. The consolidated financial statements are included in Item 8. Financial Statements and Supplementary Data of this Annual Report on Form 10-K.
(2) Financial statement schedules. All financial statement schedules are omitted because they are not applicable or the required information is shown in the consolidated financial statements or the notes to the consolidated financial statements in Item 8. Financial Statements and Supplementary Data of this Annual Report on Form 10-K.
(3) Exhibits.
122
EXHIBIT INDEX
Exhibit | ||||
No. | Description | |||
2.1 | — | |||
2.2 | ||||
3.1 | — | |||
3.2 | — | |||
3.3 | — | |||
4.1 | — | |||
10.1* | — | |||
10.2* | — | |||
10.3* | — | |||
10.4* | — | |||
10.5* | — | |||
10.6* | — | |||
10.7* | — | |||
10.8* | — | |||
10.9* | — | |||
10.10* | — | |||
10.11* | — | |||
123
Exhibit | ||||
No. | Description | |||
10.12* | — | |||
10.13 * | — | |||
10.14 * | — | |||
10.15 * | — | |||
10.16* | ||||
10.17* | ||||
10.18* | — | |||
10.19* | — | |||
10.20* | — | |||
10.21* | — | |||
10.22* | — | |||
10.23* | — | |||
10.24 | — | |||
10.25 | — | |||
124
Exhibit | ||||
No. | Description | |||
10.26 | ||||
10.27 | — | |||
10.28 | — | |||
10.29 | — | |||
10.30 | — | |||
10.31 | — | |||
10.32 | — | |||
10.33 | — | |||
10.34 | — | |||
10.35 | — | |||
10.36 | — | |||
125
Exhibit | ||||
No. | Description | |||
10.37 | — | |||
10.38 | — | |||
21.1ˆ | — | |||
23.1ˆ | — | |||
31.1ˆ | — | |||
31.2ˆ | — | |||
32.1† | — | |||
101.INSˆ | — | XBRL Instance Document | ||
101.SCHˆ | — | XBRL Taxonomy Extension Schema Document | ||
101.CALˆ | — | XBRL Taxonomy Extension Calculation Linkbase Document | ||
101.LABˆ | — | XBRL Taxonomy Extension Label Linkbase Document | ||
101.PREˆ | — | XBRL Taxonomy Extension Presentation Linkbase Document | ||
101.DEFˆ | — | XBRL Taxonomy Extension Definition Linkbase Document | ||
_______________________________________
* | Management contracts or compensatory plans or arrangements |
ˆ | Filed with this Annual Report on Form 10-K |
† | Furnished with this Annual Report on Form 10-K |
126
ITEM 16. Form 10-K Summary.
Not applicable.
127
SIGNATURES
Pursuant to the requirements of Section 13 or 15(d) of the Securities Exchange Act of 1934, Quanta Services, Inc. has duly caused this Report to be signed on its behalf by the undersigned, thereunto duly authorized, in the City of Houston, State of Texas, on February 28, 2018.
QUANTA SERVICES, INC. | ||
By: | /s/ EARL C. AUSTIN, JR. | |
Earl C. Austin, Jr. President, Chief Executive Officer and Chief Operating Officer | ||
KNOW ALL PERSONS BY THESE PRESENTS, that each person whose signature appears below constitutes and appoints Earl C. Austin, Jr. and Derrick A. Jensen, each of whom may act without joinder of the other, as their true and lawful attorneys-in-fact and agents, each with full power of substitution and resubstitution, for such person and in his or her name, place and stead, in any and all capacities, to sign any and all amendments to this Annual Report on Form 10-K, and to file the same, with all exhibits thereto and other documents in connection therewith, with the Securities and Exchange Commission, granting unto said attorneys-in-fact and agents full power and authority to do and perform each and every act and thing requisite and necessary to be done in and about the premises, as fully to all intents and purposes as he might or could do in person, hereby ratifying and confirming all that said attorneys-in-fact and agents, or their substitutes, may lawfully do or cause to be done by virtue hereof.
Pursuant to the requirements of the Securities Exchange Act of 1934, this Report has been signed by the following persons in the capacities indicated on February 28, 2018.
128
Signature | Title | |
/s/ EARL C. AUSTIN, JR. | President, Chief Executive Officer, Chief Operating Officer and Director | |
Earl C. Austin, Jr. | (Principal Executive Officer) | |
/s/ DERRICK A. JENSEN | Chief Financial Officer | |
Derrick A. Jensen | (Principal Financial Officer) | |
/s/ JERRY K. LEMON | Chief Accounting Officer | |
Jerry K. Lemon | (Principal Accounting Officer) | |
/s/ DOYLE N. BENEBY | Director | |
Doyle N. Beneby | ||
/s/ J. MICHAL CONAWAY | Director | |
J. Michal Conaway | ||
/s/ VINCENT D. FOSTER | Director | |
Vincent D. Foster | ||
/s/ BERNARD FRIED | Director | |
Bernard Fried | ||
/s/ WORTHING F. JACKMAN | Director | |
Worthing F. Jackman | ||
/s/ DAVID M. McCLANAHAN | Chairman of the Board of Directors | |
David M. McClanahan | ||
/s/ MARGARET B. SHANNON | Director | |
Margaret B. Shannon | ||
/s/ PAT WOOD, III | Director | |
Pat Wood, III | ||
129