Attached files
UNITED STATES
SECURITIES AND EXCHANGE COMMISSION
WASHINGTON, D.C. 20549
___________________________________
FORM 10-K
___________________________________
þ | ANNUAL REPORT PURSUANT TO SECTION 13 OR 15(d) OF THE SECURITIES EXCHANGE ACT OF 1934 |
For the fiscal year ended December 31, 2017
OR
¨ | TRANSITION REPORT PURSUANT TO SECTION 13 OR 15(d) OF THE SECURITIES EXCHANGE ACT OF 1934 |
For the transition period from to
Commission file number 1-11037
___________________________________
Praxair, Inc.
___________________________________
Praxair, Inc. | ||
10 Riverview Drive | State of incorporation: Delaware | |
Danbury, Connecticut 06810-6268 | IRS identification number: 06-124 9050 | |
Tel. (203) 837-2000 | ||
Securities registered pursuant to Section 12(b) of the Act:
Title of each class: | Registered on: | |
Common Stock ($0.01 par value) | New York Stock Exchange | |
1.50% Euro notes due 2020 | New York Stock Exchange | |
1.20% Euro notes due 2024 | New York Stock Exchange | |
1.625% Euro notes due 2025 | New York Stock Exchange | |
Securities registered pursuant to Section 12(g) of the Act: None
___________________________________
Indicate by check mark if the registrant is a well-known seasoned issuer, as defined in Rule 405 of the Securities Act. Yes þ No ¨
Indicate by check mark if the registrant is not required to file reports pursuant to Section 13 or Section 15(d) of the Act. Yes ¨ No þ
Indicate by check mark whether the registrant (1) has filed all reports required to be filed by Section 13 or 15(d) of the Securities Exchange Act of 1934 during the preceding 12 months (or for such shorter period that the registrant was required to file such reports), and (2) has been subject to such filing requirements for the past 90 days. Yes þ No ¨
Indicate by check mark whether the registrant has submitted electronically and posted on its corporate Web site, if any, every Interactive Data File required to be submitted and posted pursuant to Rule 405 of Regulation S-T (§232.405 of this chapter) during the preceding 12 months (or for such shorter period that the registrant was required to submit and post such files). Yes þ No ¨
Indicate by check mark if disclosure of delinquent filers pursuant to Item 405 of Regulation S-K (§229.405 of this chapter) is not contained herein, and will not be contained, to the best of registrant’s knowledge, in definitive proxy or information statements incorporated by reference in Part III of this Form 10-K or any amendment to this Form 10-K. ¨
Indicate by check mark whether the registrant is a large accelerated filer, an accelerated filer, a non-accelerated filer, a smaller reporting company, or emerging growth company. See the definitions of "large accelerated filer," "accelerated filer," " smaller reporting company, " and "emerging growth company" in Rule 12b-2 of the Exchange Act.
Large accelerated filer þ Accelerated filer ¨ Non- accelerated filer ¨ Smaller reporting company ¨ Emerging growth company ¨
If an emerging growth company, indicate by check mark if the registrant has elected not to use the extended transition period for complying with any new or revised financial accounting standards provided pursuant to Section 13(a) of the Exchange Act. ¨
Indicate by check mark whether the registrant is a shell company (as defined in Rule 12b-2 of the Act). Yes ¨ No þ
The aggregate market value of the voting and non-voting common stock held by non-affiliates as of June 30, 2017, was approximately $38 billion (based on the closing sale price of the stock on that date as reported on the New York Stock Exchange).
At January 31, 2018, 287,136,596 shares of common stock of Praxair, Inc. were outstanding.
PRAXAIR, INC.
ANNUAL REPORT ON FORM 10-K
For the fiscal year ended December 31, 2017
TABLE OF CONTENTS
Page | ||
Part I | ||
Item 1: | ||
Item 1A: | ||
Item 1B: | ||
Item 2: | ||
Item 3: | ||
Item 4: | ||
Part II | ||
Item 5: | ||
Item 6: | ||
Item 7: | ||
Item 7A: | ||
Item 8: | ||
Item 9: | ||
Item 9A: | ||
Item 9B: | ||
Part III | ||
Item 10: | ||
Item 11: | ||
Item 12: | ||
Item 13: | ||
Item 14: | ||
Part IV | ||
Item 15: | ||
2
Praxair, Inc. and Subsidiaries
PART I
ITEM 1. BUSINESS
General
Praxair, Inc. (Praxair or the company) was founded in 1907 and became an independent publicly traded company in 1992. Praxair was the first company in the United States to produce oxygen from air using a cryogenic process and continues to be a technological innovator in the industrial gases industry.
Praxair is a leading industrial gas company in North and South America and one of the largest worldwide. Praxair’s primary products in its industrial gases business are atmospheric gases (oxygen, nitrogen, argon, rare gases) and process gases (carbon dioxide, helium, hydrogen, electronic gases, specialty gases, acetylene). The company also designs, engineers, and builds equipment that produces industrial gases primarily for internal use. The company’s surface technologies segment, operated through Praxair Surface Technologies, Inc., supplies wear-resistant and high-temperature corrosion-resistant metallic and ceramic coatings and powders. Praxair’s sales were $11,437 million, $10,534 million, and $10,776 million for 2017, 2016, and 2015, respectively. Refer to Item 7, Management's Discussion and Analysis, for a discussion of consolidated sales and Note 18 to the consolidated financial statements for additional information related to Praxair’s reportable segments.
Praxair serves a diverse group of industries including healthcare, petroleum refining, manufacturing, food, beverage carbonation, fiber-optics, steel making, aerospace, chemicals and water treatment. In 2017, 95% of sales were generated in four geographic segments (North America, Europe, South America and Asia) primarily from the sale of industrial gases, with the balance generated from the surface technologies segment. Praxair provides a competitive advantage to its customers by continuously developing new products and applications, which allow them to improve their productivity, energy efficiency and environmental performance.
Proposed Business Combination with Linde AG
On June 1, 2017, Praxair and Linde AG entered into a definitive Business Combination Agreement, as amended (the "Business Combination Agreement"), pursuant to which, among other things, Praxair and Linde AG agreed to combine their respective businesses through an all-stock transaction, and become subsidiaries of a new holding company incorporated in Ireland, Linde plc. Pursuant to the business combination agreement, Linde’s business will be brought under Linde plc through Linde plc’s offer to exchange Linde AG shares for Linde plc shares and Praxair’s business will be brought under Linde plc through a merger of an indirect wholly-owned Delaware subsidiary of Linde plc with and into Praxair, with Praxair surviving the merger. Praxair’s stockholders approved the merger at Praxair’s special meeting held on September 27, 2017, and on November 24, 2017, the tender period for the exchange offer expired with approximately 92% of all Linde AG shares entitled to voting rights being tendered.
Completion of the Business Combination remains subject to approval by requisite governmental regulators and authorities, including approvals under applicable competition laws. The parties currently expect the Business Combination to be completed in the second half of 2018. Refer to Item 1A. "Risk Factors" and Note 20 to the consolidated financial statements for further details.
Industrial Gases Products and Manufacturing Processes
Atmospheric gases are the highest volume products produced by Praxair. Using air as its raw material, Praxair produces oxygen, nitrogen and argon through several air separation processes of which cryogenic air separation is the most prevalent. Rare gases, such as krypton, neon and xenon, are also produced through cryogenic air separation. As a pioneer in the industrial gases industry, Praxair is a leader in developing a wide range of proprietary and patented applications and supply systems technology. Praxair also led the development and commercialization of non-cryogenic air separation technologies for the production of industrial gases. These technologies open important new markets and optimize production capacity for the company by lowering the cost of supplying industrial gases. These technologies include proprietary vacuum pressure swing adsorption (“VPSA”) and membrane separation to produce gaseous oxygen and nitrogen, respectively.
Process gases, including carbon dioxide, hydrogen, carbon monoxide, helium, specialty gases and acetylene are produced by methods other than air separation. Most carbon dioxide is purchased from by-product sources, including chemical plants, refineries and industrial processes or is recovered from carbon dioxide wells. Carbon dioxide is processed in Praxair’s plants to produce commercial and food-grade carbon dioxide. Hydrogen and carbon monoxide can be produced by either steam methane reforming or auto-thermal reforming of natural gas or other feed streams such as naphtha.
3
Hydrogen is also produced by purifying by-product sources obtained from the chemical and petrochemical industries. Most of the helium sold by Praxair is sourced from certain helium-rich natural gas streams in the United States, with additional supplies being acquired from outside the United States. Acetylene is primarily sourced as a chemical by-product, but may also be produced from calcium carbide and water.
Industrial Gases Distribution
There are three basic distribution methods for industrial gases: (i) on-site or tonnage; (ii) merchant or bulk liquid; and (iii) packaged or cylinder gases. These distribution methods are often integrated, with products from all three supply modes coming from the same plant. The method of supply is generally determined by the lowest cost means of meeting the customer’s needs, depending upon factors such as volume requirements, purity, pattern of usage, and the form in which the product is used (as a gas or as a cryogenic liquid).
On-site. Customers that require the largest volumes of product (typically oxygen, nitrogen and hydrogen) and that have a relatively constant demand pattern are supplied by cryogenic and process gas on-site plants. Praxair constructs plants on or adjacent to these customers’ sites and supplies the product directly to customers by pipeline. On-site product supply contracts generally are total requirement contracts with terms typically ranging from 10-20 years and containing minimum purchase requirements and price escalation provisions. Many of the cryogenic on-site plants also produce liquid products for the merchant market. Therefore, plants are typically not dedicated to a single customer. Advanced air separation processes allow on-site delivery to customers with smaller volume requirements. Customers using these systems usually enter into requirement contracts with terms typically ranging from 5-15 years.
Merchant. The merchant business is generally associated with distributable liquid oxygen, nitrogen, argon, carbon dioxide, hydrogen and helium. The deliveries generally are made from Praxair’s plants by tanker trucks to storage containers at the customer's site which are owned and maintained by Praxair and leased to the customer. Due to distribution cost, merchant oxygen and nitrogen generally have a relatively small distribution radius from the plants at which they are produced. Merchant argon, hydrogen and helium can be shipped much longer distances. The customer agreements used in the merchant business are usually three-to seven-year requirement contracts.
Packaged Gases. Customers requiring small volumes are supplied products in metal containers called cylinders, under medium to high pressure. Packaged gases include atmospheric gases, carbon dioxide, hydrogen, helium, acetylene and related products. Praxair also produces and distributes in cylinders a wide range of specialty gases and mixtures. Cylinders may be delivered to the customer’s site or picked up by the customer at a packaging facility or retail store. Packaged gases are generally sold under one to three-year supply contracts and through purchase orders.
A substantial amount of the cylinder gases sold in the United States is distributed by independent distributors that buy merchant gases in liquid form and repackage the products in their facilities. Packaged gas distributors, including Praxair, also distribute hardgoods and welding equipment purchased from independent manufacturers. Over time, Praxair has acquired a number of independent industrial gases and welding products distributors at various locations in the United States and continues to sell merchant gases to other independent distributors. Between its own distribution business, joint ventures and sales to independent distributors, Praxair is represented in 48 states, the District of Columbia and Puerto Rico.
Surface Technologies
Praxair Surface Technologies is a leading worldwide supplier of coating services and thermal spray consumables to customers in the aircraft, energy, printing, primary metals, petrochemical, textile, and other industries. Its coatings are used to provide wear resistance, corrosion protection, thermal insulation, and many other surface-enhancing functions which serve to extend component life, enable optimal performance, and reduce operating costs. It also manufactures a complete line of electric arc, plasma and wire spray, and high-velocity oxy-fuel ("HVOF") equipment.
Inventories – Praxair carries inventories of merchant and cylinder gases, hardgoods and coatings materials to supply products to its customers on a reasonable delivery schedule. On-site plants and pipeline complexes have limited inventory. Inventory obsolescence is not material to Praxair’s business.
Customers – Praxair is not dependent upon a single customer or a few customers.
International – Praxair is a global enterprise with approximately 57% of its 2017 sales outside of the United States. It conducts industrial gases business through consolidated companies in Argentina, Bahrain, Belgium, Bolivia, Brazil, Canada, Chile, China, Colombia, Costa Rica, Denmark, Dominican Republic, France, Germany, India, Ireland, Italy, Japan, Mexico, the Netherlands, Norway, Panama, Paraguay, Peru, Portugal, Puerto Rico, Russia, South Korea, Spain, Sweden, Taiwan, Thailand, United Arab Emirates, the United Kingdom, and Uruguay. Societa Italiana Acetilene & Derivati S.p.A. ("S.I.A.D."), an Italian company accounted for as an equity company, also has established positions in Austria, Bosnia,
4
Bulgaria, Croatia, the Czech Republic, Hungary, Romania, Russia, Serbia, Slovakia, Slovenia and Ukraine. Refrigeration and Oxygen Company Limited ("ROC"), a Middle Eastern company accounted for as an equity company, has operations in the United Arab Emirates, Kuwait and Qatar. Praxair’s surface technologies segment has operations in Brazil, Canada, China, France, Germany, India, Italy, Japan, Singapore, South Korea and the United Kingdom.
Praxair’s international business is subject to risks customarily encountered in foreign operations, including fluctuations in foreign currency exchange rates, import and export controls, and other economic, political and regulatory policies of local governments. Also, see Item 1A. “Risk Factors” and Item 7A. “Quantitative and Qualitative Disclosures About Market Risk.”
Seasonality – Praxair’s business is generally not subject to seasonal fluctuations to any significant extent.
Research and Development – Praxair’s research and development is directed toward developing new and improved methods for the production and distribution of industrial gases and the development of new markets and applications for these gases. This results in the development of new advanced air separation and hydrogen process technologies and the frequent introduction of new industrial gas applications. Research and development for industrial gases is principally conducted at Tonawanda, New York and Burr Ridge, Illinois.
Praxair conducts research and development for its surface technologies to improve the quality and durability of coatings and the use of specialty powders for new applications and industries. Surface technologies research is conducted at Indianapolis, Indiana.
Patents and Trademarks – Praxair owns or licenses a large number of United States and foreign patents that relate to a wide variety of products and processes. Praxair’s patents expire at various times over the next 20 years. While these patents and licenses are considered important to our individual businesses, Praxair does not consider its business as a whole to be materially dependent upon any one particular patent, or patent license, or family of patents. Praxair also owns a large number of valuable trademarks. Only the "Praxair" trademark is important to our business as a whole.
Raw Materials and Energy Costs – Energy is the single largest cost item in the production and distribution of industrial gases. Most of Praxair’s energy requirements are in the form of electricity, natural gas and diesel fuel for distribution.
The supply of energy has not been a significant issue in the geographic areas where the company conducts business. However, energy availability and price is unpredictable and may pose unforeseen future risks.
For carbon dioxide, carbon monoxide, helium, hydrogen, specialty gases and surface technologies, raw materials are largely purchased from outside sources. Praxair has contracts or commitments for, or readily available sources of, most of these raw materials; however, their long-term availability and prices are subject to market conditions.
Competition – Praxair operates within a highly competitive environment. Some of its competitors are larger in size and capital base than Praxair. Competition is based on price, product quality, delivery, reliability, technology and service to customers.
Major competitors in the industrial gases industry both in the United States and worldwide include Air Products and Chemicals, Inc., L’Air Liquide S.A., and Linde AG. Principal competitors for the surface technologies business are Chromalloy Gas Turbine LLC, a subsidiary of Sequa Corporation, Bodycote, PLC, and OC Oerlikon Corp AG. There are other industrial gas and surface coating competitors that compete on a local geography basis.
Employees and Labor Relations – As of December 31, 2017, Praxair had 26,461 employees worldwide. Of this number, 10,382 are employed in the United States. Praxair has collective bargaining agreements with unions at numerous locations throughout the world, which expire at various dates. Praxair considers relations with its employees to be good.
Environment – Information required by this item is incorporated herein by reference to the section captioned “Management’s Discussion and Analysis – Environmental Matters” in Item 7 of this 10-K.
Available Information – The company makes its periodic and current reports available, free of charge, on or through its website, www.praxair.com, as soon as practicable after such material is electronically filed with, or furnished to, the Securities and Exchange Commission ("SEC"). Investors may also access from the company website other investor information such as press releases and presentations. Information on the company’s website is not incorporated by reference herein.
In addition, the public may read and copy any materials filed with the SEC at the SEC’s Public Reference Room located at 100 F Street NE, Washington, D.C. 20549. The public may also obtain information on the operation of the Public Reference Room by calling the SEC at 1-800-SEC-0330. The SEC also maintains a website, www.sec.gov, that contains reports, proxy information statements and other information regarding issuers that file electronically.
5
Executive Officers – The following Executive Officers have been elected by the Board of Directors and serve at the pleasure of the Board. It is expected that the Board will elect officers annually following each annual meeting of shareholders.
Stephen F. Angel, 62, is Chief Executive Officer of Praxair, Inc. since January 1, 2007, and Chairman since May 1, 2007. Before becoming the Chief Executive Officer, Mr. Angel served as President and Chief Operating Officer from March to December 2006, and as Executive Vice President from 2001 to March 2006. Prior to joining Praxair in 2001, Mr. Angel spent 22 years in a variety of management positions with General Electric. Mr. Angel is a director of PPG Industries, Inc. where he serves on the Officers-Directors Compensation Committee, and the Technology and Environment Committee. He is also a member of The Business Council and is a member of the Board of the U.S. - China Business Council and its Nominating Committee.
Guillermo Bichara, 43, was appointed Vice President, General Counsel and Corporate Secretary of Praxair, Inc. effective January 1, 2015. Prior to this, from 2013-2014, he was Associate General Counsel and Assistant Secretary. From 2011-2013, Mr. Bichara served as Associate General Counsel with responsibility for Praxair Europe, Praxair Mexico and corporate transactions. He was Vice President and General Counsel of Praxair Asia from 2007-2011, and joined Praxair in 2006 as director of legal affairs at Praxair Mexico. Prior to joining Praxair, Mr. Bichara served as corporate counsel at CEMEX, Mexico's global leader in the building materials industry, and was a foreign associate and counsel, respectively, at the law firms of Skadden, Arps, Slate, Meagher & Flom and White & Case.
Kelcey E. Hoyt, 48, was named Vice President and Controller effective August 1, 2016. Prior to becoming Controller, she served as Praxair’s Director of Investor Relations since 2010. She joined Praxair in 2002 and served as Director of Corporate Accounting and SEC Reporting through 2008, and later served as Controller for various divisions within Praxair’s North American Industrial Gas business. Previously, she had five years of experience in audit at KPMG, LLP. She is a certified public accountant.
Eduardo F. Menezes, 54, was promoted to Executive Vice President from Senior Vice President effective March 1, 2012. He oversees Praxair’s businesses in Asia, Europe, Mexico, and South America. From 2010 to March 2011, he was a Vice President of Praxair with responsibility for the North American Industrial Gases business. From 2007 to 2010, he was President of Praxair Europe. He served as Managing Director of Praxair’s business in Mexico from 2004 to 2007, as Vice President and General Manager for Praxair Distribution, Inc. from 2003 to 2004 and as Vice President, U.S. West Region, for North American Industrial Gases, from 2000 to 2003.
Anne K. Roby, age 53, was named Senior Vice President on January 1, 2014, responsible for Global Supply Systems, R&D, Global Market Development, Global Operations Excellence, Global Strategic Sales, Global Procurement, Sustainability and Safety, Health and Environment. From 2011to 2013, she served as President of Praxair Asia, responsible for Praxair’s industrial gases business in China, India, South Korea and Thailand as well as the electronics market globally. In 2010, Dr. Roby became President of Praxair Electronics, after having served as Vice President, Global Sales, for Praxair from 2009 to 2010. Prior to this, she was Vice President of the U.S. South Region from 2006 to 2009. Dr. Roby joined Praxair in 1991 as a development associate in the Company’s R&D organization and was promoted to other positions of increasing responsibility.
Scott E. Telesz, 50, was promoted to Executive Vice President from Senior Vice President, effective March 1, 2012. He is responsible for Praxair’s U.S. atmospheric gases businesses, and it’s business in Canada, Praxair Distribution, Praxair Surface Technologies, and Helium-Rare Gases. Before joining Praxair in 2010, he was a Vice President from 2007 to 2010 of SABIC Innovative Plastics, a major division of Riyadh-based Saudi Basic Industries Corporation, a global manufacturer of chemicals, fertilizers, plastics and metals. From 1998 to 2007, he held a variety of general management positions with General Electric, and from 1989 to 1998, Mr. Telesz held several positions, including Engagement Manager, in the United States and Australia, with McKinsey & Company.
Matthew J. White, 45, was appointed Senior Vice President and Chief Financial Officer effective January 1, 2014. Prior to this, Mr. White was President of Praxair Canada from 2011-2014. Mr. White joined Praxair in 2004 as finance director of Praxair’s largest business unit, North American Industrial Gases. In 2008, he became Vice President and Controller of Praxair, then was named Vice President and Treasurer in 2010. Before joining Praxair, Mr. White was vice president, finance, at Fisher Scientific and before that he held various financial positions, including group controller, at GenTek, a manufacturing and performance chemicals company.
6
ITEM 1A. RISK FACTORS
Due to the size and geographic reach of the company’s operations, a wide range of factors, many of which are outside of the company’s control, could materially affect the company’s future operations and financial performance. Management believes the following risks may significantly impact the company:
General Economic Conditions – Weakening economic conditions in markets in which the company does business may adversely impact the company’s financial results and/or cash flows.
Praxair serves a diverse group of industries across more than 50 countries which generally leads to financial stability through various business cycles. However, a broad decline in general economic or business conditions in the industries served by its customers could adversely affect the demand for Praxair’s products and impair the ability of our customers to satisfy their obligations to the company, resulting in uncollected receivables and/or unanticipated contract terminations or project delays. In addition, many of the company’s customers are in businesses that are cyclical in nature, such as the chemicals, electronics, metals and energy industries. Downturns in these industries may adversely impact the company during these cycles. Additionally, such conditions could impact the utilization of the company’s manufacturing capacity which may require the company to recognize impairment losses on tangible assets such as property, plant and equipment as well as intangible assets such as goodwill, customer relationships or intellectual property.
Cost and Availability of Raw Materials and Energy – Increases in the cost of energy and raw materials and/or disruption in the supply of these materials could result in lost sales or reduced profitability.
Energy is the single largest cost item in the production and distribution of industrial gases. Most of Praxair’s energy requirements are in the form of electricity, natural gas and diesel fuel for distribution. Praxair attempts to minimize the financial impact of variability in these costs through the management of customer contracts and reducing demand through operational productivity and energy efficiency. Large customer contracts typically have escalation and pass-through clauses to recover energy and feedstock costs. Such attempts may not successfully mitigate cost variability which could negatively impact its financial condition or results of operations. The supply of energy has not been a significant issue in the geographic areas where it conducts business. However, regional energy conditions are unpredictable and may pose future risk.
For carbon dioxide, carbon monoxide, helium, hydrogen, specialty gases and surface technologies, raw materials are largely purchased from outside sources. Where feasible, Praxair sources several of these raw materials, including carbon dioxide, hydrogen and calcium carbide, as chemical or industrial byproducts. In addition, Praxair has contracts or commitments for, or readily available sources of, most of these raw materials; however, their long-term availability and prices are subject to market conditions. A disruption in supply of such raw materials could impact the company’s ability to meet contractual supply commitments.
International Events and Circumstances – The company’s international operations are subject to the risks of doing business abroad and international events and circumstances may adversely impact its business, financial condition or results of operations.
Praxair has substantial international operations which are subject to risks including devaluations in currency exchange rates, transportation delays and interruptions, political and economic instability and disruptions, restrictions on the transfer of funds, the imposition of duties and tariffs, import and export controls, changes in governmental policies, labor unrest, possible nationalization and/or expropriation of assets, domestic and international tax laws and compliance with governmental regulations. These events could have an adverse effect on international operations in the future by reducing the demand for its products, decreasing the prices at which it can sell its products, reducing the U.S. dollar value of revenue from international operations or otherwise having an adverse effect on its business.
Global Financial Markets Conditions – Macroeconomic factors may impact the company’s ability to obtain financing or increase the cost of obtaining financing which may adversely impact the company’s financial results and/or cash flows.
Volatility and disruption in the U.S. and global credit and equity markets, from time to time, could make it more difficult for Praxair to obtain financing for its operations and/or could increase the cost of obtaining financing. In addition, the company’s borrowing costs can be affected by short and long-term debt ratings assigned by independent rating agencies which are based, in significant part, on the company’s performance as measured by certain criteria such as interest coverage and leverage ratios. A decrease in these debt ratings could increase the cost of borrowing or make it more difficult to obtain financing. While the impact of volatility in the global credit markets cannot be predicted with certainty, the company believes that it has sufficient operating flexibility, cash reserves, and funding sources to maintain adequate amounts of liquidity to meet its business needs around the world.
7
Competitor Actions – The inability to effectively compete could adversely impact results of operations.
Praxair operates within a highly competitive environment worldwide. Competition is based on price, product quality, delivery, reliability, technology and service to customers. Competitors’ behavior related to these areas could potentially have significant impacts on the company’s financial results.
Governmental Regulations – The company is subject to a variety of United States and foreign government regulations. Changes in these regulations could have an adverse impact on the business, financial position and results of operations.
The company is subject to regulations in the following areas, among others:
• | Environmental protection including climate change; |
• | Domestic and international tax laws and currency controls; |
• | Safety; |
• | Securities laws (e.g., SEC and generally accepted accounting principles in the United States); |
• | Trade and import/ export restrictions; |
• | Antitrust matters; |
• | Global anti-bribery laws, including the U.S. Foreign Corrupt Practices Act; |
• | Healthcare regulations |
Changes in these or other regulatory areas may impact the company’s profitability, may require the company to spend additional resources to comply with the regulations, or may restrict the company’s ability to compete effectively in the marketplace. Noncompliance with such laws and regulations could result in penalties or sanctions that could have an adverse impact on the company’s financial results and/or reputation. Environmental protection is discussed further below.
Praxair is subject to various environmental and occupational health and safety laws and regulations, including those governing the discharge of pollutants into the air or water, the storage, handling and disposal of chemicals, hazardous substances and wastes, the remediation of contamination, the regulation of greenhouse gas emissions, and other potential climate change initiatives. Violations of these laws could result in substantial penalties, third party claims for property damage or personal injury, or sanctions. The company may also be subject to liability for the investigation and remediation of environmental contamination at properties that it owns or operates and at other properties where Praxair or its predecessors have operated or arranged for the disposal of hazardous wastes. Although management does not believe that any such liabilities will have a material adverse impact on its financial position and results of operations, management cannot provide assurance that such costs will not increase in the future or will not become material. See the section captioned “Management’s Discussion and Analysis – Environmental Matters” in Item 7 of this Form 10-K.
Catastrophic Events – Catastrophic events could disrupt the operations of the company and/or its customers and suppliers and may have a significant adverse impact on the results of operations.
The occurrence of catastrophic events or natural disasters such as extreme weather, including hurricanes and floods; health epidemics; acts of war or terrorism; could disrupt or delay the company’s ability to produce and distribute its products to customers and could potentially expose the company to third-party liability claims. In addition, such events could impact the company’s customers and suppliers resulting in temporary or long-term outages and/or the limitation of supply of energy and other raw materials used in normal business operations. To mitigate these risks, Praxair evaluates the direct and indirect business risks through business impact analysis and conducts regular reviews of these business risks with management. Subsequently, Praxair establishes policies and sets priorities; consults with vendors, insurance providers and industry experts; and makes investments in facilities with suitably resilient design and technology, in order to reduce such impact to the business. Despite these steps, however, these situations are outside the company’s control and may have a significant adverse impact on the company’s financial results.
Retaining Qualified Personnel – The inability to attract and retain qualified personnel may adversely impact the company’s business.
If Praxair fails to attract, hire and retain qualified personnel, the company may not be able to develop, market or sell its products or successfully manage its business. Praxair is dependent upon its highly skilled, experienced and efficient workforce to be successful. Much of Praxair’s competitive advantage is based on the expertise and experience of its key personnel regarding its marketing, technology, manufacturing and distribution infrastructure, systems and products. The inability to attract and hire qualified individuals or the loss of key employees in very skilled areas could have a negative effect on the company’s financial results.
8
Technological Advances – If the company fails to keep pace with technological advances in the industry or if new technology initiatives do not become commercially accepted, customers may not continue to buy the company’s products and results of operations could be adversely affected.
Praxair’s research and development is directed toward developing new and improved methods for the production and distribution of industrial gases and the development of new markets and applications for the use of these gases. This results in the frequent introduction of new industrial gas applications and the development of new advanced air separation process technologies. The company also conducts research and development for its surface technologies to improve the quality and durability of coatings and the use of specialty powders for new applications and industries. As a result of these efforts, the company develops new and proprietary technologies and employs necessary measures to protect such technologies within the global geographies in which the company operates. These technologies help Praxair to create a competitive advantage and to provide a platform for the company to grow its business. If Praxair’s research and development activities do not keep pace with competitors or if it does not create new technologies that benefit customers, future results of operations could be adversely affected.
Litigation and Governmental Investigations – The outcomes of litigation and governmental investigations may affect the company’s financial results.
Praxair is subject to various lawsuits and governmental investigations arising out of the normal course of business that may result in adverse outcomes. These actions are based upon alleged environmental, tax, antitrust and personal injury claims, among others. Adverse outcomes in some or all of the claims pending may result in significant monetary damages or injunctive relief that could adversely affect its ability to conduct business. While management currently believes that resolving all of these matters, individually or in the aggregate, will not have a material adverse impact on the company’s financial position or liquidity, the litigation and other claims Praxair faces are subject to inherent uncertainties and management’s view of these matters may change in the future. There exists the possibility of a material adverse impact on the company’s results of operations for the period in which the effect of an unfavorable final outcome becomes probable and reasonably estimable.
Tax Liabilities – Potential tax liabilities could adversely impact the company’s financial position and results of operations.
Praxair is subject to income and other taxes in both the United States and numerous foreign jurisdictions. The determination of the company’s worldwide provision for income taxes and other tax liabilities requires judgment and is based on diverse legislative and regulatory structures that exist in the various jurisdictions where the company operates, including the recently enacted U.S. Tax Cuts and Jobs Act. Although management believes its estimates are reasonable, the ultimate tax outcome may differ from the amounts recorded in its financial statements and may materially affect the company’s financial results for the period when such determination is made. See Notes 5 and 17 to the consolidated financial statements of this Form 10-K.
Pension Liabilities – Risks related to our pension benefit plans may adversely impact our results of operations and cash flows.
Pension benefits represent significant financial obligations that will be ultimately settled in the future with employees who meet eligibility requirements. Because of the uncertainties involved in estimating the timing and amount of future payments and asset returns, significant estimates are required to calculate pension expense and liabilities related to the company’s plans. The company utilizes the services of independent actuaries, whose models are used to facilitate these calculations. Several key assumptions are used in the actuarial models to calculate pension expense and liability amounts recorded in the consolidated financial statements. In particular, significant changes in actual investment returns on pension assets, discount rates, or legislative or regulatory changes could impact future results of operations and required pension contributions. For information regarding the potential impacts regarding significant assumptions used to estimate pension expense, including discount rates and the expected long-term rates of return on plan assets, see “Critical Accounting Policies – Pension Benefits” included in “Management’s Discussion and Analysis of Financial Condition and Results of Operations” in Item 7 of this Form 10-K.
Operational Risks – Operational risks may adversely impact the company’s business or results of operations.
Praxair’s operating results are dependent on the continued operation of its production facilities and its ability to meet customer contract requirements and other needs. Insufficient or excess capacity threatens the company’s ability to generate competitive profit margins and may expose the company to liabilities related to contract commitments. Operating results are also dependent on the company’s ability to complete new construction projects on time, on budget and in accordance with performance requirements. Failure to do so may expose the business to loss of revenue, potential litigation and loss of business reputation.
9
Also inherent in the management of the company’s production facilities and delivery systems, including storage, vehicle transportation and pipelines, are operational risks that require continuous training, oversight and control. Material operating failures at production, storage facilities or pipelines, including fire, toxic release and explosions, or the occurrence of vehicle transportation accidents could result in loss of life, damage to the environment, loss of production and/or extensive property damage, all of which may negatively impact the company’s financial results.
Information Technology Systems – The Company may be subject to information technology system ("IT") failures, network disruptions and breaches in data security.
Praxair relies on IT systems and networks for business and operational activities, and also stores and processes sensitive business and proprietary information in these systems and networks. These systems are susceptible to outages due to fire, flood, power loss, telecommunications failures, viruses, break-ins and similar events, or breaches of security. Management has taken steps to address these risks and concerns by implementing advanced security technologies, internal controls, network and data center resiliency and recovery process. Despite these steps, however, operational failures and breaches of security from increasingly sophisticated cyber threats could lead to the loss or disclosure of confidential information, result in regulatory actions and have a material adverse impact on Praxair's operations, reputation and financial results.
Acquisitions and Joint Ventures – The inability to effectively integrate acquisitions or collaborate with joint venture partners could adversely impact the company’s financial position and results of operations.
Praxair has evaluated, and expects to continue to evaluate, a wide array of potential strategic acquisitions and joint ventures. Many of these transactions, if consummated, could be material to its financial condition and results of operations. In addition, the process of integrating an acquired company, business or group of assets may create unforeseen operating difficulties and expenditures. Although historically the company has been successful with its acquisition strategy and execution, the areas where the company may face risks include:
• | The need to implement or remediate controls, procedures and policies appropriate for a larger public company at companies that prior to the acquisition lacked these controls, procedures and policies; |
• | Diversion of management time and focus from operating existing business to acquisition integration challenges; |
• | Cultural challenges associated with integrating employees from the acquired company into the existing organization; |
• | The need to integrate each company’s accounting, management information, human resource and other administrative systems to permit effective management; |
• | Difficulty with the assimilation of acquired operations and products; |
• | Failure to achieve targeted synergies; and |
• | Inability to retain key employees and business relationships of acquired companies. |
Foreign acquisitions and joint ventures involve unique risks in addition to those mentioned above, including those related to integration of operations across different cultures and languages, currency risks and the particular economic, political and regulatory risks associated with specific countries. Also, the anticipated benefit of the company’s acquisitions may not materialize. Future acquisitions or dispositions could result in potentially dilutive issuances of equity securities, the incurrence of debt, contingent liabilities or amortization expenses, or impairments of goodwill, any of which could adversely impact the company’s financial results.
Proposed business combination with Linde - Risks in connection with the proposed business combination may adversely impact Praxair’s business, financial condition and results of operations.
On June 1, 2017, Praxair and Linde AG (Linde) entered into a definitive business combination agreement, as amended, pursuant to which, among other things, Praxair and Linde agreed to combine their respective businesses through an all-stock transaction, and become subsidiaries of a new holding company incorporated in Ireland, Linde plc. The parties currently expect the business combination to be completed in the second half of 2018. The proposed business combination with Linde involves certain risks, which may adversely impact Praxair’s business, financial condition and results of operations, and the combined company may not realize all of the anticipated benefits of the proposed business combination if and when the combination is completed. Risks in connection with the proposed business combination, which may result in significant costs and delays, include:
10
• | the expected timing and likelihood of the receipt and terms and conditions of any required governmental and regulatory approvals of the proposed business combination that could reduce anticipated benefits or cause the parties to abandon the transaction; |
• | the risk that the parties may not be able to satisfy the conditions to closing of the proposed business combination in a timely manner or at all; |
• | the occurrence of any event, change or other circumstances that could give rise to the termination of the business combination agreement; |
• | the ability to successfully complete the proposed business combination, including regulatory or other limitations imposed as a result of the proposed business combination; |
• | the success of the combined company’s business following the proposed business combination, including the ability to successfully integrate the Praxair and Linde businesses; |
• | the risk that events and publicity in connection with the proposed business combination could have adverse effects on the market price of Linde’s or Praxair’s common stock or the ability of Linde and Praxair to retain customers, retain or hire key personnel, maintain relationships with their respective suppliers and customers, and on their operating results and businesses generally; |
• | the risk that the combined company may be unable to achieve expected synergies or that it may take longer or be more costly than expected to achieve those synergies. |
11
ITEM 1B. UNRESOLVED STAFF COMMENTS
Praxair has received no written SEC staff comments regarding any of its Exchange Act reports which remain unresolved.
ITEM 2. PROPERTIES
Praxair’s worldwide headquarters are located in owned office space in Danbury, Connecticut. Other principal administrative offices are owned in Tonawanda, New York, and leased in Rio de Janeiro, Brazil; Shanghai, China and Madrid, Spain.
Praxair designs, engineers, manufactures and operates facilities that produce and distribute industrial gases. These industrial gas production facilities and certain components are designed and/or manufactured at its facilities in Tonawanda, New York; Houston, Texas; Rio de Janeiro, Brazil; and Shanghai, China. Praxair’s Italian equity affiliate, S.I.A.D., also has such capacity.
Due to the nature of Praxair’s industrial gas products, it is generally uneconomical to transport them distances greater than a few hundred miles from the production facility. As a result, Praxair operates a significant number of production facilities spread globally throughout a number of geographic regions.
The following is a description of production facilities for Praxair by segment. No significant portion of these assets was leased at December 31, 2017. Generally, these facilities are fully utilized and are sufficient to meet our manufacturing needs.
North America
The North America segment operates production facilities in the U.S., Canada and Mexico, approximately 260 of which are cryogenic air separation plants, hydrogen plants and carbon dioxide plants. There are five major pipeline complexes in North America located in Northern Indiana, Houston, along the Gulf Coast of Texas, Detroit and Louisiana. Also located throughout North America are noncryogenic air separation plants, packaged gas facilities, specialty gas plants, helium plants and other smaller plant facilities.
Europe
The Europe segment has production facilities primarily in Italy, Spain, Germany, the Benelux region, the United Kingdom, Scandinavia and Russia which include approximately 70 cryogenic air separation plants and carbon dioxide plants. There are three major pipeline complexes in Europe located in Northern Spain and the Rhine and Saar regions of Germany. These pipeline complexes are primarily supplied by cryogenic air separation plants. Also located throughout Europe are noncryogenic air separation plants, packaged gas facilities and other smaller plant facilities.
South America
The South America segment operates more than 60 cryogenic air separation plants and carbon dioxide plants, primarily located in Brazil. Many of these plants support a major pipeline complex in Southern Brazil. Also located throughout South America are packaged gas facilities and other smaller plant facilities.
Asia
The Asia segment has production facilities located primarily in China, Korea, India and Thailand, approximately 70 of which are cryogenic air separation plants and carbon dioxide plants. Also located throughout Asia are noncryogenic air separation plants, hydrogen, packaged gas and other production facilities.
Surface Technologies
The Surface Technologies segment provides coating services and manufactures coating equipment at approximately 45 sites. The majority of these sites are located in the United States and Europe, with smaller operations in Asia and Brazil.
ITEM 3. LEGAL PROCEEDINGS
Information required by this item is incorporated herein by reference to the section captioned “Notes to Consolidated Financial Statements – 17 Commitments and Contingencies” in Item 8 of this 10-K.
ITEM 4. MINE SAFETY DISCLOSURES
Not Applicable
12
PART II
ITEM 5. | MARKET FOR REGISTRANT’S COMMON EQUITY, RELATED STOCKHOLDER MATTERS AND ISSUER PURCHASES OF EQUITY SECURITIES |
The principal market for the company’s common stock (ticker symbol: PX) is the New York Stock Exchange ("NYSE"). At December 31, 2017 there were 11,128 shareholders of record.
NYSE quarterly stock price and dividend information
Market Price | Trading High | Trading Low | Close | Dividend Per Share | |||||||||||
2017 | |||||||||||||||
First Quarter | $ | 121.00 | $ | 115.00 | $ | 118.60 | $ | 0.7875 | |||||||
Second Quarter | $ | 138.69 | $ | 117.11 | $ | 132.55 | $ | 0.7875 | |||||||
Third Quarter | $ | 141.88 | $ | 127.36 | $ | 139.74 | $ | 0.7875 | |||||||
Fourth Quarter | $ | 156.40 | $ | 139.24 | $ | 154.68 | $ | 0.7875 | |||||||
2016 | |||||||||||||||
First Quarter | $ | 115.32 | $ | 95.60 | $ | 114.45 | $ | 0.75 | |||||||
Second Quarter | $ | 120.04 | $ | 106.31 | $ | 112.39 | $ | 0.75 | |||||||
Third Quarter | $ | 125.00 | $ | 110.12 | $ | 120.83 | $ | 0.75 | |||||||
Fourth Quarter | $ | 124.48 | $ | 114.43 | $ | 117.19 | $ | 0.75 | |||||||
Praxair’s annual dividend on its common stock for 2017 was $3.15 per share. On January 25, 2018, Praxair’s Board of Directors declared a dividend of $0.825 per share for the first quarter of 2018, or $3.30 per share annualized, which may be changed as Praxair’s earnings and business prospects warrant. The declaration of dividends is a business decision made by the Board of Directors based on Praxair’s earnings and financial condition and other factors the Board of Directors considers relevant.
Purchases of Equity Securities – Certain information regarding purchases made by or on behalf of the company or any affiliated purchaser (as defined in Rule 10b-18(a)(3) under the Securities Exchange Act of 1934, as amended) of its common stock during the three months ended December 31, 2017 is provided below:
Period | Total Number of Shares Purchased (Thousands) | Average Price Paid Per Share | Total Number of Shares Purchased as Part of Publicly Announced Program (1) (Thousands) | Approximate Dollar Value of Shares that May Yet be Purchased Under the Program (2) (Millions) | |||||||||
October 2017 | — | $ | — | — | $ | 1,581 | |||||||
November 2017 | — | $ | — | — | $ | 1,581 | |||||||
December 2017 | 9 | $ | 152.18 | 9 | $ | 1,580 | |||||||
Fourth Quarter 2017 | 9 | 9 | $ | 1,580 | |||||||||
________________________
(1) | On January 28, 2014, the Company’s board of directors approved the repurchase of $1.5 billion of its common stock ("2014 program") which could take place from time to time on the open market (which could include the use of 10b5-1 trading plans) or through negotiated transactions, subject to market and business conditions. |
(2) | As of December 31, 2017, the Company had purchased $1,420 million of its common stock pursuant to the 2014 program, leaving an additional $80 million remaining authorized under the 2014 program. The 2014 program does not have any stated expiration date. In addition, on July 28, 2015, the Company's board of directors approved the repurchase of $1.5 billion of its common stock ("2015 program") which could take place from time to time on the open market (which could include the use of 10b5-1 trade plans) or through negotiated transactions, subject to market and business conditions. The 2015 program does not have any stated expiration date. The 2015 program is in addition to the 2014 program. |
13
Peer Performance Table – The graph below compares the most recent five-year cumulative returns of Praxair’s common stock with those of the Standard & Poor’s 500 Index ("SPX") and the S5 Materials Index ("S5MATR") which covers 30 companies, including Praxair. The figures assume an initial investment of $100 on December 31, 2012 and that all dividends have been reinvested.
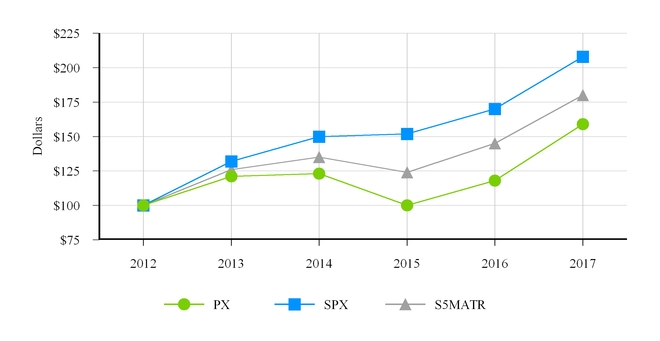
2012 | 2013 | 2014 | 2015 | 2016 | 2017 | |
PX | $100 | $121 | $123 | $100 | $118 | $159 |
SPX | $100 | $132 | $150 | $152 | $170 | $208 |
S5MATR | $100 | $126 | $135 | $124 | $145 | $180 |
14
ITEM 6. SELECTED FINANCIAL DATA
FIVE-YEAR FINANCIAL SUMMARY
(Dollar amounts in millions, except per share data)
Year Ended December 31, | 2017(a) | 2016(a) | 2015(a) | 2014(a) | 2013(a) | |||||||||||||||
From the Consolidated Statements of Income | ||||||||||||||||||||
Sales | $ | 11,437 | $ | 10,534 | $ | 10,776 | $ | 12,273 | $ | 11,925 | ||||||||||
Cost of sales, exclusive of depreciation and amortization | 6,455 | 5,860 | 5,960 | 6,962 | 6,744 | |||||||||||||||
Selling, general and administrative | 1,207 | 1,145 | 1,152 | 1,308 | 1,349 | |||||||||||||||
Depreciation and amortization | 1,184 | 1,122 | 1,106 | 1,170 | 1,109 | |||||||||||||||
Research and development | 93 | 92 | 93 | 96 | 98 | |||||||||||||||
Transaction costs and other charges | 54 | 100 | 172 | 138 | 32 | |||||||||||||||
Other income (expenses) – net | 4 | 23 | 28 | 9 | 32 | |||||||||||||||
Operating profit | 2,448 | 2,238 | 2,321 | 2,608 | 2,625 | |||||||||||||||
Interest expense – net | 161 | 190 | 161 | 213 | 178 | |||||||||||||||
Income before income taxes and equity investments | 2,287 | 2,048 | 2,160 | 2,395 | 2,447 | |||||||||||||||
Income taxes | 1,026 | 551 | 612 | 691 | 649 | |||||||||||||||
Income before equity investments | 1,261 | 1,497 | 1,548 | 1,704 | 1,798 | |||||||||||||||
Income from equity investments | 47 | 41 | 43 | 42 | 38 | |||||||||||||||
Net income (including noncontrolling interests) | 1,308 | 1,538 | 1,591 | 1,746 | 1,836 | |||||||||||||||
Noncontrolling interests | (61 | ) | (38 | ) | (44 | ) | (52 | ) | (81 | ) | ||||||||||
Net income – Praxair, Inc. | $ | 1,247 | $ | 1,500 | $ | 1,547 | $ | 1,694 | $ | 1,755 | ||||||||||
Per Share Data – Praxair, Inc. Shareholders | ||||||||||||||||||||
Basic earnings per share | $ | 4.36 | $ | 5.25 | $ | 5.39 | $ | 5.79 | $ | 5.94 | ||||||||||
Diluted earnings per share | $ | 4.32 | $ | 5.21 | $ | 5.35 | $ | 5.73 | $ | 5.87 | ||||||||||
Cash dividends per share | $ | 3.15 | $ | 3.00 | $ | 2.86 | $ | 2.60 | $ | 2.40 | ||||||||||
Weighted Average Shares Outstanding (000’s) | ||||||||||||||||||||
Basic shares outstanding | 286,261 | 285,677 | 287,005 | 292,494 | 295,523 | |||||||||||||||
Diluted shares outstanding | 289,114 | 287,757 | 289,055 | 295,608 | 298,965 | |||||||||||||||
Other Information and Ratios | ||||||||||||||||||||
Total assets | $ | 20,436 | $ | 19,332 | $ | 18,319 | $ | 19,769 | $ | 20,223 | ||||||||||
Total debt | $ | 9,000 | $ | 9,515 | 8,991 | $ | 9,231 | $ | 9,225 | $ | 8,779 | |||||||||
Net debt (b) | $ | 8,383 | $ | 8,991 | $ | 9,084 | $ | 9,099 | $ | 8,641 | ||||||||||
Cash flow from operations | $ | 3,041 | $ | 2,773 | $ | 2,695 | $ | 2,887 | $ | 2,936 | ||||||||||
Net cash used for investing activities | $ | (1,314 | ) | $ | (1,770 | ) | $ | (1,303 | ) | $ | (1,803 | ) | $ | (3,237 | ) | |||||
Net cash used for financing activities | $ | (1,656 | ) | $ | (643 | ) | $ | (1,310 | ) | $ | (1,027 | ) | $ | 309 | ||||||
EBITDA (b) | $ | 3,679 | $ | 3,401 | $ | 3,470 | $ | 3,820 | $ | 3,772 | ||||||||||
Adjusted EBITDA (b) | $ | 3,733 | $ | 3,501 | $ | 3,642 | $ | 3,958 | $ | 3,804 | ||||||||||
Capital expenditures | $ | 1,311 | $ | 1,465 | $ | 1,541 | $ | 1,689 | $ | 2,020 | ||||||||||
Acquisitions, net of cash acquired | $ | 33 | $ | 363 | $ | 82 | $ | 206 | $ | 1,323 | ||||||||||
Debt-to-capital ratio (b) | 56.2 | % | 62.3 | % | 64.9 | % | 59.5 | % | 54.2 | % | ||||||||||
Shares outstanding (000’s) | 286,777 | 284,901 | 284,879 | 289,262 | 294,134 | |||||||||||||||
Number of employees | 26,461 | 26,498 | 26,657 | 27,780 | 27,560 | |||||||||||||||
________________________
(a) | Amounts for 2017 include: (i) charges of $52 million ($48 million after-tax, or $0.17 per diluted share) for transaction costs related to the potential Linde merger, (ii) a pension settlement charge of $2 million ($1 million after-tax) related to lump sum benefit payments made from an international pension plan, and (iii) income tax charges, net of $394 million ($1.36 per diluted share) due to U.S. Tax Cuts and Jobs Act. |
Amounts for 2016 include: (i) a $16 million charge to interest expense ($10 million after–tax, or $0.04 per diluted share) related to the redemption of the $325 million 5.20% notes due 2017, (ii) a pre–tax pension settlement charge of $4 million ($3 million after–tax, or $0.01 per diluted share) related to lump sum benefit payments made from the U.S. supplemental pension plan, and (iii) pre–tax charges of $96 million ($63 million after–tax and non–controlling interests, or $0.22 per diluted share) primarily related to cost reduction actions.
15
Amounts for 2015 include: (i) a pre-tax charge of $165 million ($125 million after-tax, or $0.43 per diluted share) related to the cost reduction program and other charges; and (ii) a pre-tax charge of $7 million ($5 million after-tax, or $0.02 per diluted share) related to a pension settlement.
Amounts for 2014 include: (i) a pre-tax charge of $131 million ($131 million after-tax, or $0.45 per diluted share) related to the Venezuela currency devaluation, (ii) a pre-tax charge of $7 million ($5 million after-tax, or $0.02 per diluted share) related to pension settlements; and (iii) a pre-tax charge of $36 million ($22 million after-tax, or $0.07 per diluted share) related to a bond redemption.
Amounts for 2013 include: (i) a pre-tax charge of $23 million ($23 million after-tax, or $0.08 per diluted share) related to the Venezuela currency devaluation; (ii) a pre-tax charge of $9 million ($6 million after-tax, or $0.02 per diluted share) related to pension settlements; (iii) an income tax benefit of $40 million ($24 million net of noncontrolling interests, or $0.08 per diluted share) related to a realignment of the Italian legal structure; and (iv) a pre-tax charge of $18 million ($12 million after-tax, or $0.04 per diluted share) related to a bond redemption.
See Notes 2, 5, 11 and 16 to the consolidated financial statements.
(b) Non-GAAP measures. See the “Non-GAAP Financial Measures” section in Item 7 for definitions and reconciliation to reported amounts.
16
ITEM 7. MANAGEMENT’S DISCUSSION AND ANALYSIS OF FINANCIAL CONDITION AND RESULTS OF OPERATIONS
The following discussion of the company’s financial condition and results of operations should be read together with its consolidated financial statements and notes to the consolidated financial statements included in Item 8 of this Form 10-K.
Page | |
Business Overview | |
Executive Summary – Financial Results & Outlook | |
Consolidated Results and Other Information | |
Segment Discussion | |
Liquidity, Capital Resources and Other Financial Data | |
Contractual Obligations | |
Off-Balance Sheet Arrangements | |
Critical Accounting Policies | |
New Accounting Standards | |
Fair Value Measurements | |
Non-GAAP Financial Measures | |
Forward-Looking Statements | |
BUSINESS OVERVIEW
Praxair is a leading industrial gas company in North and South America and one of the largest worldwide. The Company's primary products in its industrial gases business are atmospheric gases (oxygen, nitrogen, argon, rare gases) and process gases (carbon dioxide, helium, hydrogen, electronic gases, specialty gases, acetylene). The company also designs, engineers, and builds equipment that produces industrial gases primarily for internal use. The company’s surface technologies segment supplies wear-resistant and high-temperature corrosion-resistant metallic and ceramic coatings and powders. Praxair Surface Technologies supplies high-performance coatings that protect metal parts from wear, corrosion and high heat. Praxair’s industrial gas operations are managed on a geographical basis and in 2017, 95% of sales were generated in four geographic segments (North America, Europe, South America, and Asia). The surface technologies segment generated the remaining 5% of sales.
Praxair serves a diverse group of industries including healthcare, petroleum refining, manufacturing, food, beverage carbonation, fiber-optics, steel making, aerospace, chemicals and water treatment. The diversity of end-markets creates financial stability for Praxair in varied business cycles.
Praxair generates most of its revenues and earnings in the following 12 core geographies where the company has its strongest market positions and where distribution and production operations allow the company to deliver the highest level of service to its customers at the lowest cost.
North America | South America | Europe | Asia | |||
United States | Brazil | Spain | China | |||
Canada | Italy | India | ||||
Mexico | Germany/Benelux | Korea | ||||
Scandinavia | Thailand | |||||
Praxair manufactures and distributes its products through networks of hundreds of production plants, pipeline complexes, distribution centers and delivery vehicles. Major pipeline complexes are located in the United States, Brazil, Spain and Germany. These networks are a competitive advantage, providing the foundation of reliable product supply to the company’s customer base. The majority of Praxair’s business is conducted through long-term contracts which provide stability in cash flow and the ability to pass through changes in energy and feedstock costs to customers. The company has growth opportunities in all major geographies and in diverse end-markets such as energy, chemicals, metals, healthcare, food and beverage, and aerospace.
17
EXECUTIVE SUMMARY – FINANCIAL RESULTS & OUTLOOK
2017 Year in review
Praxair delivered solid results for the full year of 2017 with growth across all end-markets. Sales growth was largely driven by higher volumes and positive price. Improved macro economic conditions and new project start-ups contributed to growth in North America, Europe and Asia while South America volumes remained stable. Operating cash flow was 10% higher than 2016, largely driven by higher net income.
• | Sales of $11,437 million were 9% above 2016 sales of $10,534 million. Excluding favorable currency impacts and higher cost pass-through, sales were 6% above the prior year due to volume growth in North America, Europe and Asia, including new project start-ups and higher price. |
• | Reported operating profit of $2,448 million was 9% above 2016. Adjusted operating profit of $2,502 million was 7% above adjusted operating profit in 2016. Benefits from higher volumes and price were partially offset by cost inflation.* |
• | Fourth-quarter 2017 provisional net income tax charge of $394 million related to the U.S. Tax Cuts and Jobs Act (Tax Act). Adjustments to the charge will be made as new information becomes available. |
• | Reported net income – Praxair, Inc. of $1,247 million and diluted earnings per share of $4.32 decreased from $1,500 million and $5.21, respectively in 2016. Adjusted net income – Praxair, Inc. of $1,690 million and adjusted diluted earnings per share of $5.85 were both 7% above 2016 adjusted amounts.* |
• | Cash flow from operations was a strong $3,041 million, 27% of sales. Capital expenditures were $1,311 million; dividends paid were $901 million; and net debt repayments were $771 million. |
• | Continued progress on the merger with Linde AG. |
◦ | Required Praxair and Linde AG shareholder approvals obtained. |
◦ | Regulatory filings progressing as planned and divestiture process on track. |
◦ | Merger expected to close second-half 2018. |
* A reconciliation of the Adjusted amounts can be found in the "Non-GAAP Financial Measures" section in this MD&A. See Notes 2, 5, 11 and 16 to the consolidated financial statements.
First-Quarter 2018 Outlook
• | Diluted earnings per share are forecasted to be in the range of $1.53 to $1.58. Guidance includes an estimated $0.05 benefit related to the Tax Act and does not include transaction costs related to the potential Linde merger. |
• | Effective tax rate in the range of 23% to 25%. |
• | The company’s core business is to build, own, and operate industrial gas plants in order to supply atmospheric and process gases to customers. As such, Praxair believes that its project backlog is one indicator of future sales growth. At December 31, 2017, Praxair’s backlog of 17 large projects under construction was $1.5 billion. This represents the total estimated capital cost of large plants under construction. North America represents about 80 percent of the backlog, with the majority located in the U.S. Gulf Coast. The remaining backlog resides in Asia and South America. These plants will supply customers in the energy, chemical, manufacturing, electronics and metals markets. |
The above guidance should be read in conjunction with the section entitled “Forward-Looking Statements.”
Praxair provides quarterly updates on operating results, material trends that may affect financial performance, and financial earnings guidance via earnings releases and investor teleconferences. These materials are available on the company’s website, www.praxair.com/investors but are not incorporated herein.
18
CONSOLIDATED RESULTS AND OTHER INFORMATION
The following table provides selected data for 2017, 2016, and 2015:
Variance | |||||||||||||||||
(Dollar amounts in millions, except per share data) Year Ended December 31, | 2017 | 2016 | 2015 | 2017 vs. 2016 | 2016 vs. 2015 | ||||||||||||
Reported Amounts | |||||||||||||||||
Sales | $ | 11,437 | $ | 10,534 | $ | 10,776 | 9 | % | (2 | )% | |||||||
Cost of sales, exclusive of depreciation and amortization | $ | 6,455 | $ | 5,860 | $ | 5,960 | 10 | % | (2 | )% | |||||||
Gross margin (a) | $ | 4,982 | $ | 4,674 | $ | 4,816 | 7 | % | (3 | )% | |||||||
As a percent of sales | 43.6 | % | 44.4 | % | 44.7 | % | |||||||||||
Selling, general and administrative | $ | 1,207 | $ | 1,145 | $ | 1,152 | 5 | % | (1 | )% | |||||||
As a percent of sales | 10.6 | % | 10.9 | % | 10.7 | % | |||||||||||
Depreciation and amortization | $ | 1,184 | $ | 1,122 | $ | 1,106 | 6 | % | 1 | % | |||||||
Transaction costs and other charges (b) | $ | 54 | $ | 100 | $ | 172 | |||||||||||
Other income (expense) – net | $ | 4 | $ | 23 | $ | 28 | |||||||||||
Operating profit | $ | 2,448 | $ | 2,238 | $ | 2,321 | 9 | % | (4 | )% | |||||||
Operating margin | 21.4 | % | 21.2 | % | 21.5 | % | |||||||||||
Interest expense – net | $ | 161 | $ | 190 | $ | 161 | (15 | )% | 18 | % | |||||||
Effective tax rate | 44.9 | % | 26.9 | % | 28.3 | % | |||||||||||
Income from equity investments | $ | 47 | $ | 41 | $ | 43 | 15 | % | (5 | )% | |||||||
Noncontrolling interests | $ | (61 | ) | $ | (38 | ) | $ | (44 | ) | 61 | % | (14 | )% | ||||
Net income – Praxair, Inc. | $ | 1,247 | $ | 1,500 | $ | 1,547 | (17 | )% | (3 | )% | |||||||
Diluted earnings per share | $ | 4.32 | $ | 5.21 | $ | 5.35 | (17 | )% | (3 | )% | |||||||
Diluted shares outstanding | 289,114 | 287,757 | 289,055 | — | % | — | % | ||||||||||
Number of employees | 26,461 | 26,498 | 26,657 | ||||||||||||||
Adjusted Amounts (c) | |||||||||||||||||
Operating profit | $ | 2,502 | $ | 2,338 | $ | 2,493 | 7 | % | (6 | )% | |||||||
Operating margin | 21.9 | % | 22.2 | % | 23.1 | % | |||||||||||
Interest expense – net | $ | 161 | $ | 174 | $ | 161 | (7 | )% | 8 | % | |||||||
Effective tax rate | 27.2 | % | 27.1 | % | 28.0 | % | |||||||||||
Noncontrolling interests | $ | (61 | ) | $ | (43 | ) | $ | (45 | ) | 42 | % | (4 | )% | ||||
Net income – Praxair, Inc. | $ | 1,690 | $ | 1,576 | $ | 1,677 | 7 | % | (6 | )% | |||||||
Diluted earnings per share | $ | 5.85 | $ | 5.48 | $ | 5.80 | 7 | % | (6 | )% | |||||||
Other Financial Data (c) | |||||||||||||||||
EBITDA | $ | 3,679 | $ | 3,401 | $ | 3,470 | 8 | % | (2 | )% | |||||||
EBITDA Margin | 32.2 | % | 32.3 | % | 32.2 | % | — | % | — | % | |||||||
Adjusted EBITDA | $ | 3,733 | $ | 3,501 | $ | 3,642 | 7 | % | (4 | )% | |||||||
Adjusted EBITDA Margin | 32.6 | % | 33.2 | % | 33.8 | % | (2 | )% | (2 | )% | |||||||
________________________
(a) | Gross margin excludes depreciation and amortization expense. |
(b) | See Note 2 to the consolidated financial statements. |
(c) | Adjusted amounts are non-GAAP measures. A reconciliation of reported amounts to adjusted amounts can be found in the “Non-GAAP Financial Measures” section of this MD&A. See Notes 2, 5, 11 and 16 to the consolidated financial statements. |
19
Results of Operations
The following table provides a summary of changes in consolidated sales and adjusted operating profit:
2017 vs. 2016 | 2016 vs. 2015 | |||||||||||
% Change | % Change | |||||||||||
Sales | Operating Profit | Sales | Operating Profit | |||||||||
Factors Contributing to Changes | ||||||||||||
Volume | 5 | % | 8 | % | — | % | (5 | )% | ||||
Price/Mix | 1 | % | 5 | % | 1 | % | 3 | % | ||||
Cost pass-through | 2 | % | — | % | (1 | )% | — | % | ||||
Currency | 1 | % | 1 | % | (3 | )% | (3 | )% | ||||
Acquisitions/Divestitures | — | % | — | % | 1 | % | — | % | ||||
Other | — | % | (5 | )% | — | % | 1 | % | ||||
Reported | 9 | % | 9 | % | (2 | )% | (4 | )% | ||||
Less: Transaction costs and other charges | — | % | (2 | )% | — | % | (2 | )% | ||||
Adjusted | 9 | % | 7 | % | (2 | )% | (6 | )% | ||||
The following tables provide consolidated sales by end-market and distribution method:
% of Sales | % Change* | ||||||||||||||
2017 | 2016 | 2015 | 2017 vs. 2016 | 2016 vs. 2015 | |||||||||||
Sales by End-Markets | |||||||||||||||
Manufacturing | 22 | % | 23 | % | 24 | % | 4 | % | (5 | )% | |||||
Metals | 17 | % | 17 | % | 17 | % | 7 | % | 4 | % | |||||
Energy | 12 | % | 12 | % | 13 | % | 5 | % | (6 | )% | |||||
Chemicals | 10 | % | 10 | % | 10 | % | 9 | % | — | % | |||||
Electronics | 9 | % | 8 | % | 8 | % | 13 | % | 2 | % | |||||
Healthcare | 8 | % | 8 | % | 8 | % | 4 | % | 6 | % | |||||
Food & Beverage | 9 | % | 9 | % | 9 | % | 5 | % | 7 | % | |||||
Aerospace | 3 | % | 3 | % | 3 | % | 11 | % | 2 | % | |||||
Other | 10 | % | 10 | % | 8 | % | 3 | % | 1 | % | |||||
100 | % | 100 | % | 100 | % | ||||||||||
* Excludes impact of currency, natural gas/precious metals cost pass-through and acquisitions/divestitures.
% of Sales | |||||||||
2017 | 2016 | 2015 | |||||||
Sales by Distribution Method | |||||||||
On-Site | 30 | % | 29 | % | 29 | % | |||
Merchant | 34 | % | 35 | % | 34 | % | |||
Packaged Gas | 27 | % | 28 | % | 28 | % | |||
Other | 9 | % | 8 | % | 9 | % | |||
100 | % | 100 | % | 100 | % | ||||
20
2017 Compared With 2016
Sales increased 9% to $11,437 million in 2017 compared to $10,534 million in 2016. Excluding favorable currency translation of 1% and higher cost pass-through, primarily natural gas, which increased sales by 2%, sales growth was 6%. Volume growth of 5% was driven by higher volumes in North America, Europe and Asia, including new project start-ups, and growth in all end-markets. Higher price increased sales by 1%.
Gross margin increased $308 million, or 7%, versus 2016 primarily due to higher sales. Gross margin as a percentage of sales declined to 43.6% in 2017 from 44.4% in 2016 largely driven by the contractual pass-through of higher natural gas costs to customers.
Selling, general and administrative ("SG&A") expenses increased $62 million or 5% in 2017 to $1,207 million, and decreased to 10.6% of sales versus 10.9% of sales for 2016. Currency impacts increased SG&A by $14 million. Excluding currency impacts, SG&A increased $48 million driven by higher incentive compensation, acquisitions and cost inflation partially offset by cost reduction actions.
Depreciation and amortization expense increased $62 million versus 2016. Currency impacts increased depreciation and amortization expense by $15 million. Excluding currency impacts, depreciation and amortization expense increased $47 million, or 4%, primarily due to large project start ups and acquisitions.
During the year ended December 31, 2017, Praxair recorded transaction costs and other charges of $54 million primarily related to the potential merger. During the year ended December 31, 2016, Praxair recorded charges of $100 million related primarily to a cost reduction program. (Refer to Note 2 to the consolidated financial statements.)
Other income (expenses) – net in 2017 was a $4 million benefit versus a $23 million benefit in 2016 (see Note 7 to the consolidated financial statements for a summary of major components). Other income in 2016 is largely related to net gains on asset sales.
Reported operating profit of $2,448 million in 2017 was $210 million, or 9% higher than reported operating profit of $2,238 million in 2016. 2017 included transaction costs of $52 million and a $2 million charge related to a pension settlement. 2016 included charges of $96 million related to cost reduction actions and other charges and a $4 million charge related to a pension settlement. Refer to Note 2 of the consolidated financial statements for a further discussion of these items. Excluding the impact of these items, adjusted operating profit of $2,502 million in 2017 was $164 million, or 7% higher than adjusted operating profit of $2,338 million in 2016 driven by higher volumes and price. A discussion of operating profit by segment is included in the segment discussion that follows.
Reported interest expense – net in 2017 decreased $29 million, or 15%, versus 2016. 2016 included charges of $16 million relating to the early redemption of notes (see Note 11 to the consolidated financial statements). Excluding this charge, adjusted interest expense decreased $13 million, or 7%, largely attributable to overall lower net debt. See Note 7 to the consolidated financial statements for further information relating to interest expense.
The reported effective tax rate ("ETR") for 2017 was 44.9% versus 26.9% in 2016. The ETR for the 2017 period included a net $394 million tax charge related to the Tax Act and a $5 million tax benefit related to transaction costs and a pension settlement (see Note 5 and Note 2 to the consolidated financial statements). The ETR for the 2016 period includes a $35 million tax benefit related to a pension settlement, bond redemption and cost reduction program and other charges (see Note 2 and Note 11 to the consolidated financial statements). Excluding these impacts, on an adjusted basis the ETR for the 2017 and 2016 periods was relatively flat at 27.2% and 27.1%, respectively.
Praxair’s equity investments are primarily located in the United States, China, Italy, and the Middle East. Equity income increased $6 million in 2017.
At December 31, 2017, reported noncontrolling interests consisted primarily of noncontrolling shareholders’ investments in Asia (primarily in China), Europe (primarily in Italy), and surface technologies. Reported noncontrolling interests increased $23 million to $61 million in 2017 from $38 million in 2016. Reported noncontrolling interests for the year ended December 31, 2016 included a reduction of $5 million related to a cost reduction program. The remaining increase was driven by PG Technologies, LLC ("PGT"), a surface technologies joint venture with GE Aviation formed in the fourth quarter of 2016 (see Note 14 to the consolidated financial statements).
Reported net income - Praxair, Inc. in 2017 was $1,247 million, or $253 million lower than net income - Praxair, Inc. of $1,500 million in 2016. Adjusted net income – Praxair, Inc. of $1,690 million in 2017 was $114 million, or 7% higher than adjusted net income – Praxair, Inc. of $1,576 million in 2016. Adjusted net income - Praxair, Inc. increased primarily due to higher adjusted operating profit and lower adjusted interest expense - net.
21
Reported diluted earnings per share ("EPS") of $4.32 in 2017 decreased $0.89 per diluted share, or 17% from $5.21 in 2016. The decrease included a $1.36 net income tax charge related to the Tax Act and a $0.17 charge related to transaction costs and other charges (see Note 5 and Note 2 to the consolidated financial statements). Adjusted diluted EPS of $5.85 in 2017 increased $0.37 per diluted share, or 7%, from adjusted diluted EPS of $5.48 in 2016. The increase in adjusted diluted EPS was primarily due to higher adjusted net income – Praxair, Inc.
Other comprehensive income for the year ended December 31, 2017 of $536 million includes favorable currency translation adjustments of $525 million and an $11 million favorable impact in the funded status of Praxair's retirement obligations. The favorable translation adjustments reflect the impact of translating local currency foreign subsidiary financial statements into U.S. dollars, and are largely driven by the weakening of the U.S. dollar against the Canadian dollar, Euro, and Korean won. Favorable currency translation adjustments included $232 million in Asia, $153 million in North America and $106 million in Europe partially offset by unfavorable currency translation adjustments of $35 million in South America. The increase in the funded status of retirement obligations was primarily the result of lower current year actuarial losses, as the impact of lower U.S. discount rates was largely offset by a higher actual return on assets. Refer to the Currency section of the MD&A and Notes 7 and 16 to the consolidated financial statements.
The number of employees at December 31, 2017 was 26,461, a decrease of 37 employees from December 31, 2016. This decrease primarily reflects the impact of cost reduction programs implemented during the previous year.
Other Financial Data
EBITDA increased $278 million to $3,679 million in 2017 from $3,401 million in 2016. Adjusted EBITDA increased $232 million to $3,733 million in 2017 from $3,501 million in 2016 driven by higher adjusted net income plus depreciation and amortization versus the prior year.
See the “Non-GAAP Financial Measures” section for definitions and reconciliation of these non-GAAP measures to reported amounts.
2016 Compared With 2015
Sales decreased 2% to $10,534 million in 2016 compared to $10,776 million in 2015. The decrease is primarily due to negative currency translation impacts of 3% and lower cost pass-through which reduced sales by 1%. Excluding these impacts, sales increased 2% compared to prior year. Higher pricing, primarily in North and South America, and acquisitions, largely in Europe, each contributed 1% to sales.
Gross margin decreased $142 million, or 3%, versus 2015 primarily due to lower sales. Gross margin as a percentage of sales declined to 44.4% in 2016 from 44.7% in 2015.
Selling, general and administrative ("SG&A") expenses decreased $7 million or 1% in 2016 to $1,145 million, or 10.9% of sales, versus $1,152 million, or 10.7% of sales, for 2015. Currency impacts decreased SG&A by $31 million. Excluding currency impacts, SG&A increased $24 million driven by acquisitions, cost inflation and higher incentive compensation partially offset by benefits from cost reduction programs.
Depreciation and amortization expense increased $16 million versus 2015. This increase was primarily due to plant start ups and acquisitions partially offset by currency effects.
During the year ended December 31, 2016, Praxair recorded charges of $100 million related primarily to a cost reduction program. This program is expected to result in annualized pre-tax expense reductions and cash flows increases of approximately $45 million. During 2015, Praxair recorded charges of $146 million in the second quarter and $26 million in the third quarter also related primarily to a cost reduction program. The 2015 cost reduction actions are expected to result in annualized pre-tax expense reductions and cash flow increases of approximately $80 million. To date, the expected benefits of the 2015 and 2016 cost reduction programs have met expectations, excluding any currency translation impacts (refer to Note 2 to the consolidated financial statements).
Other income (expenses) – net in 2016 was a $23 million benefit versus a $28 million benefit in 2015 (see Note 7 to the consolidated financial statements for a summary of major components). Other income in 2016 is largely related to net gains on asset sales. Other income in 2015 includes a $28 million gain from the sale of a packaged gas business in the United States.
Reported operating profit of $2,238 million in 2016 was $83 million, or 4% lower than reported operating profit of $2,321 million in 2015. 2016 included charges of $96 million related to cost reduction actions and other charges and a $4 million charge related to a pension settlement. 2015 included a $165 million charge related to cost reduction actions and other charges and a $7 million charge related to a pension settlement. Refer to Note 2 of the consolidated financial
22
statements for a further discussion of these items. Excluding the impact of these items, adjusted operating profit of $2,338 million in 2016 was $155 million, or 6% lower than adjusted operating profit of $2,493 million in 2015. Benefits from project start-ups, acquisitions net of divestitures, higher price, and cost reduction programs were more than offset by the impact of lower base volumes. A discussion of operating profit by segment is included in the segment discussion that follows.
Reported interest expense – net in 2016 increased $29 million, versus 2015. 2016 included charges of $16 million relating to the early redemption of notes (see Note 11 to the consolidated financial statements). Excluding this charge, adjusted interest expense increased $13 million largely attributable to higher average interest rates due primarily to extending debt maturities. See Note 7 to the consolidated financial statements for further information relating to interest expense.
The reported effective tax rate ("ETR") for 2016 was 26.9% versus 28.3% in 2015. The ETR for the 2016 period includes a $35 million tax benefit related to a pension settlement, bond redemption and cost reduction program and other charges. The 2015 period includes a $41 million tax benefit related to a pension settlement and cost reduction program and other charges (see Note 2 to the consolidated financial statements). Excluding these impacts, on an adjusted basis the ETR for the 2016 and 2015 periods was 27.1% and 28.0%, respectively. The decrease in the adjusted ETR is primarily due to a $20 million excess tax benefit on share–based compensation resulting from the adoption of a new accounting standard during 2016 (see Note 1 to the consolidated financial statements).
Praxair’s significant equity investments are in the United States, China, Italy, and the Middle East. Equity income decreased $2 million in 2016.
At December 31, 2016, reported noncontrolling interests consisted primarily of noncontrolling shareholders’ investments in Asia (primarily in China), Europe (primarily in Italy), and surface technologies. Noncontrolling interests decreased $6 million to $38 million in 2016 from $44 million in 2015. This decrease was due primarily to the acquisition of the remaining noncontrolling interests in a Scandinavian joint venture (See Note 14 to the consolidated financial statements) and the divestiture of a packaged gas joint venture in the United States in late 2015.
Reported net income - Praxair, Inc. in 2016 was $1,500 million, or $47 million lower than net income - Praxair, Inc. of $1,547 million in 2015. Adjusted net income – Praxair, Inc. of $1,576 million in 2016 was $101 million, or 6% lower than adjusted net income – Praxair, Inc. of $1,677 million in 2015. Adjusted net income - Praxair, Inc. decreased primarily due to lower adjusted operating profit, including negative foreign currency translation impacts.
Reported diluted earnings per share ("EPS") of $5.21 in 2016 decreased $0.14 per diluted share, or 3% from $5.35 in 2015. The decrease included a $0.01 pension settlement charge, a $0.04 bond redemption charge and a $0.22 charge related to the cost reduction actions. Adjusted diluted EPS of $5.48 in 2016 decreased $0.32 per diluted share, or 6%, from adjusted diluted EPS of $5.80 in 2015. The decrease in adjusted diluted EPS was primarily due to lower adjusted net income – Praxair, Inc.
Other comprehensive loss for the year ended December 31, 2016 of $8 million includes favorable currency translation adjustments of $68 million offset by a $76 million unfavorable impact related to a decline in the funded status of Praxair's retirement obligations. The favorable translation adjustments reflect the impact of translating local currency foreign subsidiary financial statements into U.S. dollars, and are largely driven by the weakening of the U.S. dollar against the Brazilian Real and the Canadian dollar. Favorable currency translation adjustments included $303 million in South America and $22 million in Europe offset by unfavorable currency translation adjustments of $139 million in North America and $98 million in Asia. The decline in the funded status of retirement obligations was primarily the result of unfavorable liability experience in the current year as compared with actuarial gains in the prior year offset by a higher actual return on assets. Refer to the Currency section of the MD&A and Notes 7 and 16 to the consolidated financial statements.
The number of employees at December 31, 2016 was 26,498, a decrease of 159 employees from December 31, 2015. This decrease primarily reflects the impact of cost reduction programs implemented during the current year partially offset by acquisitions.
Other Financial Data
EBITDA decreased $69 million to $3,401 million in 2016 from $3,470 million in 2015. Adjusted EBITDA decreased $141 million to $3,501 million in 2016 from $3,642 million in 2015 while adjusted EBITDA margin decreased to 33.2% in 2016 from 33.8% in 2015. The decrease in adjusted EBITDA is primarily due to lower adjusted net income adjusted for depreciation and amortization versus the prior year.
23
See the “Non-GAAP Financial Measures” section for definitions and reconciliation of these non-GAAP measures to reported amounts.
Related Party Transactions
The company’s related parties are primarily unconsolidated equity affiliates. The company did not engage in any material transactions involving related parties that included terms or other aspects that differ from those which would be negotiated with independent parties.
Environmental Matters
Praxair’s principal operations relate to the production and distribution of atmospheric and other industrial gases, which historically have not had a significant impact on the environment. However, worldwide costs relating to environmental protection may continue to grow due to increasingly stringent laws and regulations, and Praxair's ongoing commitment to rigorous internal standards.
Climate Change
Praxair operates in jurisdictions that have, or are developing, laws and/or regulations to reduce or mitigate the perceived adverse effects of greenhouse gas ("GHG") emissions and faces a highly uncertain regulatory environment in this area. For example, the U.S. Environmental Protection Agency ("EPA") has promulgated rules requiring reporting of GHG emissions, and Praxair and many of its suppliers and customers are subject to these rules. EPA has also promulgated regulations to restrict GHG emissions, including final rules regulating GHG emissions from light-duty vehicles and certain large manufacturing facilities, many of which are Praxair suppliers or customers. In addition to these developments in the United States, GHGs are regulated in the European Union under the Emissions Trading System, which has wide implications for our customers and may impact certain operations of Praxair in Europe. There are also requirements for mandatory reporting in Canada, which apply to certain Praxair operations and will be used in developing cap-and-trade regulations on GHG emissions. These regulations are expected to impact certain Praxair facilities in Canada. Climate change and energy efficiency laws and policies are also being widely introduced in jurisdictions throughout South America, Mexico and parts of Asia. China has announced plans to launch a national carbon emissions trading system, though it does not appear the regulations will have a direct impact on GHG emissions from Praxair facilities. Among other impacts, such regulations are expected to raise the costs of energy, which is a significant cost for Praxair. Nevertheless, Praxair's long-term customer contracts routinely provide rights to recover increased electricity, natural gas, and other costs that are incurred by the company as a result of Climate Change regulation.
Praxair anticipates continued growth in its hydrogen business, as hydrogen is essential to refineries that use it to remove sulfur from transportation fuels in order to meet ambient air quality standards in the United States. Hydrogen production plants and a large number of other manufacturing and electricity-generating plants have been identified under California law as a source of carbon dioxide emissions and these plants are subject to cap-and-trade regulations in that state. Praxair believes it will be able to mitigate the costs of these regulations through the terms of its product supply contracts. However, legislation that limits GHG emissions may impact growth by increasing capital, compliance, operating and maintenance costs and/or decreasing demand.
To manage business risks from current and potential GHG emission regulation, Praxair actively monitors current developments, evaluates the direct and indirect business risks, and takes appropriate actions. Among others, actions include: increasing relevant resources and training; maintaining contingency plans; obtaining advice and counsel from expert vendors, insurance providers and industry experts; incorporating GHG provisions in commercial agreements; and conducting regular reviews of the business risks with management. Although there are considerable uncertainties, Praxair believes that the business risk from potential regulations can be effectively managed through its commercial contracts. Additionally, Praxair does not anticipate any material effects regarding its plant operations or business arising from potential physical risks of climate change.
Praxair continuously seeks opportunities to optimize its own energy use and GHG footprint through rigorous energy efficiency, investment in renewable energy, and purchasing hydrogen as a chemical byproduct where feasible. Praxair maintains related performance improvement targets and reports progress against these targets regularly to business management and annually to Praxair's Board of Directors.
24
At the same time, Praxair may benefit from business opportunities arising from governmental regulation of GHG and other emissions; uncertain costs of energy and certain natural resources; the development of renewable energy alternatives; and new technologies that help extract natural gas, improve air quality, increase energy efficiency and mitigate the impacts of climate change. Praxair continues to develop new applications that can lower emissions, including GHG emissions, in Praxair's processes and help customers lower energy consumption and increase product throughput. Stricter regulation of water quality in emerging economies such as China provide a growing market for a number of gases, e.g., oxygen for wastewater treatment. Increased concern about drought in areas such as California may create a market for carbon dioxide for desalination. Renewable fuel standards in the European Union and U.S. create a market for second-generation biofuels which use industrial gases such as oxygen, carbon dioxide, and hydrogen.
Costs Relating to the Protection of the Environment
Environmental protection costs in 2017 included approximately $11 million in capital expenditures and $26 million of expenses. Praxair anticipates that future annual environmental protection expenditures will be similar to 2017, subject to any significant changes in existing laws and regulations. Based on historical results and current estimates, management does not believe that environmental expenditures will have a material adverse effect on the consolidated financial position, the consolidated results of operations or cash flows in any given year.
Legal Proceedings
See Note 17 to the consolidated financial statements for information concerning legal proceedings.
Retirement Benefits
Pensions
The net periodic benefit cost for the U.S. and International pension plans was $58 million in 2017, $51 million in 2016 and $98 million in 2015. Consolidated net periodic benefit cost included settlement charges of $2 million in 2017, $4 million in 2016 and $7 million in 2015.
The funded status (pension benefit obligation ("PBO") less the fair value of plan assets) for the U.S. plans was a deficit of $560 million as of December 31, 2017 versus a deficit of $559 million at December 31, 2016. Actuarial losses that arose during the current year related to lower U.S. discount rates and were largely offset by favorable asset returns.
Global pension contributions were $19 million in 2017, $11 million in 2016 and $15 million in 2015. At a minimum, Praxair contributes to its pension plans to comply with local regulatory requirements (e.g., ERISA in the United States). Discretionary contributions in excess of the local minimum requirements are made based on many factors, including long-term projections of the plans' funded status, the economic environment, potential risk of overfunding, pension insurance costs and alternative uses of the cash. Changes to these factors can impact the timing of discretionary contributions from year to year. Estimated required contributions for 2018 are currently expected to be in the range of $15 million to $20 million.
Praxair assumes an expected return on plan assets for 2018 in the United States of 8.00%, which is consistent with the long-term expected return on its investment portfolio.
Excluding the impact of any settlements, 2018 consolidated pension expense is expected to be $55 million, largely in line with 2017. Higher expected amortization of actuarial losses is expected to be offset by applying the return on assets assumption to a higher asset base. Service and interest costs are anticipated to remain relatively consistent.
Postretirement Benefits Other Than Pensions ("OPEB")
The net periodic benefit cost for OPEB plans was a $13 million benefit in 2017, a $5 million cost in 2016 and an $8 million cost in 2015. 2017 includes a curtailment gain on a South American OPEB plan of $18 million.
In 2018, consolidated net periodic benefit costs for the OPEB plans is expected to be approximately $4 million.
Refer to the Critical Accounting Policies section and Note 16 to the consolidated financial statements for a more detailed discussion of the company’s retirement benefits, including a description of the various retirement plans and the assumptions used in the calculation of net periodic benefit cost and funded status.
Insurance
Praxair purchases insurance to limit a variety of property and casualty risks, including those related to property, business interruption, third-party liability and workers’ compensation. Currently, the company self-retains the first $5 million per occurrence for workers’ compensation, general and vehicle liability in the United States and retains up to $5
25
million per occurrence at its various properties worldwide. To mitigate its aggregate loss potential above these retentions, the company purchases insurance coverage from highly rated insurance companies. The company does not currently operate or participate in any captive insurance companies or other non-traditional risk transfer alternatives.
At December 31, 2017 and 2016, the company had recorded a total of $35 million and $33 million, respectively, representing an estimate of the retained liability for the ultimate cost of claims incurred and unpaid as of the balance sheet dates. The estimated liability is established using statistical analysis and is based upon historical experience, actuarial assumptions and professional judgment. These estimates are subject to the effects of trends in loss severity and frequency and are subject to a significant degree of inherent variability. If actual claims differ from the company’s estimates, they will be adjusted at that time and financial results could be impacted.
Praxair recognizes estimated insurance proceeds relating to damages at the time of loss only to the extent of incurred losses. Any insurance recoveries for business interruption and for property damages in excess of the net book value of the property are recognized only when realized or pending payments confirmed by its insurance companies.
SEGMENT DISCUSSION
The following summary of sales and operating profit by segment provides a basis for the discussion that follows (for additional information concerning Praxair’s segments, see Note 18 to the consolidated financial statements). Praxair evaluates the performance of its reportable segments based on operating profit, excluding the items not indicative of ongoing business trends (See Note 2 to the consolidated financial statements).
(Dollar amounts in millions) Year Ended December 31, | Variance | ||||||||||||||||
2017 | 2016 | 2015 | 2017 vs. 2016 | 2016 vs. 2015 | |||||||||||||
Sales | |||||||||||||||||
North America | $ | 6,023 | $ | 5,592 | $ | 5,865 | 8 | % | (5 | )% | |||||||
Europe | 1,558 | 1,392 | 1,320 | 12 | % | 5 | % | ||||||||||
South America | 1,501 | 1,399 | 1,431 | 7 | % | (2 | )% | ||||||||||
Asia | 1,738 | 1,555 | 1,551 | 12 | % | — | % | ||||||||||
Surface Technologies | 617 | 596 | 609 | 4 | % | (2 | )% | ||||||||||
$ | 11,437 | $ | 10,534 | $ | 10,776 | 9 | % | (2 | )% | ||||||||
Operating Profit | |||||||||||||||||
North America | $ | 1,517 | $ | 1,430 | $ | 1,558 | 6 | % | (8 | )% | |||||||
Europe | 297 | 273 | 250 | 9 | % | 9 | % | ||||||||||
South America | 250 | 257 | 291 | (3 | )% | (12 | )% | ||||||||||
Asia | 333 | 276 | 289 | 21 | % | (4 | )% | ||||||||||
Surface Technologies | 105 | 102 | 105 | 3 | % | (3 | )% | ||||||||||
Segment operating profit | 2,502 | 2,338 | 2,493 | 7 | % | (6 | )% | ||||||||||
Transaction costs and other charges | (54 | ) | (100 | ) | (172 | ) | |||||||||||
Consolidated operating profit | $ | 2,448 | $ | 2,238 | $ | 2,321 | |||||||||||
26
North America
(Dollar amounts in millions) Year Ended December 31, | Variance | ||||||||||||||||
2017 | 2016 | 2015 | 2017 vs. 2016 | 2016 vs. 2015 | |||||||||||||
Sales | $ | 6,023 | $ | 5,592 | $ | 5,865 | 8 | % | (5 | )% | |||||||
Cost of sales, exclusive of depreciation and amortization | 3,167 | 2,872 | 3,028 | ||||||||||||||
Gross margin | 2,856 | 2,720 | 2,837 | ||||||||||||||
Operating expenses | 708 | 676 | 670 | ||||||||||||||
Depreciation and amortization | 631 | 614 | 609 | ||||||||||||||
Operating profit | $ | 1,517 | $ | 1,430 | $ | 1,558 | 6 | % | (8 | )% | |||||||
Operating margin | 25.2 | % | 25.6 | % | 26.6 | % | |||||||||||
2017 vs. 2016 | 2016 vs. 2015 | |||||||||||
% Change | % Change | |||||||||||
Sales | Operating Profit | Sales | Operating Profit | |||||||||
Factors Contributing to Changes | ||||||||||||
Volume | 4 | % | 8 | % | (3 | )% | (6 | )% | ||||
Price/Mix | 2 | % | 5 | % | 1 | % | 3 | % | ||||
Cost pass-through | 2 | % | — | % | (1 | )% | — | % | ||||
Currency | — | % | — | % | (2 | )% | (2 | )% | ||||
Acquisitions/Divestitures | — | % | — | % | — | % | — | % | ||||
Other | — | % | (7 | )% | — | % | (3 | )% | ||||
8 | % | 6 | % | (5 | )% | (8 | )% | |||||
The following tables provide sales by end-market and distribution method:
% of Sales | % Change* | ||||||||||||||
2017 | 2016 | 2015 | 2017 vs. 2016 | 2016 vs. 2015 | |||||||||||
Sales by End-Markets | |||||||||||||||
Manufacturing | 29 | % | 29 | % | 30 | % | 4 | % | (5 | )% | |||||
Metals | 12 | % | 12 | % | 11 | % | 7 | % | (1 | )% | |||||
Energy | 18 | % | 17 | % | 18 | % | 7 | % | (6 | )% | |||||
Chemicals | 9 | % | 9 | % | 10 | % | 5 | % | (8 | )% | |||||
Electronics | 5 | % | 5 | % | 5 | % | 17 | % | (4 | )% | |||||
Healthcare | 7 | % | 7 | % | 7 | % | 5 | % | 2 | % | |||||
Food & Beverage | 10 | % | 10 | % | 9 | % | 5 | % | 6 | % | |||||
Aerospace | 2 | % | 2 | % | 2 | % | 14 | % | (1 | )% | |||||
Other | 8 | % | 9 | % | 8 | % | 1 | % | 5 | % | |||||
100 | % | 100 | % | 100 | % | ||||||||||
* Excludes impact of currency, natural gas/precious metals cost pass-through and acquisitions/divestitures.
27
% of Sales | |||||||||
2017 | 2016 | 2015 | |||||||
Sales by Distribution Method | |||||||||
On-Site | 30 | % | 28 | % | 28 | % | |||
Merchant | 37 | % | 38 | % | 38 | % | |||
Packaged Gas | 31 | % | 31 | % | 32 | % | |||
Other | 2 | % | 3 | % | 2 | % | |||
100 | % | 100 | % | 100 | % | ||||
The North America segment includes Praxair’s industrial gases operations in the United States, Canada and Mexico.
Sales for 2017 increased $431 million, or 8%, versus 2016. Higher cost pass-through, primarily higher natural gas prices passed through to hydrogen customers, increased sales by 2% with minimal impact on operating profit. Excluding cost pass–through, sales increased 6% primarily due to higher volumes to all end-markets and higher pricing.
Operating profit in 2017 increased $87 million, or 6% from 2016 driven by higher volumes and pricing which were partially offset by hurricane impacts and higher costs, primarily energy and purchased products.
Sales for 2016 decreased $273 million, or 5%, versus 2015. Excluding currency and cost pass–through impacts, sales were 2% below the prior year due to lower volumes, primarily packaged gases, partially offset by higher pricing. By end–market, lower sales primarily to manufacturing and upstream energy customers were partially offset by growth in food and beverage and healthcare.
Operating profit in 2016 decreased $128 million, or 8% from 2015. Currency translation impacts, primarily the devaluation of both the Mexican Peso and the Canadian Dollar against the U.S. Dollar, reduced operating profit by 2%. Excluding currency translation impacts, operating profit decreased 6% driven by lower volumes partially offset by higher pricing. In addition, 2015 included a gain from the sale of a packaged gas business.
Europe
(Dollar amounts in millions) Year Ended December 31, | Variance | ||||||||||||||||
2017 | 2016 | 2015 | 2017 vs. 2016 | 2016 vs. 2015 | |||||||||||||
Sales | $ | 1,558 | $ | 1,392 | $ | 1,320 | 12 | % | 5 | % | |||||||
Cost of sales, exclusive of depreciation and amortization | 893 | 775 | 749 | ||||||||||||||
Gross margin | 665 | 617 | 571 | ||||||||||||||
Operating expenses | 199 | 189 | 176 | ||||||||||||||
Depreciation and amortization | 169 | 155 | 145 | ||||||||||||||
Operating profit | $ | 297 | $ | 273 | $ | 250 | 9 | % | 9 | % | |||||||
Operating margin | 19.1 | % | 19.6 | % | 18.9 | % | |||||||||||
28
2017 vs. 2016 | 2016 vs. 2015 | |||||||||||
% Change | % Change | |||||||||||
Sales | Operating Profit | Sales | Operating Profit | |||||||||
Factors Contributing to Changes | ||||||||||||
Volume | 5 | % | 8 | % | 1 | % | — | % | ||||
Price/Mix | 1 | % | 3 | % | — | % | 1 | % | ||||
Cost pass-through | 1 | % | — | % | — | % | — | % | ||||
Currency | 2 | % | 2 | % | (1 | )% | (1 | )% | ||||
Acquisitions/Divestitures | 3 | % | 2 | % | 5 | % | 3 | % | ||||
Other | — | % | (6 | )% | — | % | 6 | % | ||||
12 | % | 9 | % | 5 | % | 9 | % | |||||
The following tables provide sales by end-market and distribution method:
% of Sales | % Change* | ||||||||||||||
2017 | 2016 | 2015 | 2017 vs. 2016 | 2016 vs. 2015 | |||||||||||
Sales by End-Markets | |||||||||||||||
Manufacturing | 20 | % | 21 | % | 22 | % | 4 | % | (2 | )% | |||||
Metals | 16 | % | 16 | % | 17 | % | 9 | % | — | % | |||||
Energy | 5 | % | 5 | % | 6 | % | 1 | % | (9 | )% | |||||
Chemicals | 12 | % | 14 | % | 14 | % | 7 | % | 1 | % | |||||
Electronics | 7 | % | 7 | % | 7 | % | 7 | % | 6 | % | |||||
Healthcare | 12 | % | 11 | % | 11 | % | 4 | % | 4 | % | |||||
Food & Beverage | 14 | % | 12 | % | 10 | % | 8 | % | 5 | % | |||||
Aerospace | 1 | % | 1 | % | 1 | % | 3 | % | 5 | % | |||||
Other | 13 | % | 13 | % | 12 | % | 8 | % | 6 | % | |||||
100 | % | 100 | % | 100 | % | ||||||||||
* Excludes impact of currency, natural gas/precious metals cost pass-through and acquisitions/divestitures.
% of Sales | |||||||||
2017 | 2016 | 2015 | |||||||
Sales by Distribution Method | |||||||||
On-Site | 18 | % | 19 | % | 20 | % | |||
Merchant | 35 | % | 35 | % | 34 | % | |||
Packaged Gas | 42 | % | 42 | % | 42 | % | |||
Other | 5 | % | 4 | % | 4 | % | |||
100 | % | 100 | % | 100 | % | ||||
Praxair’s European industrial gases business operates in Spain, Ireland, Italy, France, Germany, Russia, the United Kingdom, Scandinavia and the Benelux region.
Sales in 2017 increased $166 million, or 12% from 2016. Higher cost pass-through increased sales by 1% with minimal impact on operating profit. Favorable currency translation increased sales by 2%. Higher overall volumes, including new project start-ups, and higher price increased sales by 5% and 1%, respectively. The acquisition of a carbon dioxide business in the prior year largely serving the food and beverage end-market increased sales by 3%.
Operating profit in 2017 of $297 million increased $24 million, or 9% from 2016 driven by higher volumes and higher price. Favorable currency translation and the acquisition of the carbon dioxide business in the prior year each contributed 2% to operating profit growth.
29
Sales in 2016 increased $72 million, or 5% from 2015 driven primarily by the acquisition of a carbon dioxide business largely serving the food and beverage market. Excluding the impact of acquisitions and unfavorable currency translation impacts, underlying sales increased 1% largely driven by volume growth from new project start–ups. The increase in the percentage of merchant sales year–over–year is primarily due to the acquisition of the carbon dioxide business. Refer to Note 3 to the consolidated financial statements for additional information.
Operating profit in 2016 of $273 million increased 9% from 2015 driven by the acquisition of a carbon dioxide business, higher pricing and cost reduction actions, partially offset by negative currency impacts.
South America
(Dollar amounts in millions) Year Ended December 31, | Variance | ||||||||||||||||
2017 | 2016 | 2015 | 2017 vs. 2016 | 2016 vs. 2015 | |||||||||||||
Sales | $ | 1,501 | $ | 1,399 | $ | 1,431 | 7 | % | (2 | )% | |||||||
Cost of sales, exclusive of depreciation and amortization | 894 | 828 | 809 | ||||||||||||||
Gross margin | 607 | 571 | 622 | ||||||||||||||
Operating expenses | 198 | 181 | 196 | ||||||||||||||
Depreciation and amortization | 159 | 133 | 135 | ||||||||||||||
Operating profit | $ | 250 | $ | 257 | $ | 291 | (3 | )% | (12 | )% | |||||||
Operating margin | 16.7 | % | 18.4 | % | 20.3 | % | |||||||||||
2017 vs. 2016 | 2016 vs. 2015 | |||||||||||
% Change | % Change | |||||||||||
Sales | Operating Profit | Sales | Operating Profit | |||||||||
Factors Contributing to Changes | ||||||||||||
Volume | — | % | (2 | )% | 2 | % | (2 | )% | ||||
Price/Mix | 1 | % | 3 | % | 4 | % | 17 | % | ||||
Cost pass-through | — | % | — | % | — | % | — | % | ||||
Currency | 6 | % | 4 | % | (8 | )% | (9 | )% | ||||
Acquisitions/Divestitures | — | % | — | % | — | % | — | % | ||||
Other | — | % | (8 | )% | — | % | (18 | )% | ||||
7 | % | (3 | )% | (2 | )% | (12 | )% | |||||
30
The following tables provide sales by end-market and distribution method:
% of Sales | % Change* | ||||||||||||||
2017 | 2016 | 2015 | 2017 vs. 2016 | 2016 vs. 2015 | |||||||||||
Sales by End-Markets | |||||||||||||||
Manufacturing | 17 | % | 18 | % | 21 | % | (2 | )% | (10 | )% | |||||
Metals | 31 | % | 31 | % | 28 | % | 1 | % | 14 | % | |||||
Energy | 2 | % | 2 | % | 2 | % | 23 | % | 16 | % | |||||
Chemicals | 10 | % | 9 | % | 9 | % | 8 | % | 1 | % | |||||
Electronics | — | % | — | % | — | % | — | % | — | % | |||||
Healthcare | 19 | % | 19 | % | 18 | % | 3 | % | 13 | % | |||||
Food & Beverage | 13 | % | 13 | % | 13 | % | 2 | % | 12 | % | |||||
Aerospace | — | % | — | % | — | % | — | % | — | % | |||||
Other | 8 | % | 8 | % | 9 | % | (7 | )% | (5 | )% | |||||
100 | % | 100 | % | 100 | % | ||||||||||
* Excludes impact of currency, natural gas/precious metals cost pass-through and acquisitions/divestitures.
% of Sales | |||||||||
2017 | 2016 | 2015 | |||||||
Sales by Distribution Method | |||||||||
On-Site | 33 | % | 31 | % | 28 | % | |||
Merchant | 38 | % | 40 | % | 41 | % | |||
Packaged Gas | 27 | % | 27 | % | 29 | % | |||
Other | 2 | % | 2 | % | 2 | % | |||
100 | % | 100 | % | 100 | % | ||||
Praxair’s South American industrial gases business operates in Brazil, Argentina, Bolivia, Chile, Colombia, Paraguay, Peru, and Uruguay.
Sales in 2017 increased $102 million, or 7%, versus 2016. Favorable currency translation impacts increased sales by 6% primarily due to the strengthening of the Brazilian Real against the U.S. dollar. Excluding currency, sales increased 1% driven by higher price. Volumes were flat as new project contribution was offset by negative underlying base volumes in Brazil due to weak industrial production. Growth in on-site volumes due to new plant start-ups accounted for the increase in on-site sales as a percentage of total segment sales.
Operating profit decreased $7 million or 3% versus 2016. Excluding currency translation, operating profit decreased 7% driven by unfavorable product sales mix and cost inflation which were partially offset by higher price and an OPEB benefit plan curtailment.
Sales in 2016 decreased $32 million, or 2%, versus 2015. Unfavorable currency translation impacts reduced sales by 8% primarily due to the devaluation of the Brazilian Real and Argentine Peso against the U.S. dollar. Excluding currency, sales grew 6% primarily driven by higher overall pricing which increased sales by 4% and a 2% increase due to higher volumes attributable to new plant start–ups for metals customers partially offset by lower sales to the manufacturing end–market due to weak industrial production.
Operating profit decreased $34 million or 12% versus 2015. Excluding negative currency effects which reduced operating profit by 9%, operating profit decreased 3% as higher pricing was more than offset by higher costs, including inflation.
31
Asia
(Dollar amounts in millions) Year Ended December 31, | Variance | ||||||||||||||||
2017 | 2016 | 2015 | 2017 vs. 2016 | 2016 vs. 2015 | |||||||||||||
Sales | $ | 1,738 | $ | 1,555 | $ | 1,551 | 12 | % | — | % | |||||||
Cost of sales, exclusive of depreciation and amortization | 1,098 | 998 | 977 | ||||||||||||||
Gross margin | 640 | 557 | 574 | ||||||||||||||
Operating expenses | 122 | 102 | 109 | ||||||||||||||
Depreciation and amortization | 185 | 179 | 176 | ||||||||||||||
Operating profit | $ | 333 | $ | 276 | $ | 289 | 21 | % | (4 | )% | |||||||
Operating margin | 19.2 | % | 17.7 | % | 18.6 | % | |||||||||||
2017 vs. 2016 | 2016 vs. 2015 | |||||||||||
% Change | % Change | |||||||||||
Sales | Operating Profit | Sales | Operating Profit | |||||||||
Factors Contributing to Changes | ||||||||||||
Volume / Equipment | 11 | % | 19 | % | 5 | % | 2 | % | ||||
Price/Mix | 1 | % | 8 | % | (1 | )% | (6 | )% | ||||
Cost pass-through | 1 | % | — | % | 1 | % | — | % | ||||
Currency | 1 | % | 1 | % | (4 | )% | (4 | )% | ||||
Acquisitions / Divestitures | (2 | )% | — | % | (1 | )% | — | % | ||||
Other | — | % | (7 | )% | — | % | 4 | % | ||||
12 | % | 21 | % | — | % | (4 | )% | |||||
The following tables provide sales by end-market and distribution method:
% of Sales | % Change* | ||||||||||||||
2017 | 2016 | 2015 | 2017 vs. 2016 | 2016 vs. 2015 | |||||||||||
Sales by End-Markets | |||||||||||||||
Manufacturing | 9 | % | 9 | % | 9 | % | 13 | % | (8 | )% | |||||
Metals | 27 | % | 28 | % | 29 | % | 15 | % | 5 | % | |||||
Energy | 3 | % | 3 | % | 3 | % | 14 | % | (3 | )% | |||||
Chemicals | 15 | % | 14 | % | 13 | % | 20 | % | 19 | % | |||||
Electronics | 33 | % | 33 | % | 32 | % | 12 | % | 4 | % | |||||
Healthcare | 1 | % | 1 | % | 1 | % | (1 | )% | 8 | % | |||||
Food & Beverage | 2 | % | 2 | % | 2 | % | (1 | )% | 6 | % | |||||
Aerospace | — | % | — | % | — | % | — | % | — | % | |||||
Other | 10 | % | 10 | % | 11 | % | 10 | % | (2 | )% | |||||
100 | % | 100 | % | 100 | % | ||||||||||
* Excludes impact of currency, natural gas/precious metals cost pass-through and acquisitions/divestitures.
32
% of Sales | |||||||||
2017 | 2016 | 2015 | |||||||
Sales by Distribution Method | |||||||||
On-Site | 50 | % | 50 | % | 50 | % | |||
Merchant | 30 | % | 29 | % | 30 | % | |||
Packaged Gas | 13 | % | 14 | % | 13 | % | |||
Other | 7 | % | 7 | % | 7 | % | |||
100 | % | 100 | % | 100 | % | ||||
The Asia segment includes Praxair’s industrial gases operations in China, India, Korea and Thailand, with smaller operations in Taiwan and the Middle East.
Sales in 2017 increased $183 million, or 12% versus 2016. Favorable currency translation and cost pass-through each increased sales by 1%. Divestitures decreased sales by 2% due to the sale of an ownership interest in a majority-owned joint venture in India in 2016. Excluding these impacts, sales increased 12% driven by base volume growth in China, Korea and India, new project start-ups in China and Korea and higher price.
Operating profit for 2017 increased $57 million, or 21%, as compared to the prior year driven by higher volumes and price, partially offset by cost inflation.
Sales in 2016 were comparable to the prior year. Unfavorable currency translation impacts reduced sales by 4% primarily due to the devaluation of the Chinese yuan and Indian Rupee against the U.S. Dollar. Cost pass–through increased sales by 1%. Excluding these impacts, sales increased 3%. Volume growth of 5% included new plant start–ups and was strongest to the chemicals and metals end-markets. Pricing was lower than the prior year by 1%.
Operating profit for 2016 decreased $13 million, or 4%, as compared to the prior year. Excluding currency impacts, operating profit was steady with prior year as lower pricing was offset by volume growth and cost reduction actions.
Surface Technologies
(Dollar amounts in millions) Year Ended December 31, | Variance | ||||||||||||||||
2017 | 2016 | 2015 | 2017 vs. 2016 | 2016 vs. 2015 | |||||||||||||
Sales | $ | 617 | $ | 596 | $ | 609 | 4 | % | (2 | )% | |||||||
Cost of sales, exclusive of depreciation and amortization | 403 | 388 | 397 | ||||||||||||||
Gross margin | 214 | 208 | 212 | ||||||||||||||
Operating expenses | 69 | 66 | 66 | ||||||||||||||
Depreciation and amortization | 40 | 40 | 41 | ||||||||||||||
Operating profit | $ | 105 | $ | 102 | $ | 105 | 3 | % | (3 | )% | |||||||
Operating margin | 17.0 | % | 17.1 | % | 17.2 | % | |||||||||||
33
2017 vs. 2016 | 2016 vs. 2015 | |||||||||||
% Change | % Change | |||||||||||
Sales | Operating Profit | Sales | Operating Profit | |||||||||
Factors Contributing to Changes | ||||||||||||
Volume/Price | 2 | % | 4 | % | (2 | )% | (8 | )% | ||||
Cost pass-through | — | % | — | % | — | % | — | % | ||||
Currency | — | % | — | % | (1 | )% | (1 | )% | ||||
Acquisitions/Divestitures | 2 | % | 1 | % | 1 | % | — | % | ||||
Other | — | % | (2 | )% | — | % | 6 | % | ||||
4 | % | 3 | % | (2 | )% | (3 | )% | |||||
The following table provides sales by end-market:
% of Sales | % Change* | ||||||||||||||
2017 | 2016 | 2015 | 2017 vs. 2016 | 2016 vs. 2015 | |||||||||||
Sales by End-Markets | |||||||||||||||
Manufacturing | 11 | % | 11 | % | 12 | % | 2 | % | (5 | )% | |||||
Metals | 9 | % | 9 | % | 8 | % | — | % | 11 | % | |||||
Energy | 19 | % | 23 | % | 25 | % | (12 | )% | (10 | )% | |||||
Chemicals | 2 | % | 2 | % | 2 | % | (7 | )% | (4 | )% | |||||
Electronics | 1 | % | 1 | % | 1 | % | 32 | % | 17 | % | |||||
Healthcare | — | % | — | % | — | % | — | % | — | % | |||||
Food & Beverage | 3 | % | 4 | % | 4 | % | (4 | )% | 2 | % | |||||
Aerospace | 44 | % | 40 | % | 37 | % | 11 | % | 3 | % | |||||
Other | 11 | % | 10 | % | 11 | % | 2 | % | (12 | )% | |||||
100 | % | 100 | % | 100 | % | ||||||||||
* Excludes impact of currency, natural gas/precious metals cost pass-through and acquisitions/divestitures.
Surface Technologies provides high-performance coatings and thermal-spray powders and equipment in the Americas, Europe, and Asia.
Sales increased $21 million, or 4% versus 2016 primarily due to higher volumes to the aerospace end-market and acquisitions driven by a majority-owned joint venture with GE aviation.
Operating profit increased $3 million, or 3% versus 2016 due to higher volumes and acquisitions.
Sales decreased $13 million, or 2% versus 2015 primarily due to lower volumes to the energy and manufacturing end–markets partially offset by growth in the aerospace end-market. Unfavorable currency translation impacts reduced sales by 1% while acquisitions increased sales by 1%.
Operating profit decreased $3 million, or 3% versus 2015. Lower volumes partially offset by higher pricing decreased operating profit by 8%, and negative currency translation reduced operating profit by 1%. These impacts were partially offset by productivity gains and savings from cost reduction programs.
During the fourth quarter of 2016, surface technologies completed the formation of PG Technologies, LLC ("PGT"), a majority–owned joint venture with GE Aviation ("GE") for the development, support and application of specialized coatings tailored for GE's and CFM International’s (a GE joint venture with Safran Aircraft Engines of France) current and future engine models, including the GE9X and LEAP engines. PGT will expand its production with a new coatings plant in the southeast United States.
34
Currency
The results of Praxair’s non-U.S. operations are translated to the company’s reporting currency, the U.S. dollar, from the functional currencies used in the countries in which the company operates. For most foreign operations, Praxair uses the local currency as its functional currency. There is inherent variability and unpredictability in the relationship of these functional currencies to the U.S. dollar and such currency movements may materially impact Praxair’s results of operations in any given period.
To help understand the reported results, the following is a summary of the significant currencies underlying Praxair’s consolidated results and the exchange rates used to translate the financial statements (rates of exchange expressed in units of local currency per U.S. dollar):
Percent of 2017 Consolidated Sales | Statements of Income | Balance Sheets | |||||||||||||||
Average Year Ended December 31, | December 31, | ||||||||||||||||
Currency | 2017 | 2016 | 2015 | 2017 | 2016 | ||||||||||||
Euro | 13 | % | 0.89 | 0.90 | 0.90 | 0.83 | 0.95 | ||||||||||
Brazilian real | 10 | % | 3.19 | 3.47 | 3.28 | 3.31 | 3.26 | ||||||||||
Canadian dollar | 7 | % | 1.30 | 1.32 | 1.28 | 1.26 | 1.34 | ||||||||||
Chinese yuan | 7 | % | 6.76 | 6.64 | 6.28 | 6.51 | 6.95 | ||||||||||
Mexican peso | 5 | % | 18.86 | 18.65 | 15.83 | 19.66 | 20.73 | ||||||||||
Korean won | 4 | % | 1,131 | 1,160 | 1,130 | 1,067 | 1,206 | ||||||||||
Indian rupee | 3 | % | 65.09 | 67.18 | 64.11 | 63.87 | 67.92 | ||||||||||
Argentine peso | 1 | % | 16.51 | 14.74 | 9.22 | 18.65 | 15.89 | ||||||||||
British pound | 1 | % | 0.78 | 0.74 | 0.65 | 0.74 | 0.81 | ||||||||||
Norwegian krone | 1 | % | 8.26 | 8.39 | 8.05 | 8.20 | 8.64 | ||||||||||
35
LIQUIDITY, CAPITAL RESOURCES AND OTHER FINANCIAL DATA
(Millions of dollars) Year Ended December 31, | 2017 | 2016 | 2015 | ||||||||
Net Cash Provided by (Used for) | |||||||||||
Operating Activities | |||||||||||
Net Income (including noncontrolling interests) | $ | 1,308 | $ | 1,538 | $ | 1,591 | |||||
Non-cash charges (credits): | |||||||||||
Add: Transaction costs and other charges, net of payments (a) | 26 | 83 | 121 | ||||||||
Add: Tax Act income tax charge, net | 394 | — | — | ||||||||
Add: Depreciation and amortization | 1,184 | 1,122 | 1,106 | ||||||||
Add (Less): Deferred income taxes, excluding Tax Act | 136 | (13 | ) | 99 | |||||||
Add (Less): non-cash charges and other | 102 | (4 | ) | (49 | ) | ||||||
Net Income adjusted for non-cash charges and other | 3,150 | 2,726 | 2,868 | ||||||||
Less: Pension contributions | (19 | ) | (11 | ) | (15 | ) | |||||
Add (Less): Working capital | (158 | ) | 52 | (84 | ) | ||||||
Add (Less): Other | 68 | 6 | (74 | ) | |||||||
Net cash provided from operating activities | $ | 3,041 | $ | 2,773 | $ | 2,695 | |||||
Investing Activities | |||||||||||
Capital expenditures | $ | (1,311 | ) | $ | (1,465 | ) | $ | (1,541 | ) | ||
Acquisitions, net of cash acquired | (33 | ) | (363 | ) | (82 | ) | |||||
Divestitures and asset sales | 30 | 58 | 320 | ||||||||
Total used for investing | $ | (1,314 | ) | $ | (1,770 | ) | $ | (1,303 | ) | ||
Financing Activities | |||||||||||
Debt increases (decreases) – net | $ | (771 | ) | $ | 357 | $ | 168 | ||||
Issuances (purchases) of common stock – net | 108 | (89 | ) | (637 | ) | ||||||
Cash dividends – Praxair, Inc. shareholders | (901 | ) | (856 | ) | (819 | ) | |||||
Excess tax benefit on stock based compensation | — | — | 19 | ||||||||
Noncontrolling interest transactions and other | (92 | ) | (55 | ) | (41 | ) | |||||
Total provided (used) for financing | $ | (1,656 | ) | $ | (643 | ) | $ | (1,310 | ) | ||
Effect of exchange rate changes on cash | $ | 22 | $ | 17 | $ | (61 | ) | ||||
Cash and cash equivalents | $ | 617 | $ | 524 | $ | 147 | |||||
(a) | See Note 2 to the consolidated financial statements. |
Cash increased $93 million in 2017 versus 2016. The sources of cash in 2017 were cash flows from operations of $3,041 million, proceeds from divestitures and asset sales of $30 million and net issuances of Praxair common stock of $108 million. The uses of cash included capital expenditures of $1,311 million, acquisitions of $33 million, cash dividends to shareholders of $901 million, and net debt repayments of $771 million.
36
Cash Flows From Operations
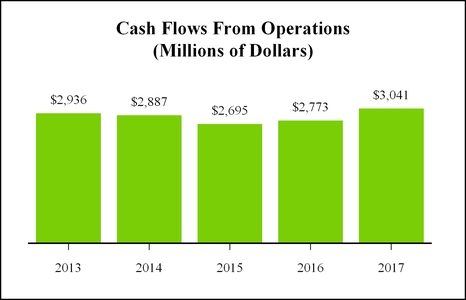
2017 compared with 2016
Cash flows from operations was $3,041 million, or 27% of sales, an increase of $268 million from $2,773 million, or 26% of sales in 2016. The increase was primarily attributable to higher net income adjusted for non-cash charges, a $103 million increase in dividends received from equity companies, primarily in China, and favorable changes in other long–term assets and liabilities which were partially offset by higher working capital requirements and pension contributions.
2016 compared with 2015
Cash flows from operations was $2,773 million, or 26% of sales, an increase of $78 million from $2,695 million, or 25% of sales in 2015. The increase was primarily attributable to lower working capital requirements and favorable changes in other long–term assets and liabilities which were partially offset by lower net income adjusted for non–cash charges.
37
Investing
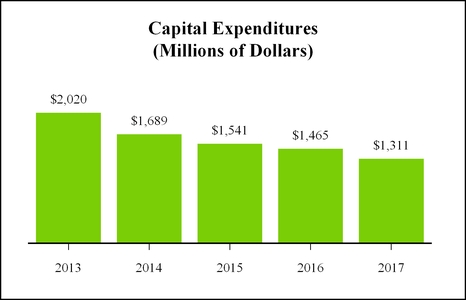
2017 compared with 2016
Net cash used for investing activities of $1,314 million decreased $456 million versus 2016 due to lower acquisitions and capital expenditures, partially offset by lower proceeds from divestiture and asset sales.
Capital expenditures in 2017 were $1,311 million, a decrease of $154 million from 2016. Capital expenditures during 2017 related primarily to investments in new plant and production equipment for growth and density. Approximately 60% of the capital expenditures were in North America with the rest in Asia, Europe and South America.
Acquisition expenditures in 2017 were $33 million, a decrease of $330 million from 2016. Acquisitions in the prior year were primarily comprised of the acquisition of a European carbon dioxide business and packaged gases businesses in North America and Europe (see Note 3 to the consolidated financial statements).
Divestitures and asset sales in 2017 totaled $30 million of proceeds from asset sales. 2016 divestitures and asset sales were $58 million which included proceeds from asset sales and and the sale of an ownership interest in a majority-owned joint venture in India.
2016 compared with 2015
Net cash used for investing activities of $1,770 million increased $467 million versus 2015 due to higher acquisitions and lower proceeds from divestiture and asset sales, partially offset by lower capital expenditures.
Capital expenditures in 2016 were $1,465 million, a decrease of $76 million from 2015. Capital expenditures during 2016 related primarily to investments in new plant and production equipment for growth and density. Approximately 60% of the capital expenditures were in North America with the rest in Asia, Europe and South America.
Acquisition expenditures in 2016 were $363 million, an increase of $281 million from 2015. Acquisitions were primarily comprised of the acquisition of a European carbon dioxide business and packaged gases businesses in North America and Europe (see Note 3 to the consolidated financial statements).
Divestitures and asset sales in 2016 totaled $58 million, which included proceeds from assets sales and the sale of an ownership interest in a majority-owned joint venture in India. 2015 divestitures and asset sales were $320 million primarily due to the sale of fixed assets under construction to a customer in the North America energy market.
38
Financing
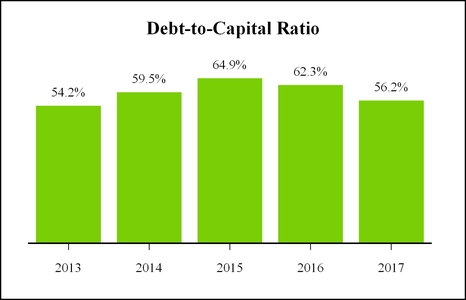
Praxair’s financing strategy is to secure long-term committed funding by issuing public notes and debentures and commercial paper backed by a long-term bank credit agreement. Praxair’s international operations are funded through a combination of local borrowing and inter-company funding to minimize the total cost of funds and to manage and centralize currency exchange exposures. As deemed necessary, Praxair manages its exposure to interest-rate changes through the use of financial derivatives (see Note 12 to the consolidated financial statements and Item 7A. Quantitative and Qualitative Disclosures About Market Risk).
Cash used by financing activities was $1,656 million in 2017 compared to $643 million in 2016. The primary financing uses of cash were for cash dividends and net debt repayments, while the primary source was net issuances of Praxair common stock. Cash dividends of $901 million increased $45 million from 2016 due to a 5% increase in dividends per share from $3.00 to $3.15. Net issuances of common stock increased $197 million due primarily to fewer share repurchases. Noncontrolling interest transactions and other payments was $92 million versus $55 million in 2016. Amounts paid in 2017 include dividends paid to NCI joint venture partners and repayment of project advances; while 2016 primarily relates to the acquisition of the remaining 34% of a Scandinavian joint venture, partially offset by the proceeds received from the formation of a consolidated joint venture in the United States and Singapore (See Note 14 to the consolidated financial statements). The cash used for debt repayments-net of $771 million increased $1,128 million from $357 million of debt issuances-net during 2016 while cash increased $93 million. Net debt (debt minus cash) decreased $608 million.
The company believes that it has sufficient operating flexibility, cash reserves, and funding sources to maintain adequate amounts of liquidity to meet its business needs around the world. At December 31, 2017, the company’s credit ratings as reported by Standard & Poor’s and Moody’s were A-1 and P-1 for short-term debt, respectively, and A and A2 for long-term debt, respectively.
Note 11 to the consolidated financial statements includes information with respect to the company’s debt repayments in 2017, current debt position, debt covenants and the available credit facilities; and Note 12 includes information relating to derivative financial instruments. Praxair's credit facilities are with major financial institutions and are non-cancelable until maturity. Therefore, the company believes the risk of the financial institutions being unable to make required loans under the credit facilities, if requested, to be low. Praxair’s major bank credit and long-term debt agreements contain standard covenants. The company was in compliance with these covenants at December 31, 2017 and expects to remain in compliance for the foreseeable future.
Praxair’s total net debt outstanding at December 31, 2017 was $8,383 million, $608 million lower than $8,991 million at December 31, 2016. The December 31, 2017 net debt balance includes $8,915 million in public securities, $85 million representing primarily worldwide bank borrowings net of $617 million of cash. Praxair’s global effective borrowing rate was approximately 2.03% for 2017.
39
In February 2017, Praxair repaid $150 million of floating rate notes that became due. Also in November 2017, Praxair repaid $400 million of 1.05% notes that became due.
In June 2017, the company entered into a $500 million 364-day revolving credit facility with a syndicate of banks which expires in June 2018. The credit facility is with major financial institutions and is non-cancelable by the issuing financial institution until maturity. No borrowings were outstanding under the credit agreement at December 31, 2017 (see Note 11 to the consolidated financial statements).
Praxair’s debt-to-capital ratio was 56.2% at December 31, 2017 versus 62.3% at December 31, 2016. This decrease was primarily attributable to (i) a reduction in net debt of $608 million; (ii) an increase in equity due to currency translation impacts on the accumulated other comprehensive income (loss) component as well as increases to equity due to earnings net of dividends declared. Praxair's debt is largely denominated in U.S. dollars. See the “Non-GAAP Financial Measures” section for definitions and reconciliation of these non-GAAP measures to reported amounts.
40
CONTRACTUAL OBLIGATIONS
The following table sets forth Praxair’s material contract obligations and other commercial commitments as of December 31, 2017:
(Millions of dollars) | Due or expiring by December 31, | ||||||||||||||||||||||||||
2018 | 2019 | 2020 | 2021 | 2022 | Thereafter | Total | |||||||||||||||||||||
Long-term debt obligations: | |||||||||||||||||||||||||||
Debt and capitalized lease maturities (Note 11)* | $ | 979 | $ | 1,100 | $ | 1,024 | $ | 1,003 | $ | 1,105 | $ | 3,551 | $ | 8,762 | |||||||||||||
Contractual interest | 212 | 187 | 158 | 130 | 98 | 609 | 1,394 | ||||||||||||||||||||
Operating leases (Note 4)* | 131 | 114 | 94 | 76 | 61 | 107 | 583 | ||||||||||||||||||||
Retirement obligations | 49 | 36 | 34 | 33 | 31 | 146 | 329 | ||||||||||||||||||||
Unconditional purchase obligations (Note 17)* | 575 | 517 | 451 | 468 | 437 | 2,511 | 4,959 | ||||||||||||||||||||
Construction commitments (Note 17)* | 842 | 212 | 11 | — | — | — | 1,065 | ||||||||||||||||||||
Total Contractual Obligations | $ | 2,788 | $ | 2,166 | $ | 1,772 | $ | 1,710 | $ | 1,732 | $ | 6,924 | $ | 17,092 | |||||||||||||
* See respective Notes to the consolidated financial statements for additional information.
Contractual interest on long-term debt of $1,394 million represents interest the company is contracted to pay on outstanding long-term debt, current portion of long-term debt and capital lease obligations, calculated on a basis consistent with planned debt maturities, excluding the interest impact of interest rate swaps. At December 31, 2017, Praxair had fixed-rate debt of $8,253 million and floating-rate debt of $747 million. The rate assumed for floating-rate debt was the rate in effect at December 31, 2017.
Retirement obligations of $329 million include estimates of pension plan contributions and expected future benefit payments for unfunded pension and OPEB plans. Pension plan contributions are forecasted for 2018 only. For purposes of the table, $18 million of estimated required contributions have been included for 2018. Expected future unfunded pension and OPEB benefit payments are forecasted only through 2027. Contribution and unfunded benefit payment estimates are based upon current valuation assumptions. Estimates of pension contributions after 2018 and unfunded benefit payments after 2027 are not included in the table because the timing of their resolution cannot be estimated. Retirement obligations are more fully described in Note 16 to the consolidated financial statements.
Liabilities for uncertain tax positions totaling $54 million, including interest and penalties, and tax liabilities for deemed repatriation of earnings of $467 million are not included in the table because the timing of their resolution cannot be estimated. See Note 5 to the consolidated financial statements for disclosures surrounding uncertain income tax positions.
OFF-BALANCE SHEET ARRANGEMENTS
As discussed in Note 17 to the consolidated financial statements, at December 31, 2017, Praxair had entered into various guarantees and other arrangements, and had undrawn outstanding letters of credit from financial institutions. These arrangements were entered into in connection with normal business operations and they are not reasonably likely to have a material impact on Praxair’s consolidated financial condition, results of operations, or liquidity.
CRITICAL ACCOUNTING POLICIES
The policies discussed below are considered by management to be critical to understanding Praxair’s financial statements and accompanying notes prepared in accordance with accounting principles generally accepted in the United States ("U.S. GAAP"). Their application places significant importance on management’s judgment as a result of the need to make estimates of matters that are inherently uncertain. Praxair’s financial position, results of operations and cash flows could be materially affected if actual results differ from estimates made. These policies are determined by management and have been reviewed by Praxair’s Audit Committee.
Depreciable Lives of Property, Plant and Equipment
Praxair’s net property, plant and equipment at December 31, 2017 was $12,057 million, representing 59% of the company’s consolidated total assets. Depreciation expense for the year ended December 31, 2017 was $1,136 million, or
41
13% of total operating costs. Management judgment is required in the determination of the estimated depreciable lives that are used to calculate the annual depreciation expense and accumulated depreciation.
Property, plant and equipment are recorded at cost and depreciated over the assets’ estimated useful lives on a straight-line basis for financial reporting purposes. The estimated useful life represents the projected period of time that the asset will be productively employed by the company and is determined by management based on many factors, including historical experience with similar assets, technological life cycles, geographic locations and contractual supply relationships with on-site customers. Circumstances and events relating to these assets, such as on-site contract modifications, are monitored to ensure that changes in asset lives or impairments (see “Asset Impairments”) are identified and prospective depreciation expense or impairment expense is adjusted accordingly. Praxair’s largest asset values relate to cryogenic air-separation production plants with depreciable lives of principally 15 years.
Based upon the assets as of December 31, 2017, if depreciable lives of machinery and equipment, on average, were increased or decreased by one year, annual depreciation expense would be decreased by approximately $65 million or increased by approximately $74 million, respectively.
Pension Benefits
Pension benefits represent financial obligations that will be ultimately settled in the future with employees who meet eligibility requirements. Because of the uncertainties involved in estimating the timing and amount of future payments, significant estimates are required to calculate pension expense and liabilities related to the company’s plans. The company utilizes the services of several independent actuaries, whose models are used to facilitate these calculations.
Several key assumptions are used in actuarial models to calculate pension expense and liability amounts recorded in the financial statements. Management believes the three most significant variables in the models are the expected long-term rate of return on plan assets, the discount rate, and the expected rate of compensation increase. The actuarial models also use assumptions for various other factors, including employee turnover, retirement age, and mortality. Praxair management believes the assumptions used in the actuarial calculations are reasonable, reflect the company’s experience and expectations for the future and are within accepted practices in each of the respective geographic locations in which it operates. Actual results in any given year will often differ from actuarial assumptions because of economic and other factors.
The weighted-average expected long-term rates of return on pension plan assets were 8.00% for U.S. plans and 7.91% for international plans for the year ended December 31, 2017 (8.00% and 7.92%, respectively at December 31, 2016). These rates are determined annually by management based on a weighted average of current and historical market trends, historical and expected portfolio performance and the current and expected portfolio mix of investments. A 0.50% change in these expected long-term rates of return, with all other variables held constant, would change Praxair’s pension expense by approximately $10 million.
The company has consistently used a market-related value of assets rather than the fair value at the measurement date to determine annual pension expense. The market-related value recognizes investment gains or losses over a five-year period. As a result, changes in the fair value of assets from year to year are not immediately reflected in the company’s annual pension expense. Instead, annual pension expense in future periods will be impacted as deferred investment gains or losses are recognized in the market-related value of assets over the five-year period. The consolidated market-related value of assets was $2,177 million, or $45 million lower than the fair value of assets of $2,222 million at December 31, 2017. These net deferred investment losses of $45 million will be recognized in the calculation of the market-related value of assets ratably over the next four years and will impact future pension expense. Future actual investment gains or losses will impact the market-related value of assets and, therefore, will impact future annual pension expense in a similar manner.
Discount rates are used to calculate the present value of plan liabilities and pension costs and are determined annually by management. For 2016 the Company changed the approach that it used to determine the service and interest cost components of pension and OPEB expense for significant plans to the spot rate approach. U.S. plans that do not use the spot rate approach continue to determine discount rates by using a cash flow matching model provided by the company's independent actuaries. The model includes a portfolio of corporate bonds graded Aa or better by at least half of the ratings agencies and matches the U.S. plans' projected cash flows to the calculated spot rates. Discount rates for the remaining international plans are based on market yields for high-quality fixed income investments representing the approximate duration of the pension liabilities on the measurement date. Refer to Note 16 to the consolidated financial statements for a summary of the discount rates used to calculate plan liabilities and benefit costs, and to the Retirement Benefits section of the Consolidated Results and Other Information section of this MD&A for a further discussion of 2017 benefit costs. A 0.50% change in discount rates, with all other variables held constant, would decrease/increase Praxair’s pension expense by approximately $11 million and would impact the PBO by approximately $186 million.
42
The weighted-average expected rate of compensation increase was 3.25% for U.S. plans and 3.35% for international plans at December 31, 2017 (3.25% and 3.73%, respectively, at December 31, 2016). The estimated annual compensation increase is determined by management every year and is based on historical trends and market indices. A 0.50% change in the expected rate of compensation increase, with all other variables held constant, would change Praxair’s pension expense by approximately $5 million and would impact the PBO by approximately $30 million.
Asset Impairments
Goodwill
At December 31, 2017, the company had goodwill of $3,233 million, which represents the aggregate of the excess purchase price for acquired businesses over the fair value of the net assets acquired.
The company performs a goodwill impairment test annually in the second quarter or more frequently if events or circumstances indicate that an impairment loss may have been incurred, and no impairments were indicated. The company has continuously re-evaluated the likelihood of goodwill impairments in its reporting units subsequent to the second quarter test, and does not believe there is indication of impairment for any of its reporting units. At December 31, 2017, Praxair’s enterprise value was approximately $53 billion (outstanding shares multiplied by the year-end stock price plus debt, and without any control premium) while its total capital was approximately $15 billion.
The impairment test allows an entity to first assess qualitative factors to determine if it is more likely than not that the fair value of a reporting unit is less than carrying value. If it is determined that it is more likely than not that the fair value of a reporting unit is less than carrying value then the company will estimate and compare the fair value of its reporting units to their carrying value, including goodwill. Reporting units are determined based on one level below the operating segment level. Fair value is determined through the use of projected future cash flows, multiples of earnings and sales and other factors.
Such analysis requires the use of certain market assumptions and discount factors, which are subjective in nature. As applicable, estimated values can be affected by many factors beyond the company's control such as business and economic trends, government regulation, and technological changes. Management believes that the qualitative factors used to perform its annual goodwill impairment assessment are appropriate and reasonable. Although the 2017 qualitative assessment indicated that it is more likely than not that the fair value of each reporting unit substantially exceeded its carrying value, changes in circumstances or conditions affecting this analysis could have a significant impact on the fair value determination, which could then result in a material impairment charge to the company's results of operations.
See Note 9 to the consolidated financial statements for disclosures concerning the carrying value of goodwill by reportable segment.
Property, Plant and Equipment
Property, plant and equipment is tested for impairment whenever events or changes in circumstances indicate that the carrying amount of an individual asset or asset group may not be recoverable. For purposes of this test, asset groups are determined based upon the lowest level for which there are independent and identifiable cash flows. Based upon Praxair's business model, an asset group may be a single plant and related assets used to support on-site, merchant and packaged gas customers. Alternatively, the asset group may be a pipeline complex which includes multiple interdependent plants and related assets connected by pipelines within a geographic area used to support the same distribution methods.
Income Taxes
At December 31, 2017, Praxair had deferred tax assets of $667 million (net of valuation allowances of $76 million), and deferred tax liabilities of $1,636 million. At December 31, 2017, uncertain tax positions totaled $54 million (see Notes 1 and 5 to the consolidated financial statements). Income tax expense was $1,026 million for the year ended December 31, 2017, or about 44.9% of pre-tax income and includes a provisional net income tax charge of $394 million related to the U.S. Tax Cuts and Jobs Act (Tax Act). Adjustments to the charge will be made as new information becomes available (see Note 5 to the consolidated financial statements for additional information related to the Tax Act).
In the preparation of consolidated financial statements, Praxair estimates income taxes based on diverse legislative and regulatory structures that exist in various jurisdictions where the company conducts business. Deferred income tax assets and liabilities represent tax benefits or obligations that arise from temporary differences due to differing treatment of certain items for accounting and income tax purposes. Praxair evaluates deferred tax assets each period to ensure that estimated future taxable income will be sufficient in character (e.g. capital gain versus ordinary income treatment), amount and timing to result in their recovery. A valuation allowance is established when management determines that it is more
43
likely than not that a deferred tax asset will not be realized to reduce the assets to their realizable value. Considerable judgments are required in establishing deferred tax valuation allowances and in assessing exposures related to tax matters. As events and circumstances change, related reserves and valuation allowances are adjusted to income at that time. Praxair’s tax returns are subject to audit and local taxing authorities could challenge the company’s tax positions. The company’s practice is to review tax filing positions by jurisdiction and to record provisions for uncertain income tax positions, including interest and penalties when applicable. Praxair believes it records and/or discloses such potential tax liabilities as appropriate and has reasonably estimated its income tax liabilities and recoverable tax assets. If new information becomes available, adjustments are charged or credited against income at that time. Management does not anticipate that such adjustments would have a material adverse effect on the company’s consolidated financial position or liquidity; however, it is possible that the final outcomes could have a material impact on the company’s reported results of operations.
In 2017, due to the Tax Act, Praxair provided $467 million of U.S. income tax on approximately $13 billion of accumulated undistributed foreign earnings and $260 million of foreign withholding tax related to the planned repatriation of approximately $4 billion of such undistributed earnings. A provision has not been made for any additional foreign income tax at December 31, 2017 on approximately $9 billion of remaining undistributed foreign earnings because Praxair intends to reinvest these earnings indefinitely. While these earnings could become subject to additional foreign income tax if they are remitted as dividends, it is not practicable to estimate the unrecognized deferred tax liability on these undistributed earnings.
Contingencies
The company accrues liabilities for non-income tax contingencies when management believes that a loss is probable and the amounts can be reasonably estimated, while contingent gains are recognized only when realized. If new information becomes available or losses are sustained in excess of recorded amounts, adjustments are charged against income at that time. Management does not anticipate that in the aggregate such losses would have a material adverse effect on the company’s consolidated financial position or liquidity; however, it is possible that the final outcomes could have a material impact on the company’s reported results of operations.
Praxair is subject to various claims, legal proceedings and government investigations that arise from time to time in the ordinary course of business. These actions are based upon alleged environmental, tax, antitrust and personal injury claims, among others (see Note 17 to the consolidated financial statements). Such contingencies are significant and the accounting requires considerable management judgments in analyzing each matter to assess the likely outcome and the need for establishing appropriate liabilities and providing adequate disclosures. Praxair believes it records and/or discloses such contingencies as appropriate and has reasonably estimated its liabilities.
NEW ACCOUNTING STANDARDS
See Note 1 to the consolidated financial statements for information concerning new accounting standards and the impact of the implementation of these standards on the company’s financial statements.
FAIR VALUE MEASUREMENTS
Praxair does not expect changes in the aggregate fair value of its financial assets and liabilities to have a material impact on the consolidated financial statements. See Note 13 to the consolidated financial statements.
44
NON-GAAP FINANCIAL MEASURES
The following non-GAAP measures are intended to supplement investors’ understanding of the company’s financial information by providing measures which investors, financial analysts and management use to help evaluate the company’s financial leverage and operating performance. Special items which the company does not believe to be indicative of on-going business performance are excluded from these calculations so that investors can better evaluate and analyze historical and future business trends on a consistent basis. Definitions of these non-GAAP measures may not be comparable to similar definitions used by other companies and are not a substitute for similar GAAP measures.
The non-GAAP measures in the following reconciliations are presented in the Selected Financial Data (Item 6) or this MD&A.
Adjusted Amounts
Certain amounts for 2017, 2016, 2015, 2014 and 2013 have been included for reference purposes and to facilitate the calculations contained herein.
(Dollar amounts in millions, except per share data) | 2017 | 2016 | 2015 | 2014 | 2013 | ||||||||||||||
Year Ended December 31, | |||||||||||||||||||
Adjusted Operating Profit and Margin | |||||||||||||||||||
Reported operating profit | $ | 2,448 | $ | 2,238 | $ | 2,321 | $ | 2,608 | $ | 2,625 | |||||||||
Add: Bond redemption | — | — | — | — | — | ||||||||||||||
Add: Pension settlement charge | 2 | 4 | 7 | 7 | 9 | ||||||||||||||
Add: Venezuela currency devaluation | — | — | — | 131 | 23 | ||||||||||||||
Add: Transaction costs | 52 | — | — | — | — | ||||||||||||||
Add: Cost reduction program | — | 96 | 165 | — | — | ||||||||||||||
Total adjustments | 54 | 100 | 172 | 138 | 32 | ||||||||||||||
Adjusted operating profit | $ | 2,502 | $ | 2,338 | $ | 2,493 | $ | 2,746 | $ | 2,657 | |||||||||
Reported percent change | 9 | % | (4 | )% | (11 | )% | (1 | )% | 8 | % | |||||||||
Adjusted percent change | 7 | % | (6 | )% | (9 | )% | 3 | % | 6 | % | |||||||||
Reported sales | $ | 11,437 | $ | 10,534 | $ | 10,776 | $ | 12,273 | $ | 11,925 | |||||||||
Reported operating margin | 21.4 | % | 21.2 | % | 21.5 | % | 21.2 | % | 22.0 | % | |||||||||
Adjusted operating margin | 21.9 | % | 22.2 | % | 23.1 | % | 22.4 | % | 22.3 | % | |||||||||
Adjusted Interest Expense - Net | |||||||||||||||||||
Reported interest expense | 161 | 190 | 161 | 213 | 178 | ||||||||||||||
Less: Bond redemption | — | (16 | ) | — | (36 | ) | (18 | ) | |||||||||||
Adjusted interest expense - net | $ | 161 | $ | 174 | $ | 161 | $ | 177 | $ | 160 | |||||||||
Adjusted Income Taxes and Effective Tax Rate | |||||||||||||||||||
Reported income taxes | $ | 1,026 | $ | 551 | $ | 612 | $ | 691 | $ | 649 | |||||||||
Add: Bond redemption | — | 6 | — | 14 | 6 | ||||||||||||||
Add: Income tax benefits | — | — | — | — | 40 | ||||||||||||||
Add: Pension settlement charge | 1 | 1 | 2 | 2 | 3 | ||||||||||||||
Add: Venezuela currency devaluation | — | — | — | — | — | ||||||||||||||
Add: Cost reduction program | — | 28 | 39 | — | — | ||||||||||||||
Less: Tax Act | (394 | ) | — | — | — | — | |||||||||||||
Add: Transaction costs | 4 | — | — | — | — | ||||||||||||||
Total adjustments | (389 | ) | 35 | 41 | 16 | 49 | |||||||||||||
Adjusted income taxes | $ | 637 | $ | 586 | $ | 653 | $ | 707 | $ | 698 | |||||||||
45
Reported income before income taxes and equity investments | $ | 2,287 | $ | 2,048 | $ | 2,160 | $ | 2,395 | $ | 2,447 | |||||||||
Add: Bond redemption | — | 16 | — | 36 | 18 | ||||||||||||||
Add: Pension settlement charge | 2 | 4 | 7 | 7 | 9 | ||||||||||||||
Add: Venezuela currency devaluation | — | — | — | 131 | 23 | ||||||||||||||
Add: Cost reduction program | — | 96 | 165 | — | — | ||||||||||||||
Add: Transaction costs | 52 | — | — | — | — | ||||||||||||||
Total adjustments | 54 | 116 | 172 | 174 | 50 | ||||||||||||||
Adjusted income before income taxes and equity investments | $ | 2,341 | $ | 2,164 | $ | 2,332 | $ | 2,569 | $ | 2,497 | |||||||||
Reported effective tax rate | 44.9 | % | 26.9 | % | 28.3 | % | 28.9 | % | 26.5 | % | |||||||||
Adjusted effective tax rate | 27.2 | % | 27.1 | % | 28.0 | % | 27.5 | % | 28.0 | % | |||||||||
Adjusted Noncontrolling Interests | |||||||||||||||||||
Reported noncontrolling interests | $ | 61 | $ | 38 | $ | 44 | $ | 52 | $ | 81 | |||||||||
Less: Income tax benefits | — | — | — | — | (16 | ) | |||||||||||||
Add: Cost reduction program | — | 5 | 1 | — | — | ||||||||||||||
Total adjustments | — | 5 | 1 | — | (16 | ) | |||||||||||||
Adjusted noncontrolling interests | $ | 61 | $ | 43 | $ | 45 | $ | 52 | $ | 65 | |||||||||
(Dollar amounts in millions, except per share data) | 2017 | 2016 | 2015 | 2014 | 2013 | ||||||||||||||
Year Ended December 31, | |||||||||||||||||||
Adjusted Net Income – Praxair, Inc. | |||||||||||||||||||
Reported net income – Praxair, Inc. | $ | 1,247 | $ | 1,500 | $ | 1,547 | $ | 1,694 | $ | 1,755 | |||||||||
Add: Bond redemption | — | 10 | — | 22 | 12 | ||||||||||||||
Less: Income tax benefits | — | — | — | — | (24 | ) | |||||||||||||
Add: Pension settlement charge | 1 | 3 | 5 | 5 | 6 | ||||||||||||||
Add: Venezuela currency devaluation | — | — | — | 131 | 23 | ||||||||||||||
Add: Cost reduction program | — | 63 | 125 | — | — | ||||||||||||||
Add: Tax Act | 394 | — | — | — | — | ||||||||||||||
Add: Transaction costs | 48 | — | — | — | — | ||||||||||||||
Total adjustments | 443 | 76 | 130 | 158 | 17 | ||||||||||||||
Adjusted net income – Praxair, Inc. | $ | 1,690 | $ | 1,576 | $ | 1,677 | $ | 1,852 | $ | 1,772 | |||||||||
Reported percent change | (17 | )% | (3 | )% | (9 | )% | (3 | )% | 4 | % | |||||||||
Adjusted percent change | 7 | % | (6 | )% | (9 | )% | 5 | % | 5 | % | |||||||||
46
(Dollar amounts in millions, except per share data) | 2017 | 2016 | 2015 | 2014 | 2013 | ||||||||||||||
Year Ended December 31, | |||||||||||||||||||
Adjusted Diluted Earnings Per Share | |||||||||||||||||||
Reported diluted earnings per share | $ | 4.32 | $ | 5.21 | $ | 5.35 | $ | 5.73 | $ | 5.87 | |||||||||
Add: Bond redemption | — | 0.04 | — | 0.07 | 0.04 | ||||||||||||||
Less: Income tax benefits | — | — | — | — | (0.08 | ) | |||||||||||||
Add: Pension settlement charge | — | 0.01 | 0.02 | 0.02 | 0.02 | ||||||||||||||
Add: Venezuela currency devaluation | — | — | — | 0.45 | 0.08 | ||||||||||||||
Add: Cost reduction program | — | 0.22 | 0.43 | — | — | ||||||||||||||
Add: Tax Act | 1.36 | — | — | — | — | ||||||||||||||
Add: Transaction costs | 0.17 | — | — | — | — | ||||||||||||||
Total adjustments | 1.53 | 0.27 | 0.45 | 0.54 | 0.06 | ||||||||||||||
Adjusted diluted earnings per share | $ | 5.85 | $ | 5.48 | $ | 5.80 | $ | 6.27 | $ | 5.93 | |||||||||
Reported percent change | (17 | )% | (3 | )% | (7 | )% | (2 | )% | 5 | % | |||||||||
Adjusted percent change | 7 | % | (6 | )% | (7 | )% | 6 | % | 6 | % | |||||||||
Debt-to-Capital Ratio
The debt-to-capital ratio is a measure used by investors, financial analysts and management to provide a measure of financial leverage and insights into how the company is financing its operations.
(Dollar amounts in millions) | 2017 | 2016 | 2015 | 2014 | 2013 | ||||||||||||||
Year Ended December 31, | |||||||||||||||||||
Total debt | $ | 9,000 | $ | 9,515 | $ | 9,231 | $ | 9,225 | $ | 8,779 | |||||||||
Less: cash and cash equivalents | (617 | ) | (524 | ) | (147 | ) | (126 | ) | (138 | ) | |||||||||
Net debt | 8,383 | 8,991 | 9,084 | 9,099 | 8,641 | ||||||||||||||
Equity and redeemable noncontrolling interests | |||||||||||||||||||
Redeemable noncontrolling interests | 11 | 11 | 113 | 176 | 307 | ||||||||||||||
Praxair, Inc. shareholders’ equity | 6,018 | 5,021 | 4,389 | 5,623 | 6,609 | ||||||||||||||
Noncontrolling interests | 493 | 420 | 404 | 387 | 394 | ||||||||||||||
Total equity and redeemable noncontrolling interests | 6,522 | 5,452 | 4,906 | 6,186 | 7,310 | ||||||||||||||
Total capital | $ | 14,905 | $ | 14,443 | $ | 13,990 | $ | 15,285 | $ | 15,951 | |||||||||
Debt-to-capital ratio | 56.2 | % | 62.3 | % | 64.9 | % | 59.5 | % | 54.2 | % | |||||||||
47
EBITDA, Adjusted EBITDA, EBITDA Margin, and Adjusted EBITDA Margin
These measures are used by investors, financial analysts and management to assess a company’s profitability.
(Dollar amounts in millions) | 2017 | 2016 | 2015 | 2014 | 2013 | ||||||||||||||
Year Ended December 31, | |||||||||||||||||||
Reported net income - Praxair, Inc. | $ | 1,247 | $ | 1,500 | $ | 1,547 | $ | 1,694 | $ | 1,755 | |||||||||
Add: noncontrolling interest | $ | 61 | $ | 38 | $ | 44 | $ | 52 | $ | 81 | |||||||||
Add: interest expense - net | $ | 161 | $ | 190 | $ | 161 | $ | 213 | $ | 178 | |||||||||
Add: income taxes | $ | 1,026 | $ | 551 | $ | 612 | $ | 691 | $ | 649 | |||||||||
Add: depreciation and amortization | $ | 1,184 | $ | 1,122 | $ | 1,106 | $ | 1,170 | $ | 1,109 | |||||||||
EBITDA | $ | 3,679 | $ | 3,401 | $ | 3,470 | $ | 3,820 | $ | 3,772 | |||||||||
Adjusted net income - Praxair, Inc. | $ | 1,690 | $ | 1,576 | $ | 1,677 | $ | 1,852 | $ | 1,772 | |||||||||
Add: adjusted noncontrolling interests | 61 | 43 | 45 | 52 | 65 | ||||||||||||||
Add: adjusted interest expense - net | 161 | 174 | 161 | 177 | 160 | ||||||||||||||
Add: adjusted income taxes | 637 | 586 | 653 | 707 | 698 | ||||||||||||||
Add: depreciation and amortization | 1,184 | 1,122 | 1,106 | 1,170 | 1,109 | ||||||||||||||
Adjusted EBITDA | $ | 3,733 | $ | 3,501 | $ | 3,642 | $ | 3,958 | $ | 3,804 | |||||||||
Reported Sales | $ | 11,437 | $ | 10,534 | $ | 10,776 | $ | 12,273 | $ | 11,925 | |||||||||
EBITDA Margin | 32.2 | % | 32.3 | % | 32.2 | % | 31.1 | % | 31.6 | % | |||||||||
Adjusted EBITDA Margin | 32.6 | % | 33.2 | % | 33.8 | % | 32.2 | % | 31.9 | % | |||||||||
48
FORWARD-LOOKING STATEMENTS
This document contains “forward-looking statements” within the meaning of the Private Securities Litigation Reform Act of 1995. These statements are based on management’s reasonable expectations and assumptions as of the date the statements are made but involve risks and uncertainties. These risks and uncertainties include, without limitation: the expected timing and likelihood of the completion of the contemplated business combination with Linde AG, including the timing, receipt and terms and conditions of any required governmental and regulatory approvals that could reduce anticipated benefits or cause the parties to abandon the transaction; the occurrence of any event, change or other circumstances that could give rise to the termination of the business combination agreement; the ability to successfully complete the proposed business combination, including satisfying closing conditions; the success of the business following the proposed business combination; the ability to successfully integrate the Praxair and Linde businesses; the risk that the combined company may be unable to achieve expected synergies or that it may take longer or be more costly than expected to achieve those synergies; the performance of stock markets generally; developments in worldwide and national economies and other international events and circumstances; changes in foreign currencies and in interest rates; the cost and availability of electric power, natural gas and other raw materials; the ability to achieve price increases to offset cost increases; catastrophic events including natural disasters, epidemics and acts of war and terrorism; the ability to attract, hire, and retain qualified personnel; the impact of changes in financial accounting standards; the impact of changes in pension plan liabilities; the impact of tax, environmental, healthcare and other legislation and government regulation in jurisdictions in which the company operates, including the impact of the U.S. Tax Cuts and Jobs Act of 2017; the cost and outcomes of investigations, litigation and regulatory proceedings; the impact of potential unusual or non-recurring items; continued timely development and market acceptance of new products and applications; the impact of competitive products and pricing; future financial and operating performance of major customers and industries served; the impact of information technology system failures, network disruptions and breaches in data security; and the effectiveness and speed of integrating new acquisitions into the business. These risks and uncertainties may cause actual future results or circumstances to differ materially from the GAAP or adjusted projections or estimates contained in the forward-looking statements. The company assumes no obligation to update or provide revisions to any forward-looking statement in response to changing circumstances. The above listed risks and uncertainties are further described in Item 1A (Risk Factors) in this report and in the proxy statement/prospectus and the offering prospectus included in the Registration Statement on Form S-4 (which Registration Statement was declared effective on August 14, 2017) filed by Linde plc with the SEC which should be reviewed carefully. Please consider the company’s forward-looking statements in light of those risks.
49
ITEM 7A. QUANTITATIVE AND QUALITATIVE DISCLOSURES ABOUT MARKET RISK
Praxair is exposed to market risks relating to fluctuations in interest rates and currency exchange rates. The objective of financial risk management at Praxair is to minimize the negative impact of interest rate and foreign exchange rate fluctuations on the company’s earnings, cash flows and equity.
To manage these risks, Praxair uses various derivative financial instruments, including interest-rate swaps, treasury rate locks, currency swaps, forward contracts, currency options and commodity contracts. Praxair only uses commonly traded and non-leveraged instruments. These contracts are entered into primarily with major banking institutions thereby minimizing the risk of credit loss. Also, see Notes 1 and 12 to the consolidated financial statements for a more complete description of Praxair’s accounting policies and use of such instruments.
The following discussion presents the sensitivity of the market value, earnings and cash flows of Praxair’s financial instruments to hypothetical changes in interest and exchange rates assuming these changes occurred at December 31, 2017. The range of changes chosen for these discussions reflects Praxair’s view of changes which are reasonably possible over a one-year period. Market values represent the present values of projected future cash flows based on interest rate and exchange rate assumptions.
Interest Rate and Debt Sensitivity Analysis
At December 31, 2017, Praxair had debt totaling $9,000 million ($9,515 million at December 31, 2016). At December 31, 2017, there was one interest rate swap agreement outstanding with a notional amount of $475 million that converts fixed-rate interest to variable-rate interest on the $475 million 1.25% notes that mature in 2018. When considered appropriate, interest-rate swaps are entered into as hedges of underlying financial instruments to effectively change the characteristics of the interest rate without actually changing the underlying financial instrument.
For fixed-rate instruments, interest-rate changes affect the fair market value but do not impact earnings or cash flows. Conversely, for floating-rate instruments, interest-rate changes generally do not affect the fair market value but impact future earnings and cash flows, assuming other factors are held constant.
At December 31, 2017, Praxair had fixed-rate debt of $8,253 million and floating-rate debt of $747 million, representing 92% and 8%, respectively, of total debt. At December 31, 2016, Praxair had fixed-rate debt of $8,407 million and floating-rate debt of $1,108 million, representing 88% and 12%, respectively, of total debt. Holding other variables constant (such as foreign exchange rates, swaps and debt levels), a one-percentage-point decrease in interest rates would increase the unrealized fair market value of the fixed-rate debt by approximately $450 million ($503 million in 2016). At December 31, 2017 and 2016, the after-tax earnings and cash flows impact for the subsequent year resulting from a one-percentage-point increase in interest rates would be approximately $6 million and $7 million, respectively, holding other variables constant.
Exchange Rate Sensitivity Analysis
Praxair’s exchange-rate exposures result primarily from its investments and ongoing operations in South America (primarily Brazil, Argentina, Chile and Colombia), Europe (primarily Germany, Italy, Russia, Norway, Spain and the United Kingdom), Canada, Mexico, Asia (primarily China, India, Korea and Thailand) and other business transactions such as the procurement of equipment from foreign sources. From time to time, Praxair utilizes foreign exchange forward contracts to hedge these exposures. At December 31, 2017, Praxair had $2,693 million notional amount ($2,104 million at December 31, 2016) of foreign exchange contracts all of which were to hedge recorded balance sheet exposures. See Note 12 to the consolidated financial statements.
Holding other variables constant, if there were a 10% adverse change in foreign-currency exchange rates for the portfolio, the fair market value of foreign-currency contracts outstanding at December 31, 2017 and 2016 would decrease by approximately $174 million and $121 million, respectively, which would be largely offset by an offsetting gain or loss on the foreign-currency fluctuation of the underlying exposure being hedged.
50
ITEM 8. FINANCIAL STATEMENTS AND SUPPLEMENTARY DATA
INDEX TO CONSOLIDATED FINANCIAL STATEMENTS
Page | |
Audited Consolidated Financial Statements | |
Notes to Consolidated Financial Statements | |
51
MANAGEMENT’S STATEMENT OF RESPONSIBILITY FOR FINANCIAL STATEMENTS
Praxair’s consolidated financial statements are prepared by management, which is responsible for their fairness, integrity and objectivity. The accompanying financial statements have been prepared in conformity with accounting principles generally accepted in the United States of America applied on a consistent basis, except for accounting changes as disclosed, and include amounts that are estimates and judgments. All historical financial information in this annual report is consistent with the accompanying financial statements.
Praxair maintains accounting systems, including internal accounting controls, monitored by a staff of internal auditors, that are designed to provide reasonable assurance of the reliability of financial records and the protection of assets. The concept of reasonable assurance is based on recognition that the cost of a system should not exceed the related benefits. The effectiveness of those systems depends primarily upon the careful selection of financial and other managers, clear delegation of authority and assignment of accountability, inculcation of high business ethics and conflict-of-interest standards, policies and procedures for coordinating the management of corporate resources, and the leadership and commitment of top management. In compliance with Section 404 of the Sarbanes-Oxley Act of 2002, Praxair assessed its internal control over financial reporting and issued a report (see below).
PricewaterhouseCoopers LLP, an independent registered public accounting firm, has completed an integrated audit of Praxair’s 2017, 2016 and 2015 consolidated financial statements and of its internal control over financial reporting as of December 31, 2017 in accordance with the standards of the Public Company Accounting Oversight Board (United States) as stated in their report.
The Audit Committee of the Board of Directors, which consists solely of non-employee directors, is responsible for overseeing the functioning of the accounting system and related controls and the preparation of annual financial statements. The Audit Committee periodically meets with management, internal auditors and the independent accountants to review and evaluate their accounting, auditing and financial reporting activities and responsibilities, including management’s assessment of internal control over financial reporting. The independent registered public accounting firm and internal auditors have full and free access to the Audit Committee and meet with the committee, with and without management present.
MANAGEMENT’S REPORT ON INTERNAL CONTROL OVER FINANCIAL REPORTING
Praxair’s management is responsible for establishing and maintaining adequate internal control over financial reporting, as such term is defined in Exchange Act Rule 13a-15(f). Under the supervision and with the participation of management, including the company’s principal executive officer and principal financial officer, the company conducted an evaluation of the effectiveness of its internal control over financial reporting based on the framework in Internal Control – Integrated Framework (2013) issued by the Committee of Sponsoring Organizations of the Treadway Commission (often referred to as COSO). Based on this evaluation, management concluded that the company’s internal control over financial reporting was effective as of December 31, 2017.
PricewaterhouseCoopers LLP, an independent registered public accounting firm, has issued their opinion on the company’s internal control over financial reporting as of December 31, 2017 as stated in their report.
/s/ STEPHEN F. ANGEL | /s/ KELCEY E. HOYT | |
Stephen F. Angel Chairman, President and Chief Executive Officer | Kelcey E. Hoyt Vice President and Controller | |
/s/ MATTHEW J. WHITE | ||
Matthew J. White Senior Vice President and Chief Financial Officer | Danbury, Connecticut February 28, 2018 | |
52
REPORT OF INDEPENDENT REGISTERED PUBLIC ACCOUNTING FIRM
To The Board of Directors and Shareholders of Praxair, Inc.:
Opinions on the Financial Statements and Internal Control over Financial Reporting
We have audited the accompanying consolidated balance sheets of Praxair, Inc. and its subsidiaries as of December 31, 2017 and 2016, and the related consolidated statements of income, comprehensive income, cash flows and equity for each of the three years in the period ended December 31, 2017, including the related notes (collectively referred to as the “consolidated financial statements”). We also have audited the Company's internal control over financial reporting as of December 31, 2017, based on criteria established in Internal Control - Integrated Framework (2013) issued by the Committee of Sponsoring Organizations of the Treadway Commission (COSO).
In our opinion, the consolidated financial statements referred to above present fairly, in all material respects, the financial position of the Company as of December 31, 2017 and 2016, and the results of their operations and their cash flows for each of the three years in the period ended December 31, 2017 in conformity with accounting principles generally accepted in the United States of America. Also in our opinion, the Company maintained, in all material respects, effective internal control over financial reporting as of December 31, 2017, based on criteria established in Internal Control - Integrated Framework (2013) issued by the COSO.
Basis for Opinions
The Company's management is responsible for these consolidated financial statements, for maintaining effective internal control over financial reporting, and for its assessment of the effectiveness of internal control over financial reporting, included in the accompanying Management’s Report on Internal Control over Financial Reporting. Our responsibility is to express opinions on the Company’s consolidated financial statements and on the Company's internal control over financial reporting based on our audits. We are a public accounting firm registered with the Public Company Accounting Oversight Board (United States) ("PCAOB") and are required to be independent with respect to the Company in accordance with the U.S. federal securities laws and the applicable rules and regulations of the Securities and Exchange Commission and the PCAOB.
We conducted our audits in accordance with the standards of the PCAOB. Those standards require that we plan and perform the audits to obtain reasonable assurance about whether the consolidated financial statements are free of material misstatement, whether due to error or fraud, and whether effective internal control over financial reporting was maintained in all material respects.
Our audits of the consolidated financial statements included performing procedures to assess the risks of material misstatement of the consolidated financial statements, whether due to error or fraud, and performing procedures that respond to those risks. Such procedures included examining, on a test basis, evidence regarding the amounts and disclosures in the consolidated financial statements. Our audits also included evaluating the accounting principles used and significant estimates made by management, as well as evaluating the overall presentation of the consolidated financial statements. Our audit of internal control over financial reporting included obtaining an understanding of internal control over financial reporting, assessing the risk that a material weakness exists, and testing and evaluating the design and operating effectiveness of internal control based on the assessed risk. Our audits also included performing such other procedures as we considered necessary in the circumstances. We believe that our audits provide a reasonable basis for our opinions.
Definition and Limitations of Internal Control over Financial Reporting
A company’s internal control over financial reporting is a process designed to provide reasonable assurance regarding the reliability of financial reporting and the preparation of financial statements for external purposes in accordance with generally accepted accounting principles. A company’s internal control over financial reporting includes those policies and procedures that (i) pertain to the maintenance of records that, in reasonable detail, accurately and fairly reflect the transactions and dispositions of the assets of the company; (ii) provide reasonable assurance that transactions are recorded as necessary to permit preparation of financial statements in accordance with generally accepted accounting principles, and that receipts and expenditures of the company are being made only in accordance with authorizations of management and directors of the company; and (iii) provide reasonable assurance regarding prevention or timely detection of unauthorized acquisition, use, or disposition of the company’s assets that could have a material effect on the financial statements.
Because of its inherent limitations, internal control over financial reporting may not prevent or detect misstatements. Also, projections of any evaluation of effectiveness to future periods are subject to the risk that controls may become inadequate because of changes in conditions, or that the degree of compliance with the policies or procedures may deteriorate.
/s/ PricewaterhouseCoopers LLP
Stamford, Connecticut
February 28, 2018
We have served as the Company’s auditor since 1992.
53
CONSOLIDATED STATEMENTS OF INCOME
PRAXAIR, INC. AND SUBSIDIARIES
(Dollar amounts in millions, except per share data)
Year Ended December 31, | 2017 | 2016 | 2015 | ||||||||
Sales | $ | 11,437 | $ | 10,534 | $ | 10,776 | |||||
Cost of sales, exclusive of depreciation and amortization | 6,455 | 5,860 | 5,960 | ||||||||
Selling, general and administrative | 1,207 | 1,145 | 1,152 | ||||||||
Depreciation and amortization | 1,184 | 1,122 | 1,106 | ||||||||
Research and development | 93 | 92 | 93 | ||||||||
Transaction costs and other charges | 54 | 100 | 172 | ||||||||
Other income (expenses) – net | 4 | 23 | 28 | ||||||||
Operating Profit | 2,448 | 2,238 | 2,321 | ||||||||
Interest expense – net | 161 | 190 | 161 | ||||||||
Income Before Income Taxes and Equity Investments | 2,287 | 2,048 | 2,160 | ||||||||
Income taxes | 1,026 | 551 | 612 | ||||||||
Income Before Equity Investments | 1,261 | 1,497 | 1,548 | ||||||||
Income from equity investments | 47 | 41 | 43 | ||||||||
Net Income (Including Noncontrolling Interests) | 1,308 | 1,538 | 1,591 | ||||||||
Less: noncontrolling interests | (61 | ) | (38 | ) | (44 | ) | |||||
Net Income – Praxair, Inc. | $ | 1,247 | $ | 1,500 | $ | 1,547 | |||||
Per Share Data – Praxair, Inc. Shareholders | |||||||||||
Basic earnings per share | $ | 4.36 | $ | 5.25 | $ | 5.39 | |||||
Diluted earnings per share | $ | 4.32 | $ | 5.21 | $ | 5.35 | |||||
Weighted Average Shares Outstanding (000’s): | |||||||||||
Basic shares outstanding | 286,261 | 285,677 | 287,005 | ||||||||
Diluted shares outstanding | 289,114 | 287,757 | 289,055 | ||||||||
The accompanying Notes on pages 60 to 103 are an integral part of these financial statements.
54
CONSOLIDATED STATEMENTS OF COMPREHENSIVE INCOME
PRAXAIR, INC. AND SUBSIDIARIES
(Dollar amounts in millions)
Year Ended December 31, | 2017 | 2016 | 2015 | ||||||||
NET INCOME (INCLUDING NONCONTROLLING INTERESTS) | $ | 1,308 | $ | 1,538 | $ | 1,591 | |||||
OTHER COMPREHENSIVE INCOME (LOSS) | |||||||||||
Translation adjustments: | |||||||||||
Foreign currency translation adjustments | 433 | 116 | (1,517 | ) | |||||||
Reclassifications to net income | — | — | — | ||||||||
Income taxes | 92 | (48 | ) | 3 | |||||||
Translation adjustments | 525 | 68 | (1,514 | ) | |||||||
Funded status - retirement obligations (Note 16): | |||||||||||
Retirement program remeasurements | (39 | ) | (163 | ) | (11 | ) | |||||
Reclassifications to net income | 55 | 60 | 84 | ||||||||
Income taxes | (5 | ) | 27 | (17 | ) | ||||||
Funded status - retirement obligations | 11 | (76 | ) | 56 | |||||||
Derivative instruments (Note 12): | |||||||||||
Current year unrealized gain (loss) | — | 1 | 1 | ||||||||
Reclassifications to net income | — | (1 | ) | (1 | ) | ||||||
Income taxes | — | — | — | ||||||||
Derivative instruments | — | — | — | ||||||||
TOTAL OTHER COMPREHENSIVE INCOME (LOSS) | 536 | (8 | ) | (1,458 | ) | ||||||
COMPREHENSIVE INCOME (INCLUDING NONCONTROLLING INTERESTS) | 1,844 | 1,530 | 133 | ||||||||
Less: noncontrolling interests | (95 | ) | (34 | ) | 3 | ||||||
COMPREHENSIVE INCOME - PRAXAIR, INC. | $ | 1,749 | $ | 1,496 | $ | 136 | |||||
The accompanying Notes on pages 60 to 103 are an integral part of these financial statements.
55
CONSOLIDATED BALANCE SHEETS
PRAXAIR, INC. AND SUBSIDIARIES
(Dollar amounts in millions)
December 31, | 2017 | 2016 | |||||
Assets | |||||||
Cash and cash equivalents | $ | 617 | $ | 524 | |||
Accounts receivable – net | 1,804 | 1,641 | |||||
Inventories | 614 | 550 | |||||
Prepaid and other current assets | 250 | 165 | |||||
Total Current Assets | 3,285 | 2,880 | |||||
Property, plant and equipment – net | 12,057 | 11,477 | |||||
Equity investments | 727 | 717 | |||||
Goodwill | 3,233 | 3,117 | |||||
Other intangible assets – net | 553 | 583 | |||||
Other long-term assets | 581 | 558 | |||||
Total Assets | $ | 20,436 | $ | 19,332 | |||
Liabilities and Equity | |||||||
Accounts payable | $ | 972 | $ | 906 | |||
Short-term debt | 238 | 434 | |||||
Current portion of long-term debt | 979 | 164 | |||||
Accrued taxes | 242 | 133 | |||||
Other current liabilities | 876 | 841 | |||||
Total Current Liabilities | 3,307 | 2,478 | |||||
Long-term debt | 7,783 | 8,917 | |||||
Other long-term liabilities | 1,588 | 1,213 | |||||
Deferred credits | 1,236 | 1,272 | |||||
Total Liabilities | 13,914 | 13,880 | |||||
Commitments and contingencies (Note 17) | |||||||
Redeemable noncontrolling interests | 11 | 11 | |||||
Praxair, Inc. Shareholders’ Equity: | |||||||
Common stock $0.01 par value, authorized – 800,000,000 shares, issued 2017 and 2016 – 383,230,625 shares | 4 | 4 | |||||
Additional paid-in capital | 4,084 | 4,074 | |||||
Retained earnings | 13,224 | 12,879 | |||||
Accumulated other comprehensive income (loss) | (4,098 | ) | (4,600 | ) | |||
Less: Treasury stock, at cost (2017– 96,453,634 shares and 2016 – 98,329,849 shares) | (7,196 | ) | (7,336 | ) | |||
Total Praxair, Inc. Shareholders’ Equity | 6,018 | 5,021 | |||||
Noncontrolling interests | 493 | 420 | |||||
Total Equity | 6,511 | 5,441 | |||||
Total Liabilities and Equity | $ | 20,436 | $ | 19,332 | |||
The accompanying Notes on pages 60 to 103 are an integral part of these financial statements.
56
CONSOLIDATED STATEMENTS OF CASH FLOWS
PRAXAIR, INC. AND SUBSIDIARIES
(Millions of dollars)
Year Ended December 31, | 2017 | 2016 | 2015 | ||||||||
Increase (Decrease) in Cash and Cash Equivalents | |||||||||||
Operations | |||||||||||
Net income – Praxair, Inc. | $ | 1,247 | $ | 1,500 | $ | 1,547 | |||||
Noncontrolling interests | 61 | 38 | 44 | ||||||||
Net income (including noncontrolling interests) | $ | 1,308 | $ | 1,538 | $ | 1,591 | |||||
Adjustments to reconcile net income to net cash provided by operating activities: | |||||||||||
Transaction costs and other charges, net of payments | 26 | 83 | 121 | ||||||||
Tax Act income tax charge, net | 394 | — | — | ||||||||
Depreciation and amortization | 1,184 | 1,122 | 1,106 | ||||||||
Deferred income taxes, excluding Tax Act | 136 | (13 | ) | 99 | |||||||
Share-based compensation | 59 | 39 | 30 | ||||||||
Non-cash charges and other | 43 | (43 | ) | (79 | ) | ||||||
Working capital | |||||||||||
Accounts receivable | (92 | ) | (33 | ) | 1 | ||||||
Inventory | (22 | ) | (13 | ) | (23 | ) | |||||
Prepaid and other current assets | (66 | ) | 6 | (22 | ) | ||||||
Payables and accruals | 22 | 92 | (40 | ) | |||||||
Pension contributions | (19 | ) | (11 | ) | (15 | ) | |||||
Long-term assets, liabilities and other | 68 | 6 | (74 | ) | |||||||
Net cash provided by operating activities | 3,041 | 2,773 | 2,695 | ||||||||
Investing | |||||||||||
Capital expenditures | (1,311 | ) | (1,465 | ) | (1,541 | ) | |||||
Acquisitions, net of cash acquired | (33 | ) | (363 | ) | (82 | ) | |||||
Divestitures and asset sales | 30 | 58 | 320 | ||||||||
Net cash used for investing activities | (1,314 | ) | (1,770 | ) | (1,303 | ) | |||||
Financing | |||||||||||
Short-term debt borrowings (repayments) – net | (199 | ) | 191 | (329 | ) | ||||||
Long-term debt borrowings | 11 | 936 | 1,497 | ||||||||
Long-term debt repayments | (583 | ) | (770 | ) | (1,000 | ) | |||||
Issuances of common stock | 120 | 139 | 88 | ||||||||
Purchases of common stock | (12 | ) | (228 | ) | (725 | ) | |||||
Cash dividends – Praxair, Inc. shareholders | (901 | ) | (856 | ) | (819 | ) | |||||
Excess tax benefit on stock based compensation | — | — | 19 | ||||||||
Noncontrolling interest transactions and other | (92 | ) | (55 | ) | (41 | ) | |||||
Net cash provided (used ) for financing activities | (1,656 | ) | (643 | ) | (1,310 | ) | |||||
Effect of exchange rate changes on cash and cash equivalents | 22 | 17 | (61 | ) | |||||||
Change in cash and cash equivalents | 93 | 377 | 21 | ||||||||
Cash and cash equivalents, beginning-of-period | 524 | 147 | 126 | ||||||||
Cash and cash equivalents, end-of-period | $ | 617 | $ | 524 | $ | 147 | |||||
Supplemental Data | |||||||||||
Income taxes paid | $ | 565 | $ | 585 | $ | 420 | |||||
Interest paid, net of capitalized interest (Note 7) | $ | 184 | $ | 189 | $ | 174 | |||||
The accompanying Notes on pages 60 to 103 are an integral part of these financial statements.
57
CONSOLIDATED STATEMENTS OF EQUITY
PRAXAIR, INC. AND SUBSIDIARIES
(Dollar amounts in millions, except per share data, shares in thousands)
Praxair, Inc. Shareholders’ Equity | |||||||||||||||||||||||||||||||||||||
Common Stock | Additional Paid-in Capital | Retained Earnings | Accumulated Other Comprehensive Income (Loss) (Note 7) | Treasury Stock | Praxair, Inc. Shareholders’ Equity | Noncontrolling Interests | Total Equity | ||||||||||||||||||||||||||||||
Activity | Shares | Amounts | Shares | Amounts | |||||||||||||||||||||||||||||||||
Balance, December 31, 2014 | 383,231 | $ | 4 | $ | 3,994 | $ | 11,461 | $ | (3,185 | ) | 93,969 | $ | (6,651 | ) | $ | 5,623 | $ | 387 | $ | 6,010 | |||||||||||||||||
Net Income | 1,547 | 1,547 | 34 | 1,581 | |||||||||||||||||||||||||||||||||
Other comprehensive income (loss) | (1,411 | ) | (1,411 | ) | (30 | ) | (1,441 | ) | |||||||||||||||||||||||||||||
Noncontrolling interests: | |||||||||||||||||||||||||||||||||||||
Dividends and other capital reductions | (16 | ) | (16 | ) | |||||||||||||||||||||||||||||||||
Additions (Reductions) | 29 | 29 | |||||||||||||||||||||||||||||||||||
Redemption value adjustments (Note 14) | 40 | 40 | 40 | ||||||||||||||||||||||||||||||||||
Dividends to Praxair, Inc. common stock ($2.86 per share) | (819 | ) | (819 | ) | (819 | ) | |||||||||||||||||||||||||||||||
Issuances of common stock: | |||||||||||||||||||||||||||||||||||||
For the dividend reinvestment and stock purchase plan | (64 | ) | 7 | 7 | 7 | ||||||||||||||||||||||||||||||||
For employee savings and incentive plans | (38 | ) | (1,562 | ) | 110 | 72 | 72 | ||||||||||||||||||||||||||||||
Purchases of common stock | 6,009 | (719 | ) | (719 | ) | (719 | ) | ||||||||||||||||||||||||||||||
Tax benefit from stock options | 19 | 19 | 19 | ||||||||||||||||||||||||||||||||||
Share-based compensation | 30 | 30 | 30 | ||||||||||||||||||||||||||||||||||
Balance, December 31, 2015 | 383,231 | $ | 4 | $ | 4,005 | $ | 12,229 | $ | (4,596 | ) | 98,352 | $ | (7,253 | ) | $ | 4,389 | $ | 404 | $ | 4,793 | |||||||||||||||||
Net Income | 1,500 | 1,500 | 35 | 1,535 | |||||||||||||||||||||||||||||||||
Other comprehensive income (loss) | (4 | ) | (4 | ) | (11 | ) | (15 | ) | |||||||||||||||||||||||||||||
Noncontrolling interests: | |||||||||||||||||||||||||||||||||||||
Dividends and other capital reductions | (28 | ) | (28 | ) | |||||||||||||||||||||||||||||||||
Additions (Reductions) | 50 | 50 | 20 | 70 | |||||||||||||||||||||||||||||||||
Redemption value adjustments (Note 14) | 6 | 6 | 6 | ||||||||||||||||||||||||||||||||||
Dividends to Praxair, Inc. common stock ($3 per share) | (856 | ) | (856 | ) | (856 | ) | |||||||||||||||||||||||||||||||
58
Praxair, Inc. Shareholders’ Equity | |||||||||||||||||||||||||||||||||||||
Common Stock | Additional Paid-in Capital | Retained Earnings | Accumulated Other Comprehensive Income (Loss) (Note 7) | Treasury Stock | Praxair, Inc. Shareholders’ Equity | Noncontrolling Interests | Total Equity | ||||||||||||||||||||||||||||||
Activity | Shares | Amounts | Shares | Amounts | |||||||||||||||||||||||||||||||||
Issuances of common stock: | |||||||||||||||||||||||||||||||||||||
For the dividend reinvestment and stock purchase plan | (60 | ) | 7 | 7 | 7 | ||||||||||||||||||||||||||||||||
For employee savings and incentive plans | (20 | ) | (2,044 | ) | 143 | 123 | 123 | ||||||||||||||||||||||||||||||
Other | 5 | 5 | 5 | ||||||||||||||||||||||||||||||||||
Purchases of common stock | 2,082 | (238 | ) | (238 | ) | (238 | ) | ||||||||||||||||||||||||||||||
Share-based compensation | 39 | 39 | 39 | ||||||||||||||||||||||||||||||||||
Balance, December 31, 2016 | 383,231 | $ | 4 | $ | 4,074 | $ | 12,879 | $ | (4,600 | ) | 98,330 | $ | (7,336 | ) | $ | 5,021 | $ | 420 | $ | 5,441 | |||||||||||||||||
Net Income | 1,247 | 1,247 | 59 | 1,306 | |||||||||||||||||||||||||||||||||
Other comprehensive loss | 502 | 502 | 34 | 536 | |||||||||||||||||||||||||||||||||
Noncontrolling interests: | |||||||||||||||||||||||||||||||||||||
Dividends and other capital reductions | (35 | ) | (35 | ) | |||||||||||||||||||||||||||||||||
Additions (Reductions) - (Note 14) | — | — | 15 | 15 | |||||||||||||||||||||||||||||||||
Redemption value adjustments (Note 14) | (1 | ) | (1 | ) | (1 | ) | |||||||||||||||||||||||||||||||
Dividends to Praxair, Inc. common stock ($3.15 per share) | (901 | ) | (901 | ) | (901 | ) | |||||||||||||||||||||||||||||||
Issuances of common stock: | |||||||||||||||||||||||||||||||||||||
For the dividend reinvestment and stock purchase plan | (50 | ) | 7 | 7 | 7 | ||||||||||||||||||||||||||||||||
For employee savings and incentive plans | (49 | ) | (1,835 | ) | 134 | 85 | 85 | ||||||||||||||||||||||||||||||
Other | — | — | — | ||||||||||||||||||||||||||||||||||
Purchases of common stock | 9 | (1 | ) | (1 | ) | (1 | ) | ||||||||||||||||||||||||||||||
Share-based compensation | 59 | 59 | 59 | ||||||||||||||||||||||||||||||||||
Balance, December 31, 2017 | 383,231 | $ | 4 | $ | 4,084 | $ | 13,224 | $ | (4,098 | ) | 96,454 | $ | (7,196 | ) | $ | 6,018 | $ | 493 | $ | 6,511 | |||||||||||||||||
The accompanying Notes on pages 60 to 103 are an integral part of these financial statements
59
NOTES TO CONSOLIDATED FINANCIAL STATEMENTS
PRAXAIR, INC. AND SUBSIDIARIES
NOTE 1. SUMMARY OF SIGNIFICANT ACCOUNTING POLICIES
Operations – Praxair, Inc. and its subsidiaries ("Praxair" or "the company") comprise one of the largest industrial gases companies worldwide. Praxair produces, sells and distributes atmospheric, process and specialty gases, and high-performance surface coatings to a diverse group of industries including aerospace, chemicals, food and beverage, electronics, energy, healthcare, manufacturing, and metals.
Principles of Consolidation – The consolidated financial statements were prepared in conformity with accounting principles generally accepted in the United States of America (" U.S. GAAP") and include the accounts of all significant subsidiaries where control exists and, in limited situations, variable-interest entities where the company is the primary beneficiary. Intercompany transactions and balances are eliminated in consolidation and any significant related-party transactions have been disclosed.
Equity investments generally consist of 20% to 50% owned operations where the company exercises significant influence, but does not have control. Equity income from equity investments in corporations is reported on an after-tax basis. Pre-tax income from equity investments that are partnerships or limited-liability corporations ("LLC") is included in other income (expenses) – net with related taxes included in Income taxes. Equity investments are reviewed for impairment whenever events or circumstances reflect that an impairment loss may have incurred. Operations less than 20% owned, where the company does not exercise significant influence, are generally carried at cost.
Changes in ownership interest that result either in consolidation or deconsolidation of an investment are recorded at fair value through earnings, including the retained ownership interest, while changes that do not result in either consolidation or deconsolidation of a subsidiary are treated as equity transactions.
Use of Estimates – The preparation of financial statements in conformity with U.S. GAAP requires management to make estimates and assumptions that affect the reported amounts of assets and liabilities and the disclosure of contingent assets and liabilities at the date of the financial statements and the reported amounts of revenues and expenses during the reporting period. While actual results could differ, management believes such estimates to be reasonable.
Revenue Recognition – Revenue is recognized when a firm sales agreement exists, collectability of a fixed or determinable sales price is reasonably assured, and when title and risks of ownership transfer to the customer for product sales or, in the case of other revenues when obligations are satisfied or services are performed. Sales returns and allowances are not a normal practice in the industry and are not significant.
For contracts that contain multiple products and/or services, amounts assigned to each component are based on its objectively determined fair value, such as the sales price for the component when it is sold separately or competitor prices for similar components.
Certain of the company’s facilities that are built to provide product to a specific customer are required to be accounted for as leases. The associated revenue streams are classified as rental revenue and are not significant.
Amounts billed for shipping and handling fees are recorded as sales, generally on FOB destination terms, and costs incurred for shipping and handling are recorded as cost of sales.
Amounts billed for sales and use taxes, value-added taxes, and certain excise and other specific transactional taxes imposed on revenue producing transactions are presented on a net basis and are not included in sales in the consolidated statement of income.
Cash Equivalents – Cash equivalents are considered to be highly liquid securities with original maturities of three months or less.
Inventories – Inventories are stated at the lower of cost or net realizable value. Cost is determined using the average-cost method.
Property, Plant and Equipment – Net – Property, plant and equipment are carried at cost, net of accumulated depreciation. The company capitalizes interest as part of the cost of constructing major facilities (see Note 7). Depreciation is calculated on the straight-line method based on the estimated useful lives of the assets, which range from 3 years to 40 years (see Note 8). Praxair uses accelerated depreciation methods for tax purposes where appropriate. Maintenance of property, plant and equipment is generally expensed as incurred.
The company performs a test for impairment whenever events or changes in circumstances indicate that the carrying amount of an individual asset or asset group may not be recoverable. Should projected undiscounted future cash flows be less
60
than the carrying amount of the asset or asset group, an impairment charge reducing the carrying amount to fair value is required. Fair value is determined based on the most appropriate valuation technique, including discounted cash flows.
Asset-Retirement Obligations – An asset-retirement obligation is recognized in the period in which sufficient information exists to determine the fair value of the liability with a corresponding increase to the carrying amount of the related property, plant and equipment which is then depreciated over its useful life. The liability is initially measured at discounted fair value and then accretion expense is recorded in each subsequent period. The company’s asset-retirement obligations are primarily associated with its on-site long-term supply arrangements where the company has built a facility on land leased from the customer and is obligated to remove the facility at the end of the contract term. The company’s asset-retirement obligations are not material to its consolidated financial statements.
Foreign Currency Translation – For most foreign operations, the local currency is the functional currency and translation gains and losses are reported as part of the accumulated other comprehensive income (loss) component of equity as a cumulative translation adjustment (see Note 7).
Financial Instruments – Praxair enters into various derivative financial instruments to manage its exposure to fluctuating interest and currency exchange rates and energy costs. Such instruments primarily include interest-rate swap and treasury rate lock agreements; currency-swap agreements; forward contracts; currency options; and commodity-swap agreements. These instruments are not entered into for trading purposes. Praxair only uses commonly traded and non-leveraged instruments.
There are three types of derivatives the company enters into: (i) those relating to fair-value exposures, (ii) those relating to cash-flow exposures, and (iii) those relating to foreign currency net investment exposures. Fair-value exposures relate to recognized assets or liabilities, and firm commitments; cash-flow exposures relate to the variability of future cash flows associated with recognized assets or liabilities, or forecasted transactions; and net investment exposures relate to the impact of foreign currency exchange rate changes on the carrying value of net assets denominated in foreign currencies.
When a derivative is executed and hedge accounting is appropriate, it is designated as either a fair-value hedge, cash-flow hedge, or a net investment hedge. Currently, Praxair designates all interest-rate and treasury rate locks as hedges for accounting purposes; however, currency contracts are generally not designated as hedges for accounting purposes unless they are related to forecasted transactions. Whether designated as hedges for accounting purposes or not, all derivatives are linked to an appropriate underlying exposure. On an ongoing basis, the company assesses the hedge effectiveness of all derivatives designated as hedges for accounting purposes to determine if they continue to be highly effective in offsetting changes in fair values or cash flows of the underlying hedged items. If it is determined that the hedge is not highly effective, then hedge accounting will be discontinued prospectively.
Changes in the fair value of derivatives designated as fair-value hedges are recognized in earnings as an offset to the change in the fair values of the underlying exposures being hedged. The changes in fair value of derivatives that are designated as cash-flow hedges are deferred in accumulated other comprehensive income (loss) and are reclassified to earnings as the underlying hedged transaction affects earnings. Any ineffectiveness is recognized in earnings immediately. Hedges of net investments in foreign subsidiaries are recognized in the cumulative translation adjustment component of accumulated other comprehensive income (loss) on the consolidated balance sheets to offset translation gains and losses associated with the hedged net investment. Derivatives that are entered into for risk-management purposes and are not designated as hedges (primarily related to anticipated net income and currency derivatives other than for firm commitments) are recorded at their fair market values and recognized in current earnings.
See Note 12 for additional information relating to financial instruments.
Goodwill – Acquisitions are accounted for using the acquisition method which requires allocation of the purchase price to assets acquired and liabilities assumed based on estimated fair values. Any excess of the purchase price over the fair value of the assets and liabilities acquired is recorded as goodwill. Allocations of the purchase price are based on preliminary estimates and assumptions at the date of acquisition and are subject to revision based on final information received, including appraisals and other analyses which support underlying estimates.
The company performs a goodwill impairment test annually in the second quarter or more frequently if events or circumstances indicate that an impairment loss may have been incurred. The applicable guidance allows an entity to first assess qualitative factors to determine if it is more likely than not that the fair value of a reporting unit is less than carrying value. If it is determined that it is more likely than not that the fair value of a reporting unit is less than carrying value then the company will estimate and compare the fair value of its reporting units to their carrying value, including goodwill. Reporting units are determined based on one level below the operating segment level. As applicable, fair value is determined through the use of projected future cash flows, multiples of earnings and sales and other factors. Such analysis requires the use of certain market assumptions and discount factors, which are subjective in nature.
See Note 9 for additional information relating to goodwill.
61
Other Intangible Assets – Customer and license/use agreements, non-compete agreements and patents and other intangibles are amortized over the estimated period of benefit. The determination of the estimated period of benefit will be dependent upon the use and underlying characteristics of the intangible asset. Praxair evaluates the recoverability of its intangible assets subject to amortization when facts and circumstances indicate that the carrying value of the asset may not be recoverable. If the carrying value is not recoverable, impairment is measured as the amount by which the carrying value exceeds its estimated fair value. Fair value is generally estimated based on either appraised value or other valuation techniques.
See Note 10 for additional information relating to other intangible assets.
Income Taxes – Deferred income taxes are recorded for the temporary differences between the financial statement and tax bases of assets and liabilities using currently enacted tax rates. Valuation allowances are established against deferred tax assets whenever circumstances indicate that it is more likely than not that such assets will not be realized in future periods.
Under the guidance for accounting for uncertainty in income taxes, the company can recognize the benefit of an income tax position only if it is more likely than not (greater than 50%) that the tax position will be sustained upon tax examination, based solely on the technical merits of the tax position. Otherwise, no benefit can be recognized. The tax benefits recognized are measured based on the largest benefit that has a greater than 50% likelihood of being realized upon ultimate settlement. Additionally, the company accrues interest and related penalties, if applicable, on all tax exposures for which reserves have been established consistent with jurisdictional tax laws. Interest and penalties are classified as income tax expense in the financial statements.
See Note 5 for additional information relating to income taxes, including the U.S. Tax Cuts and Jobs Act enacted in December 2017.
Retirement Benefits – Most Praxair employees participate in a form of defined benefit or contribution retirement plan, and additionally certain employees are eligible to participate in various post-employment health care and life insurance benefit plans. The cost of contribution plans is recognized in the year earned while the cost of other plans is recognized over the employees’ expected service period to the company, all in accordance with the applicable accounting standards. The funded status of the plans is recorded as an asset or liability in the consolidated balance sheets. Funding of retirement benefits varies and is in accordance with local laws and practices.
See Note 16 for additional information relating to retirement programs.
Share-based Compensation– The company has granted share-based awards which consist of stock options, restricted stock and performance-based stock. Share-based compensation expense is generally recognized on a straight-line basis over the stated vesting period. For stock awards granted to full-retirement-eligible employees, compensation expense is recognized over the period from the grant date to the date retirement eligibility is achieved. For performance-based awards, compensation expense is recognized only if it is probable that the performance condition will be achieved.
See Note 15 for additional disclosures relating to share-based compensation.
Recently Issued Accounting Standards
Accounting Standards Implemented in 2017
The following standards were effective for Praxair in 2017 and their adoption did not have a significant impact on the consolidated financial statements:
• | Simplifying the Measurement of Inventory – In July 2015, the FASB issued updated guidance on the measurement of inventory. The new guidance requires that inventory be measured at the lower of cost or net realizable value, previously inventory was measured at the lower of cost or market. The adoption of this guidance resulted in no material impact. |
Accounting Standards to be Implemented
• | Revenue Recognition – In May 2014, the FASB issued updated guidance on the reporting and disclosure of revenue. The new guidance requires the evaluation of contracts with customers to determine the recognition of revenue when or as the entity satisfies a performance obligation, and requires expanded disclosures. Subsequently, the FASB has issued amendments to certain aspects of the guidance including the effective date. This guidance is required to be effective beginning in the first quarter 2018 and includes several transition options. |
The Company is prepared to adopt the new standard on January 1, 2018 using the modified retrospective transition option. The impact of adoption is not expected to be material to the consolidated financial statements.
62
• | Leases – In February 2016, the FASB issued updated guidance on the accounting and financial statement presentation of leases. The new guidance requires lessees to recognize a right-of-use asset and lease liability for all leases, except those that meet certain scope exceptions, and would require expanded quantitative and qualitative disclosures. This guidance will be effective for Praxair beginning in the first quarter 2019 and requires companies to transition using a modified retrospective approach. Praxair is in the early stages of reviewing the new guidance and will provide updates on the expected impact to Praxair in future filings, as determined. |
• | Credit Losses on Financial Instruments – In June 2016, the FASB issued an update on the measurement of credit losses. The guidance introduces a new accounting model for expected credit losses on financial instruments, including trade receivables, based on estimates of current expected credit losses. This guidance will be effective for Praxair beginning in the first quarter 2020, with early adoption permitted beginning in the first quarter 2019 and requires companies to apply the change in accounting on a prospective basis. Praxair is currently evaluating the impact this update will have on our consolidated financial statements. |
• | Classification of Certain Cash Receipts and Cash Payments – In August 2016, the FASB issued updated guidance on the classification of certain cash receipts and cash payments within the statement of cash flows. The update provides accounting guidance for specific cash flow issues with the objective of reducing diversity in practice. This new guidance will be effective for Praxair beginning in the first quarter 2018 on a retrospective basis, with early adoption optional. Praxair does not expect this update to have a material impact. |
• | Intra-Entity Asset Transfers – In October 2016, the FASB issued updated guidance for income tax accounting of intra-entity transfers of assets other than inventory. The update requires an entity to recognize the income tax consequences of an intra-entity transfer of an asset other than inventory in the period when the transfer occurs. This new guidance will be effective for Praxair beginning in the first quarter 2018, with early adoption permitted, and should be applied on a modified retrospective basis. Praxair is currently evaluating the impact this update will have on our consolidated financial statements. |
• | Simplifying the Test for Goodwill Impairment – In January 2017, the FASB issued updated guidance on the measurement of goodwill. The new guidance eliminates the requirement to calculate the implied fair value of goodwill to measure a goodwill impairment charge. The guidance will be effective for Praxair beginning in the first quarter 2020 with early adoption permitted. Praxair does not expect this guidance to have a material impact. |
• | Pension Costs - In March 2017, the FASB issued updated guidance on the presentation of net periodic pension cost and net periodic postretirement benefit cost. The new guidance requires the service cost component be reported in the same line item or items as other compensation costs arising from services rendered by employees during the period. The other components of net benefit cost are required to be presented in the income statement separately from the service cost component and not included within operating profit. This guidance will be effective for Praxair beginning in the first quarter 2018 and requires companies to transition using a retrospective approach for the presentation of the service cost component and the other cost components and prospectively for the capitalization of the service cost component. |
• | Derivatives and Hedging - In August 2017, the FASB issued updated guidance on accounting for hedging activities. The new guidance changes both the designation and measurement for qualifying hedging relationships and the presentation of hedge results. This guidance will be effective for Praxair beginning in the first quarter 2019, with early adoption optional. Praxair is currently evaluating the impact this update will have on our consolidated financial statements. |
• | Reclassification of Certain Tax Effects from Accumulated Other Comprehensive Income – In February 2018, the FASB issued updated guidance which allows a reclassification from accumulated other comprehensive income to retained earnings for stranded tax effects resulting from the Tax Cuts and Jobs Act. This new guidance will be effective for Praxair beginning in the first quarter 2019 on a retrospective basis, with early adoption optional. Praxair is currently assessing the impact and timing of adoption. |
Reclassifications – Certain prior years’ amounts have been reclassified to conform to the current year’s presentation.
63
NOTE 2. TRANSACTION COSTS AND OTHER CHARGES
2017 Charges
Transaction Costs
On June 1, 2017 Praxair and Linde AG ("Linde") entered into a business combination agreement, pursuant to which they agreed to combine their respective businesses subject to shareholder and regulatory approvals (see Note 20). In connection with the intended business combination, Praxair incurred transaction costs which totaled $52 million for the year ended December 31, 2017 ($48 million after-tax or $0.17 per diluted share).
Pension Settlement Charge
In addition, in the third quarter of 2017, a series of lump sum benefit payments for employees under an international pension plan triggered a settlement of the related pension obligation. Accordingly, Praxair recorded a pension settlement charge of $2 million ($1 million after-tax).
2016 Charges
Cost Reduction Program and Other Charges
In the third quarter of 2016, Praxair recorded pre-tax charges totaling $96 million ($63 million after-tax and noncontrolling interests of $0.22 per diluted share). Following is a summary of the pre-tax charge by reportable segment:
(millions of dollars) | Severance costs | Other Charges | Total | ||||||||
North America | $ | 14 | $ | 29 | $ | 43 | |||||
Europe | 12 | 3 | 15 | ||||||||
South America | 5 | 7 | 12 | ||||||||
Asia | 6 | 13 | 19 | ||||||||
Surface Technologies | 3 | 4 | 7 | ||||||||
Total | $ | 40 | $ | 56 | $ | 96 | |||||
The severance costs of $40 million are for the elimination of 730 positions. The other charges of $56 million are primarily related to (i) the consolidation of operations for efficiencies and cost reduction primarily in North America and Surface Technologies, (ii) integration costs for recent acquisitions in Europe and North America, and (iii) asset write-downs and other charges related to the impacts of weaker underlying industrial activity, primarily in the Americas and Asia. Amounts related to asset write-downs are net of expected sale proceeds, which are not significant.
The total cash requirement of the cost reduction program and other charges are estimated to be approximately $50 million. At December 31, 2017, the actions are substantially completed.
Pension Settlement Charge
In 2015 a number of senior managers retired. These retirees are covered by the U.S. supplemental pension plan which provides for a lump sum benefit payment option. Under certain circumstances, such lump sum payments must be accounted for as a settlement of the related pension obligation, but only when paid. Accordingly, in the third quarter of 2016, Praxair recorded a pension settlement charge related to net unrecognized actuarial losses of $4 million ($3 million after-tax or $0.01 per diluted share).
2015 Charges
Cost Reduction Program and other Charges
In the second quarter of 2015, Praxair recorded pre-tax charges totaling $146 million ($112 million after-tax and noncontrolling interests or $0.39 per diluted share) and in the third quarter recorded pre-tax charges totaling $19 million ($13 million after-tax or $0.04 per diluted share). The charges related primarily to severance and other costs associated
64
with a cost reduction program, which was initiated in response to lower volumes resulting from economic slowdown in emerging markets and energy related end-markets. Following is a summary of the pre-tax charges by reportable segment:
(millions of dollars) | Severance costs | Other Charges | Total | ||||||||
North America | $ | 14 | $ | 20 | $ | 34 | |||||
Europe | 11 | 9 | 20 | ||||||||
South America | 18 | 49 | 67 | ||||||||
Asia | 11 | 14 | 25 | ||||||||
Surface Technologies | 9 | 10 | 19 | ||||||||
Total | $ | 63 | $ | 102 | $ | 165 | |||||
The severance costs of $63 million are for the elimination of 1,544 positions. A majority of the actions were completed in 2015.
The other charges of $102 million are primarily related to the consolidation of operations and the exit of other operations due to current economic conditions, primarily in Brazil. Amounts related to asset write-downs are net of expected sale proceeds, which are not significant. Following is a summary:
i. | The North America charges of $20 million relate primarily to the decision to consolidate certain manufacturing and distribution locations for efficiencies and cost reduction. |
ii. | The Europe charges of $9 million are primarily for the restructuring of operations in Russia and energy-related businesses in Northern Europe. |
iii. | The South America charges of $49 million include costs primarily associated with a decision to exit a non-core business and other operations in South America. |
iv. | The Asia charges of $14 million include costs primarily related to an asset disposal in China. |
v. | The Surface Technologies charges of $10 million relate to the realignment of sales and manufacturing operations in Europe and the United States for efficiencies and cost reduction. |
Additionally, for the year ended December 31, 2015 income taxes include a $10 million increase in valuation allowances relating to U.S. foreign tax credit carryforwards, reflecting the impact of current economic conditions.
The total cash requirements of the cost reduction program and other charges are estimated to be approximately $90 million. As of December 31, 2017 the actions were completed.
Pension Settlement Charge
In 2014 a number of senior managers retired. These retirees are covered by the U.S. supplemental pension plan which provides for a lump sum benefit payment option. Under certain circumstances, such lump sum payments must be accounted for as a settlement of the related pension obligation, but only when paid. Accordingly, when the cash payments were made in the third quarter of 2015, Praxair recorded a pension settlement charge related to net unrecognized actuarial losses of $7 million ($5 million after-tax or $0.02 per diluted share).
Reconciliation of the Cost Reduction Programs
The following table summarizes the activities related to the company's cost reduction programs for the years ended December 31, 2017 and 2016:
65
(millions of dollars) | Severance costs | Other Charges | Total | ||||||||
Balance, December 31, 2015 | $ | 30 | $ | 20 | $ | 50 | |||||
2016 Cost Reduction Program and Other Charges | 40 | 56 | 96 | ||||||||
Less: Cash payments | (33 | ) | (9 | ) | (42 | ) | |||||
Less: Non-cash asset write-offs | — | (39 | ) | (39 | ) | ||||||
Foreign currency translation and other | 1 | (1 | ) | — | |||||||
Balance, December 31, 2016 | $ | 38 | $ | 27 | $ | 65 | |||||
Less: Cash payments | (33 | ) | (5 | ) | (38 | ) | |||||
Foreign currency translation and other | 11 | (17 | ) | (6 | ) | ||||||
Balance, December 31, 2017 | $ | 16 | $ | 5 | $ | 21 | |||||
Classification in the consolidated financial statements
The pre-tax charges for each year are shown within operating profit in a separate line item on the consolidated statements of income. In the consolidated balance sheets, reductions in assets are recorded against the carrying value of the related assets and unpaid amounts are recorded primarily as short-term liabilities. On the consolidated statement of cash flows, the pre-tax impact of these charges, net of cash payments, is shown as an adjustment to reconcile net income to net cash provided by operating activities. In Note 18 - Segment Information, Praxair excluded these charges from its management definition of segment operating profit; a reconciliation of segment operating profit to consolidated operating profit is shown within the segment operating profit table.
66
NOTE 3. ACQUISITIONS
The results of operations of these businesses have been included in Praxair’s consolidated statements of income since their respective dates of acquisition. Proforma financial statements for the following acquisitions have not been provided as the acquisitions are not material individually or in the aggregate.
2017 Acquisitions
During the year ended December 31, 2017, Praxair had acquisitions totaling $33 million, primarily acquisitions of packaged gas businesses and a carbon dioxide joint venture in North America. These transactions resulted in goodwill and other intangible assets of $24 million and $3 million, respectively (see Notes 9 and 10).
2016 Acquisitions
During the year ended December 31, 2016, Praxair had acquisitions totaling $363 million, primarily the acquisition of Yara International ASA's European carbon dioxide business ("European CO2 business") and packaged gases businesses in North America and Europe. These transactions resulted in goodwill and other intangible assets of $141 million and $82 million, respectively (see Notes 9 and 10). In addition, Praxair purchased a remaining 34% share in a Scandinavian joint venture for $104 million (see Note 14).
European CO2 Acquisition
On June 1, 2016 Praxair, Inc. completed an acquisition of a European CO2 business, which is a leading supplier of liquid CO2 and dry ice primarily to the European food and beverage industries. The business operates CO2 liquefaction plants and dry ice production facilities across the UK, Ireland, Norway, Denmark, Germany, Netherlands, Belgium, France and Italy. This acquisition was accounted for as a business combination; accordingly, the results of operations were consolidated from June 1, 2016 in the European business segment.
The purchase price for the acquisition was approximately $230 million (€206 million) and resulted in $121 million of intangible assets. The intangible assets primarily consist of $69 million of goodwill and $51 million of customer relationships that will be amortized over their estimated life of 20 years.
2015 Acquisitions
During the year-ended December 31, 2015 Praxair had acquisitions totaling $82 million, primarily acquisitions of packaged gases businesses in North and South America and an acquisition of a controlling interest of an equity investment in Asia. These transactions resulted in goodwill and other intangible assets of $56 million and $26 million, respectively (see Notes 9 and 10).
NOTE 4. LEASES
In the normal course of its business, Praxair enters into various leases as the lessee, primarily involving manufacturing and distribution equipment and office space. Total lease and rental expenses under operating leases were $146 million in 2017, $141 million in 2016 and $141 million in 2015. Capital leases are not significant and are included in property, plant and equipment – net. Related obligations are included in debt.
At December 31, 2017, minimum payments due under operating leases are as follows:
(Millions of dollars) | |||
2018 | $ | 131 | |
2019 | 114 | ||
2020 | 94 | ||
2021 | 76 | ||
2022 | 61 | ||
Thereafter | 107 | ||
$ | 583 | ||
The present value of these future lease payments under operating leases is approximately $526 million.
Praxair’s leases where it is the lessor are not material.
67
NOTE 5. INCOME TAXES
Pre-tax income applicable to U.S. and foreign operations is as follows:
(Millions of dollars) Year Ended December 31, | 2017 | 2016 | 2015 | ||||||||
United States | $ | 1,003 | $ | 954 | $ | 980 | |||||
Foreign | 1,284 | 1,094 | 1,180 | ||||||||
Total income before income taxes | $ | 2,287 | $ | 2,048 | $ | 2,160 | |||||
U.S. Tax Cuts and Jobs Act (Tax Act)
On December 22, 2017 the U.S. government enacted the Tax Cuts and Jobs Act (Tax Act). This comprehensive tax legislation significantly revises the U.S. corporate income tax rules by, among other things, lowering the corporate income tax rate from 35% to 21%, implementing a territorial tax system and imposing a one-time tax on accumulated earnings of foreign subsidiaries. Given the substantial uncertainties surrounding the Tax Act and the short period of time between December 22, 2017 and December 31, 2017 to calculate the U.S. Federal, U.S. state, and non-U.S. tax impacts of the Tax Act, the Company is accounting for its income tax charge on a provisional (estimated) basis as allowed by SEC Staff Accounting Bulletin No. 118. The Company’s net provisional income tax charge of $394 million has three main components: (i) an estimated $467 million U.S. federal and state tax charge for deemed repatriation of accumulated foreign earnings; (ii) an estimated $260 million charge for foreign withholding taxes related to anticipated future repatriation of foreign earnings; and (iii) an estimated $333 million deferred tax benefit for the revaluation of net deferred tax liabilities from 35% to the new 21% tax rate. The $467 million U.S. federal and state tax charge for deemed repatriation of accumulated foreign earnings includes $422 million of deemed repatriation tax payable over eight years, of which $388 million is classified as of December 31, 2017 as other long-term liabilities on the consolidated balance sheets (see Note 7).
During 2018, the Company will continue to evaluate the Tax Act, additional guidance from the Internal Revenue Service, its historical foreign earnings and taxes and other items that could impact its net provisional tax charge. Additionally, the Company will continue to review its foreign capital structures, organizational cash needs and the foreign withholding tax cost of planned repatriation. As new information becomes available, the Company will update its provisional estimate and record any changes to its income tax expense at that time. Further, the Tax Act enacted new provisions related to the taxation of foreign earnings, known as GILTI. The Company has elected as an accounting policy to account for GILTI as period costs when incurred.
The following is an analysis of the provision for income taxes:
(Millions of dollars) Year Ended December 31, | 2017 (a) | 2016 | 2015 | ||||||||
Current tax expense | |||||||||||
U.S. federal | $ | 565 | $ | 266 | $ | 205 | |||||
State and local | 84 | 32 | 33 | ||||||||
Foreign | 374 | 266 | 275 | ||||||||
1,023 | 564 | 513 | |||||||||
Deferred tax expense (benefit) | |||||||||||
U.S. federal | (221 | ) | 3 | 71 | |||||||
State and local | 19 | 7 | 10 | ||||||||
Foreign | 205 | (23 | ) | 18 | |||||||
3 | (13 | ) | 99 | ||||||||
Total income taxes | $ | 1,026 | $ | 551 | $ | 612 | |||||
68
(a) | Includes the following amounts related to the Tax Act: |
Current | Deferred | Total | |||||||||
U.S. federal | $ | 414 | $ | (333 | ) | $ | 81 | ||||
State and local | 53 | — | 53 | ||||||||
Foreign | 60 | 200 | 260 | ||||||||
Total tax act | $ | 527 | $ | (133 | ) | $ | 394 | ||||
An analysis of the difference between the provision for income taxes and the amount computed by applying the U.S. statutory income tax rate to pre-tax income follows:
(Dollar amounts in millions) Year Ended December 31, | 2017 | 2016 | 2015 | |||||||||||||||||
U.S. statutory income tax rate | $ | 801 | 35.0 | % | $ | 717 | 35.0 | % | $ | 756 | 35.0 | % | ||||||||
State and local taxes – net of federal benefit | 32 | 1.4 | % | 28 | 1.4 | % | 28 | 1.3 | % | |||||||||||
U.S. tax credits and deductions (a) | (27 | ) | (1.2 | )% | (32 | ) | (1.6 | )% | (40 | ) | (1.9 | )% | ||||||||
Foreign tax differentials (b) | (145 | ) | (6.3 | )% | (140 | ) | (6.8 | )% | (121 | ) | (5.6 | )% | ||||||||
Share Based Compensation | (35 | ) | (1.5 | )% | (20 | ) | (1.0 | )% | — | — | % | |||||||||
Tax Act | 394 | 17.2 | % | — | — | % | — | — | % | |||||||||||
Other – net | 6 | 0.3 | % | (2 | ) | (0.1 | )% | (11 | ) | (0.5 | )% | |||||||||
Provision for income taxes | $ | 1,026 | 44.9 | % | $ | 551 | 26.9 | % | $ | 612 | 28.3 | % | ||||||||
________________________
(a) | U.S. tax credits and deductions relate to manufacturing deductions and to the research and experimentation tax credit. |
(b) | Primarily related to differences between the U.S. tax rate of 35% and the statutory tax rate in the countries where Praxair operates. Other permanent items and tax rate changes were not significant. |
69
Net deferred tax liabilities included in the consolidated balance sheet are comprised of the following:
(Millions of dollars) December 31, | 2017 | 2016 | |||||
Deferred tax liabilities | |||||||
Fixed assets | $ | 1,128 | $ | 1,522 | |||
Exchange gains | 32 | 139 | |||||
Goodwill | 143 | 178 | |||||
Other intangible assets | 72 | 115 | |||||
Foreign undistributed earnings | 200 | — | |||||
Other | 61 | 62 | |||||
$ | 1,636 | $ | 2,016 | ||||
Deferred tax assets | |||||||
Carryforwards | $ | 209 | $ | 284 | |||
Benefit plans and related (a) | 257 | 404 | |||||
Inventory | 16 | 26 | |||||
Accruals and other (b) | 261 | 410 | |||||
$ | 743 | $ | 1,124 | ||||
Less: Valuation allowances (c) | (76 | ) | (132 | ) | |||
$ | 667 | $ | 992 | ||||
Net deferred tax liabilities | $ | 969 | $ | 1,024 | |||
Recorded in the consolidated balance sheets as (See Note 7): | |||||||
Other long-term assets | 198 | 185 | |||||
Deferred credits | 1,167 | 1,209 | |||||
$ | 969 | $ | 1,024 | ||||
________________________
(a) | Includes deferred taxes of $217 million and $352 million in 2017 and 2016, respectively, related to pension / OPEB funded status (see Notes 7 and 16). |
(b) | Includes $130 million and $233 million in 2017 and 2016, respectively, related to research and development costs and $42 million and $45 million in 2017 and 2016, respectively, related to goodwill. |
(c) | Summary of valuation allowances relating to deferred tax assets follows (millions of dollars): |
2017 | 2016 | 2015 | ||||||||||
Balance, January 1, | $ | (132 | ) | $ | (123 | ) | $ | (106 | ) | |||
Income tax (charge) benefit (i) | 59 | (13 | ) | (20 | ) | |||||||
Translation adjustments | (3 | ) | (2 | ) | 4 | |||||||
Other, including write-offs | — | 6 | (1 | ) | ||||||||
Balance, December 31, | $ | (76 | ) | $ | (132 | ) | $ | (123 | ) | |||
(i) | 2017 includes a $59 million benefit related to the utilization of foreign tax credits under the Tax Act. |
Praxair evaluates deferred tax assets quarterly to ensure that estimated future taxable income will be sufficient in character (e.g., capital gain versus ordinary income treatment), amount and timing to result in their recovery. After considering the positive and negative evidence, a valuation allowance is established to reduce the assets to their realizable value when management determines that it is more likely than not (i.e., greater than 50% likelihood) that a deferred tax asset will not be realized. Considerable judgment is required in establishing deferred tax valuation allowances. At December 31, 2017, Praxair had $209 million of deferred tax assets relating to net operating losses (“NOLs”) and tax credits and $76 million of valuation allowances. These deferred tax assets include $93 million relating to NOLs of which
70
$25 million are in the United States and $68 million are in Brazil. The U.S. NOLs expire through 2032 and the Brazil NOLs have no expiration. These NOLs have no valuation allowances.
The remaining deferred tax assets of $116 million relate to U.S. state ($50 million) and other foreign ($66 million) NOLs and credit carryforwards, which expire through 2033, and have valuation allowances totaling $76 million. These valuation allowances relate to certain foreign and U.S. state NOLs and are required because management has determined, based on financial projections and available tax strategies, that it is unlikely that the NOLs will be utilized before they expire. If events or circumstances change, valuation allowances are adjusted at that time resulting in an income tax benefit or charge.
In 2017, due to the Tax Act, the Company provided $467 million of U.S. income tax on approximately $13 billion of accumulated undistributed foreign earnings and $260 million of foreign withholding tax related to the planned repatriation of approximately $4 billion of such undistributed earnings. A provision has not been made for any additional foreign income tax at December 31, 2017 on approximately $9 billion of remaining undistributed foreign earnings because Praxair intends to reinvest these earnings indefinitely. While these earnings could become subject to additional foreign income tax if they are remitted as dividends, it is not practicable to estimate the unrecognized deferred tax liability on these undistributed earnings.
Uncertain Tax Positions
Unrecognized income tax benefits represent income tax positions taken on income tax returns but not yet recognized in the consolidated financial statements. The company has unrecognized income tax benefits totaling $54 million, $56 million and $68 million as of December 31, 2017, 2016 and 2015, respectively. If recognized, essentially all of the unrecognized tax benefits and related interest and penalties would be recorded as a benefit to income tax expense on the consolidated statement of income.
A reconciliation of the beginning and ending amount of unrecognized tax benefits is as follows:
(Millions of dollars) | 2017 | 2016 | 2015 | ||||||||
Unrecognized income tax benefits, January 1 | $ | 56 | $ | 68 | $ | 71 | |||||
Additions for tax positions of prior years | 48 | 6 | 21 | ||||||||
Reductions for tax positions of prior years | (26 | ) | (15 | ) | (13 | ) | |||||
Reductions for settlements with taxing authorities (a) | (26 | ) | (2 | ) | (3 | ) | |||||
Foreign currency translation and other | 2 | (1 | ) | (8 | ) | ||||||
Unrecognized income tax benefits, December 31 | $ | 54 | $ | 56 | $ | 68 | |||||
________________________
(a) | Settlements are uncertain tax positions that were effectively settled with the taxing authorities, including positions where the company has agreed to amend its tax returns to eliminate the uncertainty. |
Praxair classifies interest income and expense related to income taxes as tax expense in the consolidated statement of income. Praxair recognized net interest expense of $8 million in 2017, net interest income of $10 million in 2016, and none in 2015. Praxair had $8 million and $6 million of accrued interest and penalties as of December 31, 2017 and December 31, 2016, respectively which were recorded in other long-term liabilities in the consolidated balance sheets (see Note 7).
71
As of December 31, 2017, the company remained subject to examination in the following major tax jurisdictions for the tax years as indicated below:
Major tax jurisdictions | Open Years |
North America | |
United States | 2014 through 2017 |
Canada | 2010 through 2017 |
Mexico | 2011 through 2017 |
Europe | |
Germany | 2011 through 2017 |
Italy | 2013 through 2017 |
Spain | 2004 through 2017 |
South America | |
Brazil | 2005 through 2017 |
Asia | |
China | 2012 through 2017 |
India | 2006 through 2017 |
Korea | 2012 through 2017 |
Thailand | 2012 through 2017 |
The company is currently under audit in a number of tax jurisdictions. As a result, it is reasonably possible that some of these audits will conclude or reach the stage where a change in unrecognized income tax benefits may occur within the next twelve months. At that time, the company will record any adjustment to income tax expense as required. In 2017, the company settled its 2011 through 2013 U.S. income tax audit. Settlements were not material to the consolidated financial statements. The company is also subject to income taxes in many hundreds of state and local taxing jurisdictions that are open to tax examinations.
NOTE 6. EARNINGS PER SHARE – PRAXAIR, INC. SHAREHOLDERS
Basic earnings per share is computed by dividing Net income – Praxair, Inc. for the period by the weighted average number of Praxair common shares outstanding. Diluted earnings per share is computed by dividing Net income – Praxair, Inc. for the period by the weighted average number of Praxair common shares outstanding and dilutive common stock equivalents, as follows:
2017 | 2016 | 2015 | |||||||||
Numerator (Millions of dollars) | |||||||||||
Net income – Praxair, Inc. | $ | 1,247 | $ | 1,500 | $ | 1,547 | |||||
Denominator (Thousands of shares) | |||||||||||
Weighted average shares outstanding | 285,893 | 285,289 | 286,606 | ||||||||
Shares earned and issuable under compensation plans | 368 | 388 | 399 | ||||||||
Weighted average shares used in basic earnings per share | 286,261 | 285,677 | 287,005 | ||||||||
Effect of dilutive securities | |||||||||||
Stock options and awards | 2,853 | 2,080 | 2,050 | ||||||||
Weighted average shares used in diluted earnings per share | 289,114 | 287,757 | 289,055 | ||||||||
Basic Earnings Per Common Share | $ | 4.36 | $ | 5.25 | $ | 5.39 | |||||
Diluted Earnings Per Common Share | $ | 4.32 | $ | 5.21 | $ | 5.35 | |||||
72
There were no antidilutive shares for the years ended December 31, 2017. Stock options of 2,602,770 for the year ended December 31, 2016 and 2,696,785 for year ended December 31, 2015 were antidilutive and therefore excluded in the computation of diluted earnings per share.
NOTE 7. SUPPLEMENTAL INFORMATION
Income Statement
(Millions of dollars) Year Ended December 31, | 2017 | 2016 | 2015 | ||||||||
Selling, General and Administrative | |||||||||||
Selling | $ | 511 | $ | 493 | $ | 507 | |||||
General and administrative | 696 | 652 | 645 | ||||||||
$ | 1,207 | $ | 1,145 | $ | 1,152 | ||||||
Year Ended December 31, | 2017 | 2016 | 2015 | ||||||||
Depreciation and Amortization | |||||||||||
Depreciation | $ | 1,136 | $ | 1,071 | $ | 1,059 | |||||
Amortization of other intangibles (Note 10) | 48 | 51 | 47 | ||||||||
$ | 1,184 | $ | 1,122 | $ | 1,106 | ||||||
Year Ended December 31, | 2017 | 2016 | 2015 | ||||||||
Other Income (Expenses) – Net | |||||||||||
Currency related net gains (losses) | $ | (3 | ) | $ | 1 | $ | (2 | ) | |||
Partnership income | 6 | 5 | 4 | ||||||||
Severance expense | (6 | ) | (7 | ) | (5 | ) | |||||
Business divestitures and asset gains (losses) – net | 4 | 16 | 34 | ||||||||
Other – net | 3 | 8 | (3 | ) | |||||||
$ | 4 | $ | 23 | $ | 28 | ||||||
Year Ended December 31, | 2017 | 2016 | 2015 | ||||||||
Interest Expense – Net | |||||||||||
Interest incurred on debt | $ | 189 | $ | 208 | $ | 194 | |||||
Interest capitalized | (28 | ) | (34 | ) | (33 | ) | |||||
Bond redemption (a) | — | 16 | — | ||||||||
$ | 161 | $ | 190 | $ | 161 | ||||||
Year Ended December 31, | 2017 | 2016 | 2015 | ||||||||
Income Attributable to Noncontrolling Interests | |||||||||||
Noncontrolling interests' operations | $ | 59 | $ | 35 | $ | 34 | |||||
Redeemable noncontrolling interests' operations (Note 14) | 2 | 3 | 10 | ||||||||
$ | 61 | $ | 38 | $ | 44 | ||||||
73
Balance Sheet
(Millions of dollars) December 31, | 2017 | 2016 | |||||
Accounts Receivable | |||||||
Trade | $ | 1,814 | $ | 1,640 | |||
Other | 128 | 122 | |||||
1,942 | 1,762 | ||||||
Less: allowance for doubtful accounts (b) | (138 | ) | (121 | ) | |||
$ | 1,804 | $ | 1,641 | ||||
December 31, | 2017 | 2016 | |||||
Inventories | |||||||
Raw materials and supplies | $ | 224 | $ | 197 | |||
Work in process | 57 | 45 | |||||
Finished goods | 333 | 308 | |||||
$ | 614 | $ | 550 | ||||
December 31, | 2017 | 2016 | |||||
Prepaid and Other Current Assets | |||||||
Prepaid (c) | 185 | 108 | |||||
Other | 65 | 57 | |||||
$ | 250 | $ | 165 | ||||
December 31, | 2017 | 2016 | |||||
Other Long-term Assets | |||||||
Pension assets (Note 16) | $ | 17 | $ | 13 | |||
Insurance contracts (d) | 74 | 74 | |||||
Long-term receivables, net (e) | 54 | 46 | |||||
Deposits | 70 | 56 | |||||
Investments carried at cost | 12 | 14 | |||||
Deferred charges | 47 | 51 | |||||
Deferred income taxes (Note 5) | 198 | 185 | |||||
Other | 109 | 119 | |||||
$ | 581 | $ | 558 | ||||
74
December 31, | 2017 | 2016 | |||||
Other Current Liabilities | |||||||
Accrued expenses | $ | 319 | $ | 285 | |||
Payroll | 170 | 141 | |||||
Cost reduction program (Note 2) | 19 | 59 | |||||
Pension and postretirement (Note 16) | 30 | 24 | |||||
Interest payable | 81 | 78 | |||||
Employee benefit accrual | 23 | 23 | |||||
Insurance reserves | 12 | 8 | |||||
Other | 222 | 223 | |||||
$ | 876 | $ | 841 | ||||
December 31, | 2017 | 2016 | |||||
Other Long-term Liabilities | |||||||
Pension and postretirement (Note 16) | $ | 851 | $ | 863 | |||
Tax liabilities for uncertain tax positions | 35 | 44 | |||||
Tax Act liabilities for deemed repatriation (Note 5) | 388 | — | |||||
Cost reduction program (Note 2) | 2 | 6 | |||||
Interest and penalties for uncertain tax positions (Note 5) | 8 | 6 | |||||
Insurance reserves | 23 | 25 | |||||
Other | 281 | 269 | |||||
$ | 1,588 | $ | 1,213 | ||||
December 31, | 2017 | 2016 | |||||
Deferred Credits | |||||||
Deferred income taxes (Note 5) | $ | 1,167 | $ | 1,209 | |||
Other | 69 | 63 | |||||
$ | 1,236 | $ | 1,272 | ||||
December 31, | 2017 | 2016 | |||||
Accumulated Other Comprehensive Income (Loss) | |||||||
Cumulative translation adjustment - net of taxes: | |||||||
North America (f) | $ | (885 | ) | $ | (1,038 | ) | |
South America (f) | (2,004 | ) | (1,969 | ) | |||
Europe (f) | (398 | ) | (504 | ) | |||
Asia (f) | (151 | ) | (383 | ) | |||
Surface Technologies | (17 | ) | (52 | ) | |||
(3,455 | ) | (3,946 | ) | ||||
Derivatives – net of taxes | (1 | ) | (1 | ) | |||
Pension/OPEB funded status obligation (net of $347 million and $352 million tax benefit in 2017 and 2016, respectively) (Note 16) | (642 | ) | (653 | ) | |||
$ | (4,098 | ) | $ | (4,600 | ) | ||
________________________
75
(a) | In February 2016, Praxair redeemed $325 million of 5.20% notes due March 2017 resulting in a $16 million interest charge ($10 million after-tax, or $0.04 per diluted share). |
(b) | Provisions to the allowance for doubtful accounts were $33 million, $41 million, and $35 million in 2017, 2016, and 2015, respectively. The allowance activity in each period related primarily to write-offs of uncollectible amounts, net of recoveries and currency movements. |
(c) | Includes estimated income tax payments of $58 million and $39 million in 2017 and 2016, respectively. 2017 also includes an energy prepayment of $58 million made in the third quarter. |
(d) | Consists primarily of insurance contracts and other investments to be utilized for non-qualified pension and OPEB obligations. |
(e) | Long-term receivables are not material and are largely reserved. The balances at December 31, 2017 and 2016 are net of reserves of $51 million and $50 million, respectively. The amounts in both periods relate primarily to government receivables in Brazil and other long-term notes receivable from customers. Collectability is reviewed regularly and uncollectible amounts are written-off as appropriate. |
(f) | North America consists of currency translation adjustments in Canada and Mexico. South America relates primarily to Brazil and Argentina. Europe relates primarily to Spain, Italy and Germany. Asia relates primarily to China, India and Korea. |
NOTE 8. PROPERTY, PLANT AND EQUIPMENT – NET
Significant classes of property, plant and equipment are as follows:
(Millions of dollars) December 31, | Depreciable Lives (Yrs) | 2017 | 2016 | |||||||
Production plants (primarily 15-year life) (a) | 10-20 | $ | 16,258 | $ | 14,588 | |||||
Storage tanks | 15-20 | 2,620 | 2,360 | |||||||
Transportation equipment and other | 3-15 | 2,173 | 2,038 | |||||||
Cylinders (primarily 30-year life) | 10-30 | 1,875 | 1,722 | |||||||
Buildings | 25-40 | 1,202 | 1,096 | |||||||
Land and improvements (b) | 0-20 | 589 | 559 | |||||||
Construction in progress | 1,159 | 1,558 | ||||||||
25,876 | 23,921 | |||||||||
Less: accumulated depreciation | (13,819 | ) | (12,444 | ) | ||||||
$ | 12,057 | $ | 11,477 | |||||||
(a) - Depreciable lives of production plants related to long-term customer supply contracts are consistent with the contract lives.
(b) - Land is not depreciated.
76
NOTE 9. GOODWILL
Changes in the carrying amount of goodwill for the years ended December 31, 2017 and 2016 were as follows:
(Millions of dollars) | North America | South America | Europe | Asia | Surface Technologies | Total | |||||||||||||||||
Balance, December 31, 2015 | $ | 2,111 | $ | 98 | $ | 582 | $ | 59 | $ | 136 | $ | 2,986 | |||||||||||
Acquisitions (Note 3) | 61 | 9 | 71 | — | — | 141 | |||||||||||||||||
Purchase adjustments & other | 6 | — | — | — | 2 | 8 | |||||||||||||||||
Foreign currency translation | (13 | ) | 25 | (24 | ) | (1 | ) | (5 | ) | (18 | ) | ||||||||||||
Balance, December 31, 2016 | $ | 2,165 | $ | 132 | $ | 629 | $ | 58 | $ | 133 | $ | 3,117 | |||||||||||
Acquisitions (Note 3) | 24 | — | — | — | — | 24 | |||||||||||||||||
Purchase adjustments & other | — | (1 | ) | 1 | — | — | — | ||||||||||||||||
Foreign currency translation | 13 | (2 | ) | 68 | 3 | 10 | 92 | ||||||||||||||||
Balance, December 31, 2017 | $ | 2,202 | $ | 129 | $ | 698 | $ | 61 | $ | 143 | $ | 3,233 | |||||||||||
Praxair has performed its goodwill impairment tests annually during the second quarter of each year, and historically has determined that the fair value of each of its reporting units was substantially in excess of its carrying value. For the 2017 test, Praxair applied the FASB's accounting guidance which allows the company to first assess qualitative factors to determine the extent of additional quantitative analysis, if any, that may be required to test goodwill for impairment. Based on the qualitative assessments performed, Praxair concluded that it was more likely than not that the fair value of each reporting unit substantially exceeded its carrying value and therefore, further quantitative analysis was not required. As a result, no impairment was recorded. There were no indicators of impairment through December 31, 2017.
77
NOTE 10. OTHER INTANGIBLE ASSETS
The following is a summary of Praxair’s other intangible assets at December 31, 2017 and 2016:
(Millions of dollars) For the year ended December 31, 2017 | Customer & License/Use Agreements | Non-compete Agreements | Patents & Other | Total | |||||||||||
Cost: | |||||||||||||||
Balance, December 31, 2016 | $ | 751 | $ | 34 | $ | 51 | $ | 836 | |||||||
Additions (Note 3) | 1 | 2 | — | 3 | |||||||||||
Foreign currency translation | 22 | — | 1 | 23 | |||||||||||
Other * | (2 | ) | (8 | ) | — | (10 | ) | ||||||||
Balance, December 31, 2017 | 772 | 28 | 52 | 852 | |||||||||||
Less: accumulated amortization: | |||||||||||||||
Balance, December 31, 2016 | (214 | ) | (22 | ) | (17 | ) | (253 | ) | |||||||
Amortization expense | (40 | ) | (4 | ) | (4 | ) | (48 | ) | |||||||
Foreign currency translation | (8 | ) | — | — | (8 | ) | |||||||||
Other * | 2 | 8 | — | 10 | |||||||||||
Balance, December 31, 2017 | (260 | ) | (18 | ) | (21 | ) | (299 | ) | |||||||
Net balance at December 31, 2017 | $ | 512 | $ | 10 | $ | 31 | $ | 553 | |||||||
(Millions of dollars) For the year ended December 31, 2016 | Customer & License/Use Agreements | Non-compete Agreements | Patents & Other | Total | |||||||||||
Cost: | |||||||||||||||
Balance, December 31, 2015 | $ | 698 | $ | 38 | $ | 47 | $ | 783 | |||||||
Additions (primarily acquisitions) | 72 | 4 | 6 | 82 | |||||||||||
Foreign currency translation | (16 | ) | (1 | ) | (2 | ) | (19 | ) | |||||||
Other * | (3 | ) | (7 | ) | — | (10 | ) | ||||||||
Balance, December 31, 2016 | 751 | 34 | 51 | 836 | |||||||||||
Less: accumulated amortization: | |||||||||||||||
Balance, December 31, 2015 | (179 | ) | (23 | ) | (13 | ) | (215 | ) | |||||||
Amortization expense | (41 | ) | (6 | ) | (4 | ) | (51 | ) | |||||||
Foreign currency translation | 6 | — | — | 6 | |||||||||||
Other * | — | 7 | — | 7 | |||||||||||
Balance, December 31, 2016 | (214 | ) | (22 | ) | (17 | ) | (253 | ) | |||||||
Net balance at December 31, 2016 | $ | 537 | $ | 12 | $ | 34 | $ | 583 | |||||||
________________________
* | Other primarily relates to the write-off of fully amortized assets, purchase accounting adjustments and reclassifications. |
There are no expected residual values related to these intangible assets. Amortization expense for the years ended December 31, 2017, 2016 and 2015 was $48 million, $51 million and $47 million, respectively. The remaining weighted-average amortization period for intangible assets is approximately 17 years.
78
Total estimated annual amortization expense is as follows:
(Millions of dollars) | |||
2018 | $ | 46 | |
2019 | 44 | ||
2020 | 41 | ||
2021 | 40 | ||
2022 | 37 | ||
Thereafter | 345 | ||
$ | 553 | ||
79
NOTE 11. DEBT
The following is a summary of Praxair’s outstanding debt at December 31, 2017 and 2016:
(Millions of dollars) | 2017 | 2016 | |||||
Short-term | |||||||
Commercial paper and U.S. bank borrowings | $ | 202 | $ | 333 | |||
Other bank borrowings (primarily international) | 36 | 101 | |||||
Total short-term debt | 238 | 434 | |||||
Long-term (a) | |||||||
U.S. borrowings | |||||||
Floating Rate Notes due 2017 (c) | — | 150 | |||||
1.05% Notes due 2017 (c) | — | 400 | |||||
1.20% Notes due 2018 | 498 | 499 | |||||
1.25% Notes due 2018 (b) | 475 | 478 | |||||
4.50% Notes due 2019 | 599 | 598 | |||||
1.90% Notes due 2019 | 500 | 499 | |||||
1.50% Euro denominated notes due 2020 | 717 | 627 | |||||
2.25% Notes due 2020 | 299 | 299 | |||||
4.05% Notes due 2021 | 498 | 497 | |||||
3.00% Notes due 2021 | 497 | 496 | |||||
2.45% Notes due 2022 | 598 | 597 | |||||
2.20% Notes due 2022 | 498 | 498 | |||||
2.70% Notes due 2023 | 498 | 497 | |||||
1.20% Euro denominated notes due 2024 | 658 | 575 | |||||
2.65% Notes due 2025 | 397 | 397 | |||||
1.625% Euro denominated notes due 2025 | 594 | 519 | |||||
3.20% Notes due 2026 | 725 | 725 | |||||
3.55% Notes due 2042 | 662 | 662 | |||||
Other | 12 | 12 | |||||
International bank borrowings | 33 | 49 | |||||
Obligations under capital lease | 4 | 7 | |||||
8,762 | 9,081 | ||||||
Less: current portion of long-term debt | (979 | ) | (164 | ) | |||
Total long-term debt | 7,783 | 8,917 | |||||
Total debt | $ | 9,000 | $ | 9,515 | |||
________________________
(a) | Amounts are net of unamortized discounts, premiums and/or debt issuance cost as applicable. |
(b) | The fair value increase related to hedge accounting for the year ended December 31, 2017 was not significant. 2016 includes a $4 million fair value increase. See Note 12 for additional information. |
(c) | In February and November 2017, Praxair repaid $150 million of floating rate notes and $400 million of 1.05% notes, respectively, that became due. |
80
Credit Facilities
At December 31, 2017, the company has the following major credit facility available for future borrowing:
Millions of dollars | Total Facility | Borrowings Outstanding | Available for Borrowing | Expires | |||||||||
Senior Unsecured | $ | 2,500 | $ | — | $ | 2,500 | December 2019 | ||||||
Revolving Credit Facility | $ | 500 | $ | — | $ | 500 | June 2018 | ||||||
In June 2017, the company entered into a $500 million 364-day revolving credit facility with a syndicate of banks which expires in June 2018. The $2.5 billion and $500 million credit facilities are with major financial institutions and are non-cancelable by the issuing financial institutions until their respective maturities. The only financial covenant for both revolving credit facilities requires Praxair not to exceed a maximum 70% leverage ratio. No borrowings were outstanding under the credit agreements at December 31, 2017.
Covenants
Praxair’s $2.5 billion senior unsecured credit facility, $500 million 364-day revolving credit facility and long-term debt agreements contain various covenants which may, among other things, restrict certain types of mergers and changes in beneficial ownership of the company, and the ability of the company to incur or guarantee debt, sell or transfer certain assets, create liens against assets, enter into sale and leaseback agreements, or pay dividends and make other distributions beyond certain limits. These agreements also require Praxair to not exceed a maximum 70% leverage ratio defined in the agreements as the ratio of consolidated total debt to the sum of consolidated total debt plus consolidated shareholders’ equity of the company. For purposes of the leverage ratio calculation, consolidated shareholders’ equity excludes changes in the cumulative foreign currency translation adjustments after June 30, 2011. At December 31, 2017, the actual leverage ratio, as calculated according to the agreement, was 49% and the company is in compliance with all financial covenants. Also, there are no material adverse change clauses or other subjective conditions that would restrict the company’s ability to borrow under the agreements.
Other Debt Information
As of December 31, 2017 and 2016, the weighted-average interest rate of short-term borrowings outstanding was 2.1% and 1.2%, respectively. The increase reflects higher commercial paper borrowing rates in the U.S.
Expected maturities of long-term debt are as follows:
(Millions of dollars) | |||
2018 | $ | 979 | |
2019 | 1,100 | ||
2020 | 1,024 | ||
2021 | 1,003 | ||
2022 | 1,105 | ||
Thereafter | 3,551 | ||
$ | 8,762 | ||
________________________
As of December 31, 2017, $4 million of Praxair’s assets (principally international fixed assets) were pledged as collateral for $4 million of long-term debt, including the current portion of long-term debt.
In February 2016, Praxair redeemed $325 million of 5.20% notes due March 2017 resulting in a $16 million interest charge ($10 million after-tax, or $0.04 per diluted share).
See Note 13 for the fair value information related to debt.
81
NOTE 12. FINANCIAL INSTRUMENTS
In its normal operations, Praxair is exposed to market risks relating to fluctuations in interest rates, foreign currency exchange rates, energy costs and to a lesser extent precious metal prices. The objective of financial risk management at Praxair is to minimize the negative impact of such fluctuations on the company’s earnings and cash flows. To manage these risks, among other strategies, Praxair routinely enters into various derivative financial instruments (“derivatives”) including interest-rate swap and treasury rate lock agreements, currency-swap agreements, forward contracts, currency options, and commodity-swap agreements. These instruments are not entered into for trading purposes and Praxair only uses commonly traded and non-leveraged instruments.
There are three types of derivatives that the company enters into: (i) those relating to fair-value exposures, (ii) those relating to cash-flow exposures, and (iii) those relating to foreign currency net investment exposures. Fair-value exposures relate to recognized assets or liabilities, and firm commitments; cash-flow exposures relate to the variability of future cash flows associated with recognized assets or liabilities, or forecasted transactions; and net investment exposures relate to the impact of foreign currency exchange rate changes on the carrying value of net assets denominated in foreign currencies.
When a derivative is executed and hedge accounting is appropriate, it is designated as either a fair-value hedge, cash-flow hedge, or a net investment hedge. Currently, Praxair designates all interest-rate and treasury-rate locks as hedges for accounting purposes; however, currency contracts are generally not designated as hedges for accounting purposes unless they are related to forecasted transactions. Whether designated as hedges for accounting purposes or not, all derivatives are linked to an appropriate underlying exposure. On an ongoing basis, the company assesses the hedge effectiveness of all derivatives designated as hedges for accounting purposes to determine if they continue to be highly effective in offsetting changes in fair values or cash flows of the underlying hedged items. If it is determined that the hedge is not highly effective, then hedge accounting will be discontinued prospectively.
Counterparties to Praxair’s derivatives are major banking institutions with credit ratings of investment grade or better and no collateral is required, and there are no significant risk concentrations. Management believes the risk of incurring losses on derivative contracts related to credit risk is remote and any losses would be immaterial.
The following table is a summary of the notional amount and fair value of derivatives outstanding at December 31, 2017 and 2016 for consolidated subsidiaries:
Fair Value | |||||||||||||||||||||||
(Millions of dollars) | Notional Amounts | Assets | Liabilities | ||||||||||||||||||||
December 31, | 2017 | 2016 | 2017 | 2016 | 2017 | 2016 | |||||||||||||||||
Derivatives Not Designated as Hedging Instruments: | |||||||||||||||||||||||
Currency contracts: | |||||||||||||||||||||||
Balance sheet items (a) | $ | 2,693 | $ | 2,104 | $ | 16 | $ | 11 | $ | 16 | $ | 18 | |||||||||||
Derivatives Designated as Hedging Instruments: | |||||||||||||||||||||||
Currency contracts: | |||||||||||||||||||||||
Balance sheet items (a) | $ | 38 | $ | 38 | $ | — | $ | 3 | $ | 2 | $ | — | |||||||||||
Forecasted purchase (a) | 4 | — | 1 | — | — | — | |||||||||||||||||
Interest rate contracts: | |||||||||||||||||||||||
Interest rate swaps (a) | 475 | 475 | — | 4 | — | — | |||||||||||||||||
Total Hedges | $ | 517 | $ | 513 | $ | 1 | $ | 7 | $ | 2 | $ | — | |||||||||||
Total Derivatives | $ | 3,210 | $ | 2,617 | $ | 17 | $ | 18 | $ | 18 | $ | 18 | |||||||||||
________________________
(a) | Assets are recorded in prepaid and other current assets, and liabilities are recorded in other current liabilities. |
82
Currency Contracts
Balance Sheet Items
Foreign currency contracts related to balance sheet items consist of forward contracts entered into to manage the exposure to fluctuations in foreign-currency exchange rates on recorded balance sheet assets and liabilities denominated in currencies other than the functional currency of the related operating unit. Certain forward currency contracts are entered into to protect underlying monetary assets and liabilities denominated in foreign currencies from foreign exchange risk and are not designated as hedging instruments. The fair value adjustments on these contracts are offset by the fair value adjustments recorded on the underlying monetary assets and liabilities. Praxair also enters into forward currency contracts, which are designated as hedging instruments, to limit the cash flow exposure on certain foreign-currency denominated intercompany loans. The fair value adjustments on these contracts are recorded to AOCI, with the effective portion immediately reclassified to earnings to offset the fair value adjustments on the underlying debt instrument.
Forecasted Purchases
Foreign currency contracts related to forecasted purchases consist of forward contracts entered into to manage the exposure to fluctuations in foreign-currency exchange rates on forecasted purchases of capital-related equipment and services denominated in currencies other than the functional currency of the related operating units. These forward contracts were designated and accounted for as cash flow hedges.
Net Investment Hedges
In 2014, Praxair designated the €600 million ($717 million as of December 31, 2017) 1.50% Euro-denominated notes due 2020 and the €500 million ($594 million as of December 31, 2017) 1.625% Euro-denominated notes due 2025, as a hedge of the net investment position in its European operations. In 2016 Praxair designated an incremental €550 million ($658 million as of December 31, 2017) 1.20% Euro-denominated notes due 2024 as an additional hedge of the net investment position in its European operations. On December 22, 2017, the U.S. government enacted the Tax Cuts and Jobs Act. In response to the decrease in the tax rate from 35% to 21%, the Company de-designated €200 million of its Euro-denominated notes, which were previously designated as a hedge of the net investment position in its European operations. These Euro-denominated debt instruments reduce the company's exposure to changes in the currency exchange rate on investments in foreign subsidiaries with Euro functional currencies. Since hedge inception, exchange rate movements have reduced long-term debt by $97 million ( long-term debt increased by $242 million during the year ended December 31, 2017), with the offsetting gain shown within the cumulative translation component of AOCI in the consolidated balance sheets and the consolidated statements of comprehensive income.
Interest Rate Contracts
Outstanding Interest Rate Swaps
At December 31, 2017, Praxair had one outstanding interest rate swap agreement with a $475 million notional amount related to the $475 million 1.25% notes that mature in 2018. The interest rate swap effectively converts fixed-rate interest to variable-rate interest and is designated as a fair value hedge. Fair value adjustments are recognized in earnings along with an equally offsetting charge / benefit to earnings for the changes in the fair value of the underlying debt instrument. At December 31, 2017, the increase in the fair value of this note was less than $1 million ($4 million at December 31, 2016).
Terminated Treasury Rate Locks
The following table summarizes the unrecognized gains (losses) related to terminated treasury rate lock contracts:
Unrecognized Gain / (Loss) (a) | |||||||||||||
(Millions of dollars) | Year Terminated | Original Gain / (Loss) | December 31, 2017 | December 31, 2016 | |||||||||
Treasury Rate Locks | |||||||||||||
Underlying debt instrument: | |||||||||||||
$500 million 2.20% fixed-rate notes that mature in 2022 (b) | 2012 | $ | (2 | ) | $ | (1 | ) | $ | (1 | ) | |||
$500 million 3.00% fixed-rate notes that mature in 2021 (b) | 2011 | (11 | ) | (4 | ) | (5 | ) | ||||||
$600 million 4.50% fixed-rate notes that mature in 2019 (b) | 2009 | 16 | 3 | 4 | |||||||||
Total – pre-tax | $ | (2 | ) | $ | (2 | ) | |||||||
Less: income taxes | 1 | 1 | |||||||||||
After- tax amounts | $ | (1 | ) | $ | (1 | ) | |||||||
________________________
83
(a) | The unrecognized gains / (losses) for the treasury rate locks are shown in accumulated other comprehensive income ("AOCI") and are being recognized on a straight line basis to interest expense – net over the term of the underlying debt agreements. Refer to the table below summarizing the impact of the company’s consolidated statements of income and AOCI for current period gain (loss) recognition. |
(b) | The notional amount of the treasury rate lock contracts are equal to the underlying debt instrument with the exception of the treasury rate lock contract entered into to hedge the $600 million 4.50% fixed-rate notes that mature in 2019. The notional amount of this contract was $500 million. |
The following table summarizes the impact of the company's derivatives not designated as hedging instruments on the consolidated statements of income:
(Millions of dollars) | Amount of Pre-Tax Gain (Loss) Recognized in Earnings * | ||||||||||
December 31, | 2017 | 2016 | 2015 | ||||||||
Derivatives Not Designated as Hedging Instruments | |||||||||||
Currency contracts: | |||||||||||
Balance sheet items: | |||||||||||
Debt-related | $ | 121 | $ | 21 | $ | (162 | ) | ||||
Other balance sheet items | — | 4 | (8 | ) | |||||||
Total | $ | 121 | $ | 25 | $ | (170 | ) | ||||
* The gains (losses) on balance sheet items are offset by gains (losses) recorded on the underlying hedged assets and liabilities. Accordingly, the gains (losses) for the derivatives and the underlying hedged assets and liabilities related to debt items are recorded in the consolidated statements of income as interest expense-net. Other balance sheet items and anticipated net income gains (losses) are recorded in the consolidated statements of income as other income (expenses)-net.
The following table summarizes the impact of the company's derivatives designated as hedging instruments that impact AOCI:
(Millions of dollars) | Amount of Gain (Loss) Recognized in AOCI | Amount of Gain (Loss) Reclassified from AOCI to the Consolidated Statement of Income | |||||||||||||||||||
December 31, | 2017 | 2016 | 2015 | 2017 | 2016 | 2015 | |||||||||||||||
Derivatives Designated as Hedging Instruments** | |||||||||||||||||||||
Currency contracts: | |||||||||||||||||||||
Net Investment hedge | $ | — | $ | (4 | ) | $ | — | $ | — | $ | — | — | |||||||||
Forecasted purchases | 1 | — | — | — | — | — | |||||||||||||||
Balance sheet items | (1 | ) | 1 | 1 | — | — | (1 | ) | |||||||||||||
Interest rate contracts: | |||||||||||||||||||||
Treasury rate locks | — | — | — | — | (1 | ) | — | ||||||||||||||
Total – Pre tax | $ | — | $ | (3 | ) | $ | 1 | $ | — | $ | (1 | ) | $ | (1 | ) | ||||||
Less: income taxes | — | — | — | — | 1 | — | |||||||||||||||
Total - Net of Taxes | $ | — | $ | (3 | ) | $ | 1 | $ | — | $ | — | $ | (1 | ) | |||||||
** The gains (losses) on net investment hedges are recorded as a component of AOCI within foreign currency translation adjustments in the consolidated balance sheets and consolidated statements of comprehensive income. The gains (losses) on forecasted purchases, balance sheet items, and treasury rate locks are recorded as a component of AOCI within derivative instruments in the consolidated balance sheets and the consolidated statements of comprehensive income. There was no ineffectiveness for these instruments during 2017 or 2016. The gains (losses) on net investment hedges are reclassified to earnings only when the related currency translation adjustments are required to be reclassified, usually upon sale or liquidation of the investment. The gains (losses) for interest rate contracts are reclassified to earnings as interest expense –net on a straight-line basis over the remaining maturity of the underlying debt. Net gains of less than $1 million are expected to be reclassified to earnings during 2018.
84
NOTE 13. FAIR VALUE DISCLOSURES
The fair value hierarchy prioritizes the inputs to valuation techniques used to measure fair value into three broad levels as follows:
Level 1 – quoted prices in active markets for identical assets or liabilities
Level 2 – quoted prices for similar assets and liabilities in active markets or inputs that are observable
Level 3 – inputs that are unobservable (for example cash flow modeling inputs based on assumptions)
Assets and Liabilities Measured at Fair Value on a Recurring Basis
The following table summarizes assets and liabilities measured at fair value on a recurring basis at December 31, 2017 and 2016:
Fair Value Measurements Using | |||||||||||||||||||||||
(Millions of dollars) | Level 1 | Level 2 | Level 3 | ||||||||||||||||||||
2017 | 2016 | 2017 | 2016 | 2017 | 2016 | ||||||||||||||||||
Assets | |||||||||||||||||||||||
Derivative assets | $ | — | $ | — | $ | 17 | $ | 18 | $ | — | $ | — | |||||||||||
Liabilities | |||||||||||||||||||||||
Derivative liabilities | $ | — | $ | — | $ | 18 | $ | 18 | $ | — | $ | — | |||||||||||
The fair values of the derivative assets and liabilities are based on market prices obtained from independent brokers or determined using quantitative models that use as their basis readily observable market parameters that are actively quoted and can be validated through external sources, including third-party pricing services, brokers and market transactions. Investments are marketable securities traded on an exchange.
The fair value of cash and cash equivalents, short-term debt, accounts receivables-net, and accounts payable approximate carrying value because of the short-term maturities of these instruments. The fair value of long-term debt is estimated based on the quoted market prices for the same or similar issues, which is deemed a Level 2 measurement. At December 31, 2017, the estimated fair value of Praxair’s long-term debt portfolio was $8,969 million versus a carrying value of $8,762 million. At December 31, 2016, the estimated fair value of Praxair’s long-term debt portfolio was $9,218 million versus a carrying value of $9,081 million. These differences are attributable to interest-rate changes subsequent to when the debt was issued.
85
NOTE 14. EQUITY AND NONCONTROLLING INTERESTS
Praxair, Inc. Shareholders’ Equity
At December 31, 2017 and 2016, there were 800,000,000 shares of common stock authorized (par value $0.01 per share) of which 383,230,625 shares were issued and 286,776,991 were outstanding at December 31, 2017 (284,900,776 were outstanding at December 31, 2016).
At December 31, 2017 and 2016, there were 25,000,000 shares of preferred stock (par value $0.01 per share) authorized, of which no shares were issued and outstanding. Praxair’s Board of Directors may from time to time authorize the issuance of one or more series of preferred stock and, in connection with the creation of such series, determine the characteristics of each such series including, without limitation, the preference and relative, participating, optional or other special rights, and the qualifications, limitations or restrictions of the series.
Noncontrolling Interests
Noncontrolling interest ownership changes are presented within the "Additions (Reductions)" line item of the consolidated statements of equity. The $15 million increase during 2017 relates to additional funding provided to PG Technologies, LLC ("PGT") by the joint venture partner. The $20 million increase during 2016 relates to the sale of an ownership interest in a majority-owned joint venture in India during the third quarter offset by the formation of PGT, a majority-owned joint venture with GE Aviation. The 2016 "Additions (Reductions)" line item of the consolidated statements of equity also includes an increase to Additional Paid-In Capital resulting from the sale of the noncontrolling interest to the PGT joint venture partner.
Redeemable Noncontrolling Interests
Noncontrolling interests with redemption features, such as put/sell options, that are not solely within the company’s control (“redeemable noncontrolling interests”) are reported separately in the consolidated balance sheets at the greater of carrying value or redemption value. For redeemable noncontrolling interests that are not yet exercisable, Praxair calculates the redemption value by accreting the carrying value to the redemption value over the period until exercisable. If the redemption value is greater than the carrying value, any increase is adjusted directly to retained earnings and does not impact net income. At December 31, 2017, the redeemable noncontrolling interest balance includes one packaged gas distributor in the United States where the noncontrolling shareholder has a put option.
The following is a summary of redeemable noncontrolling interests for the years ended December 31, 2017, 2016 and 2015 :
(Millions of dollars) | 2017 | 2016 | 2015 | ||||||||
Beginning Balance | $ | 11 | $ | 113 | $ | 176 | |||||
Net income | 2 | 3 | 10 | ||||||||
Distributions to noncontrolling interest | (3 | ) | (2 | ) | (7 | ) | |||||
Redemption value adjustment/accretion * | 1 | (6 | ) | (40 | ) | ||||||
Foreign currency translation and other | — | 7 | (17 | ) | |||||||
Purchase/divestiture of noncontrolling interest ** | — | (104 | ) | (9 | ) | ||||||
Ending Balance | $ | 11 | $ | 11 | $ | 113 | |||||
* In December 2015, Praxair sold its controlling interest in Praxair Distribution Southeast, LLC and, accordingly, removed the related redeemable noncontrolling interests.
** In June 2016, Praxair acquired the remaining 34% stake in a Scandinavian joint venture for $104 million. The cash payment related to this acquisition is shown in the financing section of the consolidated statements of cash flows under the caption "Noncontrolling interest transactions and other" as there was no change in control.
86
NOTE 15. SHARE-BASED COMPENSATION
Share-based compensation expense was $59 million in 2017 ($39 million and $30 million in 2016 and 2015, respectively). The related income tax benefit recognized was $53 million in 2017 ($32 million and $8 million in 2016 and 2015, respectively). 2017 and 2016 include $35 million and $20 million of excess tax benefits, respectively. Expense amounts reflect current estimates of achieving performance targets relating to performance-based compensation. The expense was primarily recorded in selling, general and administrative expenses and no share-based compensation expense was capitalized.
Summary of Plans
The 2009 Praxair, Inc. Long-Term Incentive Plan was initially adopted by the board of directors and shareholders of the company on April 28, 2009 and was amended and restated in its entirety by the board and shareholders on April 22, 2014 ("the 2009 Plan"). Prior to April 28, 2009, equity awards were granted under the 2002 Praxair, Inc. Long-Term Incentive Plan and the company’s ability to make further equity awards under that plan ended with its adoption of the 2009 Plan. The 2009 Plan permits awards of stock options, stock appreciation rights, restricted stock and restricted stock units, performance-based stock units and other equity awards to eligible officer and non-officer employees and non-employee directors of the company and its affiliates. Under the 2009 Plan, as amended and restated in 2014, the aggregate number of shares available for option and other equity grants is 8,000,000 shares, of which up to 2,600,000 shares may be granted as awards other than options or stock appreciation rights. The 2009 Plan also provides calendar year per-participant limits on grants of stock options and stock appreciation rights and on other types of awards intended to qualify as Performance-Based Compensation under Section 162(m) of the Internal Revenue Code. The First Amendment to the 2009 Plan was adopted by the board of directors and shareholders of the company on January 24, 2017 and April 25, 2017, respectively. Under the First Amendment, the aggregate number of shares available for option and other equity grants is 8,000,000 shares in addition to those authorized shares still available for granting prior to amendment. As of December 31, 2017, 9,933,618 shares remained available for equity grants under the 2009 Plan.
In 2005, the board of directors and shareholders of the company adopted the 2005 Equity Compensation Plan for Non-Employee Directors of Praxair, Inc. ("the 2005 Plan"). Under the 2005 Plan, the aggregate number of shares available for option and other equity grants was limited to a total of 500,000 shares. The 2005 Plan expired on April 30, 2010, by its own terms, and no shares were available for grant thereafter.
Exercise prices for options granted under the 2009 Plan may not be less than the closing market price of the company’s common stock on the date of grant and granted options may not be re-priced or exchanged without shareholder approval. Options granted under the 2009 Plan subject only to time vesting requirements may become partially exercisable after a minimum of one year after the date of grant but may not become fully exercisable until at least three years have elapsed from the date of grant, and all options have a maximum duration of ten years. Options granted under predecessor plans had similar terms.
In order to satisfy option exercises and other equity grants, the Company may issue authorized but previously unissued shares or it may issue treasury shares.
Stock Option Fair Value
The company utilizes the Black-Scholes Options-Pricing Model to determine the fair value of stock options consistent with that used in prior years. Management is required to make certain assumptions with respect to selected model inputs, including anticipated changes in the underlying stock price (i.e., expected volatility) and option exercise activity (i.e., expected life). Expected volatility is based on the historical volatility of the company’s stock over the most recent period commensurate with the estimated expected life of the company’s stock options and other factors. The expected life of options granted, which represents the period of time that the options are expected to be outstanding, is based primarily on historical exercise experience. The expected dividend yield is based on the company’s most recent history and expectation of dividend payouts. The risk-free rate is based on the U.S. Treasury yield curve in effect at the time of grant for a period commensurate with the estimated expected life. If factors change and result in different assumptions in future periods, the stock option expense that the company records for future grants may differ significantly from what the company has recorded in the current period.
The weighted-average fair value of options granted during 2017 was $12.40 ($8.91 in 2016 and $11.99 in 2015) based on the Black-Scholes Options-Pricing model. The increase in grant date fair value year-over-year is primarily attributable to an increase in the company's stock price.
The following weighted-average assumptions were used to value the grants in 2017, 2016 and 2015:
87
Year Ended December 31, | 2017 | 2016 | 2015 | |||||
Dividend yield | 2.7 | % | 2.9 | % | 2.2 | % | ||
Volatility | 14.0 | % | 14.4 | % | 13.5 | % | ||
Risk-free interest rate | 2.13 | % | 1.41 | % | 1.51 | % | ||
Expected term years | 6 | 6 | 5 | |||||
The following table summarizes option activity under the plans as of December 31, 2017 and changes during the period then ended (averages are calculated on a weighted basis; life in years; intrinsic value expressed in millions):
Activity | Number of Options (000’s) | Average Exercise Price | Average Remaining Life | Aggregate Intrinsic Value | ||||||||
Outstanding at January 1, 2017 | 11,708 | $ | 101.58 | |||||||||
Granted | 2,091 | 118.71 | ||||||||||
Exercised | (2,877 | ) | 86.82 | |||||||||
Cancelled or expired | (135 | ) | 113.37 | |||||||||
Outstanding at December 31, 2017 | 10,787 | $ | 108.70 | 6.1 | $ | 496 | ||||||
Exercisable at December 31, 2017 | 6,757 | $ | 105.80 | 4.7 | $ | 330 | ||||||
The aggregate intrinsic value represents the difference between the company’s closing stock price of $154.68 as of December 31, 2017 and the exercise price multiplied by the number of in the money options outstanding as of that date. The total intrinsic value of stock options exercised during 2017 was $137 million ($82 million and $65 million in 2016 and 2015, respectively).
Cash received from option exercises under all share-based payment arrangements for 2017 was $107 million ($128 million and $72 million in 2016 and 2015, respectively). The cash tax benefit realized from share-based compensation totaled $51 million for 2017 ($32 million and $33 million cash tax benefit in 2016 and 2015, respectively).
As of December 31, 2017, $17 million of unrecognized compensation cost related to non-vested stock options is expected to be recognized over a weighted-average period of approximately 1 year.
Performance-Based and Restricted Stock Awards
In 2017, the company granted performance-based stock awards under the 2009 Plan to senior level executives of 223,730 shares that vest, subject to the attainment of pre-established minimum performance criteria, principally on the third anniversary of their date of grant. These awards are tied to either return on capital ("ROC") performance or relative total shareholder return ("TSR") performance versus that of the S&P 500. The actual number of shares issued in settlement of a vested award can range from zero to 200 percent of the target number of shares granted based upon the company’s attainment of specified performance targets at the end of a three-year period. Compensation expense related to these awards is recognized over the three-year performance period based on the fair value of the closing market price of the company’s common stock on the date of the grant and the estimated performance that will be achieved. Compensation expense for ROC awards will be adjusted during the three-year performance period based upon the estimated performance levels that will be achieved. TSR awards are measured at their grant date fair value and not subsequently re-measured.
There were 82,615 restricted stock units granted to employees during 2017. In addition, the company had previously granted restricted stock to certain key employees that vest after a designated service period ranging from 2 to 10 years although the majority of the restricted stock units vest at the end of a three-year service period. Generally, restricted stock does not earn quarterly dividends while vesting. Compensation expense related to the restricted stock units is recognized on a straight-line basis over the vesting period.
The weighted-average fair value of ROC performance-based stock awards and restricted stock units granted during 2017 was $109.68 and $111.95, respectively ($93.46 and $98.18 in 2016 and $120.04 and $120.24 in 2015). These fair values are based on the closing market price of Praxair's common stock on the grant date adjusted for dividends that will not be paid during the vesting period.
The weighted-average fair value of performance-based stock tied to relative TSR performance granted during 2017 was $124.12 per unit ($124.18 in 2016, none in 2015), and was estimated using a Monte Carlo simulation performed as of the grant date.
88
The following table summarizes non-vested performance-based and restricted stock award activity as of December 31, 2017 and changes during the period then ended (shares based on target amounts, averages are calculated on a weighted basis):
Performance-Based | Restricted Stock | ||||||||||||
Number of Shares (000’s) | Average Grant Date Fair Value | Number of Shares (000’s) | Average Grant Date Fair Value | ||||||||||
Non-vested at January 1, 2017 | 714 | $ | 115.72 | 274 | $ | 109.49 | |||||||
Granted | 224 | 114.82 | 83 | 111.95 | |||||||||
Vested | (77 | ) | 121.16 | (83 | ) | 118.24 | |||||||
Cancelled and Forfeited | (196 | ) | 113.66 | (10 | ) | 108.44 | |||||||
Non-vested at December 31, 2017 | 665 | $ | 113.40 | 264 | $ | 107.56 | |||||||
There are approximately 9 thousand performance-based shares and 6 thousand restricted stock shares that are non-vested at December 31, 2017 which will be settled in cash due to foreign regulatory limitations. The liability related to these grants reflects the current estimate of performance that will be achieved and the current common stock price.
As of December 31, 2017, based on current estimates of future performance, $17 million of unrecognized compensation cost related to performance-based awards and $10 million of unrecognized compensation cost related to the restricted stock awards is expected to be recognized primarily through the first quarter of 2020.
NOTE 16. RETIREMENT PROGRAMS
Defined Benefit Pension Plans
Praxair has two main U.S. retirement programs which are non-contributory defined benefit plans: the Praxair Pension Plan and the CBI Pension Plan. The latter program benefits primarily former employees of CBI Industries, Inc. which Praxair acquired in 1996. Effective July 1, 2002, the Praxair Pension Plan was amended to give participating employees a one-time choice to remain covered by the old formula or to elect coverage under a new formula. The old formula is based predominantly on years of service, age and compensation levels prior to retirement, while the new formula provides for an annual contribution to an individual account which grows with interest each year at a predetermined rate. Also, this new formula applies to all new employees hired after April 30, 2002 into businesses adopting this plan. The U.S. and international pension plan assets are comprised of a diversified mix of investments, including domestic and international corporate equities, government securities and corporate debt securities. Praxair has several plans that provide supplementary retirement benefits primarily to higher level employees that are unfunded and are nonqualified for federal tax purposes. Pension coverage for employees of certain of Praxair’s international subsidiaries generally is provided by those companies through separate plans. Obligations under such plans are primarily provided for through diversified investment portfolios, with some smaller plans provided for under insurance policies or by book reserves.
Multi-employer Pension Plans
In the United States Praxair participates in six multi-employer defined benefit pension plans ("MEPs"), pursuant to the terms of collective bargaining agreements, covering approximately 200 union-represented employees. The collective bargaining agreements expire on different dates through 2021. In connection with such agreements, the Company is required to make periodic contributions to the MEPs in accordance with the terms of the respective collective bargaining agreements. Praxair’s participation in these plans is not material either at the plan level or in the aggregate. Praxair’s contributions to these plans were $2 million in 2017, 2016, and 2015 (these costs are not included in the tables that follow). For all MEPs, Praxair’s contributions were significantly less than 1% of the total contributions to each plan for 2016 and 2015. Total 2017 contributions were not yet available from the MEPs.
Praxair has obtained the most recently available Pension Protection Act ("PPA") zone status letters from the Trustees of the MEPs. The PPA classifies MEPs as either Red, Yellow or Green zone plans. Among other factors, plans in the Red zone are generally less than 65 percent funded; plans in the Yellow zone are generally 65 to 80 percent funded; and plans in the Green zone are generally at least 80 percent funded. According to the most current data available, three of the MEPs that the Company participates in are in a Red zone status and three are in a Green zone status. As of December 31, 2017, the three Red Zone plans have pending or have implemented financial improvement or rehabilitation plans. Praxair does not currently anticipate significant future obligations due to the funding status of these plans. If Praxair determined it was probable that it would withdraw from an MEP, the Company would record a liability for its portion of the MEP’s unfunded pension obligations, as calculated at that time. Historically, such withdrawal payments have not been significant.
89
Defined Contribution Plans
Praxair’s U.S. business employees are eligible to participate in the Praxair defined contribution savings plan. Employees may contribute up to 40% of their compensation, subject to the maximum allowable by IRS regulations. For the U.S. packaged gases business, company contributions to this plan are calculated as a percentage of salary based on age plus service. U.S. employees other than those in the packaged gases business have company contributions to this plan calculated on a graduated scale based on employee contributions to the plan. The cost for these defined contribution plans was $29 million in 2017, $28 million in 2016 and $28 million in 2015 (these costs are not included in the tables that follow).
The defined contribution plans include a non-leveraged employee stock ownership plan ("ESOP") which covers all employees participating in this plan. The collective number of shares of Praxair common stock in the ESOP totaled 2,397,847 at December 31, 2017.
Certain international subsidiaries of the company also sponsor defined contribution plans where contributions are determined under various formulas. The expense for these plans was $21 million in 2017, $18 million in 2016 and $17 million in 2015 (these expenses are not included in the tables that follow).
Postretirement Benefits Other Than Pensions (OPEB)
Praxair provides health care and life insurance benefits to certain eligible retired employees. These benefits are provided through various insurance companies and healthcare providers. Praxair is also obligated to make payments for a portion of postretirement benefits related to retirees of Praxair’s former parent. Additionally, as part of the CBI acquisition in 1996, Praxair assumed responsibility for healthcare and life insurance benefit obligations for CBI’s retired employees. All postretirement healthcare programs have cost caps that limit the company’s exposure to future cost increases. In addition, as part of the retirement elections made for July 1, 2002, eligible employees were given the choice of maintaining coverage in the current retiree medical design (as may be amended from time to time), or to move to a design whereby coverage would be provided, but with no Praxair subsidy whatsoever. Also, all new employees hired after April 30, 2002 into a business adopting these plans will not receive a company subsidy. Praxair does not currently fund its postretirement benefits obligations. Praxair’s retiree plans may be changed or terminated by Praxair at any time for any reason with no liability to current or future retirees.
Praxair uses a measurement date of December 31 for its pension and other post-retirement benefit plans.
Pension and Postretirement Benefit Costs
The components of net pension and OPEB costs for 2017, 2016 and 2015 are shown below:
(Millions of dollars) Year Ended December 31, | Pensions | OPEB | |||||||||||||||||||||
2017 | 2016 | 2015 | 2017 | 2016 | 2015 | ||||||||||||||||||
Service cost | $ | 46 | $ | 45 | $ | 54 | $ | 3 | $ | 2 | $ | 3 | |||||||||||
Interest cost | 103 | 100 | 112 | 5 | 6 | 7 | |||||||||||||||||
Expected return on plan assets | (161 | ) | (157 | ) | (154 | ) | — | — | — | ||||||||||||||
Net amortization and deferral | 68 | 59 | 79 | (3 | ) | (3 | ) | (2 | ) | ||||||||||||||
Curtailment gain * | — | — | — | (18 | ) | — | — | ||||||||||||||||
Net periodic benefit cost before pension settlement charges | $ | 56 | $ | 47 | $ | 91 | $ | (13 | ) | $ | 5 | $ | 8 | ||||||||||
Pension settlement charges ** | 2 | 4 | 7 | — | — | — | |||||||||||||||||
Net periodic benefit cost | $ | 58 | $ | 51 | $ | 98 | $ | (13 | ) | $ | 5 | $ | 8 | ||||||||||
* The curtailment gain recorded during the year ended December 31, 2017 resulted from the termination of an OPEB plan in South America in the first quarter.
** 2017 includes the impact of a $2 million charge related to a series of lump sum benefit payments for employees under an international pension plan. 2016 and 2015 include charges of $4 million and $7 million, respectively, related primarily to the retirement of senior managers in the United States (see Note 2).
90
Funded Status
The changes in benefit obligation and plan assets for Praxair’s pension and OPEB programs, including reconciliation of the funded status of the plans to amounts recorded in the consolidated balance sheet, as of December 31, 2017 and 2016 are shown below:
(Millions of dollars) Year Ended December 31, | Pensions | ||||||||||||||||||||||
2017 | 2016 | OPEB | |||||||||||||||||||||
U.S. | International | U.S. | International | 2017 | 2016 | ||||||||||||||||||
Change in Benefit Obligation ("PBO") | |||||||||||||||||||||||
Benefit obligation January 1 | $ | 2,066 | $ | 666 | $ | 1,992 | $ | 580 | $ | 156 | $ | 160 | |||||||||||
Service cost | 32 | 14 | 31 | 14 | 3 | 2 | |||||||||||||||||
Interest cost | 70 | 33 | 70 | 30 | 5 | 6 | |||||||||||||||||
Participant contributions | — | — | — | — | 6 | 10 | |||||||||||||||||
Plan amendment | — | — | — | (2 | ) | — | (7 | ) | |||||||||||||||
Actuarial loss (gain) | 153 | 8 | 104 | 76 | (6 | ) | 4 | ||||||||||||||||
Benefits paid | (106 | ) | (43 | ) | (131 | ) | (33 | ) | (13 | ) | (20 | ) | |||||||||||
Plan curtailment | — | — | — | — | (6 | ) | — | ||||||||||||||||
Foreign currency translation and other | — | 47 | — | 1 | 1 | 1 | |||||||||||||||||
Benefit obligation, December 31 | $ | 2,215 | $ | 725 | $ | 2,066 | $ | 666 | $ | 146 | $ | 156 | |||||||||||
Accumulated benefit obligation ("ABO") | $ | 2,113 | $ | 691 | $ | 1,970 | $ | 639 | |||||||||||||||
Change in Plan Assets | |||||||||||||||||||||||
Fair value of plan assets, January 1 | $ | 1,507 | $ | 507 | $ | 1,509 | $ | 475 | $ | — | $ | — | |||||||||||
Actual return on plan assets | 243 | 44 | 117 | 47 | — | — | |||||||||||||||||
Company contributions | 4 | 15 | — | 11 | — | — | |||||||||||||||||
Benefits paid from plan assets | (99 | ) | (32 | ) | (119 | ) | (26 | ) | — | — | |||||||||||||
Foreign currency translation | — | 33 | — | — | — | — | |||||||||||||||||
Fair value of plan assets, December 31 | $ | 1,655 | $ | 567 | $ | 1,507 | $ | 507 | $ | — | $ | — | |||||||||||
Funded Status, End of Year | $ | (560 | ) | $ | (158 | ) | $ | (559 | ) | $ | (159 | ) | $ | (146 | ) | $ | (156 | ) | |||||
Recorded in the Balance Sheet | |||||||||||||||||||||||
Other long-term assets | $ | — | $ | 17 | $ | — | $ | 13 | $ | — | $ | — | |||||||||||
Other current liabilities | (13 | ) | (7 | ) | (7 | ) | (5 | ) | (10 | ) | (12 | ) | |||||||||||
Other long-term liabilities | (547 | ) | (168 | ) | (552 | ) | (167 | ) | (136 | ) | (144 | ) | |||||||||||
Net amount recognized, December 31 | $ | (560 | ) | $ | (158 | ) | $ | (559 | ) | $ | (159 | ) | $ | (146 | ) | $ | (156 | ) | |||||
Amounts recognized in accumulated other comprehensive income (loss) consist of: | |||||||||||||||||||||||
Net actuarial loss (gain) | $ | 807 | $ | 192 | $ | 832 | $ | 189 | $ | (15 | ) | $ | (20 | ) | |||||||||
Prior service cost (credit) | — | 11 | — | 12 | (6 | ) | (8 | ) | |||||||||||||||
Deferred tax benefit (Note 5) | (309 | ) | (47 | ) | (318 | ) | (46 | ) | 9 | 12 | |||||||||||||
Amount recognized in accumulated other comprehensive income (loss) (Note 7) | $ | 498 | $ | 156 | $ | 514 | $ | 155 | $ | (12 | ) | $ | (16 | ) | |||||||||
91
The changes in plan assets and benefit obligations recognized in other comprehensive income in 2017 and 2016 are as follows:
Pensions | OPEB | ||||||||||||||
(Millions of dollars) | 2017 | 2016 | 2017 | 2016 | |||||||||||
Current year net actuarial losses (gains)* | $ | 34 | $ | 172 | $ | (6 | ) | $ | 4 | ||||||
Amortization of net actuarial gains (losses) | (67 | ) | (60 | ) | 1 | 3 | |||||||||
Plan amendment | — | (2 | ) | — | (7 | ) | |||||||||
Amortization of prior service credits (costs) | (1 | ) | 1 | 2 | — | ||||||||||
Pension settlements (Note 2) | (2 | ) | (4 | ) | — | — | |||||||||
Curtailments | — | — | 12 | — | |||||||||||
Foreign currency translation and other | 13 | (2 | ) | (2 | ) | (2 | ) | ||||||||
Total recognized in other comprehensive income | $ | (23 | ) | $ | 105 | $ | 7 | $ | (2 | ) | |||||
________________________
* | Pension net actuarial losses in 2017 are driven by lower U.S. discount rates, which more than offset favorable plan asset experience. Pension net actuarial losses in 2016 are primarily driven by liability experience as well as lower U.S. discount rates. OPEB net actuarial gains in 2017 relate primarily to favorable liability experience whereas losses in 2016 are largely due to unfavorable plan experience. |
The amounts in accumulated other comprehensive income (loss) that are expected to be recognized as components of net periodic benefit cost during 2018 are as follows:
(Millions of dollars) | Pension | OPEB | |||||
Net actuarial loss (gain) | $ | 70 | $ | (2 | ) | ||
Prior service cost (credit) | 2 | — | |||||
$ | 72 | $ | (2 | ) | |||
The following table provides information for pension plans where the accumulated benefit obligation exceeds the fair value of the plan assets:
(Millions of dollars) Year Ended December 31, | Pensions | ||||||||||||||
2017 | 2016 | ||||||||||||||
U.S. | International | U.S. | International | ||||||||||||
Projected benefit obligation ("PBO") | $ | 2,215 | $ | 391 | $ | 2,066 | $ | 372 | |||||||
Accumulated benefit obligation ("ABO") | $ | 2,113 | $ | 383 | $ | 1,970 | $ | 365 | |||||||
Fair value of plan assets | $ | 1,655 | $ | 215 | $ | 1,507 | $ | 199 | |||||||
92
Assumptions
The assumptions used to determine benefit obligations are as of the respective balance sheet dates and the assumptions used to determine net benefit cost are as of the previous year-end, as shown below:
Pensions | |||||||||||||||||
U.S. | International | OPEB | |||||||||||||||
2017 | 2016 | 2017 | 2016 | 2017 | 2016 | ||||||||||||
Weighted average assumptions used to determine benefit obligations at December 31, | |||||||||||||||||
Discount rate | 3.61 | % | 4.05 | % | 4.46 | % | 5.09 | % | 3.58 | % | 4.21 | % | |||||
Rate of increase in compensation levels | 3.25 | % | 3.25 | % | 3.35 | % | 3.73 | % | N/A | N/A | |||||||
Weighted average assumptions used to determine net periodic benefit cost for years ended December 31, | |||||||||||||||||
Discount rate | 4.05 | % | 4.32 | % | 5.09 | % | 5.32 | % | 4.21 | % | 4.24 | % | |||||
Rate of increase in compensation levels | 3.25 | % | 3.25 | % | 3.73 | % | 3.57 | % | N/A | N/A | |||||||
Expected long-term rate of return on plan assets (1) | 8.00 | % | 8.00 | % | 7.91 | % | 7.92 | % | N/A | N/A | |||||||
________________________
(1) | The expected long term rate of return on the U.S. and international plan assets is estimated based on the plans' investment strategy and asset allocation, historical capital market performance and, to a lesser extent, historical plan performance. For the U.S. plans, the expected rate of return of 8.00% was derived based on the target asset allocation of 50%-70% equity securities (approximately 9.5% expected return), 20%-40% fixed income securities (approximately 5.5% expected return) and 2% - 10% real estate funds (approximately 7% expected return). For the international plans, the expected rate of return was derived based on the weighted average target asset allocation of 30%-50% equity securities (approximately 10% expected return), 40%-60% fixed income securities (approximately 7.5% expected return), and 0%-10% alternative investments (approximately 7.5% expected return). For the U.S. plan assets, the actual annualized total returns for the most recent 10-year and 20-year periods ended December 31, 2017 were approximately 5.8% and 6.7%, respectively. For the international plan assets, the actual annualized total returns for the same two periods were approximately 7.5% and 8.3%, respectively. Changes to plan asset allocations and investment strategy over this time period limit the value of historical plan performance as factor in estimating the expected long term rate of return. For 2018, the expected long-term rate of return on plan assets will be 8.00% for the U.S. plans. Expected weighted average returns for international plans will vary. |
OPEB | |||||
Assumed healthcare cost trend rates | 2017 | 2016 | |||
Healthcare cost trend assumed | 6.50 | % | 7.00 | % | |
Rate to which the cost trend rate is assumed to decline (the ultimate trend rate) | 5.00 | % | 5.00 | % | |
Year that the rate reaches the ultimate trend rate | 2023 | 2020 | |||
These healthcare cost trend rate assumptions have an impact on the amounts reported. However, cost caps limit the impact on the net OPEB benefit cost in the U.S. To illustrate the effect, a one-percentage point change in assumed healthcare cost trend rates would have the following effects:
One-Percentage Point | |||||||
(Millions of dollars) | Increase | Decrease | |||||
Effect on the total of service and interest cost components of net OPEB benefit cost | $ | — | $ | — | |||
Effect on OPEB benefit obligation | $ | 3 | $ | (2 | ) | ||
Pension Plan Assets
The investments of the U.S. pension plan are managed to meet the future expected benefit liabilities of the plan over the long term by investing in diversified portfolios consistent with prudent diversification and historical and expected
93
capital market returns. When Praxair became an independent, publicly traded company in 1992, its former parent retained all liabilities for its term-vested and retired employees. Praxair’s plan received assets and retained pension liabilities for its own active employee base. Therefore, the liabilities under the Praxair U.S. pension plan mature at a later date compared to pension funds of other similar companies. Investment strategies are reviewed by the Finance and Pension Committee of the company’s Board of Directors and investment performance is tracked against appropriate benchmarks. There are no concentrations of risk as it relates to the assets within the plans.
The international pension plans are managed individually based on diversified investment portfolios, with different target asset allocations that vary for each plan. Praxair’s U.S. and international pension plans’ weighted-average asset allocations at December 31, 2017 and 2016, and the target asset allocation range for 2017, by major asset category, are as follows:
U.S. | International | ||||||||||||||
Asset Category | Target | 2017 | 2016 | Target | 2017 | 2016 | |||||||||
Equity securities | 50%-70% | 61 | % | 59 | % | 30%-50% | 38 | % | 35 | % | |||||
Fixed income securities | 20%-40% | 30 | % | 32 | % | 40%-60% | 53 | % | 56 | % | |||||
Other | 2% - 10% | 9 | % | 9 | % | 0%-10% | 9 | % | 9 | % | |||||
94
The following table summarizes pension assets measured at fair value by asset category at December 31, 2017 and 2016. During the years presented, there has been no transfer of assets between Levels 1, 2 and 3 (see Note 13 for definition of the levels):
Fair Value Measurements Using | |||||||||||||||||||||||||||||||
Level 1 | Level 2 | Level 3 ** | Total | ||||||||||||||||||||||||||||
(Millions of dollars) | 2017 | 2016 | 2017 | 2016 | 2017 | 2016 | 2017 | 2016 | |||||||||||||||||||||||
Cash and cash equivalents | $ | 7 | $ | 3 | $ | — | $ | — | $ | — | $ | — | $ | 7 | $ | 3 | |||||||||||||||
Equity securities: | |||||||||||||||||||||||||||||||
U.S. equities | 257 | 344 | — | — | — | — | 257 | 344 | |||||||||||||||||||||||
International equities | 45 | 37 | — | — | — | — | 45 | 37 | |||||||||||||||||||||||
Mutual funds | — | 2 | — | — | — | — | — | 2 | |||||||||||||||||||||||
Fixed income securities: | |||||||||||||||||||||||||||||||
U.S. government bonds | — | — | 54 | 51 | — | — | 54 | 51 | |||||||||||||||||||||||
International government bonds | — | — | 192 | 159 | — | — | 192 | 159 | |||||||||||||||||||||||
Mutual funds | 118 | 104 | — | — | — | — | 118 | 104 | |||||||||||||||||||||||
Corporate bonds | — | — | 181 | 194 | — | — | 181 | 194 | |||||||||||||||||||||||
Other: | |||||||||||||||||||||||||||||||
Insurance contracts | — | — | — | — | 50 | 45 | 50 | 45 | |||||||||||||||||||||||
Real estate funds | — | — | — | — | 158 | 135 | 158 | 135 | |||||||||||||||||||||||
Total plan assets at fair value, December 31, | $ | 427 | $ | 490 | $ | 427 | $ | 404 | $ | 208 | $ | 180 | $ | 1,062 | $ | 1,074 | |||||||||||||||
Pooled funds * | 1,160 | 940 | |||||||||||||||||||||||||||||
Total fair value plan assets December 31, | $ | 2,222 | $ | 2,014 | |||||||||||||||||||||||||||
* Pooled funds are measured using the net asset value ("NAV") as a practical expedient for fair value as permissible under the accounting standard for fair value measurements and have not been categorized in the fair value hierarchy in accordance with recently issued accounting standards updates related to Disclosures for Investments in Certain Entities That Calculate Net Asset Value per Share.
** The following table summarizes changes in fair value of the pension plan assets classified as level 3 for the periods ended December 31, 2017 and 2016:
(Millions of dollars) | Insurance Contracts | Real Estate Funds | Total | ||||||||
Balance, December 31, 2015 | $ | 43 | $ | 123 | $ | 166 | |||||
Gain/(Loss) for the period | 3 | 12 | 15 | ||||||||
Acquisitions | — | — | — | ||||||||
Foreign currency translation | (1 | ) | — | (1 | ) | ||||||
Balance, December 31, 2016 | 45 | 135 | 180 | ||||||||
Gain/(Loss) for the period | (1 | ) | 12 | 11 | |||||||
Acquisitions | — | 11 | 11 | ||||||||
Foreign currency translation | 6 | — | 6 | ||||||||
Balance, December 31, 2017 | $ | 50 | $ | 158 | $ | 208 | |||||
The descriptions and fair value methodologies for the U.S. and international pension plan assets are as follows:
Cash and Cash Equivalents – This category includes cash and short-term interest bearing investments with maturities of three months or less. Investments are valued at cost plus accrued interest. Cash and cash equivalents are classified within level 1 of the valuation hierarchy.
95
Equity Securities – This category is comprised of shares of common stock in U.S. and international companies from a diverse set of industries and size. Common stock is valued at the closing market price reported on a U.S. or international exchange where the security is actively traded. Equity securities are classified within level 1 of the valuation hierarchy.
Mutual Funds – These categories consist of publicly and privately managed funds that invest primarily in marketable equity and fixed income securities. The fair value of these investments is determined by reference to the net asset value of the underlying securities of the fund. Shares of publicly traded mutual funds are valued at the net asset value quoted on the exchange where the fund is traded and are classified as level 1 within the valuation hierarchy.
U.S. and International Government Bonds – This category includes U.S. treasuries, U.S. federal agency obligations and international government debt. The majority of these investments do not have quoted market prices available for a specific government security and so the fair value is determined using quoted prices of similar securities in active markets and is classified as level 2 within the valuation hierarchy.
Corporate Bonds – This category is comprised of corporate bonds of U.S. and international companies from a diverse set of industries and size. The fair values for U.S. and international corporate bonds are determined using quoted prices of similar securities in active markets and observable data or broker or dealer quotations. The fair values for these investments are classified as level 2 within the valuation hierarchy.
Pooled Funds - Pooled fund NAVs are provided by the trustee and are determined by reference to the fair value of the underlying securities of the trust, less its liabilities, which are valued primarily through the use of directly or indirectly observable inputs. Depending on the pooled fund, underlying securities may include marketable equity securities or fixed income securities.
Insurance Contracts – The fair value of insurance contracts is determined based on the cash surrender value of the insurance contract, which is determined based on such factors as the fair value of the underlying assets and discounted cash flows. These contracts are with highly rated insurance companies. Insurance contracts are classified within level 3 of the valuation hierarchy.
Real Estate Funds – This category includes real estate properties, partnership equities and investments in operating companies. The fair value of the assets is determined using discounted cash flows by estimating an income stream for the property plus a reversion into a present value at a risk adjusted rate. Yield rates and growth assumptions utilized are derived from market transactions as well as other financial and industry data. The fair value for these investments are classified within level 3 of the valuation hierarchy.
Contributions
At a minimum, Praxair contributes to its pension plans to comply with local regulatory requirements (e.g., ERISA in the United States). Discretionary contributions in excess of the local minimum requirements are made based on many factors, including long-term projections of the plans' funded status, the economic environment, potential risk of overfunding, pension insurance costs and alternative uses of the cash. Changes to these factors can impact the timing of discretionary contributions from year to year. Pension contributions were $19 million in 2017, $11 million in 2016 and $15 million in 2015. Estimated required contributions for 2018 are currently expected to be in the area of $15 million to $20 million.
Estimated Future Benefit Payments
The following table presents estimated future benefit payments, net of participants contributions:
(Millions of dollars) | Pensions | ||||||||||
Year Ended December 31, | U.S. | International | OPEB | ||||||||
2018 | $ | 117 | $ | 35 | $ | 11 | |||||
2019 | 124 | 36 | 11 | ||||||||
2020 | 125 | 38 | 11 | ||||||||
2021 | 127 | 38 | 11 | ||||||||
2022 | 129 | 38 | 10 | ||||||||
2023-2027 | 680 | 199 | 44 | ||||||||
96
NOTE 17. COMMITMENTS AND CONTINGENCIES
The company accrues non income-tax liabilities for contingencies when management believes that a loss is probable and the amounts can be reasonably estimated, while contingent gains are recognized only when realized. In the event any losses are sustained in excess of accruals, they will be charged against income at that time. Attorney fees are recorded as incurred. Commitments represent obligations, such as those for future purchases of goods or services, that are not yet recorded on the company’s balance sheet as liabilities. The company records liabilities for commitments when incurred (i.e., when the goods or services are received).
Contingent Liabilities
Praxair is subject to various lawsuits and government investigations that arise from time to time in the ordinary course of business. These actions are based upon alleged environmental, tax, antitrust and personal injury claims, among others. Praxair has strong defenses in these cases and intends to defend itself vigorously. It is possible that the company may incur losses in connection with some of these actions in excess of accrued liabilities. Management does not anticipate that in the aggregate such losses would have a material adverse effect on the company’s consolidated financial position or liquidity; however, it is possible that the final outcomes could have a significant impact on the company’s reported results of operations in any given period.
Significant matters are:
• | During May 2009, the Brazilian government published Law 11941/2009 instituting a new voluntary amnesty program (“Refis Program”) which allowed Brazilian companies to settle certain federal tax disputes at reduced amounts. During the 2009 third quarter, Praxair decided that it was economically beneficial to settle many of its outstanding federal tax disputes and such disputes were enrolled in the Refis Program, subject to final calculation and review by the Brazilian federal government. The Company recorded estimated liabilities based on the terms of the Refis Program. Since 2009, Praxair has been unable to reach final agreement on the calculations and initiated litigation against the government in an attempt to resolve certain items. Open issues relate to the following matters: (i) application of cash deposits and net operating loss carryforwards to satisfy obligations and (ii) the amount of tax reductions available under the Refis Program. It is difficult to estimate the timing of resolution of legal matters in Brazil. |
• | At December 31, 2017 the most significant non-income and income tax claims in Brazil, after enrollment in the Refis Program, relate to state VAT tax matters and a federal income tax matter where the taxing authorities are challenging the tax rate that should be applied to income generated by a subsidiary company. The total estimated exposure relating to such claims, including interest and penalties, as appropriate, is approximately $235 million. Praxair has not recorded any liabilities related to such claims based on management judgments, after considering judgments and opinions of outside counsel. Because litigation in Brazil historically takes many years to resolve, it is very difficult to estimate the timing of resolution of these matters; however, it is possible that certain of these matters may be resolved within the near term. The company is vigorously defending against the proceedings. |
• | On September 1, 2010, CADE ("Brazilian Administrative Council for Economic Defense") announced alleged anticompetitive activity on the part of five industrial gas companies in Brazil and imposed fines on all five companies. Originally, CADE imposed a civil fine of R$2.2 billion Brazilian reais (US$665 million) against White Martins, the Brazil-based subsidiary of Praxair, Inc. In response to a motion for clarification, the fine was reduced to R$1.7 billion Brazilian reais (US$514 million) due to a calculation error made by CADE. The amount of the fine is subject to indexation using SELIC. On September 2, 2010, Praxair issued a press release and filed a report on Form 8-K rejecting all claims and stating that the fine represents a gross and arbitrary disregard of Brazilian law. |
On October 19, 2010, White Martins filed an annulment petition (“appeal”) with the Federal Court in Brasilia seeking to have the fine against White Martins entirely overturned. In order to suspend payment of the fine pending the completion of the appeal process, Brazilian law required that the company tender a form of guarantee in the amount of the fine as security. Initially, 50% of the guarantee was satisfied by letters of credit with a financial institution and 50% by equity of a Brazilian subsidiary. On April 15, 2016, the Ninth Federal Court in Brasilia allowed White Martins to withdraw and cancel the letters of credit. Accordingly, the guarantee is currently satisfied solely by equity of a Brazilian subsidiary.
On September 14, 2015, the Ninth Federal Court of Brasilia overturned the fine against White Martins and declared the original CADE administrative proceeding to be null and void. On June 30, 2016, CADE filed an appeal against this decision with the Federal Circuit Court in Brasilia.
97
Praxair strongly believes that the allegations are without merit and that the fine will be entirely overturned during the appeal process. The company further believes that it has strong defenses and will vigorously defend against the allegations and related fine up to such levels of the Federal Courts in Brazil as may be necessary. Because appeals in Brazil historically take many years to resolve, it is very difficult to estimate when the appeal will be finally decided. Based on management judgments, after considering judgments and opinions of outside counsel, no reserve has been recorded for this proceeding as management does not believe that a loss is probable.
Commitments and Contractual Obligations
The following table sets forth Praxair’s material commitments and contractual obligations as of December 31, 2017, excluding leases, tax liabilities for uncertain tax positions, long-term debt, other post retirement and pension obligations which are summarized elsewhere in the financial statements (see Notes 4, 5, 11, and 16):
(Millions of dollars) Expiring through December 31, | Unconditional Purchase Obligations | Construction Commitments | |||||
2018 | $ | 575 | $ | 842 | |||
2019 | 517 | 212 | |||||
2020 | 451 | 11 | |||||
2021 | 468 | — | |||||
2022 | 437 | — | |||||
Thereafter | 2,511 | — | |||||
$ | 4,959 | $ | 1,065 | ||||
Unconditional purchase obligations of $4,959 million represent contractual commitments under various long and short-term take-or-pay arrangements with suppliers and are not included on Praxair's balance sheet. These obligations are primarily minimum-purchase commitments for helium, electricity, natural gas and feedstock used to produce atmospheric and process gases. A significant portion of these obligations is passed on to customers through similar take-or-pay or other contractual arrangements. Purchase obligations that are not passed along to customers through such contractual arrangements are subject to market conditions, but do not represent a material risk to Praxair. During 2017, payments related to Praxair's unconditional purchase obligations totaled $1,034 million, including $455 million for electricity and $261 million for natural gas. Approximately $2,591 million of the purchase obligations relates to power and is intended to secure the uninterrupted supply of electricity and feedstock to Praxair's plants to reliably satisfy customer product supply obligations, and extend through 2030. Certain of the power contracts contain various cancellation provisions requiring supplier agreement, and many are subject to annual escalations based on local inflation factors. The purchase obligations also include a multi-year contract for silane, with a total purchase obligation of $69 million as of December 31, 2017. At December 31, 2017, Praxair's current selling prices and estimated future demand for silane are in excess of its contractual purchase obligations under the contract.
Construction commitments of $1,065 million represent outstanding commitments to complete authorized construction projects as of December 31, 2017. A significant portion of Praxair’s capital spending is related to the construction of new production facilities to satisfy customer commitments which may take a year or more to complete.
Unconsolidated equity investees had total debt of approximately $353 million at December 31, 2017, which was non-recourse to Praxair. Additionally, Praxair pledged its interest in an unconsolidated equity investment as collateral for $24 million of debt held by that same equity investee. Praxair has no significant financing arrangements with closely-held related parties.
At December 31, 2017, Praxair had undrawn outstanding letters of credit, bank guarantees and surety bonds valued at approximately $572 million from financial institutions. These relate primarily to customer contract performance guarantees (including plant construction in connection with certain on-site contracts), self-insurance claims and other commercial and governmental requirements, including foreign litigation matters.
98
NOTE 18. SEGMENT INFORMATION
The company’s operations are organized into five reportable segments, four of which have been determined on a geographic basis of segmentation: North America, Europe, South America and Asia. In addition, Praxair operates its worldwide surface technologies business through its wholly-owned subsidiary, Praxair Surface Technologies, Inc., which represents the fifth reportable segment.
Praxair’s operations consist of two major product lines: industrial gases and surface technologies. The industrial gases product line centers on the manufacturing and distribution of atmospheric gases (oxygen, nitrogen, argon, rare gases) and process gases (carbon dioxide, helium, hydrogen, electronic gases, specialty gases, acetylene). Many of these products are co-products of the same manufacturing process. Praxair manufactures and distributes nearly all of its products and manages its customer relationships on a regional basis. Praxair’s industrial gases are distributed to various end-markets within a regional segment through one of three basic distribution methods: on-site or tonnage; merchant or bulk; and packaged or cylinder gases. The distribution methods are generally integrated in order to best meet the customer’s needs and very few of its products can be economically transported outside of a region. Therefore, the distribution economics are specific to the various geographies in which the company operates and are consistent with how management assesses performance.
Praxair evaluates the performance of its reportable segments based primarily on operating profit, excluding inter-company royalties and items not indicative of ongoing business trends. Corporate and globally managed expenses, and research and development costs relating to Praxair’s global industrial gases business, are allocated to operating segments based on sales.
The table below presents information about reportable segments for the years ended December 31, 2017, 2016 and 2015.
(Millions of dollars) | 2017 | 2016 | 2015 | ||||||||
Sales (a) | |||||||||||
North America | $ | 6,023 | $ | 5,592 | $ | 5,865 | |||||
Europe | 1,558 | 1,392 | 1,320 | ||||||||
South America | 1,501 | 1,399 | 1,431 | ||||||||
Asia | 1,738 | 1,555 | 1,551 | ||||||||
Surface Technologies | 617 | 596 | 609 | ||||||||
$ | 11,437 | $ | 10,534 | $ | 10,776 | ||||||
2017 | 2016 | 2015 | |||||||||
Operating Profit | |||||||||||
North America | $ | 1,517 | $ | 1,430 | $ | 1,558 | |||||
Europe | 297 | 273 | 250 | ||||||||
South America | 250 | 257 | 291 | ||||||||
Asia | 333 | 276 | 289 | ||||||||
Surface Technologies | 105 | 102 | 105 | ||||||||
Segment operating profit | 2,502 | 2,338 | 2,493 | ||||||||
Transaction costs and other charges (Note 2) | (54 | ) | (100 | ) | (172 | ) | |||||
Total operating profit | $ | 2,448 | $ | 2,238 | $ | 2,321 | |||||
99
2017 | 2016 | 2015 | |||||||||
Total Assets (b) | |||||||||||
North America | $ | 10,419 | $ | 10,019 | $ | 9,748 | |||||
Europe | 3,282 | 2,928 | 2,704 | ||||||||
South America | 2,738 | 2,748 | 2,124 | ||||||||
Asia | 3,252 | 2,984 | 3,113 | ||||||||
Surface Technologies | 745 | 653 | 630 | ||||||||
$ | 20,436 | $ | 19,332 | $ | 18,319 | ||||||
2017 | 2016 | 2015 | |||||||||
Depreciation and Amortization | |||||||||||
North America | $ | 631 | $ | 614 | $ | 609 | |||||
Europe | 169 | 155 | 145 | ||||||||
South America | 159 | 133 | 135 | ||||||||
Asia | 185 | 179 | 176 | ||||||||
Surface Technologies | 40 | 41 | 41 | ||||||||
$ | 1,184 | $ | 1,122 | $ | 1,106 | ||||||
2017 | 2016 | 2015 | |||||||||
Capital Expenditures and Acquisitions | |||||||||||
North America | $ | 779 | $ | 989 | $ | 869 | |||||
Europe | 141 | 402 | 227 | ||||||||
South America | 129 | 232 | 285 | ||||||||
Asia | 209 | 165 | 208 | ||||||||
Surface Technologies | 86 | 40 | 34 | ||||||||
$ | 1,344 | $ | 1,828 | $ | 1,623 | ||||||
2017 | 2016 | 2015 | |||||||||
Sales by Product Group | |||||||||||
Atmospheric gases and related | $ | 7,938 | $ | 7,329 | $ | 7,595 | |||||
Process gases and other | 2,882 | 2,609 | 2,572 | ||||||||
Surface technologies | 617 | 596 | 609 | ||||||||
$ | 11,437 | $ | 10,534 | $ | 10,776 | ||||||
2017 | 2016 | 2015 | |||||||||
Sales by Major Country | |||||||||||
United States | $ | 4,973 | $ | 4,623 | $ | 4,771 | |||||
Brazil | 1,179 | 1,091 | 1,107 | ||||||||
Other – foreign | 5,285 | 4,820 | 4,898 | ||||||||
$ | 11,437 | $ | 10,534 | $ | 10,776 | ||||||
100
2017 | 2016 | 2015 | |||||||||
Long-lived Assets by Major Country (c) | |||||||||||
United States | $ | 5,122 | $ | 4,922 | $ | 4,825 | |||||
Brazil | 1,225 | 1,262 | 986 | ||||||||
Other – foreign | 5,710 | 5,293 | 5,187 | ||||||||
$ | 12,057 | $ | 11,477 | $ | 10,998 | ||||||
________________________
(a) | Sales reflect external sales only. Intersegment sales, primarily from North America to other segments, were not material. |
(b) | Includes equity investments as of December 31, as follows: |
(Millions of dollars) | 2017 | 2016 | 2015 | ||||||||
North America | $ | 115 | $ | 121 | $ | 127 | |||||
Europe | 287 | 243 | 195 | ||||||||
Asia | 325 | 353 | 343 | ||||||||
$ | 727 | $ | 717 | $ | 665 | ||||||
Changes primarily relate to equity investment earnings, dividends and currency impacts.
(c) | Long-lived assets include property, plant and equipment – net. |
NOTE 19. QUARTERLY DATA (UNAUDITED)
(Dollar amounts in millions, except per share data)
2017 | 1Q (a) | 2Q (a) | 3Q (a) | 4Q (a) | YEAR (a) | ||||||||||||||
Sales | $ | 2,728 | $ | 2,834 | $ | 2,922 | $ | 2,953 | $ | 11,437 | |||||||||
Cost of sales, exclusive of depreciation and amortization | $ | 1,545 | $ | 1,598 | $ | 1,652 | $ | 1,660 | $ | 6,455 | |||||||||
Depreciation and amortization | $ | 287 | $ | 292 | $ | 298 | $ | 307 | $ | 1,184 | |||||||||
Operating profit | $ | 582 | $ | 604 | $ | 626 | $ | 636 | $ | 2,448 | |||||||||
Net income – Praxair, Inc. | $ | 389 | $ | 406 | $ | 419 | $ | 33 | $ | 1,247 | |||||||||
Basic Per Share Data | |||||||||||||||||||
Net income | $ | 1.36 | $ | 1.42 | $ | 1.46 | $ | 0.11 | $ | 4.36 | |||||||||
Weighted average shares (000’s) | 285,509 | 286,090 | 286,467 | 286,976 | 286,261 | ||||||||||||||
Diluted Per Share Data | |||||||||||||||||||
Net income | $ | 1.35 | $ | 1.41 | $ | 1.45 | $ | 0.11 | $ | 4.32 | |||||||||
Weighted average shares (000’s) | 287,384 | 288,535 | 289,216 | 290,456 | 289,114 | ||||||||||||||
101
2016 | 1Q (a) | 2Q | 3Q (a) | 4Q | YEAR (a) | ||||||||||||||
Sales | $ | 2,509 | $ | 2,665 | $ | 2,716 | $ | 2,644 | $ | 10,534 | |||||||||
Cost of sales, exclusive of depreciation and amortization | $ | 1,381 | $ | 1,468 | $ | 1,533 | $ | 1,478 | $ | 5,860 | |||||||||
Depreciation and amortization | $ | 272 | $ | 281 | $ | 284 | $ | 285 | $ | 1,122 | |||||||||
Operating profit | $ | 554 | $ | 588 | $ | 497 | $ | 599 | $ | 2,238 | |||||||||
Net income – Praxair, Inc. | $ | 356 | $ | 399 | $ | 339 | $ | 406 | $ | 1,500 | |||||||||
Basic Per Share Data | |||||||||||||||||||
Net income | $ | 1.25 | $ | 1.40 | $ | 1.19 | $ | 1.42 | $ | 5.25 | |||||||||
Weighted average shares (000’s) | 285,429 | 285,702 | 285,858 | 285,720 | 285,677 | ||||||||||||||
Diluted Per Share Data | |||||||||||||||||||
Net income | $ | 1.24 | $ | 1.39 | $ | 1.18 | $ | 1.41 | $ | 5.21 | |||||||||
Weighted average shares (000’s) | 286,665 | 287,727 | 288,195 | 287,956 | 287,757 | ||||||||||||||
________________________
(a) | 2017 and 2016 include the impact of the following charges (see Notes 2, 5, 11 & 16): |
(Millions of dollars) | Operating Profit/ (Loss) | Net Income/ (Loss) | Diluted Earnings Per Share | ||||||||
Transaction costs - Q1 | $ | (6 | ) | $ | (6 | ) | $ | (0.02 | ) | ||
Transaction costs - Q2 | (15 | ) | (15 | ) | (0.05 | ) | |||||
Transaction costs - Q3 | (14 | ) | (13 | ) | (0.05 | ) | |||||
Pension settlement charge - Q3 | (2 | ) | (1 | ) | — | ||||||
Transaction costs - Q4 | (17 | ) | (14 | ) | (0.05 | ) | |||||
Tax Act - Q4 | — | (394 | ) | (1.36 | ) | ||||||
Year 2017 | $ | (54 | ) | $ | (443 | ) | $ | (1.53 | ) | ||
Bond Redemption - Q1 | $ | — | $ | (10 | ) | $ | (0.04 | ) | |||
Cost reduction program and other charges - Q3 | (96 | ) | (63 | ) | (0.22 | ) | |||||
Pension settlement charge - Q3 | (4 | ) | (3 | ) | (0.01 | ) | |||||
Year 2016 | $ | (100 | ) | $ | (76 | ) | $ | (0.27 | ) | ||
102
NOTE 20. PROPOSED BUSINESS COMBINATION WITH LINDE AG
On June 1, 2017, Praxair, Inc. and Linde AG entered into a definitive Business Combination Agreement, as amended (the "Business Combination Agreement"), pursuant to which, among other things, Praxair, Inc. and Linde AG agreed to combine their respective businesses through an all-stock transaction, and become subsidiaries of a new holding company incorporated in Ireland, Linde plc. In connection with the proposed business combination, Linde plc filed a Registration Statement on Form S-4 which was declared effective by the U. S. Securities and Exchange Commission ("SEC") on August 14, 2017.
Linde plc also filed an offer document with the German Federal Financial Supervisory Authority (Bundesanstalt fuer Finanzdienstleistungsaufsicht) (“BaFin”) which was approved for publication by BaFin on August 14, 2017 and published by Linde plc on August 15, 2017. Pursuant to the offer document, Linde plc made an offer to exchange each issued and outstanding no-par value bearer share of Linde AG for 1.540 ordinary shares of Linde plc (the “Exchange Offer”). In addition, Zamalight Subco, Inc., an indirect wholly-owned Delaware subsidiary of Linde plc, will merge with and into Praxair, Inc., with Praxair, Inc. surviving the merger (the “Merger”, and together with the Exchange Offer, the “Business Combination”). In the Merger, each share of Praxair, Inc. common stock will be converted into the right to receive one Linde plc ordinary share. Linde plc will apply to list its ordinary shares on the New York Stock Exchange and the Frankfurt Stock Exchange, and will seek inclusion in the S&P 500 and DAX 30 indices. Praxair Inc.’s stockholders approved the Merger at Praxair Inc.’s special meeting held on September 27, 2017, and on November 24, 2017, the tender period for the Exchange Offer expired with approximately 92% of all Linde AG shares entitled to voting rights being tendered. The parties currently expect the Business Combination to be completed in the second half of 2018.
Completion of the Business Combination remains subject to approval by requisite governmental regulators and authorities, including approvals under applicable competition laws.
The Business Combination Agreement, or certain covenants contained therein, may be terminated for, or may terminate as a result of, certain reasons, including, among others, (a) the mutual consent of Praxair, Inc. and Linde AG to termination, (b) a permanent injunction or order by any governmental entity in Ireland, the United Kingdom, Germany or the United States that prohibits or makes illegal the completion of the Business Combination, (c) the occurrence of a change, event, occurrence or effect that has had or is reasonably expected to have a “material adverse change” (as defined in the Business Combination Agreement) on Linde AG or Praxair, Inc. or (d) the failure to obtain approval by requisite governmental regulators and authorities described in the preceding paragraph.
For additional information related to the Business Combination Agreement, please refer to the proxy statement/prospectus filed by Praxair, Inc. on Schedule 14A with the SEC on August 16, 2017.
103
ITEM 9. | CHANGES IN AND DISAGREEMENTS WITH ACCOUNTANTS ON ACCOUNTING AND FINANCIAL DISCLOSURE |
None.
ITEM 9A. CONTROLS AND PROCEDURES
Conclusion Regarding the Effectiveness of Disclosure Controls and Procedures
Based on an evaluation of the effectiveness of Praxair’s disclosure controls and procedures, which was made under the supervision and with the participation of management, including Praxair’s principal executive officer and principal financial officer, the principal executive officer and principal financial officer have each concluded that, as of the end of the annual period covered by this report, such disclosure controls and procedures are effective in ensuring that information required to be disclosed by Praxair in reports that it files under the Exchange Act of 1934 is recorded, processed, summarized and reported within the time periods specified in the Securities and Exchange Commission’s rules and forms, and accumulated and communicated to management including Praxair’s principal executive officer and principal financial officer, to allow timely decisions regarding required disclosure.
Management’s Report on Internal Control Over Financial Reporting
Praxair’s management is responsible for establishing and maintaining adequate internal control over financial reporting, as such term is defined in Exchange Act Rule 13a-15(f). Under the supervision and with the participation of management, including the company’s principal executive officer and principal financial officer, Praxair conducted an evaluation of the effectiveness of its internal control over financial reporting based on the framework in Internal Control – Integrated Framework (2013) issued by the Committee of Sponsoring Organizations of the Treadway Commission (often referred to as COSO). Based on this evaluation, management concluded that the company’s internal control over financial reporting was effective as of December 31, 2017.
PricewaterhouseCoopers LLP, an independent registered public accounting firm, has issued their opinion on the company’s internal control over financial reporting as of December 31, 2017 as stated in their report in Item 8.
Changes in Internal Control over Financial Reporting
There were no changes in Praxair’s internal control over financial reporting that occurred during the fourth quarter of 2017 that have materially affected, or are reasonably likely to materially affect, Praxair’s internal control over financial reporting.
ITEM 9B. OTHER INFORMATION
None.
104
PART III
Introductory note: On January 29, 2018, Praxair announced that the Board of Directors of Praxair has postponed the 2018 Annual Meeting of Shareholders given Praxair’s proposed business combination with Linde AG (“Linde”) pursuant to the Business Combination Agreement dated as of June 1, 2017, as amended, among Praxair, Linde, Linde plc and certain of their subsidiaries. As such, Praxair does not anticipate distributing a proxy statement to shareholders, from which certain information required by this Part III would be incorporated by reference, unless a postponed Annual Meeting is held later in 2018. Therefore, the information required by this Part III is either set forth in the applicable item below or will be provided in an amendment to this Form 10-K filed no later than April 30, 2018.
ITEM 10. DIRECTORS, EXECUTIVE OFFICERS AND CORPORATE GOVERNANCE
Biographical and other information about each member of Praxair’s Board of Directors is set forth below. Biographical and other information about each executive office of Praxair is set forth under Item 1 of this Form 10-K under the caption “Executive Officers.”
Directors of Praxair
STEPHEN F. ANGEL | |||
Chief Executive Officer and Chairman of Praxair | |||
Age Director Since Other Public Company Directorships | 62 2006 PPG Industries, Inc. | Qualification Highlights · Industry · Praxair End-Markets · Praxair Foreign Markets · Operations · International business · Technology · Risk Management · Public company board | |
Biography
Chief Executive Officer of Praxair, Inc. since January 1, 2007, and Chairman since May 1, 2007. Before becoming the Chief Executive Officer, Mr. Angel served as President & Chief Operating Officer from March to December 2006, and as Executive Vice President from 2001 to March 2006. Prior to joining Praxair in 2001, Mr. Angel spent 22 years in a variety of management positions with General Electric.
Mr. Angel is a director of PPG Industries, Inc. (where he serves on the Officers-Directors Compensation Committee and the Technology and Environment Committee). He is also a member of The Business Council and is a member of the Board of the U.S. - China Business Council where he serves on its Nominating Committee.
Experience and Qualifications
As the Chief Executive Officer of the Company and a former senior operating executive at General Electric, a global diversified manufacturing company, Mr. Angel brings the senior executive experience and skills described above. He also has a deep insight into the industrial gases industry and the needs, challenges and global opportunities of the Company in particular. Mr. Angel utilizes his deep operating experience and knowledge of the industry and the Company in performing his role as Chairman to, among other things, drive capital discipline and to help facilitate Board discussions and keep the Board apprised of significant developments in the Company’s business.
105
OSCAR BERNARDES | |||
Managing partner at Yguapora Consultoria e Empreendimentos Ltda. | |||
Age Director Since Other Public Company Directorships | 71 2010 DASA Laboratorios da America SA Localiza Rent A Car S.A. Marcopolo S.A. | Qualification Highlights · Praxair End-Markets · Praxair Foreign Markets · Operations · International business · Risk Management · Public company board | |
Biography
Managing partner at Yguapora Consultoria e Empreendimentos Ltda. in São Paulo, Brazil, a consulting and investment firm. From 2003 to 2010, he was a managing partner at Integra Assessoria em Negocios Ltda. in São Paulo, Brazil, a consulting firm specializing in financial restructuring, governance and interim management in turnaround situations. From 1997 to 1999, he was Chief Executive Officer of Bunge International, a leading global agribusiness and food company. Prior to joining Bunge, he was Senior Vice President and Managing Partner for Latin America with Booz Allen and Hamilton, Inc. and prior to that, operations director in Brazil for Ferro Corporation.
Mr. Bernardes is a director of three public companies in Brazil: DASA Laboratorios da America SA, Localiza Rent A Car S.A. (where he is Chairman of the Audit Committee), and Marcopolo S.A. During the past five years, he was also a director of Gerdau S.A., Metalurgica Gerdau S.A., Johnson Electric Holdings Ltd. in Hong Kong, and São Paulo Alpargatas S.A. He is also on the advisory board of Amerys, Johnson Electric and a Board Member of Votorantim Participacoes and OMINI, both private companies.
Experience and Qualifications
As a former chief executive officer at Bunge International, and as a senior executive of Booz Allen and Hamilton, Mr. Bernardes brings the senior executive experience and skills described above. He also has an in-depth understanding of markets and business operations in South America generally, and in Brazil particularly, where the Company has a large presence.
NANCE K. DICCIANI | |||
Former President & Chief Executive Officer of Honeywell Specialty Materials | |||
Age Director Since Other Public Company Directorships | 70 2008 AgroFresh Solutions, Inc. Halliburton Company LyondellBasell Industries | Qualification Highlights · Industry · Praxair End-Markets · Praxair Foreign Markets · Operations · International business · Technology · Risk Management · Public company board | |
Biography
Former President & Chief Executive Officer of Honeywell Specialty Materials, a strategic business group of Honeywell International, Inc., from 2001 until her retirement in 2008. Dr. Dicciani joined Honeywell from Rohm and Haas Company where she was Senior Vice President and Business Group Executive of Chemical Specialties and Director of the European Region, responsible for business strategy and worldwide operations of five business units and for the company’s operations and infrastructure in Europe, the Middle East and Africa. Previously, she served as Rohm and Haas’ Vice President and General Manager of the Petroleum Chemicals division and headed the company’s worldwide Monomers business.
In 2006, President George W. Bush appointed Dr. Dicciani to the President’s Council of Advisors on Science and Technology. She has served on the Board of Directors and Executive Committee of the American Chemistry Council and has chaired its Research Committee. She currently serves on the Board of Directors of AgroFresh Solutions, Inc. (where she serves as non-executive Chair and a member of the Compensation Committee). Dr. Dicciani also serves on the Board of Directors of Halliburton Company (where she serves on the Audit, and the Health, Safety and Environment Committees), LyondellBasell Industries (where she serves on the Finance, and the Health, Safety and Environmental Committees), and on the Board of Trustees of Villanova University. During the past five years, Dr. Dicciani also served on
106
the Board of Directors of Rockwood Holdings, Inc. (where she was the Lead Director and served on the Compensation Committee and was the Chairperson of the Corporate Governance and Nominating Committee). She also serves as the Co-Chair of the Advisory Board of the Center for Corporate Governance of Drexel University.
Experience and Qualifications
As a former senior operating executive at Honeywell, a global industrial and consumer products manufacturing company, and at Rohm and Haas, a global chemicals company, Dr. Dicciani brings the senior executive experience and skills described above. She also has a substantial understanding of technology policy, management and markets. Her technical expertise in the chemical industry, an important end-market for the Company, and her international operations experience, also enable her to provide the Board and management with valuable insight and counsel.
EDWARD G. GALANTE | |||
Former Senior Vice President of ExxonMobil Corporation | |||
Age Director Since Other Public Company Directorships | 67 2007 Celanese Corporation Clean Harbors, Inc. Tesoro Corporation | Qualification Highlights · Praxair End-Markets · Praxair Foreign Markets · Operations · International business · Technology · Risk Management · Public company board | |
Biography
Former Senior Vice President and a member of the Management Committee of ExxonMobil Corporation from 2001 until his retirement in 2006. His principal responsibilities included the worldwide downstream business - Refining & Supply, Fuels Marketing, Lubricants and Specialties, and Research and Engineering. Immediately prior to that, Mr. Galante was Executive Vice President of ExxonMobil Chemical Company.
Mr. Galante is the Lead Independent director of Celanese Corporation (where he serves on the Compensation and Management Development Committee and the Governance & Nominating Committee), a director of Clean Harbors, Inc. (where he serves on the Compensation Committee, the Governance Committee and is the Chair of the Environmental, Safety and Health Committee), and is a director of Andeavor Corporation (where he serves on the Compensation Committee and the Environmental, Health, Safety and Security Committee). He also serves on the Board of the United Way Foundation of Metropolitan Dallas, and is the Vice Chairman of the Board of Trustees of Northeastern University. During the past five years, Mr. Galante also served on the Board of Directors of Foster Wheeler Ltd. (2008 – 2014) where he served on the Audit Committee and was the Chairman of the Compensation and Executive Development Committee.
Experience and Qualifications
As a former senior operating executive at ExxonMobil, one of the largest global energy companies, Mr. Galante brings the senior executive experience and skills described above and also has significant experience in the operations and management of a large, global business. He has substantial experience in the oil, gas, refining and chemical sectors of the energy industry, all of which are important end markets for the Company, as well as an in-depth understanding of engineering management, operations and technology, which are important in the execution of many of the Company’s large capital projects.
107
RAYMOND W. LEBOEUF | |||
Former Chairman & Chief Executive Officer of PPG Industries, Inc. | |||
Age Director Since Other Public Company Directorships | 71 1997 MassMutual Financial Group | Qualification Highlights · Industry · Praxair End-Markets · Praxair Foreign Markets · Operations · International business · Financial Expert · Risk Management · Public company board | |
Biography
Former Chairman & Chief Executive Officer of PPG Industries, Inc. (principally a manufacturer of coatings) from 1997 to 2005. From 1995 to 1997, Mr. LeBoeuf served as President & Chief Operating Officer of PPG Industries, Inc. and was elected a director in 1995. From 1988-1994, he was the Chief Financial Officer of PPG.
Experience and Qualifications
As a former Chief Executive Officer and Chief Financial Officer of PPG Industries, a global diversified manufacturing company, Mr. LeBoeuf brings the senior executive experience and skills described above. He also has an in-depth understanding of corporate and international finance, accounting, financial reporting and internal controls and the review and preparation of financial statements.
LARRY D. MCVAY | |||
Principal of Edgewater Energy, LLC | |||
Age Director Since Other Public Company Directorships | 70 2008 Callon Petroleum Company Chicago Bridge and Iron Company | Qualification Highlights · Praxair End-Markets · Praxair Foreign Markets · Operations · International business · Technology · Risk Management · Public company board | |
Biography
Principal of Edgewater Energy, LLC, an oil and gas industry firm. Mr. McVay served as the Chief Operating Officer of TNK-BP Holding from 2003 until his retirement in 2006. TNK-BP Holding, based in Moscow, Russia, was a vertically integrated oil company that was 50%-owned by BP PLC. Mr. McVay’s responsibilities at TNK-BP included executive leadership for the upstream, downstream, oil field services, technology and supply chain management. He previously served as Technology Vice President - Operations and Vice President of Health Safety Environment for BP’s Exploration and Production operations from 2000 to 2003. Prior to joining BP, Mr. McVay held numerous positions at Amoco, including engineering management and senior operating leadership positions.
Mr. McVay is a director of Callon Petroleum Company (where he serves on the Audit Committee, the Nominating and Governance Committee and is the Chairman of the Strategic Planning and Reserves Committee) and Chicago Bridge & Iron Company (where he serves on the Audit Committee, the Strategic Initiatives Committee and is the Chairman of the Corporate Governance Committee).
Experience and Qualifications
As a former senior operating executive at BP, one of the largest global energy companies, Mr. McVay brings the senior executive experience and skills described above. He has an in-depth understanding of engineering management and of worldwide energy markets, operations and technology, all of which are important to the Company’s operations, particularly those involving large capital project investments. He also has practical experience in operating in Russia and the Middle East, both of which are emerging markets for the Company.
108
MARTIN H. RICHENHAGEN | |||
Chairman, President and Chief Executive Officer of AGCO Corporation | |||
Age Director Since Other Public Company Directorships | 65 2015 AGCO Corporation PPG Industries, Inc. | Qualification Highlights · Praxair Foreign Markets · Operations · International business · Risk Management · Public company board | |
Biography
President and Chief Executive Officer of AGCO Corporation, a global manufacturer and distributor of agricultural equipment, since 2004, and Chairman of the Board of Directors since 2006. From 2003 -2004, Mr. Richenhagen was Executive Vice President of Forbo International SA, a flooring material company headquartered in Switzerland. He also served as Group President for CLAAS KgaA mbH, a global agricultural equipment manufacturer and distributor headquartered in Germany, from 1998 - 2002. Mr. Richenhagen was the Senior Executive Vice President for Schindler Deutschland Holdings GmbH in Germany, a worldwide manufacturer and distributor of elevators and escalators, from 1995 - 1998.
Mr. Richenhagen is a director of PPG Industries, Inc., a leading coatings and specialty products and services company (where he is Chairman of the Audit Committee and serves on the Officers-Directors Compensation Committee). He is the Chairman of the German American Chambers of Commerce of the United States, and he is a member of the U.S. Chamber of Commerce Board of Directors. Mr. Richenhagen has served as Chairman of the Board of the Association of Equipment Manufacturers (AEM) and is a Life Honorary Director of AEM.
Experience and Qualifications
As Chairman, President and Chief Executive Officer of AGCO Corporation, a large international manufacturer and distributor of agricultural equipment, Mr. Richenhagen brings the senior executive experience and skills described above. In particular, his background includes extensive international, operational and manufacturing experience. In addition, AGCO Corporation operates in many of the foreign markets in which the Company operates, including Europe and South America, and Mr. Richenhagen therefore adds his understanding of these large, foreign markets where the Company has a significant presence.
WAYNE T. SMITH | |||
Chairman, President & Chief Executive Officer of Community Health Systems, Inc. | |||
Age Director Since Other Public Company Directorships | 72 2001 Community Health Systems, Inc. | Qualification Highlights · Praxair End-Markets · Operations · Risk Management · Public company board | |
Biography
Chairman, President & Chief Executive Officer of Community Health Systems, Inc. (a hospital and healthcare services company) since 2001. In 1997, Mr. Smith was elected President and then Chief Executive Officer and a director of Community Health Systems, Inc. Prior to joining Community Health Systems, he served as Chief Operating Officer, President, and a director of Humana Inc.
Mr. Smith is a trustee of Auburn University, and is a trustee and the past Chairman of the Federation of American Hospitals.
Experience and Qualifications
As the Chief Executive Officer of Community Health Systems, a large healthcare services company, Mr. Smith brings the senior executive experience and skills described above. He also has an in-depth understanding of the health care business and the regulatory, compliance and business environment in which it operates. Mr. Smith also brings his experience in leading a senior management team on the numerous issues required of the CEO of Community Health, as well as his experience in leading a board of directors as the Chairman of Community Health.
109
ROBERT L. WOOD | |||
Former Chairman, President & Chief Executive Officer of Chemtura Corporation | |||
Age Director Since Other Public Company Directorships | 63 2004 MRC Global Inc. Univar Inc. | Qualification Highlights · Industry · Praxair End-Markets · Operations · Risk Management · Public company board | |
Biography
Former Chairman, President & Chief Executive Officer of Chemtura Corporation (a specialty chemicals company) from 2004 to 2008. Prior to joining Chemtura, Mr. Wood served in various senior management positions at Dow Chemical Company, most recently as business group president for Thermosets and Dow Automotive, from November 2000. Mr. Wood has been Praxair’s Lead Director since January 1, 2013.
Mr. Wood is a director of MRC Global Inc. (where he serves as Chairman of the Compensation Committee and a member of the Governance Committee), and a director of Univar Inc. (where he serves on the Audit Committee and Compensation Committee). During the past five years, Mr. Wood was also a director of Jarden Corporation (where he served on the Nominating and Policies Committee and was Chairman of the Audit Committee). He has served as Chairman of the American Plastics Council and the American Chemistry Council, and is a member of the United States Olympic Committee.
Experience and Qualifications
As a former Chief Executive Officer of Chemtura Corporation, a global specialty chemicals company, and a former senior operating executive of Dow, a global chemicals company, Mr. Wood brings the senior executive experience and skills described above. He also has a deep understanding of the specific challenges and opportunities facing a global basic materials company. Mr. Wood’s knowledge of the chemicals industry, an important end market for the Company, provides valuable insight to the Board and management.
Section 16(a) Beneficial Ownership Reporting Compliance
Based solely upon a review of SEC Forms 3, 4 and 5 furnished to the Company and written representations from the Company’s executive officers and directors, the Company believes that those persons complied with all Section 16(a) filing requirements during 2017 with respect to transactions in the Company’s stock, except that Scott Telesz, an executive officer of the Company, made a late filing to report a purchase of 67 shares of common stock that was made inadvertently in a trust account for which his spouse serves as trustee.
Identification of the Audit Committee
Praxair has a separately-designated standing Audit Committee established in accordance with Section 3(a)(58)(A) of the Securities Exchange Act of 1934 as amended (the “Exchange Act”). The members of that Audit Committee are Raymond W. LeBoeuf, Chairman, Nance K. Dicciani and Larry D. McVay, and each member is independent within the meaning of the independence standards adopted by the Board of Directors and those of the New York Stock Exchange.
Audit Committee Financial Expert
The Praxair Board of Directors has determined that Raymond W. LeBoeuf is an “audit committee financial expert” as defined by Item 407(d)(5)(ii) of Regulation S-K of the Exchange Act and is independent within the meaning of the independence standards adopted by the Board of Directors and those of the New York Stock Exchange.
Code of Ethics
Praxair has adopted a code of ethics that applies to the company’s directors and all employees, including its Chief Executive Officer, Chief Financial Officer, and Controller. This code of ethics has been approved by the Praxair Board of Directors and is named the “Compliance with Laws and Business Integrity and Ethics Policy”. To assist employees and directors in complying with this code of ethics, management, from time to time, develops specific standards implementing
110
certain provisions of the code which standards are contained in Praxair’s “Standards of Business Integrity.” Both documents are posted on the company’s public website, www.praxair.com but are not incorporated herein.
ITEM 11. EXECUTIVE COMPENSATION
Information required by this item will be included in an amendment to this Form 10-K filed no later than April 30, 2018.
111
ITEM 12. SECURITY OWNERSHIP OF CERTAIN BENEFICIAL OWNERS AND MANAGEMENT AND RELATED STOCKHOLDER MATTERS
Equity Compensation Plans Information – The table below provides information as of December 31, 2017 about company stock that may be issued upon the exercise of options, warrants and rights granted to employees or members of Praxair’s Board of Directors under present and former equity compensation plans, including plans approved by shareholders and one plan which has not been approved by shareholders, the 1996 Praxair, Inc. Performance Incentive Plan ("the 1996 Plan"). The equity compensation plan not approved by shareholders was terminated in March 2001 and directors and officers of the company were not eligible to participate in that plan. Shareholder approval of that plan was not required under applicable NYSE rules. The 1996 Plan provided for granting nonqualified or incentive stock options, stock grants, performance awards and other stock related incentives for key employees. The exercise price under the 1996 Plan was equal to the closing price of Praxair’s common stock on the date of grant. Options that were granted under this plan became exercisable after one or more years after the date of grant and the option term was no more than ten years.
EQUITY COMPENSATION PLANS TABLE
Plan Category | Number of securities to be issued upon exercise of outstanding options, warrants and rights (a) | Weighted-average exercise price of outstanding options, warrants and rights (b) | Number of securities remaining available for future issuance under equity compensation plans (excluding securities reflected in column (a)) (c) | ||||||
Equity compensation plans approved by shareholders | 11,716,499 | (1) | $ | 100.07 | 9,933,618 | ||||
Equity compensation plans not approved by shareholders | — | — | — | ||||||
Total | 11,716,499 | $ | 100.07 | 9,933,618 | |||||
________________________
(1) | This amount includes 264,357 restricted shares and 665,440 performance shares. Up to an additional 665,440 performance shares could be issued if performance goals are achieved at the maximum specified targets. See Note 15 to the consolidated financial statements. |
The information required by this item regarding the beneficial ownership of Praxair’s common stock is set forth below.
Information on Stock Ownership
Principal Holders
The only beneficial owners of more than 5% of Praxair’s Common Stock are the following:
Name and Address of Beneficial Owner | Number of Shares Beneficially Owned(a) | Percent of Shares Outstanding(b) | |||||
The Vanguard Group, 100 Vanguard Blvd., Malvern, PA 19355 | 21,606,823 | 7.5 | % | ||||
Capital World Investors, 333 S. Hope Street, Los Angeles, CA 90071 | 20,061,192 | 6.9 | % | ||||
BlackRock, Inc., 55 East 52nd Street, New York, NY 10055 | 17,780,636 | 6.2 | % | ||||
(a) | Holdings as of December 31, 2017 as reported in SEC Schedules 13G filed by the Vanguard Group, Capital World Investors, and Blackrock, Inc. According to its Schedule 13G, Vanguard and certain of its affiliates had sole voting power as to 407,094 shares, shared voting power as to 69,828 shares, shared dispositive power as to 469,290 shares, and sole dispositive power as to 21,137,533 shares. According to its Schedule 13G, Capital World and certain of its affiliates had sole voting power as to 18,575,563 shares, and sole dispositive power as to all of the reported shares. According to its Schedule 13G, BlackRock and certain of its subsidiaries had sole voting power as to 15,389,271 shares, and sole dispositive power as to 17,780,636 shares. |
(b) | Based on 287,162,287 total shares outstanding on February 15, 2018 excluding shares held for the account of Praxair. |
112
Directors and Executive Officers
The table below sets forth the beneficial ownership of Praxair’s Common Stock as of February 15, 2018 by each director and certain executive officers. No director or executive officer of Praxair beneficially owned more than 1% of Praxair’s common stock, and directors and executive officers of Praxair as a group (16 persons) beneficially owned approximately 1% of the outstanding shares as of that date.
Name | Position | Common Stock | Stock Units(1) | Total | Stock Options(2) | ||||||||||
Stephen F. Angel | Chairman, President & Chief Executive Officer | 435,401 | 67,018 | 502,419 | 1,529,558 | ||||||||||
Matthew J. White | Senior Vice President & Chief Financial Officer | 18,058 | 605 | 18,663 | 235,288 | ||||||||||
Scott E. Telesz | Executive Vice President | 28,719 | 20,965 | 49,684 | 245,209 | ||||||||||
Eduardo F. Menezes | Executive Vice President | 60,846 | 843 | 61,689 | 246,085 | ||||||||||
Anne K. Roby | Senior Vice President | 22,701 | 4,261 | 26,962 | 139,936 | ||||||||||
Oscar Bernardes | Director | 7,960 | 1,380 | 9,340 | — | ||||||||||
Nance K. Dicciani | Director | 15,447 | 13,134 | 28,581 | — | ||||||||||
Edward G. Galante | Director | 10,362 | 18,437 | 28,799 | 4,600 | ||||||||||
Raymond W. LeBoeuf | Director | 14,128 | 51,405 | 65,533 | — | ||||||||||
Larry D. McVay | Director | 9,213 | 5,912 | 15,125 | — | ||||||||||
Martin H. Richenhagen | Director | 2,145 | 1,380 | 3,525 | — | ||||||||||
Wayne T. Smith | Director | 19,034 | 34,909 | 53,943 | — | ||||||||||
Robert L. Wood | Director | 14,222 | 2,915 | 17,137 | — | ||||||||||
Total | 658,236 | 223,164 | 881,400 | 2,400,676 | |||||||||||
Directors, Nominees and Executive Officers as a group | 16 persons | 674,041 | 223,359 | 897,400 | 2,547,336 | ||||||||||
(1) | Includes Deferred Stock Units and/or Restricted Stock Units held. Deferred Stock Units are stock price-based units into which deferred compensation has been invested pursuant to the deferred compensation plans for management and for non-employee directors. Restricted Stock Units are stock price-based units granted as long term incentive awards to management and as equity compensation to non-employee directors. Holders have no voting rights with respect to either Deferred Stock Units or Restricted Stock Units. The value of Deferred Stock Units and Restricted Stock Units varies with the price of Praxair’s common stock and, at the end of the deferral period or the restriction period, the units are payable in Praxair common stock on a one-for-one basis. |
(2) | Represent shares that may be acquired upon exercise of options exercisable within 60 days of February 15, 2018. |
ITEM 13. CERTAIN RELATIONSHIPS AND RELATED TRANSACTIONS AND DIRECTOR INDEPENDENCE
The information required by this item is set forth below.
Director Independence
The Praxair Board of Directors has adopted independence standards for service on Praxair’s Board of Directors which are posted at Praxair’s public website, www.praxair.com in the Our Company/Our People/ Our Board of Directors section. The Board has applied these standards to all of the non-management directors (all directors are non-management except for Mr. Angel, the Company’s Chairman & CEO), and has determined that each qualifies as independent. The Board is not otherwise aware of any relationship with the Company or its management that could potentially impair the independent judgment of these directors.
Certain Relationships and Transactions
113
When determining whether any director or nominee is independent, the Board considers all facts and circumstances and any relationships that a director or nominee may have with the Company, directly or indirectly, other than in the capacity of serving as a director. To assist the Board in making independence determinations, it also applies the independence standards which are posted at Praxair’s public website, www.praxair.com in the Our Company/Our People/Our Board of Directors section. In February 2018, the Board considered the following circumstances and relationships of those directors who then had any direct or indirect relationship with the Company. In the ordinary course of its business, (1) Praxair: sells medical oxygen and other industrial gases products to Community Health Systems, Inc. of which Mr. Smith is an executive officer; and (2) sells industrial gases to AGCO Corporation, of which Mr. Richenhagen is an executive officer. The 2017 consolidated revenues for each of Praxair, Community Health and AGCO Corporation were $11.4 billion, $15.4 billion, and $8.3 billion, respectively. For the last three fiscal years, the dollar value of Praxair’s sales to Community Health ranged from $2.2 million to $5.2 million, and sales to AGCO Corporation ranged from $840,000 to $2.4 million. Such sale and purchase transactions were well below the limits set forth in the Board’s independence standards and, for any of the last three fiscal years, were significantly less than 1% of either Praxair’s, Community Health Systems’, or AGCO Corporation’s consolidated revenues. Therefore, the Board has determined that such ordinary course business relationships are not material and do not otherwise impair the ability of either Mr. Smith or Mr. Richenhagen to exercise independent judgment as a director.
Review, Approval or Ratification of Transactions with Related Persons
The Company’s Compliance with Laws and Business Integrity and Ethics Policy (“Ethics Policy”) prohibits employees, officers and Board members from having a personal, financial or family interest that could in any way prevent the individual from acting in the best interests of the Company (a “conflict of interest”) and provides that any conflict of interest waiver relating to Board members or executive officers may be made only after review and approval by the Board upon the recommendation of its Governance & Nominating Committee. In addition, the Board’s Corporate Governance Guidelines require that any “related party transaction” by an executive officer or director be pre-approved by a committee of independent and disinterested directors. For this purpose, a “related party transaction” means any transaction or relationship that is reportable under Regulation S-K, Item 404, of the Securities and Exchange Commission (“SEC”) or that, in the case of a non-management director, would violate the Board’s independence standards.
Reporting and Review Procedures
To implement the foregoing policies, the Governance & Nominating Committee has adopted a written procedure for the Handling of Potential Conflicts of Interests which specifies a process for the referral of potential conflicts of interests to the Board and standards for the Board’s evaluation of those matters. This policy applies to any transaction or relationship involving an executive officer, a member of the Board of Directors, a nominee for election as a director of the Company, or a family member of any of the foregoing which (1) could violate the Company’s Ethics Policy provisions regarding conflicts of interest, (2) would be reportable under the SEC’s disclosure rules, or (3) in the case of a non-management director, would violate the Board’s independence standards.
Under this procedure, potential conflicts of interest are reported to the Corporate Secretary for preliminary analysis to determine whether referral to the Governance & Nominating Committee is appropriate. Potential conflicts of interest can be self-identified by the director or executive officer or may arise from internal audits, the integrity hotline or other referrals, or through periodic due diligence conducted by the Corporate Secretary’s office. The Governance & Nominating Committee then examines the facts and circumstances of each matter referred to it and makes a final determination as to (1) whether the transaction or relationship would (or does) constitute a violation of the conflicts of interest provisions of the Company’s Ethics Policy, and (2) whether the transaction or relationship should be approved or ratified and the conditions, if any, of such approval or ratification. In determining whether a transaction or relationship constitutes a violation of the conflicts of interest provisions of the Company’s Ethics Policy, the Governance & Nominating Committee considers, among other factors, the materiality of the transaction or relationship to the individual’s personal interest, whether the individual’s personal interest is materially adverse to or competitive with the interests of the Company, and whether the transaction or relationship materially interferes with the proper performance of the individual’s duties or loyalty to the Company. In determining whether to approve or ratify a transaction or relationship, the Governance & Nominating Committee considers, among other factors, whether the matter would constitute a violation of the conflicts of interest provisions of the Company’s Ethics Policy, whether the matter would violate the NYSE listing standards, the expected practical impact of the transaction or relationship on the individual’s independence of judgment or ability to act in the best interests of the Company, the availability, practicality and effectiveness of mitigating controls or safeguards such as recusal, restricted access to information, reassignment etc., and the best interests of the Company and its shareholders generally.
114
Application of Policies and Procedures
During 2017, no actual or potential conflicts of interest were identified with respect to the executive officers and directors of the Company.
ITEM 14. PRINCIPAL ACCOUNTING FEES AND SERVICES
The information required by this item is set forth below.
Independent Auditor Selection
The Audit Committee is directly responsible for the appointment, compensation (including approval of all audit and non-audit fees), retention and oversight of the independent registered public accounting firm that audits Praxair’s financial statements and its internal control over financial reporting. The Audit Committee selected PricewaterhouseCoopers LLP (“PWC”) as Praxair’s independent auditor for 2017, and PWC has served as Praxair’s independent auditor since 1992.
Audit and Non-Audit Engagement Services Pre-Approval Policy
The Audit Committee retained PWC to provide audit services and to provide non-audit services (along with other accounting firms) in 2017 and understands the need for PWC to maintain objectivity and independence as the auditor of Praxair’s financial statements and our internal control over financial reporting. Accordingly, the Audit Committee has established a policy whereby all audit and non-audit fees of the independent auditor must be approved in advance by the Audit Committee or its Chairman, and has adopted a guideline that, absent special circumstances, the aggregate cost of non-audit engagements in a year should not exceed the audit fees for that year. The non-audit fees that are incurred are typically far less than this limit and such non-audit fees were approximately 4.4% of audit fees in 2017. All of the Audit-Related Fees, Tax Fees and All Other Fees disclosed below were approved by the Audit Committee.
Fees Paid to the Independent Auditor
The Audit Committee authorizes and oversees the fees paid to PWC for audit and non-audit services. The aggregate fees billed by PWC in 2017 and 2016 for its services are set forth in the table below, followed by a description of the fees:
Types of Fees | ||||||||||||
Audit | Audit - Related | Tax | All Other | Total | Non-Audit Fees % of Total Audit Fees | |||||||
2017 | 7,620,000 | 303,000 | 17,000 | 14,000 | 7,954,000 | 4.4 | % | |||||
2016 | 6,206,000 | 28,000 | 94,000 | 39,000 | 6,367,000 | 2.6 | % | |||||
Audit Fees
These are fees paid for the audit of Praxair’s annual financial statements, the reviews of the financial statements included in Praxair’s reports on Form 10-Q, the opinion regarding the Company’s internal controls over financial reporting as required by §404 of the Sarbanes-Oxley Act of 2002, and services that are normally provided by the independent auditor in connection with statutory and regulatory filings or engagements for those fiscal years. In addition, 2017 audit fees include services related to the potential Linde merger.
Audit-Related Fees
These are fees paid for assurance and related services rendered that are reasonably related to the performance of the audit or review of Praxair’s financial statements other than the fees disclosed in the foregoing paragraph. These fees included those related to due diligence services and certifications required by customers and others. In addition, 2017 audit-related fees include services related to the potential Linde merger.
115
Tax Fees
These are fees paid for professional services rendered for tax compliance and tax preparation, including preparation of original and amended tax returns, and claims for refunds.
All Other Fees
These are fees paid for services rendered other than those described in the foregoing paragraphs. These services related primarily to consulting and advice in regard to local country accounting issues for non-U.S. subsidiaries.
116
PART IV
ITEM 15. EXHIBITS, FINANCIAL STATEMENT SCHEDULES
(a) | The following documents are filed as part of this report: |
(1) | The company’s 2017 Consolidated Financial Statements and the Report of the Independent Registered Public Accounting Firm are included in Part II, Item 8. Financial Statements and Supplementary Data. |
(2) | Financial Statement Schedules – All financial statement schedules have been omitted because they are not applicable or the required information is shown in the financial statements or notes thereto. |
(3) | Exhibits – The exhibits filed as part of this Annual Report on Form 10-K are listed in the accompanying index. |
117
SIGNATURES
Praxair, Inc. and Subsidiaries
Pursuant to the requirements of the Securities Exchange Act of 1934, the registrant has duly caused this report to be signed on its behalf by the undersigned thereunto duly authorized.
PRAXAIR, INC. | ||||||
(Registrant) | ||||||
Date: February 28, 2018 | By: | /s/ KELCEY E. HOYT | ||||
Kelcey E. Hoyt Vice President and Controller (On behalf of the Registrant and as Chief Accounting Officer) | ||||||
Pursuant to the requirements of the Securities Exchange Act of 1934, this report has been signed below by the following persons on behalf of the Registrant and in the capacities indicated on February 28, 2018.
/s/ STEPHEN F. ANGEL | /s/ MATTHEW J. WHITE | /s/ OSCAR DE PAULA BERNARDES | ||
Stephen F. Angel Chairman, President, Chief Executive Officer and Director | Matthew J. White Senior Vice President and Chief Financial Officer | Oscar de Paula Bernardes Director | ||
/s/ NANCE K. DICCIANI | /s/ EDWARD G. GALANTE | /s/ RAYMOND W. LEBOEUF | ||
Nance K. Dicciani Director | Edward G. Galante Director | Raymond W. LeBoeuf Director | ||
/s/ LARRY D. MCVAY | /s/ MARTIN H. RICHENHAGEN | /s/ WAYNE T. SMITH | ||
Larry D. McVay Director | Martin H. Richenhagen Director | Wayne T. Smith Director | ||
/s/ ROBERT L. WOOD | ||||
Robert L. Wood Director | ||||
118
INDEX TO EXHIBITS
Praxair, Inc. and Subsidiaries
Exhibit No. | Description | |
2.1 | ||
2.1a | ||
3.01 | ||
3.02 | ||
3.03 | Certificate of Designations for the 7.48% Cumulative Preferred Stock, Series A (Filed on February 13, 1997 as Exhibit 3.3 to Amendment #1 to the Company’s Registration Statement on Form S-3, Registration No. 333-18141). | |
3.04 | Certificate of Designations for the 6.75% Cumulative Preferred Stock, Series B (Filed on February 13, 1997 as Exhibit 3.4 to Amendment #1 to the Company’s Registration Statement on Form S-3, Registration No. 333-18141). | |
4.01 | Common Stock Certificate (Filed as Exhibit 4.01 to the Company’s Registration Statement on Form 10, Filing No. 1-11037, and incorporated herein by reference). | |
4.02a | ||
4.02b | ||
4.03 | Copies of the agreements relating to long-term debt which are not required to be filed as exhibits to this Annual Report on Form 10-K will be furnished to the Securities and Exchange Commission upon request. | |
4.04 | Series A Preferred Stock Certificate (Filed on February 7, 1997 as Exhibit 4.3 to Amendment #1 to the Company’s Registration Statement on Form S-3, Registration No. 333-18141). | |
4.05 | Series B Preferred Stock Certificate (Filed on February 7, 1997 as Exhibit 4.4 to Amendment #1 to the Company’s Registration Statement on Form S-3, Registration No. 333-18141). | |
*10.01 | Restated 2002 Praxair, Inc. Long Term Incentive Plan (Filed as Exhibit 10.01 to the Company’s 2003 Annual Report on Form 10-K, Filing No. 1-11037, and incorporated herein by reference). | |
*10.01a | ||
*10.01b | ||
*10.01c | ||
*10.01d | ||
119
Exhibit No. | Description | |
*10.02 | ||
*10.02a | ||
*10.02b | ||
*10.02c | ||
*10.02d | ||
*10.03 | ||
*10.04 | ||
*10.04a | ||
*10.04b | ||
*10.04c | ||
*10.05a | ||
*10.05b | ||
*10.05c | ||
*10.05d | ||
*10.05e | ||
*10.05f | ||
*10.05g | ||
120
Exhibit No. | Description | |
*10.05h | ||
*10.05i | ||
*10.05j | ||
*10.05k | ||
*10.05l | ||
*10.05m | ||
*10.06 | ||
*10.07 | ||
*10.07a | ||
10.08 | Transfer Agreement dated January 1, 1989, between Union Carbide Corporation and the registrant (Filed as Exhibit 10.06 to the Company’s Registration Statement on Form 10, Filing No. 1-11037, and incorporated herein by reference). | |
10.08a | Amendment No. 1 dated as of December 31, 1989, to the Transfer Agreement (Filed as Exhibit 10.07 to the Company’s Registration Statement on Form 10, Filing No. 1-11037, and incorporated herein by reference). | |
10.08b | Amendment No. 2 dated as of July 2, 1990, to the Transfer Agreement (Filed as Exhibit 10.08 to the Company’s Registration Statement on Form 10, Filing No. 1-11037, and incorporated herein by reference). | |
10.08c | Amendment No. 3 dated as of January 2, 1991, to the Transfer Agreement (Filed as Exhibit 10.09 to the Company’s Registration Statement on Form 10, Filing No. 1-11037, and incorporated herein by reference). | |
10.09 | Transfer Agreement dated January 1, 1989, between Union Carbide Corporation and Union Carbide Coatings Service Corporation (Filed as Exhibit 10.14 to the Company’s Registration Statement on Form 10, Filing No. 1-11037, and incorporated herein by reference). | |
10.09a | Amendment No. 1 dated as of December 31, 1989, to the Transfer Agreement (Filed as Exhibit 10.15 to the Company’s Registration Statement on Form 10, Filing No. 1-11037, and incorporated herein by reference). | |
10.09b | Amendment No. 2 dated as of July 2, 1990, to the Transfer Agreement (Filed as Exhibit 10.16 to the Company’s Registration Statement on Form 10, Filing No. 1-11037, and incorporated herein by reference). | |
10.10 | Additional Provisions Agreement dated as of June 4, 1992 (Filed as Exhibit 10.21 to the Company’s Registration Statement on Form 10, Filing No. 1-11037, and incorporated herein by reference). | |
10.11 | Amended and Restated Realignment Indemnification Agreement dated as of June 4, 1992 (Filed as Exhibit 10.23 to the Company’s Registration Statement on Form 10, Filing No. 1-11037, and incorporated herein by reference). | |
121
Exhibit No. | Description | |
10.12 | Environmental Management, Services and Liabilities Allocation Agreement dated as of January 1, 1990 (Filed as Exhibit 10.13 to the Company’s Registration Statement on Form 10, Filing No. 1-11037, and incorporated herein by reference). | |
10.12a | Amendment No. 1 to the Environmental Management, Services and Liabilities Allocation Agreement dated as of June 4, 1992 (Filed as Exhibit 10.22 to the Company’s Registration Statement on Form 10, Filing No. 1-11037, and incorporated herein by reference). | |
10.13 | Danbury Lease-Related Services Agreement dated as of June 4, 1992 (Filed as Exhibit 10.24 to the Company’s Registration Statement on Form 10, Filing No. 1-11037, and incorporated herein by reference). | |
10.13a | First Amendment to Danbury Lease-Related Services Agreement (Filed as Exhibit 10.13a to the Company’s 1994 Annual Report on Form 10-K, Filing No. 1-11037, and incorporated herein by reference). | |
10.14 | Danbury Lease Agreements, as amended (Filed as Exhibit 10.26 to the Company’s Registration Statement on Form 10, Filing No. 1-11037, and incorporated herein by reference). | |
10.14a | Second Amendment to Linde Data Center Lease (Danbury) (Filed as Exhibit 10.14a to the Company’s 1993 Annual Report on Form 10-K, Filing No. 1-11037, and incorporated herein by reference). | |
10.14b | Fourth Amendment to Carbide Center Lease (Filed as Exhibit 10.14b to the Company’s 1993 Annual Report on Form 10-K, Filing No. 1-11037, and incorporated herein by reference). | |
10.14c | Third Amendment to Linde Data Center Lease (Filed as Exhibit 10.14c to the Company’s 1994 Annual Report on Form 10-K, Filing No. 1-11037, and incorporated herein by reference). | |
10.14d | Fifth Amendment to Carbide Center Lease (Filed as Exhibit 10.14d to the Company’s 1994 Annual Report on Form 10-K, Filing No. 1-11037, and incorporated herein by reference). | |
10.14e | ||
10.15 | Employee Benefits Agreement dated as of June 4, 1992 (Filed as Exhibit 10.25 to the Company’s Registration Statement on Form 10, Filing No. 1-11037, and incorporated herein by reference). | |
10.15a | First Amendatory Agreement to the Employee Benefits Agreement (Filed as Exhibit 10.15a to the Company’s 1994 Annual Report on Form 10-K, Filing No. 1-11037, and incorporated herein by reference). | |
10.16 | Tax Disaffiliation Agreement dated as of June 4, 1992 (Filed as Exhibit 10.20 to the Company’s Registration Statement on Form 10, Filing No. 1-11037, and incorporated herein by reference). | |
10.17 | ||
10.17a | ||
*10.18 | ||
*10.19 | ||
*10.20 | ||
*10.21 | ||
122
Exhibit No. | Description | |
*10.22 | ||
*10.23 | ||
*10.24a | ||
*10.24b | ||
*10.24c | ||
*10.25 | ||
*10.25a | ||
*10.26 | ||
*10.26a | ||
*10.27 | ||
*10.27a | ||
*10.28a | ||
*10.28b | ||
*10.28c | ||
*10.28d | ||
10.29 | ||
123
Exhibit No. | Description | |
12.01 | ||
21.01 | ||
23.01 | ||
31.01 | ||
31.02 | ||
32.01 | ||
32.02 | ||
101.INS | XBRL Instance Document | |
101.SCH | XBRL Taxonomy Extension Schema | |
101.CAL | XBRL Taxonomy Extension Calculation Linkbase | |
101.LAB | XBRL Taxonomy Extension Label Linkbase | |
101.PRE | XBRL Taxonomy Extension Presentation Linkbase | |
101.DEF | XBRL Taxonomy Extension Definition Linkbase | |
Copies of exhibits incorporated by reference can be obtained from the SEC and are located in SEC File No. 1-11037.
* Indicates a management contract or compensatory plan or arrangement.
124