Attached files
| file | filename |
|---|---|
| EX-99.1 - EXHIBIT 99.1 - Jernigan Capital, Inc. | jcap-20180228xex99_1.htm |
| 8-K - 8-K - Jernigan Capital, Inc. | jcap-20180228x8k.htm |

Table of Contents
| 3 | |
|
|
|
| 4 | |
|
|
|
| 8 | |
|
|
|
| 9 | |
|
|
|
| 10 | |
|
|
|
| 11 | |
|
|
|
| 12 | |
|
|
|
| 13 | |
|
|
|
| 14 | |
|
|
|
| 18 | |
|
|
|
| 19 | |
|
|
|
| 20 |
Fourth Quarter 2017  2
2
This Supplemental Information package contains forward-looking statements within the meaning of the Private Securities Litigation Reform Act of 1995 (set forth in Section 27A of the Securities Act of 1933, as amended (the “Securities Act”) and Section 21E of the Securities Exchange Act of 1934, as amended (the “Exchange Act”)). These forward-looking statements include, without limitation, statements about our estimates, expectations, predictions and forecasts of our future business plans and financial and operating performance and/or results, including our first quarter and full-year 2018 earnings guidance, our ability to successfully source, structure, negotiate and close investments in self-storage facilities, our ability to fund our outstanding future investment commitments, the availability, terms and our rate of deployment of equity capital and our ability to increase borrowing base of our credit facility, as well as statements of management’s goals and objectives and other similar expressions concerning matters that are not historical facts. When we use the words “may,” “should,” “could,” “would,” “predicts,” “potential,” “continue,” “expects,” “anticipates,” “future,” “intends,” “plans,” “believes,” “estimates” or similar expressions or their negatives, as well as statements in future tense, we intend to identify forward-looking statements. Although we believe that the expectations reflected in such forward-looking statements are based upon reasonable assumptions, beliefs and expectations, such forward-looking statements are not predictions of future events or guarantees of future performance and our actual financial and operating results could differ materially from those set forth in the forward-looking statements. Some factors that might cause such differences are described in the section entitled “Risk Factors” in our most recent Annual Report on Form 10-K for the year ended December 31, 2016, and those set forth in our other reports and information filed with the Securities and Exchange Commission (“SEC”), which factors include, without limitation, the following:
|
|
|
our ability to successfully source, structure, negotiate and close investments in self-storage facilities; |
|
|
|
changes in our business strategy and the market’s acceptance of our investment terms; |
|
|
|
our ability to fund our outstanding and future investment commitments; |
|
|
|
our ability to obtain certificates of occupancy at the facilities in which we invest; |
|
|
|
the future availability for borrowings under our credit facility (including borrowing base capacity and the availability of the accordion feature); |
|
|
|
availability, terms and our rate of deployment of equity and debt capital; |
|
|
|
our manager’s ability to hire and retain qualified personnel; |
|
|
|
changes in the self-storage industry, interest rates or the general economy; |
|
|
|
the degree and nature of our competition; |
|
|
|
volatility in the value of our assets carried at fair market value; |
|
|
|
potential limitations on our ability to pay dividends at historical rates; |
|
|
|
limitations in our existing and future debt agreements on our ability to pay distributions; |
|
|
|
the impact of our outstanding preferred stock on our ability to execute our business plan and pay distributions on our common stock; and |
|
|
|
general volatility of the capital markets and the market price of our common stock. |
Given these uncertainties, undue reliance should not be placed on our forward-looking statements. We assume no duty or responsibility to publicly update or revise any forward-looking statement that may be made to reflect future events or circumstances or to reflect the occurrence of unanticipated events. We urge you to review the disclosures concerning risks in the sections entitled “Risk Factors” and “Management’s Discussion and Analysis of Financial Condition and Results of Operations” in our most recent Annual Report on Form 10-K for the year ended December 31, 2016 and in other documents that we file from time-to-time with the SEC.
Non-GAAP Financial Measures
Adjusted Earnings is a non-GAAP measure and is defined as net income attributable to common stockholders plus stock dividends payable to preferred stockholders, stock-based compensation expense, depreciation and amortization on real estate assets, loss on modification of debt, transaction and other expenses, restructuring costs, and deferred termination fee to manager. Management uses Adjusted Earnings and Adjusted Earnings per diluted share as key performance indicators in evaluating the operations of the Company's business. The Company is a capital provider to self-storage developers and believes that these measures are useful to management and investors as a starting point in measuring its operational performance because they exclude various equity-based payments (including stock dividends) and other items included in net income that do not relate to or are not indicative of its present and future operating performance, which can make periodic and peer analyses of operating performance more difficult. The Company’s computation of Adjusted Earnings and Adjusted Earnings per share may not be comparable to other key performance indicators reported by other REITs or real estate companies. Reconciliations of Adjusted Earnings and Adjusted Earnings per share to Net income attributable to common stockholders and Earnings per share, respectively, are provided in the attached table entitled “Calculation of Adjusted Earnings.”
Fourth Quarter 2017 3
Jernigan Capital Reports 2017 Earnings per Share of $1.10 and Adjusted Earnings per Share of $1.31
- Provides 2018 Earnings per Share and Adjusted Earnings per Share Guidance -
MEMPHIS, Tennessee, February 28, 2018 / Business Wire / Jernigan Capital, Inc. (NYSE: JCAP), a leading capital partner for self-storage entrepreneurs nationwide, today announced results for the quarter and year ended December 31, 2017 and initiated earnings per share and adjusted earnings per share guidance for the first quarter and full year 2018. Highlights include:
|
§ |
Annual earnings per share and adjusted earnings per share of $1.10 and $1.31, respectively; |
|
§ |
Quarterly earnings per share and adjusted earnings per share of $0.19 and $0.23, respectively; |
|
§ |
Increased book value per common share from $17.74 at December 31, 2016 to $18.58 at December 31, 2017; and |
|
§ |
$408.8 million of new on-balance sheet development investments during 2017. |
“2017 was an outstanding year for the Company,” stated Dean Jernigan, Chairman and Chief Executive Officer of Jernigan Capital, Inc. “We closed 32 new investments in state-of-the-art Generation V self-storage development projects in some of the best submarkets in the country. We matched those commitments with dedicated sources of capital funding, including a new revolving credit facility. We have now launched an attractive bridge investment program designed to sustain our earnings momentum and provide us the opportunity to ultimately own additional top quality properties through the exercise of our rights of first refusal on bridge investments. Our initial bridge investment transaction of approximately $82 million is set to close at the end of this week. Finally, over the past three quarters, we have acquired from developers their 50.1% interests in five newly developed facilities, fulfilling our oft-stated goal to ultimately own self-storage developments we financed.”
John Good, President and Chief Operating Officer of Jernigan Capital, Inc. added, “We achieved year-over-year growth in total revenues of 87% while holding G&A increases (excluding stock-based compensation) to 1.4%, further demonstrating the scalability of our platform. We have entered 2018 with an investment pipeline exceeding $500 million and have adapted to a changing self-storage cycle by creating new, innovative and entrepreneurial investment opportunities that position us to take advantage of each stage of the real estate cycle. From a capital perspective, we continue to be extremely focused on maximizing shareholder value by properly matching investments with the optimal capital sources for those investments, and this will remain a top priority for us in 2018.”
Financial Highlights
Net income attributable to common stockholders for the three months ended December 31, 2017 was $2.7 million, or $0.19 per share, and adjusted earnings was $3.3 million, or $0.23 per share. Net income attributable to common stockholders for the year ended December 31, 2017 was $13.1 million, or $1.10 per share, and adjusted earnings was $15.6 million, or $1.31 per share.
Total revenues for the quarter and year ended December 31, 2017 were $3.9 million and $12.2 million, respectively, representing increases of $1.8 million, or 82.1%, and $5.7 million, or 86.6%, over revenues for the comparable periods in 2016. The increase in revenues is primarily attributed to the increase in the outstanding principal balances on the Company’s investment portfolio and other assets.
General and administrative expenses and stock-based compensation expense (“SBE”), for the quarter and year ended December 31, 2017 and 2016 were as follows (dollars in thousands):
|
|
|||||||||
|
|
Three months ended December 31, |
||||||||
|
|
2017 |
2016 |
% inc |
||||||
|
General and administrative expenses, excluding SBE |
$ |
1,245 |
$ |
1,220 | 2.0 |
% |
|||
|
Plus: SBE |
272 | 252 | 7.9 |
% |
|||||
|
General and administrative expenses |
$ |
1,517 |
$ |
1,472 | 3.1 |
% |
|||
|
|
|||||||||
|
|
Year ended December 31, |
||||||||
|
|
2017 |
2016 |
% inc |
||||||
|
General and administrative expenses, excluding SBE |
$ |
4,557 |
$ |
4,494 | 1.4 |
% |
|||
|
Plus: SBE |
1,295 | 1,080 | 19.9 |
% |
|||||
|
General and administrative expenses |
$ |
5,852 |
$ |
5,574 | 5.0 |
% |
|||
Fourth Quarter 2017 4
The increase in SBE for the quarter and year ended December 31, 2017 was primarily due to additional restricted stock grants to certain officers and employees of the Company’s external manager during the second quarter of 2017.
Net income attributable to common stockholders and adjusted earnings for the quarter and year ended December 31, 2017 also include increases in the fair value of investments of $1.7 million and $10.8 million, respectively, compared to increases of $4.2 million and $18.4 million for the comparable periods in 2016. These results reflect the impact of the limited number of on-balance sheet investment closings in 2016 resulting in modest fair value adjustments in 2017 on the 2016 investments. As detailed in the 2018 guidance discussion below, fair value increases are expected to substantially increase in 2018, reflecting the record year of on-balance sheet development investments we experienced in 2017.
Subsequent Events
In an effort to enhance its product offering and develop an investment vehicle that is well positioned for the current stage of the self-storage development cycle, the Company launched an innovative bridge loan program. This program allows the Company to function as a knowledgeable, later-stage capital partner for developers who desire to retire construction debt and take out capital partners but retain their own interests as projects lease up. The Company expects this program to create a future “off-market” pipeline of acquisition opportunities through additional rights of first refusal.
On January 15, 2018, the Company executed non-binding term sheets to provide an aggregate principal amount of approximately $82 million of first mortgage bridge financing with respect to five separate self-storage facilities in the Miami, Florida metropolitan statistical area. Under the term sheets, three bridge loans amounting to an aggregate principal amount of approximately $47 million will be secured by first priority mortgages on self-storage properties with an aggregate of over 203,000 net rentable square feet that were completed and began lease up in 2016, which loans will bear interest at an annual rate of 6.9%, payable monthly in cash. The term sheets also provide the Company with 49.9% of positive operating cash flows and 49.9% of capital proceeds.
Two bridge loans aggregating a principal amount of approximately $35 million will be secured by first priority mortgages on self-storage properties with an expected aggregate of over 160,000 net rentable square feet that are expected to be completed and begin lease up in the first quarter of 2018, which loans will bear interest at an annual rate of 9.5%, with 6.5% payable monthly in cash and 3.0% accruing and payable upon maturity of the loan. The Company will also receive 49.9% of positive operating cash flows and 49.9% of capital proceeds, after the other members of the borrower receive $1.0 million of preferential payments per loan.
All five loans will mature five years from the date of closing, with the borrower having two extension options for one year each. Approximately $75 million of the aggregate principal amount of the five loans is expected to be advanced upon closing on or around March 2, 2018, with the balance to be advanced as requested by the borrower to pay interest and operating and other expenses during the lease up period. Each of the term sheets is non-binding, and the loans are conditioned upon the execution of definitive loan documents and other customary closing conditions.
The Company can provide no assurance that it will enter into definitive agreements for these loans or that the loans will close on the expected timeline or at all. Further, no assurance can be provided that the two projects under construction will reach C/O status on the expected timeline or at all.
Capital Markets Activities
During the quarter ended December 31, 2017, under the Company’s at-the-market equity program (“ATM program”), the Company issued and sold 186,504 shares of common stock at a weighted average price of $20.36, receiving net proceeds after commissions of approximately $3.7 million. As of December 31, 2017, the Company had approximately $21.4 million available for issuance under the ATM program.
During the quarter ended December 31, 2017, the Company issued $30.0 million of its Series A Preferred Stock. Additionally, on February 16, 2018, the Company issued $20.0 million of additional Series A Preferred Stock for a total of $60.0 million of Series A Preferred Stock outstanding. The Company has $65.0 million of Series A Preferred Stock available for issuance under its stock purchase agreement with affiliates of Highland Capital Management, LLC (the “Stock Purchase Agreement”).
On January 26, 2018, the Company issued and sold 1,500,000 shares of its newly designated 7.00% Series B Preferred Stock (“Series B Preferred Stock”) at a public offering price of $25.00 per share for net proceeds, after underwriting discounts, but before offering expenses, of approximately $36.3 million. The Company intends to use the net proceeds from the offering to partially fund our approximately $82 million bridge loan investment.
As of December 31, 2017, the Company had no borrowings under its secured revolving credit facility. As of February 27, 2018, the Company had $30.0 million outstanding out of its $40.8 million in total availability under its secured revolving credit facility.
Fourth Quarter 2017 5
Dividends
On November 1, 2017, the Company declared cash and stock dividends on its Series A Preferred Stock. The cash dividend of $0.4 million was paid on January 12, 2018 to holders of record on January 1, 2018. A stock dividend of 2,222 shares of common stock was issued on January 12, 2018 to holders of record on January 1, 2018 for an aggregate value of $44,000 pursuant to the terms of the Stock Purchase Agreement.
Additionally, on November 1, 2017, the Company declared a dividend of $0.35 per common share. The dividend was paid on January 12, 2018 to common stockholders of record on January 2, 2018.
First Quarter and Full-Year 2018 Guidance
The following tables reflect earnings per share and adjusted earnings per share guidance ranges for the three months ending March 31, 2018 and for the full-year 2018. Such guidance is based on management's current expectations of Company investment activity (including fair value appreciation and the expected timing of construction progress and receipts of certificates of occupancy), the operational and new supply dynamics of the self-storage markets in which the Company has invested, and overall economic conditions. Adjusted earnings is a performance measure that is not specifically defined by accounting principles generally accepted in the United States (“GAAP”) and is defined as net income attributable to common stockholders (computed in accordance with GAAP) plus stock dividends payable to preferred stockholders, stock-based compensation expense, and depreciation and amortization on real estate assets. For more information about our calculation of adjusted earnings, see “Non-GAAP Financial Measures” below.
|
|
||||||||||||
|
|
|
Dollars in thousands, |
||||||||||
|
|
|
except share and per share data |
||||||||||
|
|
|
Three months ending |
|
Year ending |
||||||||
|
|
|
March 31, 2018 |
|
December 31, 2018 |
||||||||
|
|
|
Low |
|
High |
|
Low |
|
High |
||||
|
Interest income from investments |
|
$ |
4,400 |
|
$ |
4,500 |
|
$ |
25,200 |
|
$ |
26,700 |
|
Rental revenue from real estate owned |
|
|
575 |
|
|
600 |
|
|
3,100 |
|
|
3,300 |
|
Other income |
|
|
20 |
|
|
25 |
|
|
80 |
|
|
100 |
|
Total revenues |
|
$ |
4,995 |
|
$ |
5,125 |
|
$ |
28,380 |
|
$ |
30,100 |
|
G&A expenses (1) |
|
|
(3,225) |
|
|
(3,105) |
|
|
(15,000) |
|
|
(13,500) |
|
Property operating expenses (excl. depreciation and amortization) |
|
|
(320) |
|
|
(300) |
|
|
(1,600) |
|
|
(1,500) |
|
Depreciation and amortization on real estate assets |
|
|
(740) |
|
|
(720) |
|
|
(3,600) |
|
|
(3,300) |
|
Interest expense |
|
|
(475) |
|
|
(450) |
|
|
(4,800) |
|
|
(4,000) |
|
JV income |
|
|
400 |
|
|
430 |
|
|
1,400 |
|
|
1,900 |
|
Other interest income |
|
|
80 |
|
|
85 |
|
|
150 |
|
|
200 |
|
Change in fair value of investments (2) |
|
|
1,500 |
|
|
2,000 |
|
|
41,000 |
|
|
47,000 |
|
Net income |
|
|
2,215 |
|
|
3,065 |
|
|
45,930 |
|
|
56,900 |
|
Net income attributable to preferred stockholders (3) |
|
|
(3,535) |
|
|
(3,530) |
|
|
(19,000) |
|
|
(18,000) |
|
Net income (loss) attributable to common stockholders |
|
|
(1,320) |
|
|
(465) |
|
|
26,930 |
|
|
38,900 |
|
Add: stock dividends |
|
|
2,125 |
|
|
2,125 |
|
|
8,500 |
|
|
8,500 |
|
Add: stock-based compensation |
|
|
400 |
|
|
350 |
|
|
2,000 |
|
|
1,800 |
|
Add: depreciation and amortization on real estate assets |
|
|
740 |
|
|
720 |
|
|
3,600 |
|
|
3,300 |
|
Adjusted earnings |
|
$ |
1,945 |
|
$ |
2,730 |
|
$ |
41,030 |
|
$ |
52,500 |
|
Earnings (loss) per share – diluted |
|
$ |
(0.09) |
|
$ |
(0.03) |
|
$ |
1.76 |
|
$ |
2.54 |
|
Adjusted earnings per share - diluted |
|
$ |
0.13 |
|
$ |
0.19 |
|
$ |
2.68 |
|
$ |
3.43 |
|
Average shares outstanding - diluted |
|
|
14,550,000 |
|
|
14,550,000 |
|
|
15,300,000 |
|
|
15,300,000 |
|
(1) |
Includes $1.3 million (low and high) and $7.0 million (low) / $6.2 million (high) of management fees for the three months ending March 31, 2018 and for the year ending December 31, 2018, respectively. |
|
(2) |
Excludes $0.3 million (low and high) and $0.8 million (low) / $1.2 million (high) of unrealized appreciation in fair value of investments from the real estate venture which is included in JV income for the three months ending March 31, 2018 and for the year ending December 31, 2018, respectively. |
|
(3) |
Represents both cash dividends and stock dividends (which stock dividends will be paid out in either shares of the Company’s common stock or additional shares of Series A Preferred Stock, at the option of the Series A stockholders) estimated with respect to outstanding shares of Series A Preferred Stock, as well as cash dividends estimated with respect to outstanding shares of Series B Preferred Stock. |
Fourth Quarter 2017 6
The guidance above is based on the following key assumptions regarding the Company’s business activities in 2018:
|
§ |
Impact of development and investment activity: |
|
· |
Projected closings on $200 million to $230 million of new self-storage investments with a profits interest for the full-year 2018, including the aforementioned approximately $82 million bridge loan investment scheduled to fully close on March 2, 2018; |
|
· |
Fundings of approximately $300 million to $340 million on the Company’s closed and projected investment commitments during the full-year 2018; and |
|
· |
Acquisition of 100% of developer interests in the Company’s Jacksonville 1, Atlanta 1, Atlanta 2, and Pittsburgh development investments in January and February 2018, resulting in a total of five wholly-owned self-storage facilities in 2018. |
|
§ |
Impact of financing activity: |
|
· |
Guidance ranges assume 2018 investment fundings and commitments are financed with long-term capital, with specific impact on 2018 earnings dependent upon the amount, timing, cost, and form of capital raised. |
|
· |
Specific assumptions included in guidance are as follows: |
|
ž |
Proceeds of $85.0 million from the issuance of Series A Preferred Stock during the first seven months of 2018, which includes the issuance of $20.0 million of Series A Preferred Stock on February 16, 2018; |
|
ž |
Impact of the amendment to the Series A Preferred Stock that was executed during the first quarter of 2018, which had the effect of leveling out the quarterly stock dividend through the second quarter of 2021; |
|
ž |
Impact of the issuance of $37.5 million of 7% Series B Cumulative Redeemable Perpetual Preferred Stock in January 2018; and |
|
ž |
Utilization of the Company’s credit facility over the course of the year as availability increases (expected borrowing base to secure full $200.0 million by the end of 2018, subject to syndication) with expected borrowings at year-end of $160.0 million to $180.0 million. |
Additionally, the Company updated its 2018 fair value guidance to reflect the recent increase in interest rates thus far in 2018, the impact of the Company’s acquisitions of four of its development partners’ interests, and the updated estimates of construction progress and timing of the receipt of certificates of occupancy from its development partners. Together, this resulted in a reduction and/or shifting of fair value recognition out of 2018, which in turn is expected to positively impact 2019. These were partially offset by expected fair value accretion on the Company’s aforementioned bridge investment. Of the estimated $41.0 million to $47.0 million of fair value appreciation in 2018, the Company expects $1.5 million to $2.0 million to be recognized during the first quarter, $9.3 million to $10.5 million to be recognized in the second quarter, $13.0 million to $15.0 million to be recognized in the third quarter, and $17.2 million to $19.5 million to be recognized in the fourth quarter. Timing of fair value appreciation is heavily dependent upon construction progress and the timing of receipt of certificates of occupancy, both of which are subject to factors outside the control of the Company’s development partners. As such, the exact timing of fair value recognition is subject to change.
Refer to the Company’s Fourth Quarter 2017 Supplemental Information Package for more information.
Fourth Quarter 2017 7
Financial Highlights- Trailing Five Quarters
(unaudited, in thousands, except share and per share data)
|
|
|||||||||||||||
|
|
Three months ended |
||||||||||||||
|
|
December 31, |
September 30, |
June 30, |
March 31, |
December 31, |
||||||||||
|
|
2017 |
2017 |
2017 |
2017 |
2016 |
||||||||||
|
Operating Data: |
|||||||||||||||
|
Interest income, rental-related income and other revenues |
$ |
3,930 |
$ |
3,361 |
$ |
2,599 |
$ |
2,301 |
$ |
2,158 | |||||
|
JV income |
516 | 730 | 595 | 422 | 424 | ||||||||||
|
Total revenues and JV income |
4,446 | 4,091 | 3,194 | 2,723 | 2,582 | ||||||||||
|
General & administrative expenses |
(2,597) | (2,422) | (2,078) | (2,208) | (1,942) | ||||||||||
|
Property operating expenses of real estate owned |
(83) | (114) | (43) | (31) |
- |
||||||||||
|
Depreciation and amortization of real estate owned |
(238) | (172) | (38) | (24) |
- |
||||||||||
|
Interest expense |
(296) | (323) | (230) | (204) | (373) | ||||||||||
|
Loss on modification of debt |
- |
(232) |
- |
- |
- |
||||||||||
|
Subtotal |
1,232 | 828 | 805 | 256 | 267 | ||||||||||
|
Change in fair value of investments |
1,738 | 3,384 | 4,289 | 1,393 | 4,185 | ||||||||||
|
Other interest income |
155 | 245 | 100 | 134 | 37 | ||||||||||
|
Net income |
3,125 | 4,457 | 5,194 | 1,783 | 4,489 | ||||||||||
|
Net income attributable to preferred stockholders |
(423) | (310) | (177) | (546) | (996) | ||||||||||
|
Net income attributable to common stockholders |
$ |
2,702 |
$ |
4,147 |
$ |
5,017 |
$ |
1,237 |
$ |
3,493 | |||||
|
Plus: stock dividends payable to preferred stockholders |
44 | 132 |
- |
371 | 823 | ||||||||||
|
Plus: stock-based compensation |
272 | 296 | 435 | 292 | 252 | ||||||||||
|
Plus: depreciation and amortization on real estate assets |
238 | 172 | 38 | 24 |
- |
||||||||||
|
Plus: loss on modification of debt |
- |
232 |
- |
- |
- |
||||||||||
|
Adjusted Earnings |
$ |
3,256 |
$ |
4,979 |
$ |
5,490 |
$ |
1,924 |
$ |
4,568 | |||||
|
|
|||||||||||||||
|
Basic earnings per share attributable to common stockholders |
|
$ |
0.19 |
|
$ |
0.29 |
|
$ |
0.50 |
|
$ |
0.14 |
|
$ |
0.53 |
|
Diluted earnings per share attributable to common stockholders |
|
$ |
0.19 |
|
$ |
0.29 |
|
$ |
0.50 |
|
$ |
0.14 |
|
$ |
0.53 |
|
|
|
|
|
|
|
|
|
|
|
|
|
|
|
|
|
|
Adjusted Earnings per share attributable to common stockholders – diluted |
|
$ |
0.23 |
|
$ |
0.35 |
|
$ |
0.55 |
|
$ |
0.21 |
|
$ |
0.69 |
|
|
|
|
|
|
|
|
|
|
|
|
|
|
|
|
|
|
Weighted-average shares of common stock outstanding: |
|
|
|
|
|
|
|
|
|
|
|
|
|
|
|
|
Basic |
14,108,415 | 14,042,350 | 9,850,967 | 8,857,030 | 6,458,845 | ||||||||||
|
Diluted |
14,295,639 | 14,244,345 | 10,033,029 | 8,993,528 | 6,619,848 | ||||||||||
|
|
|||||||||||||||
|
Dividends declared per share of common stock |
$ |
0.35 |
$ |
0.35 |
$ |
0.35 |
$ |
0.35 |
$ |
0.35 | |||||
|
|
|||||||||||||||
|
Balance Sheet Data: |
|||||||||||||||
|
Cash and cash equivalents |
$ |
46,977 |
$ |
54,999 |
$ |
100,529 |
$ |
28,252 |
$ |
67,373 | |||||
|
Development property investments at fair value |
228,233 | 188,540 | 163,979 | 117,936 | 95,102 | ||||||||||
|
Operating property loans at fair value |
5,938 | 5,990 | 8,790 | 9,965 | 9,905 | ||||||||||
|
Self-storage real estate owned, net |
15,355 | 15,594 | 7,283 | 7,350 |
- |
||||||||||
|
Investment in and advances to real estate venture |
13,856 | 12,573 | 14,314 | 10,812 | 5,373 | ||||||||||
|
Total assets |
314,634 | 284,193 | 305,127 | 192,429 | 192,779 | ||||||||||
|
Senior loan participations |
718 | 668 | 20,147 | 19,299 | 18,582 | ||||||||||
|
Secured revolving credit facility |
- |
- |
- |
- |
- |
||||||||||
|
Total liabilities |
8,814 | 8,434 | 28,733 | 24,873 | 24,417 | ||||||||||
|
Total equity |
305,820 | 275,759 | 276,394 | 167,556 | 168,362 | ||||||||||
|
Common book value / common shares outstanding |
$ |
18.58 |
$ |
18.71 |
$ |
18.75 |
$ |
17.57 |
$ |
17.74 | |||||
Fourth Quarter 2017 8
Jernigan Capital, Inc.
Consolidated Balance Sheets- Trailing Five Quarters
(unaudited, in thousands)
|
|
|||||||||||||||
|
|
As of |
||||||||||||||
|
|
December 31, |
September 30, |
June 30, |
March 31, |
December 31, |
||||||||||
|
|
2017 |
2017 |
2017 |
2017 |
2016 |
||||||||||
|
Assets: |
|||||||||||||||
|
Cash and cash equivalents |
$ |
46,977 |
$ |
54,999 |
$ |
100,529 |
$ |
28,252 |
$ |
67,373 | |||||
|
Development property investments at fair value |
228,233 | 188,540 | 163,979 | 117,936 | 95,102 | ||||||||||
|
Operating property loans at fair value |
5,938 | 5,990 | 8,790 | 9,965 | 9,905 | ||||||||||
|
Self-storage real estate owned, net |
15,355 | 15,594 | 7,283 | 7,350 |
- |
||||||||||
|
Investment in and advances to real estate venture |
13,856 | 12,573 | 14,314 | 10,812 | 5,373 | ||||||||||
|
Other loans, at cost |
1,313 | 1,754 | 6,619 | 14,826 | 11,752 | ||||||||||
|
Deferred costs |
2,004 | 3,813 | 2,305 | 2,294 | 2,207 | ||||||||||
|
Prepaid expenses and other assets |
776 | 734 | 1,119 | 809 | 868 | ||||||||||
|
Fixed assets, net |
182 | 196 | 189 | 185 | 199 | ||||||||||
|
Total assets |
$ |
314,634 |
$ |
284,193 |
$ |
305,127 |
$ |
192,429 |
$ |
192,779 | |||||
|
|
|||||||||||||||
|
Liabilities: |
|||||||||||||||
|
Senior loan participations |
$ |
718 |
$ |
668 |
$ |
20,147 |
$ |
19,299 |
$ |
18,582 | |||||
|
Secured revolving credit facility |
- |
- |
- |
- |
- |
||||||||||
|
Due to Manager |
1,484 | 1,438 | 1,027 | 839 | 1,008 | ||||||||||
|
Accounts payable, accrued expenses and other liabilities |
1,138 | 1,035 | 2,399 | 1,040 | 697 | ||||||||||
|
Dividends payable |
5,474 | 5,293 | 5,160 | 3,695 | 4,130 | ||||||||||
|
Total liabilities |
$ |
8,814 |
$ |
8,434 |
$ |
28,733 |
$ |
24,873 |
$ |
24,417 | |||||
|
|
|||||||||||||||
|
Equity: |
|||||||||||||||
|
Cumulative Series A preferred stock, at liquidation preference of $40.0 million and $10.0 million, net of allocated costs, respectively |
|
$ |
37,764 |
|
$ |
9,445 |
|
$ |
9,445 |
|
$ |
9,446 |
|
$ |
9,448 |
|
Common stock |
144 | 142 | 142 | 90 | 90 | ||||||||||
|
Additional paid-in capital |
276,814 | 272,726 | 272,525 | 163,772 | 162,664 | ||||||||||
|
Accumulated deficit |
(8,902) | (6,554) | (5,718) | (5,752) | (3,840) | ||||||||||
|
Total equity |
305,820 | 275,759 | 276,394 | 167,556 | 168,362 | ||||||||||
|
Total liabilities and equity |
$ |
314,634 |
$ |
284,193 |
$ |
305,127 |
$ |
192,429 |
$ |
192,779 | |||||
Fourth Quarter 2017 9
Consolidated Statements of Operations
(unaudited, in thousands, except per share data)
|
|
||||||||||||
|
|
Quarter ended |
Year ended |
||||||||||
|
|
December 31, |
December 31, |
||||||||||
|
|
2017 |
2016 |
2017 |
2016 |
||||||||
|
Revenues: |
||||||||||||
|
Interest income from investments |
$ |
3,698 |
$ |
2,158 |
$ |
11,457 |
$ |
6,532 | ||||
|
Rental and other property-related income from real estate owned |
202 |
- |
530 |
- |
||||||||
|
Other revenues |
30 |
- |
204 |
- |
||||||||
|
Total revenues |
3,930 | 2,158 | 12,191 | 6,532 | ||||||||
|
|
||||||||||||
|
Costs and expenses: |
||||||||||||
|
General and administrative expenses |
1,517 | 1,472 | 5,852 | 5,574 | ||||||||
|
Management fees to Manager |
1,080 | 470 | 3,453 | 1,688 | ||||||||
|
Property operating expenses of real estate owned |
83 |
- |
271 |
- |
||||||||
|
Depreciation and amortization of real estate owned |
238 |
- |
472 |
- |
||||||||
|
Transaction and other expenses |
- |
- |
- |
2,129 | ||||||||
|
Restructuring costs |
- |
- |
- |
54 | ||||||||
|
Deferred termination fee to Manager |
- |
- |
- |
239 | ||||||||
|
Total costs and expenses |
2,918 | 1,942 | 10,048 | 9,684 | ||||||||
|
|
||||||||||||
|
Operating income (loss) |
1,012 | 216 | 2,143 | (3,152) | ||||||||
|
|
||||||||||||
|
Other income (expense): |
||||||||||||
|
Equity in earnings from unconsolidated real estate venture |
516 | 424 | 2,263 | 1,278 | ||||||||
|
Change in fair value of investments |
1,738 | 4,185 | 10,804 | 18,370 | ||||||||
|
Interest expense |
(296) | (373) | (1,053) | (559) | ||||||||
|
Loss on modification of debt |
- |
- |
(232) |
- |
||||||||
|
Other interest income |
155 | 37 | 634 | 80 | ||||||||
|
Total other income |
2,113 | 4,273 | 12,416 | 19,169 | ||||||||
|
Net income |
3,125 | 4,489 | 14,559 | 16,017 | ||||||||
|
Net income attributable to preferred stockholders |
(423) | (996) | (1,456) | (996) | ||||||||
|
Net income attributable to common stockholders |
$ |
2,702 |
$ |
3,493 |
$ |
13,103 |
$ |
15,021 | ||||
|
|
||||||||||||
|
Basic earnings per share attributable to common stockholders |
$ |
0.19 |
$ |
0.53 |
$ |
1.10 |
$ |
2.42 | ||||
|
Diluted earnings per share attributable to common stockholders |
$ |
0.19 |
$ |
0.53 |
$ |
1.10 |
$ |
2.42 | ||||
|
|
||||||||||||
|
Dividends declared per share of common stock |
$ |
0.35 |
$ |
0.35 |
$ |
1.40 |
$ |
1.40 | ||||
Fourth Quarter 2017 10
Calculation of Adjusted Earnings and Reconciliation to Net Income Attributable to
Common Stockholders
(unaudited, in thousands, except share and per share data)
|
|
|||||||||||||||
|
|
|
Three months ended |
|||||||||||||
|
|
|
December 31, |
|
September 30, |
|
June 30, |
|
March 31, |
|
December 31, |
|||||
|
|
|
2017 |
|
2017 |
|
2017 |
|
2017 |
|
2016 |
|||||
|
|
|
|
|
|
|
|
|
|
|
|
|
|
|
|
|
|
Net income attributable to common stockholders |
|
$ |
2,702 |
|
$ |
4,147 |
|
$ |
5,017 |
|
$ |
1,237 |
|
$ |
3,493 |
|
Plus: stock dividends payable to preferred stockholders |
|
|
44 |
|
|
132 |
|
|
- |
|
|
371 |
|
|
823 |
|
Plus: stock-based compensation |
|
|
272 |
|
|
296 |
|
|
435 |
|
|
292 |
|
|
252 |
|
Plus: depreciation and amortization on real estate assets |
|
|
238 |
|
|
172 |
|
|
38 |
|
|
24 |
|
|
- |
|
Plus: loss on modification of debt |
|
|
- |
|
|
232 |
|
|
- |
|
|
- |
|
|
- |
|
Adjusted Earnings |
|
$ |
3,256 |
|
$ |
4,979 |
|
$ |
5,490 |
|
$ |
1,924 |
|
$ |
4,568 |
|
Adjusted Earnings per share attributable to common stockholders – diluted |
|
$ |
0.23 |
|
$ |
0.35 |
|
$ |
0.55 |
|
$ |
0.21 |
|
$ |
0.69 |
|
Weighted average shares of common stock outstanding – diluted |
|
|
14,295,639 |
|
|
14,244,345 |
|
|
10,033,029 |
|
|
8,993,528 |
|
|
6,619,848 |
|
|
||||||
|
|
|
Year ended December 31, |
||||
|
|
|
2017 |
|
2016 |
||
|
Net income attributable to common stockholders |
|
$ |
13,103 |
|
$ |
15,021 |
|
Plus: stock dividends payable to preferred stockholders |
|
|
547 |
|
|
823 |
|
Plus: stock-based compensation |
|
|
1,295 |
|
|
1,080 |
|
Plus: depreciation and amortization on real estate assets |
|
|
472 |
|
|
- |
|
Plus: loss on modification of debt |
|
|
232 |
|
|
- |
|
Plus: transaction and other expenses |
|
|
- |
|
|
2,129 |
|
Plus: restructuring costs |
|
|
- |
|
|
54 |
|
Plus: deferred termination fee to Manager |
|
|
- |
|
|
239 |
|
Adjusted Earnings |
|
$ |
15,649 |
|
$ |
19,346 |
|
Adjusted Earnings per share attributable to common stockholders – diluted |
|
$ |
1.31 |
|
$ |
3.11 |
|
Weighted average shares of common stock outstanding – diluted |
|
|
11,908,512 |
|
|
6,212,648 |
Fourth Quarter 2017 11
First Quarter and Full-Year 2018 Guidance
(in thousands, except share and per share data)
|
|
||||||||||||
|
|
Three months ending |
Year ending |
||||||||||
|
|
March 31, 2018 |
December 31, 2018 |
||||||||||
|
|
Low |
High |
Low |
High |
||||||||
|
Interest income from investments |
$ |
4,400 |
$ |
4,500 |
$ |
25,200 |
$ |
26,700 | ||||
|
Rental revenue from real estate owned |
575 | 600 | 3,100 | 3,300 | ||||||||
|
Other income |
20 | 25 | 80 | 100 | ||||||||
|
Total revenues |
$ |
4,995 |
$ |
5,125 |
$ |
28,380 |
$ |
30,100 | ||||
|
G&A expenses (1) |
(3,225) | (3,105) | (15,000) | (13,500) | ||||||||
|
Property operating expenses (excl. depreciation) |
(320) | (300) | (1,600) | (1,500) | ||||||||
|
Depreciation on real estate assets |
(740) | (720) | (3,600) | (3,300) | ||||||||
|
Interest expense |
(475) | (450) | (4,800) | (4,000) | ||||||||
|
JV income |
400 | 430 | 1,400 | 1,900 | ||||||||
|
Other interest income |
80 | 85 | 150 | 200 | ||||||||
|
Change in fair value of investments (2) |
1,500 | 2,000 | 41,000 | 47,000 | ||||||||
|
Net income |
2,215 | 3,065 | 45,930 | 56,900 | ||||||||
|
Cash and stock dividends payable to preferred stockholders (3) |
(3,535) | (3,530) | (19,000) | (18,000) | ||||||||
|
Net income (loss) to common stockholders |
(1,320) | (465) | 26,930 | 38,900 | ||||||||
|
Add: stock dividends payable to preferred stockholders |
2,125 | 2,125 | 8,500 | 8,500 | ||||||||
|
Add: stock-based compensation |
400 | 350 | 2,000 | 1,800 | ||||||||
|
Add: depreciation and amortization on real estate assets |
740 | 720 | 3,600 | 3,300 | ||||||||
|
Adjusted earnings |
$ |
1,945 |
$ |
2,730 |
$ |
41,030 |
$ |
52,500 | ||||
|
Earnings (loss) per share – diluted |
$ |
(0.09) |
$ |
(0.03) |
$ |
1.76 |
$ |
2.54 | ||||
|
Adjusted earnings per share – diluted |
$ |
0.13 |
$ |
0.19 |
$ |
2.68 |
$ |
3.43 | ||||
|
Average shares outstanding – diluted |
14,550,000 | 14,550,000 | 15,300,000 | 15,300,000 | ||||||||
|
(1) |
Includes $1.3 million (low and high) and $7.0 million (low) / $6.2 million (high) of management fees for the three months ending March 31, 2018 and for the year ending December 31, 2018, respectively. |
|
(2) |
Excludes $0.3 million (low and high) and $0.8 million (low) / $1.2 million (high) of unrealized appreciation in fair value of investments from the real estate venture which is included in JV income for the three months ending March 31, 2018 and for the year ending December 31, 2018, respectively. |
|
(3) |
Represents both cash dividends and stock dividends (which stock dividends will be paid out in either shares of the Company’s common stock or additional shares of Series A Preferred Stock, at the option of the Series A stockholders) estimated with respect to outstanding shares of Series A Preferred Stock, as well as cash dividends estimated with respect to outstanding shares of Series B Preferred Stock. |
Key Assumptions:
|
§ |
Projected closings on $200 million to $230 million of new self-storage investments with a profits interest for the full-year 2018, including the aforementioned approximately $82 million bridge loan investment scheduled to fully close on March 2, 2018; |
|
§ |
Fundings of approximately $300 million to $340 million on the Company’s closed and projected investment commitments during the full-year 2018; and |
|
§ |
Acquisition of 100% of developer interests in four development investments in January and February 2018, resulting in a total of five wholly-owned self-storage facilities in 2018. |
|
§ |
Guidance ranges assume 2018 investment fundings and commitments are financed with long-term capital, with specific impact on 2018 earnings dependent upon the amount, timing, cost, and form of capital raised. |
|
· |
Specific assumptions included in guidance are as follows: |
|
ž |
Proceeds of $85.0 million from the issuance of Series A Preferred Stock during the first seven months of 2018, which includes the issuance of $20.0 million of Series A Preferred Stock on February 16, 2018; |
|
ž |
Impact of the amendment to the Series A Preferred Stock that was executed during the first quarter of 2018 which had the effect of leveling out the quarterly stock dividend through the second quarter of 2021; |
|
ž |
Impact of the issuance of $37.5 million of 7% Series B Cumulative Redeemable Perpetual Preferred Stock in January 2018; and |
|
ž |
Utilization of the Company’s credit facility over the course of the year as availability increases (expected borrowing base to secure full $200.0 million by the end of 2018, subject to syndication) with expected borrowings at year-end of $160.0 million to $180.0 million. |
Additionally, the Company updated its 2018 fair value guidance to reflect the recent increase in interest rates thus far in 2018, the impact of the Company’s acquisitions of four of its development partners’ interests, and the updated estimates of construction progress and timing of the receipt of certificates of occupancy from its development partners. Together, this resulted in a reduction and/or shifting of fair value recognition out of 2018, which in turn is expected to positively impact 2019. These were partially offset by expected fair value accretion on the Company’s aforementioned bridge investment. Of the estimated $41.0 million to $47.0 million of fair value appreciation in 2018, the Company expects $1.5 million to $2.0 million to be recognized during the first quarter, $9.3 million to $10.5 million to be recognized in the second quarter, $13.0 million to $15.0 million to be recognized in the third quarter, and $17.2 million to $19.5 million to be recognized in the fourth quarter. Timing of fair value appreciation is heavily dependent upon construction progress and the timing of receipt of certificates of occupancy, both of which are subject to factors outside the control of the Company’s development partners. As such, the exact timing of fair value recognition is subject to change.
Fourth Quarter 2017 12
Jernigan Capital, Inc.
Changes to Preliminary 2018 Guidance
|
|
Preliminary 2018 Guidance |
Updated 2018 Guidance |
||||||||||||||||
|
|
Year ending December 31,2018 |
Year ending December 31, 2018 |
Change |
|||||||||||||||
|
|
Low |
High |
Low |
High |
Low |
High |
||||||||||||
|
Interest income and other revenues |
$ |
23,000 |
$ |
25,000 |
$ |
25,200 |
$ |
26,700 |
$ |
2,200 |
$ |
1,700 | ||||||
|
Rental revenue from real estate owned |
900 | 1,000 | 3,100 | 3,300 | 2,200 | 2,300 | ||||||||||||
|
Other income |
80 | 100 | 80 | 100 |
- |
- |
||||||||||||
|
Total revenues and JV income |
$ |
23,980 |
$ |
26,100 |
$ |
28,380 |
$ |
30,100 |
$ |
4,400 |
$ |
4,000 | ||||||
|
|
||||||||||||||||||
|
G&A expenses |
(15,000) | (13,500) | (15,000) | (13,500) |
- |
- |
||||||||||||
|
|
||||||||||||||||||
|
JV Income |
1,400 | 1,900 | 1,400 | 1,900 |
- |
- |
||||||||||||
|
|
||||||||||||||||||
|
Change in fair value of investments |
46,000 | 56,000 | 41,000 | 47,000 | (5,000) | (9,000) | ||||||||||||
Primary factors impacting changes to preliminary 2018 guidance ranges:
|
· |
Bridge loan investment scheduled to close on or about March 2, 2018, resulting in increases to interest income and change in fair value of investments; |
|
· |
Acquisitions of 100% control of four development properties in the first quarter of 2018, resulting in a decrease in interest income, an increase in rental income, and a decrease in change in fair value of investments; |
|
· |
Rising interest rates, resulting in a decrease in the change in fair value of investments; |
|
· |
Construction delays and/or expected certificate of occupancy dates, resulting in the delay of fair value appreciation timing and the funding of construction draws. The construction and expected certificate of occupancy delays are being driven by the following factors: |
|
- |
Lack of control over permitting / permitting delays; |
|
- |
National shortage of construction labor resulting in construction delays; and |
|
- |
Extreme winter weather in several markets. |
Change in Fair Value of Investments Bridge
|
|
Mid-Point |
||
|
Change in fair value of investments – preliminary |
$ |
51,000 |
|
|
Construction delays / CO movements |
(7,000) |
||
|
Impact of rising interest rates |
(2,000) |
||
|
Bridge investment portfolio |
3,000 |
||
|
Acquisitions – change from fair value investments to cost investment |
(1,000) |
||
|
Change in fair value of investments – updated |
$ |
44,000 |
2018 Quarterly Expected Timing of Certificates of Occupancy and Fair Value Recognition
|
|
No. of COs |
Aggregate Commitment |
Expected Fair Value Mid-Point |
||||||
|
First quarter |
1 |
$ |
7,530 |
$ |
1,750 | ||||
|
Second quarter |
5 |
54,578 | 9,900 | ||||||
|
Third quarter |
6 |
65,434 | 14,000 | ||||||
|
Fourth quarter |
7 |
84,125 | 18,350 | ||||||
|
Total |
19 |
$ |
211,667 |
$ |
44,000 |
Fourth Quarter 2017 13
Jernigan Capital, Inc.
Schedule of Completed Development Projects
As of December 31, 2017
(unaudited, dollars in thousands)
|
|
||||||||||||||||||||||||||
|
|
Location |
Remaining |
||||||||||||||||||||||||
|
|
(MSA) |
Funded |
Unfunded |
Size |
Date |
Months |
% Physical |
|||||||||||||||||||
|
Closing Date |
Address |
Commitment |
Investment |
Commitment |
Fair Value |
(NRSF) (3) |
Opened |
Open (1) |
Occupancy (1) |
|||||||||||||||||
|
6/10/2015 |
Atlanta 1 (5) |
|||||||||||||||||||||||||
|
|
5110 McGinnis Ferry Rd |
8,132 | 8,086 | 46 | 10,741 | 71,743 |
5/25/2016 |
21 | 66.0 |
% |
||||||||||||||||
|
6/19/2015 |
Tampa 1 |
|||||||||||||||||||||||||
|
|
12832 S US Highway 301 |
5,369 | 5,285 | 84 | 6,012 | 50,050 |
4/11/2016 |
23 | 80.6 |
% |
||||||||||||||||
|
6/26/2015 |
Atlanta 2 (5) |
|||||||||||||||||||||||||
|
|
340 Franklin Gateway SE |
6,050 | 5,769 | 281 | 8,631 | 66,137 |
5/24/2016 |
21 | 69.5 |
% |
||||||||||||||||
|
6/29/2015 |
Charlotte 1 |
|||||||||||||||||||||||||
|
|
9323 Wright Hill Rd |
7,624 | 7,251 | 373 | 10,363 | 87,430 |
8/18/2016 |
18 | 44.5 |
% |
||||||||||||||||
|
7/2/2015 |
Milwaukee |
|||||||||||||||||||||||||
|
|
420 W St Paul Ave |
7,650 | 7,512 | 138 | 8,994 | 83,277 |
10/9/2016 |
(2) |
17 | 38.2 |
% |
|||||||||||||||
|
7/31/2015 |
New Haven |
|||||||||||||||||||||||||
|
|
453 Washington Ave |
6,930 | 6,524 | 406 | 8,231 | 64,225 |
12/16/2016 |
14 | 51.9 |
% |
||||||||||||||||
|
9/30/2015 |
Jacksonville 1 (5) |
|||||||||||||||||||||||||
|
|
1939 East West Pkwy |
6,445 | 5,988 | 457 | 8,913 | 59,848 |
8/12/2016 |
19 | 83.1 |
% |
||||||||||||||||
|
10/27/2015 |
Austin |
|||||||||||||||||||||||||
|
|
251 N AW Grimes Blvd |
8,658 | 7,297 | 1,361 | 8,782 | 77,334 |
3/16/2017 |
11 | 37.4 |
% |
||||||||||||||||
|
8/10/2015 |
Pittsburgh (5) |
|||||||||||||||||||||||||
|
|
6400 Hamilton Ave |
5,266 | 4,798 | 468 | 6,774 | 48,024 |
5/11/2017 |
10 | 21.7 |
% |
||||||||||||||||
|
1/4/2017 |
New York City 1 |
|||||||||||||||||||||||||
|
|
1775 5th Ave |
16,117 | 14,914 | 1,203 | 18,892 | 105,447 |
9/29/2017 |
5 | 16.3 |
% |
||||||||||||||||
|
Total Completed Development Loans |
$ |
78,241 |
$ |
73,424 |
$ |
4,817 |
$ |
96,333 | ||||||||||||||||||
|
|
||||||||||||||||||||||||||
|
4/21/2015 |
Orlando 1/2 (4) |
|||||||||||||||||||||||||
|
|
11920 W Colonial Dr. |
10,506 |
N/A |
N/A |
N/A |
93,965 |
5/1/2016 |
22 | 70.5 |
% |
||||||||||||||||
|
Total Owned Properties |
$ |
10,506 | ||||||||||||||||||||||||
|
|
||||||||||||||||||||||||||
|
Total Completed Investments |
$ |
88,747 | ||||||||||||||||||||||||
|
|
(1) |
As of February 27, 2018. |
|
|
|
(2) |
Certificate of Occupancy (“C/O”) was received in August 2016, prior to the property being ready for opening by the manager of the project. Property opened to partial leasing in October 2016. All floors opened to leasing in February 2017. |
|
|
|
(3) |
The net rentable square feet (“NRSF”) includes only climate controlled and non-climate controlled storage space. It does not include retail space, office space, non-covered RV space or parking spaces. |
|
|
|
(4) |
In August 2017, the Company purchased its partner’s remaining 25.1% profits interest in the Orlando 1 investment and its partner’s 50.1% profits interest in the Orlando 2 investment, the 287-unit addition to the Orlando 1 investment, for $1.6 million. The Orlando facility is now wholly-owned by the Company. Orlando 1 (51,235 NRSF) was at 86.2% physical occupancy on July 18, 2017. On July 19, 2017 the 42,730 NRSF Orlando 2 addition opened for business. Occupancy reflected is for the combined facility. |
|
|
|
(5) |
During the first quarter of 2018, the Company purchased its partner’s 50.1% profits interest in this investment, and as such, the investments are wholly-owned by the Company. |
|
Fourth Quarter 2017 14
Schedule of Development Projects in Progress
As of December 31, 2017
(unaudited, dollars in thousands)
|
|
|||||||||||||||||||||
|
|
Location |
Remaining |
Estimated |
||||||||||||||||||
|
|
(MSA) |
Funded |
Unfunded |
Size |
Construction |
C/O |
|||||||||||||||
|
Closing Date |
Address |
Commitment |
Investment |
Commitment |
Fair Value |
(NRSF) (2) |
Start Date |
Quarter (1) |
|||||||||||||
|
8/14/2015 |
Raleigh |
||||||||||||||||||||
|
|
1501 Sunrise Ave |
$ |
8,792 |
$ |
5,550 |
$ |
3,242 |
$ |
5,889 | 60,935 |
Q4 2016 |
Q2 2018 |
|||||||||
|
9/20/2016 |
Charlotte 2 |
||||||||||||||||||||
|
|
1200 E 10th St |
12,888 | 5,453 | 7,435 | 5,686 | 77,915 |
Q1 2017 |
Q2 2018 |
|||||||||||||
|
11/17/2016 |
Jacksonville 2 |
||||||||||||||||||||
|
|
37 Jefferson Rd |
7,530 | 4,971 | 2,559 | 5,818 | 70,930 |
Q4 2016 |
Q1 2018 |
|||||||||||||
|
1/18/2017 |
Atlanta 3 |
||||||||||||||||||||
|
|
1484 Northside Dr NW |
14,115 | 2,393 | 11,722 | 2,236 | 92,935 |
Q4 2017 |
Q1 2019 |
|||||||||||||
|
1/31/2017 |
Atlanta 4 |
||||||||||||||||||||
|
|
4676 S Atlanta Rd |
13,678 | 7,040 | 6,638 | 7,147 | 105,288 |
Q2 2017 |
Q2 2018 |
|||||||||||||
|
2/24/2017 |
Orlando 3 |
||||||||||||||||||||
|
|
12711 E Colonial Dr |
8,056 | 3,144 | 4,912 | 3,335 | 70,625 |
Q3 2017 |
Q2 2018 |
|||||||||||||
|
2/24/2017 |
New Orleans |
||||||||||||||||||||
|
|
2709 Severn Ave |
12,549 | 677 | 11,872 | 553 | 90,315 |
Q3 2017 |
Q1 2019 |
|||||||||||||
|
2/27/2017 |
Atlanta 5 |
||||||||||||||||||||
|
|
56 Peachtree Valley Rd NE |
17,492 | 4,971 | 12,521 | 4,739 | 84,988 |
Q3 2017 |
Q1 2019 |
|||||||||||||
|
3/1/2017 |
Fort Lauderdale |
||||||||||||||||||||
|
|
5601 NE 14th Ave |
9,952 | 1,128 | 8,824 | 1,043 | 79,279 |
Q1 2018 |
Q1 2019 |
|||||||||||||
|
3/1/2017 |
Houston |
||||||||||||||||||||
|
|
1070 Brittmoore Rd |
13,630 | 3,633 | 9,997 | 3,547 | 132,967 |
Q4 2017 |
Q4 2018 |
|||||||||||||
|
4/14/2017 |
Louisville 1 |
||||||||||||||||||||
|
|
2801 N Hurstbourne Pkwy |
8,523 | 2,932 | 5,591 | 3,083 | 66,150 |
Q2 2017 |
Q3 2018 |
|||||||||||||
|
4/20/2017 |
Denver 1 |
||||||||||||||||||||
|
|
6206 W Alameda Ave |
9,806 | 1,940 | 7,866 | 1,849 | 59,150 |
Q1 2018 |
Q1 2019 |
|||||||||||||
|
4/20/2017 |
Denver 2 |
||||||||||||||||||||
|
|
3110 S Wadsworth Blvd |
11,164 | 5,442 | 5,722 | 5,849 | 74,615 |
Q2 2017 |
Q2 2018 |
|||||||||||||
|
5/2/2017 |
Atlanta 6 |
||||||||||||||||||||
|
|
2033 Monroe Dr |
12,543 | 4,344 | 8,199 | 4,262 | 81,120 |
Q2 2017 |
Q3 2018 |
|||||||||||||
|
5/2/2017 |
Tampa 2 |
||||||||||||||||||||
|
|
9185 Ulmerton Rd |
8,091 | 1,086 | 7,005 | 1,010 | 71,400 |
Q1 2018 |
Q4 2018 |
|||||||||||||
|
5/19/2017 |
Tampa 3 |
||||||||||||||||||||
|
|
Lot 3B Crossroads Town Center |
9,224 | 1,422 | 7,802 | 1,335 | 70,888 |
Q3 2017 |
Q3 2018 |
|||||||||||||
|
6/12/2017 |
Tampa 4 |
||||||||||||||||||||
|
|
3209 30th Ave S St |
10,266 | 1,847 | 8,419 | 1,752 | 73,500 |
Q4 2017 |
Q3 2018 |
|||||||||||||
|
6/19/2017 |
Baltimore |
||||||||||||||||||||
|
|
1835 Washington Blvd |
10,775 | 3,315 | 7,460 | 3,115 | 83,450 |
Q3 2017 |
Q3 2018 |
|||||||||||||
|
6/28/2017 |
Knoxville |
||||||||||||||||||||
|
|
7807 Kingston Pike |
9,115 | 1,351 | 7,764 | 1,265 | 72,069 |
Q3 2017 |
Q4 2018 |
|||||||||||||
|
6/29/2017 |
Boston 1 |
||||||||||||||||||||
|
|
329 Boston Post Rd |
14,103 | 4,978 | 9,125 | 4,914 | 93,738 |
Q3 2017 |
Q3 2018 |
|||||||||||||
|
6/30/2017 |
New York City 2 |
||||||||||||||||||||
|
|
465 W 150th St |
26,482 | 18,042 | 8,440 | 17,576 | 40,593 |
Q4 2017 |
Q4 2018 |
|||||||||||||
|
7/27/2017 |
Jacksonville 3 |
||||||||||||||||||||
|
|
2004 Edison Ave |
8,096 | 1,134 | 6,962 | 1,053 | 68,700 |
Q4 2017 |
Q4 2018 |
|||||||||||||
|
8/30/2017 |
Orlando 4 |
||||||||||||||||||||
|
|
9001 Eastmar Commons |
9,037 | 2,059 | 6,978 | 1,960 | 77,125 |
Q1 2018 |
Q1 2019 |
|||||||||||||
|
9/14/2017 |
Los Angeles |
||||||||||||||||||||
|
|
943-959 W Hyde Park Blvd |
28,750 | 7,533 | 21,217 | 7,398 | 120,038 |
Q1 2019 |
Q3 2020 |
|||||||||||||
|
9/14/2017 |
Miami 1 |
||||||||||||||||||||
|
|
4250 SW 8th St |
14,657 | 5,862 | 8,795 | 5,725 | 69,175 |
Q2 2018 |
Q2 2019 |
|||||||||||||
|
9/28/2017 |
Louisville 2 |
||||||||||||||||||||
|
|
3415 Bardstown Rd |
9,940 | 1,864 | 8,076 | 1,762 | 74,172 |
Q4 2017 |
Q4 2018 |
|||||||||||||
|
10/12/2017 |
Miami 2 |
||||||||||||||||||||
|
|
880 W Prospect Rd |
9,459 | 1,014 | 8,445 | 820 | 58,000 |
Q2 2018 |
Q3 2019 |
|||||||||||||
|
10/30/2017 |
New York City 3 |
||||||||||||||||||||
|
|
5203 Kennedy Blvd |
14,701 | 2,595 | 12,106 | 2,294 | 68,660 |
Q4 2017 |
Q1 2019 |
|||||||||||||
|
11/16/2017 |
Miami 3 |
||||||||||||||||||||
|
|
120-132 NW 27th Ave |
20,168 | 3,508 | 16,660 | 3,099 | 96,295 |
Q1 2018 |
Q3 2019 |
|||||||||||||
|
11/21/2017 |
Minneapolis |
||||||||||||||||||||
|
|
2109 University Ave W |
12,674 | 1,150 | 11,524 | 1,023 | 88,838 |
Q2 2018 |
Q2 2019 |
|||||||||||||
|
12/1/2017 |
Boston 2 |
||||||||||||||||||||
Fourth Quarter 2017 15
|
|
10 Hampshire Rd |
8,771 | 1,306 | 7,465 | 1,220 | 74,625 |
Q4 2017 |
Q4 2018 |
|||||||||||||
|
12/15/2017 |
New York City 4 |
||||||||||||||||||||
|
|
6 Commerce Center Dr |
10,591 | 927 | 9,664 | 823 | 78,425 |
Q1 2018 |
Q1 2019 |
|||||||||||||
|
12/27/2017 |
Boston 3 |
||||||||||||||||||||
|
|
19 Coolidge Hill Rd |
10,174 | 2,259 | 7,915 | 2,169 | 62,700 |
Q2 2018 |
Q2 2019 |
|||||||||||||
|
12/28/2017 |
New York City 5 |
||||||||||||||||||||
|
|
375 River St |
16,073 | 4,303 | 11,770 | 4,178 | 90,200 |
Q1 2018 |
Q2 2019 |
|||||||||||||
|
Total Development Loan in Progress |
$ |
421,865 |
$ |
121,173 |
$ |
300,692 |
$ |
119,527 | |||||||||||||
|
|
(1) |
Estimated C/O dates represent the Company’s best estimate as of December 31, 2017 based on project specific information learned through underwriting and communications with respective developers. These dates are subject to change due to unexpected project delays/efficiencies. |
|
|
(2) |
The NRSF includes only climate controlled and non-climate controlled storage space. It does not include retail space, office space, noncovered RV space or parking spaces. |
Fourth Quarter 2017 16
Schedule of Heitman JV Development Projects Completed and in Progress
As of December 31, 2017
(unaudited, dollars in thousands)
Development Projects Completed:
|
|
|||||||||||||||||||||||||
|
|
|||||||||||||||||||||||||
|
|
Location |
Remaining |
|||||||||||||||||||||||
|
|
(MSA) |
Funded |
Unfunded |
Size |
Date |
Months |
% Physical |
||||||||||||||||||
|
Closing Date |
Address |
Commitment |
Investment |
Commitment |
Fair Value |
(NRSF) (2) |
Opened |
Open (1) |
Occupancy (1) |
||||||||||||||||
|
7/19/2016 |
Jacksonville |
||||||||||||||||||||||||
|
|
3211 San Pablo Rd S |
8,127 | 7,131 | 996 | 10,895 | 80,621 |
7/26/2017 |
7 | 47.2 |
% |
|||||||||||||||
|
9/28/2016 |
Columbia |
||||||||||||||||||||||||
|
|
401 Hampton St |
9,199 | 7,925 | 1,274 | 8,843 | 70,671 |
8/23/2017 |
6 | 23.6 |
% |
|||||||||||||||
|
8/15/2016 |
Atlanta 2 |
||||||||||||||||||||||||
|
|
11220 Medlock Bridge Rd |
8,772 | 7,367 | 1,405 | 8,435 | 70,209 |
9/14/2017 |
5 | 13.9 |
% |
|||||||||||||||
|
4/15/2016 |
Washington DC |
||||||||||||||||||||||||
|
|
1325 Kenilworth Ave NE |
17,269 | 15,698 | 1,571 | 17,600 | 89,785 |
9/25/2017 |
5 | 16.5 |
% |
|||||||||||||||
|
8/25/2016 |
Denver |
||||||||||||||||||||||||
|
|
2225 E 104th Ave |
11,032 | 8,690 | 2,342 | 10,280 | 85,575 |
12/14/2017 |
2 | 17.7 |
% |
|||||||||||||||
|
Total Completed Development Loans |
$ |
54,399 |
$ |
46,811 |
$ |
7,588 |
$ |
56,053 | |||||||||||||||||
|
|
(1) |
As of February 27, 2018. |
|
|
(2) |
The NRSF includes only climate controlled and non-climate controlled storage space. It does not include retail space, office space, non-covered RV space or parking spaces. |
Development Projects In Progress:
|
|
|||||||||||||||||||||
|
|
Location |
Remaining |
Estimated |
||||||||||||||||||
|
|
(MSA) |
Funded |
Unfunded |
Size |
Construction |
C/O |
|||||||||||||||
|
Closing Date |
Address |
Commitment |
Investment |
Commitment |
Fair Value |
(NRSF) (2) |
Start Date |
Quarter (1) |
|||||||||||||
|
5/14/2015 |
Miami 1 |
||||||||||||||||||||
|
|
490 NW 36th St |
$ |
13,867 |
$ |
10,348 |
$ |
3,519 |
$ |
11,950 | 75,838 |
Q1 2016 |
Q1 2018 |
|||||||||
|
5/14/2015 |
Miami 2 |
||||||||||||||||||||
|
|
1100 NE 79th St |
14,849 | 10,187 | 4,662 | 10,945 | 74,113 |
Q2 2016 |
Q2 2018 |
|||||||||||||
|
9/25/2015 |
Fort Lauderdale |
||||||||||||||||||||
|
|
812 NW 1st St |
13,230 | 8,955 | 4,275 | 10,216 | 87,413 |
Q2 2016 |
Q2 2018 |
|||||||||||||
|
4/29/2016 |
Atlanta 1 |
||||||||||||||||||||
|
|
1801 Savoy Dr |
10,223 | 7,093 | 3,130 | 7,778 | 71,475 |
Q4 2016 |
Q1 2018 |
|||||||||||||
|
7/21/2016 |
New Jersey |
||||||||||||||||||||
|
|
10 Central Ave |
7,828 | 1,967 | 5,861 | 1,908 | 57,975 |
Q2 2017 |
Q3 2018 |
|||||||||||||
|
12/22/2016 |
Raleigh |
||||||||||||||||||||
|
|
7620 ACC Blvd |
8,877 | 4,280 | 4,597 | 4,603 | 65,110 |
Q1 2017 |
Q2 2018 |
|||||||||||||
|
Total Development Projects in Progress |
$ |
68,874 |
$ |
42,830 |
$ |
26,044 |
$ |
47,400 | |||||||||||||
|
|
|||||||||||||||||||||
|
Total Heitman JV Investments |
$ |
123,273 |
$ |
89,641 |
$ |
33,632 |
$ |
103,453 | |||||||||||||
|
|
(1) |
Estimated C/O dates represent the Company’s best estimate as of December 31, 2017 based on project specific information learned through underwriting and communications with respective developers. These dates are subject to change due to unexpected project delays/efficiencies. |
|
|
(2) |
The NRSF includes only climate controlled and non-climate controlled storage space. It does not include retail space, office space, non-covered RV space or parking spaces. |
Fourth Quarter 2017 17
Closed Investments by Geography
As of December 31, 2017
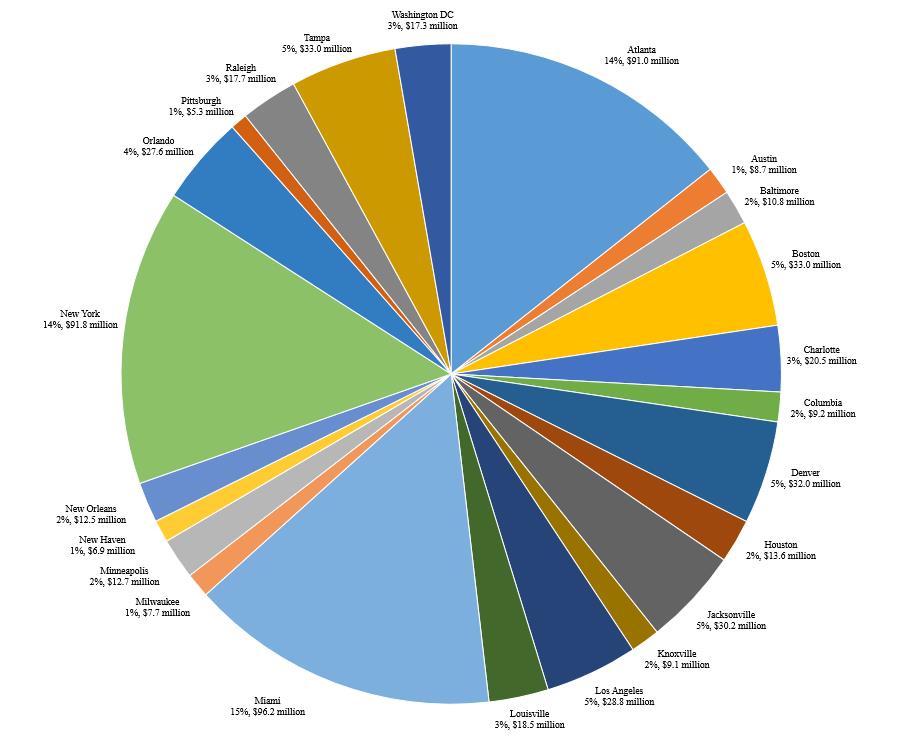
Fourth Quarter 2017 18
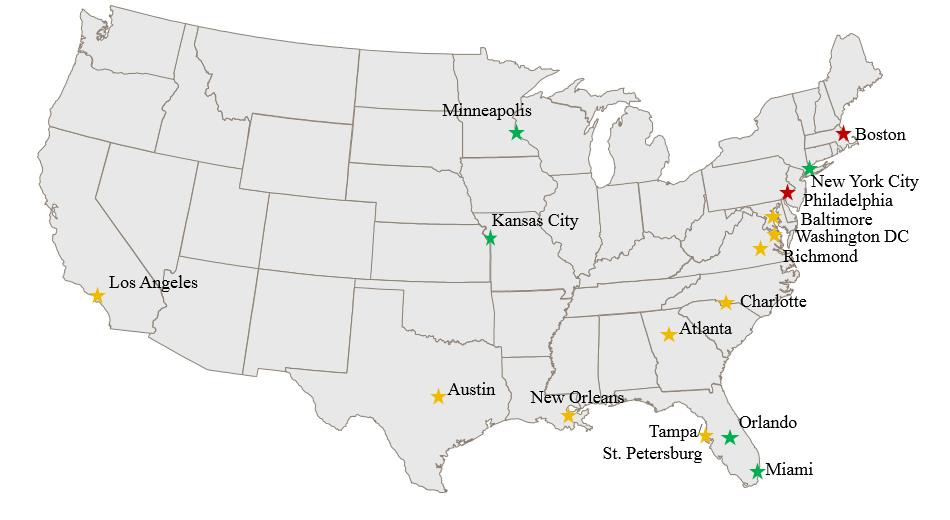
Investment Pipeline by Geography
|
|
|
Excluding the Miami portfolio investment, executed term sheets for investments in 9 separate self-storage development projects for an aggregate capital commitment of approximately $129 million |
|
|
|
Maintain a robust pipeline in excess of $500 million of additional development investment opportunities in top 50 markets |
Fourth Quarter 2017 19
Company Information
|
Corporate Headquarters |
Trading Symbol |
Investor Relations |
Information Requests |
|
6410 Poplar Avenue |
Common shares: JCAP |
6410 Poplar Avenue |
To request an Investor Relations |
|
Suite 650 |
7.00% Series B Preferred Stock: JCAP- |
Suite 650 |
package or annual report, please |
|
|
PR B |
|
|
|
Memphis, TN 38119 |
Stock Exchange Listing |
Memphis, TN 38119 |
visit our website at |
|
901.567.9510 |
New York Stock Exchange |
901.567.9510 |
www.jernigancapital.com |
Executive Management
|
Dean Jernigan |
John A. Good |
|
Chairman and Chief Executive Officer |
President and Chief Operating Officer |
|
|
|
|
Kelly P. Luttrell |
|
|
Senior Vice President, Chief Financial Officer and Treasurer |
|
Independent Directors
|
Mark O. Decker |
James D. Dondero |
|
Director |
Director |
|
|
|
|
Howard A. Silver |
Harry J. Thie |
|
Director |
Director |
Equity Research Coverage
|
Baird Equity Research |
FBR Capital Markets |
|
RJ Milligan |
David Corak |
|
rjmilligan@rwbaird.com |
dcorak@fbr.com |
|
|
|
|
Jefferies LLC |
KeyBanc Capital Markets |
|
George Hoglund |
Todd M. Thomas |
|
gholund@jefferies.com |
tthomas@key.com |
|
|
|
|
Raymond James & Associates |
|
|
Jonathan Hughes |
|
|
jonathan.hughes@raymondjames.com |
|
Any opinions, estimates, forecasts or predictions regarding Jernigan Capital’s performance made by these analysts are theirs alone and do not represent opinions, estimates, forecasts or predictions of Jernigan Capital or its management. Jernigan Capital does not by its reference above or distribution imply its endorsement of or concurrence with such opinions, estimates, forecasts or predictions.
Fourth Quarter 2017 20