Attached files
| file | filename |
|---|---|
| EX-32.2 - EX-32.2 - Installed Building Products, Inc. | d519411dex322.htm |
| EX-32.1 - EX-32.1 - Installed Building Products, Inc. | d519411dex321.htm |
| EX-31.2 - EX-31.2 - Installed Building Products, Inc. | d519411dex312.htm |
| EX-31.1 - EX-31.1 - Installed Building Products, Inc. | d519411dex311.htm |
| EX-23.1 - EX-23.1 - Installed Building Products, Inc. | d519411dex231.htm |
| EX-21.1 - EX-21.1 - Installed Building Products, Inc. | d519411dex211.htm |
| EX-10.34 - EX-10.34 - Installed Building Products, Inc. | d519411dex1034.htm |
| EX-10.33 - EX-10.33 - Installed Building Products, Inc. | d519411dex1033.htm |
| EX-10.31 - EX-10.31 - Installed Building Products, Inc. | d519411dex1031.htm |
Table of Contents
UNITED STATES
SECURITIES AND EXCHANGE COMMISSION
Washington, D.C. 20549
FORM 10-K
| ☒ | ANNUAL REPORT PURSUANT TO SECTION 13 OR 15(d) OF THE SECURITIES EXCHANGE ACT OF 1934 |
For the Fiscal Year Ended December 31, 2017
OR
| ☐ | TRANSITION REPORT PURSUANT TO SECTION 13 OR 15(d) OF THE SECURITIES EXCHANGE ACT OF 1934 |
For the Transition Period From To
Commission File Number: 001-36307
Installed Building Products, Inc.
(Exact name of registrant as specified in its charter)
| Delaware | 45-3707650 | |
| (State or other jurisdiction of incorporation or organization) |
(I.R.S. Employer Identification No.) | |
| 495 South High Street, Suite 50 Columbus, Ohio |
43215 | |
| (Address of principal executive offices) | (Zip Code) | |
(614) 221-3399
(Registrant’s telephone number, including area code)
Securities registered pursuant to Section 12(b) of the Act:
| Title of each class |
Name of each exchange on which registered | |
| Common Stock, $0.01 par value per share | The New York Stock Exchange |
Securities registered pursuant to Section 12(g) of the Act: None
Indicate by check mark if the registrant is a well-known seasoned issuer, as defined in Rule 405 of the Securities Act. Yes ☒ No ☐
Indicate by check mark if the registrant is not required to file reports pursuant to Section 13 or Section 15(d) of the Act. Yes ☐ No ☒
Indicate by check mark whether the registrant (1) has filed all reports required to be filed by Section 13 or 15(d) of the Securities Exchange Act of 1934 during the preceding 12 months (or for such shorter period that the registrant was required to file such reports), and (2) has been subject to such filing requirements for the past 90 days. Yes ☒ No ☐
Indicate by check mark whether the registrant has submitted electronically and posted on its corporate Website, if any, every Interactive Data File required to be submitted and posted pursuant to Rule 405 of Regulation S-T (§232.405 of this chapter) during the preceding 12 months (or for such shorter period that the registrant was required to submit and post such files). Yes ☒ No ☐
Indicate by check mark if disclosure of delinquent filers pursuant to Item 405 of Regulation S-K (§229.405 of this chapter) is not contained herein, and will not be contained, to the best of registrant’s knowledge, in definitive proxy or information statements incorporated by reference in Part III of this Form 10-K or any amendment to this Form 10-K. ☐
Indicate by a check mark whether the registrant is a large accelerated filer, an accelerated filer, a non-accelerated filer, or a smaller reporting company, or an emerging growth company. See the definitions of “large accelerated filer,” “accelerated filer,” “smaller reporting company” and “emerging growth company” in Rule 12b-2 of the Exchange Act.
| Large accelerated filer | ☒ | Accelerated filer | ☐ | |||
| Non-accelerated filer | ☐ (Do not check if a smaller reporting company) | Smaller reporting company | ☐ | |||
| Emerging growth company | ☐ | |||||
If an emerging growth company, indicate by check mark if the registrant has elected not to use the extended transition period for complying with any new or revised financial accounting standards provided pursuant to Section 13(a) of the Exchange Act. ☐
Indicate by check mark whether the registrant is a shell company (as defined in Rule 12b-2 of the Act). Yes ☐ No ☒
The aggregate market value of the voting and non-voting common equity held by non-affiliates computed by reference to the price at which the common equity was last sold on June 30, 2017 was $1,150,753,666.
On February 20, 2018, the registrant had 31,862,080 shares of common stock, par value $0.01 per share, outstanding.
DOCUMENTS INCORPORATED BY REFERENCE
Portions of the registrant’s Definitive Proxy Statement relating to the 2018 Annual Meeting of Stockholders are incorporated by reference into Part III of this Annual Report on Form 10-K where indicated. Such Definitive Proxy Statement will be filed with the Securities and Exchange Commission within 120 days after the end of the registrant’s fiscal year ended December 31, 2017.
Table of Contents
i
Table of Contents
Information Regarding Forward-Looking Statements
This Annual Report on Form 10-K (“Form 10-K”) contains forward-looking statements within the meaning of the federal securities laws, including with respect to our financial and business model, demand for our services and product offerings, expansion of our national footprint and diversification, our ability to capitalize on the new home and commercial construction recovery, our ability to grow and strengthen our market position, our ability to pursue and integrate value-enhancing acquisitions, our ability to improve sales and profitability and expectations for demand for our services and our earnings in 2018. Forward-looking statements may generally be identified by the use of words such as “anticipate,” “believe,” “estimate,” “project,” “predict,” “possible,” “forecast,” “may,” “could,” “would,” “should,” “expect,” “intends,” “plan,” and “will” or, in each case, their negative, or other variations or comparable terminology. These forward-looking statements include all matters that are not historical facts. By their nature, forward-looking statements involve risks and uncertainties because they relate to events and depend on circumstances that may or may not occur in the future. Any forward-looking statements that we make herein and in any future reports and statements are not guarantees of future performance, and actual results may differ materially from those expressed in or suggested by such forward-looking statements as a result of various factors, including, without limitation, the factors discussed in the “Risk Factors” section of this Form 10-K, as the same may be updated from time to time in our subsequent filings with the Securities and Exchange Commission. Any forward-looking statement made by the Company in this report speaks only as of the date hereof. New risks and uncertainties arise from time to time and it is impossible for the Company to predict these events or how they may affect it. The Company has no obligation, and does not intend, to update any forward-looking statements after the date hereof, except as required by federal securities laws.
Important factors that could cause our results to vary from expectations include, but are not limited to:
| • | our dependence on the residential and commercial construction industries, the economy and the credit markets; |
| • | declines in the economy or slowing of the housing market recovery that could lead to significant impairment charges; |
| • | the cyclical and seasonal nature of our business; |
| • | our exposure to severe weather conditions; |
| • | the highly fragmented and competitive nature of our industry; |
| • | product shortages or the loss of key suppliers; |
| • | changes in the costs and availability of products; |
| • | inability to successfully acquire and integrate other businesses; |
| • | our exposure to claims arising from our operations; |
| • | our reliance on key personnel; |
| • | our ability to attract, train and retain qualified employees while controlling labor costs; |
| • | our exposure to product liability, workmanship warranty, casualty, construction defect and other claims and legal proceedings; |
| • | changes in, or failure to comply with, federal, state, local and other regulations; |
| • | disruptions in our information technology systems, including cybersecurity incidents; |
| • | our ability to implement and maintain effective internal control over financial reporting; and |
| • | additional factors discussed under Item 1, Business; Item 1A, Risk Factors; and Item 7, Management’s Discussion and Analysis of Financial Condition and Results of Operations, of this Form 10-K. |
ii
Table of Contents
PART I
| Item 1. | Business |
OUR COMPANY
We are one of the nation’s largest insulation installers for the residential new construction market and are also a diversified installer of complementary building products, including waterproofing, fire-stopping and fireproofing, garage doors, rain gutters, shower doors, closet shelving and mirrors, throughout the United States. We offer our portfolio of services for new and existing single-family and multi-family residential and commercial building projects from our national network of over 125 branch locations in all 48 continental states and the District of Columbia. We believe we have the number one or two market position for new single-family insulation installation in more than half of the markets in which we operate based on permits issued in those markets. In January 2017, we acquired Trilok Industries, Inc., Alpha Insulation and Waterproofing, Inc. and Alpha Insulation and Waterproofing Company (collectively “Alpha”) to expand our market position in commercial insulation installation and strengthen our complementary installed product offerings in waterproofing, fire-stopping and fireproofing.
We manage all aspects of the installation process for our customers, from our direct purchase and receipt of materials from national manufacturers to our timely supply of materials to job sites and quality installation. Installation of insulation is a critical phase in the construction process, as certain interior work cannot begin until the insulation phase passes inspection. We benefit from our national scale, long-standing supplier relationships and a broad customer base that includes production and custom homebuilders, multi-family and commercial construction firms and homeowners.
Our business began in 1977 with one location in Columbus, Ohio. In the late 1990s, we began our acquisition strategy with the goal of creating a national platform. Since 1999, we have successfully completed and integrated over 125 acquisitions, which has allowed us to generate significant scale and to diversify our product offerings while expanding into some of the most attractive new construction markets in the United States. We believe we are well positioned to continue to profitably grow our business due to our strong balance sheet, liquidity and continuing acquisition strategy. For a further discussion of our industry and trends affecting our industry, please refer to Item 7, Management’s Discussion and Analysis of Financial Condition, Key Factors Affecting our Operating Results, in this Form 10-K.
OUR OPERATIONS
We manage all aspects of the installation process for our customers, from our direct purchase and receipt of materials from national manufacturers to our timely supply of materials to job sites and quality installation:
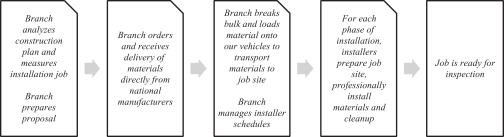
Our Typical Installation Process
| • | In each of our markets, our branch management and staff foster close working relationships with local customers. |
| • | Our branch management hires and trains installers with a focus on quality, safety and timely installation. |
| • | Our branch sales staff analyzes construction plans and measures the installation jobs to prepare customer proposals that comply with local building codes and energy efficiency standards and meet customer requirements. |
| • | Our branches order and receive delivery of materials directly from national manufacturers. |
| • | Our branches break bulk shipments and load required materials onto our vehicles for each job and manage installer schedules to ensure timely installation that meets our customers’ scheduling requirements. |
1
Table of Contents
| • | For each phase of product installation, our installers prepare the job site, professionally install the materials to pass inspection, clean-up when the installation is complete and return unused materials to the branch. |
Our customers generally select their building products installer based on quality and timeliness of service, knowledge of local building codes, product application expertise, pricing, relationships and reputation in the market. For these reasons, we emphasize the importance of developing and maintaining customer relationships at the local level and rely heavily on the knowledge and experience of our branch management and staff.
Once we are selected for an installation job, our branch staff coordinates with our customer to ensure that the job is completed in a quality manner and within the customer’s production schedule. Throughout the construction process, our branch sales and supervisory staff and installation teams make frequent site visits to ensure timely and proper installation and to provide general service support. We believe a high level of service is valued by our customers and generates customer loyalty. There are typically three phases to complete a residential insulation installation: (i) basement insulation installation; (ii) installation of insulation in the exterior walls and air sealing of the structure; and (iii) ceiling and attic insulation installation. We also assist the builders with coordinating inspection. We believe that our ability to consistently complete our installations within a customer’s production schedule is recognized by our customers and is a key component of our high level of service.
Insulation
Overview
We are one of the largest new residential insulation installers in the United States based on our internal estimates. Insulation installation comprised approximately 67% of our net revenue for the year ended December 31, 2017. We handle every stage of the installation process, including material procurement, project scheduling and logistics, multi-phase professional installation and field quality inspection.
Insulation Materials
We offer a wide range of insulation materials consisting of:
| • | Fiberglass and Cellulose Insulation – Fiberglass insulation is made of fibrous glass that is held together by a thermoset resin creating insulating air pockets. It typically contains an average of 50% recycled content. It is primarily available in two forms: batts (also referred to as blankets) and loosefill (also referred to as blown in). Fiberglass is the most widely used residential insulation material in the United States. Cellulose insulation is made primarily of paper and cardboard and has a very high recycled content. Cellulose is only available in loosefill form and is blown into the structure with specialized equipment. Fiberglass and cellulose insulation accounted for approximately 86% of our insulation sales for the year ended December 31, 2017. |
| • | Spray Foam Insulation – Spray foam insulation, which is generally a polyurethane foam, is applied at a job site by mixing two chemical components together in specialized application equipment. While typically having the highest insulating value per inch and sealing effectiveness of all insulation |
2
Table of Contents
| materials that we offer, spray foam is also typically the most expensive on an installed basis. Spray foam insulation accounted for approximately 14% of our insulation sales for the year ended December 31, 2017. |
Insulation Installation Applications
Local building codes typically require the installation of insulation in multiple areas of a structure. Each of these areas is frequently referred to as a phase of the insulation installation process and requires a separate trip to the job site by our installers at different points in the construction of a structure. Building practice and the inspection process differ geographically and require our involvement at different times during the construction process. We install insulation and sealant materials in many areas of a structure, including:
| • | Basement and Crawl Space – These spaces often account for the second most energy loss in a residential structure. |
| • | Building Envelope – We insulate the exterior walls of both residential and commercial structures by applying insulation on the wall or between the studs. |
| • | Attic – We insulate the attics of new and existing residential structures. The attic is the area where the most energy may be lost in a home. |
| • | Acoustical – Many builder or architect specifications call for acoustical insulation for sound reduction purposes in both residential and commercial structures. This product is generally installed in the interior walls to minimize sound transmission. |
| • | In each of these applications, we typically use fiberglass batts, except in attic installations where we typically install loosefill fiberglass. |
Waterproofing
Some of our locations install waterproofing, caulking and moisture protection systems for commercial and industrial construction projects. We offer a variety of waterproofing options, including, but not limited to, sheet and hot applied waterproofing membranes, deck coating systems, bentonite systems and air & vapor systems. The installation and service of waterproofing comprised approximately 8% of our net revenue for the year ended December 31, 2017.
Shower Doors, Closet Shelving and Mirrors
Some of our locations install a variety of shower enclosures, ranging from basic sliding door designs to complex custom designs. We have the ability to meet our customers’ diverse needs by customizing shower enclosures by size and style according to their specifications, including framing, hardware and glass options. We design and install closet shelving systems in select markets utilizing some of the highest quality products available from national brands. We also offer standard and custom designed mirrors for our customers. Shower doors, closet shelving and mirror installations comprised approximately 7% of our net revenue for the year ended December 31, 2017.
Garage Doors
Some of our locations install and service garage doors and openers for new residential construction builders, homeowners and commercial customers. We offer a variety of options from some of the best-known garage door brands. We offer steel, aluminum, wood and vinyl garage doors as well as opener systems. Unlike the other products we install, the garage door business has an ongoing aftermarket service component, which represented almost one-third of the net revenue resulting from garage doors for the year ended December 31, 2017. The installation and service of garage doors comprised approximately 5% of our net revenue for the year ended December 31, 2017.
3
Table of Contents
Rain Gutters
Some of our locations install a wide range of rain gutters, which direct water from a home’s roof away from the structure and foundation. Rain gutters are typically constructed from aluminum or copper and are available in a wide variety of colors, shapes and widths. They are generally assembled on the job site using specialized equipment. The installation of rain gutters comprised approximately 4% of our net revenue for the year ended December 31, 2017.
Other Building Products
Some of our locations install other complementary building products, none of which is an individually significant percentage of net revenue. Installation of other building products comprised approximately 9% of our net revenue for the year ended December 31, 2017.
Sales and Marketing
We seek to attract and retain customers through exceptional customer service, superior installation quality, broad service offerings and competitive pricing. Our strategy is centered on building and maintaining strong customer relationships. We also capitalize on cross-selling opportunities from existing customer relationships and identifying situations where customers may benefit from more than one of our installation service offerings. By executing this strategy, we believe we can continue to generate incremental sales volumes with new and existing customers.
Experienced sales and service professionals are important to our customer growth and increasing our profitability. Retaining and motivating local employees has been an important component of our acquisition and operating strategies. As of December 31, 2017, we employed approximately 550 sales professionals and our sales force has spent an average of almost a decade with our operations. The local sales staff, which is generally led by the branch manager, is responsible for maintaining relationships with our customers. These local teams work diligently to increase sales by supporting our existing customers with excellent service and value while also pursuing new customers with competitive offerings. In addition to the efforts of our sales staff, we market our product and service offerings on the internet, in the local yellow pages, on the radio and through advertisements in trade journals. We primarily conduct our marketing using local trademarks and trade names.
Quality Control and Safety
Our quality control process starts with the initial proposal. Our sales staff and managers are knowledgeable about our service offerings and scope of work. They are trained on manufacturers’ guidelines as well as state and local building codes. Our quality control programs emphasize onsite inspections, training by manufacturers and various certification programs.
We consider risk management and safety to be a core business objective. Significant staffing, funding and other resources are allocated to our management that enhance quality and safety for our employees and our customers. Our branch managers are held accountable for the safety of employees and quality of workmanship at their locations. We provide our employees with ongoing training and development programs necessary to improve work quality and safety performance.
BUSINESS STRATEGY
We believe our geographic footprint, long-standing relationships with national insulation manufacturers, streamlined value chain structure and proven track record of successful acquisitions provides us with opportunities for continued growth in our existing markets and expansion into new markets. We believe we are
4
Table of Contents
well positioned to further improve our profitability and results in 2018 and we will continue to emphasize the following strategic business objectives in 2018:
| • | capitalize on the new residential and commercial construction markets; |
| • | capitalize on our ability to cross-sell products through existing markets as well as new markets entered as a result of acquisitions; |
| • | continue to strengthen our market share position by working with the best customers; |
| • | pursue value enhancing acquisitions by being disciplined in our approach to valuations and pricing; |
| • | obtain additional value from our operating leverage and national scale; and |
| • | continue organic expansion of the commercial end market in existing geographies. |
However, we can provide no assurance that the positive trends reflected in our recent financial and operating results will continue in 2018.
CUSTOMERS
We serve a broad group of national, regional and local homebuilders, multi-family and commercial construction firms, individual homeowners and repair and remodeling contractors. Our top ten customers, which are a combination of national and regional builders, accounted for approximately 14% of net revenue for the year ended December 31, 2017. No single customer accounted for more than 3.5% of net revenue during the year ended December 31, 2017.
BACKLOG
Certain of our contracts are accounted for under the percentage of completion method of accounting. When the percentage-of-completion method is used, we estimate the costs to complete individual contracts and record as revenue that portion of the total contract price that is considered complete based on the relationship of costs incurred to date to total anticipated costs. The costs of earned revenue include all direct material and labor costs and those indirect costs related to contract performance, such as indirect labor, supplies, tools and repairs. Backlog represents expected revenue on uncompleted contracts, including the amount of revenue on contracts for which our work has not yet commenced, less the revenue recognized under these contracts, which we currently estimate to be $80.8 million as of December 31, 2017. However, backlog is not a guarantee of future revenues as contractual commitments may change. There can be no assurance that backlog will result in revenues within the expected timeframe, if at all.
SUPPLIERS
We have long-term relationships with many of our suppliers and have not experienced any significant disruption in the supply of any of the primary materials we purchase and install. As one of the largest purchasers of fiberglass and spray foam insulation in the United States, we believe that we maintain particularly strong relationships with the largest manufacturers of these insulation products. The proximity of certain of our branch locations to insulation manufacturers’ facilities provides additional mutual benefits, including opportunities for cost savings and joint planning regarding future production. Due to the limited number of large fiberglass insulation manufacturers, our three largest suppliers in the aggregate accounted for approximately 38% of all material purchases for the year ended December 31, 2017. We also believe that we maintain good relationships with suppliers of the non-insulation products we install. We believe that the pricing, terms and rebates we receive from our suppliers, as well as supply assurance, are favorable. We have found that using multiple suppliers helps to ensure a stable source of materials and favorable purchasing terms as suppliers compete to gain and maintain our business. In addition, our national purchasing volumes provide leverage with suppliers as we pursue additional procurement cost savings and purchasing synergies.
5
Table of Contents
SEASONALITY
We tend to have higher sales during the second half of the year as our homebuilder customers complete construction of homes placed under contract for sale in the traditionally stronger spring selling season. In addition, some of our larger branches operate in states impacted by winter weather and, as such, experience a slowdown in construction activity during the first quarter of the calendar year. This winter slowdown contributes to traditionally lower sales and profitability in our first quarter.
The composition and level of our working capital typically change during periods of increasing sales as we carry more inventory and receivables, although these changes are generally offset in part by higher trade payables to our suppliers. Working capital levels increase in the summer and fall seasons due to higher sales during the peak of residential construction activity. Typically, the subsequent collection of receivables and reduction in inventory levels during the winter months has positively impacted cash flow. In the past, we have from time to time utilized our borrowing availability under our credit facility to cover short-term working capital needs.
COMPETITION
We believe that competition in our industry is based on quality and timeliness of service, knowledge of local building codes, pricing, relationships and reputation in the market. The building products installation industry is fragmented. The markets for our non-insulation installation services are even more fragmented than the markets for insulation installation services. Our competitors include two other large national contractors, several large regional contractors and numerous local contractors. We expect to continue to effectively compete in our local markets given our long-standing customer relationships, access to capital, tenure and quality of local staff, quality installation reputation and competitive pricing.
EMPLOYEES
As of December 31, 2017, we had approximately 6,900 employees, consisting of approximately 4,900 installers, approximately 550 sales professionals, approximately 425 production personnel and approximately 1,025 administrative and management personnel. Approximately 30 of our employees are covered under collective bargaining agreements. We have never experienced a work stoppage or strike, and we believe that we have good relationships with our employees.
INFORMATION TECHNOLOGY
JobCORE is our web-enabled internal software technology designed to enhance the effectiveness of our operations and management. In addition, we typically integrate jobCORE into our acquired operations. The jobCORE software provides in-depth operational and financial performance data from individual branches to the corporate office. JobCORE provides our branch managers and our salespeople with an important operational tool for monitoring branch level performance. It assists management in assessing important business questions, including customer analysis, sales staff analysis, branch analysis and other operating activities.
INTELLECTUAL PROPERTY
We possess intellectual property rights, including trademarks, trade names and know-how and other proprietary rights that are important to our business. In particular, we maintain registered trademarks and trade names, the majority of which are the trademarks and trade names under which many of our local branches operate. While we do not believe our business is dependent on any one of our trademarks or trade names, we believe that our trademarks and trade names are important to the development and conduct of our business as well as to the local marketing of our services. We also maintain domain name registrations for each of our local branch websites. We make efforts to protect our intellectual property rights, although the actions we take may be inadequate to prevent others from using similar intellectual property. In addition, third parties may assert claims against our use of intellectual property and we may be unable to successfully resolve such claims.
6
Table of Contents
ENVIRONMENTAL AND REGULATORY MATTERS
We are subject to various federal, state and local laws and regulations applicable in the jurisdictions in which we operate, including laws and regulations relating to our relationships with our employees, public health and safety, workplace safety, transportation, zoning and fire codes. We strive to operate in accordance with applicable laws, codes and regulations.
Our transportation operations are subject to the regulatory jurisdiction of the U.S. Department of Transportation, or DOT, which has broad administrative powers. We are also subject to safety requirements governing interstate operations prescribed by the DOT. In addition, vehicle dimension and weight and driver hours of service are subject to both federal and state regulation. Our operations are also subject to the regulatory jurisdiction of the U.S. Department of Labor’s Occupational Safety and Health Administration, or OSHA, which has broad administrative powers regarding workplace and jobsite safety.
Our operations and properties are subject to federal, state and local laws and regulations relating to the use, storage, handling, generation, transportation, treatment, emission, release, discharge and disposal of hazardous or toxic materials, substances, waste and petroleum products and the investigation, remediation, removal and monitoring of the presence or release of such materials, substances, waste and petroleum products, including at currently or formerly owned or occupied premises and off-site disposal locations. We have not previously incurred material costs to comply with environmental laws and regulations. However, we could be subject to material costs, liabilities or claims relating to environmental compliance in the future, especially in the event of changes in existing laws and regulations or in their interpretation or enforcement.
As the nature of our business involves the use or handling of certain potentially hazardous or toxic substances, including spray foam applications and lead-based paint, we may be held liable for claims alleging injury or damage resulting from the release of or exposure to such substances, as well as claims relating to the presence of mold, fungal growth and moisture intrusion alleged in connection with our business activities. In addition, as owners and lessees of real property, we may be held liable for, among other things, releases of hazardous or toxic substances or petroleum products on, at, under or emanating from currently or formerly owned or operated properties, or any off-site disposal locations, or for any known or newly discovered environmental conditions at or relating to any of our properties, including those arising from activities conducted by previous occupants or at adjoining properties, without regard to whether we knew of or were responsible for such release. We may be required to investigate, remove, remediate or monitor the presence or release of such hazardous or toxic substances or petroleum products and may be held liable by a governmental entity for fines and penalties or to any third parties for damages, including for bodily injury, property damage and natural resource damage in connection with the presence or release of hazardous or toxic substances or petroleum products.
To date, costs to comply with applicable laws and regulations relating to pollution or the protection of human health and safety, the environment and natural resources have not had a material adverse effect on our financial condition or operating results, and we do not anticipate incurring material expenditures to comply with such laws and regulations in the current fiscal year.
In conjunction with our lease agreements and other transactions, we often provide reasonable and customary indemnities relating to various matters, including environmental issues. To date, we have not had to pay a material amount pursuant to any such indemnification obligations.
In addition, our suppliers are subject to various laws and regulations, including environmental laws and regulations.
CORPORATE AND AVAILABLE INFORMATION
Installed Building Products, Inc. is a Delaware corporation formed on October 28, 2011 and is a holding company that derives all of its operating income from its subsidiaries. Our principal executive offices are located
7
Table of Contents
at 495 South High Street, Suite 50, Columbus, Ohio 43215. Our main telephone number is (614) 221-3399. Our common stock is listed on the New York Stock Exchange, or NYSE, under the symbol “IBP.” Unless the context requires otherwise, the terms “IBP,” “the Company,” “we,” “us” and “our” in this Form 10-K refer to Installed Building Products, Inc. and its subsidiaries.
We are subject to the reporting requirements of the Securities Exchange Act of 1934, as amended, or the Exchange Act, and file annual, quarterly and current reports, proxy statements and other information with the Securities and Exchange Commission, or SEC. These filings are available to the public on the SEC’s website at www.sec.gov. Our periodic reports and any other information that we file with the SEC may be inspected without charge and copied at the SEC’s Public Reference Room at 100 F Street, NE, Washington, D.C. 20549. Information on the operation of the Public Reference Room can be obtained by calling the SEC at 1-800-SEC-0330. Our corporate website is located at www.installedbuildingproducts.com, and our investor relations website is located at http://investors.installedbuildingproducts.com. Copies of our Form 10-K, Quarterly Reports on Form 10-Q, Current Reports on Form 8-K, and amendments to these reports filed or furnished pursuant to Section 13(a) or 15(d) of the Exchange Act are available, free of charge, on our investor relations website as soon as reasonably practicable after we file such material with or furnish it electronically to the SEC.
We webcast our earnings calls and post the materials used in meetings with members of the investment community on our investor relations website. Additionally, we provide notifications of news or announcements regarding our financial performance, including SEC filings, investor events and press and earnings releases on our investor relations website. We have used, and intend to continue to use, our investor relations website as a means of disclosing material non-public information and for complying with disclosure obligations under Regulation FD. Further corporate governance information, including our certificate of incorporation, bylaws, governance guidelines, board committee charters and code of business conduct and ethics, is also available on our investor relations website under the heading “Corporate Governance.” The contents of our website are not incorporated by reference in, or otherwise made a part of, this Form 10-K or in any other report or document we file with the SEC, and any references to our websites are intended to be inactive textual references only.
| Item 1A. | Risk Factors |
There are a number of business risks and uncertainties that affect our business. These risks and uncertainties could cause our actual results to differ from past performance or expected results. We consider the following risks and uncertainties to be most relevant to our business activities. Additional risks and uncertainties not presently known to us, or that we currently believe to be immaterial, may also adversely impact our business, financial condition and results of operations. We urge investors to consider carefully the risk factors described below in evaluating the information contained in this report.
RISKS RELATED TO OUR BUSINESS
Our business is cyclical and significantly affected by changes in general and local economic conditions.
Demand for our services is cyclical and highly sensitive to general and local economic conditions over which we have no control, including changes in:
| • | the number of new home and commercial building construction starts; |
| • | short- and long-term interest rates; |
| • | inflation; |
| • | employment levels and job and personal income growth; |
| • | housing demand from population growth, household formation and other demographic changes; |
| • | the length of building cycles from permit to completion, based on local economic or environmental factors; |
8
Table of Contents
| • | availability and pricing of mortgage financing for homebuyers and commercial financing for developers of multi-family homes and subcontractors; |
| • | consumer confidence generally and the confidence of potential homebuyers in particular; |
| • | U.S. and global financial and political system and credit market stability; |
| • | private party and government mortgage loan programs and federal and state regulation, oversight and legal action regarding lending, appraisal, foreclosure and short sale practices; |
| • | federal and state personal income tax rates and provisions, including provisions for the deduction of mortgage loan interest payments, state and local income and real estate taxes and other expenses; and |
| • | federal, state and local energy efficiency programs, regulations, codes and standards. |
For example, the Tax Cuts and Jobs Act enacted on December 22, 2017 limits homeowners’ ability to deduct mortgage interest, property taxes and state and local income taxes. Unfavorable changes in any of the above conditions could adversely affect consumer spending, result in decreased demand for homes and adversely affect our business generally or be more prevalent or concentrated in particular markets in which we operate. Any deterioration in economic conditions or continuation of uncertain economic conditions could have a material adverse effect on our business, financial condition, results of operations and prospects.
The housing market has faced significant challenges in the past which could return and/or intensify.
The homebuilding industry is still recovering from a significant downturn that began in mid-2006 and began to stabilize in late 2011. The housing market has steadily strengthened since then. In 2017, U.S. homebuilding activity increased to approximately 849 thousand single-family starts although it remains well below the historical average (from 1959 through 2017) of approximately 1.0 million to 1.1 million single-family starts per year. According to the U.S. Census Bureau, actual U.S. single family housing starts in the U.S. during 2017 were 81% lower than in 2007. The factors that may be contributing to a slow recovery may include: a severe economic recession, followed by a gradual economic recovery; limited credit availability; shortages of suitable building lots in many regions; shortages of experienced labor; rising home prices in many markets resulting in affordability issues for potential buyers; and soft housing demand in certain markets. The downturn in the homebuilding industry resulted in a substantial reduction in demand for our products and services. These challenges could return and/or intensify and limit any future improvement in the levels and mix of new home construction activity, which could adversely affect our business, financial condition, results of operations and cash flows.
Our business relies on commercial construction activity, which has faced significant challenges and is dependent on business investment.
A portion of the products we sell are for the commercial construction market. Challenging economic conditions in recent years have adversely affected demand for commercial construction projects. Although demand is now improving, current market estimates indicate that commercial construction activity remains uneven and below historical average levels. If the present recovery does not continue or gain further momentum, the growth potential of our business, and our financial condition, results of operations and cash flows could be adversely affected.
The strength of the commercial construction market depends on business investment which is a function of many national, regional and local economic conditions beyond our control, including capital and credit availability for commercial construction projects, material costs, interest rates, employment rates, vacancy rates, labor and healthcare costs, fuel and other energy costs and changes in tax laws affecting the real estate industry. Adverse changes or continued uncertainty regarding these and other economic conditions could result in a decline or postponement in spending on commercial construction projects, which could adversely affect our financial condition, results of operations and cash flows.
9
Table of Contents
The downturn from 2008 to 2011 in the U.S. commercial new construction market was one of the most severe of the last 40 years. Previously, downturns in the construction industry have typically lasted about two to three years, but the downturn from 2008 to 2011 was much more significant, with a market decline of approximately 49% during those three years. We cannot predict the duration of the current market conditions or the timing or strength of any future recovery of commercial construction activity in our markets. Weakness in the commercial construction market would have a material adverse effect on our business, financial condition and operating results. Continued uncertainty about current economic conditions will continue to pose a risk to our businesses that serve the non-residential markets. If participants in these industries postpone spending in response to tighter credit, negative financial news and declines in income or asset values or other factors, this could have a material negative effect on the demand for our products and services and on our business, financial condition and results of operations.
A decline in the economy and/or a deterioration in expectations regarding the housing market or the commercial construction market could cause us to record significant non-cash impairment charges, which could negatively affect our earnings and reduce stockholders’ equity.
Annually, we either assess qualitative factors or perform a detailed analysis to determine if it is more likely than not that the fair value of a reporting unit is less than its carrying amount. We did not record any goodwill impairment charges in 2017, 2016, or 2015; however, a decline in the expectation of our future performance or deterioration in expectations regarding the general economy and/or the timing and the extent of new home construction and home improvement and commercial construction activity may cause us to recognize non-cash, pre-tax impairment charges for goodwill or other long-lived assets, which are not determinable at this time. In addition, as a result of our acquisition strategy, we have recorded goodwill and may incur impairment charges in connection with prior and future acquisitions. If the value of goodwill or other intangible assets is impaired, our earnings and stockholders’ equity would be adversely affected.
As of December 31, 2017, we had goodwill and other intangible assets in an aggregate amount of $293.5 million, or approximately 40% of our total assets. Current year acquisitions, including the acquisition of Alpha in January 2017, have resulted in a significant increase in our goodwill and other intangible assets. We review our goodwill and other intangible assets for impairment annually during the fourth quarter and when events or changes in circumstances indicate the carrying value may not be recoverable. A significant decrease in our estimates for income and cash flows or a decline in our market capitalization could result in an impairment of our goodwill and/or other intangible assets. Given the significant increase in the amount of our goodwill and other intangible assets after completion of the Alpha acquisition, any future impairment of these assets could require us to record material charges that would negatively impact our earnings and reduce stockholders’ equity.
Our business may be affected by severe weather conditions and is seasonal.
Severe weather conditions, such as unusually prolonged cold conditions, rain, blizzards or hurricanes, could accelerate, delay or halt construction or installation activity. The impact of these types of events on our business may adversely impact quarterly or annual net revenue, cash flows from operations and results of operations.
We tend to have higher sales during the second half of the year as our homebuilder customers complete construction of homes placed under contract for sale in the traditionally stronger spring selling season. In addition, some of our larger branches operate in states impacted by winter weather and, as such, experience a slowdown in construction activity during inclement months. This winter slowdown contributes to traditionally lower sales and profitability in our first quarter.
Our industry is highly fragmented and competitive, and increased competitive pressure may adversely affect our business, financial condition, results of operations and cash flows.
The building products installation industry is highly fragmented and competitive. We face significant competition from other national, regional and local companies. Any of these competitors may: (i) foresee the
10
Table of Contents
course of market development more accurately than we do; (ii) offer services that are deemed superior to ours; (iii) install building products at a lower cost; (iv) develop stronger relationships with homebuilders and suppliers; (v) adapt more quickly to new technologies, new installation techniques or evolving customer requirements; or (vi) have access to financing on more favorable terms than we can obtain in the market. As a result, we may not be able to compete successfully with them. If we are unable to compete effectively, our business, financial condition, results of operations and cash flows may be adversely affected.
In the event that increased demand leads to higher prices for the products we install, we may have limited, if any, ability to pass on price increases in a timely manner or at all due to the fragmented and competitive nature of our industry.
Product shortages or the loss of key suppliers could affect our business, financial condition, results of operations and cash flows.
Our ability to offer a wide variety of products to our customers depends on our ability to obtain adequate product supply from manufacturers. We do not typically enter into long-term agreements with our suppliers but have done so from time to time. We have certain agreements that do not qualify as supply agreements due to a lack of a fixed price and/or lack of a fixed and determinable purchase quantity, but nonetheless may require us to purchase certain of our products from certain vendors, depending on the specific circumstances. Generally, our products are available from various sources and in sufficient quantities to meet our operating needs. However, the loss of, or a substantial decrease in the availability of, products from our suppliers or the loss of key supplier arrangements could adversely impact our business, financial condition, results of operations and cash flows. Historically, unexpected events, such as incapacitation of supplier facilities due to extreme weather or fire, have temporarily reduced manufacturing capacity and production. In addition, during prior economic downturns in the housing industry, manufacturers have reduced capacity by closing plants and production lines within plants. Even if such capacity reductions are not permanent, there may be a delay in manufacturers’ ability to increase capacity in times of rising demand. If the demand for products from manufacturers and other suppliers exceeds the available supply, we may be unable to source additional products in sufficient quantity or quality in a timely manner and the prices for the products that we install could rise. These developments could affect our ability to take advantage of market opportunities and limit our growth prospects. We continually evaluate our supplier relationships and at any given time may move some or all of our purchases from one or more of our suppliers. There can be no assurance that any such action would have its intended effect.
Failure by our suppliers to continue to provide us with products on commercially favorable terms, or at all, could have a material adverse effect on our operating margins, financial condition, operating results and/or cash flows. Our inability to source materials in a timely manner could also damage our relationships with our customers.
Changes in the costs of the products we install can decrease our profit margins.
The principal building products that we install have been subject to price changes in the past, some of which have been significant. Our results of operations for individual quarterly periods can be, and have been, adversely affected by a delay between when building product cost increases are implemented and when we are able to increase prices for our products and services, if at all. Our supplier purchase prices often depend on volume requirements. If we do not meet these volume requirements, our costs could increase and our margins may be adversely affected. In addition, while we have been able to achieve cost savings through volume purchasing and our relationships with suppliers, we may not be able to continue to receive advantageous pricing for the products that we install, which could have a material adverse effect on our financial condition, results of operations and cash flows.
We may be unable to successfully acquire and integrate other businesses and realize the anticipated benefits of acquisitions.
Acquisitions are a core part of our strategy and we may be unable to continue to grow our business through acquisitions. We may not be able to continue to identify suitable acquisition candidates and may face increased
11
Table of Contents
competition for these acquisition candidates. In addition, acquired businesses may not perform in accordance with expectations, and our business judgments concerning the value, strengths and weaknesses of acquired businesses may not prove to be correct. We may also be unable to achieve expected improvements or achievements in businesses that we acquire. At any given time, including currently, we may be evaluating or in discussions with one or more acquisition candidates, including entering into non-binding letters of intent. The value of our common stock following the completion of an acquisition could be adversely affected if we are unable to realize the expected benefits from the acquisition on a timely basis or at all. Future acquisitions may result in the incurrence of debt and contingent liabilities, legal liabilities, goodwill impairments, increased interest expense and amortization expense and significant integration costs. In addition, future acquisitions could result in dilution of existing stockholders if we issue shares of common stock as consideration.
Acquisitions involve a number of special risks, including:
| • | our inability to manage acquired businesses or control integration costs and other costs relating to acquisitions; |
| • | potential adverse short-term effects on operating results from increased costs, business disruption or otherwise; |
| • | diversion of management’s attention; |
| • | loss of suppliers, customers or other significant business partners of the acquired business; |
| • | failure to retain existing key personnel of the acquired business and recruit qualified new employees at the location; |
| • | failure to successfully implement infrastructure, logistics and systems integration; |
| • | potential impairment of goodwill and other intangible assets; |
| • | risks associated with the internal controls of acquired businesses; |
| • | exposure to legal claims for activities of the acquired business prior to acquisition and inability to realize on any indemnification claims, including with respect to environmental and immigration claims; |
| • | the risks inherent in the systems of the acquired business and risks associated with unanticipated events or liabilities; and |
| • | our inability to obtain financing necessary to complete acquisitions on attractive terms or at all. |
Our strategy could be impeded if we do not identify, or face increased competition for, suitable acquisition candidates and our business, financial condition, results of operations and cash flows could be adversely affected if any of the foregoing factors were to occur.
We may be unable to continue to realize the expected benefits of our acquisition of Alpha.
On January 5, 2017, we closed the acquisition of Alpha, our largest acquisition to date. Our expectations regarding the benefits of the Alpha acquisition were necessarily based on estimates and assumptions about the combined businesses, which may not materialize as we expect or which may prove to be inaccurate. The value of our common stock and results of our operations could be adversely affected if we are unable to realize the expected benefits from the acquisition within the expected timeframe or at all. As we continue to work to integrate Alpha into our business, we may face unexpected operational, strategic, financial or administrative challenges, including, without limitation:
| • | failure to successfully manage our increased business in the commercial construction end market; |
| • | difficulties incorporating Alpha into our existing internal control over financial reporting due to material weaknesses and significant deficiencies identified in Alpha’s internal control over financial reporting; |
12
Table of Contents
| • | discovery of material misstatements in the historical financial statements of Alpha resulting from material weaknesses and/or significant deficiencies in its internal control over financial reporting; |
| • | loss of employees, suppliers, customers or other significant business partners of Alpha as well as business disruption; and |
| • | an increase in our financing costs as a result of the indebtedness that we incurred in connection with the acquisition. |
Our continued expansion into the commercial construction end market following our acquisition of Alpha could affect our margins, financial condition, operating results and cash flows.
Following the completion of the Alpha acquisition, our revenues derived from the commercial construction end market have significantly increased on an absolute basis and as a percentage of our total revenues. While we expect such growth to continue as we expand our commercial construction end market business, we may face new or unexpected competitive, operational, financial and accounting challenges and other risks that differ from our current business and existing operations. For example, the typical contractual terms and arrangements and billing cycle for the commercial construction end market are different than the residential new construction end market. These factors and any other challenges we encounter could adversely affect our margins, financial condition, operating results and cash flows.
The amount of our goodwill and other intangible assets has significantly increased as a result of our acquisition of Alpha. If our goodwill and other intangible assets become impaired in the future, we may be required to record significant non-cash impairment charges, which would negatively affect our earnings and reduce stockholders’ equity.
We may be subject to claims arising from the operations of our various businesses for periods prior to the dates we acquired them.
We have consummated over 125 acquisitions. We may be subject to claims or liabilities arising from the ownership or operation of acquired businesses for the periods prior to our acquisition of them, including environmental, employee-related and other liabilities and claims not covered by insurance. These claims or liabilities could be significant. Our ability to seek indemnification from the former owners of our acquired businesses for these claims or liabilities may be limited by various factors, including the specific time, monetary or other limitations contained in the respective acquisition agreements and the financial ability of the former owners to satisfy our indemnification claims. In addition, insurance companies may be unwilling to cover claims that have arisen from acquired businesses or locations, or claims may exceed the coverage limits that our acquired businesses had in effect prior to the date of acquisition. If we are unable to successfully obtain insurance coverage of third-party claims or enforce our indemnification rights against the former owners, or if the former owners are unable to satisfy their obligations for any reason, including because of their financial position, we could be held liable for the costs or obligations associated with such claims or liabilities, which could adversely affect our financial condition and results of operations.
Our success depends on our key personnel.
Our business results depend largely upon the continued contributions of our Chief Executive Officer and other members of our management team. We do not have employment agreements with any of our executive officers other than Jeff Edwards, our Chief Executive Officer and President. Although Mr. Edwards’ employment agreement requires him to devote the amount of time necessary to conduct our business and affairs, he is also permitted to engage in other business activities that do not create a conflict of interest or substantially interfere with his service to us, including non-competitive operational activities for his real estate development business. If we lose members of our management team, our business, financial condition and results of operations, as well as the market price of our securities, could be adversely affected.
13
Table of Contents
Our business results also depend upon our branch managers and sales personnel, including those of companies recently acquired. While we customarily sign non-competition agreements, which typically continue for two years following the termination of employment, with our branch managers and sales personnel in order to maintain key customer relationships in our markets, such agreements do not protect us fully against competition from former employees.
We are dependent on attracting, training and retaining qualified employees while controlling labor costs.
The labor market for the construction industry is tight and we have recently experienced higher employee-related costs. We must attract, train and retain a large number of qualified employees while controlling related labor costs. We compete with other businesses for these employees. Tighter labor markets may make it even more difficult for us to hire and retain installers and control labor costs. Our ability to control labor costs is subject to numerous external factors, including competitive wage rates and health and other insurance and benefit costs. A significant increase in competition, minimum wage or overtime rates in localities where we have employees could have a significant impact on our operating costs and may require that we take steps to mitigate such increases, all of which may cause us to incur additional costs, expend resources responding to such increases and lower our margins.
Higher health care costs and labor costs could adversely affect our business.
With the passage in 2010 of the U.S. Patient Protection and Affordable Care Act, or the Affordable Care Act, we are required to provide affordable coverage, as defined in the Affordable Care Act, to all employees, or otherwise be subject to a payment per employee based on the affordability criteria therein. These requirements and any future legislation could cause us to experience higher health care and labor costs in the future. Additionally, some states and localities have passed state and local laws mandating the provision of certain levels of health benefits by some employers. Increased health care and insurance costs could have an adverse effect on our business, financial condition and results of operations. In addition, changes in federal or state workplace regulations could adversely affect our ability to meet our financial targets.
Changes in employment laws may adversely affect our business.
Various federal and state labor laws govern the relationship with our employees and impact operating costs. These laws include:
| • | employee classification as exempt or non-exempt for overtime and other purposes; |
| • | workers’ compensation rates; |
| • | immigration status; |
| • | mandatory health benefits; |
| • | tax reporting; and |
| • | other wage and benefit requirements. |
We have a significant exposure to changes in laws governing our relationships with our employees, including wage and hour laws and regulations, fair labor standards, minimum wage requirements, overtime pay, unemployment tax rates, workers’ compensation rates, citizenship requirements and payroll taxes, which likely would have a direct impact on our operating costs. Significant additional government-imposed increases in the preceding areas could have a material adverse effect on our business, financial condition and results of operations.
In addition, various states in which we operate are considering or have already adopted new immigration laws or enforcement programs, and the U.S. Congress and Department of Homeland Security from time to time consider
14
Table of Contents
and implement changes to federal immigration laws, regulations or enforcement programs. These changes may increase our compliance and oversight obligations, which could subject us to additional costs and make our hiring process more cumbersome, or reduce the availability of potential employees. Although we verify the employment eligibility status of all our employees, including through participation in the “E-Verify” program where required, some of our employees may, without our knowledge, be unauthorized workers. Use of the “E-Verify” program does not guarantee that we will properly identify all applicants who are ineligible for employment. Unauthorized workers are subject to deportation and may subject us to fines or penalties and, if any of our workers are found to be unauthorized, we could experience adverse publicity that negatively impacts our brand and may make it more difficult to hire and retain qualified employees. Termination of a significant number of employees who were unauthorized employees may disrupt our operations, cause temporary increases in our labor costs as we train new employees and result in additional adverse publicity. We could also become subject to fines, penalties and other costs related to claims that we did not fully comply with all recordkeeping obligations of federal and state immigration laws. These factors could have a material adverse effect on our business, financial condition and results of operations.
Our results of operations, financial condition and cash flows could be adversely affected if pending or future legal claims against us are not resolved in our favor.
We are subject to various claims and lawsuits arising in the ordinary course of business, including wage and hour lawsuits. The ultimate resolution of these matters is subject to inherent uncertainties. It is possible that the costs to resolve these matters could have a material adverse effect on our results of operations, financial condition or cash flows for the periods in which the matters are resolved. Similarly, if additional claims are filed against us in the future, the negative outcome of one or more of such matters could have a material adverse effect on our results, financial condition and cash flows.
The nature of our business exposes us to product liability, workmanship warranty, casualty, negligence, construction defect, breach of contract and other claims and legal proceedings.
We are subject to product liability, workmanship warranty, casualty, negligence, construction defect, breach of contract and other claims and legal proceedings relating to the products we install that, if adversely determined, could adversely affect our financial condition, results of operations and cash flows. We rely on manufacturers and other suppliers to provide us with most of the products we install. Because we do not have direct control over the quality of such products manufactured or supplied by such third-party suppliers, we are exposed to risks relating to the quality of such products. In addition, we are exposed to potential claims arising from the conduct of our employees, homebuilders and other subcontractors, for which we may be contractually liable.
We have in the past been, and may in the future be, subject to fines, penalties and other liabilities in connection with injury or damage incurred in conjunction with the installation of our products. Although we currently maintain what we believe to be suitable and adequate insurance, we may be unable to maintain such insurance on acceptable terms or such insurance may not provide adequate protection against potential liabilities.
Product liability, workmanship warranty, casualty, negligence, construction defect, breach of contract and other claims and legal proceedings can be expensive to defend and can divert the attention of management and other personnel for significant periods of time, regardless of the ultimate outcome. In addition, lawsuits relating to construction defects typically have statutes of limitations that can run as long as ten years. Claims of this nature could also have a negative impact on customer confidence in us and our services. Current or future claims could have a material adverse effect on our reputation, business, financial condition and results of operations. For additional information, see Note 14, Commitments and Contingencies, to our audited consolidated financial statements included in this Form 10-K.
15
Table of Contents
In the ordinary course of business, we are required to obtain performance bonds and licensing bonds, the unavailability of which could adversely affect our business, financial condition, results of operations and/or cash flows.
We are often required to obtain performance bonds and licensing bonds to secure our performance under certain contracts and other arrangements. In addition, the commercial construction end market also requires higher levels of performance bonding.
Our ability to obtain performance bonds and licensing bonds primarily depends on our credit rating, capitalization, working capital, past performance, management expertise and certain external factors, including the overall capacity of the surety market and the underwriting practices of surety bond issuers. The ability to obtain performance bonds and licensing bonds can also be impacted by the willingness of insurance companies to issue performance bonds and licensing bonds. If we are unable to obtain performance bonds and licensing bonds when required, our business, financial condition, results of operations and/or cash flows could be adversely impacted.
Federal, state, local and other laws and regulations could impose substantial costs and/or restrictions on our operations that would reduce our net income.
We are subject to various federal, state, local and other laws and regulations, including, among other things, worker and workplace health and safety regulations promulgated by the U.S. Department of Transportation, or DOT, employment regulations promulgated by the U.S. Equal Employment Opportunity Commission and tax regulations promulgated by the Internal Revenue Service and various other state and local tax authorities. More burdensome regulatory requirements in these or other areas may increase our expenses and adversely affect our business, financial condition, results of operations and cash flows. Moreover, our failure to comply with the regulatory requirements applicable to our business could subject us to substantial fines and penalties that could adversely affect our business, financial condition, results of operations and cash flows.
Our transportation operations, which we depend on to transport materials from our locations to job sites, are subject to the regulatory jurisdiction of the DOT. The DOT has broad administrative powers with respect to our transportation operations. More restrictive limitations on vehicle weight and size, trailer length and configuration or driver hours of service would increase our costs, which may increase our expenses and adversely affect our financial condition, operating results and/or cash flows. If we fail to comply with DOT regulations or the regulations become more stringent, we could experience increased inspections, regulatory authorities could take remedial action, including imposing fines or shutting down our operations, and we could be subject to increased audit and compliance costs. We organize our transportation operations as a separate legal entity in certain states, including Ohio and Indiana, to take advantage of sales tax exemptions relating to vehicle operating costs. If legislation is enacted that modifies or eliminates these exemptions, our costs may increase. If any of these events were to occur, our financial condition, results of operations and cash flows may be adversely affected.
In addition, the residential construction and commercial construction industries are subject to various federal, state and local statutes, ordinances, rules and regulations concerning zoning, building design and safety, construction, contractors’ licensing, energy conservation and similar matters, including regulations that impose restrictive zoning and density requirements on the residential new construction industry or that limit the number of homes that can be built within the boundaries of a particular area. Regulatory restrictions and industry standards may require us to alter our installation processes and our sourcing, increase our operating expenses and limit the availability of suitable building lots for our customers, any of which could negatively affect our business, financial condition and results of operations.
We are subject to environmental regulation and potential exposure to environmental liabilities.
We are subject to various federal, state and local environmental laws and regulations. Although we believe that we operate our business, including each of our locations, in compliance with applicable laws and regulations and
16
Table of Contents
maintain all material permits required under such laws and regulations to operate our business, we may be held liable or incur fines or penalties in connection with such requirements. Certain types of insulation, particularly spray foam applications, require our employees to handle potentially hazardous or toxic substances. While our employees who handle these and other potentially hazardous or toxic materials, including lead-based paint, receive specialized training and wear protective clothing, there is still a risk that they, or others, may be exposed to these substances. Exposure to these substances could result in significant injury to our employees and others, including site occupants, and damage to our property or the property of others, including natural resource damage. Our personnel and others at our work sites are also at risk for other workplace-related injuries, including slips and falls. In addition, as owners and lessees of real property, we may be held liable for, among other things, hazardous or toxic substances, including asbestos or petroleum products on, at, under or emanating from currently or formerly owned or operated properties, or any off-site disposal locations, or for any known or newly discovered environmental conditions at or relating to any of our properties, including those arising from activities conducted by previous occupants or at adjoining properties, without regard to whether we knew of or were responsible for such release. We may be required to investigate, remove, remediate or monitor the presence or release of such hazardous or toxic substances or petroleum products. We may also be held liable for fines, penalties or damages, including for bodily injury, property damage and natural resource damage in connection with the presence or release of hazardous or toxic substances or petroleum products. In addition, expenditures may be required in the future as a result of releases of, or exposure to, hazardous or toxic substances or petroleum products, the discovery of currently unknown environmental conditions or changes in environmental laws and regulations or their interpretation or enforcement and, in certain instances, such expenditures may be material.
Increases in union organizing activity and work stoppages could delay or reduce availability of products that we install and increase our costs.
Less than one percent of our employees are currently covered by collective bargaining or other similar labor agreements. However, if a larger number of our employees were to unionize, including in the wake of any future legislation that makes it easier for employees to unionize, our business could be negatively affected. Any inability by us to negotiate collective bargaining arrangements could cause strikes or other work stoppages, and new contracts could result in increased operating costs. If any such strikes or other work stoppages occur, or if other employees become represented by a union, we could experience a disruption of our operations and higher labor costs.
In addition, certain of our suppliers have unionized work forces and certain of our products are transported by unionized truckers. Strikes or work stoppages could result in slowdowns or closures of facilities where the products that we install are manufactured or could affect the ability of our suppliers to deliver such products to us. Any interruption in the production or delivery of these products could delay or reduce availability of these products and increase our costs.
Increases in fuel costs could adversely affect our results of operations.
The price of oil has fluctuated over the last few years, creating volatility in our fuel costs. We do not currently hedge our fuel costs. Increases in fuel costs can negatively impact our cost to deliver our products to our customers and thus increase our cost of sales. If we are unable to increase the selling price of our products to our customers to cover any increases in fuel costs, net income may be adversely affected.
We may be adversely affected by disruptions in our information technology systems.
Our operations are dependent upon our information technology systems, including our web-enabled internal software technology, jobCORE. The jobCORE software provides in-depth operational and financial performance data from individual branch locations to the corporate office. We rely upon such information technology systems to manage customer orders on a timely basis, coordinate our sales and installation activities across locations and manage invoicing. As a result, the proper functioning of our information technology systems is critical to the
17
Table of Contents
successful operation of our business. Although our information technology systems are protected through physical and software safeguards, our information technology systems are still vulnerable to natural disasters, power losses, unauthorized access, delays and outages in our service, system capacity limits from unexpected increases in our volume of business, telecommunication failures, computer viruses and other problems. A substantial disruption in our information technology systems for any prolonged time period could result in delays in receiving inventory and supplies or installing our products on a timely basis for our customers, which could adversely affect our reputation and customer relationships.
In the event of a cybersecurity incident, we could experience operational interruptions, incur substantial additional costs, become subject to legal or regulatory proceedings or suffer damage to our reputation.
In addition to the disruptions that may occur from interruptions in our information technology systems, cybersecurity threats and sophisticated and targeted cyberattacks pose a risk to our information technology systems. We have established security policies, processes and defenses designed to help identify and protect against intentional and unintentional misappropriation or corruption of our information technology systems and information and disruption of our operations. Despite these efforts, our information technology systems may be damaged, disrupted or shut down due to attacks by unauthorized access, malicious software, computer viruses, undetected intrusion, hardware failures or other events, and in these circumstances our disaster recovery plans may be ineffective or inadequate. These breaches or intrusions could lead to business interruption, exposure of proprietary or confidential information, data corruption, damage to our reputation, exposure to legal and regulatory proceedings and other costs. Such events could have a material adverse impact on our financial condition, results of operations and cash flows. In addition, we could be adversely affected if any of our significant customers or suppliers experiences any similar events that disrupt their business operations or damage their reputation.
We maintain monitoring practices and protections of our information technology to reduce these risks and test our systems on an ongoing basis for potential threats. We carry cybersecurity insurance to help mitigate the financial exposure and related notification procedures in the event of intentional intrusion. There can be no assurance, however, that our efforts will prevent the risk of a security breach of our databases or systems that could adversely affect our business.
Because we operate our business through highly dispersed locations across the United States, our operations may be materially adversely affected by inconsistent practices and the operating results of individual branches may vary.
We operate our business through a network of highly dispersed locations throughout the United States, supported by executives and services at our corporate office, with local branch management retaining responsibility for day-to-day operations and adherence to applicable local laws. Our operating structure can make it difficult for us to coordinate procedures across our operations in a timely manner or at all. In addition, our branches may require significant oversight and coordination from our corporate office to support their growth. Inconsistent implementation of corporate strategy and policies at the local level could materially and adversely affect our overall profitability, business, results of operations, financial condition and prospects.
In addition, the operating results of an individual branch may differ from those of another branch for a variety of reasons, including market size, management practices, competitive landscape, regulatory requirements, state and local taxes and local economic conditions. As a result, certain of our branches may experience higher or lower levels of growth than other branches. Therefore, our overall financial performance and results of operations may not be indicative of the performance and results of operations of any individual branch.
18
Table of Contents
Restrictions in our credit agreement, or any other indebtedness we may incur in the future, could adversely affect our business, financial condition, results of operations, ability to make distributions to stockholders and the value of our common stock.
Our credit agreement, or any future credit facility we enter into or other indebtedness we incur, may limit our ability to, among other things:
| • | incur or guarantee additional debt; |
| • | make distributions or dividends on or redeem or repurchase shares of common stock; |
| • | make certain investments and acquisitions; |
| • | make capital expenditures; |
| • | incur certain liens or permit them to exist; |
| • | enter into certain types of transactions with affiliates; |
| • | acquire, merge or consolidate with another company; and |
| • | transfer, sell or otherwise dispose of all or substantially all of our assets. |
Our credit agreement contains, and any future credit facility or other debt instruments we may enter into may contain, covenants requiring us to maintain certain financial ratios and meet certain tests, such as a fixed charge coverage ratio, leverage ratio or debt to earnings ratio. See Item 7, Management’s Discussion and Analysis of Financial Condition and Results of Operations, Liquidity and Capital Resources, Credit and Security Agreement. Our ability to comply with those financial ratios and tests can be affected by events beyond our control, and we may not be able to comply with those ratios and tests when required to do so under the applicable debt instruments.
The provisions of our credit agreement, or other debt instruments, may affect our ability to obtain future financing and pursue attractive business opportunities and our flexibility in planning for, and reacting to, changes in business conditions. In addition, a failure to comply with the provisions of our credit agreement, any future credit facility or other debt instruments could result in a default or an event of default that could enable our lenders or other debt holders to declare the outstanding principal of that debt, together with accrued and unpaid interest, to be immediately due and payable. If the payment of our debt is accelerated, our assets may be insufficient to repay such debt in full, and our stockholders could experience a partial or total loss of their investment.
Our indebtedness exposes us to interest expense increases if interest rates increase.
As of December 31, 2017, $199.0 million of our borrowings were at variable interest rates and expose us to interest rate risk. If interest rates increase, our debt service obligations on the variable rate indebtedness would increase even though the amount borrowed would remain the same, and our net income and cash flows would correspondingly decrease. An increase of 100 basis points in the interest rates payable on our variable rate indebtedness would increase our annual interest expense by $2.0 million, based on our total variable interest rate indebtedness outstanding as of December 31, 2017.
We may require additional capital in the future, which may not be available on favorable terms or at all.
Our future capital requirements will depend on many factors, including industry and market conditions, our ability to successfully complete future business combinations and expansion of our existing operations. We anticipate that we may need to raise additional funds in order to grow our business and implement our business strategy. We anticipate that any such additional funds may be raised through equity or debt financings. Any equity or debt financing, if available at all, may be on terms that are not favorable to us and will be subject to
19
Table of Contents
changes in interest rates and the capital markets environment. Even if we are able to raise capital through equity or debt financings, as to which there can be no assurance, the interest of existing stockholders in our company may be diluted, and the securities we issue may have rights, preferences and privileges that are senior to those of our common stock or may otherwise materially and adversely affect the holdings or rights of our existing stockholders. If we cannot obtain adequate capital, we may not be able to fully implement our business strategy and our business, results of operations and financial condition could be adversely affected.
RISKS RELATED TO OWNERSHIP OF OUR COMMON STOCK
The price of our common stock may fluctuate substantially and your investment may decline in value.
The market price of our common stock may be significantly affected by factors, such as:
| • | market conditions affecting the residential construction, commercial construction and building products industries; |
| • | quarterly variations in our results of operations; |
| • | changes in government regulations; |
| • | the announcement of acquisitions by us or our competitors; |
| • | changes in general economic and political conditions; |
| • | volatility in the financial markets; |
| • | results of our operations and the operations of others in our industry; |
| • | changes in interest rates; |
| • | threatened or actual litigation and government investigations; |
| • | the addition or departure of key personnel; |
| • | actions taken by our stockholders, including the sale or disposition of their shares of our common stock; and |
| • | differences between our actual financial and operating results and those expected by investors and analysts and changes in analysts’ recommendations or projections. |
These and other factors may lower the market price of our common stock, regardless of our actual operating performance.
Furthermore, in recent years the stock market has experienced significant price and volume fluctuations. This volatility has had a significant impact on the market price of securities issued by many companies, including companies in our industry. The changes frequently appear to occur without regard to the operating performance of the affected companies. Hence, the price of our common stock could fluctuate based upon factors that have little or nothing to do with us, and these fluctuations could materially reduce the price of our common stock and materially affect the value of your investment.
We are no longer an “emerging growth company” and, as a result, we will have to comply with increased disclosure and governance requirements.
Because the market value of our common stock held by non-affiliates exceeded $700 million as of June 30, 2016, we were deemed a large accelerated filer as of December 31, 2016 and, accordingly, we no longer qualify as an emerging growth company. As a large accelerated filer, we are subject to certain requirements that apply to other public companies but did not previously apply to us. These requirements include:
| • | compliance with the auditor attestation requirements in the assessment of our internal control over financial reporting; |
20
Table of Contents
| • | compliance with any requirement that may be adopted by the Public Company Accounting Oversight Board; |
| • | full disclosure obligations regarding executive compensation; and |
| • | compliance with the requirements of holding a nonbinding advisory vote on executive compensation and stockholder approval of any golden parachute payments not previously approved. |
Failure to comply with these requirements could subject us to enforcement actions by the SEC, divert management’s attention, damage our reputation and adversely affect our business, results of operations and financial condition.
We expect that compliance with the additional requirements of being a large accelerated filer will continue to require higher legal and financial compliance costs and make some activities more time consuming and costly.
Our internal controls over financial reporting may not be effective, which could have a significant and adverse effect on our business and reputation.
As a public company, we are required to comply with the SEC’s rules implementing Sections 302 and 404 of the Sarbanes-Oxley Act, which require management to certify financial and other information in our quarterly and annual reports and provide an annual management report on the effectiveness of controls over financial reporting.
To comply with the requirements of being a public company, we may undertake various actions, such as implementing additional internal controls and procedures and hiring additional accounting or internal audit staff. Testing and maintaining internal controls can divert our management’s attention from other matters that are important to the operation of our business. If we identify material weaknesses in our internal controls over financial reporting or are unable to comply with the requirements of Section 404 or are unable to assert that our internal controls over financial reporting are effective, investors may lose confidence in the accuracy and completeness of our financial reports and the market price of our common stock could be negatively affected, and we could become subject to investigations by the SEC or other regulatory authorities, which could require additional financial and management resources.
Future sales of our common stock, or the perception in the public markets that these sales may occur, may depress our stock price.
The market price of our common stock could decline significantly as a result of sales of a large number of shares of our common stock. These sales, or the perception that these sales might occur, could depress the market price of our common stock or make it more difficult for us to sell equity securities in the future at a time and at a price that we deem appropriate.
We have approximately 31.9 million shares of common stock outstanding as of December 31, 2017. The shares of common stock are freely tradable, except for any shares of common stock that may be held or acquired by our directors, executive officers and other affiliates, the sale of which will be restricted under the Securities Act of 1933, as amended, or the Securities Act. As of December 31, 2017, approximately 2.6 million of the 3.0 million shares of common stock authorized for issuance under the 2014 Omnibus Incentive Plan were available for issuance. These shares will become eligible for sale in the public market in the future, subject to certain legal and contractual limitations. If our existing stockholders sell substantial amounts of our common stock in the public market, or if the public perceives that such sales could occur, this could have an adverse impact on the market price of our common stock, even if there is no relationship between such sales and the performance of our business.
TCI Holdings, LLC (“TCI”), an entity managed by one of our directors, has pledged 600,000 shares of our common stock to secure a loan made by a financial institution to TCI. Depending on the occurrence of certain events relating to this financial obligation, TCI may experience a foreclosure or margin call that could result in the sale of these pledged shares, in the open market or otherwise. Such sales could adversely affect the market and trading price of our common stock. Also, in the future, we may issue shares of our common stock in
21
Table of Contents
connection with investments or acquisitions. The amount of shares of our common stock issued in connection with an investment or acquisition could constitute a material portion of our then-outstanding shares of our common stock.
Jeff Edwards has significant ownership of our common stock and may have interests that conflict with those of our other stockholders.
As of December 31, 2017, Jeff Edwards beneficially owns approximately 24.4% of our outstanding common stock. As a result of his beneficial ownership of our common stock, he has sufficient voting power to significantly influence all matters requiring stockholder approval, including the election of directors, amendment of our amended and restated certificate of incorporation and approval of significant corporate transactions, and he has significant influence over our management and policies. This concentration of voting power may have the effect of delaying or preventing a change in control of us or discouraging others from making tender offers for our shares of common stock, which could prevent stockholders from receiving a premium for their shares of common stock. These actions may be taken even if other stockholders oppose them. The interests of Jeff Edwards may not always coincide with the interests of other stockholders, and he may act in a manner that advances his best interests and not necessarily those of our other stockholders. In addition, under our amended and restated certificate of incorporation, Jeff Edwards is permitted to pursue corporate opportunities for himself, rather than for us.
Capped call transactions that were entered into by parties affiliated with Jeff Edwards and that become exercisable and expire on April 16, 2018 may affect the value of our common stock.
Certain of our stockholders entered into a capped call agreement with the underwriters of the secondary offering of our common stock completed on June 17, 2014. This agreement provided these stockholders with an option to call from the underwriters a total of approximately 1.0 million shares of our common stock at a capped price, with settlement required to be made in cash. During the second quarter of 2016, these stockholders exercised the call option with respect to approximately 0.7 million of these underlying shares. In addition, in the fourth quarter of 2016, these stockholders simultaneously cancelled the remaining portion of the call option and purchased a new call option from the underwriters. The new capped call agreement provides these stockholders with the option to call from the underwriters a total of approximately 0.4 million shares of our common stock at a capped price. The option becomes exercisable and expires on April 16, 2018 and will be settled in cash. The capped call agreement is between these stockholders and the underwriters and does not represent compensation to the stockholders for services rendered to us. The price paid for the option represents the fair value of that transaction and we are not a party to the agreement. In connection with establishing its initial hedge of the capped call transactions, the option counterparty (or one of its affiliates) purchased shares of our common stock.
In addition, the option counterparty (or one of its affiliates) may modify its hedge position by entering into or unwinding various derivatives with respect to our common stock and/or purchasing or selling common stock or other securities of ours in secondary market transactions from time to time. This activity could also cause or mitigate an increase or decrease in the market price of our common stock. We cannot predict what effect the capped call transactions could have on the price of our common stock.
Provisions of our charter documents and Delaware law could delay, discourage or prevent an acquisition of us, even if the acquisition would be beneficial to our stockholders, and could make it more difficult for our stockholders to change our management.
Our amended and restated certificate of incorporation and bylaws may discourage, delay or prevent a merger, acquisition or other change in control that stockholders may consider favorable, including transactions in which stockholders might otherwise receive a premium for their shares of our common stock. In addition, these provisions may frustrate or prevent any attempt by our stockholders to replace or remove our current management by making it more difficult to replace or remove members of our board of directors. These provisions include the following:
| • | a classified board of directors with three-year staggered terms; |
22
Table of Contents
| • | no cumulative voting in the election of directors, which limits the ability of minority stockholders to elect director candidates; |
| • | the exclusive right of our board of directors to fill a vacancy created by the expansion of the board of directors or the resignation, death or removal of a director, which prevents stockholders from being able to fill vacancies on our board of directors; |
| • | the ability of our board of directors to authorize the issuance of shares of preferred stock and to determine the price and other terms of those shares, including preferences and voting rights, without stockholder approval, which could be used to significantly dilute the ownership of the holders of our stock or a hostile acquirer; |
| • | a prohibition on stockholder action by written consent, which forces stockholder action to be taken at an annual or special meeting of our stockholders; |
| • | a requirement that a special meeting of stockholders may be called only by a resolution duly adopted by our board of directors; and |
| • | advance notice procedures that stockholders must comply with in order to nominate candidates to our board of directors or to propose matters to be acted upon at a stockholders’ meeting, which may discourage or deter a potential acquirer from conducting a solicitation of proxies to elect the acquirer’s own slate of directors or otherwise attempting to obtain control of us. |
In addition, we are subject to Section 203 of the Delaware General Corporation Law, which generally prohibits a Delaware corporation from engaging in any of a broad range of business combinations with a stockholder owning 15% or more of such corporation’s outstanding voting stock for a period of three years following the date on which such stockholder became an “interested” stockholder. In order for us to consummate a business combination with an “interested” stockholder within three years of the date on which the stockholder became “interested,” either (1) the business combination or the transaction that resulted in the stockholder becoming “interested” must be approved by our board of directors prior to the date the stockholder became “interested,” (2) the “interested” stockholder must own at least 85% of our outstanding voting stock at the time the transaction commences (excluding voting stock owned by directors who are also officers and certain employee stock plans) or (3) the business combination must be approved by our board of directors and authorized by at least two-thirds of our stockholders (excluding the “interested” stockholder). This provision could have the effect of delaying or preventing a change of control, whether or not it is desired by or beneficial to our stockholders. Any delay or prevention of a change of control transaction or changes in our board of directors and management could deter potential acquirers or prevent the completion of a transaction in which our stockholders could receive a substantial premium over the then-current market price for their shares of our common stock.
We do not expect to pay any dividends in the foreseeable future.
We intend to retain our future earnings, if any, in order to reinvest in the development and growth of our business and, therefore, do not intend to pay dividends on our common stock for the foreseeable future. Any future determination to pay dividends will be at the discretion of our board of directors and will depend on our financial condition, results of operations, capital requirements, the limits imposed by the terms of our credit agreement, or any then-existing debt instruments, and such other factors as our board of directors deems relevant. Accordingly, investors in our common stock may need to sell their shares to realize a return on their investment in our common stock, and investors may not be able to sell their shares at or above the prices paid for them.
If securities analysts do not publish favorable reports about us or if we, or our industry, are the subject of unfavorable commentary, the price of our common stock could decline.
The trading price for our common stock depends in part on the research and reports about us that are published by analysts in the financial industry. Analysts could issue negative commentary about us or our industry, or they could downgrade our common stock. We may also not receive sufficient research coverage or visibility in the market. Any of these factors could result in the decline of the trading price of our common stock, causing investors in our common stock to lose all or a portion of their investment.
23
Table of Contents
| Item 1B. | Unresolved Staff Comments |
None.
| Item 2. | Properties |
Real Property
We lease office and warehouse space in 38 states, including our corporate office in Columbus, Ohio. Our leases are typically short in duration with customary extensions at our option. We also own one adjoining property in Mars, Pennsylvania. We believe suitable alternative space is available in all of our markets. The table below summarizes our locations as of December 31, 2017.
| * | Includes one owned property. |
Our Fleet
As of December 31, 2017, our fleet consisted of approximately 3,750 total vehicles that we either leased or owned, including approximately 3,500 installation vehicles, which our installers use to deliver and install products from our locations to job sites, and approximately 250 other vehicles that are utilized by our sales staff, branch managers and various senior management personnel. For additional information, see Note 6, Long-Term Debt, and Note 14, Commitments and Contingencies, to our audited consolidated financial statements included in this Form 10-K.
| Item 3. | Legal Proceedings |
We are involved in various claims and lawsuits incidental to the conduct of our business in the ordinary course, including wage and hour lawsuits. We carry insurance coverage that we believe to be reasonable under the circumstances, although insurance may or may not cover any or all of our liabilities in respect to claims and lawsuits. While management currently believes that the ultimate resolution of these matters, individually or in the aggregate, will not have a material adverse effect on our consolidated financial position, results of operations or cash flows, such matters are subject to inherent uncertainties.
| Item 4. | Mine Safety Disclosures |
Not applicable.
24
Table of Contents
PART II
| Item 5. | Market for Registrant’s Common Equity, Related Stockholder Matters and Issuer Purchases of Equity Securities |
Market Information for Common Stock
Our common stock is traded on the NYSE under the symbol “IBP.” The following table sets forth, for the periods indicated, high and low sales prices for our common stock as reported by the NYSE:
| 2017 |
High | Low | ||||||
| First Quarter |
$ | 53.00 | $ | 40.05 | ||||
| Second Quarter |
$ | 55.40 | $ | 46.75 | ||||
| Third Quarter |
$ | 65.55 | $ | 50.95 | ||||
| Fourth Quarter |
$ | 79.20 | $ | 59.85 | ||||
| 2016 |
High | Low | ||||||
| First Quarter |
$ | 27.09 | $ | 17.60 | ||||
| Second Quarter |
$ | 36.30 | $ | 25.78 | ||||
| Third Quarter |
$ | 38.97 | $ | 30.16 | ||||
| Fourth Quarter |
$ | 44.28 | $ | 30.80 | ||||
Holders of Record
As of February 20, 2018, there were 176 holders of record of our common stock, one of which was Cede & Co., which is the holder of shares held through the Depository Trust Company.
Dividend Policy
During the years ended December 31, 2017, 2016 and 2015, we did not declare or pay any cash dividends on our capital stock. We currently do not anticipate paying dividends for the foreseeable future. Any future determination relating to dividends will be made at the discretion of our board of directors and will depend on a number of factors, including our future earnings, capital requirements, financial condition, future prospects, contractual restrictions, legal requirements and other factors our board of directors may deem relevant.
25
Table of Contents
Stock Performance Graph
The table below compares the cumulative total shareholder return on our common stock with the cumulative total return of (i) the Russell 2000 Index (“Russell 2000”), (ii) the Standard & Poor’s Industrials Index (“S&P 500 Industrials”) and (iii) the S&P Smallcap 600 Index (“S&P Smallcap 600 ”). The graph assumes investments of $100 in our common stock and in each of the three indices and the reinvestment of dividends from February 13, 2014, the date of our initial public offering (“IPO”), through December 31, 2017.
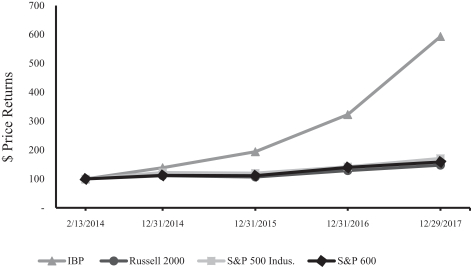
| 2/13/2014 | 12/31/2014 | 12/31/2015 | 12/31/2016 | 12/29/2017 | ||||||||||||||||
| IBP |
100 | 139 | 194 | 323 | 593 | |||||||||||||||
| Russell 2000 |
100 | 112 | 107 | 129 | 148 | |||||||||||||||
| S&P 500 Industrials |
100 | 123 | 120 | 142 | 171 | |||||||||||||||
| S&P Smallcap 600 |
100 | 113 | 111 | 140 | 159 | |||||||||||||||
Sale of Unregistered Securities
On January 5, 2017, we acquired all of the outstanding shares of Alpha. The purchase price for the acquisition was approximately $82.1 million in cash plus $21.7 million in contingent consideration, $10.9 million by issuing 282,577 shares of our common stock to two individuals who are the sole direct or indirect equityholders of the sellers of the acquired shares and seller obligations totaling $2.0 million. The common shares issued were not registered under the Securities Act of 1933, as amended, pursuant to Section 4(a)(2) of the Securities Act.
26
Table of Contents
The following table shows the stock repurchase activity for the three months ended December 31, 2017:
| Total Number of Shares Purchased1 |
Average Price Paid Per Share |
Total Number of Shares Purchased as Part of Publicly Announced Plans or Programs |
Maximum Number of Shares that May Be Purchased under the Plan or Programs |
|||||||||||||
| October 1—31, 2017 |
174 | $ | 63.90 | — | — | |||||||||||
| November 1—30, 2017 |
— | — | — | — | ||||||||||||
| December 1—31, 2017 |
— | — | — | — | ||||||||||||
|
|
|
|
|
|
|
|
|
|||||||||
| 174 | $ | 63.90 | — | — | ||||||||||||
|
|
|
|
|
|
|
|
|
|||||||||
| 1 | Consists of shares surrendered to the Company by employees to satisfy tax withholding obligations arising in connection with the vesting of 486 shares of restricted stock awarded under our 2014 Omnibus Incentive Plan. |
27
Table of Contents
| Item 6. | Selected Financial Data |
The following tables set forth selected historical consolidated financial data that should be read in conjunction with Item 7, Management’s Discussion and Analysis of Financial Condition and Results of Operations, and our consolidated financial statements and notes thereto included in Part II, Item 8, Financial Statements and Supplementary Data, of this Form 10-K. The Consolidated Statements of Operations and Comprehensive Income data for the years ended and the Consolidated Balance Sheets data as of December 31, 2017, 2016, 2015, 2014 and 2013 are derived from our audited consolidated financial statements. The selected historical consolidated financial data in this section is not intended to replace our historical consolidated financial statements and the related notes thereto. Our historical results are not necessarily indicative of future results.
| Years ended December 31, | ||||||||||||||||||||
| 2017 | 2016 | 2015 | 2014 | 2013 | ||||||||||||||||
| Statement of operations: |
||||||||||||||||||||
| (in thousands, except per share amounts) |
||||||||||||||||||||
| Net revenue |
$ | 1,132,927 | $ | 862,980 | $ | 662,719 | $ | 518,020 | $ | 431,929 | ||||||||||
| Cost of sales |
808,901 | 610,532 | 474,426 | 377,968 | 322,241 | |||||||||||||||
|
|
|
|
|
|
|
|
|
|
|
|||||||||||
| Gross profit |
324,026 | 252,448 | 188,293 | 140,052 | 109,688 | |||||||||||||||
| Operating expenses |
||||||||||||||||||||
| Selling |
58,450 | 49,667 | 37,702 | 30,951 | 25,509 | |||||||||||||||
| Administrative and other (1) |
191,310 | 136,731 | 105,639 | 83,515 | 71,101 | |||||||||||||||
|
|
|
|
|
|
|
|
|
|
|
|||||||||||
| Operating income |
74,266 | 66,050 | 44,952 | 25,586 | 13,078 | |||||||||||||||
| Other expense |
18,446 | 6,440 | 3,022 | 2,999 | 2,224 | |||||||||||||||
|
|
|
|
|
|
|
|
|
|
|
|||||||||||
| Income before income taxes |
55,820 | 59,610 | 41,930 | 22,587 | 10,854 | |||||||||||||||
| Income tax provision |
14,680 | 21,174 | 15,413 | 8,607 | 4,216 | |||||||||||||||
|
|
|
|
|
|
|
|
|
|
|
|||||||||||
| Net income |
41,140 | 38,436 | 26,517 | 13,980 | 6,638 | |||||||||||||||
| Discontinued Operations |
||||||||||||||||||||
| Loss from discontinued operations, net of tax |
— | — | — | 48 | 598 | |||||||||||||||
|
|
|
|
|
|
|
|
|
|
|
|||||||||||
| Net income |
41,140 | 38,436 | 26,517 | 13,932 | 6,040 | |||||||||||||||
|
|
|
|
|
|
|
|
|
|
|
|||||||||||
| Accretion charges on redeemable preferred stock |
— | — | — | (19,897 | ) | (6,223 | ) | |||||||||||||
|
|
|
|
|
|
|
|
|
|
|
|||||||||||
| Net income (loss) |
$ | 41,140 | $ | 38,436 | $ | 26,517 | $ | (5,965 | ) | $ | (183 | ) | ||||||||
|
|
|
|
|
|
|
|
|
|
|
|||||||||||
| Net income (loss) per share (basic and diluted) |
$ | 1.30 | $ | 1.23 | $ | 0.85 | $ | (0.20 | ) | $ | (0.01 | ) | ||||||||
|
|
|
|
|
|
|
|
|
|
|
|||||||||||
| Balance sheet data: |
||||||||||||||||||||
| (in thousands) |
||||||||||||||||||||
| Cash |
$ | 62,510 | $ | 14,482 | $ | 6,818 | $ | 10,761 | $ | 4,065 | ||||||||||
| Total current assets |
$ | 354,942 | $ | 192,391 | $ | 150,232 | $ | 119,288 | $ | 95,512 | ||||||||||
| Property and equipment, net |
$ | 81,075 | $ | 67,788 | $ | 57,592 | $ | 39,370 | $ | 29,475 | ||||||||||
| Total assets |
$ | 738,746 | $ | 462,095 | $ | 373,572 | $ | 234,162 | $ | 191,070 | ||||||||||
| Total debt (2) |
$ | 359,722 | $ | 166,720 | $ | 143,677 | $ | 53,738 | $ | 50,059 | ||||||||||
| Mezzanine equity (3) |
$ | — | $ | — | $ | — | $ | — | $ | 136,848 | ||||||||||
| Total stockholders’ equity (deficit) |
$ | 210,528 | $ | 153,977 | $ | 114,483 | $ | 91,874 | $ | (71,429 | ) | |||||||||
| Total mezzanine equity and stockholders’ equity |
$ | 210,528 | $ | 153,977 | $ | 114,483 | $ | 91,874 | $ | 65,419 | ||||||||||
| (1) | Prior to November 1, 2013, Jeff Edwards served as a consultant and non-employee officer to us. The costs of Jeff Edwards’ services were paid through various management agreements. In anticipation of our IPO and with a view towards operating as a public company, we entered into an employment agreement with Jeff Edwards on November 1, 2013, as amended, that pays Mr. Edwards a minimum annual base salary of |
28
Table of Contents
| $0.6 million and provides him an opportunity to participate in the Company’s annual incentive and benefit programs. Compensation paid by us to Mr. Edwards since November 1, 2013 has been recorded as an administrative expense in our consolidated statement of operations. |
| (2) | Total debt consists of current and long-term portions of long-term debt, capital lease obligations and vehicle financing arrangements. For the year ended December 31, 2016, we adopted Accounting Standards Update (“ASU”) 2015-03 which resulted in a retrospective reclassification of $0.5 million of debt issuance costs related to our long-term debt from other non-current assets to long-term debt as of December 31, 2015. No debt issuance costs were reclassified for the year ended December 31, 2014 due to immateriality of the portion to be reclassified. No debt issuance costs were required to be reclassified for the year ended December 31, 2013 due to the nature of existing debt as of those dates. |
| (3) | Consists of Series A Preferred Stock, $0.01 par value per share (the “Redeemable Preferred Stock”) and Redeemable Common Stock. This treatment was no longer required as of the date of our IPO in February 2014. |
| Item 7. | Management’s Discussion and Analysis of Financial Condition and Results of Operations |
You should read the following in conjunction with the consolidated financial statements and related notes thereto included in Item 8, Financial Statements and Supplemental Data, of Part II of this Form 10-K. This discussion contains forward-looking statements reflecting current expectations that involve risks and uncertainties. Actual results and the timing of events may differ materially from those contained in these forward-looking statements due to a number of factors, including those discussed in the section captioned “Risk Factors” and elsewhere in this Form 10-K.
OVERVIEW
We are one of the nation’s largest insulation installers for the residential new construction market and are also a diversified installer of complementary building products including waterproofing, fire-stopping and fireproofing, garage doors, rain gutters, shower doors, closet shelving, mirrors and other products throughout the United States. We offer our portfolio of services for new and existing single-family and multi-family residential and commercial building projects in all 48 continental states and the District of Columbia from our national network of over 125 branch locations. Substantially all of our net revenue comes from service-based installation of these products in the residential new construction, repair and remodel and commercial construction end markets. We believe our business is well positioned to continue to profitably grow due to our strong balance sheet, liquidity and our continuing acquisition strategy.
A large portion of our net revenue comes from the U.S. residential new construction market, which depends upon a number of economic factors including demographic trends, interest rates, consumer confidence, employment rates, housing inventory levels, foreclosure rates, the health of the economy and availability of mortgage financing. The strategic acquisitions of multiple companies over the last several years contributed meaningfully to our 31.3% increase in net revenue during the year ended December 31, 2017 compared to 2016.
The recently passed Tax Cuts and Jobs Act has added additional momentum to the economic landscape. While there have been concerns about the impact of the new tax law on housing, initial readings and reviews are suggesting that it is generally stimulative to the economy. In addition, concerns about the reduction of the mortgage interest deduction, deductibility of real estate taxes, state taxes and local taxes seem to be offset by overall optimistic momentum around economic stability and growth. We may adjust our strategies based on housing demand and our performance in each of our markets.
2017 Highlights
Net revenues increased 31.3% or $269.9 million during 2017 compared to 2016, primarily driven by acquisitions and organic growth amongst our existing branches. Our acquisition of Alpha in January 2017 accounted for
29
Table of Contents
$116.1 million of the increase and expanded our market position in commercial insulation installation and strengthened our complementary installed product offerings in waterproofing, fire-stopping and fireproofing. During 2017, we maintained momentum in our acquisition strategy, as we completed ten acquisitions, not including multiple insignificant tuck-in acquisitions merged into existing operations, which expanded our product line offerings and geographical reach. In April 2017, we entered into a term loan credit agreement which provides for a seven-year $300 million term loan facility and an asset-based lending credit agreement which provides for up to approximately $100 million. A portion of the proceeds from the Senior Secured Credit Facilities were used to repay, in full, all amounts outstanding under the previous credit and security agreement.
We believe there are several trends that should drive long-term growth in the housing market. These trends include an aging housing stock, population growth and household formation growth. These positive trends are reflected in Blue Chip’s February 2018 consensus forecast, which projects housing starts to increase from approximately 1.2 million in 2017 to approximately 1.3 million in 2018. We expect that our net revenue, gross profit and operating income will benefit from this growth.
2016 Highlights
Net revenue increased 30.2% or $200.3 million during 2016 compared to 2015, primarily driven by acquisitions and organic growth amongst our existing branches. During 2016, we completed nine acquisitions that expanded our footprint in certain markets. In February 2016, we amended and restated our previous credit Agreement and entered into a credit and security agreement that provided for a five-year senior secured credit facility in an aggregate principal amount of up to $325 million. A portion of the proceeds were used to pay off outstanding balances under the previous credit Agreement.
Sales performance
Net revenues increased $269.9 million, or 31.3%, in 2017 compared to 2016, and $200.3 million, or 30.2%, in 2016 compared to 2015.
Same branch sales1
Same branch net revenues increased during 2017 compared to 2016 due to a year-over-year increase in housing permits across the majority of our markets. Of the total revenue increase of $269.9 million in 2017, approximately $49.6 million was predominantly attributable to organic growth in the volume of completed jobs in all of our end markets, while $34.6 million resulted from a variety of factors including customer and product mix, market pricing variations and insulation volume requirement changes driven by building code requirements. Of the total revenue increase of $200.3 million in 2016, approximately $58.6 million was predominantly attributable to organic growth in the volume of completed jobs in all of our end markets, while $44.8 million resulted from a variety of factors including customer and product mix, market pricing variations and insulation volume requirement changes driven by building code requirements.
Acquisition branch sales2
Since 1999, our acquisition strategy has allowed us to generate significant scale, diversify our product offering and expand into many of the largest housing markets in the United States. We have pursued and expect to continue to pursue both geographic expansion as well as accretive acquisitions in existing markets. We expect to target acquisition candidates that meet our criteria, which often include a strong local reputation and high-quality management and labor force. Our acquisition strategy is also focused on using our national buying power, value-enhancing technology and proven operating platform to achieve operating efficiencies in our acquisitions.
| 1 | Represents sales for branch locations owned for greater than 12 months as of the financial statement date. |
| 2 | Represents sales for branch locations owned for less than 12 months as of the financial statement date. |
30
Table of Contents
Our 2017 acquisitions included Alpha, Columbia Shelving & Mirror Inc. and Charleston Shelving & Mirror, Inc. (together, “Columbia”), All In Insulation, LLC d/b/a Astro Insulation (“Astro”) and six additional businesses as well as multiple insignificant tuck-in acquisitions merged into existing operations. Alpha, purchased on January 5, 2017 for $116.7 million, and which recorded $116.1 million in sales in 2017, has expanded our market position in commercial insulation installation as well as strengthened our complementary installed product offerings in waterproofing, fire-stopping and fireproofing. Alpha allows us to serve large commercial markets throughout the United States, including Georgia, North Carolina, Tennessee, Florida and Texas. During 2017, Alpha expanded its geographical footprint to Oklahoma and Colorado. The acquisition of Columbia furthered our complementary installed product offerings in the South Carolina market, while our acquisition of Astro furthered our insulation presence in the Chicago market. Other acquisitions in 2017 expanded our market presence in insulation and other complementary product offerings throughout the United States.
Our 2016 acquisitions, which included Alpine Insulation Co., Inc. (“Alpine”), East Coast Insulators II, L.L.C. (“East Coast”), and seven additional businesses, expanded our market presence in insulation and other complimentary product offerings throughout the United States, with locations in Arizona, California, Indiana, Louisiana, Michigan, Texas, Virginia and Wisconsin.
Our 2015 acquisitions, which included BDI Insulation (“BDI”), C.Q. Insulation Inc. (“CQ”), Layman Brothers Contracting (“Layman”), Eastern Contractor Services (“Eastern”) and four additional businesses as well as one immaterial tuck-in acquisition merged into existing operations, expanded our market presence in insulation and other complimentary product offerings throughout the United States, with locations in California, Florida, Idaho, Kentucky, New Hampshire, New Jersey, New York, North Carolina, Texas, Vermont, Virginia, Utah and Washington.
Direct acquisition and integration costs totaled $3.9 million, $2.3 million and $1.1 million for the years ended December 31, 2017, 2016 and 2015, respectively, and are included in Administrative expenses on the Consolidated Statements of Operations and Comprehensive Income. We have in the past been, and may in the future be, subject to post-closing payment obligations under contracts we enter into with businesses we acquire.
Cost of sales and gross profit
Gross profit for 2017, 2016 and 2015 was as follows (dollars in thousands):
| 2017 | Change | 2016 | Change | 2015 | ||||||||||||||||
| Net revenues |
$ | 1,132,927 | 31.3 | % | $ | 862,980 | 30.2 | % | $ | 662,719 | ||||||||||
| Cost of sales |
808,901 | 32.5 | % | 610,532 | 28.7 | % | 474,426 | |||||||||||||
|
|
|
|
|
|
|
|||||||||||||||
| Gross profit |
$ | 324,026 | 28.4 | % | $ | 252,448 | 34.1 | % | $ | 188,293 | ||||||||||
|
|
|
|
|
|
|
|||||||||||||||
| Gross profit percentage |
28.6% | 29.3% | 28.4% | |||||||||||||||||
As a percent of net revenues, gross profit decreased during the year ended December 31, 2017 compared to the year ended December 31, 2016 attributable primarily to higher employee related costs, including costs associated with the implementation of financial wellness and longevity stock compensation plans. On a dollar basis, cost of sales included increases from acquired businesses of approximately $130.5 million. Approximately $33.8 million was predominantly attributable to organic growth in the volume of completed jobs in the residential new construction end market. Depreciation expense increased $4.4 million as a result of increased investment in vehicles and equipment to support our growth, including growth from acquisitions. Additionally, cost of sales increased $29.6 million as a result of a variety of factors, including customer and product mix, market pricing variations and insulation volume requirement changes driven by building code requirements. No factor was more significant than any other.
As a percent of net revenues, gross profit increased during the year ended December 31, 2016 compared to the year ended December 31, 2015, attributable to savings in materials and improved fuel prices and fuel utilization.
31
Table of Contents
In addition, in 2016 there were favorable changes in our customer and product mix, market pricing variations and insulation volume requirements that further contributed to the increased gross profit margin. On a dollar basis, cost of sales included increases from acquired businesses of approximately $68.4 million. Approximately $40.5 million was predominantly attributable to organic growth in the volume of completed jobs in the residential new construction end market. Depreciation expense increased $6.2 million as a result of increased investment in vehicles and equipment to support our growth, including growth from acquisitions. Additionally, cost of sales increased $21.0 million as a result of a variety of factors, including customer and product mix, market pricing variations and insulation volume requirement changes driven by building code requirements. No factor was more significant than any other.
Operating expenses
Operating expenses for 2017, 2016 and 2015 were as follows (dollars in thousands):
| 2017 | Change | 2016 | Change | 2015 | ||||||||||||||||
| Selling |
$ | 58,450 | 17.7 | % | $ | 49,667 | 31.7 | % | $ | 37,702 | ||||||||||
| Percentage of total net revenue |
5.2% | 5.8% | 5.7% | |||||||||||||||||
| Administrative |
$ | 164,453 | 31.1 | % | $ | 125,472 | 26.3 | % | $ | 99,375 | ||||||||||
| Percentage of total net revenue |
14.5% | 14.5% | 15.0% | |||||||||||||||||
| Amortization |
$ | 26,857 | 138.5 | % | $ | 11,259 | 79.7 | % | $ | 6,264 | ||||||||||
| Percentage of total net revenue |
2.4% | 1.3% | 0.9% | |||||||||||||||||
Selling
The dollar increase in selling expenses in 2017 was primarily driven by a year-over-year increase in selling wages and commissions, in the amounts of $3.1 million and $4.0 million, respectively, which supported both organic and acquisition-related growth. However, selling expense decreased 0.6% as a percentage of sales primarily due to selling leverage gained through increased commercial, multi-family and production-builder sales in which commission rates are typically less than those for local and regional residential builders. The increase in 2016 was primarily due to higher commissions, wages and benefits of $9.1 million, and increased bad debt costs of $2.0 million, both of which supported organic and acquisition-related growth.
Administrative
The increase in administrative expenses in 2017 was primarily due to an increase in wages and benefits in the amount of $25.3 million, which was attributable to acquisitions, stock compensation and to support our organic growth. In addition, our facility costs increased $4.8 million primarily due to leases from the facilities of acquired companies and expanded facilities to support our growth. During 2017, we saw our costs related to liability insurance increase due to overall growth, as well as an increase in our accounting and legal fees as a result of no longer qualifying as an emerging growth company. The increase in 2016 was primarily due to higher wages and benefits in the amount of $15.5 million, which was attributable to acquisitions and to support our organic growth and our facility costs increased $3.2 million primarily due to leases from the facilities of acquired companies.
Amortization
Amortization of intangibles attributable to acquisitions increased $15.6 million and $5.0 million in 2017 and 2016, respectively. A significant portion of the increase in amortization in 2017, $13.6 million, relates to intangibles acquired through the acquisition of Alpha in January 2017, of which $9.1 million is related to amortization of acquired backlog which amortizes over a 1.5-year amortization period through June 2018. Our intangible assets include non-competes, customer listings, tradenames and backlog.
32
Table of Contents
Other expense/(income)
Other expense/(income) net for 2017, 2016 and 2015 was as follows (dollars in thousands):
| 2017 | Change | 2016 | Change | 2015 | ||||||||||||||||
| Interest expense |
$ | 17,381 | 181 | % | $ | 6,177 | 65 | % | $ | 3,738 | ||||||||||
| Other |
1,065 | 305 | % | 263 | 137 | % | (716 | ) | ||||||||||||
|
|
|
|
|
|
|
|||||||||||||||
| Total other expense/(income) |
$ | 18,446 | 186 | % | $ | 6,440 | 113 | % | $ | 3,022 | ||||||||||
|
|
|
|
|
|
|
|||||||||||||||
The year-over-year increase in other expense/(income) during 2017 and 2016 was primarily a result of an increase in interest expense due to year-over-year increased debt levels associated with the Senior Secured Credit Agreement to support acquisition-related growth. In addition, we recorded $1.8 million in interest expense related to the November 30, 2017 modification/extinguishment of the Term Loan. See Note 6 to our audited consolidated financial statements included in this Form 10-K for further information regarding debt balances and Term Loan modification/extinguishment.
Income tax provision
Income tax provision and effective tax rates for 2017, 2016 and 2015 were as follows (dollars in thousands):
| 2017 | 2016 | 2015 | ||||||||||
| Income tax provision |
$ | 14,680 | $ | 21,174 | $ | 15,413 | ||||||
| Effective tax rate |
26.3% | 35.5% | 36.8% | |||||||||
During the year ended December 31, 2017, our tax rate was favorably impacted by excess tax benefits from share-based compensation arrangements, the statute expiring for various uncertain tax positions and the revaluation of our net deferred liabilities due to tax reform. During the year ended December 31, 2016, our tax rate was favorably impacted by a decrease to the state income tax rate. During the year ended December 31, 2015, our tax rate was favorably impacted by a non-taxable bargain purchase gain, which was offset by an increase in the state income tax rate and various other unfavorable permanent items.
For each of the years ended December 31, 2017, 2016 and 2015 our tax rate was favorably impacted by deductions related to domestic production activities and usage of net operating losses for a tax filing entity which previously had a full valuation allowance. This favorable impact was offset by separate tax filing entities in a loss position for which a full valuation allowance will be accounted for against the losses, causing no tax benefit to be recognized on the losses and various other unfavorable permanent items.
Impacts of the Tax Cuts and Jobs Act
The Tax Cuts and Jobs Act (the “Tax Act”) was enacted on December 22, 2017. The Act reduces the U.S. federal corporate tax rate from 35% to 21%, which had a positive impact on our 2017 effective tax rate due to the revaluation of our ending net deferred tax liabilities, and we expect it will have a positive impact on our effective tax rate in 2018 and subsequent years.
Income tax expense decreased $3.4 million for the year ended December 31, 2017, compared to 2016, due to the impact of the Tax Act. The Company recognized a $3.8 million tax benefit as a result of revaluing the ending net deferred tax liabilities from 35% to the newly enacted U.S. corporate income tax rate of 21%, which was partially offset by tax expense of $0.4 million related to the revaluation of the uncertain tax positions and the valuation allowance. Potential future offsets to the lower federal corporate tax rate under the Tax Act include the impacts of the potential loss of the domestic production activities deduction as well as the loss of certain employee expense-related deductions.
We have recognized the tax impacts related to the revaluation of deferred tax assets and liabilities and included these amounts in our consolidated financial statements for the year ended December 31, 2017. The
33
Table of Contents
ultimate impact may differ from these provisional amounts, possibly materially, due to, among other things, additional analysis, changes in interpretations and assumptions we have made, additional regulatory guidance that may be issued, and actions we may take as a result of the Tax Act.
KEY FACTORS AFFECTING OUR OPERATING RESULTS
Trends in the construction industry
Our operating results may vary based on the amount and type of products we install and the mix of our end markets among new single-family, multi-family and commercial builders and owners of existing homes. Forecasts issued by various third-party industry sources suggest a higher rate of growth in single-family new home construction compared to that for multi-family new home construction over the next couple of years. We expect to benefit from this shift in mix as our net revenue per single-family completion is higher than our net revenue per multi-family unit completion. In addition, our total net revenue from single-family completions is higher than from multi-family completions. Over the next couple of years, we expect to benefit from the continued growth of large homebuilders as well as regional and local builders and individual lot owners. We maintain a mix of business among all types of homebuilders ranging from small custom builders to large regional and national homebuilders as well as a wide range of commercial builders. Net revenue derived from our ten largest homebuilder customers in the United States was approximately 14% for the year ended December 31, 2017. The residential new construction and repair and remodel markets represented approximately 83%, 88% and 89% of our total net revenue for the years ended December 31, 2017, 2016 and 2015, respectively, with the remaining portion attributable to the commercial construction end market. In addition, the residential repair and remodel market represented approximately 7%, 8% and 8% of our total net revenue for the years ended December 31, 2017, 2016 and 2015, respectively.
Material costs
We purchase the materials that we install primarily from manufacturers. The supply of materials we install was impacted during the fourth quarter of 2017, resulting in insulation material allocation throughout the industry and, as a result, increased market pricing in 2018. This increased market pricing could impact our results of operations, to the extent that price increases cannot be passed on to our customers.
Labor costs
Our business is labor intensive. As of December 31, 2017, we had approximately 6,900 employees, most of whom work as installers on local construction sites. As the housing market continues to recover, labor markets continue to tighten as the demand increases for installers. We expect to spend more to hire, train and retain installers to support our growing business in 2018, as tight labor availability continues within the construction industry. We offer a comprehensive benefits package, which many of our local competitors are not able to provide, which will increase costs as we hire additional personnel. Our workers’ compensation costs also continue to increase as we increase our coverage for additional personnel. With the enactment in 2010 of the U.S. Patient Protection and Affordable Care Act, or the Affordable Care Act, we are required to provide affordable coverage, as defined in the Affordable Care Act, to all employees, or otherwise be subject to a payment per employee based on the affordability criteria therein. Therefore, health care costs are expected to increase proportionately with increases in the labor force.
Other factors
We expect our selling and administrative expenses to continue to increase as our business grows, which could impact our future operating profitability.
34
Table of Contents
INFLATION
Our performance is dependent to a significant extent upon the levels of U.S. residential new construction spending, which is affected by factors such as interest rates, inflation, consumer confidence and unemployment. We do not believe that inflation has had a material impact on our business, financial condition or results of operations up to this point in the housing recovery.
SEASONALITY
We tend to have higher sales during the second half of the year as our homebuilder customers complete construction of homes placed under contract for sale in the traditionally stronger spring selling season. In addition, some of our larger branches operate in states impacted by winter weather and as such experience a slowdown in construction activity during the first quarter of the calendar year. This winter slowdown contributes to traditionally lower sales and profitability in our first quarter. See Item 1, Business, for further information.
LIQUIDITY AND CAPITAL RESOURCES
Our primary capital requirements are to fund working capital needs, operating expenses, acquisitions and capital expenditures and meet required principal and interest payments. Our capital resources primarily consist of cash from operations and borrowings under our credit agreement and capital equipment leases and loans. Our investments consist of highly liquid instruments including primarily corporate bonds and commercial paper. As of December 31, 2017, we had no outstanding borrowings under our ABL Revolver (as defined below) and our borrowing availability was $100.0 million prior to being reduced by outstanding letters of credit of $17.9 million.
Our acquisition of Alpha, which was completed on January 5, 2017, required us to commit significant resources to the acquisition and ongoing support of Alpha’s business. This acquisition was funded by drawing on the credit facility in existence at that time.
We believe that our cash flows from operations, combined with our current cash levels and available borrowing capacity, will be adequate to support our ongoing operations and to fund our debt service requirements, capital expenditures and working capital for at least the next 12 months as evidenced by our net positive cash flows from operations for the years ended December 31, 2017, 2016 and 2015.
The following table presents selected financial information as of and for the years ended December 31, 2017, 2016 and 2015 (in thousands):
| 2017 | 2016 | 2015 | ||||||||||
| Cash, cash equivalents and investments |
$ | 92,563 | $ | 14,482 | $ | 6,818 | ||||||
| Property, plant and equipment, net |
81,075 | 67,788 | 57,592 | |||||||||
| Total term debt |
347,577 | 151,427 | 123,235 | |||||||||
| Capital lease obligation |
12,145 | 15,293 | 20,442 | |||||||||
| Working capital |
195,136 | 62,286 | 52,810 | |||||||||
| Cash provided by operating activities |
68,772 | 73,266 | 34,547 | |||||||||
| Cash used in investing activities |
(200,443 | ) | (79,597 | ) | (111,365 | ) | ||||||
| Cash provided by financing activities |
179,699 | 13,995 | 72,875 | |||||||||
Senior Secured Credit Agreement
On April 13, 2017, we entered into a $300 million, seven-year term loan facility, which amortizes in quarterly principal payments of $0.8 million. Concurrently, we also entered into an asset-based lending credit agreement providing for a revolving line of credit of up to approximately $100 million and up to $50 million for the issuance of letters of credit. All obligations under the Senior Secured Credit Facilities, and the guarantees of
35
Table of Contents
those obligations, are secured by substantially all of the assets of the Company and the guarantors subject to certain exceptions and permitted liens. Our term loan and asset-based lending credit agreement bear interest at either the Eurodollar rate (“LIBOR”) or the base rate (which approximated the prime rate), at our election, plus a margin based on the type of rate applied and leverage ratio: (i) the Term Loan Agreement margin will be (A) 2.50% in the case of Eurodollar rate loans and (B) 1.50% in the case of base rate loans, and (ii) the ABL Facility margin will be (A) 1.25%, 1.50% or 1.75% in the case of Eurodollar rate loans (based on a measure of availability under the ABL Facility) and (B) 0.25%, 0.50% or 0.75% in the case of base rate loans (based on a measure of availability under the ABL Facility). Proceeds from the Senior Secured Credit Facilities were used to repay in full all amounts outstanding under our previous credit and security agreement, dated as of February 29, 2016, by and between the Company and the lenders named therein.
The Term Loan was amended on November 30, 2017 (the “Amendment”) to refinance the total principal amount of the Term Loan outstanding under the Term Loan Agreement immediately prior to the effective date of the Amendment, or an aggregate principal amount of $299.3 million on substantially the same terms as the Initial Term Loan, except for (i) a decrease in the Applicable Margin (as defined in the Term Loan Agreement) applicable to the interest rates in the case of base rate and Eurodollar rate loans, (ii) an increase in the cap on permitted indebtedness related to capital expenditures other than capital lease obligations and (iii) the inclusion of a mechanism to establish an alternative Eurodollar rate if certain circumstances have arisen such that the London Interbank Offered Rate may no longer be used.
At December 31, 2017, we were in compliance with all applicable covenants under the Senior Secured Credit Agreements. See Note 6 to our audited consolidated financial statements included in this Form 10-K for more information regarding our Senior Secured Credit Facilities, including information pertaining to applicable covenants.
Vehicle and Equipment Notes
We have financing loan agreements with various lenders to provide financing for the purpose of purchasing or leasing vehicles and equipment used in the normal course of business. Vehicles and equipment purchased or leased under each financing arrangement serve as collateral for the note applicable to such financing arrangement. Regular payments are due under each note for a period of typically 60 consecutive months after the incurrence of the obligation.
Total gross assets and respective outstanding loan balances relating to our master loan and equipment agreements were $74.5 million and $50.4 million as of December 31, 2017, respectively and $48.7 million and $38.2 million as of December 31, 2016, respectively. See Note 6 to our audited consolidated financial statements included in this Form 10-K for more information regarding our Master Loan and Security Agreement, Master Equipment Lease Agreement and Master Loan Agreements.
Letters of Credit and Bonds
We use letters of credit to secure our performance under our general liability and workers’ compensation insurance programs. As of December 31, 2017, we had $17.9 million of outstanding letters of credit and $0.3 million in cash securing our performance under these insurance programs. In January 2018, we posted $10.0 million into a trust to serve as additional collateral for our workers’ compensation and general liability policies. Beginning January 2018, this $10.0 million will be classified as restricted cash on our Consolidated Balance Sheets. We occasionally use performance bonds to ensure completion of our work on certain larger customer contracts that can span several months. As of December 31, 2017, we had 64 performance bonds outstanding, totaling approximately $29.9 million. Performance bonds generally do not have stated expiration dates; rather, we are released from the bonds as the contractual performance is completed. As of December 31, 2017, we had 387 permit and license bonds outstanding, totaling approximately $6.3 million. Permit and license bonds are typically issued for one year and are required by certain municipalities when we obtain licenses and permits to perform work in their jurisdictions.
36
Table of Contents
Historical cash flow information
Working capital
We carefully manage our working capital and operating expenses. As of December 31, 2017 and 2016, our working capital, including cash, was $195.1 million, or 17.2% of net revenue, and $62.3 million, or 7.2% of net revenue, respectively. The increase in working capital year-over-year in 2017 was driven primarily by a $48.0 million increase in cash and cash equivalents resulting from operating cash flows and loan activity and an increase of $30.1 million in short-term investments. In addition, the increase in accounts receivable and decrease in accounts payable, combined, accounted for only 1.3% of the total 10.0% increase as a percentage of revenue in working capital. We continue to look for opportunities to reduce our working capital as a percentage of net revenue.
Cash flows from operating activities
Net cash provided by operating activities was $68.8 million, $73.3 million and $34.5 million for the twelve months ended December 31, 2017, 2016 and 2015, respectively. Generally, the primary drivers of our cash flow from operations are operating income, adjusted for certain non-cash items, offset by cash payments for taxes and interest on our outstanding debt. Our cash flows from operations can be impacted by the timing of our cash collections on sales and collection of retainage amounts. In addition, cash flows are seasonally stronger in the third and fourth quarters as a result of increased construction activity.
Cash flows from investing activities
Business Combinations. In 2017, 2016 and 2015 we made cash payments, net of cash acquired, of $137.1 million, $53.3 million and $84.3 million, respectively on business combinations. Our acquisition of Alpha in January 2017 required an investing cash outlay of $103.8 million. See Note 15 to our audited consolidated financial statements included in this Form 10-K for more information regarding our business acquisitions in 2017, 2016 and 2015.
Capital Expenditures. Capital expenditures vary depending on prevailing business factors, including current and anticipated market conditions. Total capital expenditures, excluding insignificant non-cash purchases on account, were $31.7 million, $27.0 million and $27.3 million for the years ended December 31, 2017, 2016 and 2015, respectively, and primarily related to purchases of vehicles and various equipment to support our growing operations and increased net revenue. We expect to continue to support any increases in 2018 net revenue through further capital expenditures.
Other. In 2017 we invested $30.2 million in short-term investments consisting primarily of corporate bonds and commercial paper. We made no such investments in 2016 or 2015.
Cash flows from financing activities
We utilize our credit facilities to support our operations and continuing acquisitions as well as to finance our fleet expansion. During 2017, 2016 and 2015 we had cash inflows from our credit facilities, net of payments on these instruments and other long-term debt, amounting to $202.2 million, $27.7 million and $92.6 million, respectively, to support those initiatives. We incurred $8.3 million, $1.2 million and $0.8 million of debt issuance costs in 2017, 2016 and 2015, respectively, related to new credit facilities in each of those years. In addition, we made $7.3 million, $8.6 million and $9.7 million in principal payments on our capital leases in 2017, 2016 and 2015, respectively. Lastly, we incurred $4.5 million, $3.1 million and $3.2 million of acquisition-related obligations in 2017, 2016 and 2015, respectively and repurchased 315,000 of our common stock shares in 2015 for $6.1 million.
37
Table of Contents
Financial Instruments
Interest Rate Derivatives
We have various borrowing facilities which charge interest based on the one month U.S. dollar LIBOR rate plus an interest spread. On May 8, 2017, we entered into two interest rate swaps with a notional amount of $100.0 million. During the second quarter of 2017, we began to receive variable rate interest payments based upon one month U.S. dollar LIBOR and in return were obligated to pay interest at a fixed rate of 1.9%. This effectively converted the borrowing rate on $100.0 million of debt from a variable rate to a fixed rate. These derivatives are designated as cash flow hedges for accounting purposes. Accordingly, any effective portion of the unrealized gain or loss on these derivative instruments is reported as a component of other comprehensive income and reclassified into earnings in the same line item associated with the forecasted transactions and in the same period during which the hedged transactions affect earnings. Any ineffective portion of the gain or loss on the derivative instrument is recognized into earnings. For additional disclosures of the gain or loss included with other comprehensive income and earnings in 2017, see Note 9 to our audited consolidated financial statements included in this Form 10-K, Derivative and Hedging Activities. The assumptions used in measuring fair value of the interest rate derivatives are considered level 2 inputs, which are based upon LIBOR and interest paid based upon a designated fixed rate over the life of the swap agreements.
Capped Call Agreement
Certain of our stockholders entered into a capped call agreement with the underwriters of the secondary offering of our common stock completed on June 17, 2014. This agreement provided these stockholders with an option to call from the underwriters a total of approximately 1.0 million shares of our common stock at a capped price, with settlement required to be made in cash. During 2016, these stockholders exercised the call option with respect to approximately 0.7 million of the shares. In addition, in the fourth quarter of 2016, these stockholders simultaneously cancelled the remaining portion of the call option and purchased a new call option from the underwriters. This new capped call agreement provides these stockholders with the option to call from the underwriters a total of approximately 0.4 million shares of our common stock at a capped price. The option becomes exercisable and expires on April 16, 2018 and will be settled in cash. The capped call agreement is between these stockholders and the underwriters and does not represent compensation to the stockholders for services rendered to us. The price paid for the option represents the fair value of that transaction and we are not a party to the agreement. Accordingly, we have not recorded any expense related to this transaction.
Contractual Obligations
In the table below, we set forth our enforceable and legally binding obligations as of December 31, 2017. Some of the amounts included in the table are based on management’s estimates and assumptions about these obligations, including their duration, the possibility of renewal, anticipated actions by third parties and other factors. Because these estimates and assumptions are necessarily subjective, our actual payments may vary from those reflected in the table. In addition, our unrecognized tax benefits under ASC 740, “Income Taxes,” have been excluded from the contractual obligations table because of the inherent uncertainty and the inability to reasonably estimate the timing of cash outflows.
| Payments due by period | ||||||||||||||||||||||||||||
| (in thousands) | Total | 2018 | 2019 | 2020 | 2021 | 2022 | Thereafter | |||||||||||||||||||||
| Long-term debt obligations (1) |
$ | 431,168 | $ | 30,426 | $ | 29,996 | $ | 28,558 | $ | 22,775 | $ | 18,081 | $ | 301,332 | ||||||||||||||
| Capital lease obligations (2) |
13,204 | 6,287 | 4,322 | 1,688 | 882 | 25 | — | |||||||||||||||||||||
| Operating lease obligations (3) |
39,801 | 13,254 | 10,748 | 7,349 | 3,523 | 2,404 | 2,523 | |||||||||||||||||||||
| (1) | Long-term debt obligations include principal and interest payments on our Term Loan under the Senior Secured Credit Agreement as well as our notes payable to sellers of acquisitions and vehicles purchased |
38
Table of Contents
| under the Master Loan and Security Agreement, the Master Equipment Agreement, and the Master Loan Agreements. Long-term debt obligations do not include commitment fees on the unused portion of the ABL Revolver since those fees are subject to change based on the factors described in Senior Secured Credit Agreement. Interest on seller obligations maturing through March 2025 is estimated using current market rates. For additional information, see Note 6, Long-Term Debt, to our audited consolidated financial statements included in this Form 10-K. |
| (2) | We maintain certain production vehicles under a capital lease structure. The leases expire on various dates through December 2022. Capital lease obligations, as disclosed above, include estimated interest expense payments. In determining expected interest expense payments, we utilize the rates embedded in the lease documentation. |
| (3) | We lease certain locations, vehicles and equipment under operating lease agreements, including, but not limited to, corporate offices, branch locations and various office and operating equipment. In some instances, these location lease agreements exist with related parties. For additional information, see Note 13, Related Party Transactions, to our audited consolidated financial statements included in this Form 10-K. |
Off-Balance Sheet Arrangements
As of December 31, 2017 and 2016, other than operating leases, letters of credit issued under the ABL Revolver and performance and license bonds, we had no material off-balance sheet arrangements with unconsolidated entities.
Critical Accounting Policies and Estimates
Management’s discussion and analysis of our financial condition and results of operations is based upon our consolidated financial statements, which have been prepared in accordance with accounting principles generally accepted in the United States. The preparation of our consolidated financial statements requires us to make estimates and assumptions that affect the reported amounts of assets, liabilities, revenues and expenses and related disclosure of contingent assets and liabilities. Certain accounting policies involve judgments and uncertainties to such an extent that there is a reasonable likelihood that materially different amounts could have been reported using different assumptions or under different conditions. We evaluate our estimates and assumptions on a regular basis. We base our estimates on historical experience and various other assumptions that are believed to be reasonable under the circumstances, the results of which form the basis for making judgments about the carrying values of our assets and liabilities that are not readily apparent from other sources. Actual results may differ from these estimates and assumptions used in preparation of our consolidated financial statements. We provide discussion of our more significant accounting policies, estimates, assumptions and judgments used in preparation of our consolidated financial statements below.
Revenue and Cost Recognition
Revenue from the sale and installation of products is recognized when all of the following have occurred: (i) persuasive evidence of an arrangement exists; (ii) delivery has occurred or services have been rendered; (iii) the price is fixed or determinable; and (iv) the ability to collect is reasonably assured. We recognize revenue using either the completed contract method or the percentage-of-completion method of accounting, depending primarily on the length of time required to complete the contract. The completed contract method is used for short-term contracts for which financial position and results of operations reported on the completed-contract basis would not vary materially from those resulting from use of the percentage-of-completion method. Revenue from the sale and installation of products is recognized net of adjustments and discounts and, for revenue using the completed contract method of accounting, at the time the installation is complete. When the percentage-of-completion method is used, we estimate the costs to complete individual contracts and record as revenue that portion of the total contract price that is considered complete based on the relationship of costs incurred to date to total anticipated costs (the cost-to-cost approach). Under the cost-to-cost approach, the use of estimated costs to complete each contract is a significant variable in the process of determining recognized revenue and is a significant factor in the accounting for contracts. The costs of earned revenue include all direct
39
Table of Contents
material and labor costs and those indirect costs related to contract performance, such as indirect labor, supplies, tools and repairs. Provisions for estimated losses on uncompleted contracts are made in the period in which such losses are determined. Due to the various estimates inherent in our contract accounting, actual results could differ from those estimates, which could result in material changes to our financial statements and related disclosures.
Backlog represents expected revenue on uncompleted contracts, including the amount of revenue on contracts for which our work has not yet commenced, less the revenue recognized under these contracts, which we currently estimate to be $80.8 million as of December 31, 2017.
Accounts Receivable
We account for trade receivables based on amounts billed to customers. Past due receivables are determined based on contractual terms. We do not accrue interest on any of our trade receivables.
Retainage receivables represent the amount retained by our customers to ensure the quality of the installation and is received after satisfactory completion of each installation project. Management regularly reviews aging of retainage receivables and changes in payment trends and records an allowance when collection of amounts due are considered at risk. Amounts retained by project owners under construction contracts and included in accounts receivable were $23.1 million and $10.3 million as of December 31, 2017 and 2016, respectively.
Share-Based Compensation
Our share-based compensation program is designed to attract and retain employees while also aligning employees’ interests with the interests of our stockholders. Restricted stock awards are periodically granted to certain employees, officers and non-employee members of our board of directors under the stockholder-approved 2014 Omnibus Incentive Plan.
Equity-based awards: Certain of our stock awards are deemed to be equity-based with a service condition and do not contain a market or performance condition with the exception of performance-based awards granted to certain officers and performance-based restricted stock units. Fair value of the non-performance-based awards to employees and officers is measured at the grant date and amortized to expense over the vesting period of the awards using the straight-line attribution method for all service-based awards with a graded vesting feature. This fair value is reduced by assumed forfeitures and adjusted for actual forfeitures until vesting. We also issue performance stock-based awards to certain officers under our 2014 Omnibus Incentive Plan. The performance-based compensation expense is recorded over the requisite service period using the graded-vesting method for the entire award. Performance-based stock awards are accounted for at fair value at date of grant. We also periodically grant restricted stock units to certain employees under the stockholder-approved 2014 Omnibus Incentive Plan. These units convert to shares upon meeting time- and performance-based requirements.
Liability-based awards: Certain of our stock awards represent a predominately-fixed monetary amount that is to be settled with a variable number of shares. These awards contain both time and performance requirements, and are deemed to be liability-based, which requires that we re-measure to reflect the fair value at the end of each reporting period. The change in fair value each reporting period is recorded as compensation cost, with a corresponding increase or decrease in the share-based liability, either immediately or over the remaining service period depending on the vested status of the award.
Compensation expense for both equity and liability-based restricted stock units is recorded based on an assessment each reporting period of the probability that certain performance goals will be met during the contingent vesting period. If performance goals are not probable of occurrence, no compensation expense will be recognized. If performance goals that were previously deemed probable are not or are not expected to be met, the previously recognized compensation cost related to such performance goals will be reversed. Employees and officers are subject to tax at the vesting date based on the market price of the shares on that date, or on the grant date if an election is made.
40
Table of Contents
Business Combinations
The purchase price for business combinations is allocated to the estimated fair values of acquired tangible and intangible assets, including goodwill and assumed liabilities, where applicable. Additionally, we recognize customer relationships, trademarks and trade names and non-competition agreements as identifiable intangible assets. These assets are recorded at fair value as of the transaction date. The fair value of these intangibles is determined primarily using the income approach and using current industry information which involves significant unobservable inputs classified as Level 3 inputs. These inputs include projected sales, margin and tax rate.
At times, the total purchase price for a business combination could be less than the estimated fair values of acquired tangible and intangible assets. In these cases, we record a gain on bargain purchase within Other Expenses in the Consolidated Statements of Operations and Comprehensive Income rather than goodwill in accordance with generally accepted accounting principles.
Insurance Liabilities
We carry insurance for a number of risks, including, but not limited to, workers’ compensation, general liability, vehicle liability, property and our obligation for employee-related health care benefits. Liabilities relating to claims associated with these risks are estimated by considering historical claims experience, including frequency, severity, demographic factors and other actuarial assumptions. In estimating our liability for such claims, we periodically analyze our historical trends, including loss development, and apply appropriate loss development factors to the incurred costs associated with the claims with the assistance of external actuarial consultants. While we do not expect the amounts ultimately paid to differ significantly from our estimates, our reserves and corresponding expenses could be affected if future claim experience differs significantly from historical trends and actuarial assumptions.
Taxes
We account for income taxes using the asset and liability method. Under this method, the amount of taxes currently payable or refundable are accrued and deferred tax assets and liabilities are recognized for the estimated future tax consequences of temporary differences that currently exist between the tax basis and financial reporting basis of our assets and liabilities.
Valuation allowances are established against deferred tax assets when it is more likely than not that the realization of those deferred tax assets will not occur. In evaluating our ability to recover our deferred tax assets within the jurisdiction from which they arise, we consider all available positive and negative evidence, including scheduled reversals of deferred tax liabilities, the ability to produce future taxable income, tax planning strategies available and recent financial operations. In projecting future taxable income, we begin with historical results adjusted for the results of discontinued operations and changes in accounting policies and incorporate assumptions, including the amount of future federal and state pretax operating income, the reversal of temporary differences and the implementation of feasible and prudent tax planning strategies.
Deferred tax assets and liabilities are measured using the enacted tax rates in effect in the years when those temporary differences are expected to reverse. The effect on deferred taxes from a change in tax rate is recognized through income tax provision within the Consolidated Statement of Operations and Comprehensive Income in the period that includes the enactment date of the change.
A tax benefit from an uncertain tax position may be recognized when it is more likely than not that the position will be sustained upon examination, including resolutions of any related appeals or litigation processes, based on the technical merits. We recognize tax liabilities for uncertain tax positions and adjust these liabilities when our judgment changes as a result of the evaluation of new information not previously available.
41
Table of Contents
Our income tax expense, deferred tax assets and liabilities and reserves for unrecognized tax benefits reflect management’s best assessment of estimated future taxes to be paid. We are subject to income taxes in the United States, which includes numerous state and local jurisdictions. Significant judgments and estimates are required in determining the income tax expense.
Recent Accounting Pronouncements
For a description of recently issued and/or adopted accounting pronouncements, see Note 2, Significant Accounting Policies, to our audited consolidated financial statements included in this Form 10-K.
| Item 7A. | Quantitative and Qualitative Disclosures about Market Risk |
We are exposed to market risks related to fluctuations in interest rates on our outstanding variable rate debt. As of December 31, 2017, we had approximately $298.5 million outstanding on the term loan under our Senior Secured Credit Agreement, no outstanding borrowings on the ABL Revolver and $0.5 million outstanding under various capital leases subject to variable interest rates. Our two interest rate swaps effectively reduce our variable rate debt by $100.0 million, and therefore total variable rate debt exposed to market risks totaled $199.0 million as of December 31, 2017. A hypothetical one percentage point increase (decrease) in interest rates on our variable rate debt would increase (decrease) our annual interest expense by approximately $2.0 million.
For variable rate debt, interest rate changes generally do not affect the fair value of the debt instrument, but do impact future earnings and cash flows, assuming other factors are held constant. We did not utilize swaps, forward or option contracts on interest rates or commodities, or other types of derivative financial instruments during 2016 or 2015. We have not entered into and currently do not hold derivatives for trading or speculative purposes.
| Item 8. | Financial Statements and Supplementary Data |
42
Table of Contents
REPORT OF INDEPENDENT REGISTERED PUBLIC ACCOUNTING FIRM
To the Board of Directors and Stockholders of
Installed Building Products, Inc.
Opinion on the Financial Statements
We have audited the accompanying consolidated balance sheets of Installed Building Products, Inc. (the “Company”) as of December 31, 2017 and 2016, the related consolidated statements of operations and comprehensive income, stockholders’ equity, and cash flows, for each of the three years in the period ended December 31, 2017, and the related notes (collectively referred to as the “financial statements”). In our opinion, the financial statements present fairly, in all material respects, the financial position of the Company as of December 31, 2017 and 2016, and the results of its operations and its cash flows for each of the three years in the period ended December 31, 2017, in conformity with accounting principles generally accepted in the United States of America.
We have also audited, in accordance with the standards of the Public Company Accounting Oversight Board (United States) (PCAOB), the Company’s internal control over financial reporting as of December 31, 2017, based on criteria established in Internal Control – Integrated Framework (2013) issued by the Committee of Sponsoring Organizations of the Treadway Commission and our report dated February 28, 2018, expressed an unqualified opinion on the Company’s internal control over financial reporting.
Basis for Opinion
These financial statements are the responsibility of the Company’s management. Our responsibility is to express an opinion on the Company’s financial statements based on our audits. We are a public accounting firm registered with the PCAOB and are required to be independent with respect to the Company in accordance with the U.S. federal securities laws and the applicable rules and regulations of the Securities and Exchange Commission and the PCAOB.
We conducted our audits in accordance with the standards of the PCAOB. Those standards require that we plan and perform the audit to obtain reasonable assurance about whether the financial statements are free of material misstatement, whether due to error or fraud. Our audits included performing procedures to assess the risks of material misstatement of the financial statements, whether due to error or fraud, and performing procedures that respond to those risks. Such procedures include examining, on a test basis, evidence regarding the amounts and disclosures in the financial statements. Our audits also included evaluating the accounting principles used and significant estimates made by management, as well as evaluating the overall presentation of the financial statements. We believe that our audits provide a reasonable basis for our opinion.
/s/ Deloitte & Touche LLP
Columbus, Ohio
February 28, 2018
We have served as the Company’s auditor since 2013.
43
Table of Contents
INSTALLED BUILDING PRODUCTS, INC.
CONSOLIDATED BALANCE SHEETS
(in thousands, except share and per share amounts)
| As of December 31, | ||||||||
| 2017 | 2016 | |||||||
| ASSETS |
||||||||
| Current assets |
||||||||
| Cash and cash equivalents |
$ | 62,510 | $ | 14,482 | ||||
| Investments |
30,053 | — | ||||||
| Accounts receivable (less allowance for doubtful accounts of $4,805 and $3,397 at December 31, 2017 and 2016, respectively) |
180,725 | 128,466 | ||||||
| Inventories |
48,346 | 40,229 | ||||||
| Other current assets |
33,308 | 9,214 | ||||||
|
|
|
|
|
|||||
| Total current assets |
354,942 | 192,391 | ||||||
| Property and equipment, net |
81,075 | 67,788 | ||||||
| Non-current assets |
||||||||
| Goodwill |
155,466 | 107,086 | ||||||
| Intangibles, net |
137,991 | 86,317 | ||||||
| Other non-current assets |
9,272 | 8,513 | ||||||
|
|
|
|
|
|||||
| Total non-current assets |
302,729 | 201,916 | ||||||
|
|
|
|
|
|||||
| Total assets |
$ | 738,746 | $ | 462,095 | ||||
|
|
|
|
|
|||||
| LIABILITIES AND STOCKHOLDERS’ EQUITY |
||||||||
| Current liabilities |
||||||||
| Current maturities of long-term debt |
$ | 16,650 | $ | 17,192 | ||||
| Current maturities of capital lease obligations |
5,666 | 6,929 | ||||||
| Accounts payable |
87,425 | 67,921 | ||||||
| Accrued compensation |
25,399 | 18,212 | ||||||
| Other current liabilities |
24,666 | 19,851 | ||||||
|
|
|
|
|
|||||
| Total current liabilities |
159,806 | 130,105 | ||||||
| Long-term debt |
330,927 | 134,235 | ||||||
| Capital lease obligations, less current maturities |
6,479 | 8,364 | ||||||
| Deferred income taxes |
6,444 | 14,239 | ||||||
| Other long-term liabilities |
24,562 | 21,175 | ||||||
|
|
|
|
|
|||||
| Total liabilities |
528,218 | 308,118 | ||||||
| Commitments and contingencies (Note 14) |
||||||||
| Stockholders’ equity |
||||||||
| Preferred Stock; $0.01 par value: 5,000,000 authorized and 0 shares issued and outstanding at December 31, 2017 and 2016, respectively |
— | — | ||||||
| Common Stock; $0.01 par value: 100,000,000 authorized, 32,524,934 and 32,135,176 issued and 31,862,146 and 31,484,774 shares outstanding at December 31, 2017 and 2016, respectively (Note 10) |
325 | 321 | ||||||
| Additional paid in capital |
174,043 | 158,581 | ||||||
| Retained earnings |
48,434 | 7,294 | ||||||
| Treasury Stock; at cost: 662,788 and 650,402 shares at December 31, 2017 and 2016, respectively |
(12,781 | ) | (12,219 | ) | ||||
| Accumulated other comprehensive income |
507 | — | ||||||
|
|
|
|
|
|||||
| Total stockholders’ equity |
210,528 | 153,977 | ||||||
|
|
|
|
|
|||||
| Total liabilities and stockholders’ equity |
$ | 738,746 | $ | 462,095 | ||||
|
|
|
|
|
|||||
See accompanying notes to consolidated financial statements
44
Table of Contents
INSTALLED BUILDING PRODUCTS, INC.
CONSOLIDATED STATEMENTS OF OPERATIONS
(in thousands, except share and per share amounts)
| Years ended December 31, | ||||||||||||
| 2017 | 2016 | 2015 | ||||||||||
| Net revenue |
$ | 1,132,927 | $ | 862,980 | $ | 662,719 | ||||||
| Cost of sales |
808,901 | 610,532 | 474,426 | |||||||||
|
|
|
|
|
|
|
|||||||
| Gross profit |
324,026 | 252,448 | 188,293 | |||||||||
| Operating expenses |
||||||||||||
| Selling |
58,450 | 49,667 | 37,702 | |||||||||
| Administrative |
164,453 | 125,472 | 99,375 | |||||||||
| Amortization |
26,857 | 11,259 | 6,264 | |||||||||
|
|
|
|
|
|
|
|||||||
| Operating income |
74,266 | 66,050 | 44,952 | |||||||||
| Other expense (income) |
||||||||||||
| Interest expense, net |
17,381 | 6,177 | 3,738 | |||||||||
| Other |
1,065 | 263 | (716 | ) | ||||||||
|
|
|
|
|
|
|
|||||||
| Income before income taxes |
55,820 | 59,610 | 41,930 | |||||||||
| Income tax provision |
14,680 | 21,174 | 15,413 | |||||||||
|
|
|
|
|
|
|
|||||||
| Net income |
$ | 41,140 | $ | 38,436 | $ | 26,517 | ||||||
|
|
|
|
|
|
|
|||||||
| Other comprehensive income, net of tax: |
||||||||||||
| Unrealized gain on cash flow hedge, net of tax provision of $206, $0 and $0 for the twelve months ended December 31, 2017, 2016 and 2015, respectively |
507 | — | — | |||||||||
|
|
|
|
|
|
|
|||||||
| Comprehensive income |
$ | 41,647 | $ | 38,436 | $ | 26,517 | ||||||
|
|
|
|
|
|
|
|||||||
| Basic and diluted net income per share |
$ | 1.30 | $ | 1.23 | $ | 0.85 | ||||||
|
|
|
|
|
|
|
|||||||
| Weighted average shares outstanding: |
||||||||||||
| Basic |
31,639,283 | 31,301,887 | 31,298,163 | |||||||||
| Diluted |
31,756,363 | 31,363,290 | 31,334,569 | |||||||||
See accompanying notes to consolidated financial statements
45
Table of Contents
INSTALLED BUILDING PRODUCTS, INC.
CONSOLIDATED STATEMENTS OF STOCKHOLDERS’ EQUITY
(in thousands, except share amounts)
| Additional Paid In Capital |
(Accumulated Deficit) / Retained Earnings |
Accumulated Other Comprehensive Income |
Stockholders’ Equity |
|||||||||||||||||||||||||||||
| Common Stock | Treasury Stock | |||||||||||||||||||||||||||||||
| Shares | Amount | Shares | Amount | |||||||||||||||||||||||||||||
| BALANCE—January 1, 2015 |
31,839,087 | $ | 319 | $ | 154,497 | $ | (57,659 | ) | (300,000 | ) | $ | (5,283 | ) | $ | — | $ | 91,874 | |||||||||||||||
|
|
|
|
|
|
|
|
|
|
|
|
|
|
|
|
|
|||||||||||||||||
| Net Income |
26,517 | 26,517 | ||||||||||||||||||||||||||||||
| Issuance of Common Stock Awards to Employees |
130,613 | 1 | (1 | ) | — | |||||||||||||||||||||||||||
| Surrender of Common Stock Awards by Employees |
(1,560 | ) | — | |||||||||||||||||||||||||||||
| Share-Based Compensation Expense |
1,816 | 1,816 | ||||||||||||||||||||||||||||||
| Share-Based Compensation Issued to Directors |
13,188 | 300 | 300 | |||||||||||||||||||||||||||||
| Tax Benefit from Stock Plan |
76 | 76 | ||||||||||||||||||||||||||||||
| Common Stock Repurchase |
(315,000 | ) | (6,100 | ) | (6,100 | ) | ||||||||||||||||||||||||||
|
|
|
|
|
|
|
|
|
|
|
|
|
|
|
|
|
|||||||||||||||||
| BALANCE—January 1, 2016 |
31,982,888 | $ | 320 | $ | 156,688 | $ | (31,142 | ) | (616,560 | ) | $ | (11,383 | ) | $ | — | $ | 114,483 | |||||||||||||||
|
|
|
|
|
|
|
|
|
|
|
|
|
|
|
|
|
|||||||||||||||||
| Net Income |
38,436 | 38,436 | ||||||||||||||||||||||||||||||
| Issuance of Common Stock Awards to Employees |
143,528 | 1 | (1 | ) | — | |||||||||||||||||||||||||||
| Surrender of Common Stock Awards by Employees |
(33,842 | ) | (836 | ) | (836 | ) | ||||||||||||||||||||||||||
| Share-Based Compensation Expense |
1,594 | 1,594 | ||||||||||||||||||||||||||||||
| Share-Based Compensation Issued to Directors |
8,760 | 300 | 300 | |||||||||||||||||||||||||||||
|
|
|
|
|
|
|
|
|
|
|
|
|
|
|
|
|
|||||||||||||||||
| BALANCE—January 1, 2017 |
32,135,176 | $ | 321 | $ | 158,581 | $ | 7,294 | (650,402 | ) | $ | (12,219 | ) | $ | — | $ | 153,977 | ||||||||||||||||
|
|
|
|
|
|
|
|
|
|
|
|
|
|
|
|
|
|||||||||||||||||
| Net Income |
41,140 | 41,140 | ||||||||||||||||||||||||||||||
| Purchase of Remaining Interest in Subsidiary |
(1,888 | ) | (1,888 | ) | ||||||||||||||||||||||||||||
| Issuance of Common Stock for Acquisition |
282,577 | 3 | 10,856 | 10,859 | ||||||||||||||||||||||||||||
| Issuance of Common Stock Awards to Employees |
101,241 | 1 | (1 | ) | — | |||||||||||||||||||||||||||
| Surrender of Common Stock Awards by Employees |
(12,386 | ) | (562 | ) | (562 | ) | ||||||||||||||||||||||||||
| Share-Based Compensation Expense |
6,195 | 6,195 | ||||||||||||||||||||||||||||||
| Share-Based Compensation Issued to Directors |
5,940 | 300 | 300 | |||||||||||||||||||||||||||||
| Other Comprehensive Income, Net of Tax |
507 | 507 | ||||||||||||||||||||||||||||||
|
|
|
|
|
|
|
|
|
|
|
|
|
|
|
|
|
|||||||||||||||||
| BALANCE—December 31, 2017 |
32,524,934 | $ | 325 | $ | 174,043 | $ | 48,434 | (662,788 | ) | $ | (12,781 | ) | $ | 507 | $ | 210,528 | ||||||||||||||||
|
|
|
|
|
|
|
|
|
|
|
|
|
|
|
|
|
|||||||||||||||||
See accompanying notes to consolidated financial statements
46
Table of Contents
INSTALLED BUILDING PRODUCTS, INC.
CONSOLIDATED STATEMENTS OF CASH FLOWS
(in thousands)
| Years ended December 31, | ||||||||||||
| 2017 | 2016 | 2015 | ||||||||||
| Cash flows from operating activities |
||||||||||||
| Net income |
$ | 41,140 | $ | 38,436 | $ | 26,517 | ||||||
| Adjustments to reconcile net income to net cash provided by operating activities |
||||||||||||
| Depreciation and amortization of property and equipment |
28,285 | 23,571 | 16,975 | |||||||||
| Amortization of intangibles |
26,857 | 11,259 | 6,264 | |||||||||
| Amortization of deferred financing costs and debt discount |
1,093 | 383 | 264 | |||||||||
| Provision for doubtful accounts |
2,834 | 2,928 | 919 | |||||||||
| Write-off of debt issuance costs |
2,113 | 286 | — | |||||||||
| Gain on sale of property and equipment |
(492 | ) | (254 | ) | (409 | ) | ||||||
| Gain on bargain purchase |
— | — | (1,116 | ) | ||||||||
| Noncash stock compensation |
6,592 | 1,894 | 2,116 | |||||||||
| Deferred income taxes |
(6,160 | ) | (605 | ) | (1,515 | ) | ||||||
| Changes in assets and liabilities, excluding effects of acquisitions |
||||||||||||
| Accounts receivable |
(19,955 | ) | (18,760 | ) | (17,526 | ) | ||||||
| Inventories |
(3,667 | ) | (8,677 | ) | (2,846 | ) | ||||||
| Other assets |
(4,602 | ) | 2,803 | 823 | ||||||||
| Accounts payable |
6,303 | 12,400 | (2,511 | ) | ||||||||
| Income taxes payable/receivable |
(18,605 | ) | 1,484 | 3,592 | ||||||||
| Other liabilities |
7,036 | 6,118 | 3,000 | |||||||||
|
|
|
|
|
|
|
|||||||
| Net cash provided by operating activities |
68,772 | 73,266 | 34,547 | |||||||||
|
|
|
|
|
|
|
|||||||
| Cash flows from investing activities |
||||||||||||
| Purchases of investments |
(30,194 | ) | — | — | ||||||||
| Purchases of property and equipment |
(31,668 | ) | (27,013 | ) | (27,305 | ) | ||||||
| Acquisitions of businesses, net of cash acquired of $247, $2,181 and $926 in 2017, 2016 and 2015, respectively |
(137,120 | ) | (53,312 | ) | (84,274 | ) | ||||||
| Proceeds from sale of property and equipment |
959 | 691 | 634 | |||||||||
| Other |
(2,420 | ) | 37 | (420 | ) | |||||||
|
|
|
|
|
|
|
|||||||
| Net cash used in investing activities |
(200,443 | ) | (79,597 | ) | (111,365 | ) | ||||||
|
|
|
|
|
|
|
|||||||
| Cash flows from financing activities |
||||||||||||
| Proceeds from revolving line of credit under credit agreement applicable to respective period (Note 6) |
— | 37,975 | 149,350 | |||||||||
| Payments on revolving line of credit under credit agreement applicable to respective period (Note 6) |
— | (37,975 | ) | (149,350 | ) | |||||||
| Proceeds from term loan under credit agreement applicable to respective period (Note 6) |
300,000 | 100,000 | 50,000 | |||||||||
| Payments on term loan under credit agreement applicable to respective period (Note 6) |
(97,750 | ) | (51,875 | ) | (24,688 | ) | ||||||
| Proceeds from delayed draw term loan under credit agreement applicable to respective period (Note 6) |
112,500 | 12,500 | 50,000 | |||||||||
| Payments on delayed draw term loan under credit agreement applicable to respective period (Note 6) |
(125,000 | ) | (50,000 | ) | — | |||||||
| Proceeds from vehicle and equipment notes payable |
22,460 | 22,948 | 21,334 | |||||||||
| Debt issuance costs |
(8,281 | ) | (1,238 | ) | (758 | ) | ||||||
| Principal payments on long-term debt |
(10,002 | ) | (5,849 | ) | (4,088 | ) | ||||||
| Principal payments on capital lease obligations |
(7,314 | ) | (8,598 | ) | (9,674 | ) | ||||||
| Acquisition-related obligations |
(4,464 | ) | (3,057 | ) | (3,151 | ) | ||||||
| Repurchase of common stock |
— | — | (6,100 | ) | ||||||||
| Surrender of common stock awards by employees |
(562 | ) | (836 | ) | — | |||||||
| Purchase of remaining interest in subsidiary |
(1,888 | ) | — | — | ||||||||
|
|
|
|
|
|
|
|||||||
| Net cash provided by financing activities |
179,699 | 13,995 | 72,875 | |||||||||
|
|
|
|
|
|
|
|||||||
| Net change in cash and cash equivalents |
48,028 | 7,664 | (3,943 | ) | ||||||||
| Cash and cash equivalents at beginning of year |
14,482 | 6,818 | 10,761 | |||||||||
|
|
|
|
|
|
|
|||||||
| Cash and cash equivalents at end of year |
$ | 62,510 | $ | 14,482 | $ | 6,818 | ||||||
|
|
|
|
|
|
|
|||||||
| Supplemental disclosures of cash flow information |
||||||||||||
| Net cash paid during the year for: |
||||||||||||
| Interest |
$ | 13,758 | $ | 5,342 | $ | 3,287 | ||||||
| Income taxes, net of refunds |
38,887 | 18,929 | 13,493 | |||||||||
| Supplemental disclosure of noncash investing and financing activities |
||||||||||||
| Common stock issued for acquisition of business |
10,859 | — | — | |||||||||
| Vehicles capitalized under capital leases and related lease obligations |
4,440 | 3,737 | 3,379 | |||||||||
| Seller obligations in connection with acquisition of businesses |
5,128 | 4,459 | 13,180 | |||||||||
| Unpaid purchases of property and equipment included in accounts payable |
2,003 | 775 | 220 | |||||||||
See accompanying notes to consolidated financial statements
47
Table of Contents
INSTALLED BUILDING PRODUCTS, INC.
NOTES TO CONSOLIDATED FINANCIAL STATEMENTS
NOTE 1 – ORGANIZATION
Installed Building Products, Inc. (“IBP”), a Delaware corporation formed on October 28, 2011, and its wholly-owned subsidiaries (collectively referred to as the “Company” and “we,” “us” and “our”) primarily install insulation, waterproofing, fire-stopping, fireproofing, garage doors, rain gutters, shower doors, closet shelving and mirrors and other products for residential and commercial builders located in the continental United States. The Company operates in over 125 locations and its corporate office is located in Columbus, Ohio.
We have one operating segment and a single reportable segment. We offer our portfolio of services for new and existing single-family and multi-family residential and commercial building projects from our national network of branch locations. Commercial sales have increased primarily due to the acquisition of Trilok Industries, Inc., Alpha Insulation and Waterproofing Inc. and Alpha Insulation and Waterproofing Company (collectively, “Alpha”).
Each of our branches has the capacity to serve all of our end markets. For the years ended December 31, 2017, 2016 and 2015, residential new construction and repair and remodel was 83%, 88% and 89% of our net revenue and commercial construction was 17%, 12% and 11% of our net revenue, respectively. The following table sets forth the percentage of our net revenue by product category:
| Years ended December 31, | ||||||||||||
| 2017 | 2016 | 2015 | ||||||||||
| Insulation |
67 | % | 77 | % | 78 | % | ||||||
| Waterproofing |
8 | 2 | 2 | |||||||||
| Shower doors, shelving and mirrors |
7 | 5 | 5 | |||||||||
| Garage doors |
5 | 6 | 6 | |||||||||
| Rain gutters |
4 | 4 | 5 | |||||||||
| Other building products |
9 | 6 | 4 | |||||||||
|
|
|
|
|
|
|
|||||||
| 100 | % | 100 | % | 100 | % | |||||||
NOTE 2 – SIGNIFICANT ACCOUNTING POLICIES
Basis of Presentation and Principles of Consolidation
We prepare our consolidated financial statements in accordance with accounting principles generally accepted in the United States of America (“U.S. GAAP”). The accompanying consolidated financial statements include all of our wholly-owned subsidiaries. All intercompany accounts and transactions have been eliminated.
Use of Estimates
Preparation of the consolidated financial statements in conformity with U.S. GAAP requires management to make estimates and assumptions that affect the reported amounts of assets and liabilities and disclosure of contingent assets and liabilities at the date of the financial statements and the reported amounts of revenues and expenses during the reporting period. Significant estimates include the revenue, costs and reserves established under the percentage-of-completion method, allowance for doubtful accounts, valuation allowance on deferred tax assets, valuation of the reporting unit, valuation of acquired intangible assets, impairment of intangible assets and other long-lived assets, share-based compensation, reserves for general liability and workers’ compensation and medical insurance. Management believes the accounting estimates are appropriate and reasonably determined; however, due to the inherent uncertainties in making these estimates, actual amounts could differ from such estimates.
48
Table of Contents
INSTALLED BUILDING PRODUCTS, INC.
NOTES TO CONSOLIDATED FINANCIAL STATEMENTS
Cash and Cash Equivalents
We consider all highly-liquid investments purchased with original term to maturity of three months or less to be cash equivalents. We had $55.6 million of cash equivalents as of December 31, 2017 and zero cash equivalents as of December 31, 2016. Substantially all cash is held in banks providing FDIC coverage of $0.25 million per depositor.
Revenue and Cost Recognition
Revenue from the sale and installation of products is recognized when all of the following have occurred: (i) persuasive evidence of an arrangement exists; (ii) delivery has occurred or services have been rendered; (iii) the price is fixed or determinable; and (iv) the ability to collect is reasonably assured. We recognize revenue using either the completed contract method or the percentage-of-completion method of accounting, depending primarily on length of time required to complete the contract. The completed contract method is used for short-term contracts for which financial position and results of operations reported on the completed-contract basis would not vary materially from those resulting from use of the percentage-of-completion method. Revenue from the sale and installation of products is recognized net of adjustments and discounts and, for revenue using the completed contract method of accounting, at the time the installation is complete. When the percentage-of-completion method is used, we estimate the costs to complete individual contracts and record as revenue that portion of the total contract price that is considered complete based on the relationship of costs incurred to date to total anticipated costs (the cost-to-cost approach). The costs of earned revenue include all direct material and labor costs and those indirect costs related to contract performance, such as indirect labor, supplies, tools and repairs. Provisions for estimated losses on uncompleted contracts are made in the period in which such losses are determined.
Accounting Policy for Derivative Instruments and Hedging Activities
We record all derivatives on the balance sheet at fair value. The accounting for changes in the fair value of derivatives depends on the intended use of the derivative, whether we have elected to designate a derivative in a hedging relationship and apply hedge accounting and whether the hedging relationship has satisfied the criteria necessary to apply hedge accounting. Derivatives designated and qualifying as a hedge of the exposure to variability in expected future cash flows, or other types of forecasted transactions, are considered cash flow hedges. Hedge accounting generally provides for the matching of the timing of gain or loss recognition on the hedging instrument with the recognition of the earnings effect of the hedged forecasted transactions in a cash flow hedge. We may enter into derivative contracts that are intended to economically hedge certain of our risks, even though hedge accounting does not apply or we elect not to apply hedge accounting.
Investment Policy
Marketable securities with original maturities longer than three months but less than one year from the balance sheet date are classified as investments within current assets. These investments consist of highly liquid investment grade instruments primarily including corporate bonds and commercial paper. Investments for which we have the ability and positive intent to hold to maturity are carried at amortized cost. The difference between the acquisition costs and face values of held-to-maturity investments is amortized over the remaining term of the investments and added to or subtracted from the acquisition cost and interest income. As of December 31, 2017, all of our investments were classified as held-to-maturity.
Business Combinations
The purchase price for business combinations is allocated to the estimated fair values of acquired tangible and intangible assets, including goodwill and assumed liabilities, where applicable. Additionally, we recognize
49
Table of Contents
INSTALLED BUILDING PRODUCTS, INC.
NOTES TO CONSOLIDATED FINANCIAL STATEMENTS
customer relationships, trademarks and trade names, backlog and non-competition agreements as identifiable intangible assets. These assets are recorded at fair value as of the transaction date. The fair value of these intangibles is determined primarily using the income approach and using current industry information which involves significant unobservable inputs (Level 3 inputs). These inputs include projected sales, margin and tax rate.
At times, the total purchase price for a business combination could be less than the estimated fair values of acquired tangible and intangible assets. In these cases, we record a gain on bargain purchase within other expenses in the Consolidated Statements of Operations and Comprehensive Income rather than goodwill in accordance with U.S. GAAP.
Accounts Receivable
We account for trade receivables based on amounts billed to customers. Past due receivables are determined based on contractual terms. We do not accrue interest on any of our trade receivables.
Retainage receivables represent the amount retained by our customers to ensure the quality of the installation and is received after satisfactory completion of each installation project. Management regularly reviews aging of retainage receivables and changes in payment trends and records an allowance when collection of amounts due are considered at risk. Amounts retained by project owners under construction contracts and included in accounts receivable were $23.1 million and $10.3 million as of December 31, 2017 and 2016, respectively. As of December 31, 2017, all but $0.5 million of retainage receivables, which are recorded in other long-term assets, were estimated to be contractually due within one year.
50
Table of Contents
INSTALLED BUILDING PRODUCTS, INC.
NOTES TO CONSOLIDATED FINANCIAL STATEMENTS
Allowance for Doubtful Accounts
We maintain an allowance for doubtful accounts for estimated losses resulting from the failure of customers to make required payments. The allowance is determined by management based on our historical losses, specific customer circumstances and general economic conditions. We analyze aged accounts receivable and generally increase the allowance as receivables age. Management reviews accounts receivable and records an allowance for specific customers based on current circumstances and charges off the receivable against the allowance when all attempts to collect the receivable have failed. This analysis is performed regularly and the allowance is adjusted accordingly. The following table sets forth our allowance for doubtful accounts (in thousands):
| Allowance for doubtful accounts receivable |
||||
| January 1, 2015 |
$ | 2,661 | ||
| Charged to costs and expenses |
919 | |||
| Charged to other accounts (1) |
533 | |||
| Deductions (2) |
(1,627 | ) | ||
|
|
|
|||
| December 31, 2015 |
$ | 2,486 | ||
|
|
|
|||
| Charged to costs and expenses |
2,928 | |||
| Charged to other accounts (1) |
435 | |||
| Deductions (2) |
(2,452 | ) | ||
|
|
|
|||
| December 31, 2016 |
$ | 3,397 | ||
|
|
|
|||
| Charged to costs and expenses |
2,834 | |||
| Charged to other accounts (1) |
699 | |||
| Deductions (2) |
(2,125 | ) | ||
|
|
|
|||
| December 31, 2017 |
$ | 4,805 | ||
|
|
|
|||
| (1) | Recovery of receivables previously written off as bad debt and other |
| (2) | Write-off of uncollectible accounts receivable |
Concentration of Credit Risk
Credit risk is our risk of financial loss from the non-performance of a contractual obligation on the part of our counterparty. Such risk arises principally from our receivables from customers and cash and bank balances. Substantially all of our trade accounts receivable are from entities engaged in residential and commercial construction. We perform periodic credit evaluations of our customers’ financial condition. The general credit risk of our counterparties is not considered to be significant. In addition, no individual customer made up more than 3% of accounts receivable or 4% of net revenue for the years ended December 31, 2017, 2016 and 2015.
Inventories
Inventories consist of insulation, garage doors, rain gutters, shower doors, mirrors, closet shelving and other products. We install these products but do not manufacture them. We value inventory at the lower of cost or market with cost determined using the first-in, first-out (“FIFO”) method. As of December 31, 2017 and 2016, all inventory was finished goods. Inventory provisions are recorded to reduce inventory to the lower of cost or market value for obsolete or slow moving inventory based on assumptions about future demand and marketability of products, the impact of new product introductions, inventory levels and turns, product spoilage, and specific identification of items such as product discontinuance, engineering/material changes, or regulatory-related changes.
51
Table of Contents
INSTALLED BUILDING PRODUCTS, INC.
NOTES TO CONSOLIDATED FINANCIAL STATEMENTS
Property and Equipment
Property and equipment are stated at cost, less accumulated depreciation. We provide for depreciation and amortization of property and equipment using the straight-line method over the expected useful lives of the assets. Expected useful lives of property and equipment vary but generally are the shorter of lease life or five years for vehicles and leasehold improvements, three to five years for furniture, fixtures and equipment and 30 years for buildings.
Major renewals and improvements are capitalized. Maintenance, repairs and minor renewals are expensed as incurred. When assets are retired or otherwise disposed of, the related cost and accumulated depreciation are removed from the accounts and any resulting gain or loss is recorded.
Goodwill
Goodwill results from business combinations and represents the excess of the purchase price over the fair value of acquired tangible assets and liabilities and identifiable intangible assets. Annually, on October 1, or if conditions indicate an earlier review is necessary, we either perform a quantitative test or assess qualitative factors to determine if it is more likely than not that the fair value of the reporting unit is less than its carrying amount and if it is necessary to perform the quantitative two-step goodwill impairment test. If we perform the quantitative test, we compare the carrying value of the reporting unit to an estimate of the reporting unit’s fair value to identify potential impairment. The estimate of the reporting unit’s fair value is determined by weighting a discounted cash flow model and a market-related model using current industry information that involve significant unobservable inputs (Level 3 inputs). In determining the estimated future cash flow, we consider and apply certain estimates and judgments, including current and projected future levels of income based on management’s plans, business trends, prospects, market and economic conditions and market-participant considerations. If the estimated fair value of the reporting unit is less than the carrying value, a second step is performed to determine the amount of the potential goodwill impairment. If impaired, goodwill is written down to its estimated implied fair value.
Impairment of Other Intangible and Long-Lived Assets
Other intangible assets consist of customer relationships, backlog, non-competition agreements and business trademarks and trade names. Amortization of finite lived intangible assets is recorded to reflect the pattern of economic benefits based on projected revenues over their respective estimated useful lives (customer relationships – eight to 15 years, non-competition agreements – one to five years and business trademarks and trade names – eight to 15 years). We do not have any indefinite-lived intangible assets other than goodwill.
We review long-lived assets and intangible assets whenever events or changes in circumstances indicate that the carrying value of an asset may not be recoverable. An impairment loss is recognized when estimated future cash flows expected to result from the use of an asset and its eventual disposition are less than its carrying amount. When impairment is identified, the carrying amount of the asset is reduced to its estimated fair value. Assets to be disposed of are recorded at the lower of net book value or fair market value less cost to sell at the date management commits to a plan of disposal. There was no impairment loss for the years ended December 31, 2017, 2016 and 2015.
Other Liabilities
Our workers’ compensation insurance program, for a significant portion of our business, is considered a high deductible program whereby we are responsible for the cost of claims under approximately $0.8 million. If we do
52
Table of Contents
INSTALLED BUILDING PRODUCTS, INC.
NOTES TO CONSOLIDATED FINANCIAL STATEMENTS
not pay these claims, our workers’ compensation insurance carriers are required to make these payments to the claimants on our behalf. Effective with the plan year beginning October 1, 2015, our general liability insurance program is considered a high retention program whereby we are responsible for the cost of claims up to approximately $2.0 million, subject to an aggregate cap of $8.0 million. If we do not pay these claims, our general liability insurance carrier is required to make these payments to the claimants on our behalf. Prior to the claim year beginning October 1, 2015, our general liability insurance program has a self-incurred retention (“SIR”) of $0.4 million whereby we continue to be responsible for all claims below the SIR and the insurance company continues to be responsible for all liabilities above the SIR. The liabilities represent our best estimate of our costs, using generally accepted actuarial reserving methods, of the ultimate obligations for reported claims plus those incurred but not reported for all claims incurred through December 31, 2017 and 2016. We establish case reserves for reported claims using case-basis evaluation of the underlying claims data and we update as information becomes known. We regularly monitor the potential for changes in estimates, evaluate our insurance accruals and adjust our recorded provisions.
The assumptions underlying the ultimate costs of existing claim losses are subject to a high degree of unpredictability, which can affect the liability recorded for such claims. For example, variability in inflation rates of health care costs inherent in workers’ compensation claims can affect the ultimate costs. Similarly, changes in legal trends and interpretations, as well as a change in the nature and method of how claims are settled, can affect ultimate costs. Our estimates of liabilities incurred do not anticipate significant changes in historical trends for these variables and any changes could have a considerable effect on future claim costs and currently recorded liabilities.
We carry insurance for a number of risks, including, but not limited to, workers’ compensation, general liability, vehicle liability, property and our obligation for employee-related health care benefits. Liabilities relating to claims associated with these risks are estimated by considering historical claims experience, including frequency, severity, demographic factors and other actuarial assumptions. In estimating our liability for such claims, we periodically analyze our historical trends, including loss development, and apply appropriate loss development factors to the incurred costs associated with the claims with the assistance of external actuarial consultants. While we do not expect the amounts ultimately paid to differ significantly from our estimates, our reserves and corresponding expenses could be affected if future claim experience differs significantly from historical trends and actuarial assumptions.
Advertising Costs
Advertising costs are generally expensed as incurred. Advertising expense was approximately $3.2 million, $3.0 million and $2.3 million for the years ended December 31, 2017, 2016 and 2015, respectively, and is included in selling expense on the Consolidated Statements of Operations and Comprehensive Income.
Deferred Financing Costs
Deferred financing costs and debt issuance costs combined, totaling $6.8 million and $1.7 million, net of accumulated amortization as of December 31, 2017 and 2016, respectively, are amortized over the term of the related debt on a straight-line basis which approximates the effective interest method. The deferred financing costs are included in other non-current assets while the debt issuance costs are included in long-term debt on the Consolidated Balance Sheets as of December 31, 2017 and 2016, respectively. The related amortization expense of these costs combined was $1.1 million, $0.4 million and $0.3 million and is included in interest expense, net on the Consolidated Statements of Operations and Comprehensive Income for the years ended December 31, 2017, 2016 and 2015, respectively. In addition, we expensed loan costs of approximately $1.0 million and $0.3 million for the years ended December 31, 2017 and 2016, respectively, associated with our Credit and Security Agreement because
53
Table of Contents
INSTALLED BUILDING PRODUCTS, INC.
NOTES TO CONSOLIDATED FINANCIAL STATEMENTS
they did not meet the requirements for capitalization. For the year ended December 31, 2017, we wrote off $2.1 million in loan costs as a result of refinancing our credit facilities. We did not write off any loan costs during the year ended December 31, 2016. For additional information, see Note 6, Long-Term Debt.
Share-Based Compensation
Our share-based compensation program is designed to attract and retain employees while also aligning employees’ interests with the interests of our stockholders. Restricted stock awards are periodically granted to certain employees, officers and non-employee members of our board of directors under the stockholder-approved 2014 Omnibus Incentive Plan.
Equity-based awards: Certain of our stock awards are deemed to be equity-based with a service condition and do not contain a market or performance condition with the exception of performance-based awards granted to certain officers and performance-based restricted stock units. Fair value of the non-performance-based awards to employees and officers is measured at the grant date and amortized to expense over the vesting period of the awards using the straight-line attribution method for all service-based awards with a graded vesting feature. This fair value is reduced by assumed forfeitures and adjusted for actual forfeitures until vesting. We also issue performance stock-based awards to certain officers under our 2014 Omnibus Incentive Plan. The performance-based compensation expense is recorded over the requisite service period using the graded-vesting method for the entire award. Performance-based stock awards are accounted for at fair value at date of grant. We also periodically grant restricted stock units to certain employees under the stockholder-approved 2014 Omnibus Incentive Plan. These units convert to shares upon meeting time- and performance-based requirements.
Liability-based awards: Certain of our stock awards represent a predominately-fixed monetary amount that is to be settled with a variable number of shares. These awards contain both time and performance requirements, and are deemed to be liability-based, which requires that we re-measure to reflect their fair value at the end of each reporting period. The change in fair value each reporting period is recorded as compensation cost, with a corresponding increase or decrease in our share-based liability, either immediately or over the remaining service period depending on the vested status of the award.
Compensation expense for both equity and liability-based restricted stock units is recorded based on an assessment each reporting period of the probability that certain performance goals will be met during the contingent vesting period. If performance goals are not probable to occur, no compensation expense will be recognized. If performance goals that were previously deemed probable are not or are not expected to be met, the previously recognized compensation cost related to such performance goals will be reversed. Employees and officers are subject to tax at the vesting date based on the market price of the shares on that date, or on the grant date if an election is made.
Income Taxes
We account for income taxes using the asset and liability method. Under this method, the amount of taxes currently payable or refundable are accrued and deferred tax assets and liabilities are recognized for the estimated future tax consequences of temporary differences that currently exist between the tax basis and financial reporting basis of our assets and liabilities.
Valuation allowances are established against deferred tax assets when it is more likely than not that the realization of those deferred tax assets will not occur. In evaluating our ability to recover our deferred tax assets within the jurisdiction from which they arise, we consider all available positive and negative evidence, including
54
Table of Contents
INSTALLED BUILDING PRODUCTS, INC.
NOTES TO CONSOLIDATED FINANCIAL STATEMENTS
scheduled reversals of deferred tax liabilities, the ability to produce future taxable income, prudent and feasible tax planning strategies and recent financial operations. In projecting future taxable income, we factor in historical results and changes in accounting policies and incorporate assumptions, including the amount of future federal and state pretax operating income, the reversal of temporary differences and the implementation of feasible and prudent tax planning strategies. These assumptions require significant judgment about the forecasts of future taxable income and are consistent with the plans and estimates we use to manage the underlying businesses.
Deferred tax assets and liabilities are measured using the enacted tax rates in effect in the years when those temporary differences are expected to reverse. The effect on deferred taxes from a change in tax rate is recognized through operations in the period that includes the enactment date of the change. Changes in tax laws and rates could also affect recorded deferred tax assets and liabilities in the future. The Tax Cuts and Jobs Act (the “Tax Act”) that was enacted on December 22, 2017 reduces the US federal corporate tax rate from 35% to 21% effective January 1, 2018. The Company recognized a $3.8 million tax benefit as a result of revaluing the ending net deferred tax liabilities from 35% to the newly enacted U.S. corporate income tax rate of 21%. See Note 12, Income Taxes, for additional information.
A tax benefit from an uncertain tax position may be recognized when it is more likely than not that the position will be sustained upon examination, including resolutions of any related appeals or litigation processes, based on the technical merits. Income tax positions must meet a more likely than not recognition threshold to be recognized.
We recognize tax liabilities for uncertain tax positions and adjust these liabilities when our judgment changes as a result of the evaluation of new information not previously available. Liabilities related to uncertain tax positions are recorded in other long-term liabilities on the Consolidated Balance Sheets. Due to the complexity of some of these uncertainties, the ultimate resolution may result in a payment that is materially different from the current estimate of the tax liabilities. These differences will be reflected as increases or decreases to income tax expense and the effective tax rate in the period in which the new information becomes available. Interest and penalties related to unrecognized tax benefits are recognized within income tax expense in the Consolidated Statements of Operations and Comprehensive Income. Accrued interest and penalties are recognized in other current liabilities on the Consolidated Balance Sheets.
Our income tax expense, deferred tax assets and liabilities and reserves for unrecognized tax benefits reflect management’s best assessment of estimated future taxes to be paid. We are subject to income taxes in the United States, which includes numerous state and local jurisdictions. Significant judgments and estimates are required in determining the income tax expense, deferred tax assets and liabilities and the reserve for unrecognized tax benefits.
Estimated Fair Value of Financial Instruments
Accounts receivable, accounts payable, cash and cash equivalents, short-term investments and accrued liabilities as of December 31, 2017 and 2016 approximate their fair value due to the short-term maturities of these financial instruments. The carrying amounts of our long-term debt, including the term loan, delayed draw term loan and revolving line of credit under the current and previous credit agreements approximate their fair values as of December 31, 2017 and 2016 due to the variable rate nature of the agreements. The carrying amount of the obligations associated with our capital leases and vehicle and equipment notes approximate fair value as of December 31, 2017 and 2016 because we have incurred the obligations within recent fiscal years when the interest rate markets have been low and stable despite the changes in the interest rate environment in 2017. Refinancing these obligations at current market rates would result in similar balances. All debt classifications represent Level 2 fair value measurements.
55
Table of Contents
INSTALLED BUILDING PRODUCTS, INC.
NOTES TO CONSOLIDATED FINANCIAL STATEMENTS
Recently Adopted Accounting Pronouncements
We have not recently adopted any new accounting pronouncements that have had a material impact on our financial statements. We continuously review the Federal Accounting Standards Board’s issued Accounting Standards Updates to ensure we have adopted all current accounting pronouncements, and include any such standard adoptions that are deemed to have a material impact on our financial statements herein.
Recently Issued Accounting Pronouncements Not Yet Adopted
In May 2014, the FASB issued ASU 2014-09, “Revenue from Contracts with Customers (Topic 606).” ASU 2014-09 and related subsequently issued amendments set forth a new revenue recognition model that requires identifying the contract(s) with a customer, identifying the performance obligations in the contract, determining the transaction price, allocating the transaction price to the performance obligations and recognizing the revenue upon satisfaction of performance obligations. In July 2015, the FASB voted to defer the application of the provisions of this standard for public companies until annual reporting periods beginning after December 15, 2017, including interim periods within those reporting periods. We commenced our evaluation of the impact of ASC 606 in late 2016, by evaluating its impact on selected contracts. Based on our initial review of those select contracts, we developed a project plan to evaluate numerous contracts across our business and assess the internal control structure in order to adopt ASC 606 on January 1, 2018. We have periodically briefed our Audit Committee on our progress made towards adoption. As of December 31, 2017, we have completed our assessment on the applicability of the standard on accounting for contracts with customers. The standard will result in a change to the timing of revenue recognition for certain of our contracts that, under ASC 605, we currently recognize revenue on a performance obligation level as each obligation is completed whereas, under ASC 606, we will recognize revenue associated with these contracts over time as service is performed and the transfer of control occurs based on a percentage-of-completion method using input methods as a measure of progress. We do not expect the impact on our revenue recognition to be material for our contracts that are currently recognized under the existing percentage-of-completion method of accounting, due to the inherent similarities of the over time methodology of revenue recognition to percentage-of-completion. We adopted the new standard on January 1, 2018, using the modified retrospective approach, and as such will recognize the cumulative effect of initially applying the standard as an adjustment to the opening balance of retained earnings on January 1, 2018. The estimated adjustment to our opening retained earnings on January 1, 2018, as a result of implementation of this ASU, is estimated to be approximately $3.0 million.
In February 2016, the FASB issued ASU 2016-02, “Leases (Topic 842).” This update amends the existing accounting standards for lease accounting, including requiring lessees to recognize most leases on their balance sheets and making targeted changes to lessor accounting. ASU 2016-02 requires a modified retrospective transition approach for all leases existing at, or entered into after, the date of initial application, with an option to use certain transition relief. For public business entities, this update is effective for annual reporting periods beginning after December 15, 2018, including interim periods within those fiscal years, and early adoption is permitted as of the standard’s issuance date. We have not completed our assessment, but we expect the adoption of this standard will have a significant impact on our Consolidated Balance Sheets. Information about our undiscounted future lease payments and the timing of those payments is in Note 14, Commitments and Contingencies, in our Form 10-K. We will adopt this standard effective January 1, 2019.
In June 2016, the FASB issued ASU 2016-13, “Financial Instruments – Credit Losses (Topic 326): Measurement of Credit Losses on Financial Instruments.” This ASU amends the accounting for credit losses on available-for-sale debt securities and purchased financial assets with credit deterioration. In addition, these amendments require the measurement of all expected credit losses for financial assets, including trade accounts receivable, held at the reporting date based on historical experience, current conditions and reasonable and
56
Table of Contents
INSTALLED BUILDING PRODUCTS, INC.
NOTES TO CONSOLIDATED FINANCIAL STATEMENTS
supportable forecasts. For public business entities, this update is effective for financial statements issued for fiscal years beginning after December 15, 2019 and interim periods within those fiscal years. We are evaluating whether this ASU will have a material impact on our consolidated financial statements.
In August 2016, the FASB issued ASU 2016-15, “Statement of Cash Flows: Clarification of Certain Cash Receipts and Cash Payments (Topic 230).” This ASU addresses the diversity in practice related to the classification of certain cash receipts and payments in the statement of cash flows by adding or clarifying guidance on eight specific cash flow issues. We have determined that this update addresses one issue that specifically impacts us, which is the classification of contingent consideration payments made after a business combination. We adopted the new provision on January 1, 2018 and as such will classify contingent consideration payments in excess of the recorded contingent liability not made soon after the acquisition date as operating activities on the cash flow statement. Cash payments made soon after the acquisition date will be classified as investing activities.
In August 2017, the FASB issued ASU 2017-12, “Derivatives and Hedging (Topic 815): Targeted Improvements to Accounting for Hedging Activities.” This ASU better aligns a company’s risk management activities and financial reporting for hedging relationships and makes certain improvements to simplify the application of hedge accounting guidance. For public business entities, this update is effective for financial statements issued for fiscal years beginning after December 15, 2018 and interim periods within those fiscal years. We are evaluating whether this ASU will have a material impact on our consolidated financial statements.
NOTE 3 – INVESTMENTS
Cash and cash equivalents includes investments in money market funds that are valued based on the net asset value of the funds. The cash equivalents consist primarily of money market funds that are Level 1 measurements. The investments in these funds were $55.6 million as of December 31, 2017. We had no such investments as of December 31, 2016.
All other investments are classified as held-to-maturity and consist of highly liquid instruments including primarily corporate bonds and commercial paper. As of December 31, 2017, the amortized cost of these investments equaled the net carrying value, which was $30.1 million. We had no such investments as of December 31, 2016. All held-to-maturity securities as of December 31, 2017 mature in one year or less. See Note 8, Fair Value Measurements, for additional information.
NOTE 4 – PROPERTY AND EQUIPMENT
Property and equipment consisted of the following (in thousands):
| As of December 31, | ||||||||
| 2017 | 2016 | |||||||
| Land |
$ | 66 | $ | 66 | ||||
| Buildings |
218 | 218 | ||||||
| Leasehold improvements |
6,152 | 5,235 | ||||||
| Furniture, fixtures and equipment |
30,863 | 26,344 | ||||||
| Vehicles and equipment |
153,744 | 124,861 | ||||||
|
|
|
|
|
|||||
| 191,043 | 156,724 | |||||||
| Less: accumulated depreciation and amortization |
(109,968 | ) | (88,936 | ) | ||||
|
|
|
|
|
|||||
| $ | 81,075 | $ | 67,788 | |||||
|
|
|
|
|
|||||
57
Table of Contents
INSTALLED BUILDING PRODUCTS, INC.
NOTES TO CONSOLIDATED FINANCIAL STATEMENTS
During the twelve months ended December 31, 2017 and 2016 we recorded the following depreciation and amortization expense on our property and equipment, by income statement category (in thousands):
| As of December 31, | ||||||||||||
| 2017 | 2016 | 2015 | ||||||||||
| Cost of sales |
$ | 26,731 | $ | 22,294 | $ | 16,101 | ||||||
| Administrative |
1,554 | 1,276 | 874 | |||||||||
Property and equipment as of December 31, 2017 and 2016 of $49.7 million and $42.7 million, respectively, were fully depreciated but still being utilized in our business.
NOTE 5 – GOODWILL AND INTANGIBLES
Goodwill
The change in carrying amount of goodwill was as follows (in thousands):
| Goodwill (Gross) |
Accumulated Impairment Losses |
Goodwill (Net) |
||||||||||
| January 1, 2016 |
$ | 160,516 | $ | (70,004 | ) | $ | 90,512 | |||||
| Business combinations |
16,918 | — | 16,918 | |||||||||
| Other |
(344 | ) | — | (344 | ) | |||||||
|
|
|
|
|
|
|
|||||||
| December 31, 2016 |
177,090 | (70,004 | ) | 107,086 | ||||||||
| Business combinations |
47,727 | — | 47,727 | |||||||||
| Other |
653 | — | 653 | |||||||||
|
|
|
|
|
|
|
|||||||
| December 31, 2017 |
$ | 225,470 | $ | (70,004 | ) | $ | 155,466 | |||||
|
|
|
|
|
|
|
|||||||
Other changes included in the above table for the years ended December 31, 2017 and 2016 include minor adjustments for the allocation of certain acquisitions still under measurement. In addition, other changes for the year ended December 31, 2017 include multiple immaterial tuck-in acquisitions. For additional information regarding changes to goodwill resulting from acquisitions, see Note 15, Business Combinations.
At October 1, 2017, our measurement date, we performed a qualitative analysis that weighed all evidence of potential impairment, whether positive or negative, and determined that no factors existed that indicated an impairment of goodwill more likely than not existed. As such, no impairment of goodwill was recognized for the year ended December 31, 2017. In addition, no impairment of goodwill was recognized for the years ended December 31, 2016 or 2015.
58
Table of Contents
INSTALLED BUILDING PRODUCTS, INC.
NOTES TO CONSOLIDATED FINANCIAL STATEMENTS
Intangibles, net
The following table provides the gross carrying amount, accumulated amortization and net book value for each major class of intangibles (in thousands):
| As of December 31, | ||||||||||||||||||||||||
| 2017 | 2016 | |||||||||||||||||||||||
| Gross Carrying Amount |
Accumulated Amortization |
Net Book Value |
Gross Carrying Amount |
Accumulated Amortization |
Net Book Value |
|||||||||||||||||||
| Amortized intangibles: |
||||||||||||||||||||||||
| Customer relationships |
$ | 121,015 | $ | 38,651 | $ | 82,364 | $ | 80,909 | $ | 27,533 | $ | 53,376 | ||||||||||||
| Covenants not-to-compete |
11,807 | 4,773 | 7,034 | 8,602 | 2,466 | 6,136 | ||||||||||||||||||
| Trademarks and tradenames |
58,136 | 14,076 | 44,060 | 37,303 | 10,498 | 26,805 | ||||||||||||||||||
| Backlog |
13,600 | 9,067 | 4,533 | — | — | — | ||||||||||||||||||
|
|
|
|
|
|
|
|
|
|
|
|
|
|||||||||||||
| $ | 204,558 | $ | 66,567 | $ | 137,991 | $ | 126,814 | $ | 40,497 | $ | 86,317 | |||||||||||||
|
|
|
|
|
|
|
|
|
|
|
|
|
|||||||||||||
There was no intangible asset impairment loss for the years ended December 31, 2017, 2016 and 2015.
The gross carrying amount of intangibles increased approximately $77.7 million and $30.4 million during the years ended December 31, 2017 and 2016, respectively. Intangibles associated with business combinations accounted for approximately $76.8 million and $30.3 million of the increases during the years ended December 31, 2017 and 2016, respectively, with the remaining changes due to other factors. For more information, see Note 15, Business Combinations. Amortization expense on intangible assets totaled approximately $26.9 million, $11.3 million and $6.3 million during the years ended December 31, 2017, 2016 and 2015, respectively. Remaining estimated aggregate annual amortization expense is as follows (in thousands):
| 2018 |
$ | 23,516 | ||
| 2019 |
18,387 | |||
| 2020 |
17,671 | |||
| 2021 |
16,653 | |||
| 2022 |
15,735 | |||
| Thereafter |
46,029 |
59
Table of Contents
INSTALLED BUILDING PRODUCTS, INC.
NOTES TO CONSOLIDATED FINANCIAL STATEMENTS
NOTE 6 – LONG-TERM DEBT
Long-term debt consisted of the following (in thousands):
| As of December 31, | ||||||||
| 2017 | 2016 | |||||||
| Term loans, in effect, net of unamortized debt issuance costs of $5,146 and $447, respectively |
$ | 293,354 | $ | 95,803 | ||||
| Delayed draw term loans, in effect, net of unamortized debt issuance costs of $0 and $50, respectively |
— | 12,450 | ||||||
| Vehicle and equipment notes, maturing December 2022; payable in various monthly installments, including interest rates ranging from 2% to 4.5% |
50,357 | 38,186 | ||||||
| Various notes payable, maturing through March 2025; payable in various monthly installments, including interest rates ranging from 4% to 6% |
3,866 | 4,988 | ||||||
|
|
|
|
|
|||||
| 347,577 | 151,427 | |||||||
| Less: current maturities |
(16,650 | ) | (17,192 | ) | ||||
|
|
|
|
|
|||||
| Long-term debt, less current maturities |
$ | 330,927 | $ | 134,235 | ||||
|
|
|
|
|
|||||
On April 13, 2017, we entered into a term loan credit agreement (the “Term Loan Agreement”) which provides for a seven-year $300.0 million term loan facility (the “Term Loan”) and an asset-based lending credit agreement (the “ABL Credit Agreement” and together with the Term Loan Agreement, the “Senior Secured Credit Agreements”) which provides for up to approximately $100.0 million with a sublimit up to $50.0 million for the issuance of letters of credit (the “ABL Revolver” and together with the Term Loan, the “Senior Secured Credit Facilities”), which may be reduced or increased pursuant to the ABL Credit Agreement. The borrowing base for the ABL Revolver, which determines availability under the facility, is based on a percentage of the value of certain assets securing the obligations of the Company and the subsidiary guarantors under the ABL Credit Agreement. Proceeds from the Senior Secured Credit Facilities were used to repay in full all amounts outstanding under the Credit and Security Agreement (the “Credit and Security Agreement”), dated as of February 29, 2016, by and among the Company and the lenders named therein.
The Term Loan was amended on November 30, 2017 (the “Amendment”) to refinance the total principal amount of the Term Loan outstanding under the Term Loan Agreement immediately prior to the effective date of the Amendment, or an aggregate principal amount of $299.3 million, on substantially the same terms as the initial term loan, except for (i) a decrease in the Applicable Margins (as defined below) applicable to the base rate and Eurodollar rate loans, (ii) an increase in the cap on permitted indebtedness related to capital expenditures other than capital lease obligations and (iii) the inclusion of a mechanism to establish an alternative Eurodollar rate if certain circumstances have arisen such that the London Interbank Offered Rate may no longer be used. The ABL Credit Agreement was amended in December 2017 to revise the formula for maximum indebtedness incurred by the Company while subject to the ABL Credit Agreement. The Term Loan amortizes in quarterly principal payments of approximately $0.8 million, with any remaining unpaid balances due on April 15, 2024, which is the maturity date. Loans incurred under the ABL Revolver will have a final maturity of April 13, 2022.
Subject to certain exceptions, the Term Loan will be subject to mandatory pre-payments equal to (i) 100% of the net cash proceeds from issuances or incurrence of debt by the Company or any of its restricted subsidiaries (other than with respect to certain permitted indebtedness); (ii) 100% of the net cash proceeds from certain sales or dispositions of assets by the Company or any of its restricted subsidiaries in excess of a certain amount and
60
Table of Contents
INSTALLED BUILDING PRODUCTS, INC.
NOTES TO CONSOLIDATED FINANCIAL STATEMENTS
subject to customary reinvestment provisions and certain other expenses; and (iii) 50% (with step-downs to 25% and 0% based upon achievement of specified net leverage ratios) of excess cash flow of the Company and its restricted subsidiaries in excess of $5.0 million, subject to customary exceptions and limitations.
Loans under the Senior Secured Credit Facilities bear interest based on, at the Company’s election, either the base rate or the Eurodollar rate plus, in each case, an applicable margin (the “Applicable Margin”). The Applicable Margin in respect of loans under (i) the Term Loan Agreement will be (A) 2.50% in the case of Eurodollar rate loans and (B) 1.50% in the case of base rate loans, and (ii) the ABL Facility will be (A) 1.25%, 1.50% or 1.75% in the case of Eurodollar rate loans (based on a measure of availability under the ABL Facility) and (B) 0.25%, 0.50% or 0.75% in the case of base rate loans (based on a measure of availability under the ABL Facility).
In addition, we will pay customary commitment fees and letter of credit fees under the ABL Credit Agreement. The commitment fees will vary based upon a measure of our utilization under the ABL Revolver.
The Senior Secured Credit Agreements each contain a number of customary affirmative and negative non-financial covenants, and the ABL Credit Agreement also contains a financial covenant requiring the satisfaction of a minimum fixed charge coverage ratio of 1.00 to 1.00 in the event that we do not meet a minimum measure of availability under the ABL Revolver.
Vehicle and Equipment Notes
We are party to a Master Loan and Security Agreement (“Master Loan and Security Agreement”), a Master Equipment Lease Agreement (“Master Equipment Agreement”) and one or more Master Loan Agreements (“Master Loan Agreements”) with various lenders to provide financing for the purpose of purchasing or leasing vehicles and equipment used in the normal course of business. Each financing arrangement under these agreements constitutes a separate note and obligation. Vehicles and equipment purchased or leased under each financing arrangement serve as collateral for the note applicable to such financing arrangement. Regular payments are due under each note for a period of typically 60 consecutive months after the incurrence of the obligation. The specific terms of each note are based on specific criteria, including the type of vehicle or equipment and the market interest rates at the time. No termination date applies to these agreements. One of these Master Loan Agreements, entered into in November 2017, is with US Bank and provides for up to $100.0 million. The facility is subject to a 60-month term with interest rates being set at the time of funding. As of December 31, 2017, substantially all of the $100.0 million US Bank Master Loan was available for purchases of equipment.
Total gross assets relating to our master loan and equipment agreements were $74.5 million and $48.7 million as of December 31, 2017 and 2016, respectively, none of which were fully depreciated as of December 31, 2017 or 2016, respectively. The net book value of assets under these agreements was $51.4 million and $38.0 million as of December 31, 2017 and 2016, respectively. Depreciation of assets held under these agreements is included within cost of sales on the Consolidated Statements of Operations and Comprehensive Income.
61
Table of Contents
INSTALLED BUILDING PRODUCTS, INC.
NOTES TO CONSOLIDATED FINANCIAL STATEMENTS
NOTE 7 – COSTS AND ESTIMATED EARNINGS ON UNCOMPLETED CONTRACTS
Uncompleted contracts were as follows (in thousands):
| As of December 31, 2017 |
||||
| Costs incurred on uncompleted contracts |
$ | 79,235 | ||
| Estimated earnings |
44,035 | |||
|
|
|
|||
| Total |
123,270 | |||
| Less: Billings to date |
121,464 | |||
|
|
|
|||
| Net under (over) billings |
$ | 1,806 | ||
|
|
|
|||
Net under (over) billings were as follows (in thousands):
| As
of |
||||
| Costs and estimated earnings in excess of billings on uncompleted contracts |
$ | 6,182 | ||
| Billings in excess of costs and estimated earnings on uncompleted contracts |
(4,376 | ) | ||
|
|
|
|||
| Net under (over) billings |
$ | 1,806 | ||
|
|
|
|||
The asset, costs and estimated earnings in excess of billings on uncompleted contracts, represents revenues recognized in excess of amounts billed and is included in other current assets in our Consolidated Balance Sheets. The liability, billings in excess of costs and estimated earnings on uncompleted contracts, represents billings in excess of revenues recognized and is included in other current liabilities in our Consolidated Balance Sheets.
NOTE 8 – FAIR VALUE MEASUREMENTS
Fair Values
Fair value is the price that would be received for an asset or paid to transfer a liability (an exit price) in the principal or most advantageous market for the asset or liability in an orderly transaction between market participants on the measurement date.
ASC 820, “Fair Value Measurement,” establishes a fair value hierarchy that requires an entity to maximize the use of observable inputs and minimize the use of unobservable inputs when measuring fair value. The standard describes three levels of inputs that may be used to measure fair value:
Level 1: Quoted prices (unadjusted) for identical assets or liabilities in active markets that the entity has the ability to access as of the measurement date.
Level 2: Significant other observable inputs other than Level 1 prices such as quoted prices for similar assets or liabilities; quoted prices in markets that are not active; or other inputs that are observable or can be corroborated by observable market data.
Level 3: Significant unobservable inputs that reflect a reporting entity’s own assumptions about the assumptions that market participants would use in pricing an asset or liability.
Assets and Liabilities Measured at Fair Value on a Recurring Basis
In many cases, a valuation technique used to measure fair value includes inputs from multiple levels of the fair value hierarchy. The lowest level of significant input determines the placement of the entire fair value
62
Table of Contents
INSTALLED BUILDING PRODUCTS, INC.
NOTES TO CONSOLIDATED FINANCIAL STATEMENTS
measurement in the hierarchy. During the periods presented, there were no transfers between fair value hierarchical levels.
Assets Measured at Fair Value on a Nonrecurring Basis
Certain assets are measured at fair value on a nonrecurring basis in periods subsequent to initial recognition. Assets measured at fair value on a nonrecurring basis as of December 31, 2017 and 2016 are categorized based on the lowest level of significant input to the valuation. The assets are measured at fair value when our impairment assessment indicates a carrying value for each of the assets in excess of the asset’s estimated fair value. Undiscounted cash flows, a Level 3 input, are utilized in determining estimated fair values. During each of the years ended December 31, 2017, 2016 and 2015, we did not record any impairments on these assets required to be measured at fair value on a nonrecurring basis. See the “Impairment of Other Intangible and Long-Lived Assets” caption of Note 2, Significant Accounting Policies, for more information.
Estimated Fair Value of Financial Instruments
The fair values of financial assets and liabilities not described above were as follows (in thousands):
| As of December 31, 2017 | ||||||||||||||||
| Total | Level 1 | Level 2 | Level 3 | |||||||||||||
| Financial assets: |
||||||||||||||||
| Cash equivalents |
$ | 55,634 | $ | 55,634 | $ | — | $ | — | ||||||||
| Investments |
30,038 | — | 30,038 | — | ||||||||||||
| Derivative financial instruments, net of tax |
618 | 618 | ||||||||||||||
|
|
|
|
|
|
|
|
|
|||||||||
| Total financial assets |
$ | 86,290 | $ | 55,634 | $ | 30,656 | $ | — | ||||||||
|
|
|
|
|
|
|
|
|
|||||||||
We had no such items upon which to report fair value as of December 31, 2016. See Note 3, Investments, for more information on cash equivalents and investments included in the table above. Also see Note 9, Derivatives and Hedging Activities, for more information on derivative financial instruments. In addition, see Note 2 for more information regarding our accounting for fair value instruments.
NOTE 9 – DERIVATIVES AND HEDGING ACTIVITIES
Risk Management Objective of Using Derivatives
We are exposed to certain risks arising from both our business operations and economic conditions. We manage exposure to a wide variety of business and operational risks through our core business activities. We manage economic risks, including interest rate, liquidity and credit risk primarily by overseeing the amount, sources and duration of debt funding and the use of derivative financial instruments. Specifically, we have entered into derivative financial instruments to manage exposure to interest rate movements that result in the receipt or payment of future known and uncertain cash amounts, the value of which are determined by interest rates. Our derivative financial instruments are used to manage differences in the amount, timing and duration of our known or expected cash receipts and known or expected cash payments principally related to our investments and borrowings.
Cash Flow Hedges of Interest Rate Risk
Our purpose for using interest rate derivatives is to add stability to interest expense and to manage our exposure to interest rate movements. To accomplish these objectives, we primarily use interest rate swaps as part of our
63
Table of Contents
INSTALLED BUILDING PRODUCTS, INC.
NOTES TO CONSOLIDATED FINANCIAL STATEMENTS
interest rate risk management strategy. Interest rate swaps designated as cash flow hedges involve the receipt of variable amounts from a counterparty in exchange for making fixed-rate payments over the life of the agreements without exchange of the underlying notional amount. As of December 31, 2017, we have two interest rate swaps with a beginning notional of $100.0 million that amortize quarterly to $95.3 million at a maturity date of May 31, 2022. We did not have any derivative instruments as of December 31, 2016.
The effective portion of changes in the fair value of derivatives designated and that qualify as cash flow hedges is recorded in accumulated other comprehensive income and is subsequently reclassified into earnings in the period that the hedged forecasted transaction affects earnings. During 2017, such derivatives were used to hedge the variable cash flows associated with existing variable-rate debt. The ineffective portion of the change in fair value of the derivatives, when present, is recognized directly in earnings. During the twelve months ended December 31, 2017, we recorded $0.1 million as a result of hedge ineffectiveness in earnings.
Amounts reported in accumulated other comprehensive income related to derivatives will be reclassified to interest expense, net as interest payments are made on our variable-rate debt. Over the next twelve months, we estimate that an additional $0.2 million will be reclassified as an increase to interest expense, net.
Additionally, we do not use derivatives for trading or speculative purposes and we currently do not have any derivatives that are not designated as hedges. As of December 31, 2017, the Company has not posted any collateral related to these agreements.
NOTE 10 – STOCKHOLDERS’ EQUITY
As of December 31, 2017, we had $0.5 million in accumulated other comprehensive income on our Consolidated Balance Sheet, which represents the effective portion of the unrealized gain on our derivative instruments. For additional information, see Note 9, Derivatives and Hedging Activities.
In March 2015, we entered into a share repurchase agreement with Installed Building Systems, Inc. (“IBS”), a related party, for the purchase of 315 thousand shares of our common stock for a purchase price of approximately $6.1 million or $19.23 per share, which represented a 7.5% discount to the last reported price of our common stock on March 13, 2015. The effect of these treasury shares reducing the number of common shares outstanding is reflected in our earnings per share calculation. For additional information, see Note 13, Related Party Transactions.
NOTE 11 – EMPLOYEE BENEFITS
Healthcare
We participate in multiple healthcare plans, of which our primary plan is partially self-funded with an insurance company paying benefits in excess of stop loss limits per individual. Our healthcare benefit expense (net of employee contributions) was approximately $17.4 million, $15.2 million and $11.8 million for the years ended December 31, 2017, 2016 and 2015, respectively, for all plans. An accrual for estimated healthcare claims incurred but not reported (“IBNR”) is included within accrued compensation on the Consolidated Balance Sheets and was $1.8 million and $1.7 million as of December 31, 2017 and 2016, respectively.
Workers’ Compensation
We participate in multiple workers’ compensation plans. Under these plans, for a significant portion of our business, we use a high deductible program to cover losses above the deductible amount on a per claim basis. We
64
Table of Contents
INSTALLED BUILDING PRODUCTS, INC.
NOTES TO CONSOLIDATED FINANCIAL STATEMENTS
accrue for the estimated losses occurring from both asserted and unasserted claims. Workers’ compensation liability for premiums is included in other current liabilities on the Consolidated Balance Sheets. Insurance claims and reserves include accruals of estimated settlements for known claims, as well as accruals of actuarial estimates of IBNR claims. In estimating these reserves, historical loss experience and judgments about the expected levels of costs per claim are considered. These claims are accounted for based on actuarial estimates of the undiscounted claims, including IBNR. We believe the use of actuarial methods to account for these liabilities provides a consistent and effective way to measure these highly judgmental accruals.
Workers’ compensation expense totaled $13.5 million, $12.1 million and $12.0 million for the years ended December 31, 2017, 2016 and 2015, respectively, and is included in cost of sales on the Consolidated Statements of Operations and Comprehensive Income. Workers’ compensation known claims and IBNR reserves included on the Consolidated Balance Sheets were as follows (in thousands):
| As of December 31, | ||||||||
| 2017 | 2016 | |||||||
| Included in other current liabilities |
$ | 5,899 | $ | 4,595 | ||||
| Included in other long-term liabilities |
8,721 | 7,052 | ||||||
|
|
|
|
|
|||||
| $ | 14,620 | $ | 11,647 | |||||
|
|
|
|
|
|||||
We also had an insurance receivable for claims that exceeded the stop loss limit included on the Consolidated Balance Sheets. This receivable offsets an equal liability included within the reserve amounts noted above and was as follows (in thousands):
| As of December 31, | ||||||||
| 2017 | 2016 | |||||||
| Included in other non-current assets |
$ | 1,826 | $ | 1,249 | ||||
Profit-Sharing Plans
We also participate in various profit-sharing and 401(k) plans. Certain plans provide that eligible employees can defer a portion of their wages into the trust, subject to current Internal Revenue Code rules and limitations. We provide a matching contribution of wages deferred by employees and can also make discretionary contributions to each plan. Certain plans allow for discretionary employer contributions only. These plans cover substantially all our eligible employees. During the years ended December 31, 2017, 2016 and 2015, we recognized 401(k) plan expenses of $1.6 million, $1.3 million and $0.8 million, respectively, which is included in administrative expenses on the accompanying Consolidated Statements of Operations and Comprehensive Income.
Share-Based Compensation
Directors
We periodically grant shares of restricted stock to members of our board of directors. Accordingly, we record compensation expense within administrative expenses on the Consolidated Statements of Operations and Comprehensive Income at the time of the grant.
In 2017, 2016 and 2015, we granted approximately six thousand, nine thousand and 13 thousand shares of restricted stock, respectively, at a price of $50.50, $34.23 and $22.74 per share, respectively (which represents market price on the grant dates), to non-employee members of our board of directors. Accordingly, for each of the years ended December 31, 2017, 2016 and 2015, we recorded $0.3 million in compensation expense related
65
Table of Contents
INSTALLED BUILDING PRODUCTS, INC.
NOTES TO CONSOLIDATED FINANCIAL STATEMENTS
to these grants within administrative expenses on the Consolidated Statements of Operations and Comprehensive Income at the time of grant. These shares vested on the grant date since there is no service period associated with these awards.
The weighted-average grant date fair value is the same as the issue price for all shares.
Employees – Common Stock Awards
During the twelve months ended December 31, 2017, we granted approximately 0.1 million shares of restricted stock which vest in three equal installments (rounded to the nearest whole share) on each of April 20, 2018, 2019 and 2020 to certain employees. During the twelve months ended December 31, 2016, we granted approximately 0.1 million shares of restricted stock which vest in three equal installments (rounded to the nearest whole share) on each of April 20, 2017, 2018 and 2019 to certain employees.
During the twelve months ended December 31, 2017, our employees surrendered approximately 11 thousand shares of our common stock to satisfy tax withholding obligations arising in connection with the vesting of such common stock awards previously issued under our 2014 Omnibus Incentive Plan. We recorded $2.7 million and $1.6 million in compensation expense related to these grants within administrative expenses on the Consolidated Statements of Operations and Comprehensive Income for the years ended December 31, 2017 and 2016, respectively. We recognized excess tax benefits within income tax provision on the Consolidated Statements of Operations and Comprehensive Income of approximately $0.6 million and $0.3 million for the years ended December 31 2017 and 2016, respectively.
As of December 31, 2017, there was $5.5 million of unrecognized compensation expense related to these nonvested common stock awards. This expense is subject to future adjustments for forfeitures and is expected to be recognized on a straight-line basis over the remaining weighted-average period of 2.0 years. Shares forfeited are returned as treasury shares and available for future issuances. See the table below for changes in shares and related weighted average fair market value per share.
Employees – Performance-Based Stock Awards
During the twelve months ended December 31, 2017, we established, and our Board of Directors approved, performance-based targets in connection with common stock awards to be issued to certain officers in 2018 contingent upon achievement of these targets. We recorded $0.9 million in compensation expense associated with these performance-based awards.
As of December 31, 2017, there was $1.7 million of unrecognized compensation expense related to nonvested performance-based common stock awards. This expense is subject to future adjustments for forfeitures and is expected to be recognized over the remaining weighted-average period of 1.9 years using the graded-vesting method. See the table below for changes in shares and related weighted average fair market value per share.
In addition, during the twelve months ended December 31, 2017, we established, and our Board of Directors approved, performance-based restricted stock awards to be issued to certain employees between 2018 and 2022 contingent upon achievement of certain performance targets. These awards will be accounted for as liability-based awards since they represent a predominantly-fixed monetary amount that will be settled with a variable number of common shares and as such are included in other long-term liabilities on the Consolidated Balance Sheets. We recorded $0.1 million in compensation expense associated with these performance-based awards. The unrecognized compensation expense associated with the liability-based awards is subject to fair value adjustment each reporting period, and is expected to be recognized on a straight-line basis over the remaining vesting period of 4 years.
66
Table of Contents
INSTALLED BUILDING PRODUCTS, INC.
NOTES TO CONSOLIDATED FINANCIAL STATEMENTS
Employees – Performance-Based Restricted Stock Units
During the twelve months ended December 31, 2017, we established, and our Board of Directors approved, performance-based restricted stock units in connection with common stock awards to be issued to certain employees in 2018 contingent upon achievement of a performance target. These units will be accounted for as equity-based awards that will be settled with a fixed number of common shares. We recorded $2.6 million in compensation expense associated with these performance-based units during the twelve months ended December 31, 2017.
As of December 31, 2017, there was $1.1 million of unrecognized compensation expense related to nonvested performance-based common stock units. This expense is subject to future adjustments for forfeitures and is expected to be recognized on a straight-line basis over the remaining weighted-average period of 0.3 years. See the table below for changes in shares and related weighted average fair market value per share.
Share-Based Compensation Summary
Amounts for each category of equity-based award for employees as of December 31, 2017 and changes during the twelve months ended December 31, 2017 were as follows:
| Common Stock Awards |
Performance-Based Stock Awards |
Performance-Based Restricted Stock Units |
||||||||||||||||||||||
| Awards | Weighted Average Fair Market Value Per Share |
Awards | Weighted Average Fair Market Value Per Share |
Units | Weighted Average Fair Market Value Per Share |
|||||||||||||||||||
| Nonvested awards/units at December 31, 2016 |
161,174 | $ | 26.36 | — | $ | — | — | $ | — | |||||||||||||||
| Granted |
101,241 | 52.00 | 77,254 | 41.00 | 74,818 | 52.16 | ||||||||||||||||||
| Vested |
(58,302 | ) | 26.43 | — | — | — | — | |||||||||||||||||
| Forfeited/Cancelled |
(1,782 | ) | 35.07 | — | — | (2,818 | ) | 52.00 | ||||||||||||||||
|
|
|
|
|
|
|
|
|
|
|
|
|
|||||||||||||
| Nonvested awards/units at December 31, 2017 |
202,331 | $ | 39.09 | 77,254 | $ | 41.00 | 72,000 | $ | 52.16 | |||||||||||||||
|
|
|
|
|
|
|
|
|
|
|
|
|
|||||||||||||
During the twelve months ended December 31, 2017 and 2016, we recorded the following stock compensation expense, by income statement category (in thousands):
| 2017 | 2016 | |||||||
| Cost of sales |
$ | 965 | $ | — | ||||
| Selling |
571 | — | ||||||
| Administrative |
5,055 | 1,894 | ||||||
|
|
|
|
|
|||||
| $ | 6,591 | $ | 1,894 | |||||
|
|
|
|
|
|||||
Administrative stock compensation expense includes all stock compensation earned by our administrative personnel, while cost of sales and selling stock compensation represents all stock compensation earned by our installation and sales employees, respectively.
As of December 31, 2017, approximately 2.6 million of the 3.0 million shares of common stock authorized for issuance were available for issuance under the 2014 Omnibus Incentive Plan.
67
Table of Contents
INSTALLED BUILDING PRODUCTS, INC.
NOTES TO CONSOLIDATED FINANCIAL STATEMENTS
NOTE 12 – INCOME TAXES
The provision for income taxes is comprised of (in thousands):
| Years ended December 31, | ||||||||||||
| 2017 | 2016 | 2015 | ||||||||||
| Current: |
||||||||||||
| Federal |
$ | 17,557 | $ | 18,307 | $ | 13,939 | ||||||
| State |
3,302 | 3,472 | 2,989 | |||||||||
|
|
|
|
|
|
|
|||||||
| 20,859 | 21,779 | 16,928 | ||||||||||
| Deferred: |
||||||||||||
| Federal |
(5,895 | ) | (338 | ) | (1,255 | ) | ||||||
| State |
(284 | ) | (267 | ) | (260 | ) | ||||||
|
|
|
|
|
|
|
|||||||
| (6,179 | ) | (605 | ) | (1,515 | ) | |||||||
|
|
|
|
|
|
|
|||||||
| Total tax expense |
$ | 14,680 | $ | 21,174 | $ | 15,413 | ||||||
|
|
|
|
|
|
|
|||||||
The reconciliation between our effective tax rate on net income and the federal statutory rate is as follows (dollars in thousands):
| Years ended December 31, | ||||||||||||||||||||||||
| 2017 | 2016 | 2015 | ||||||||||||||||||||||
| Income tax at federal statutory rate |
$ | 19,537 | 35.0 | % | $ | 20,864 | 35.0 | % | $ | 14,676 | 35.0 | % | ||||||||||||
| Stock compensation |
(581 | ) | (1.0 | %) | (227 | ) | (0.4 | %) | — | 0.0 | % | |||||||||||||
| Qualified Production Activity Deduction |
(1,715 | ) | (3.1 | %) | (1,776 | ) | (3.0 | %) | (1,347 | ) | (3.2 | %) | ||||||||||||
| Other permanent items |
197 | 0.4 | % | (92 | ) | (0.1 | %) | (69 | ) | (0.2 | %) | |||||||||||||
| Change in valuation allowance |
285 | 0.5 | % | 442 | 0.7 | % | 467 | 1.1 | % | |||||||||||||||
| Change in uncertain tax positions |
(1,807 | ) | (3.2 | %) | 66 | 0.1 | % | (559 | ) | (1.3 | %) | |||||||||||||
| State income taxes, net of federal benefit |
2,150 | 3.8 | % | 1,897 | 3.2 | % | 2,245 | 5.4 | % | |||||||||||||||
| Rate impact of the Tax Act |
(3,386 | ) | (6.1 | %) | — | — | % | — | — | % | ||||||||||||||
|
|
|
|
|
|
|
|||||||||||||||||||
| Total tax expense |
$ | 14,680 | 26.3 | % | $ | 21,174 | 35.5 | % | $ | 15,413 | 36.8 | % | ||||||||||||
|
|
|
|
|
|
|
|||||||||||||||||||
68
Table of Contents
INSTALLED BUILDING PRODUCTS, INC.
NOTES TO CONSOLIDATED FINANCIAL STATEMENTS
Components of the net deferred tax asset or liability are as follows (in thousands):
| As of December 31, | ||||||||
| 2017 | 2016 | |||||||
| Deferred Tax Assets |
||||||||
| Long-term |
||||||||
| Accrued reserves and allowances |
$ | 3,916 | $ | 1,866 | ||||
| Allowance for doubtful accounts |
426 | 448 | ||||||
| Inventories |
213 | 284 | ||||||
| Intangibles |
3,279 | 806 | ||||||
| Net operating loss carryforwards |
2,623 | 2,921 | ||||||
| Other current and long-term |
10 | 2 | ||||||
|
|
|
|
|
|||||
| Long-term deferred tax assets |
10,467 | 6,327 | ||||||
| Less: Valuation allowance |
(1,746 | ) | (2,415 | ) | ||||
|
|
|
|
|
|||||
| Net deferred tax assets |
8,721 | 3,912 | ||||||
| Deferred Tax Liabilities |
||||||||
| Long-term |
||||||||
| Accrued reserves and allowances |
(308 | ) | (565 | ) | ||||
| Property and equipment |
(1,453 | ) | (1,505 | ) | ||||
| Intangibles |
(3,543 | ) | (4,899 | ) | ||||
| Investment in partnership |
(9,189 | ) | (9,530 | ) | ||||
| Other |
(208 | ) | (62 | ) | ||||
|
|
|
|
|
|||||
| Long-term deferred tax liabilities |
(14,701 | ) | (16,561 | ) | ||||
|
|
|
|
|
|||||
| Net deferred tax liabilities |
$ | (5,980 | ) | $ | (12,649 | ) | ||
|
|
|
|
|
|||||
As of December 31, 2017, we have recorded a deferred tax asset of $2.6 million reflecting the benefit of $10.6 million in federal and state income tax net operating loss (NOL) carryforwards, the earliest of which expires in 2030.
Valuation Allowance
We assess the available positive and negative evidence to estimate if sufficient future taxable income will be generated to utilize the existing deferred tax assets on a jurisdiction and by tax filing entity basis. A significant piece of objective negative evidence evaluated is cumulative losses incurred over the most recent three-year period. Such objective evidence limits our ability to consider other subjective positive evidence such as our projections for future growth.
Based on this evaluation, a valuation allowance has been recorded as of December 31, 2017 and 2016 for the net deferred tax assets recorded on certain of our wholly owned subsidiaries. Such deferred tax assets relate primarily to net operating losses that are not more likely than not realizable. However, the amount of the deferred tax asset considered realizable could be adjusted if our estimate of future taxable income during the carryforward period changes, or if objective negative evidence in the form of cumulative losses is no longer present. Additional weight may be given to subjective evidence such as our projections for growth in this situation.
69
Table of Contents
INSTALLED BUILDING PRODUCTS, INC.
NOTES TO CONSOLIDATED FINANCIAL STATEMENTS
Uncertain Tax Positions
We are subject to taxation in the United States and various state jurisdictions. As of December 31, 2017, our tax years for 2014 through 2016 are subject to examination by the tax authorities. A rollforward of the gross unrecognized tax benefits is as follows (in thousands):
| Unrecognized tax benefit, January 1, 2016 |
$ | 3,586 | ||
| Increase as a result of tax positions taken during the period |
2,354 | |||
| Decrease as a result of tax positions taken during the period |
(1,356 | ) | ||
| Decrease as a result of expiring statutes |
(487 | ) | ||
|
|
|
|||
| Unrecognized tax benefit, December 31, 2016 |
4,097 | |||
| Increase as a result of tax positions taken during the period |
4,353 | |||
| Decrease as a result of tax positions taken during the period |
(2,311 | ) | ||
| Decrease as a result of expiring statutes |
(1,689 | ) | ||
|
|
|
|||
| Unrecognized tax benefit, December 31, 2017 |
$ | 4,450 | ||
|
|
|
Unrecognized tax benefits of $1.5 million at December 31, 2017 would affect the effective tax rate. Interest expense and penalties accrued related to uncertain tax positions as of December 31, 2017 are $0.1 million.
We expect a decrease to the amount of unrecognized tax benefits (exclusive of penalties and interest) within the next twelve months of zero to $1.1 million.
Determining uncertain tax positions and the related estimated amounts requires judgment and carry estimation risk. If future tax law changes or interpretations should come to light, or additional information should become known, our conclusions regarding unrecognized tax benefits may change.
Impacts of the Tax Cuts and Jobs Act
The Tax Act was enacted on December 22, 2017. The Tax Act reduces the U.S. federal corporate tax rate from 35% to 21%, which had a positive impact on our 2017 effective tax rate due to the revaluation of our ending net deferred tax liabilities, and we expect it will have a positive impact on our effective tax rate in 2018 and subsequent years.
Income tax expense (benefit) decreased $3.4 million for the year ended December 31, 2017, compared to 2016, due to the impact of the Tax Act. The Company recognized a $3.8 million tax benefit as a result of revaluing the ending net deferred tax liabilities from 35% to the newly enacted U.S. corporate income tax rate of 21%. The tax benefit was partially offset by tax expense of $0.4 million net amount for the revaluation of the uncertain tax positions and the valuation allowance.
The Company has recognized the tax impacts related to the revaluation of deferred tax assets and liabilities and included these amounts in its consolidated financial statements for the year ended December 31, 2017. The ultimate impact may differ from these provisional amounts, possibly materially, due to, among other things, additional analysis, changes in interpretations and assumptions the Company has made, additional regulatory guidance that may be issued, and actions the Company may take as a result of the Tax Act.
NOTE 13 – RELATED PARTY TRANSACTIONS
We sell installation services to other companies related to us through common or affiliated ownership and/or board of directors and/or management relationships. We also purchase services and materials and pay rent to companies with common or related ownership. For additional information, see Note 14, Commitments and Contingencies.
70
Table of Contents
INSTALLED BUILDING PRODUCTS, INC.
NOTES TO CONSOLIDATED FINANCIAL STATEMENTS
For the years ended December 31, 2017, 2016 and 2015, the amount of sales to common or related parties as well as the purchases from and rent expense paid to common or related parties were as follows (in thousands):
| Years ended December 31, | ||||||||||||
| 2017 | 2016 | 2015 | ||||||||||
| Sales |
$ | 10,250 | $ | 7,914 | $ | 6,720 | ||||||
| Purchases |
1,294 | 579 | 480 | |||||||||
| Rent |
1,154 | 635 | 598 | |||||||||
At December 31, 2017 and 2016, we had related party balances of approximately $2.0 million and $1.5 million, respectively, included in accounts receivable on our Consolidated Balance Sheets. These balances primarily represent trade accounts receivable arising during the normal course of business with various related parties. M/I Homes, Inc., a customer whose Chairman, President and Chief Executive Officer is a member of our Board of Directors, accounted for $1.0 million and $0.8 million of these balances as of December 31, 2017 and 2016, respectively.
On March 13, 2015, we entered into a share repurchase agreement with IBS for the purchase of 315 thousand shares of our common stock. Jeff Edwards, our Chief Executive Officer, is the President of IBS and, in such role, has sole voting and dispositive power over the shares held by IBS and is deemed the beneficial owner of the shares of our common stock held by IBS. For additional information, see Note 10, Stockholders’ Equity.
NOTE 14 – COMMITMENTS AND CONTINGENCIES
Accrued General Liability
Accrued general insurance reserves included on the Consolidated Balance Sheets were as follows (in thousands):
| As of December 31, | ||||||||
| 2017 | 2016 | |||||||
| Included in other current liabilities |
$ | 2,033 | $ | 1,949 | ||||
| Included in other long-term liabilities |
7,073 | 7,104 | ||||||
|
|
|
|
|
|||||
| $ | 9,106 | $ | 9,053 | |||||
|
|
|
|
|
|||||
We also had insurance receivables and an indemnification asset included on the Consolidated Balance Sheets that, in aggregate, offset an equal liability included within the reserve amounts noted above. The amounts were as follows (in thousands):
| As of December 31, | ||||||||
| 2017 | 2016 | |||||||
| Insurance receivable and indemnification asset for claims under a fully insured policy |
$ | 2,773 | $ | 2,773 | ||||
| Insurance receivable for claims that exceeded the stop loss limit |
2 | 26 | ||||||
|
|
|
|
|
|||||
| Total insurance receivables included in other non-current assets |
$ | 2,775 | $ | 2,799 | ||||
|
|
|
|
|
|||||
Leases
We are obligated under capital leases covering vehicles and certain equipment. The vehicle and equipment leases generally have initial terms ranging from four to six years. Total assets relating to capital leases were
71
Table of Contents
INSTALLED BUILDING PRODUCTS, INC.
NOTES TO CONSOLIDATED FINANCIAL STATEMENTS
approximately $63.4 million and $64.2 million as of December 31, 2017 and 2016, respectively, and a total of approximately $26.8 million and $22.8 million were fully depreciated as of December 31, 2017 and 2016, respectively. The net book value of assets under capital leases was approximately $13.0 million and $16.4 million as of December 31, 2017 and 2016, respectively. Amortization of assets held under capital leases is included within cost of sales on the Consolidated Statements of Operations and Comprehensive Income.
We also have several noncancellable operating leases, primarily for buildings, improvements, equipment and certain vehicles. These leases generally contain renewal options for periods ranging from one to five years and require us to pay all executory costs such as property taxes, maintenance and insurance.
Future minimum lease payments under noncancellable operating leases (with initial or remaining lease terms in excess of one year) and future minimum capital lease payments as of December 31, 2017 are as follows (in thousands):
| Capital Leases | Operating Leases | |||||||||||||||
| Related Party | Other | Total Operating | ||||||||||||||
| 2018 |
$ | 6,287 | $ | 950 | $ | 12,304 | $ | 13,254 | ||||||||
| 2019 |
4,322 | 837 | 9,911 | 10,748 | ||||||||||||
| 2020 |
1,688 | 574 | 6,775 | 7,349 | ||||||||||||
| 2021 |
882 | 591 | 2,932 | 3,523 | ||||||||||||
| 2022 |
25 | 609 | 1,795 | 2,404 | ||||||||||||
| Thereafter |
— | — | 2,523 | 2,523 | ||||||||||||
|
|
|
|
|
|
|
|
|
|||||||||
| 13,204 | $ | 3,561 | $ | 36,240 | $ | 39,801 | ||||||||||
|
|
|
|
|
|
|
|||||||||||
| Less: Amounts representing executory costs |
(326 | ) | ||||||||||||||
| Less: Amounts representing interest |
(733 | ) | ||||||||||||||
|
|
|
|||||||||||||||
| Total obligation under capital leases |
12,145 | |||||||||||||||
| Less: Current portion of capital leases |
(5,666 | ) | ||||||||||||||
|
|
|
|||||||||||||||
| Long term capital lease obligation |
$ | 6,479 | ||||||||||||||
|
|
|
|||||||||||||||
Total rent expense under these operating leases for the years ended December 31, 2017, 2016 and 2015 was approximately $15.1 million, $11.6 million and $9.4 million, respectively, which is included in the Consolidated Statements of Operations and Comprehensive Income as follows (in thousands):
| Years ended December 31, | ||||||||||||
| 2017 | 2016 | 2015 | ||||||||||
| Cost of Sales |
$ | 813 | $ | 848 | $ | 855 | ||||||
| Administrative |
14,310 | 10,732 | 8,507 | |||||||||
|
|
|
|
|
|
|
|||||||
| Total |
$ | 15,123 | $ | 11,580 | $ | 9,362 | ||||||
|
|
|
|
|
|
|
|||||||
Other Commitments and Contingencies
From time to time, various claims and litigation are asserted or commenced against us principally arising from contractual matters and personnel and employment disputes. In determining loss contingencies, management considers the likelihood of loss as well as the ability to reasonably estimate the amount of such loss or liability. An estimated loss is recorded when it is considered probable that such a liability has been incurred and when the amount of loss can be reasonably estimated. As litigation is subject to inherent uncertainties, we cannot be
72
Table of Contents
INSTALLED BUILDING PRODUCTS, INC.
NOTES TO CONSOLIDATED FINANCIAL STATEMENTS
certain that we will prevail in these matters. However, we do not believe that the ultimate outcome of any pending matters will have a material adverse effect on our consolidated financial position, results of operations or cash flows.
NOTE 15 – BUSINESS COMBINATIONS
As part of our ongoing strategy to expand geographically and increase market share in certain markets, we completed ten, nine and eight business combinations during the years ended December 31, 2017, 2016 and 2015, respectively, as well as insignificant tuck-in acquisitions merged into existing operations in 2017 and 2015, in which we acquired 100% of the voting equity interests in each acquired entity. Acquisition-related costs amounted to $3.9 million, $2.3 million and $1.1 million for the years ended December 31, 2017, 2016 and 2015, respectively, and are included in Administrative expenses on the Consolidated Statements of Operations and Comprehensive Income. The goodwill to be recognized in conjunction with these business combinations represents the excess cost of the acquired entity over the net amount assigned to assets acquired and liabilities assumed. We expect to deduct $47.2 million of goodwill for tax purposes as a result of 2017 acquisitions.
The largest of our 2017 acquisitions were Alpha, Columbia Shelving & Mirror Inc. and Charleston Shelving & Mirror, Inc. (collectively, “Columbia”) and All In Insulation, LLC d/b/a Astro Insulation (collectively, “Astro”). The remaining acquisitions were individually insignificant but material in the aggregate, as follows. Net Income (Loss), as noted below, includes amortization, taxes and interest allocations.
For the twelve months ended December 31, 2017 (in thousands):
| Name |
Date | Acquisition Type |
Cash Paid | Seller Obligations |
Fair Value of Common Stock Issued |
Total Purchase Price |
Revenue | Net Income (Loss) |
||||||||||||||||||||||||
| Alpha (1) |
1/5/2017 | Share | $ | 103,810 | $ | 2,002 | $ | 10,859 | $ | 116,671 | $ | 116,070 | $ | (1,148 | ) | |||||||||||||||||
| Columbia |
6/26/2017 | Asset | 8,768 | 225 | — | 8,993 | 6,046 | 86 | ||||||||||||||||||||||||
| Astro |
9/18/2017 | Asset | 9,144 | 482 | — | 9,626 | 1,829 | 11 | ||||||||||||||||||||||||
| Other |
Various | Asset | 15,645 | 2,419 | — | 18,064 | 20,457 | 573 | ||||||||||||||||||||||||
|
|
|
|
|
|
|
|
|
|
|
|
|
|||||||||||||||||||||
| Total |
$ | 137,367 | $ | 5,128 | $ | 10,859 | $ | 153,354 | $ | 144,402 | $ | (478 | ) | |||||||||||||||||||
|
|
|
|
|
|
|
|
|
|
|
|
|
|||||||||||||||||||||
| (1) | The cash paid included $21.7 million in contingent consideration to satisfy purchase price adjustments related to cash and net working capital requirements, earnout consideration based on Alpha’s change in EBITDA from 2015 and a customary holdback. These payments were based on fair value of each contingent payment at the time of acquisition and subsequently adjusted during the measurement period. We issued 282,577 shares of our common stock with a fair value of $10.9 million. |
For the twelve months ended December 31, 2016 (in thousands):
| Name |
Date | Acquisition Type |
Cash Paid | Seller Obligations |
Total Purchase Price |
Revenue | Net Income (Loss) |
|||||||||||||||||||||
| Alpine Insulation Co., Inc. |
4/12/2016 | Asset | $ | 21,151 | $ | 1,560 | $ | 22,711 | $ | 21,359 | $ | 1,370 | ||||||||||||||||
| East Coast |
10/17/2016 | Asset | 15,589 | 600 | 16,189 | 4,701 | 21 | |||||||||||||||||||||
| Other |
Various | Asset | 18,753 | 2,299 | 21,052 | 19,974 | (592 | ) | ||||||||||||||||||||
|
|
|
|
|
|
|
|
|
|
|
|||||||||||||||||||
| Total |
$ | 55,493 | $ | 4,459 | $ | 59,952 | $ | 46,034 | $ | 799 | ||||||||||||||||||
|
|
|
|
|
|
|
|
|
|
|
|||||||||||||||||||
73
Table of Contents
INSTALLED BUILDING PRODUCTS, INC.
NOTES TO CONSOLIDATED FINANCIAL STATEMENTS
For the twelve months ended December 31, 2015 (in thousands):
| Name |
Date | Acquisition Type |
Cash Paid | Seller Obligations |
Total Purchase Price |
Revenue | Net Income (Loss) |
|||||||||||||||||||||
| BDI |
3/12/2015 | Stock | $ | 30,680 | $ | 5,765 | $ | 36,445 | $ | 32,505 | $ | 2,023 | ||||||||||||||||
| CQ |
4/6/2015 | Stock | 5,193 | 2,319 | 7,512 | 7,839 | 556 | |||||||||||||||||||||
| Layman |
6/1/2015 | Asset | 9,088 | 600 | 9,688 | 8,211 | 516 | |||||||||||||||||||||
| Eastern |
8/10/2015 | Stock | 24,199 | 2,875 | 27,074 | 7,368 | 312 | |||||||||||||||||||||
| Other |
Various | Asset | 16,040 | 1,621 | 17,661 | 6,349 | (97 | ) | ||||||||||||||||||||
|
|
|
|
|
|
|
|
|
|
|
|||||||||||||||||||
| Total |
$ | 85,200 | $ | 13,180 | $ | 98,380 | $ | 62,272 | $ | 3,310 | ||||||||||||||||||
|
|
|
|
|
|
|
|
|
|
|
|||||||||||||||||||
Purchase Price Allocations
The estimated fair values of the assets acquired and liabilities assumed for the acquisitions, as well as total purchase prices and cash paid, approximated the following (in thousands):
| 2017 | ||||||||||||||||||||
| Alpha | Columbia | Astro | Other | Total | ||||||||||||||||
| Estimated fair values: |
||||||||||||||||||||
| Cash |
$ | 247 | $ | — | $ | — | $ | — | $ | 247 | ||||||||||
| Accounts receivable |
29,851 | 1,004 | 924 | 3,195 | 34,974 | |||||||||||||||
| Inventories |
1,852 | 704 | 296 | 1,544 | 4,396 | |||||||||||||||
| Other current assets |
4,500 | 8 | 36 | 96 | 4,640 | |||||||||||||||
| Property and equipment |
1,528 | 659 | 640 | 1,820 | 4,647 | |||||||||||||||
| Intangibles |
57,200 | 4,760 | 5,168 | 9,688 | 76,816 | |||||||||||||||
| Goodwill |
38,511 | 2,184 | 2,926 | 4,106 | 47,727 | |||||||||||||||
| Other non-current assets |
383 | 32 | — | 234 | 649 | |||||||||||||||
| Accounts payable and other current liabilities |
(17,401 | ) | (358 | ) | (364 | ) | (2,619 | ) | (20,742 | ) | ||||||||||
|
|
|
|
|
|
|
|
|
|
|
|||||||||||
| Fair value of assets acquired |
116,671 | 8,993 | 9,626 | 18,064 | 153,354 | |||||||||||||||
| Less fair value of common stock issued |
10,859 | — | — | — | 10,859 | |||||||||||||||
| Less seller obligations |
2,002 | 225 | 482 | 2,419 | 5,128 | |||||||||||||||
|
|
|
|
|
|
|
|
|
|
|
|||||||||||
| Cash paid |
$ | 103,810 | $ | 8,768 | $ | 9,144 | $ | 15,645 | $ | 137,367 | ||||||||||
|
|
|
|
|
|
|
|
|
|
|
|||||||||||
| 2016 | ||||||||||||||||
| Alpine | East Coast | Other | Total | |||||||||||||
| Estimated fair values: |
||||||||||||||||
| Cash |
$ | — | $ | 2,181 | $ | — | $ | 2,181 | ||||||||
| Accounts receivable |
3,959 | 3,093 | 2,502 | 9,554 | ||||||||||||
| Inventories |
700 | 332 | 1,183 | 2,215 | ||||||||||||
| Other current assets |
— | 1 | 24 | 25 | ||||||||||||
| Property and equipment |
656 | 666 | 1,616 | 2,938 | ||||||||||||
| Intangibles |
12,800 | 6,400 | 11,067 | 30,267 | ||||||||||||
| Goodwill |
6,642 | 4,346 | 5,933 | 16,921 | ||||||||||||
| Other non-current assets |
— | 116 | 345 | 461 | ||||||||||||
| Accounts payable and other current liabilities |
(2,046 | ) | (946 | ) | (1,618 | ) | (4,610 | ) | ||||||||
|
|
|
|
|
|
|
|
|
|||||||||
| Fair value of assets acquired |
22,711 | 16,189 | 21,052 | 59,952 | ||||||||||||
| Less seller obligations |
1,560 | 600 | 2,299 | 4,459 | ||||||||||||
|
|
|
|
|
|
|
|
|
|||||||||
| Cash paid |
$ | 21,151 | $ | 15,589 | $ | 18,753 | $ | 55,493 | ||||||||
|
|
|
|
|
|
|
|
|
|||||||||
74
Table of Contents
INSTALLED BUILDING PRODUCTS, INC.
NOTES TO CONSOLIDATED FINANCIAL STATEMENTS
| 2015 | ||||||||||||||||||||||||
| BDI | CQ | Layman | Eastern | Other | Total | |||||||||||||||||||
| Estimated fair values: |
||||||||||||||||||||||||
| Cash |
$ | 661 | $ | 100 | $ | — | $ | 165 | $ | — | $ | 926 | ||||||||||||
| Accounts receivable |
4,735 | 1,423 | 1,245 | 2,768 | 4,093 | 14,264 | ||||||||||||||||||
| Inventories |
980 | 152 | 267 | 335 | 720 | 2,454 | ||||||||||||||||||
| Other current assets |
368 | 39 | — | 109 | 32 | 548 | ||||||||||||||||||
| Property and equipment |
1,006 | 190 | 733 | 1,364 | 1,574 | 4,867 | ||||||||||||||||||
| Intangibles |
21,280 | 4,350 | 5,330 | 13,871 | 10,534 | 55,365 | ||||||||||||||||||
| Goodwill |
16,213 | 3,035 | 3,143 | 9,904 | 4,809 | 37,104 | ||||||||||||||||||
| Other non-current assets |
3,736 | — | — | 322 | 60 | 4,118 | ||||||||||||||||||
| Accounts payable and other current liabilities |
(3,303 | ) | (1,539 | ) | (1,030 | ) | (1,681 | ) | (2,220 | ) | (9,773 | ) | ||||||||||||
| Deferred income tax liabilities |
(5,495 | ) | — | — | — | (825 | ) | (6,320 | ) | |||||||||||||||
| Long-term debt |
— | — | — | (82 | ) | — | (82 | ) | ||||||||||||||||
| Other long-term liabilities |
(3,736 | ) | (238 | ) | — | (1 | ) | — | (3,975 | ) | ||||||||||||||
|
|
|
|
|
|
|
|
|
|
|
|
|
|||||||||||||
| Fair value of assets acquired |
36,445 | 7,512 | 9,688 | 27,074 | 18,777 | 99,496 | ||||||||||||||||||
| Gain on bargain purchase |
— | — | — | — | (1,116 | ) | (1,116 | ) | ||||||||||||||||
|
|
|
|
|
|
|
|
|
|
|
|
|
|||||||||||||
| Total purchase price |
36,445 | 7,512 | 9,688 | 27,074 | 17,661 | 98,380 | ||||||||||||||||||
| Less seller obligations |
5,765 | 2,319 | 600 | 2,875 | 1,621 | 13,180 | ||||||||||||||||||
|
|
|
|
|
|
|
|
|
|
|
|
|
|||||||||||||
| Cash paid |
$ | 30,680 | $ | 5,193 | $ | 9,088 | $ | 24,199 | $ | 16,040 | $ | 85,200 | ||||||||||||
|
|
|
|
|
|
|
|
|
|
|
|
|
|||||||||||||
Contingent consideration is included as “seller obligations” in the above table or within “fair value of assets acquired” if subsequently paid during the period presented. These contingent payments consist primarily of amounts based on working capital calculations, earnouts based on performance, and non-compete agreements, all of which are based on fair value at the time of acquisition. When these payments are expected to be made over one year from the acquisition date, the contingent consideration is discounted to net present value using our weighted average cost of capital (WACC).
Further adjustments to the allocation for each acquisition still under its measurement period are expected as third-party or internal valuations are finalized, certain tax aspects of the transaction are completed, contingent consideration is settled, and customary post-closing reviews are concluded during the measurement period attributable to each individual business combination. As a result, insignificant adjustments to the fair value of assets acquired, and in some cases total purchase price, have been made to certain business combinations since the date of acquisition and future adjustments may be made through the end of each measurement period. Goodwill and intangibles per the above table do not agree to the total gross increases of these assets as shown in Note 5, Goodwill and Intangibles, during the years ended December 31, 2017 and 2016 due to minor adjustments to goodwill for the allocation of certain acquisitions still under measurement, an immaterial goodwill reclassification in the year ended December 31, 2016 related to the prior period, as well as other immaterial intangible assets added during the ordinary course of business. In addition, goodwill and intangibles increased during the years ended December 31, 2017, 2016 and 2015 due to various immaterial tuck-in acquisitions that do not appear in the above tables.
The provisional amounts for Alpha originally reported in our Condensed Consolidated Balance Sheets included in our Quarterly Report on Form 10-Q for the period ended March 31, 2017 were adjusted to reflect the review and ongoing analysis of the fair value measurements. As a result of our continued evaluation during the measurement period, we increased goodwill by approximately $2.1 million, offset by a corresponding net reduction in various working capital accounts.
75
Table of Contents
INSTALLED BUILDING PRODUCTS, INC.
NOTES TO CONSOLIDATED FINANCIAL STATEMENTS
The provisional amounts for Columbia originally reported in our Condensed Consolidated Balance Sheets included in our Quarterly Report on Form 10-Q for the period ended June 30, 2017 were adjusted to reflect the review and ongoing analysis of the fair value measurements. As a result of our continued evaluation during the measurement period, we increased goodwill by approximately $0.5 million and our seller obligations by approximately $0.4 million for an adjustment to the fair value of a working capital contingent liability. These adjustments, as well as various other insignificant adjustments, resulted in a total purchase price increase for Columbia of approximately $0.6 million as reflected within the above table and were within applicable measurement period guidelines.
The fair value of the net assets acquired, including identifiable intangible assets, relating to one of the 2015 business combinations included in the “Other” column in the above table was approximately $4.8 million, which exceeds the purchase price of $3.7 million. Accordingly, we recognized the excess of the fair value of the net assets acquired over purchase price paid of approximately $1.1 million as a gain on bargain purchase. The gain on bargain purchase is included in other income in our Consolidated Statements of Operations and Comprehensive Income. Prior to recognizing the gain, we reassessed the fair value of the assets acquired and liabilities assumed in the business combination including consultation with our external valuation experts. Assets were valued using the same methodology as our other business combinations, including the use of a discounted cash flow model as well as several other factors. We believe we were able to acquire this entity for less than the fair value of its net assets due to an absence of multiple bidders combined with the significant improvement of our purchasing power.
Included in other noncurrent assets in the above table as of the year ended December 31, 2015 is an insurance receivable of $2.0 million and an indemnification asset in the amount of $1.7 million associated with the 2015 acquisition of BDI. These assets offset equal liabilities included in other long-term liabilities in the above table, which represent additional insurance reserves for which we may be liable. All amounts are measured at their acquisition date fair value. The indemnification asset has been reduced to $0.9 million as of December 31, 2017 due to an adjustment to an uncertain tax position related to this item.
Estimates of acquired intangible assets related to the acquisitions are as follows (dollars in thousands):
| 2017 | 2016 | 2015 | ||||||||||||||||||||||
| Acquired intangibles assets |
Estimated Fair Value |
Weighted Average Estimated Useful Life (yrs) |
Estimated Fair Value |
Weighted Average Estimated Useful Life (yrs) |
Estimated Fair Value |
Weighted Average Estimated Useful Life (yrs) |
||||||||||||||||||
| Customer relationships |
$ | 39,922 | 8 | $ | 18,511 | 9 | $ | 36,129 | 8 | |||||||||||||||
| Trademarks and trade names |
20,667 | 15 | 8,983 | 15 | 14,567 | 15 | ||||||||||||||||||
| Non-competition agreements |
2,628 | 5 | 2,773 | 5 | 4,668 | 5 | ||||||||||||||||||
| Backlog |
13,600 | 1.5 | — | — | — | — | ||||||||||||||||||
76
Table of Contents
INSTALLED BUILDING PRODUCTS, INC.
NOTES TO CONSOLIDATED FINANCIAL STATEMENTS
Pro Forma Information (unaudited)
The unaudited pro forma information has been prepared as if the 2017 acquisitions had taken place on January 1, 2016, the 2016 acquisitions had taken place on January 1, 2015 and the 2015 acquisitions had taken place on January 1, 2014. The unaudited pro forma information is not necessarily indicative of the results that we would have achieved had the transactions actually taken place on January 1, 2016, 2015 and 2014 and the unaudited pro forma information does not purport to be indicative of future financial operating results (in thousands, except for per share data).
| Unaudited Pro Forma for the years ended December 31, |
||||||||||||
| 2017 | 2016 | 2015 | ||||||||||
| Net revenue |
$ | 1,169,061 | $ | 1,058,707 | $ | 786,144 | ||||||
| Net income |
43,179 | 43,891 | 29,463 | |||||||||
| Basic and diluted net income per share |
1.36 | 1.39 | 0.94 | |||||||||
Unaudited pro forma net income reflects additional intangible asset amortization expense of $1.3 million, $17.5 million and $6.6 million for the years ended December 31, 2017, 2016 and 2015, respectively, as well as additional income tax expense of $0.7 million, $3.0 million and $1.7 million for the years ended December 31, 2017, 2016 and 2015, respectively, and additional interest expense of $1.8 million for the year ended December 31, 2016 that would have been recorded had the 2017 acquisitions taken place on January 1, 2016, the 2016 acquisitions taken place on January 1, 2015 and the 2015 acquisitions taken place on January 1, 2014.
NOTE 16 – INCOME PER COMMON SHARE
Basic net income per common share is calculated by dividing net income by the weighted average shares outstanding during the period, without consideration for common stock equivalents.
Diluted net income per common share is calculated by adjusting weighted average shares outstanding for the dilutive effect of common stock equivalents outstanding for the period, determined using the treasury stock method. Potential common stock is included in the diluted income per common share calculation when dilutive. The dilutive effect of outstanding restricted stock awards after application of the treasury stock method as of December 31, 2017, 2016 and 2015, was 117 thousand, 61 thousand and 36 thousand shares, respectively.
NOTE 17 – SUBSEQUENT EVENTS
On January 16, 2018, we acquired substantially all of the assets of Rocket Insulation & Coatings Inc. for total consideration of approximately $2.2 million, subject to a working capital adjustment. The initial accounting for the business combination was not complete at the time the financial statements were issued due to the timing of the acquisition and the filing of this Annual Report on Form 10-K. As a result, disclosures required under ASC 805-10-50, Business Combinations, cannot be made at this time.
In January 2018, we posted $10.0 million into a trust to serve as additional collateral for our workers’ compensation and general liability policies. Beginning January 2018, this $10.0 million is classified as restricted cash on our Consolidated Balance Sheets.
IBP’s Board of Directors has approved a stock repurchase program, effective as of March 2, 2018, pursuant to which we may repurchase up to $50 million of its outstanding common stock. The program will remain in effect until February 28, 2019, unless extended by the Board of Directors.
77
Table of Contents
INSTALLED BUILDING PRODUCTS, INC.
NOTES TO CONSOLIDATED FINANCIAL STATEMENTS
NOTE 18 – QUARTERLY FINANCIAL INFORMATION (UNAUDITED)
Summarized unaudited quarterly financial results for 2017 and 2016 is as follows (in thousands, except per share data):
| 2017 |
Three months ended | |||||||||||||||||||
| March 31 | June 30 | September 30 | December 31 | Total Year | ||||||||||||||||
| Net revenue |
$ | 255,669 | $ | 282,196 | $ | 295,193 | $ | 299,869 | $ | 1,132,927 | ||||||||||
| Gross profit |
72,172 | 84,928 | 85,581 | 81,345 | 324,026 | |||||||||||||||
| Net income |
6,364 | 11,973 | 12,010 | 10,793 | 41,140 | |||||||||||||||
| Comprehensive income |
6,364 | 11,896 | 12,042 | 11,345 | 41,647 | |||||||||||||||
| Basic and diluted net income per share |
0.20 | 0.38 | 0.38 | 0.34 | 1.30 | |||||||||||||||
| 2016 |
Three months ended | |||||||||||||||||||
| March 31 | June 30 | September 30 | December 31 | Total Year | ||||||||||||||||
| Net revenue |
$ | 191,698 | $ | 211,913 | $ | 225,392 | $ | 233,977 | $ | 862,980 | ||||||||||
| Gross profit |
54,591 | 62,243 | 67,260 | 68,354 | 252,448 | |||||||||||||||
| Net income |
5,813 | 9,993 | 11,549 | 11,081 | 38,436 | |||||||||||||||
| Comprehensive income |
5,813 | 9,993 | 11,549 | 11,081 | 38,436 | |||||||||||||||
| Basic and diluted net income per share |
0.19 | 0.32 | 0.37 | 0.35 | 1.23 | |||||||||||||||
| Item 9. | Changes in and Disagreements with Accountants on Accounting and Financial Disclosure |
Not applicable.
| Item 9A. | Controls and Procedures |
Evaluation of Disclosure Controls and Procedures
We conducted an evaluation of our disclosure controls and procedures (as defined in Rule 13a-15(e) under the Exchange Act) as of December 31, 2017 with the participation of the Company’s principal executive officer and principal financial officer as required by Exchange Act Rule 13a-15(b). Based on that evaluation, the Company’s principal executive officer and principal financial officer concluded that, as of December 31, 2017, our disclosure controls and procedures were effective to ensure that information required to be disclosed in the reports that we file or submit under the Exchange Act is recorded, processed, summarized and reported, within the time periods specified in the SEC’s rules and forms, and includes, without limitation, controls and procedures designed to ensure that information required to be disclosed by us in the reports we file or submit under the Exchange Act is accumulated and communicated to our management, including our principal executive officer and our principal financial officer, or persons performing similar functions, as appropriate to allow timely decisions regarding required disclosure.
Management’s Report on Internal Control over Financial Reporting
Our management is responsible for establishing and maintaining adequate internal control over financial reporting (as defined in Rule 13a-15(f) under the Exchange Act). Our internal control over financial reporting is a process designed to provide reasonable assurance regarding the reliability of financial reporting and the preparation of financial statements for external purposes in accordance with accounting principles generally accepted in the United States of America.
Management, under the supervision of the principal executive officer and the principal financial officer, assessed the effectiveness of our internal control over financial reporting, excluding the internal control over financial
78
Table of Contents
INSTALLED BUILDING PRODUCTS, INC.
NOTES TO CONSOLIDATED FINANCIAL STATEMENTS
reporting at the subsidiaries listed below that we acquired during 2017 as of December 31, 2017 using the criteria set forth by the Committee of Sponsoring Organizations of the Treadway Commission (COSO) in Internal Control – Integrated Framework (2013). The scope of management’s assessment of the effectiveness of internal control over financial reporting as of December 31, 2017 includes all of the Company’s subsidiaries except the subsidiaries listed below, which were acquired during 2017 and whose financial statements constitute the percentages of total assets and net revenue listed below of the consolidated financial statements of the Company as of and for the year ended December 31, 2017:
| Percentage of Total Assets |
Percentage of Net Revenue |
|||||||||
| Trilok Industries, Inc., Alpha Insulation and Waterproofing, Inc. and Alpha Insulation and Waterproofing Company |
January 5, 2017 | 18.0 | % | 10.2 | % | |||||
| Custom Glass Atlanta, Inc. & Atlanta Commercial Glazing, Inc. |
March 20, 2017 | 0.7 | % | 1.0 | % | |||||
| Legacy Glass & Supply, Inc. |
May 1, 2017 | 0.3 | % | 0.4 | % | |||||
| Columbia Shelving and Mirror & Charleston Shelving & Mirror |
June 26, 2017 | 1.3 | % | 0.5 | % | |||||
| Energy Savers, LLC |
July 31, 2017 | 0.1 | % | 0.1 | % | |||||
| Red Rock Insulation |
September 1, 2017 | 0.6 | % | 0.2 | % | |||||
| All In Insulation dba Astro Insulation |
September 18, 2017 | 1.3 | % | 0.2 | % | |||||
| A+ Insulation, LLC |
October 30, 2017 | 0.4 | % | 0.0 | % | |||||
| Allpro Insulation Co. |
December 11, 2017 | 0.1 | % | 0.0 | % | |||||
| Blind Ambitions LLC |
December 29, 2017 | 0.6 | % | 0.0 | % | |||||
Management excluded the internal control over financial reporting at these subsidiaries from its assessment in accordance with the guidance of the staff of the SEC that an assessment of a recently acquired business may be omitted from the scope of management’s assessment of internal control over financial reporting for one year following the acquisition. Based on this assessment, management has determined that our internal control over financial reporting was effective as of December 31, 2017.
The effectiveness of our internal control over financial reporting as of December 31, 2017, has been audited by Deloitte & Touche LLP, an independent registered public accounting firm, as stated in their report, which follows below.
Changes in Internal Control over Financial Reporting
There were no changes in our internal control over financial reporting identified in management’s evaluation pursuant to Rules 13a-15(d) or 15d-15(d) of the Exchange Act during the quarter ended December 31, 2017 that has materially affected, or are reasonably likely to materially affect, our internal control over financial reporting.
| Item 9B. | Other Information |
None.
79
Table of Contents
REPORT OF INDEPENDENT REGISTERED PUBLIC ACCOUNTING FIRM
To the Board of Directors and Stockholders of
Installed Building Products, Inc.
Opinion on Internal Control over Financial Reporting
We have audited the internal control over financial reporting of Installed Building Products, Inc. (the “Company”) as of December 31, 2017, based on criteria established in Internal Control – Integrated Framework (2013) issued by the Committee of Sponsoring Organizations of the Treadway Commission (COSO). In our opinion, the Company maintained, in all material respects, effective internal control over financial reporting as of December 31, 2017, based on criteria established in Internal Control – Integrated Framework (2013) issued by COSO.
We have also audited, in accordance with the standards of the Public Company Accounting Oversight Board (United States) (PCAOB), the consolidated financial statements as of and for the year ended December 31, 2017, of the Company and our report dated February 28, 2018, expressed an unqualified opinion on those financial statements.
As described in Management’s Report on Internal Control over Financial Reporting, management excluded from its assessment the internal control over financial reporting at the subsidiaries listed below, which were acquired during 2017 and whose financial statements constitute the percentages of total revenues and assets listed below of the consolidated financial statements of the Company as of and for the year ended December 31, 2017.
| Percentage of Total Assets |
Percentage of Net Revenue |
|||||||||
| Trilok Industries, Inc., Alpha Insulation and Waterproofing, Inc. and Alpha Insulation and Waterproofing Company |
January 5, 2017 | 18.0 | % | 10.2 | % | |||||
| Custom Glass Atlanta, Inc. & Atlanta Commercial Glazing, Inc. |
March 20, 2017 | 0.7 | % | 1.0 | % | |||||
| Legacy Glass & Supply, Inc. |
May 1, 2017 | 0.3 | % | 0.4 | % | |||||
| Columbia Shelving and Mirror & Charleston Shelving & Mirror |
June 26, 2017 | 1.3 | % | 0.5 | % | |||||
| Energy Savers, LLC |
July 31, 2017 | 0.1 | % | 0.1 | % | |||||
| Red Rock Insulation |
September 1, 2017 | 0.6 | % | 0.2 | % | |||||
| All In Insulation dba Astro Insulation |
September 18, 2017 | 1.3 | % | 0.2 | % | |||||
| A+ Insulation, LLC |
October 30, 2017 | 0.4 | % | 0.0 | % | |||||
| Allpro Insulation Co. |
December 11, 2017 | 0.1 | % | 0.0 | % | |||||
| Blind Ambitions LLC |
December 29, 2017 | 0.6 | % | 0.0 | % | |||||
Accordingly, our audit did not include the internal control over financial reporting of the subsidiaries listed above.
Basis for Opinion
The Company’s management is responsible for maintaining effective internal control over financial reporting and for its assessment of the effectiveness of internal control over financial reporting, included in the accompanying Management’s Report on Internal Control over Financial Reporting. Our responsibility is to express an opinion on the Company’s internal control over financial reporting based on our audit. We are a public accounting firm registered with the PCAOB and are required to be independent with respect to the Company in accordance with the U.S. federal securities laws and the applicable rules and regulations of the Securities and Exchange Commission and the PCAOB.
We conducted our audit in accordance with the standards of the PCAOB. Those standards require that we plan and perform the audit to obtain reasonable assurance about whether effective internal control over financial
80
Table of Contents
reporting was maintained in all material respects. Our audit included obtaining an understanding of internal control over financial reporting, assessing the risk that a material weakness exists, testing and evaluating the design and operating effectiveness of internal control based on the assessed risk, and performing such other procedures as we considered necessary in the circumstances. We believe that our audit provides a reasonable basis for our opinion.
Definition and Limitations of Internal Control over Financial Reporting
A company’s internal control over financial reporting is a process designed to provide reasonable assurance regarding the reliability of financial reporting and the preparation of financial statements for external purposes in accordance with generally accepted accounting principles. A company’s internal control over financial reporting includes those policies and procedures that (1) pertain to the maintenance of records that, in reasonable detail, accurately and fairly reflect the transactions and dispositions of the assets of the company; (2) provide reasonable assurance that transactions are recorded as necessary to permit preparation of financial statements in accordance with generally accepted accounting principles, and that receipts and expenditures of the company are being made only in accordance with authorizations of management and directors of the company; and (3) provide reasonable assurance regarding prevention or timely detection of unauthorized acquisition, use, or disposition of the company’s assets that could have a material effect on the financial statements.
Because of its inherent limitations, internal control over financial reporting may not prevent or detect misstatements. Also, projections of any evaluation of effectiveness to future periods are subject to the risk that controls may become inadequate because of changes in conditions, or that the degree of compliance with the policies or procedures may deteriorate.
/s/ Deloitte & Touche LLP
Columbus, Ohio
February 28, 2018
81
Table of Contents
PART III
| Item 10. | Directors, Executive Officers and Corporate Governance |
The information required by this item will be set forth under the headings “Election of Directors,” “Executive Officers and Certain Significant Employees,” “Corporate Governance” and “Section 16(a) Beneficial Ownership Reporting Compliance” in our definitive proxy statement for the 2018 Annual Meeting of Stockholders (“2018 Proxy Statement”) to be filed with the SEC within 120 days of the fiscal year ended December 31, 2017 and is incorporated herein by reference.
Our board of directors has adopted a code of business conduct and ethics that applies to all of our employees, officers and directors, including our Chief Executive Officer, Chief Financial Officer and other executive and senior financial officers. The full text of our code of business conduct and ethics is posted on the investor relations page on our website which is located at http://investors.installedbuildingproducts.com. We will post any amendments to our code of business conduct and ethics, or waivers of its requirements, on our website.
| Item 11. | Executive Compensation |
The information required by this item will be set forth under the headings “Executive Compensation,” “Pay Ratio Disclosure” and “Compensation Committee Interlocks and Insider Participation” in our 2018 Proxy Statement and is incorporated herein by reference.
| Item 12. | Security Ownership of Certain Beneficial Owners and Management and Related Stockholder Matters |
Information regarding security ownership of certain beneficial owners and management and related stockholder matters, as well as equity compensation plan information, will be presented in our Proxy Statement for our 2018 Annual Meeting of Stockholders, to be filed on or before April 20, 2018, and such information is incorporated herein by reference.
| Item 13. | Certain Relationships and Related Transactions, and Director Independence |
The information required by this item will be set forth under the headings “Certain Relationships and Related-Party Transactions” and “Corporate Governance” in our 2018 Proxy Statement and is incorporated herein by reference.
| Item 14. | Principal Accounting Fees and Services |
The information required by this item will be set forth under the heading “Independent Registered Public Accounting Firm Fees and Pre-Approval Policies and Procedures” in our 2018 Proxy Statement and is incorporated herein by reference.
82
Table of Contents
PART IV
| Item 15. | Exhibits and Financial Statement Schedule |
(a) The following documents are filed as a part of this Form 10-K:
| 1. | Financial Statements: The Consolidated Financial Statements, the Notes to Consolidated Financial Statements and the Report of Independent Registered Public Accounting Firm for Installed Building Products, Inc. are presented in Item 8, Financial Statements and Supplementary Data, of Part II of this Form 10-K. |
| 2. | Financial Schedules: All financial statement schedules have been omitted because they are inapplicable, not required, or shown in the consolidated financial statements and notes in Item 8, Financial Statements and Supplementary Data, of Part II of this Form 10-K. |
(b) Exhibits.
83
Table of Contents
84
Table of Contents
85
Table of Contents
| * | Filed herewith. |
| † | Schedules have been omitted pursuant to Item 601(b)(2) of Regulation S-K. The Company agrees to furnish supplemental copies of any of the omitted schedules to the Securities and Exchange Commission upon request. |
| # | Indicates management contract or compensatory plan. |
| Item 16. | Form 10-K Summary |
None
86
Table of Contents
Pursuant to the requirements of Section 13 or 15(d) of the Securities Exchange Act of 1934, the registrant has duly caused this report to be signed on its behalf by the undersigned, thereunto duly authorized.
Date: February 28, 2018
| INSTALLED BUILDING PRODUCTS, INC. | ||
| /s/ Jeffrey W. Edwards | ||
| By: | Jeffrey W. Edwards | |
| President and Chief Executive Officer | ||
Pursuant to the requirements of the Securities Exchange Act of 1934, this report has been signed below by the following persons on behalf of the registrant and in the capacities and on the dates indicated.
| Signature |
Title |
Date | ||
| /s/ Jeffrey W. Edwards Jeffrey W. Edwards |
President, Chief Executive Officer and Chairman of the Board of Directors (Principal Executive Officer) |
February 28, 2018 | ||
| /s/ Michael T. Miller Michael T. Miller |
Executive Vice President, Chief Financial Officer and Director (Principal Financial Officer) |
February 28, 2018 | ||
| /s/ Todd R. Fry Todd R. Fry |
Chief Accounting Officer (Principal Accounting Officer) |
February 28, 2018 | ||
| /s/ Margot L. Carter Margot L. Carter |
Director | February 28, 2018 | ||
| /s/ Lawrence A. Hilsheimer Lawrence A. Hilsheimer |
Director | February 28, 2018 | ||
| /s/ Janet E. Jackson Janet E. Jackson |
Director | February 28, 2018 | ||
| /s/ J. Michael Nixon J. Michael Nixon |
Director | February 28, 2018 | ||
| /s/ Robert H. Schottenstein Robert H. Schottenstein |
Director | February 28, 2018 | ||
| /s/ Michael H. Thomas Michael H. Thomas |
Director | February 28, 2018 | ||
| /s/ Vikas Verma Vikas Verma |
Director | February 28, 2018 | ||
87