Attached files
| file | filename |
|---|---|
| EX-32.2 - EXHIBIT 32.2 - GREENHILL & CO INC | ex322-ghlx12312017.htm |
| EX-32.1 - EXHIBIT 32.1 - GREENHILL & CO INC | ex321-ghlx12312017.htm |
| EX-31.2 - EXHIBIT 31.2 - GREENHILL & CO INC | ex312-ghlx12312017.htm |
| EX-31.1 - EXHIBIT 31.1 - GREENHILL & CO INC | ex311-ghlx12312017.htm |
| EX-23.1 - EXHIBIT 23.1 - GREENHILL & CO INC | exhibit231-ghl12312017.htm |
| EX-21.1 - EXHIBIT 21.1 - GREENHILL & CO INC | exhibit211-ghl12312017.htm |
UNITED STATES
SECURITIES AND EXCHANGE COMMISSION
Washington, DC 20549
_____________________________________________________________________________________
FORM 10-K
(Mark One)
þ | ANNUAL REPORT PURSUANT TO SECTION 13 OR 15(d) OF THE SECURITIES EXCHANGE ACT OF 1934 |
For the fiscal year ended December 31, 2017. | |
OR | |
¨ | TRANSITION REPORT PURSUANT TO SECTION 13 OR 15(d) OF THE SECURITIES EXCHANGE ACT OF 1934 |
For the transition period from to . | |
Commission file number 001-32147
______________________________________________________________________________
GREENHILL & CO., INC.
(Exact Name of Registrant as Specified in its Charter)
Delaware | 51-0500737 |
(State or Other Jurisdiction of Incorporation or Organization) | (I.R.S. Employer Identification No.) |
300 Park Avenue New York, New York | 10022 (ZIP Code) |
(Address of Principal Executive Offices) | |
Registrant’s telephone number, including area code: (212) 389-1500
Securities registered pursuant to Section 12(b) of the Act:
Title of each class | Name of each exchange on which registered |
Common Stock, par value $.01 per share | New York Stock Exchange |
Securities registered pursuant to Section 12(g) of the Act: None
Indicate by check mark if the registrant is a well-known seasoned issuer, as defined in Rule 405 of the Securities Act. Yes ¨ No þ
Indicate by check mark if the registrant is not required to file reports pursuant to Section 13 or 15(d) of the Act. Yes ¨ No þ
Indicate by check mark whether the registrant (1) has filed all reports required to be filed by Section 13 or 15(d) of the Securities Exchange Act of 1934 during the preceding 12 months (or for such shorter period that the registrant was required to file such reports), and (2) has been subject to such filing requirements for the past 90 days. Yes þ No ¨
Indicate by check mark whether the registrant has submitted electronically and posted on its corporate Web site, if any, every Interactive Data File required to be submitted and posted pursuant to Rule 405 of Regulation S-T (§ 232.405 of this chapter) during the preceding 12 months (or for such shorter period that the registrant was required to submit and post such files). Yes þ No ¨
Indicate by check mark if disclosure of delinquent filers pursuant to Item 405 of Regulation S-K (§ 229.405 of this chapter) is not contained herein, and will not be contained, to the best of registrant’s knowledge, in definitive proxy or information statements incorporated by reference in Part III of this Form 10-K or any amendment to this Form 10-K. þ
Indicate by check mark whether the registrant is a large accelerated filer, an accelerated filer, a non-accelerated filer, a smaller reporting company or an emerging growth company. See the definitions of “large accelerated filer,” “accelerated filer,” “smaller reporting company” and “emerging growth company” in Rule 12b-2 of the Exchange Act. (Check one):
Large accelerated filer ¨ | Accelerated filer þ | Non-accelerated filer ¨ | Smaller reporting company ¨ |
(Do not check if a smaller reporting company) | Emerging growth company ¨ | ||
If an emerging growth company, indicate by check mark if the registrant has elected not to use the extended transition period for complying with any new or revised financial accounting standards provided pursuant to Section 13(a) of the Exchange Act. ¨
Indicate by check mark whether the registrant is a shell company (as defined in Rule 12b-2 of the Exchange Act). Yes ¨ No ý
The aggregate market value of the common stock held by non-affiliates of the registrant, computed by reference to the closing price as of the last business day of the registrant’s most recently completed second fiscal quarter, June 30, 2017, was approximately $526 million. The registrant has no non-voting stock. As of February 15, 2018, there were 27,303,100 shares of the registrant’s common stock outstanding.
DOCUMENTS INCORPORATED BY REFERENCE
Part III of this Annual Report on Form 10-K incorporates by reference information from the definitive Proxy Statement for the registrant’s 2018 Annual Meeting of Stockholders or a Form10-K/A to be filed with the Securities and Exchange Commission not later than 120 days after the registrant’s fiscal year ended December 31, 2017.
TABLE OF CONTENTS
Page | ||
Item 1. | ||
Item 1A. | ||
Item 1B. | ||
Item 2. | ||
Item 3. | ||
Item 4. | ||
Item 5. | ||
Item 6. | ||
Item 7. | ||
Item 7A. | ||
Item 8. | ||
Item 9. | ||
Item 9A. | ||
Item 9B. | ||
Item 10. | ||
Item 11. | ||
Item 12. | ||
Item 13. | ||
Item 14. | ||
Item 15. | ||
2
PART I
When we use the terms “Greenhill”, “we”, “us”, “our”, “the Company”, and “the Firm”, we mean Greenhill & Co., Inc., a Delaware corporation, and its consolidated subsidiaries. Our principal advisory subsidiaries are Greenhill & Co., LLC, a registered broker-dealer regulated by the Securities and Exchange Commission which provides investment banking and capital advisory services in North America; Greenhill & Co. International LLP and Greenhill & Co. Europe LLP, which provide investment banking and capital advisory services in Europe and are regulated by the United Kingdom Financial Conduct Authority; Greenhill & Co. Australia Pty Limited, which provides investment banking and capital advisory services in Australia and is regulated by the Australian Securities and Investments Commission; and Greenhill Cogent, LP, a registered broker-dealer regulated by the Securities and Exchange Commission which provides capital advisory services in North America.
Item 1. Business
Overview
Greenhill is a leading independent investment bank that provides financial and strategic advice on significant domestic and cross-border mergers and acquisitions, divestitures, restructurings, financings, capital raising and other transactions to a diverse client base, including corporations, partnerships, institutions and governments globally. We serve as a trusted advisor to our clients throughout the world on a collaborative, globally integrated basis from our offices in the United States, Australia, Brazil, Canada, Germany, Hong Kong, Japan, Spain, Sweden and the United Kingdom.
At Greenhill, we are singularly focused on providing conflict-free advice to clients on a wide variety of complex financial matters, using our global resources to provide a combination of transaction experience, industry sector expertise and knowledge of relevant regional markets. We work seamlessly across offices and markets to provide the highest caliber advice and services to our clients.
Greenhill was established in 1996 by Robert F. Greenhill, the former President of Morgan Stanley and former Chairman and Chief Executive Officer of Smith Barney. Greenhill was formed as a limited liability company and converted to a Delaware corporation in 2004 at the time of our IPO. Since our founding, Greenhill has grown through recruiting talented managing directors and other senior professionals, by acquiring complementary advisory businesses and by training, developing and promoting professionals internally. We have expanded beyond merger and acquisition advisory services to include financing, restructuring, and capital advisory services, and we have expanded the breadth of our sector expertise to cover substantially all major industries. Since the opening of our original office in New York, we have expanded globally to 15 offices across five continents.
As of December 31, 2017, we had 346 employees globally, including 77 managing directors and 14 senior advisors.
Advisory Services
Greenhill is a unique global investment banking firm, not only in relation to the large integrated, or "bulge bracket", institutions which engage in commercial lending, underwriting, research, sales and trading and other businesses, but also in relation to other so called "independent" investment banks, many of which engage in investment management, research and capital markets businesses, all of which can create conflicts with clients' interests. Greenhill's singular focus on advisory services differentiates us from other investment banks, and enables us to offer best-in-class service to each of our clients.
• | Advising clients is our only business. We do not engage in investing, trading, lending, underwriting, research or investment management businesses. Our clients' interests are our sole priority. |
• | We provide unbiased, conflict free advice. We have no products or additional services to cross-sell and, thus, no inherent conflicts of interest. We also have no lending, prime brokerage or other relationships with activist investors. |
• | We maintain the highest levels of confidentiality. Our advisory only business model and minimal conflicts enable us to maintain greater client confidentiality. |
• | Senior level attention is fundamental to our model. Our managing directors, who are seasoned professionals with both transaction expertise and sector and regional knowledge, are actively engaged in our client mandates from origination through execution and closing. |
• | We offer a collaborative approach to global client service. Our professionals around the globe work together on a fully integrated, one firm-one team approach to advance the interests of our clients. |
3
We provide comprehensive financial advisory services primarily in connection with mergers and acquisitions, divestitures, restructurings, financings, capital raising and other transactions. We also provide advice in connection with defense preparedness, activist response strategies and other mission critical situations. For all of our advisory services, we draw on the extensive experience, senior relationships and industry expertise of our managing directors and senior advisors.
Mergers and Acquisitions. On merger and acquisition engagements, we provide a broad range of advice to global clients in relation to domestic and cross-border mergers, acquisitions, divestitures, spin-offs and other strategic transactions, through all stages of a transaction's life cycle, from initial structuring and negotiation to final execution. Our focus is on providing high-quality, unbiased advice to senior executive management teams, boards of directors and special committees of prominent large and mid-cap companies and to key decision makers at governments and at large institutions on transactions that typically are of the highest strategic and financial importance to our clients. We have specialists in nearly every significant industry sector who work closely with our transaction and regional specialists to provide the highest quality advice and transaction execution. In addition to merger and acquisition transactions, we advise clients on a full range of critical strategic matters, including activist response, defensive tactics, special committee projects, licensing deals and joint ventures. We provide advice on valuation, negotiation tactics, industry dynamics, structuring alternatives, timing and pricing of transactions, as well as financing alternatives. In appropriate situations, we also provide fairness opinions with regard to merger and acquisition transactions.
Financing Advisory and Restructuring. Our financing advisory and restructuring practice encompasses a wide range of advisory services. In debt restructurings, we advise debtors, creditors, governments, pension funds and other stakeholders in companies experiencing financial distress, as well as potential acquirers of distressed companies and assets. We provide advice on valuation, restructuring alternatives, capital structures, financing alternatives, and sales or recapitalizations, and assist clients in identifying and capitalizing on potential incremental sources of value. We also assist those clients who seek court-assisted reorganizations by developing and seeking approval for plans of reorganization as well as the implementation of such plans. In addition to debt restructurings, we advise on a variety of other financing matters, including debt issuances, equity financings, exchange offers and spin-off transactions. We also provide advice on initial public offerings (IPOs) and other equity capital market transactions in which clients value independent advice from a knowledgeable advisor who does not stand to earn substantial underwriting or placement fees.
Capital Advisory. In our capital advisory business, we assist general partners and sponsors in raising primary capital commitments for new private funds and provide related advisory services to those entities globally. Our capital advisory group provides clients with comprehensive global marketing efforts to a diverse investor base of pension funds, sovereign wealth funds, endowments and other institutional investors worldwide and is one of the leading advisors in the primary market to real estate funds globally. As a result of the acquisition of Cogent Partners, LP ("Cogent"), which we acquired on April 1, 2015 and have integrated into our capital advisory business, we also are one of the leading global financial advisors to pension funds, endowments and other institutional investors on the secondary market for the sale of alternative assets. We advise such institutions on secondary sales of interests in private equity and similar funds, as well as providing advice to alternative asset fund sponsors for restructuring, financing, liquidity options, valuation and related services.
Revenues
Our revenues are principally derived from advisory services on mergers and acquisitions (or M&A), financings and restructurings and are primarily driven by total deal volume and the size of individual transactions. While fees payable upon the successful conclusion of a transaction generally represent the largest portion of our advisory fees, we also earn other corporate advisory fees, including on-going retainer fees, substantially all of which relate to non-success based strategic advisory and financing advisory and restructuring assignments, and fees payable upon the commencement of an engagement or upon the achievement of certain milestones, such as the announcement of a transaction or the rendering of a fairness opinion. Additionally, our capital advisory group provides capital raising advisory services in the primary market for real estate funds, where revenues are driven primarily by the amount of capital raised, and in the secondary market for alternative assets, where revenue is determined based upon a fixed percentage of the transaction value.
In addition, since 2012 we have generated approximately 1%-2% of our revenues from interest income and gains (or losses) in merchant banking fund investments, which we substantially liquidated in prior years. Revenue recognized on investments in merchant banking funds is based on our allocable share of realized and unrealized gains (or losses) reported by such funds on a quarterly basis.
Employees
As an independent investment bank focused solely on advisory services, our people are our primary asset. Our managing directors and senior advisors average more than 20 years of relevant experience, which they leverage to provide the highest quality advice on a collaborative, globally integrated basis across our full range of services. Our managing directors and senior advisors are supported by a strong team of more junior professionals and we spend a significant amount of time training and mentoring
4
our junior professionals. We seek to provide our junior professionals with broad exposure to a variety of assignments involving mergers and acquisitions, divestitures, restructurings, financings, capital raisings and other transactions. This approach provides us with the flexibility to allocate resources depending on the transaction environment and provides our bankers with a wide variety of experiences to assist in the development of their business and financial judgment.
As of December 31, 2017, Greenhill employed a total of 346 people (including our managing directors and senior advisors), of which 203 were located in our offices in North America, 89 were based in our European offices, and 54 in the rest of the world. The vast majority of our accounting, operational and administrative employees are located in the United States. We strive to maintain a work environment that fosters collegiality, teamwork, professionalism, excellence, diversity, and collaboration among our employees worldwide. We utilize a comprehensive evaluation process at the end of each year to measure performance, determine compensation and provide guidance on opportunities for continued development.
Competition
We operate in a highly competitive environment where there are no long-term contracted sources of revenue. Each revenue-generating engagement is separately awarded and negotiated. Our list of clients with whom there is an active engagement changes continually. To develop new client relationships, and to develop new engagements from historic client relationships, we maintain, on an ongoing basis, business dialogues with a large number of clients and potential clients. We have gained a significant number of new clients each year through our business development initiatives, through recruiting additional senior investment banking professionals who bring with them client relationships and expertise in certain industry sectors or geographies and through referrals from members of boards of directors, attorneys and other parties with whom we have relationships. At the same time, we lose clients each year as a result of the sale or merger of a client, a change in a client’s senior management team, competition from other investment banks and other causes.
The financial services industry is intensely competitive, and we expect it to remain so. Our competitors are global and regional integrated banking firms, mid-sized full service financial firms, other independent financial services firms and specialized financial advisory firms. We compete with some of our competitors globally and with others on a regional, product, industry or niche basis. We compete on the basis of a number of factors, including the quality of our advice and service, our range of products and services, strength of relationships, innovation, reputation and price.
The global and regional integrated banking firms offer a wider range of products, from loans, deposit-taking and insurance to brokerage, hedging, foreign exchange, asset management and corporate finance and securities underwriting services, which may enhance their competitive position. They also have the ability to support their investment banking operations with commercial banking, insurance and other financial services revenues in an effort to gain market share, which could result in pricing pressure in our business. In addition to our larger and mid-sized full service competitors, we compete with a number of independent investment banks, which offer independent advisory services on a model similar to ours. A few of the independent banks with whom we compete are larger and have greater general and industry specific coverage resources. Further, over the past several years, there has been an increase in the number of newly formed independent advisory firms. Since independent advisory firms require minimal capital to operate, there are few obstacles to starting new firms.
We believe our primary competitors in securing mergers and acquisitions and financing advisory engagements are large, diversified financial institutions including Bank of America Corporation, Barclays Bank PLC, Citigroup Inc., Credit Suisse Group AG, Deutsche Bank AG, Goldman Sachs Group, Inc., JPMorgan Chase & Co., Morgan Stanley, and UBS AG, as well as other publicly listed investment banking firms such as Evercore Partners Inc., Jefferies Group, Inc., Lazard Ltd., Moelis & Co. and PJT Partners, and certain closely held boutique firms. Advisory services in restructuring and bankruptcy situations tend to be highly specialized, and we believe our primary competitors to be Evercore Partners, Inc., Houlihan Lokey, Inc., Lazard Ltd., Moelis & Co., PJT Partners Inc., Rothschild Group and many closely held boutique firms. We believe our primary competitors in our capital advisory business are Credit Suisse Group AG, Evercore Partners, Inc., Lazard Ltd., Park Hill Group LLC (part of PJT Partners Inc.), UBS AG and many closely held boutique firms.
Competition can be intense for the hiring and retention of qualified employees. Our ability to continue to compete effectively in our business will depend upon our ability to attract new employees and retain and motivate our existing employees.
For a discussion of risks related to the highly competitive environment in which we operate, see "Item 1A. Risk Factors" in this annual report.
Regulation
Our business, as well as the financial services industry generally, is subject to extensive regulation in the United States and elsewhere. As a matter of public policy, regulatory bodies in the United States and the rest of the world are charged with safeguarding the integrity of the securities and other financial markets and with protecting the interests of parties participating in those markets.
5
Certain of our operations are subject to compliance with laws and regulations of U.S. federal and state governments, non-U.S. governments, their respective agencies and/or various self-regulatory organizations or exchanges, and any failure to comply with these regulations could expose us to liability and/or damage our reputation. Our businesses have operated for many years within a legal framework that requires us to monitor and comply with a broad range of legal and regulatory developments that affect our activities. However, additional legislation, changes in rules promulgated by self-regulatory organizations or changes in the interpretation or enforcement of existing laws and rules, either in the United States or elsewhere, may directly affect our mode of operation and profitability.
North America
In the United States, the Securities and Exchange Commission (“SEC”) is the federal agency responsible for the administration of the federal securities laws and the protection of investors who invest in Greenhill. Both Greenhill & Co., LLC ("G&Co LLC") and Greenhill Cogent, LP ("GC LP"), wholly-owned subsidiaries of Greenhill through which we conduct our U.S. advisory business, are registered as broker-dealers with the SEC, are members of the Financial Industry Regulatory Authority (“FINRA”), and are subject to regulation and oversight by the SEC. In addition, FINRA, a self-regulatory organization that is subject to oversight by the SEC, adopts and enforces rules governing the conduct, and examines the activities, of its member firms, including G&Co LLC and GC LP. State and local securities regulators also have regulatory or oversight authority over G&Co LLC and GC LP.
Broker-dealers are subject to regulations that cover all aspects of the securities business. Our business model is exclusively focused on providing strategic advice to clients and we do not hold customer funds or securities, or carry on research, securities trading, lending or underwriting activities. While this means that certain broker-dealer regulations, such as those pertaining to the use and safekeeping of customers' funds and securities and the financing of customers' purchases, may not be applicable to us, we remain subject to other applicable broker-dealer regulations, including regulatory capital levels, record keeping and reporting requirements, and the conduct and qualifications of officers and employees. In particular, as a registered broker-dealer and member of a self-regulatory organization, G&Co LLC and GC, LP, are subject to the SEC's uniform net capital rule, Rule 15c3-1. Rule 15c3-1 specifies the minimum level of net capital a broker-dealer must maintain and also requires that a significant portion of a broker-dealer's assets be retained in liquid financial instruments relative to the amount of its liabilities. The SEC and various self-regulatory organizations impose rules that require notification when net capital falls below certain predefined criteria, limit the ratio of subordinated debt to equity in the regulatory capital composition of a broker-dealer and constrain the ability of a broker-dealer to expand its business under certain circumstances. Additionally, the SEC's uniform net capital rule imposes certain requirements that may have the effect of prohibiting a broker-dealer from distributing or withdrawing capital and requiring prior notice to the SEC for certain withdrawals of capital.
Our capital advisory business also is affected by various state and local regulations that restrict or prohibit the use of placement agents in connection with investments by public pension funds, including regulations in California, Illinois, New York State and New York City. Similar measures are being considered or have been implemented in other jurisdictions.
In addition, Greenhill Capital Partners, LLC, our wholly owned subsidiary, which operated as and will continue to operate as general partner of Greenhill Capital Partners II ("GCP II"), one of our former merchant banking funds, is a registered investment adviser under the Investment Advisers Act of 1940, as amended. As such, it is subject to regulation and periodic examinations by the SEC. Such regulations relate to, among other things, fiduciary duties to clients, maintaining an effective compliance program, solicitation agreements, conflicts of interest, recordkeeping and reporting requirements, disclosure requirements, limitations on agency cross and principal transactions between an adviser and advisory clients and general anti-fraud prohibitions.
Europe
Greenhill & Co. International LLP and Greenhill & Co. Europe LLP, our wholly owned affiliated partnerships with offices in the United Kingdom and Germany, respectively, through which we conduct the majority of our European advisory business, are authorized and regulated by the United Kingdom's Financial Conduct Authority (“FCA”). Greenhill & Co. Europe LLP is also subject to regulation by the Federal Financial Supervisory Authority in Germany (“BaFin”). The current UK regulatory regime is based upon the Financial Services and Markets Act 2000 (the “FSMA”), together with secondary legislation and other rules made under the FSMA. These rules govern all aspects of our advisory business in the United Kingdom, including carrying on regulated activities, record keeping, approval standards for individuals, anti-money laundering and periodic reporting.
Both Greenhill & Co. International LLP and Greenhill & Co. Europe LLP have obtained the appropriate European financial services passport rights to provide cross-border services into a number of other members of the European Economic Area (“EEA”). This “passport” derives from the pan-European regime established by the EU Markets in Financial Instruments Directive, which regulates the provision of financial services and activities throughout the EEA. We continue to monitor developments regarding the U.K.’s proposed departure from the European Union and its potential impact on the structure of our European operations, including in relation to the continued access to the European Single Market and associated passport regime.
6
Greenhill & Co. Sweden AB, our wholly owned Swedish subsidiary with an office in Stockholm, provides financial advice to clients in Sweden and the wider Nordic region, and is subject to regulation by the Swedish Financial Supervisory Authority.
Greenhill & Co. Spain Limited, our wholly owned Spanish subsidiary with an office in Madrid, provides financial advice to clients in Spain and the wider Iberian region, and is authorized and regulated by the FCA and also subject to regulation by the Comisión Nacional del Mercado de Valores (CNMV).
Australia
Greenhill & Co. Australia Pty Limited ("Greenhill Australia"), our wholly owned Australian subsidiary, is licensed and subject to regulation by the Australian Securities and Investments Commission (“ASIC”) and must also comply with applicable provisions of the Corporations Act 2001 and other Australian legal and regulatory requirements, including capital adequacy rules, customer protection rules, and compliance with other applicable trading and investment banking regulations.
Asia
Greenhill & Co. Asia Limited, a wholly owned Hong Kong subsidiary, is licensed under the Hong Kong Securities and Futures Ordinance with the Securities and Futures Commission (“SFC”) and is regulated by the SFC. The compliance requirements of the SFC include, among other things, net capital, stockholders' equity and periodic reporting requirements, and also the registration and training of certain employees and responsible officers.
General
Our business may also be subject to regulation by other governmental and regulatory bodies and self-regulatory authorities in other countries where Greenhill operates or conducts business.
Federal anti-money-laundering laws make it a criminal offense to own or operate a money transmitting business without the appropriate state licenses, which we maintain, and registration with the U.S. Department of Treasury's Financial Crimes Enforcement Network (FinCEN). In addition, the USA PATRIOT Act of 2001 and the Treasury Department's implementing federal regulations require us, as a "financial institution," to establish and maintain an anti-money-laundering program.
In connection with its administration and enforcement of economic and trade sanctions based on U.S. foreign policy and national security goals, the Treasury Department's Office of Foreign Assets Control, or OFAC, publishes a list of individuals and companies owned or controlled by, or acting for or on behalf of, targeted countries. It also lists individuals, groups and entities, such as terrorists and narcotics traffickers, designated under programs that are not country-specific. Collectively, such individuals and companies are called "Specially Designated Nationals," or SDNs. Assets of SDNs are blocked, and we are generally prohibited from dealing with them. In addition, OFAC administers a number of comprehensive sanctions and embargoes that target certain countries, governments and geographic regions. Similar restrictions have been issued in the U.K. by HM Treasury. We are generally prohibited from engaging in transactions involving any country, region or government that is subject to such comprehensive sanctions.
We also are subject to the Foreign Corrupt Practices Act, which prohibits offering, promising, giving, or authorizing others to give anything of value, either directly or indirectly, to a non-U.S. government official in order to influence official action or otherwise gain an unfair business advantage, such as to obtain or retain business. We are also subject to applicable anti-corruption laws in the United States and in the other jurisdictions in which we operate, such as the U.K. Bribery Act. We have implemented policies, procedures, and internal controls that are designed to comply with such laws, rules, and regulations.
For a discussion of risk related to the regulation that we are subject to, see "Item 1A. Risk Factors" in this annual report.
Where You Can Find Additional Information
Greenhill & Co., Inc. files current, annual and quarterly reports, proxy statements and other information required by the Securities Exchange Act of 1934, as amended (the “Exchange Act”), with the SEC. You may read and copy any document the Company files at the SEC’s public reference room located at 100 F Street, N.E., Washington, D.C. 20549, U.S.A. Please call the SEC at 1-800-SEC-0330 for further information on the public reference room. Our SEC filings are also available to the public from the SEC’s internet site at http://www.sec.gov. Copies of these reports, proxy statements and other information can also be inspected at the offices of the New York Stock Exchange, Inc., located at 20 Broad Street, New York, New York 10005, U.S.A.
Our public internet site is http://www.greenhill.com. We make available, free of charge, through our internet site, via a link to the SEC’s internet site at http://www.sec.gov, our annual reports on Form 10-K, quarterly reports on Form 10-Q, current reports on Form 8-K, proxy statements and Forms 3, 4 and 5 filed on behalf of directors and executive officers and any amendments to those reports filed or furnished pursuant to the Exchange Act as soon as reasonably practicable after we electronically file such
7
material with, or furnish it to, the SEC. Also posted on our website in the “Corporate Governance” section, and available in print upon request of any stockholder to our Investor Relations Department, are the charters for our Audit Committee, Compensation Committee and Nominating & Corporate Governance Committee, our Corporate Governance Guidelines, Related Party Transaction Policy and Code of Business Conduct & Ethics governing our directors, officers and employees. You may need to have Adobe Acrobat Reader software installed on your computer to view these documents, which are in PDF format. The information on our website is not, and shall not be deemed to be, a part hereof or incorporated into this or any of our other filings with the SEC.
Item 1A. Risk Factors
Our ability to retain our managing directors and other professionals is critical to the success of our business
The success of our business depends upon the personal reputation, judgment, integrity, business generation capabilities and project execution skills of our managing directors and senior advisors, particularly our senior managing directors. Our managing directors’ personal reputations and relationships with our clients are a critical element in obtaining and maintaining client engagements. Accordingly, the retention of our managing directors, who are not obligated to remain employed with us, is particularly crucial to our future success. Managing directors have left Greenhill in the past and others may do so in the future, and we cannot predict the impact that the departure of any managing director will have on our business. The departure or other loss of our senior managing directors, in particular Robert F. Greenhill, our founder and Chairman and Scott L. Bok, our Chief Executive Officer, could materially adversely affect our ability to secure and successfully complete engagements, which could materially adversely affect our results of operations.
In addition, if any of our managing directors were to join an existing competitor or form a competing company, some of our clients could choose to use the services of that competitor instead of our services or some of our managing directors or other professionals could choose to follow the departing managing director in joining an existing competitor or forming a competing company. Although we have entered into non-competition agreements with our managing directors, the restriction period in many of the agreements does not exceed three to six months, and there is no guarantee that these agreements are sufficiently broad or effective to prevent our managing directors from resigning to join our competitors or that the non-competition agreements would be upheld if we were to seek to enforce our rights under these agreements.
Principally all of our revenues are derived from advisory fees, which results in volatility in our revenues and profits
We are entirely focused on the financial advisory business and we earn principally all of our revenues from advisory fees paid to us by each of our clients, in large part upon the successful completion of the client's transaction, the timing of which is outside of our control. Unlike diversified investment banks, which generate revenues from commercial lending, securities trading and underwriting, or other advisory firms, which have asset management and other businesses, our generation of revenues from sources other than advisory fees is minimal. As a result, a decline in our advisory engagements, the number and scale of successfully completed client transactions or the market for advisory services generally would have a material adverse effect on our business and results of operations.
Our engagements are singular in nature and do not provide for subsequent engagements, which could cause our revenues to fluctuate materially from period to period
We operate in a highly-competitive environment where our clients generally retain us on a non-exclusive, short-term, engagement-by-engagement basis in connection with specific transactions or projects, rather than under long-term contracts covering potential additional future services. As these transactions and projects are singular in nature and subject to intense competition, we must seek out new engagements when our current engagements are successfully completed or are terminated. As a result, high activity levels in any period are not necessarily indicative of continued high levels of activity in the next-succeeding period or any future period. In addition, we generally derive most of our engagement revenues at key transaction milestones, such as announcement or closing, and the timing of these milestones is outside our control. Extended regulatory and other delays in the closing of announced transactions can create increased volatility in our revenues from period to period since the largest portion of our fees is paid upon closing. Further, a transaction can fail to be completed for many reasons, including failure to agree upon final terms with the counterparty, failure to secure necessary board or shareholder approvals, failure to secure necessary financing, failure to achieve necessary regulatory approvals and adverse market conditions. In cases where an engagement is terminated prior to the successful completion of a transaction or project, whether due to market reasons or otherwise, we may earn limited or no fees and may not be able to recoup the costs we incurred prior to the termination.
8
A high percentage of our advisory revenues is derived from a small number of clients and the termination of any one advisory engagement could reduce our revenues and harm our operating results
Each year, we advise a limited number of clients. Our top ten client engagements accounted for 39% of our total revenues in 2017 and 40% in 2016. There was no single client in 2017 or 2016 that represented greater than 10% of our revenues. We earned $1 million or more from 58 clients in 2017, compared to 71 in 2016, of which 31% of the clients were new to the Firm in 2017 and 24% in 2016. While the composition of the group comprising our largest clients varies significantly from year to year, we expect that our advisory engagements will continue to be limited to a relatively small number of clients, compared to some of our larger competitors, and that an even smaller number of those clients will account for a high percentage of revenues in any particular year. As a result, the adverse impact on our results of operation from lost engagements or the non-completion of transactions on which we are advising can be significant.
We generate a substantial portion of our revenues from our services in connection with mergers and acquisitions and in the event of a decline in merger and acquisition activity it is unlikely we could offset lower revenues with revenues from other services
The large majority of our bankers are focused on covering clients in the context of providing merger and acquisition advisory services and those activities generate a substantial portion of our revenues. In the event of a decline in merger and acquisition activity we may seek to generate greater business from our financing advisory and restructuring and/or capital advisory services. However, it is unlikely that we will be able to offset lower revenues from our merger and acquisition activities with revenues generated from either financing advisory and restructuring or capital advisory assignments. Both our financing advisory and restructuring business, which provides financing, restructuring and bankruptcy advice to companies in financial distress or their creditors or other stakeholders, and our capital advisory business, which assists in capital raisings for new private funds and advises on secondary transactions for alternative assets, are smaller than our mergers and acquisitions advisory business and we expect that they will remain that way for the foreseeable future.
If the number of debt defaults, bankruptcies or other factors affecting demand for our restructuring services is at a low level, our financial advisory and restructuring business could suffer
We provide various financing advisory and restructuring and related advice to companies in financial distress or to their creditors or other stakeholders. A number of factors affect demand for these advisory services, including general economic conditions, the availability and cost of debt and equity financing, governmental policy and changes to laws, rules and regulations, including those that protect creditors. In addition, providing restructuring advisory services entails the risk that the transaction will be unsuccessful, takes considerable time and can be subject to a bankruptcy court's discretionary power to disallow or discount our fees. If the number of debt defaults, bankruptcies or other factors affecting demand for our restructuring advisory services is at a low level, our financing advisory and restructuring business would be adversely affected.
Our capital advisory business is dependent on the availability of capital for deployment in primary and secondary alternative asset classes for clients we serve
In our capital advisory business, we provide primary fund placement services, principally for real estate funds, and we advise institutional investors on the sale of alternative assets funds in secondary transactions. Our ability to find suitable engagements and earn fees in this business depends on the availability of private and public capital for investments in illiquid assets such as private equity and real estate funds. Our ability to assist fund managers and sponsors in raising capital from investors or to assist investors in selling their interests in secondary transactions depends on a number of factors, including many that are outside our control, such as the general economic environment, changes in the weight investors give to alternative asset investments as part of their overall investment portfolio among asset classes, and market liquidity and volatility. To the extent private and public capital focused on primary or secondary investment in alternative investment opportunities for our clients is limited, the results of our capital advisory business may be adversely affected.
Our business may be adversely affected by difficult market conditions and a decline in transaction activity
Adverse market or economic conditions would likely affect the number, size and timing of transactions on which we provide advice and therefore adversely affect our advisory fees. Furthermore, rapid increases in equity valuations and market volatility can negatively impact merger and acquisition activity. Our clients engaging in mergers and acquisitions often rely on access to the credit and/or equity markets to finance their transactions. The uncertainty of available credit and the volatility of equity markets can adversely affect the size, volume, timing and ability of our clients to successfully complete merger and acquisition transactions and adversely affect our advisory business. Furthermore, market volatility also affects our clients’ ability and willingness to engage in stock-for-stock transactions.
9
While we operate in North America, Europe, Australia, Asia and South America, our operations in the United States and Europe have historically provided most of our revenues and earnings. Consequently, our revenues and profitability are particularly affected by market conditions in these locations.
We face strong competition from far larger firms and other independent firms, which could adversely affect our market share of the advisory business
The investment banking industry is intensely competitive and we expect it to remain so. We compete on the basis of a number of factors, including the quality of our advice and service, our range of products and services, strength of relationships, innovation, reputation and price. We may experience pricing pressures in the future if some of our competitors seek to obtain market share by reducing prices. We are a relatively small investment bank, with 346 employees (including managing directors and senior advisors) as of December 31, 2017 and total revenues of $239.2 million for the year ended December 31, 2017. Most of our competitors in the investment banking industry have a far greater range of products and services, greater financial and marketing resources, larger customer bases, greater name recognition, more managing directors to serve clients' needs, greater global reach and broader relationships with current and potential clients than we have. These larger and better capitalized competitors may be better able to respond to changes in the investment banking market, to compete for skilled professionals, to finance acquisitions, to fund internal growth and to compete for market share generally.
Our integrated investment banking competitors and other large commercial banks, insurance companies and other broad-based financial services firms that have established or acquired financial advisory practices and broker-dealers or have merged with other financial institutions have the ability to offer a wide range of products, from loans, deposit-taking and insurance to brokerage, hedging, foreign exchange, asset management and investment banking services, which may enhance their competitive position. Their ability to support investment banking with commercial banking, insurance and other financial services revenues in an effort to gain market share could result in pricing pressure in our businesses. In particular, the ability to provide financing as well as advisory services has become an important advantage for some of our larger competitors, and because we are unable to provide such financing, we may be unable to compete for advisory clients in a significant part of the advisory market.
In addition to our larger competitors, a number of independent investment banks offer independent advisory services and some of these firms are larger and have greater general and industry specific coverage resources and larger financing advisory and restructuring groups than we do. Furthermore, a number of such independent firms are publicly traded and may have greater financial resources than us. Additionally, over the past several years, there has been an increase in the number of newly formed independent advisory firms, some of which provide industry specific advice. Since independent advisory firms require minimal capital to operate, there are few obstacles to forming a new firm. As these independent firms seek to gain market share, our share of the advisory business could diminish and there could be pricing pressure, which would adversely affect our revenues and earnings.
Our future growth is dependent on both our ability to identify, attract and hire additional managing directors and other professionals and our ability to identify, acquire and successfully integrate complementary advisory businesses
The future growth of our business is dependent upon our ability both to recruit new personnel, develop our existing and new personnel and to expand through strategic investments or acquisitions. To successfully increase our headcount we must identify, attract and hire professionals, or teams of professionals, to join our firm, who not only will be able to function as a trusted advisor to our clients without the support of a large suite of products but also will be able to fit into our collegial culture. The recruitment, development and training of professionals require large commitments of time and resources. It may take a substantial amount of time to determine whether new professionals will be effective and, during that time, we may incur significant expenses on compensation, integration and business development activities. Furthermore, there can be no certainty that our personnel will develop the skills necessary to advise our client base or that we will be able to retain the high achieving personnel.
In the event we grow by strategic investment or acquisition, we face numerous risks and uncertainties similar to those of hiring and developing internally our individual professionals. We also face the challenge of integrating a large number of personnel into our global organization and ensuring a good cultural fit. Management and other existing personnel will spend considerable time and resources working to integrate the acquired business, which may distract them from other business operations.
If we are unable to successfully attract, hire and train new and existing professionals or make strategic investments and integrate the personnel into our business and retain them, our financial results could suffer.
Strategic investments and acquisitions, or foreign expansion, may result in additional risks and uncertainties in our business
When we make strategic investments or acquisitions, such as our acquisitions of Caliburn (now Greenhill Australia) and Cogent (now Greenhill's secondary capital advisory team), in additional to the risks associated with the integration and retention of
10
personnel, we face numerous risks and uncertainties combining or integrating the relevant businesses and systems, including accounting and data processing systems and management controls.
To the extent that we pursue business opportunities in certain markets outside the United States, such as our business operations in Asia and Brazil, we will be subject to political, economic, legal, operational, regulatory and other risks that are inherent in operating in a foreign country, including risks of possible nationalization, expropriation, price controls, capital controls, exchange controls, inflation controls, licensing requirements and other restrictive governmental actions, as well as the outbreak of hostilities. In many countries, the laws and regulations applicable to the financial services industries are uncertain and evolving, and it may be difficult and costly for us to determine the exact requirements of local laws in every market. Our inability to remain in compliance with local laws in a particular foreign market could have a significant and negative effect not only on our businesses in that market but also on our reputation generally.
If we expand to new geographic locations, we will incur additional compensation, occupancy, integration, legal and business development costs. Additionally, it may take significant time for us to determine whether new managing directors will be profitable or effective, during which time we may incur significant expenses and expend significant time and resources on compensation, integration and business development. Accordingly, the additional costs and expenses of an expansion may be reflected in our financial results before any offsetting revenues are generated. Depending upon the extent of our expansion, and whether it is done by recruiting new managing directors, strategic investment or acquisition, the incremental costs of our expansion may be funded from cash from operations or other financing alternatives. There can be no assurance that we will be able to generate or obtain sufficient capital on acceptable terms to fund our expansion needs which would limit our future growth and could adversely affect our share price.
Sustaining growth will also require us to commit additional management, operational, and financial resources to this growth and to maintain appropriate operational and financial systems to adequately support expansion. There can be no assurance that we will be able to manage our expanding operations effectively or that we will be able to maintain or accelerate our growth, and any failure to do so could adversely affect our ability to generate revenues and control our expenses.
The inherent volatility in our financial results from period to period, translates into volatility in our stock price
Our revenue and profits are highly volatile. We can experience significant variations in revenues and earnings during each quarterly period. These variations can generally be attributed to the fact that our revenues are usually earned in large amounts throughout the year upon the successful completion of a transaction, the timing of which is uncertain and is not subject to our control.
Compared to our larger, more diversified competitors in the financial services industry, we generally experience even greater variations in our quarterly revenues and profits. This is due to our dependence on a relatively small number of transactions for a large percentage of our revenues in each quarterly reporting period, with the result that our earnings can be significantly affected by the size and number of transactions closed in any particular quarter.
Furthermore, since substantially all of our revenues are generated from advisory fees, we lack other more stable sources of revenue such as brokerage and asset management fees, which could moderate some of the volatility in advisory revenues. As a result, it may be difficult for us to achieve consistent results and steady earnings growth on a quarterly basis, which could adversely affect our stock price.
Our advisory fee revenues are subject to risks and uncertainties beyond our control
In many cases, we are not paid for advisory engagements that do not result in the successful consummation of a transaction or restructuring or closing of a fund. As a result, our business is highly dependent on market conditions and the decisions and actions of our clients and interested third parties. For example, in our mergers and acquisitions business, a client could delay or terminate a transaction because of a failure to agree upon final terms with the counterparty, failure to obtain necessary regulatory consents or board or shareholder approvals, failure to secure necessary financing, or adverse market conditions. In our restructuring business, anticipated bidders for assets of a client in financial distress may not materialize or our client may not be able to restructure its operations or indebtedness due to a failure to reach agreement with its principal creditors. In our capital advisory business, our clients may not raise sufficient capital to start a new fund or may not be able to sell their fund interests in secondary transactions because anticipated investors may decline to invest in such a fund due to lack of liquidity, change in strategic direction of the investor, or other factors. In these circumstances, we may receive limited or no advisory fees, despite having committed substantial time and resources to an engagement. The failure of the parties to complete a transaction on which we are advising, and the consequent loss of revenue to us, could lead to large adverse movements in our revenues and earnings.
11
Our increased leverage and substantial long-term debt could adversely affect our business
In October 2017, we substantially increased our leverage through the borrowing of $350.0 million under a five-year secured term loan facility as well entering into a three-year revolving credit facility pursuant to which we can borrow an additional $20.0 million. At December 31, 2017, $350.0 million remained outstanding on the term loan facility and the first principal installment payment of $4.375 million is due March 31, 2018 and future quarterly payments, which increase to $8.75 million beginning December 31, 2018 are due thereafter.
Our ability to make payments on, or repay or refinance, our debt, and to fund other contractual obligations will depend largely upon our future operating performance, which is subject to general economic, financial, competitive, regulatory and other factors that are beyond our control. We cannot provide assurance that we will maintain a level of cash flows from our operating activities sufficient to permit us to pay the principal of, and interest on, any indebtedness or fund other contractual obligations.
The amount of our long-term debt could have adverse consequences. For example, it could:
•increase our vulnerability to general adverse economic and industry conditions;
• | require us to dedicate a substantial portion of our cash flow from operations to make interest and principal payments on our debt, thereby limiting the availability of our cash flow to fund our operating activities, including deferred compensation arrangements, working capital, and other general corporate requirements; |
•limit our flexibility in planning for, or reacting to, changes in our business and the industry in which we operate;
•place us at a competitive disadvantage compared with our competitors; and
• | limit our ability to borrow additional funds, even when necessary to maintain adequate liquidity and meet regulatory capital requirements. |
If we are unable to fund our debt obligations we may need to consider taking other actions, including issuing additional securities, seeking strategic investments, reducing operating costs or consider taking a combination of these actions, in each case on terms which may not be favorable to us. Further, failure to make timely principal and interest payments under the debt agreement could result in a default. A default would permit lenders to accelerate the maturity for the debt and to foreclose upon any collateral securing the debt. In addition, the limitations imposed by the new credit agreement related to our five-year secured term loan facility on our ability to incur additional debt and to take other actions might significantly impair our ability to obtain other financing for our existing operations or to fund new business opportunities. Our inability to incur additional indebtedness could limit our business opportunities, which could have a material impact on our operations and have a material adverse effect on our share price. Further, our inability to repay or refinance the loan facilities when due could have a material adverse effect on our liquidity and result in our inability to meet our obligations, which could have a material adverse effect on our business operations and our stock price.
Our borrowings bear interest at variable rates subject to, at our election, either the U.S. Prime Rate plus a margin of 2.75% or LIBOR plus a margin of 3.75%. An increase in interest rates would increase the portion of our cash flow used to service our indebtedness and could have a material adverse effect on our liquidity and our ability to meet our obligations timely, which could have a material adverse effect on our stock price.
The credit agreement related to our five-year secured term and three-year secured revolving loans contains various covenants that impose restrictions on us that may affect our ability to operate our business
The credit agreement contains covenants that may limit our ability to take actions that might be to the advantage of the Firm and our shareholders. Among other things, subject to certain exceptions, the credit agreement limits our ability to:
•grant liens on our assets;
•incur additional indebtedness (including guarantees and other contingent obligations);
•make certain investments (including loans and advances);
•make certain acquisitions;
•merge or make other fundamental changes;
12
•sell or otherwise dispose of property or assets;
•pay dividends and other distributions, repurchase shares and prepay certain indebtedness;
•make changes in the nature of our business;
•enter into transactions with our affiliates;
•amend or waive our organizational documents, subordinated and junior lien indebtedness;
•change our fiscal year; and
•enter into contracts restricting dividends and lien grants by non-guarantor subsidiaries.
In addition, we are subject to a springing total net leverage ratio financial covenant, subject to certain step downs, if our borrowings under the secured revolving loan facility exceed $12.5 million. Under the terms of the new loan facilities we are also subject to certain other non-financial covenants. Our ability to comply with these covenants will depend upon our future operating performance. These covenants may adversely affect our ability to finance our future operations or capital needs or to engage in other business activities that may be desirable or advantageous to us.
Failure to comply with any of the covenants in our new credit agreement could result in a default which would permit lenders to accelerate the maturity for the debt and to foreclose upon any collateral securing the debt. Under these circumstances, we might not have sufficient funds or other resources to satisfy all of our obligations. In addition, the limitations imposed by the new credit agreement on our ability to incur additional debt and to take other actions might significantly impair our ability to obtain other financing. Our inability to repay or refinance the loan facilities when due could have a material adverse effect on our liquidity and result in our inability to meet our obligations, which could have a material adverse effect on our business operations and our stock price.
Our decision to return cash to our shareholders through repurchases of our common stock may not prove to be the best use of our capital or result in the effects we anticipated, including a positive return of capital to stockholders.
In September 2017, our Board of Directors authorized the repurchase of up to $285.0 million of our common stock. From the launch of our share repurchase plan in September 2017 through January 31, 2018, we have repurchased 4,119,290 common shares, which represented approximately 13% of common stock outstanding at the time we announced the recapitalization plan, at an average price of $17.54 per share, for a total cost of $72.3 million as of January 31, 2018. In February 2018, we launched a modified Dutch auction tender offer for the purchase of up to $110.0 million in value of our common stock at a purchase price of not greater than $20.50 nor less than $18.50 per share, which is scheduled to expire on March 14, 2018, subject to extension. Following the completion of the modified Dutch tender offer, we plan to implement the remaining authority under our repurchase plan through various means, which could include one or more of the following: open market purchases (including pursuant to 10b5-1 plans), additional tender offers, privately negotiated transactions and/or accelerated share repurchases after taking into account our results of operations, financial position, general business conditions, legal, tax and regulatory constraints or restrictions, any contractual restrictions (including any restrictions contained in the new credit agreement) and other factors we deem relevant. The price and timing of future share repurchases, as well as the total funds ultimately expended, will be subject to market conditions and other factors. There can be no assurances of the price at which we may be able to repurchase our shares or that we will repurchase the full amount authorized. The existence of our share repurchase plan could cause the price of our common stock to be higher than it would be in the absence of such a program and could potentially reduce the market liquidity for our common stock and impact our ability to effectuate the repurchases. Furthermore, there can be no assurance that any past or future repurchases will have a positive impact on our stock price or enhance shareholder value, or that the share repurchase plan provides the best use of our capital because the value of our common stock may decline significantly below the levels at which we repurchased shares of common stock. The repurchase plan could increase volatility in our common stock, and any announcement of a termination of the plan may result in a decrease in the trading price of our stock. Any failure to repurchase shares after we have announced our intention to do so may negatively impact our reputation and investor confidence in us and may negatively impact our stock price.
13
Our decision to repurchase shares of our common stock will reduce our public float which could cause our share price to decline.
Prior to the announcement of our share repurchase plan on September 25, 2017, we had approximately 29.6 million shares outstanding and the aggregate value of our outstanding common shares was approximately $425 million. At February 12, 2018, following the completion of our fixed price tender offer, the purchase of $10.0 million of our common stock by each of our Chairman and Chief Executive Officer, recent additional open market purchases and the annual vesting of restricted stock awards, but in advance of our announcement of our modified Dutch auction tender offer, we had approximately 27.3 million shares outstanding and the aggregate value of our outstanding common shares was approximately $507.8 million. As we continue to implement our share repurchase plan we will continue to reduce our "public float," (the number of shares of our common stock that are owned by non-affiliated stockholders and available for trading in the securities markets), which may reduce the volume of trading in our shares and result in reduced liquidity and cause fluctuations in the trading price of our common stock unrelated to our performance. Furthermore, certain institutional holders of our common shares (including index funds) may require a minimum market capitalization of each of their holdings in excess of our market capitalization and therefore be required to dispose of our common stock, which may cause the value of our common stock to decline. There can be no assurance that this reduction in our public float will not result in a lower share price or reduced liquidity in the trading market for our common shares during and upon completion of our share repurchase plan.
Our executive officers, directors and other employees, together with their affiliated entities, hold a significant percentage of our common stock, and their interests may differ from those of our unaffiliated shareholders
Our executive officers, directors and other employees and their affiliated entities collectively owned approximately 16% of the total shares of common stock outstanding as of February 15, 2018 (or approximately 32%, assuming vesting in full on February 15, 2018 of all restricted stock units they hold).
If we repurchase the remaining $212.7 million of shares authorized under our repurchase program at a purchase price of $18.50 per share (the minimum purchase price under our modified Dutch auction tender offer), and assuming our executive officers, directors and other employees, together with their affiliated entities, maintain their current holdings in our common stock, our executive officers, directors and other employees, together with their affiliated entities, would increase their relative ownership of our common stock and would collectively own approximately 23% of our outstanding common stock (or approximately 45%, assuming vesting in full on February 15, 2018 of all restricted stock units they hold). As a result of these shareholdings, our executive officers, directors and employees, together with their affiliated entities, currently are able to exercise, and may increasingly be able to exercise, significant influence over the election of our Board of Directors, the management and policies of Greenhill and the outcome of any corporate transaction or other matter submitted to the shareholders for approval, including mergers, and their interests may differ from those of our unaffiliated shareholders. In addition, this concentration of ownership could have the effect of delaying, preventing or defeating a third party from acquiring control or merging with us.
In addition, sales of substantial amounts of common stock by our executive officers, directors and other employees, or their affiliated entities, or the possibility of such sales, may adversely affect the price of the common stock and impede our ability to raise capital through the issuance of equity securities. Though such persons are subject to certain restrictions on sales of our common stock by applicable securities laws and our internal policies and procedures, they may nonetheless sell a substantial number of shares over time during open trading windows.
A significant portion of the compensation of our managing directors is paid in restricted stock units and the shares we expect to issue on the vesting of those restricted stock units could result in a significant increase in the number of shares of common stock outstanding
As part of annual bonus and incentive compensation, we award restricted stock units to managing directors and other employees. We also award restricted stock units as a long-term incentive to new hires at the time they join Greenhill. At February 15, 2018, 6,223,598, restricted stock units were outstanding, including 1,811,132 restricted stock units granted to employees in February 2018 as part of the long-term incentive award component of our annual compensation package for 2017. Each restricted stock unit represents the holder’s right to receive one share of our common stock or a cash payment equal to the fair value thereof, at our election, following the applicable vesting date. Awards of restricted stock units to our managing directors and other senior employees generally vest over a four to five-year period, with the first vesting on the first anniversary of the grant date, or do not vest until the third or fifth anniversary of their grant date, when they vest in full, subject to continued employment on the vesting date. Awards of restricted stock to our more junior professionals generally vest ratably over a three to four year period. Shares will be issued in respect of restricted stock units only under the circumstances specified in the applicable award agreements and the equity incentive plan, and may be forfeited in certain cases. Vesting of restricted stock units will be accelerated and immediately vested upon a participant’s death, disability or retirement, as defined in the relevant agreements. Assuming all of the conditions to vesting are fulfilled, shares in respect of the restricted stock units that were outstanding as of February 15, 2018 are scheduled to be issued
14
as follows: 341,120 additional shares in 2018, 1,550,468 shares in 2019, 1,626,107 shares in 2020, 1,074,672 shares in 2021, 1,583,731 shares in 2022, and 47,500 shares in 2023.
In January 2016, we also awarded 115,473 performance restricted stock units to our Chief Executive Officer. The performance restricted stock units will vest based upon Greenhill’s level of achievement of three equally weighted performance metrics measured over a three-year performance period running from January 1, 2016 through December 31, 2018. Subject to the level of achievement of each of the performance metrics, the number of shares issuable at the end of the performance period could be zero to 288,683. Vesting of the performance restricted stock units will be accelerated in the case of death, disability, or retirement after at least one year of service. Since the performance period for this award continues through December 31, 2018, no additional performance awards based upon Greenhill's performance were made in 2017 or 2018.
Employee misconduct could harm Greenhill and is difficult to detect and deter
There have been a number of highly publicized cases involving fraud, insider trading or other misconduct by employees in the financial services industry in recent years, and we run the risk that employee misconduct could occur at Greenhill. For example, misconduct by employees could involve the improper use or disclosure of confidential information, which could result in regulatory sanctions and material fines, or insider trading, which could lead to criminal charges. Our advisory business often requires that we deal with highly confidential information of great significance to our clients, the improper use of which may have a material adverse impact on our clients. It is not always possible to deter employee misconduct and the precautions we take to detect and prevent this activity may not be effective in all cases. Any breach of our clients’ confidences as a result of employee misconduct may harm our reputation and impair our ability to attract and retain advisory clients, which could adversely affect our business.
In recent years, the U.S. Department of Justice and the SEC have also devoted greater resources to the enforcement of the Foreign Corrupt Practices Act. In addition, the United Kingdom has significantly expanded the reach of its anti-bribery laws. While we have developed and implemented policies and procedures designed to ensure strict compliance with anti-bribery and other laws, such policies and procedures may not be effective in all instances to prevent violations. Any determination that we have violated these laws or other applicable anti-corruption laws could subject us to, among other things, civil and criminal penalties, material fines, profit disgorgement, injunction on future conduct, securities litigation and reputational damage, any one of which could adversely affect our business prospects, financial position or the market value of our common stock.
We may face damage to our professional reputation and legal liability to our clients and affected third parties if our services are not regarded as satisfactory or if conflicts of interests should arise
As an independent investment banking firm, we depend to a large extent on our relationships with our clients and our reputation for integrity and high-caliber professional services to attract and retain clients. As a result, if a client is not satisfied with our services, it may be more damaging in our business than in other businesses. Further, because we provide our services primarily in connection with significant or complex transactions, disputes or other matters that usually involve confidential and sensitive information or are adversarial, and because our work is the product of myriad judgments of our financial professionals and other staff operating under significant time and other pressures, we may not always perform to the standards expected by our clients. In addition, we may face reputational damage from, among other things, litigation against us, our failure to protect confidential information and/or breaches of our cybersecurity protections or other inappropriate disclosure of confidential information, including inadvertent disclosures.
In addition, our clients are often concerned about conflicts of interest that may arise in the course of engagements. While we have adopted various policies, controls and procedures to reduce the risks associated with the execution of transactions, the rendering of fairness opinions and potential conflicts of interest, these policies may not be adhered to by our employees or be effective in reducing these risks. Failure to adhere to these policies and procedures may result in regulatory sanctions or client litigation. We are unable to estimate the amount of monetary damages which could be assessed or reputational harm that could occur as a result of regulatory sanction or client litigation.
As a financial advisor on significant transactions, we face substantial litigation risk
Our role as advisor to our clients on important mergers and acquisitions or restructuring transactions involves complex analysis and the exercise of professional judgment, including rendering fairness opinions in connection with mergers and other transactions. Our activities may subject us to the risk of significant legal liabilities to our clients and aggrieved third parties, including shareholders of our clients who could bring actions against us. In recent years, the volume of claims and amount of damages claimed in litigation and regulatory proceedings against financial advisors has been increasing, including claims for aiding and abetting client misconduct. Moreover, judicial scrutiny and criticism of investment banker performance and activities has increased, creating risk that our services in a litigated transaction could be criticized by the court. These risks often may be difficult to assess or quantify and their existence and magnitude often remain unknown for substantial periods of time.
15
Our engagements typically include broad indemnities from our clients and provisions to limit our exposure to legal claims relating to our services, but these provisions may not protect us or may not be enforceable in all cases. These indemnities also are dependent on our client's capacity to pay the amounts claimed. As a result, we may incur significant legal expenses in defending against litigation. Substantial legal liability or significant regulatory action against us could have material adverse financial effects or cause significant reputational harm to us, which could seriously harm our business prospects. We depend to a large extent on our business relationships and our reputation for integrity and high-caliber professional services to attract and retain clients. As a result, allegations of improper conduct by private litigants or regulators, whether the ultimate outcome is favorable or unfavorable to us, as well as negative publicity and press speculation about us, whether or not valid, may harm our reputation, which may be more damaging to our business than to other types of businesses.
We are subject to extensive regulation in the financial services industry, which creates risk of non-compliance that could adversely affect our business and reputation
As a participant in the financial services industry, we are subject to extensive regulation in the United States, Europe, Australia and Asia. In addition, as we expand our international operations by opening new offices outside the United States or by carrying out transactions or private placement activities internationally, we are increasingly subject to new regulatory requirements. Regulatory and self-regulatory agencies as well as securities commissions in various jurisdictions in which we do business are empowered to conduct periodic examinations and administrative proceedings that can result in censure, fine, issuance of “cease and desist” orders or suspension of personnel or other sanctions, including revocation of our license or registration or the registration of any of our regulated subsidiaries. In addition, as a result of recent highly publicized scandals in the financial services industry, scrutiny by regulators of financial services firms has increased significantly. Even if a sanction imposed against us or our personnel is small in monetary amount, the adverse publicity arising from the imposition of sanctions against us by regulators could harm our reputation and cause us to lose existing clients or fail to gain new clients.
Change in applicable law and regulatory schemes could adversely affect our business
From time to time, the United States and other national governments in the countries in which we operate and related regulatory authorities, as well as local governments, may adopt new rules which affect our business. Many of the requirements imposed by our regulators are designed to ensure the integrity of the financial markets and to protect customers and other third parties who deal with us and are not designed to protect our stockholders. Consequently, these regulations may serve to limit our activities, including through net capital, customer protection and market conduct requirements. There can be no assurance that regulations will not be imposed which may materially adversely affect our business, financial condition or results of operation.
In addition, several states and municipalities in the United States, such as California, Illinois, New York State and New York City, have adopted “pay-to-play” and placement agent rules which, in addition to imposing registration and reporting requirements, limit our ability to charge fees in connection with certain of our capital advisory engagements or restrict or prohibit the use of placement agents in connection with investments by public pension funds. These types of measures could materially and adversely impact the fees we earn from our capital advisory engagements.
In addition, public figures in the United States, including the current President, members of his administration and other public officials, including members of the current U.S. Congress, continue to signal a willingness to revise, renegotiate, or terminate various multilateral trade agreements under which U.S. companies currently exchange products and services around the world and to impose taxes or other adverse consequences on certain business activities. It is not known what specific measures might be proposed or how they would be implemented and enforced. There can be no assurance that pending or future legislation or executive action in the U.S. that could significantly increase costs with respect to our foreign operations and, consequently, adversely affect our business, financial condition or results of operations, will not be enacted. In addition, such steps, if adopted, could also lead to retaliatory actions by other foreign governments through measures to prohibit, reduce, discourage business of foreign companies or other means, which could make it more difficult for us to do business in those countries.
Compliance with any new laws or regulations could also make compliance more difficult and expensive, affect the manner in which we conduct our business and adversely affect our profitability.
Legal restrictions on our clients may reduce the demand for our services
New laws or regulations or changes in enforcement of existing laws or regulations applicable to our clients may also adversely affect our businesses. For example, changes in antitrust enforcement could affect the level of mergers and acquisitions activity and changes in regulation could restrict the activities of our clients and their need for the types of advisory services that we provide to them.
16
The cost of compliance with international employment, labor, benefits and tax regulations may adversely affect our business and hamper our ability to expand internationally
Since we operate our business both in the United States and internationally, we are subject to many distinct employment, labor, benefits and tax laws in each state and country in which we operate, including regulations affecting our employment practices and our relations with our employees and service providers. If the existing regulations under which we operate are modified or interpreted differently or new regulations are issued and we are unable to comply with these regulations or interpretations, our business could be adversely affected or the cost of compliance may make it difficult to expand into new international markets. Additionally, our competitiveness in international markets may be adversely affected by regulations requiring, among other things, the awarding of contracts to local contractors, the employment of local citizens, the purchase of services from local businesses, or requiring local ownership.
Uncertainty regarding Brexit and the outcome of future arrangements between the European Union and the United Kingdom may adversely affect our business
We have a presence in certain European Union countries, including the U.K. On June 23, 2016, the U.K. voted in favor of a referendum to leave the European Union, commonly referred to as "Brexit". The nature of the arrangements that are yet to be determined between the U.K. and the European Union are difficult to predict. Uncertainty regarding the outcome of such arrangements may continue for a significant period of time and could adversely affect European and worldwide economic and market conditions, contribute to instability in global financial and foreign exchange markets, and introduce significant legal uncertainty and potentially divergent national laws and regulations. Conditions arising from Brexit could adversely affect our U.K. business and operations, including by reducing the volume or size of mergers, acquisitions, divestitures and other strategic corporate transactions on which we seek to advise. An exit by the U.K. from the European Union could also cause our U.K. entities to lose their European Union financial services passport license, which allows them to operate, on a cross-border and off-shore basis, into all European Union countries without obtaining regulatory approval outside of the U.K., which would increase our legal, compliance and operational costs.
The value of our goodwill may decline in the future, which could adversely affect our financial results
A significant decline in our expected future cash flows, a significant adverse change in the business climate, or slower growth rates, any or all of which could be materially affected by many of the risk factors discussed herein, may require that we take charges in the future related to the impairment of goodwill. Future regulatory actions also could have a material impact on assessments of goodwill for impairment. If we were to conclude that a future write-down of our goodwill and other intangible assets is necessary, we would record the appropriate charge which could have a material adverse effect on our results of operations and market value of our common stock.
Our failure to prevent a cyber-security attack may disrupt our businesses, harm our reputation, result in losses or limit our growth
Our clients typically provide us with sensitive and confidential information. We rely heavily on our technological and communications infrastructure to securely process, transmit and store such information among our locations around the world and with our professional staff, clients, alliance partners and vendors. If any of our technology systems do not operate properly or are disabled, we could suffer financial loss, a disruption of our businesses, regulatory intervention or reputational damage. Our information systems and technology may not continue to be able to accommodate our growth, and the cost of maintaining such systems may increase from its current level. Such a failure to accommodate growth, or an increase in costs related to such information systems, could have a material adverse effect on us.
We may also encounter cyber-attacks on our critical data and we may not be able to anticipate or prevent all such attacks. We may incur increasing costs in an effort to minimize these risks and could be held liable for any security breach or loss. While we have policies and procedures designed to prevent or limit the effect of the possible failure, interruption or security breach of our information and communication systems, there can be no assurance that any such failure, interruption or security breach will not occur or, if they do occur, that they will be adequately addressed. The occurrence of any failure, interruption or security breach of our information or communication systems could damage our reputation, result in a loss of business, subject us to additional regulatory scrutiny, or expose us to civil litigation and possible financial liability.
We depend on our headquarters in New York City, where a large number of our personnel are located, for the continued operation of our business. A disaster or a disruption in the infrastructure that supports our businesses, including catastrophic events such as hurricanes or other larger scale catastrophes, a disruption involving electronic communications or other services used by us or third parties with whom we conduct business, or directly affecting our headquarters, could have a material adverse impact on our ability to continue to operate our business without interruption. The incidence and severity of catastrophes and other disasters are inherently unpredictable. Our disaster recovery programs may not be sufficient to mitigate the harm that may result from such a
17
disaster or disruption. Although we carry insurance to mitigate its exposure to certain catastrophic events, our insurance and other safeguards might only partially reimburse us for our losses, if at all.
Fluctuations in foreign currency exchange rates could adversely affect our results of operations
Because our financial statements are denominated in U.S. dollars and we receive a portion of our revenue in other currencies, predominantly in British pounds, euros, and Australian dollars, we are exposed to fluctuations in foreign currencies. In addition, we pay compensation to our non-U.S. employees and certain of our other expenses in such currencies. We have not entered into any transactions to hedge our exposure to these foreign exchange fluctuations through the use of derivative instruments or otherwise. An appreciation or depreciation of any of these currencies relative to the U.S. dollar could result in an adverse or beneficial impact to our financial results.
The market price of our common stock is volatile and may decline
The price of our common stock may fluctuate widely, depending upon many factors, including the perceived prospects of Greenhill and the financial services industry in general, differences between our actual financial and operating results and those expected by investors, changes in general economic or market conditions, broad market fluctuations, the impact of increased leverage on our financial position and the reduction in float as a result of our share repurchase plan. Since a significant portion of the compensation of our managing directors and certain other employees is paid in restricted stock units and our employees rely upon the ability of share sales to generate additional cash flow, a decline in the price of our stock may adversely affect our ability to retain key employees, including our managing directors. Similarly, our ability to recruit managing directors and other professionals may be adversely affected by a decline in the price of our stock.
We could change our existing dividend policy in the future, which could adversely affect our stock price
We began paying quarterly cash dividends to holders of record of our common stock in June 2004. In order to improve tax efficiency and accelerate the future payment of debt, as part of our recapitalization plan we elected to substantially reduce our quarterly dividend from the historical $0.45 per share of our common stock paid to holders of record since 2007. In that regard, in October 2017 our Board declared a dividend of $0.05 per share, which was paid in December 2017, and in February 2018 our Board declared a dividend of $0.05 per share to be paid on March 21, 2018 to common stockholders of record on March 7, 2018. We intend to continue to pay such reduced quarterly dividends subject to capital availability, cash flows and periodic determinations that cash dividends are in the best interest of our stockholders. Future declaration and payment of dividends on our common stock is at the discretion of our Board of Directors and depend upon, among other things, general financial conditions, capital requirements and surplus, cash flows, debt service obligations, our recent and expected future operations and earnings, contractual restrictions and other factors as the Board of Directors may deem relevant. For example, in the event that there is deterioration in our financial performance and/or our liquidity position, a downturn in global economic conditions or disruptions in the credit markets and our ability to obtain financing, our Board of Directors could decide to further reduce or even suspend dividend payments in the future. We cannot provide assurance that we will continue to declare dividends at all or in any particular amounts. A reduction or suspension in our dividend payments could have a negative effect on our stock price.
Cautionary Statement Concerning Forward-Looking Statements
We have made statements under the captions “Business”, “Risk Factors”, and “Management’s Discussion and Analysis of Financial Condition and Results of Operations” and in other sections of this Annual Report on Form 10-K that are forward-looking statements. In some cases, you can identify these statements by forward-looking words such as “may”, “might”, “will”, “should”, “expect”, “plan”, “outlook”, “potential”, “anticipate”, “believe”, “estimate”, “intend”, “predict”, “potential” or “continue”, the negative of these terms and other comparable terminology. These forward-looking statements, which are subject to risks, uncertainties and assumptions about us, may include current views and projections of our operations and future financial performance, growth strategies and anticipated trends in our business. These statements are only predictions based on our current expectations and projections about future events. There are important factors that could cause our actual results, level of activity, performance or achievements to differ materially from the results, level of activity, performance or achievements expressed or implied by the forward-looking statements. In particular, you should consider the numerous risks outlined in the foregoing paragraphs of this “Risk Factors” section.
These risks are not exhaustive. Other sections of this Annual Report on Form 10-K may include additional factors which could adversely affect our business and financial performance. Moreover, we operate in a very competitive and rapidly changing environment. New risk factors emerge from time to time and it is not possible for our management to predict all risk factors, nor can we assess the impact of all factors on our business or the extent to which any factor, or combination of factors, may cause actual results to differ materially from those contained in any forward-looking statements.
18
Although we believe the expectations reflected in the forward-looking statements are reasonable, we cannot give assurances that those expectations will be achieved, nor can we guarantee future results, level of activity, performance or achievements. Moreover, neither we nor any other person assumes responsibility for the accuracy or completeness of any of these forward-looking statements. You should not rely upon forward-looking statements as predictions of future events. We are under no duty to update or review any of these forward-looking statements after the date of this filing to conform our prior statements to actual results or revised expectations whether as a result of new information, future developments or otherwise.
Item 1B. Unresolved Staff Comments
There are no unresolved written comments that were received from the SEC staff 180 days or more before the end of the year relating to our periodic or current reports under the Exchange Act.
Item 2. Properties
Our principal offices, all of which are leased, are as follows:
Location | Owned/Leased | Lease Expiration | Approximate Square Footage as of December 31, 2017 | ||
300 Park Avenue | Leased | 2020 | 105,000 square feet | ||
New York, New York (Global Headquarters) | |||||
Lansdowne House | Leased | 2021 | 19,000 square feet | ||
57 Berkeley Square, London | |||||
Neue Mainzer Strasse 52-58 | Leased | 2023 | 7,000 square feet | ||
Frankfurt | |||||
Av. Brigadeiro Faria Lima, 2277 | Leased | 2023 | 5,000 square feet | ||
São Paulo | |||||
79 Wellington Street West | Leased | 2026 | 5,000 square feet | ||
Toronto | |||||
Marunouchi Building | Leased | 2021 | 4,000 square feet | ||
Tokyo | |||||
Governor Phillip Tower | Leased | 2025 | 11,000 square feet | ||
1 Farrer Place, Sydney | |||||
2101 Cedar Springs Rd | Leased | 2025 | 15,000 square feet | ||
Dallas, Texas | |||||
Most of the lease arrangements listed above provide for renewal options beyond the date of expiration.
We also have seven additional offices with approximately 38,000 of aggregate square footage with terms expiring through 2027.
In addition, in connection with the acquisition of Cogent we consolidated their personnel located in New York and London into our office space and we have subleased approximately 7,000 of aggregate square footage in their former locations. The sublease arrangements extend through the terms of the existing leases, which both terminate in 2019.
Item 3. Legal Proceedings
We are from time to time involved in legal proceedings incidental to the ordinary course of our business. We do not believe any such proceedings will have a material effect on our results of operations.
Item 4. Mine Safety Disclosures
Not applicable.
19
EXECUTIVE OFFICERS AND DIRECTORS
Our executive officers are Scott L. Bok (Chief Executive Officer), Kevin M. Costantino (President), David A. Wyles (President) and Harold J. Rodriguez, Jr. (Chief Financial Officer, Chief Operating Officer, Chief Compliance Officer and Treasurer). Set forth below is a brief biography of each executive officer.
Scott L. Bok, 58, has served as Chief Executive Officer since April 2010, served as Co-Chief Executive Officer between October 2007 and April 2010, and served as our U.S. President between January 2004 and October 2007. He has also served as a member of our Management Committee since its formation in January 2004. In addition, Mr. Bok has been a director of Greenhill & Co., Inc. since its incorporation in March 2004. Mr. Bok joined Greenhill as a Managing Director in February 1997. Before joining Greenhill, Mr. Bok was a Managing Director in the mergers, acquisitions and restructuring department of Morgan Stanley & Co., where he worked from 1986 to 1997, based in New York and London. From 1984 to 1986, Mr. Bok practiced mergers and acquisitions and securities law in New York with Wachtell, Lipton, Rosen & Katz. Mr. Bok also served as a member of the Board of Directors of Iridium Communications Inc., from 2009 to 2013.
Kevin M. Costantino, 41, has served as President since 2015, and also is a member of our Management Committee and serves as Co-Head of U.S. M&A. Prior to his appointment as President, Mr. Costantino served as Co-Head of our Australian business. Mr. Costantino joined Greenhill's New York office in 2005, to which he relocated in July 2015 after a second stay in our Sydney office. He also spent time in our Chicago office following its 2009 opening, and was involved in our expansion to Brazil two years ago. Before joining Greenhill, Mr. Costantino was a mergers and acquisitions lawyer with Wachtell, Lipton, Rosen & Katz in New York.
David A. Wyles, 49, has served as President since 2015, and also is a member of our Management Committee. Prior to his appointment as President, Mr. Wyles served as Co-Head of our European business. Mr. Wyles joined Greenhill 19 years ago as part of the original team from Baring Brothers that founded our London office, and was involved in the opening of our Frankfurt office two years later. He is one of the leading M&A advisors in the UK market, and has also led numerous major transaction assignments in Continental Europe and globally, including most of our assignments involving China.
Harold J. Rodriguez, Jr., 62, has served as our Chief Financial Officer since August 2016, as our Chief Operating Officer since January 2012, as Chief Administrative Officer from March 2008 until January 2012 and was Managing Director — Finance, Regulation and Operations from January 2004 to March 2008. Mr. Rodriguez also serves as our Chief Compliance Officer and Treasurer and is a member of our Management Committee. Mr. Rodriguez is the Chief Financial Officer of Greenhill’s operating subsidiaries and from November 2000 through December 2003 was Chief Financial Officer of Greenhill. Mr. Rodriguez has served as the Chief Financial Officer of Greenhill Capital Partners LLC since he joined Greenhill in June 2000. Prior to joining Greenhill, Mr. Rodriguez was Vice President — Finance and Controller of Silgan Holdings, Inc., a major consumer packaging goods manufacturer, from 1987 to 2000. From 1978 to 1987, Mr. Rodriguez worked at Ernst & Young, where he was a senior manager specializing in taxation.
Our Board of Directors has six members, two of whom are employees (Robert F. Greenhill and Scott L. Bok) and four of whom are independent (Steven F. Goldstone, Stephen L. Key, John D. Liu and Karen P. Robards). A brief biography of each of Messrs. Greenhill, Goldstone, Key and Liu and Ms. Robards is set forth below.
Robert F. Greenhill, 81, our founder, has served as our Chairman since the time of our founding in 1996 and served as our Chief Executive Officer between 1996 and October 2007. In addition, Mr. Greenhill has been a director of Greenhill & Co., Inc. since its incorporation in March 2004. Prior to founding and becoming Chairman of Greenhill, Mr. Greenhill was Chairman and Chief Executive Officer of Smith Barney Inc. and a member of the Board of Directors of the predecessor to the present Travelers Corporation (the parent of Smith Barney) from June 1993 to January 1996. From January 1991 to June 1993, Mr. Greenhill was president of, and from January 1989 to January 1991, Mr. Greenhill was a vice chairman of, Morgan Stanley Group, Inc. Mr. Greenhill joined Morgan Stanley in 1962 and became a partner in 1970. In 1972, Mr. Greenhill directed Morgan Stanley’s newly-formed mergers and acquisitions department. In 1980, Mr. Greenhill was named director of Morgan Stanley’s investment banking division, with responsibility for domestic and international corporate finance, mergers and acquisitions, merchant banking, capital markets services and real estate. Also in 1980, Mr. Greenhill became a member of Morgan Stanley’s management committee.
Steven F. Goldstone, 72, has served on our Board of Directors since July 2004 and has also served as our Lead Independent Director since January 2016. He currently manages Silver Spring Group, a private investment firm. From 1995 until his retirement in 2000, Mr. Goldstone was Chairman and Chief Executive Officer of RJR Nabisco, Inc. (which was subsequently named Nabisco Group Holdings following the reorganization of RJR Nabisco, Inc.). Prior to joining RJR Nabisco, Inc., Mr. Goldstone was a partner at Davis Polk & Wardwell, a law firm in New York City. He is also the non-executive Chairman of ConAgra Foods, Inc. Mr. Goldstone served as a member of the Board of Directors of Trane, Inc. (f/k/a American Standard Companies, Inc.) from 2002 until 2008 and as a member of the Board of Directors of Merck & Co. from 2008 until 2012. Mr. Goldstone has also served as a member of the Board of Directors of The Chefs' Warehouse, Inc. since March 2016.
20
Stephen L. Key, 74, has served on our Board of Directors since May 2004. Since 2003, Mr. Key has been the sole proprietor of Key Consulting, LLC. From 1995 to 2001, Mr. Key was the Executive Vice President and Chief Financial Officer of Textron Inc., and from 1992 to 1995, Mr. Key was the Executive Vice President and Chief Financial Officer of ConAgra, Inc. From 1968 to 1992, Mr. Key worked at Ernst & Young, serving in various capacities, including as the Managing Partner of Ernst & Young’s New York Office from 1988 to 1992. Mr. Key is a Certified Public Accountant in the State of New York. Mr. Key served as a member of the Board of Directors of Fairway Group Holdings Corp. from 2012 to 2016 and as Chairman of the Audit Committee of the Board of Directors of Fairway Group Holdings Corp. from 2013 to 2016. Mr. Key has also served as a member of the Board of Directors of Sitel, Inc. from 2007 until 2008, as a member of the Board of Directors of Forward Industries, Inc. from 2010 until 2012, and as a member of the Board of Directors of 1-800-Contacts, Inc. from 2005 to 2012.
John D. Liu, 47, has served on our Board of Directors since June 2017. Since March 2008, Mr. Liu has been the chief executive officer of Essex Equity Management, a financial services company, and managing partner of Richmond Hill Investments, an investment management firm. Prior to that time, Mr. Liu was employed for 12 years by Greenhill until March 2008 in positions of increasing responsibility, including as chief financial officer from January 2004 to March 2008 and as co-head of U.S. Mergers and Acquisitions from January 2007 to March 2008. Earlier in his career, Mr. Liu worked at Wolfensohn & Co. and was an analyst at Donaldson, Lufkin & Jenrette. Mr. Liu also serves as a member of the Board of Directors of Whirlpool Corporation.
Karen P. Robards, 67, has served on our Board of Directors since April 2013. Since 1987, Ms. Robards has been a principal of Robards & Company, LLC, a consulting and private investment firm. From 1976 to 1987, Ms. Robards was an investment banker at Morgan Stanley where she served as head of its healthcare investment banking activities. Ms. Robards currently serves as Vice Chair of the Board and Chair of the Audit Committee of BlackRock Closed-End Funds. Ms. Robards served as a member of the Board of Directors of AtriCure, Inc., a medical device company, from 2000 to May 2017. From 1996 to 2005, Ms. Robards served as a director of Enable Medical Corporation, a developer and manufacturer of surgical instruments, which was acquired by AtriCure, Inc. in 2005. From 2007 to 2010, Ms. Robards also served as a director of Care Investment Trust, a publicly held real estate investment trust focusing on investment opportunities in the healthcare industry.
21
PART II
Item 5. Market for Registrant’s Common Stockholders' Equity, Related Stockholder Matters and Issuer Purchases of Equity Securities
The New York Stock Exchange is the principal market on which our common stock (ticker: GHL) is traded. The following tables set forth, for the fiscal quarters indicated, the high and low sales prices per share of our common stock, as reported in the consolidated transaction reporting system, and the quarterly dividends declared.
Fiscal 2017 | |||||||||||
Sales Price | Dividends per share of common stock | ||||||||||
High | Low | ||||||||||
First quarter | $ | 30.75 | $ | 26.40 | $ | 0.45 | |||||
Second quarter | 29.30 | 19.50 | 0.45 | ||||||||
Third quarter | 20.50 | 14.00 | 0.45 | ||||||||
Fourth quarter | 20.65 | 16.60 | 0.05 | ||||||||
Fiscal 2016 | |||||||||||
Sales Price | Dividends per share of common stock | ||||||||||
High | Low | ||||||||||
First quarter | $ | 28.61 | $ | 20.61 | $ | 0.45 | |||||
Second quarter | 22.06 | 15.93 | 0.45 | ||||||||
Third quarter | 23.59 | 16.00 | 0.45 | ||||||||
Fourth quarter | 29.05 | 22.41 | 0.45 | ||||||||
As of February 15, 2018, there were 7 holders of record of our common stock. The majority of our shares are held in street name by diversified financial broker dealers which are not counted as “record” holders.
On February 15, 2018, the last reported sales price for our common stock on the New York Stock Exchange was $20.40 per share.
22
The following performance graph and related information shall not be deemed “soliciting material” or to be “filed” with the Securities and Exchange Commission, nor shall such information be incorporated by reference into any future filing under the Securities Act of 1933 or Securities Exchange Act of 1934, each as amended, except to the extent we specifically incorporate it by reference into such filing. Our stock price performance shown in the graph below is not indicative of future stock price performance.
COMPARES 5-YEAR CUMULATIVE TOTAL RETURN AMONG GREENHILL & CO.,
INC., S&P 500 INDEX AND S&P FINANCIAL INDEX
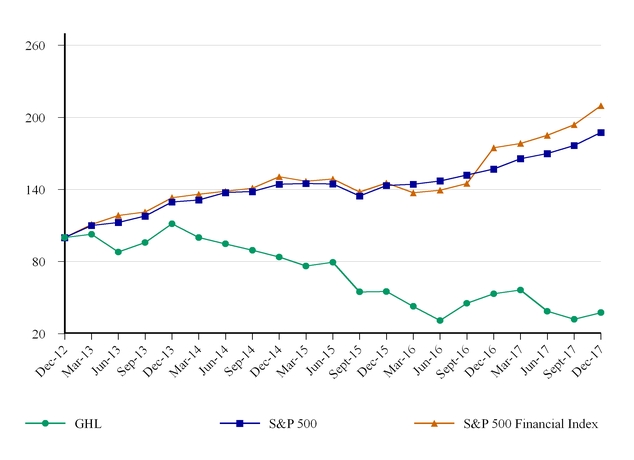
ASSUMES $100 INVESTED ON DECEMBER 31, 2012
ASSUMES DIVIDEND REINVESTED
FISCAL YEAR ENDING DECEMBER 31, 2017
23
Share Repurchases in the Fourth Quarter of 2017
Period | Total Number of Shares Repurchased (1) | Average Price Paid Per Share | Total Number of Shares Purchased as Part of Publicly Announced Plans or Programs (1) | Approximate Dollar Value of Shares that May Yet Be Purchased under the Plans or Programs (2) (3) | |||||||
October 1 – October 31 | 3,434,137 | $ | 17.25 | 3,434,137 | $ | 225,761,137 | |||||
November 1 – November 30 | 130,003 | 19.05 | 130,003 | 223,284,708 | |||||||
December 1 – December 31 | 213,408 | 19.03 | 213,408 | 219,223,716 | |||||||
Total | 3,777,548 | 3,777,548 | $ | 219,223,716 | |||||||
_____________________________________________
(1) | Includes 3,434,137 shares we repurchased in the fourth quarter of 2017 pursuant to a cash tender offer at a purchase price of $17.25 per share, which closed on October 25, 2017. Excludes 42,939 shares we are deemed to have repurchased in the fourth quarter of 2017 at an average price of $17.35 per share, or $0.7 million, from employees in conjunction with the payment of tax liabilities in respect of stock delivered to employees in settlement of restricted stock units. |
(2) | Shares which may be repurchased under the plan authorized by the Board of Directors. On January 26, 2017, the Board of Directors authorized the repurchase of up to $75,000,000 of our common stock during 2017. Effective September 25, 2017, the Board of Directors revoked and terminated such prior authorization, and authorized the repurchase of up to $285,000,000 of our common stock for further share repurchases, including shares repurchased during the tender offer which closed on October 25, 2017. |
(3) | The value of shares repurchased during the year ended December 31, 2017 excludes 491,677 shares we are deemed to have repurchased at an average price of $28.04 per share, or $13.8 million, from employees in conjunction with the payment of tax liabilities in respect of stock delivered to employees in settlement of restricted stock units. |
24
Item 6. Selected Financial Data
As of or for the Year Ended December 31, | |||||||||||||||||||
2017 | 2016 | 2015 | 2014 | 2013 | |||||||||||||||
(in millions, except per share and number of employees data) | |||||||||||||||||||
Statement of Operations Data: | |||||||||||||||||||
Advisory revenues | $ | 238.0 | $ | 334.8 | $ | 260.3 | $ | 280.5 | $ | 287.0 | |||||||||
Investment revenues | 1.2 | 0.7 | 1.3 | (5.2 | ) | 0.2 | |||||||||||||
Total revenues | 239.2 | 335.5 | 261.6 | 275.3 | 287.2 | ||||||||||||||
% change from prior year | (29 | )% | 28 | % | (5 | )% | (4 | )% | 1 | % | |||||||||
Employee compensation and benefits expense | 160.2 | 182.5 | 147.2 | 147.6 | 155.7 | ||||||||||||||
Non-compensation operating expenses | 72.1 | 61.9 | 68.6 | 59.0 | 59.3 | ||||||||||||||
Total operating income | 6.9 | 91.1 | 45.8 | 68.7 | 72.2 | ||||||||||||||
Interest expense | 7.2 | 3.2 | 2.5 | 1.2 | 1.0 | ||||||||||||||
Income (loss) before taxes | (0.3 | ) | 87.9 | 43.3 | 67.5 | 71.2 | |||||||||||||
Provision for taxes | 26.4 | 27.1 | 17.7 | 24.1 | 24.5 | ||||||||||||||
Net income (loss) allocated to common stockholders | (26.7 | ) | 60.8 | 25.6 | 43.4 | 46.7 | |||||||||||||
Diluted average shares outstanding | 32,074,894 | 32,074,232 | 31,200,378 | 30,357,691 | 30,160,669 | ||||||||||||||
Diluted earnings (loss) per share | (0.83 | ) | 1.89 | 0.82 | 1.43 | 1.55 | |||||||||||||
Balance Sheet Data: | |||||||||||||||||||
Total assets | $ | 610.8 | $ | 456.7 | $ | 423.1 | $ | 337.0 | $ | 352.4 | |||||||||
Total liabilities | 402.5 | 165.5 | 139.8 | $ | 81.4 | 75.7 | |||||||||||||
Stockholders’ equity | 208.3 | 291.2 | 283.4 | $ | 255.5 | 276.7 | |||||||||||||
Dividends declared per share | 1.40 | 1.80 | 1.80 | 1.80 | 1.80 | ||||||||||||||
Selected Data and Ratios (unaudited) | |||||||||||||||||||
Operating income as a percentage of revenues | 3 | % | 27% | 18 | % | 25 | % | 25% | |||||||||||
Revenues per employee (a) | $ | 681 | $ | 950 | $ | 799 | $ | 882 | $ | 893 | |||||||||
Employees at year-end (b) | |||||||||||||||||||
North America | 203 | 195 | 192 | 154 | 173 | ||||||||||||||
Europe | 89 | 91 | 88 | 84 | 86 | ||||||||||||||
Rest of World | 54 | 70 | 70 | 67 | 60 | ||||||||||||||
Total employees | 346 | 356 | 350 | 305 | 319 | ||||||||||||||
(a) | Total revenues divided by average number of employees (including managing directors and senior advisors) in each year (in thousands). |
(b) | Includes our managing directors and senior advisors. |
25
Item 7. Management’s Discussion and Analysis of Financial Condition and Results of Operations
Overview
Greenhill is a leading independent investment bank that provides financial and strategic advice on significant domestic and cross-border mergers and acquisitions, divestitures, restructurings, financings, capital raising and other strategic transactions to a diverse client base, including corporations, partnerships, institutions and governments globally. We serve as a trusted advisor to our clients throughout the world from our offices in the United States, Australia, Brazil, Canada, Germany, Hong Kong, Japan, Spain, Sweden, and the United Kingdom.
Our revenues are principally derived from advisory services on mergers and acquisitions (or M&A), financings and restructurings and are primarily driven by total deal volume and the size of individual transactions. While fees payable upon the successful conclusion of a transaction generally represent the largest portion of our advisory fees, we also earn other corporate advisory fees, including on-going retainer fees, substantially all of which relate to non-success based strategic advisory and financing advisory and restructuring assignments, and fees payable upon the commencement of an engagement or upon the achievement of certain milestones, such as the announcement of a transaction or the rendering of a fairness opinion. Additionally, our global capital advisory group provides capital raising advisory services in the primary market for real estate funds, where revenues are driven primarily by the amount of capital raised, and in the secondary market for alternative assets, where revenue is determined based upon a fixed percentage of the transaction value.
Greenhill was established in 1996 by Robert F. Greenhill, the former President of Morgan Stanley and former Chairman and Chief Executive Officer of Smith Barney. Since our founding, Greenhill has grown by recruiting talented managing directors and other senior professionals, by acquiring complementary advisory businesses and by training, developing and promoting professionals internally. We have expanded beyond merger and acquisition advisory services to include financing, restructuring and capital advisory services, and we have expanded the breadth of our sector expertise to cover substantially all major industries. Since the opening of our original office in New York, we have expanded globally to 15 offices across five continents.
Over our 22 years as an independent investment banking firm, we have sought to opportunistically recruit new managing directors with a range of industry and transaction specialties, as well as high-level corporate and other relationships, from major investment banks, independent financial advisory firms and other institutions. We also have sought to expand our geographic reach both through recruiting managing directors in new locations and through strategic acquisitions, such as our 2006 acquisition of Beaufort Partners Limited (now Greenhill Canada) in Canada and our 2010 acquisition of Caliburn Partnership Pty Limited (now Greenhill Australia) in Australia. Additionally, we expanded the breadth of our advisory services through the recruitment of a team of managing directors focused on real estate capital advisory services, through the hiring of managing directors to focus on financing and restructuring advisory services, and through our acquisition in 2015 of Cogent, which provides advisory services related to the secondary fund placement market. Through our recruiting and acquisition activity, we have significantly increased our geographic reach by adding offices in the United States, United Kingdom, Germany, Canada, Japan, Australia, Sweden, Hong Kong, Brazil and Spain. We intend to continue our efforts to recruit new managing directors with industry sector experience and/or geographic reach who can help expand our advisory capabilities. During 2017, we announced the recruitment of nine corporate advisory focused managing directors, who have joined our teams in the United States, Australia, Canada and Europe, including two who extend our reach into the Spanish market. We had 71 client facing managing directors as of January 1, 2018.
In September 2017, we announced plans for a leveraged recapitalization to put in place a capital structure designed to enhance long term shareholder value in the context of our then current equity valuation, existing tax rates and existing opportunities in the credit market. Under that plan, net proceeds from the borrowing of $350.0 million of term loans, which closed in early October 2017, were used to repay in full the existing bank indebtedness outstanding at the time. The remaining term loan proceeds, in addition to the proceeds from the purchase of $10.0 million of our common stock by each of our Chairman and Chief Executive Officer, which closed in early November 2017, were intended to be used to repurchase up to $285.0 million of our common stock (together the term loan borrowing, common stock purchases, bank debt repayment and the plan for the repurchase of common stock constitute the "Recapitalization"). The Recapitalization plan is intended to reduce taxes, increase earnings per share and increase employee alignment with shareholders, while offering those wishing to monetize their shares a significant opportunity for liquidity. We began the implementation of our repurchase plan during the fourth quarter of 2017 and, as of December 31, 2017, we repurchased 3,434,137 shares of our common stock through a fixed price tender offer and an additional 343,411 common shares through open market transactions, or in aggregate 3,777,548 common shares at an average price of $17.41 per share, for a total cost of $65.8 million. In January 2018, we repurchased an additional 341,742 shares through open market transactions for $6.5 million. The repurchased shares represent approximately 13% of our total outstanding shares at the time we announced the Recapitalization plan. In February 2018, we launched a modified Dutch auction tender offer for the purchase of up to $110.0 million in value of our common stock at a purchase price of not greater than $20.50 nor less than $18.50 per share, which is scheduled to expire on March 14, 2018, subject to extension. We intend to continue to implement our share repurchase plan through various means, which could include one or more of the following: open market purchases (including pursuant to 10b5-1 plans),
26
tender offers, privately negotiated transactions and/or accelerated share repurchases. The price and timing of future share repurchases, as well as the total funds ultimately expended, will be subject to market conditions and other factors. See "Item 2. Management's Discussion and Analysis of Financial Condition and Results of Operations — Liquidity and Capital Resources".
At December 31, 2017, we employed 346 people. We strive to maintain a work environment that fosters professionalism, excellence, diversity, and cooperation among our employees worldwide. We utilize a comprehensive evaluation process at the end of each year to measure performance, determine compensation and provide guidance on opportunities for continued development.
Business Environment and Outlook
Economic and global financial market conditions can materially affect our financial performance. In addition, revenues and net income in any period may not be indicative of full-year results or the results of any other period and may vary significantly from year to year and quarter to quarter. See “Risk Factors.”
Our total revenues were $239.2 million in the year ended December 31, 2017 compared to $335.5 million in the year ended December 31, 2016, a decrease of $96.3 million, or 29%. The decrease resulted from significantly fewer larger merger and acquisition completion fees as well as a decrease in announcement fees, offset in part by higher capital advisory revenues and an increase in retainer fee revenues. For the full year 2017, the number of worldwide completed M&A transactions in 2017 increased by 4% as compared to 2016, while the volume (dollar value) of completed transactions (reflecting the sum of all transaction sizes) decreased by 10%. For 2017, the number of announced transactions increased by 7% as compared to 2016, while the volume (dollar value) of announced transactions decreased by 1% in the same period.(1)
In 2017, we advised on transactions for the first time for such leading companies around the world as Brookfield Canada Office Properties, Bupa Ltd., Chromalox, Inc., Deltaplam Embalagens Indústria e Comércio Ltda., Energy Corporation of America, Inc., Equiniti Group plc, Grupo Sidecu, Inenco Group Pty Ltd, Jaybro, Mãe Terra Produtos Naturais Ltda., McDermott International, Inc., MorphoSys AG, Morris Corporation Group Pty Ltd, Natural Resource Partners, L.P., Palatin Technologies, Inc., PERSOL HOLDINGS CO., LTD, Talen Energy, Thermamax, Inc., and Total System Services, Inc. We also advised on new transactions for historic clients in all major markets including Bionomics Limited, Det Norske Veritas Holding AS, Emerson Electric Co., Experian plc, F+W Media, Inc., International Flavors & Fragrances, Inc., Ladbrokes Coral Group PLC, Lonmin plc, Lion Pty Ltd, Mannkind Corporation, TEGNA, Inc., and Tesco PLC.
By geographic region in 2017, North America, where we generated 73% of our revenues, remained our largest contributor, although in absolute terms our revenues there declined slightly year over year. In Europe we derived 17% of our revenues, and our absolute revenues there declined by more than half from 2016. In the rest of the world, we generated 10% of our revenues, which was a decline year over year in both the percentage and dollar amount of revenues.
By industry sector in 2017, improved performance in capital advisory and to a lesser extent the energy & utilities sectors were more than offset by a decline in revenues generated from our activities in the healthcare, financial services, technology, communication and media, and general industrial sectors.
Our decline in revenues in 2017 as compared to 2016 and prior years primarily related to lower revenue generation from our international operations, particularly our European operations, which has historically been a strong revenue producer. Revenue from clients in Europe and elsewhere outside the U.S. fell by more than half relative to the prior year, as a result of significantly fewer large transaction completions. Based on announced transaction activity in Europe, our historical revenue results and ongoing transaction dialogues we expect that we will generate increased revenues from our European operations in 2018. Partially offsetting the weaker results from international corporate advisory activity was increased revenue from our capital advisory business, which achieved record annual revenues in 2017. Assuming reasonably stable markets and continued sector growth in the secondary capital business, we expect that we will continue to generate revenues in the capital advisory businesses at the levels we have achieved since 2015.
As a result of lower revenues in 2017 our compensation and benefits expense, which we measure as a percentage of revenues, increased to 67% of revenues as compared to a range from 54% to 56% for the prior three years. Similarly, our historical strong profit margin was impacted by the decline in revenues. Assuming our revenues increase toward average levels we have achieved in the past five years, we would expect our compensation ratio and profit margin in future periods to move back toward historic levels.
(1) | Excludes transactions less than $100,000 and withdrawn/canceled deals. Source: Thomson Financial as of February 5, 2018. |
27
We generally experience significant variations in revenues during each quarterly period and we also experienced a significant variation in our annual revenue in 2017 as compared to recent years. These variations can generally be attributed to the fact that a majority of our revenues is usually earned in large amounts upon the successful completion of transactions, the timing of which is uncertain and are not subject to our control. As a result, our results of operations vary and our results in one period may not be indicative of our results in any future period.
Results of Operations
The following tables set forth data relating to the Firm’s sources of revenues:
Historical Revenues by Source
For the Years Ended December 31, | |||||||||||||||||||
2017 | 2016 | 2015 | 2014 | 2013 | |||||||||||||||
(in millions) | |||||||||||||||||||
Advisory revenues | $ | 238.0 | $ | 334.8 | $ | 260.3 | $ | 280.5 | $ | 287.0 | |||||||||
Investment revenues (losses) | 1.2 | 0.7 | 1.3 | (5.2 | ) | 0.2 | |||||||||||||
Total revenues | $ | 239.2 | $ | 335.5 | $ | 261.6 | $ | 275.3 | $ | 287.2 | |||||||||
Advisory Revenues
Historical Advisory Revenues by Client Location
For the Years Ended December 31, | ||||||||||||||
2017 | 2016 | 2015 | 2014 | 2013 | ||||||||||
North America | 73 | % | 57 | % | 58 | % | 59 | % | 52 | % | ||||
Europe | 17 | % | 30 | % | 23 | % | 30 | % | 33 | % | ||||
Rest of World | 10 | % | 13 | % | 19 | % | 11 | % | 15 | % | ||||
Historical Advisory Revenues by Industry
For the Year Ended December 31, | ||||||||||||||
2017 | 2016 | 2015 | 2014 | 2013 | ||||||||||
Consumer Goods & Retail | 9 | % | 10 | % | 4 | % | 16 | % | 14 | % | ||||
Energy & Utilities | 10 | % | 6 | % | 5 | % | 7 | % | 7 | % | ||||
Financial Services | 2 | % | 7 | % | 6 | % | 11 | % | 13 | % | ||||
General Industrial & Other | 24 | % | 24 | % | 39 | % | 25 | % | 20 | % | ||||
Healthcare | 9 | % | 16 | % | 12 | % | 15 | % | 16 | % | ||||
Real Estate, Lodging & Leisure | 3 | % | 6 | % | 4 | % | 2 | % | 4 | % | ||||
Technology, Communications & Media | 13 | % | 16 | % | 9 | % | 13 | % | 15 | % | ||||
Capital Advisory (Fund Placement) | 30 | % | 15 | % | 21 | % | 11 | % | 11 | % | ||||
We operate in a highly competitive environment where there are no long-term contracted sources of revenue. Each revenue-generating engagement is separately awarded and negotiated. Our list of clients with whom there are active engagements changes continually. To develop new client relationships, and to develop new engagements from historic client relationships, we maintain, on an ongoing basis, active business dialogues with a large number of clients and potential clients. We gain new clients each year through our business development initiatives, through recruiting additional senior investment banking professionals who bring with them client relationships and expertise in certain industry sectors or geographies and through referrals from members of boards of directors, attorneys and other parties with whom we have relationships. At the same time, we lose clients each year as a result of the sale or merger of a client, a change in a client’s senior management team, turnover of our senior banking professionals, competition from other investment banks and other causes.
28
Our revenues are principally derived from advisory services on mergers and acquisitions (or M&A), financings and restructurings and are primarily driven by total deal volume and the size of individual transactions. A majority of our advisory revenue is contingent upon the closing of a merger, acquisition, financing, restructuring, capital fund transaction or other advisory transaction. While fees payable upon the successful conclusion of a transaction generally represent the largest portion of our fees, we also earn other corporate advisory fees, including on-going retainer fees, substantially all of which relate to non-success based strategic advisory and financing advisory and restructuring assignments, and fees payable upon the commencement of an engagement or upon the achievement of certain milestones, such as the announcement of a transaction or the rendering of a fairness opinion. Additionally, our capital advisory group provides capital raising advisory services in the primary market for real estate funds, where revenues are driven primarily by the amount of capital raised by the fund at each interim closing and at the final closing for the amount of capital committed since the last interim closing, and in the secondary market for alternative assets, where revenue is determined based upon a fixed percentage of the transaction value at the closing of each transaction.
We do not allocate our advisory revenue by type of advice rendered (M&A, financing advisory and restructuring, strategic advisory, or other) because of the complexity of the assignments for which we earn revenue and because a single transaction can encompass multiple types of advice. For example, a restructuring assignment can involve, and in some cases end successfully in, a sale of all or part of the financially distressed company. Likewise, an acquisition assignment can relate to a financially distressed target involved in or considering a restructuring, and an M&A assignment can develop from a relationship that we had on a prior restructuring assignment, and vice versa. We do, however, separately allocate capital advisory revenue.
2017 versus 2016. Advisory revenues were $238.0 million for the year ended December 31, 2017 compared to $334.8 million for the year ended December 31, 2016, a decrease of 29%. The decrease in our 2017 advisory revenues, as compared to 2016, resulted from significantly fewer larger merger and acquisition completion fees as well as a decrease in announcement fees, offset in part by higher capital advisory revenues and an increase in retainer fee revenues.
Prominent advisory assignments completed in 2017 include:
• | the acquisition by American Axle & Manufacturing Holdings, Inc. of Metaldyne Performance Group Inc.; |
• | the sale of Derma Sciences, Inc. to Integra LifeSciences Holdings Corporation; |
• | the representation of Det Norske Veritas Holding AS on its acquisition of a 36.5% stake in DNV GL Group AS; |
• | the acquisition by Emerson Electric Co. of Pentair plc's Valves and Controls business; |
• | the sale by Energy Corporation of America of substantially all of its oil and gas assets to Greylock Energy, an affiliate of ArcLight Capital Partners; |
• | the acquisition by GoDaddy Inc. of Host Europe Group Ltd.; |
• | advising Natural Resource Partners L.P. on a series of recapitalization transactions, including the extension of NRP's near-term debt maturities and the issuance of $250 million of new preferred equity capital; |
• | the acquisition by PERSOL HOLDINGS CO., LTD of Programmed Maintenance Services Limited; |
• | the merger of Shanks Group plc with Van Gansewinkel Groep B.V.; and |
• | the spin-off by TEGNA Inc. of Cars.com. |
During 2017, our capital advisory group advised real estate fund general partners on six final closings of primary capital commitments from institutional investors in such funds, and advised institutional investors on 82 closings of sales of limited partnership interests in secondary market transactions. Capital advisory fees for 2017 increased to $70.9 million, an increase of $19.7 million, or 38%, compared to $51.2 million for 2016. For 2017, we generated 30% of our advisory revenues from capital advisory fees.
We earned advisory revenues from 197 different clients in 2017 and 212 different clients in 2016. Of this group of clients, 44% were new to us in 2017. We earned fees of $1 million or more from 58 clients in 2017, down 18% compared to 71 clients in 2016. The ten largest fee-paying clients contributed 39% of our total revenues in 2017 and 40% in 2016. There was no single client in 2017 or 2016 that represented greater than 10% of our revenues.
29
2016 versus 2015. Advisory revenues were $334.8 million for the year ended December 31, 2016 compared to $260.3 million for the year ended December 31, 2015, an increase of 29%. The increase in our 2016 advisory revenues, as compared to 2015, resulted from a greater number of completed merger and acquisition transactions with fees which were generally larger in scale than the prior year, offset in part by a decrease in other corporate advisory fees.
Prominent advisory assignments completed in 2016 include:
• | the acquisition by Ball Corporation of Rexam plc; |
• | the representation of Boehringer Ingelheim GmbH on a global collaboration with AbbVie Inc.; |
• | the sale of Heartland Payment Systems, Inc. to Global Payments Inc.; |
• | the acquisition by MANN+HUMMEL GmbH of the global filtration operations of Affinia Group Holding, Inc.; |
• | the sale of ROFIN-SINAR Technologies, Inc. to Coherent, Inc.; |
• | the representation of SUPERVALU INC. on the sale of its Save-A-Lot business to an affiliate of Onex Corporation; |
• | the sale of Telecity Group plc to Equinix, Inc.; |
• | the acquisition by Teva Pharmaceuticals Industries Ltd. of Allergan plc's generics business; |
• | the representation of Teva Pharmaceuticals Industries Ltd. on the divestment of the U.S. rights to seventy-nine generic products to eleven different counterparties; |
• | the representation of Texas Competitive Electric Holdings and its subsidiaries at the direction of its independent director in connection with its and Energy Future Holdings' Chapter 11 proceedings; and |
• | the sale of Whistler Blackcomb Holdings Inc. to Vail Resorts, Inc. |
During 2016, our capital advisory group advised real estate fund general partners on five final closings of primary capital commitments from institutional investors in such funds, and advised institutional investors on 83 closings of sales of limited partnership interests in secondary market transactions. Capital advisory fees for 2016 decreased to $51.2 million, a slight decrease of $3.8 million, or 7%, compared to $55.0 million for 2015, which principally resulted from a slowdown in transaction activity as a result of market volatility throughout the year, offset by an additional three months of revenue from our secondary placement business, which was acquired April 1, 2015. For 2016, we generated 15% of our advisory revenues from capital advisory fees.
We earned advisory revenues from 212 different clients in 2016 and 197 different clients in 2015. Of this group of clients, 47% were new to us in 2016. We earned fees of $1 million or more from 71 clients in 2016, up 11% compared to 64 clients in 2015. The ten largest fee-paying clients contributed 40% of our total revenues in 2016 and 32% in 2015. There was no single client in 2016 or 2015 that represented greater than 10% of our revenues.
Investment Revenues
We also generate a small portion of our revenues from interest income and gains (or losses) in merchant banking fund investments, which we substantially liquidated in prior years. Revenue recognized on investments in merchant banking funds is based on our allocable share of realized and unrealized gains (or losses) reported by such funds on a quarterly basis.
At December 31, 2017, our remaining investments in merchant banking funds consisted of a small group of diverse investments held, which in aggregate had an estimated fair value of $1.2 million. The remaining merchant banking fund investments are expected to be liquidated as the relevant managers seek to realize value from each underlying investment. We have no remaining commitments to make principal investments, and we do not intend to make any going forward.
30
The following table sets forth information relating to our investment revenues:
For the Years Ended December 31, | |||||||||||
2017 | 2016 | 2015 | |||||||||
(In millions) | |||||||||||
Net realized and unrealized gains (losses) in investments in merchant banking funds | $ | (0.2 | ) | $ | (0.2 | ) | $ | 0.2 | |||
Interest income | 1.4 | 0.9 | 1.1 | ||||||||
Total investment revenues | $ | 1.2 | $ | 0.7 | $ | 1.3 | |||||
2017 versus 2016. For the year ended December 31, 2017, we recorded investment revenues of $1.2 million compared to $0.7 million for the year ended December 31, 2016. The investment revenues for both 2017 and 2016 primarily consisted of interest income.
2016 versus 2015. For the year ended December 31, 2016, we recorded investment revenues of $0.7 million compared to $1.3 million for the year ended December 31, 2015. The investment revenues for both 2016 and 2015 primarily consisted of interest income.
Operating Expenses
As a result of the Recapitalization and the incurrence of interest expense related to a $350.0 million term loan facility we have separately classified in the presentation of expenses (i) operating expenses, which consist of employee compensation and benefits expenses and non-compensation operating expenses, and (ii) interest expense. Non-compensation operating expenses include travel, office space, communications, information services, depreciation, and professional services. A portion of certain costs are reimbursed by clients under the terms of client engagements. The data presented for 2016 and 2015 has been reclassified to conform to the current year presentation, which excludes interest expense from operating expenses and operating profit and reports it as a separate component of income before tax.
For the year ended December 31, 2017, total operating expenses were $232.3 million compared to $244.4 million in 2016. The decrease of $12.1 million, or 5%, resulted principally from a decrease in our compensation and benefits expenses, offset in part by an increase in non-compensation expenses, both as described in more detail below. Our operating profit margin was 3% for 2017 as compared to 27% for 2016.
For the year ended December 31, 2016, total operating expenses were $244.4 million compared to $215.8 million in 2015. The increase of $28.6 million, or 13%, resulted principally from an increase in our compensation and benefits expenses, offset in part by a decrease in non-compensation expenses, as described in more detail below. Our operating profit margin was 27% for 2016 as compared to 18% for 2015.
The following table sets forth information relating to our operating expenses, which are reported net of reimbursements of certain expenses by our clients:
For the Years Ended December 31, | |||||||||||
2017 | 2016 | 2015 | |||||||||
(in millions, except employee data) | |||||||||||
Number of employees at year end | 346 | 356 | 350 | ||||||||
Employee compensation and benefits expenses | $ | 160.2 | $ | 182.5 | $ | 147.2 | |||||
% of revenues | 67 | % | 54 | % | 56 | % | |||||
Non-compensation operating expenses | 72.1 | 61.9 | 68.6 | ||||||||
% of revenues | 30 | % | 18 | % | 26 | % | |||||
Total operating expenses | 232.3 | 244.4 | 215.8 | ||||||||
% of revenues | 97 | % | 73 | % | 82 | % | |||||
Total operating income | 6.9 | 91.1 | 45.8 | ||||||||
Operating profit margin | 3 | % | 27 | % | 18 | % | |||||
Compensation and Benefits Expenses
The largest component of our operating expenses is employee compensation and benefits expenses, which we determine annually based on a percentage of revenues. The actual percentage of revenue is determined by management in consultation with the
31
Compensation Committee at each year-end and based on such factors as the relative level of revenues, anticipated compensation requirements to retain and reward our employees, the cost to recruit and exit employees, the charge for amortization of restricted stock and deferred cash compensation awards and related forfeitures and other relevant factors. The ratio of compensation and benefits expense to revenues was 67% in 2017 as compared to 54% in 2016.
Our compensation and benefits expenses principally consist of (i) base salary and benefits, (ii) amortization of long-term incentive compensation awards of restricted stock units and deferred cash compensation and (iii) annual incentive compensation payable as cash bonus awards. Base salary and benefits are paid ratably throughout the year. Awards of restricted stock units and deferred cash compensation are discretionary and are amortized into compensation expense (based upon the fair value of the award at the time of grant) during the service period over which the award vests, which is generally four to five years for the majority of the awards. As we expense the restricted stock awards, the restricted stock units recognized are recorded within stockholders’ equity. Annual cash bonuses, which are accrued each quarter, are discretionary and dependent upon a number of factors, including our financial performance, and are generally paid in the first quarter in respect of the preceding year.
The sum of base salaries and benefits and the amortization of long-term incentive compensation awards, which we refer to as our fixed compensation cost, has ranged annually from approximately $125.0 million to $135.0 million during the three-year period ended December 31, 2017. We estimate that our fixed compensation cost for 2018 will fall within this range. This estimate is based upon our headcount and salary levels as of the beginning of 2018. The decisions we make throughout the year relating to hiring, retaining and exiting employees may increase or decrease our full year fixed compensation cost. Our fixed compensation cost may vary from year to year based on such factors as headcount, changes in charges for the amortization of restricted stock units and other related matters.
The aggregate amount of discretionary bonus payments generally represents the excess amount of the total compensation amount over the amount of base salary and benefits and amortization of long-term incentive compensation award. Annual cash bonus amounts of $24.4 million, $53.3 million and $23.0 million were paid and/or accrued in 2017, 2016 and 2015, respectively.
Our ratio of compensation to revenues was 67% in 2017, which was significantly higher than the range of 53% to 56% over the past several years. It is our goal to reduce the compensation ratio over time toward our historic range, which will be dependent upon our revenue generation, changes in headcount and other factors. We will balance this goal with our objective of retaining our core personnel and compensating them competitively in order to maintain our strong franchise, and continuing to recruit new senior bankers.
2017 versus 2016. For the year ended December 31, 2017, our employee compensation and benefits expenses were $160.2 million as compared to $182.5 million for the same period in the prior year. During 2017 and 2016, we incurred similar amounts of base compensation and amortization of long-term incentive compensation and the decrease of $22.3 million, or 12%, was principally attributable to a lower year-end bonus accrual for our Managing Director group, reflecting their respective individual performances and our overall financial performance. The ratio of compensation to revenues increased to 67% in 2017, as compared to 54% in 2016 as a result of the spreading of lower compensation and benefits expenses over significantly lower revenues in 2017.
2016 versus 2015. For the year ended December 31, 2016, our employee compensation and benefits expenses were $182.5 million as compared to $147.2 million for the same period in the prior year. During 2016 and 2015, we incurred similar amounts of base compensation and amortization of long-term incentive compensation and the increase of $35.3 million, or 24%, in our employee compensation and benefits expenses resulted from our higher annual revenues and was principally attributable to an increase in incentive compensation, a portion of which was paid prior to year end. The ratio of compensation to revenues decreased to 54% in 2016, as compared to 56% in 2015 as a result of the increase in revenues during the year, which enabled us to return to the ratio of compensation paid in 2014 and 2013, while also increasing the aggregate amount of compensation paid to our employees.
Our compensation expense is generally based upon revenues and can fluctuate materially in any particular year depending upon the changes in headcount, amount of revenues recognized, as well as other factors. Accordingly, the amount of compensation expense recognized in any particular year may not be indicative of compensation expense in future years.
Non-Compensation Operating Expenses
Our non-compensation operating expenses include the costs for occupancy and equipment rental, communications, information services, professional fees, recruiting, travel and entertainment, insurance, depreciation and amortization, and other operating expenses. Reimbursed client expenses are netted against non-compensation operating expenses.
Our non-compensation operating expenses are generally relatively fixed year to year with increases generally dependent mostly on our geographic expansion to new locations, strategic business expansion, general inflation-related increases in rent and other costs we incur and, to a much lesser extent, on an increase in headcount within our existing locations. Over the past few years we
32
have incurred some volatility in our non-compensation operating expenses principally due to foreign exchange gains and losses related to the financing of our foreign investments, particularly our investment in Brazil, and the accounting related to a contingent cash earnout related to our acquisition of Cogent.
In connection with our purchase of Cogent, we agreed to pay additional consideration of $18.9 million in cash and issue 334,048 shares of our common stock if a revenue target of $80.0 million is achieved in our secondary capital advisory business during either of the two-year periods ending March 31, 2017 or March 31, 2019, which we refer to as the Earnout. The revenue generated by our secondary fund placement business for the first two year period ended March 31, 2017 was slightly less than required to achieve the Earnout and there remains a second opportunity for the business to achieve the Earnout during the two year period ended March 31, 2019. The fair value of the contingent cash consideration was valued on the date of our purchase at $13.1 million and is remeasured quarterly based on a probability weighted present value discount that the revenue target may be achieved. Based on our remeasurement of the likelihood of achieving the revenue target we recorded a benefit of $1.3 million for the year ended December 31, 2017 and incurred charges of $1.5 million and $0.5 million for the years ended December 31, 2016 and 2015, respectively. At December 31, 2017, the fair value of the contingent cash consideration was valued at $13.8 million. If the revenue target is achieved we will record as expense the change in the estimated fair value of the contingent cash consideration until it reaches its face value of $18.9 million. Contrarily, if during a reporting period the likelihood that the Earnout may be achieved decreases we will record as income the decrease in the estimated fair value of the contingent consideration until it reaches zero.
2017 versus 2016. For the year ended December 31, 2017, our non-compensation operating expenses of $72.1 million compared to $61.9 million in 2016, representing an increase of $10.2 million, or 16%. The increase in non-compensation operating expenses principally resulted from higher occupancy costs due to both the addition of office space and an escalation of rent costs, an increase in professional fees in part related to costs associated with our tender offer as part of our recapitalization plan, higher travel costs due to business development expenditures, and a foreign exchange loss of $3.3 million related to the financing of our foreign investments versus a foreign exchange gain of $3.9 million in 2016.
Non-compensation operating expenses as a percentage of revenues for 2017 were 30% compared to 18% for 2016. The increase in non-compensation expenses as a percentage of revenues resulted from the effect of spreading of higher non-compensation costs over significantly lower revenues in 2017 as compared to 2016.
2016 versus 2015. For the year ended December 31, 2016, our non-compensation expenses of $61.9 million decreased $6.7 million, or 10%, from $68.6 million in 2015. The decrease in non-compensation expenses principally resulted from lower occupancy costs related to lower cost levels outside of the U.S. and the sublease of redundant Cogent space, the benefit of a foreign exchange gain versus a foreign exchange loss of $2.0 million in the prior year, lower professional fees principally due to the absence of transaction costs incurred with the acquisition of Cogent, partially offset by a full year of operating costs related to Cogent and an increase in the charge for the change in the estimated fair value of the contingent cash consideration for the Earnout.
Non-compensation expenses as a percentage of revenues for 2016 were 18% compared to 26% for 2015. The decrease in non-compensation expenses as a percentage of revenues resulted from the spreading of lower non-compensation costs over significantly higher revenues in 2016 as compared to 2015.
Our non-compensation expenses as a percentage of revenues can vary as a result of a variety of factors including fluctuation in annual revenue amounts, changes in headcount, the amount of recruiting and business development activity, the amount of office space expansion, the amount of reimbursement of engagement-related expenses by clients, costs associated with acquisitions, and currency movements and other factors. Accordingly, the non-compensation expenses as a percentage of revenues in any particular year may not be indicative of the non-compensation expenses as a percentage of revenues in future years.
Interest Expense
As part of our recapitalization plan, on October 12, 2017 we substantially increased our leverage and interest expense through the borrowing of $350.0 million under a secured term loan facility, which bears interest at LIBOR plus 3.75%. As a result of the recapitalization we repaid in full bank borrowings of $83.8 million, which bore interest at the U.S. Prime Rate.
2017 versus 2016. For the year ended December 31, 2017, we incurred interest expense of $7.2 million as compared to $3.2 million for 2016. The increase in interest expense during 2017 related to the increased borrowings incurred as part of the Recapitalization.
2016 versus 2015. For the year ended December 31, 2016, we incurred interest expense of $3.2 million as compared to $2.5 million for 2015. The increase in interest expense during 2016 related to the carrying cost for a full year of the bank term loan, which was used to finance the acquisition of Cogent in April 2015.
33
The rate of interest on our current borrowing is based on LIBOR and can vary from period to period. Further, we are required under the secured term loan facility to make quarterly amortization payments and beginning in 2019 an annual repayment based on a calculation of our excess cash flow. Accordingly, the amount of interest expense in any particular period may not be indicative of the amount of interest expense in future periods.
Provision for Income Taxes
We are subject to federal, foreign and state and local corporate income taxes in the United States. In addition, our non-U.S. subsidiaries are subject to income taxes in their local jurisdictions.
The provision for income taxes for 2017, which was based on a nominal pre-tax loss for the year, was adversely affected by a number of factors. First, we incurred a consolidated tax charge due to income taxes incurred on earnings generated in the U.S. that were not fully offset by tax benefits realized from foreign source losses. Second, in accordance with the accounting requirements we established a valuation allowance for tax loss carryforwards in certain foreign jurisdictions. Third, we were subject to a new accounting pronouncement beginning in 2017, which required us to record a tax charge of $1.5 million during the year for the tax effect of the difference between the grant price value and market price value of restricted stock awards at the time of vesting. Prior to 2017, the tax effect of this difference was recorded as a charge or benefit to stockholders equity. Finally, in the fourth quarter we incurred a substantial tax charge as a result of the enactment of the “Tax Cuts and Jobs Act” (the “TCJA”), which was signed into law on December 22, 2017, and reduced the U.S. corporate income tax rate beginning in 2018 from 35% to 21%. While the reduction in income tax rates will benefit us in future periods, at the time the tax legislation was enacted we were required to revalue our deferred tax assets and deferred tax liabilities to account for the future impact of lower corporate income tax rates on these deferred amounts. The revaluation of deferred tax accounts resulted in a charge of $15.4 million in 2017.
If the U.S. corporate income tax rate had been 21% in prior years, our effective tax rates for 2016 would have been 23%, or approximately 8 percentage points less than our reported tax rate of 31%. If a similar calculation was made for 2015 our effective tax rate would have been 29%, or approximately 12 percentage points less than our reported rate of 41%. For 2017, due to nearly breakeven results the benefit of the lower tax rate would still not have been meaningful except our provision for taxes would not have reflected the various adjustments related to the tax law change. Because a portion of our earnings is generated in foreign jurisdictions, and the amount of such earnings vary year over year, we cannot predict an estimated effective rate for future periods, however, we expect that due to further reductions in foreign tax rates over the past few years that our rate will be at the lower end of the range above of 23% to 29%.
Beginning in the first quarter of 2017, we (and all publicly traded companies that issue restricted stock awards) will be subject to a new accounting requirement which will require us to record in our provision for income taxes at the time of vesting of restricted stock awards a charge or benefit for the tax effect of the difference between the grant price value and market price value of the awards. Based on the market price on the date of the vesting of our annual awards, which represent a substantial amount of our awards vesting during the year, the average grant price of the awards vesting in 2018 exceeded the market price of our shares. As a result we expect we will incur an increase in tax expense of approximately $3.8 million in the first quarter of 2018. Because we are not able to predict our future share price we are not able estimate the impact that this change will have on our provision for income taxes or net income in subsequent future periods.
2017 versus 2016. For the year ended December 31, 2017, the provision for taxes was $26.4 million as compared to a provision for taxes for the year ended December 31, 2016 of $27.1 million. While the provision for income taxes in 2017 and 2016 was relatively comparable, we had substantially lower pre-tax income in 2017 as compared to 2016, and the provision for income taxes in 2017 principally resulted from certain non-recurring tax adjustments discussed above. For 2017, the effective rate was not meaningful due to nearly breakeven results for the year and the various adjustments discussed above. For 2016, our effective tax rate was 31%, which was lower than our average historical rate due to the generation of a greater proportion of earnings from foreign jurisdictions with lower tax rates.
2016 versus 2015. For the year ended December 31, 2016, the provision for taxes was $27.1 million, which reflected an effective tax rate of 31%. This compared to a provision for taxes for the year ended December 31, 2015 of $17.7 million, which reflected an effective tax rate of 41%. The increase in the provision for income taxes of $9.4 million in the year ended December 31, 2016, as compared to 2015, resulted from substantially higher pre-tax income, partially offset by a lower effective tax rate, which resulted from the generation of a greater proportion of earnings in foreign jurisdictions with lower tax rates.
The effective tax rate can fluctuate as a result of variations in the relative amounts of income earned and the tax rate imposed in the tax jurisdictions in which we operate. Accordingly, the effective tax rate in any particular year may not be indicative of the effective tax rate in future years.
34
Net Income and Earnings Per Share
2017 versus 2016. For the year ended December 31, 2017, the net loss allocated to common stockholders was $26.7 million, or $0.83 per diluted share, as compared to net income allocated to common stockholders of $60.8 million, or $1.89 per diluted share, in 2016. The decrease in net income allocated to common stockholders of $87.5 million resulted from the impact on net income of lower revenues, higher non-compensation expenses and tax adjustments related to the TCJA offset, in part, by lower compensation expense as discussed above.
During 2017, our fully diluted average shares outstanding remained at 32.1 million, which was the same as 2016. An increase in our fully diluted average shares outstanding related to the recognition of restricted stock unit awards of 0.9 million, net of shares deemed repurchased by us for the settlement of employee tax liabilities arising upon the vesting of the awards, was fully offset by the weighted average impact of 3.8 million shares repurchased in the fourth quarter in connection with the Recapitalization.
At December 31, 2017 and 2016, our shares outstanding plus restricted stock units vested for accounting purposes (i.e. not weighted for the timing of purchases during the year) were 30.1 million and 31.8 million, respectively. See "Note 11 — Equity" and "Note 12 — Earnings Per Share” to the Consolidated Financial Statements.
2016 versus 2015. For the year ended December 31, 2016, net income allocated to common stockholders was $60.8 million, or $1.89 per diluted share, as compared to net income allocated to common stockholders of $25.6 million, or $0.82 per diluted share, in 2015. The increase in net income allocated to common stockholders of $35.2 million principally resulted from the impact on net income of higher revenues and lower non-compensation expenses offset, in part, by higher compensation expense.
During 2016, our fully diluted average shares outstanding increased by 0.9 million to 32.1 million from 31.2 million in 2015. The increase in our fully diluted average shares outstanding principally related to the recognition of 1.1 million restricted stock unit awards, net of shares deemed repurchased by us for the settlement of employee tax liabilities arising upon the vesting of the awards, and the full-year impact of the shares issued in April 2015 in conjunction with the acquisition of Cogent partially offset by the weighted average impact of open market repurchases of 0.9 million shares.
Geographic Data
For a summary of the total revenues, income before taxes and total assets by geographic region, see “Note 18 — Business Information” to the Consolidated Financial Statements.
Liquidity and Capital Resources
Our liquidity position, which consists of cash and cash equivalents, other significant working capital assets and liabilities, debt and other matters relating to liquidity requirements and current market conditions, is monitored by management on a regular basis. We retain our cash in financial institutions with high credit ratings and/or invest in short-term investments which are expected to provide liquidity. At December 31, 2017, we had cash and cash equivalents of $267.6 million.
We generate substantially all of our cash from advisory fees. Following the Recapitalization, we plan to use our cash primarily for recurring operating expenses, the service of our debt under the new term loan facility, the repurchase of our common shares under our share repurchase plan, and the funding of leasehold improvements for the build out of office space. Our recurring monthly operating disbursements principally consist of base compensation expense, occupancy, travel and entertainment, and other operating expenses. Our recurring quarterly and annual disbursements consist of cash bonus payments, tax payments, dividend payments, and repurchases of our common stock from our employees in conjunction with the payment of tax liabilities incurred on vesting of restricted stock units. These amounts vary depending upon our profitability and other factors.
Because a portion of the compensation we pay to our employees is distributed in annual cash bonus awards (usually in February of each year), our net cash balance is typically at its lowest level during the first quarter of each year and generally accumulates from our operating activities throughout the remainder of the year. In general, we collect our accounts receivable within 60 days, except for fees generated through our primary capital advisory engagements, which are generally paid in installments over a period of three years, and certain restructuring transactions, where collections may take longer due to court-ordered holdbacks. At December 31, 2017, we had advisory fees receivable of $64.2 million, including long-term receivables related to our primary capital advisory engagements of $29.3 million.
Our current liabilities primarily consist of accounts payable, which are generally paid monthly, accrued compensation, which includes accrued cash bonuses that are generally paid in the first quarter of the following year to the large majority of our employees, and current taxes payable. In the first quarter of 2018, we expect to pay cash bonuses and accrued benefits of approximately $12.5 million relating to 2017 compensation for our employees. In addition, we expect to pay approximately $2.5 million in 2018 related to income taxes owed principally in the U.S. for the year ended December 31, 2017.
35
In September 2017, we announced the Recapitalization to put in place a capital structure designed to enhance long term shareholder value in the context of our then current equity valuation, existing tax rates and opportunities in the credit market. Under that plan net proceeds from the borrowing of $350.0 million of term loans under the new credit facility were used to repay bank indebtedness outstanding at the time of the Recapitalization. The remaining term loan proceeds and the proceeds from the purchase of $10.0 million of our common stock by each of our Chairman and Chief Executive Officer are being used to repurchase up to $285.0 million of our common stock.
On October 12, 2017, we entered into a new credit agreement with a syndicate of lenders, who loaned us $350.0 million under a five-year secured term loan facility and provided us with a three-year secured revolving credit facility for $20.0 million, which was undrawn at closing and has remained undrawn. Borrowings under the new credit facilities bear interest at either the U.S. Prime Rate plus 2.75% or LIBOR plus 3.75%. Our borrowing rate in 2017 under the new credit facility ranged from 5.0% to 5.3%. The term loan requires quarterly principal amortization payments commencing on March 31, 2018 of $4.375 million through September 30, 2018 and $8.75 million (or $35.0 million annually) beginning December 31, 2018 through September 30, 2022 with the remaining balance of the term loan due at maturity on October 12, 2022. In addition, beginning for the year ended December 31, 2018, we are required to make annual repayments of principal on the term loan of 50% of our excess cash flow as defined in the credit agreement. We are also required to repay certain amounts of the term loan in connection with the non-ordinary course sale of assets, receipt of insurance proceeds, and the issuance of debt obligations, subject to certain exceptions.
All mandatory repayments of the term loan facility will be applied without penalty or premium. Voluntary prepayments of borrowings under the term loan facility will be permitted. In the event that all or any portion of the term loan facility is prepaid or refinanced or repriced through any amendment prior to April 12, 2019, such repayment, prepayment, refinancing, or repricing will be at 101.0% of the principal amount so repaid, prepaid, refinanced or repriced.
The new term and revolving loan facilities are guaranteed by our existing and subsequently acquired or organized wholly-owned U.S. restricted subsidiaries (excluding any registered broker-dealers) and secured with a first priority perfected security interest in certain domestic assets and 100% of the capital stock of each U.S. subsidiary and 65% of the capital stock of each non-U.S. subsidiary, subject to certain exclusions which, for the avoidance of doubt, such security interest shall not include any assets of regulated subsidiaries that are not permitted to be pledged by law, statute or regulation, including cash held by regulated subsidiaries and any other capital required to meet and maintain regulatory capital requirements. The credit facilities contain certain covenants that limit our ability above certain permitted amounts to incur additional indebtedness, make certain acquisitions, pay dividends and repurchase shares. The term loan facility does not have financial covenants and the revolving loan facility is subject to a springing total net leverage ratio financial covenant, subject to certain step downs, if our borrowings under the revolving loan facility exceed $12.5 million. We are also subject to certain other non-financial covenants. Our failure to comply with the terms of these covenants may adversely affect our operations and could permit lenders to accelerate the maturity of the debt and to foreclose upon any collateral securing the debt. At December 31, 2017, we were compliant with all loan covenants and we expect to continue to be compliant with all loan covenants in future periods.
We used a portion of the borrowings from the new term loan facility to repay in full the outstanding balance of $83.8 million under our prior revolving bank loan facility. There were no prepayment penalties for the payoff of our prior revolving bank loan facility. As with our prior revolving bank loan facility, the new $20.0 million revolving loan facility is available to use for working capital needs and other general corporate purposes. No scheduled principal payments will be required on amounts drawn on the three year revolving loan facility until the maturity date of that facility in October 2020. Any borrowings under the new revolving loan facility may be repaid and reborrowed.
During 2017 and prior to the borrowing made from the new term loan facility, we paid in full the remaining principal amount outstanding of $16.9 million under the $45.0 million bank term loan made in connection with our acquisition of Cogent in April 2015. There were no prepayment penalties for the early repayment of the bank term loan facility.
As additional contingent consideration for the purchase of Cogent, we agreed to pay to the selling unitholders $18.9 million in cash and issue 334,048 shares of our common stock in the future if the Earnout is achieved. Pursuant to the terms of the purchase agreement, the cash payment and the issuance of common shares occurs if our secondary fund placement business achieves a revenue target of $80.0 million during either the two-year period ending on the second anniversary of the closing (March 31, 2017) or the two year period ending on the fourth anniversary of the closing (March 31, 2019). For the two-year period ended March 31, 2017, the revenue generated by our secondary placement business was slightly less than revenue target required to achieve the Earnout during the first two-year period. If the revenue target is achieved during the two-year period ended March 31, 2019, the contingent consideration will be paid promptly after that date. In the event the Earnout is achieved we expect the cash payment will be funded from our cash and cash equivalent balance. See "Item 2. Management's Discussion and Analysis of Financial Condition and Results of Operations — Operating Results — Non-Compensation Expenses".
36
As a result of the enactment of the TCJA we no longer expect to be subject to incremental tax on the repatriation of foreign earnings and we will repatriate cash at the time we have forecast cash needs in the U.S. Currently, we hold a substantial amount of cash in the U.S. and have no need for additional cash and consequently, we intend to retain for the near-term our foreign source cash in the local jurisdictions in which it was generated.
As part of the Recapitalization, our Board of Directors has provided us with authority to repurchase up to $285.0 million of our common stock through various means, which could include one or more of the following: open market purchases (including pursuant to 10b5-1 plans), tender offers, privately negotiated transactions and/or accelerated share repurchases after taking into account our results of operations, financial position and capital requirements, general business conditions, legal, tax and regulatory constraints or restrictions, any contractual restrictions (including any restrictions contained in the credit agreement), potential obligations under the Earnout, and other factors we deem relevant. Pursuant to that authority, in October 2017 we purchased 3,434,137 shares of our common stock, or approximately 12% of our then outstanding shares, at a purchase price of $17.25 per share for a total cash cost of approximately $59.2 million. In addition, since we completed the fixed price tender offer and through January 31, 2018, we have acquired an additional 685,153 common shares through other open market transactions for $13.0 million, or in aggregate 4,119,290 common shares at an average price of $17.54 per share, for a total cost of $72.3 million, which represented approximately 13% of our total outstanding shares at the time we announced the Recapitalization plan. In order to further execute our repurchase plan, in February 2018, we launched a modified Dutch auction tender offer for the purchase of up to $110.0 million in value of our common stock at a purchase price of not greater than $20.50 nor less than $18.50 per share, which is scheduled to expire on March 14, 2018, subject to extension. Assuming the Dutch auction tender offer is fully subscribed, $102.7 million will remain authorized and available under our share repurchase program. There can be no assurances of the price at which we may be able to repurchase our shares or that we will repurchase the full amount authorized. Our credit agreement limits our share repurchase program to $285.0 million, subject to certain exceptions, and once the share repurchase program is completed, we expect to refrain from share repurchases (although we expect to continue to make repurchases of share equivalents through tax withholding on vesting restricted stock units) for a period of time in order to focus cash flow on debt repayment.
In addition to our share repurchase plan, during the year ended December 31, 2017, we were deemed to have repurchased 491,677 shares of our common stock at an average price of $28.04 per share (for a total cost of $13.8 million) in conjunction with the payment of tax liabilities in respect of stock delivered to our employees in settlement of restricted stock units.
In February 2018, we were deemed to have repurchased 361,453 shares of our common stock at a price of $18.40 per share (for a total cost of $6.7 million) in conjunction with the payment of tax liabilities in respect of stock delivered to our employees in settlement of restricted stock units that vested.
As part of our long term incentive award program, we may award restricted stock units to managing directors and other employees at the time of hire and/or as part of annual compensation. Awards of restricted stock units generally vest over a four to five-year service period, subject to continued employment on the vesting date. Each restricted stock unit represents the holder’s right to receive one share of our common stock (or at our election, a cash payment equal to the fair value thereof) on the vesting date. Under the terms of our equity incentive plan, we generally repurchase from our employees that portion of restricted stock unit awards used to fund income tax withholding due at the time the restricted stock unit awards vest and pay the remainder of the award in shares of our common stock. Based upon the number of restricted stock unit grants outstanding at February 15, 2018, which takes into account both the vesting of annual awards in early February 2018 and the grant of new awards in early February 2018 made as part of our 2017 compensation, we estimate repurchases of our common stock from our employees in conjunction with the cash settlement of tax liabilities incurred on vesting of restricted stock units of approximately $49.5 million (as calculated based upon the closing share price as of February 15, 2018 of $20.40 per share and assuming a withholding tax rate of 39% consistent with our recent experience) over the next five years, of which an additional $2.7 million will be payable in 2018, $12.3 million will be payable in 2019, $12.9 million will be payable in 2020, $8.6 million will be payable in 2021, $12.6 million will be payable in 2022, and $0.4 million will be payable in 2023. We will realize a corporate income tax deduction concurrently with the vesting of the restricted stock units. While we expect to fund future repurchases of our common stock (if any) with operating cash flow to the extent the amount is less than $20.0 million per year as permitted under the credit agreement, we are unable to predict the timing or magnitude of our share repurchases. To the extent future repurchases are expected to exceed the amount allowable under the credit agreement we will seek other means to settle the withholding tax liability incurred on the vesting of the restricted stock units.
Also, as part of its long-term incentive award program, we may award deferred cash compensation to managing directors and other employees at the time of hire and/or as part of annual compensation. Awards of deferred cash compensation generally vest over a three to five year service period, subject to continued employment. Each award provides the employee with the right to receive future cash compensation payments, which are non-interest bearing, on the vesting date. Based upon the value of the deferred cash awards outstanding at February 15, 2018, we estimate payments of $34.9 million over the next five years, of which $8.1 million remains payable in 2018, $8.5 million will be payable in 2019, $10.6 million will be payable in 2020, $6.2 million
37
will be payable in 2021, and $1.5 million will be payable in 2022. We will realize a corporate income tax deduction at the time of payment.
In order to improve tax efficiency and accelerate the future payment of debt related to our Recapitalization we have elected to substantially reduce our quarterly dividend. Under the credit agreement we are permitted to make aggregate annual dividend distributions of up to $5.0 million, with any amounts not distributed in any particular year available for carryover to future years. For the fourth quarter of 2017 and the first quarter of 2018, we declared dividends of $0.05 per common share payable in December 2017 and March 2018, respectively. Prior to our Recapitalization our quarterly dividend has been $0.45 per share since 2007. For the year ended December 31, 2017, we made dividend distributions of $47.6 million, or $1.40 per common share and outstanding restricted stock unit. We intend to continue to pay quarterly dividends, subject to capital availability and periodic determinations that cash dividends are in the best interest of our stockholders. Future declaration and payment of dividends on our common stock is at the discretion of our Board of Directors and depends upon, among other things, our future operations and earnings, capital requirements and surplus, general financial condition, restrictions under the credit agreement, potential obligations under the Earnout, and other factors as our Board of Directors may deem relevant.
At January 31, 2018, we had cash and cash equivalents of approximately $271.1 million, a term loan balance of $350.0 million and there were no drawings under our revolving loan facility. It is our objective to retain a global cash balance adequate to service our forecast operating and financing needs. To fund the repurchases of our common stock we have invested a portion of our cash in readily marketable obligations issued or directly and fully guaranteed by the government or any agency of instrumentality of the U.S. having average maturities of not more than twelve months or other liquid investments each as permitted under the credit agreement.
While we believe that the cash generated from operations will be sufficient to meet our expected operating needs, tax obligations, interest and principal payments on our loan facilities, common dividend payments, share repurchases related to the tax settlement payments upon the vesting of the RSUs, deferred cash compensation payments, potential obligation under the Earnout and build-out costs of new office space, we may adjust our variable expenses and other disbursements, if necessary, to meet our liquidity needs. There is no assurance that our cash flow will be sufficient to allow us to make timely principal and interest payments under the credit agreement. If we are unable to fund our debt obligations, we may need to consider taking other actions, including issuing additional securities, seeking strategic investments, reducing operating costs or consider taking a combination of these actions, in each case on terms which may not be favorable to us. Further, failure to make timely principal and interest payments under the debt agreement could result in a default. A default would permit lenders to accelerate the maturity for the debt and to foreclose upon any collateral securing the debt. In addition, the limitations imposed by financing agreements on our ability to incur additional debt and to take other actions might significantly impair our ability to obtain other financing.
Cash Flows
2017. Cash and cash equivalents increased by $169.3 million from December 31, 2016, including an increase of $5.5 million resulting from the effect of the translation of foreign currency amounts into U.S. dollars at the year-end foreign currency conversion rates. We generated $15.2 million from operating activities, which consisted of $30.6 million from net income after giving effect to the non-cash items and a net increase in working capital of $15.4 million (principally due to payment of annual bonuses and accrued income taxes). We used $2.3 million for investing activities principally to fund $2.6 million for leasehold improvements and other capital expenditures, offset in part by distributions from merchant banking fund investments of $0.2 million. We generated $151.0 million from financing activities through the net borrowing of $339.0 million under the new term loan facility and proceeds of $20.0 million from the issuance of common stock, which were used in part to fund the repayment in full of both the bank term loan facility of $16.9 million and the net amount outstanding on the revolving bank loan facility of $64.1 million, the payment of dividends of $47.6 million, repurchases of our common stock of $65.8 million, and the repurchase of our common stock from employees in conjunction with the payment of tax liabilities in settlement of restricted stock units of $13.8 million.
2016. Cash and cash equivalents increased by $28.4 million from December 31, 2015, including a decrease of $7.8 million resulting from the effect of the translation of foreign currency amounts into U.S. dollars at the year-end foreign currency conversion rates. We generated $124.2 million from operating activities, which consisted of $104.1 million from net income after giving effect to the non-cash items and a net decrease in working capital of $20.1 million (principally due to an increase in bonuses payable). We used $0.8 million for investing activities principally as a result of $1.7 million for leasehold improvements and other capital expenditures, offset in part by distributions from merchant banking fund investments of $0.9 million. We used $87.3 million in financing activities, including $16.9 million for the repayment of the bank term loan facilities, $61.6 million for the payment of dividends, $20.2 million for open market repurchases of our common stock, $8.0 million for the repurchase of our common stock from employees in conjunction with the payment of tax liabilities in settlement of restricted stock units, and $4.9 million of tax costs related to the delivery of restricted stock units at a vesting price lower than the grant price, offset in part by the net borrowing of $24.3 million on our revolving bank loan facility.
38
2015. Cash and cash equivalents increased by $19.0 million from December 31, 2014, including a decrease of $1.4 million resulting from the effect of the translation of foreign currency amounts into U.S. dollars at the year-end foreign currency conversion rates. We generated $92.8 million from operating activities, which consisted of $70.3 million from net income after giving effect to the non-cash items and a net decrease in working capital of $22.4 million (primarily due to a decrease in advisory fees receivable and an increase in income taxes payable). We used $33.5 million for investing activities, principally as a result of the cash payment of $45.3 million for the acquisition of Cogent, including transaction costs, and $2.2 million for leasehold improvements and other capital expenditures, offset in part by the recording of the contingent Earnout at an estimated fair value of $13.6 million and by distributions from merchant banking fund investments of $0.8 million. We used $38.8 million in financing activities, including $58.9 million for the payment of dividends, $11.9 million for the repurchase of our common stock from employees in conjunction with the payment of tax liabilities in settlement of restricted stock units and $5.9 million of tax costs related to the delivery of restricted stock units at a vesting price lower than the grant price, offset in part by the net borrowing of $33.8 million of bank term loan facilities ($45.0 million of bank term loans to finance the acquisition of Cogent, net of a repayment of $11.3 million), and net borrowings of $4.2 million on our revolving bank loan facility.
Contractual Obligations
The following table sets forth information relating to our contractual obligations as of December 31, 2017:
Payment Due by Period | ||||||||||||||||||||
Contractual Obligations | Total | Less than 1 year | Years 2-3 | Years 4-5 | More than 5 years | |||||||||||||||
(in millions) | ||||||||||||||||||||
Operating lease obligations | $ | 64.1 | $ | 16.2 | $ | 29.8 | $ | 10.0 | $ | 8.1 | ||||||||||
Secured term loan | 350.0 | 21.9 | 70.0 | 258.1 | — | |||||||||||||||
Total | (a) (b) (c) | $ | 414.1 | $ | 38.1 | $ | 99.8 | $ | 268.1 | $ | 8.1 | |||||||||
_____________________________________________
(a) | As additional contingent consideration for the purchase of Cogent, we agreed to pay $18.9 million in cash in the future if the Earnout is achieved. The payment will be made if our secondary capital advisory business achieves a revenue target of $80.0 million during the two-year period ending March 31, 2019. See "Item 2. Management's Discussion and Analysis of Financial Condition and Results of Operations — Operating Results — Non-Compensation Expenses". |
(b) | Total contractual obligations are recorded at their gross amount and have not been reduced by approximately $1.2 million in minimum sublease rentals due during the period 2018 and 2019 under sublease obligations related to space formerly occupied by Cogent personnel in New York and London. |
(c) | Total contractual obligations set forth above do not include the three-year secured revolving loan facility under which we can borrow $20.0 million and was undrawn at December 31, 2017. |
Off-Balance Sheet Arrangements
We do not invest in any off-balance sheet vehicles that provide financing, liquidity, market risk or credit risk support, or engage in any leasing or hedging activities that expose us to any liability that is not reflected in our Consolidated Financial Statements.
Market Risk
Our operating cash is principally limited to depository accounts and short-term cash investments, which we believe do not face any material interest rate risk, equity price risk or other market risk. We maintain our operating cash with financial institutions with high credit ratings. Although these deposits are generally not insured, management believes we are not exposed to significant credit risk due to the financial position of the depository institutions in which those deposits are held. The remaining net proceeds from the Recapitalization are invested in government securities with short durations or in short term liquid assets with high credit ratings both as permitted under the credit agreement. We do not believe these investments are exposed to significant credit risk due to the quality of the institutions in which the funds are invested.
We monitor the quality of our investments on a regular basis and may choose to diversify such investments to mitigate perceived market risk. Our cash and cash equivalents are denominated in U.S. dollars, Australian dollars, Canadian dollars, pound sterling, euros, yen, Swedish krona and Brazilian real, and we face foreign currency risk in our cash balances held in accounts outside the United States due to potential currency movements and the associated foreign currency translation accounting requirements. We currently do not hedge our foreign currency exposure, but we may do so if we expect we will need to fund U.S. dollar obligations with foreign currency.
39
In addition, the reported amounts of our advisory revenues may be affected by movements in the rate of exchange in the major markets in which we operate between the Australian dollar, Canadian dollar, pound sterling, euro, yen, krona and real (in which collectively 27% of our revenues for the year ended December 31, 2017 were denominated) and the dollar, in which our financial statements are denominated. We do not currently hedge against movements in these exchange rates. We analyzed our potential exposure to a decline in exchange rates by performing a sensitivity analysis on our net income in those jurisdictions in which we have generated a significant portion of our foreign earnings, which included the United Kingdom, Europe, and Australia. During the year ended December 31, 2017, as compared to 2016, the value of the U.S. dollar strengthened relative to the pound sterling, weakened relative to the Australian dollar, and remained relatively constant with the euro. In aggregate, although there was a negative impact on our revenues in 2017 as compared to 2016 as a result of movements in the foreign currency exchange rates, we did not deem the impact significant due to the timing of receipts and the mix of currencies we received, including the negotiation for the payment of certain foreign transaction fees in U.S. dollars. Further, because our operating costs in foreign jurisdictions are denominated in local currency we are effectively internally hedged against the impact in the movements of foreign currency relative to the U.S. dollar. While our earnings are subject to volatility from changes in foreign currency rates, we do not believe we face any material risk in this respect.
Critical Accounting Policies and Estimates
Management's discussion and analysis of its results of operation and financial condition is based on our Consolidated Financial Statements that have been prepared in accordance with GAAP in the United States, which requires management to make estimates and assumptions regarding future events that affect the amounts reported in the Consolidated Financial Statements. Management employs judgment in making these estimates in consideration of historical experience, currently available information and various other assumptions that we believe to be reasonable under the circumstances. Actual results could differ from our estimates and assumptions, and any such differences could be material to the Consolidated Financial Statements. Descriptions of our critical accounting policies and estimates, which we believe are those that are most important to the presentation of our financial condition and results of operations and require management’s most difficult, subjective and complex judgments, are set forth below in "Part IV — Item 15 — Notes to Consolidated Financial Statements, Note 2 — Summary of Significant Accounting Policies” and are incorporated by reference herein.
Item 7A. Quantitative and Qualitative Disclosures About Market Risk
Quantitative and qualitative disclosures about market risk are set forth above in “Item 7 — Management’s Discussion and Analysis of Financial Condition and Results of Operation — Market Risk”.
Item 8. Financial Statements and Supplementary Data
The financial statements required by this item are listed in “Item 15. Exhibits and Financial Statement Schedules”.
Item 9. Changes in and Disagreements with Accountants on Accounting and Financial Disclosure
None.
Item 9A. Controls and Procedures
Based upon their evaluation of the Firm’s disclosure controls and procedures pursuant to Exchange Act Rule 13a-15 as of the end of the year covered by this Annual Report on Form 10-K, the Firm’s Chief Executive Officer and Chief Financial Officer have concluded that such controls and procedures are effective. There were no changes in our internal controls over financial reporting that occurred during the most recent fiscal quarter that have materially affected, or are reasonably likely to materially affect, our internal control over financial reporting.
Management’s report on the Firm’s internal control over financial reporting (as defined in Rules 13a-15(f) and 15d-15(f) of the Exchange Act), and the related report of our independent public accounting firm, are included on pages F-2 through F-4 of this report.
In addition, on August 15, 2017 our Chief Executive Officer certified to the New York Stock Exchange (“NYSE”) that he was not aware of any violation by the Firm of the NYSE’s corporate governance listing standards. We have filed as an exhibit to this Form 10-K the certifications of our Chief Executive Officer and Chief Financial Officer pursuant to Rule 13a-14(a) or 15d-14(a) of the Exchange Act (as adopted pursuant to Section 302 of the Sarbanes-Oxley Act of 2002).
Item 9B. Other Information
None.
40
PART III
Item 10. Directors, Executive Officers and Corporate Governance
The information required by this Item (except for information required with respect to our executive officers which is set forth under “Executive Officers and Directors” in Part I of this Annual Report on Form 10-K) will be contained in a Form 10-K/A that we intend to file with the Securities and Exchange Commission within 120 days after the end of our fiscal year ended December 31, 2017.
Our Board of Directors has adopted a Code of Business Conduct and Ethics applicable to all officers, directors, and employees, which is available on our website (www.greenhill.com/investor) under "Corporate Governance." We intend to satisfy the disclosure requirement under Item 5.05 of Form 8-K regarding amendment to, or waiver from, a provision of our Code of Business Conduct and Ethics by posting such information on the website address and location specified above.
Item 11. Executive Compensation
The information required by this Item will be contained in a Form 10-K/A that we intend to file with the Securities and Exchange Commission within 120 days after the end of our fiscal year ended December 31, 2017 and is incorporated herein by reference.
Item 12. Security Ownership of Certain Beneficial Owners and Management and Related Stockholder Matters
The information required by this Item will be contained in a Form 10-K/A that we intend to file with the Securities and Exchange Commission within 120 days after the end of our fiscal year ended December 31, 2017 and is incorporated herein by reference.
Item 13. Certain Relationships and Related Transactions, and Director Independence
The information required by this Item will be contained in a Form 10-K/A that we intend to file with the Securities and Exchange Commission within 120 days after the end of our fiscal year ended December 31, 2017 and is incorporated herein by reference.
Item 14. Principal Accounting Fees and Services
The information required by this Item will be contained in a Form 10-K/A that we intend to file with the Securities and Exchange Commission within 120 days after the end of fiscal year ended December 31, 2017 and is incorporated herein by reference.
41
PART IV
Item 15. Exhibits and Financial Statement Schedules
(a) Financial Statements
INDEX TO FINANCIAL STATEMENTS
Consolidated Financial Statements of Greenhill & Co., Inc. and Subsidiaries
Consolidated Statements of Operations | |
F-1
Management's Report on Internal Control over Financial Reporting
Management of Greenhill & Co., Inc. and Subsidiaries (the “Company”) is responsible for establishing and maintaining adequate internal control over financial reporting. The Company’s internal control over financial reporting is a process designed under the supervision of the Company’s principal executive and principal financial officers to provide reasonable assurance regarding the reliability of financial reporting and the preparation of the Company’s financial statements for external reporting purposes in accordance with generally accepted accounting principles in the United States of America.
As of December 31, 2017, management conducted an assessment of the effectiveness of the Company’s internal control over financial reporting based on the framework established in Internal Control — Integrated Framework issued by the Committee of Sponsoring Organizations of the Treadway Commission (2013 framework) (COSO). Based upon this assessment, management has determined that the Company’s internal control over financial reporting as of December 31, 2017 was effective.
The Company’s internal control over financial reporting includes those policies and procedures that (i) pertain to the maintenance of records that, in reasonable detail, accurately and fairly reflect the transactions and dispositions of the assets of the Company; (ii) provide reasonable assurance that transactions are recorded as necessary to permit preparation of financial statements in accordance with generally accepted accounting principles, and that receipts and expenditures of the Company are being made only in accordance with authorizations of management and directors of the Company; and (iii) provide reasonable assurance regarding prevention or timely detection of unauthorized acquisition, use or disposition of the Company’s assets that could have a material effect on the financial statements.
The Company’s independent registered public accounting firm has issued their auditors’ report appearing on page F-4 which expresses an unqualified opinion on the effectiveness of the Company’s internal control over financial reporting.
F-2
Report of Independent Registered Public Accounting Firm
To the Shareholders and the Board of Directors of Greenhill & Co., Inc. and Subsidiaries
Opinion on the Financial Statements
We have audited the accompanying consolidated statements of financial condition of Greenhill & Co., Inc. and subsidiaries (the "Company") as of December 31, 2017 and 2016, and the related consolidated statements of operations, comprehensive income, changes in stockholders' equity, and cash flows for each of the three years in the period ended December 31, 2017, and the related notes (collectively referred to as the "financial statements"). In our opinion, the financial statements present fairly, in all material respects, the consolidated financial position of the Company at December 31, 2017 and 2016, and the consolidated results of its operations and its cash flows for each of the three years in the period ended December 31, 2017, in conformity with U.S. generally accepted accounting principles.
We also have audited, in accordance with the standards of the Public Company Accounting Oversight Board (United States) (PCAOB), the Company's internal control over financial reporting as of December 31, 2017, based on criteria established in Internal Control — Integrated Framework issued by the Committee of Sponsoring Organizations of the Treadway Commission (2013 framework), and our report dated February 28, 2018 expressed an unqualified opinion thereof.
Basis for Opinion
These financial statements are the responsibility of the Company's management. Our responsibility is to express an opinion on the Company's financial statements based on our audits. We are a public accounting firm registered with the PCAOB and are required to be independent with respect to the Company in accordance with the U.S. federal securities laws and the applicable rules and regulations of the Securities and Exchange Commission and the PCAOB.
We conducted our audits in accordance with the standards of the PCAOB. Those standards require that we plan and perform the audit to obtain reasonable assurance about whether the financial statements are free of material misstatement, whether due to error or fraud. Our audits included performing procedures to assess the risks of material misstatement of the financial statements, whether due to error or fraud, and performing procedures that respond to those risks. Such procedures included examining, on a test basis, evidence regarding the amounts and disclosures in the financial statements. Our audit also included evaluating the accounting principles used and significant estimates made by management, as well as evaluating the overall presentation of the financial statements. We believe that our audits provide a reasonable basis for our opinion.
We have served as the Company's auditor since 1997.
/s/ Ernst & Young LLP
New York, New York
February 28, 2018
F-3
Report of Independent Registered Public Accounting Firm
To the Board of Directors and Shareholders of Greenhill & Co., Inc. and Subsidiaries
Opinion on Internal Control over Financial Reporting
We have audited Greenhill & Co., Inc. and Subsidiaries internal control over financial reporting as of December 31, 2017, based on criteria established in Internal Control — Integrated Framework issued by the Committee of Sponsoring Organizations of the Treadway Commission (2013 framework) (the COSO criteria). In our opinion, Greenhill & Co., Inc. and Subsidiaries (the "Company") maintained, in all material respects, effective internal control over financial reporting as of December 31, 2017, based on the COSO criteria.
We also have audited, in accordance with the standards of the Public Company Accounting Oversight Board (United States) (PCAOB), the consolidated statements of financial condition of the Company as of December 31, 2017 and 2016, the related consolidated statements of operations, comprehensive income, changes in stockholders' equity, and cash flows for each of the three years in the period ended December 31, 2017, and the related notes of the Company and our report dated February 28, 2018 expressed an unqualified opinion thereon.
Basis for Opinion
The Company’s management is responsible for maintaining effective internal control over financial reporting and for its assessment of the effectiveness of internal control over financial reporting included in the accompanying Managements’ Report on Internal Control over Financial Reporting. Our responsibility is to express an opinion on the Company’s internal control over financial reporting based on our audit. We are a public accounting firm registered with the PCAOB and are required to be independent with respect to the Company in accordance with the U.S. federal securities laws and the applicable rules and regulations of the Securities and Exchange Commission and the PCAOB.
We conducted our audit in accordance with the standards of the PCAOB. Those standards require that we plan and perform the audit to obtain reasonable assurance about whether effective internal control over financial reporting was maintained in all material respects. Our audit included obtaining an understanding of internal control over financial reporting, assessing the risk that a material weakness exists, testing and evaluating the design and operating effectiveness of internal control based on the assessed risk, and performing such other procedures as we considered necessary in the circumstances. We believe that our audit provides a reasonable basis for our opinion.
Definition and Limitations of Internal Control Over Financial Reporting
A company’s internal control over financial reporting is a process designed to provide reasonable assurance regarding the reliability of financial reporting and the preparation of financial statements for external purposes in accordance with generally accepted accounting principles. A company’s internal control over financial reporting includes those policies and procedures that (1) pertain to the maintenance of records that, in reasonable detail, accurately and fairly reflect the transactions and dispositions of the assets of the company; (2) provide reasonable assurance that transactions are recorded as necessary to permit preparation of financial statements in accordance with generally accepted accounting principles, and that receipts and expenditures of the company are being made only in accordance with authorizations of management and directors of the company; and (3) provide reasonable assurance regarding prevention or timely detection of unauthorized acquisition, use, or disposition of the company’s assets that could have a material effect on the financial statements.
Because of its inherent limitations, internal control over financial reporting may not prevent or detect misstatements. Also, projections of any evaluation of effectiveness to future periods are subject to the risk that controls may become inadequate because of changes in conditions, or that the degree of compliance with the policies or procedures may deteriorate.
/s/ Ernst & Young LLP
New York, New York
February 28, 2018
F-4
Greenhill & Co., Inc. and Subsidiaries
Consolidated Statements of Financial Condition
As of December 31,
(in thousands except share and per share data)
2017 | 2016 | ||||||
Assets | |||||||
Cash and cash equivalents ($3.9 million and $4.3 million restricted from use at December 31, 2017 and 2016, respectively) | $ | 267,646 | $ | 98,313 | |||
Advisory fees receivable, net of allowance for doubtful accounts of $0.3 million and $0.0 million at December 31, 2017 and 2016, respectively | 64,244 | 68,140 | |||||
Other receivables | 3,964 | 2,830 | |||||
Property and equipment, net of accumulated depreciation of $62.1 and $59.0 million at December 31, 2017 and 2016 | 8,602 | 8,764 | |||||
Goodwill | 217,737 | 208,186 | |||||
Deferred tax asset, net | 42,345 | 62,108 | |||||
Other assets | 6,279 | 8,341 | |||||
Total assets | $ | 610,817 | $ | 456,682 | |||
Liabilities and Equity | |||||||
Compensation payable | $ | 26,022 | $ | 37,527 | |||
Accounts payable and accrued expenses | 15,443 | 9,297 | |||||
Current income taxes payable | 5,311 | 18,968 | |||||
Bank revolving loan payable | — | 64,070 | |||||
Bank term loans payable | — | 16,875 | |||||
Secured term loan payable | 339,048 | — | |||||
Contingent obligation due selling unitholders of Cogent | 13,763 | 15,095 | |||||
Deferred tax liability | 2,928 | 3,667 | |||||
Total liabilities | 402,515 | 165,499 | |||||
Common stock, par value $0.01 per share; 100,000,000 shares authorized, 43,750,170 and 41,377,614 shares issued as of December 31, 2017 and 2016, respectively; 27,084,520 and 28,981,189 shares outstanding as of December 31, 2017 and 2016, respectively | 438 | 414 | |||||
Restricted stock units | 80,512 | 85,907 | |||||
Additional paid-in capital | 800,806 | 734,728 | |||||
Exchangeable shares of subsidiary; 257,156 shares issued as of December 31, 2017 and 2016; 32,804 shares outstanding as of December 31, 2017 and 2016 | 1,958 | 1,958 | |||||
Retained earnings | 37,595 | 111,798 | |||||
Accumulated other comprehensive income (loss) | (22,222 | ) | (32,398 | ) | |||
Treasury stock, at cost, par value $0.01 per share; 16,665,650 and 12,396,425 shares as of December 31, 2017 and 2016, respectively | (690,785 | ) | (611,224 | ) | |||
Stockholders’ equity | 208,302 | 291,183 | |||||
Total liabilities and equity | $ | 610,817 | $ | 456,682 | |||
See accompanying notes to Consolidated Financial Statements.
F-5
Greenhill & Co., Inc. and Subsidiaries
Consolidated Statements of Operations
Years Ended December 31,
(in thousands except share and per share data)
2017 | 2016 | 2015 | |||||||||
Revenues | |||||||||||
Advisory revenues | $ | 237,997 | $ | 334,787 | $ | 260,281 | |||||
Investment revenues | 1,185 | 732 | 1,279 | ||||||||
Total revenues | 239,182 | 335,519 | 261,560 | ||||||||
Operating Expenses | |||||||||||
Employee compensation and benefits | 160,201 | 182,478 | 147,200 | ||||||||
Occupancy and equipment rental | 20,713 | 19,553 | 21,271 | ||||||||
Depreciation and amortization | 3,114 | 3,243 | 3,433 | ||||||||
Information services | 9,529 | 8,920 | 8,975 | ||||||||
Professional fees | 8,212 | 6,851 | 7,856 | ||||||||
Travel related expenses | 13,142 | 11,912 | 12,580 | ||||||||
Other operating expenses | 17,371 | 11,454 | 14,472 | ||||||||
Total operating expenses | 232,282 | 244,411 | 215,787 | ||||||||
Total operating income | 6,900 | 91,108 | 45,773 | ||||||||
Interest expense | 7,198 | 3,227 | 2,478 | ||||||||
Income (loss) before taxes | (298 | ) | 87,881 | 43,295 | |||||||
Provision for taxes | 26,353 | 27,119 | 17,697 | ||||||||
Net income (loss) allocated to common stockholders | $ | (26,651 | ) | $ | 60,762 | $ | 25,598 | ||||
Average shares outstanding: | |||||||||||
Basic | 32,074,894 | 32,042,594 | 31,197,288 | ||||||||
Diluted | 32,074,894 | 32,074,232 | 31,200,378 | ||||||||
Earnings (loss) per share: | |||||||||||
Basic | $ | (0.83 | ) | $ | 1.90 | $ | 0.82 | ||||
Diluted | $ | (0.83 | ) | $ | 1.89 | $ | 0.82 | ||||
Dividends declared and paid per share | $ | 1.40 | $ | 1.80 | $ | 1.80 | |||||
See accompanying notes to Consolidated Financial Statements.
F-6
Greenhill & Co., Inc. and Subsidiaries
Consolidated Statements of Comprehensive Income
Years Ended December 31,
(in thousands)
2017 | 2016 | 2015 | |||||||||
Consolidated net income (loss) | $ | (26,651 | ) | $ | 60,762 | $ | 25,598 | ||||
Currency translation adjustment, net of tax | 10,176 | (3,993 | ) | (10,436 | ) | ||||||
Comprehensive income (loss) allocated to common stockholders | $ | (16,475 | ) | $ | 56,769 | $ | 15,162 | ||||
See accompanying notes to Consolidated Financial Statements.
F-7
Greenhill & Co., Inc. and Subsidiaries
Consolidated Statements of Changes in Stockholders' Equity
Years Ended December 31,
(in thousands)
2017 | 2016 | 2015 | |||||||||
Common stock, par value $0.01 per share | |||||||||||
Common stock, beginning of the year | $ | 414 | $ | 405 | $ | 389 | |||||
Common stock issued | 24 | 9 | 16 | ||||||||
Common stock, end of the year | 438 | 414 | 405 | ||||||||
Contingent convertible preferred stock, par value $0.01 per share | |||||||||||
Contingent convertible preferred stock, beginning of the year | — | — | 14,446 | ||||||||
Contingent convertible preferred stock canceled or converted | — | — | (14,446 | ) | |||||||
Contingent convertible preferred stock, end of the year | — | — | — | ||||||||
Restricted stock units | |||||||||||
Restricted stock units, beginning of the year | 85,907 | 84,969 | 90,107 | ||||||||
Restricted stock units recognized, net of forfeitures | 40,597 | 45,880 | 47,071 | ||||||||
Restricted stock units delivered | (45,992 | ) | (44,942 | ) | (52,209 | ) | |||||
Restricted stock units, end of the year | 80,512 | 85,907 | 84,969 | ||||||||
Additional paid-in capital | |||||||||||
Additional paid-in capital, beginning of the year | 734,728 | 697,607 | 596,463 | ||||||||
Common stock issued | 65,231 | 44,789 | 94,554 | ||||||||
Contingent convertible preferred stock canceled | — | — | 14,446 | ||||||||
Tax benefit (expense) from the delivery of restricted stock units | 847 | (7,668 | ) | (7,856 | ) | ||||||
Additional paid-in capital, end of the year | 800,806 | 734,728 | 697,607 | ||||||||
Exchangeable shares of subsidiary | |||||||||||
Exchangeable shares of subsidiary, beginning of the year | 1,958 | 1,958 | 1,958 | ||||||||
Exchangeable shares of subsidiary delivered | — | — | — | ||||||||
Exchangeable shares of subsidiary, end of the year | 1,958 | 1,958 | 1,958 | ||||||||
Retained earnings | |||||||||||
Retained earnings, beginning of the year | 111,798 | 109,860 | 141,290 | ||||||||
Dividends | (47,552 | ) | (61,609 | ) | (58,940 | ) | |||||
Tax benefit from payment of restricted stock unit dividends | — | 2,785 | 1,912 | ||||||||
Net income (loss) allocated to common stockholders | (26,651 | ) | 60,762 | 25,598 | |||||||
Retained earnings, end of the year | 37,595 | 111,798 | 109,860 | ||||||||
Accumulated other comprehensive income | |||||||||||
Accumulated other comprehensive income (loss), beginning of the year | (32,398 | ) | (28,405 | ) | (17,969 | ) | |||||
Currency translation adjustment, net of tax | 10,176 | (3,993 | ) | (10,436 | ) | ||||||
Accumulated other comprehensive income (loss), end of the year | (22,222 | ) | (32,398 | ) | (28,405 | ) | |||||
Treasury stock, at cost, par value $0.01 per share | |||||||||||
Treasury stock, beginning of the year | (611,224 | ) | (583,038 | ) | (571,136 | ) | |||||
Repurchased | (79,561 | ) | (28,186 | ) | (11,902 | ) | |||||
Treasury stock, end of the year | (690,785 | ) | (611,224 | ) | (583,038 | ) | |||||
Total stockholders’ equity | $ | 208,302 | $ | 291,183 | $ | 283,356 | |||||
See accompanying notes to Consolidated Financial Statements.
F-8
Greenhill & Co., Inc. and Subsidiaries
Consolidated Statements of Cash Flows
Years Ended December 31,
(in thousands)
2017 | 2016 | 2015 | |||||||||
Operating activities: | |||||||||||
Consolidated net income (loss) | $ | (26,651 | ) | $ | 60,762 | $ | 25,598 | ||||
Adjustments to reconcile consolidated net income to net cash provided by operating activities: | |||||||||||
Non-cash items included in consolidated net income: | |||||||||||
Depreciation and amortization | 3,114 | 3,243 | 3,433 | ||||||||
Net investment (gains) losses | 258 | 255 | (234 | ) | |||||||
Restricted stock units recognized | 40,597 | 45,880 | 47,071 | ||||||||
Deferred taxes | 14,594 | (7,457 | ) | (6,058 | ) | ||||||
(Gain) loss on fair value of contingent obligation | (1,332 | ) | 1,448 | 503 | |||||||
Changes in operating assets and liabilities: | |||||||||||
Advisory fees receivable | 3,896 | (3,710 | ) | 17,341 | |||||||
Other receivables and assets | 449 | 1,509 | (1,779 | ) | |||||||
Deferred tax asset, net | — | 7,668 | 7,882 | ||||||||
Compensation payable | (11,505 | ) | 15,394 | (4,271 | ) | ||||||
Accounts payable and accrued expenses | 5,409 | (706 | ) | (5,747 | ) | ||||||
Current income taxes payable | (13,657 | ) | (52 | ) | 9,012 | ||||||
Net cash provided by operating activities | 15,172 | 124,234 | 92,751 | ||||||||
Investing activities: | |||||||||||
Distributions from investments, net | 221 | 937 | 832 | ||||||||
Purchases of property and equipment | (2,555 | ) | (1,737 | ) | (2,242 | ) | |||||
Contingent obligation due selling unitholders of Cogent | — | — | 13,144 | ||||||||
Cogent acquisition | — | — | (45,265 | ) | |||||||
Net cash used in investing activities | (2,334 | ) | (800 | ) | (33,531 | ) | |||||
Financing activities: | |||||||||||
Proceeds from revolving bank loan | 69,355 | 105,999 | 80,000 | ||||||||
Repayment of revolving bank loan | (133,425 | ) | (81,729 | ) | (75,800 | ) | |||||
Proceeds from bank term loans | — | — | 45,000 | ||||||||
Repayment of bank term loans | (16,875 | ) | (16,875 | ) | (11,250 | ) | |||||
Proceeds from secured term loan, net | 339,048 | — | — | ||||||||
Proceeds from the issuance of common stock | 20,000 | — | — | ||||||||
Dividends paid | (47,552 | ) | (61,609 | ) | (58,940 | ) | |||||
Purchase of treasury stock | (79,561 | ) | (28,186 | ) | (11,902 | ) | |||||
Net tax benefit (cost) from the delivery of restricted stock units and payment of dividend equivalents | — | (4,883 | ) | (5,944 | ) | ||||||
Net cash provided by (used in) financing activities | 150,990 | (87,283 | ) | (38,836 | ) | ||||||
Effect of exchange rate changes on cash and cash equivalents | 5,505 | (7,800 | ) | (1,362 | ) | ||||||
Net increase in cash and cash equivalents | 169,333 | 28,351 | 19,022 | ||||||||
Cash and cash equivalents, beginning of year | 98,313 | 69,962 | 50,940 | ||||||||
Cash and cash equivalents, end of year | $ | 267,646 | $ | 98,313 | $ | 69,962 | |||||
Supplemental disclosure of cash flow information: | |||||||||||
Cash paid for interest | $ | 6,567 | $ | 2,944 | $ | 2,427 | |||||
Cash paid for taxes, net of refunds | $ | 26,026 | $ | 28,979 | $ | 14,445 | |||||
See accompanying notes to Consolidated Financial Statements.
F-9
Greenhill & Co., Inc. and Subsidiaries
Notes to Consolidated Financial Statements
Note 1 — Organization
Greenhill & Co., Inc. and subsidiaries (the "Company" or "Greenhill") is a leading independent investment bank that provides financial and strategic advice on significant domestic and cross-border mergers and acquisitions, restructurings, financings, capital raisings and other strategic transactions to a diverse client base, including corporations, partnerships, institutions and governments globally. We act for clients located throughout the world from our global offices in the United States, Australia, Brazil, Canada, Germany, Hong Kong, Japan, Spain, Sweden, and the United Kingdom.
The Company's wholly-owned subsidiaries provide advisory services in various jurisdictions. Our most significant operating entities include: Greenhill & Co., LLC (“G&Co”), Greenhill & Co. International LLP (“GCI”), Greenhill & Co. Europe LLP ("GCE"), Greenhill & Co. Australia Pty Limited (“Greenhill Australia”) and Greenhill Cogent, LP ("GC LP").
G&Co is engaged in investment banking activities principally in the United States. G&Co is registered as a broker-dealer with the Securities and Exchange Commission (“SEC”) and the Financial Industry Regulatory Authority (“FINRA”), and is licensed in all 50 states and the District of Columbia. GCI and GCE are engaged in investment banking activities in the United Kingdom and Europe, respectively, and are subject to regulation by the U.K. Financial Conduct Authority (“FCA”). Greenhill Australia engages in investment banking activities in Australia and New Zealand and is licensed and subject to regulation by the Australian Securities and Investment Commission (“ASIC”). GC LP is engaged in capital advisory services to institutional investors principally in the United States and is registered as a broker-dealer with the SEC and FINRA. See "Note 3 — Acquisition".
The Company also operates in other locations throughout the world which are subject to regulation by other governmental and regulatory bodies and self-regulatory authorities.
Note 2 — Summary of Significant Accounting Policies
Basis of Financial Information
These Consolidated Financial Statements are prepared in conformity with accounting principles generally accepted in the United States (U.S. GAAP), which require management to make estimates and assumptions regarding future events that affect the amounts reported in our financial statements and these footnotes, including investment valuations, compensation accruals and other matters. Management believes that the estimates used in preparing its Consolidated Financial Statements are reasonable and prudent. Actual results could differ materially from those estimates. Certain reclassifications have been made to prior year information to conform to current year presentation.
The Consolidated Financial Statements of the Company include all consolidated accounts of Greenhill & Co., Inc. and all other entities in which the Company has a controlling interest after eliminations of all significant inter-company accounts and transactions.
Revenue Recognition
Advisory Revenues
It is the Company's accounting policy to recognize revenue when (i) there is persuasive evidence of an arrangement with a client, (ii) the agreed-upon services have been completed and delivered to the client or the transaction or events noted in the engagement letter are determined to be substantially complete, (iii) fees are fixed and determinable, and (iv) collection is reasonably assured.
The Company recognizes advisory fee revenues for mergers and acquisitions or financing advisory and restructuring engagements when the services related to the underlying transactions are completed in accordance with the terms of the engagement letter and all other requirements for revenue recognition are satisfied.
The Company recognizes capital advisory fees from primary capital raising transactions at the time of the client's acceptance of capital or capital commitments to a fund in accordance with the terms of the engagement letter. Generally, fee revenue is determined based upon a fixed percentage of capital committed to the fund. For multiple closings, revenue is recognized at each interim closing based on the amount of capital committed at each closing at the fixed fee percentage. At the final closing, revenue is recognized at the fixed percentage for the amount of capital committed since the last interim closing.
F-10
The Company recognizes capital advisory fees from secondary market transactions at the time the sale or transfer of the capital interest is completed in accordance with the terms of the engagement letter. Generally, fee revenue is determined based upon a fixed percentage of the transaction value.
While the majority of the Company's fee revenue is earned at the conclusion of a transaction or closing of a fund, on-going retainer fees, substantially all of which relate to non-success based strategic advisory and financing advisory and restructuring assignments, are also earned and recognized as advisory fee revenue over the period in which the related service is rendered.
The Company’s clients reimburse certain expenses incurred by the Company in the conduct of advisory engagements. Expenses are reported net of such client reimbursements. Client reimbursements totaled $4.7 million, $6.5 million and $5.4 million for the years ended December 31, 2017, 2016, and 2015, respectively.
Investment Revenues
Investment revenues consist of gains (or losses) on the Company's investments in certain merchant banking funds and interest income. The Company recognizes revenue on its investments in merchant banking funds based on its allocable share of realized and unrealized gains (or losses) reported by such funds.
Cash and Cash Equivalents
The Company’s cash and cash equivalents consist of (i) cash held on deposit with financial institutions, (ii) cash equivalents and (iii) restricted cash. The Company maintains its cash and cash equivalents with financial institutions with high credit ratings. The Company considers all highly liquid investments with a maturity date of three months or less, when purchased, to be cash equivalents. Cash equivalents primarily consist of money market funds, commercial paper, Treasury bills and short-term government bonds and are carried at cost, plus accrued interest, which approximates the fair value due to the short term nature of these investments.
Management believes that the Company is not exposed to significant credit risk due to the financial position of the depository institutions in which those deposits are held. See "Note 4 — Cash and Cash Equivalents".
Advisory Fees Receivables
Receivables are stated net of an allowance for doubtful accounts. The estimate for the allowance for doubtful accounts is derived by the Company by utilizing past client transaction history and an assessment of the client’s creditworthiness. The Company recorded bad debt expense of $1.1 million, $0.4 million and $0.3 million for the years ended December 31, 2017, 2016 and 2015, respectively.
Included in the advisory fees receivable balances at December 31, 2017 and 2016 were $29.3 million and $26.1 million of long term receivables related to primary capital advisory engagements, which are generally paid in installments over a period of three years. Included as a component of investment revenues is interest income related to primary capital advisory engagements of $0.7 million, $0.8 million and $0.9 million for the years ended December 31, 2017, 2016 and 2015, respectively.
Credit risk related to advisory fees receivable is disbursed across a large number of clients located in various geographic areas. The Company controls credit risk through credit approvals and monitoring procedures but does not require collateral to support accounts receivable.
Goodwill
Goodwill is the cost in excess of the fair value of identifiable net assets at acquisition date. The Company tests its goodwill for impairment at least annually. An impairment loss is triggered if the estimated fair value of an operating unit is less than estimated net book value. Such loss is calculated as the difference between the estimated fair value of goodwill and its carrying value.
Goodwill is translated at the rate of exchange prevailing at the end of the periods presented in accordance with the accounting guidance for foreign currency translation. Any translation gain or loss is included in the foreign currency translation adjustment, which is included as a component of other comprehensive income in the consolidated statements of changes in stockholders' equity.
Other Assets
Included in other assets are the Company's investments in merchant banking funds, which are recorded under the equity method of accounting based upon the Company's proportionate share of the estimated fair value of the underlying merchant banking fund's net assets. The value of merchant banking fund investments is determined by management of the fund after giving
F-11
consideration to the cost of the security, quoted market prices, the pricing of other sales of securities by the portfolio company, the price of securities of other companies comparable to the portfolio company, purchase multiples paid in other comparable third-party transactions, the original purchase price multiple, market conditions, liquidity, operating results and other qualitative and quantitative factors. The fund may apply discounts to reflect the lack of liquidity and other transfer restrictions.
Compensation Payable
Included in compensation payable are discretionary compensation awards comprised of annual cash bonuses and long-term incentive compensation, consisting of deferred cash retention awards, which are non-interest bearing, and generally amortized over a three to five year service period after the date of grant. See "Note 14 — Deferred Compensation".
Restricted Stock Units
The Company accounts for its share-based compensation payments by recording the fair value of restricted stock units granted to employees as compensation expense. The restricted stock units are generally amortized over a four to five-year service period following the date of grant. Compensation expense is determined based upon the fair market value of the Company’s common stock at the date of grant. In certain circumstances the Company issues share-based compensation, which is contingent on achievement of certain performance targets. Compensation expense for performance based awards begins at the time it is deemed more probable than not the performance target will be achieved and is amortized into expense over the remaining service period.
As the Company expenses the awards, the restricted stock units recognized are recorded within stockholders' equity. The restricted stock units are reclassified into common stock and additional paid-in capital upon vesting. The Company records as treasury stock the repurchase of stock delivered to its employees in settlement of tax liabilities incurred upon the vesting of restricted stock units. The Company records dividend equivalent payments on outstanding restricted stock units eligible for such payment as a dividend payment and a charge to stockholders' equity.
Earnings per Share
The Company calculates basic earnings per share (“EPS”) by dividing net income allocated to common stockholders by the sum of (i) the weighted average number of shares outstanding for the period and (ii) the weighted average number of shares deemed issuable due to the vesting of restricted stock units for accounting purposes. See "Note 11 — Equity".
The Company calculates diluted EPS by dividing net income allocated to common stockholders by the sum of (i) basic shares per above and (ii) the dilutive effect of the common stock deliverable pursuant to restricted stock units for which future service is required. Under the treasury method, the number of shares issuable upon the vesting of restricted stock units included in the calculation of diluted EPS is the excess, if any, of the number of shares expected to be issued, less the number of shares that could be purchased by the Company with the proceeds to be received upon settlement at the average market closing price during the reporting period.
Provision for Taxes
The Company accounts for taxes in accordance with the accounting guidance for income taxes which requires the recognition of tax benefits or expenses on the temporary differences between the financial reporting and tax bases of its assets and liabilities.
The Company follows the guidance for income taxes in recognizing, measuring, presenting and disclosing in its financial statements uncertain tax positions taken or expected to be taken on its income tax returns. Income tax expense is based on pre-tax accounting income, including adjustments made for the recognition or derecognition related to uncertain tax positions. The recognition or derecognition of income tax expense related to uncertain tax positions is determined under the guidance, and the Company's policy is to treat interest and penalties related to uncertain tax positions as part of pre-tax income.
Deferred tax assets and liabilities are recognized for the future tax attributable to differences between the financial statement carrying amounts of existing assets and liabilities and their respective tax bases. Deferred tax assets and liabilities are measured using enacted tax rates expected to be recovered or settled. The effect on deferred tax assets and liabilities of a change in tax rates is recognized in earnings in the period of change. Management applies the “more-likely-than-not criteria” when determining tax benefits.
Foreign Currency Translation
Assets and liabilities denominated in foreign currencies have been translated at rates of exchange prevailing at the end of the periods presented in accordance with the accounting guidance for foreign currency translation. Income and expenses transacted in foreign currency have been translated at average monthly exchange rates during the period. Translation gains and losses are
F-12
included in the foreign currency translation adjustment, which is included as a component of other comprehensive income (loss) in the consolidated statement of changes in stockholders' equity. Foreign currency transaction gains and losses are included in the consolidated statements of operations.
Financial Instruments and Fair Value
The Company accounts for financial instruments measured at fair value in accordance with accounting guidance for fair value measurements and disclosures which establishes a fair value hierarchy that prioritizes the inputs to valuation techniques used to measure fair value. The hierarchy gives the highest priority to unadjusted quoted prices in active markets for identical assets or liabilities (Level 1 measurements) and the lowest priority to unobservable inputs (Level 3 measurements). The three levels of the fair value hierarchy under the pronouncement are described below:
Basis of Fair Value Measurement
Level 1 – Unadjusted quoted prices in active markets that are accessible at the measurement date for identical, unrestricted assets or liabilities;
Level 2 – Quoted prices in markets that are not active or financial instruments for which all significant inputs are observable, either directly or indirectly; and
Level 3 – Prices or valuations that require inputs that are both significant to the fair value measurement and unobservable.
A financial instrument’s level within the fair value hierarchy is based on the lowest level of any input that is significant to the fair value measurement. In determining the appropriate levels, the Company performs an analysis of the assets and liabilities that are subject to these disclosures. At each reporting period, all assets and liabilities for which the fair value measurement is based on significant unobservable inputs or instruments which trade infrequently and therefore have little or no price transparency are classified as Level 3. Transfers between levels are recognized as of the end of the period in which they occur. See "Note 8 - Fair Value of Financial Instruments".
Fair Value of Other Financial Instruments
The Company believes that the carrying values of all financial instruments, other than certain cash equivalents, presented in the consolidated statements of financial condition approximate their fair value generally due to their short-term nature and generally negligible credit risk. These fair value measurements would be categorized as Level 2 within the fair value hierarchy. Cash equivalents are categorized as Level 1 within the fair value hierarchy.
Property and Equipment
Property and equipment is stated at cost less accumulated depreciation and amortization. Depreciation is computed using the straight-line method over the life of the assets. Amortization of leasehold improvements is computed using the straight-line method over the lesser of the life of the asset or the remaining term of the lease. Estimated useful lives of the Company’s fixed assets are generally as follows:
Aircraft – 7 years
Equipment – 5 years
Furniture and fixtures – 7 years
Leasehold improvements – the lesser of 10 years or the remaining lease term
Business Information
The Company's activities as an investment banking firm constitute a single business segment, with substantially all revenues generated from advisory services, which includes engagements relating to mergers and acquisitions, financing advisory and restructuring, and capital advisory services. The Company earns less than 1% of its revenues from interest income and investment gains (losses) on investments.
Recently Adopted Accounting Pronouncements
In March 2016, the FASB issued ASU No. 2016-09, Improvements to Employee Share-Based Payment Accounting ("ASU 2016-09"). ASU 2016-09 amends the guidance in former ASC Topic 718, Compensation – Stock Compensation. The standard is
F-13
effective for public entities for annual reporting periods beginning after December 15, 2016 and the Company adopted these amendments effective on January 1, 2017. The impact of ASU No. 2016-09 resulted in a net increase to the provision for income taxes for the year ended December 31, 2017 related to excess tax benefits and tax deficiencies for its restricted stock unit compensation, which under the prior standard was recorded as an adjustment to retained earnings. See "Note 16 — Income Taxes".
Accounting Developments
In February 2016, the FASB issued ASU No. 2016-02, Leases ("ASU 2016-02"). ASU 2016-02 amends the guidance in former ASC 840, Leases. Management is currently evaluating the impact of the future adoption of ASU 2016-02 on the Company’s Consolidated Financial Statements. The standard is effective for public entities for annual reporting periods beginning after December 15, 2018 and the Company will adopt these amendments effective on January 1, 2019.
In May 2014, the FASB issued ASU 2014-9 "Revenue from Contracts with Customers" codifying ASC 606, Revenue Recognition - Revenue from Contracts with Customers, which amends the guidance in former ASC 605, Revenue Recognition. The standard is effective for public entities for annual reporting periods beginning after December 15, 2017 utilizing either a full retrospective or modified retrospective approach. The Company will adopt this standard effective on January 1, 2018 utilizing the modified retrospective approach.
The Company has evaluated the impact of the adoption of ASU 2014-09 on our consolidated financial statements which requires applying the new standard to prior comparative periods when reporting under the new standard becomes effective. Based on the current guidance provided by the AICPA industry task force on Broker-Dealers, the AICPA's Revenue Recognition Working Group and the AICPA's Financial Reporting Executive Committee (FinREC), certain revenue of the Company, which is currently recognized at the time the services are provided, will now be recognized either at a point in time or over the term of an engagement. The change in Company's revenue recognition policy under the new revenue recognition model will create deferred revenue beginning in 2018 that will be recognized at a point in time as certain performance obligations are met. The Company estimates that as of January 1, 2018, the change will increase the Company's assets and liabilities by approximately $2.6 million and $10.2 million, respectively, and decrease retained earnings by approximately $7.6 million. The Company will also change the current presentation of certain reimbursed costs prospectively from a net to a gross presentation.
Note 3 — Acquisition
On April 1, 2015, the Company acquired 100% ownership of Cogent Partners, LP and its affiliates ("Cogent") (now known as our secondary capital advisory business), a global financial advisor to pension funds, endowments and other institutional investors on the secondary market for alternative assets, (the "Acquisition"). As consideration for the Acquisition the Company exchanged a combination of (i) $44.0 million in cash and 779,454 shares of Greenhill common stock paid at closing and (ii) $18.9 million in cash and 334,048 shares of Greenhill common stock payable in the future if certain agreed revenue targets are achieved (the "Earnout"). The cash component of the consideration paid at closing was funded by two bank term loan facilities, each in an original principal sum of $22.5 million, and together in aggregate $45.0 million. See "Note 10 — Loan Facilities".
The cash payment and the issuance of common shares related to the Earnout will be made if secondary capital advisory revenues of $80.0 million or more are earned during either the two year period ending on the second anniversary of the closing or the two year period ending on the fourth anniversary of the closing. The revenue generated by the secondary fund placement business for the first two year period ended March 31, 2017 was slightly less than required to achieve the Cogent earnout. If the revenue target is achieved during the second two year period ending on March 31, 2019, the contingent consideration will be paid promptly after that date. If the revenue target is not achieved during either of the two year Earnout periods, a payment will not be made. The fair value of the contingent issuance of common shares was valued on the date of the acquisition at $11.9 million and has been recorded as a component of stockholders' equity in the consolidated statements of financial condition. The fair value of the contingent cash consideration was valued on the date of the acquisition at $13.1 million and is remeasured quarterly based on a probability weighted present value discount that the revenue target may be achieved. At December 31, 2017, based on changes in the estimated probability of achievement and the present value of the remaining term, the contingent cash consideration was valued at $13.8 million. For the year ended December 31, 2017, the Company recognized a decrease in other operating expenses of $1.3 million, and for the years ended December 31, 2016 and 2015 an increase in other operating expenses of $1.5 million and $0.5 million, respectively. See "Note 8 — Fair Value of Financial Instruments", "Note 11 — Equity" and "Note 12 — Earnings per Share".
The Acquisition has been accounted for using the purchase method of accounting and the results of operations for the acquired secondary capital advisory business have been included in the consolidated statements of operations from the date of acquisition. The Company incurred $1.2 million of transaction costs related to the Acquisition, which have been included as a component of professional fees in the consolidated statement of operations for the year ended December 31, 2015.
F-14
An allocation of the total purchase price of approximately $100.0 million has been made to the assets acquired and liabilities assumed based on their fair values as of April 1, 2015, the date of the acquisition, as follows (in thousands):
Allocation of assets acquired and liabilities assumed: | |||
Assets: | |||
Current assets | $ | 13,970 | |
Property and equipment | 599 | ||
Other assets | 651 | ||
Identifiable intangible assets | 1,300 | ||
Goodwill | 93,116 | ||
Total assets | 109,636 | ||
Liabilities: | |||
Current liabilities | 9,640 | ||
Total liabilities | 9,640 | ||
Net assets | $ | 99,996 | |
The excess of the purchase price over the fair value of the net assets acquired of $93.1 million has been recorded as goodwill. Goodwill includes the in-place workforce, which allows the Company to continue serving its existing client base, begin marketing to potential clients and avoid significant costs reproducing the workforce.
The fair value of the intangible assets acquired, which consist of Cogent's backlog of client assignments that existed at the time of the closing, customer relationships, and trade name, is based, in part, on a valuation using an income approach, market approach or cost approach and has been included in other assets on the consolidated statements of financial condition. The fair value ascribed to the identifiable intangible assets will be amortized on a straight-line basis over the remaining useful life of each asset over periods ranging between one to three years. The Company recorded amortization expense of $0.3 million for the year ended December 31, 2017, and $0.5 million for each of the years ended December 31, 2016 and 2015 in respect of these assets.
In addition, under the terms of the purchase, the sellers were entitled to receive a post-closing distribution for the amount of net working capital, as defined, as of March 31, 2015, in excess of $5.0 million. The amount distributable to the sellers was $7.9 million and was paid in 2015. Further, the total purchase included at the date of acquisition an escrow amount of $8.9 million, of which $8.4 million was paid to the sellers and $0.5 million was returned to the Company in 2016.
The Acquisition was treated as an asset purchase for tax purposes. Similar to the purchase accounting method used for book purposes, the excess of the purchase price paid over the fair value of the net assets acquired was recorded as goodwill for tax purposes. The amount of goodwill recorded for tax purposes was determined based on the consideration paid at closing and is being amortized for tax purposes ratably over a fifteen years year period. If the Earnout is achieved, the additional consideration paid will also be treated as goodwill for tax purposes and will be amortized ratably over the remainder of the fifteen years period. For book purposes, the tax benefit from the amortization of goodwill is being recorded as an indefinite-lived deferred tax liability as it is realized.
Consistent with the Company's normal personnel recruiting policies, and in order to provide long term incentives for retention and continued strong performance, the Company also granted restricted stock units and other deferred compensation awards to a number of Cogent employees, subject to continued employment. The awards will generally vest on the third or fifth anniversary of the closing. The awards have not been recorded as a component of the purchase price and will be expensed over the service period during which they are earned.
Set forth below are the Company's summary unaudited pro forma results of operations for the year ended December 31, 2015. The unaudited pro forma results of operations include the historical results of the Company and give effect to the Acquisition as if it had occurred on January 1, 2015. These pro forma results include the actual results of Cogent from January 1, 2015 through March 31, 2015. For the period April 1, 2015 through December 31, 2015, the results of the acquired secondary capital advisory business were included in the consolidated results of the Company. See "Note 12 — Earnings per Share".
The unaudited pro forma results of operations do not purport to represent what the Company's results of operations would actually have been had the Acquisition occurred on January 1, 2015, as the case may be, or to project the Company's results of operations for any future period. Actual future results may vary considerably based on a variety of factors beyond the Company's control.
F-15
For the Year Ended December 31, | ||||
2015 | ||||
(in millions, except per share amounts) (unaudited) | ||||
(pro forma) | ||||
Revenues | $ | 272.0 | ||
Income before taxes | 45.2 | |||
Net income allocated to common stockholders | 26.8 | |||
Diluted earnings per share | $ | 0.84 | ||
The pro forma results include (i) compensation and benefits expense based upon a ratio of compensation to total revenues of 54%, which was the actual compensation ratio used by the Company in the pro forma periods presented, (ii) the amortization of identifiable intangible assets of Cogent, (iii) the estimated interest expense related to the bank term loan borrowings used to fund the Acquisition, (iv) the elimination of non-recurring revenue and expense items of Cogent which were directly attributable to the Acquisition, and (v) the estimated income tax expense related to Cogent's historical earnings, which as a result of the Acquisition, is subject to income tax at the effective tax rate of the Company.
Note 4 — Cash and Cash Equivalents
The carrying values of the Company's cash and cash equivalents are as follows:
As of December 31, | |||||||
2017 | 2016 | ||||||
(in thousands) | |||||||
Cash | $ | 70,459 | $ | 85,047 | |||
Cash equivalents | 193,315 | 9,013 | |||||
Restricted cash - letters of credit | 3,872 | 4,253 | |||||
Total cash and cash equivalents | $ | 267,646 | $ | 98,313 | |||
The carrying value of the Company's cash equivalents approximates fair value. See "Note 8 — Fair Value of Financial Instruments".
Letters of credit were secured by cash held on deposit. See "Note 15 — Commitments and Contingencies".
Included as a component of investment revenues is interest income related to cash and cash equivalents of $0.6 million, $0.1 million and $0.2 million for the years ended December 31, 2017, 2016 and 2015, respectively.
Note 5 — Property and Equipment
Property and equipment consist of the following:
As of December 31, | |||||||
2017 | 2016 | ||||||
(in thousands) | |||||||
Aircraft | $ | 19,260 | $ | 19,160 | |||
Equipment | 20,930 | 19,788 | |||||
Furniture and fixtures | 7,639 | 7,201 | |||||
Leasehold improvements | 22,847 | 21,612 | |||||
70,676 | 67,761 | ||||||
Less accumulated depreciation and amortization | (62,074 | ) | (58,997 | ) | |||
Total property and equipment, net | $ | 8,602 | $ | 8,764 | |||
F-16
Note 6 — Goodwill
Goodwill consists of the following:
As of December 31, | |||||||
2017 | 2016 | ||||||
(in thousands) | |||||||
Balance, January 1 | $ | 208,186 | $ | 209,024 | |||
Foreign currency translation adjustments | 9,551 | (838 | ) | ||||
Balance, December 31 | $ | 217,737 | $ | 208,186 | |||
The Company performs a goodwill impairment test annually or more frequently if circumstances indicate that impairment may have occurred. The Company has reviewed its goodwill for potential impairment and determined that the fair value of goodwill exceeded the carrying value. Accordingly, no goodwill impairment loss has been recognized for the years ended December 31, 2017, 2016 or 2015.
Note 7 — Other Assets
At December 31, 2017, the Company had an investment in a previously sponsored merchant banking funds, Greenhill Capital Partners II (“GCP II”), and an interest in Barrow Street III, a real estate investment fund. At December 31, 2016, the Company had investments in certain previously sponsored merchant banking funds: Greenhill Capital Partners I and GCP II, and an interest in Barrow Street III. At December 31, 2017 and 2016, the Company had no remaining unfunded commitments.
Other assets consist of the following:
As of December 31, | |||||||
2017 | 2016 | ||||||
(in thousands) | |||||||
Prepaid expenses | $ | 2,583 | $ | 4,295 | |||
Investments in merchant banking funds | 1,209 | 1,689 | |||||
Rent deposits | 1,798 | 1,517 | |||||
Other tangible assets | 639 | 540 | |||||
Intangible assets | 50 | 300 | |||||
Total other assets | $ | 6,279 | $ | 8,341 | |||
Investment revenues
The Company’s generates investment revenues from its investments in merchant banking funds and interest income as follows:
For the Years Ended December 31, | |||||||||||
2017 | 2016 | 2015 | |||||||||
(in thousands) | |||||||||||
Net realized and unrealized gains (losses) on investments in merchant banking funds | $ | (247 | ) | $ | (210 | ) | $ | 236 | |||
Interest income | 1,432 | 942 | 1,043 | ||||||||
Total investment revenues (losses) | $ | 1,185 | $ | 732 | $ | 1,279 | |||||
Note 8 — Fair Value of Financial Instruments
Assets and liabilities are classified in their entirety based on their lowest level of input that is significant to the fair value measurement. There were no Level 1 liabilities or Level 2 assets or liabilities measured at fair value during the year ended December 31, 2017. There were no Level 1 or Level 2 assets or liabilities measured in the fair value hierarchy during the year ended December 31, 2016. There were also no Level 3 assets measured at fair value during the years ended December 31, 2017 and 2016.
The following table sets forth the measurement at fair value on a recurring basis of the investments in money market fund and U.S. government securities. The securities are categorized as a Level 1 asset, as their valuation is based on quoted prices for identical assets in active markets. See "Note 4 — Cash and Cash Equivalents".
F-17
Assets Measured at Fair Value on a Recurring Basis as of December 31, 2017
Quoted Prices in Active Markets for Identical Assets (Level 1) | Significant Other Observable Inputs (Level 2) | Significant Unobservable Inputs (Level 3) | Balance as of December 31, 2017 | ||||||||||||
(in thousands) | |||||||||||||||
Assets | |||||||||||||||
Cash and cash equivalents | $ | 183,369 | $ | — | $ | — | $ | 183,369 | |||||||
Total | $ | 183,369 | $ | — | $ | — | $ | 183,369 | |||||||
The following table sets forth the measurement at fair value on a recurring basis of the contingent cash consideration due the selling unitholders of Cogent related to the Earnout. The liability arose as a result of the Acquisition and is categorized as a Level 3 liability. See "Note 3 — Acquisition".
Liabilities Measured at Fair Value on a Recurring Basis as of December 31, 2017
Quoted Prices in Active Markets for Identical Assets (Level 1) | Significant Other Observable Inputs (Level 2) | Significant Unobservable Inputs (Level 3) | Balance as of December 31, 2017 | ||||||||||||
(in thousands) | |||||||||||||||
Liabilities | |||||||||||||||
Contingent obligation due selling unitholders of Cogent | $ | — | $ | — | $ | 13,763 | $ | 13,763 | |||||||
Total | $ | — | $ | — | $ | 13,763 | $ | 13,763 | |||||||
Liabilities Measured at Fair Value on a Recurring Basis as of December 31, 2016
Quoted Prices in Active Markets for Identical Assets (Level 1) | Significant Other Observable Inputs (Level 2) | Significant Unobservable Inputs (Level 3) | Balance as of December 31, 2016 | ||||||||||||
(in thousands) | |||||||||||||||
Liabilities | |||||||||||||||
Contingent obligation due selling unitholders of Cogent | $ | — | $ | — | $ | 15,095 | $ | 15,095 | |||||||
Total | $ | — | $ | — | $ | 15,095 | $ | 15,095 | |||||||
Changes in Level 3 liabilities measured at fair value on a recurring basis for the year ended December 31, 2017 are as follows:
Opening Balance as of January 1, 2017 | Total realized and unrealized gains (losses) included in Net Income | Unrealized gains (losses) included in Other Comprehensive Income | Purchases | Issues | Sales | Settlements | Closing Balance as of December 31, 2017 | Unrealized gains (losses) for Level 3 liabilities outstanding at December 31, 2017 | |||||||||||||||||||||||||||
(in thousands) | |||||||||||||||||||||||||||||||||||
Liabilities | |||||||||||||||||||||||||||||||||||
Contingent obligation due selling unitholders of Cogent | $ | 15,095 | $ | 1,332 | $ | — | $ | — | $ | — | $ | — | $ | — | $ | 13,763 | $ | 1,332 | |||||||||||||||||
Total | $ | 15,095 | $ | 1,332 | $ | — | $ | — | $ | — | $ | — | $ | — | $ | 13,763 | $ | 1,332 | |||||||||||||||||
F-18
Changes in Level 3 liabilities measured at fair value on a recurring basis for the year ended December 31, 2016 are as follows:
Opening Balance as of January 1, 2016 | Total realized and unrealized gains (losses) included in Net Income | Unrealized gains (losses) included in Other Comprehensive Income | Purchases | Issues | Sales | Settlements | Closing Balance as of December 31, 2016 | Unrealized gains (losses) for Level 3 liabilities outstanding at December 31, 2016 | |||||||||||||||||||||||||||
(in thousands) | |||||||||||||||||||||||||||||||||||
Liabilities | |||||||||||||||||||||||||||||||||||
Contingent obligation due selling unitholders of Cogent | $ | 13,647 | $ | (1,448 | ) | $ | — | $ | — | $ | — | $ | — | $ | — | $ | 15,095 | $ | (1,448 | ) | |||||||||||||||
Total | $ | 13,647 | $ | (1,448 | ) | $ | — | $ | — | $ | — | $ | — | $ | — | $ | 15,095 | $ | (1,448 | ) | |||||||||||||||
Realized and unrealized gains (losses) are reported as a component of other operating expenses in the consolidated statements of operations.
The following tables presents quantitative information about the significant unobservable inputs utilized by the Company in the fair value measure of Level 3 liabilities measured at fair value on a recurring basis, as of December 31, 2017:
Fair Value as of December 31, 2017 | Valuation Technique(s) | Unobservable Input(s) | Range (Weighted Average) | |||||||
(in thousands) | ||||||||||
Liabilities | ||||||||||
Contingent obligation due selling unitholders of Cogent | $ | 13,763 | Present value of expected payments | Discount rate | 13 | % | ||||
Forecast revenue | (a) | |||||||||
The following tables presents quantitative information about the significant unobservable inputs utilized by the Company in the fair value measure of Level 3 liabilities measured at fair value on a recurring basis, as of December 31, 2016:
Fair Value as of December 31, 2016 | Valuation Technique(s) | Unobservable Input(s) | Range (Weighted Average) | |||||||
(in thousands) | ||||||||||
Liabilities | ||||||||||
Contingent obligation due selling unitholders of Cogent | $ | 15,095 | Present value of expected payments | Discount rate | 13 | % | ||||
Forecast revenue | (a) | |||||||||
_____________________________________________
(a) The Company's estimate of contingent consideration as of December 31, 2017 and December 31, 2016 was principally based on the acquired business' (i) actual revenue generation from April 1, 2015 through March 31, 2017 and (ii) actual and projected revenue generation from April 1, 2017 through March 31, 2019.
Valuation Processes - Level 3 Measurements - The Company utilizes a valuation technique based on a present value method applied to the probability of achieving a range of potential revenue outcomes. The valuation was conducted by the Company. The Company updates unobservable inputs each reporting period and has a formal process in place to review changes in fair value.
F-19
Sensitivity Analysis - Level 3 Measurements - The significant unobservable inputs used in determining fair value are the discount rate and forecast revenue information. Significant increases (decreases) in the discount rate would have resulted in a lower (higher) fair value measurement. Significant increases (decreases) in the forecast revenue information would result in a higher (lower) fair value measurement. For all significant unobservable inputs used in the fair value measurement of the Level 3 liabilities, a change in one of the inputs would not necessarily result in a directionally similar change in the other inputs.
Note 9 — Related Parties
At December 31, 2017 and 2016, the Company had no amounts payable to related parties.
In November 2017, the Company's Chairman, through an entity controlled by him, and the Company's Chief Executive Officer, in his personal capacity and through an entity controlled by him, each purchased of $10.0 million of the Company's common stock, for an aggregate total of $20.0 million, and a total of 1,159,420 common shares were issued. See "Note 11 — Equities".
The Company subleases airplane and office space to a firm owned by the Chairman of the Company. The Company recognized rent reimbursements of $0.08 million, $0.07 million and $0.07 million, respectively, for the years ended December 31, 2017, 2016 and 2015, which are included as a reduction of occupancy and equipment rental on the consolidated statements of operations. During 2017, 2016 and 2015, the Company paid $0.01 million, $0.01 million and $0.04 million, respectively, for the use of an aircraft owned by the Chairman of the Company.
Note 10 — Loan Facilities
On October 12, 2017, as part of a recapitalization plan, the Company entered into a new credit agreement with a syndicate of lenders, who lent in face amount $350.0 million under a five-year secured term loan facility ("Term Loan Facility) and provided a three-year secured revolving credit facility ("Revolving Loan Facility") for $20.0 million, which was undrawn at closing. In conjunction with the borrowings under the credit facilities the Company incurred expenses of $11.5 million, consisting of original issue discount of $1.75 million and deferred financing costs of $9.8 million, which have been recorded as a reduction in the carrying value of the secured term loan in the consolidated statements of financial position. The closing costs of the credit facilities are being amortized into interest expense over the lives of the obligations. For the year ended December 31, 2017 the Company incurred incremental interest expense of $0.6 million related to the amortization of these costs. See "Note 11 — Equity".
As of December 31, | |||||||
2017 | 2016 | ||||||
(in thousands) | |||||||
Secured term loan | $ | 339,048 | $ | — | |||
Bank revolving loan | — | 64,070 | |||||
Bank term loan | — | 16,875 | |||||
Unamortized discount | 1,663 | — | |||||
Unamortized debt issuance costs | 9,289 | — | |||||
Total debt facilities | 350,000 | 80,945 | |||||
Current maturities of debt | (21,875 | ) | (75,320 | ) | |||
Total long-term debt | $ | 328,125 | $ | 5,625 | |||
Borrowings under the new credit facilities bear interest at either the U.S. Prime Rate plus 2.75% or LIBOR plus 3.75%. Borrowings under the Term Loan Facility had a weighted average interest rate for the period outstanding in 2017 of approximately 5.1% (with borrowing rate ranging from 5.0% to 5.3% during the period that the Term Facility was outstanding).
The Term Loan Facility requires quarterly principal amortization payments commencing on March 31, 2018 of $4.375 million through September 30, 2018 and $8.75 million (or $35.0 million annually) beginning December 31, 2018 through September 30, 2022 with the remaining balance of the term loan due at maturity on October 12, 2022. In addition, beginning for the year ended December 31, 2018, the Company is required to make annual repayments of principal within ninety days of year end on the term loan of 50% of its annual excess cash flow as defined in the credit agreement. The Company is also required to repay certain amounts of the term loan in connection with the non-ordinary course sale of assets, receipt of insurance proceeds, and the issuance of debt obligations, subject to certain exceptions. At December 31, 2017, $350.0 million was outstanding on the Term Loan Facility and no amounts were outstanding under the Revolving Loan Facility.
F-20
All mandatory repayments of the Term Loan Facility will be applied without penalty or premium. Voluntary prepayments of borrowings under the term loan facility will be permitted. In the event that all or any portion of the term loan facility is prepaid or refinanced or repriced through any amendment prior to April 12, 2019, such repayment, prepayment, refinancing, or repricing will be at 101.0% of the principal amount so repaid, prepaid, refinanced or repriced.
The Term Loan Facility and Revolving Loan Facility are both guaranteed by the Company's existing and subsequently acquired or organized wholly-owned U.S. restricted subsidiaries (excluding any registered broker-dealers) and secured with a first priority perfected security interest in certain domestic assets and 100% of the capital stock of each U.S. subsidiary and 65% of the capital stock of each non-U.S. subsidiary, subject to certain exclusions which, for the avoidance of doubt, such security interest shall not include any assets of regulated subsidiaries that are not permitted to be pledged by law, statute or regulation, including cash held by regulated subsidiaries and any other capital required to meet and maintain regulatory capital requirements. The credit facilities contain certain covenants that limit the Company's ability above certain permitted amounts to incur additional indebtedness, make certain acquisitions, pay dividends and repurchase shares. The term loan facility does not have financial covenants and the revolving loan facility is subject to a springing total net leverage ratio financial covenant, subject to certain step downs, if the Company's borrowings under the revolving loan facility exceed $12.5 million. The Company is also subject to certain other non-financial covenants. At December 31, 2017, the Company was compliant with all loan covenants.
In conjunction with the borrowing of the Term Loan Facility in October 2017, the Company used a portion of the proceeds to repay in full outstanding borrowings of $83.8 million under the previously existing revolving bank loan facility plus accrued interest. Interest on the previous revolving bank loan facility was based on the higher of 3.50% or the U.S. Prime Rate (4.25% at the time of repayment) and was payable monthly. The weighted average daily borrowings outstanding under the previous revolving bank loan facility for the portion of the year the obligation was outstanding were approximately $65.3 million and $54.1 million for the years ended December 31, 2017 and 2016, respectively. The weighted average interest rate was 4.1% for the period outstanding in 2017, and 3.5% and 3.3% for the years ended December 31, 2016 and 2015, respectively.
In connection with the acquisition of Cogent in April 2015, the Company borrowed $45.0 million, which was comprised of two bank term loan facilities, each in an original principal amount of $22.5 million. One bank term loan facility, which bore interest at the U.S. Prime Rate plus 0.75%, was repaid in two equal installments, one in June 2015 and the other in April 2016. The second bank term loan facility, which bore interest at the Prime Rate plus one and one-quarter percent (1.25%) per annum, which interest rate was to be reduced to the Prime Rate plus three-quarters of one percent (0.75%) per annum when the amount outstanding was $7.5 million or less, had a maturity date of April 30, 2018 and was payable in four equal semi-annual installments beginning on October 31, 2016. In 2016, a principal payment of $5.625 million was made on the second term loan facility. In 2017, prior to the drawdown of the new credit facility, the Company repaid the outstanding balance of the term loan of $16.9 million in full satisfaction of the remaining tranche of the term loan facility used to fund the acquisition of Cogent. There were no prepayment penalties for the early repayment of the bank term loan facilities. The weighted average interest rate of the bank term loan facilities for the portion of the year the obligation was outstanding was 5.2% and 4.7% for the year ended December 31, 2017 and 2016, respectively.
Note 11 — Equity
In September 2017, the Company announced plans for a leveraged recapitalization, which included the authorization to repurchase up to $285 million of the Company's common stock. In connection with the recapitalization, in October 2017 the Company borrowed $350 million of secured term loans and repaid $83.8 million outstanding under the existing bank loan facilities. See “Note 10 — Loan Facilities”.
In October 2017, the Company repurchased 3,434,137 shares of its common stock under the share repurchase plan through a tender offer at $17.25 per share for a total cash cost of approximately $59.2 million. In addition, the Company incurred fees and expenses relating to the tender offer of $0.7 million. In addition, during November and December 2017, the Company repurchased an additional 343,411 common shares through other open market transactions. Since commencement of its share repurchase plan, the Company repurchased in aggregate 3,777,548 shares of its common stock at an average price of $17.41 for a total cost of $65.8 million. At December 31, 2017, the Company had remaining authorization under its share repurchase plan of $219.2 million. See "Note 19 — Subsequent Events".
In November 2017, the Company's Chairman, through an entity controlled by him, and the Company's Chief Executive Officer, in his personal capacity and through an entity controlled by him, each purchased of $10.0 million of the Company's common stock, for an aggregate total of $20.0 million, and a total of 1,159,420 common shares were issued. See "Note 9 — Related Parties".
In connection with the acquisition of Cogent, the Company issued 779,454 shares of common stock on the acquisition date, April 1, 2015. In addition, the Company will issue 334,048 shares of common stock shortly after the second or fourth anniversary of the Acquisition, as the case may be, if the revenue target related to the Earnout is achieved. If the revenue target related to the
F-21
Earnout is not achieved the common shares will not be issued. The fair value of the contingent issuance of common shares was valued on the date of the acquisition at $11.9 million and has been recorded as additional paid in capital in the consolidated statements of financial condition. A portion of the value will be transferred to common stock if the Earnout is achieved. See "Note 3 — Acquisition" and "Note 12 — Earnings per Share".
During 2017, 1,197,260 restricted stock units vested and were issued as common stock of which the Company is deemed to have repurchased 491,677 shares at an average price of $28.04 per share in conjunction with the payment of tax liabilities in respect of stock delivered to its employees in settlement of restricted stock units.
During 2016, 852,218 restricted stock units vested and were issued as common stock of which the Company is deemed to have repurchased 319,573 shares at an average price of $25.10 per share in conjunction with the payment of tax liabilities in respect of stock delivered to its employees in settlement of restricted stock units. In addition, during 2016 the Company repurchased in open market transactions 891,017 shares of its common stock at an average price of $22.63.
On December 20, 2017, a dividend of $0.05 per share was paid to stockholders of record on December 6, 2017. For the year ended December 31, 2017, dividends declared per common share were $1.40. For each of the years ended December 31, 2016 and 2015, dividends declared per common share were $1.80 and are paid on outstanding common shares. In addition, dividend equivalent amounts are paid on outstanding restricted stock units and amounted to $6.3 million, $8.5 million and $6.5 million for the years ended December 31, 2017, 2016 and 2015, respectively, and are included in dividends paid on the consolidated statements of cash flows. In the event a restricted stock unit holder’s employment is terminated, a portion of the dividend equivalent amount is required to be paid back (a "clawback") to the Company and is netted against the dividend equivalent amounts. See “Note 14 — Deferred Compensation - Restricted Stock Units”.
Note 12 — Earnings per Share
The computations of basic and diluted EPS are set forth below:
For the Years Ended December 31, | |||||||||||
2017 | 2016 | 2015 | |||||||||
(in thousands, except per share amounts) | |||||||||||
Numerator for basic and diluted EPS — net income (loss) allocated to common stockholders | $ | (26,651 | ) | $ | 60,762 | $ | 25,598 | ||||
Denominator for basic EPS — weighted average number of shares | 32,075 | 32,043 | 31,197 | ||||||||
Add — dilutive effect of: | |||||||||||
Weighted average number of incremental shares issuable from restricted stock units | — | (1) | 31 | 3 | |||||||
Denominator for diluted EPS — weighted average number of shares and dilutive potential shares | 32,075 | 32,074 | 31,200 | ||||||||
Earnings (loss) per share: | |||||||||||
Basic | $ | (0.83 | ) | $ | 1.90 | $ | 0.82 | ||||
Diluted | $ | (0.83 | ) | $ | 1.89 | $ | 0.82 | ||||
The weighted number of shares and dilutive potential shares do not include 334,048 shares of common stock, which will be issued to certain selling unitholders of Cogent, following the fourth anniversary of the acquisition if the revenue target related to the Earnout is achieved. In the event that the revenue target is achieved, such shares will be included in the Company’s share count at March 31, 2019. If the revenue target is not achieved, the shares of common stock will not be issued. See “Note 3 — Acquisition” and "Note 11 — Equity".
________________________
(1) | Excludes 223,438 shares for the year ended December 31, 2017, which were considered antidilutive and thus were not included in the above calculation. |
Note 13 — Retirement Plan
In the U.S., the Company sponsor qualified defined contribution plans (the “Retirement Plans”) covering all eligible employees of G&Co and GC LP The Retirement Plans provide for both employee contributions in accordance with Section 401(k) of the Internal Revenue Code, and employer discretionary profit sharing contributions, subject to statutory limits. The Company incurred costs of $0.6 million, $0.6 million and $0.3 million for contributions to the Retirement Plans for the years ended
F-22
December 31, 2017, 2016 and 2015, respectively. There was $0.2 million and $0.5 million related to contributions due to the Retirement Plans included in compensation payable at December 31, 2017 and 2016, respectively.
GCI also operates a defined contribution pension fund for its employees. The assets of the pension fund are held separately in an independently administered fund. For the years ended December 31, 2017, 2016 and 2015, GCI incurred costs for the funding of pension contributions of approximately $0.3 million, $0.4 million and $0.5 million, respectively. At December 31, 2017 and 2016, there were no amounts related to contributions due to the defined contribution pension fund included in compensation payable.
Greenhill Australia is required by Australian law to contribute compulsory superannuation on employees' gross earnings, generally at a rate of 9%, subject to an annual limit per employee. Superannuation is a defined contribution plan in which retirement benefits are determined by the contribution accumulated over the working life plus investment earnings within the fund less expenses. Greenhill Australia incurred costs for the funding of pension contributions of approximately $0.4 million for each of the years ended December 31, 2017 and 2016, respectively, and $0.5 million for the year ended December 31, 2015. At December 31, 2017 and 2016, there were no amounts related to superannuation contributions due to the defined contribution plan included in compensation payable.
Note 14 — Deferred Compensation
Restricted Stock Units
The Company has adopted an equity incentive plan to motivate its employees and allow them to participate in the ownership of its stock. Under the Company’s plan, restricted stock units, which represent a right to a future payment equal to one share of common stock, may be awarded to employees, directors and certain other non-employees as selected by the Compensation Committee. Awards granted under the plan generally vest ratably over a period of up to four to five years beginning on the first anniversary of the grant date or in full on the fourth or fifth anniversary of the grant date. To the extent the restricted stock units are outstanding at the time a dividend is paid on the common stock, a dividend equivalent amount is paid to the holders of the restricted stock units. In the event that the holder’s employment is terminated under circumstances in which units awarded under the plan are forfeited any dividend equivalent payments related to such forfeiture, which are unvested for accounting purposes, are required to be repaid to the Company.
The activity related to the restricted stock units is set forth below:
Restricted Stock Units Outstanding | |||||||||||||
2017 | 2016 | ||||||||||||
Units | Grant Date Weighted Average Fair Value | Units | Grant Date Weighted Average Fair Value | ||||||||||
Outstanding, January 1, | 4,844,956 | $ | 33.38 | 3,723,129 | $ | 45.88 | |||||||
Granted | 2,227,659 | (1) | 20.87 | 2,407,173 | (2) | 21.61 | |||||||
Delivered | (1,219,193 | ) | (1) | 37.38 | (871,226 | ) | (2) | 52.27 | |||||
Forfeited | (456,694 | ) | 24.76 | (414,120 | ) | 37.66 | |||||||
Outstanding, December 31, | 5,396,728 | $ | 28.02 | 4,844,956 | $ | 33.38 | |||||||
_____________________________________________
(1) | Excludes 1,811,132 stock units granted and 931,180 stock units delivered to employees in connection with the annual awards granted and vested subsequent to December 31, 2017 as part of the long-term incentive awards program. |
(2) | Excludes 973,946 stock units granted and 1,023,132 stock units delivered to employees in connection with the annual awards granted and vested subsequent to December 31, 2016 as part of the long-term incentive awards program. |
For the years ended December 31, 2017, 2016 and 2015, the Company recognized compensation expense from the amortization of restricted stock units, net of forfeitures, of $40.2 million, $45.8 million and $46.5 million, respectively.
The weighted-average grant date fair value for restricted stock units granted during the years ended December 31, 2017, 2016 and 2015 was $20.87, $21.61 and $36.45, respectively. As of December 31, 2017, unrecognized restricted stock units compensation expense was approximately $60.1 million, with such unrecognized compensation expense expected to be recognized over a weighted average period of approximately 1.8 years.
The Company issues restricted stock units to employees under the equity incentive plan, primarily in connection with its annual bonus awards and compensation agreements for new hires. In certain jurisdictions, the Company may settle share-based
F-23
payment awards in cash in lieu of shares of common stock to obtain tax deductibility. In these circumstances, the awards are settled in the cash equivalent value of the Company's shares of common stock based upon their value at settlement date. These cash settled share-based awards are remeasured at fair value at each reporting period.
The Company awarded 115,473 performance-based restricted stock awards ("PRSU"), as part of long-term incentive compensation in 2016. The PRSU award targeted performance from 2016 to 2018 to multi-year revenue, pre-tax profit and total stockholder return (“TSR”) goals, each equally weighted. If the achievement of a performance metric is below the threshold goal, the payout factor for such performance metric will be 0%. The maximum payout under the award is 288,683 units and the cumulative dividends over the reward period. The performance relative to revenue and pre-tax profit is measured quarterly and the probability weighted likelihood of achievement is recorded based on the grant day price. The TSR component is measured quarterly and the probability weighted likelihood of achievement is recorded based on the fair value at the date of grant.
Deferred Cash Compensation
As part of its long-term incentive award program, the Company grants deferred cash retention awards to certain eligible employees. The deferred awards, which generally vest over a three to five year service period or in full on the third or fifth anniversary of the grant date, provide the employee with the right to receive future cash compensation payments, which are non-interest bearing. Deferred cash compensation of $14.9 million and $7.0 million as of December 31, 2017 and 2016, respectively is included in compensation payable in the consolidated statements of financial condition. As of December 31, 2017, total unrecognized deferred cash compensation (prior to the consideration of forfeitures) was approximately $14.9 million and is expected to be recognized over a weighted-average period of 0.8 years.
For the years ended December 31, 2017, 2016 and 2015, the Company recognized compensation expense from the amortization of deferred compensation, net of forfeitures, of $13.1 million, $4.8 million and $2.6 million, respectively.
Note 15 — Commitments and Contingencies
The Company has entered into certain leases for office space under non-cancellable operating lease agreements that expire on various dates through 2027.
As of December 31, 2017, the approximate aggregate minimum future rental payments required were as follows (in thousands):
2018 | $ | 16,144 | |
2019 | 16,071 | ||
2020 | 13,727 | ||
2021 | 6,151 | ||
2022 | 3,867 | ||
Thereafter | 8,106 | ||
Total (1) | $ | 64,066 | |
_____________________________________________
(1) | Minimum future rental payments are recorded at their gross amounts and have not been reduced by sublease rentals of $0.7 million for 2018 and $0.5 million for 2019 for approximately 7,000 of aggregate square footage for former Cogent office space in New York and London. The subleases extend through the terms of the existing leases, which both terminate in 2019. |
The Company has also entered into various operating leases for office equipment.
Rent expense for leased office space, net of sublease reimbursements, for the years ended December 31, 2017, 2016 and 2015 was approximately $15.0 million, $14.3 million and $16.0 million, respectively.
Diversified financial institutions issued five letters of credit on behalf of the Company to secure office space leases, which totaled $3.9 million and $4.3 million at December 31, 2017 and 2016, respectively. These letters of credit were secured by cash held on deposit. At December 31, 2017 and 2016, no amounts had been drawn under any of the letters of credit. See "Note 4 — Cash and Cash Equivalents".
In addition, the Company has a contingent cash obligation of $18.9 million due the selling unit holders of Cogent if the Earnout is achieved. See "Note 3 — Acquisition" and "Note 8 — Fair Value of Financial Instruments".
F-24
The Company is from time to time involved in legal proceedings incidental to the ordinary course of its business. The Company does not believe any such proceedings will have a material adverse effect on its results of operations.
Note 16 — Income Taxes
The Company is subject to U.S. federal, foreign, state and local corporate income taxes.
The components of the provision for income taxes reflected on the consolidated statements of operations are set forth below:
For the Years Ended December 31, | |||||||||||
2017 | 2016 | 2015 | |||||||||
(in thousands) | |||||||||||
Current taxes: | |||||||||||
U.S. federal | $ | 8,792 | $ | 19,392 | $ | 15,995 | |||||
State and local | 1,181 | 1,939 | 3,624 | ||||||||
Foreign | 1,786 | 13,245 | 4,136 | ||||||||
Total current tax expense | 11,759 | 34,576 | 23,755 | ||||||||
Deferred taxes: | |||||||||||
U.S. federal | 14,626 | (4,530 | ) | (2,252 | ) | ||||||
State and local | 795 | (321 | ) | (759 | ) | ||||||
Foreign | (827 | ) | (2,606 | ) | (3,047 | ) | |||||
Total deferred tax (benefit) expense | 14,594 | (7,457 | ) | (6,058 | ) | ||||||
Total tax expense | $ | 26,353 | $ | 27,119 | $ | 17,697 | |||||
The Company accounts for income taxes in accordance with ASC 740, which requires an asset and liability approach for financial accounting and reporting for income taxes. Deferred taxes are provided for the net tax effects of temporary differences between the carrying amounts of assets and liabilities for financial reporting purposes and the amounts used for income tax purposes. These deferred taxes are measured using the enacted tax rates and laws that will be in effect when such differences are expected to reverse. Recent changes in tax laws and enacted accounting pronouncements significantly affected the Company’s income tax provision in the current year.
Effective in 2017, the Company was subject to a new accounting pronouncement which required it to record a charge or benefit in its income tax provision for the tax effect of the difference between the grant price value of restricted stock units and the market value of such awards at the time of vesting. In addition, this new pronouncement required the Company to record an income tax benefit for the tax effect of dividend payments on restricted stock units. In prior periods, the tax effect of these differences was recorded as a charge or benefit to stockholders equity. For the year ended December 31, 2017, the Company incurred a net charge of $1.5 million related to this new accounting requirement.
On December 22, 2017, the Tax Cuts and Jobs Act (the “TCJA”) was enacted making significant changes to U.S. corporate income tax laws by, among other things, lowering the corporate income tax rate from 35% to 21% beginning in 2018, imposing a one-time repatriation tax in the current year for the deemed repatriation of earnings of foreign subsidiaries previously tax deferred before the effective date of the legislation, and implementing a territorial-type tax system with a minimum tax for certain foreign earnings starting in 2018. Although the reduction in the corporate income tax rate is not effective until after the year ended December 31, 2017, the legislation required the Company to revalue its deferred tax assets and liabilities and charge to deferred tax expense the future impact of the lower corporate tax rate as of the effective date of the legislation. In accordance with ASC 740, this revaluation adjustment includes the tax effect related to the change in corporate tax rates for foreign currency translation adjustments that had previously been accounted for as a tax adjustment in other comprehensive income in the consolidated statements of changes in stockholders' equity. The effect of the revaluation of the Company’s deferred tax assets and liabilities resulted in a net charge of $15.4 million for the year ended December 31, 2017. Despite having significant tax deferred foreign earnings at the effective date of the legislation, the one-time repatriation tax charge for previously deferred earnings of foreign subsidiaries did not result in a charge in the tax provision for the year ended December 31, 2017, because the calculation of the deemed repatriation allows the offset of cumulative foreign earning by jurisdiction against cumulative foreign losses of other jurisdictions. The implementation of a territorial-type tax system does not affect the tax provision for the year ended December 31, 2017 and is not expected to have a material impact in future years. As such, in order to better align its structure and operations with these new tax laws, the Company no longer intends to indefinitely reinvest its non-U.S. subsidiary earnings outside of the United States.
F-25
Significant components of the Company's net deferred tax assets and liabilities are set forth below:
As of December 31, | |||||||
2017 | 2016 | ||||||
(in thousands) | |||||||
Deferred tax assets: | |||||||
Compensation and benefits | $ | 23,080 | $ | 32,021 | |||
Depreciation and amortization | 1,521 | 2,483 | |||||
Cumulative translation adjustment | 8,878 | 20,361 | |||||
Operating loss carryforwards | 10,133 | 4,944 | |||||
Capital loss carryforwards | 2,106 | 1,938 | |||||
Unrealized loss on investments | 61 | — | |||||
Other financial accruals | 2,047 | 2,299 | |||||
Valuation allowances | (5,481 | ) | (1,938 | ) | |||
Total deferred tax assets | 42,345 | 62,108 | |||||
Deferred tax liabilities: | |||||||
Unrealized gain on investments | — | 659 | |||||
Other financial accruals | 2,928 | 3,008 | |||||
Total deferred tax liabilities | 2,928 | 3,667 | |||||
Net deferred tax asset | $ | 39,417 | $ | 58,441 | |||
Based on the Company's historical taxable income and its expectation for taxable income in the future, management expects that its largest deferred tax asset, which relates principally to compensation expense deducted for book purposes but not yet deducted for tax purposes, will be realized as offsets to future taxable income.
The Company’s deferred taxes for operating loss carryforwards relate to losses incurred in foreign jurisdictions. In 2017, although operating loss carryforwards increased in most foreign jurisdictions, these jurisdictions had been profitable in prior years and the Company believes it is more likely than not they will be profitable in future years. However, management has carefully considered the need for a valuation allowance by evaluating each foreign jurisdiction separately and considering items such as historical and estimated future taxable income, cost bases, and other various factors. Based on all available information, the Company has determined that it is more likely than not that it will realize the full benefit of these operating loss carryforwards and other deferred tax assets in the majority of its foreign jurisdictions. However, due to accounting requirements and other factors the Company has established valuation allowances for operating loss carryforwards and other deferred tax assets of $3.4 million. At December 31, 2017, the Company had foreign operating loss carryforwards, which in aggregate totaled $37.4 million, including the reserved amounts and the additional amounts related to the new accounting pronouncement. These operating loss carryforwards may be carried forward for eight years and longer notwithstanding $0.6 million which can be carried forward for 4 years to 6 years.
In addition to the valuation allowances against certain foreign operating loss carryforwards, the Company has previously recorded a valuation allowance against a deferred tax asset related to a capital loss carryforward in the United Kingdom. This capital loss was realized from the sale of an investment in the United Kingdom and can be carried forward indefinitely but can only be utilized against capital gain in the same jurisdiction. Since the Company has nominal remaining investments in the United Kingdom and considers it more likely than not that the Company will not generate a capital gain in the United Kingdom, the Company had previously established a full valuation allowance against this related deferred tax asset. As of December 31, 2017, the amount of the deferred tax asset and corresponding valuation allowance for the capital loss carryforward in the United Kingdom was $2.1 million. This amount is greater than the prior year due to movement in the foreign currency exchange rate.
Notwithstanding the tax effect of the change in corporate tax rates enacted by the TCJA, which has been included in deferred tax expense, any gain or loss resulting from the translation of deferred taxes for foreign affiliates has been included in the foreign currency translation adjustment as a component of other comprehensive income, net of tax, in the consolidated statements of changes in stockholders' equity. Income taxes receivable of $2.0 million and $1.4 million as of December 31, 2017 and 2016, respectively, were included in other receivables in the consolidated statements of financial condition.
The Company is subject to the income tax laws of the United States, its states and municipalities, and those of the foreign jurisdictions in which the Company operates. These laws are complex, and the manner in which they apply to the taxpayer's facts
F-26
is sometimes open to interpretation. Management must make judgments in assessing the likelihood that a tax position will be sustained upon examination by the taxing authorities based on the technical merits of the tax position. In the normal course of business, the Company may be under audit in one or more of its jurisdictions in an open tax year for that particular jurisdiction. As of December 31, 2017, the Company does not expect any material changes in its tax provision related to any current or future audits.
The Company recognizes tax positions in the financial statements only when it is more likely than not that the position will be sustained on examination by the relevant taxing authority based on the technical merits of the position. A position that meets this standard is measured at the largest amount of benefit that will more likely than not be realized on settlement. A liability is established for differences between positions taken in a tax return and amounts recognized in the financial statements. The Company performed an analysis of its tax positions as of December 31, 2017, and determined that there was no requirement to accrue any material additional liabilities. Also, when present as part of the tax provision calculation, interest and penalties have been reported as interest expense and other operating expenses in the consolidated statements of operations.
A reconciliation of the statutory U.S. federal income tax rate of 35.0% to the Company’s effective income tax rate is set forth below:
For the Years Ended December 31, | ||||||||
2017 | 2016 | 2015 | ||||||
U.S. statutory tax rate | 35.0 | % | 35.0 | % | 35.0 | % | ||
Increase related to state and local taxes, net of U.S. income tax benefit | (499.9 | ) | 1.3 | 4.7 | ||||
Benefits and taxes related to foreign operations | (2,796.3 | ) | (6.2 | ) | 0.7 | |||
Accounting pronouncement for equity compensation including foreign | (486.2 | ) | — | — | ||||
Rate change to deferred items related to Tax Cuts and Jobs Act | (5,193.7 | ) | — | — | ||||
Other | 89.2 | 0.8 | 0.5 | |||||
Effective income tax rate | (8,851.9 | )% | 30.9 | % | 40.9 | % | ||
For the year ended December 31, 2017, the rate reconciliation to 35.0% is not meaningful principally as result of the application of various material adjustments related to the TCJA on nominal pre-tax loss for the period.
Note 17 — Regulatory
Certain subsidiaries of the Company are subject to various regulatory requirements in the United States, United Kingdom, Australia and certain other jurisdictions, which specify, among other requirements, minimum net capital requirements for registered broker-dealers.
G&Co is subject to the SEC’s Uniform Net Capital requirements under Rule 15c3-1 (the “Rule”), which specifies, among other requirements, minimum net capital requirements for registered broker-dealers. The Rule requires G&Co to maintain a minimum net capital of the greater of $5,000 or 1/15 of aggregate indebtedness, as defined in the Rule. As of December 31, 2017 and 2016, G&Co’s net capital was $5.0 million and $7.3 million, respectively, which exceeded its requirement by $4.0 million and $5.9 million, respectively. G&Co’s aggregate indebtedness to net capital ratio was 3.03 to 1 and 2.80 to 1 at December 31, 2017 and 2016, respectively. Certain distributions and other capital withdrawals of G&Co are subject to certain notifications and restrictive provisions of the Rule.
GC LP is also subject to the Rule. GCI, GCE and the European affiliate of GC LP are subject to capital requirements of the FCA. Greenhill Australia is subject to capital requirements of the ASIC. We are also subject to certain capital regulatory requirements in other jurisdictions. As of December 31, 2017 and 2016, GCI, GCE, GC LP, Greenhill Australia, and our other regulated operations were in compliance with local capital adequacy requirements.
Note 18 — Business Information
The Company's activities as an investment banking firm constitute a single business segment, with substantially all revenues generated from advisory services, which includes engagements relating to mergers and acquisitions, financing advisory and restructuring, and capital advisory services. The Company generally generates less than 1% of its revenues from investment revenues, consisting of interest income and gains and losses on its remaining principal investments in merchant banking funds.
The Company principally earns its revenues from advisory fees upon the successful completion of the client’s transaction or restructuring, or fund closing. Advisory revenues represented substantially all of the Company’s total revenues for the years
F-27
ended December 31, 2017, 2016 and 2015, respectively. In 2017 and 2016, there were no advisory clients that accounted for more than 10% of total revenues.
Since the financial markets are global in nature, the Company generally manages its business based on the operating results of the enterprise taken as whole, not by geographic region. For reporting purposes, the geographic regions are the North America, Europe, and the rest of the world, which are the locations where the Company retains substantially all of its employees.
The following table presents information about the Company by geographic region, after elimination of all significant inter-company accounts and transactions:
As of or for the Years Ended December 31, | |||||||||||
2017 | 2016 | 2015 | |||||||||
(in thousands) | |||||||||||
Total revenues | |||||||||||
North America | $ | 169,502 | $ | 206,673 | $ | 172,582 | |||||
Europe | 47,441 | 110,229 | 63,875 | ||||||||
Rest of World | 22,239 | 18,617 | 25,103 | ||||||||
Total | $ | 239,182 | $ | 335,519 | $ | 261,560 | |||||
Income (loss) before taxes | |||||||||||
North America | $ | 15,315 | $ | 48,927 | $ | 40,895 | |||||
Europe | (10,547 | ) | 52,650 | 9,577 | |||||||
Rest of World | (5,066 | ) | (13,696 | ) | (7,177 | ) | |||||
Total | $ | (298 | ) | $ | 87,881 | $ | 43,295 | ||||
Total assets | |||||||||||
North America | $ | 426,799 | $ | 266,975 | $ | 261,077 | |||||
Europe | 48,195 | 64,467 | 38,409 | ||||||||
Rest of World | 135,823 | 125,240 | 123,658 | ||||||||
Total | $ | 610,817 | $ | 456,682 | $ | 423,144 | |||||
The Company's revenues are based on the country where the services were derived. For the years ended December 31, 2017, 2016 and 2015, the Company generated 70%, 59%, and 66%, respectively, of its total revenues from the United States and 15%, 27% and 20% respectively, of its total revenues from the United Kingdom. No other country had revenues which individually represented more than 10% of the Company's total revenues during the years ended December 31, 2017, 2016 and 2015, respectfully.
Included in the Company's total assets it had long-lived assets, excluding deferred tax assets and intangible assets, located in the United States of $36.6 million and $34.8 million at December 31, 2017 and 2016, respectively. No other country had long- lived assets, which individually represented more than 10% of the Company's total long-lived assets at December 31, 2017 and 2016.
Note 19 — Subsequent Events
The Company evaluates subsequent events through the date on which the financial statements are issued.
On February 6, 2018, the Board of Directors of the Company declared a quarterly dividend of $0.05 per share. The dividend will be payable on March 21, 2018 to the common stockholders of record on March 7, 2018.
On February 13, 2018, the Company launched a modified Dutch auction tender offer to repurchase up to $110.0 million in value of its common stock at a price not greater than $20.50 per share nor less than $18.50 per share. The Company will determine from the prices specified by the tendering stockholders the lowest single price specified that will allow it to purchase the shares at an aggregate purchase price of up to $110.0 million. The tender offer is scheduled to expire on March 14, 2018, subject to extension. As of February 12, 2018, the Company had remaining share repurchase authorization of $212.7 million, which will be reduced to $102.7 million if the tender offer is fully subscribed. Following completion of the tender offer and the 10 business day period provided by the tender offer rules, the remainder of the $285.0 million share repurchase program may be implemented through open market purchases or other means. The price and timing of share repurchases, as well as the total funds ultimately expended, will be subject to market conditions and other factors.
F-28
Supplemental Financial Information Quarterly Results (unaudited)
The following represents the Company’s unaudited quarterly results for the years ended December 31, 2017 and 2016. These quarterly results were prepared in accordance with U.S. generally accepted accounting principles and reflect all adjustments that are, in the opinion of management, necessary for a fair presentation of the results.
For the Three Months Ended | |||||||||||||||
March 31, 2017 | June 30, 2017 | Sept. 30, 2017 | Dec. 31, 2017 | ||||||||||||
(in millions, except per share data) | |||||||||||||||
Total revenues | $ | 56.9 | $ | 67.3 | $ | 48.1 | $ | 66.9 | |||||||
Total operating expenses | 54.0 | 56.9 | 57.5 | 63.9 | |||||||||||
Total operating income (loss) | 2.9 | 10.4 | (9.4 | ) | 3.0 | ||||||||||
Interest expense | 0.8 | 0.8 | 0.9 | 4.7 | |||||||||||
Income (loss) before taxes | 2.1 | 9.6 | (10.3 | ) | (1.7 | ) | |||||||||
Provision (benefit) for taxes | 2.9 | 3.3 | (4.4 | ) | 24.5 | ||||||||||
Net income (loss) allocated to common stockholders | $ | (0.8 | ) | $ | 6.3 | $ | (5.9 | ) | $ | (26.2 | ) | ||||
Earnings (loss) per share: | |||||||||||||||
Basic | $ | (0.02 | ) | $ | 0.20 | $ | (0.18 | ) | $ | (0.85 | ) | ||||
Diluted | $ | (0.02 | ) | $ | 0.20 | $ | (0.18 | ) | $ | (0.85 | ) | ||||
Dividends declared per share | $ | 0.45 | $ | 0.45 | $ | 0.45 | $ | 0.05 | |||||||
For the Three Months Ended | |||||||||||||||
March 31, 2016 | June 30, 2016 | Sept. 30, 2016 | Dec. 31, 2016 | ||||||||||||
(in millions, except per share data) | |||||||||||||||
Total revenues | $ | 66.9 | $ | 90.5 | $ | 76.6 | $ | 101.6 | |||||||
Total operating expenses | 59.7 | 59.8 | 56.5 | 68.4 | |||||||||||
Total operating income | 7.2 | 30.7 | 20.1 | 33.2 | |||||||||||
Interest expense | 0.7 | 0.8 | 0.9 | 0.8 | |||||||||||
Income before taxes | 6.5 | 29.9 | 19.2 | 32.4 | |||||||||||
Provision for taxes | 2.1 | 10.2 | 6.1 | 8.7 | |||||||||||
Net income allocated to common stockholders | $ | 4.4 | $ | 19.7 | $ | 13.1 | $ | 23.7 | |||||||
Earnings per share: | |||||||||||||||
Basic | $ | 0.14 | $ | 0.62 | $ | 0.41 | $ | 0.74 | |||||||
Diluted | $ | 0.14 | $ | 0.62 | $ | 0.41 | $ | 0.74 | |||||||
Dividends declared per share | $ | 0.45 | $ | 0.45 | $ | 0.45 | $ | 0.45 | |||||||
F-29
(b) Exhibits
EXHIBIT INDEX
Exhibit Number | Description | |
2.1 | ||
2.2 | ||
3.1 | ||
3.2 | ||
4.1 | ||
10.1 | ||
10.2 | ||
10.3 | ||
10.4 | ||
10.5 | ||
10.6 | ||
10.7 | ||
10.8 | ||
10.9 | ||
10.10 | ||
10.11 | ||
10.12 | ||
10.13 | ||
10.14 | ||
10.15 | ||
E-1
10.16 | ||
21.1* | ||
23.1* | ||
31.1** | ||
31.2** | ||
32.1** | ||
32.2** | ||
101** | Interactive data files pursuant to Rule 405 of Regulation S-T. | |
_____________________________________________
* | Filed herewith. |
** | This information is furnished and not filed herewith for purposes of Sections 11 and 12 of the Securities Act of 1933, as amended, and Section 18 of the Exchange Act |
E-2
SIGNATURES
Pursuant to the requirements of Section 13 or 15(d) of the Securities Exchange Act of 1934, as amended, the Registrant has duly caused this Report to be signed on its behalf by the undersigned, thereunto duly authorized.
Dated: February 28, 2018
GREENHILL & CO., INC. | ||
By: | /s/ SCOTT L. BOK | |
Scott L. Bok | ||
Chief Executive Officer | ||
II-1
Pursuant to the requirements of the Securities Exchange Act of 1934, as amended, this Report has been signed below by the following persons on behalf of the Registrant in the capacities and on the dates indicated.
Signature | Capacity | Date | ||
/s/ ROBERT F. GREENHILL | ||||
Robert F. Greenhill | Chairman and Director | February 28, 2018 | ||
/s/ SCOTT L. BOK | ||||
Scott L. Bok | Chief Executive Officer and Director (Principal Executive Officer) | February 28, 2018 | ||
/s/ HAROLD J. RODRIGUEZ, JR. | ||||
Harold J. Rodriguez, Jr. | Chief Financial Officer and Chief Operating Officer (Principal Financial Officer and Principal Accounting Officer) | February 28, 2018 | ||
/s/ STEVEN F. GOLDSTONE | ||||
Steven F. Goldstone | Director | February 28, 2018 | ||
/s/ STEPHEN L. KEY | ||||
Stephen L. Key | Director | February 28, 2018 | ||
/s/ John D. Liu | ||||
John D. Liu | Director | February 28, 2018 | ||
/s/ KAREN P. ROBARDS | ||||
Karen P. Robards | Director | February 28, 2018 | ||
II-2