Attached files
| file | filename |
|---|---|
| EX-32.2 - EX 32.2 - DJD - Bloomin' Brands, Inc. | blmn-123117_ex322.htm |
| EX-32.1 - EX 32.1 - EAS - Bloomin' Brands, Inc. | blmn-123117_ex321.htm |
| EX-31.2 - EX 31.2 - DJD - Bloomin' Brands, Inc. | blmn-123117_ex312.htm |
| EX-31.1 - EX 31.1 - EAS - Bloomin' Brands, Inc. | blmn-123117_ex311.htm |
| EX-23.1 - EX 23.1 - CONSENT OF PRICEWATERHOUSECOOPERS LLP - Bloomin' Brands, Inc. | blmn-123117_ex231.htm |
| EX-21.1 - EX 21.1 - SUBSIDIARIES OF THE REGISTRANT - Bloomin' Brands, Inc. | blmn-123117_ex211.htm |
| EX-10.40 - EX 10.40 - SEVERANCE AGREEMENT AND GENERAL RELEASE - Bloomin' Brands, Inc. | blmn-123117_ex1040.htm |
| EX-10.39 - EX 10.39 - SEVERANCE AGREEMENT AND GENERAL RELEASE - Bloomin' Brands, Inc. | blmn-123117_ex1039.htm |
| EX-10.38 - EX 10.38 - AMENDED AND RESTATED CREDIT AGREEMENT - Bloomin' Brands, Inc. | blmn-123117_ex1038.htm |
UNITED STATES
SECURITIES AND EXCHANGE COMMISSION
Washington, D.C. 20549
FORM 10-K
(Mark One) | |
[X] | Annual Report Pursuant to Section 13 or 15(d) of the Securities Exchange Act of 1934 |
For the fiscal year ended: December 31, 2017 | |
Or | |
[ ] | Transition Report Pursuant to Section 13 or 15(d) of the Securities Exchange Act of 1934 |
For the transition period from ______ to ______ | |
Commission File Number: 001-35625

BLOOMIN’ BRANDS, INC.
(Exact name of registrant as specified in its charter)
Delaware | 20-8023465 | |||
(State or other jurisdiction of incorporation or organization) | (I.R.S. Employer Identification No.) | |||
2202 North West Shore Boulevard, Suite 500, Tampa, Florida 33607
(Address of principal executive offices) (Zip Code)
(813) 282-1225
(Registrant’s telephone number, including area code)
Securities registered pursuant to Section 12(b) of the Act:
Title of each class | Name of each exchange on which registered | |||
Common Stock, $0.01 par value | The Nasdaq Stock Market LLC (Nasdaq Global Select Market) | |||
Securities registered pursuant to Section 12(g) of the Act: None
Indicate by check mark if the registrant is a well-known seasoned issuer, as defined in Rule 405 of the Securities Act.
YES ý NO o
Indicate by check mark if the registrant is not required to file reports pursuant to Section 13 or Section 15(d) of the Act. YES o NO ý
Indicate by check mark whether the registrant (1) has filed all reports required to be filed by Section 13 or 15(d) of the Securities Exchange Act of 1934 during the preceding 12 months (or for such shorter period that the registrant was required to file such reports), and (2) has been subject to such filing requirements for the past 90 days. YES ý NO o
Indicate by check mark whether the registrant has submitted electronically and posted on its corporate Web site, if any, every Interactive Data File required to be submitted and posted pursuant to Rule 405 of Regulation S-T (§232.405 of this chapter) during the preceding 12 months (or for such shorter period that the registrant was required to submit and post such files).
YES ý NO o
Indicate by check mark if disclosure of delinquent filers pursuant to Item 405 of Regulation S-K (§229.405 of this chapter) is not contained herein, and will not be contained, to the best of registrant’s knowledge, in definitive proxy or information statements incorporated by reference in Part III of this Form 10-K or any amendment to this Form 10-K. o
Indicate by check mark whether the registrant is a large accelerated filer, an accelerated filer, a non-accelerated filer, or a smaller reporting company. See the definitions of “large accelerated filer,” “accelerated filer,” “smaller reporting company” and “emerging growth company” in Rule 12b-2 of the Exchange Act.
Large accelerated filer ý Accelerated filer o Non-accelerated filer o (Do not check if smaller reporting company)
Smaller reporting company o Emerging growth company o
If an emerging growth company, indicate by check mark if the registrant has elected not to use the extended transition period for complying with any new or revised financial accounting standards provided pursuant to Section 13(a) of the Exchange Act. o
Indicate by check mark whether the registrant is a shell company (as defined in Rule 12b-2 of the Act). YES o NO ý
The aggregate market value of common stock held by non-affiliates (based on the closing price on the last business day of the registrant’s most recently completed second fiscal quarter as reported on the Nasdaq Global Select Market) was $1.9 billion.
As of February 23, 2018, 92,581,406 shares of common stock of the registrant were outstanding.
DOCUMENTS INCORPORATED BY REFERENCE
Portions of the registrant’s definitive Proxy Statement for its 2018 Annual Meeting of Stockholders, expected to be held on April 24, 2018, are incorporated by reference into Part III, Items 10-14 of this Annual Report on Form 10-K.
BLOOMIN’ BRANDS, INC.
INDEX TO ANNUAL REPORT ON FORM 10-K
For Fiscal Year 2017
TABLE OF CONTENTS
PAGE NO. | |
PART I | |
PART II | |
PART III | |
PART IV | |
2
BLOOMIN’ BRANDS, INC.
PART I
Cautionary Statement
This Annual Report on Form 10-K (the “Report”) includes statements that express our opinions, expectations, beliefs, plans, objectives, assumptions or projections regarding future events or future results and therefore are, or may be deemed to be, “forward-looking statements” within the meaning of Section 27A of the Securities Act of 1933, as amended, and Section 21E of the Securities Exchange Act of 1934, as amended (the “Exchange Act”). These forward-looking statements can generally be identified by the use of forward-looking terminology, including the terms “believes,” “estimates,” “anticipates,” “expects,” “feels,” “seeks,” “forecasts,” “projects,” “intends,” “plans,” “may,” “will,” “should,” “could” or “would” or, in each case, their negative or other variations or comparable terminology, although not all forward-looking statements are accompanied by such terms. These forward-looking statements include all matters that are not historical facts. They appear in a number of places throughout this Report and include statements regarding our intentions, beliefs or current expectations concerning, among other things, our results of operations, financial condition, liquidity, prospects, growth, strategies and the industry in which we operate.
By their nature, forward-looking statements involve risks and uncertainties because they relate to events and depend on circumstances that may or may not occur in the future. Although we base these forward-looking statements on assumptions that we believe are reasonable when made, we caution you that forward-looking statements are not guarantees of future performance and that our actual results of operations, financial condition and liquidity, and industry developments may differ materially from statements made in or suggested by the forward-looking statements contained in this Report. In addition, even if our results of operations, financial condition and liquidity, and industry developments are consistent with the forward-looking statements contained in this Report, those results or developments may not be indicative of results or developments in subsequent periods. Important factors that could cause actual results to differ materially from statements made or suggested by forward-looking statements include, but are not limited to, those described in the “Risk Factors” section of this Report and the following:
(i) | Consumer reactions to public health and food safety issues; |
(ii) | Our ability to compete in the highly competitive restaurant industry with many well-established competitors and new market entrants; |
(iii) | Minimum wage increases and additional mandated employee benefits; |
(iv) | Economic conditions and their effects on consumer confidence and discretionary spending, consumer traffic, the cost and availability of credit and interest rates; |
(v) | Fluctuations in the price and availability of commodities; |
(vi) | Our ability to effectively respond to changes in patterns of consumer traffic, consumer tastes and dietary habits; |
(vii) | Our ability to comply with governmental laws and regulations, the costs of compliance with such laws and regulations and the effects of changes to applicable laws and regulations, including tax laws and unanticipated liabilities; |
(viii) | Our ability to implement our expansion, remodeling and relocation plans due to uncertainty in locating and acquiring attractive sites on acceptable terms, obtaining required permits and approvals, recruiting and training necessary personnel, obtaining adequate financing and estimating the performance of newly opened, remodeled or relocated restaurants; |
(ix) | Our ability to protect our information technology systems from interruption or security breach, including cyber security threats, and to protect consumer data and personal employee information; |
3
BLOOMIN’ BRANDS, INC.
(x) | The effects of international economic, political and social conditions and legal systems on our foreign operations and on foreign currency exchange rates; |
(xi) | Our ability to preserve and grow the reputation and value of our brands, particularly in light of changes in consumer engagement with social media platforms; |
(xii) | Any impairment in the carrying value of our goodwill or other intangible or long-lived assets and its effect on our financial condition and results of operations; |
(xiii) | Strategic actions, including acquisitions and dispositions, and our success in implementing these initiatives or integrating any acquired or newly created businesses; |
(xiv) | Seasonal and periodic fluctuations in our results and the effects of significant adverse weather conditions and other disasters or unforeseen events; |
(xv) | The effects of our substantial leverage and restrictive covenants in our various credit facilities on our ability to raise additional capital to fund our operations, to make capital expenditures to invest in new or renovate restaurants and to react to changes in the economy or our industry, and our exposure to interest rate risk in connection with our variable-rate debt; and |
(xvi) | The adequacy of our cash flow and earnings and other conditions which may affect our ability to pay dividends and repurchase shares of our common stock. |
In light of these risks and uncertainties, we caution you not to place undue reliance on these forward-looking statements. Any forward-looking statement that we make in this Report speaks only as of the date of such statement, and we undertake no obligation to update any forward-looking statement or to publicly announce the results of any revision to any of those statements to reflect future events or developments. Comparisons of results for current and any prior periods are not intended to express any future trends or indications of future performance, unless specifically expressed as such, and should only be viewed as historical data.
4
BLOOMIN’ BRANDS, INC.
Item 1. Business
General and History - Bloomin’ Brands, Inc. (“Bloomin’ Brands,” the “Company,” “we,” “us,” and “our” and similar terms mean Bloomin’ Brands, Inc. and its subsidiaries except where the context otherwise requires) is one of the largest casual dining restaurant companies in the world, with a portfolio of leading, differentiated restaurant concepts. We have four founder-inspired concepts: Outback Steakhouse, Carrabba’s Italian Grill, Bonefish Grill and Fleming’s Prime Steakhouse & Wine Bar. Our restaurant concepts range in price point and degree of formality from casual (Outback Steakhouse and Carrabba’s Italian Grill) to upscale casual (Bonefish Grill) and fine dining (Fleming’s Prime Steakhouse & Wine Bar).
As of December 31, 2017, we owned and operated 1,199 restaurants and franchised 290 restaurants across 48 states, Puerto Rico, Guam and 19 countries.
The first Outback Steakhouse restaurant opened in 1988 and in 1996, we expanded the Outback Steakhouse concept internationally. OSI Restaurant Partners, LLC (“OSI”), a wholly-owned subsidiary of Bloomin’ Brands, is our primary operating entity.
Financial Information About Segments - We have two reportable segments, U.S. and International, which reflects how we manage our business, review operating performance and allocate resources. The U.S. segment includes all brands operating in the U.S., and brands operating outside the U.S. are included in the International segment. Following is a summary of reporting segments as of December 31, 2017:
SEGMENT (1) | CONCEPT | GEOGRAPHIC LOCATION | ||
U.S. | Outback Steakhouse | United States of America | ||
Carrabba’s Italian Grill | ||||
Bonefish Grill | ||||
Fleming’s Prime Steakhouse & Wine Bar | ||||
International | Outback Steakhouse | Brazil, Hong Kong, China | ||
Carrabba’s Italian Grill (Abbraccio) | Brazil | |||
_________________
(1) | Includes franchise locations. See Item 2 - Properties for disclosure of our restaurant count by state, territory and country. |
Segment information for 2017, 2016 and 2015, which reflects financial information by geographic area, is included in Management’s Discussion and Analysis of Financial Condition and Results of Operations in Part II, Item 7 and Note 20 - Segment Reporting of our Notes to Consolidated Financial Statements in Part II, Item 8.
OUR SEGMENTS
U.S. Segment
As of December 31, 2017, in our U.S. segment, we owned and operated 1,075 restaurants and franchised 165 restaurants across 48 states.
Outback Steakhouse - Outback Steakhouse is a casual steakhouse restaurant concept focused on steaks, signature flavors and Australian decor. The Outback Steakhouse menu offers seasoned and seared or wood-fire grilled steaks, chops, chicken, seafood, pasta, salads and seasonal specials. The menu also includes several specialty appetizers, including our signature Bloomin’ Onion®, and desserts, together with full bar service including Australian wine and beer.
Carrabba’s Italian Grill - Carrabba’s Italian Grill is a casual authentic Italian restaurant concept featuring handcrafted dishes. The Carrabba’s Italian Grill menu includes a variety of Italian pasta, chicken, beef and seafood dishes, small plates, salads and wood-fired pizza. Our ingredients are sourced from around the world and our traditional Italian exhibition kitchen allows customers to watch handmade dishes being prepared.
5
BLOOMIN’ BRANDS, INC.
Bonefish Grill - Bonefish Grill is an upscale casual seafood restaurant concept that specializes in market fresh fish from around the world, wood-grilled specialties and hand-crafted cocktails. In addition, Bonefish Grill offers beef, pork and chicken entrées, as well as several specialty appetizers, including our signature Bang Bang Shrimp®, and desserts.
Fleming’s Prime Steakhouse & Wine Bar - Fleming’s Prime Steakhouse & Wine Bar is a contemporary steakhouse concept featuring prime cuts of beef, chops, fresh fish, seafood and poultry, salads and side dishes. The steak selection features USDA Prime corn-fed beef, both wet- and dry-aged for flavor and texture, in a variety of sizes and cuts. Fleming’s Prime Steakhouse & Wine Bar offers a large selection of domestic and imported wines, with 100 selections available by the glass.
International Segment
We have cross-functional, local management to support and grow restaurants in each of the countries where we have Company-owned operations. Our international operations are integrated with our corporate organization to leverage enterprise-wide capabilities, including marketing, finance, real estate, information technology, legal, human resources, supply chain management and productivity.
As of December 31, 2017, in our International segment, we owned and operated 124 restaurants and franchised 125 restaurants across 19 countries, Puerto Rico and Guam.
Outback Steakhouse - International Outback Steakhouse restaurants have a menu similar to the U.S. menu with additional variety to meet local taste preferences. In addition to the traditional Outback Special sirloin, a typical international menu may feature local beef cuts such as the Aussie Grilled Picanha in Brazil.
Carrabba’s Italian Grill (Abbraccio Cucina Italiana) - Abbraccio Cucina Italiana, our Carrabba’s Italian Grill restaurant concept in Brazil, offers a blend of traditional modern Italian dishes. The menu varies, with additional pasta and pizza menu offerings, to account for local tastes and customs. Abbraccio Cucina Italiana also has a range of beverage options, including classically inspired cocktails and local favorites with an Italian twist.
Restaurant Overview
Selected Sales Data - Following is sales mix by product type and average check per person for Company-owned restaurants during 2017:
U.S. | INTERNATIONAL | ||||||||||||||||||
Outback Steakhouse | Carrabba’s Italian Grill | Bonefish Grill | Fleming’s Prime Steakhouse & Wine Bar | Outback Steakhouse Brazil | |||||||||||||||
Food & non-alcoholic beverage | 90 | % | 85 | % | 78 | % | 74 | % | 84 | % | |||||||||
Alcoholic beverage | 10 | % | 15 | % | 22 | % | 26 | % | 16 | % | |||||||||
100 | % | 100 | % | 100 | % | 100 | % | 100 | % | ||||||||||
Average check per person ($USD) | $ | 23 | $ | 23 | $ | 26 | $ | 80 | $ | 18 | |||||||||
Average check per person (LC) | R$ | 56 | |||||||||||||||||
6
BLOOMIN’ BRANDS, INC.
System-wide Restaurant Summary - Following is a system-wide rollforward of restaurants in operation during 2017:
DECEMBER 25, 2016 | 2017 ACTIVITY | DECEMBER 31, 2017 | U.S. STATE | |||||||||||||
OPENED | CLOSED | OTHER | COUNT | |||||||||||||
Number of restaurants: | ||||||||||||||||
U.S. | ||||||||||||||||
Outback Steakhouse | ||||||||||||||||
Company-owned (1) | 650 | 1 | (13 | ) | (53 | ) | 585 | |||||||||
Franchised (1) | 105 | 1 | (4 | ) | 53 | 155 | ||||||||||
Total | 755 | 2 | (17 | ) | — | 740 | 48 | |||||||||
Carrabba’s Italian Grill | ||||||||||||||||
Company-owned (1) | 242 | — | (16 | ) | (1 | ) | 225 | |||||||||
Franchised (1) | 2 | — | — | 1 | 3 | |||||||||||
Total | 244 | — | (16 | ) | — | 228 | 31 | |||||||||
Bonefish Grill | ||||||||||||||||
Company-owned | 204 | 1 | (11 | ) | — | 194 | ||||||||||
Franchised | 6 | 1 | — | — | 7 | |||||||||||
Total | 210 | 2 | (11 | ) | — | 201 | 33 | |||||||||
Fleming’s Prime Steakhouse & Wine Bar | ||||||||||||||||
Company-owned | 68 | 2 | (1 | ) | — | 69 | 28 | |||||||||
Express | ||||||||||||||||
Company-owned | — | 2 | — | — | 2 | 1 | ||||||||||
U.S. Total | 1,277 | 8 | (45 | ) | — | 1,240 | ||||||||||
International | ||||||||||||||||
Company-owned | ||||||||||||||||
Outback Steakhouse - Brazil (2) | 83 | 4 | — | — | 87 | |||||||||||
Other | 29 | 11 | (3 | ) | — | 37 | ||||||||||
Franchised | ||||||||||||||||
Outback Steakhouse - South Korea | 73 | 5 | (6 | ) | — | 72 | ||||||||||
Other | 54 | 3 | (4 | ) | — | 53 | ||||||||||
International Total | 239 | 23 | (13 | ) | — | 249 | ||||||||||
System-wide total | 1,516 | 31 | (58 | ) | — | 1,489 | ||||||||||
(1) | In April 2017, we sold 53 Outback Steakhouse restaurants and one Carrabba’s Italian Grill restaurant, which are now operated as franchises. See Note 3 - Disposals of our Notes to Consolidated Financial Statements in Part II, Item 8 for additional information. |
(2) | The restaurant counts for Brazil are reported as of November 30, 2017 and 2016, respectively, to correspond with the balance sheet dates of this subsidiary. |
RESTAURANT DESIGN AND DEVELOPMENT
Site Design - We generally construct freestanding buildings on leased properties, although certain leased sites are also located in strip shopping centers. Construction of a new restaurant typically takes 60 to 180 days from the date the location is leased or under contract and fully permitted. In the majority of cases, future restaurant development will result from the lease of existing third-party retail space. We typically design the interior of our restaurants in-house, utilizing outside architects when necessary. We have an ongoing remodel program across all of our concepts to maintain the relevance of our restaurants’ ambiance. During 2017, we remodeled 145 Outback Steakhouse restaurants.
Site Selection Process - We have a central site selection team comprised of real estate development, property/lease management and design and construction personnel. This site selection team also utilizes a combination of existing field operations managers, internal development personnel and outside real estate brokers to identify and qualify potential sites.
7
BLOOMIN’ BRANDS, INC.
We have a relocation initiative in process, primarily related to the U.S. Outback Steakhouse brand. This multi-year relocation plan is focused on driving additional traffic to our restaurants by moving legacy restaurants from non-prime to prime locations within the same trade area. During 2017, we relocated 18 U.S. Outback Steakhouse restaurants.
Restaurant Development
We utilize the ownership structure and market entry strategy that best fits the needs for a particular market, including Company-owned units, joint ventures and franchises, as determined by demand, cost structure and economic conditions.
International Development - We continue to pursue international expansion opportunities, leveraging established equity and franchise markets in South America and Asia, and in strategically selected emerging and high-growth developed markets, with a focus on Brazil.
See Item 2 - Properties for disclosure of our international restaurant count by country.
U.S. Development - We plan to opportunistically pursue unit growth across our concepts through existing geography fill-in and market expansion opportunities based on current location mix.
During 2017, we opened our first Express units, which combine Outback Steakhouse and Carrabba’s Italian Grill offerings in a delivery and take-out only format. We will utilize this smaller footprint concept to expand our reach into both new trade areas and fill-in opportunities in existing trade areas where we believe that the off-premise dining occasion has the largest potential.
RESEARCH & DEVELOPMENT / INNOVATION
We utilize a global core menu policy to ensure consistency and quality in our menu offerings. Before we add an item to the core menu, our research and development (“R&D”) team performs a thorough review of the item, including conducting consumer research. Internationally, we have teams in our developed markets that tailor our menus to address the preferences of local consumers.
We continuously evolve our product offerings based on consumer trends and feedback. We have a 12-month pipeline of new menu and promotional items across all concepts that allows us to quickly make adjustments in response to market demands, when necessary. In addition, we continue to focus on productivity across the portfolio. For new menu items and significant product changes, we have a testing process that includes direct consumer feedback on the product and its pricing.
Menu innovation and enhancement remains a high priority across all concepts. During the last two years, we introduced a new center-cut sirloin, increased certain portion sizes and simplified the menu at Outback Steakhouse. We also reduced menu complexity to refocus efforts on fresh seafood at Bonefish Grill and introduced new specialty items to our menu at Carrabba’s Italian Grill.
INFORMATION SYSTEMS
The Company leverages technology to support customer engagement, labor and food productivity initiatives and restaurant operations.
To drive customer engagement, the Company continues to invest in technology infrastructure, including brand websites, online ordering and mobile apps. To increase customer convenience, we are leveraging our existing online ordering infrastructure to facilitate expanded off-premise dining. Additionally, we developed systems to support our new customer loyalty program with a focus of increasing traffic to our restaurants. Investments are also being made in a global supply chain management system to provide better inventory forecasting and replenishment to our restaurants, which will help manage food quality and specifications. We also continue to invest in a range of tools and infrastructure to support risk management and cyber security.
8
BLOOMIN’ BRANDS, INC.
Our integrated point-of-sale (“POS”) system allows us to transact business in our restaurants and communicate sales data through a secure corporate network to our enterprise resource planning system and data warehouse. Our Company-owned restaurants, and most of our franchised restaurants, are connected through a portal that provides our Company employees and franchise partners with access to business information and tools that allow them to collaborate, communicate, train and share information.
ADVERTISING AND MARKETING
We generally advertise through national and spot television and radio media. Our concepts have an active public relations program and also rely on national promotions, site visibility, local marketing, digital marketing, direct mail, billboards and point-of-sale materials to promote our restaurants. Recently, we increased our focus on data segmentation and personalization, customer relationship management and digital advertising to be more efficient with our advertising expenditures. Internationally, we have teams in our developed markets that engage local agencies to tailor advertising to each market and develop relevant and timely promotions based on local consumer demand.
We utilize a multi-branded loyalty program, called Dine Rewards, to drive incremental traffic. Additionally, to help maintain consumer interest and relevance, each concept leverages limited-time offers featuring seasonal specials. We promote limited-time offers through integrated marketing programs that utilize all of our advertising resources.
RESTAURANT OPERATIONS
Management and Employees - The restaurant management staff varies by concept and restaurant size. Our restaurants employ primarily hourly employees, many of whom work part-time. The Restaurant Managing Partner has primary responsibility for the day-to-day operation of the restaurant and is required to follow Company-established operating standards. Area Operating Partners are responsible for overseeing the operations of typically six to 12 restaurants and Restaurant Managing Partners in a specific region.
Area Operating Partner, Restaurant Managing Partner and Chef Partner Programs - In addition to salary, Area Operating Partners, Restaurant Managing Partners and Chef Partners generally receive performance-based bonuses for providing management and supervisory services to their restaurants, certain of which may be based on a percentage of their restaurants’ monthly operating results or cash flows and/or total controllable income (“Monthly Payments”).
Restaurant Managing Partners and Chef Partners in the U.S. are eligible to participate in deferred compensation programs and are eligible to receive payments upon completion of their five-year employment agreement. To fund deferred compensation arrangements, we may invest in corporate-owned life insurance policies, which are held within an irrevocable grantor or “rabbi” trust account for settlement of certain of our obligations under the deferred compensation plans. Also, on the fifth anniversary of the opening of each new U.S. Company-owned restaurant, the Area Operating Partner supervising the restaurant during the first five years of operation receives an additional performance-based bonus.
Many of our International Restaurant Managing Partners are given the option to purchase participation interests in the cash distributions of the restaurants they manage. The amount, terms and availability vary by country.
Supervision and Training - We require our Area Operating Partners and Restaurant Managing Partners to have significant experience in the full-service restaurant industry. All Area Operating Partners and Restaurant Managing Partners are required to complete a comprehensive training program that emphasizes our operating strategy, procedures and standards. The Restaurant Managing Partners and Area Operating Partners, together with our Presidents, Regional Vice Presidents, Vice Presidents of Training and Directors of Training, are responsible for selecting and training the employees for each new restaurant.
9
BLOOMIN’ BRANDS, INC.
Service - In order to better assess and improve our performance, we use a third-party research firm to conduct an ongoing satisfaction measurement program that provides us with industry benchmarking information for our Company-owned and franchise locations in the U.S. We have a similar consumer satisfaction measurement program for our international Company-owned and certain international franchise locations and we obtain industry benchmarking information for the international markets in which we operate, when available. These programs measure satisfaction across a wide range of experience elements.
SOURCING AND SUPPLY
Sourcing and Supply - We take a global approach to procurement and supply chain management, with our corporate team serving all U.S. and international concepts. In addition, we have dedicated supply chain management personnel for our international operations in South America and Asia. The supply chain management organization is responsible for all food and operating supply purchases as well as a large percentage of purchases of field and corporate services.
We address the end-to-end costs associated with the products and goods we purchase by utilizing a combination of global, regional and local suppliers to capture efficiencies and economies of scale. This “total cost of ownership” (“TCO”) approach focuses on the initial purchase price, coupled with the cost structure underlying the procurement and order fulfillment process. The TCO approach includes monitoring commodity markets and trends to execute product purchases at the most advantageous times.
We have a distribution program that includes food, beverage, smallwares and packaging goods in all major markets. This program is managed by a custom distribution company that only provides products approved for our system. This customized relationship also enables our staff to effectively manage and prioritize our supply chain.
Beef represents the majority of purchased proteins and of our overall global commodity procurement. In 2017, we primarily purchased our U.S. beef raw materials from four beef suppliers and our Brazil beef raw materials from one beef supplier. Due to the nature of our industry, we expect to continue purchasing a substantial amount of our beef from a small number of suppliers. Other major commodity categories purchased include produce, dairy, bread and pasta, and energy sources to operate our restaurants, such as natural gas and electricity.
Quality Control - Our R&D facility is located in Tampa, Florida and serves as a global test kitchen and vendor product qualification site. Our quality assurance team manages internal auditors responsible for supplier evaluations and external third parties who inspect supplier adherence to quality, food safety and product specification. Our suppliers also utilize third-party labs for food safety and quality verification. We have a program that ensures suppliers comply with quality, food safety and other specifications. We develop sourcing strategies for all commodity categories based on the dynamics of each category. In addition, we require our supplier partners to meet or exceed our quality assurance standards.
Our operational teams have multiple touch points in the restaurants ensuring food safety, quality and freshness throughout all phases of the preparation process. In addition, we employ third-party auditors to verify our standards of food safety, training and sanitation.
RESTAURANT OWNERSHIP STRUCTURES
Our restaurants are Company-owned or operated under franchise arrangements. We generate our revenues from our Company-owned restaurants and through ongoing royalties from our franchised restaurants and sales of franchise rights.
Company-owned Restaurants - Company-owned restaurants are wholly-owned by us or in which we have a majority ownership. Our cash flows from entities in which we have a majority ownership are limited to the portion of our ownership. The results of operations of Company-owned restaurants are included in our consolidated operating results and the portion of income or loss attributable to the noncontrolling interests is eliminated in our Consolidated Statements of Operations and Comprehensive Income.
10
BLOOMIN’ BRANDS, INC.
We pay royalties that range from 0.5% to 1.5% of U.S. sales on the majority of our Carrabba’s Italian Grill restaurants, pursuant to agreements we entered into with the Carrabba’s Italian Grill founders (“Carrabba’s Founders”).
Each Carrabba’s restaurant located outside the United States pays a one-time lump sum fee to the Carrabba’s Founders, which varies depending on the size of the restaurant. No continuing royalty fee is paid to the Carrabba’s Founders for Carrabba’s restaurants located outside the United States.
Unaffiliated Franchise Program - Our unaffiliated franchise agreements grant third parties rights to establish and operate a restaurant using one of our concepts. Franchised restaurants are required to be operated in accordance with the franchise agreement and in compliance with their respective concept’s standards and specifications.
Under our franchise agreements, each of our franchisees is required to pay an initial franchise fee and pay monthly royalties based on a percentage of gross restaurant sales. Initial franchise fees are $40,000 for U.S. franchisees and range between $40,000 and $75,000 for international franchisees, depending on the market. Some franchisees may also pay administration fees based on a percentage of gross restaurant sales. Following is a summary of royalty fee percentages based on our current existing unaffiliated franchise agreements:
(as a % of gross Restaurant sales) | MONTHLY ROYALTY FEE PERCENTAGE |
U.S. franchisees (1) | 3.50% - 5.75% |
International franchisees (2) | 3.00% - 6.00% |
_________________
(1) | U.S. franchisees must also contribute a percentage of gross sales for national marketing programs and also spend a certain percentage of gross sales on local advertising. For U.S. franchisees, there is a maximum of 8.0% of gross restaurant sales for combined national marketing and local advertising. |
(2) | International franchisees must also spend a certain percentage of gross sales on local advertising, which varies depending on the market. |
COMPETITION
The restaurant industry is highly competitive with a substantial number of restaurant operators that compete directly and indirectly with us in respect to price, service, location and food quality, and there are other well-established competitors with significant financial and other resources. There is also active competition for management personnel, attractive suitable real estate sites, supplies and restaurant employees. In addition, competition is also influenced strongly by marketing and brand reputation. At an aggregate level, all major U.S. casual dining restaurants and casual dining restaurants in the international markets in which we operate would be considered competitors of our concepts. Further, we face growing competition from the supermarket industry and home delivery services, with improved selections of prepared meals, and from quick service and fast casual restaurants, as a result of higher-quality food and beverage offerings. Internationally, we face increasing competition due to an increase in the number of casual dining restaurant options in the markets in which we operate.
GOVERNMENT REGULATION
We are subject to various federal, state, local and international laws affecting our business. Each of our restaurants is subject to licensing and regulation by a number of governmental authorities, which may include, among others, alcoholic beverage control, health and safety, nutritional menu labeling, health care, environmental and fire agencies in the state, municipality or country in which the restaurant is located.
U.S. - Alcoholic beverage sales represent 14% of our U.S. restaurant sales. Alcoholic beverage control regulations require each of our restaurants to apply to a state authority and, in certain locations, county or municipal authorities for a license or permit to sell alcoholic beverages on the premises and to provide service for extended hours and on Sundays.
11
BLOOMIN’ BRANDS, INC.
Our restaurant operations are also subject to federal and state laws for such matters as:
• | immigration, employment, minimum wages, overtime, tip credits, worker conditions and health care; |
• | nutritional labeling, nutritional content, menu labeling and food safety; |
• | the Americans with Disabilities Act, which, among other things, requires our restaurants to meet federally mandated requirements for the disabled; and |
• | information security, privacy, cashless payments, gift cards and consumer credit, protection and fraud. |
International - Our restaurants outside of the United States are subject to similar local laws and regulations as our U.S. restaurants, including labor, food safety and information security. In addition, we are subject to anti-bribery and anti-corruption laws and regulations.
See Item 1A - Risk Factors for a discussion of risks relating to federal, state, local and international regulation of our business.
EXECUTIVE OFFICERS OF THE REGISTRANT
Below is a list of the names, ages, positions and a brief description of the business experience of each of our executive officers as of February 23, 2018.
NAME | AGE | POSITION | ||
Elizabeth A. Smith | 54 | Chairman of the Board of Directors and Chief Executive Officer | ||
David J. Deno | 60 | Executive Vice President and Chief Financial and Administrative Officer | ||
Donagh M. Herlihy | 54 | Executive Vice President and Chief Technology Officer | ||
Joseph J. Kadow | 61 | Executive Vice President and Chief Legal Officer | ||
Michael Kappitt | 48 | Executive Vice President and President of Carrabba’s Italian Grill | ||
Gregg Scarlett | 56 | Executive Vice President and President of Outback Steakhouse | ||
David P. Schmidt | 47 | Executive Vice President and President of Bonefish Grill | ||
Sukhdev Singh | 54 | Executive Vice President and Global Chief Development and Franchising Officer | ||
Elizabeth A. Smith was appointed Chairman in January 2012. Since November 2009, Ms. Smith has served as Chief Executive Officer and as a member of our Board of Directors. Ms. Smith is a member of the Board of Directors of Hilton Worldwide Holdings, Inc. and was previously a member of the Board of Directors of Staples, Inc. from September 2008 to June 2014.
David J. Deno has served as Executive Vice President and Chief Financial and Administrative Officer since May 2012. From December 2009 to May 2012, Mr. Deno served as Chief Financial Officer of the international division of Best Buy Co. Inc. Mr. Deno previously served as President and later Chief Executive Officer of Quiznos and Chief Financial Officer and later Chief Operating Officer of YUM! Brands, Inc.
Donagh M. Herlihy has served as Executive Vice President and Chief Technology Officer since September 2014. Prior to joining Bloomin’ Brands, Mr. Herlihy was Senior Vice President, Chief Information Officer and eCommerce of Avon Products, Inc. from March 2008 to August 2014.
Joseph J. Kadow has served as Executive Vice President and Chief Legal Officer since April 2005. Mr. Kadow has served as Assistant Secretary since February 2016 and previously served as Secretary from April 1994 to February 2016.
12
BLOOMIN’ BRANDS, INC.
Michael Kappitt has served as Executive Vice President and President of Carrabba’s Italian Grill since February 2016. Mr. Kappitt served as Senior Vice President and Chief Marketing Officer from January 2014 to February 2016 and Chief Marketing Officer of Outback Steakhouse from March 2011 to December 2013.
Gregg Scarlett has served as Executive Vice President and President of Outback Steakhouse since July 2016. Mr. Scarlett previously served as Executive Vice President and President of Bonefish Grill from March 2015 to July 2016; Senior Vice President, Casual Dining Restaurant Operations from January 2013 to March 2015; and Senior Vice President of Operations for Outback Steakhouse from March 2010 to January 2013.
David P. Schmidt has served as Executive Vice President and President of Bonefish Grill since July 2016. Mr. Schmidt previously served as Group Vice President of Finance from April 2016 to July 2016; Vice President of Finance for Bonefish Grill from August 2015 to April 2016; Vice President of Productivity from November 2011 to August 2015 and Vice President of Corporate Finance from April 2010 to November 2011 for Bloomin’ Brands.
Sukhdev Singh has served as Executive Vice President and Global Chief Development and Franchising Officer since May 2015. Mr. Singh previously served as Senior Vice President, Chief Development Officer from January 2014 to May 2015. Prior to joining Bloomin’ Brands, Mr. Singh was Chief Development Officer for Darden Restaurants, Inc. from July 2006 to January 2014.
EMPLOYEES
As of December 31, 2017, we employed approximately 94,000 persons, of which approximately 850 are corporate personnel, including 200 in international markets. None of our U.S. employees are covered by a collective bargaining agreement. Various national industry-wide labor agreements apply to certain of our employees in Brazil. We consider our employee relations to be in good standing.
TRADEMARKS
We regard our Outback®, Outback Steakhouse®, Carrabba’s Italian Grill®, Bonefish Grill®, and Fleming’s Prime Steakhouse & Wine Bar® service marks and our Bloomin’ Onion® trademark as having significant value and as being important factors in the marketing of our restaurants. We have also obtained trademarks for several of our other menu items and for various advertising slogans. We are aware of names and marks similar to the service marks of ours used by other persons in certain geographic areas in which we have restaurants. However, we believe such uses will not adversely affect us. Our policy is to pursue registration of our marks whenever possible and to oppose vigorously any infringement of our marks.
We license the use of our registered trademarks to franchisees and third parties through franchise arrangements and licenses. The franchise and license arrangements restrict franchisees’ and licensees’ activities with respect to the use of our trademarks, and impose quality control standards in connection with goods and services offered in connection with the trademarks.
SEASONALITY AND QUARTERLY RESULTS
Our business is subject to seasonal fluctuations. Historically, customer traffic patterns for our established U.S. restaurants are generally highest in the first quarter of the year and lowest in the third quarter of the year. International customer traffic patterns vary by market. For example, Brazil historically experiences minimal seasonal traffic fluctuations. Additionally, holidays and severe weather may affect sales volumes seasonally in some of our markets.
Quarterly results have been and will continue to be significantly affected by general economic conditions, the timing of new restaurant openings and their associated pre-opening costs, restaurant closures and exit-related costs and impairments of goodwill, definite and indefinite-lived intangible assets and property, fixtures and equipment. As a result of these and other factors, our financial results for any given quarter may not be indicative of the results that may be achieved for a full year.
13
BLOOMIN’ BRANDS, INC.
ADDITIONAL INFORMATION
We make available, free of charge, through our internet website www.bloominbrands.com, our Annual Report on Form 10-K, Quarterly Reports on Form 10-Q, Current Reports on Form 8-K, Proxy Statements and amendments to those reports filed or furnished pursuant to Section 13(a) or 15(d) of the Securities Exchange Act of 1934, as amended, as soon as reasonably practicable after electronically filing such material with the Securities and Exchange Commission (“SEC”). You may read and copy any materials filed with the SEC at the Securities and Exchange Commission’s Public Reference Room at 100 F Street, NE, Washington, DC 20549. You may obtain information on the operation of the Public Reference Room by calling the SEC at 1-800-SEC-0330. Our reports and other materials filed with the SEC are also available at www.sec.gov. The reference to these website addresses does not constitute incorporation by reference of the information contained on the websites and should not be considered part of this Report.
14
BLOOMIN’ BRANDS, INC.
Item 1A. Risk Factors
The risk factors set forth below should be carefully considered. The risks described below are those that we believe could materially and adversely affect our business, financial condition or results of operations, however, they are not the only risks facing us. Additional risks and uncertainties not currently known to us or those we currently view to be immaterial may also materially and adversely affect our business, financial condition or results of operations.
Risks Related to Our Business and Industry
Food safety and food-borne illness concerns in our restaurants or throughout the industry or supply chain may have an adverse effect on our business by reducing demand and increasing costs.
Regardless of the source or cause, any report of food-borne illnesses and other food safety issues, whether at one of our restaurants or in the industry or supply chain generally, could have a negative impact on our traffic and sales and adversely affect the reputation of our brands. Food safety issues could be caused by suppliers or distributors and, as a result, be out of our control. Health concerns or outbreaks of disease in a food product could also reduce demand for particular menu offerings. Even instances of food-borne illness, food tampering or food contamination occurring solely at restaurants of other companies could result in negative publicity about the food service industry generally and adversely impact our sales. Social media has dramatically increased the rate at which negative publicity, including as it relates to food-borne illnesses, can be disseminated before there is any meaningful opportunity to respond or address an issue. The occurrence of food-borne illnesses or food safety issues could also adversely affect the price and availability of affected ingredients, resulting in higher costs and lower margins.
The restaurant industry is highly competitive and consumer options for other prepared food offerings continue to expand. Our inability to compete effectively could adversely affect our business, financial condition and results of operations.
A substantial number of restaurant operators compete directly and indirectly with us with respect to price, service, location and food quality, some of which are well-established with significant resources. There is also active competition for management and other personnel, and attractive suitable real estate sites. Consumer tastes, nutritional and dietary trends, traffic patterns and the type, number and location of competing restaurants often affect the restaurant business, and our competitors may react more efficiently, creatively and effectively to those conditions. In addition, our competitors may generate or better implement business strategies that improve the value and relevance of their brands and reputation, relative to ours. For example, our competitors may more successfully implement menu or technology initiatives, such as remote ordering, social media or mobile technology platforms that expedite or enhance the customer experience. Further, we face growing competition from quick service and fast casual restaurants, the supermarket industry and meal kit and food delivery providers, with the improvement of prepared food offerings and the trend towards convergence in grocery, deli, retail and restaurant services. We believe all of the above factors have increased competitive pressures in the casual dining sector in recent periods and we believe they will continue to present a challenging competitive environment in future periods. If we are unable to continue to compete effectively, our traffic, sales and margins could decline and our business, financial condition and results of operations would be adversely affected.
We are subject to various federal and state employment and labor laws and regulations.
Various federal and state employment and labor laws and regulations govern our relationships with our employees and affect operating costs, and similar laws and regulations apply to our operations outside of the U.S. These laws and regulations relate to matters including employment discrimination, minimum wage requirements, overtime, tip credits, unemployment tax rates, workers’ compensation rates, working conditions, immigration status, tax reporting and other wage and benefit requirements. Any significant additional government regulations and new laws governing our relationships with employees, including minimum wage increases, mandated benefits or other requirements that impose additional obligations on us, could increase our costs and adversely affect our business and results of operations.
15
BLOOMIN’ BRANDS, INC.
As a significant number of our food service and preparation personnel are paid at rates related to the applicable minimum wage, federal, state and local proposals related to minimum wage requirements or similar matters could, to the extent implemented, materially increase our labor and other costs. Several states in which we operate have recently approved minimum wage increases. As minimum wage increases are implemented in these states or any other states in which we operate in the future, we expect our labor costs will continue to increase. Our ability to respond to minimum wage increases by increasing menu prices depends on the responses of our competitors and consumers. Our distributors and suppliers could also be affected by higher minimum wage, benefit standards and compliance costs, which could result in higher costs for goods and services supplied to us.
We rely on our employees to accurately disclose the full amount of their tip income, and we base our FICA tax reporting on the disclosures provided to us by such tipped employees. Inaccurate employee FICA tax reporting could subject us to monetary liabilities, which could harm our business, results of operations and financial condition. In 2015, the IRS issued tax adjustments related to cash tips received and unreported by our employees during prior years.
Challenging economic conditions may have a negative effect on our business and financial results.
Challenging economic conditions may negatively impact consumer spending and thus cause a decline in our financial results. For example, international, domestic and regional economic conditions, consumer income levels, financial market volatility, social unrest, governmental, political and budget matters and a slow or stagnant pace of economic growth generally may have a negative effect on consumer confidence and discretionary spending, which the restaurant industry depends upon. In recent years, we believe these factors and conditions may have affected consumer traffic and comparable restaurant sales for us and throughout our industry and may continue to contribute to a challenging sales environment in the casual dining sector. A decline in economic conditions or negative developments with respect to any of the other factors mentioned above, generally or in particular markets in which we operate, and our consumers’ reactions to these trends could result in increased pressure with respect to our pricing, traffic levels, commodity and other costs and the continuation of our innovation and productivity initiatives, which could negatively impact our business and results of operations. These factors could also cause us to, among other things, reduce the number and frequency of new restaurant openings, close restaurants or delay remodeling of our existing restaurant locations. Further, poor economic conditions may force nearby businesses to shut down, which could cause our restaurant locations to be less attractive.
Increased commodity, energy and other costs could decrease our profit margins or cause us to limit or otherwise modify our menus or increase prices, which could adversely affect our business.
The performance of our restaurants depends on our ability to anticipate and react to changes in the price and availability of food commodities. Our business also incurs significant costs for energy, insurance, labor, marketing and real estate. Prices may be affected due to supply, market changes, increased competition, the general risk of inflation, changes in laws, shortages or interruptions in supply due to weather, disease or other conditions beyond our control, or other reasons. Increased prices or shortages could affect the cost and quality of the items we buy or require us to raise prices, limit our menu options or implement alternative processes or products. As result, these events, combined with other more general economic and demographic conditions, could impact our pricing and negatively affect our sales and profit margins.
Our failure to comply with government regulation related to our restaurant operations, and the costs of compliance or non-compliance, could adversely affect our business.
We are subject to various federal, state, local and foreign laws affecting our business. Each of our restaurants is subject to licensing and regulation by a number of governmental authorities, which may include, among others, alcoholic beverage control, food safety, nutritional menu labeling, health care, environmental and fire agencies in the state, municipality or country in which the restaurant is located. Our suppliers are also subject to regulation in some of these areas. Any difficulties or inabilities to retain or renew licenses, or increased compliance costs due to changed regulations, could adversely affect operations at existing restaurants. Additionally, difficulties in obtaining or failing to obtain the required licenses or approvals could delay or prevent the development of new restaurants.
16
BLOOMIN’ BRANDS, INC.
Alcoholic beverage sales represent 14% of our consolidated restaurant sales and are subject to extensive state and local licensing and other regulations. The failure of a restaurant to obtain or retain a liquor license would adversely affect that restaurant’s operations. In addition, we are subject to “dram shop” statutes in certain states. These statutes generally provide a person injured by an intoxicated person the right to recover damages from an establishment that wrongfully served alcoholic beverages to the intoxicated person.
The FDA adopted final regulations to implement federal nutritional disclosure requirements in 2014, and, although implementation has been delayed, we expect we will be required to comply with these regulations in 2018. The regulations will require us to include calorie information on our menus, and provide additional nutritional information upon request. If the costs of implementing or complying with these new requirements exceed our expectations, our results of operations could be adversely affected. Furthermore, the effect of such labeling requirements on consumer choices, if any, is unclear. It is possible that we may also become subject to other regulation in the future seeking to tax or regulate high fat and high sodium foods in certain of our markets. Compliance with these regulations could be costly.
The food service industry is affected by consumer preferences and perceptions. Changes in these preferences and perceptions may lessen the demand for our products, which would reduce sales and harm our business.
Food service businesses are affected by changes in consumer tastes and demographic trends. For instance, if prevailing health or dietary preferences cause consumers to avoid steak and other products we offer in any of our concepts in favor of foods or ingredients that are perceived as healthier or otherwise reflect popular demand, our business and operating results would be harmed. If we are unable to anticipate or successfully respond to changes in consumer preferences, our results of operations could be adversely affected, generally or in particular concepts or markets.
Changes in tax laws and unanticipated tax liabilities could adversely affect the taxes we pay and our profitability.
We are subject to income and other taxes in the United States and numerous foreign jurisdictions. Our effective income tax rate in the future could be adversely affected by a number of factors, including changes in the mix of earnings in countries with different statutory tax rates, changes in the valuation of deferred tax assets and liabilities, changes in tax laws or other legislative changes, including the Tax Cuts and Jobs Act (the “Tax Act”) and the Base Erosion Profit Shifting initiative being conducted by the Organization for Economic Co-operation and Development, the outcome of income tax audits, and any repatriation of non-U.S. earnings for which we have not previously provided for U.S. taxes. Although we believe our tax estimates are reasonable, the final determination of tax audits could be materially different from our historical income tax provisions and accruals. The results of a tax audit could have a material effect on our results of operations or cash flows in the period or periods for which that determination is made. In addition, our effective income tax rate and our results may be impacted by our ability to realize deferred tax benefits and by any increases or decreases of our valuation allowances applied to our existing deferred tax assets.
The Tax Act is expected to have a favorable impact on the Company’s effective tax rate and net income as reported under generally accepted accounting principles both in the first fiscal quarter of 2018 and subsequent reporting periods to which the Tax Act is effective. However, the Company is assessing the impact of the Tax Act and there can be no assurances that it will have the expected impact.
17
BLOOMIN’ BRANDS, INC.
Risks associated with our expansion, remodeling and relocation plans may have adverse effects on our operating results.
As part of our business strategy, we intend to continue to expand our current portfolio of restaurants. Our current development schedule calls for the construction of approximately 20 new system-wide locations in 2018. A variety of factors could cause the actual results and outcome of those expansion plans to differ from the anticipated results, including among other things:
• | the availability of attractive sites for new restaurants; |
• | acquiring or leasing those sites at acceptable prices and other terms; |
• | funding or financing our development; |
• | obtaining all required permits, approvals and licenses on a timely basis; |
• | recruiting and training skilled management and restaurant employees and retaining those employees on acceptable terms; |
• | weather, natural disasters and other events or factors beyond our control resulting in construction or other delays; and |
• | consumer tastes in new geographic regions and acceptance of our restaurant concepts and awareness of our brands in those regions. |
It is difficult to estimate the performance of newly opened restaurants. Earnings achieved to date by restaurants open for less than two years may not be indicative of future operating results. If new restaurants do not meet targeted performance, it could have a material adverse effect on our operating results, including as a result of any impairment losses that we may be required to recognize. There is also the possibility that new restaurants may attract consumers away from other restaurants we own, thereby reducing the revenues of those existing restaurants, or that we will incur unrecoverable costs in the event a development project is abandoned prior to completion.
Some of the challenges described above could be more significant in international markets in which we have more limited experience, either generally or with a particular brand. Those markets are likely to have different competitive conditions, consumer tastes, discretionary spending patterns and brand awareness, which may cause our new restaurants to be less successful than restaurants in our existing markets or make it more difficult to estimate the performance of new restaurants.
In addition, in an effort to increase same-restaurant sales and improve our operating performance, we continue to make improvements to our facilities through our remodeling and relocation programs. We also close underperforming restaurants from time to time in order to improve the performance of our brands. As demographic and economic patterns change or there are declines in neighborhoods where our restaurants are located or adverse economic conditions in local areas, current locations may not continue to be attractive or profitable. Because we lease a significant majority of our restaurants, we incur significant lease termination expenses when we close or relocate a restaurant and are often obligated to continue rent and other lease related payments after restaurant closure. We also incur significant asset impairment and other charges in connection with closures and relocations. If the expenses associated with remodels, relocations or closures are higher than anticipated, we cannot find suitable locations or remodeled or relocated restaurants do not perform as expected, these programs may not yield the desired return on investment, which could have a negative effect on our operating results.
Cyber security breaches of confidential consumer, personal employee and other material information may adversely affect our business.
A cyber incident is considered to be any adverse event that threatens the confidentiality, integrity or availability of our information resources. More specifically, a cyber incident is an intentional attack or an unintentional event that can include gaining unauthorized access to systems to disrupt operations, corrupt data or the theft or exposure of confidential information or intellectual property. A cyber incident that compromises the information of our consumers or employees could result in widespread negative publicity, damage to the reputation of our brands, a loss of consumers, an interruption of our business and legal liabilities.
18
BLOOMIN’ BRANDS, INC.
The majority of our restaurant sales are by credit or debit cards. We also maintain certain personal information regarding our employees and confidential information about our customers, franchisees and suppliers. We segment our card data environment and employ a cybersecurity protection program, which is based upon proven industry frameworks. This program includes but is not limited to cybersecurity techniques, tactics and procedures including the deployment of a robust set of security controls, continuous monitoring and detection programs, network protections, stringent vendor selection criteria, secure software development programs and ongoing employee training, awareness and incident response preparedness. In addition, we continuously scan and improve our environment for any vulnerabilities, perform penetration testing and engage third parties to assure effectiveness of our security measures. However, there are no assurances that such programs will prevent or detect cyber security breaches.
Despite our security measures, our technology systems may be vulnerable to damage, disability or failures due to physical theft, fire, power loss, telecommunications failure or other catastrophic events, as well as from internal and external security breaches, employee error or malfeasance, denial of service attacks, viruses, worms and other disruptive problems. From time to time we have been, and likely will continue to be, the target of attempted cyber and other security threats. In recent years our reliance on technology has increased, and consequently so have the scope and severity of risks posed to our systems from cyber threats. Malicious attacks and intrusion efforts are continuous and evolving, and are perpetuated by many different parties with varying motives, including identity thieves, contractors, vendors, employees, competitors, prospective insider traders, so-called “hacktivists,” terrorists and others. We continuously monitor and develop our information technology networks and infrastructure to prevent, detect, address and mitigate the risk of unauthorized access, misuse, computer viruses and other events that could have a security impact.
Our operations and corporate functions rely heavily on information systems, including point-of-sale processing in our restaurants, management of our supply chain, payment of obligations, collection of cash, data warehousing to support analytics, finance and accounting systems, mobile technologies to enhance the customer experience and other various processes and procedures, some of which are handled by third parties. Our ability to efficiently and effectively manage our business depends significantly on the reliability and capacity of these systems. The failure of these systems to operate effectively, system maintenance problems, upgrading or transitioning to new platforms, or any cyber incident relating to these systems could expose our systems or information to cyber threats, result in delays in consumer service, reduced efficiency in our operations or result in negative publicity. For example, a weakness in vendor’s systems or software products may provide a mechanism for a cyber threat. In recent years, certain retailers have experienced security breaches in which customer information was stolen through vendor access channels. While we select our third-party suppliers carefully, cyber attacks and security breaches at a supplier could compromise confidential information or adversely affect our ability to deliver products and services to our customers. These problems could negatively affect our results of operations, and remediation could result in significant, unplanned capital investments.
As a merchant and service provider of point-of-sale related services, we are subject to the Payment Card Industry Data Security Standard (“PCI DSS”), issued by the Payment Card Industry Council. PCI DSS contains compliance guidelines and standards with regard to our security surrounding the physical and electronic storage, processing and transmission of individual cardholder data. Despite our information security measures and our efforts to comply with PCI DSS guidelines, we cannot be certain that all of our information technology systems are able to prevent, contain or detect any cyber incidents from known malware or malware that may be developed in the future.
We may in the future become subject to lawsuits or other proceedings for purportedly fraudulent transactions arising out of the actual or alleged theft of our consumers’ credit or debit card information or if consumer or employee information is obtained by unauthorized persons or used inappropriately. Any such claim or proceeding, or any adverse publicity resulting from such an event, may have a material adverse effect on our business and the potential of incurring significant remediation costs.
19
BLOOMIN’ BRANDS, INC.
We face a variety of risks associated with doing business in foreign markets that could have a negative impact on our financial performance.
We have a significant number of restaurants outside the United States, and we intend to continue our efforts to grow internationally. There is no assurance that international operations will be profitable or international growth will continue. In addition, if we have a significant concentration of restaurants in a foreign market the impact of any negative local conditions can have a sizable impact on our results.
Our foreign operations are subject to all of the same risks as our U.S. restaurants, as well as additional risks including, among others, international economic, political, social and legal conditions and the possibility of instability and unrest, differing cultures and consumer preferences, diverse government regulations and tax systems, corruption, anti-American sentiment, the ability to source high quality ingredients and other commodities in a cost-effective manner, uncertain or differing interpretations of rights and obligations in connection with international franchise agreements and the collection of ongoing royalties from international franchisees, the availability and costs of land, construction and financing, and the availability of experienced management, appropriate franchisees and area operating partners.
Currency regulations and fluctuations in exchange rates could also affect our performance. We have operations in many foreign countries, including direct investments in restaurants in Brazil, Hong Kong and China, as well as international franchises. Brazil is our largest international market and will continue to be our top international development priority. As a result, we may experience losses from fluctuations in foreign currency exchange rates or any hedging arrangements we enter into to offset such fluctuations, and such losses could adversely affect our overall sales and earnings.
We are subject to governmental regulation of our foreign operations, including antitrust and tax requirements, anti-boycott regulations, import/export/customs regulations and other international trade regulations, the USA Patriot Act and the Foreign Corrupt Practices Act. Any new regulatory or trade initiatives could impact our operations in certain countries. Failure to comply with any such legal requirements could subject us to monetary liabilities and other sanctions, which could harm our business, results of operations and financial condition.
Loss of key management personnel could hurt our business and inhibit our ability to operate and grow successfully.
Our success will continue to depend, to a significant extent, on our leadership team and other key management personnel. If we are unable to attract and retain sufficiently experienced and capable management personnel, our business and financial results may suffer.
Failure to recruit, train and retain high-quality restaurant management and team members may result in lower guest satisfaction and lower sales and profitability.
Our restaurant-level management and team members are largely responsible for the quality of our service. Our guests may be dissatisfied and our sales may decline if we fail to recruit, train and retain managers and team members that effectively implement our business strategy and provide high quality guest service. There is active competition for quality management personnel and hourly team members. If we experience high turnover, we may experience higher labor costs and have a shortage of adequate management personnel required for future growth.
Our success depends substantially on the value of our brands and our ability to execute innovative marketing and consumer relationship initiatives to maintain brand relevance and drive profitable sales growth.
Our success depends on our ability to preserve and grow our brands. Our brand value and reputation are especially important to differentiate our concepts in the highly competitive casual dining sector to achieve sustainable same-restaurant sales growth and warrant new unit growth. Brand value and reputation is based in large part on consumer perceptions, which are driven by both our actions and actions beyond our control, such as new brand strategies or their implementation, business incidents, ineffective advertising or marketing efforts, or unfavorable mainstream or social media publicity involving us, our industry, our franchisees, or our suppliers. A failure to innovate and extend our brands in ways that are relevant to consumers and occasions in order to generate sustainable same-restaurant traffic growth,
20
BLOOMIN’ BRANDS, INC.
and produce non-traditional sales and earnings growth opportunities, could have an adverse effect on our results of operations. Additionally, insufficient focus on our competition or failure to adequately address declines in the casual dining industry, could adversely impact results of operations.
If our competitors increase their spending on advertising, promotions and loyalty programs, if our advertising, media or marketing expenses increase, or if our advertising, promotions and loyalty programs become less effective than those of our competitors, or if we do not adequately leverage technology and data analytic capabilities needed to generate concise competitive insight, we could experience a material adverse effect on our results of operations.
Our inability or failure to recognize, respond to and effectively manage the accelerated impact of social media could have a material adverse impact on our business.
There has been a marked increase in the use of social media platforms and similar devices that allow individuals to access a broad audience of consumers and other interested persons. The availability of information on social media platforms is virtually immediate as is its impact, and users can post information often without filters or checks on the accuracy of the content posted. Adverse or inaccurate information concerning our company or concepts may be posted on such platforms at any time, and such information can quickly reach a wide audience. The harm may be immediate without affording us an opportunity for redress or correction, and it is challenging to monitor and anticipate developments on social media in order to respond in an effective and timely manner. We could also be exposed to these risks if we fail to use social media responsibly in our marketing efforts. These factors could have a material adverse effect on our business. Regardless of its basis or validity, any unfavorable publicity could adversely affect public perception of our brands.
Although search engine marketing, social media and other new technological platforms offer great opportunities to increase awareness of and engagement with our brands, a failure to use social media responsibly in our marketing efforts may further expose us to these risks. Many of our competitors are expanding their use of social media and new social media platforms are rapidly being developed, potentially making more traditional social media platforms obsolete. As a result, we need to continuously innovate and develop our social media strategies in order to maintain broad appeal with guests and brand relevance. As part of our marketing efforts, we rely on search engine marketing and social media platforms to attract and retain guests. We also continue to invest in other digital marketing initiatives that allow us to reach our guests across multiple digital channels and build their awareness of, engagement with, and loyalty to our brands. These initiatives may not be successful, resulting in expenses incurred without the benefit of higher revenues, increased employee engagement or brand recognition. In addition, a variety of risks are associated with the use of social media, including the improper disclosure of proprietary information, negative comments about us, exposure of personally identifiable information, fraud, or out-of-date information. The inappropriate use of social media vehicles by our guests or employees could increase our costs, lead to litigation or result in negative publicity that could damage our reputation.
An impairment in the carrying value of our goodwill or other intangible or long-lived assets could adversely affect our financial condition and results of operations.
Along with other intangible assets, we test goodwill for impairment annually and whenever events or changes in circumstances indicate that its carrying value may not be recoverable. We also evaluate long-lived assets on a quarterly basis or whenever events or changes in circumstances indicate that the carrying value may not be recoverable. We cannot accurately predict the amount and timing of any impairment of assets. A significant amount of judgment is involved in determining if an indication of impairment exists. Should the value of goodwill or other intangible or long-lived assets become impaired, there could be an adverse effect on our financial condition and consolidated results of operations.
21
BLOOMIN’ BRANDS, INC.
We have limited control with respect to the operations of our franchisees, which could have a negative impact on our business.
Our franchisees are contractually obligated to operate their restaurants in accordance with our standards and we provide training and support to franchisees. However, franchisees are independent third parties that we do not control, and these franchisees own, operate and oversee the daily operations of their restaurants. As a result, the ultimate success and quality of any franchise restaurant rests with the franchisee. If franchisees do not successfully operate restaurants in a manner consistent with our product and service quality standards and contractual requirements, our image and reputation could be harmed, which in turn could adversely affect our business and operating results.
We have a limited number of suppliers for our major products and rely on one custom distribution company for our national distribution programs in the U.S. and Brazil. If our suppliers or custom distributors are unable to fulfill their obligations under their contracts or we are unable to develop or maintain relationships with these or new suppliers or distributors, if needed, we could encounter supply shortages and incur higher costs.
We depend on frequent deliveries of fresh food products that meet our specifications, and we have a limited number of suppliers for our major products, such as beef. In 2017, we purchased: (i) more than 85% of our U.S. beef raw materials from four beef suppliers that represent more than 80% of the total beef marketplace in the U.S and (ii) more than 95% of our Brazil beef raw materials from one beef supplier that represents approximately 12% of the total Brazil beef marketplace. Due to the nature of our industry, we expect to continue to purchase a substantial amount of our beef from a small number of suppliers. We also primarily use one supplier in the U.S. and Brazil, respectively, to process beef raw materials to our specifications and we use one distribution company to provide distribution services in the U.S and Brazil, respectively. Although we have not experienced significant problems with our suppliers or distributors, if our suppliers or distributors are unable to fulfill their obligations under their contracts, we could encounter supply shortages and incur higher costs.
In addition, if we are unable to maintain current purchasing terms or ensure service availability with our suppliers and distributor, we may lose consumers and experience an increase in costs in seeking alternative supplier or distribution services. The failure to develop and maintain supplier and distributor relationships and any resulting disruptions to the provision of food and other supplies to our restaurant locations could adversely affect our operating results.
Failure to achieve our projected cost savings from our efficiency initiatives could adversely affect our results of operations and eliminate potential funding for growth opportunities.
In recent years, we have identified strategies and taken steps to reduce operating costs and free up resources to reinvest in our business. These strategies include improved supply chain management, implementing labor scheduling tools and integrating restaurant information systems across our brands. We continue to evaluate and implement further cost-saving initiatives. However, the ability to reduce our operating costs through these initiatives is subject to risks and uncertainties, such as our ability to obtain improved supply pricing and the reliability of any new suppliers or technology, and we cannot assure that these activities, or any other activities that we may undertake in the future, will achieve the desired cost savings and efficiencies. Failure to achieve such desired savings could adversely affect our results of operations and financial condition and curtail investment in growth opportunities.
There are risks and uncertainties associated with strategic actions and initiatives that we may implement.
From time to time, we consider various strategic actions and initiatives in order to grow and evolve our business and brands and improve our operating results. These actions and initiatives could include, among other things, acquisitions or dispositions of restaurants or brands, new joint ventures, new franchise arrangements, restaurant closures and changes to our operating model. For example, in 2017, we engaged in sale-leaseback transactions with respect to 31 restaurant properties, refranchised 54 restaurant locations, began to test our delivery model and opened our first two Express units. There can be no assurance that any such actions or initiatives will be successful or deliver their anticipated benefits. We may be exposed to new and unforeseen risks and challenges, particularly if we enter into markets or engage in activities with which we have no or limited prior experience, and it may be difficult to predict the success
22
BLOOMIN’ BRANDS, INC.
of such endeavors. If we incur significant expenses or divert management, financial and other resources to a strategic initiative that is unsuccessful or does not meet our expectations, our results of operations and financial condition would be adversely affected. We may also incur significant asset impairment and other charges in connection with any such initiative. Regardless of the ultimate success of a strategic initiative, the implementation and integration of new business or operational processes could be disruptive to our current operations. Even if we test and evaluate an initiative on a limited basis, the diversion of management time and resources could have an adverse effect on our business.
Our business is subject to seasonal and periodic fluctuations, and past results are not indicative of future results.
Historically, consumer traffic patterns for our established restaurants are generally highest in the first quarter of the year and lowest in the third quarter of the year. Holidays may also affect sales volumes seasonally in some of the markets in which we operate. In addition, our quarterly results have been and will continue to be affected by the timing of new restaurant openings and their associated preopening costs, as well as restaurant closures and exit-related costs, debt extinguishment and modification costs and impairments of goodwill, intangible assets and property, fixtures and equipment. As a result of these and other factors, our financial results for any quarter may not be indicative of the results that may be achieved for a full year.
Significant adverse weather conditions and other disasters or unforeseen events could negatively impact our results of operations.
Adverse weather conditions and natural disasters and other unforeseen events, such as winter storms, severe temperatures, thunderstorms, floods, hurricanes and earthquakes, terror attacks, war and widespread/pandemic illness, and the effects of such events on economic conditions and consumer spending patterns, could negatively impact our results of operations. Temporary and prolonged restaurant closures may occur and consumer traffic may decline due to the actual or perceived effects from these events. For example, severe winter weather conditions and hurricanes have impacted our traffic, and that of our franchises, and results of operations in recent years.
Our failure or inability to enforce our trademarks or other proprietary rights could adversely affect our competitive position or the value of our brand.
Our trademarks, including Outback Steakhouse, Carrabba’s Italian Grill, Bonefish Grill, Fleming’s Prime Steakhouse & Wine Bar and Bloomin’ Onion, and other proprietary rights are important to our success and our competitive position. The protective actions that we take may not be sufficient to prevent unauthorized usage or imitation by others, which could harm our image, brand or competitive position. Furthermore, our ability to protect trademarks and other proprietary rights may be more limited in certain international markets where we operate.
Litigation could have a material adverse impact on our business and our financial performance.
We are subject to lawsuits, administrative proceedings and claims that arise in the regular course of business. These matters typically involve claims by consumers and others regarding issues such as food borne illness, food safety, premises liability, “dram shop” statute liability, promotional advertising and other operational issues common to the food service industry, as well as contract disputes and intellectual property infringement matters. We are also subject to employee claims against us based, among other things, on discrimination, harassment, wrongful termination, disability, or violation of wage and labor laws. These claims may divert our financial and management resources that would otherwise be used to benefit our operations. The ongoing expense of any resulting lawsuits, and any substantial settlement payment or damage award against us, could adversely affect our business and results of operations. Significant legal fees and costs in complex class action litigation or an adverse judgment or settlement that is not insured or is in excess of insurance coverage could have a material adverse effect on our financial position and results of operations.
23
BLOOMIN’ BRANDS, INC.
Our insurance policies may not provide adequate levels of coverage against all claims, and fluctuating insurance requirements and costs could negatively impact our profitability.
We carry insurance programs with specific retention levels or high per-claim deductibles for a significant portion of our risks and associated liabilities with respect to workers’ compensation, general liability, liquor liability, employment practices liability, property, health benefits, cyber security and other insurable risks. However, there are types of losses we may incur that cannot be insured against or that we believe are not commercially reasonable to insure. These losses, if they occur, could have a material and adverse effect on our business and results of operations. Additionally, if our insurance costs increase, there can be no assurance that we will be able to successfully offset the effect of such increases and our results of operations may be adversely affected.
Failure to maintain effective systems of internal control over financial reporting and disclosure controls and procedures could adversely affect the trading price of our common stock.
Effective internal control over financial reporting is necessary for us to provide accurate financial information. If we are unable to adequately maintain effective internal control over financial reporting, we may not be able to accurately report our financial results, which could cause investors to lose confidence in our reported financial information and negatively affect the trading price of our common stock. Furthermore, we cannot be certain that our internal control over financial reporting and disclosure controls and procedures will prevent all possible error and fraud. Because of inherent limitations in all control systems, no evaluation of controls can provide absolute assurance that all control issues and instances of error or fraud, if any, in our company have been detected. These inherent limitations include the realities that judgments in decision-making can be faulty and that breakdowns can occur because of simple error or mistake, which could have an adverse impact on our business.
Risks Related to Our Indebtedness
Our substantial leverage and our ability to refinance our indebtedness in the future could adversely affect our ability to raise additional capital to fund our operations, limit our ability to react to changes in the economy or our industry and expose us to interest rate risk in connection with our variable-rate debt.
We are highly leveraged. As of December 31, 2017, our total indebtedness was $1.1 billion and we had $377.3 million in available unused borrowing capacity under our revolving credit facility, net of undrawn letters of credit of $22.7 million.
Our high degree of leverage could have important consequences, including:
• | making it more difficult for us to make payments on indebtedness; |
• | increasing our vulnerability to general economic, industry and competitive conditions and the various risks we face in our business; |
• | increasing our cost of borrowing; |
• | requiring a substantial portion of cash flow from operations to be dedicated to the payment of principal and interest on our indebtedness, thereby reducing our ability to use our cash flow to fund our operations, capital expenditures, dividend payments, share repurchases and future business opportunities; |
• | exposing us to the risk of increased interest rates because certain of our borrowings are at variable rates of interest; |
• | restricting us from making strategic acquisitions or causing us to make non-strategic divestitures; |
• | limiting our ability to obtain additional financing for working capital, capital expenditures, restaurant development, debt service requirements, acquisitions and general corporate or other purposes; and |
• | limiting our ability to adjust to changing market conditions and placing us at a competitive disadvantage compared to our competitors who may not be as highly leveraged. |
24
BLOOMIN’ BRANDS, INC.
We may incur substantial additional indebtedness in the future, subject to the restrictions contained in our senior secured credit facilities (the “Senior Secured Credit Facility”). If new indebtedness is added to our current debt levels, the related risks that we now face could increase.
We had $1.1 billion of variable-rate debt outstanding under our Senior Secured Credit Facility as of December 31, 2017. We also have variable-to-fixed interest rate swap agreements with eight counterparties to hedge a portion of the cash flows of our variable rate debt. The swap agreements have an aggregate notional amount of $400.0 million and mature on May 16, 2019. While these agreements limit our exposure to higher interest rates, an increase in the floating rate could nonetheless cause a material increase in our interest expense due to the total amount of our outstanding variable rate indebtedness.
We cannot be certain that our financial condition or credit and other market conditions will be favorable when our Senior Secured Credit Facility matures in 2022, or at any earlier time we may seek to refinance our debt. If we are unable to refinance our indebtedness on favorable terms, our financial condition and results of operations would be adversely affected.
Our debt agreements contain restrictions that limit our flexibility in operating our business.
Certain of our debt agreements limit our and our subsidiaries’ ability to, among other things, incur or guarantee additional indebtedness, pay dividends on, redeem or repurchase our capital stock, make certain acquisitions or investments, incur or permit to exist certain liens, enter into transactions with affiliates or sell our assets to, merge or consolidate with or into, another company. Our debt agreements require us to satisfy certain financial tests and ratios. Our ability to satisfy such tests and ratios may be affected by events outside of our control.
If we breach the covenants under our debt agreements, the lenders could elect to declare all amounts outstanding under the agreements to be immediately due and payable and terminate all commitments to extend further credit. If we are unable to repay those amounts, the lenders could proceed against the collateral granted to them to secure that indebtedness. We have pledged substantially all of our assets as collateral under our debt agreement. If our lenders accelerate the repayment of borrowings, we cannot be certain that we will have sufficient assets to repay them.
We may not be able to generate sufficient cash to service all of our indebtedness and operating lease obligations, and we may be forced to take other actions to satisfy our obligations under our indebtedness and operating lease obligations, which may not be successful. If we fail to meet these obligations, we would be in default under our debt agreements and the lenders could elect to declare all amounts outstanding under them to be immediately due and payable and terminate all commitments to extend further credit.
Our ability to make scheduled payments on our debt obligations and to satisfy our operating lease obligations depends on our financial condition and operating performance, which is subject to prevailing economic and competitive conditions and to financial, business and other factors, many of which are beyond our control. We cannot be certain that we will maintain a level of cash flow from operating activities sufficient to permit us to pay the principal, premium, if any, and interest on our indebtedness, or to pay our operating lease obligations. If our cash flow and capital resources are insufficient to fund our debt service obligations and operating lease obligations, we may be forced to reduce or delay capital expenditures, sell assets, seek additional capital or restructure or refinance our indebtedness. These alternative measures may not be successful and may not permit us to meet our scheduled debt service obligations. In the absence of sufficient operating results and resources, we could face substantial liquidity problems and might be required to dispose of material assets or operations or take other actions to meet our debt service and other obligations. Our debt agreements restrict our ability to dispose of assets and how we may use the proceeds from the disposition. We may not be able to consummate those dispositions or to obtain the proceeds that we could otherwise realize from such dispositions and any such proceeds that are realized may not be adequate to meet any debt service obligations then due. The failure to meet our debt service obligations or the failure to remain in compliance with the financial covenants under our debt agreements would constitute an event of default under those agreements and the lenders could elect to declare all amounts outstanding under them to be immediately due and payable and terminate all commitments to extend further credit.
25
BLOOMIN’ BRANDS, INC.
Risks Related to Our Common Stock
Our stock price is subject to volatility.
The stock market in general is highly volatile. As a result, the market price of our common stock is similarly volatile. The price of our common stock could be subject to wide fluctuations in response to a number of factors, some of which may be beyond our control. These factors include actual or anticipated fluctuations in our operating results, changes in, or our ability to achieve, estimates of our operating results by analysts, investors or management, analysts’ recommendations regarding our stock or our competitors’ stock, sales of substantial amounts of our common stock by our stockholders, actions or announcements by us or our competitors, the maintenance and growth of the value of our brands, litigation, legislation or other regulatory developments affecting us or our industry, natural disasters, terrorist acts, war or other calamities and changes in general market and economic conditions.
If we are unable to continue to pay dividends or repurchase our stock, your investment in our common stock may decline in value.
In 2015, we initiated a quarterly dividend program. Our Board of Directors has also authorized several stock repurchase programs commencing in late 2014 and we have repurchased a significant amount of our stock since that time. The continuation of these programs, at all or consistent with past levels, will require the generation of sufficient cash flows and the existence of surplus earnings. Any decisions to declare and pay dividends and continue stock repurchase programs in the future will be made at the discretion of our Board of Directors and will depend on, among other things, our results of operations, financial condition, cash requirements, borrowing capacity, contractual restrictions including debt covenants and other factors that our Board of Directors may deem relevant at the time.
If we discontinue our dividend or stock repurchase programs, or reduce the amount of the dividends we pay or stock that we repurchase, the price of our common stock may fall. As a result, you may not be able to resell your shares at or above the price you paid for them.
Provisions in our certificate of incorporation and bylaws, our Senior Secured Credit Facility and Delaware law may discourage, delay or prevent a change of control of our company or changes in our management and, therefore, may depress the trading price of our stock.
Our certificate of incorporation and bylaws include certain provisions that could have the effect of discouraging, delaying or preventing a change of control of our company or changes in our management.
In addition, our Senior Secured Credit Facility includes change of control provisions that require that no stockholder or “group” within the meaning of Sections 13(d) and 14(d) of the Exchange Act has obtained more than 40% of our voting power.
These provisions may discourage, delay or prevent a transaction involving a change in control of the Company that is in the best interests of our stockholders. Even in the absence of a takeover attempt, the existence of these provisions may adversely affect the prevailing market price of our common stock if they are viewed as discouraging future takeover attempts.
Section 203 of the Delaware General Corporation Law may affect the ability of an “interested stockholder” to engage in certain business combinations, including mergers, consolidations or acquisitions of additional shares, for a period of three years following the time that the stockholder becomes an “interested stockholder.” An “interested stockholder” is defined to include persons owning directly or indirectly 15% or more of the outstanding voting stock of a corporation. Although we have elected in our certificate of incorporation not to be subject to Section 203 of the Delaware General Corporation Law our certificate of incorporation contains provisions that have the same effect as Section 203, except that they provide that our former private equity sponsors will not be deemed to be “interested stockholders,” regardless of the percentage of our voting stock owned by them, and accordingly will not be subject to such restrictions.
26
BLOOMIN’ BRANDS, INC.
Our ability to raise capital in the future may be limited, which could make us unable to fund our capital requirements.
Our business and operations may consume resources faster than we anticipate. In the future, we may need to raise additional funds through the issuance of new equity securities, debt or a combination of both. Additional financing may not be available on favorable terms or at all. If adequate funds are not available on acceptable terms, we may be unable to fund our capital requirements. If we issue new debt securities, the debt holders would have rights senior to common stockholders to make claims on our assets, and the terms of any debt could restrict our operations, including our ability to pay dividends on our common stock. If we issue additional equity securities, existing stockholders may experience dilution, and the new equity securities could have rights senior to those of our common stock. Because our decision to issue securities in any future offering will depend on market conditions and other factors beyond our control, we cannot predict or estimate the amount, timing or nature of our future offerings. Thus, our stockholders bear the risk of our future securities offerings reducing the market price of our common stock and diluting their interest.
Item 1B. Unresolved Staff Comments
Not applicable.
27
BLOOMIN’ BRANDS, INC.
Item 2. Properties
During 2017 and 2016, we entered into sale-leaseback transactions with third-parties in which we sold 31 and 159 restaurant properties, respectively. As of December 31, 2017, we leased 95% of our restaurant sites from third parties and owned the remaining 5% of our restaurant sites. We had 1,489 system-wide restaurants located across the following states, territories or countries as of December 31, 2017:
COMPANY-OWNED | ||||||||||||||
U.S. | INTERNATIONAL | |||||||||||||
Alabama | 19 | Kentucky | 17 | Ohio | 49 | Brazil (1) | 104 | |||||||
Arizona | 13 | Louisiana | 23 | Oklahoma | 11 | China (Mainland) | 9 | |||||||
Arkansas | 11 | Maryland | 40 | Pennsylvania | 46 | Hong Kong | 11 | |||||||
California | 15 | Massachusetts | 17 | Rhode Island | 3 | |||||||||
Colorado | 14 | Michigan | 34 | South Carolina | 37 | |||||||||
Connecticut | 11 | Minnesota | 8 | South Dakota | 1 | |||||||||
Delaware | 4 | Mississippi | 1 | Tennessee | 36 | |||||||||
Florida | 219 | Missouri | 14 | Texas | 70 | |||||||||
Georgia | 49 | Nebraska | 7 | Utah | 1 | |||||||||
Hawaii | 6 | Nevada | 6 | Vermont | 1 | |||||||||
Illinois | 25 | New Hampshire | 3 | Virginia | 60 | |||||||||
Indiana | 23 | New Jersey | 39 | West Virginia | 8 | |||||||||
Iowa | 7 | New York | 43 | Wisconsin | 12 | |||||||||
Kansas | 7 | North Carolina | 65 | |||||||||||
Total U.S. company-owned | 1,075 | Total International company-owned | 124 | |||||||||||
FRANCHISE | ||||||||||||||
U.S. | INTERNATIONAL | |||||||||||||
Alabama | 1 | Nevada | 10 | Australia | 8 | Malaysia | 2 | |||||||
Alaska | 1 | New Mexico | 5 | Bahamas | 1 | Mexico | 5 | |||||||
Arizona | 14 | Ohio | 1 | Brazil | 1 | Philippines | 4 | |||||||
California | 59 | Oregon | 7 | Canada | 2 | Puerto Rico | 4 | |||||||
Colorado | 16 | South Dakota | 1 | Costa Rica | 1 | Qatar | 1 | |||||||
Florida | 1 | Tennessee | 3 | Dominican Republic | 2 | Saudi Arabia | 6 | |||||||
Georgia | 1 | Utah | 5 | Ecuador | 1 | Singapore | 1 | |||||||
Idaho | 6 | Virginia | 1 | Guam | 1 | South Korea | 72 | |||||||
Mississippi | 7 | Washington | 21 | Indonesia | 3 | Thailand | 1 | |||||||
Montana | 3 | Wyoming | 2 | Japan | 9 | |||||||||
Total U.S. franchise | 165 | Total International franchise | 125 | |||||||||||
____________________
(1) | The restaurant count for Brazil is reported as of November 2017 to correspond with the balance sheet date of this subsidiary. |
Following is a summary of the location and leased square footage for our corporate offices as of December 31, 2017:
LOCATION (1) | USE | SQUARE FEET | LEASE EXPIRATION | ||||
Tampa, Florida | Corporate Headquarters | 168,000 | 1/31/2025 | ||||
São Paulo, Brazil | Brazil Operations Center | 17,000 | 7/31/2021 | ||||
____________________
(1) | We also have other smaller office locations regionally in China (mainland) and Hong Kong. |
Item 3. Legal Proceedings
For a description of our legal proceedings, see Note 19 - Commitments and Contingencies, of the Notes to our Consolidated Financial Statements of this Report.
28
BLOOMIN’ BRANDS, INC.
Item 4. Mine Safety Disclosures
Not applicable.
PART II
Item 5. Market for Registrant’s Common Equity, Related Stockholder Matters and Issuer Purchases of Equity Securities
MARKET INFORMATION AND DIVIDENDS
Our common stock is listed on the Nasdaq Global Select Market under the symbol “BLMN”.
In 2014, our Board of Directors (our “Board”) adopted a dividend policy under which it intends to declare quarterly cash dividends on shares of our common stock. Future dividend payments will depend on earnings, financial condition, capital expenditure requirements, surplus and other factors that our Board considers relevant. The terms of our debt agreements permit regular quarterly dividend payments, subject to certain restrictions. The following table sets forth for the periods indicated the high and low sales prices per share of our common stock as reported on Nasdaq and the dividends declared and paid during the periods indicated:
SALES PRICE | DIVIDENDS DECLARED AND PAID (1) | ||||||||||||||||||||||
2017 | 2016 | ||||||||||||||||||||||
HIGH | LOW | HIGH | LOW | 2017 | 2016 | ||||||||||||||||||
First Quarter | $ | 19.64 | $ | 16.58 | $ | 18.09 | $ | 14.91 | $ | 0.08 | $ | 0.07 | |||||||||||
Second Quarter | 22.16 | 18.60 | 19.83 | 16.01 | 0.08 | 0.07 | |||||||||||||||||
Third Quarter | 21.70 | 16.11 | 19.89 | 17.21 | 0.08 | 0.07 | |||||||||||||||||
Fourth Quarter | 22.47 | 16.30 | 19.99 | 15.82 | 0.08 | 0.07 | |||||||||||||||||
____________________
(1) | See Part II, Item 7 “Management’s Discussion and Analysis of Financial Condition and Results of Operations - DIVIDENDS AND SHARE REPURCHASES.” |
HOLDERS
As of February 23, 2018, there were 10 holders of record of our common stock. The number of registered holders does not include holders who are beneficial owners whose shares are held in street name by brokers and other nominees.
SECURITIES AUTHORIZED FOR ISSUANCE UNDER EQUITY COMPENSATION PLANS
The following table presents the securities authorized for issuance under our equity compensation plans as of December 31, 2017:
(shares in thousands) | (a) | (b) | (c) | |||||||
PLAN CATEGORY | NUMBER OF SECURITIES TO BE ISSUED UPON EXERCISE OF OUTSTANDING OPTIONS, WARRANTS AND RIGHTS | WEIGHTED-AVERAGE EXERCISE PRICE OF OUTSTANDING OPTIONS, WARRANTS AND RIGHTS | NUMBER OF SECURITIES REMAINING AVAILABLE FOR FUTURE ISSUANCE UNDER EQUITY COMPENSATION PLANS (EXCLUDING SECURITIES REFLECTED IN COLUMN (a)) (1) | |||||||
Equity compensation plans approved by security holders | 10,051 | $ | 14.89 | 5,063 | ||||||
____________________
(1) | The shares remaining available for issuance may be issued in the form of stock options, restricted stock, restricted stock units or other stock awards under the 2016 Omnibus Incentive Compensation Plan. |
29
BLOOMIN’ BRANDS, INC.
STOCK PERFORMANCE GRAPH
The following graph depicts total return to stockholders from December 31, 2012 through December 31, 2017, relative to the performance of the Standard & Poor’s 500 Index and the Standard & Poor’s 500 Consumer Discretionary Sector, a peer group. The graph assumes an investment of $100 in our common stock and each index on December 31, 2012 and the reinvestment of dividends paid since that date. The stock price performance shown in the graph is not necessarily indicative of future price performance.
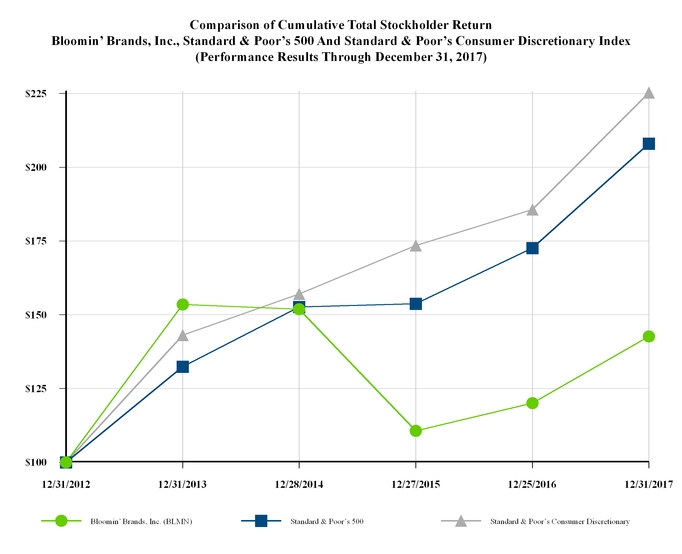
DECEMBER 31, 2012 | DECEMBER 31, 2013 | DECEMBER 28, 2014 | DECEMBER 27, 2015 | DECEMBER 25, 2016 | DECEMBER 31, 2017 | ||||||||||||||||||
Bloomin’ Brands, Inc. (BLMN) | $ | 100.00 | $ | 153.52 | $ | 151.85 | $ | 110.60 | $ | 120.02 | $ | 142.69 | |||||||||||
Standard & Poor’s 500 | 100.00 | 132.37 | 152.62 | 153.78 | 172.64 | 208.05 | |||||||||||||||||
Standard & Poor’s Consumer Discretionary | 100.00 | 143.08 | 157.03 | 173.43 | 185.67 | 225.30 | |||||||||||||||||
30
BLOOMIN’ BRANDS, INC.
PURCHASES OF EQUITY SECURITIES BY THE ISSUER AND AFFILIATED PURCHASERS
The following table provides information regarding our purchases of common stock during the fourteen weeks ended December 31, 2017:
PERIOD | TOTAL NUMBER OF SHARES PURCHASED | AVERAGE PRICE PAID PER SHARE | TOTAL NUMBER OF SHARES PURCHASED AS PART OF PUBLICLY ANNOUNCED PLANS OR PROGRAMS | APPROXIMATE DOLLAR VALUE OF SHARES THAT MAY YET BE PURCHASED UNDER THE PLANS OR PROGRAMS (1) | ||||||||||
September 25, 2017 through October 22, 2017 | — | $ | — | — | $ | 55,000,223 | ||||||||
October 23, 2017 through November 19, 2017 | — | $ | — | — | $ | 55,000,223 | ||||||||
November 20, 2017 through December 31, 2017 | — | $ | — | — | $ | 55,000,223 | ||||||||
Total | — | — | ||||||||||||
____________________
(1) | On April 21, 2017, the Board of Directors authorized the repurchase of $250.0 million of our outstanding common stock as announced in our press release issued on April 26, 2017 (the “2017 Share Repurchase Program”). On February 16, 2018, our Board of Directors canceled the remaining $55.0 million of authorization under the 2017 Share Repurchase Program and approved a new $150.0 million authorization (the “2018 Share Repurchase Program”), as announced in our press release issued on February 22, 2018. The 2018 Share Repurchase Program will expire on August 16, 2019. |
31
BLOOMIN’ BRANDS, INC.
Item 6. Selected Financial Data
FISCAL YEAR | |||||||||||||||||||
(dollars in thousands, except per share data) | 2017 | 2016 | 2015 | 2014 | 2013 | ||||||||||||||
Operating Results: | |||||||||||||||||||
Revenues | |||||||||||||||||||
Restaurant sales | $ | 4,168,658 | $ | 4,226,057 | $ | 4,349,921 | $ | 4,415,783 | $ | 4,089,128 | |||||||||
Franchise and other revenues | 44,688 | 26,255 | 27,755 | 26,928 | 40,102 | ||||||||||||||
Total revenues (1) | $ | 4,213,346 | $ | 4,252,312 | $ | 4,377,676 | $ | 4,442,711 | $ | 4,129,230 | |||||||||
Income from operations (2) | $ | 146,092 | $ | 127,606 | $ | 230,925 | $ | 191,964 | $ | 225,357 | |||||||||
Net income including noncontrolling interests (2) (3) | $ | 102,558 | $ | 46,347 | $ | 131,560 | $ | 95,926 | $ | 214,568 | |||||||||
Net income attributable to Bloomin’ Brands (2) (3) | $ | 100,243 | $ | 41,748 | $ | 127,327 | $ | 91,090 | $ | 208,367 | |||||||||
Basic earnings per share | $ | 1.04 | $ | 0.37 | $ | 1.04 | $ | 0.73 | $ | 1.69 | |||||||||
Diluted earnings per share (4) | $ | 1.01 | $ | 0.37 | $ | 1.01 | $ | 0.71 | $ | 1.63 | |||||||||
Cash dividends declared per common share | $ | 0.32 | $ | 0.28 | $ | 0.24 | $ | — | $ | — | |||||||||
Balance Sheet Data: | |||||||||||||||||||
Total assets | $ | 2,572,907 | $ | 2,642,279 | $ | 3,032,569 | $ | 3,338,240 | $ | 3,267,421 | |||||||||
Total debt, net | $ | 1,118,104 | $ | 1,089,485 | $ | 1,316,864 | $ | 1,309,797 | $ | 1,408,088 | |||||||||
Total stockholders’ equity (5) | $ | 49,471 | $ | 195,353 | $ | 421,900 | $ | 556,449 | $ | 482,709 | |||||||||
Common stock outstanding (5) | 91,913 | 103,922 | 119,215 | 125,950 | 124,784 | ||||||||||||||
Cash Flow Data: | |||||||||||||||||||
Investing activities: | |||||||||||||||||||
Capital expenditures | $ | 260,589 | $ | 260,578 | $ | 210,263 | $ | 237,868 | $ | 237,214 | |||||||||
Proceeds from sale-leaseback transactions, net | 98,840 | 530,684 | — | — | — | ||||||||||||||
Financing activities: | |||||||||||||||||||
Repurchase of common stock (5) | $ | 272,916 | $ | 310,334 | $ | 170,769 | $ | 930 | $ | 436 | |||||||||
Note: This selected consolidated financial data should be read in conjunction with the consolidated financial statements and notes thereto, included in Item 8 of this Report and Management’s Discussion and Analysis of Financial Condition and Results of Operations, included in Item 7 of this Report.
(1) | There were 53 operating weeks in 2017, versus 52 operating weeks for the other periods presented. This additional week resulted in an increase in Total revenues of $80.4 million during 2017. Due to the change in our fiscal year end, Total revenues for 2015 includes $24.3 million of higher restaurant sales and Total revenues in 2014 includes $46.0 million of lower restaurant sales. |
(2) | 2017 includes: (i) $42.8 million of asset impairments and closing costs primarily related to certain approved closure and restructuring initiatives, the remeasurement of certain surplus properties and for our China subsidiary, (ii) $12.5 million of asset impairments and restaurant closing costs related to the relocation of certain restaurants and (iii) $11.0 million of severance expense incurred as a result a restructuring event. 2016 results include: (i) $51.4 million of asset impairments and closing costs related to certain approved closure and restructuring initiatives, (ii) $43.1 million of asset impairments related to the refranchising of Outback Steakhouse South Korea and for our Puerto Rico subsidiary, (iii) $7.2 million of asset impairments and restaurant closing costs related to the relocation of certain restaurants and (iv) $5.5 million of severance related to a restructuring event and the relocation of our Fleming’s operations center to the corporate home office. 2015 results include $4.9 million of higher income from operations due to a change in our fiscal year end and $31.8 million of asset impairments and restaurant closing costs related to certain approved closure and restructuring initiatives. 2014 results include: (i) $9.2 million of lower income from operations due to a change in our fiscal year end, (ii) $26.8 million of asset impairments due to certain approved closure and restructuring initiatives, (iii) $24.0 million of asset impairments related to our Roy’s concept and corporate airplanes and (iv) $9.0 million of severance related to our organizational realignment. 2013 includes $18.7 million of asset impairments due to certain approved closure and restructuring initiatives. |
(3) | Includes $27.0 million, $11.1 million and $14.6 million in 2016, 2014 and 2013, respectively, of loss on defeasance, extinguishment and modification of debt. Includes a $36.6 million gain on remeasurement of a previously held equity investment related to our Brazil acquisition and a $52.0 million income tax benefit for a U.S. valuation allowance release in 2013. |
(4) | Fiscal year 2017 includes $0.11 of additional diluted earnings per share from a 53rd operating week. |
(5) | During 2017, 2016 and 2015, we repurchased 13.8 million, 16.6 million and 7.6 million shares, respectively, of our outstanding common stock. |
32
BLOOMIN’ BRANDS, INC.
MANAGEMENT’S DISCUSSION AND ANALYSIS OF
FINANCIAL CONDITION AND RESULTS OF OPERATIONS
Item 7. Management’s Discussion and Analysis of Financial Condition and Results of Operations
Management’s discussion and analysis of financial condition and results of operations should be read in conjunction with our consolidated financial statements and the related notes.
Overview
We are one of the largest casual dining restaurant companies in the world with a portfolio of leading, differentiated restaurant concepts. As of December 31, 2017, we owned and operated 1,199 restaurants and franchised 290 restaurants across 48 states, Puerto Rico, Guam and 19 countries. We have four founder-inspired concepts: Outback Steakhouse, Carrabba’s Italian Grill, Bonefish Grill and Fleming’s Prime Steakhouse & Wine Bar.
Executive Summary
Our 2017 financial results include:
• | A decrease in total revenues of 0.9% to $4.2 billion in 2017 as compared to 2016, driven primarily by refranchising internationally and domestically. This decrease was partially offset by restaurant sales during the 53rd week of 2017, higher comparable restaurant sales and the effect of foreign currency translation. |
• | Income from operations increased to $146.1 million in 2017 as compared to $127.6 million in 2016, primarily due to lower impairment charges, the impact of the 53rd week in 2017, increases in franchise and other revenues and increases in average check per person. These increases were partially offset by higher general and administrative expense and labor costs. |
Following is a summary of factors that impacted our operating results and liquidity in 2017 and significant actions we have taken during the year:
Refranchising and Sale Transactions - During 2017, we refranchised 54 and sold one of our U.S. Company-owned Outback Steakhouse and Carrabba’s Italian Grill locations for aggregate cash proceeds of $46.1 million, net of certain closing adjustments. The transactions resulted in an aggregate net gain of $15.8 million within Other income (expense), net, in the Consolidated Statements of Operations and Other Comprehensive Income. See Note 3 - Disposals of our Notes to Consolidated Financial Statements for additional details.
New Credit Agreement - On November 30, 2017, we entered into a credit agreement, including OSI as co-borrower (the “Credit Agreement”), completing the refinancing of OSI’s senior secured credit facility. The Credit Agreement provides for senior secured credit financing of up to $1.5 billion, consisting of a $500.0 million Term loan A and a $1.0 billion revolving credit facility, including letter of credit and swing line loan sub-facilities (the “Senior Secured Credit Facility”). The proceeds of the Senior Secured Credit Facility were used to pay down OSI’s former credit facility (the “Former Credit Facility”). Our total indebtedness did not materially change as a result of the refinancing. See Note 12 - Long-term Debt, Net of the Notes to Consolidated Financial Statements for further information.
Sale-leaseback Transactions - During 2017, we entered into sale-leaseback transactions with third-parties in which we sold 31 restaurant properties at fair market value for gross proceeds of $108.0 million. With a portion of the proceeds from these transactions, we repaid our mortgage loan (the “PRP Mortgage Loan”) in April 2017.
Share Repurchase Programs and Dividends - We repurchased 13.8 million shares of common stock during 2017 for a total of $272.7 million and paid $31.0 million of dividends. On February 16, 2018, our Board canceled the remaining $55.0 million of authorization under the 2017 Share Repurchase Program and approved a new $150.0 million authorization (the “2018 Share Repurchase Program”). The 2018 Share Repurchase Program will expire on August 16, 2019.
33
BLOOMIN’ BRANDS, INC.
MANAGEMENT’S DISCUSSION AND ANALYSIS OF
FINANCIAL CONDITION AND RESULTS OF OPERATIONS - Continued
2017 Closure Initiative and Surplus Properties - On February 15, 2017, we decided to close 43 underperforming restaurants. Most of these restaurants were closed in 2017, with the balance closing as leases and certain operating covenants expire or are amended or waived. During 2017, we recognized impairment charges of $10.7 million in connection with the remeasurement of certain held and used surplus properties. See Note 4 - Impairments and Exit Costs of our Notes to Consolidated Financial Statements for additional details.
Express Concept - During 2017, we opened our first two Express units, which combine Outback Steakhouse and Carrabba’s Italian Grill offerings in a delivery and take-out only format.
Casual Dining Industry Conditions
In 2017, the casual dining industry continued to experience considerable pressures driven by the changing landscape of the restaurant space. We believe casual dining traffic levels declined due to ongoing challenges including an oversupply of restaurants, the relative affordability and quality of prepared meals from supermarkets, and an increase in home delivery services. These changing industry dynamics have led to an increased emphasis on discounts and promotions to improve value. We expect these industry trends to continue in fiscal 2018.
Fiscal Year
We utilize a 52-53 week year ending on the last Sunday in December. In a 52 week fiscal year, each of our quarterly periods comprise 13 weeks. The additional operating week in a 53 week fiscal year is added to the fourth quarter. Fiscal year 2017 consisted of 53 weeks and fiscal years 2016 and 2015 consisted of 52 weeks. The additional operating week resulted in increases of $80.4 million in Total revenues and $0.11 of diluted earnings per share during fiscal year 2017.
Business Strategies
In 2018, our key business strategies include:
• | Elevate the 360-Degree Customer Experience. We plan to continue to make investments to enhance our core guest experience, increase off-premise dining occasions, remodel and relocate restaurants, invest in digital marketing and data personalization and utilize the Dine Rewards loyalty program and multimedia marketing campaigns to drive traffic. |
• | Optimize International Opportunities. We continue to focus on existing geographic regions in South America, with strategic expansion in Brazil, and pursue franchise opportunities in Asia and the Middle East. |
• | Engage with All Stakeholders Responsibly. We take the responsibility to our people, customers and communities seriously and continue to invest in programs that support the wellbeing of those engaged with us. |
• | Drive Long-Term Shareholder Value. We plan to drive long-term shareholder value by reinvesting operational cash flow in our business, improving our credit profile and returning excess cash to shareholders through share repurchases and dividends. |
We intend to fund our business strategies, in part, by utilizing productivity initiatives across our business. Productivity savings will be reinvested in the business to drive revenue growth and margin improvement.
34
BLOOMIN’ BRANDS, INC.
MANAGEMENT’S DISCUSSION AND ANALYSIS OF
FINANCIAL CONDITION AND RESULTS OF OPERATIONS - Continued
Key Performance Indicators
Key measures that we use in evaluating our restaurants and assessing our business include the following:
• | Average restaurant unit volumes—average sales per restaurant to measure changes in consumer traffic, pricing and development of the brand; |
• | Comparable restaurant sales—year-over-year comparison of sales volumes for Company-owned restaurants that are open 18 months or more in order to remove the impact of new restaurant openings in comparing the operations of existing restaurants; |
• | System-wide sales—total restaurant sales volume for all Company-owned, franchise and unconsolidated joint venture restaurants, regardless of ownership, to interpret the overall health of our brands; |
• | Restaurant-level operating margin, Income from operations, Net income and Diluted earnings per share — financial measures utilized to evaluate our operating performance. |
Restaurant-level operating margin is widely regarded in the industry as a useful metric to evaluate restaurant level operating efficiency and performance of ongoing restaurant-level operations, and we use it for these purposes, overall and particularly within our two segments. Our restaurant-level operating margin is expressed as the percentage of our Restaurant sales that Cost of sales, Labor and other related and Other restaurant operating (including advertising expenses) represent, in each case as such items are reflected in our Consolidated Statement of Operations. The following categories of our revenue and operating expenses are not included in restaurant-level operating margin because we do not consider them reflective of operating performance at the restaurant-level within a period:
(i) | Franchise and other revenues which are earned primarily from franchise royalties and other non-food and beverage revenue streams, such as rental and sublease income. |
(ii) | Depreciation and amortization which, although substantially all is related to restaurant-level assets, represent historical sunk costs rather than cash outlays for the restaurants. |
(iii) | General and administrative expense which includes primarily non-restaurant-level costs associated with support of the restaurants and other activities at our corporate offices. |
(iv) | Asset impairment charges and restaurant closing costs which are not reflective of ongoing restaurant performance in a period. |
Restaurant-level operating margin excludes various expenses, as discussed above, that are essential to support the operations of our restaurants and may materially impact our Consolidated Statement of Operations. As a result, restaurant-level operating margin is not indicative of our consolidated results of operations and is presented exclusively as a supplement to, and not a substitute for, net income or income from operations. In addition, our presentation of restaurant operating margin may not be comparable to similarly titled measures used by other companies in our industry;
• | Adjusted restaurant-level operating margin, Adjusted income from operations, Adjusted net income, Adjusted diluted earnings per share—non-GAAP financial measures utilized to evaluate our operating performance, which definitions, usefulness and reconciliations are described in more detail in the “Non-GAAP Financial Measures” section below; and |
• | Consumer satisfaction scores—measurement of our consumers’ experiences in a variety of key areas. |
35
BLOOMIN’ BRANDS, INC.
MANAGEMENT’S DISCUSSION AND ANALYSIS OF
FINANCIAL CONDITION AND RESULTS OF OPERATIONS - Continued
Selected Operating Data
The table below presents the number of our restaurants in operation as of the end of the periods indicated:
DECEMBER 31, 2017 | DECEMBER 25, 2016 | DECEMBER 27, 2015 | ||||||
Number of restaurants (at end of the period): | ||||||||
U.S. | ||||||||
Outback Steakhouse | ||||||||
Company-owned (1) | 585 | 650 | 650 | |||||
Franchised (1) | 155 | 105 | 105 | |||||
Total | 740 | 755 | 755 | |||||
Carrabba’s Italian Grill | ||||||||
Company-owned (1) | 225 | 242 | 244 | |||||
Franchised (1) | 3 | 2 | 3 | |||||
Total | 228 | 244 | 247 | |||||
Bonefish Grill | ||||||||
Company-owned | 194 | 204 | 210 | |||||
Franchised | 7 | 6 | 5 | |||||
Total | 201 | 210 | 215 | |||||
Fleming’s Prime Steakhouse & Wine Bar | ||||||||
Company-owned | 69 | 68 | 66 | |||||
Express | ||||||||
Company-owned | 2 | — | — | |||||
U.S. Total | 1,240 | 1,277 | 1,283 | |||||
International | ||||||||
Company-owned | ||||||||
Outback Steakhouse - Brazil (2) | 87 | 83 | 75 | |||||
Outback Steakhouse - South Korea (3) | — | — | 75 | |||||
Other | 37 | 29 | 16 | |||||
Franchised | ||||||||
Outback Steakhouse - South Korea (3) | 72 | 73 | — | |||||
Other | 53 | 54 | 58 | |||||
International Total | 249 | 239 | 224 | |||||
System-wide total | 1,489 | 1,516 | 1,507 | |||||
____________________
(1) | In 2017, we sold 53 Outback Steakhouse restaurants and one Carrabba’s Italian Grill restaurant, which are now operated as franchises. |
(2) | The restaurant counts for Brazil are reported as of November 30, 2017, 2016 and 2015, respectively, to correspond with the balance sheet dates of this subsidiary. |
(3) | In 2016, we sold our restaurant locations in South Korea, converting all restaurants in that market to franchised locations. |
36
BLOOMIN’ BRANDS, INC.
MANAGEMENT’S DISCUSSION AND ANALYSIS OF
FINANCIAL CONDITION AND RESULTS OF OPERATIONS - Continued
Results of Operations
The following table sets forth, for the periods indicated, the percentages of certain items in our Consolidated Statements of Operations and Comprehensive Income in relation to Total revenues or Restaurant sales, as indicated:
FISCAL YEAR | ||||||||
2017 | 2016 | 2015 | ||||||
Revenues | ||||||||
Restaurant sales | 98.9 | % | 99.4 | % | 99.4 | % | ||
Franchise and other revenues | 1.1 | 0.6 | 0.6 | |||||
Total revenues | 100.0 | 100.0 | 100.0 | |||||
Costs and expenses | ||||||||
Cost of sales (1) | 31.6 | 32.1 | 32.6 | |||||
Labor and other related (1) | 29.3 | 28.7 | 27.7 | |||||
Other restaurant operating (1) | 23.5 | 23.5 | 23.1 | |||||
Depreciation and amortization | 4.6 | 4.6 | 4.3 | |||||
General and administrative | 7.3 | 6.3 | 6.6 | |||||
Provision for impaired assets and restaurant closings | 1.2 | 2.5 | 0.8 | |||||
Total costs and expenses | 96.5 | 97.0 | 94.7 | |||||
Income from operations | 3.5 | 3.0 | 5.3 | |||||
Loss on defeasance, extinguishment and modification of debt | (*) | (0.6 | ) | (0.1 | ) | |||
Other income (expense), net | 0.4 | * | (*) | |||||
Interest expense, net | (1.1 | ) | (1.1 | ) | (1.3 | ) | ||
Income before provision for income taxes | 2.8 | 1.3 | 3.9 | |||||
Provision for income taxes | 0.4 | 0.2 | 0.9 | |||||
Net income | 2.4 | 1.1 | 3.0 | |||||
Less: net income attributable to noncontrolling interests | 0.1 | 0.1 | 0.1 | |||||
Net income attributable to Bloomin’ Brands | 2.3 | % | 1.0 | % | 2.9 | % | ||
____________________
(1) | As a percentage of Restaurant sales. |
* | Less than 1/10th of one percent of Total revenues. |
37
BLOOMIN’ BRANDS, INC.
MANAGEMENT’S DISCUSSION AND ANALYSIS OF
FINANCIAL CONDITION AND RESULTS OF OPERATIONS - Continued
Revenues
Restaurant sales - Following is a summary of the change in Restaurant sales:
FISCAL YEAR | |||||||
(dollars in millions): | 2017 (1) | 2016 | |||||
For fiscal years 2016 and 2015 | $ | 4,226.0 | $ | 4,349.9 | |||
Change from: | |||||||
Divestiture of restaurants through refranchising transactions (2) | (209.4 | ) | (86.9 | ) | |||
Restaurant closings | (84.2 | ) | (33.9 | ) | |||
Restaurant openings (3) | 75.6 | 86.2 | |||||
Comparable restaurant sales (3) | 124.7 | (57.7 | ) | ||||
Effect of foreign currency translation | 36.0 | (31.6 | ) | ||||
For fiscal years 2017 and 2016 | $ | 4,168.7 | $ | 4,226.0 | |||
____________________
(1) | Includes $79.9 million of additional restaurant sales from the 53rd week of 2017. |
(2) | Includes $5.7 million related to divestiture of Roy’s in 2016. |
(3) | Summation of quarterly changes for restaurant openings and comparable restaurant sales will not total to annual amounts as the restaurants that meet the definition of a comparable restaurant will differ each period based on when the restaurant opened. |
The decrease in Restaurant sales in 2017 as compared to 2016 was primarily attributable to the refranchising internationally and domestically and the closing of 57 restaurants since December 27, 2015. The decrease in restaurant sales was partially offset by: (i) restaurant sales during the 53rd week of 2017, (ii) sales from 69 new restaurants not included in our comparable restaurant sales base, (iii) higher comparable restaurant sales and (iv) the effect of foreign currency translation, due to the appreciation of the Brazil Real.
The decrease in Restaurant sales in 2016 as compared to 2015 was primarily attributable to: (i) the refranchising of Outback Steakhouse South Korea restaurants in July 2016, (ii) lower U.S. comparable restaurant sales, (iii) the closing of 24 restaurants since December 28, 2014 and (iv) the effect of foreign currency translation, due to the depreciation of the Brazil Real. The decrease in restaurant sales was partially offset by sales from 92 new restaurants not included in our comparable restaurant sales base.
38
BLOOMIN’ BRANDS, INC.
MANAGEMENT’S DISCUSSION AND ANALYSIS OF
FINANCIAL CONDITION AND RESULTS OF OPERATIONS - Continued
Comparable Restaurant Sales and Average Check Per Person Increases (Decreases)
Following is a summary of comparable restaurant sales, traffic and average check per person increases (decreases):
FISCAL YEAR | ||||||||
2017 (1) | 2016 | 2015 (2) | ||||||
Year over year percentage change: | ||||||||
Comparable restaurant sales (stores open 18 months or more) (3): | ||||||||
U.S. | ||||||||
Outback Steakhouse | 1.8 | % | (2.3 | )% | 1.8 | % | ||
Carrabba’s Italian Grill | (1.2 | )% | (2.7 | )% | (0.7 | )% | ||
Bonefish Grill | (1.7 | )% | (0.5 | )% | (3.3 | )% | ||
Fleming’s Prime Steakhouse & Wine Bar | (0.4 | )% | (0.2 | )% | 1.3 | % | ||
Combined U.S. | 0.5 | % | (1.9 | )% | 0.5 | % | ||
International | ||||||||
Outback Steakhouse - Brazil (4) | 6.3 | % | 6.7 | % | 6.3 | % | ||
Traffic: | ||||||||
U.S. | ||||||||
Outback Steakhouse | 0.3 | % | (5.7 | )% | (1.5 | )% | ||
Carrabba’s Italian Grill | (4.2 | )% | (2.7 | )% | (0.1 | )% | ||
Bonefish Grill | (2.8 | )% | (3.7 | )% | (6.2 | )% | ||
Fleming’s Prime Steakhouse & Wine Bar | (5.5 | )% | (2.2 | )% | (0.2 | )% | ||
Combined U.S. | (1.3 | )% | (4.7 | )% | (1.8 | )% | ||
International | ||||||||
Outback Steakhouse - Brazil | (0.2 | )% | 0.2 | % | 0.5 | % | ||
Average check per person increases (decreases) (5): | ||||||||
U.S. | ||||||||
Outback Steakhouse | 1.5 | % | 3.4 | % | 3.3 | % | ||
Carrabba’s Italian Grill | 3.0 | % | — | % | (0.6 | )% | ||
Bonefish Grill | 1.1 | % | 3.2 | % | 2.9 | % | ||
Fleming’s Prime Steakhouse & Wine Bar | 5.1 | % | 2.0 | % | 1.5 | % | ||
Combined U.S. | 1.8 | % | 2.8 | % | 2.3 | % | ||
International | ||||||||
Outback Steakhouse - Brazil | 6.3 | % | 6.5 | % | 6.0 | % | ||
____________________
(1) | For 2017, comparable restaurant sales compare the 53 weeks from December 26, 2016 through December 31, 2017 to the 53 weeks from December 28, 2015 through January 1, 2017. |
(2) | Includes $24.3 million higher restaurant sales recognized in 2015 due to a change in our fiscal year end. |
(3) | Comparable restaurant sales exclude the effect of fluctuations in foreign currency rates. Relocated international restaurants closed more than 30 days and relocated U.S. restaurants closed more than 60 days are excluded from comparable restaurant sales until at least 18 months after reopening. |
(4) | Includes trading day impact from calendar period reporting. |
(5) | Average check per person increases (decreases) includes the impact of menu pricing changes, product mix and discounts. |
39
BLOOMIN’ BRANDS, INC.
MANAGEMENT’S DISCUSSION AND ANALYSIS OF
FINANCIAL CONDITION AND RESULTS OF OPERATIONS - Continued
Average Restaurant Unit Volumes and Operating Weeks
Following is a summary of the average restaurant unit volumes and operating weeks:
FISCAL YEAR | |||||||||||
(dollars in thousands) | 2017 | 2016 | 2015 | ||||||||
Average restaurant unit volumes: | |||||||||||
U.S. | |||||||||||
Outback Steakhouse | $ | 3,542 | $ | 3,354 | $ | 3,430 | |||||
Carrabba’s Italian Grill | $ | 2,960 | $ | 2,857 | $ | 2,954 | |||||
Bonefish Grill | $ | 3,079 | $ | 3,007 | $ | 3,019 | |||||
Fleming’s Prime Steakhouse & Wine Bar | $ | 4,436 | $ | 4,277 | $ | 4,247 | |||||
International | |||||||||||
Outback Steakhouse - Brazil (1) | $ | 4,429 | $ | 3,856 | $ | 4,137 | |||||
Operating weeks: | |||||||||||
U.S. | |||||||||||
Outback Steakhouse | 31,969 | 33,812 | 33,758 | ||||||||
Carrabba’s Italian Grill | 12,125 | 12,658 | 12,678 | ||||||||
Bonefish Grill | 10,411 | 10,667 | 10,731 | ||||||||
Fleming’s Prime Steakhouse & Wine Bar | 3,585 | 3,469 | 3,432 | ||||||||
International | |||||||||||
Outback Steakhouse - Brazil | 4,441 | 4,096 | 3,563 | ||||||||
____________________
(1) | Translated at average exchange rates of 3.20, 3.50 and 3.19 for 2017, 2016 and 2015, respectively. |
Franchise and other revenues
FISCAL YEAR | |||||||||||
(dollars in millions) | 2017 | 2016 | 2015 | ||||||||
Franchise revenues (1) | $ | 32.6 | $ | 19.8 | $ | 17.9 | |||||
Other revenues | 12.1 | 6.5 | 9.9 | ||||||||
Franchise and other revenues | $ | 44.7 | $ | 26.3 | $ | 27.8 | |||||
____________________
(1) | Represents franchise royalties and initial franchise fees. |
COSTS AND EXPENSES
Cost of sales
FISCAL YEAR | FISCAL YEAR | ||||||||||||||||||||
(dollars in millions): | 2017 | 2016 | Change | 2016 | 2015 | Change | |||||||||||||||
Cost of sales | $ | 1,317.1 | $ | 1,354.9 | $ | 1,354.9 | $ | 1,419.7 | |||||||||||||
% of Restaurant sales | 31.6 | % | 32.1 | % | (0.5 | )% | 32.1 | % | 32.6 | % | (0.5 | )% | |||||||||
Cost of sales, consisting of food and beverage costs, decreased as a percentage of Restaurant sales in 2017 as compared to 2016. The decrease as a percentage of Restaurant sales was primarily due to: (i) 0.4% from increases in average check per person, (ii) 0.4% from lower beef costs and (iii) 0.3% from the impact of certain cost savings initiatives. These decreases were partially offset by increases as a percentage of Restaurant sales primarily due to 0.5% from higher other commodity costs.
40
BLOOMIN’ BRANDS, INC.
MANAGEMENT’S DISCUSSION AND ANALYSIS OF
FINANCIAL CONDITION AND RESULTS OF OPERATIONS - Continued
The decrease as a percentage of Restaurant sales in 2016 as compared to 2015 was primarily due to: (i) 0.7% from the impact of certain cost savings initiatives and (ii) 0.4% from average check increases. These decreases were partially offset by increases as a percentage of Restaurant sales due to 0.5% from higher commodity costs.
In 2018, we expect commodity costs to increase 3.0% to 3.5%.
Labor and other related expenses
FISCAL YEAR | FISCAL YEAR | ||||||||||||||||||||
(dollars in millions): | 2017 | 2016 | Change | 2016 | 2015 | Change | |||||||||||||||
Labor and other related | $ | 1,219.6 | $ | 1,211.3 | $ | 1,211.3 | $ | 1,205.6 | |||||||||||||
% of Restaurant sales | 29.3 | % | 28.7 | % | 0.6 | % | 28.7 | % | 27.7 | % | 1.0 | % | |||||||||
Labor and other related expenses include all direct and indirect labor costs incurred in operations, including distribution expense to Restaurant Managing Partners, costs related to field deferred compensation plans and other field incentive compensation expenses. Labor and other related expenses increased as a percentage of Restaurant sales for 2017 as compared to 2016 primarily attributable to 1.5% of higher kitchen and service labor costs due to higher wage rates and investments in our service model. This was partially offset by a decrease as a percentage of Restaurant sales of 0.6% from increases in average check per person and 0.2% impact from the refranchising of Outback Steakhouse South Korea in 2016.
Labor and other related expenses increased as a percentage of Restaurant sales for 2016 as compared to 2015 due to 1.2% of higher kitchen and service labor costs due to higher wage rates and investments in our service model. This increase was partially offset by a decrease as a percentage of Restaurant sales due to 0.4% from increases in average check per person.
In 2018, we anticipate approximately 4.0% labor cost inflation.
Other restaurant operating expenses
FISCAL YEAR | FISCAL YEAR | ||||||||||||||||||||
(dollars in millions): | 2017 | 2016 | Change | 2016 | 2015 | Change | |||||||||||||||
Other restaurant operating | $ | 979.0 | $ | 992.2 | $ | 992.2 | $ | 1,006.8 | |||||||||||||
% of Restaurant sales | 23.5 | % | 23.5 | % | — | % | 23.5 | % | 23.1 | % | 0.4 | % | |||||||||
Other restaurant operating expenses include certain unit-level operating costs such as operating supplies, rent, repairs and maintenance, advertising expenses, utilities, pre-opening costs and other occupancy costs. A substantial portion of these expenses is fixed or indirectly variable. Other restaurant operating expenses was flat for 2017 as compared to 2016 and was the result of increases as a percentage of Restaurant sales primarily due to 0.5% from operating expense inflation and 0.3% from higher rent expense due to the sale-leaseback of certain properties. These increases were offset by a decrease as a percentage of Restaurant sales primarily due to 0.6% from lower advertising expenses in 2017 and 0.2% from the impact of certain cost savings initiatives.
The increase as a percentage of Restaurant sales for 2016 as compared to 2015 was primarily due to 0.4% from an increase in operating expenses due to inflation and timing and 0.3% from higher net rent expense due to the sale-leaseback of certain properties. These increases were partially offset by a decrease as a percentage of Restaurant sales primarily due to 0.3% from the impact of certain cost savings initiatives.
41
BLOOMIN’ BRANDS, INC.
MANAGEMENT’S DISCUSSION AND ANALYSIS OF
FINANCIAL CONDITION AND RESULTS OF OPERATIONS - Continued
Depreciation and amortization
FISCAL YEAR | FISCAL YEAR | ||||||||||||||||||||||
(dollars in millions): | 2017 | 2016 | Change | 2016 | 2015 | Change | |||||||||||||||||
Depreciation and amortization | $ | 192.3 | $ | 193.8 | $ | (1.5 | ) | $ | 193.8 | $ | 190.4 | $ | 3.4 | ||||||||||
Depreciation and amortization decreased for 2017 as compared to 2016 primarily due to: (i) disposal of assets related to the sale-leaseback of certain properties, (ii) refranchising internationally and domestically and (iii) assets impaired in connection with the 2017 Closure Initiative, partially offset by additional depreciation expense related to the opening of new restaurants and the relocation or remodel of our existing restaurants.
Depreciation and amortization increased for 2016 as compared to 2015 primarily due to the opening of new restaurants and the remodeling of existing restaurants, partially offset by lower depreciation expense related to: (i) the refranchising of Outback South Korea, (ii) impairments related to the Bonefish Grill Restructuring and (iii) the effect of foreign currency translation.
General and administrative expenses
General and administrative expense includes salaries and benefits, management incentive programs, related payroll tax and benefits, other employee-related costs and professional services. Following is a summary of the changes in general and administrative expenses:
FISCAL YEAR | |||||||
(dollars in millions): | 2017 | 2016 | |||||
For fiscal years 2016 and 2015 | $ | 268.0 | $ | 287.6 | |||
Change from: | |||||||
Incentive compensation (1) | 23.0 | (9.4 | ) | ||||
Legal and professional fees | 5.9 | (5.2 | ) | ||||
Severance | 4.4 | 3.6 | |||||
Life insurance and deferred compensation | 2.8 | (10.2 | ) | ||||
Foreign currency exchange | 2.6 | (3.4 | ) | ||||
Computer expense | 1.7 | 1.0 | |||||
Employee stock-based compensation | — | 1.5 | |||||
Compensation, benefits and payroll tax | (4.9 | ) | — | ||||
Other | 3.5 | 2.5 | |||||
For fiscal years 2017 and 2016 | $ | 307.0 | $ | 268.0 | |||
____________________
(1) | The increase in incentive compensation was driven by improved sales and profit performance against current year objectives. |
Provision for impaired assets and restaurant closings
FISCAL YEAR | FISCAL YEAR | ||||||||||||||||||||||
(dollars in millions): | 2017 | 2016 | Change | 2016 | 2015 | Change | |||||||||||||||||
Provision for impaired assets and restaurant closings | $ | 52.3 | $ | 104.6 | $ | (52.3 | ) | $ | 104.6 | $ | 36.7 | $ | 67.9 | ||||||||||
42
BLOOMIN’ BRANDS, INC.
MANAGEMENT’S DISCUSSION AND ANALYSIS OF
FINANCIAL CONDITION AND RESULTS OF OPERATIONS - Continued
Restructuring and Closure Initiatives - Following is a summary of expenses related to the 2017 Closure Initiative, Bonefish Restructuring and Pre-2015 Restaurant Closure Initiatives (the “Closure Initiatives”) recognized in Provision for impaired assets and restaurant closings in our Consolidated Statements of Operations and Comprehensive Income for the periods indicated:
FISCAL YEAR | |||||||||||
(dollars in millions) | 2017 | 2016 | 2015 | ||||||||
Impairment, facility closure and other expenses | |||||||||||
2017 Closure Initiative (1) | $ | 20.4 | $ | 46.5 | $ | — | |||||
Bonefish Restructuring (2) | 3.8 | 4.9 | 24.2 | ||||||||
Pre-2015 Closure Initiatives (3) | — | — | 7.6 | ||||||||
Impairment, facility closure and other expenses for Closure Initiatives | $ | 24.2 | $ | 51.4 | $ | 31.8 | |||||
________________
(1) | On February 15, 2017 and August 28, 2017, we decided to close 43 underperforming restaurants in the U.S. and two Abbraccio restaurants outside of the core markets of São Paulo and Rio de Janeiro in Brazil (the “2017 Closure Initiative”). In connection with the 2017 Closure Initiative, we reassessed the future undiscounted cash flows of the impacted restaurants, and as a result, we recognized pre-tax asset impairments. We expect to incur additional charges of approximately $2.9 million to $3.8 million for the 2017 Closure Initiative over the next two years, including costs associated with lease obligations. |
(2) | In February 2016, we decided to close 14 Bonefish restaurants (the “Bonefish Restructuring”). We expect to substantially complete these restaurant closings through the first quarter of 2019 and we expect to incur additional charges of approximately $1.6 million to $2.3 million for the Bonefish Restructuring over the next two years, including costs associated with lease obligations. |
(3) | During 2014 and 2013, we decided to close 36 underperforming international locations, primarily in South Korea and 22 underperforming domestic locations (the “Pre-2015 Closure Initiatives”). |
Sale of Outback Steakhouse South Korea - On July 25, 2016, we completed the sale of Outback Steakhouse South Korea, converting all restaurants in that market to franchised locations. In connection with the decision to sell Outback Steakhouse South Korea, we recognized an impairment charge of $39.6 million during 2016.
Surplus Properties - During 2017, we recognized impairment charges of $10.7 million in connection with the remeasurement of certain held and used surplus properties.
Other Impairments - During the fourth quarter of 2017, we recognized asset impairment charges of $6.3 million for our China subsidiary. During 2016, we recognized impairment charges of $3.5 million for our Puerto Rico subsidiary.
The remaining restaurant impairment and closing charges resulted from: (i) the carrying value of a restaurant’s assets exceeding its estimated fair market value, primarily due to locations identified for relocation, sale or closure and (ii) lease liabilities.
Income from operations
FISCAL YEAR | FISCAL YEAR | ||||||||||||||||||||
(dollars in millions): | 2017 | 2016 | Change | 2016 | 2015 | Change | |||||||||||||||
Income from operations | $ | 146.1 | $ | 127.6 | $ | 127.6 | $ | 230.9 | |||||||||||||
% of Total revenues | 3.5 | % | 3.0 | % | 0.5 | % | 3.0 | % | 5.3 | % | (2.3 | )% | |||||||||
The increase in income from operations during 2017 as compared to 2016 was primarily due to lower impairment charges, primarily related to the 2017 Closure Initiative and refranchising of Outback Steakhouse South Korea in 2016, the impact of the 53rd week in 2017, increases in franchise and other revenues and increases in average check per person. These increases were partially offset by higher general and administrative expense and labor costs.
The decrease in income from operations during 2016 as compared to 2015 was primarily due to impairment charges incurred in connection with the 2017 Closure Initiative and the refranchising of Outback South Korea, higher labor
43
BLOOMIN’ BRANDS, INC.
MANAGEMENT’S DISCUSSION AND ANALYSIS OF
FINANCIAL CONDITION AND RESULTS OF OPERATIONS - Continued
costs and commodity and operating expense inflation. These decreases were partially offset by lower general and administrative expense, the impact of certain cost saving initiatives and increases in average check per person.
Loss on defeasance, extinguishment and modification of debt
FISCAL YEAR | FISCAL YEAR | ||||||||||||||||||||||
(dollars in millions) | 2017 | 2016 | Change | 2016 | 2015 | Change | |||||||||||||||||
Loss on defeasance, extinguishment and modification of debt | $ | 1.1 | $ | 27.0 | $ | (25.9 | ) | $ | 27.0 | $ | 3.0 | $ | 24.0 | ||||||||||
We recognized a loss on defeasance, extinguishment and modification of debt in connection with the: (i) the defeasance of the 2012 CMBS loan and the amendment of the PRP Mortgage Loan in 2016 and (ii) the refinancing of our Senior Secured Credit Facility in 2017 and 2015.
Other income (expense), net
Other income (expense), net, includes items deemed to be non-operating based on management’s assessment of the nature of the item in relation to our core operations:
FISCAL YEAR | FISCAL YEAR | ||||||||||||||||||||||
(dollars in millions): | 2017 | 2016 | Change | 2016 | 2015 | Change | |||||||||||||||||
Other income (expense), net | $ | 14.9 | $ | 1.6 | $ | 13.3 | $ | 1.6 | $ | (0.9 | ) | $ | 2.5 | ||||||||||
We recorded other income (expense) primarily in connection with: (i) gains on sale of 55 of our U.S. Company-owned locations during 2017, (ii) a gain on refranchising of Outback Steakhouse South Korea in 2016 and (iii) a loss on sale of our Roy’s business during 2015.
Interest expense, net
FISCAL YEAR | FISCAL YEAR | ||||||||||||||||||||||
(dollars in millions): | 2017 | 2016 | Change | 2016 | 2015 | Change | |||||||||||||||||
Interest expense, net | $ | 41.4 | $ | 45.7 | $ | (4.3 | ) | $ | 45.7 | $ | 56.2 | $ | (10.5 | ) | |||||||||
The decrease in interest expense, net in 2017 as compared to 2016 was primarily due to refinancing of the 2012 CMBS loan in February 2016 and subsequent repayment of the PRP Mortgage loan in April 2017, partially offset by additional draws on our revolving credit facility and increasing interest rates.
The decrease in interest expense, net in 2016 as compared to 2015 was primarily due to the refinancing of the 2012 CMBS loan in February 2016, partially offset by deferred financing fee amortization, additional draws on our revolving credit facility and expense related to the interest rate swaps.
Provision for income taxes
FISCAL YEAR | FISCAL YEAR | ||||||||||||||||
2017 | 2016 | Change | 2016 | 2015 | Change | ||||||||||||
Effective income tax rate | 13.5 | % | 18.0 | % | (4.5 | )% | 18.0 | % | 23.0 | % | (5.0 | )% | |||||
The net decrease in the effective income tax rate in 2017 as compared to 2016 was primarily due to impairment and additional tax liabilities recorded in connection with the refranchising of Outback Steakhouse South Korea in 2016. The remaining decrease was primarily due to a domestic manufacturing deduction and excess tax benefits from equity-
44
BLOOMIN’ BRANDS, INC.
MANAGEMENT’S DISCUSSION AND ANALYSIS OF
FINANCIAL CONDITION AND RESULTS OF OPERATIONS - Continued
based compensation arrangements recorded in 2017. These decreases were mostly offset by employment-related credits being a lower percentage of net income in 2017 relative to 2016 and the impact of the Tax Act.
The net decrease in the effective income tax rate in 2016 as compared to 2015 was primarily due to benefits from employment-related credits being a higher percentage of net income in 2016 and a change in the amount and mix of income and losses across our domestic and international subsidiaries, partially offset by the refranchising of Outback Steakhouse South Korea.
The effective income tax rate for 2017, 2016 and 2015 was lower than the blended federal and state statutory rate of 39.0%, primarily due to the benefit of tax credits for FICA taxes on certain employees’ tips.
We estimate our effective income tax rate for 2018 will be between 9% and 10%.
Segments
We have two reportable segments, U.S. and International, which reflects how we manage our business, review operating performance and allocate resources. The U.S. segment includes all brands operating in the U.S. while brands operating outside the U.S. are included in the International segment. Resources are allocated and performance is assessed by our Chief Executive Officer, whom we have determined to be our Chief Operating Decision Maker.
Revenues for both segments include only transactions with customers and excludes intersegment revenues. Excluded from income from operations for U.S. and International are legal and certain corporate costs not directly related to the performance of the segments, certain stock-based compensation expenses and certain bonus expense.
Following is a reconciliation of segment income (loss) from operations to the consolidated operating results:
FISCAL YEAR | |||||||||||
(dollars in thousands) | 2017 | 2016 | 2015 | ||||||||
Segment income (loss) from operations | |||||||||||
U.S. | $ | 297,260 | $ | 286,683 | $ | 348,731 | |||||
International | 28,916 | (5,954 | ) | 34,597 | |||||||
Total segment income from operations | 326,176 | 280,729 | 383,328 | ||||||||
Unallocated corporate operating expense | (180,084 | ) | (153,123 | ) | (152,403 | ) | |||||
Total income from operations | 146,092 | 127,606 | 230,925 | ||||||||
Loss on defeasance, extinguishment and modification of debt | (1,069 | ) | (26,998 | ) | (2,956 | ) | |||||
Other income (expense), net | 14,912 | 1,609 | (939 | ) | |||||||
Interest expense, net | (41,392 | ) | (45,726 | ) | (56,176 | ) | |||||
Income before Provision for income taxes | $ | 118,543 | $ | 56,491 | $ | 170,854 | |||||
45
BLOOMIN’ BRANDS, INC.
MANAGEMENT’S DISCUSSION AND ANALYSIS OF
FINANCIAL CONDITION AND RESULTS OF OPERATIONS - Continued
U.S. Segment
FISCAL YEAR | |||||||||||
(dollars in thousands) | 2017 | 2016 | 2015 | ||||||||
Revenues | |||||||||||
Restaurant sales | $ | 3,718,261 | $ | 3,777,907 | $ | 3,857,162 | |||||
Franchise and other revenues | 32,698 | 19,402 | 22,581 | ||||||||
Total revenues | $ | 3,750,959 | $ | 3,797,309 | $ | 3,879,743 | |||||
Restaurant-level operating margin | 15.1 | % | 15.4 | % | 16.0 | % | |||||
Income from operations | 297,260 | 286,683 | 348,731 | ||||||||
Operating income margin | 7.9 | % | 7.5 | % | 9.0 | % | |||||
Restaurant sales
Following is a summary of the change in U.S. segment Restaurant sales for 2017 and 2016:
FISCAL YEAR | |||||||
(dollars in millions) | 2017 (1) | 2016 | |||||
For fiscal years 2016 and 2015 | $ | 3,777.9 | $ | 3,857.2 | |||
Change from: | |||||||
Divestiture of restaurants through refranchising transactions (2) | (118.9 | ) | (5.7 | ) | |||
Restaurant closings | (81.2 | ) | (25.1 | ) | |||
Restaurant openings (3) | 33.7 | 24.0 | |||||
Comparable restaurant sales (3) | 106.8 | (72.5 | ) | ||||
For fiscal years 2017 and 2016 | $ | 3,718.3 | $ | 3,777.9 | |||
(1) | Includes $79.9 million of additional restaurant sales from the 53rd week of 2017. |
(2) | Fiscal year 2016 includes $5.7 million related to divestiture of Roy’s. |
(3) | Summation of quarterly changes for restaurant openings and comparable restaurant sales will not total to annual amounts as the restaurants that meet the definition of a comparable restaurant will differ each period based on when the restaurant opened. |
The decrease in U.S. Restaurant sales in 2017 was primarily attributable to the refranchising of certain Company-owned restaurants during the second quarter and the closing of 52 restaurants since December 27, 2015. The decrease in U.S. Restaurant sales was partially offset by: (i) restaurant sales during the 53rd week of 2017, (ii) sales from 21 new restaurants not included in our comparable restaurant sales base and (iii) an increase in comparable restaurant sales.
The decrease in U.S. Restaurant sales in 2016 as compared to 2015 was primarily attributable to: (i) lower comparable restaurant sales, (ii) the closing of 18 restaurants since December 28, 2014 and (iii) the sale of 20 Roy’s restaurants in January 2015. The decrease in U.S. Restaurant sales was partially offset by sales from 38 new restaurants not included in our comparable restaurant sales base.
Restaurant-level operating margin
The decrease in U.S. restaurant-level operating margin in 2017 as compared to 2016 was primarily due to: (i) higher kitchen and service labor costs due to higher wage rates and investments in our service model, (ii) an increase in operating expenses due to inflation and timing and (iii) higher net rent expense due to the sale-leaseback of certain properties. These increases were partially offset by: (i) lower advertising expense, (ii) the impact of certain cost saving initiatives and (iii) increases in average check per person.
46
BLOOMIN’ BRANDS, INC.
MANAGEMENT’S DISCUSSION AND ANALYSIS OF
FINANCIAL CONDITION AND RESULTS OF OPERATIONS - Continued
The decrease in U.S. restaurant-level operating margin in 2016 as compared to 2015 was primarily due to: (i) higher kitchen and service labor costs due to higher wage rates and investments in our service model, (ii) an increase in operating expenses due to inflation and timing and (iii) higher net rent expense due to the sale-leaseback of certain properties. These increases were partially offset by: (i) the impact of certain cost saving initiatives and (ii) increases in average check per person.
Income from operations
The increase in U.S. income from operations generated in 2017 as compared to 2016 was primarily due to: (i) lower impairment and restaurant closing costs, primarily related to the 2017 Closure Initiative in 2016 and (ii) increases in franchise and other revenues, partially offset by a decrease in operating margin at the restaurant-level.
The decrease in U.S. income from operations generated in 2016 as compared to 2015 was primarily due to: (i) higher impairment and restaurant closing costs, primarily related to the 2017 Closure Initiative and (ii) lower operating margin at the restaurant level, partially offset by lower general and administrative expense. General and administrative expense for the U.S. segment decreased primarily from lower deferred compensation expense due to the acquisition of a managing partner’s interests in certain Outback Steakhouse restaurants.
International Segment
FISCAL YEAR | |||||||||||
(dollars in thousands) | 2017 | 2016 | 2015 | ||||||||
Revenues | |||||||||||
Restaurant sales | $ | 450,397 | $ | 448,150 | $ | 492,759 | |||||
Franchise and other revenues | 11,990 | 6,853 | 5,174 | ||||||||
Total revenues | $ | 462,387 | $ | 455,003 | $ | 497,933 | |||||
Restaurant-level operating margin | 20.6 | % | 18.8 | % | 19.3 | % | |||||
Income (loss) from operations | 28,916 | (5,954 | ) | 34,597 | |||||||
Operating income (loss) margin | 6.3 | % | (1.3 | )% | 6.9 | % | |||||
Restaurant sales
Following is a summary of the change in International Segment Restaurant sales:
FISCAL YEAR | |||||||
(dollars in millions) | 2017 | 2016 | |||||
For fiscal years 2016 and 2015 | $ | 448.2 | $ | 492.8 | |||
Change from: | |||||||
Restaurant openings (1) | 41.9 | 62.2 | |||||
Effect of foreign currency translation | 36.0 | (31.6 | ) | ||||
Comparable restaurant sales (1) | 17.9 | 14.8 | |||||
Refranchising of Outback Steakhouse South Korea | (90.5 | ) | (81.2 | ) | |||
Restaurant closings | (3.1 | ) | (8.8 | ) | |||
For fiscal years 2017 and 2016 | $ | 450.4 | $ | 448.2 | |||
____________________
(1) | Summation of quarterly changes for restaurant openings and comparable restaurant sales will not total to annual amounts as the restaurants that meet the definition of a comparable restaurant will differ each period based on when the restaurant opened. |
The increase in Restaurant sales in 2017 was primarily attributable to: (i) sales from 48 new restaurants not included in our comparable restaurant sales base, (ii) the effect of foreign currency translation due to appreciation of the Brazilian
47
BLOOMIN’ BRANDS, INC.
MANAGEMENT’S DISCUSSION AND ANALYSIS OF
FINANCIAL CONDITION AND RESULTS OF OPERATIONS - Continued
Real and (iii) an increase in comparable restaurant sales. The increase in restaurant sales was partially offset by the refranchising of 72 Outback Steakhouse South Korea restaurants in July 2016.
The decrease in Restaurant sales in 2016 as compared to 2015 was primarily attributable to: (i) the refranchising of 72 Outback Steakhouse South Korea restaurants in July 2016, (ii) the effect of foreign currency translation and (iii) the closing of six restaurants since December 28, 2014. The decrease in restaurant sales was partially offset by: (i) sales from 54 new restaurants not included in our comparable restaurant sales base and (ii) an increase in comparable restaurant sales.
Restaurant-level operating margin
The increase in International restaurant-level operating margin in 2017 as compared to 2016 was primarily due to: (i) increases in average check per person, (ii) the impact of the refranchising of Outback Steakhouse South Korea in 2016 and (iii) the impact of certain cost saving initiatives. The increase was partially offset by labor, commodity and operating expense inflation.
The decrease in International restaurant-level operating margin in 2016 as compared to 2015 was primarily due to: (i) higher commodity and labor inflation and (ii) higher operating expenses due to inflation. The decrease was partially offset by: (i) increases in average check per person and (ii) the impact of certain cost saving initiatives.
Income (loss) from operations
The increase in International income from operations in 2017 as compared to 2016 was primarily due to: (i) lower impairment charges, primarily related to the refranchising of Outback Steakhouse South Korea in 2016, (ii) higher operating margin at the restaurant-level and (iii) increases in franchise and other revenues, partially offset by higher general and administrative expense. General and administrative expense for the International segment increased primarily from the effects of foreign currency translation.
The decrease in International income from operations in 2016 as compared to 2015 was primarily due to higher impairment charges related to the refranchising of Outback Steakhouse South Korea and lower operating margin at the restaurant-level, partially offset by lower general and administrative expense.
Non-GAAP Financial Measures
In addition to the results provided in accordance with U.S. GAAP, we provide certain non-GAAP measures, which present operating results on an adjusted basis. These are supplemental measures of performance that are not required by or presented in accordance with U.S. GAAP and include the following: (i) system-wide sales, (ii) Adjusted restaurant-level operating margins, (iii) Adjusted income from operations and the corresponding margins, (iv) Adjusted net income and (v) Adjusted diluted earnings per share.
We believe that our use of non-GAAP financial measures permits investors to assess the operating performance of our business relative to our performance based on U.S. GAAP results and relative to other companies within the restaurant industry by isolating the effects of certain items that may vary from period to period without correlation to core operating performance or that vary widely among similar companies. However, our inclusion of these adjusted measures should not be construed as an indication that our future results will be unaffected by unusual or infrequent items or that the items for which we have made adjustments are unusual or infrequent or will not recur. We believe that the disclosure of these non-GAAP measures is useful to investors as they form part of the basis for how our management team and Board of Directors evaluate our operating performance, allocate resources and establish employee incentive plans.
These non-GAAP financial measures are not intended to replace U.S. GAAP financial measures, and they are not necessarily standardized or comparable to similarly titled measures used by other companies. We maintain internal
48
BLOOMIN’ BRANDS, INC.
MANAGEMENT’S DISCUSSION AND ANALYSIS OF
FINANCIAL CONDITION AND RESULTS OF OPERATIONS - Continued
guidelines with respect to the types of adjustments we include in our non-GAAP measures. These guidelines endeavor to differentiate between types of gains and expenses that are reflective of our core operations in a period, and those that may vary from period to period without correlation to our core performance in that period. However, implementation of these guidelines necessarily involves the application of judgment, and the treatment of any items not directly addressed by, or changes to, our guidelines will be considered by our disclosure committee. Refer to the reconciliations of non-GAAP measures for descriptions of the actual adjustments made in the current period and the corresponding prior period.
As previously announced, based on a review of our non-GAAP presentations, we determined that, commencing with our results for the first fiscal quarter of 2017, when presenting the non-GAAP measures Adjusted income from operations and the corresponding margins, Adjusted net income and Adjusted diluted earnings per share, we no longer adjust for expenses incurred in connection with our remodel program or intangible amortization recorded as a result of the acquisition of our Brazil operations. We recast the historical comparable periods to conform to the revised presentation.
System-Wide Sales
System-wide sales is a non-GAAP financial measure that includes sales of all restaurants operating under our brand names, whether we own them or not. Management uses this information to make decisions about future plans for the development of additional restaurants and new concepts, as well as evaluation of current operations. System-wide sales comprise sales of Company-owned and franchised restaurants.
Following is a summary of sales of Company-owned restaurants:
FISCAL YEAR | |||||||||||
COMPANY-OWNED RESTAURANT SALES (dollars in millions): | 2017 | 2016 | 2015 | ||||||||
U.S. | |||||||||||
Outback Steakhouse (1) | $ | 2,136 | $ | 2,180 | $ | 2,226 | |||||
Carrabba’s Italian Grill (1) | 677 | 696 | 720 | ||||||||
Bonefish Grill | 605 | 617 | 623 | ||||||||
Fleming’s Prime Steakhouse & Wine Bar | 300 | 285 | 280 | ||||||||
Other | 1 | — | 8 | ||||||||
U.S. Total | 3,719 | 3,778 | 3,857 | ||||||||
International | |||||||||||
Outback Steakhouse-Brazil | 377 | 303 | 283 | ||||||||
Outback Steakhouse-South Korea (2) | — | 90 | 172 | ||||||||
Other | 73 | 55 | 38 | ||||||||
International Total | 450 | 448 | 493 | ||||||||
Total Company-owned restaurant sales | $ | 4,169 | $ | 4,226 | $ | 4,350 | |||||
____________________
(1) | In 2017, we sold 53 Outback Steakhouse restaurants and one Carrabba’s Italian Grill restaurant, which are now operated as franchises. |
(2) | On July 25, 2016, we sold our restaurant locations in South Korea, converting all restaurants in that market to franchised locations. |
49
BLOOMIN’ BRANDS, INC.
MANAGEMENT’S DISCUSSION AND ANALYSIS OF
FINANCIAL CONDITION AND RESULTS OF OPERATIONS - Continued
The following table provides a summary of sales of franchised restaurants, which are not included in our consolidated financial results, and our income from the royalties and/or service fees that franchisees pay us based generally on a percentage of sales. The following table does not represent our sales and is presented only as an indicator of changes in the restaurant system, which management believes is important information regarding the health of our restaurant concepts and in determining our royalties and/or service fees.
FISCAL YEAR | |||||||||||
FRANCHISE SALES (dollars in millions): (1) | 2017 | 2016 | 2015 | ||||||||
U.S. | |||||||||||
Outback Steakhouse (2) | $ | 459 | $ | 334 | $ | 340 | |||||
Carrabba's Italian Grill (2) | 10 | 11 | 9 | ||||||||
Bonefish Grill | 14 | 13 | 12 | ||||||||
U.S. Total | 483 | 358 | 361 | ||||||||
International | |||||||||||
Outback Steakhouse-South Korea (3) | 186 | 74 | — | ||||||||
Other | 115 | 111 | 115 | ||||||||
International Total | 301 | 185 | 115 | ||||||||
Total franchise sales (1) | $ | 784 | $ | 543 | $ | 476 | |||||
Income from franchises (4) | $ | 33 | $ | 20 | $ | 18 | |||||
____________________
(1) | Franchise sales are not included in Total revenues in the Consolidated Statements of Operations and Comprehensive Income. |
(2) | In 2017, we sold 53 Outback Steakhouse restaurants and one Carrabba’s Italian Grill restaurant, which are now operated as franchises. |
(3) | On July 25, 2016, we sold our restaurant locations in South Korea, converting all restaurants in that market to franchised locations. |
(4) | Represents the franchise royalty income and initial franchise fees included in the Consolidated Statements of Operations and Comprehensive Income in Franchise and other revenues. |
Adjusted restaurant-level operating margin
Restaurant-level operating margin is calculated as Restaurant sales after deduction of the main restaurant-level operating costs, which includes Cost of sales, Labor and other related and Other restaurant operating expenses. Adjusted restaurant-level operating margin is Restaurant-level operating margin adjusted for certain items, as noted below. The following tables show the percentages of certain operating cost financial statement line items in relation to Restaurant sales on both a U.S. GAAP basis and an adjusted basis, as indicated:
FISCAL YEAR | |||||||||||||||||
2017 | 2016 | 2015 | |||||||||||||||
U.S. GAAP | ADJUSTED (1) | U.S. GAAP | ADJUSTED (2) | U.S. GAAP | ADJUSTED (3) | ||||||||||||
Restaurant sales | 100.0 | % | 100.0 | % | 100.0 | % | 100.0 | % | 100.0 | % | 100.0 | % | |||||
Cost of sales | 31.6 | % | 31.6 | % | 32.1 | % | 32.1 | % | 32.6 | % | 32.6 | % | |||||
Labor and other related | 29.3 | % | 29.3 | % | 28.7 | % | 28.7 | % | 27.7 | % | 27.8 | % | |||||
Other restaurant operating | 23.5 | % | 23.6 | % | 23.5 | % | 23.6 | % | 23.1 | % | 23.1 | % | |||||
Restaurant-level operating margin | 15.7 | % | 15.5 | % | 15.8 | % | 15.7 | % | 16.5 | % | 16.5 | % | |||||
_________________
(1) | Includes adjustments for the write-off of $5.7 million of deferred rent liabilities associated with approved closure and restructuring initiatives and our relocation program, recorded in Other restaurant operating. |
(2) | Includes adjustments for the write-off of $5.9 million of deferred rent liabilities, primarily related to approved closure and restructuring initiatives, partially offset by $2.3 million of legal settlement costs related to the Sears matter. The reversal of the deferred rent liabilities and the legal settlement were recorded in Other restaurant operating. |
(3) | Includes adjustments for the favorable resolution of payroll tax audit contingencies of $5.6 million, partially offset by legal settlement costs of $4.0 million, primarily related to the Cordoza litigation. The payroll audit adjustment was recorded in Labor and other related and the legal settlement was recorded in Other restaurant operating. |
50
BLOOMIN’ BRANDS, INC.
MANAGEMENT’S DISCUSSION AND ANALYSIS OF
FINANCIAL CONDITION AND RESULTS OF OPERATIONS - Continued
Adjusted income from operations, Adjusted net income and Adjusted diluted earnings per share
The following table reconciles Adjusted income from operations and the corresponding margins, Adjusted net income and Adjusted diluted earnings per share to their respective most comparable U.S. GAAP measures:
FISCAL YEAR | |||||||||||
(dollars in thousands, except per share amounts) | 2017 | 2016 | 2015 | ||||||||
Income from operations | $ | 146,092 | $ | 127,606 | $ | 230,925 | |||||
Operating income margin | 3.5 | % | 3.0 | % | 5.3 | % | |||||
Adjustments: | |||||||||||
Restaurant impairments and closing costs (1) | 23,770 | 45,806 | 33,507 | ||||||||
Asset impairments and related costs (2) | 18,997 | 44,680 | 746 | ||||||||
Restaurant relocations and related costs (3) | 12,539 | 8,971 | 3,185 | ||||||||
Severance (4) | 11,006 | 5,463 | — | ||||||||
Transaction-related expenses (5) | 1,447 | 1,910 | 1,294 | ||||||||
Legal and contingent matters (6) | 553 | 2,340 | 5,843 | ||||||||
Payroll tax audit contingency (7) | — | — | (5,587 | ) | |||||||
Total income from operations adjustments | $ | 68,312 | $ | 109,170 | $ | 38,988 | |||||
Adjusted income from operations | $ | 214,404 | $ | 236,776 | $ | 269,913 | |||||
Adjusted operating income margin | 5.1 | % | 5.6 | % | 6.2 | % | |||||
Net income attributable to Bloomin’ Brands | $ | 100,243 | $ | 41,748 | $ | 127,327 | |||||
Adjustments: | |||||||||||
Income from operations adjustments | 68,312 | 109,170 | 38,988 | ||||||||
Loss on defeasance, extinguishment and modification of debt (8) | 1,069 | 26,998 | 2,956 | ||||||||
Gain on disposal of business and other costs (9) | (14,854 | ) | (1,632 | ) | 1,328 | ||||||
Total adjustments, before income taxes | 54,527 | 134,536 | 43,272 | ||||||||
Adjustment to provision for income taxes (7) (10) | (18,885 | ) | (33,100 | ) | (13,669 | ) | |||||
Net adjustments | 35,642 | 101,436 | 29,603 | ||||||||
Adjusted net income | $ | 135,885 | $ | 143,184 | $ | 156,930 | |||||
Diluted earnings per share | $ | 1.01 | $ | 0.37 | $ | 1.01 | |||||
Adjusted diluted earnings per share | $ | 1.36 | $ | 1.25 | $ | 1.25 | |||||
Diluted weighted average common shares outstanding | 99,707 | 114,311 | 125,585 | ||||||||
_________________
(1) | Represents expenses incurred primarily for approved closure and restructuring initiatives. |
(2) | Represents asset impairment charges and related costs primarily associated with: (i) the remeasurement of certain surplus properties in 2017, (ii) our China subsidiary in 2017, (iii) our Puerto Rico subsidiary in 2016, (iv) the decision to sell Outback Steakhouse South Korea in 2016 and (v) the sale of corporate aircraft in 2015. |
(3) | Represents asset impairment charges and accelerated depreciation incurred in connection with our relocation program. |
(4) | Relates to severance expense incurred as a result of: (i) restructuring events in 2017 and 2016 and (ii) the relocation of our Fleming’s operations center to the corporate home office in 2016. |
(5) | Relates primarily to the following: (i) professional fees related to certain income tax items in which the associated tax benefit is adjusted in Adjustments to provision for income taxes in 2017, as described in footnote 10 to this table and (ii) costs incurred in connection with our sale-leaseback initiative. |
(6) | Represents fees and expenses related to certain legal and contingent matters, including the Sears litigation in 2016 and the Cardoza litigation in 2015. |
(7) | Relates to a payroll tax audit contingency adjustment for the employer’s share of FICA taxes related to cash tips allegedly received and unreported by our employees during calendar year 2011, which is recorded in Labor and other related. In addition, a deferred income tax adjustment has been recorded for the allowable income tax credits for the employer's share expected to be paid, included in Provision for income taxes and offsets the adjustment to Labor and other related expenses. As a result, there is no impact to Net income from this adjustment. |
51
BLOOMIN’ BRANDS, INC.
MANAGEMENT’S DISCUSSION AND ANALYSIS OF
FINANCIAL CONDITION AND RESULTS OF OPERATIONS - Continued
(8) | Relates to: (i) refinancing of our Senior Secured Credit Facility in 2017 and 2015, (ii) modification of our Credit Agreement in 2017 and (iii) amendment of the PRP Mortgage loan and defeasance of the 2012 CMBS loan in 2016. |
(9) | Primarily relates to: (i) gains on the sale of 55 U.S. Company-owned restaurants in 2017, (ii) expenses related to certain surplus properties in 2017 and (iii) a gain on the refranchising of Outback Steakhouse South Korea during 2016. |
(10) | Includes the impact of the Tax Act ($1.9 million), other discretionary tax adjustments, including the allowable income tax credits in 2015 for the employer’s share of FICA taxes discussed in footnote 7 above, and the income tax effect of non-GAAP adjustments. |
52
BLOOMIN’ BRANDS, INC.
MANAGEMENT’S DISCUSSION AND ANALYSIS OF
FINANCIAL CONDITION AND RESULTS OF OPERATIONS - Continued
Liquidity and Capital Resources
LIQUIDITY
Our liquidity sources consist of cash flow from our operations, cash and cash equivalents and credit capacity under our credit facilities. We expect to use cash primarily for general operating expenses, share repurchases and dividend payments, remodeling or relocating older restaurants, principal and interest payments on our debt, development of new restaurants and new markets, obligations related to our deferred compensation plans and investments in technology.
We believe that our expected liquidity sources are adequate to fund debt service requirements, lease obligations, capital expenditures and working capital obligations for the 12 months following this filing. However, our ability to continue to meet these requirements and obligations will depend on, among other things, our ability to achieve anticipated levels of revenue and cash flow and our ability to manage costs and working capital successfully.
Cash and Cash Equivalents - As of December 31, 2017, we had $128.3 million in cash and cash equivalents, of which $38.2 million was held by foreign affiliates. The international jurisdictions in which we have significant cash do not have any known restrictions that would prohibit the repatriation of cash and cash equivalents.
We previously considered the earnings in our non-U.S. subsidiaries to be indefinitely reinvested and, accordingly, recorded no deferred income taxes. Given the Tax Act’s significant changes and potential opportunities to repatriate cash free of U.S. federal tax, we are in the process of evaluating our current permanent reinvestment assertions. This evaluation includes the repatriation of historical earnings (2017 and prior) that have been previously taxed under the Tax Act. See Note 18 - Income Taxes of the Notes to Consolidated Financial Statements for further information regarding the Tax Act.
As of December 31, 2017, we had aggregate undistributed untaxed accumulated and current earnings and profits (‘E&P”) from foreign subsidiaries of approximately $136.0 million, which is considered previously taxed income (“PTI”) subsequent to the Tax Act. We recorded $0.1 million in provisional Transition Tax in connection with this E&P. Due to the ability to utilize foreign tax credits in the calculation of the Transition Tax, the obligation primarily related to the estimated state impacts. Additionally, we have recorded a deferred tax liability of $0.2 million as of December 31, 2017 for certain state income taxes on the potential future repatriation of PTI as a result of this assertion. We currently consider the remaining financial statement carrying amounts over the tax basis of our investments in our foreign subsidiaries to be indefinitely reinvested, and have not recorded a deferred tax liability. The determination of any unrecorded deferred tax liability on this amount is not practicable due to the uncertainty of how these investments would be recovered.
Restructuring - Total aggregate future undiscounted cash expenditures of $31.9 million to $38.7 million for the 2017 Closure Initiative and Bonefish Restructuring, primarily related to lease liabilities, are expected to occur over the remaining lease terms with the final term ending in January 2029.
Capital Expenditures - We estimate that our capital expenditures will total approximately $200.0 million in 2018. The amount of actual capital expenditures may be affected by general economic, financial, competitive, legislative and regulatory factors, among other things, including restrictions imposed by our borrowing arrangements.
Refranchising and Sale Transactions - During 2017, we refranchised 54 and sold one of our U.S. Company-owned Outback Steakhouse and Carrabba’s Italian Grill locations for aggregate cash proceeds of $46.1 million, net of certain closing adjustments.
On July 25, 2016, we sold Outback Steakhouse South Korea for a purchase price of $50.0 million, converting all restaurants in that market to franchised locations.
53
BLOOMIN’ BRANDS, INC.
MANAGEMENT’S DISCUSSION AND ANALYSIS OF
FINANCIAL CONDITION AND RESULTS OF OPERATIONS - Continued
Sale-Leaseback Transactions - During 2017 and 2016, we entered into sale-leaseback transactions with third-parties in which we sold 31 and 159 restaurant properties at fair market value for gross proceeds of $108.0 million and $560.4 million, respectively. With the proceeds from these transactions, we repaid our PRP Mortgage Loan in full.
Credit Facilities - As of December 31, 2017, we had $1.1 billion of outstanding borrowings under our Senior Secured Credit Facility. See Note 12 - Long-term Debt, Net of the Notes to Consolidated Financial Statements for further information. Following is a summary of principal payments and debt issuance:
FORMER CREDIT FACILITY | SENIOR SECURED CREDIT FACILITY | 2012 CMBS LOAN | PRP MORTGAGE LOAN | TOTAL CREDIT FACILITIES | |||||||||||||||||||||||
TERM LOANS | REVOLVING FACILITY | TERM LOAN A | REVOLVING FACILITY | ||||||||||||||||||||||||
(dollars in thousands) | |||||||||||||||||||||||||||
Balance as of December 27, 2015 | $ | 427,500 | $ | 432,000 | $ | — | $ | — | $ | 458,969 | $ | — | $ | 1,318,469 | |||||||||||||
2016 new debt (1) | — | 729,500 | — | — | — | 369,512 | 1,099,012 | ||||||||||||||||||||
2016 payments (1) | (28,125 | ) | (539,500 | ) | — | — | (458,969 | ) | (322,310 | ) | (1,348,904 | ) | |||||||||||||||
Balance as of December 25, 2016 | 399,375 | 622,000 | — | — | — | 47,202 | 1,068,577 | ||||||||||||||||||||
2017 new debt (2) | 125,000 | 654,500 | 500,000 | 697,000 | — | — | 1,976,500 | ||||||||||||||||||||
2017 payments (2) | (524,375 | ) | (1,276,500 | ) | — | (97,000 | ) | — | (47,202 | ) | (1,945,077 | ) | |||||||||||||||
Balance as of December 31, 2017 | $ | — | $ | — | $ | 500,000 | $ | 600,000 | $ | — | $ | — | $ | 1,100,000 | |||||||||||||
________________
(1) | In February 2016, we drew $185.0 million on our revolving credit facility. The drawdowns, together with the proceeds from the PRP Mortgage Loan, were used to prepay a portion, and fully defease the remainder, of the 2012 CMBS loan. |
(2) | In May 2017, OSI amended its Credit Agreement, which provided an incremental Term loan A-2 in an aggregate principal amount of $125.0 million. A portion of the proceeds were used to repay $25.0 million of our outstanding revolving credit facility. Also includes $1.2 billion related to a refinancing of our Former Credit Facility, which did not materially increase total indebtedness. |
Following is a summary of our outstanding credit facilities:
INTEREST RATE DECEMBER 31, 2017 (1) | ORIGINAL FACILITY | PRINCIPAL MATURITY DATE | OUTSTANDING | |||||||||||||
(dollars in thousands) | DECEMBER 31, 2017 | DECEMBER 25, 2016 | ||||||||||||||
Term loan A | 3.27 | % | $ | 500,000 | November 2022 | $ | 500,000 | $ | — | |||||||
Revolving credit facility | 3.26 | % | 1,000,000 | November 2022 | 600,000 | — | ||||||||||
Total Senior secured credit facility | 1,500,000 | 1,100,000 | — | |||||||||||||
Term loan A | — | % | 300,000 | May 2019 | — | 258,750 | ||||||||||
Term loan A-1 | — | % | 150,000 | May 2019 | — | 140,625 | ||||||||||
Term loan A-2 | — | % | 125,000 | May 2019 | — | — | ||||||||||
Revolving credit facility | — | % | 825,000 | May 2019 | — | 622,000 | ||||||||||
Total Former Credit Facility | 1,400,000 | — | 1,021,375 | |||||||||||||
PRP Mortgage Loan | — | % | 369,512 | February 2018 | — | 47,202 | ||||||||||
Total credit facilities | $ | 3,269,512 | $ | 1,100,000 | $ | 1,068,577 | ||||||||||
(1) | Represents the weighted-average interest rate. |
New Credit Agreement - On November 30, 2017, we entered into a Credit Agreement, including OSI as co-borrower, with a syndicate of institutional lenders, providing for senior secured financing of up to $1.5 billion, consisting of a $500.0 million Term loan A and a $1.0 billion revolving credit facility, including letter of credit and swing line loan sub-facilities. The Senior Secured Credit Facility matures on November 30, 2022.
At closing, $697.0 million was drawn under the revolving credit facility. The proceeds of the Credit Agreement were used to repay OSI’s Former Credit Facility. Our total indebtedness did not materially change as a result of the refinancing.
54
BLOOMIN’ BRANDS, INC.
MANAGEMENT’S DISCUSSION AND ANALYSIS OF
FINANCIAL CONDITION AND RESULTS OF OPERATIONS - Continued
As of December 31, 2017, we had $377.3 million in available unused borrowing capacity under our revolving credit facility, net of letters of credit of $22.7 million.
The Credit Agreement contains mandatory prepayment requirements for the term loans. We are required to prepay outstanding amounts with 50% of our annual excess cash flow, as defined in the Credit Agreement. The amount of outstanding term loans required to be prepaid may vary based on our leverage ratio and year end results. Other than the required minimum amortization premiums of $25.0 million, we do not anticipate any other payments will be required through December 30, 2018.
See Note 12 - Long-term Debt, Net of the Notes to Consolidated Financial Statements for further information regarding the Credit Agreement and Senior Secured Credit Facility.
Debt Covenants - Our Credit Agreement contains various financial and non-financial covenants. A violation of these covenants could negatively impact our liquidity by restricting our ability to borrow under the revolving credit facility and cause an acceleration of the amounts due under the credit facilities. See Note 12 - Long-term Debt, Net of the Notes to our Consolidated Financial Statements for further information.
As of December 31, 2017 and December 25, 2016, we were in compliance with our debt covenants. We believe that
we will remain in compliance with our debt covenants during the next 12 months.
Cash Flow Hedges of Interest Rate Risk - We have variable-to-fixed interest rate swap agreements with eight counterparties to hedge a portion of the cash flows of our variable rate debt. The swap agreements have an aggregate notional amount of $400.0 million and mature on May 16, 2019. We pay a weighted-average fixed rate of 2.02% on the $400.0 million notional amount and receive payments from the counterparty based on the 30-day LIBOR rate. We estimate $1.0 million will be reclassified to interest expense over the next twelve months. See Note 16 - Derivative Instruments and Hedging Activities of the Notes to Consolidated Financial Statements for further information.
SUMMARY OF CASH FLOWS
The following table presents a summary of our cash flows provided by (used in) operating, investing and financing activities for the periods indicated:
FISCAL YEAR | |||||||||||
(dollars in thousands) | 2017 | 2016 | 2015 | ||||||||
Net cash provided by operating activities | $ | 409,002 | $ | 340,587 | $ | 395,139 | |||||
Net cash (used in) provided by investing activities | (123,115 | ) | 295,248 | (187,595 | ) | ||||||
Net cash used in financing activities | (293,505 | ) | (657,978 | ) | (241,001 | ) | |||||
Effect of exchange rate changes on cash and cash equivalents | 975 | 2,955 | (9,193 | ) | |||||||
Net decrease in cash, cash equivalents and restricted cash | $ | (6,643 | ) | $ | (19,188 | ) | $ | (42,650 | ) | ||
Operating activities - Net cash provided by operating activities increased in 2017 as compared to 2016 primarily as a result of the following: (i) lower income tax payments and (ii) the timing of collections of holiday gift card sales from third party vendors. These increases were partially offset by: (i) lower gift card sales and (ii) the timing of purchases of inventory.
Net cash provided by operating activities decreased in 2016 as compared to 2015 primarily as a result of the following: (i) higher income tax payments primarily due to sale-leaseback transactions and (ii) the timing of rent payments. These decreases were partially offset by: (i) utilization of inventory on hand and (ii) lower cash interest payments.
55
BLOOMIN’ BRANDS, INC.
MANAGEMENT’S DISCUSSION AND ANALYSIS OF
FINANCIAL CONDITION AND RESULTS OF OPERATIONS - Continued
Investing activities - Net cash used in investing activities during 2017 consisted primarily of capital expenditures, partially offset by: (i) proceeds from sale-leaseback transactions and (ii) proceeds from refranchising transactions.
Net cash provided by investing activities during 2016 consisted primarily of: (i) proceeds from sale-leaseback transactions and (ii) proceeds from the refranchising of Outback Steakhouse South Korea.
Net cash used in investing activities during 2015 consisted primarily of capital expenditures. Net cash used in investing activities was partially offset by the following: (i) proceeds from other investments, net, (ii) proceeds from the sale of Roy’s and (iii) proceeds from the disposal of property, fixtures and equipment.
Financing activities - Net cash used in financing activities during 2017 was primarily attributable to the following: (i) repayments due to the refinancing of our Former Credit Facility in December 2017, (ii) repayment of our PRP Mortgage Loan, (iii) voluntary repayments of our revolving credit facility, net of drawdowns and (iv) the repurchase of common stock. Net cash used in financing activities was partially offset by proceeds from our new Senior Secured Credit Facility.
Net cash used in financing activities during 2016 was primarily attributable to the following: (i) the defeasance of the 2012 CMBS loan and payments on our PRP Mortgage Loan, (ii) the repurchase of common stock, (iii) the purchase of outstanding noncontrolling interests and limited partnership interests in certain restaurants, (iv) payment of cash dividends on our common stock and (v) repayments of partner deposits and accrued partner obligations. Net cash used in financing activities was partially offset by the following: (i) proceeds from the PRP Mortgage Loan, (ii) drawdowns on our revolving credit facility, net of repayments and (iii) proceeds from the sale of certain properties, which are considered financing obligations.
Net cash used in financing activities during 2015 was primarily attributable to the following: (i) repayments of the Term loan B due to the Senior Secured Credit Facility refinancing in March 2015 and voluntary prepayments, (ii) the repurchase of common stock, (iii) repayments of partner deposits and accrued partner obligations and (iv) payment of cash dividends on our common stock. Net cash used in financing activities was partially offset by the following: (i) proceeds from the incremental Term loan A-1, net of financing fees, (ii) drawdowns on the revolving credit facility, net of repayments, and (iii) proceeds from the exercise of stock options.
FINANCIAL CONDITION
Following is a summary of our current assets, current liabilities and working capital:
(dollars in thousands) | DECEMBER 31, 2017 | DECEMBER 25, 2016 | |||||
Current assets | $ | 360,209 | $ | 390,519 | |||
Current liabilities | 860,863 | 823,408 | |||||
Working capital (deficit) | $ | (500,654 | ) | $ | (432,889 | ) | |
Working capital (deficit) included Unearned revenue from unredeemed gift cards and loyalty program rewards of $378.2 million and $388.5 million as of December 31, 2017 and December 25, 2016, respectively. We have, and in the future may continue to have, negative working capital balances (as is common for many restaurant companies). We operate successfully with negative working capital because cash collected on restaurant sales is typically received before payment is due on our current liabilities, and our inventory turnover rates require relatively low investment in inventories. Additionally, ongoing cash flows from restaurant operations and gift card sales are used to service debt obligations and make capital expenditures.
56
BLOOMIN’ BRANDS, INC.
MANAGEMENT’S DISCUSSION AND ANALYSIS OF
FINANCIAL CONDITION AND RESULTS OF OPERATIONS - Continued
Deferred Compensation Programs - The deferred compensation obligation due to managing and chef partners was $96.3 million and $113.0 million as of December 31, 2017 and December 25, 2016, respectively. We invest in various corporate-owned life insurance policies, which are held within an irrevocable grantor or “rabbi” trust account for settlement of our obligations under the deferred compensation plans. The rabbi trust is funded through our voluntary contributions. The unfunded obligation for managing and chef partners’ deferred compensation is $36.6 million and $50.6 million as of December 31, 2017 and December 25, 2016, respectively.
We use capital to fund the deferred compensation plans and currently expect annual cash funding of $18.0 million to $20.0 million. Actual funding of the deferred compensation obligations and future funding requirements may vary significantly depending on the actual performance compared to targets, timing of deferred payments of partner contracts, forfeiture rates, number of partner participants, growth of partner investments and our funding strategy.
DIVIDENDS AND SHARE REPURCHASES
Dividends - In 2017, 2016 and 2015, we declared and paid quarterly cash dividends of $0.08, $0.07 and $0.06 per share, respectively.
In February 2018, the Board declared a quarterly cash dividend of $0.09 per share, payable on March 14, 2018. Future dividend payments are dependent on our earnings, financial condition, capital expenditure requirements, surplus and other factors that our Board considers relevant.
Share Repurchases - On February 16, 2018, our Board canceled the remaining $55.0 million of authorization under the 2017 Share Repurchase Program and approved a new $150.0 million authorization. The 2018 Share Repurchase Program will expire on August 16, 2019. Following is a summary of our share repurchase programs as of December 31, 2017 (dollars in thousands):
SHARE REPURCHASE PROGRAM | BOARD APPROVAL DATE | AUTHORIZED | REPURCHASED | CANCELED | REMAINING | |||||||||||||
2014 | December 12, 2014 | $ | 100,000 | $ | 100,000 | $ | — | $ | — | |||||||||
2015 | August 3, 2015 | 100,000 | 69,999 | 30,001 | — | |||||||||||||
2016 | February 12, 2016 | 250,000 | 139,892 | 110,108 | — | |||||||||||||
July 2016 | July 26, 2016 | 300,000 | 247,731 | 52,269 | — | |||||||||||||
2017 | April 21, 2017 | 250,000 | 195,000 | — | 55,000 | |||||||||||||
The following table presents our dividends and share repurchases:
SHARE REPURCHASES | |||||||||||||||
(dollars in thousands) | DIVIDENDS PAID | REPURCHASE PROGRAMS | SETTLEMENT OF TAXES RELATED TO EQUITY AWARDS | TOTAL | |||||||||||
Fiscal year 2017 | $ | 30,988 | $ | 272,736 | $ | 180 | $ | 303,904 | |||||||
Fiscal year 2016 | 31,379 | 309,887 | 447 | 341,713 | |||||||||||
Fiscal year 2015 | 29,332 | 169,999 | 770 | 200,101 | |||||||||||
Total | $ | 91,699 | $ | 752,622 | $ | 1,397 | $ | 845,718 | |||||||
Our ability to pay dividends and make share repurchases is dependent on our ability to obtain funds from our subsidiaries, have access to our revolving credit facility and the existence of surplus. Based on our Credit Agreement, restricted dividend payments can be made on an unlimited basis provided we are compliant with our debt covenants.
OFF-BALANCE SHEET ARRANGEMENTS
None.
57
BLOOMIN’ BRANDS, INC.
MANAGEMENT’S DISCUSSION AND ANALYSIS OF
FINANCIAL CONDITION AND RESULTS OF OPERATIONS - Continued
OTHER MATERIAL COMMITMENTS
Our contractual obligations, debt obligations and commitments as of December 31, 2017 are summarized in the table below:
PAYMENTS DUE BY PERIOD | |||||||||||||||||||
LESS THAN | 1-3 | 3-5 | MORE THAN | ||||||||||||||||
(dollars in thousands) | TOTAL | 1 YEAR | YEARS | YEARS | 5 YEARS | ||||||||||||||
Recorded Contractual Obligations | |||||||||||||||||||
Long-term debt (1) | $ | 1,118,104 | $ | 26,335 | $ | 51,030 | $ | 1,021,276 | $ | 19,463 | |||||||||
Deferred compensation and other partner obligations (2) | 106,551 | 25,469 | 43,844 | 24,283 | 12,955 | ||||||||||||||
Other recorded contractual obligations (3) | 42,262 | 10,206 | 12,004 | 6,421 | 13,631 | ||||||||||||||
Unrecorded Contractual Obligations | |||||||||||||||||||
Interest (4) | 202,995 | 40,419 | 74,422 | 67,143 | 21,011 | ||||||||||||||
Operating leases | 1,697,668 | 185,183 | 335,627 | 274,101 | 902,757 | ||||||||||||||
Purchase obligations (5) | 445,955 | 276,706 | 89,136 | 42,246 | 37,867 | ||||||||||||||
Total contractual obligations | $ | 3,613,535 | $ | 564,318 | $ | 606,063 | $ | 1,435,470 | $ | 1,007,684 | |||||||||
____________________
(1) | Includes capital lease obligations. Excludes unamortized debt issuance costs and discount of $4.4 million. |
(2) | Includes deferred compensation obligations, deposits and other accrued obligations due to our restaurant partners. Timing and amounts of payments may vary significantly based on employee turnover, return of deposits and changes to buyout values. |
(3) | Includes other long-term liabilities, primarily consisting of non-partner deferred compensation obligations and restaurant closing cost liabilities. As of December 31, 2017, unrecognized tax benefits of $23.7 million were excluded from the table since it is not possible to estimate when these future payments will occur. |
(4) | Projected future interest payments on long-term debt are based on interest rates in effect as of December 31, 2017 and assume only scheduled principal payments. Estimated interest expense includes the impact of financing obligations and our variable-to-fixed interest rate swap agreements. |
(5) | Purchase obligations include agreements to purchase goods or services that are enforceable, are legally binding and specify all significant terms, including fixed or minimum quantities to be purchased; fixed, minimum or variable price provisions; and the approximate timing of the transaction. We have purchase obligations with various vendors that consist primarily of inventory, restaurant level service contracts, advertising and technology. |
Critical Accounting Policies and Estimates
Our discussion and analysis of our financial condition and results of operations are based upon our consolidated financial statements, which have been prepared in accordance with U.S. GAAP. The preparation of these accompanying consolidated financial statements requires us to make estimates and judgments that affect the reported amounts of assets, liabilities, revenues and expenses, and related disclosure of contingent assets and liabilities during the reporting period. We base our estimates on historical experience and on various other assumptions that are believed to be reasonable under the circumstances, the results of which form the basis for making judgments about the carrying value of assets and liabilities that are not readily apparent from other sources. Actual results may differ from these estimates under different assumptions or conditions. We consider an accounting estimate to be critical if it requires assumptions to be made and changes in these assumptions could have a material impact on our consolidated financial condition or results of operations.
Impairment or Disposal of Long-Lived Assets - Long-lived assets are reviewed for impairment whenever events or changes in circumstances indicate that the carrying value may not be recoverable. The evaluation is performed at the lowest level of identifiable cash flows independent of other assets. For long-lived assets deployed at our restaurants, we review for impairment at the individual restaurant level.
When evaluating for impairment, the total future undiscounted cash flows expected to be generated by the assets are compared to the carrying amount. If the total future undiscounted cash flows expected to be generated by the assets are less than the carrying amount, this may be an indicator of impairment. An impairment loss is recognized in earnings
58
BLOOMIN’ BRANDS, INC.
MANAGEMENT’S DISCUSSION AND ANALYSIS OF
FINANCIAL CONDITION AND RESULTS OF OPERATIONS - Continued
when the asset’s carrying value exceeds its estimated fair value. Fair value is generally estimated using a discounted cash flow model. The key estimates and assumptions used in this model are future cash flow estimates, with material changes generally driven by changes in expected use, and the discount rate.
Goodwill and Indefinite-Lived Intangible Assets - Goodwill and indefinite-lived intangible assets are tested for impairment annually in the second fiscal quarter, or whenever events or changes in circumstances indicate that the carrying amount may not be recoverable.
We may elect to perform a qualitative assessment to determine whether it is more likely than not that a reporting unit is impaired. In considering the qualitative approach, we evaluate factors including, but not limited to, macro-economic conditions, market and industry conditions, commodity cost fluctuations, competitive environment, share price performance, results of prior impairment tests, operational stability and the overall financial performance of the reporting units.
If the qualitative assessment is not performed or if we determine that it is not more likely than not that the fair value of the reporting unit exceeds the carrying value, the fair value of the reporting unit is calculated. Fair value of a reporting unit is the price a willing buyer would pay for the reporting unit and is estimated using a discounted cash flow model. The key estimates and assumptions used in this model are future cash flow estimates, which are heavily influenced by growth rates, and the discount rate. The fair value of the trade name is determined through a relief from royalty method.
The carrying value of the reporting unit is compared to its estimated fair value, with any excess of carrying value over fair value deemed to be an indicator of potential impairment, in which case a second step is performed comparing the recorded amount of goodwill or indefinite-lived intangible assets to the implied fair value.
The carrying value of goodwill as of December 31, 2017 was $310.2 million, which related to our U.S. and International reporting units. Based on our annual impairment test, none of our reporting units with remaining goodwill were at risk for impairment.
Sales declines at our restaurants, unplanned increases in commodity or labor costs, deterioration in overall economic conditions and challenges in the restaurant industry may result in future impairment charges. It is possible that changes in circumstances or changes in our judgments, assumptions and estimates could result in an impairment charge of a portion or all of our goodwill or other intangible assets.
Insurance Reserves - We carry insurance programs with specific retention levels or high per-claim deductibles for a significant portion of expected losses under our workers’ compensation, general or liquor liability, health, property and management liability insurance programs. For some programs, we maintain stop-loss coverage to limit the exposure relating to certain risks.
We record a liability for all unresolved claims and for an estimate of incurred but not reported claims at the anticipated cost that falls below our specified retention levels or per-claim deductible amounts. Our liability for insurance claims was $59.4 million and $62.8 million as of December 31, 2017 and December 25, 2016, respectively. In establishing our reserves, we consider certain actuarial assumptions and judgments regarding economic conditions, the frequency and severity of claims and claim development history and settlement practices. Reserves recorded for workers’ compensation and general or liquor liability claims are discounted using the average of the one-year and five-year risk free rate of monetary assets that have comparable maturities.
We do not believe there is a reasonable likelihood that there will be a material change in the estimates or assumptions used to calculate our insurance claim liabilities. However, if actual results are not consistent with our estimates or assumptions, we may be exposed to losses or gains that could be material. A 50 basis point change in the discount rate in our insurance claim liabilities as of December 31, 2017, would have affected net earnings by $0.8 million in 2017.
59
BLOOMIN’ BRANDS, INC.
MANAGEMENT’S DISCUSSION AND ANALYSIS OF
FINANCIAL CONDITION AND RESULTS OF OPERATIONS - Continued
Stock-Based Compensation - We have a stock-based compensation plan that permits the grant of stock options, stock appreciation rights, restricted stock, restricted stock units, performance awards and other stock-based awards to our management and other key employees. We account for our stock-based employee compensation using a fair value-based method of accounting.
We use the Black-Scholes option pricing model to estimate the weighted-average grant date fair value of stock options granted. Expected volatility is based on historical volatility of our stock. The expected term of options granted represents the period of time that options granted are expected to be outstanding. The simplified method of estimating expected term is used since we do not have significant historical exercise experience for our stock options. Dividend yield is the level of dividends expected to be paid on our common stock over the expected term of our options. The risk-free rate for periods within the expected life of the option is based on the U.S. Treasury yield curve in effect as of the grant date. Forfeitures of share-based compensation awards are recognized as they occur.
Our performance-based share units (“PSUs”) require assumptions regarding the likelihood of achieving certain Company performance criteria set forth in the award agreements. Assumptions used in our assessment are consistent with our internal forecasts and operating plans.
Estimates and assumptions are based upon information currently available, including historical experience and current business and economic conditions. A simultaneous 10% change in our volatility, forfeiture rate, weighted-average risk-free interest rate, dividend rate and term of grant in our stock option pricing model for 2017 would not have a material effect on net income.
If we assumed that the PSU performance conditions for stock-based awards were not met, stock-based compensation expense would have decreased by $2.2 million for 2017. If we assumed that PSU share awards met their maximum threshold, expense would have increased by $2.5 million for 2017.
Income Taxes - Deferred tax assets and liabilities are recognized based on the differences between the financial statement carrying amounts of assets and liabilities and their respective tax basis. Deferred tax assets and liabilities are measured using the tax rates, based on certain judgments regarding enacted tax laws and published guidance, in effect in the years in which we expect those temporary differences to reverse. As of December 31, 2017, tax loss carryforwards and credit carryforwards that do not have a valuation allowance are expected to be recoverable within the applicable statutory expiration periods. A valuation allowance is established against the deferred tax assets when it is more likely than not that some portion or all of the deferred taxes may not be realized. Changes in assumptions regarding our level and composition of earnings, tax laws or the deferred tax valuation allowance and the results of tax audits, may materially impact the effective income tax rate.
As a result of the enactment of the Tax Act, we have reflected our best provisional estimates and assumptions including, but not limited to: (i) the value of deferred income tax assets and liabilities based on the enacted corporate federal tax rate of 21%, (ii) the value of foreign tax credit carryforwards based on our ability to utilize foreign tax credits to offset future income tax liabilities and (iii) the accounting impact of the Deemed Repatriation Transition Tax. These provisional estimates are based on the information available and our current interpretation of the Tax Act, and may change due to changes in interpretations and assumptions we make and additional guidance or context from the Internal Revenue Service, the U.S. Treasury Department, the Financial Accounting Standards Board or others regarding the Tax Act. As our understanding of the application of certain rules under the Tax Act becomes clarified, we may further refine our estimates throughout 2018. See Note 18 - Income Taxes of the Notes to Consolidated Financial Statements for further information regarding the Tax Act.
Our income tax returns, like those of most companies, are periodically audited by U.S. and foreign tax authorities. In determining taxable income, income or loss before taxes is adjusted for differences between local tax laws and generally accepted accounting principles. A tax benefit from an uncertain position is recognized only if it is more likely than not that the position is sustainable based on its technical merits. For uncertain tax positions that do not meet this threshold,
60
BLOOMIN’ BRANDS, INC.
MANAGEMENT’S DISCUSSION AND ANALYSIS OF
FINANCIAL CONDITION AND RESULTS OF OPERATIONS - Continued
we recognize a liability. The liability for unrecognized tax benefits requires significant management judgment regarding exposures about our various tax positions. These assumptions and probabilities are periodically reviewed and updated based upon new information. An unfavorable tax settlement generally requires the use of cash and an increase in the amount of income tax expense we recognize.
Revenue Recognition - We sell gift cards to customers in our restaurants, through our websites and through select third parties. A liability is initially established for the value of the gift card when sold. We recognize revenue from gift cards when the card is redeemed by the customer. There is uncertainty when calculating gift card breakage because management is required to make assumptions and to apply judgment regarding the effects of future events. We currently recognize gift card breakage revenue for gift cards when the likelihood of redemption by the customer is remote.
Upon the adoption of ASU No. 2014-09 “Revenue Recognition (Topic 606), Revenue from Contracts with Customers”, we expect to recognize breakage proportional to actual gift card redemptions. See Note 2 - Summary of Significant Accounting Policies of our Notes to Consolidated Financial Statements in Part II, Item 8 for further information.
Recently Issued Financial Accounting Standards
For a description of recently issued Financial Accounting Standards that we adopted in 2017 and that are applicable to us but have not yet been adopted, see Note 2 - Summary of Significant Accounting Policies of the Notes to the Consolidated Financial Statements of this Report.
61
BLOOMIN’ BRANDS, INC.
Item 7A. Quantitative and Qualitative Disclosures about Market Risk
We are exposed to market risk from changes in interest rates on debt, changes in foreign currency exchange rates and changes in commodity prices.
Interest Rate Risk
We are exposed to market risk from fluctuations in interest rates, which could affect our consolidated balance sheet, earnings and cash flows. Stockholders’ equity can be adversely affected by changing interest rates, as after-tax changes in the fair value of interest rate swaps designated as cash flow hedges are reflected as increases and decreases to a component of stockholders’ equity.
We manage our exposure to market risk through regular operating and financing activities and when deemed appropriate, through the use of derivative financial instruments. We use derivative financial instruments as risk management tools and not for speculative purposes. See Note 16 - Derivative Instruments and Hedging Activities of the Notes to our Consolidated Financial Statements for further information.
As of December 31, 2017, our interest rate risk was primarily from variable interest rate changes on our Senior Secured Credit Facility. To manage the risk of fluctuations in variable interest rate debt, we have interest rate swaps for an aggregate notional amount of $400.0 million that mature on May 16, 2019.
We utilize valuation models to estimate the effects of changing interest rates. The following table summarizes the changes to fair value and interest expense under a shock scenario. This analysis assumes that interest rates change suddenly, as an interest rate “shock” and continue to increase or decrease at a consistent level above or below the LIBOR curve.
DECEMBER 31, 2017 | |||||||
(dollars in thousands) | INCREASE (1) | DECREASE | |||||
Change in fair value: | |||||||
Interest rate swap | $ | 4,145 | $ | (6,151 | ) | ||
Change in annual interest expense (2): | |||||||
Variable rate debt | $ | 6,906 | $ | (6,906 | ) | ||
________________
(1) | The potential change from a hypothetical 100 basis point increase in short-term interest rates. |
(2) | The potential change from a hypothetical basis point increase (decrease) in short-term interest rates based on the LIBOR curve with a floor of zero. The curve ranges from our current interest rate of 155 basis points to 198 basis points. |
Foreign Currency Exchange Rate Risk
We are subject to foreign currency exchange risk for our restaurants operating in foreign countries. Our exposure to foreign currency exchange risk is primarily related to fluctuations in the Brazil Real relative to the U.S. dollar. Our operations in other markets consist of Company-owned restaurants on a smaller scale than Brazil. If foreign currency exchange rates depreciate in the countries in which we operate, we may experience declines in our operating results.
For 2017, 11.0% of our revenue was generated in foreign currencies. A 10% change in average foreign currency rates against the U.S. dollar would have increased or decreased our Total revenues and Net income for our foreign entities by $50.1 million and $1.6 million, respectively.
62
BLOOMIN’ BRANDS, INC.
Commodity Pricing Risk
Many of the ingredients used in the products sold in our restaurants are commodities that are subject to unpredictable price volatility. Although we attempt to minimize the effect of price volatility by negotiating fixed price contracts for the supply of key ingredients, there are no established fixed price markets for certain commodities such as produce and wild fish, and we are subject to prevailing market conditions when purchasing those types of commodities. Other commodities are purchased based upon negotiated price ranges established with vendors with reference to the fluctuating market prices. The related agreements may contain contractual features that limit the price paid by establishing certain price floors and caps. Extreme changes in commodity prices or long-term changes could affect our financial results adversely. We expect that in most cases increased commodity prices could be passed through to our customers through increases in menu prices. However, if there is a time lag between the increasing commodity prices and our ability to increase menu prices, or if we believe the commodity price increase to be short in duration and we choose not to pass on the cost increases, our short-term financial results could be negatively affected. Additionally, from time to time, competitive circumstances could limit menu price flexibility, and in those cases margins would be negatively impacted by increased commodity prices.
Our restaurants are dependent upon energy to operate and are impacted by changes in energy prices, including natural gas. We utilize derivative instruments to mitigate some of our overall exposure to material increases in natural gas prices. Mark-to-market changes in the fair value of our natural gas derivative instruments recorded in earnings and the related assets and liabilities were not material for 2017, 2016, and 2015, respectively.
In addition to the market risks identified above, we are subject to business risk as our U.S. beef supply is highly dependent upon a limited number of vendors. If these vendors were unable to fulfill their obligations under their contracts, we could encounter supply shortages and incur higher costs to secure adequate supplies. See Note 19 - Commitments and Contingencies of the Notes to Consolidated Financial Statements for further details.
This market risk discussion contains forward-looking statements. Actual results may differ materially from the discussion based upon general market conditions and changes in U.S. and global financial markets.
63
BLOOMIN’ BRANDS, INC.
Item 8. Financial Statements and Supplementary Data
INDEX TO FINANCIAL INFORMATION
PAGE NO. | |
64
BLOOMIN’ BRANDS, INC.
Management’s Annual Report on Internal Control over Financial Reporting
Management is responsible for establishing and maintaining adequate internal control over financial reporting, as such term is defined in Exchange Act Rule 13a-15(f). The Company’s internal control over financial reporting includes those policies and procedures that (i) pertain to the maintenance of records that in reasonable detail accurately and fairly reflect the transactions and dispositions of the assets of the Company; (ii) provide reasonable assurance that transactions are recorded as necessary to permit preparation of financial statements in accordance with generally accepted accounting principles, and that receipts and expenditures of the Company are being made only in accordance with authorizations of management and directors of the Company; and (iii) provide reasonable assurance regarding prevention or timely detection of unauthorized acquisition, use or disposition of the Company’s assets that could have a material effect on the financial statements.
Internal control over financial reporting is designed to provide reasonable assurance regarding the reliability of financial reporting and the preparation of financial statements prepared for external purposes in accordance with generally accepted accounting principles. Because of its inherent limitations, internal control over financial reporting may not prevent or detect misstatements. Also, projections of any evaluation of effectiveness to future periods are subject to the risk that controls may become inadequate because of changes in conditions, or that the degree of compliance with the policies or procedures may deteriorate.
On May 14, 2013, the Committee of Sponsoring Organizations of the Treadway Commission (“COSO”) issued an updated version of its Internal Control—Integrated Framework (“2013 Framework”). Under the supervision and with the participation of management, including our Chief Executive Officer and Chief Financial and Administrative Officer, we carried out an evaluation of the effectiveness of our internal control over financial reporting as of December 31, 2017 using the 2013 Framework. Based upon our evaluation, management concluded that our internal control over financial reporting was effective as of December 31, 2017.
The effectiveness of our internal control over financial reporting as of December 31, 2017 has been audited by PricewaterhouseCoopers LLP, an independent registered certified public accounting firm, as stated in their report which is included herein.
65
BLOOMIN’ BRANDS, INC.
Report of Independent Registered Public Accounting Firm
To the Board of Directors and Stockholders of Bloomin’ Brands, Inc.
Opinions on the Financial Statements and Internal Control over Financial Reporting
We have audited the accompanying consolidated balance sheets of Bloomin’ Brands, Inc. and its subsidiaries as of December 31, 2017 and December 25, 2016, and the related consolidated statements of operations and comprehensive income, of changes in stockholders’ equity and cash flows for each of the three years in the period ended December 31, 2017, including the related notes (collectively referred to as the “consolidated financial statements”). We also have audited the Company’s internal control over financial reporting as of December 31, 2017, based on criteria established in Internal Control - Integrated Framework (2013) issued by the Committee of Sponsoring Organizations of the Treadway Commission (COSO).
In our opinion, the consolidated financial statements referred to above present fairly, in all material respects, the financial position of the Company as of December 31, 2017 and December 25, 2016, and the results of their operations and their cash flows for each of the three years in the period ended December 31, 2017 in conformity with accounting principles generally accepted in the United States of America. Also in our opinion, the Company maintained, in all material respects, effective internal control over financial reporting as of December 31, 2017, based on criteria established in Internal Control - Integrated Framework (2013) issued by the COSO.
Basis for Opinions
The Company’s management is responsible for these consolidated financial statements, for maintaining effective internal control over financial reporting, and for its assessment of the effectiveness of internal control over financial reporting, included in the accompanying Management's Annual Report on Internal Control over Financial Reporting. Our responsibility is to express opinions on the Company’s consolidated financial statements and on the Company’s internal control over financial reporting based on our audits. We are a public accounting firm registered with the Public Company Accounting Oversight Board (United States) (“PCAOB”) and are required to be independent with respect to the Company in accordance with the U.S. federal securities laws and the applicable rules and regulations of the Securities and Exchange Commission and the PCAOB.
We conducted our audits in accordance with the standards of the PCAOB. Those standards require that we plan and perform the audits to obtain reasonable assurance about whether the consolidated financial statements are free of material misstatement, whether due to error or fraud, and whether effective internal control over financial reporting was maintained in all material respects.
Our audits of the consolidated financial statements included performing procedures to assess the risks of material misstatement of the consolidated financial statements, whether due to error or fraud, and performing procedures that respond to those risks. Such procedures included examining, on a test basis, evidence regarding the amounts and disclosures in the consolidated financial statements. Our audits also included evaluating the accounting principles used and significant estimates made by management, as well as evaluating the overall presentation of the consolidated financial statements. Our audit of internal control over financial reporting included obtaining an understanding of internal control over financial reporting, assessing the risk that a material weakness exists, and testing and evaluating the design and operating effectiveness of internal control based on the assessed risk. Our audits also included performing such other procedures as we considered necessary in the circumstances. We believe that our audits provide a reasonable basis for our opinions.
Definition and Limitations of Internal Control over Financial Reporting
A company’s internal control over financial reporting is a process designed to provide reasonable assurance regarding the reliability of financial reporting and the preparation of financial statements for external purposes in accordance with generally accepted accounting principles. A company’s internal control over financial reporting includes those
66
BLOOMIN’ BRANDS, INC.
policies and procedures that (i) pertain to the maintenance of records that, in reasonable detail, accurately and fairly reflect the transactions and dispositions of the assets of the company; (ii) provide reasonable assurance that transactions are recorded as necessary to permit preparation of financial statements in accordance with generally accepted accounting principles, and that receipts and expenditures of the company are being made only in accordance with authorizations of management and directors of the company; and (iii) provide reasonable assurance regarding prevention or timely detection of unauthorized acquisition, use, or disposition of the company’s assets that could have a material effect on the financial statements.
Because of its inherent limitations, internal control over financial reporting may not prevent or detect misstatements. Also, projections of any evaluation of effectiveness to future periods are subject to the risk that controls may become inadequate because of changes in conditions, or that the degree of compliance with the policies or procedures may deteriorate.
/s/ PricewaterhouseCoopers LLP
Certified Public Accountants
Tampa, Florida
February 28, 2018
We have served as the Company’s auditor since 1998.
67
BLOOMIN’ BRANDS, INC.
CONSOLIDATED BALANCE SHEETS
(IN THOUSANDS, EXCEPT SHARE AND PER SHARE DATA)
DECEMBER 31, 2017 | DECEMBER 25, 2016 | ||||||
ASSETS | |||||||
Current Assets | |||||||
Cash and cash equivalents | $ | 128,263 | $ | 127,176 | |||
Current portion of restricted cash and cash equivalents | 1,280 | 7,886 | |||||
Inventories | 51,264 | 65,231 | |||||
Other current assets, net | 179,402 | 190,226 | |||||
Total current assets | 360,209 | 390,519 | |||||
Restricted cash | — | 1,124 | |||||
Property, fixtures and equipment, net | 1,173,414 | 1,237,148 | |||||
Goodwill | 310,234 | 310,055 | |||||
Intangible assets, net | 522,290 | 535,523 | |||||
Deferred income tax assets, net | 71,499 | 38,764 | |||||
Other assets, net | 135,261 | 129,146 | |||||
Total assets | $ | 2,572,907 | $ | 2,642,279 | |||
LIABILITIES, MEZZANINE EQUITY AND STOCKHOLDERS’ EQUITY | |||||||
Current Liabilities | |||||||
Accounts payable | $ | 185,461 | $ | 195,371 | |||
Accrued and other current liabilities | 270,840 | 204,415 | |||||
Unearned revenue | 378,227 | 388,543 | |||||
Current portion of long-term debt | 26,335 | 35,079 | |||||
Total current liabilities | 860,863 | 823,408 | |||||
Deferred rent | 160,047 | 151,130 | |||||
Deferred income tax liabilities | 16,926 | 16,709 | |||||
Long-term debt, net | 1,091,769 | 1,054,406 | |||||
Deferred gain on sale-leaseback transactions, net | 188,086 | 181,696 | |||||
Other long-term liabilities, net | 205,745 | 219,030 | |||||
Total liabilities | 2,523,436 | 2,446,379 | |||||
Commitments and contingencies (Note 19) | |||||||
Mezzanine Equity | |||||||
Redeemable noncontrolling interests | — | 547 | |||||
Stockholders’ Equity | |||||||
Bloomin’ Brands Stockholders’ Equity | |||||||
Preferred stock, $0.01 par value, 25,000,000 shares authorized; no shares issued and outstanding as of December 31, 2017 and December 25, 2016 | — | — | |||||
Common stock, $0.01 par value, 475,000,000 shares authorized; 91,912,546 and 103,922,110 shares issued and outstanding as of December 31, 2017 and December 25, 2016, respectively | 919 | 1,039 | |||||
Additional paid-in capital | 1,081,813 | 1,079,583 | |||||
Accumulated deficit | (944,951 | ) | (786,780 | ) | |||
Accumulated other comprehensive loss | (99,199 | ) | (111,143 | ) | |||
Total Bloomin’ Brands stockholders’ equity | 38,582 | 182,699 | |||||
Noncontrolling interests | 10,889 | 12,654 | |||||
Total stockholders’ equity | 49,471 | 195,353 | |||||
Total liabilities, mezzanine equity and stockholders’ equity | $ | 2,572,907 | $ | 2,642,279 | |||
The accompanying notes are an integral part of these consolidated financial statements. | |||||||
68
BLOOMIN’ BRANDS, INC.
CONSOLIDATED STATEMENTS OF OPERATIONS AND COMPREHENSIVE INCOME
(IN THOUSANDS, EXCEPT PER SHARE DATA)
FISCAL YEAR | |||||||||||
2017 | 2016 | 2015 | |||||||||
Revenues | |||||||||||
Restaurant sales | $ | 4,168,658 | $ | 4,226,057 | $ | 4,349,921 | |||||
Franchise and other revenues | 44,688 | 26,255 | 27,755 | ||||||||
Total revenues | 4,213,346 | 4,252,312 | 4,377,676 | ||||||||
Costs and expenses | |||||||||||
Cost of sales | 1,317,110 | 1,354,853 | 1,419,689 | ||||||||
Labor and other related | 1,219,593 | 1,211,250 | 1,205,610 | ||||||||
Other restaurant operating | 978,984 | 992,157 | 1,006,772 | ||||||||
Depreciation and amortization | 192,282 | 193,838 | 190,399 | ||||||||
General and administrative | 306,956 | 267,981 | 287,614 | ||||||||
Provision for impaired assets and restaurant closings | 52,329 | 104,627 | 36,667 | ||||||||
Total costs and expenses | 4,067,254 | 4,124,706 | 4,146,751 | ||||||||
Income from operations | 146,092 | 127,606 | 230,925 | ||||||||
Loss on defeasance, extinguishment and modification of debt | (1,069 | ) | (26,998 | ) | (2,956 | ) | |||||
Other income (expense), net | 14,912 | 1,609 | (939 | ) | |||||||
Interest expense, net | (41,392 | ) | (45,726 | ) | (56,176 | ) | |||||
Income before provision for income taxes | 118,543 | 56,491 | 170,854 | ||||||||
Provision for income taxes | 15,985 | 10,144 | 39,294 | ||||||||
Net income | 102,558 | 46,347 | 131,560 | ||||||||
Less: net income attributable to noncontrolling interests | 2,315 | 4,599 | 4,233 | ||||||||
Net income attributable to Bloomin’ Brands | $ | 100,243 | $ | 41,748 | $ | 127,327 | |||||
Net income | $ | 102,558 | $ | 46,347 | $ | 131,560 | |||||
Other comprehensive income: | |||||||||||
Foreign currency translation adjustment | 8,959 | 37,075 | (96,194 | ) | |||||||
Unrealized gain (loss) on derivatives, net of tax | 627 | (1,250 | ) | (6,033 | ) | ||||||
Reclassification of adjustment for loss on derivatives included in Net income, net of tax | 2,381 | 3,807 | 2,235 | ||||||||
Comprehensive income | 114,525 | 85,979 | 31,568 | ||||||||
Less: comprehensive income (loss) attributable to noncontrolling interests | 2,338 | 8,008 | (8,934 | ) | |||||||
Comprehensive income attributable to Bloomin’ Brands | $ | 112,187 | $ | 77,971 | $ | 40,502 | |||||
Earnings per share: | |||||||||||
Basic | $ | 1.04 | $ | 0.37 | $ | 1.04 | |||||
Diluted | $ | 1.01 | $ | 0.37 | $ | 1.01 | |||||
Weighted average common shares outstanding: | |||||||||||
Basic | 96,365 | 111,381 | 122,352 | ||||||||
Diluted | 99,707 | 114,311 | 125,585 | ||||||||
Cash dividends declared per common share | $ | 0.32 | $ | 0.28 | $ | 0.24 | |||||
The accompanying notes are an integral part of these consolidated financial statements.
69
BLOOMIN’ BRANDS, INC.
CONSOLIDATED STATEMENTS OF CHANGES IN STOCKHOLDERS’ EQUITY
(IN THOUSANDS, EXCEPT PER SHARE DATA)
BLOOMIN’ BRANDS | ||||||||||||||||||||||||||
COMMON STOCK | ADDITIONAL PAID-IN CAPITAL | ACCUM-ULATED DEFICIT | ACCUMULATED OTHER COMPREHENSIVE LOSS | NON- CONTROLLING INTERESTS | TOTAL | |||||||||||||||||||||
SHARES | AMOUNT | |||||||||||||||||||||||||
Balance, December 28, 2014 | 125,950 | $ | 1,259 | $ | 1,085,627 | $ | (474,994 | ) | $ | (60,542 | ) | $ | 5,099 | $ | 556,449 | |||||||||||
Net income | — | — | — | 127,327 | — | 3,228 | 130,555 | |||||||||||||||||||
Other comprehensive (loss) income, net of tax | — | — | — | — | (86,825 | ) | 9 | (86,816 | ) | |||||||||||||||||
Cash dividends declared, $0.24 per common share | — | — | (29,332 | ) | — | — | — | (29,332 | ) | |||||||||||||||||
Repurchase and retirement of common stock | (7,645 | ) | (76 | ) | (169,923 | ) | — | — | (169,999 | ) | ||||||||||||||||
Stock-based compensation | — | — | 21,672 | — | — | — | 21,672 | |||||||||||||||||||
Excess tax benefit on stock-based compensation | — | — | 733 | — | — | — | 733 | |||||||||||||||||||
Common stock issued under stock plans (1) | 910 | 9 | 6,015 | (770 | ) | — | — | 5,254 | ||||||||||||||||||
Purchase of noncontrolling interests | — | — | (306 | ) | — | — | — | (306 | ) | |||||||||||||||||
Change in the redemption value of redeemable interests | — | — | (11,548 | ) | — | — | — | (11,548 | ) | |||||||||||||||||
Distributions to noncontrolling interests | — | — | — | — | — | (4,761 | ) | (4,761 | ) | |||||||||||||||||
Contributions from noncontrolling interests | — | — | — | — | — | 3,635 | 3,635 | |||||||||||||||||||
Conversion of accrued partner obligations to noncontrolling interests | — | — | — | — | — | 6,364 | 6,364 | |||||||||||||||||||
Balance, December 27, 2015 | 119,215 | $ | 1,192 | $ | 1,072,861 | $ | (518,360 | ) | $ | (147,367 | ) | $ | 13,574 | $ | 421,900 | |||||||||||
Net income | — | — | — | 41,748 | — | 3,622 | 45,370 | |||||||||||||||||||
Other comprehensive income (loss), net of tax | — | — | — | — | 36,224 | (43 | ) | 36,181 | ||||||||||||||||||
Cash dividends declared, $0.28 per common share | — | — | (31,379 | ) | — | — | — | (31,379 | ) | |||||||||||||||||
Repurchase and retirement of common stock | (16,647 | ) | (166 | ) | — | (309,721 | ) | — | — | (309,887 | ) | |||||||||||||||
Stock-based compensation | — | 23,539 | — | — | — | 23,539 | ||||||||||||||||||||
Excess tax benefit from stock-based compensation | — | — | 454 | — | — | — | 454 | |||||||||||||||||||
Common stock issued under stock plans (1) | 1,354 | 13 | 6,831 | (447 | ) | — | — | 6,397 | ||||||||||||||||||
Purchase of noncontrolling interests, net of tax of $1,504 | — | — | 9,301 | — | — | 581 | 9,882 | |||||||||||||||||||
Change in the redemption value of redeemable interests | — | — | (2,024 | ) | — | — | — | (2,024 | ) | |||||||||||||||||
Distributions to noncontrolling interests | — | — | — | — | — | (5,818 | ) | (5,818 | ) | |||||||||||||||||
Contributions from noncontrolling interests | — | — | — | — | — | 738 | 738 | |||||||||||||||||||
Balance, December 25, 2016 | 103,922 | $ | 1,039 | $ | 1,079,583 | $ | (786,780 | ) | $ | (111,143 | ) | $ | 12,654 | $ | 195,353 | |||||||||||
(CONTINUED...) | ||||||||||||||||||||||||||
70
BLOOMIN’ BRANDS, INC.
CONSOLIDATED STATEMENTS OF CHANGES IN STOCKHOLDERS’ EQUITY
(IN THOUSANDS, EXCEPT PER SHARE DATA)
BLOOMIN’ BRANDS | ||||||||||||||||||||||||||
COMMON STOCK | ADDITIONAL PAID-IN CAPITAL | ACCUM-ULATED DEFICIT | ACCUMULATED OTHER COMPREHENSIVE LOSS | NON- CONTROLLING INTERESTS | TOTAL | |||||||||||||||||||||
SHARES | AMOUNT | |||||||||||||||||||||||||
Balance, December 25, 2016 | 103,922 | $ | 1,039 | $ | 1,079,583 | $ | (786,780 | ) | $ | (111,143 | ) | $ | 12,654 | $ | 195,353 | |||||||||||
Net income | — | — | — | 100,243 | — | 3,099 | 103,342 | |||||||||||||||||||
Other comprehensive income (loss), net of tax | — | — | — | — | 11,944 | (3 | ) | 11,941 | ||||||||||||||||||
Cash dividends declared, $0.32 per common share | — | — | (30,988 | ) | — | — | — | (30,988 | ) | |||||||||||||||||
Repurchase and retirement of common stock | (13,807 | ) | (138 | ) | — | (272,598 | ) | — | — | (272,736 | ) | |||||||||||||||
Stock-based compensation | — | — | 23,721 | — | — | — | 23,721 | |||||||||||||||||||
Common stock issued under stock plans (1) | 1,798 | 18 | 10,421 | (180 | ) | — | — | 10,259 | ||||||||||||||||||
Purchase of noncontrolling interests, net of tax of $45 | — | — | (713 | ) | — | — | (180 | ) | (893 | ) | ||||||||||||||||
Change in the redemption value of redeemable interests | — | — | (211 | ) | — | — | — | (211 | ) | |||||||||||||||||
Distributions to noncontrolling interests | — | — | — | — | — | (5,973 | ) | (5,973 | ) | |||||||||||||||||
Contributions from noncontrolling interests | — | — | — | — | — | 873 | 873 | |||||||||||||||||||
Cumulative-effect from a change in accounting principle | — | — | — | 14,364 | — | — | 14,364 | |||||||||||||||||||
Other | — | — | — | — | — | 419 | 419 | |||||||||||||||||||
Balance, December 31, 2017 | 91,913 | $ | 919 | $ | 1,081,813 | $ | (944,951 | ) | $ | (99,199 | ) | $ | 10,889 | $ | 49,471 | |||||||||||
________________
(1) | Net of forfeitures and shares withheld for employee taxes. |
The accompanying notes are an integral part of these consolidated financial statements.
71
FISCAL YEAR | |||||||||||
2017 | 2016 | 2015 | |||||||||
Cash flows provided by operating activities: | |||||||||||
Net income | $ | 102,558 | $ | 46,347 | $ | 131,560 | |||||
Adjustments to reconcile net income to cash provided by operating activities: | |||||||||||
Depreciation and amortization | 192,282 | 193,838 | 190,399 | ||||||||
Amortization of deferred discounts and issuance costs | 2,868 | 7,857 | 4,722 | ||||||||
Amortization of deferred gift card sales commissions | 26,751 | 28,045 | 28,205 | ||||||||
Provision for impaired assets and restaurant closings | 52,329 | 104,627 | 36,667 | ||||||||
Stock-based and other non-cash compensation expense | 25,938 | 21,522 | 22,725 | ||||||||
Deferred income tax (benefit) expense | (19,595 | ) | (75,349 | ) | 3,996 | ||||||
Loss on defeasance, extinguishment and modification of debt | 1,069 | 26,998 | 2,956 | ||||||||
(Gain) loss on sale of a business or subsidiary | (15,632 | ) | (1,633 | ) | 1,182 | ||||||
Recognition of deferred gain on sale-leaseback transactions | (11,872 | ) | (5,981 | ) | (2,121 | ) | |||||
Excess tax benefit from stock-based compensation | — | (2,252 | ) | (733 | ) | ||||||
Other non-cash items, net | 5,412 | 830 | (2,253 | ) | |||||||
Change in assets and liabilities: | |||||||||||
Decrease (increase) in inventories | 11,065 | 15,053 | (3,831 | ) | |||||||
Increase in other current assets | (12,262 | ) | (22,778 | ) | (43,727 | ) | |||||
(Increase) decrease in other assets | (1,585 | ) | 5,752 | 16,969 | |||||||
Increase (decrease) in accounts payable and accrued and other current liabilities | 53,880 | (8,222 | ) | (9,141 | ) | ||||||
Increase in deferred rent | 12,079 | 12,426 | 17,983 | ||||||||
(Decrease) increase in unearned revenue | (10,450 | ) | 7,812 | 6,106 | |||||||
Decrease in other long-term liabilities | (5,833 | ) | (14,305 | ) | (6,525 | ) | |||||
Net cash provided by operating activities | 409,002 | 340,587 | 395,139 | ||||||||
Cash flows (used in) provided by investing activities: | |||||||||||
Proceeds from sale-leaseback transactions, net | 98,840 | 530,684 | — | ||||||||
Proceeds from sale of a business, net of cash divested | 39,196 | 28,635 | 7,798 | ||||||||
Capital expenditures | (260,589 | ) | (260,578 | ) | (210,263 | ) | |||||
Other investments, net | (562 | ) | (3,493 | ) | 14,870 | ||||||
Net cash (used in) provided by investing activities | $ | (123,115 | ) | $ | 295,248 | $ | (187,595 | ) | |||
(CONTINUED...) | |||||||||||
72
FISCAL YEAR | |||||||||||
2017 | 2016 | 2015 | |||||||||
Cash flows used in financing activities: | |||||||||||
Proceeds from issuance of long-term debt, net | $ | 621,603 | $ | 364,211 | $ | 149,250 | |||||
Defeasance, extinguishment and modification of debt | (1,193,719 | ) | (478,906 | ) | (215,000 | ) | |||||
Repayments of long-term debt | (75,528 | ) | (355,616 | ) | (43,076 | ) | |||||
Proceeds from borrowings on revolving credit facilities, net | 1,345,761 | 729,500 | 564,040 | ||||||||
Repayments of borrowings on revolving credit facilities | (676,500 | ) | (539,500 | ) | (458,300 | ) | |||||
Proceeds from failed sale-leaseback transactions, net | 5,942 | 18,246 | — | ||||||||
Proceeds from the exercise of share-based compensation | 10,439 | 6,843 | 6,024 | ||||||||
Distributions to noncontrolling interests | (5,973 | ) | (5,818 | ) | (4,761 | ) | |||||
Contributions from noncontrolling interests | 873 | 738 | 3,635 | ||||||||
Purchase of limited partnership and noncontrolling interests | (5,713 | ) | (39,476 | ) | (890 | ) | |||||
Repayments of partner deposits and accrued partner obligations | (16,786 | ) | (18,739 | ) | (42,555 | ) | |||||
Repurchase of common stock | (272,916 | ) | (310,334 | ) | (170,769 | ) | |||||
Excess tax benefit from stock-based compensation | — | 2,252 | 733 | ||||||||
Cash dividends paid on common stock | (30,988 | ) | (31,379 | ) | (29,332 | ) | |||||
Net cash used in financing activities | (293,505 | ) | (657,978 | ) | (241,001 | ) | |||||
Effect of exchange rate changes on cash and cash equivalents | 975 | 2,955 | (9,193 | ) | |||||||
Net decrease in cash, cash equivalents and restricted cash | (6,643 | ) | (19,188 | ) | (42,650 | ) | |||||
Cash, cash equivalents and restricted cash as of the beginning of the period | 136,186 | 155,374 | 198,024 | ||||||||
Cash, cash equivalents and restricted cash as of the end of the period | $ | 129,543 | $ | 136,186 | $ | 155,374 | |||||
Supplemental disclosures of cash flow information: | |||||||||||
Cash paid for interest | $ | 40,475 | $ | 41,645 | $ | 53,971 | |||||
Cash paid for income taxes, net of refunds | 33,392 | 88,823 | 31,552 | ||||||||
Supplemental disclosures of non-cash investing and financing activities: | |||||||||||
Purchase of noncontrolling interest included in accrued and other current liabilities | $ | — | $ | 1,414 | $ | — | |||||
(Decrease) increase in liabilities from the acquisition of property, fixtures and equipment or capital leases | (4,747 | ) | 9,610 | 3,396 | |||||||
Deferred tax effect of purchase of noncontrolling interests | — | 1,504 | — | ||||||||
Conversion of accrued partner obligations to noncontrolling interests | — | — | 6,364 | ||||||||
The accompanying notes are an integral part of these consolidated financial statements.
73
1. Description of Business
Bloomin’ Brands, Inc. (“Bloomin’ Brands” or the “Company”) is one of the largest casual dining restaurant companies in the world, with a portfolio of leading, differentiated restaurant concepts. OSI Restaurant Partners, LLC (“OSI”) is the Company’s primary operating entity.
The Company owns and operates casual, upscale casual and fine dining restaurants. The Company’s restaurant portfolio has four concepts: Outback Steakhouse, Carrabba’s Italian Grill, Bonefish Grill and Fleming’s Prime Steakhouse & Wine Bar. Additional Outback Steakhouse, Carrabba’s Italian Grill and Bonefish Grill restaurants in which the Company has no direct investment are operated under franchise agreements.
2. Summary of Significant Accounting Policies
Basis of Presentation - The Company’s consolidated financial statements include the accounts and operations of Bloomin’ Brands and its subsidiaries.
To ensure timely reporting, the Company consolidates the results of its Brazil operations on a one-month calendar lag. There were no intervening events that would materially affect the Company’s consolidated financial position, results of operations or cash flows as of and for the year ended December 31, 2017.
Principles of Consolidation - All intercompany accounts and transactions have been eliminated in consolidation.
The Company consolidates variable interest entities where it has been determined that the Company is the primary beneficiary of those entities’ operations. The Company is a franchisor of 290 restaurants as of December 31, 2017, but does not possess any ownership interests in its franchisees and does not provide financial support to its franchisees. These franchise relationships are not deemed variable interest entities and are not consolidated.
Investments in entities the Company does not control, but where the Company’s interest is generally between 20% and 50% and the Company has the ability to exercise significant influence over the entity are accounted for under the equity method.
Fiscal Year - The Company utilizes a 52-53 week year ending on the last Sunday in December. In a 52 week fiscal year, each quarterly period is comprised of 13 weeks. The additional week in a 53 week fiscal year is added to the fourth quarter. Fiscal year 2017 consisted of 53 weeks and fiscal years 2016 and 2015 consisted of 52 weeks. The additional operating week of 2017 resulted in increases of $80.4 million of Total revenues and $0.11 of diluted earnings per share in the Consolidated Statements of Operations and Comprehensive Income.
Use of Estimates - The preparation of the accompanying consolidated financial statements in conformity with generally accepted accounting principles requires management to make estimates and assumptions that affect the reported amounts of assets and liabilities and disclosure of contingent assets and liabilities at the date of the financial statements and the reported amounts of revenues and expenses during the reporting period. Actual results could differ from those estimated.
Cash and Cash Equivalents - Cash equivalents consist of investments that are readily convertible to cash with an original maturity date of three months or less. Cash and cash equivalents include $51.6 million and $50.0 million, as of December 31, 2017 and December 25, 2016, respectively, for amounts in transit from credit card companies since settlement is reasonably assured.
Concentrations of Credit and Counterparty Risk - Financial instruments that potentially subject the Company to a concentration of credit risk are gift card, vendor and other receivables. Gift card, vendor and other receivables consist primarily of amounts due from gift card resellers and vendor rebates. The Company considers the concentration of
74
credit risk for gift card, vendor and other receivables to be minimal due to the payment histories and general financial condition of its gift card resellers and vendors.
Financial instruments that potentially subject the Company to concentrations of counterparty risk are cash and cash equivalents, restricted cash and derivatives. The Company attempts to limit its counterparty risk by investing in certificates of deposit, money market funds, noninterest-bearing accounts and other highly rated investments. Whenever possible, the Company selects investment grade counterparties and rated money market funds in order mitigate its counterparty risk. At times, cash balances may be in excess of FDIC insurance limits. See Note 16 - Derivative Instruments and Hedging Activities for a discussion of the Company’s use of derivative instruments and management of credit risk inherent in derivative instruments.
Fair Value - Fair value is the price that would be received for an asset or paid to transfer a liability, or the exit price, in an orderly transaction between market participants on the measurement date. Fair value is categorized into one of the following three levels based on the lowest level of significant input:
Level 1 | Unadjusted quoted market prices in active markets for identical assets or liabilities |
Level 2 | Observable inputs available at measurement date other than quoted prices included in Level 1 |
Level 3 | Unobservable inputs that cannot be corroborated by observable market data |
Inventories - Inventories consist of food and beverages and are stated at the lower of cost (first-in, first-out) or net realizable value.
Restricted Cash - The Company has short-term restricted cash balances consisting of amounts pledged for settlement of deferred compensation plan obligations.
Property, Fixtures and Equipment - Property, fixtures and equipment are stated at cost, net of accumulated depreciation. Depreciation is computed on the straight-line method over the estimated useful life of the assets. Improvements to leased properties are depreciated over the shorter of their useful life or the lease term, which includes renewal periods that are reasonably assured. Estimated useful lives by major asset category are generally as follows:
Buildings and building improvements | 20 to 30 years |
Furniture and fixtures | 5 to 7 years |
Equipment | 2 to 7 years |
Leasehold improvements | 5 to 20 years |
Capitalized software | 3 to 7 years |
Repair and maintenance costs that maintain the appearance and functionality of the restaurant, but do not extend the useful life of any restaurant asset are expensed as incurred. The Company suspends depreciation and amortization for assets held for sale. The cost and related accumulated depreciation of assets sold or disposed of are removed from the Company’s Consolidated Balance Sheets, and any resulting gain or loss is generally recognized in Other restaurant operating expenses in its Consolidated Statements of Operations and Comprehensive Income.
The Company capitalizes direct and indirect internal costs associated with the acquisition, development, design and construction of Company-owned restaurant locations as these costs have a future benefit to the Company. Upon restaurant opening, these costs are depreciated and charged to depreciation and amortization expense. Internal costs of $9.1 million, $7.6 million and $8.0 million were capitalized during 2017, 2016 and 2015, respectively.
For 2017 and 2016, software costs of $19.1 million and $7.1 million, respectively, were capitalized. As of December 31, 2017 and December 25, 2016, there was $31.4 million and $24.4 million, respectively, of unamortized software included in Property, fixtures and equipment, net on the Company’s Consolidated Balance Sheets.
75
Goodwill and Intangible Assets - Goodwill represents the excess of the purchase price over the fair value of net assets acquired in business combinations and is assigned to the reporting unit in which the acquired business will operate. The Company’s indefinite-lived intangible assets consist of trade names. Goodwill and indefinite-lived intangible assets are tested for impairment annually, as of the first day of the second fiscal quarter, or whenever events or changes in circumstances indicate that the carrying amount may not be recoverable.
The Company may elect to perform a qualitative assessment to determine whether it is more likely than not that a reporting unit is impaired. If the qualitative assessment is not performed or if the Company determines that it is not more likely than not that the fair value of the reporting unit exceeds the carrying value, the fair value of the reporting unit is calculated. The carrying value of the reporting unit is compared to its estimated fair value, with any excess of carrying value over fair value deemed to be an indicator of potential impairment, in which case a second step is performed comparing the recorded amount of goodwill or indefinite-lived intangible assets to the implied fair value.
Definite-lived intangible assets, which consist primarily of trademarks, franchise agreements, reacquired franchise rights, favorable leases, and other long-lived assets, are amortized over their estimated useful lives and are tested for impairment, using the discounted cash flow method, whenever events or changes in circumstances indicate that the carrying value may not be recoverable.
Derivatives - The Company records all derivatives on the balance sheet at fair value. The accounting for changes in the fair value of derivatives depends on the intended use of the derivative, whether the Company has elected to designate a derivative in a hedging relationship and apply hedge accounting and whether the hedging relationship has satisfied the criteria necessary to apply hedge accounting.
Derivatives designated and qualifying as a hedge of the exposure to variability in expected future cash flows, or other types of forecasted transactions, are considered cash flow hedges. If the derivative qualifies for hedge accounting treatment, then the effective portion of the gain or loss on the derivative instrument is recognized in equity as a change to Accumulated other comprehensive loss and reclassified into earnings in the same period or periods during which the hedged transaction affects earnings. Any ineffective portion of the gain or loss on the derivative instrument is immediately recognized in the Company’s Consolidated Statements of Operations and Comprehensive Income.
The Company may enter into derivative contracts that are intended to economically hedge certain of its risk, even though hedge accounting does not apply or the Company elects not to apply hedge accounting. Derivatives not designated as hedges are not speculative and are used to manage the Company’s exposure to interest rate movements, foreign currency exchange rate movements, changes in energy prices and other identified risks. Changes in the fair value of derivatives not designated in hedging relationships are recorded directly in earnings. The Company has elected not to offset derivative positions in the balance sheet with the same counterparty under the same agreement.
Deferred Financing Fees - For fees associated with its revolving credit facility, the Company records deferred financing fees related to the issuance of debt obligations in Other assets, net on its Consolidated Balance Sheets. For fees associated with all other debt obligations, the Company records deferred financing fees in Long-term debt, net.
The Company amortizes deferred financing fees to interest expense over the term of the respective financing arrangement, primarily using the effective interest method. The Company amortized deferred financing fees of $2.9 million, $7.1 million and $2.9 million to interest expense for 2017, 2016 and 2015, respectively.
Liquor Licenses - The costs of obtaining non-transferable liquor licenses directly issued by local government agencies for nominal fees are expensed as incurred. The costs of purchasing transferable liquor licenses through open markets in jurisdictions with a limited number of authorized liquor licenses are capitalized as indefinite-lived intangible assets and included in Other assets, net on the Company’s Consolidated Balance Sheets. Annual liquor license renewal fees are expensed over the renewal term.
76
Insurance Reserves - The Company carries insurance programs with specific retention levels or high per-claim deductibles for a significant portion of expected losses under its workers’ compensation, general or liquor liability, health, property and management liability insurance programs. The Company records a liability for all unresolved claims and for an estimate of incurred but not reported claims at the anticipated cost that falls below its specified retention levels or per-claim deductible amounts. In establishing reserves, the Company considers certain actuarial assumptions and judgments regarding economic conditions, the frequency and severity of claims, claim development history and settlement practices. Reserves recorded for workers’ compensation and general liability claims are discounted using the average of the one-year and five-year risk free rate of monetary assets that have comparable maturities.
Redeemable Noncontrolling Interests - Redeemable noncontrolling interests are reported at estimated redemption value measured as the greater of estimated fair value at the end of each reporting period or the historical cost basis of the redeemable noncontrolling interest adjusted for cumulative earnings or loss allocations. The resulting increases or decreases to fair value, if applicable, are recognized as adjustments to Retained earnings, or in the absence of Retained earnings, Additional paid-in capital. Redeemable noncontrolling interests are classified in Mezzanine equity on the Company’s Consolidated Balance Sheets.
Share Repurchase - Shares repurchased are retired. The par value of the repurchased shares is deducted from common stock and the excess of the purchase price over the par value of the shares is recorded to Accumulated deficit.
Revenue Recognition - The Company records food and beverage revenues, net of discounts, upon sale. Initial and developmental franchise fees are recognized as income once the Company has substantially performed all of its material obligations under the franchise agreement, which is generally upon the opening of the franchised restaurant. Continuing royalties, which are a percentage of net sales of the franchisee, are recognized as income when earned. Franchise-related revenues are included in Franchise and other revenues in the Company’s Consolidated Statements of Operations and Comprehensive Income, except for amounts received for national marketing, which are recorded as a reduction of Other restaurant operating expenses.
The Company defers revenue for gift cards, which do not have expiration dates, until redemption by the customer. Gift cards sold at a discount are recorded as revenue upon redemption of the associated gift cards at an amount net of the related discount. The Company also recognizes gift card breakage revenue for gift cards when the likelihood of redemption by the customer is remote. The Company recorded breakage revenue of $27.5 million, $26.0 million and $22.9 million for 2017, 2016 and 2015, respectively. Breakage revenue is recorded as a component of Restaurant sales in the Company’s Consolidated Statements of Operations and Comprehensive Income.
Gift card sales commissions paid to third-party providers are initially capitalized and subsequently recognized as Other restaurant operating expenses upon redemption of the associated gift card. Deferred expenses of $16.2 million and $15.6 million as of December 31, 2017 and December 25, 2016, respectively, were reflected in Other current assets, net on the Company’s Consolidated Balance Sheets. Gift card sales that are accompanied by a bonus gift card to be used by the customer at a future visit result in a separate deferral of a portion of the original gift card sale. Revenue is recorded when the bonus card is redeemed at the estimated fair market value of the bonus card.
The Company maintains a customer loyalty program, Dine Rewards, in the U.S., where customers have the ability to earn a reward after a number of qualified visits. The Company has developed an estimated value of the partial reward earned from each qualified visit based on historical data. The estimated value of the partial reward is recorded as deferred revenue. Each reward has a maximum value and must be redeemed within three months of earning such reward. The revenue associated with the fair value of the qualified visit is recognized upon the earlier of redemption or expiration of the reward. Deferred revenue related to the loyalty program was $6.7 million and $4.2 million as of December 31, 2017 and December 25, 2016, respectively.
77
The Company collects and remits sales, food and beverage, alcoholic beverage and hospitality taxes on transactions with customers and reports revenue net of taxes in its Consolidated Statements of Operations and Comprehensive Income.
Effective January 1, 2018, the Company’s revenue accounting policies will change in conjunction with its adoption of Accounting Standards Update (“ASU”) No. 2014-09 “Revenue Recognition (Topic 606), Revenue from Contracts with Customers” (“ASU No. 2014-09”). See discussion of ASU No. 2014-09 discussion in Recently Issued Financial Accounting Standards Not Yet Adopted below.
Operating Leases - Rent expense for the Company’s operating leases, which generally have escalating rentals over the term of the lease and may include rent holidays, is recorded on a straight-line basis over the initial lease term and those renewal periods that are reasonably assured. The difference between rent expense and rent paid is recorded as deferred rent and is included in the Company’s Consolidated Balance Sheets. Payments received from landlords as incentives for leasehold improvements are recorded as deferred rent and are amortized on a straight-line basis over the term of the lease as a reduction of rent expense. Favorable and unfavorable lease assets and liabilities are amortized on a straight-line basis to rent expense over the remaining lease term.
Pre-Opening Expenses - Non-capital expenditures associated with opening new restaurants are expensed as incurred and are included in Other restaurant operating expenses in the Company’s Consolidated Statements of Operations and Comprehensive Income.
Consideration Received from Vendors - The Company receives consideration for a variety of vendor-sponsored programs, such as volume rebates, promotions and advertising allowances. Advertising allowances are intended to offset the Company’s costs of promoting and selling menu items in its restaurants. Vendor consideration is recorded as a reduction of Cost of sales or Other restaurant operating expenses when recognized in the Company’s Consolidated Statements of Operations and Comprehensive Income.
Impairment of Long-Lived Assets and Costs Associated with Exit Activities - Long-lived assets are reviewed for impairment whenever events or changes in circumstances indicate that the carrying value may not be recoverable. The evaluation is performed at the lowest level of identifiable cash flows independent of other assets. For long-lived assets deployed at its restaurants, the Company reviews for impairment at the individual restaurant level. When evaluating for impairment, the total future undiscounted cash flows expected to be generated by the asset are compared to the carrying amount. If the total future undiscounted cash flows of the asset are less than its carrying amount, recoverability is measured by comparing the fair value of the assets to the carrying amount. An impairment loss is recognized in earnings when the asset’s carrying value exceeds its estimated fair value. Fair value is generally estimated using a discounted cash flow model.
Generally, restaurant closure costs, including lease termination fees, are expensed as incurred. When the Company ceases using the property rights under a non-cancelable operating lease, it records a liability for the net present value of any remaining lease obligations as a result of lease termination, less the estimated sublease income that can reasonably be obtained for the property. Any subsequent adjustments to that liability as a result of lease termination or changes in estimates of sublease income are recorded in the period incurred. The associated expense is recorded in Provision for impaired assets and restaurant closings in the Company’s Consolidated Statements of Operations and Comprehensive Income.
Restaurant sites and certain other assets to be sold are included in assets held for sale when certain criteria are met, including the requirement that the likelihood of selling the assets within one year is probable.
Advertising Costs - Advertising production costs are expensed in the period when the advertising first occurs. All other advertising costs are expensed in the period in which the costs are incurred. Advertising expense of $134.2 million, $160.8 million and $161.6 million for 2017, 2016 and 2015, respectively, was recorded in Other restaurant operating expenses in the Company’s Consolidated Statements of Operations and Comprehensive Income.
78
Legal Costs - Settlement costs are accrued when they are deemed probable and reasonably estimable. Legal fees are recognized as incurred and are reported in General and administrative expense in the Company’s Consolidated Statements of Operations and Comprehensive Income.
Research and Development Expenses (“R&D”) - R&D is expensed as incurred in General and administrative expense in the Company’s Consolidated Statements of Operations and Comprehensive Income. R&D primarily consists of payroll and benefit costs. R&D was $3.9 million, $5.2 million and $6.5 million for 2017, 2016 and 2015, respectively.
Partner Compensation - In addition to salary, Area Operating Partners, Restaurant Managing Partners and Chef Partners generally receive performance-based bonuses for providing management and supervisory services to their restaurants, certain of which may be based on a percentage of their restaurants’ monthly operating results or cash flows and/or total controllable income (“Monthly Payments”). The expense associated with the Monthly Payments for Restaurant Managing Partners and Chef Partners is included in Labor and other related expenses, and the expense associated with Monthly Payments for Area Operating Partners is included in General and administrative expenses in the Company’s Consolidated Statements of Operations and Comprehensive Income.
Restaurant Managing Partners and Chef Partners in the U.S. that are eligible to participate in a deferred compensation program receive an unsecured promise of a cash contribution to their account (see Note 6 - Stock-based and Deferred Compensation Plans). Also, on the fifth anniversary of the opening of each new U.S. Company-owned restaurant, the Area Operating Partner supervising the restaurant during the first five years of operation receives an additional performance-based bonus. International Restaurant Managing Partners whom purchase participation interests receive monthly cash distributions based on performance. Also, the supervising partners receive additional performance-based bonuses based on completion of their agreement. The terms and availability of these plans vary by country.
The Company estimates future bonuses and deferred compensation obligations to Restaurant Managing Partners, Chef Partners and Area Operating Partners, using current and historical information on restaurant performance and records the long-term portion of partner obligations in Other long-term liabilities, net on its Consolidated Balance Sheets. Deferred compensation expenses for Restaurant Managing and Chef Partners are included in Labor and other related expenses and bonus expense for Area Operating Partners is included in General and administrative expenses in the Company’s Consolidated Statements of Operations and Comprehensive Income.
Stock-based Compensation - Stock-based compensation awards are measured at fair value at the date of grant and expensed over their vesting or service periods. Stock-based compensation expense is recognized only for those awards expected to vest. The expense, net of forfeitures, is recognized using the straight-line method. Forfeitures of share-based compensation awards are recognized as they occur.
Foreign Currency Translation and Transactions - For non-U.S. operations, the functional currency is the local currency. Foreign currency denominated assets and liabilities are translated into U.S. dollars using the exchange rates in effect at the balance sheet date with the translation adjustments recorded in Accumulated other comprehensive loss in the Company’s Consolidated Statements of Changes in Stockholders’ Equity. Results of operations are translated using the average exchange rates for the reporting period.
The Company recorded foreign currency exchange transaction losses of $0.1 million, $1.3 million and $1.2 million for 2017, 2016 and 2015, respectively. Foreign currency exchange transaction losses are recorded in General and administrative in the Company’s Consolidated Statements of Operations and Comprehensive Income.
Income Taxes - Deferred income tax assets and liabilities are recognized for the future tax consequences attributable to differences between the financial statement carrying amounts of existing assets and liabilities and their respective tax basis. Deferred income tax assets and liabilities are measured using enacted tax rates expected to apply to taxable income in the years in which those temporary differences are expected to be recovered or settled. The effect on deferred income tax assets and liabilities of a change in the tax rate is recognized in income in the period that includes the
79
enactment date of the rate change. A valuation allowance may reduce deferred income tax assets to the amount that is more likely than not to be realized.
The Company records a tax benefit for an uncertain tax position using the highest cumulative tax benefit that is more likely than not to be realized. The Company adjusts its liability for unrecognized tax benefits in the period in which it determines the issue is effectively settled, the statute of limitations expires or when more information becomes available. Liabilities for unrecognized tax benefits, including penalties and interest, are recorded in Accrued and other current liabilities and Other long-term liabilities, net on the Company’s Consolidated Balance Sheets.
Recently Adopted Financial Accounting Standards - Effective December 26, 2016, the Company adopted ASU No. 2016-09: “Compensation - Stock Compensation (Topic 718): Improvements to Employee Share-Based Payment Accounting” (“ASU No. 2016-09”). ASU No. 2016-09 simplifies several aspects related to the accounting for share-based payment transactions, including the accounting for income taxes, statutory tax withholding requirements and classification on the statement of cash flows. Upon adoption, the Company made an accounting policy election to recognize forfeitures as they occur. Using the modified retrospective transition method required under the standard, the Company recorded a cumulative-effect adjustment for the adoption of ASU No. 2016-09 of $14.4 million for previously unrecognized excess tax benefits, which increased Deferred tax assets and reduced Accumulated deficit. The recognition of excess tax benefits and tax shortfalls in the income statement and presentation of excess tax benefits on the statement of cash flows were adopted prospectively, with no adjustments made to prior periods. The remaining provisions of ASU No. 2016-09 did not have a material impact on the Company’s Consolidated Financial Statements.
Effective June 26, 2017, the Company adopted ASU No. 2016-18, “Statement of Cash Flows (Topic 230), Restricted Cash” (“ASU No. 2016-18”). ASU No. 2016-18 provides guidance on the presentation of restricted cash and restricted cash equivalents, which are now included with cash and cash equivalents when reconciling the beginning and ending cash amounts shown on the statements of cash flows. Using the retrospective transition method required under the standard, the Company has adjusted the presentation of its Consolidated Statements of Cash Flows for all periods presented. The adoption of ASU No. 2016-18 did not have any other impact on the Company’s Consolidated Financial Statements.
The following table provides additional details by financial statement line item of the adjusted presentation in the Company’s Consolidated Statement of Cash Flows:
FISCAL YEAR | |||||||||||||||||||||||
2016 | 2015 | ||||||||||||||||||||||
(dollars in thousands) | AS REPORTED | 2016-18 IMPACT | ADJUSTED | AS REPORTED | 2016-18 IMPACT | ADJUSTED | |||||||||||||||||
Cash flows provided by operating activities | |||||||||||||||||||||||
Other non-cash items, net | $ | 824 | $ | 6 | $ | 830 | $ | 38 | $ | (2,291 | ) | $ | (2,253 | ) | |||||||||
Net cash provided by operating activities | $ | 340,581 | $ | 6 | $ | 340,587 | $ | 397,430 | $ | (2,291 | ) | $ | 395,139 | ||||||||||
Cash flows provided by (used in) investing activities | |||||||||||||||||||||||
Decrease in restricted cash | $ | 45,479 | $ | (45,479 | ) | $ | — | $ | 54,782 | $ | (54,782 | ) | $ | — | |||||||||
Increase in restricted cash | (31,446 | ) | 31,446 | — | (47,830 | ) | 47,830 | — | |||||||||||||||
Net cash provided by (used in) investing activities | $ | 309,281 | $ | (14,033 | ) | $ | 295,248 | $ | (180,643 | ) | $ | (6,952 | ) | $ | (187,595 | ) | |||||||
Net decrease in cash, cash equivalents and restricted cash | $ | (5,161 | ) | $ | (14,027 | ) | $ | (19,188 | ) | $ | (33,407 | ) | $ | (9,243 | ) | $ | (42,650 | ) | |||||
Cash, cash equivalents, and restricted cash as of the beginning of the period | 132,337 | 23,037 | 155,374 | 165,744 | 32,280 | 198,024 | |||||||||||||||||
Cash, cash equivalents and restricted cash as of the end of the period | $ | 127,176 | $ | 9,010 | $ | 136,186 | $ | 132,337 | $ | 23,037 | $ | 155,374 | |||||||||||
80
Recently Issued Financial Accounting Standards Not Yet Adopted - In May 2014, the Financial Accounting Standards Board (“the FASB”) issued ASU No. 2014-09. ASU No. 2014-09 provides a single source of guidance for revenue arising from contracts with customers and supersedes current revenue recognition standards. Under ASU No. 2014-09, revenue is recognized in an amount that reflects the consideration an entity expects to receive for the transfer of goods and services. The standard also requires additional disclosures about the nature, timing and uncertainty of revenue and cash flows arising from contracts with customers. The Company has implemented new controls to comply with ASU No. 2014-09 and permit adoption on January 1, 2018.
Although the Company is in the process of finalizing the impact of adoption, it has determined that changes in the timing of breakage revenue will impact quarterly results. Under the new standard, the Company will recognize gift card breakage proportional to redemptions. Previously, under the remote method, the majority of breakage revenue was recorded in the Company’s fourth fiscal quarter corresponding with the timing of the original gift card sale. Advertising fees charged to franchisees, which are currently recorded as a reduction to Other restaurant operating expenses, and approximated $17.2 million and $12.4 million in 2017 and 2016, respectively, will be recognized as revenue. In addition, initial franchise fees will be recognized over the term of the franchise agreement. Included in Q2 2017 was $2.2 million of initial franchise fees from domestic refranchising transactions.
The Company intends to adopt ASU No. 2014-09 using the full retrospective transition method, which will result in restating each prior reporting period presented in the year of adoption.
In February 2016, the FASB issued ASU No. 2016-02: “Leases (Topic 842)” (“ASU No. 2016-02”). ASU No. 2016-02 requires the lease rights and obligations arising from lease contracts, including existing and new arrangements, to be recognized as assets and liabilities on the balance sheet. ASU No. 2016-02 is effective for the Company in 2019 and must be adopted using a modified retrospective approach. The Company expects the adoption of ASU No. 2016-02 to have a significant impact on its Consolidated Balance Sheet due to recognition of right-of-use assets and lease liabilities for operating leases. The Company’s evaluation of ASU No. 2016-02 is ongoing and may identify additional impacts on the consolidated financial statements and related disclosures.
In August 2017, the FASB issued ASU No. 2017-12, Derivatives and Hedging (Topic 815): Targeted Improvements to Accounting for Hedging Activities (“ASU No. 2017-12”) which provides guidance for reporting the economic results of hedging activities and to simplify the disclosures of risk exposures and hedging strategies. ASU No. 2017-12 will be effective for the Company in 2019, with early adoption permitted. The Company is currently evaluating the impact of ASU No. 2017-12 on its Consolidated Financial Statements.
Reclassifications - The Company reclassified certain items in the accompanying consolidated financial statements for prior periods to be comparable with the classification for the current period. These reclassifications had no effect on previously reported net income.
3. Disposals
Refranchising - In the second quarter of 2017, the Company completed the sale of 54 of its existing U.S. Company-owned Outback Steakhouse and Carrabba’s Italian Grill locations to two of its existing franchisees (the “Buyers”) for aggregate cash proceeds of $36.2 million, net of certain closing adjustments. The transactions resulted in an aggregate net gain of $7.4 million, recorded within Other income, net, in the Consolidated Statements of Operations and Other Comprehensive Income, and is net of an impairment of $1.7 million related to certain Company-owned assets leased to the Buyers. Included in the cash proceeds are initial franchise fees of $2.2 million that are recorded within Franchise and other revenues in the Consolidated Statements of Operations and Other Comprehensive Income.
These restaurants are now operated as franchises and the Company remains contingently liable on certain real estate lease agreements assigned to the Buyers. See Note 19 - Commitments and Contingencies for additional details regarding lease guarantees.
81
Other Disposals - During third quarter of 2017, the Company closed and completed the sale of one U.S. Company-owned Carrabba’s Italian Grill location for a purchase price of $9.9 million, net of closing costs. The sale resulted in a net gain of $8.4 million, recorded in Other income, net, in the Company’s Consolidated Statements of Operations and Other Comprehensive Income.
Outback Steakhouse South Korea - In 2016, the Company completed the sale of its Outback Steakhouse subsidiary in South Korea (“Outback Steakhouse South Korea”) for a purchase price of $50.0 million, converting all restaurants in that market to franchised locations. Following is the Income (loss) before income taxes of Outback Steakhouse South Korea included in the Consolidated Statements of Operations and Comprehensive Income for the periods indicated:
FISCAL YEAR | |||||||
(dollars in thousands) | 2016 | 2015 | |||||
Restaurant sales | $ | 90,455 | $ | 171,649 | |||
Income (loss) before income taxes (1) | $ | (32,348 | ) | $ | 3,284 | ||
________________
(1) | Includes impairment charges of $39.6 million for Assets held for sale and a gain on sale of $2.1 million in 2016. |
Roy’s - In 2015, the Company sold its Roy’s business to United Ohana, LLC, for a purchase price of $10.0 million, less certain liabilities. Following are the components of Roy’s included in the Company’s Consolidated Statements of Operations and Comprehensive Income for 2015:
FISCAL YEAR | |||
(dollars in thousands) | 2015 | ||
Restaurant sales | $ | 5,729 | |
Loss before income taxes (1) | $ | (831 | ) |
________________
(1) | Includes loss on sale of $0.9 million. |
4. Impairments and Exit Costs
The components of Provision for impaired assets and restaurant closings are as follows:
FISCAL YEAR | |||||||||||
(dollars in thousands) | 2017 | 2016 | 2015 | ||||||||
Impairment losses | |||||||||||
U.S. | $ | 15,325 | $ | 57,464 | $ | 27,408 | |||||
International | 10,124 | 41,599 | — | ||||||||
Corporate | — | — | 746 | ||||||||
Total impairment losses | $ | 25,449 | $ | 99,063 | $ | 28,154 | |||||
Restaurant closure expenses | |||||||||||
U.S. | $ | 26,749 | $ | 5,596 | $ | 2,460 | |||||
International | 131 | (32 | ) | 6,053 | |||||||
Total restaurant closure expenses | $ | 26,880 | $ | 5,564 | $ | 8,513 | |||||
Provision for impaired assets and restaurant closings | $ | 52,329 | $ | 104,627 | $ | 36,667 | |||||
82
Closure Initiative and Restructuring Costs - Following is a summary of expenses related to the 2017 Closure Initiative, Bonefish Restructuring and the Pre-2015 Closure Initiatives (the “Closure Initiatives”), recognized in Provision for impaired assets and restaurant closings in the Company’s Consolidated Statements of Operations and Comprehensive Income for the periods indicated:
FISCAL YEAR | |||||||||||
(dollars in thousands) | 2017 | 2016 | 2015 | ||||||||
Impairment, facility closure and other expenses | |||||||||||
2017 Closure Initiative (1) | $ | 20,352 | $ | 46,500 | $ | — | |||||
Bonefish Restructuring (2) | 3,783 | 4,859 | 24,204 | ||||||||
Pre-2015 Closure Initiatives (3) | — | — | 7,643 | ||||||||
Provision for impaired assets and restaurant closings | $ | 24,135 | $ | 51,359 | $ | 31,847 | |||||
Severance and other expenses | |||||||||||
2017 Closure Initiative (1) | $ | 3,299 | $ | — | $ | — | |||||
Bonefish Restructuring (2) | 67 | 601 | 143 | ||||||||
Pre-2015 Closure Initiatives (3) | — | — | 1,715 | ||||||||
General and administrative | $ | 3,366 | $ | 601 | $ | 1,858 | |||||
Reversal of deferred rent liability | |||||||||||
2017 Closure Initiative (1) | $ | (4,755 | ) | $ | (3,271 | ) | $ | — | |||
Bonefish Restructuring (2) | — | (3,410 | ) | — | |||||||
Pre-2015 Closure Initiatives (3) | — | — | (198 | ) | |||||||
Other restaurant operating | $ | (4,755 | ) | $ | (6,681 | ) | $ | (198 | ) | ||
$ | 22,746 | $ | 45,279 | $ | 33,507 | ||||||
________________
(1) | On February 15, 2017 and August 28, 2017, the Company decided to close 43 underperforming restaurants in the U.S. and two Abbraccio restaurants outside of the core markets of São Paulo and Rio de Janeiro in Brazil (the “2017 Closure Initiative”). Most of these restaurants were closed in 2017, with the balance mostly closing as leases and certain operating covenants expire or are amended or waived. In connection with the 2017 Closure Initiative, the Company recognized impairments of $17.9 million and $45.6 million within the U.S. segment and $2.5 million and $0.9 million within the International segment for 2017 and 2016, respectively. |
(2) | On February 12, 2016, the Company decided to close 14 Bonefish Grill restaurants (the “Bonefish Restructuring”). The Company expects to substantially complete these restaurant closings through the first quarter of 2019. In connection with the Bonefish Restructuring, the Company reassessed the future undiscounted cash flows of the impacted restaurants, and as a result, recognized pre-tax asset impairments during 2015. Expenses related to the Bonefish Restructuring are recognized within the U.S. segment. |
(3) | During 2013 and 2014, the Company decided to close 22 domestic and 36 international (primarily in South Korea) underperforming locations (the “Pre-2015 Closure Initiatives”). |
Cumulative Closure Initiative and Restructuring Costs - Following is a summary of cumulative expenses related to the Closure Initiatives incurred through December 31, 2017 (dollars in thousands):
DESCRIPTION | LOCATION OF CHARGE IN THE CONSOLIDATED STATEMENTS OF OPERATIONS AND COMPREHENSIVE INCOME | CLOSURE INITIATIVES AND RESTRUCTURING | ||||||||||||||||
2017 | BONEFISH | PRE-2015 | TOTAL | |||||||||||||||
Impairments, facility closure and other expenses | Provision for impaired assets and restaurant closings | $ | 66,852 | $ | 32,846 | $ | 52,048 | $ | 151,746 | |||||||||
Severance and other expenses | General and administrative | 3,299 | 811 | 5,757 | 9,867 | |||||||||||||
Reversal of deferred rent liability | Other restaurant operating | (8,026 | ) | (3,410 | ) | (3,109 | ) | (14,545 | ) | |||||||||
$ | 62,125 | $ | 30,247 | $ | 54,696 | $ | 147,068 | |||||||||||
83
Surplus Properties - The Company owns certain U.S. restaurant properties and assets that are no longer utilized to operate its restaurant concepts (“surplus properties”). Surplus properties primarily consist of closed properties which include land and a building, and liquor licenses no longer needed for operations. Surplus properties may be classified in the Consolidated Balance Sheets as assets held for sale or as assets held and used when the Company does not expect to sell these assets within the next 12 months. Following is a summary of the carrying value and number of surplus properties as of the dates indicated:
(dollars in thousands) | CONSOLIDATED BALANCE SHEET CLASSIFICATION | DECEMBER 31, 2017 | DECEMBER 25, 2016 | ||||||
Surplus properties - assets held for sale | Other current assets, net | $ | 6,217 | $ | 676 | ||||
Surplus properties - assets held and used | Property, fixtures and equipment, net | 21,611 | 34,501 | ||||||
Total surplus properties | $ | 27,828 | $ | 35,177 | |||||
Number of surplus properties owned | 22 | 18 | |||||||
During 2017, the Company recognized impairment charges of $10.7 million in connection with the remeasurement of certain held and used surplus properties.
Other Impairment - During the fourth quarter of 2017, the Company recognized asset impairment charges of $6.3 million for its China subsidiary, within the International segment. During 2016, the Company recognized impairment charges of $3.5 million for its Puerto Rico subsidiary, within the U.S. segment.
The remaining restaurant impairment and closing charges resulted from the carrying value of a restaurant’s assets exceeding its estimated fair market value, primarily due to locations identified for relocation or closure and lease liabilities.
Projected Future Expenses and Cash Expenditures - The Company currently expects to incur additional charges for the 2017 Closure Initiative and Bonefish Restructuring over the next two years, including costs associated with lease obligations, employee terminations and other closure-related obligations. Following is a summary of estimated pre-tax expense by type:
Estimated future expense (dollars in millions) | 2017 CLOSURE INITIATIVE | BONEFISH RESTRUCTURING | |||||||||||||
Lease related liabilities, net of subleases | $ | 2.9 | to | $ | 3.8 | $ | 1.6 | to | $ | 2.3 | |||||
Employee severance and other obligations | 0.4 | to | 0.7 | 0.1 | to | 0.4 | |||||||||
Total estimated future expense | $ | 3.3 | to | $ | 4.5 | $ | 1.7 | to | $ | 2.7 | |||||
Total estimated future cash expenditures (dollars in millions) | $ | 22.3 | to | $ | 26.4 | $ | 9.6 | to | $ | 12.3 | |||||
Total future undiscounted cash expenditures for the 2017 Closures Initiative and Bonefish Grill Restructuring, primarily related to lease liabilities, are expected to occur over the remaining lease terms with the final term ending in January 2029 and October 2024, respectively.
84
Accrued Facility Closure and Other Cost Rollforward - The following table summarizes the Company’s accrual activity related to facility closure and other costs:
FISCAL YEAR | |||||||
(dollars in thousands) | 2017 | 2016 | |||||
Beginning of the year | $ | 6,557 | $ | 5,699 | |||
Charges | 29,393 | 6,845 | |||||
Cash payments | (10,728 | ) | (4,706 | ) | |||
Adjustments | (2,513 | ) | (1,281 | ) | |||
End of the year (1) | $ | 22,709 | $ | 6,557 | |||
________________
(1) | The Company had exit-related accruals of $6.7 million and $2.6 million, recorded in Accrued and other current liabilities and $16.0 million and $4.0 million, recorded in Other long-term liabilities, net, as of December 31, 2017 and December 25, 2016, respectively. |
5. Earnings Per Share
The Company computes basic earnings per share based on the weighted average number of common shares that were outstanding during the period. Diluted earnings per share includes the dilutive effect of common stock equivalents consisting of restricted stock, restricted stock units, performance-based share units and stock options, using the treasury stock method. Performance-based share units are considered dilutive when the related performance criterion has been met.
The following table presents the computation of basic and diluted earnings per share:
FISCAL YEAR | |||||||||||
(in thousands, except per share amounts) | 2017 | 2016 | 2015 | ||||||||
Net income attributable to Bloomin’ Brands | $ | 100,243 | $ | 41,748 | $ | 127,327 | |||||
Basic weighted average common shares outstanding | 96,365 | 111,381 | 122,352 | ||||||||
Effect of diluted securities: | |||||||||||
Stock options | 2,895 | 2,659 | 2,992 | ||||||||
Nonvested restricted stock and restricted stock units | 421 | 260 | 216 | ||||||||
Nonvested performance-based share units | 26 | 11 | 25 | ||||||||
Diluted weighted average common shares outstanding | 99,707 | 114,311 | 125,585 | ||||||||
Basic earnings per share | $ | 1.04 | $ | 0.37 | $ | 1.04 | |||||
Diluted earnings per share | $ | 1.01 | $ | 0.37 | $ | 1.01 | |||||
Dilutive securities outstanding not included in the computation of earnings per share because their effect was antidilutive were as follows:
FISCAL YEAR | ||||||||
(shares in thousands) | 2017 | 2016 | 2015 | |||||
Stock options | 5,555 | 5,151 | 2,670 | |||||
Nonvested restricted stock and restricted stock units | 128 | 219 | 27 | |||||
Nonvested performance-based share units | 222 | 92 | — | |||||
85
6. Stock-based and Deferred Compensation Plans
Stock-based Compensation Plans
The Company recognized stock-based compensation expense as follows:
FISCAL YEAR | |||||||||||
(dollars in thousands) | 2017 | 2016 | 2015 | ||||||||
Stock options | $ | 10,423 | $ | 11,926 | $ | 10,041 | |||||
Restricted stock and restricted stock units | 9,933 | 9,275 | 6,758 | ||||||||
Performance-based share units | 2,227 | 1,393 | 3,596 | ||||||||
$ | 22,583 | $ | 22,594 | $ | 20,395 | ||||||
Stock Options - Stock options generally vest and become exercisable over a period of four years in an equal number of shares each year. Stock options have an exercisable life of no more than ten years from the date of grant. The Company settles stock option exercises with authorized but unissued shares of the Company’s common stock.
The following table presents a summary of the Company’s stock option activity:
(in thousands, except exercise price and contractual life) | OPTIONS | WEIGHTED- AVERAGE EXERCISE PRICE | WEIGHTED- AVERAGE REMAINING CONTRACTUAL LIFE (YEARS) | AGGREGATE INTRINSIC VALUE | ||||||||
Outstanding as of December 25, 2016 | 10,984 | $ | 14.24 | 5.8 | $ | 58,231 | ||||||
Granted | 1,279 | 17.39 | ||||||||||
Exercised | (1,411 | ) | 9.54 | |||||||||
Forfeited or expired | (801 | ) | 19.31 | |||||||||
Outstanding as of December 31, 2017 | 10,051 | $ | 14.89 | 5.2 | $ | 71,373 | ||||||
Exercisable as of December 31, 2017 | 6,727 | $ | 12.96 | 3.7 | $ | 60,814 | ||||||
Assumptions used in the Black-Scholes option pricing model and the weighted-average fair value of option awards granted were as follows for the periods indicated:
FISCAL YEAR | |||||||||||
2017 | 2016 | 2015 | |||||||||
Assumptions: | |||||||||||
Weighted-average risk-free interest rate (1) | 1.92 | % | 1.32 | % | 1.64 | % | |||||
Dividend yield (2) | 1.84 | % | 1.59 | % | 1.00 | % | |||||
Expected term (3) | 6.3 years | 6.1 years | 6.3 years | ||||||||
Weighted-average volatility (4) | 33.7 | % | 35.2 | % | 43.4 | % | |||||
Weighted-average grant date fair value per option | $ | 5.09 | $ | 5.28 | $ | 10.11 | |||||
________________
(1) | Risk-free interest rate is the U.S. Treasury yield curve in effect as of the grant date for periods within the expected term of the option. |
(2) | Dividend yield is the level of dividends expected to be paid on the Company’s common stock over the expected term of the option. |
(3) | Expected term represents the period of time that the options are expected to be outstanding. The simplified method of estimating the expected term is used since the Company does not have significant historical exercise experience for its stock options. |
(4) | Based on the historical volatility of the Company’s stock. |
86
The following represents stock option compensation information for the periods indicated:
FISCAL YEAR | |||||||||||
(dollars in thousands) | 2017 | 2016 | 2015 | ||||||||
Intrinsic value of options exercised | $ | 15,139 | $ | 10,792 | $ | 11,843 | |||||
Excess tax benefits for tax deductions related to the exercise of stock options | $ | 2,928 | $ | 2,146 | $ | 702 | |||||
Cash received from option exercises, net of tax withholding | $ | 13,329 | $ | 8,998 | $ | 7,440 | |||||
Fair value of stock options vested | $ | 28,085 | $ | 19,431 | $ | 26,643 | |||||
Tax benefits for stock option compensation expense | $ | 5,889 | $ | 4,177 | $ | 4,594 | |||||
Unrecognized stock option expense | $ | 12,347 | |||||||||
Remaining weighted-average vesting period | 2.3 years | ||||||||||
Restricted Stock and Restricted Stock Units - Restricted stock and restricted stock units generally vest over a period of four years and become exercisable in an equal number of shares each year. Following is a summary of the Company’s restricted stock and restricted stock unit activity:
(shares in thousands) | NUMBER OF RESTRICTED STOCK & RESTRICTED STOCK UNIT AWARDS | WEIGHTED-AVERAGE GRANT DATE FAIR VALUE PER AWARD | ||||
Outstanding as of December 25, 2016 | 1,594 | $ | 18.55 | |||
Granted | 619 | 16.49 | ||||
Vested | (533 | ) | 19.10 | |||
Forfeited | (288 | ) | 17.91 | |||
Outstanding as of December 31, 2017 | 1,392 | $ | 17.54 | |||
The following represents restricted stock and restricted stock unit compensation information as of December 31, 2017:
FISCAL YEAR | |||||||||||
(dollars in thousands) | 2017 | 2016 | 2015 | ||||||||
Fair value of restricted stock vested | $ | 10,182 | $ | 7,752 | $ | 5,339 | |||||
Tax benefits for restricted stock compensation expense | $ | 3,664 | $ | 2,513 | $ | 2,303 | |||||
Unrecognized restricted stock expense | $ | 17,365 | |||||||||
Remaining weighted-average vesting period | 2.5 years | ||||||||||
Performance-based Share Units (“PSUs”) - The number of units that vest is determined for each year based on the achievement of certain performance criteria as set forth in the award agreement and may range from zero to 200% of the annual target grant. The PSUs are settled in shares of common stock, with holders receiving one share of common stock for each performance-based share unit that vests. The fair value of PSUs is based on the closing price of the Company’s common stock on the grant date. Compensation expense for PSUs is recognized over the vesting period when it is probable the performance criteria will be achieved.
87
The following table presents a summary of the Company’s PSU activity:
(shares in thousands) | PERFORMANCE-BASED SHARE UNITS | WEIGHTED-AVERAGE GRANT DATE FAIR VALUE PER AWARD | ||||
Outstanding as of December 25, 2016 | 312 | $ | 16.26 | |||
Granted | 403 | 17.44 | ||||
Vested | (70 | ) | 16.29 | |||
Forfeited | (146 | ) | 17.98 | |||
Outstanding as of December 31, 2017 | 499 | $ | 16.72 | |||
The following represents PSU compensation information as of December 31, 2017:
FISCAL YEAR | |||||||||||
(dollars in thousands) | 2017 | 2016 | 2015 | ||||||||
Tax benefits for PSU compensation expense | $ | 501 | $ | 910 | $ | 636 | |||||
Unrecognized PSU expense | $ | 2,820 | |||||||||
Remaining weighted-average vesting period (1) | 1.0 year | ||||||||||
________________
(1) | For PSUs granted prior to 2016, units typically vest in an equal number of shares over four years. PSUs granted after 2015 vest after three years. |
As of December 31, 2017, the maximum number of shares of common stock available for issuance pursuant to the 2016 Omnibus Incentive Plan was 5,063,157.
Deferred Compensation Plans
Restaurant Managing Partners and Chef Partners are eligible to participate in deferred compensation programs. To fund deferred compensation arrangements, the Company may invest in corporate-owned life insurance policies, which are held within an irrevocable grantor or “rabbi” trust account for settlement of certain of the obligations under the deferred compensation plans. The deferred compensation obligation due to Restaurant Managing and Chef Partners was $96.3 million and $113.0 million as of December 31, 2017 and December 25, 2016, respectively. The rabbi trust is funded through the Company’s voluntary contributions. The unfunded obligation for Restaurant Managing and Chef Partners’ deferred compensation was $36.6 million and $50.6 million as of December 31, 2017 and December 25, 2016, respectively.
Other Benefit Plans
401(k) Plan - The Company has a qualified defined contribution plan that qualifies under Section 401(k) of the Internal Revenue Code of 1986, as amended. The Company incurred contribution costs of $3.3 million, $3.2 million and $3.7 million for the 401(k) Plan for 2017, 2016 and 2015, respectively.
Deferred Compensation Plan - The Company provides a deferred compensation plan for its highly compensated employees who are not eligible to participate in the 401(k) Plan. The deferred compensation plan allows these employees to contribute a percentage of their base salary and cash bonus on a pre-tax basis. The deferred compensation plan is unsecured and funded through the Company’s voluntary contributions.
88
7. Other Current Assets, Net
Other current assets, net, consisted of the following:
(dollars in thousands) | DECEMBER 31, 2017 | DECEMBER 25, 2016 | |||||
Prepaid expenses | $ | 40,688 | $ | 35,298 | |||
Accounts receivable - gift cards, net | 66,361 | 102,664 | |||||
Accounts receivable - vendors, net | 19,483 | 10,107 | |||||
Accounts receivable - franchisees, net | 2,017 | 1,677 | |||||
Accounts receivable - other, net | 22,808 | 20,497 | |||||
Assets held for sale | 6,217 | 1,331 | |||||
Other current assets, net | 21,828 | 18,652 | |||||
$ | 179,402 | $ | 190,226 | ||||
8. Property, Fixtures and Equipment, Net
Property, fixtures and equipment, net, consisted of the following:
(dollars in thousands) | DECEMBER 31, 2017 | DECEMBER 25, 2016 | |||||
Land | $ | 74,228 | $ | 114,375 | |||
Buildings and building improvements | 653,246 | 726,418 | |||||
Furniture and fixtures | 410,792 | 383,758 | |||||
Equipment | 600,977 | 550,598 | |||||
Leasehold improvements | 534,875 | 492,465 | |||||
Construction in progress | 40,740 | 47,332 | |||||
Less: accumulated depreciation | (1,141,444 | ) | (1,077,798 | ) | |||
$ | 1,173,414 | $ | 1,237,148 | ||||
Sale-leaseback Transactions - During 2017 and 2016, the Company entered into sale-leaseback transactions with third-parties in which it sold 31 and 153 restaurant properties at fair market value for gross proceeds of $108.0 million and $541.9 million, respectively. In connection with these sale-leaseback transactions, the Company recorded deferred gains of $22.3 million and $163.4 million, respectively, which are amortized to Other restaurant operating expense in its Consolidated Statements of Operations and Comprehensive Income over the initial term of each lease, ranging from 10 to 20 years.
During 2016, the Company sold six restaurant properties to third parties for aggregate proceeds of $18.5 million that did not qualify for sale-leaseback accounting. The book value of the buildings and land for these restaurant properties remains on the Company’s Consolidated Balance Sheets. See Note 12 - Long-term Debt, Net and Note 19 - Commitments and Contingencies for additional details regarding the related financing obligation.
Leased Properties - As of December 31, 2017, the Company leased $20.9 million and $27.6 million of certain land and buildings, respectively, to third parties. Accumulated depreciation related to the leased building assets of $9.5 million is included in Property, fixtures and equipment, net as of December 31, 2017.
Depreciation and repair and maintenance expense is as follows for the periods indicated:
FISCAL YEAR | |||||||||||
(dollars in thousands) | 2017 | 2016 | 2015 | ||||||||
Depreciation expense | $ | 182,254 | $ | 183,049 | $ | 178,855 | |||||
Repair and maintenance expense | 111,926 | 108,940 | 107,960 | ||||||||
89
9. Goodwill and Intangible Assets, Net
Goodwill - The following table is a rollforward of goodwill:
(dollars in thousands) | U.S. | INTERNATIONAL | CONSOLIDATED | ||||||||
Balance as of December 27, 2015 | $ | 172,711 | $ | 128,150 | $ | 300,861 | |||||
Translation adjustments | — | 11,382 | 11,382 | ||||||||
Divestitures | — | (1,901 | ) | (1,901 | ) | ||||||
Transfer to Assets held for sale | (287 | ) | — | (287 | ) | ||||||
Balance as of December 25, 2016 | $ | 172,424 | $ | 137,631 | $ | 310,055 | |||||
Translation adjustments | — | 3,280 | 3,280 | ||||||||
Impairments (1) | — | (1,444 | ) | (1,444 | ) | ||||||
Divestitures (2) | (1,657 | ) | — | (1,657 | ) | ||||||
Balance as of December 31, 2017 | $ | 170,767 | $ | 139,467 | $ | 310,234 | |||||
________________
(1) | During the fourth quarter of 2017, the Company recognized $1.4 million goodwill impairment related to its China subsidiary in Provision for impaired assets and restaurant closings within its Consolidated Statements of Operations and Comprehensive Income. |
(2) | During the second quarter 2017, the Company disposed of Goodwill in connection with the sale of 54 of its U.S. Company-owned Outback Steakhouse and Carrabba’s Italian Grill locations to existing franchisees. |
The following table is a summary of the Company’s gross goodwill balances and accumulated impairments:
DECEMBER 31, 2017 | DECEMBER 25, 2016 | DECEMBER 27, 2015 | |||||||||||||||||||||
(dollars in thousands) | GROSS CARRYING AMOUNT | ACCUMULATED IMPAIRMENTS | GROSS CARRYING AMOUNT | ACCUMULATED IMPAIRMENTS | GROSS CARRYING AMOUNT | ACCUMULATED IMPAIRMENTS | |||||||||||||||||
U.S. | $ | 838,937 | $ | (668,170 | ) | $ | 840,594 | $ | (668,170 | ) | $ | 840,881 | $ | (668,170 | ) | ||||||||
International | 257,377 | (117,910 | ) | 254,097 | (116,466 | ) | 244,616 | (116,466 | ) | ||||||||||||||
Total goodwill | $ | 1,096,314 | $ | (786,080 | ) | $ | 1,094,691 | $ | (784,636 | ) | $ | 1,085,497 | $ | (784,636 | ) | ||||||||
The Company performs its annual assessment for impairment of goodwill and other indefinite-lived intangible assets each year during the second quarter. As a result of this assessment, the Company did not record any goodwill asset impairment charges during the periods presented.
Intangible Assets, net - Intangible assets, net, consisted of the following:
WEIGHTED AVERAGE AMORTIZATION PERIOD (IN YEARS) | DECEMBER 31, 2017 | DECEMBER 25, 2016 | |||||||||||||||||||||||
(dollars in thousands) | GROSS CARRYING VALUE | ACCUMULATED AMORTIZATION | NET CARRYING VALUE | GROSS CARRYING VALUE | ACCUMULATED AMORTIZATION | NET CARRYING VALUE | |||||||||||||||||||
Trade names | Indefinite | $ | 414,141 | $ | 414,141 | $ | 414,041 | $ | 414,041 | ||||||||||||||||
Trademarks | 11 | 81,381 | $ | (40,233 | ) | 41,148 | 81,381 | $ | (36,400 | ) | 44,981 | ||||||||||||||
Favorable leases | 10 | 66,338 | (39,259 | ) | 27,079 | 73,665 | (41,258 | ) | 32,407 | ||||||||||||||||
Franchise agreements | 3 | 14,881 | (12,067 | ) | 2,814 | 14,881 | (10,922 | ) | 3,959 | ||||||||||||||||
Reacquired franchise rights | 13 | 54,961 | (17,963 | ) | 36,998 | 53,045 | (13,091 | ) | 39,954 | ||||||||||||||||
Other intangibles | 2 | 9,099 | (8,989 | ) | 110 | 9,099 | (8,918 | ) | 181 | ||||||||||||||||
Total intangible assets | 10 | $ | 640,801 | $ | (118,511 | ) | $ | 522,290 | $ | 646,112 | $ | (110,589 | ) | $ | 535,523 | ||||||||||
The Company did not record any indefinite-lived intangible asset impairment charges during the periods presented.
90
Definite-lived intangible assets are amortized on a straight-line basis. The following table presents the aggregate expense related to the amortization of the Company’s trademarks, favorable leases, franchise agreements, reacquired franchise rights and other intangibles:
FISCAL YEAR | |||||||||||
(dollars in thousands) | 2017 | 2016 | 2015 | ||||||||
Amortization expense (1) | $ | 14,191 | $ | 15,666 | $ | 16,852 | |||||
________________
(1) | Amortization expense is recorded in Depreciation and amortization and Other restaurant operating expenses in the Company’s Consolidated Statements of Operations and Comprehensive Income. |
The following table presents expected annual amortization of intangible assets as of December 31, 2017:
(dollars in thousands) | |||
2018 | $ | 13,397 | |
2019 | 12,990 | ||
2020 | 11,333 | ||
2021 | 10,079 | ||
2022 | 9,649 | ||
10. Other Assets, Net
Other assets, net, consisted of the following:
(dollars in thousands) | DECEMBER 31, 2017 | DECEMBER 25, 2016 | |||||
Company-owned life insurance | $ | 73,818 | $ | 74,629 | |||
Deferred financing fees (1) | 8,232 | 2,632 | |||||
Liquor licenses | 24,659 | 27,515 | |||||
Other assets | 28,552 | 24,370 | |||||
$ | 135,261 | $ | 129,146 | ||||
________________
(1) | Net of accumulated amortization of $4.1 million and $3.3 million as of December 31, 2017 and December 25, 2016, respectively. |
11. Accrued and Other Current Liabilities
Accrued and other current liabilities consisted of the following:
(dollars in thousands) | DECEMBER 31, 2017 | DECEMBER 25, 2016 | |||||
Accrued payroll and other compensation | $ | 113,636 | $ | 81,981 | |||
Accrued insurance | 23,482 | 23,533 | |||||
Other current liabilities | 133,722 | 98,901 | |||||
$ | 270,840 | $ | 204,415 | ||||
91
12. Long-term Debt, Net
Following is a summary of outstanding long-term debt:
DECEMBER 31, 2017 | DECEMBER 25, 2016 | ||||||||||||
(dollars in thousands) | OUTSTANDING BALANCE | INTEREST RATE | OUTSTANDING BALANCE | INTEREST RATE | |||||||||
Senior Secured Credit Facility: | |||||||||||||
Term loan A (1) | $ | 500,000 | 3.27 | % | $ | — | — | % | |||||
Revolving credit facility (1) | 600,000 | 3.26 | % | — | — | % | |||||||
Total Senior Secured Credit Facility | 1,100,000 | — | |||||||||||
Former Credit Facility: | |||||||||||||
Term loan A (1) | — | — | % | 258,750 | 2.63 | % | |||||||
Term loan A-1 | — | — | % | 140,625 | 2.70 | % | |||||||
Revolving credit facility (1) | — | — | % | 622,000 | 2.67 | % | |||||||
Total Former Credit Facility | — | 1,021,375 | |||||||||||
PRP Mortgage Loan | — | — | % | 47,202 | 3.21 | % | |||||||
Financing obligations | 19,579 | 7.52% to 7.82% | 19,595 | 7.45% to 7.60% | |||||||||
Capital lease obligations | 2,015 | 2,364 | |||||||||||
Other notes payable | 904 | 0.00% to 2.18% | 1,776 | 0.00% to 7.00% | |||||||||
Less: unamortized debt discount and issuance costs | (4,394 | ) | (2,827 | ) | |||||||||
Total debt, net | 1,118,104 | 1,089,485 | |||||||||||
Less: current portion of long-term debt | (26,335 | ) | (35,079 | ) | |||||||||
Long-term debt, net | $ | 1,091,769 | $ | 1,054,406 | |||||||||
________________
(1) | Represents the weighted-average interest rate for the respective period. |
Bloomin’ Brands, Inc. is a holding company and conducts its operations through its subsidiaries, certain of which have incurred indebtedness as described below.
New Credit Agreement - On November 30, 2017, the Company and OSI, as co-borrowers, entered into a credit agreement (the “Credit Agreement”) with a syndicate of institutional lenders, providing for senior secured financing of up to $1.5 billion consisting of a $500.0 million Term loan A and a $1.0 billion revolving credit facility, including a letter of credit and swing line loan sub-facilities (the “Senior Secured Credit Facility”). The Senior Secured Credit Facility matures on November 30, 2022.
At closing, $697.0 million was drawn under the revolving credit facility. The proceeds of the Credit Agreement were used to repay OSI’s former senior secured credit facility (the “Former Credit Facility”). The Company’s total indebtedness was not materially changed as a result of the refinancing.
OSI’s Former Credit Facility, originally dated October 26, 2012, as amended, provided up to $1.4 billion, consisting of a $300.0 million Term loan A, a $150.0 million Term loan A-1 and a $825.0 million revolving credit facility, including letter of credit and swing line loan sub-facilities. Prior to the refinancing, in May 2017, OSI amended its former credit agreement, which provided for the $125.0 million Term loan A-2.
92
The Company may elect an interest rate for the Credit Agreement at each reset period based on the Alternate Base Rate or the Eurocurrency Rate. The Alternate Base Rate option is the highest of: (i) the prime rate of Wells Fargo Bank, National Association, (ii) the federal funds effective rate plus 0.5 of 1.0% or (iii) the Eurocurrency rate with a one-month interest period plus 1.0% (the “Alternate Base Rate”). The Eurocurrency Rate option is the seven, 30, 60, 90 or 180-day Eurocurrency rate (“Eurocurrency Rate”). The interest rates are as follows:
BASE RATE ELECTION | EUROCURRENCY RATE ELECTION | ||
Term loan A and revolving credit facility | 50 to 100 basis points over Base Rate | 150 to 200 basis points over the Eurocurrency Rate | |
Fees on letters of credit and the daily unused availability under the revolving credit facility as of December 31, 2017 were 1.88% and 0.30%, respectively. As of December 31, 2017, $22.7 million of the revolving credit facility was committed for the issuance of letters of credit and not available for borrowing.
The Senior Secured Credit Facility is guaranteed by each of the Company’s current and future domestic subsidiaries and is secured by substantially all now owned or later acquired assets of the Company and OSI, including the Company’s domestic subsidiaries.
PRP Mortgage Loan - During 2016, New Private Restaurant Partners, LLC, an indirect wholly-owned subsidiary of the Company (“PRP”) entered into loan agreements (the “PRP Mortgage Loan”), as borrower, and Wells Fargo Bank, National Association, as lender, for $369.5 million. The proceeds of the PRP Mortgage Loan were used, together with borrowings under the Company’s revolving credit facility, to prepay a portion, and fully defease the remainder, of the 2012 CMBS loan. The Company repaid the PRP Mortgage Loan in April 2017.
Financing Obligation - During 2016, the Company sold six restaurant properties to third parties for aggregate proceeds of $18.5 million and the Company entered into lease agreements under which the Company agreed to lease back each of the properties for an initial term of 20 years. As the Company had continuing involvement in these restaurant properties, the sale of the properties did not qualify for sale-leaseback accounting. As a result, the aggregate proceeds were recorded as a financing obligation on its Consolidated Balance Sheet. As such, the lease payments are recognized as interest expense. See Note 19 - Commitments and Contingencies for additional details regarding the financing obligation.
Debt Covenants and Other Restrictions - Borrowings under the Company’s debt agreements are subject to various covenants that limit its ability to: incur additional indebtedness; make significant payments; sell assets; pay dividends and other restricted payments; acquire certain assets; effect mergers and similar transactions; and effect certain other transactions with affiliates. The Senior Secured Credit Facility has a financial covenant to maintain a specified quarterly Total Net Leverage Ratio (“TNLR”). TNLR is the ratio of Consolidated Total Debt (Current portion of long-term debt and Long-term debt, net of cash) to Consolidated EBITDA (earnings before interest, taxes, depreciation and amortization and certain other adjustments as defined in the Credit Agreement). The TNLR may not exceed 4.50 to 1.00. The Company’s TNLR as of December 31, 2017 does not limit the Company’s ability to draw on its revolving credit facility.
The Senior Secured Credit Facility permits regular quarterly dividend payments, subject to certain restrictions.
As of December 31, 2017 and December 25, 2016, the Company was in compliance with its debt covenants.
93
Loss on Defeasance, Extinguishment and Modification of Debt - Following is a summary of loss on defeasance, extinguishment and modification of debt recorded in the Company’s Consolidated Statements of Operations and Comprehensive Income:
FISCAL YEAR | |||||||||||
(dollars in thousands) | 2017 | 2016 | 2015 | ||||||||
Refinancing of Senior Secured Credit Facility | $ | 809 | $ | — | $ | 2,956 | |||||
Modification of the Former Credit Facility | 260 | — | — | ||||||||
Defeasance of 2012 CMBS Loan (1) | — | 26,580 | — | ||||||||
Modification of PRP Mortgage Loan | — | 418 | — | ||||||||
Loss on defeasance, extinguishment and modification of debt | $ | 1,069 | $ | 26,998 | $ | 2,956 | |||||
________________
(1) | The loss was comprised primarily of a penalty of $23.2 million. |
Deferred financing fees - The Company deferred $9.7 million and $5.8 million of financing costs incurred in connection with the refinancing of its Credit Agreement and PRP Mortgage Loan in 2017 and 2016, respectively. Deferred financing fees of $6.9 million associated with the revolving credit facility were recorded in Other Assets, net in 2017. All other deferred financing fees associated with the refinancing of the Credit Agreement and PRP Mortgage Loan in 2017 and 2016, respectively, were recorded in Long-term debt, net.
Maturities - Following is a summary of principal payments of the Company’s total consolidated debt outstanding:
(dollars in thousands) | DECEMBER 31, 2017 | ||
Year 1 | $ | 26,335 | |
Year 2 | 25,543 | ||
Year 3 | 25,487 | ||
Year 4 | 37,969 | ||
Year 5 | 983,307 | ||
Thereafter | 19,463 | ||
Total | $ | 1,118,104 | |
The following is a summary of required amortization payments for the Term loan A:
SCHEDULED QUARTERLY PAYMENT DATES (dollars in thousands) | TERM LOAN A | |||
April 1, 2018 through December 27, 2020 | $ | 6,250 | ||
March 28, 2021 through December 26, 2021 | $ | 9,375 | ||
March 27, 2022 through September 25, 2022 | $ | 12,500 | ||
The Senior Secured Credit Facility contains mandatory prepayment requirements for Term loan A. The Company is required to prepay outstanding amounts under these loans with 50% of its annual excess cash flow, as defined in the agreement. The amount of outstanding loans required to be prepaid in accordance with the debt covenants may vary based on the Company’s leverage ratio and year end results. Other than the required minimum amortization premiums of $25.0 million, the Company does not anticipate any other payments will be required through December 30, 2018.
94
13. Other Long-term Liabilities, Net
Other long-term liabilities, net, consisted of the following:
(dollars in thousands) | DECEMBER 31, 2017 | DECEMBER 25, 2016 | |||||
Accrued insurance liability | $ | 35,945 | $ | 39,260 | |||
Unfavorable leases (1) | 36,661 | 41,778 | |||||
Chef and Restaurant Managing Partner deferred compensation obligations and deposits | 81,083 | 102,768 | |||||
Other long-term liabilities | 52,056 | 35,224 | |||||
$ | 205,745 | $ | 219,030 | ||||
_______________
(1) | Net of accumulated amortization of $34.0 million and $32.6 million as of December 31, 2017 and December 25, 2016, respectively. |
14. Redeemable Noncontrolling Interests
Brazil Redeemable Noncontrolling Interests - In 2013, the Company, through its wholly-owned subsidiary, Outback Steakhouse Restaurantes Brasil S.A. (“OB Brasil”), completed the acquisition of a controlling interest in PGS Consultoria e Serviços Ltda. (the “Brazil Joint Venture”). The purchase agreement provided certain former equity holders of the Brazil Joint Venture with options to sell their remaining interests to OB Brasil and provided OB Brasil with options to purchase such remaining interests (the “Options”).
In 2016 and 2015, the former equity holders exercised Options to sell their interests in the Brazil Joint Venture to the Company for total cash consideration of $27.3 million and $0.9 million, respectively. These transactions resulted in a reduction of $29.4 million and $0.6 million of Mezzanine equity and an increase of $2.1 million and $0.3 million of Additional paid-in capital during 2016 and 2015, respectively. The Company also recognized a cumulative translation adjustment of $9.6 million, which resulted in an increase to Additional paid-in capital and a decrease to Accumulated other comprehensive loss during 2016. As a result of these transactions, the Company owns 100% of the Brazil Joint Venture.
China Redeemable Noncontrolling Interests - The Company also consolidates a subsidiary in China, which has noncontrolling interests that are permitted to deliver subsidiary shares in exchange for cash at a future date.
Rollforward of Redeemable Noncontrolling Interests - The following table presents a rollforward of Redeemable noncontrolling interests:
FISCAL YEAR | |||||||
(dollars in thousands) | 2017 | 2016 | |||||
Balance, beginning of period | $ | 547 | $ | 23,526 | |||
Change in redemption value of Redeemable noncontrolling interests | 211 | 2,024 | |||||
Net (loss) income attributable to Redeemable noncontrolling interests | (784 | ) | 977 | ||||
Foreign currency translation attributable to Redeemable noncontrolling interests | 26 | 3,451 | |||||
Purchase of Redeemable noncontrolling interests | — | (29,431 | ) | ||||
Balance, end of period | $ | — | $ | 547 | |||
95
15. Stockholders’ Equity
Share Repurchases - Following is a summary of the Company’s share repurchase programs as of December 31, 2017 (dollars in thousands):
SHARE REPURCHASE PROGRAM | BOARD APPROVAL DATE | AUTHORIZED | REPURCHASED | CANCELED | REMAINING | |||||||||||||
2014 | December 12, 2014 | $ | 100,000 | $ | 100,000 | $ | — | $ | — | |||||||||
2015 | August 3, 2015 | $ | 100,000 | $ | 69,999 | $ | 30,001 | $ | — | |||||||||
2016 | February 12, 2016 | $ | 250,000 | $ | 139,892 | $ | 110,108 | $ | — | |||||||||
July 2016 | July 26, 2016 | $ | 300,000 | $ | 247,731 | $ | 52,269 | $ | — | |||||||||
2017 | April 21, 2017 | $ | 250,000 | $ | 195,000 | $ | — | $ | 55,000 | |||||||||
Following is a summary of the shares repurchased under the Company’s share repurchase programs:
NUMBER OF SHARES (in thousands) | AVERAGE REPURCHASE PRICE PER SHARE | AMOUNT (dollars in thousands) | |||||||||||||||||||
2017 | 2016 | 2017 | 2016 | 2017 | 2016 | ||||||||||||||||
First fiscal quarter | 2,887 | 4,399 | $ | 18.37 | $ | 17.05 | $ | 53,053 | $ | 75,000 | |||||||||||
Second fiscal quarter | 7,030 | 3,376 | $ | 20.72 | $ | 19.22 | 145,675 | 64,892 | |||||||||||||
Third fiscal quarter | 3,890 | 7,056 | $ | 19.03 | $ | 19.13 | 74,008 | 135,000 | |||||||||||||
Fourth fiscal quarter | — | 1,816 | $ | — | $ | 19.27 | — | 34,995 | |||||||||||||
Total common stock repurchases | 13,807 | 16,647 | $ | 19.75 | $ | 18.62 | $ | 272,736 | $ | 309,887 | |||||||||||
On February 16, 2018, the Company’s Board of Directors (the “Board”) canceled the remaining $55.0 million of authorization under the 2017 Share Repurchase Program and approved a new $150.0 million authorization (the “2018 Share Repurchase Program”). The 2018 Share Repurchase Program will expire on August 16, 2019.
Dividends - The Company declared and paid dividends per share during the periods presented as follows:
DIVIDENDS PER SHARE | AMOUNT (dollars in thousands) | ||||||||||||||
2017 | 2016 | 2017 | 2016 | ||||||||||||
First fiscal quarter | $ | 0.08 | $ | 0.07 | $ | 8,254 | $ | 8,238 | |||||||
Second fiscal quarter | 0.08 | 0.07 | 8,054 | 7,978 | |||||||||||
Third fiscal quarter | 0.08 | 0.07 | 7,369 | 7,765 | |||||||||||
Fourth fiscal quarter | 0.08 | 0.07 | 7,311 | 7,398 | |||||||||||
Total cash dividends declared and paid | $ | 0.32 | $ | 0.28 | $ | 30,988 | $ | 31,379 | |||||||
In February 2018, the Board declared a quarterly cash dividend of $0.09 per share, payable on March 14, 2018 to shareholders of record at the close of business on March 5, 2018.
Acquisition of Limited Partnership Interests - During 2016, the Company purchased the remaining partnership interests in certain of the Company’s limited partnerships for five Outback Steakhouse restaurants for an aggregate purchase price of $3.4 million. These transactions resulted in a reduction of $2.5 million, net of tax, in Additional paid-in capital in the Company’s Consolidated Statement of Changes in Stockholders’ Equity.
96
The following table sets forth the effect of the acquisition of the limited partnership interests on stockholders’ equity attributable to Bloomin’ Brands for the following periods:
NET INCOME ATTRIBUTABLE TO BLOOMIN’ BRANDS AND TRANSFERS TO NONCONTROLLING INTERESTS | |||||||
FISCAL YEAR | |||||||
(dollars in thousands) | 2017 | 2016 | |||||
Net income attributable to Bloomin’ Brands | $ | 100,243 | $ | 41,748 | |||
Transfers to noncontrolling interests: | |||||||
Decrease in Bloomin’ Brands additional paid-in capital for purchase of limited partnership interests | (713 | ) | (2,475 | ) | |||
Change from net income attributable to Bloomin’ Brands and transfers to noncontrolling interests | $ | 99,530 | $ | 39,273 | |||
Accumulated Other Comprehensive Loss - Following are the components of Accumulated other comprehensive loss (“AOCL”):
(dollars in thousands) | DECEMBER 31, 2017 | DECEMBER 25, 2016 | |||||
Foreign currency translation adjustment | $ | (98,573 | ) | $ | (107,509 | ) | |
Unrealized losses on derivatives, net of tax | (626 | ) | (3,634 | ) | |||
Accumulated other comprehensive loss | $ | (99,199 | ) | $ | (111,143 | ) | |
Following are the components of Other comprehensive (loss) income during the periods indicated:
FISCAL YEAR | |||||||||||
(dollars in thousands) | 2017 | 2016 | 2015 | ||||||||
Bloomin’ Brands: | |||||||||||
Foreign currency translation adjustment | $ | 8,936 | $ | 33,667 | $ | (92,259 | ) | ||||
Out-of period adjustment - foreign currency translation (1) | — | — | 9,232 | ||||||||
Total foreign currency translation adjustment | $ | 8,936 | $ | 33,667 | $ | (83,027 | ) | ||||
Unrealized gain (loss) on derivatives, net of tax (2) | $ | 627 | $ | (1,250 | ) | $ | (6,033 | ) | |||
Reclassification of adjustment for loss on derivatives included in Net income, net of tax (3) | 2,381 | 3,807 | 2,235 | ||||||||
Total unrealized gain (loss) on derivatives, net of tax | $ | 3,008 | $ | 2,557 | $ | (3,798 | ) | ||||
Other comprehensive income (loss) attributable to Bloomin’ Brands | $ | 11,944 | $ | 36,224 | $ | (86,825 | ) | ||||
Non-controlling interests: | |||||||||||
Foreign currency translation adjustment | $ | (3 | ) | $ | (43 | ) | $ | 9 | |||
Other comprehensive (loss) income attributable to Non-controlling interests | $ | (3 | ) | $ | (43 | ) | $ | 9 | |||
Redeemable non-controlling interests: | |||||||||||
Foreign currency translation adjustment | $ | 26 | $ | 3,451 | $ | (3,944 | ) | ||||
Out-of period adjustment - foreign currency translation (1) | — | — | (9,232 | ) | |||||||
Total foreign currency translation adjustment | $ | 26 | $ | 3,451 | $ | (13,176 | ) | ||||
Other comprehensive income (loss) attributable to Redeemable non-controlling interests | $ | 26 | $ | 3,451 | $ | (13,176 | ) | ||||
________________
(1) | In 2015, the Company identified and corrected errors in accounting for the allocation of foreign currency translation adjustments to Redeemable noncontrolling interests and fair value adjustments for Redeemable noncontrolling interests. The errors resulted in a reclassification of $9.2 million from Comprehensive income attributable to Bloomin’ Brands to Comprehensive income (loss) attributable to Redeemable noncontrolling interests. |
(2) | Unrealized gain (loss) on derivatives is net of tax of $0.5 million, ($0.8) million and ($3.9) million for 2017, 2016 and 2015, respectively. |
(3) | Reclassifications of adjustments for losses on derivatives are net of tax benefits of $1.5 million, $2.4 million and $1.4 million for 2017, 2016 and 2015 respectively. |
97
Noncontrolling Interests - In 2015, certain former equity holders of PGS Par contributed approximately $3.2 million to the Company for a noncontrolling interest in Abbraccio in Brazil.
16. Derivative Instruments and Hedging Activities
Interest Rate Risk - The Company manages economic risks, including interest rate variability, primarily by managing the amount, sources and duration of its debt funding and through the use of derivative financial instruments. The Company’s objectives in using interest rate derivatives are to manage its exposure to interest rate movements. To accomplish this objective, the Company uses interest rate swaps.
DESIGNATED HEDGES
Cash Flow Hedges of Interest Rate Risk - On September 9, 2014, the Company entered into variable-to-fixed interest rate swap agreements with eight counterparties to hedge a portion of the cash flows of the Company’s variable rate debt. The swap agreements have an aggregate notional amount of $400.0 million, a start date of June 30, 2015, and mature on May 16, 2019. Under the terms of the swap agreements, the Company pays a weighted-average fixed rate of 2.02% on the notional amount and receives payments from the counterparty based on the 30-day LIBOR rate.
The interest rate swaps, which have been designated and qualify as a cash flow hedge, are recognized on the Company’s Consolidated Balance Sheets at fair value and are classified based on the instruments’ maturity dates. The Company estimates $1.0 million will be reclassified to interest expense over the next twelve months.
The following table presents the fair value of the Company’s interest rate swaps as well as their classification on the Company’s Consolidated Balance Sheets:
(dollars in thousands) | DECEMBER 31, 2017 | DECEMBER 25, 2016 | CONSOLIDATED BALANCE SHEET CLASSIFICATION | ||||||
Interest rate swaps - asset (1) | $ | 67 | $ | — | Other assets, net | ||||
Interest rate swaps - liability | $ | 1,010 | $ | 3,968 | Accrued and other current liabilities | ||||
Interest rate swaps - liability | — | 1,999 | Other long-term liabilities, net | ||||||
Total fair value of derivative instruments - liabilities (1) | $ | 1,010 | $ | 5,967 | |||||
Accrued interest | $ | 15 | $ | 408 | Accrued and other current liabilities | ||||
____________________
(1) See Note 17 - Fair Value Measurements for fair value discussion of the interest rate swaps.
The following table summarizes the effects of the interest rate swaps on Net income for the periods indicated:
FISCAL YEAR | |||||||||||
(dollars in thousands) | 2017 | 2016 | 2015 | ||||||||
Interest rate swap expense recognized in Interest expense, net (1) | $ | (3,908 | ) | $ | (6,241 | ) | $ | (3,664 | ) | ||
Income tax benefit recognized in Provision for income taxes | 1,527 | 2,434 | 1,429 | ||||||||
Total effects of the interest rate swaps on Net income | $ | (2,381 | ) | $ | (3,807 | ) | $ | (2,235 | ) | ||
____________________
(1) | During the periods presented, the Company did not recognize any gain or loss as a result of hedge ineffectiveness. |
The Company records its derivatives on its Consolidated Balance Sheets on a gross balance basis. The Company’s interest rate swaps are subject to master netting arrangements. As of December 31, 2017, the Company did not have more than one derivative between the same counterparties and as such, there was no netting.
The Company is exposed to credit-related losses in the event that the counterparty fails to perform under the terms of the derivative contract. To mitigate this risk, the Company enters into derivative contracts with major financial
98
institutions based upon credit ratings and other factors. The Company continually assesses the creditworthiness of its counterparties. As of December 31, 2017 and December 25, 2016, all counterparties to the interest rate swaps had performed in accordance with their contractual obligations.
The Company has agreements with each of its derivative counterparties that contain a provision where the Company could be declared in default on its derivative obligations if the repayment of the underlying indebtedness is accelerated by the lender due to the Company’s default on indebtedness.
As of December 31, 2017 and December 25, 2016, the fair value of the Company’s interest rate swaps in a net liability position, which includes accrued interest but excludes any adjustment for nonperformance risk, was $1.0 million and $6.4 million, respectively. As of December 31, 2017 and December 25, 2016, the Company has not posted any collateral related to these agreements. If the Company had breached any of these provisions as of December 31, 2017 and December 25, 2016, it could have been required to settle its obligations under the agreements at their termination value of $1.0 million and $6.4 million, respectively.
17. Fair Value Measurements
Fair Value Measurements on a Recurring Basis - The following table presents the Company’s financial assets and liabilities measured at fair value by hierarchy level on a recurring basis:
DECEMBER 31, 2017 | DECEMBER 25, 2016 | ||||||||||||||||||||||
(dollars in thousands) | TOTAL | LEVEL 1 | LEVEL 2 | TOTAL | LEVEL 1 | LEVEL 2 | |||||||||||||||||
Assets: | |||||||||||||||||||||||
Cash equivalents: | |||||||||||||||||||||||
Fixed income funds | $ | 1,830 | $ | 1,830 | $ | — | $ | 90 | $ | 90 | $ | — | |||||||||||
Money market funds | 24,656 | 24,656 | — | 18,607 | 18,607 | — | |||||||||||||||||
Restricted cash equivalents: | |||||||||||||||||||||||
Fixed income funds | — | — | — | 552 | 552 | — | |||||||||||||||||
Money market funds | 1,280 | 1,280 | — | 2,518 | 2,518 | — | |||||||||||||||||
Other assets, net: | |||||||||||||||||||||||
Derivative instruments - interest rate swaps | 67 | — | 67 | — | — | — | |||||||||||||||||
Total asset recurring fair value measurements | $ | 27,833 | $ | 27,766 | $ | 67 | $ | 21,767 | $ | 21,767 | $ | — | |||||||||||
Liabilities: | |||||||||||||||||||||||
Accrued and other current liabilities: | |||||||||||||||||||||||
Derivative instruments - interest rate swaps | $ | 1,010 | $ | — | $ | 1,010 | $ | 3,968 | $ | — | $ | 3,968 | |||||||||||
Derivative instruments - commodities | — | — | — | 157 | — | 157 | |||||||||||||||||
Other long-term liabilities: | |||||||||||||||||||||||
Derivative instruments - interest rate swaps | — | — | — | 1,999 | — | 1,999 | |||||||||||||||||
Total liability recurring fair value measurements | $ | 1,010 | $ | — | $ | 1,010 | $ | 6,124 | $ | — | $ | 6,124 | |||||||||||
Fair value of each class of financial instrument is determined based on the following:
FINANCIAL INSTRUMENT | METHODS AND ASSUMPTIONS | |
Fixed income funds and Money market funds | Carrying value approximates fair value because maturities are less than three months. | |
Derivative instruments | The Company’s derivative instruments include interest rate swaps and commodities. Fair value measurements are based on the contractual terms of the derivatives and use observable market-based inputs. The interest rate swaps are valued using a discounted cash flow analysis on the expected cash flows of each derivative using observable inputs including interest rate curves and credit spreads. The Company also considers its own nonperformance risk and the respective counterparty’s nonperformance risk in the fair value measurements. As of December 31, 2017 and December 25, 2016 the Company has determined that the credit valuation adjustments are not significant to the overall valuation of its derivatives. | |
99
Fair Value Measurements on a Nonrecurring Basis - Assets and liabilities that are measured at fair value on a nonrecurring basis relate primarily to property, fixtures and equipment, goodwill and other intangible assets, which are remeasured when carrying value exceeds fair value. The following table summarizes the fair value remeasurements for Assets held for sale and Property, fixtures and equipment, aggregated by the level in the fair value hierarchy within which those measurements fall:
2017 | 2016 | 2015 | |||||||||||||||||||||
(dollars in thousands) | CARRYING VALUE | TOTAL IMPAIRMENT | CARRYING VALUE | TOTAL IMPAIRMENT | CARRYING VALUE | TOTAL IMPAIRMENT | |||||||||||||||||
Assets held for sale (1) | $ | 870 | $ | 467 | $ | 45,901 | $ | 44,729 | $ | 4,136 | $ | 1,028 | |||||||||||
Property, fixtures and equipment (2) | 19,222 | 23,539 | 21,450 | 53,136 | 3,634 | 27,126 | |||||||||||||||||
Other (3) | — | 1,444 | 39 | 1,198 | — | — | |||||||||||||||||
$ | 20,092 | $ | 25,450 | $ | 67,390 | $ | 99,063 | $ | 7,770 | $ | 28,154 | ||||||||||||
________________
(1) | Carrying value approximates fair value with all assets measured using Level 2 inputs (purchase contracts and market appraisals) to estimate the fair value. Refer to Note 4 - Impairments and Exit Costs for discussion of impairments related to Outback Steakhouse South Korea and Roy’s. |
(2) | Carrying value approximates fair value. Carrying values for assets measured using Level 2 inputs totaled $19.2 million, $20.3 million and $2.5 million for 2017, 2016 and 2015, respectively. Assets measured using Level 3 inputs, had carrying values of $1.2 million and $1.1 million for 2016 and 2015, respectively. Third-party market appraisals (Level 2) and discounted cash flow models (Level 3) were used to estimate the fair value. Refer to Note 4 - Impairments and Exit Costs for discussion of impairments related to closure and restructuring initiatives. |
(3) | Other primarily includes: (i) goodwill in 2017 and (ii) investment in unconsolidated affiliates and intangible assets in 2016. Carrying value approximates fair value with all assets measured using market appraisals (Level 2) to estimate the fair value. |
Fair Value of Financial Instruments - The Company’s non-derivative financial instruments as of December 31, 2017 and December 25, 2016 consist of cash equivalents, restricted cash, accounts receivable, accounts payable and current and long-term debt, the fair values of which approximate their carrying amounts reported in its Consolidated Balance Sheets due to their short duration.
Debt is carried at amortized cost; however, the Company estimates the fair value of debt for disclosure purposes. The following table includes the carrying value and fair value of the Company’s debt, aggregated by the level in the fair value hierarchy in which those measurements fall:
DECEMBER 31, 2017 | DECEMBER 25, 2016 | ||||||||||||||||||||||
CARRYING VALUE | FAIR VALUE | CARRYING VALUE | FAIR VALUE | ||||||||||||||||||||
(dollars in thousands) | LEVEL 2 | LEVEL 3 | LEVEL 2 | LEVEL 3 | |||||||||||||||||||
Senior Secured Credit Facility: | |||||||||||||||||||||||
Term loan A | $ | 500,000 | $ | 502,500 | $ | — | $ | — | $ | — | $ | — | |||||||||||
Revolving credit facility | $ | 600,000 | $ | 598,500 | $ | — | $ | — | $ | — | $ | — | |||||||||||
Former Credit Facility: | |||||||||||||||||||||||
Term loan A | $ | — | $ | — | $ | — | $ | 258,750 | $ | 257,780 | $ | — | |||||||||||
Term loan A-1 | $ | — | $ | — | $ | — | $ | 140,625 | $ | 140,098 | $ | — | |||||||||||
Revolving credit facility | $ | — | $ | — | $ | — | $ | 622,000 | $ | 617,335 | $ | — | |||||||||||
PRP Mortgage Loan | $ | — | $ | — | $ | — | $ | 47,202 | $ | — | $ | 47,202 | |||||||||||
Other notes payable | $ | 904 | $ | — | $ | 891 | $ | 1,776 | $ | — | $ | 1,659 | |||||||||||
100
Fair value of debt is determined based on the following:
DEBT FACILITY | METHODS AND ASSUMPTIONS | |
Senior Secured Credit Facility and Former Credit Facility | Quoted market prices in inactive markets. | |
PRP mortgage loan | Assumptions derived from current conditions in real estate and credit markets, changes in underlying collateral and expectations of management. | |
Other notes payable | Discounted cash flow approach with inputs that primarily include cost of debt interest rates used to determine fair value. | |
18. Income Taxes
On December 22, 2017, the U.S. government enacted comprehensive tax legislation commonly referred to as the Tax Cuts and Jobs Act (the “Tax Act”). The Tax Act makes broad and complex changes to the U.S. tax code that impacted the Company’s 2017 provision for income taxes, including, but not limited to: (i) requiring a one-time transition tax on certain unrepatriated earnings of foreign subsidiaries that is payable over eight years and (ii) bonus depreciation that will allow for full expensing of qualified property.
The Tax Act also establishes new tax laws that will affect 2018, including, but not limited to: (i) reduction of the U.S. federal corporate tax rate; (ii) elimination of the corporate alternative minimum tax; (iii) the creation of the base erosion anti-abuse tax, a new minimum tax; (iv) a general elimination of U.S. federal income taxes on dividends from foreign subsidiaries; (v) a new provision designed to tax global intangible low-taxed income (“GILTI”), which allows for the possibility of using foreign tax credits (“FTCs”) and a deduction of up to 50 percent to offset the income tax liability (subject to some limitations); (vi) a new limitation on deductible interest expense; (vii) the repeal of the domestic manufacturing deduction; (viii) limitations on the deductibility of certain executive compensation; (ix) limitations on the use of FTCs to reduce the U.S. income tax liability; and (x) limitations on net operating losses generated after December 31, 2017, to 80 percent of taxable income.
The SEC staff issued Staff Accounting Bulletin No. 118 (“SAB 118”), which provides guidance on accounting for the tax effects of the Tax Act. SAB 118 provides a measurement period that should not extend beyond one year from the Tax Act enactment date for companies to complete the accounting under ASC 740. In accordance with SAB 118, a company must reflect the income tax effects of those aspects of the Act for which the accounting under ASC 740 is complete. To the extent that a company’s accounting for certain income tax effects of the Tax Act is incomplete but it is able to determine a reasonable estimate, it must record a provisional estimate in the financial statements. If a company cannot determine a provisional estimate to be included in the financial statements, it should continue to apply ASC 740 on the basis of the provisions of the tax laws that were in effect immediately before the enactment of the Tax Act.
In connection with its initial analysis of the impact of the Tax Act, the Company recorded a provisional net tax expense of $1.9 million in the period ending December 31, 2017, as described in the following table:
FISCAL YEAR | |||
(dollars in thousands) | 2017 | ||
Transition Tax (provisional) | $ | 100 | |
Net impact on U.S. deferred tax assets and liabilities (provisional) (1) | 1,600 | ||
Net changes in deferred tax liability associated with anticipated repatriation taxes (provisional) | 200 | ||
$ | 1,900 | ||
________________
(1) | Includes $4.7 million of expense for a valuation allowance recorded against foreign tax credit carryforwards, $3.9 million of benefit from the impact of the corporate rate reduction on net deferred tax liability balances, and an expense of $0.8 million for the write-off of certain deferred tax assets that will no longer be realized. |
101
For various reasons that are discussed more fully below, the Company has not completed its accounting for the income tax effects of the Tax Act. The Company has made reasonable estimates of the effects of the Tax Act and recorded the provisional adjustments as shown in the table above.
Reduction of U.S. Federal Corporate Income Tax Rate - The Tax Act reduces the corporate income tax rate to 21 percent, effective January 1, 2018. While the Company is able to make a reasonable estimate of the impact of the reduction in corporate rate on its deferred tax assets and liabilities, it may be affected by other analyses related to the Tax Act, including, but not limited to, its calculation of deemed repatriation of deferred foreign income and the state tax effect of adjustments made to federal temporary differences.
Deemed Repatriation Transition Tax - The Deemed Repatriation Transition Tax (“Transition Tax”) is a tax on previously untaxed accumulated and current earnings and profits (“E&P”) of the Company’s foreign subsidiaries. To determine the amount of the Transition Tax, the Company must determine, in addition to other factors, the amount of post-1986 E&P of the relevant subsidiaries, as well as the amount of non-U.S. income taxes paid on such earnings. The Company is able to make a reasonable estimate of the Transition Tax and recorded a provisional amount. Due to the ability to utilize foreign tax credits in the calculation of the Transition Tax, the obligation primarily related to the estimated state impacts. However, the Company is continuing to gather additional information. Additional guidance from the U.S. Treasury and state taxing authorities on the application of certain provisions of the Tax Act is expected in the future.
Valuation Allowances - The Company must assess whether its valuation allowance analyses or deferred tax assets are affected by various aspects of the Tax Act (e.g., deemed repatriation of deferred foreign income, GILTI inclusions and new categories of FTCs). While the Company did record an additional valuation allowance against foreign tax credit carryforwards, the Company has recorded provisional amounts related to certain portions of the Tax Act and any corresponding determination of the need for a change in a valuation allowance is also provisional.
The Company is continuing to evaluate other provisions of the Tax Act and the application of ASC 740, however, the Company has estimated that these provisions will not have a material impact in the current year.
The following table presents the domestic and foreign components of Income before provision for income taxes:
FISCAL YEAR | |||||||||||
(dollars in thousands) | 2017 | 2016 | 2015 | ||||||||
Domestic | $ | 119,632 | $ | 70,481 | $ | 146,331 | |||||
Foreign | (1,089 | ) | (13,990 | ) | 24,523 | ||||||
$ | 118,543 | $ | 56,491 | $ | 170,854 | ||||||
102
Provision (benefit) for income taxes consisted of the following:
FISCAL YEAR | |||||||||||
(dollars in thousands) | 2017 | 2016 | 2015 | ||||||||
Current provision: | |||||||||||
Federal | $ | 18,384 | $ | 43,071 | $ | 17,952 | |||||
State | 8,155 | 28,033 | 5,962 | ||||||||
Foreign | 9,041 | 14,389 | 11,384 | ||||||||
35,580 | 85,493 | 35,298 | |||||||||
Deferred (benefit) provision: | |||||||||||
Federal | (15,792 | ) | (53,647 | ) | 2,514 | ||||||
State | (3,850 | ) | (21,316 | ) | 626 | ||||||
Foreign | 47 | (386 | ) | 856 | |||||||
(19,595 | ) | (75,349 | ) | 3,996 | |||||||
Provision for income taxes | $ | 15,985 | $ | 10,144 | $ | 39,294 | |||||
Effective Income Tax Rate - The reconciliation of income taxes calculated at the United States federal tax statutory rate to the Company’s effective income tax rate is as follows:
FISCAL YEAR | ||||||||
2017 | 2016 | 2015 | ||||||
Income taxes at federal statutory rate | 35.0 | % | 35.0 | % | 35.0 | % | ||
State and local income taxes, net of federal benefit | 2.2 | 8.2 | 2.3 | |||||
Employment-related credits, net | (25.5 | ) | (53.5 | ) | (15.8 | ) | ||
Domestic manufacturing deduction | (4.3 | ) | — | — | ||||
Excess tax benefits from stock-based compensation arrangements (1) | (2.1 | ) | — | — | ||||
Noncontrolling interests | (1.3 | ) | (2.8 | ) | (0.8 | ) | ||
Net life insurance expense | (0.6 | ) | (2.7 | ) | (0.3 | ) | ||
Refranchising of Outback Steakhouse South Korea | — | 27.4 | — | |||||
Valuation allowance on deferred income tax assets | 3.1 | 6.1 | 1.7 | |||||
Nondeductible compensation | 3.1 | 2.5 | 0.8 | |||||
Cumulative effect of the Tax Act | 1.6 | — | — | |||||
Foreign rate differential | 1.6 | 0.8 | 0.6 | |||||
Tax settlements and related adjustments | 0.2 | (0.2 | ) | (0.1 | ) | |||
Other, net | 0.5 | (2.8 | ) | (0.4 | ) | |||
Total | 13.5 | % | 18.0 | % | 23.0 | % | ||
____________________
(1) | During 2017, excess tax benefits from share-based award activity are reflected as a reduction to the provision for income taxes as a result of the adoption of ASU No. 2016-09. |
The net decrease in the effective income tax rate in 2017 as compared to 2016 was primarily due to impairment and additional tax liabilities recorded in connection with the refranchising of Outback Steakhouse South Korea in 2016. The remaining decrease was primarily due to a domestic manufacturing deduction and excess tax benefits from equity-based compensation arrangements recorded in 2017. These decreases were mostly offset by employment-related credits being a lower percentage of net income in 2017 relative to 2016 and the impact of the Tax Act.
The net decrease in the effective income tax rate in 2016 as compared to 2015 was primarily due to benefits from employment-related credits being a higher percentage of net income in 2016 and a change in the amount and mix of income and losses across the Company’s domestic and international subsidiaries, partially offset by the refranchising of Outback Steakhouse South Korea.
103
Deferred Tax Assets and Liabilities - The income tax effects of temporary differences that give rise to significant portions of deferred income tax assets and liabilities are as follows:
(dollars in thousands) | DECEMBER 31, 2017 | DECEMBER 25, 2016 | |||||
Deferred income tax assets: | |||||||
Deferred rent | $ | 40,504 | $ | 57,783 | |||
Insurance reserves | 15,788 | 23,906 | |||||
Unearned revenue | 15,020 | 19,566 | |||||
Deferred compensation | 38,273 | 62,389 | |||||
Net operating loss carryforwards | 8,003 | 6,036 | |||||
Federal tax credit carryforwards | 75,661 | 58,963 | |||||
Partner deposits and accrued partner obligations | 4,326 | 8,245 | |||||
Other, net | 15,342 | 8,309 | |||||
Gross deferred income tax assets | 212,917 | 245,197 | |||||
Less: valuation allowance | (15,925 | ) | (7,220 | ) | |||
Net deferred income tax assets | 196,992 | 237,977 | |||||
Deferred income tax liabilities: | |||||||
Less: property, fixtures and equipment basis differences | (18,814 | ) | (37,847 | ) | |||
Less: intangible asset basis differences | (116,425 | ) | (155,053 | ) | |||
Less: deferred gain on extinguishment of debt | (7,180 | ) | (23,022 | ) | |||
Net deferred income tax assets | $ | 54,573 | $ | 22,055 | |||
Undistributed Earnings - The Company previously considered the earnings in its non-U.S. subsidiaries to be indefinitely reinvested and, accordingly, recorded no deferred income taxes. Given the Tax Act’s significant changes and potential opportunities to repatriate cash free of U.S. federal tax, the Company is in the process of evaluating its current permanent reinvestment assertions. This evaluation includes the repatriation of historical earnings (2017 and prior) that have been previously taxed under the Tax Act.
The Company had aggregate undistributed E&P from foreign subsidiaries of approximately $136.0 million, which is considered previously taxed income (“PTI”) subsequent to the Tax Act. The Company recorded $0.1 million in provisional Transition Tax in connection with this E&P. Due to the ability to utilize foreign tax credits in the calculation of the Transition Tax, the obligation primarily related to the estimated state impacts. Additionally, the Company has recorded a provisional deferred tax liability of $0.2 million as of December 31, 2017 for certain state income taxes on the future repatriation of PTI. The Company currently considers the remaining financial statement carrying amounts over the tax basis of investments in its foreign subsidiaries to be indefinitely reinvested, and have not recorded a provisional deferred tax liability. The determination of any unrecorded provisional deferred tax liability on this amount is not practicable due to the uncertainty of how these investments would be recovered.
Tax Carryforwards - The amount and expiration dates of tax loss carryforwards and credit carryforwards as of December 31, 2017 are as follows:
(dollars in thousands) | EXPIRATION DATE | AMOUNT | |||||
United States federal tax credit carryforwards | 2026 | - | 2037 | $ | 90,092 | ||
Foreign loss carryforwards | 2018 | - | Indefinite | $ | 29,581 | ||
Unrecognized Tax Benefits - As of December 31, 2017 and December 25, 2016, the liability for unrecognized tax benefits was $23.7 million and $19.6 million, respectively. Of the total amount of unrecognized tax benefits, including accrued interest and penalties, $24.0 million and $18.9 million, respectively, if recognized, would impact the Company’s effective tax rate.
104
The following table summarizes the activity related to the Company’s unrecognized tax benefits:
FISCAL YEAR | |||||||||||
(dollars in thousands) | 2017 | 2016 | 2015 | ||||||||
Balance as of beginning of year | $ | 19,583 | $ | 19,430 | $ | 17,563 | |||||
Additions for tax positions taken during a prior period | 4,149 | 476 | 3,022 | ||||||||
Reductions for tax positions taken during a prior period | (1,009 | ) | (430 | ) | (848 | ) | |||||
Additions for tax positions taken during the current period | 1,822 | 2,472 | 2,305 | ||||||||
Settlements with taxing authorities | — | (391 | ) | (1,078 | ) | ||||||
Lapses in the applicable statutes of limitations | (945 | ) | (2,230 | ) | (540 | ) | |||||
Translation adjustments | 63 | 256 | (994 | ) | |||||||
Balance as of end of year | $ | 23,663 | $ | 19,583 | $ | 19,430 | |||||
The Company had approximately $1.8 million and $1.2 million accrued for the payment of interest and penalties as of December 31, 2017 and December 25, 2016, respectively. The Company recognized immaterial interest and penalties related to uncertain tax positions in the Provision for income taxes, for all periods presented.
In many cases, the Company’s uncertain tax positions are related to tax years that remain subject to examination by relevant taxable authorities. Based on the outcome of these examinations, or a result of the expiration of the statute of limitations for specific jurisdictions, it is reasonably possible that the related recorded unrecognized tax benefits for tax positions taken on previously filed tax returns will change by approximately $3.0 million to $4.0 million within the next twelve months.
Open Tax Years - Following is a summary of the open audit years by jurisdiction:
OPEN AUDIT YEARS | |||
United States federal | 2007 | - | 2016 |
United States states | 2001 | - | 2016 |
Foreign | 2009 | - | 2016 |
The Company was previously under examination by tax authorities in South Korea for the 2008 to 2012 tax years. In connection with the examination, the Company was assessed and paid $6.7 million of tax obligations. The Company is currently seeking relief from double taxation through competent authority.
19. Commitments and Contingencies
Operating Leases - The Company leases restaurant and office facilities and certain equipment under operating leases mainly having initial terms expiring between 2018 and 2036. The restaurant facility leases have renewal clauses primarily from five to 30 years, exercisable at the option of the Company. Certain of these leases require the payment of contingent rentals leased on a percentage of gross revenues, as defined by the terms of the applicable lease agreement.
Total rent expense and sublease rental income is as follows for the periods indicated:
FISCAL YEAR | |||||||||||
(dollars in thousands) | 2017 | 2016 | 2015 | ||||||||
Rent expense (1) | $ | 188,205 | $ | 173,507 | $ | 164,754 | |||||
Sublease revenues | $ | 4,472 | $ | 853 | $ | 906 | |||||
____________________
(1) | Includes contingent rent expense of $4.3 million, $5.9 million and $7.4 million, respectively, for the periods presented. |
105
As of December 31, 2017, future minimum rental payments and sublease revenues under non-cancelable operating leases are as follows:
(dollars in thousands) | LEASE PAYMENTS (1) | SUBLEASE REVENUES | |||||
2018 | $ | 185,183 | $ | 5,068 | |||
2019 | 174,060 | 5,127 | |||||
2020 | 161,567 | 5,091 | |||||
2021 | 145,528 | 5,093 | |||||
2022 | 128,573 | 4,784 | |||||
Thereafter | 902,757 | 58,633 | |||||
Total minimum lease payments | $ | 1,697,668 | $ | 83,796 | |||
____________________
(1) | Minimum lease payments have not been reduced by minimum sublease rentals. |
Lease Guarantees - The Company assigned its interest, and is contingently liable, under certain real estate leases. These leases have varying terms, the latest of which expires in 2032. As of December 31, 2017, the undiscounted payments the Company could be required to make in the event of non-payment by the primary lessees was approximately $30.3 million. The present value of these potential payments discounted at the Company’s incremental borrowing rate as of December 31, 2017 was approximately $21.2 million. In the event of default, the indemnity clauses in the Company’s purchase and sale agreements govern its ability to pursue and recover damages incurred. The Company believes the financial strength and operating history of the buyers significantly reduces the risk that it will be required to make payments under these leases. Accordingly, no liability has been recorded.
Financing Obligation - Following is a summary of the Company’s minimum financing payments during the initial term of the various leases:
(dollars in thousands) | DECEMBER 31, 2017 | ||
Year 1 | $ | 1,323 | |
Year 2 | 1,345 | ||
Year 3 | 1,366 | ||
Year 4 | 1,398 | ||
Year 5 | 1,423 | ||
Thereafter | 22,219 | ||
Total (1) | $ | 29,074 | |
____________________
(1) | Refer to Note 12 - Long-term Debt, Net for additional details regarding the Company’s financing obligation. |
Purchase Obligations - Purchase obligations were $446.0 million and $439.4 million as of December 31, 2017 and December 25, 2016, respectively. These purchase obligations are primarily due within five years, however, commitments with various vendors extend through December 2023. Outstanding commitments consist primarily of food and beverage products related to normal business operations and contracts for restaurant level service contracts, advertising and technology. In 2017, the Company purchased more than 85% of its U.S. beef raw materials from four beef suppliers that represent more than 80% of the total beef marketplace in the U.S.
Litigation and Other Matters - In relation to various legal matters discussed below, the Company had $4.3 million and $3.5 million of liability recorded as of December 31, 2017 and December 25, 2016, respectively. During 2017, 2016 and 2015, the Company recognized $1.2 million, $4.0 million and $4.6 million, respectively, in Other restaurant operating expenses in the Company’s Consolidated Statements of Operations and Comprehensive Income for certain legal settlements.
106
In November 2015, David Sears and Elizabeth Thomas, two former Outback Managers (“Manager Plaintiffs”), sent a demand letter seeking unpaid overtime compensation on behalf of all managers and kitchen managers employed at Outback Steakhouse restaurants from November 2012 to present. The Manager Plaintiffs claimed that managers were not assigned sufficient management duties to qualify as exempt from overtime. In December 2016, the Company agreed to a tentative class settlement for eligible kitchen managers and in 2017, the class period closed and the Company made final payment of $2.3 million.
On October 4, 2013, two then-current employees (the “Nevada Plaintiffs”) filed a collective action lawsuit against the Company and certain of its subsidiaries. The complaint alleges violations of the Fair Labor Standards Act by requiring employees to work off the clock, complete on-line training without pay and attend meetings in the restaurant without pay. The nationwide collective action permitted all hourly employees in all Outback Steakhouse restaurants to join. The suit requested an unspecified amount in back pay for the employees that joined the lawsuit, an equal amount in liquidated damages, costs, expenses, and attorney’s fees. The Nevada Plaintiffs also filed a companion lawsuit in Nevada state court alleging that the Company violated the state break time rules. In November 2015, the Company reached a tentative settlement agreement resolving all claims and the cost of class administration for $3.2 million. The Court issued final approval in November 2016 and the Company subsequently made payment during 2016.
In addition, the Company is subject to legal proceedings, claims and liabilities, such as liquor liability, slip and fall cases, wage-and-hour and other employment-related litigation, which arise in the ordinary course of business and are generally covered by insurance if they exceed specified retention or deductible amounts. Other than the litigation noted above, in the opinion of management, the amount of ultimate liability with respect to those actions will not have a material adverse impact on the Company’s financial position or results of operations and cash flows.
Insurance - As of December 31, 2017, the future payments the Company expects for workers’ compensation, general liability and health insurance claims are:
(dollars in thousands) | |||
2018 | $ | 24,231 | |
2019 | 12,883 | ||
2020 | 8,336 | ||
2021 | 4,622 | ||
2022 | 2,512 | ||
Thereafter | 10,842 | ||
$ | 63,426 | ||
A reconciliation of the expected aggregate undiscounted reserves to the discounted reserves for insurance claims recognized on the Company’s Consolidated Balance Sheets is as follows:
(dollars in thousands) | DECEMBER 31, 2017 | DECEMBER 25, 2016 | |||||
Undiscounted reserves | $ | 63,426 | $ | 65,471 | |||
Discount (1) | (3,999 | ) | (2,678 | ) | |||
Discounted reserves | $ | 59,427 | $ | 62,793 | |||
Discounted reserves recognized in the Company’s Consolidated Balance Sheets: | |||||||
Accrued and other current liabilities | $ | 23,482 | $ | 23,533 | |||
Other long-term liabilities, net | 35,945 | 39,260 | |||||
$ | 59,427 | $ | 62,793 | ||||
____________________
(1) | Discount rates of 1.88% and 1.32% were used for December 31, 2017 and December 25, 2016, respectively. |
107
20. Segment Reporting
The Company has two reportable segments, U.S. and International, which reflects how the Company manages its business, reviews operating performance and allocates resources. The U.S. segment includes all brands operating in the U.S. while brands operating outside the U.S. are included in the International segment. Resources are allocated and performance is assessed by the Company’s Chief Executive Officer, whom the Company has determined to be its Chief Operating Decision Maker. Following is a summary of reporting segments as of December 31, 2017:
SEGMENT (1) | CONCEPT | GEOGRAPHIC LOCATION | ||
U.S. | Outback Steakhouse | United States of America | ||
Carrabba’s Italian Grill | ||||
Bonefish Grill | ||||
Fleming’s Prime Steakhouse & Wine Bar | ||||
International | Outback Steakhouse | Brazil, Hong Kong, China | ||
Carrabba’s Italian Grill (Abbraccio) | Brazil | |||
_________________
(1) | Includes franchise locations. |
Segment accounting policies are the same as those described in Note 2 - Summary of Significant Accounting Policies. Revenues for all segments include only transactions with customers and exclude intersegment revenues. Excluded from income from operations for U.S. and International are certain legal and corporate costs not directly related to the performance of the segments, certain stock-based compensation expenses and certain bonus expense.
The following table is a summary of Total revenue by segment:
FISCAL YEAR | |||||||||||
(dollars in thousands) | 2017 | 2016 | 2015 | ||||||||
Total revenues | |||||||||||
U.S. | $ | 3,750,959 | $ | 3,797,309 | $ | 3,879,743 | |||||
International | 462,387 | 455,003 | 497,933 | ||||||||
Total revenues | $ | 4,213,346 | $ | 4,252,312 | $ | 4,377,676 | |||||
The following table is a reconciliation of Segment income (loss) from operations to Income before Provision for income taxes:
FISCAL YEAR | |||||||||||
(dollars in thousands) | 2017 | 2016 | 2015 | ||||||||
Segment income (loss) from operations | |||||||||||
U.S. | $ | 297,260 | $ | 286,683 | $ | 348,731 | |||||
International | 28,916 | (5,954 | ) | 34,597 | |||||||
Total segment income from operations | 326,176 | 280,729 | 383,328 | ||||||||
Unallocated corporate operating expense | (180,084 | ) | (153,123 | ) | (152,403 | ) | |||||
Total income from operations | 146,092 | 127,606 | 230,925 | ||||||||
Loss on defeasance, extinguishment and modification of debt | (1,069 | ) | (26,998 | ) | (2,956 | ) | |||||
Other income (loss), net | 14,912 | 1,609 | (939 | ) | |||||||
Interest expense, net | (41,392 | ) | (45,726 | ) | (56,176 | ) | |||||
Income before Provision for income taxes | $ | 118,543 | $ | 56,491 | $ | 170,854 | |||||
108
The following table is a summary of Depreciation and amortization expense by segment:
FISCAL YEAR | |||||||||||
(dollars in thousands) | 2017 | 2016 | 2015 | ||||||||
Depreciation and amortization | |||||||||||
U.S. | $ | 149,976 | $ | 155,434 | $ | 151,868 | |||||
International | 27,796 | 26,013 | 26,736 | ||||||||
Corporate | 14,510 | 12,391 | 11,795 | ||||||||
Total depreciation and amortization | $ | 192,282 | $ | 193,838 | $ | 190,399 | |||||
The following table is a summary of capital expenditures by segment:
FISCAL YEAR | |||||||||||
(dollars in thousands) | 2017 | 2016 | 2015 | ||||||||
Capital expenditures | |||||||||||
U.S. | $ | 209,260 | $ | 211,855 | $ | 153,445 | |||||
International | 33,302 | 40,662 | 46,803 | ||||||||
Corporate | 13,280 | 17,671 | 10,015 | ||||||||
Total capital expenditures | $ | 255,842 | $ | 270,188 | $ | 210,263 | |||||
The following table sets forth Total assets by segment:
(dollars in thousands) | DECEMBER 31, 2017 | DECEMBER 25, 2016 | |||||
Assets | |||||||
U.S. | $ | 1,856,406 | $ | 1,995,227 | |||
International | 450,974 | 436,024 | |||||
Corporate | 265,527 | 211,028 | |||||
Total assets | $ | 2,572,907 | $ | 2,642,279 | |||
Geographic areas — International assets are defined as assets residing in a country other than the U.S. The following table details long-lived assets, excluding goodwill, intangible assets and deferred tax assets, by major geographic area:
(dollars in thousands) | DECEMBER 31, 2017 | DECEMBER 25, 2016 | |||||
U.S. | $ | 1,164,322 | $ | 1,231,154 | |||
International | 144,353 | 136,264 | |||||
$ | 1,308,675 | $ | 1,367,418 | ||||
International revenues are defined as revenues generated from restaurant sales originating in a country other than the U.S. The following table details Total revenues by major geographic area:
FISCAL YEAR | |||||||||||
(dollars in thousands) | 2017 | 2016 | 2015 | ||||||||
U.S. | $ | 3,750,959 | $ | 3,797,309 | $ | 3,879,743 | |||||
International: | |||||||||||
Brazil | 410,249 | 318,881 | 287,698 | ||||||||
Other | 52,138 | 136,122 | 210,235 | ||||||||
Total revenues | $ | 4,213,346 | $ | 4,252,312 | $ | 4,377,676 | |||||
109
21. Selected Quarterly Financial Data (Unaudited)
2017 FISCAL QUARTERS (dollars in thousands, except per share data) | FIRST (1) | SECOND (1) | THIRD (1) | FOURTH (1) | |||||||||||
Total revenues | $ | 1,143,823 | $ | 1,032,982 | $ | 948,899 | $ | 1,087,642 | |||||||
Income from operations | 69,130 | 42,154 | 3,182 | 31,626 | |||||||||||
Net income | 44,923 | 36,329 | 4,046 | 17,260 | |||||||||||
Net income attributable to Bloomin’ Brands | 43,910 | 35,630 | 4,336 | 16,367 | |||||||||||
Earnings per share: | |||||||||||||||
Basic | $ | 0.43 | $ | 0.36 | $ | 0.05 | $ | 0.18 | |||||||
Diluted | $ | 0.41 | $ | 0.35 | $ | 0.05 | $ | 0.17 | |||||||
2016 FISCAL QUARTERS (dollars in thousands, except per share data) | FIRST (2) | SECOND (2) | THIRD (2) | FOURTH (2) | |||||||||||
Total revenues | $ | 1,164,188 | $ | 1,078,588 | $ | 1,005,387 | $ | 1,004,149 | |||||||
Income (loss) from operations | 86,684 | 13,333 | 31,734 | (4,145 | ) | ||||||||||
Net income (loss) | 35,883 | (8,065 | ) | 21,228 | (2,699 | ) | |||||||||
Net income (loss) attributable to Bloomin’ Brands | 34,475 | (9,177 | ) | 20,733 | (4,283 | ) | |||||||||
Earnings (loss) per share: | |||||||||||||||
Basic | $ | 0.29 | $ | (0.08 | ) | $ | 0.19 | $ | (0.04 | ) | |||||
Diluted | $ | 0.29 | $ | (0.08 | ) | $ | 0.18 | $ | (0.04 | ) | |||||
____________________
(1) | Total revenues for the fourth quarter include an increase of $80.4 million for the 53rd week. Income from operations in the first, second, third and fourth quarters include expense of $17.6 million, $3.0 million, $20.0 million and $25.7 million, respectively, for impairments, closing costs and severance related to: (i) approved closure and restructuring initiatives, (ii) the relocation of certain restaurants, (iii) the remeasurement of certain surplus properties, (iv) a restructuring event and (v) our China subsidiary. Net income for the second and third quarters include gains on the sale of certain restaurants of $7.4 million and $8.4 million, respectively. Includes $0.11 of additional earnings per share from a 53rd operating week in 2017. |
(2) | Income from operations in the first, second, third and fourth quarters include expense of $3.6 million, $39.6 million, $3.2 million and $56.5 million, respectively. for impairments, closing costs and severance related to: (i) approved closure and restructuring initiatives, (ii) the Company’s decision to sell Outback Steakhouse South Korea, (iii) its Puerto Rico subsidiary, (iv) the relocation of certain restaurants and (v) a restructuring event, partially offset by the fourth quarter reversal of $3.3 million of deferred rent liabilities in connection with the 2017 Closure Initiative. Net income for the first quarter includes $26.6 million related to the defeasance of the 2012 CMBS loan. |
110
BLOOMIN’ BRANDS, INC.
Item 9. Changes in and Disagreements with Accountants on Accounting and Financial Disclosure
None.
Item 9A. Controls and Procedures
Evaluation of Disclosure Controls and Procedures
We have established and maintain disclosure controls and procedures that are designed to ensure that information required to be disclosed by us in the reports that we file or submit under the Securities Exchange Act of 1934, as amended, is recorded, processed, summarized, and reported within the time periods specified in the Securities and Exchange Commission’s rules and forms, and that such information is accumulated and communicated to our management, including our Chief Executive Officer and Chief Financial and Administrative Officer, as appropriate to allow timely decisions regarding required disclosure. We carried out an evaluation, under the supervision and with the participation of our management, including our Chief Executive Officer and Chief Financial and Administrative Officer, of the effectiveness of our disclosure controls and procedures as of the end of the period covered by this report. Based on that evaluation, the Chief Executive Officer and Chief Financial and Administrative Officer concluded that our disclosure controls and procedures were effective as of December 31, 2017.
Management’s Annual Report on Internal Control over Financial Reporting
Management’s report on our internal control over financial reporting and the attestation report of PricewaterhouseCoopers LLP, our independent registered certified public accounting firm, on our internal control over financial reporting are included in Item 8, Financial Statements and Supplementary Data, of this Annual Report on Form 10-K.
Changes in Internal Control over Financial Reporting
There have been no changes in our internal control over financial reporting during our most recent quarter ended December 31, 2017 that have materially affected, or are reasonably likely to materially affect, our internal control over financial reporting.
Item 9B. Other Information
None.
111
BLOOMIN’ BRANDS, INC.
PART III
Item 10. Directors, Executive Officers and Corporate Governance
The information required by this item relating to our directors and nominees will be included under the captions “Proposal No. 1: Election of Directors—Nominees for Election at this Annual Meeting” and “—Directors Continuing in Office” in our definitive Proxy Statement for the 2018 Annual Meeting of Stockholders (“Definitive Proxy Statement”) and is incorporated herein by reference.
The information required by this item relating to our executive officers is included under the caption “Executive Officers of the Registrant” in Part I of this Report on Form 10-K.
The information required by this item regarding compliance with Section 16(a) of the Securities Act of 1934 will be included under the caption “Ownership of Securities—Section 16(a) Beneficial Ownership Reporting Compliance” in our Definitive Proxy Statement and is incorporated herein by reference.
We have adopted a Business Conduct and Code of Ethics that applies to all employees. A copy of our Business Conduct and Code of Ethics is available on our website, free of charge. The Internet address for our website is www.bloominbrands.com, and the Business Conduct and Code of Ethics may be found on our main webpage by clicking first on “Investors” and then on “Corporate Governance” and next on “Code of Business Conduct and Ethics.”
We intend to satisfy any disclosure requirement under Item 5.05 of Form 8-K regarding an amendment to, or waiver from, a provision of this code of ethics by posting such information on our website, on the webpage found by clicking through to “Code of Business Conduct and Ethics” as specified above.
The information required by this item regarding our Audit Committee will be included under the caption “Proposal No. 1: Election of Directors—Board Committees and Meetings” in our Definitive Proxy Statement and is incorporated herein by reference.
Item 11. Executive Compensation
The information required by this item will be included under the captions “Proposal No. 1: Election of Directors—Director Compensation” and “Executive Compensation and Related Information” in our Definitive Proxy Statement and is incorporated herein by reference.
Item 12. Security Ownership of Certain Beneficial Owners and Management and Related Stockholder Matters
The information required by this item will be included under the caption “Ownership of Securities” in our Definitive Proxy Statement and is incorporated herein by reference.
The information relating to securities authorized for issuance under equity compensation plans is included under the caption “Securities Authorized for Issuance Under Equity Compensation Plans” in Item 5 of this Report on Form 10-K.
Item 13. Certain Relationships and Related Transactions, and Director Independence
The information required by this item relating to transactions with related persons will be included under the caption “Certain Relationships and Related Party Transactions,” and the information required by this item relating to director independence will be included under the caption “Proposal No. 1: Election of Directors—Independent Directors,” in each case in our Definitive Proxy Statement, and is incorporated herein by reference.
112
BLOOMIN’ BRANDS, INC.
Item 14. Principal Accounting Fees and Services
The information required by this item will be included under the captions “Proposal No. 2: Ratification of Independent Registered Certified Public Accounting Firm—Principal Accountant Fees and Services” and “—Policy on Audit Committee Pre-Approval of Audit and Permissible Non-Audit Services of Independent Registered Certified Public Accounting Firm” in our Definitive Proxy Statement and is incorporated herein by reference.
113
BLOOMIN’ BRANDS, INC.
PART IV
Item 15. Exhibits and Financial Statement Schedules.
(a)(1) LISTING OF FINANCIAL STATEMENTS
The following consolidated financial statements of the Company and subsidiaries are included in Item 8 of this Report:
• | Consolidated Balance Sheets - December 31, 2017 and December 25, 2016 |
• | Consolidated Statements of Operations and Comprehensive Income – Fiscal years 2017, 2016, and 2015 |
• | Consolidated Statements of Changes in Stockholders’ Equity – Fiscal years 2017, 2016, and 2015 |
• | Consolidated Statements of Cash Flows – Fiscal years 2017, 2016, and 2015 |
• | Notes to Consolidated Financial Statements |
(a)(2) FINANCIAL STATEMENT SCHEDULES
All financial statement schedules have been omitted, since the required information is not applicable or is not present in amounts sufficient to require submission of the schedule, or because the information required is included in the consolidated financial statements and notes thereto included in this Report.
(a)(3) EXHIBITS
EXHIBIT NUMBER | DESCRIPTION OF EXHIBITS | FILINGS REFERENCED FOR INCORPORATION BY REFERENCE | ||
3.1 | Registration Statement on Form S-8, File No. 333-183270, filed on August 13, 2012, Exhibit 4.1 | |||
3.2 | Registration Statement on Form S-8, File No. 333-183270, filed on August 13, 2012, Exhibit 4.2 | |||
4.1 | Amendment No. 4 to Registration Statement on Form S-1, File No. 333-180615, filed on July 18, 2012, Exhibit 4.1 | |||
10.1 | Registration Statement on Form S-1, File No. 333-180615, filed on April 6, 2012, Exhibit 10.6 | |||
10.2 | June 29, 2014 Form 10-Q, Exhibit 10.6 | |||
10.3 | June 25, 2017 Form 10-Q, Exhibit 10.1 | |||
114
BLOOMIN’ BRANDS, INC.
EXHIBIT NUMBER | DESCRIPTION OF EXHIBITS | FILINGS REFERENCED FOR INCORPORATION BY REFERENCE | ||
10.4 | Registration Statement on Form S-1, File No. 333-180615, filed on April 6, 2012, Exhibit 10.8 | |||
10.5 | Amendment No. 1 to Registration Statement on Form S-1, File No. 333-180615, filed on May 17, 2012, Exhibit 10.52 | |||
10.6 | December 31, 2013 Form 10-K, Exhibit 10.28 | |||
10.7* | Registration Statement on Form S-1, File No. 333-180615, filed on April 6, 2012, Exhibit 10.46 | |||
10.8* | Registration Statement on Form S-1, File No. 333-180615, filed on April 6, 2012, Exhibit 10.1 | |||
10.9* | Registration Statement on Form S-1, File No. 333-180615, filed on April 6, 2012, Exhibit 10.42 | |||
10.10* | Amendment No. 4 to Registration Statement on Form S-1, File No. 333-180615, filed on July 18, 2012, Exhibit 10.2 | |||
10.11* | December 7, 2012 Form 8-K, Exhibit 10.2 | |||
10.12* | December 7, 2012 Form 8-K, Exhibit 10.3 | |||
10.13* | December 7, 2012 Form 8-K, Exhibit 10.4 | |||
10.14* | September 30, 2013 Form 10-Q, Exhibit 10.1 | |||
10.15* | September 30, 2013 Form 10-Q, Exhibit 10.2 | |||
10.16* | December 7, 2012 Form 8-K, Exhibit 10.5 | |||
10.17* | Amendment No. 4 to Registration Statement on Form S-1, File No. 333-180615, filed on July 18, 2012, Exhibit 10.39 | |||
10.18* | March 11, 2016 Definitive Proxy Statement | |||
115
BLOOMIN’ BRANDS, INC.
EXHIBIT NUMBER | DESCRIPTION OF EXHIBITS | FILINGS REFERENCED FOR INCORPORATION BY REFERENCE | ||
10.19* | June 26, 2016 Form 10-Q, Exhibit 10.2 | |||
10.20* | June 26, 2016 Form 10-Q, Exhibit 10.3 | |||
10.21* | June 26, 2016 Form 10-Q, Exhibit 10.4 | |||
10.22* | June 26, 2016 Form 10-Q, Exhibit 10.5 | |||
10.23* | March 26, 2017 Form 10-Q, Exhibit 10.1 | |||
10.24* | December 7, 2012 Form 8-K, Exhibit 10.1 | |||
10.25* | June 30, 2012 Form 10-Q, Exhibit 10.1 | |||
10.26* | Registration Statement on Form S-1, File No. 333-180615, filed on April 6, 2012, Exhibit 10.40 | |||
10.27* | Registration Statement on Form S-1, File No. 333-180615, filed on April 6, 2012, Exhibit 10.41 | |||
10.28* | Amendment No. 1 to Registration Statement on Form S-1, File No. 333-180615, filed on May 17, 2012, Exhibit 10.53 | |||
10.29* | June 29, 2014 Form 10-Q, Exhibit 10.7 | |||
10.30* | Registration Statement on Form S-1, File No. 333-180615, filed on April 6, 2012, Exhibit 10.29 | |||
10.31* | Registration Statement on Form S-1, File No. 333-180615, filed on April 6, 2012, Exhibit 10.48 | |||
10.32* | December 28, 2014 Form 10-K, Exhibit 10.58 | |||
10.33* | December 27, 2015 Form 10-K, Exhibit 10.57 | |||
116
BLOOMIN’ BRANDS, INC.
EXHIBIT NUMBER | DESCRIPTION OF EXHIBITS | FILINGS REFERENCED FOR INCORPORATION BY REFERENCE | ||
10.34* | March 27, 2016 Form 10-Q, Exhibit 10.3 | |||
10.35* | September 25, 2016 Form 10-Q, Exhibit 10.2 | |||
10.36* | September 25, 2016 Form 10-Q, Exhibit 10.3 | |||
10.37 | May 1, 2014 Form 8-K, Exhibit 10.3 | |||
10.38 | Filed herewith | |||
10.39* | Filed herewith | |||
10.40* | Filed herewith | |||
21.1 | Filed herewith | |||
23.1 | Filed herewith | |||
31.1 | Filed herewith | |||
31.2 | Filed herewith | |||
32.1 | Filed herewith | |||
32.2 | Filed herewith | |||
101.INS | XBRL Instance Document | Filed herewith | ||
101.SCH | XBRL Taxonomy Extension Schema Document | Filed herewith | ||
101.CAL | XBRL Taxonomy Extension Calculation Linkbase Document | Filed herewith | ||
101.DEF | XBRL Taxonomy Extension Definition Linkbase Document | Filed herewith | ||
101.LAB | XBRL Taxonomy Extension Label Linkbase Document | Filed herewith | ||
101.PRE | XBRL Taxonomy Extension Presentation Linkbase Document | Filed herewith | ||
* Management contract or compensatory plan or arrangement required to be filed as an exhibit
1These certifications are not deemed to be “filed” for purposes of Section 18 of the Exchange Act, or otherwise subject to the liability of that section. These certifications will not be deemed to be incorporated by reference into any filing
117
BLOOMIN’ BRANDS, INC.
under the Securities Act or the Exchange Act, except to the extent that the registrant specifically incorporates them by reference.
Item 16. Form 10-K Summary
None.
SIGNATURES
Pursuant to the requirements of Section 13 or 15(d) of the Securities Exchange Act of 1934, the registrant has duly caused this report to be signed on its behalf by the undersigned, thereunto duly authorized.
Date: | February 28, 2018 | Bloomin’ Brands, Inc. | |
By: /s/ Elizabeth A. Smith | |||
Elizabeth A. Smith Chief Executive Officer (Principal Executive Officer) | |||
Pursuant to the requirements of the Securities Exchange Act of 1934, this report has been signed below by the following persons on behalf of the registrant and in the capacities and on the dates indicated.
Signature | Title | Date | ||
/s/ Elizabeth A. Smith | Chief Executive Officer and Director (Principal Executive Officer) | |||
Elizabeth A. Smith | February 28, 2018 | |||
/s/ David J. Deno | Executive Vice President and Chief Financial and Administrative Officer (Principal Financial and Accounting Officer) | |||
David J. Deno | February 28, 2018 | |||
/s/ James R. Craigie | ||||
James R. Craigie | Director | February 28, 2018 | ||
/s/ David R. Fitzjohn | ||||
David R. Fitzjohn | Director | February 28, 2018 | ||
/s/ Mindy Grossman | ||||
Mindy Grossman | Director | February 28, 2018 | ||
/s/ Tara Walpert Levy | ||||
Tara Walpert Levy | Director | February 28, 2018 | ||
/s/ John J. Mahoney | ||||
John J. Mahoney | Director | February 28, 2018 | ||
/s/ R. Michael Mohan | ||||
R. Michael Mohan | Director | February 28, 2018 | ||
Wendy A. Beck | Director | February 28, 2018 | ||
118