Attached files
| file | filename |
|---|---|
| EX-99.1 - EXHIBIT 99.1 - VEEVA SYSTEMS INC | a51765017ex99_1.htm |
| 8-K - VEEVA SYSTEMS INC. 8-K - VEEVA SYSTEMS INC | a51765017.htm |
Exhibit 99.2

ASC 606 Investor Presentation
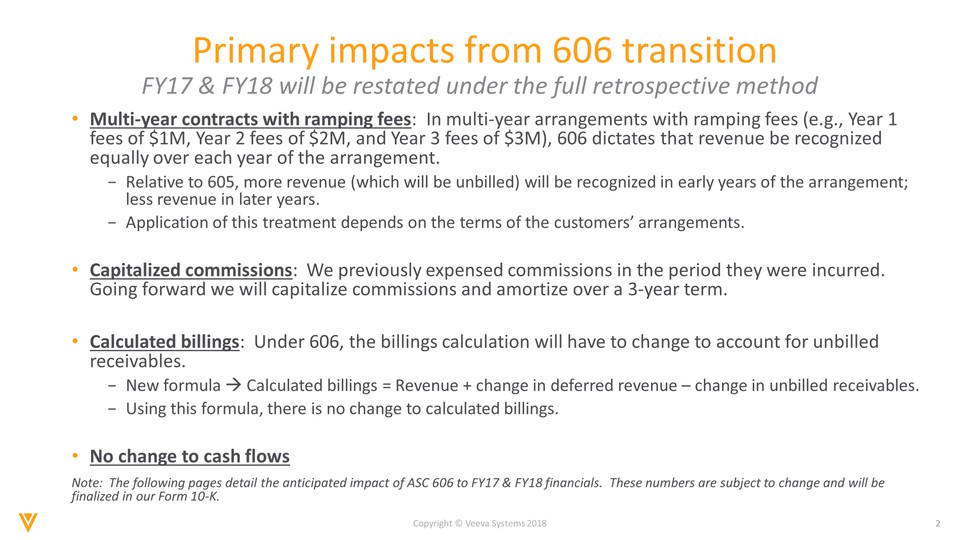
Copyright © Veeva Systems 2018 Multi-year contracts with ramping fees: In multi-year arrangements with ramping fees (e.g., Year 1 fees of $1M, Year 2 fees of $2M, and Year 3 fees of $3M), 606 dictates that revenue be recognized equally over each year of the arrangement. −Relative to 605, more revenue (which will be unbilled) will be recognized in early years of the arrangement; less revenue in later years. −Application of this treatment depends on the terms of the customers’ arrangements. Capitalized commissions: We previously expensed commissions in the period they were incurred. Going forward we will capitalize commissions and amortize over a 3-year term. Calculated billings: Under 606, the billings calculation will have to change to account for unbilled receivables. −New formula Calculated billings = Revenue + change in deferred revenue –change in unbilled receivables. −Using this formula, there is no change to calculated billings. No change to cash flows Note: The following pages detail the anticipated impact of ASC 606 to FY17 & FY18 financials. These numbers are subject to change and will be finalized in our Form 10-K. Primary impacts from 606 transition FY17 & FY18 will be restated under the full retrospective method
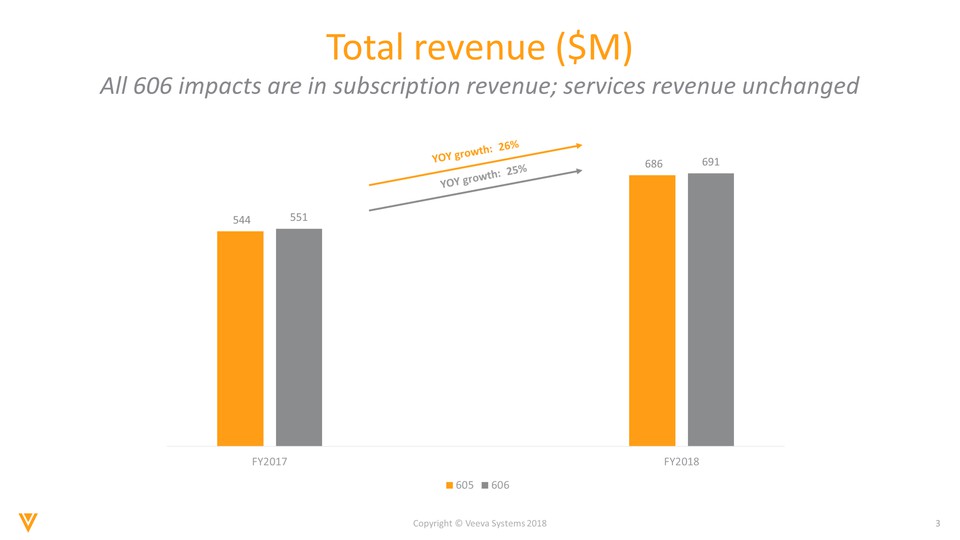
Copyright © Veeva Systems 2018 Total revenue ($M) 544 686 551 691 FY2017 FY2018 605 606 All 606 impacts are in subscription revenue; services revenue unchanged YOY growth: 26% YOY growth: 25%
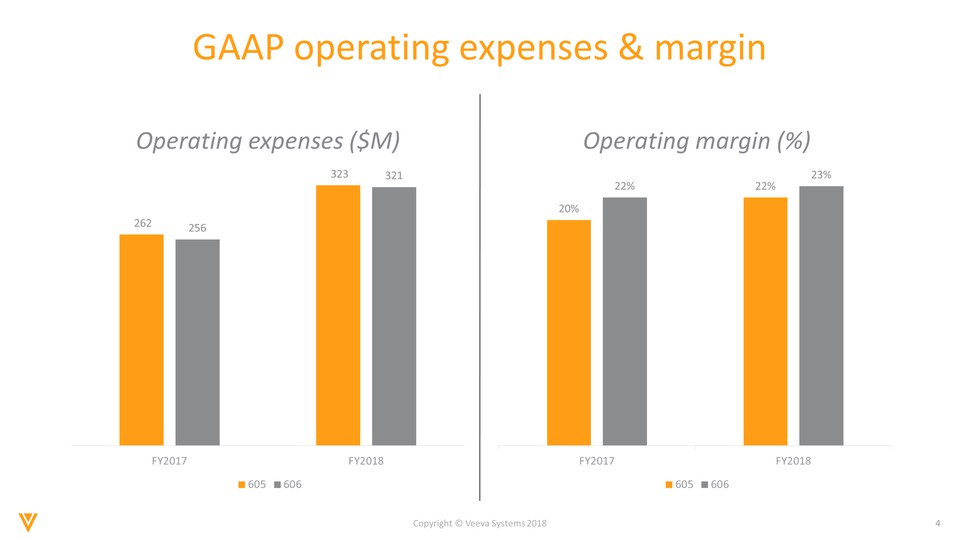
Copyright © Veeva Systems 2018 GAAP operating expenses & margin 262 323 256 321 FY2017 FY2018 605 606 Operating expenses ($M) 20% 22% 22% 23% FY2017 FY2018 605 606 Operating margin (%)
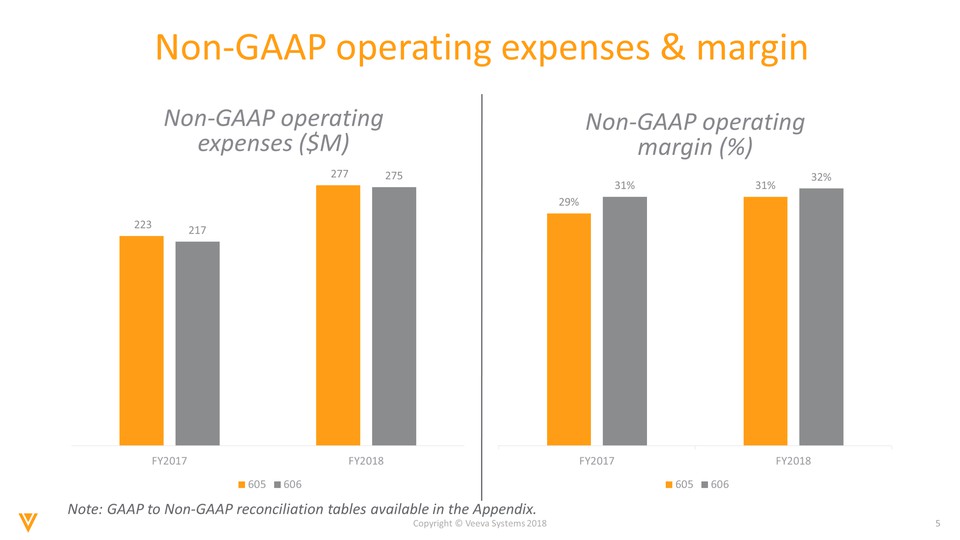
Copyright © Veeva Systems 2018 Non-GAAP operating expenses & margin 223 277 217 275 FY2017 FY2018 605 606 Non-GAAP operating expenses ($M) 29% 31% 31% 32% FY2017 FY2018 605 606 Non-GAAP operating margin (%) Note: GAAP to Non-GAAP reconciliation tables available in the Appendix.
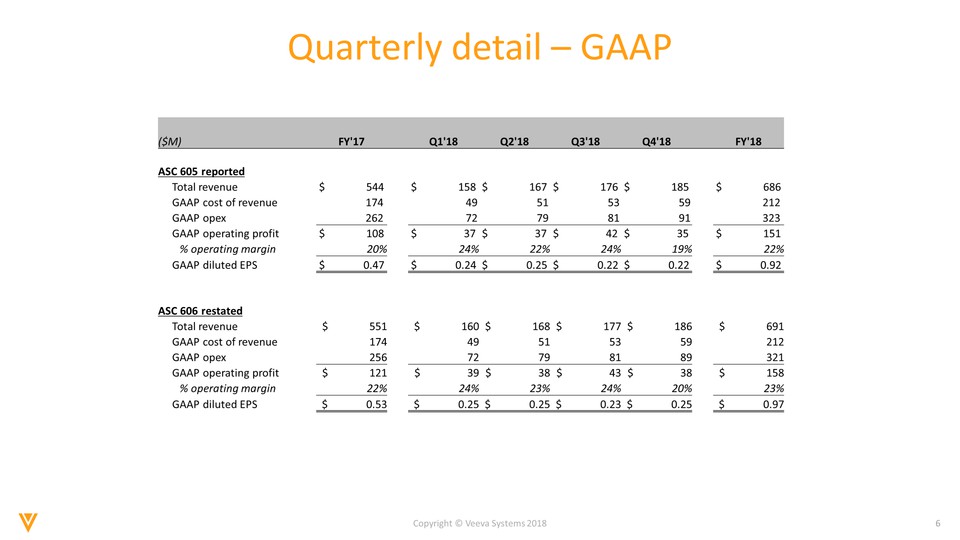
Copyright © Veeva Systems 2018 Quarterly detail –GAAP ($M) FY'17 Q1'18 Q2'18 Q3'18 Q4'18 FY'18 ASC 605 reported Total revenue $ 544 $ 158 $ 167 $ 176 $ 185 $ 686 GAAP cost of revenue 174 49 51 53 59 212 GAAP opex 262 72 79 81 91 323 GAAP operating profit $ 108 $ 37 $ 37 $ 42 $ 35 $ 151 % operating margin 20% 24% 22% 24% 19% 22% GAAP diluted EPS $ 0.47 $ 0.24 $ 0.25 $ 0.22 $ 0.22 $ 0.92 ASC 606 restated Total revenue $ 551 $ 160 $ 168 $ 177 $ 186 $ 691 GAAP cost of revenue 174 49 51 53 59 212 GAAP opex 256 72 79 81 89 321 GAAP operating profit $ 121 $ 39 $ 38 $ 43 $ 38 $ 158 % operating margin 22% 24% 23% 24% 20% 23% GAAP diluted EPS $ 0.53 $ 0.25 $ 0.25 $ 0.23 $ 0.25 $ 0.97
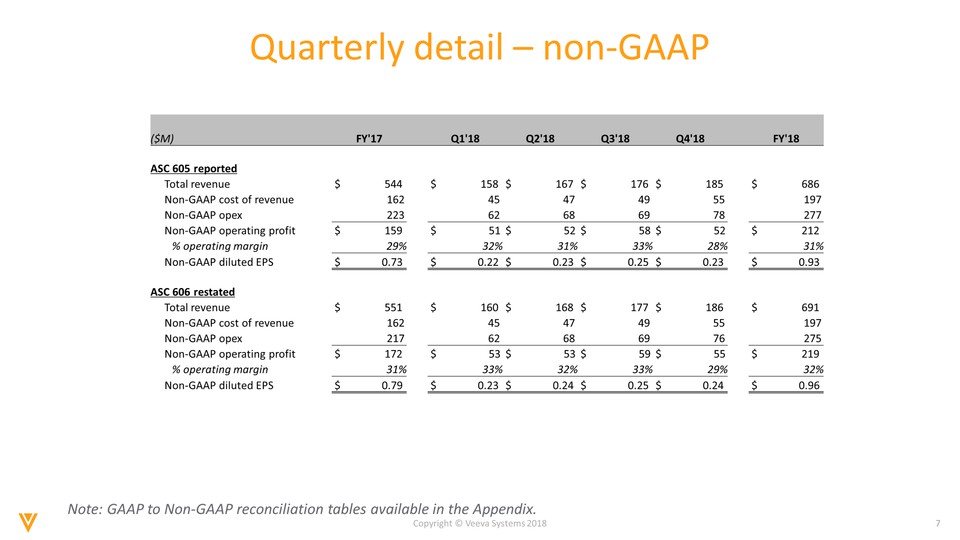
Copyright © Veeva Systems 2018 Quarterly detail –non-GAAP Note: GAAP to Non-GAAP reconciliation tables available in the Appendix. ($M) FY'17 Q1'18 Q2'18 Q3'18 Q4'18 FY'18 ASC 605 reported Total revenue $ 544 $ 158 $ 167 $ 176 $ 185 $ 686 Non-GAAP cost of revenue 162 45 47 49 55 197 Non-GAAP opex 223 62 68 69 78 277 Non-GAAP operating profit $ 159 $ 51 $ 52 $ 58 $ 52 $ 212 % operating margin 29% 32% 31% 33% 28% 31% Non-GAAP diluted EPS $ 0.73 $ 0.22 $ 0.23 $ 0.25 $ 0.23 $ 0.93 ASC 606 restated Total revenue $ 551 $ 160 $ 168 $ 177 $ 186 $ 691 Non-GAAP cost of revenue 162 45 47 49 55 197 Non-GAAP opex 217 62 68 69 76 275 Non-GAAP operating profit $ 172 $ 53 $ 53 $ 59 $ 55 $ 219 % operating margin 31% 33% 32% 33% 29% 32% Non-GAAP diluted EPS $ 0.79 $ 0.23 $ 0.24 $ 0.25 $ 0.24 $ 0.96
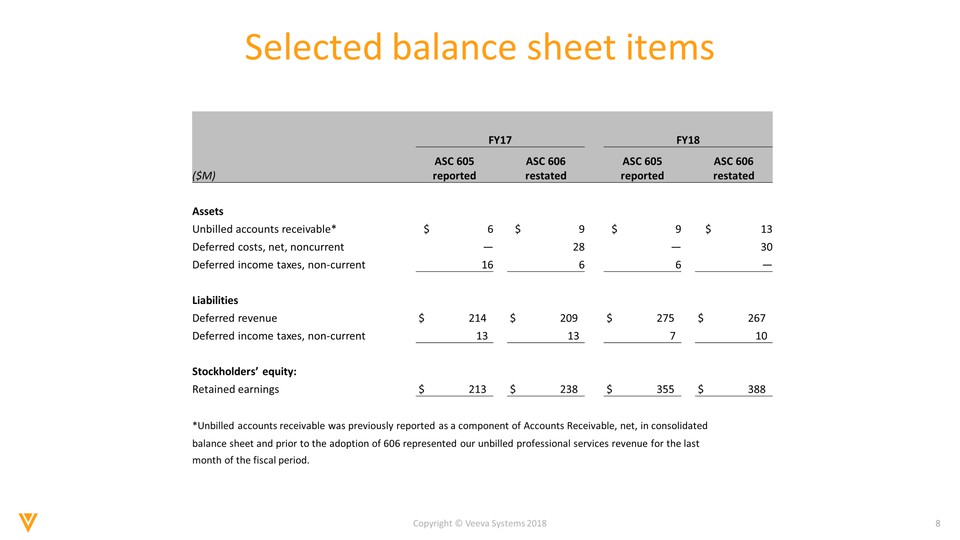
Copyright © Veeva Systems 2018 Selected balance sheet items FY17 FY18 ($M) ASC 605 reported ASC 606 restated ASC 605 reported ASC 606 restated Assets Unbilled accounts receivable* $ 6 $ 9 $ 9 $ 13 Deferred costs, net, noncurrent — 28 — 30 Deferred income taxes, non-current 16 6 6 — Liabilities Deferred revenue $ 214 $ 209 $ 275 $ 267 Deferred income taxes, non-current 13 13 7 10 Stockholders’ equity: Retained earnings $ 213 $ 238 $ 355 $ 388 *Unbilled accounts receivable was previously reported as a component of Accounts Receivable, net, in consolidated balance sheet and prior to the adoption of 606 represented our unbilled professional services revenue for the last month of the fiscal period.

Appendix
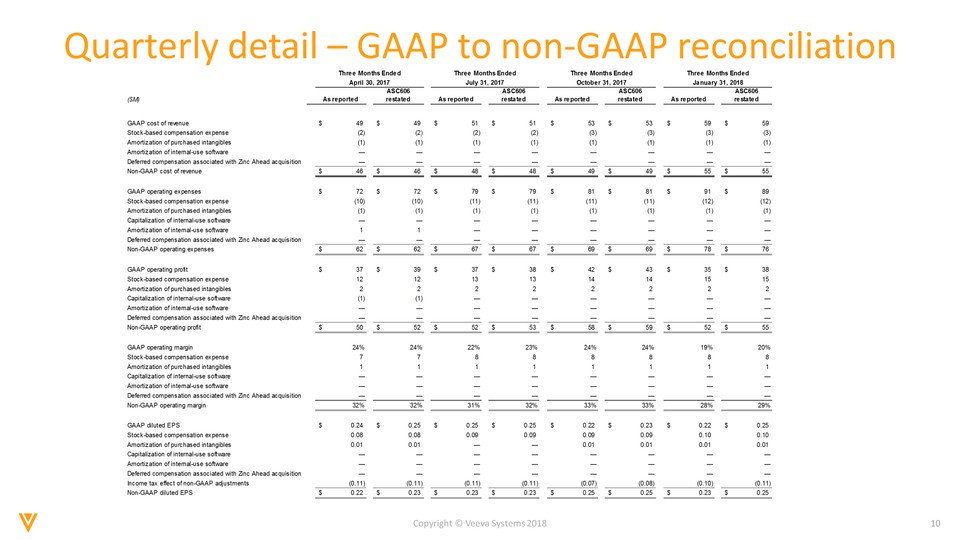
Copyright © Veeva Systems 2018 Quarterly detail –GAAP to non-GAAP reconciliation ($M)As reportedASC606 restated As reportedASC606 restated As reportedASC606 restated As reportedASC606 restated GAAP cost of revenue49$ 49$ 51$ 51$ 53$ 53$ 59$ 59$ Stock-based compensation expense(2) (2) (2) (2) (3) (3) (3) (3) Amortization of purchased intangibles(1) (1) (1) (1) (1) (1) (1) (1) Amortization of internal-use software————————Deferred compensation associated with Zinc Ahead acquisition————————Non-GAAP cost of revenue46$ 46$ 48$ 48$ 49$ 49$ 55$ 55$ GAAP operating expenses72$ 72$ 79$ 79$ 81$ 81$ 91$ 89$ Stock-based compensation expense(10) (10) (11) (11) (11) (11) (12) (12) Amortization of purchased intangibles(1) (1) (1) (1) (1) (1) (1) (1) Capitalization of internal-use software————————Amortization of internal-use software1 1 ——————Deferred compensation associated with Zinc Ahead acquisition————————Non-GAAP operating expenses62$ 62$ 67$ 67$ 69$ 69$ 78$ 76$ GAAP operating profit37$ 39$ 37$ 38$ 42$ 43$ 35$ 38$ Stock-based compensation expense12 12 13 13 14 14 15 15 Amortization of purchased intangibles2 2 2 2 2 2 2 2 Capitalization of internal-use software(1)(1)——————Amortization of internal-use software————————Deferred compensation associated with Zinc Ahead acquisition————————Non-GAAP operating profit50$ 52$ 52$ 53$ 58$ 59$ 52$ 55$ GAAP operating margin24%24%22%23%24%24%19%20%Stock-based compensation expense7 7 8 8 8 8 8 8 Amortization of purchased intangibles1 1 1 1 1 1 1 1 Capitalization of internal-use software————————Amortization of internal-use software————————Deferred compensation associated with Zinc Ahead acquisition————————Non-GAAP operating margin32%32%31%32%33%33%28%29%GAAP diluted EPS0.24$ 0.25$ 0.25$ 0.25$ 0.22$ 0.23$ 0.22$ 0.25$ Stock-based compensation expense0.08 0.08 0.09 0.09 0.09 0.09 0.10 0.10 Amortization of purchased intangibles0.01 0.01 ——0.01 0.01 0.01 0.01 Capitalization of internal-use software————————Amortization of internal-use software————————Deferred compensation associated with Zinc Ahead acquisition————————Income tax effect of non-GAAP adjustments(0.11) (0.11) (0.11) (0.11) (0.07) (0.08) (0.10) (0.11) Non-GAAP diluted EPS0.22$ 0.23$ 0.23$ 0.23$ 0.25$ 0.25$ 0.23$ 0.25$ Three Months Ended Three Months Ended Three Months Ended Three Months Ended April 30, 2017July 31, 2017October 31, 2017January 31, 2018
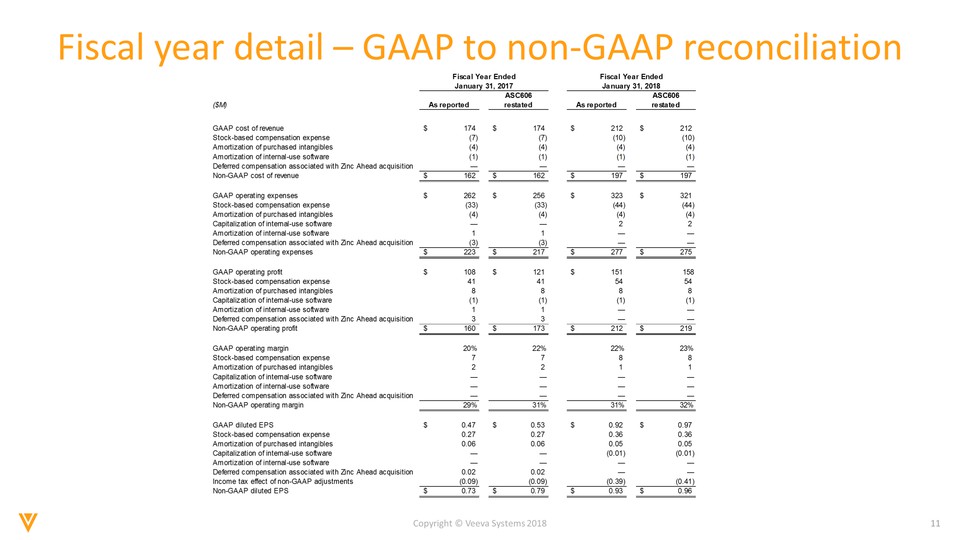
Copyright © Veeva Systems 2018 Fiscal year detail –GAAP to non-GAAP reconciliation ($M)As reportedASC606 restated As reportedASC606 restated GAAP cost of revenue174$ 174$ 212$ 212$ Stock-based compensation expense(7) (7) (10) (10) Amortization of purchased intangibles(4) (4) (4) (4) Amortization of internal-use software(1) (1) (1)(1)Deferred compensation associated with Zinc Ahead acquisition————Non-GAAP cost of revenue162$ 162$ 197$ 197$ GAAP operating expenses262$ 256$ 323$ 321$ Stock-based compensation expense(33) (33) (44) (44) Amortization of purchased intangibles(4) (4) (4) (4) Capitalization of internal-use software——2 2 Amortization of internal-use software1 1 ——Deferred compensation associated with Zinc Ahead acquisition(3) (3) ——Non-GAAP operating expenses223$ 217$ 277$ 275$ GAAP operating profit108$ 121$ 151$ 158Stock-based compensation expense41 41 54 54 Amortization of purchased intangibles8 8 8 8 Capitalization of internal-use software(1) (1) (1) (1) Amortization of internal-use software1 1 ——Deferred compensation associated with Zinc Ahead acquisition3 3 ——Non-GAAP operating profit160$ 173$ 212$ 219$ GAAP operating margin20%22%22%23%Stock-based compensation expense7 7 8 8 Amortization of purchased intangibles2 2 1 1 Capitalization of internal-use software————Amortization of internal-use software————Deferred compensation associated with Zinc Ahead acquisition————Non-GAAP operating margin29%31%31%32%GAAP diluted EPS0.47$ 0.53$ 0.92$ 0.97$ Stock-based compensation expense0.27 0.27 0.36 0.36 Amortization of purchased intangibles0.06 0.06 0.05 0.05 Capitalization of internal-use software——(0.01) (0.01) Amortization of internal-use software————Deferred compensation associated with Zinc Ahead acquisition0.02 0.02 ——Income tax effect of non-GAAP adjustments(0.09) (0.09) (0.39) (0.41) Non-GAAP diluted EPS0.73$ 0.79$ 0.93$ 0.96$ Fiscal Year Ended January 31, 2018Fiscal Year Ended January 31, 2017