Attached files
| file | filename |
|---|---|
| EX-31.2 - EXHIBIT 31.2 - PLAINS GP HOLDINGS LP | pagp201710-kexhibit312.htm |
| EX-32.2 - EXHIBIT 32.2 - PLAINS GP HOLDINGS LP | pagp201710-kexhibit322.htm |
| EX-32.1 - EXHIBIT 32.1 - PLAINS GP HOLDINGS LP | pagp201710-kexhibit321.htm |
| EX-31.1 - EXHIBIT 31.1 - PLAINS GP HOLDINGS LP | pagp201710-kexhibit311.htm |
| EX-23.1 - EXHIBIT 23.1 - PLAINS GP HOLDINGS LP | pagp201710-kexhibit231.htm |
| EX-21.1 - EXHIBIT 21.1 - PLAINS GP HOLDINGS LP | pagp201710-kexhibit211.htm |
UNITED STATES
SECURITIES AND EXCHANGE COMMISSION
Washington, D.C. 20549
Form 10-K
(Mark One)
x | ANNUAL REPORT PURSUANT TO SECTION 13 OR 15(d) OF THE SECURITIES EXCHANGE ACT OF 1934 |
For the fiscal year ended December 31, 2017
OR
o | TRANSITION REPORT PURSUANT TO SECTION 13 OR 15(d) OF THE SECURITIES EXCHANGE ACT OF 1934 |
Commission file number 1-36132
PLAINS GP HOLDINGS, L.P.
(Exact name of registrant as specified in its charter)
Delaware | 90-1005472 | |
(State or other jurisdiction of incorporation or organization) | (I.R.S. Employer Identification No.) | |
333 Clay Street, Suite 1600, Houston, Texas | 77002 | |
(Address of principal executive offices) | (Zip Code) | |
Registrant’s telephone number, including area code: (713) 646-4100
Securities registered pursuant to Section 12(b) of the Act:
Title of Each Class | Name of Each Exchange on Which Registered | |
Class A Shares, Representing Limited Partner Interests | New York Stock Exchange | |
Securities registered pursuant to Section 12(g) of the Act: None
Indicate by check mark if the registrant is a well-known seasoned issuer, as defined in Rule 405 of the Securities Act. Yes x No o
Indicate by check mark if the registrant is not required to file reports pursuant to Section 13 or Section 15(d) of the Act. Yes o No x
Indicate by check mark whether the registrant (1) has filed all reports required to be filed by Section 13 or 15(d) of the Securities Exchange Act of 1934 during the preceding 12 months (or for such shorter period that the registrant was required to file such reports), and (2) has been subject to such filing requirements for the past 90 days. Yes x No o
Indicate by check mark whether the registrant has submitted electronically and posted on its corporate Web site, if any, every Interactive Data File required to be submitted and posted pursuant to Rule 405 of Regulation S-T during the preceding 12 months (or for such shorter period that the registrant was required to submit and post such files). Yes x No o
Indicate by check mark if disclosure of delinquent filers pursuant to Item 405 of Regulation S-K is not contained herein, and will not be contained, to the best of registrant’s knowledge, in definitive proxy or information statements incorporated by reference in Part III of this Form 10-K or any amendment to this Form 10-K. x
Indicate by check mark whether the registrant is a large accelerated filer, an accelerated filer, a non-accelerated filer, a smaller reporting company, or an emerging growth company. See the definitions of “large accelerated filer,” “accelerated filer,” “smaller reporting company” and “emerging growth company” in Rule 12b-2 of the Exchange Act. (Check one):
Large accelerated filer x | Accelerated filer o | |
Non-accelerated filer o | Smaller reporting company o | |
(Do not check if a smaller reporting company) | Emerging growth company o | |
If an emerging growth company, indicate by check mark if the registrant has elected not to use the extended transition period for complying with any new or revised financial accounting standards provided pursuant to Section 13(a) of the Exchange Act. o
Indicate by check mark whether the registrant is a shell company (as defined in Rule 12b-2 of the Exchange Act). Yes o No x
The aggregate market value of the Class A shares held by non-affiliates of the registrant (treating all executive officers and directors of the registrant and holders of 10% or more of the Class A shares outstanding, for this purpose, as if they may be affiliates of the registrant) was approximately $3.9 billion on June 30, 2017, based on a closing price of $26.16 per Class A share as reported on the New York Stock Exchange on such date. As of February 12, 2018, there were 157,011,139 Class A shares outstanding.
DOCUMENTS INCORPORATED BY REFERENCE
Portions of the registrant’s definitive Proxy Statement to be filed pursuant to Regulation 14A pertaining to the 2018 Annual Meeting of Class A Shareholders are incorporated by reference into Part III hereof. The registrant intends to file such Proxy Statement no later than 120 days after the end of the fiscal year covered by this Form 10-K.
PLAINS GP HOLDINGS, L.P. AND SUBSIDIARIES
FORM 10-K—2017 ANNUAL REPORT
Table of Contents
Page | ||
2
FORWARD-LOOKING STATEMENTS
All statements included in this report, other than statements of historical fact, are forward-looking statements, including but not limited to statements incorporating the words “anticipate,” “believe,” “estimate,” “expect,” “plan,” “intend” and “forecast,” as well as similar expressions and statements regarding our business strategy, plans and objectives for future operations. The absence of such words, expressions or statements, however, does not mean that the statements are not forward-looking. Any such forward-looking statements reflect our current views with respect to future events, based on what we believe to be reasonable assumptions. Certain factors could cause actual results or outcomes to differ materially from the results or outcomes anticipated in the forward-looking statements. The most important of these factors include, but are not limited to:
• | our ability to pay distributions to our Class A shareholders; |
• | our expected receipt of, and amounts of, distributions from Plains AAP, L.P.; |
• | declines in the actual or expected volume of crude oil and NGL shipped, processed, purchased, stored, fractionated and/or gathered at or through the use of our assets, whether due to declines in production from existing oil and gas reserves, reduced demand, failure to develop or slowdown in the development of additional oil and gas reserves, whether from reduced cash flow to fund drilling or the inability to access capital, or other factors; |
• | the effects of competition; |
• | market distortions caused by over-commitments to infrastructure projects, which impacts volumes, margins, returns and overall earnings; |
• | unanticipated changes in crude oil and NGL market structure, grade differentials and volatility (or lack thereof); |
• | maintenance of PAA’s credit rating and ability to receive open credit from suppliers and trade counterparties; |
• | environmental liabilities or events that are not covered by an indemnity, insurance or existing reserves; |
• | fluctuations in refinery capacity in areas supplied by our mainlines and other factors affecting demand for various grades of crude oil and natural gas and resulting changes in pricing conditions or transportation throughput requirements; |
• | the occurrence of a natural disaster, catastrophe, terrorist attack (including eco-terrorist attacks) or other event, including attacks on our electronic and computer systems; |
• | failure to implement or capitalize, or delays in implementing or capitalizing, on expansion projects, whether due to permitting delays, permitting withdrawals or other factors; |
• | tightened capital markets or other factors that increase our cost of capital or limit our ability to obtain debt or equity financing on satisfactory terms to fund additional acquisitions, expansion projects, working capital requirements and the repayment or refinancing of indebtedness; |
• | the successful integration and future performance of acquired assets or businesses and the risks associated with operating in lines of business that are distinct and separate from historical operations; |
• | the failure to consummate, or significant delay in consummating, sales of assets or interests as a part of our strategic divestiture program; |
• | the impact of current and future laws, rulings, governmental regulations, accounting standards and statements, and related interpretations; |
• | the currency exchange rate of the Canadian dollar; |
• | continued creditworthiness of, and performance by, our counterparties, including financial institutions and trading companies with which we do business; |
• | inability to recognize current revenue attributable to deficiency payments received from customers who fail to ship or move more than minimum contracted volumes until the related credits expire or are used; |
• | non-utilization of our assets and facilities; |
• | increased costs, or lack of availability, of insurance; |
• | weather interference with business operations or project construction, including the impact of extreme weather events or conditions; |
3
• | the availability of, and our ability to consummate, acquisition or combination opportunities; |
• | the effectiveness of our risk management activities; |
• | shortages or cost increases of supplies, materials or labor; |
• | fluctuations in the debt and equity markets, including the price of PAA’s units at the time of vesting under its long-term incentive plans; |
• | risks related to the development and operation of our assets, including our ability to satisfy our contractual obligations to our customers; |
• | factors affecting demand for natural gas and natural gas storage services and rates; |
• | general economic, market or business conditions and the amplification of other risks caused by volatile financial markets, capital constraints and pervasive liquidity concerns; and |
• | other factors and uncertainties inherent in the transportation, storage, terminalling and marketing of crude oil, as well as in the storage of natural gas and the processing, transportation, fractionation, storage and marketing of natural gas liquids. |
Other factors described herein, as well as factors that are unknown or unpredictable, could also have a material adverse effect on future results. Please read Item 1A. “Risk Factors.” Except as required by applicable securities laws, we do not intend to update these forward-looking statements and information.
4
PART I
Items 1 and 2. Business and Properties
General
Plains GP Holdings, L.P. (“PAGP”) is a Delaware limited partnership formed in July 2013 that has elected to be taxed as a corporation for United States federal income tax purposes. PAGP does not directly own any operating assets; as of December 31, 2017, its principal sources of cash flow are derived from an indirect investment in Plains All American Pipeline, L.P (“PAA”), a publicly traded Delaware limited partnership. As used in this Form 10-K and unless the context indicates otherwise (taking into account the fact that PAGP has no operating activities apart from those conducted by PAA and its subsidiaries), the terms “Partnership,” “we,” “us,” “our,” “ours” and similar terms refer to PAGP and its subsidiaries.
Organizational History
We completed our initial public offering (“IPO”) in October 2013, and our Class A shares are publicly traded on the New York Stock Exchange under the ticker symbol “PAGP”. Immediately prior to completion of our IPO, certain owners of Plains AAP, L.P. (“AAP”) transferred a portion of their interests in AAP to us, resulting in our ownership of a limited partnership interest in AAP. As of December 31, 2017, we owned (i) a 100% managing member interest in Plains All American GP LLC (“GP LLC”), which has also elected to be taxed as a corporation for United States federal income tax purposes, and (ii) an approximate 55% limited partner interest in AAP through our direct ownership of approximately 155.1 million Class A units of AAP (“AAP units”) and indirect ownership of approximately 1.0 million AAP units through GP LLC. As of such date, the remaining limited partner interests in AAP were held by a group of owners that included many of the owners of AAP immediately prior to our IPO and various current and former members of management (collectively, the “Legacy Owners”).
GP LLC is a Delaware limited liability company that also holds the non-economic general partner interest in AAP. AAP is a Delaware limited partnership that, as of December 31, 2017, directly owned a limited partner interest in PAA through its ownership of approximately 284.0 million PAA common units (approximately 36% of PAA’s total outstanding common units and Series A preferred units combined (together, “PAA Common Unit Equivalents”)). AAP is the sole member of PAA GP LLC (“PAA GP”), a Delaware limited liability company that directly holds the non-economic general partner interest in PAA. Our non-economic general partner interest is held by PAA GP Holdings LLC (“PAGP GP”), a Delaware limited liability company.
PAA is a publicly traded master limited partnership that owns and operates midstream energy infrastructure and provides logistics services primarily for crude oil, natural gas liquids (“NGL”) and natural gas. PAA owns an extensive network of pipeline transportation, terminalling, storage and gathering assets in key crude oil and NGL producing basins and transportation corridors and at major market hubs in the United States and Canada.
References to the “PAGP Entities” include PAGP GP, PAGP, GP LLC, AAP and PAA GP. References to the “Plains Entities” include the PAGP Entities and PAA and its subsidiaries.
5
Partnership Structure and Management
Our general partner manages our operations and activities and is responsible for exercising on our behalf any rights we have as the sole and managing member of GP LLC. The PAGP GP Board has ultimate responsibility for managing the business and affairs of AAP, PAA and us. GP LLC employs all domestic officers and personnel involved in the operation and management of PAA. PAA’s Canadian officers and personnel are employed by Plains Midstream Canada ULC (“PMC”). Our general partner does not receive a management fee or other compensation in connection with its management of our business.
The two diagrams below show our organizational structure and ownership as of December 31, 2017 in both a summarized and more detailed format. The first diagram depicts our legal structure in summary format, while the second diagram depicts a more comprehensive view of such structure, including ownership and economic interests and shares and units outstanding:
Summarized Partnership Structure
(as of December 31, 2017)
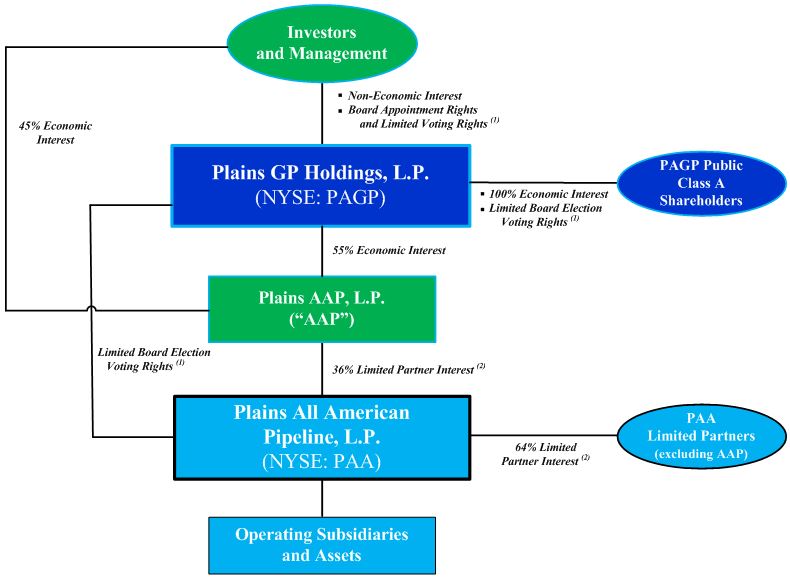
(1) | We will hold annual meetings for the election of eligible directors beginning in May 2018. Through a “pass-through” voting right as a result of PAA’s ownership of our Class C shares, PAA’s common unitholders have the effective right to vote, pro rata with the holders of our Class A and Class B shares, for the election of eligible directors. |
(2) | Represents percentage ownership of PAA Common Unit Equivalents. |
6
Detailed Partnership Structure
(as of December 31, 2017)
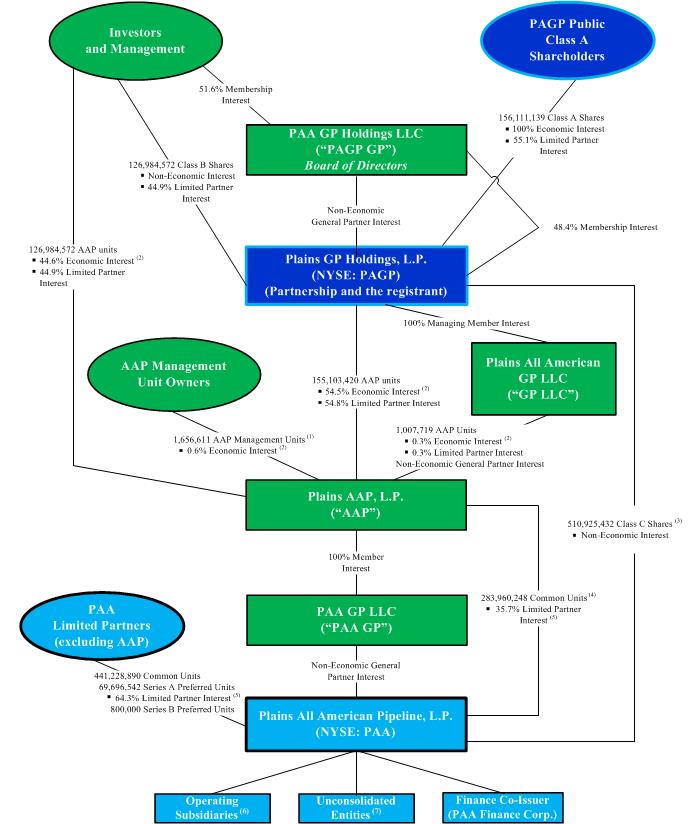
(1) | Represents the number of AAP units for which the outstanding Class B units of AAP (referred to herein as the “AAP Management Units”) will be exchangeable, assuming the conversion of all such units at a rate of approximately 0.941 AAP units for each AAP Management Unit. |
7
(2) | Assumes conversion of all outstanding AAP Management Units into AAP units. |
(3) | Each Class C share represents a non-economic limited partner interest in us. Through a “pass-through” voting right as a result of PAA’s ownership of our Class C shares, PAA’s common unitholders have the effective right to vote, pro rata with the holders of our Class A and Class B shares, for the election of eligible directors. |
(4) | Amount does not include 792,074 PAA common units that will become issuable to AAP that relate to AAP Management Units that are outstanding but not earned. See Note 16 to our Consolidated Financial Statements for additional discussion of the AAP Management Units. |
(5) | Represents percentage ownership of PAA Common Unit Equivalents. |
(6) | PAA holds direct and indirect ownership interests in consolidated operating subsidiaries including, but not limited to, Plains Marketing, L.P., Plains Pipeline, L.P. and PMC. |
(7) | PAA holds indirect equity interests in unconsolidated entities including Advantage Pipeline, L.L.C. (“Advantage”), BridgeTex Pipeline Company, LLC (“BridgeTex”), Caddo Pipeline LLC (“Caddo”), Cheyenne Pipeline LLC (“Cheyenne”), Diamond Pipeline LLC (“Diamond”), Eagle Ford Pipeline LLC (“Eagle Ford Pipeline”), Eagle Ford Terminals Corpus Christi LLC (“Eagle Ford Terminals”), Midway Pipeline LLC (“Midway Pipeline”), Saddlehorn Pipeline Company, LLC (“Saddlehorn”), Settoon Towing, LLC (“Settoon Towing”), STACK Pipeline LLC (“STACK”) and White Cliffs Pipeline, L.L.C. (“White Cliffs”). |
Our Business
As of December 31, 2017, our only cash-generating assets consisted of approximately 156.1 million AAP units, which represented an approximate 55% limited partner and economic interest in AAP. Of these AAP units, we directly own approximately 155.1 million, and we indirectly own the remaining 1.0 million AAP units through our 100% ownership in GP LLC. Unless we directly acquire and hold assets or businesses in the future, our cash flows will be generated solely from the cash distributions we receive on the AAP units. AAP currently receives all of its cash flows from distributions on common units it owns in PAA. As of December 31, 2017, AAP owned approximately 284.0 million common units in PAA.
Accordingly, our primary business objective is to increase our cash available for distribution to our Class A shareholders through the execution by PAA of its business strategy. In addition, we may facilitate PAA’s growth activities through various means, including, but not limited to, making loans, purchasing equity interests or providing other forms of financial support to PAA.
We have and will maintain a one-to-one relationship between our Class A shares and the underlying PAA common units in which we have an indirect economic interest through our ownership interests in AAP and GP LLC (referred to as “Economic Parity”), such that the number of our outstanding Class A shares equals the number of AAP units we directly and indirectly own, which in turn equals the number of PAA common units held by AAP attributable to our direct and indirect ownership in AAP.
PAA’s Business Strategy
PAA’s principal business strategy is to provide competitive and efficient midstream transportation, terminalling, storage, processing, fractionation and supply and logistics services to producers, refiners and other customers. Toward this end, PAA endeavors to address regional supply and demand imbalances for crude oil and NGL in the United States and Canada by combining the strategic location and capabilities of its transportation, terminalling, storage, processing and fractionation assets with its supply, logistics and distribution expertise. We believe PAA’s successful execution of this strategy will enable it to generate sustainable earnings and cash flow. PAA intends to manage and grow its business by:
• | developing and implementing growth projects that (i) address evolving crude oil and NGL needs in the midstream transportation and infrastructure sector and (ii) are well positioned to benefit from long-term industry trends and opportunities; |
• | using its transportation, terminalling, storage, processing and fractionation assets in conjunction with its supply and logistics activities to provide flexibility for customers, capture market opportunities, address physical market imbalances, mitigate inherent risks and increase margin; |
• | running a safe, reliable, environmentally and socially responsible operation, which includes driving operational excellence, cost savings, asset optimization and improved efficiencies throughout the organization; and |
• | selectively pursuing strategic and accretive acquisitions that complement its existing asset base and distribution capabilities. |
8
PAA’s Competitive Strengths
We believe that the following competitive strengths position PAA to successfully execute its principal business strategy:
• | Many of PAA’s assets are strategically located and operationally flexible. The majority of PAA’s primary Transportation segment assets are in crude oil service, are located in well-established crude oil producing regions (with PAA’s largest asset presence in the Permian Basin) and other transportation corridors and are connected, directly or indirectly, with PAA’s Facilities segment assets. The majority of PAA’s Facilities segment assets are located at major trading locations and premium markets that serve as gateways to major North American refinery and distribution markets where PAA has strong business relationships. In addition, PAA’s assets include pipeline, rail, barge, truck and storage assets, which provide PAA’s customers and PAA with significant flexibility and optionality to satisfy demand and balance markets, particularly during a dynamic period of changing product flows and recent developments with respect to rising crude oil exports. |
• | PAA possesses specialized crude oil and NGL market knowledge. We believe PAA’s business relationships with participants in various phases of the crude oil and NGL distribution chain, from producers to refiners, as well as PAA’s own industry expertise (including PAA’s knowledge of North American crude oil and NGL flows), provide PAA with an extensive understanding of the North American physical crude oil and NGL markets. |
• | PAA’s supply and logistics activities typically generate a positive margin with the opportunity to realize incremental margins. We believe the variety of activities executed within PAA’s Supply and Logistics segment in combination with PAA’s risk management strategies provides PAA with a low-risk opportunity to generate incremental margin, the amount of which may vary depending on market conditions (such as commodity price levels, differentials and certain competitive factors). |
• | PAA has the evaluation, integration and engineering skill sets and the financial flexibility to continue to pursue acquisition and expansion opportunities. Since 1998, PAA has completed and integrated over 90 acquisitions with an aggregate purchase price of approximately $13.2 billion. Since 1998, PAA has also implemented expansion capital projects totaling approximately $12.6 billion. In addition, considering PAA’s investment grade credit rating, liquidity and capital structure, we believe PAA has the financial resources and strength necessary to finance future strategic expansion and acquisition opportunities. As of December 31, 2017, PAA had approximately $3.0 billion of liquidity available, including cash and cash equivalents and availability under its committed credit facilities, subject to continued covenant compliance. |
• | PAA has an experienced management team whose interests are aligned with those of its unitholders. PAA’s executive management team has an average of 32 years of industry experience, and an average of 17 years with PAA or its predecessors and affiliates. In addition, through their ownership of PAA common units, grants of phantom units and interests in us, AAP units and AAP Management Units, PAA’s management team has a vested interest in PAA’s continued success. |
Our Financial Strategy
Our financial strategy is designed to be complementary to PAA’s financial and business strategies. Our only cash-generating assets consist of our direct and indirect limited partner interests in AAP, which currently receives all of its cash flows from distributions on the PAA common units it owns.
We have entered into an Omnibus Agreement with the Plains Entities which provides for (i) our ability to issue additional Class A shares and use the net proceeds therefrom to purchase a like number of AAP units from AAP, and the corresponding ability of AAP to use the net proceeds therefrom to purchase a like number of PAA common units from PAA and (ii) our ability to lend proceeds of any future indebtedness we incur to AAP, and AAP’s corresponding ability to lend such proceeds to PAA, in each case on substantially the same terms as we incur.
Accordingly, we intend to access the equity capital markets from time to time to enhance the financial position of PAA and its ability to compete for incremental capital opportunities (including organic investments and third-party acquisitions) to drive future growth. We currently do not intend to incur any indebtedness in the near term. We would expect to fund direct acquisitions made by us, if any, with a combination of debt and equity.
9
PAA’s Financial Strategy
Targeted Credit Profile
We believe that a major factor in PAA’s continued success is its ability to maintain a competitive cost of capital and access to the capital markets. In that regard, PAA intends to maintain a credit profile that it believes is consistent with investment grade credit ratings. PAA targets a credit profile with the following attributes:
• | an average long-term debt-to-total capitalization ratio of approximately 50% or less; |
• | a long-term debt-to-adjusted EBITDA multiple averaging between 3.5x and 4.0x (adjusted EBITDA is earnings before interest, taxes, depreciation and amortization and further adjusted for selected items that impact comparability. See Item 7. “Management’s Discussion and Analysis of Financial Condition and Results of Operations—Results of Operations—Non-GAAP Financial Measures” for a discussion of our selected items that impact comparability and our non-GAAP measures.); |
• | an average total debt-to-total capitalization ratio of approximately 60% or less; and |
• | an average adjusted EBITDA-to-interest coverage multiple of approximately 3.3x or better. |
The first two of these four metrics include long-term debt as a critical measure. PAA also incurs short-term debt in connection with its supply and logistics activities that involve the simultaneous purchase and forward sale of crude oil and NGL. The crude oil and NGL purchased in these transactions are hedged. PAA does not consider the working capital borrowings associated with these activities to be part of its long-term capital structure. These borrowings are self-liquidating as they are repaid with sales proceeds. As part of PAA’s Leverage Reduction Plan (as discussed further below), PAA has reduced its levels of hedged inventory related borrowings. PAA also incurs short-term debt to fund New York Mercantile Exchange (“NYMEX”) and Intercontinental Exchange (“ICE”) margin requirements. In certain market conditions, these routine short-term debt levels may increase significantly above baseline levels. For example, PAA’s short-term debt levels at December 31, 2017 and 2016 included borrowings for $212 million and $410 million, respectively, of margin requirements, which were significantly elevated from historical levels primarily due to the increase in crude oil prices at the end of each year.
Typically, for PAA to maintain its targeted credit profile and achieve growth through acquisitions and expansion capital, PAA funds approximately 55% of the capital requirements associated with these activities with equity and cash flow in excess of distributions. From time to time, PAA may be outside the parameters of its targeted credit profile as, in certain cases, capital expenditures and acquisitions may be financed initially using debt or there may be delays in realizing anticipated synergies from acquisitions or contributions from expansion capital projects to adjusted EBITDA. As a result of a challenging environment and the impact of the gap in the timing between funding our capital program and the time the assets are placed in service and begin to generate cash flow, PAA expects its long-term debt-to-adjusted EBITDA to be above its target range for the near-term. PAA expects this leverage ratio will improve and return to targeted levels as PAA executes its Leverage Reduction Plan (discussed further below), and as the industry recovers and PAA realizes EBITDA growth from capital investments.
PAA Leverage Reduction Plan
On August 25, 2017, PAA announced that it was implementing an action plan to strengthen its balance sheet, reduce leverage, enhance its distribution coverage, minimize new issuances of common equity and position PAA for future distribution growth. See Item 7. “Management’s Discussion and Analysis of Financial Condition and Results of Operations—Executive Summary” for a summary of this action plan and the status of PAA’s efforts to implement such plan.
10
PAA’s Acquisitions
The acquisition of midstream assets and businesses that are strategic and complementary to PAA’s existing operations constitutes an integral component of its business strategy and growth objectives. Such assets and businesses include crude oil and NGL logistics assets as well as other energy assets that have characteristics and provide opportunities similar to its existing business lines and enable PAA to leverage its assets, knowledge and skill sets.
The following table summarizes acquisitions greater than $200 million that PAA has completed over the past five years.
Acquisition (1) | Date | Description | Approximate Purchase Price (2) (in millions) | ||||||
Alpha Crude Connector Gathering System | Feb-2017 | Recently constructed gathering system located in the Northern Delaware Basin | $ | 1,215 | |||||
Spectra Energy Partners Western Canada NGL Assets | Aug-2016 | Integrated system of NGL assets located in Western Canada | $ | 204 | (3) | ||||
50% Interest in BridgeTex Pipeline Company, LLC (“BridgeTex”) | Nov-2014 | BridgeTex owns a crude oil pipeline that extends from Colorado City, Texas to East Houston | $ | 1,088 | (4) | ||||
(1) | Excludes PAA’s acquisition of all of the outstanding publicly-traded common units of PAA Natural Gas Storage, L.P. (“PNG”) on December 31, 2013 (referred to herein as the “PNG Merger”), as we historically consolidated PNG into our financial statements for financial reporting purposes in accordance with generally accepted accounting principles in the United States (“GAAP”). As consideration for the PNG Merger, PAA issued approximately 14.7 million of its common units with a value of approximately $760 million. |
(2) | As applicable, the approximate purchase price includes total cash paid and debt assumed, including amounts for working capital and inventory. |
(3) | Approximate purchase price of $180 million, net of cash, inventory and other working capital acquired. |
(4) | Approximate purchase price of $1.075 billion, net of working capital acquired. PAA accounts for its 50% interest in BridgeTex under the equity method of accounting. |
PAA’s Divestitures
During 2016, PAA initiated a program to evaluate potential sales of non-core assets and/or sales of partial interests in assets to strategic joint venture partners to optimize its asset portfolio and strengthen its balance sheet and leverage metrics. Through December 31, 2017, PAA has completed asset sales totaling approximately $1.7 billion, of which approximately $0.6 billion closed in 2016 (net of amounts paid for the remaining interest in a pipeline that was subsequently sold) and approximately $1.1 billion closed in 2017. See Note 6 to our Consolidated Financial Statements for additional discussion of dispositions and divestitures.
Ongoing Acquisition, Divestiture and Investment Activities
Consistent with its business strategy, PAA is continuously engaged in the evaluation of potential acquisitions, joint ventures and capital projects. As a part of these efforts, PAA often engages in discussions with potential sellers or other parties regarding the possible purchase of or investment in assets and operations that are strategic and complementary to PAA’s existing operations. In addition, PAA has in the past evaluated and pursued, and intends in the future to evaluate and pursue, the acquisition of or investment in other energy-related assets that have characteristics and opportunities similar to PAA’s existing business lines and enable PAA to leverage its assets, knowledge and skill sets. Such efforts may involve participation by PAA in processes that have been made public and involve a number of potential buyers or investors, commonly referred to as “auction” processes, as well as situations in which PAA believes it is the only party or one of a limited number of parties who are in negotiations with the potential seller or other party. These acquisition and investment efforts often involve assets which, if acquired or constructed, could have a material effect on PAA’s financial condition and results of operations.
From time to time, PAA may also (i) sell assets that it regards as non-core or that it believes might be a better fit with the business or assets of a third-party buyer or (ii) sell partial interests in assets to strategic joint venture partners, in each case to optimize PAA’s asset portfolio and strengthen its balance sheet and leverage metrics. With respect to a potential divestiture, PAA may also conduct an auction process or may negotiate a transaction with one or a limited number of potential buyers.
11
PAA typically does not announce a transaction until after it has executed a definitive agreement. However, in certain cases in order to protect its business interests or for other reasons, PAA may defer public announcement of a transaction until closing or a later date. Past experience has demonstrated that discussions and negotiations regarding a potential transaction can advance or terminate in a short period of time. Moreover, the closing of any transaction for which PAA has entered into a definitive agreement may be subject to customary and other closing conditions, which may not ultimately be satisfied or waived. Accordingly, PAA can give no assurance that its current or future acquisition or investment efforts will be successful, or that its strategic asset divestitures will be completed. Although PAA expects the acquisitions and investments it makes to be accretive in the long term, PAA can provide no assurance that its expectations will ultimately be realized. See Item 1A. “Risk Factors—Risks Related to PAA’s Business—If PAA makes acquisitions that fail to perform as anticipated, its future growth may be limited” and “—Acquisitions and divestitures involve risks that may adversely affect PAA’s business.”
PAA’s Expansion Capital Projects
PAA’s extensive asset base and its relationships with customers provide it with opportunities for organic growth through the construction of additional assets that are complementary to, and expand or extend, its existing asset base. PAA’s 2018 expansion capital plan is representative of the diversity and balance of its overall project portfolio. The following expansion capital projects are included in PAA’s 2018 capital plan as of February 2018:
Project | Description | Projected In-Service Date | 2018 Plan Amount (1) ($ in millions) | |||||
Permian Basin Takeaway Pipeline Projects | Primarily includes (i) the Cactus II pipeline system project and (ii) the extension/looping of the Sunrise pipeline system | Q1 2019 - Q3 2019 | $ | 765 | ||||
Complementary Permian Basin Projects | Multiple projects to support the Permian Basin takeaway pipeline projects, including additional terminalling and storage facilities and intra-basin and gathering pipelines | Q1 2018 - Q4 2019 | 375 | |||||
Selected Facilities | Includes projects at St. James, Fort Saskatchewan and other terminals | Q2 2018 - Q4 2018 | 50 | |||||
Other Projects | Q1 2018 - 2019+ | 210 | ||||||
Total Projected Expansion Capital Expenditures | $ | 1,400 | ||||||
(1) | Represents the portion of the total project cost expected to be incurred during the year. Potential variation to current capital costs estimates may result from (i) changes to project design, (ii) final cost of materials and labor and (iii) timing of incurrence of costs due to uncontrollable factors such as receipt of permits or regulatory approvals and weather. Amounts reflect our expectation that certain projects will be owned in a joint venture structure with a proportionate share of the project cost dispersed among the partners. |
12
Global Petroleum Market Overview
The health of the global petroleum market is dependent on the relative supply and demand of hydrocarbons, including crude oil and NGL. These supply and demand economics are greatly influenced by the broader global economic climate, exposing the petroleum market to the challenges and volatility associated with global economic development. For the period from 2004 through 2013, global liquids production increased 7.8 million barrels per day while global liquids consumption increased 9.2 million barrels per day. For the period from 2013 through 2016, global production growth outpaced global consumption growth by 1.2 million barrels per day resulting in a cumulative imbalance of 1.0 million barrels per day. In 2017, the global supply/demand gap tightened as global liquids consumption increased 1.4 million barrels per day, the third consecutive year of above trend demand growth. The Organization of Petroleum Exporting Countries (“OPEC”) supply growth was limited as a result of the November 2016 OPEC production agreement that aimed to limit OPEC crude oil output to 32.5 million barrels per day. The table below depicts historical OPEC and non-OPEC liquids production and global liquids consumption and is derived from the U.S. Energy Information Administration (“EIA”) Short-Term Energy Outlook, January 2018 (see EIA website at www.eia.doe.gov):
Annual Liquids Production / Consumption | ∆ from | ∆ from | ∆ from | ||||||||||||||||||||||||
2004 | 2013 | 2014 | 2015 | 2016 | 2017 | 2004-2013 | 2013-2016 | 2016-2017 | |||||||||||||||||||
(in millions of barrels per day) (1) | |||||||||||||||||||||||||||
Production (Supply) | |||||||||||||||||||||||||||
OPEC | 34.2 | 36.9 | 36.9 | 38.2 | 39.2 | 39.3 | 2.7 | 2.3 | 0.1 | ||||||||||||||||||
Non-OPEC | 49.3 | 54.4 | 56.9 | 58.5 | 58.0 | 58.7 | 5.1 | 3.6 | 0.7 | ||||||||||||||||||
Total | 83.4 | 91.3 | 93.8 | 96.7 | 97.2 | 98.0 | 7.8 | 5.9 | 0.8 | ||||||||||||||||||
Total Consumption (Demand) | 83.0 | 92.2 | 93.6 | 95.4 | 97.0 | 98.4 | 9.2 | 4.8 | 1.4 | ||||||||||||||||||
Global Supply / Demand Balance | 0.5 | (0.9 | ) | 0.2 | 1.4 | 0.3 | (0.4 | ) | (1.4 | ) | 1.2 | (0.7 | ) | ||||||||||||||
(1) | Amounts may not recalculate due to rounding. |
In November 2017, OPEC indicated a desire to continue managing crude oil production levels. Joined by certain non-OPEC countries such as Russia and Mexico, OPEC and non-OPEC producers agreed to manage market stability for the remainder of 2018. To the extent the production cut is executed, accumulated inventories should decline further, prices should remain firm and potentially rise, ultimately leading to increased activity levels.
Crude Oil Market Overview
The definition of a commodity is a “mass-produced unspecialized product” and implies the attribute of fungibility. Crude oil is typically referred to as a commodity; however, it is neither unspecialized nor fungible. The crude slate available to U.S. and world-wide refineries consists of a substantial number of different grades and varieties of crude oil. Each crude oil grade has distinguishing physical properties. For example, specific gravity (generally referred to as light or heavy), sulfur content (generally referred to as sweet or sour) and metals content, along with other characteristics, collectively result in varying economic attributes. In many cases, these factors result in the need for such grades to be batched or segregated in the transportation and storage processes, blended to precise specifications or adjusted in value.
The lack of fungibility of the various grades of crude oil creates logistical transportation, terminalling and storage challenges and inefficiencies associated with regional volumetric supply and demand imbalances. These logistical inefficiencies are created as certain qualities of crude oil are indigenous to particular regions or countries. Also, each refinery has a distinct configuration of process units designed to handle particular grades of crude oil. The relative yields and the cost to obtain, transport and process the crude oil drive the refinery’s choice of feedstock. In addition, from time to time, natural disasters and geopolitical factors such as hurricanes, earthquakes, tsunamis, inclement weather, labor strikes, refinery disruptions, embargoes and armed conflicts may impact supply, demand, transportation and storage logistics.
Our assets and our business strategy are designed to serve our producer and refiner customers by addressing regional crude oil supply and demand imbalances that exist in the United States and Canada. The nature and extent of these imbalances change from time to time as a result of a variety of factors, including regional production declines and/or increases; refinery
13
expansions, modifications and shut-downs; available transportation and storage capacity; and government mandates and related regulatory factors.
From 2011 through 2015, the combination of (i) a significant increase in North American production volumes, (ii) a change in crude oil qualities and related differentials and (iii) high utilization of existing pipeline and terminal infrastructure stimulated multiple industry initiatives to build new pipeline and terminal infrastructure, convert certain pipeline assets to alternative service or reverse flows and expand the use of trucks, rail and barges for the movement of crude oil and condensate. Increased production came from mature producing areas such as the Rockies, the Permian Basin in West Texas and the Mid-Continent region, as well as from less mature, but rapidly growing areas such as the Eagle Ford Shale in South Texas and the Williston Basin in North Dakota. As a result, North American crude oil production increased 5.6 million barrels per day, or 33% between 2011 and 2015, with the increases coming primarily from Canada, the Eagle Ford Shale, the Permian Basin and the Williston Basin. Production increases in all of these regions strained existing transportation, terminalling and downstream infrastructure. The resulting opportunity for new crude oil infrastructure attracted significant investment in midstream oil assets, resulting in excess midstream capacity in the Permian, Eagle Ford, Williston, Midcontinent and Denver Julesburg basins. However, the combination during such period of surging North American liquids production, relatively flat liquids production for the rest of the world and relatively modest growth in global liquids demand led to a supply imbalance, which in turn led to a significant and rapid reduction in petroleum prices. The meaningful decrease in crude oil price levels during the second half of 2014 and throughout 2015 relative to the levels experienced during 2013 and the first half of 2014 led many producers, including North American producers, to significantly scale back capital programs. As a result, during 2015, 2016 and part of 2017, the rate of growth of North American crude oil production slowed and production levels began to decrease in some areas. The combination of a slowdown in the rate of North American crude oil production growth and significant commitments for new infrastructure created an environment in which margins have compressed and differentials have tightened, reaching levels that are less than transportation cost in some cases. As the rate of production growth increases and pipeline utilizations increase, differentials should increase. The improvement is expected to occur on a regional basis based on the speed and extent of reductions in excess transportation capacity.
In addition, significant shifts in the type and location of crude oil being produced in North America, relative to the types and location of crude oil being produced five years ago, have led to changes in the utilization of downstream infrastructure. From 2009 through 2015, refiners increased throughputs to take advantage of discounted domestic production, which led to lower use of imported crude oil by U.S. refineries. This decline in imports was a meaningful change in a multi-year trend whereby foreign imports of crude oil tripled over an approximately 23-year period from 1985 to 2007. In 2017, U.S. refinery inputs reached historically high levels fueled by price-driven demand growth and exports. U.S. petroleum consumption increased to 19.8 million barrels per day for the twelve-month period ended December 2017. The table below shows the overall domestic petroleum consumption projected through 2019 and is derived from the EIA Short-Term Energy Outlook, January 2018 (see EIA website at www.eia.doe.gov):
Actual (1) | Projected (1) | |||||||||||
2016 | 2017 | 2018 | 2019 | |||||||||
(in millions of barrels per day) | ||||||||||||
Supply | ||||||||||||
Domestic Crude Oil Production | 8.9 | 9.3 | 10.3 | 10.8 | ||||||||
Net Imports - Crude Oil | 7.3 | 6.8 | 6.3 | 5.7 | ||||||||
Other (Supply Adjustment / Stock Change) | 0.1 | 0.5 | 0.2 | 0.1 | ||||||||
Crude Oil Input to Domestic Refineries | 16.2 | 16.6 | 16.8 | 16.7 | ||||||||
Net Product Imports / (Exports) | (2.5 | ) | (3.1 | ) | (3.1 | ) | (3.1 | ) | ||||
Supply from Renewable Sources | 1.2 | 1.2 | 1.2 | 1.2 | ||||||||
Other (NGL Production, Refinery Processing Gain) | 4.8 | 5.2 | 5.5 | 5.9 | ||||||||
Total Domestic Petroleum Consumption | 19.7 | 19.8 | 20.3 | 20.6 | ||||||||
(1) | Amounts may not recalculate due to rounding. |
14
U.S. Crude Oil Exports
The number of countries receiving exported U.S. crude oil has risen since the removal of restrictions on exporting U.S. crude oil in December 2015. U.S. crude oil exports have occurred despite uneconomic price spreads between international and domestic crude oil grades as global counterparties began to expand their sourcing options. U.S. crude oil exports averaged 1.0 million barrels per day in the first ten months of 2017, 0.45 (76%) million barrels per day more than the full-year 2016 and 0.58 (126%) million barrels per day more than full-year 2015. Continued increases in U.S. crude oil exports will likely depend on increases in U.S. crude oil production and wider price differences between domestic and international crude oil. The table below depicts historical U.S. crude oil exports and is derived from the EIA Monthly Energy Review, January 2018 (see EIA website at www.eia.doe.gov):
Annual U.S. Exports of Crude Oil | ∆ from | ∆ from | ∆ from | |||||||||||||||||
2014 | 2015 | 2016 | 2017 (1) | 2014-2015 | 2015-2016 | 2016-2017 (1) | ||||||||||||||
(in millions of barrels per day) (2) | ||||||||||||||||||||
PADD 1 | 0.05 | 0.07 | 0.19 | 0.02 | 0.02 | 0.11 | (0.17 | ) | ||||||||||||
PADD 2 | 0.09 | 0.08 | 0.11 | 0.19 | (0.01 | ) | 0.02 | 0.08 | ||||||||||||
PADD 3 | 0.19 | 0.29 | 0.29 | 0.82 | 0.10 | — | 0.52 | |||||||||||||
PADD 4 | 0.01 | 0.01 | 0.01 | — | — | — | (0.01 | ) | ||||||||||||
PADD 5 | — | 0.01 | 0.02 | 0.02 | 0.01 | 0.01 | — | |||||||||||||
Total U.S. Crude Oil Exports | 0.35 | 0.46 | 0.59 | 1.04 | 0.11 | 0.13 | 0.45 | |||||||||||||
(1) | Data reflects the first ten months of 2017. |
(2) | Amounts may not recalculate due to rounding. |
NGL Market Overview
NGL primarily includes ethane, propane, normal butane, iso-butane and natural gasoline, and is derived from natural gas production and processing activities, as well as crude oil refining processes. Liquefied petroleum gas (“LPG”) primarily includes propane and butane, which liquefy at moderate pressures thus making it easier to transport and store such products as compared to ethane. NGL refers to all NGL products including LPG when used in this Form 10-K.
NGL Demand. Individual NGL products have varying uses. Described below are the five basic NGL components and their typical uses:
• | Ethane. Ethane accounts for the largest portion of the NGL barrel and substantially all of the extracted ethane is used as feedstock in the production of ethylene, one of the basic building blocks for a wide range of plastics and other chemical products. When ethane recovery from a wet natural gas stream is uneconomic, ethane is left in the natural gas stream, subject to pipeline specifications. |
• | Propane. Propane is used as heating fuel, engine fuel and industrial fuel, for agricultural burning and drying and also as petrochemical feedstock for the production of ethylene and propylene. |
• | Normal butane. Normal butane is principally used for motor gasoline blending and as fuel gas, either alone or in a mixture with propane, and feedstock for the manufacture of ethylene and butadiene, a key ingredient of synthetic rubber. Normal butane is also used as a feedstock for iso-butane production and as a diluent in the transportation of heavy crude oil and bitumen, particularly in Canada. |
• | Iso-butane. Iso-butane is principally used by refiners to produce alkylates to enhance the octane content of motor gasoline. |
• | Natural Gasoline. Natural gasoline is principally used as a motor gasoline blend stock, a petrochemical feedstock, or as diluent in the transportation of heavy crude oil and bitumen, particularly in Canada. |
15
NGL Supply. The bulk (approximately 88%) of the United States NGL supply comes from gas processing plants, which separate a mixture of NGL from the dry gas (primarily methane). This NGL mix (also referred to as “Y Grade”) is then either fractionated at the processing site into the five individual NGL components (known as purity products), which may be transported, stored and sold to end use markets, or transported as a Y-Grade to a regional fractionation facility.
The majority of gas processing plants in the United States are located along the Gulf Coast, in the West Texas/Oklahoma area, the Marcellus and Utica region and in the Rockies region. In Canada, the vast majority of the processing capacity is located in Alberta, with a much smaller (but increasing) amount in British Columbia and Saskatchewan.
NGL products from refineries represent approximately 8% of the United States supply and are by-products of the refinery conversion processes. Consequently, they have generally already been separated into individual components and do not require further fractionation. NGL products from refineries are principally propane, with lesser amounts of butane, refinery naphthas (products similar to natural gasoline) and ethane. Due to refinery maintenance schedules and seasonal demand considerations, refinery production of propane and butane varies on a seasonal basis.
NGL is also imported into certain regions of the United States from Canada and other parts of the world (approximately 4% of total supply). NGL (primarily propane and butane) is also exported from certain regions of the United States.
NGL Transportation and Trading Hubs. NGL, whether as a mixture or as purity products, is transported by pipelines, barges, railcars and tank trucks. The method of transportation used depends on, among other things, the resources of the transporter, the locations of production points and delivery points, cost-efficiency and the quantity of product being transported. Pipelines are generally the most cost-efficient mode of transportation when large, consistent volumes of product are to be delivered.
The major NGL infrastructure and trading hubs in North America are located at Mont Belvieu, Texas; Conway, Kansas; Edmonton, Alberta; and Sarnia, Ontario. Each of these hubs contains a critical mass of infrastructure, including fractionators, storage, pipelines and access to end markets, particularly Mont Belvieu.
NGL Storage. NGL must be stored under pressure to maintain a liquid state. The lighter the product (e.g., ethane), the greater the pressure that must be maintained. Large volumes of NGL are stored in underground caverns constructed in salt or granite; however, product is also stored in above ground tanks. Natural gasoline can be stored at relatively low pressures in tankage similar to that used to store motor gasoline. Propane and butane are stored at much higher pressures in steel spheres, cylinders, bullets, salt caverns or other configurations. Ethane is stored at very high pressures, typically in salt caverns. Storage is especially important for NGL as supply and demand can vary materially on a seasonal basis.
NGL Market Outlook. The growth of shale based production in both traditional and new producing areas has resulted in a significant increase in NGL supplies from gas processing plants over the past several years. This has driven extensive expansion and new development of midstream infrastructure in Canada, the Bakken, Marcellus/Utica, and throughout Texas.
The growth of production in non-traditional producing regions has shifted regional basis relationships and created new logistics and infrastructure opportunities. Growing NGL production has meant expansion into new markets, through exports or increased petrochemical demand. The continuation of a relatively low ratio of North American gas and NGL prices to world-wide crude oil prices will mean North American NGL can continue to be competitive on a world scale, either as feedstock for North American based manufacturing or export to overseas markets. In addition to substantially increased exports, a portion of the increased supply of NGL will be absorbed by the domestic petrochemical sector as low-cost feed stocks, as the North American petrochemical industry has enjoyed a supply cost advantage on a world scale.
While a low price environment may stunt production growth, we believe the fundamentals of an accessible resource base and improved midstream infrastructure should mean producers can continue to develop the most economic new supply and be ready to go back to rapid growth as prices recover. The NGL market is, among other things, expected to be driven by:
• | the absolute prices of NGL products and their prices relative to natural gas and crude oil; |
• | drilling activity and wet natural gas production in developing liquids-rich production areas; |
• | available processing, fractionation, storage and transportation capacity; |
• | petro-chemical demand driven by the build-out or new builds of Ethylene Cracker capacity (ethane demand) and Propane Dehydrogenation facilities (propane demand); |
16
• | increased export capacity for both ethane and propane; |
• | diluent requirements for heavy Canadian oil; |
• | regulatory changes in gasoline specifications affecting demand for butane; |
• | seasonal demand from refiners; |
• | seasonal weather related demand; and |
• | inefficiencies caused by regional supply and demand imbalances. |
As a result of these and other factors, the NGL market is complex and volatile, which, along with expected market growth, creates opportunities to solve the logistical inefficiencies inherent in the business.
Natural Gas Storage Market Overview
North American natural gas storage facilities provide a staging and warehousing function for seasonal swings in demand relative to supply, as well as an essential reliability cushion against disruptions in natural gas supply, demand and transportation by allowing natural gas to be injected into, withdrawn from or warehoused in such storage facilities as dictated by market conditions. Natural gas storage serves as the “shock absorber” that balances the market, serving as a source of supply to meet the consumption demands in excess of daily production capacity during high-demand periods and a warehouse for gas production in excess of daily demand during low-demand periods.
Overall market conditions for natural gas storage have been challenging during the last several years, driven by a variety of factors, including (i) increased natural gas supplies due to production from shale resources, (ii) a shift from Gulf of Mexico production to Northeast production causing less concern over supply disruptions from tropical weather and (iii) lower basis differentials in certain regions due to expansion and improved connectivity of natural gas transportation infrastructure.
Longer term, we believe several factors will contribute to meaningful growth in North American natural gas demand that will bolster the market need for and the commercial value of natural gas storage. These fundamental factors include (i) exports of North American volumes of LNG, (ii) increased exports of natural gas to Mexico, (iii) construction of new gas-fired power plants, (iv) sustained fuel switching from coal to natural gas among existing power plants and (v) growth in base-level industrial demand.
17
Description of Segments and Associated Assets
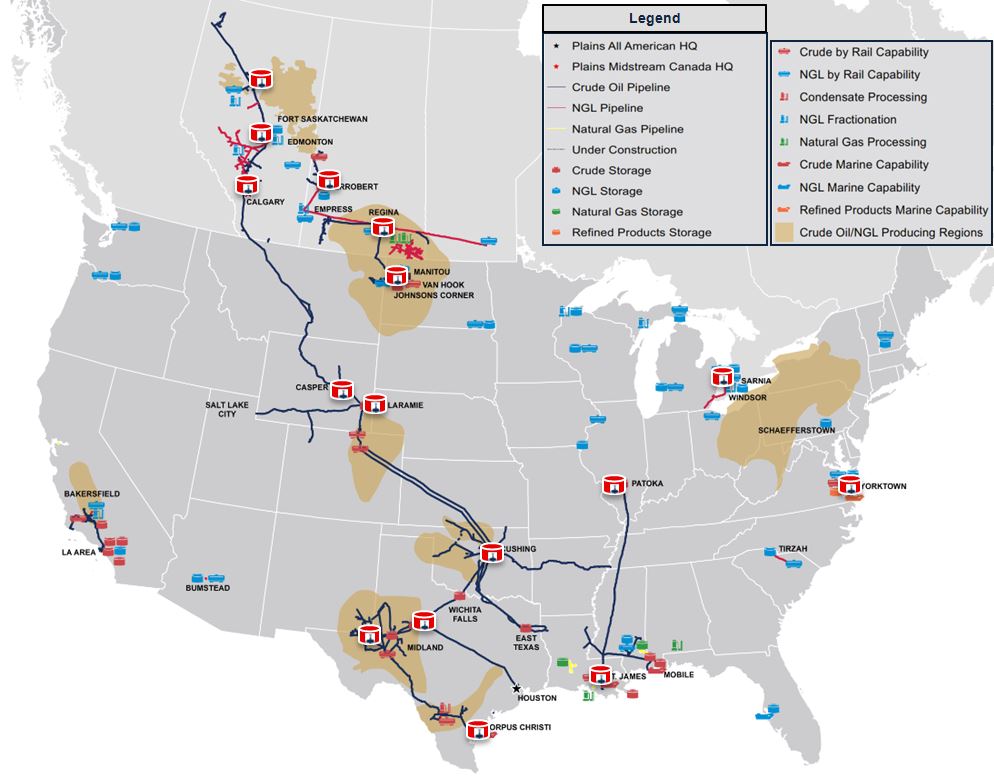
Under GAAP, we consolidate GP LLC, AAP and PAA and its subsidiaries. We currently have no separate operating activities apart from those conducted by PAA. As such, our segment analysis, presentation and discussion is the same as that of PAA, which conducts its operations through three segments—Transportation, Facilities and Supply and Logistics. Accordingly, any references to “we,” “us,” “our,” and similar terms describing assets, business characteristics or other related matters are references to assets, business characteristics or other matters involving PAA’s assets and operations. We have an extensive network of pipeline transportation, terminalling, storage and gathering assets in key crude oil and NGL producing basins and transportation corridors and at major market hubs in the United States and Canada. The map and descriptions below highlight our more significant assets (including certain assets under construction or development) as of December 31, 2017. Unless the context requires otherwise, references herein to our “facilities” includes all of the pipelines, terminals, storage and other assets owned by us.
Following is a description of the activities and assets for each of our three business segments.
18
Transportation Segment
Our Transportation segment operations generally consist of fee-based activities associated with transporting crude oil and NGL on pipelines, gathering systems, trucks and barges. We generate revenue through a combination of tariffs, third-party pipeline capacity agreements and other transportation fees. Our Transportation segment also includes equity earnings from our investments in entities that own the Advantage, BridgeTex, Caddo, Cheyenne, Diamond, Eagle Ford, Midway, Saddlehorn, STACK and White Cliffs pipeline systems, as well as Settoon Towing. We account for these investments under the equity method of accounting.
As of December 31, 2017, we employed a variety of owned or, to a much lesser extent, leased long-term physical assets throughout the United States and Canada in this segment, including approximately:
• | 18,700 miles of active crude oil and NGL pipelines and gathering systems; |
• | 32 million barrels of active, above-ground tank capacity used primarily to facilitate pipeline throughput and help maintain product quality segregation; |
• | 810 trailers (primarily in Canada); and |
• | 60 transport and storage barges and 30 transport tugs through our interest in Settoon Towing. |
The following is a tabular presentation of our active crude oil and NGL pipeline assets in the United States and Canada as of December 31, 2017, grouped by geographic location:
Region | Ownership Percentage | Approximate System Miles (1) | 2017 Average Net Barrels per Day (2) | |||||
(in thousands) | ||||||||
Crude Oil Pipelines: | ||||||||
Permian Basin: | ||||||||
Gathering pipelines | 100% | 2,860 | 735 | |||||
Intra-basin pipelines (3) | 50% - 100% | 725 | 1,285 | |||||
Export pipelines (3) | 50% - 100% | 1,135 | 835 | |||||
4,720 | 2,855 | |||||||
South Texas/Eagle Ford | 50% - 100% | 660 | 360 | |||||
Central | 50% - 100% | 2,950 | 420 | |||||
Gulf Coast (3) | 54% - 100% | 1,170 | 350 | |||||
Rocky Mountain (3) | 21% - 100% | 3,980 | 395 | |||||
Western | 100% | 640 | 185 | |||||
Canada | 100% | 2,880 | 350 | |||||
Crude Oil Pipelines Total | 17,000 | 4,915 | ||||||
Canadian NGL Pipelines | 21% - 100% | 1,700 | 170 | |||||
Crude Oil and NGL Pipelines Total | 18,700 | 5,085 | ||||||
(1) | Includes total mileage from pipelines owned by unconsolidated entities. |
19
(2) | Represents average daily volumes for the entire year attributable to our interest. Average daily volumes are calculated as the total volumes (attributable to our interest) for the year divided by the number of days in the year. Volumes reflect tariff movements and thus may be included multiple times as volumes move through our integrated system. |
(3) | Includes pipelines operated by a third party. |
A significant portion of our pipeline assets are interconnected and are operated as a contiguous system. The following descriptions are organized by geographic location and represent a selection of our most significant assets. Pipeline capacities throughout these descriptions are based on our reasonable estimate of volumes that can be delivered from origin to final destination on our pipeline systems. We report pipeline volumes based on the tariffs charged for individual movements, some of which may only utilize a portion of a pipeline system (i.e. two short-haul movements on a pipeline from point A to point B and another point B to point C would double the pipeline tariff volumes on a particular system versus a point A to point C movement). As a result, at times, our reported tariff barrel movements may exceed our total capacity.
Crude Oil Pipelines
Permian Basin
We are among the largest providers of crude oil midstream infrastructure and services in the Permian Basin located in west Texas and southeastern New Mexico. Our Permian Basin asset base represents an interconnected system that aggregates receipts from wellhead gathering lines and bulk truck injection locations into intra-basin trunk lines for transportation and delivery to a combination of owned and third-party mainline takeaway pipelines. Accordingly, our Permian Basin crude oil pipelines fall into one of three categories: Gathering, Intra-basin or Export.
Gathering Pipelines
We own and operate approximately 2,860 miles of gathering pipelines in the Permian Basin. Our gathering systems are in both the Midland Basin and the Delaware Basin and in aggregate represent approximately 2 million barrels per day of pipeline capacity. This gathering capacity includes pipeline capacity that delivers volumes to regional hubs and includes certain large diameter pipeline segments/systems. Approximately 75% of the capacity of our gathering systems is in the Delaware Basin. This total gathering capacity includes over 500,000 barrels per day of incremental capacity gained in 2017 through our acquisition of the Alpha Crude Connector (“ACC”) gathering system and the completion of various expansion projects.
Intra-basin Pipelines
We operate an approximately 2 million barrel per day intra-basin Permian Basin pipeline system that connects gathering and truck injection volumes to our owned and operated as well as third-party mainline pipelines that transport crude oil to major market hubs. This interconnected pipeline system is designed to provide shippers flow assurance, flexibility and access to multiple markets.
Two of our largest intra-basin pipelines are the Mesa and Sunrise Pipelines. The Mesa and Sunrise Pipelines extend from our Midland, Texas terminal to our Colorado City, Texas terminal where they have access to all of the Permian Basin takeaway pipelines that originate at Colorado City.
• | Mesa Pipeline. We own a 63% undivided interest in and are the operator of Mesa Pipeline, which transports crude oil from Midland, Texas to a refinery at Big Spring, Texas, and to connecting carriers at Colorado City, with capacity of up to 400,000 barrels per day (approximately 252,000 barrels per day attributable to our interest). |
• | Sunrise Pipeline. We own and operate the Sunrise Pipeline, which transports crude oil from Midland to connecting carriers at Colorado City, with capacity of approximately 350,000 barrels per day. We have announced plans to loop the line from Midland to Colorado City (which will add an additional 550,000 barrels per day of capacity to Colorado City), and extend the line from Colorado City to Wichita Falls, Texas. In addition, in 2018 we sold 100,000 barrels per day of this new capacity from Midland to Wichita Falls to a refiner. These projects are underpinned by long-term shipper commitments and are expected to be placed into service in 2019. |
Export Pipelines
We own interests in three export Permian Basin pipeline systems that, on a combined basis, represent approximately 1 million barrels per day of takeaway capacity (net to our ownership interests) out of the Permian Basin.
20
• | Basin Pipeline (Permian to Cushing). We own an 87% undivided joint interest in and are the operator of Basin Pipeline. Basin Pipeline has two primary origination locations at Wink, Texas and Midland and, in addition to making intra-basin movements, serves as the primary route for transporting crude oil from the Permian Basin to Cushing, Oklahoma. Basin Pipeline also receives crude oil from a facility in southern Oklahoma which aggregates South Central Oklahoma Oil Province (SCOOP) production. |
• | BridgeTex Pipeline (Permian to Houston). We own a 50% interest in BridgeTex Pipeline Company, LLC, a joint venture with a subsidiary of Magellan Midstream Partners, L.P. (“Magellan”). Such joint venture owns a crude oil pipeline (the “BridgeTex Pipeline”) that originates at Colorado City, receiving volumes from our Basin and Sunrise Pipelines, and extends to Houston, Texas. In 2017, the joint venture expanded BridgeTex Pipeline by 100,000 barrels per day to 400,000 barrels per day of total capacity and subsequently announced an open season for a potential additional 40,000 barrel per day expansion. The BridgeTex Pipeline is operated by Magellan. |
• | Cactus Pipeline (Permian to Corpus Christi). We own and operate the Cactus Pipeline, which originates at McCamey, Texas and extends to Gardendale, Texas. Cactus Pipeline volumes are interconnected to the Corpus Christi market through a connection at Gardendale to our Eagle Ford joint venture pipeline system. In 2017, we expanded Cactus Pipeline to 390,000 barrels per day of total capacity. |
• | Cactus II Pipeline (Permian to Corpus Christi). In January 2018, we announced that we had received sufficient binding commitments on the initial open season launched mid-December, and would be proceeding with construction of a new Permian mainline system extending directly to the Corpus Christi market (the “Cactus II Pipeline”). Furthermore, in February 2018, we announced that Cactus II Pipeline is fully committed with long-term third-party contracts following the conclusion of a second binding open season. We expect that Cactus II Pipeline will be owned in a joint-venture structure, and that we will operate the pipeline and own a majority of the interest in the pipeline. Cactus II Pipeline will have initial capacity of 585,000 barrels per day and is expected to be placed into service in the second half of 2019. |
South Texas/Eagle Ford Area
We own a 100% interest in and are the operator of gathering systems that feed into our Gardendale Station. Additionally, we own a 50% interest in Eagle Ford Pipeline LLC, a joint venture with a subsidiary of Enterprise Products Partners, L.P. (“Enterprise”). This joint venture owns a pipeline system, of which we serve as the operator, that has a total capacity of approximately 660,000 barrels per day and connects Permian and Eagle Ford area production to Corpus Christi refiners and terminals. Additionally, the joint venture system has connectivity to Houston via a connection with Enterprise’s pipeline at Lyssy, Texas.
Central
We own and operate gathering and mainline pipelines that source crude oil from Western and Central Oklahoma, Southwest Kansas and the Eastern Panhandle for transportation and delivery into our terminal facilities at Cushing, Oklahoma. In addition, we own and operate various pipeline systems that extend from our Cushing facility with interconnectivity to various demand locations, including the following systems:
Diamond Pipeline (Cushing to Memphis). We own a 50% interest in Diamond Pipeline LLC, a joint venture with Valero Energy Corporation (“Valero”). This joint venture owns, and we operate, the Diamond Pipeline, which was placed into service in late 2017 and which extends from our Cushing Terminal to Valero’s refinery in Memphis, Tennessee. The Diamond Pipeline is underpinned by a long-term minimum volume commitment and currently has a total capacity of 200,000 barrels per day, which is expandable by an additional 150,000 barrels per day as conditions warrant.
Red River Pipeline (Cushing to Longview). The Red River Pipeline is an approximately 150,000 barrels per day capacity pipeline that extends from our Cushing Terminal to Longview, Texas, where it connects with various pipelines, including the Caddo Pipeline. The Red River Pipeline is supported by long-term shipper commitments and was placed into service in December 2016. We serve as operator of the pipeline. In January 2017, we sold an undivided 40% interest in a segment of the Red River Pipeline to a subsidiary of Valero Energy Partners LP. The undivided interest conveyed represents 60,000 barrels per day on the segment of the pipeline extending from Cushing to Hewitt, Oklahoma near Valero’s refinery in Ardmore, Oklahoma (the “Hewitt Segment”). We retained an undivided 60% interest in the Hewitt Segment and a 100% interest in the remaining portion of the pipeline that extends from Ardmore to Longview.
21
Caddo Pipeline. We own a 50% interest in Caddo Pipeline LLC, a joint venture with Delek Logistics Partners, LP (“Delek”). The joint venture owns, and we operate, the Caddo Pipeline, which is an approximately 80,000 barrels per day capacity pipeline that originates in Longview at the terminus of the Red River Pipeline and serves refineries in Shreveport, Louisiana and El Dorado, Arkansas. The Caddo Pipeline was placed into service in December 2016 and is underpinned by shipper commitments.
STACK Pipeline. In 2017, we formed a 50/50 joint venture with Phillips 66 Partners, L.P., known as STACK Pipeline LLC. This joint venture owns the STACK Pipeline, which serves producers in the STACK (Sooner Trend Anadarko Basin Canadian and Kingfisher Counties) resource play. We serve as operator of this joint-venture system and in 2017 expanded its capacity by 150,000 barrels per day to a total capacity of 250,000 barrels per day. The project is supported by producer commitments, which also warranted our extension of the system into the core areas of the STACK resource play. This extension was completed in late 2017.
Gulf Coast
We own and/or operate pipelines in the Gulf Coast area with transportation and delivery into connecting carriers, terminal facilities and a refinery. This includes a 54% undivided joint interest in the Capline Pipeline system (“Capline”). Capline is an approximately 1.1 million barrel per day capacity mainline pipeline that is operated by Marathon Pipeline LLC and has historically facilitated a south-to-north movement from St. James, Louisiana to Patoka, Illinois. The Capline owners are assessing the commercial potential to reverse the pipeline direction within the next several years, potentially enabling it to transport Canadian crude oil to the U.S. Gulf Coast.
Rocky Mountain
We own and operate pipelines that provide gathering services in the Bakken and the Powder River Basin. We own a pipeline system that can move Bakken crude oil to the Enbridge mainline system at Regina, Saskatchewan. We own an undivided joint interest in a pipeline system that extends from the Canadian border to our terminal in Guernsey, Wyoming. This pipeline system receives crude oil from our Rangeland and Milk River Pipelines in Canada. In addition to these assets, our largest Rocky Mountain area systems include the following joint venture pipelines, both of which connect to our terminal in Cushing:
Saddlehorn Pipeline. We own a 40% interest in Saddlehorn Pipeline LLC (“SP LLC”), which owns 190,000 barrels per day of capacity in the Saddlehorn Pipeline that extends from the Niobrara and DJ Basin to Cushing. Magellan serves as operator of the Saddlehorn Pipeline. Saddlehorn Pipeline was placed into service in 2016 and is supported by minimum volume commitments.
White Cliffs Pipeline. We own an approximate 36% interest in White Cliffs Pipeline LLC, which owns an approximately 215,000 barrel per day capacity pipeline that extends from the DJ Basin to Cushing. Rose Rock Midstream, L.P. serves as the operator of the pipeline.
Western
We own and operate pipeline systems in our Western region including the following:
Gathering. We own and operate gathering pipelines with aggregate capacity of over 150,000 barrels per day that source crude oil from the San Joaquin Valley in California and connect to our Line 63 and Line 2000 pipelines, as well as other third-party pipelines and terminals.
Line 63 and Line 2000. We own and operate the Line 63 and Line 2000 pipelines, which have an approximately 60,000 barrels per day and 130,000 barrels per day of pipeline capacity, respectively, and transport crude oil from the San Joaquin Valley to refineries and terminal facilities in the Los Angeles Basin and in Bakersfield, California. Additionally, we have a distribution pipeline system in the Los Angeles Basin that connects our storage assets with all major refineries and third-party pipelines and marine terminals in the Los Angeles Basin.
All American Pipeline. We own the All American Pipeline, which historically received crude oil from offshore oil producers at Las Flores, California and at Gaviota, California. The pipeline terminates at our Emidio Station. Between Gaviota and our Emidio Station, the All American Pipeline interconnects with our San Joaquin Valley Gathering System, Line 2000 and Line 63, as well as other third-party intrastate pipelines.
22
In May 2015, we experienced a crude oil release on the segment of the All American Pipeline known as Line 901 that runs from Las Flores to Gaviota in Santa Barbara County, California. The segment of the pipeline upstream of our Pentland station has been shut down since this incident. We are currently evaluating a replacement of the pipeline, subject to receipt of shipper commitments and regulatory approvals. See Note 17 to our Consolidated Financial Statements for additional information regarding the Line 901 incident.
Canada
Rainbow Pipeline. We own and operate the Rainbow Pipeline, which is an approximately 185,000 barrel per day capacity pipeline that extends from Zama, Alberta to Edmonton, Alberta. The pipeline transports both blended heavy and light crude oil and includes gathering and diluent pipelines.
Rangeland Pipeline. We own and operate the Rangeland Pipeline system, which transports NGL mix, butane, condensate, light sweet crude oil and light sour crude oil either north to Edmonton or south to the U.S./Canadian border near Cutbank, Montana.
South Saskatchewan Pipeline. We own and operate the South Saskatchewan system, which has approximately 65,000 barrels per day of capacity to transport heavy crude oil from gathering areas in southern Saskatchewan to the Enbridge mainline system at Regina.
Manito Pipeline. We own and operate the Manito heavy oil system, which is connected to our Kerrobert Terminal, which in turn is connected to the Enbridge mainline system. The Manito system includes blended crude oil lines with parallel diluent lines.
Canadian NGL Pipelines
Co-Ed NGL Pipeline. We own and operate the Co-Ed NGL pipeline, which has approximately 70,000 barrels per day of capacity to transport NGL that it gathers from approximately 27 field gas processing plants located in Alberta, including all of the NGL produced at the Cochrane Straddle Plant for delivery to our NGL facilities at Fort Saskatchewan.
PPTC Pipeline. We own and operate the Plains Petroleum Transmission Company Pipeline (the “PPTC Pipeline”), which has approximately 20,000 barrels per day of capacity to transport NGL from Empress, Alberta to the Fort Whyte Terminal in Winnipeg, Manitoba. The PPTC Pipeline also provides access to several truck terminals and rail loading facilities.
Facilities Segment
Our Facilities segment operations generally consist of fee-based activities associated with providing storage, terminalling and throughput services primarily for crude oil, NGL and natural gas, as well as NGL fractionation and isomerization services and natural gas and condensate processing services. We generate revenue through a combination of month-to-month and multi-year agreements.
Revenues generated in this segment primarily include (i) fees that are generated from storage capacity agreements, (ii) terminal throughput fees that are generated when we receive liquids from one connecting source and deliver the applicable product to another connecting source, (iii) fees from NGL fractionation and isomerization services, (iv) fees from natural gas and condensate processing services, (v) fees associated with natural gas park and loan activities, interruptible storage services and wheeling and balancing services and (vi) loading and unloading fees at our rail terminals.
As of December 31, 2017, we owned, operated or employed a variety of long-term physical assets throughout the United States and Canada in this segment, including:
• | approximately 77 million barrels of crude oil storage capacity primarily at our terminalling and storage locations; |
• | approximately 34 million barrels of NGL storage capacity; |
• | approximately 67 billion cubic feet (“Bcf”) of natural gas storage working capacity; |
• | approximately 25 Bcf of owned base gas; |
• | nine natural gas processing plants located throughout Canada and the Gulf Coast area of the United States; |
23
• | a condensate processing facility located in the Eagle Ford area of South Texas with an aggregate processing capacity of approximately 120,000 barrels per day; |
• | eight fractionation plants located throughout Canada and the United States with an aggregate net processing capacity of approximately 211,000 barrels per day, and an isomerization and fractionation facility in California with an aggregate processing capacity of approximately 15,000 barrels per day; |
• | 34 crude oil and NGL rail terminals located throughout the United States and Canada. See “Rail Facilities” below for an overview of various terminals and “Supply and Logistics” regarding our use of railcars; |
• | five marine facilities in the United States; and |
• | approximately 1,000 miles of active pipelines that support our facilities assets. |
The following is a tabular presentation of our active Facilities segment storage and service assets in the United States and Canada as of December 31, 2017, grouped by product and service type, with capacity and volume as indicated:
Crude Oil Storage Facilities | Total Capacity (MMBbls) | ||
Cushing | 25 | ||
St. James | 13 | ||
LA Basin | 8 | ||
Patoka | 7 | ||
Mobile and Ten Mile | 4 | ||
Other (1) | 20 | ||
77 | |||
NGL Storage Facilities | Total Capacity (MMBbls) | ||
Sarnia Area | 10 | ||
Fort Saskatchewan | 10 | ||
Empress Area | 4 | ||
Bumstead | 3 | ||
Other | 7 | ||
34 | |||
Natural Gas Storage Facilities | Total Capacity (Bcf) | ||
Salt Caverns | 67 | ||
Natural Gas Processing Facilities (2) | Ownership Interest | Total Gas Spec Product (3) (Bcf/d) | Gas Processing Capacity (Bcf/d) | |||||
United States Gulf Coast Area | 100% | 0.2 | 0.3 | |||||
Canada | 50-100% | 2.7 | 7.1 | |||||
2.9 | 7.4 | |||||||
Condensate Stabilization Facility | Total Capacity (Bbls/d) | ||
Gardendale | 120,000 | ||
24
NGL Fractionation and Isomerization Facilities | Ownership Interest | Total Spec Product (3) (Bbls/d) | Net Capacity (Bbls/d) | |||||
Empress | 100% | 16,000 | 28,300 | |||||
Fort Saskatchewan | 21-100% | 35,100 | 67,800 | |||||
Sarnia | 62-84% | 55,000 | 90,000 | |||||
Shafter | 100% | 10,400 | 15,000 | |||||
Other | 82-100% | 9,300 | 25,000 | |||||
125,800 | 226,100 | |||||||
Rail Facilities | Ownership Interest | Loading Capacity (Bbls/d) | Unloading Capacity (Bbls/d) | |||||
Crude Oil Rail Facilities | 100% | 380,000 | 350,000 | |||||
Ownership Interest | Number of Rack Spots | Number of Storage Spots | ||||||
NGL Rail Facilities (4) | 50-100% | 335 | 1,515 | |||||
(1) | Amount includes approximately 2 million barrels of storage capacity associated with our crude oil rail terminal operations. |
(2) | While natural gas processing volumes and capacity amounts are presented, they currently are not a significant driver of our segment results. |
(3) | Represents average volumes net to our share for the entire year. |
(4) | Our NGL rail terminals are predominately utilized for internal purposes specifically for our supply and logistics activities. See our “Supply and Logistics Segment” discussion following this section for further discussion regarding the use of our rail terminals. |
The following discussion contains a detailed description of our more significant Facilities segment assets.
Crude Oil Facilities
Cushing Terminal. We are the largest provider of crude oil terminalling services in Cushing, Oklahoma, which is one of the largest physical trading hubs in the United States and is the delivery point for crude oil futures contracts traded on the NYMEX. Our Cushing Terminal has been designated by the NYMEX as an approved delivery location for crude oil delivered under the NYMEX light sweet crude oil futures contract. As the NYMEX delivery point and a cash market hub, the Cushing Interchange serves as a source of refinery feedstock for Midwest and Gulf Coast refiners and plays an integral role in establishing and maintaining markets for multiple grades of foreign and domestic crude oil.
Our Cushing Terminal is designed to serve the operational needs of refiners, with an emphasis on ensuring operational reliability and flexibility. Accordingly, we have access to all major inbound and outbound pipelines in Cushing and our facility is designed to handle multiple grades of crude oil while minimizing the interface and enabling deliveries to connecting carriers at their maximum rate. Since 1999, we have completed multiple expansions that have increased the capacity of our Cushing Terminal to over 25 million barrels, which includes approximately 2 million barrels of additional shell capacity that was completed in 2017. Additionally, our Cushing Terminal has 22 direct pipeline connections, both incoming and outgoing.
St. James Terminal. We have crude oil storage capacity at the St. James crude oil interchange in Louisiana, which is one of the three most liquid crude oil interchanges in the United States. Our facility is connected to major pipelines and other terminals and includes a manifold and header system that allows for receipts and deliveries with connecting pipelines at their maximum operating capacity. In addition, this facility includes a marine dock that is able to receive from, and deliver to, tankers and barges and is also connected to our rail unloading facility. See “Rail Facilities” below for further discussion.
L.A. Basin. We own four crude oil and black oil storage facilities in the Los Angeles area with storage capacity in commercial service and a distribution pipeline system of approximately 50 miles of pipeline in the Los Angeles Basin. We use the Los Angeles area storage and distribution system to service the storage and distribution needs of refining, pipeline and
25
marine terminal facilities in the Los Angeles Basin. Our Los Angeles area system’s pipeline distribution assets connect our storage assets with major refineries and third-party pipelines and marine terminals in the Los Angeles Basin.
Patoka Terminal. Our Patoka Terminal includes crude oil storage and an associated manifold and header system at the Patoka Interchange located in Southern Illinois. Our terminal has access to all major pipelines and terminals at the Patoka Interchange, a growing regional hub serving both northbound and southbound movements. In 2017, we added approximately 0.5 million barrels of storage capacity.
Mobile and Ten Mile Terminal. We have a marine terminal in Mobile, Alabama (the “Mobile Terminal”) that has current useable capacity of 2 million barrels. Approximately 4 million barrels of additional storage capacity is available at our nearby Ten Mile Facility, which is connected to our Mobile Terminal. Of this capacity, approximately 2 million barrels supports our Facilities segment operations, with the remaining storage supporting our Transportation segment assets. The Mobile Terminal is equipped with a ship/tanker dock, barge dock, truck unloading facilities and various third-party connections for crude oil movements to area refiners. Our Ten Mile Facility is connected to our Pascagoula Pipeline.
Corpus Christi (Eagle Ford) Terminal. We own a 50% interest in Eagle Ford Terminals Corpus Christi LLC, a joint venture with a subsidiary of Enterprise. Eagle Ford Terminals is currently developing a terminal in Corpus Christi, Texas that, when completed, will be capable of loading ocean going vessels with either crude oil or condensate. Initial storage capacity of the terminal will be approximately 1 million barrels. The facility will have access to production from both the Eagle Ford and the Permian Basin through the Eagle Ford joint venture pipeline and is expected to be placed into service in 2018.
NGL Storage Facilities
Sarnia Area. Our Sarnia Area facilities in Southwestern Ontario have an aggregate useable storage capacity of 10 million barrels and consist of (i) our Sarnia facility, (ii) our Windsor storage terminal and (iii) our St. Clair terminal. The Sarnia facility is a large NGL fractionation and storage facility located in the Sarnia Chemical Valley that contains multiple rail and truck loading locations and is served by a network of 14 pipelines providing product delivery capabilities to our Windsor and St. Clair terminal facilities, in addition to refineries, chemical plants and other pipeline systems in the area.
Fort Saskatchewan. The Fort Saskatchewan facility is located near Edmonton, Alberta in one of the key North American NGL hubs. The facility is a receipt, storage, fractionation and delivery facility for NGL and is connected to other major NGL plants and pipeline systems in the area. The facility’s primary assets include 25 storage caverns with an aggregate of approximately 10 million barrels in useable storage capacity. The facility includes assets operated by us and assets operated by a third party. Our ownership in the various facility assets ranges from approximately 21% to 100%. See the section entitled “—NGL Fractionation and Isomerization Facilities” below for additional discussion of this facility.
In 2013, we began upgrading our Fort Saskatchewan storage capacity as part of a multi-phase expansion. The first phase of the expansion included the addition of 2.4 million barrels of new brine pond capacity and two new NGL storage caverns each with a capacity of 350,000 barrels in 2016. In addition, we converted approximately 3 million barrels of NGL mix storage to propane, butane and condensate storage in the first half of 2017. As part of the second phase of the project, in 2017 we added 2.7 million barrels of new brine pond capacity and two new ethane caverns totaling 1.6 million barrels of capacity which are supported by long-term commitments from third parties, and we will add an additional multi-purpose cavern in 2018 which will provide 600,000 barrels of storage.
Empress Area. We own a network of seven NGL terminals (Fort Whyte, Moose Jaw, Rapid City, Stewart Valley, Dewdney, Empress and Richardson) with an aggregate useable storage capacity of 4 million barrels. The facilities are complemented by various other NGL fractionation and extraction assets as described further below.
Bumstead. Our Bumstead facility is located at a major rail transit point near Phoenix, Arizona. With 3 million barrels of useable capacity, the facility’s primary assets include salt-dome storage caverns, a rail track and truck racks.
Natural Gas Storage Facilities
We own two U.S. Federal Energy Regulatory Commission (“FERC”) regulated natural gas storage facilities located in the Gulf Coast that are certificated for 120 Bcf of working gas capacity, and as of December 31, 2017, we had an aggregate working gas capacity of approximately 67 Bcf in service. Our facilities have aggregate certificated peak daily injection and withdrawal rates of 3.6 Bcf and 5.6 Bcf, respectively.
26
Our natural gas storage facilities are strategically located and have a diverse group of customers, including utilities, pipelines, producers, power generators, marketers and liquefied natural gas (“LNG”) exporters, whose storage needs vary from traditional seasonal storage services to hourly balancing. We are located near several major market hubs, including the Henry Hub (the delivery point for NYMEX natural gas futures contracts), the Carthage Hub (located in East Texas), and the Perryville Hub (located in North Louisiana). Our facilities have 17 interconnects with third-party interstate pipelines and gas-fired power plants, serving markets in the Gulf Coast, Mid-Atlantic, Northeast, and Southeast regions of the United States.
Natural Gas Processing Facilities
We own and/or operate four straddle plants and two field gas processing plants located in Western Canada. Through our August 2016 acquisition of the Empress straddle plant, we added 2.4 Bcf per day of gross NGL processing capacity with the ability to extract ethane and NGL liquids from TransCanada main lines. Cumulatively, our straddle plants have an aggregate gross natural gas processing capacity of approximately 7 Bcf per day and a long-term liquids supply contract relating to a third-party owned straddle plant with gross processing capacity of approximately 2.5 Bcf per day. We also own and operate three natural gas processing plants located in Louisiana and Alabama with an aggregate natural gas processing capacity of approximately 0.3 Bcf per day.
NGL Fractionation and Isomerization Facilities
Empress. We own the Empress fractionation facility, which is connected to and receives liquids from our Empress straddle plant and has a fractionation capacity of approximately 28,000 barrels per day of propane, butane and condensate. The facility is capable of producing spec NGL products and connects to our PPTC Pipeline network.
Fort Saskatchewan. Our recently expanded Fort Saskatchewan fractionation facility has a design capacity of 85,000 barrels per day and produces spec propane, butane, condensate and a C3/C4 mix, which is sent to our Sarnia facility for further fractionation. We are in the process of adding a merox sweetening unit that will increase our ability to handle a variety of feed streams providing more flexibility and flow assurance. This final stage of the expansion is expected to be completed in the first half of 2018 and is supported by long-term commitments from third parties. Through our 21% ownership in the Keyera Fort Saskatchewan fractionation plant, we have additional fractionation capacity, net to our share, of approximately 17,000 barrels per day.
Sarnia. The Sarnia Fractionator is the largest fractionation plant in Eastern Canada and receives NGL feedstock from the Enbridge Pipeline and from refineries, gas plants and chemical plants in the area. The fractionation unit has a net useable capacity of 90,000 barrels per day and produces specification propane, isobutane, normal butane and natural gasoline. Our ownership in the various processing units at the Sarnia Fractionator ranges from 62% to 84%.
Shafter. Our Shafter facility located near Bakersfield, California provides isomerization and fractionation services to producers and customers. The primary assets consist of approximately 200,000 barrels of NGL storage and a processing facility with butane isomerization capacity of approximately 15,000 barrels per day including NGL fractionation capacity of approximately 12,000 barrels per day.
Condensate Processing Facility
Our Gardendale condensate processing facility located in La Salle County, Texas is designed to extract natural gas liquids from condensate. The facility is adjacent to our Gardendale terminal and rail facility and is connected to a third-party pipeline that delivers NGL to Mont Belvieu. The facility has a total processing capacity of 120,000 barrels per day and useable storage capacity of 160,000 barrels. Throughput at the Gardendale processing facility is supplied by long-term commitments from producers.
Rail Facilities
Crude Oil Rail Loading Facilities
We own crude oil and condensate rail loading facilities with a combined loading capacity of approximately 380,000 barrels per day. These facilities are located at or near Carr, Colorado; Tampa, Colorado; Gardendale, Texas; McCamey, Texas; Manitou, North Dakota; Van Hook, North Dakota; and Kerrobert, Saskatchewan.
27
Crude Oil Rail Unloading Facilities
We own three crude oil rail unloading facilities that have a combined unloading capacity of approximately 350,000 barrels per day. Our St. James, Louisiana facility receives unit trains and has a capacity of 140,000 barrels per day. Our Yorktown, Virginia rail facility can receive unit trains and has an unload capacity of approximately 140,000 barrels per day. Our Bakersfield, California rail facility receives unit trains and has permitted capacity to unload 70,000 barrels per day.
NGL Rail Facilities
We own 26 operational NGL rail facilities (including our Fort Saskatchewan rail facility, as well as facilities that can provide both crude oil and NGL service) strategically located near NGL storage, pipelines, gas production or propane distribution centers throughout the United States and Canada. Our NGL rail facilities currently have 335 railcar rack spots and 1,515 railcar storage spots, and we have the ability to switch our own railcars at ten of these terminals.
Supply and Logistics Segment
Our Supply and Logistics segment operations generally consist of the following merchant-related activities:
• | the purchase of U.S. and Canadian crude oil at the wellhead, and the bulk purchase of crude oil at pipeline, terminal and rail facilities; |
• | the storage of inventory during contango market conditions and the seasonal storage of NGL and natural gas; |
• | the purchase of NGL from producers, refiners, processors and other marketers; |
• | the resale or exchange of crude oil and NGL at various points along the distribution chain to refiners, exporters or other resellers; and |
• | the transportation of crude oil and NGL on trucks, barges, railcars, pipelines and vessels from various delivery points, market hub locations or directly to end users such as refineries, processors and fractionation facilities. |
Our purchase and resale of crude oil and NGL results in us generating a margin, which is reduced by the transportation, facilities and other logistical costs associated with delivering the crude oil or NGL to market as well as related operating and general and administrative expenses. A portion of our results is impacted by overall market structure and the degree of market volatility, as well as variable operating expenses. Our activities are designed to limit downside exposure, while generating upside potential associated with opportunities inherent in volatile market conditions (including opportunities to benefit from fluctuating differentials and market structure). The opportunity to realize upside potential through our Supply and Logistics operations has been materially reduced in recent years due to high levels of competition. See “—Impact of Commodity Price Volatility and Dynamic Market Conditions on Our Business Model” below for further discussion.
In addition to hedged working inventories associated with its merchant activities, as of December 31, 2017, our Supply and Logistics segment owned significant volumes of crude oil and NGL classified as long-term assets and linefill or minimum inventory requirements and employed a variety of owned or leased physical assets throughout the United States and Canada, including approximately:
• | 14 million barrels of crude oil and NGL linefill in pipelines owned by us; |
• | 4 million barrels of crude oil and NGL linefill in pipelines owned by third parties and other long-term inventory; |
• | 730 trucks and 900 trailers; and |
• | 10,100 crude oil and NGL railcars. |
In connection with its operations, our Supply and Logistics segment secures transportation and facilities services from our other two segments as well as third-party service providers under month-to-month and multi-year arrangements. Intersegment fees are based on posted tariff rates, rates similar to those charged to third parties or rates that we believe approximate market rates.
28
The following table shows the average daily volume of our supply and logistics activities for the year ended December 31, 2017:
Volumes (MBbls/d) | ||
Crude oil lease gathering purchases | 945 | |
NGL sales | 274 | |
Supply and Logistics segment total volumes | 1,219 | |
Crude Oil and NGL Purchases. We purchase crude oil and NGL from multiple producers under contracts and believe that we have established long-term, broad-based relationships with the crude oil and NGL producers in our areas of operations.
Our crude oil contracts generally range in term from thirty-day evergreen to five years, with the majority ranging from thirty days to one year and a limited number of contracts with remaining terms extending up to ten years. We utilize our truck fleet, railcars and pipelines as well as leased railcars, third-party pipelines, trucks and barges to transport crude oil to market. From time to time, we enter into various types of purchase and exchange transactions including fixed-price purchase contracts, collars, financial swaps and crude oil and NGL-related futures contracts as hedging devices.
We purchase NGL from producers, refiners and other NGL marketing companies under contracts that typically have ranged from immediate delivery to one year in term. In the last few years, we have implemented an increasing number of contracts with longer terms to ensure capacity utilization and base-load expansion projects. We utilize our trucking fleet and pipeline network, as well as leased railcars, third-party tank trucks and third-party pipelines to transport NGL.
In addition to purchasing crude oil from producers, we purchase both domestic and foreign crude oil in bulk at major hub locations, rail and dock facilities. We also purchase NGL in bulk at major pipeline terminal points and storage facilities from major integrated oil companies, large independent producers or other NGL marketing companies or processors. Crude oil and NGL are purchased in bulk when we believe additional opportunities exist to realize margins further downstream in the crude oil or NGL distribution chain. The opportunities to earn additional margins vary over time with changing market conditions. Accordingly, the margins associated with our bulk purchases will fluctuate from period to period.
Crude Oil and NGL Sales. The activities involved in the supply, logistics and distribution of crude oil and NGL are complex and require current detailed knowledge of crude oil and NGL sources and end markets, as well as a familiarity with a number of factors including individual refinery demand for specific grades of crude oil, area market price structures, location of customers, various modes and availability of transportation facilities to deliver crude oil and NGL to our customers.
We sell our crude oil to major integrated oil companies, independent refiners, exporters and other resellers in various types of sale and exchange transactions. Our crude oil sales contracts generally range in term from thirty-day evergreen to five years, with the majority ranging from thirty days to one year. We sell NGL primarily to propane and refined product retailers, petrochemical companies and refiners, and limited volumes to other marketers. The majority of our NGL contracts generally span a term of one year. For contracts greater than one year, pricing mechanisms are typically put in place to ensure any significant cost escalations are accounted for, which may include provisions for annual price negotiations designed to ensure both the buyer and seller remain at market-based pricing. We establish a margin for the crude oil and NGL we purchase by entering into physical sales contracts with third parties, or by entering into a future delivery obligation with respect to futures contracts on the NYMEX, ICE or over-the-counter exchanges. Through these transactions, we seek to maintain a position that is substantially balanced between purchases and sales and future delivery obligations. From time to time, we enter into various types of sale and exchange transactions, including fixed-price delivery contracts, collars, financial swaps and crude oil and NGL-related futures contracts as hedging devices.
Crude Oil and NGL Exchanges. We pursue exchange opportunities to enhance margins throughout the gathering and marketing process. When opportunities arise to increase our margin or to acquire a grade, type or volume of crude oil or NGL that more closely matches our physical delivery requirement, location or the preferences of our customers, we exchange physical crude oil or NGL, as appropriate, with third parties. These exchanges are effected through contracts called exchange or buy/sell agreements. Through an exchange agreement, we agree to buy crude oil or NGL that differs in terms of geographic location, grade of crude oil or type of NGL, or physical delivery schedule from crude oil or NGL we have available for sale. Generally, we enter into exchanges to acquire crude oil or NGL at locations that are closer to our end markets, thereby reducing transportation costs and increasing our margin. We also exchange our crude oil to be physically delivered at a later date, if the exchange is expected to result in a higher margin net of storage costs, and we enter into exchanges based on the grade of crude
29
oil, which includes such factors as sulfur content and specific gravity, in order to meet the quality specifications of our physical delivery contracts. See Note 2 to our Consolidated Financial Statements for further discussion of our accounting for exchange and buy/sell agreements.
Credit. Our merchant activities involve the purchase of crude oil and NGL for resale and require significant extensions of credit by our suppliers. In order to assure our ability to perform our obligations under the purchase agreements, various credit arrangements are negotiated with our suppliers. These arrangements include open lines of credit and, to a lesser extent, standby letters of credit issued under our hedged inventory facility or our senior unsecured revolving credit facility.
When we sell crude oil and NGL, we must determine the amount, if any, of credit to be extended to any given customer. We manage our exposure to credit risk through credit analysis, credit approvals, credit limits, prepayment, letters of credit and monitoring procedures. Additionally, in an effort to mitigate credit risk, a significant portion of our transactions with counterparties are settled on a net-cash basis. Furthermore, we also enter into netting agreements (contractual agreements that allow us to offset receivables and payables with those counterparties against each other on our balance sheet) for the majority of our net-cash arrangements.
Because our typical sales transactions can involve large volumes of crude oil, the risk of nonpayment and nonperformance by customers is a major consideration in our business. We believe our sales are made to creditworthy entities or entities with adequate credit support. Generally, sales of crude oil are settled within 30 days of the month of delivery, and pipeline, transportation and terminalling services settle within 30 days from the date we issue an invoice for the provision of services.
We also have credit risk exposure related to our sales of NGL (principally propane); however, because our sales are typically in relatively small amounts to individual customers, we do not believe that these transactions pose a material concentration of credit risk. Typically, we enter into annual contracts to sell NGL on a forward basis, as well as to sell NGL on a current basis to local distributors and retailers. In certain cases our NGL customers prepay for their purchases, in amounts ranging up to 100% of their contracted amounts.
Certain activities in our Supply and Logistics segment are affected by seasonal aspects, primarily with respect to NGL supply and logistics activities, which are sensitive to weather-related demand, particularly during the approximate five-month peak heating season of November through March.
Impact of Commodity Price Volatility and Dynamic Market Conditions on Our Business Model
Through our three business segments, we are engaged in the transportation, storage, terminalling and marketing of crude oil, NGL and natural gas. The majority of our activities are focused on crude oil, which is the principal feedstock used by refineries in the production of transportation fuels.
Crude oil, NGL and natural gas commodity prices have historically been very volatile. For example, since the mid-1980s, NYMEX West Texas Intermediate (“WTI”) crude oil benchmark prices have ranged from a low of approximately $10 per barrel during 1986 to a high of over $147 per barrel during 2008. During 2017, WTI crude oil prices traded within a range of approximately $43 to $60 per barrel. There has also been volatility within the propane and butane markets as seen through the North American benchmark price located at Mont Belvieu, Texas. Specifically, over the last ten years, propane prices have ranged from a low of approximately 40% of the WTI benchmark price for crude oil in 2015 to a high of approximately 65% of the WTI benchmark price for crude oil in 2011. During 2017, propane averaged 63% of WTI and on a daily basis traded within a range of 48% to 80% of WTI. During the same ten-year period, butane has seen a price range from a low of approximately 51% of the WTI benchmark price for crude oil in 2015 to a high of approximately 79% of the WTI benchmark price for crude oil in 2011. During 2017, butane averaged 72% of WTI and on a daily basis traded within a range of 51% to 111% of WTI.
Absent extended periods of lower crude oil or NGL prices that are below production replacement costs or higher crude oil or NGL prices that have a significant adverse impact on consumption, demand for the services we provide in our fee-based Transportation and Facilities segments and our financial results from these activities have little correlation to absolute commodity prices. Relative contribution levels will vary from quarter-to-quarter due to seasonal and other similar factors, but we project that (absent material outperformance in our Supply and Logistics business) our fee-based Transportation and Facilities segments should comprise approximately 90% or greater of our aggregate segment results.
30
Results from our supply and logistics activities depend on our ability to sell crude oil and NGL at prices in excess of our aggregate cost. Although segment results may be adversely affected during certain transitional periods as discussed further below, our crude oil and NGL supply, logistics and distribution operations are not directly affected by the absolute level of prices, but are affected by overall levels of supply and demand for crude oil and NGL and relative fluctuations in market-related indices.
In developing our business model and allocating our resources among our three segments, we attempt to anticipate the impacts of shifts between supply-driven markets and demand-driven markets, seasonality, cyclicality, regional surpluses and shortages, economic conditions and a number of other influences that can cause volatility and change market dynamics on a short, intermediate and long-term basis. Our objective is to position the Partnership such that our overall annual cash flow is not materially adversely affected by the absolute level of energy prices, shifts between demand-driven markets and supply-driven markets or other similar dynamics. Beginning in the second half of 2014 to present, however, the market has experienced impacts from aggressive competition and overbuilt infrastructure in certain regions, which has caused supply and demand imbalances and price volatility. In some of the areas where we operate, there has been significantly increased competition for marginal or incremental volumes from shippers on third-party pipelines who have committed to ship more production than they have and are purchasing barrels in the market for shipment on the applicable third-party pipeline to satisfy their transportation commitments, often doing so at a loss because the loss on sale of the purchased crude oil will be less than the amount of the take-or-pay obligation on the pipeline. This type of activity has put downward pressure on margins across our three business segments. During such transitional markets, our Supply and Logistics segment may not be able to fully recover its costs on certain transactions.
While recent market conditions have been challenging, we believe the complementary, integrated nature of our business activities and diversification of our asset base among varying regions and demand-driven and supply-driven markets provides flexibility for our customers and plays a valuable role in driving the growth of our fee-based Transportation and Facilities segments. Additionally, this approach is also intended to provide opportunities to realize incremental margin during volatile market conditions. While these opportunities have been reduced in recent years, the possibility for upside potential remains. For example, if crude oil prices are high relative to historical levels, we may hedge some of our expected pipeline loss allowance barrels, and if crude oil prices are low relative to historical prices, we may hedge a portion of our anticipated diesel purchases needed to operate our trucks and barges. Also, during periods when supply exceeds the demand for crude oil, NGL or natural gas in the near term, the market for such product is often in contango, meaning that the price for future deliveries is higher than current prices. In a contango market, entities that have access to storage at major trading locations can purchase crude oil, NGL or natural gas at current prices for storage and simultaneously sell forward such products for future delivery at higher prices.
In executing our business model, we employ a variety of financial risk management tools and techniques, predominantly in our Supply and Logistics segment. These are discussed in greater detail below.
Risk Management
In order to hedge margins involving our physical assets and manage risks associated with our various commodity purchase and sale obligations and, in certain circumstances, to realize incremental margin during volatile market conditions, we use derivative instruments. We also use various derivative instruments to manage our exposure to interest rate risk and currency exchange rate risk. In analyzing our risk management activities, we draw a distinction between enterprise level risks and trading-related risks. Enterprise level risks are those that underlie our core businesses and may be managed based on management’s assessment of the cost or benefit of doing so. Conversely, trading-related risks (the risks involved in trading in the hopes of generating an increased return) are not inherent in our core business; rather, those risks arise as a result of engaging in trading activities. Our policy is to manage the enterprise level risks inherent in our core businesses, rather than trying to profit from trading activity. Our commodity risk management policies and procedures are designed to monitor NYMEX, ICE and over-the-counter positions, as well as physical volumes, grades, locations, delivery schedules and storage capacity, to help ensure that our hedging activities address our risks. Our interest rate and currency exchange rate risk management policies and procedures are designed to monitor our derivative positions and ensure that those positions are consistent with our objectives and approved strategies. We have a risk management function that has direct responsibility and authority for our risk policies, related controls around commercial activities and procedures and certain other aspects of corporate risk management. Our risk management function also approves all new risk management strategies through a formal process. Our approved strategies are intended to mitigate and manage enterprise-level risks that are inherent in our core businesses.
31
Our policy is generally to structure our purchase and sales contracts so that price fluctuations do not materially affect our operating income, and not to acquire and hold physical inventory or derivatives for the purpose of speculating on outright commodity price changes. Although we seek to maintain a position that is substantially balanced within our supply and logistics activities, we purchase crude oil, NGL and natural gas from thousands of locations and may experience net unbalanced positions for short periods of time as a result of production, transportation and delivery variances as well as logistical issues associated with inclement weather conditions and other uncontrollable events that may occur. When unscheduled physical inventory builds or draws do occur, they are monitored constantly and managed to a balanced position over a reasonable period of time. This activity is monitored independently by our risk management function and must take place within predefined limits and authorizations.
Geographic Data; Financial Information about Segments
See Note 19 to our Consolidated Financial Statements.
Customers
Marathon Petroleum Corporation and its subsidiaries accounted for 19%, 18% and 17% of our revenues for the years ended December 31, 2017, 2016 and 2015, respectively. ExxonMobil Corporation and its subsidiaries accounted for 11%, 14% and 13% of our revenues for the years ended December 31, 2017, 2016 and 2015, respectively. Phillips 66 Company and its subsidiaries accounted for 11% of our revenues for each of the years ended December 31, 2017 and 2016. No other customers accounted for 10% or more of our revenues during any of the three years ended December 31, 2017. The majority of revenues from these customers pertain to our supply and logistics operations. The sales to these customers occur at multiple locations and we believe that the loss of these customers would have only a short-term impact on our operating results. There is risk, however, that we would not be able to identify and access a replacement market at comparable margins. For a discussion of customers and industry concentration risk, see Note 14 to our Consolidated Financial Statements.
Competition
Competition among pipelines is based primarily on transportation charges, access to producing areas and supply regions and demand for crude oil and NGL by end users. Although new pipeline projects represent a source of competition for our business, there are also existing third-party owned pipelines with excess capacity in the vicinity of our operations that expose us to significant competition based on the relatively low operating cost associated with moving an incremental barrel of crude oil or NGL through such unutilized capacity. In the current environment, competition for marginal or incremental volumes has been exacerbated in some areas by shippers on third-party pipelines who have committed to ship more production than they own or have secured under contract and are purchasing barrels in the market and shipping them on the applicable third-party pipeline in satisfaction of their transportation commitment. This type of activity reduces the pool of incremental barrels that would otherwise be available for transport on our pipelines. In addition, in areas where additional infrastructure is necessary to accommodate new or increased production or changing product flows, we face competition in providing the required infrastructure solutions as well as the risk of building capacity in excess of sustainable demand levels. Depending upon the specific movement, pipelines, which generally offer the lowest cost of transportation, may also face competition from other forms of transportation, such as truck, rail and barge. Although these alternative forms of transportation are typically higher cost, they can provide access to alternative markets at which a higher price may be realized for the commodity being transported, thereby overcoming the increased transportation cost.
We also face competition with respect to our supply and logistics and facilities services. Our competitors include other crude oil and NGL pipeline and terminalling companies, other NGL processing and fractionation companies, the major integrated oil companies and their marketing affiliates, independent gatherers, private equity backed entities, banks that have established a trading platform, brokers and marketers of widely varying sizes, financial resources and experience. Some of these competitors have capital resources greater than ours.
With respect to our natural gas storage operations, the principal elements of competition are rates, terms of service, supply and market access and flexibility of service. An increase in competition in our markets could arise from new ventures or expanded operations from existing competitors. Our natural gas storage facilities compete with several other storage providers, including regional storage facilities and utilities. Certain pipeline companies have storage facilities connected to their systems that compete with some of our facilities.
32
Regulation
Our assets, operations and business activities are subject to extensive legal requirements and regulations under the jurisdiction of numerous federal, state, provincial and local agencies. Many of these agencies are authorized by statute to issue, and have issued, requirements binding on the pipeline industry, related businesses and individual participants. The failure to comply with such legal requirements and regulations can result in substantial fines and penalties, expose us to civil and criminal claims, and cause us to incur significant costs and expenses. See Item 1A. “Risk Factors—Risks Related to PAA’s Business—PAA’s operations are also subject to laws and regulations relating to protection of the environment and wildlife, operational safety, climate change and related matters that may expose it to significant costs and liabilities.” At any given time there may be proposals, provisional rulings or proceedings in legislation or under governmental agency or court review that could affect our business. The regulatory burden on our assets, operations and activities increases our cost of doing business and, consequently, affects our profitability. We can provide no assurance that the increased costs associated with any new or proposed laws, rules or regulations will not be material. We may at any time also be required to apply significant resources in responding to governmental requests for information and/or enforcement actions.
The following is a summary of certain, but not all, of the laws and regulations affecting our operations.
Environmental, Health and Safety Regulation
General
Our operations involving the storage, treatment, processing and transportation of liquid hydrocarbons, including crude oil, are subject to stringent federal, state, provincial and local laws and regulations governing the discharge of materials into the environment or otherwise relating to protection of the environment. As with the industry generally, compliance with these laws and regulations increases our overall cost of doing business, including our capital costs to construct, maintain and upgrade equipment and facilities as regulations are updated or new regulations are invoked. Failure to comply with these laws and regulations could result in the assessment of administrative, civil and criminal penalties, the imposition of investigatory and remedial liabilities and the issuance of injunctions or other orders that may subject us to additional operational constraints. Failure to comply with these laws and regulations could also result in negative public perception of our operations or the industry in general, which may adversely impact our ability to conduct our business. Environmental and safety laws and regulations are subject to changes that may result in more stringent requirements, and we cannot provide any assurance that compliance with current and future laws and regulations will not have a material effect on our results of operations or earnings. A discharge of hazardous liquids into the environment could, to the extent such event is not insured, subject us to substantial expense, including both the cost to comply with applicable laws and regulations and any claims made by third parties. The following is a summary of some of the environmental, health and safety laws and regulations to which our operations are subject.
Pipeline Safety/Integrity Management
A substantial portion of our petroleum pipelines and our storage tank facilities in the United States are subject to regulation by the Department of Transportation’s (“DOT”) Pipeline and Hazardous Materials Safety Administration (“PHMSA”) pursuant to the Hazardous Liquids Pipeline Safety Act of 1979, as amended (the “HLPSA”). The HLPSA imposes safety requirements on the design, installation, testing, construction, operation, replacement and management of pipeline and tank facilities. Federal regulations implementing the HLPSA require pipeline operators to adopt measures designed to reduce the environmental impact of oil discharges from onshore oil pipelines, including the maintenance of comprehensive spill response plans and the performance of extensive spill response training for pipeline personnel. These regulations also require pipeline operators to develop and maintain a written qualification program for individuals performing covered tasks on pipeline facilities. Comparable regulation exists in some states in which we conduct intrastate common carrier or private pipeline operations. Regulation in Canada is under the National Energy Board (“NEB”) and provincial agencies.
United States
The HLPSA was amended by the Pipeline Safety Improvement Act of 2002 and the Pipeline Inspection, Protection, Enforcement and Safety Act of 2006. These amendments have resulted in the adoption of rules by the DOT that require transportation pipeline operators to implement integrity management programs, including frequent inspections, correction of identified anomalies and other measures, to ensure pipeline safety in “high consequence areas” such as high population areas, areas unusually sensitive to environmental damage, and commercially navigable waterways. In the United States, our costs associated with the inspection, testing and correction of identified anomalies were approximately $137 million in 2017, $89 million in 2016 and $107 million in 2015. Based on currently available information, our preliminary estimate for 2018 is that
33
we will incur approximately $63 million in capital expenditures and approximately $24 million in operational expenditures associated with our required pipeline integrity management program. Significant additional expenses could be incurred if new or more stringently interpreted pipeline safety requirements are implemented. In addition to required activities, our integrity management program includes several voluntary, multi-year initiatives designed to prevent incidents. Costs incurred in connection with these voluntary initiatives were approximately $39 million in 2017, $48 million in 2016 and $33 million in 2015, and our preliminary estimate for 2018 is that we will incur approximately $41 million of such costs.
PHMSA was reauthorized and the HLPSA was amended in 2011 and 2016. The regulatory changes precipitated by these actions have increased our cost to operate. We anticipate that future rulemaking will have the potential to contribute to a higher cost to operate. For example, PHMSA is expected to finalize new rules in 2018 that will impose new reporting and integrity management requirements on hazardous liquids pipelines.
In October 2015, the Governor of California signed the Oil Spill Response: Environmentally and Ecologically Sensitive Areas Bill (“AB-864”) which requires automatic shut offs for pipelines located in environmentally sensitive areas. Efforts to draft and implement regulations to adopt the provisions of AB-864 continue and are expected to be finalized in the first half of 2018. We anticipate that the regulations promulgated in response to AB-864 will have a material impact on our pipeline operations in California.
The DOT has issued guidelines with respect to securing regulated facilities against terrorist attack. We have instituted security measures and procedures in accordance with such guidelines to enhance the protection of certain of our facilities; however, we cannot provide any assurance that these security measures would fully protect our facilities from an attack.
The DOT has generally adopted American Petroleum Institute Standard 653 (“API 653”) as the standard for the inspection, repair, alteration and reconstruction of steel aboveground petroleum storage tanks subject to DOT jurisdiction. API 653 requires regularly scheduled inspection and repair of tanks remaining in service. In the United States, our costs associated with this program were approximately $37 million, $29 million and $33 million in 2017, 2016 and 2015, respectively. For 2018, we have budgeted approximately $56 million in connection with continued API 653 compliance activities and similar new EPA regulations for tanks not regulated by the DOT. Certain storage tanks may be taken out of service if we believe the cost of compliance will exceed the value of the storage tanks or replacement tankage may be constructed.
Canada
In Canada, the NEB and provincial agencies regulate the safety and integrity management of pipelines and storage tanks used for hydrocarbon transmission. We have incurred and will continue to incur costs related to such regulatory requirements.
The Pipeline Safety Act, SC 2015, c. 21 (the “Pipeline Safety Act” or the “Act”) became effective in June 2016, amending the National Energy Board Act and the Canada Oil and Gas Operations Act in order to strengthen the safety and security of pipelines regulated under those acts. It reinforces the “polluter pays” principle, such that operators of pipelines are liable for costs and damages for all unintended or uncontrolled releases of oil, gas, or other substances. The Act introduces absolute liability for costs and damages up to $1 billion from an uncontrolled release of oil, gas or other commodity from a major pipeline (i.e. those with capacity over 250,000 barrels per day). Additionally, operators will be required to maintain the financial resources necessary to meet the applicable absolute liability obligations imposed under the Act. The total transportation capacity of our pipelines regulated by the NEB exceeds 250,000 barrels per day, so information about financial resources we have available to respond to a pipeline release was filed with the NEB. Finally, the NEB imposes requirements with respect to abandoned pipelines, including an obligation to maintain adequate funds to pay for abandonment costs.
In addition to required activities, our Canadian integrity management program includes several voluntary, multi-year initiatives designed to prevent incidents. Costs incurred for all integrity management activities were approximately $57 million, $56 million and $66 million in 2017, 2016 and 2015, respectively, and our preliminary estimate for 2018 is that we will incur approximately $72 million of such costs.
We cannot predict the potential costs associated with additional, future regulation. Significant additional expenses could be incurred, and additional operational requirements and constraints could be imposed, if new or more stringently interpreted pipeline safety requirements are implemented.
34
Occupational Safety and Health
United States
In the United States, we are subject to the requirements of the Occupational Safety and Health Act, as amended (“OSHA”) and comparable state statutes that regulate the protection of the health and safety of workers. In addition, the OSHA hazard communication standard requires that certain information be maintained about hazardous materials used or produced in operations and that this information be provided to employees, state and local government authorities and citizens. Certain of our facilities are subject to OSHA Process Safety Management (“PSM”) regulations, which are designed to prevent or minimize the consequences of catastrophic releases of toxic, reactive, flammable or explosive chemicals. These regulations apply to any process which involves a chemical at or above specified thresholds or any process that involves 10,000 pounds or more of a flammable liquid or gas in one location.
Canada
Similar regulatory requirements exist in Canada under the federal and provincial Occupational Health and Safety Acts, Regulations and Codes. The agencies with jurisdiction under these regulations are empowered to enforce them through inspection, audit, incident investigation or investigation of a public or employee complaint. In some jurisdictions, the agencies have been empowered to administer penalties for contraventions without the company first being prosecuted. Additionally, under the Criminal Code of Canada, organizations, corporations and individuals may be prosecuted criminally for violating the duty to protect employee and public safety.
Solid Waste
We generate wastes, including hazardous wastes, which are subject to the requirements of the federal Resource Conservation and Recovery Act, as amended (“RCRA”), and analogous state and provincial laws. Many of the wastes that we generate are not subject to the most stringent requirements of RCRA because our operations generate primarily oil and gas wastes, which currently are excluded from consideration as RCRA hazardous wastes. It is possible, however, that in the future, oil and gas waste under RCRA may be revisited and our wastes subject to more rigorous and costly disposal requirements, resulting in additional capital expenditures or operating expenses. For example, pursuant to a settlement agreement with environmental organizations, the EPA must determine by 2019 whether currently exempt oil and gas wastes should be regulated under RCRA’s hazardous waste provisions.
Hazardous Substances
The federal Comprehensive Environmental Response, Compensation and Liability Act, as amended (“CERCLA”), also known as “Superfund,” and comparable state laws impose liability, without regard to fault or the legality of the original act, on certain classes of persons that contributed to the release of a “hazardous substance” into the environment. These persons include the owner or operator of the site or sites where the release occurred and companies that disposed of, or arranged for the disposal of, the hazardous substances found at the site. Such persons may be subject to strict, joint and several liability for the costs of cleaning up the hazardous substances that have been released into the environment, for damages to natural resources, and for the costs of certain health studies. It is not uncommon for neighboring landowners and other third parties to file claims for personal injury and property damage allegedly caused by hazardous substances or other pollutants released into the environment. In the course of our ordinary operations, we may generate waste that falls within CERCLA’s definition of a “hazardous substance.” Canadian federal and provincial laws also impose liabilities for releases of certain substances into the environment.
We are subject to the Environmental Protection Agency’s (“EPA”) Risk Management Plan regulations at certain facilities. These regulations are intended to work with OSHA’s PSM regulations (see “—Occupational Safety and Health” above) to minimize the offsite consequences of catastrophic releases. The regulations require us to develop and implement a risk management program that includes a five-year accident history, an offsite consequence analysis process, a prevention program and an emergency response program. In January 2016, the EPA finalized revisions to the Risk Management Plan (“RMP”) rules, including requirements for the use of third-party compliance audits, root cause analyses for facilities that experience releases, process hazard analyses and enhanced information-sharing provisions, effective March 2017. However, the EPA has since published a rule delaying implementation of the RMP revisions until February 2019 while the agency considers whether to amend or repeal the rule. OSHA has announced that it is considering similar revisions to the PSM rule, but, to date, has not issued a Notice of Proposed Rulemaking. The potential for revisions to either the RMP or PSM rule is uncertain at this time.
35
Environmental Remediation
We currently own or lease, and in the past have owned or leased, properties where hazardous liquids, including hydrocarbons, are or have been handled. These properties may be subject to CERCLA, RCRA and state and Canadian federal and provincial laws and regulations. Under such laws and regulations, we could be required to remove or remediate hazardous liquids or associated wastes (including wastes disposed of or released by prior owners or operators) and to clean up contaminated property (including contaminated groundwater).
We maintain insurance of various types with varying levels of coverage that we consider adequate under the circumstances to cover our operations and properties. The insurance policies are subject to deductibles and retention levels that we consider reasonable and not excessive. Consistent with insurance coverage generally available in the industry, in certain circumstances our insurance policies provide limited coverage for losses or liabilities relating to gradual pollution, with broader coverage for sudden and accidental occurrences.
Assets we have acquired or will acquire in the future may have environmental remediation liabilities for which we are not indemnified. We have in the past experienced and in the future may experience releases of crude oil into the environment from our pipeline and storage operations. We may also discover environmental impacts from past releases that were previously unidentified.
Air Emissions
Our United States operations are subject to the United States Clean Air Act (“Clean Air Act”), comparable state laws and associated state and federal regulations. In October 2015, the EPA promulgated a revised national ambient air standard for ozone. The revised standard may make air permits for sources of volatile organic compounds (such as crude oil tank farms) more difficult to obtain in some areas. In addition, in June 2016, the EPA finalized rules regarding criteria for aggregating multiple small surface sites into a single source for air-quality permitting purposes applicable to the oil and gas industry. This rule could cause small facilities, on an aggregate basis, to be deemed a major source, thereby triggering more stringent air permitting processes and control requirements. Our Canadian operations are also subject to federal and provincial air emission regulations.
As a result of the changing air emission requirements in both Canada and the United States, we may be required to incur certain capital and operating expenditures in the next several years to install air pollution control equipment and otherwise comply with more stringent federal, state, provincial and regional air emissions control requirements when we attempt to obtain or maintain permits and approvals for sources of air emissions. We can provide no assurance that future air compliance obligations will not have a material adverse effect on our financial condition or results of operations.
Climate Change Initiatives
United States
The EPA has adopted rules for the reporting the emission of carbon dioxide, methane and other greenhouse gases (“GHG”) from certain sources. Fewer than ten of our facilities are presently subject to the federal GHG reporting requirements. These include facilities with combustion GHG emissions and potential fugitive emissions above the reporting thresholds. We import sufficient quantities of finished fuel products into the United States to be required to report that activity as well.
In June 2016, the EPA finalized regulations affecting new, modified and reconstructed sources of air emissions in the oil and natural gas sector that require significant reductions in fugitive methane emissions from certain upstream and midstream oil and gas facilities. These new rules also require operators to implement fugitive emission leak detection and repair requirements for compressor stations. However, over the past year the EPA has taken several steps to delay implementation of its methane rules, and the agency proposed a rulemaking in June 2017 to stay the requirements for a period of two years and revisit implementation of the methane rules in their entirety. The EPA has not yet published a final rule but, as a result of these developments, future implementation of the 2016 rules is uncertain at this time. However, several states have either proposed or finalized similar regulations related to the reduction of methane emissions from the oil and natural gas sector.
California has implemented a GHG cap-and-trade program, authorized under Assembly Bill 32 (“AB32”). Through 2014, California’s cap-and-trade program has only applied to large industrial facilities. The California Air Resources Board has published a list of facilities that are subject to this program. At this time, the list only includes one of our facilities, the Lone
36
Star Gas Liquids facility in Shafter, California because it is a significant combustion source. As a result, compliance instruments for GHG emissions have been purchased since 2013.
Effective January 1, 2015, the AB32 regulations also covered finished fuel providers and importers. California finished fuels providers (refiners and importers) are required to purchase GHG emission credits for finished fuel sold in or imported into California. Plains Marketing was included in this portion of the regulation due to propane imports and completed its first year of compliance in 2016. The compliance requirements of the GHG cap-and-trade program through 2020 are being phased in.
Executive Order B-30-15 was signed by California’s Governor in mid-year 2015. This Executive Order requires a 40% reduction in GHG emissions from the 1990 baseline level by 2030. The current 2020 goals for GHG emissions reductions are at 15% below the 1990 baseline level. Compliance with this reduction requirement may necessitate the lowering of the threshold for industrial facilities required to participate in the GHG cap and trade program.
While it is not possible at this time to predict how federal or state governments may choose to regulate GHG emissions, any new regulatory restrictions on GHG emissions could result in material increased compliance costs, additional operating restrictions and an increase in the cost of feedstock and products produced by our refinery customers.
In December 2015, the Paris Agreement was signed at the 21st annual Conference of Parties to the United Nations Framework Convention on Climate Change (“UNFCCC”). The Paris Agreement, which came into effect in November 2016, requires signatory parties to develop and implement carbon emission reduction policies with a goal of limiting the rise in average global temperatures to 2°C or less. The United States and Canada are currently signatories to the Agreement; however, in June 2017, President Trump stated that the United States would withdraw from the Paris Agreement, but may enter into a future international agreement related to GHGs. In August 2017, the U.S. State Department officially informed the United Nations of the intent of the United States to withdraw from the Paris Agreement. The United States’ adherence to the exit process is uncertain and/or the terms on which the United States may reenter the Paris Agreement or a separately negotiated agreement are unclear at this time. This Agreement is likely to become a significant driver for future potential GHG reduction programs in participating countries. Notwithstanding potential risks related to climate change, the International Energy Agency estimates that global energy demand will continue to rise and will not peak until after 2040 and that oil and gas will continue to represent a substantial percentage of global energy use over that time. Finally, to the extent increasing concentrations of GHGs in the Earth’s atmosphere may produce climate changes that have significant physical effects, such as increased frequency and severity of storms, droughts, floods and other climatic events, such events could have a material adverse effect on our assets, particularly those located in coastal or flood prone areas.
Although it is not possible at this time to predict how legislation or new regulations that may be adopted to address GHG emissions would impact our business, any such future laws and regulations could result in increased compliance costs or additional operating restrictions, and could have a material adverse effect on our business, demand for our services, financial condition, results of operations and cash flows.
Canada
Federal Regulations. Along with 194 other countries, Canada is a signatory to the UNFCCC “Durban Platform” committing it to develop a legally binding agreement to reduce GHG emissions by 2020. Since 2004, large emitters of GHG were required to report their emissions under the Canadian Greenhouse Gas Emissions Reporting Program. Three PMC facilities meet the current 50 thousand tonnes per year (“kt/y”) reporting threshold.
Effective January 1, 2018, the federal Department of Environment and Climate Change lowered the reporting threshold for all facilities from 50 kt/y to 10 kt/y. This may result in up to four additional PMC facilities (for a total of seven) being required to prepare annual reports of their emissions; however, the associated costs with this requirement would not be material.
In October 2016, the Government of Canada implemented a pan-Canadian approach to pricing carbon pollution requiring all Canadian provinces and territories to have carbon pricing in place by 2018. The provinces and territories will have flexibility in deciding how they implement carbon pricing either by placing a direct price on carbon pollution or adopting a cap-and-trade system. The price on carbon pollution will start at $10/tonne in 2018 and rise by $10 a year to reach $50/tonne in 2022.
37
More recently, in May 2017, the federal Department of Environment and Climate Change proposed regulations designed to reduce methane emissions by up to 45% by 2025 (from 2012 levels) from oil and natural gas facilities. The scope and requirements of the proposed rule are similar to the EPA methane rules described above.
Provincial Regulations
Ontario. In February 2015, the Ontario Ministry of Environment and Climate Change issued a discussion paper that identified carbon pricing as a critical action necessary to reduce emissions of greenhouse gases. In April 2015, the Ontario government announced it would be implementing a GHG cap and trade program, which would be implemented through the Western Climate Initiative (WCI), which includes Quebec and California. Mandatory participants for the program were responsible for their emissions starting on January 1, 2017. PMC’s facility at Sarnia is considered to be a mandatory participant in the program (threshold >25,000 tonnes GHG emissions). At this time, we do not believe that participation in Ontario’s cap and trade program will have a material adverse effect on our operations.
Alberta. The Alberta Climate Change and Emissions Management Act provides a framework for managing GHG emissions by reducing specified gas emissions to 50% of 1990 levels by December 31, 2020. The Specified Gas Emitters Regulation (“SGER”) imposed GHG emissions limits on large emitters and required reductions in GHG emissions intensity. PMC has two facilities (Fort Saskatchewan Storage and Fractionation Facility and Empress VI) which do not meet the reduction obligations. As such, PMC has been required to submit compliance payments to the Climate Change Emissions Management Fund. In January 2018, the SGER has been replaced with the Carbon Competitive Incentive Regulation (CCIR) for compliance years 2018 onwards. Although various elements of the SGER are carried through into the CCIR, the CCIR has fundamental differences both in the way a facility’s regulated emissions are calculated as well as how the emission intensity reduction is measured. Compliance options under the CCIR are similar to those under the previous SGER and significant penalties may apply for non-compliance.
Water
The U.S. Federal Water Pollution Control Act, as amended, also known as the Clean Water Act (“CWA”), and analogous state and Canadian federal and provincial laws impose restrictions and strict controls regarding the discharge of pollutants into navigable waters of the United States and Canada, as well as state and provincial waters. Federal, state and provincial regulatory agencies can impose administrative, civil and/or criminal penalties for non-compliance with discharge permits or other requirements of the CWA, and can also pursue injunctive relief to enforce compliance with the CWA and analogous laws.
The U.S. Oil Pollution Act of 1990 (“OPA”) amended certain provisions of the CWA, as they relate to the release of petroleum products into navigable waters. OPA subjects owners of facilities to strict, joint and potentially unlimited liability for containment and removal costs, natural resource damages and certain other consequences of an oil spill. State and Canadian federal and provincial laws also impose requirements relating to the prevention of oil releases and the remediation of areas.
In addition, for over 35 years, the Army Corps of Engineers (the “Corps”) has authorized construction, maintenance and repair of pipelines under a streamlined nationwide permit program under the CWA known as Nationwide Permit 12 (“NWP”). The NWP program is supported by strong statutory and regulatory history and was originally approved by Congress in 1977. From time to time, environmental groups have challenged the NWP program; however, to date, federal courts have upheld the validity of NWP program under the CWA. We cannot predict whether future lawsuits will be filed to contest the validity of NWP; however, in the event that a court wholly or partially strikes down the NWP program, which we believe to be unlikely, we could face significant delays and financial costs when seeking project approvals from the Corps.
In May 2015, the EPA published a final rule that attempted to clarify federal jurisdiction under the CWA over waters of the United States. This clarification greatly expanded the definition of “waters of the United States” thus increasing the jurisdiction of the Corps. A number of legal challenges to this rule are pending. Additionally, following the issuance of a presidential executive order to review the rule, the EPA and the Corps proposed a rulemaking in June 2017 to repeal the May 2015 rule. The EPA and Corps also announced their intent to issue a new rule defining the CWA’s jurisdiction and recently finalized a stay delaying implementation of the rule for two years. Several states and environmental organizations have already announced their intent to challenge the stay and any attempt by the EPA and the Corps to rescind or revise the rule. As a result, future implementation of the May 2015 rule is uncertain at this time. To the extent any final rule on the scope of the CWA rule expands the scope of the CWA’s jurisdiction, we could face increased costs and delays with respect to obtaining permits for dredge and fill activities in wetland areas.
38
Endangered Species
New projects may require approvals and environmental analysis under federal, state and provincial laws, including the National Environmental Policy Act and the Endangered Species Act in the United States and the Species at Risk Act in Canada. The resulting costs and liabilities associated with lengthy regulatory review and approval requirements could materially and negatively affect the viability of such projects.
Other Regulations
Transportation Regulation
Our transportation activities are subject to regulation by multiple governmental agencies. Our historical operating costs reflect the recurring costs resulting from compliance with these regulations. The following is a summary of the types of transportation regulation that may impact our operations.
General Interstate Regulation in the United States. Our interstate common carrier liquids pipeline operations are subject to rate regulation by the FERC under the Interstate Commerce Act (“ICA”). The ICA requires that tariff rates for liquids pipelines, which include both crude oil pipelines and refined products pipelines, be just and reasonable and non-discriminatory.
State Regulation in the United States. Our intrastate liquids pipeline transportation activities are subject to various state laws and regulations, as well as orders of state regulatory bodies, including the Railroad Commission of Texas (“TRRC”) and the California Public Utility Commission (“CPUC”). The CPUC prohibits certain of our subsidiaries from acting as guarantors of our senior notes and credit facilities.
U.S. Energy Policy Act of 1992 and Subsequent Developments. In October 1992, Congress passed the Energy Policy Act of 1992 (“EPAct”), which, among other things, required the FERC to issue rules to establish a simplified and generally applicable ratemaking methodology for petroleum pipelines and to streamline procedures in petroleum pipeline proceedings. The FERC responded to this mandate by establishing a formulaic methodology for petroleum pipelines to change their rates within prescribed ceiling levels that are tied to an inflation index. The FERC reviews the formula every five years. Effective July 1, 2016, the annual index adjustment for the five year period ending June 30, 2021 will equal the producer price index for finished goods for the applicable year plus an adjustment factor of 1.23%. Pipelines may raise their rates to the rate ceiling level generated by application of the annual index adjustment factor each year; however, a shipper may challenge such increase if the increase in the pipeline’s rates was substantially in excess of the actual cost increases incurred by the pipeline during the relevant year. If the FERC’s annual index adjustment reduces the ceiling level such that it is lower than a pipeline’s filed rate, the pipeline must reduce its rate to conform with the lower ceiling unless doing so would reduce a rate “grandfathered” by the EPAct (see below) to below the grandfathered level. A pipeline must, as a general rule, use the indexing methodology to change its rates. The FERC, however, retained cost-of-service ratemaking, market-based rates and settlement rates as alternatives to the indexing approach that may be used in certain specified circumstances. Because the indexing methodology for the next five-year period is tied to an inflation index and is not based on pipeline-specific costs, the indexing methodology could hamper our ability to recover cost increases.
Under the EPAct, petroleum pipeline rates in effect for the 365-day period ending on the date of enactment of EPAct are deemed to be just and reasonable under the ICA, if such rates had not been subject to complaint, protest or investigation during such 365-day period. Generally, complaints against such “grandfathered” rates may only be pursued if the complainant can show that a substantial change has occurred since the enactment of EPAct in either the economic circumstances of the oil pipeline or in the nature of the services provided that were a basis for the rate. EPAct places no such limit on challenges to a provision of an oil pipeline tariff as unduly discriminatory or preferential.
Pipeline Rate Regulation in the United States. The FERC historically has not investigated rates of liquids pipelines on its own initiative when those rates have not been the subject of a protest or complaint by a shipper. The majority of our Transportation segment profit in the United States is produced by rates that are either grandfathered or set by agreement with one or more shippers. FERC issued an Advance Notice of Proposed Rulemaking on October 20, 2016 that addressed issues related to FERC’s indexing methodology and liquids pipeline reporting practices. If implemented, the proposals in this rulemaking could affect the profitability of certain liquids pipelines. On December 15, 2016, FERC issued a Notice of Inquiry regarding certain matters related to FERC’s income tax allowance policy. Parties submitted comments in response to this notice, and FERC could, after review of those comments, decide to propose changes to its current policy.
39
Canadian Regulation. Our Canadian pipeline assets are subject to regulation by the NEB and by provincial authorities. With respect to a pipeline over which it has jurisdiction, the relevant regulatory authority has the power, upon application by a third party, to determine the rates we are allowed to charge for transportation on, and set other terms of access to, such pipeline. In such circumstances, if the relevant regulatory authority determines that the applicable terms and conditions of service are not just and reasonable, the regulatory authority can impose conditions it considers appropriate.
Trucking Regulation
United States
We operate a fleet of trucks to transport crude oil and oilfield materials as a private, contract and common carrier. We are licensed to perform both intrastate and interstate motor carrier services. As a motor carrier, we are subject to certain safety regulations issued by the DOT. The trucking regulations cover, among other things: (i) driver operations, (ii) log book maintenance, (iii) truck manifest preparations, (iv) safety placard placement on the trucks and trailer vehicles, (v) drug and alcohol testing and (vi) operation and equipment safety. We are also subject to OSHA with respect to our trucking operations.
Canada
Our trucking assets in Canada are subject to regulation by both federal and provincial transportation agencies in the provinces in which they are operated. These regulatory agencies do not set freight rates, but do establish and administer rules and regulations relating to other matters including equipment, facility inspection, reporting and safety. We are licensed to operate both intra- and inter-provincially under the direction of the National Safety Code (“NSC”) that is administered by Transport Canada. Our for-hire service is primarily the transportation of crude oil, condensates and NGL. We are required under the NSC to, among other things, monitor: (i) driver operations, (ii) log book maintenance, (iii) truck manifest preparations, (iv) safety placard placement on the trucks and trailers, (v) operation and equipment safety and (vi) many other aspects of trucking operations. We are also subject to Occupational Health and Safety regulations with respect to our trucking operations.
Railcar Regulation
We own and operate a number of railcar loading and unloading facilities in the United States and Canada. In connection with these rail terminals, we own and lease a significant number of railcars. Our railcar operations are subject to the regulatory jurisdiction of the Federal Railroad Administration of the DOT, the OSHA, as well as other federal and state regulatory agencies and Canadian regulatory agencies for operations in Canada.
Railcar accidents involving trains carrying crude oil from North Dakota’s Bakken shale formation have led to increased regulatory scrutiny. PHMSA issued a safety advisory warning that Bakken crude may be more flammable than other grades of crude oil and reinforcing the requirement to properly test, characterize, classify, and where appropriate sufficiently degasify hazardous materials prior to and during transportation. PHMSA also initiated “Operation Classification”, a compliance initiative involving unannounced inspections and testing of crude oil samples to verify that offerors of the materials have properly classified, described and labeled the hazardous materials before transportation. In May 2015, PHMSA adopted a final rule that, among other things, imposes a new tank car design standard, a phase out by as early as January 2018 for older DOT-111 tank cars that are not retrofitted, and a classification and testing program for unrefined petroleum based products, including crude oil. The rule also includes new operational requirements such as speed restrictions. In December 2015, Congress passed the Fixing America’s Surface Transportation (“FAST”) Act which was subsequently signed by the President. This legislation clarified the parameters around the timeline and requirements for railcars hauling crude oil in the United States. We believe our railcar fleet is in compliance in all material respects with current standards for crude oil moved by rail.
In December 2014, the North Dakota Industrial Commission adopted new standards to improve the safety of Bakken crude oil for transport. The new standard, Commission Order 25417, was effective April 1, 2015, and requires operators/producers to condition Bakken crude oil to certain vapor pressure limits. Under the order, all Bakken crude oil produced in North Dakota will be conditioned with no exceptions. The order requires operators/producers to separate light hydrocarbons from all Bakken crude oil to be transported and prohibits the blending of light hydrocarbons back into oil supplies prior to shipment. We are not directly responsible for the conditioning or stabilization of Bakken crude oil; however, under the order, it is our responsibility to notify the State of North Dakota upon discovering that Bakken crude oil received at our rail facility exceeds the permitted vapor pressure limits.
40
Cross Border Regulation
As a result of our cross border activities, including transportation and importation of crude oil, NGL and natural gas between the United States and Canada, we are subject to a variety of legal requirements pertaining to such activities including presidential permit requirements, export/import license requirements, tariffs, Canadian and U.S. customs and taxes and requirements relating to toxic substances. U.S. legal requirements relating to these activities include regulations adopted pursuant to the Short Supply Controls of the Export Administration Act (“EAA”), the North American Free Trade Agreement (“NAFTA”) and the Toxic Substances Control Act (“TSCA”), as well as presidential permit requirements of the U.S. Department of State. In addition, the importation and exportation of natural gas from and to the United States and Canada is subject to regulation by U.S. Customs and Border Protection, U.S. Department of Energy and the NEB. Violations of these licensing, tariff and tax reporting requirements or failure to provide certifications relating to toxic substances could result in the imposition of significant administrative, civil and criminal penalties. Furthermore, the failure to comply with U.S. federal, state and local tax requirements, as well as Canadian federal and provincial tax requirements, could lead to the imposition of additional taxes, interest and penalties.
Market Anti-Manipulation Regulation
In November 2009, the Federal Trade Commission (“FTC”) issued regulations pursuant to the Energy Independence and Security Act of 2007, intended to prohibit market manipulation in the petroleum industry. Violators of the regulations face civil penalties of up to approximately $1.2 million per violation per day (adjusted annually for inflation). In July 2010, Congress passed the Dodd-Frank Act, which incorporated an expansion of the authority of the Commodity Futures Trading Commission (“CFTC”) to prohibit market manipulation in the markets regulated by the CFTC. This authority, with respect to crude oil swaps and futures contracts, is similar to the anti-manipulation authority granted to the FTC with respect to crude oil purchases and sales. In July 2011, the CFTC issued final rules to implement their new anti-manipulation authority. The rules subject violators to a civil penalty of up to the greater of approximately $1.1 million (adjusted annually for inflation) or triple the monetary gain to the person for each violation.
Natural Gas Storage Regulation
Our natural gas storage operations are subject to regulatory oversight by numerous federal, state and local regulatory agencies, many of which are authorized by statute to issue, and have issued, rules and regulations binding on the natural gas storage and pipeline industry, related businesses and market participants. The failure to comply with such laws and regulations can result in substantial penalties and fines.
The following is a summary of the kinds of regulation that may impact our natural gas storage operations. However, our unitholders should not rely on such discussion as an exhaustive review of all regulatory considerations affecting our natural gas storage operations.
Our natural gas storage facilities provide natural gas storage services in interstate commerce and are subject to comprehensive regulation by the FERC under the Natural Gas Act of 1938 (“NGA”). Pursuant to the NGA and FERC regulations, storage providers are prohibited from making or granting any undue preference or advantage to any person or subjecting any person to any undue prejudice or disadvantage or from maintaining any unreasonable difference in rates, charges, service, facilities, or in any other respect. The terms and conditions for services provided by our facilities are set forth in natural gas tariffs on file with the FERC. We have been granted market-based rate authorization for the services that our facilities provide. Market-based rate authority allows us to negotiate rates with individual customers based on market demand.
The FERC also has authority over the siting, construction, and operation of United States pipeline transportation and storage facilities and related facilities used in the transportation, storage and sale for resale of natural gas in interstate commerce, including the extension, enlargement or abandonment of such facilities. The FERC’s authority extends to maintenance of accounts and records, terms and conditions of service, acquisition and disposition of facilities, initiation and discontinuation of services, imposition of creditworthiness and credit support requirements applicable to customers and relationships among pipelines and storage companies and certain affiliates. Our natural gas storage entities are required by the FERC to post certain information daily regarding customer activity, capacity and volumes on their respective websites. Additionally, the FERC has jurisdiction to impose rules and regulations applicable to all natural gas market participants to ensure market transparency. FERC regulations require that buyers and sellers of more than a de minimis volume of natural gas report annual numbers and volumes of relevant transactions to the FERC. Our natural gas storage facilities and related marketing entities are subject to these annual reporting requirements.
41
Under the Energy Policy Act of 2005 (“EPAct 2005”) and related regulations, it is unlawful in connection with the purchase or sale of natural gas or transportation services subject to FERC jurisdiction to use or employ any device, scheme or artifice to defraud; to make any untrue statement of material fact or omit to make any such statement necessary to make the statements made not misleading; or to engage in any act or practice that operates as a fraud or deceit upon any person. EPAct 2005 gives the FERC civil penalty authority to impose penalties for certain violations of up to approximately $1.2 million per day for each violation (adjusted annually for inflation). FERC also has the authority to order disgorgement of profits from transactions deemed to violate the NGA and the EPAct 2005.
In December 2016, PHMSA issued an interim final rule (“IFR”) that establishes minimum federal standards for salt dome underground natural gas storage facilities. The IFR imposes new requirements on “downhole facilities,” including wells, wellbore tubing and casings at underground natural gas storage facilities. The IFR addresses construction, maintenance, risk management and integrity management procedures for these facilities and includes registration and reporting obligations. The IFR adopts and incorporates by reference the requirements and recommendations contained in American Petroleum Institute (“API”) Recommended Practice 1170. Existing salt dome underground natural gas storage facilities must meet the appropriate requirements and mandatory recommendations of API 1170 by January 18, 2018. However, PHMSA issued a partial stay of the IFR’s requirements in June 2017. A final rule is expected in 2018. We do not anticipate that compliance with the final rule will have a significant adverse effect on our operations.
The natural gas industry historically has been heavily regulated. New rules, orders, regulations or laws may be passed or implemented that impose additional costs, burdens or restrictions on us. We cannot give any assurance regarding the likelihood of such future rules, orders, regulations or laws or the effect they could have on our business, financial condition, and results of operations or ability to make distributions to our unitholders.
Operational Hazards and Insurance
Pipelines, terminals, trucks or other facilities or equipment may experience damage as a result of an accident, natural disaster, terrorist attack, cyber event or other event. These hazards can cause personal injury and loss of life, severe damage to and destruction of property and equipment, pollution or environmental damage and suspension of operations. We maintain various types and varying levels of insurance coverage that we consider adequate under the circumstances to cover our operations and properties, and we self-insure certain risks, including gradual pollution and named windstorm. With respect to our insurance, our policies are subject to deductibles and retention levels that we consider reasonable and not excessive. However, such insurance does not cover every potential risk that might occur, associated with operating pipelines, terminals and other facilities and equipment, including the potential loss of significant revenues and cash flows.
Since the terrorist attacks of September 11, 2001, the United States Government has issued numerous warnings that energy assets, including our nation’s pipeline infrastructure, may be future targets of terrorist organizations. These developments expose our operations and assets to increased risks. We have instituted security measures and procedures in conformity with DOT or the Transportation Safety Administration guidance. We will institute, as appropriate, additional security measures or procedures indicated by the DOT or the Transportation Safety Administration. However, there can be no assurance that these or any other security measures would protect our facilities from an attack. Any future terrorist attacks on our facilities, those of our customers and, in some cases, those of our competitors, could have a material adverse effect on our business, whether insured or not.
The occurrence of a significant event not fully insured, indemnified or reserved against, or the failure of a party to meet its indemnification obligations, could materially and adversely affect our operations and financial condition. We believe that we maintain adequate insurance coverage, although insurance will not cover many types of interruptions that might occur, will not cover amounts up to applicable deductibles and will not cover all risks associated with certain of our assets and operations. Additionally we self-insure certain risks including, gradual pollution and named windstorm. With respect to our insurance coverage, no assurance can be given that we will be able to maintain adequate insurance in the future at rates we consider reasonable. As a result, we may elect to self-insure or utilize higher deductibles in certain other insurance programs. In addition, although we believe that we have established adequate reserves and liquidity to the extent such risks are not insured, costs incurred in excess of these reserves may be higher or we may not receive insurance proceeds in a timely manner, which may potentially have a material adverse effect on our financial conditions, results of operations or cash flows.
42
Title to Properties and Rights-of-Way
Our real property holdings generally consist of: (i) parcels of land that we own in fee, (ii) surface leases and underground storage leases and (iii) easements, rights-of-way, permits, crossing agreements or licenses from landowners or governmental authorities permitting the use of certain lands for our operations. In all material respects, we believe we have satisfactory title or the right to use the sites upon which our significant facilities are located, subject to customary liens, restrictions or encumbrances. Except for challenges that we do not regard as material relative to our overall operations, we believe that we have satisfactory rights pursuant to all of our material leases, easements, rights-of-way, permits and licenses. Some of our real property rights (mainly for pipelines) may be subject to termination under agreements that provide for one or more of: periodic payments, term periods, renewal rights, revocation by the licensor or grantor and possible relocation obligations.
Employees and Labor Relations
To carry out our operations, through GP LLC or its affiliates, we employed approximately 4,850 employees at December 31, 2017. Of these employees, 158 are covered by four separate collective agreements, all of which expire in 2019. We consider employee relations to be good.
Summary of Tax Considerations
The following is a summary of material U.S. federal income tax consequences, tax considerations, and in the case of a non-U.S. holder, estate tax consequences related to the purchase, ownership and disposition of our Class A shares by a taxpayer that holds our Class A shares as a “capital asset” (generally property held for investment). This summary is based on the provisions of the Internal Revenue Code of 1986, as amended (“the Code”), U.S. Treasury regulations, administrative rulings and judicial decisions, all as in effect on the date hereof, and all of which are subject to change, possibly with retroactive effect. We have not sought any ruling from the Internal Revenue Service, or the IRS, with respect to the statements made and the conclusions reached in the following summary, and there can be no assurance that the IRS or a court will agree with such statements and conclusions.
This summary does not address all aspects of U.S. federal income and estate taxation or the tax considerations arising under the laws of any non-U.S., state, or local jurisdiction, or under U.S. federal gift tax laws. In addition, this summary does not address tax considerations applicable to investors that may be subject to special treatment under the U.S. federal income tax laws. The tax consequences of ownership of Class A shares depends in part on the owner’s individual tax circumstances. It is the responsibility of each shareholder, either individually or through a tax advisor, to investigate the legal and tax consequences, under the laws of pertinent U.S. federal, states and localities, as well as Canada and the Canadian provinces, of the shareholder’s investment in us. Further, it is the responsibility of each shareholder to file all U.S. federal, Canadian, state, provincial and local tax returns that may be required of the shareholder. Also see Item 1A. “Risk Factors—Tax Risks.”
Corporate Status
Although we are a Delaware limited partnership, we have elected to be treated as a corporation for U.S. federal income tax purposes. As a result, we are subject to tax as a corporation and distributions on our Class A shares will be treated as distributions on corporate stock for U.S. federal income tax purposes. No Schedule K-1 will be issued with respect to our Class A shares. Instead, holders of Class A shares will receive a Form 1099 from us with respect to distributions received on our Class A shares.
Consequences to U.S. Holders
The discussion in this section is addressed to holders of our Class A shares who are U.S. holders for U.S. federal income tax purposes. For purposes of this discussion, a “U.S. holder” is a beneficial owner of our Class A shares that, for U.S. federal income tax purposes, is:
• | an individual who is a citizen or resident of the United States; |
• | a corporation (or other entity treated as a corporation for U.S. federal income tax purposes) created or organized in or under the laws of the United States, any state thereof or the District of Columbia; |
• | an estate the income of which is subject to U.S. federal income tax regardless of its source; or |
43
• | a trust (i) the administration of which is subjected to the primary supervision of a U.S. court and which has one or more United States persons who have the authority to control all substantial decisions of the trust or (ii) which has made a valid election under applicable U.S. Treasury regulations to be treated as a United States person. |
Distributions
Distributions with respect to our Class A shares will constitute dividends for U.S. federal income tax purposes to the extent paid from our current or accumulated earnings and profits, as determined under U.S. federal income tax principles. To the extent that the amount of a distribution with respect to our Class A shares exceeds our current and accumulated earnings and profits, such distribution will be treated first as a tax-free return of capital to the extent of the U.S. holder’s adjusted tax basis in such Class A shares, which reduces such basis dollar-for-dollar, and thereafter as capital gain from the sale or exchange of such Class A shares. See “—Gain on Disposition of Class A Shares” below. Non-corporate holders that receive distributions on our Class A shares that are treated as dividends for U.S. federal income tax purposes generally will be subject to U.S. federal income tax at a reduced rate (currently at a maximum tax rate of 20%) provided certain holding period requirements are met.
Both AAP and PAA have made elections permitted by Section 754 of the Code. As a result, our acquisition of AAP Class A units in connection with our IPO and in connection with exchanges since the IPO by the Legacy Owners and their permitted transferees of their AAP Class A units and Class B shares for Class A shares have resulted in basis adjustments with respect to our interest in the assets of AAP (and indirectly in PAA). Such adjustments have resulted in depreciation and amortization deductions that we anticipate will offset a substantial portion of our taxable income for an extended period of time. In addition, future exchanges of AAP Class A units and Class B shares for our Class A shares will result in additional basis adjustments with respect to our interest in the assets of AAP (and indirectly in PAA). We expect to benefit from additional tax deductions resulting from those adjustments, the amount of which will vary depending on the value of the Class A shares at the time of the exchange.
We do not expect to have any earnings and profits for an extended period of time, which we estimate will include, at a minimum, each of the periods ending December 31, 2018 through 2020, and we may not have sufficient earnings and profits during future tax years for any distributions on our Class A shares to qualify as dividends for U.S. federal income tax purposes. If a distribution on our Class A shares fails to qualify as a dividend for U.S. federal income tax purposes, U.S. corporate holders would be unable to utilize the corporate dividends-received deduction with respect to such distribution.
Prospective investors in our Class A shares are encouraged to consult their tax advisors as to the tax consequences of receiving distributions on our Class A shares that do not qualify as dividends for U.S. federal income tax purposes, including, in the case of prospective corporate investors, the inability to claim the corporate dividends received deduction with respect to such distributions.
Gain on Disposition of Class A Shares
A U.S. holder generally will recognize capital gain or loss on a sale, exchange, certain redemptions, or other taxable disposition of our Class A shares equal to the difference, if any, between the amount realized upon the disposition of such Class A shares and the U.S. holder’s adjusted tax basis in those shares. A U.S. holder’s tax basis in the shares generally will be equal to the amount paid for such shares reduced (but not below zero) by distributions received on such shares that are not treated as dividends for U.S. federal income tax purposes. Such capital gain or loss generally will be long-term capital gain or loss if the U.S. holder’s holding period for the shares sold or disposed of is more than one year. Long-term capital gains of individuals generally are subject to U.S. federal income tax at a reduced rate (currently at a maximum rate of 20%). The deductibility of net capital losses is subject to limitations.
Backup Withholding and Information Reporting
Information returns generally will be filed with the IRS with respect to distributions on our Class A shares and the proceeds from a disposition of our Class A shares. U.S. holders may be subject to backup withholding on distributions with respect to our Class A shares and on the proceeds of a disposition of our Class A shares unless such U.S. holders furnish the applicable withholding agent with a taxpayer identification number, certified under penalties of perjury, and certain other information, or otherwise establish, in the manner prescribed by law, an exemption from backup withholding. Penalties apply for failure to furnish correct information and for failure to include reportable payments in income.
Backup withholding is not an additional tax. Any amounts withheld under the backup withholding rules will be creditable against a U.S. holder’s U.S. federal income tax liability, and the U.S. holder may be entitled to a refund, provided the U.S. holder timely furnishes the required information to the IRS. U.S. holders are urged to consult their own tax advisors
44
regarding the application of the backup withholding rules to their particular circumstances and the availability of, and procedure for, obtaining an exemption from backup withholding.
Consequences to Non-U.S. Holders
The discussion in this section is addressed to holders of our Class A shares who are non-U.S. holders for U.S. federal income tax purposes. For purposes of this discussion, a “non-U.S. holder” is a beneficial owner of our Class A shares that is an individual, corporation, estate or trust that is not a U.S. holder as defined above.
Distributions
Distributions with respect to our Class A shares will constitute dividends for U.S. federal income tax purposes to the extent paid from our current or accumulated earnings and profits, as determined under U.S. federal income tax principles. Subject to the withholding requirements under FATCA (as defined below) and with respect to effectively connected dividends, each of which is discussed below, any distribution treated as a dividend paid to a non-U.S. holder on our Class A shares generally will be subject to U.S. withholding tax at a rate of 30% of the gross amount of the distribution or such lower rate as may be specified by an applicable income tax treaty. To the extent a distribution exceeds our current and accumulated earnings and profits, such distribution will reduce the non-U.S. holder’s adjusted tax basis in its Class A shares (but not below zero). The amount of any such distribution in excess of the non-U.S. holder’s adjusted tax basis in its Class A shares will be treated as gain from the sale of such shares and will have the tax consequences described below under “Gain on Disposition of Class A Shares.” The rules applicable to distributions by a United States real property holding corporation (a “USRPHC”) to non-U.S. persons that exceed current and accumulated earnings and profits are not clear. As a result, it is possible that U.S. federal income tax at a rate not less than 15% (or such lower rate as may be specified by an applicable income tax treaty for distributions from a USRPHC) may be withheld from distributions received by non-U.S. holders that exceed our current and accumulated earnings and profits. To receive the benefit of a reduced treaty rate on distributions, a non-U.S. holder must provide the applicable withholding agent with an IRS Form W-8BEN or IRS Form W-8BEN-E (or other applicable or successor form) certifying qualification for the reduced rate.
Non-U.S. holders are encouraged to consult their tax advisors regarding the withholding rules applicable to distributions on our Class A shares, the requirement for claiming treaty benefits, and any procedures required to obtain a refund of any overwithheld amounts.
Distributions treated as dividends that are paid to a non-U.S. holder and are effectively connected with a trade or business conducted by the non-U.S. holder in the United States (and, if required by an applicable income tax treaty, are attributable to a permanent establishment maintained by the non-U.S. holder in the United States) generally will be taxed on a net income basis at the rates and in the manner generally applicable to United States persons (as defined under the Code). Such effectively connected dividends will not be subject to U.S. withholding tax if the non-U.S. holder satisfies certain certification requirements by providing the applicable withholding agent a properly executed IRS Form W-8ECI (or successor form) certifying eligibility for exemption. If a non-U.S. holder is a non-U.S. corporation, it may also be subject to a “branch profits tax” (at a 30% rate or such lower rate as may be specified by an applicable income tax treaty) on its effectively connected earnings and profits (as adjusted for certain items), which will include effectively connected dividends.
Gain on Disposition of Class A Shares
Subject to the discussion below under “—Additional Withholding Requirements under FATCA,” a non-U.S. holder generally will not be subject to U.S. federal income tax on any gain realized upon the sale or other disposition of our Class A shares unless:
• | the non-U.S. holder is an individual who is present in the United States for a period or periods aggregating 183 days or more during the calendar year in which the sale or disposition occurs and certain other conditions are met; |
• | the gain is effectively connected with a trade or business conducted by the non-U.S. holder in the United States (and, if required by an applicable income tax treaty, is attributable to a permanent establishment maintained by the non-U.S. holder in the United States); or |
• | our Class A shares constitute a United States real property interest by reason of our status as a USRPHC for U.S. federal income tax purposes. |
45
A non-U.S. holder described in the first bullet point above will be subject to U.S. federal income tax at a rate of 30% (or such lower rate as may be specified by an applicable income tax treaty) on the amount of such gain, which generally may be offset by U.S. source capital losses.
A non-U.S. holder whose gain is described in the second bullet point above or, subject to the exceptions described in the next paragraph, the third bullet point above, generally will be taxed on a net income basis at the rates and in the manner generally applicable to United States persons (as defined under the Code) unless an applicable income tax treaty provides otherwise. If the non-U.S. holder is a corporation whose gain is described in the second bullet point above, then such gain would also be included in its effectively connected earnings and profits (as adjusted for certain items), which may be subject to a branch profits tax (at a 30% rate or such lower rate as may be specified by an applicable income tax treaty).
Generally, a corporation is a USRPHC if the fair market value of its United States real property interests equals or exceeds 50% of the sum of the fair market value of its worldwide real property interests and its other assets used or held for use in a trade or business. We believe that we currently are, and expect to remain for the foreseeable future, a USRPHC for U.S. federal income tax purposes. However, as long as our Class A shares continue to be regularly traded on an established securities market, only a non-U.S. holder that actually or constructively owns, or owned at any time during the shorter of the five-year period ending on the date of the disposition or the non-U.S. holder’s holding period for the Class A shares, more than 5% of our Class A shares will be taxable on gain realized on the disposition of our Class A shares as a result of our status as a USRPHC. If our Class A shares were not considered to be regularly traded on an established securities market, such non-U.S. holder (regardless of the percentage of our Class A shares owned) would be subject to U.S. federal income tax on a taxable disposition of our Class A shares (as described in the preceding paragraph), and a withholding tax would apply to the gross proceeds from such disposition at the applicable withholding rate (currently at a rate of 15%).
Non-U.S. holders should consult their tax advisors with respect to the application of the foregoing rules to their ownership and disposition of our Class A shares.
U.S. Federal Estate Tax
Our Class A shares beneficially owned or treated as owned by an individual who is not a citizen or resident of the United States (as defined for U.S. federal estate tax purposes) at the time of death generally will be includable in the decedent’s gross estate for U.S. federal estate tax purposes, unless an applicable estate tax treaty provides otherwise, and therefore may be subject to U.S. federal estate tax.
Backup Withholding and Information Reporting
Generally, we must report annually to the IRS and to each non-U.S. holder the amount of dividends paid to such holder, the name and address of the recipient, and the amount, if any, of tax withheld with respect to those dividends. These information reporting requirements apply even if withholding was not required. Pursuant to tax treaties or other agreements, the IRS may make such reports available to tax authorities in the recipient’s country of residence. Payments of dividends to a non-U.S. holder generally will not be subject to backup withholding if the non-U.S. holder establishes an exemption by properly certifying its non-U.S. status on an IRS Form W-8BEN, IRS Form W-8BEN-E or other appropriate version of IRS Form W-8, provided that the withholding agent does not have actual knowledge, or reason to know, that the beneficial owner is a United States person that is not an exempt recipient.
Payments of the proceeds from a sale or other disposition by a non-U.S. holder of our Class A shares effected by or through a U.S. office of a broker generally will be subject to information reporting and backup withholding (at the applicable rate) unless the non-U.S. holder establishes an exemption by properly certifying its non-U.S. status on an IRS Form W-8BEN, IRS Form W-8BEN-E or other appropriate version of IRS Form W-8 and certain other conditions are met. Information reporting and backup withholding generally will not apply to any payment of the proceeds from a sale or other disposition of our Class A shares effected outside the United States by a non-U.S. office of a broker. However, unless such broker has documentary evidence in its records that the holder is not a United States person and certain other conditions are met, or the non-U.S. holder otherwise establishes an exemption, information reporting will apply to a payment of the proceeds of the disposition of our Class A shares effected outside the United States by such a broker if it has certain relationships within the United States.
Backup withholding is not an additional tax. Rather, the U.S. income tax liability (if any) of persons subject to backup withholding will be reduced by the amount of tax withheld. If backup withholding results in an overpayment of taxes, a refund may be obtained, provided that the required information is timely furnished to the IRS.
46
Additional Withholding Requirements under FATCA
Sections 1471 through 1474 of the Code, and the Treasury regulations and administrative guidance issued thereunder (“FATCA”), impose a 30% withholding tax on any dividends paid on our Class A shares and on the gross proceeds from a disposition of our Class A shares (if such disposition occurs after December 31, 2018), in each case if paid to a “foreign financial institution” or a “non-financial foreign entity” (each as defined in the Code) (including, in some cases, when such foreign financial institution or non-financial foreign entity is acting as an intermediary), unless (i) in the case of a foreign financial institution, such institution enters into an agreement with the U.S. government to withhold on certain payments, and to collect and provide to the U.S. tax authorities substantial information regarding U.S. account holders of such institution (which includes certain equity and debt holders of such institution, as well as certain account holders that are non-U.S. entities with U.S. owners), (ii) in the case of a non-financial foreign entity, such entity certifies that it does not have any “substantial United States owners” (as defined in the Code) or provides the applicable withholding agent with a certification identifying each direct and indirect substantial United States owner of the entity (in either case, generally on an IRS Form W-8BEN-E), or (iii) the foreign financial institution or non-financial foreign entity otherwise qualifies for an exemption from these rules and provides appropriate documentation (such as an IRS Form W-8BEN-E). Foreign financial institutions located in jurisdictions that have an intergovernmental agreement with the United States governing these rules may be subject to different rules. Under certain circumstances, a holder might be eligible for refunds or credits of such taxes.
Payments subject to withholding tax under this law generally include dividends paid on Class A shares after June 30, 2014, and gross proceeds from sales or redemptions of such Class A shares after December 31, 2016. Non-U.S. holders are encouraged to consult their tax advisors regarding the possible implications of this law.
Available Information
We make available, free of charge on our Internet website at ir.pagp.com, our annual report on Form 10-K, quarterly reports on Form 10-Q, current reports on Form 8-K, and amendments to those reports filed or furnished pursuant to Section 13(a) or 15(d) of the Securities Exchange Act of 1934 as soon as reasonably practicable after we electronically file the material with, or furnish it to, the Securities and Exchange Commission (“SEC”). The public may read and copy any materials filed by PAGP with the SEC at the SEC’s Public Reference Room at 100 F Street, NE, Room 1580, Washington, DC 20549. The public may obtain information on the operation of the Public Reference Room by calling the SEC at 1-800-SEC-0330. The SEC maintains an Internet site that contains reports, proxy and information statements, and other information regarding issuers that file electronically with the SEC at http://www.sec.gov.
Item 1A. Risk Factors
Risks Inherent in an Investment in Us
Our cash flow will be entirely dependent upon the ability of PAA to make cash distributions to AAP, and the ability of AAP to make cash distributions to us.
The source of our earnings and cash flow currently consists exclusively of cash distributions from AAP, which currently consist exclusively of cash distributions from PAA. The amount of cash that PAA will be able to distribute to its partners, including AAP, each quarter principally depends upon the amount of cash it generates from its business. For a description of certain factors that can cause fluctuations in the amount of cash that PAA generates from its business, please read “—Risks Related to PAA’s Business” and “Management’s Discussion and Analysis of Financial Condition and Results of Operations.” PAA may not have sufficient available cash each quarter to continue paying distributions at its current level or at all. If PAA reduces its per unit distribution, either because of reduced operating cash flow, higher expenses, capital requirements or otherwise, we will have less cash available for distribution and would likely be required to reduce our per share distribution. The amount of cash PAA has available for distribution depends primarily upon PAA’s cash flow, including cash flow from the release of financial reserves as well as borrowings, and is not solely a function of profitability, which will be affected by non-cash items. As a result, PAA may make cash distributions during periods when it records losses and may not make cash distributions during periods when it records profits.
Furthermore, AAP’s ability to distribute cash to us and our ability to distribute cash received from AAP to our Class A shareholders is limited by a number of factors, including:
• | our payment of any income taxes; |
• | restrictions on distributions contained in PAA’s credit facilities and any future debt agreements entered into by AAP, PAA or us; and |
47
• | reserves our general partner establishes for the proper conduct of our business, to comply with applicable law or any agreement binding on us or our subsidiaries (exclusive of PAA and its subsidiaries), which reserves are not subject to a limit pursuant to our partnership agreement. |
A material increase in amounts paid or reserved with respect to any of these factors could restrict our ability to pay quarterly distributions to our Class A shareholders.
The distributions AAP is entitled to receive may fluctuate, which may reduce cash distributions to our Class A shareholders.
At December 31, 2017, we directly and indirectly owned an approximate 55% limited partner interest in AAP, which owned 283,960,248 PAA common units. All of the cash flow we receive from AAP is derived from its ownership of these PAA common units. Because distributions on PAA common units are dependent on the amount of cash PAA generates, distributions may fluctuate based on PAA’s performance. The actual amount of cash that is available to be distributed each quarter will depend on numerous factors, some of which are beyond our control and the control of PAA. Cash distributions are dependent primarily on cash flow, including cash flow from financial reserves and working capital borrowings, and not solely on profitability, which is affected by non-cash items. Therefore, PAA’s cash distributions might be made during periods when PAA records losses and might not be made during periods when PAA record profits.
If distributions on our Class A shares are not paid with respect to any fiscal quarter, our Class A shareholders will not be entitled to receive that quarter’s payments in the future.
Our distributions to our Class A shareholders are not cumulative. Consequently, if distributions on our Class A shares are not paid with respect to any fiscal quarter, our Class A shareholders will not be entitled to receive that quarter’s payments in the future.
The amount of cash that we and PAA distribute each quarter may limit our ability to grow.
Because we distribute all of our available cash, our growth may not be as fast as the growth of businesses that reinvest their available cash to expand ongoing operations. In fact, because currently our cash flow is generated solely from distributions we receive from AAP, which are derived from AAP’s partnership interests in PAA, our growth will initially be completely dependent upon PAA. The amount of distributions received by AAP is based on PAA’s per unit distribution paid on each PAA common unit and the number of PAA common units that AAP owns. If we issue additional Class A shares or we were to incur debt or are required to pay taxes, the payment of distributions on those additional Class A shares, or interest on such debt or payment of such taxes could increase the risk that we will be unable to maintain or increase our cash distribution levels.
Restrictions in PAA’s credit facilities could limit AAP’s ability to make distributions to us, thereby limiting our ability to make distributions to our Class A shareholders.
PAA’s credit facilities contain various operating and financial restrictions and covenants. PAA’s ability to comply with these restrictions and covenants may be affected by events beyond its control, including prevailing economic, financial and industry conditions. If PAA is unable to comply with these restrictions and covenants, any indebtedness under these credit facilities may become immediately due and payable and PAA’s lenders’ commitment to make further loans under these credit facilities may terminate. PAA might not have, or be able to obtain, sufficient funds to make these accelerated payments.
For more information regarding PAA’s credit facilities, please read “Management’s Discussion and Analysis of Financial Condition and Results of Operations—Liquidity and Capital Resources.” For information regarding risks related to PAA’s credit facilities, please see “—Risks Related to PAA’s Business—The terms of PAA’s indebtedness may limit its ability to borrow additional funds or capitalize on business opportunities. In addition, PAA’s future debt level may limit its future financial and operating flexibility.”
Our shareholders do not elect or have the power to remove our general partner. The Class B shareholders own a sufficient number of shares to allow them to prevent the removal of our general partner.
Our shareholders have only limited voting rights on matters affecting our business and, therefore, limited ability to influence management’s decisions regarding our business. If our Class A shareholders are dissatisfied with the performance of our general partner, they have little ability to remove our general partner. Our general partner may only be removed by vote of the holders of at least 66 2/3% of our outstanding shares (including both Class A and Class B shares). At December 31, 2017, the Legacy Owners owned approximately 45% of our outstanding Class A and Class B shares. This ownership level enables the Legacy Owners to prevent our general partner’s removal.
48
As a result of these provisions, the price at which our shares trade may be lower because of the absence or reduction of a takeover premium in the trading price.
Our general partner may cause us to issue additional Class A shares or other equity securities, including equity securities that are senior to our Class A shares, or cause AAP to issue additional securities, in each case without shareholder approval, which may adversely affect our shareholders.
Our general partner may cause us to issue an unlimited number of additional Class A shares or other equity securities of equal rank with the Class A shares, or cause AAP to issue additional securities, in each case without shareholder approval. In addition, we may issue an unlimited number of shares that are senior to our Class A shares in right of distribution, liquidation and voting. Except for Class A shares issued in connection with the exercise of an Exchange Right, which will result in the cancellation of an equivalent number of Class B shares and therefore have no effect on the total number of outstanding shares, the issuance of additional Class A shares or our other equity securities of equal or senior rank, or the issuance by AAP of additional securities, will have the following effects:
• | each shareholder’s proportionate ownership interest in us may decrease; |
• | the amount of cash available for distribution on each Class A share may decrease; |
• | the relative voting strength of each previously outstanding Class A share may be diminished; |
• | the ratio of taxable income to distributions may increase; and |
• | the market price of the Class A shares may decline. |
If PAA’s unitholders remove PAA GP, AAP may be required to sell or exchange its indirect general partner interest and we would lose the ability to manage and control PAA.
We currently manage our investment in PAA through our membership interest in GP LLC, the general partner of AAP. PAA’s partnership agreement, however, gives unitholders of PAA the right to remove PAA GP upon the affirmative vote of holders of 66 2/3% of PAA’s outstanding units. If PAA GP withdraws as general partner in compliance with PAA’s partnership agreement or is removed as general partner of PAA where cause (as defined in PAA’s partnership agreement) does not exist and a successor general partner is elected in accordance with PAA’s partnership agreement, AAP will receive cash in exchange for its general partner interest. If PAA GP withdraws in circumstances other than those described in the preceding sentence and a successor general partner is elected in accordance with PAA’s partnership agreement, the successor general partner will purchase the general partner interest for its fair market value. If PAA GP’s interests are not purchased in accordance with the foregoing theory, they would be converted into common units based on an independent valuation. In each case, PAA GP would also lose its ability to manage PAA.
In addition, if PAA GP is removed as general partner of PAA, we would face an increased risk of being deemed an investment company. Please read “—If in the future we cease to manage and control PAA, we may be deemed to be an investment company under the Investment Company Act of 1940.”
Shareholders may not have limited liability if a court finds that shareholder action constitutes control of our business.
Under Delaware law, our shareholders could be held liable for our obligations to the same extent as a general partner if a court determined that the right or the exercise of the right by our shareholders as a group to remove or replace our general partner, to approve some amendments to the partnership agreement or to take other action under our partnership agreement constituted participation in the “control” of our business. Additionally, the limitations on the liability of holders of limited partner interests for the liabilities of a limited partnership have not been clearly established in many jurisdictions.
Furthermore, Section 17-607 of the Delaware Revised Uniform Limited Partnership Act provides that, under some circumstances, a shareholder may be liable to us for the amount of a distribution for a period of three years from the date of the distribution.
49
If in the future we cease to manage and control PAA, we may be deemed to be an investment company under the Investment Company Act of 1940.
If we cease to indirectly manage and control PAA and are deemed to be an investment company under the Investment Company Act of 1940, we would either have to register as an investment company under the Investment Company Act of 1940, obtain exemptive relief from the SEC or modify our organizational structure or our contractual rights to fall outside the definition of an investment company. Registering as an investment company could, among other things, materially limit our ability to engage in transactions with affiliates, including the purchase and sale of certain securities or other property to or from our affiliates, restrict the ability of PAA and us to borrow funds or engage in other transactions involving leverage, require us to add additional directors who are independent of us and our affiliates, and adversely affect the price of our Class A shares.
Our partnership agreement restricts the rights of shareholders owning 20% or more of our shares.
Our shareholders’ voting rights are restricted by the provision in our partnership agreement generally providing that any shares held by a person or group that owns 20% or more of any class of shares then outstanding, other than our general partner, the Legacy Owners (or certain transferees in private, non-exchange transactions), their respective affiliates and persons who acquired such shares with the prior approval of our general partner’s board of directors, cannot be voted on any matter, except that such shares constituting up to 19.9% of the total shares outstanding may be voted in the election of directors. In addition, our partnership agreement contains provisions limiting the ability of our shareholders to call meetings or to acquire information about our operations, as well as other provisions limiting our shareholders’ ability to influence the manner or direction of our management. As a result, the price at which our Class A shares will trade may be lower because of the absence or reduction of a takeover premium in the trading price.
If PAA’s general partner, which is owned by AAP, is not fully reimbursed or indemnified for obligations and liabilities it incurs in managing the business and affairs of PAA, its value, and, therefore, the value of our Class A shares, could decline.
AAP, GP LLC and their affiliates may make expenditures on behalf of PAA for which PAA GP will seek reimbursement from PAA. Under Delaware partnership law, PAA GP has unlimited liability for the obligations of PAA, such as its debts and environmental liabilities, except for those contractual obligations of PAA that are expressly made without recourse to the general partner. To the extent PAA GP incurs obligations on behalf of PAA, it is entitled to be reimbursed or indemnified by PAA. If PAA is unable or unwilling to reimburse or indemnify PAA GP, PAA GP may be required to satisfy those liabilities or obligations, which would reduce AAP’s cash flows to us.
The price of our Class A shares may be volatile, and holders of our Class A shares could lose a significant portion of their investments.
The market price of our Class A shares could be volatile, and our shareholders may not be able to resell their Class A shares at or above the price at which they purchased such Class A shares due to fluctuations in the market price of the Class A shares, including changes in price caused by factors unrelated to our operating performance or prospects or the operating performance or prospects of PAA. The following factors, among others, could affect our Class A share price:
• | PAA’s operating and financial performance and prospects and the trading price of its common units; |
• | the level of PAA’s quarterly distributions and our quarterly distributions; |
• | quarterly variations in the rate of growth of our financial indicators, such as distributable cash flow per Class A share, net income and revenues; |
• | changes in revenue or earnings and distribution estimates or publication of research reports by analysts; |
• | speculation by the press or investment community; |
• | sales of our Class A shares by our shareholders; |
• | the exercise by the Legacy Owners of their exchange rights with respect to any retained AAP units; |
• | announcements by PAA or its competitors of significant contracts, acquisitions, strategic partnerships, joint ventures, securities offerings or capital commitments; |
• | general market conditions, including conditions in financial markets; |
• | changes in accounting standards, policies, guidance, interpretations or principles; |
• | adverse changes in tax laws or regulations; |
50
• | domestic and international economic, legal and regulatory factors related to PAA’s performance; and |
• | other factors described in these “Risk Factors.” |
An increase in interest rates may cause the market price of our shares to decline.
Like all equity investments, an investment in our Class A shares is subject to certain risks. In exchange for accepting these risks, investors may expect to receive a higher rate of return than would otherwise be obtainable from lower-risk investments. Accordingly, as interest rates rise, the ability of investors to obtain higher risk-adjusted rates of return by purchasing government-backed debt securities may cause a corresponding decline in demand for riskier investments generally, including yield-based equity investments such as publicly traded limited partnership interests. Reduced demand for our Class A shares resulting from investors seeking other more favorable investment opportunities may cause the trading price of our Class A shares to decline.
Future sales of our Class A shares in the public market could reduce our Class A share price, and any additional capital raised by us through the sale of equity or convertible securities may have a dilutive effect on our shareholders.
Subject to certain limitations and exceptions, holders of AAP units may exchange their AAP units (together with a corresponding number of Class B shares) for Class A shares (on a one-for-one basis, subject to customary conversion rate adjustments for equity splits and reclassification and other similar transactions) and then sell those Class A shares. We may also issue additional Class A shares or convertible securities in subsequent public or private offerings.
We cannot predict the size of future issuances of our Class A shares or securities convertible into Class A shares or the effect, if any, that future issuances and sales of our Class A shares will have on the market price of our Class A shares. Sales of substantial amounts of our Class A shares (including shares issued in connection with an acquisition), or the perception that such sales could occur, may adversely affect prevailing market prices of our Class A shares.
The Legacy Owners hold a significant portion of the combined voting power of our Class A and Class B shares.
At December 31, 2017, through their ownership of Class B shares, the Legacy Owners held approximately 45% of the combined voting power of our Class A and Class B shares. The Legacy Owners are entitled to act separately in their own respective interests with respect to their partnership interests in us, and collectively they currently have the ability to influence (i) the outcome of all matters requiring shareholder approval, including certain mergers and other material transactions and (ii) a change in the composition of our board of directors or a change in control of our company that could deprive our shareholders of an opportunity to receive a premium for their Class A shares as part of a sale of our company. So long as the Legacy Owners continue to own a significant amount of our outstanding shares, even if such amount is less than 50%, they will continue to be able to strongly influence all matters requiring shareholder approval, regardless of whether or not other shareholders believe that such matters are in their own best interests.
A valuation allowance on our deferred tax asset could reduce our earnings.
As of December 31, 2017, we have a gross deferred tax asset of approximately $1.5 billion. GAAP requires that a valuation allowance must be established for deferred tax assets when it is more likely than not that they will not be realized. We believe that the deferred tax asset we recorded through 2017 will be realized and that a valuation allowance is not required. However, if we were to determine that a valuation allowance was appropriate for our deferred tax asset, we would be required to take an immediate charge to earnings with a corresponding reduction of partners’ capital and increase in balance sheet leverage as measured by debt-to-total capitalization. In light of the Tax Cuts and Jobs Act of 2017, a valuation allowance will not be required for any U.S. federal deferred tax asset created after 2017.
The New York Stock Exchange (“NYSE”) does not require a limited partnership like us to comply with certain of its corporate governance requirements.
Because we are a limited partnership, the NYSE does not require our general partner to have a majority of independent directors on its board of directors or to establish a compensation committee or a nominating and corporate governance committee. Accordingly, our shareholders do not have the same protections afforded to certain corporations that are subject to all of the NYSE corporate governance requirements. In addition, as a limited partnership we are not required to seek shareholder approval for issuances of Class A shares, including issuances in excess of 20% of our outstanding equity securities, or for issuances of equity to certain affiliates.
51
We may incur liability as a result of our ownership of our and PAA’s general partner.
Under Delaware law, a general partner of a limited partnership is generally liable for the debts and liabilities of the partnership for which it serves as general partner, subject to the terms of any indemnification agreements contained in the partnership agreement and except to the extent the partnership’s contracts are non-recourse to the general partner. As a result of our structure, we indirectly own and control the general partner of PAA and own a portion of our general partner’s membership interests. Our percentage ownership of our general partner is expected to increase over time as the Legacy Owners exercise their exchange rights. To the extent the indemnification provisions in the applicable partnership agreement or non-recourse provisions in our contracts are not sufficient to protect us from such liability, we may in the future incur liabilities as a result of our ownership of these general partner entities.
Risks Related to Conflicts of Interest
Our existing organizational structure and the relationships among us, PAA, our respective general partners, the Legacy Owners and affiliated entities present the potential for conflicts of interest. Moreover, additional conflicts of interest may arise in the future among us and the entities affiliated with any general partner or similar interests we acquire or among PAA and such entities.
Conflicts of interest may arise as a result of our organizational structure and the relationships among us, PAA, our respective general partners, the Legacy Owners and affiliated entities.
Our partnership agreement defines the duties of our general partner (and, by extension, its officers and directors). Our general partner’s board of directors or its conflicts committee will have authority on our behalf to resolve any conflict involving us and they have broad latitude to consider the interests of all parties to the conflict.
Conflicts of interest may arise between us and our shareholders, on the one hand, and our general partner and its owners and affiliated entities, on the other hand, or between us and our shareholders, on the one hand, and PAA and its unitholders, on the other hand. The resolution of these conflicts may not always be in our best interest or that of our shareholders.
Our partnership agreement defines our general partner’s duties to us and contains provisions that reduce the remedies available to our shareholders for actions that might otherwise be challenged as breaches of fiduciary or other duties under state law.
Our partnership agreement contains provisions that substantially reduce the standards to which our general partner would otherwise be held by state fiduciary duty law. For example, our partnership agreement:
• | permits our general partner to make a number of decisions in its individual capacity, as opposed to in its capacity as our general partner. This entitles our general partner to consider only the interests and factors that it desires, and it has no duty or obligation to give any consideration to any interest of, or factors affecting, us, the Legacy Owners, our affiliates or any limited partner. Examples include its right to vote membership interests in our general partner held by us, the exercise of its limited call right, its rights to transfer or vote any shares it may own, and its determination whether or not to consent to any merger or consolidation of our partnership or amendment to our partnership agreement; |
• | generally provides that our general partner will not have any liability to us or our shareholders for decisions made in its capacity as a general partner so long as it acted in good faith which, pursuant to our partnership agreement, requires a subjective belief that the determination, or other action or anticipated result thereof is in, or not opposed to, our best interests; |
• | generally provides that any resolution or course of action adopted by our general partner and its affiliates in respect of a conflict of interest will be permitted and deemed approved by all of our partners, and will not constitute a breach of our partnership agreement or any duty stated or implied by law or equity if the resolution or course of action in respect of such conflict of interest is: |
◦ | approved by a majority of the members of our general partner’s conflicts committee after due inquiry, based on a subjective belief that the course of action or determination that is the subject of such approval is fair and reasonable to us; |
52
◦ | approved by majority vote of our Class A shares and Class B shares (excluding Class C shares and excluding shares owned by our general partner and its affiliates, but including shares owned by the Legacy Owners) voting together as a single class; |
◦ | determined by our general partner (after due inquiry) to be on terms no less favorable to us than those generally being provided to or available from unrelated third parties; or |
◦ | determined by our general partner (after due inquiry) to be fair and reasonable to us, which determination may be made taking into account the circumstances and the relationships among the parties involved (including our short-term or long-term interests and other arrangements or relationships that could be considered favorable or advantageous to us). |
• | provides that, to the fullest extent permitted by law, in connection with any action or inaction of, or determination made by, our general partner or the conflicts committee of our general partner’s board of directors with respect to any matter relating to us, it shall be presumed that our general partner or the conflicts committee of our general partner’s board of directors acted in a manner that satisfied the contractual standards set forth in our partnership agreement, and in any proceeding brought by any limited partner or by or on behalf of such limited partner or any other limited partner or our partnership challenging any such action or inaction of, or determination made by, our general partner, the person bringing or prosecuting such proceeding shall have the burden of overcoming such presumption; and |
• | provides that our general partner and its officers and directors will not be liable for monetary damages to us, our limited partners or assignees for any acts or omissions unless there has been a final and non-appealable judgment entered by a court of competent jurisdiction determining that our general partner or those other persons acted in bad faith or engaged in fraud or willful misconduct or, in the case of a criminal matter, acted with knowledge that such person’s conduct was criminal. |
The Legacy Owners may have interests that conflict with holders of our Class A shares.
At December 31, 2017, the Legacy Owners owned approximately 45% of our outstanding Class A and Class B shares and approximately 45% of the AAP units. As a result, the Legacy Owners may have conflicting interests with holders of Class A shares. For example, the Legacy Owners may have different tax positions from us which could influence their decisions regarding whether and when to cause us to dispose of assets.
Furthermore, conflicts of interest could arise in the future between us, on the one hand, and the Legacy Owners, on the other hand, concerning among other things, potential competitive business activities or business opportunities. These conflicts of interest may not be resolved in our favor.
If we are presented with business opportunities, PAA has the first right to pursue such opportunities.
Pursuant to the administrative agreement, we have agreed to certain business opportunity arrangements to address potential conflicts with respect to business opportunities that may arise among us, our general partner, PAA, PAA GP, AAP and GP LLC. If a business opportunity is presented to us, our general partner, PAA, PAA GP, AAP or GP LLC, then PAA will have the first right to pursue such business opportunity. We have the right to pursue and/or participate in such business opportunity if invited to do so by PAA, or if PAA abandons the business opportunity and GP LLC so notifies our general partner. Accordingly, the terms of the administrative agreement limit our ability to pursue business opportunities.
Our general partner’s affiliates and the Legacy Owners may compete with us.
Our partnership agreement provides that our general partner will be restricted from engaging in any business activities other than acting as our general partner and those activities incidental to its ownership of interests in us. The restrictions contained in our general partner’s limited liability company agreement are subject to a number of exceptions. Affiliates of our general partner and the Legacy Owners will not be prohibited from engaging in other businesses or activities that might be in direct competition with us except to the extent they compete using our confidential information.
53
Our general partner has a call right that may require our shareholders to sell their Class A shares at an undesirable time or price.
If at any time more than 80% of our outstanding Class A shares and Class B shares on a combined basis (including Class A shares issuable upon the exchange of Class B shares) are owned by our general partner, the Legacy Owners (or certain transferees in private, non-exchange transactions) or their respective affiliates, our general partner will have the right (which it may assign to any of its affiliates, the Legacy Owners or us), but not the obligation, to acquire all, but not less than all, of the remaining Class A shares held by public shareholders at a price equal to the greater of (x) the current market price of such shares as of the date three days before notice of exercise of the call right is first mailed and (y) the highest price paid by our general partner, the Legacy Owners (or certain transferees in private, non-exchange transactions) or their respective affiliates for such shares during the 90 day period preceding the date such notice is first mailed. As a result, holders of our Class A shares may be required to sell such Class A shares at an undesirable time or price and may not receive any return of or on their investment. Class A shareholders may also incur a tax liability upon a sale of their Class A shares. At December 31, 2017, the Legacy Owners owned approximately 45% of the Class A shares and Class B shares on a combined basis.
Risks Related to PAA’s Business
PAA’s profitability depends on the volume of crude oil, natural gas and NGL shipped, processed, purchased, stored, fractionated and/or gathered at or through the use of its facilities, which can be negatively impacted by a variety of factors outside of its control.
PAA’s profitability could be materially impacted by a decline in the volume of crude oil, natural gas and NGL transported, gathered, stored or processed at or through its facilities. A material decrease in crude oil or natural gas production or crude oil refining, as a result of depressed commodity prices, natural decline rates attributable to crude oil and natural gas reservoirs, a decrease in exploration and development activities, supply disruptions, economic conditions or otherwise, could result in a decline in the volume of crude oil, natural gas or NGL handled by PAA’s facilities.
During the latter half of 2014 and continuing into 2016, benchmark crude oil prices declined significantly; as a result, many of the companies that produce oil and gas significantly reduced capital expenditures. Such reduced expenditure levels, coupled with high decline rates for many horizontal wells in the shale resource plays, led to production declines in many areas in the Lower 48 United States (excluding Gulf of Mexico production). Other factors that could adversely impact production include reduced capital market access, increased capital raising costs for producers or adverse governmental or regulatory action. In turn, such developments could lead to reduced throughput on PAA’s pipelines and at PAA’s other facilities, which, depending on the level of production declines, could have a material adverse effect on PAA’s business.
Also, except with respect to some of our recently constructed pipeline assets, third-party shippers generally do not have long-term contractual commitments to ship crude oil on PAA’s pipelines. A decision by a shipper to substantially reduce or cease to ship volumes of crude oil on PAA’s pipelines could cause a significant decline in its revenues.
To maintain the volumes of crude oil PAA purchases in connection with its operations, PAA must continue to contract for new supplies of crude oil to offset volumes lost because of reduced drilling activity by producers, natural declines in crude oil production from depleting wells or volumes lost to competitors. If production declines, competitors with under-utilized assets could impair PAA’s ability to secure additional supplies of crude oil.
PAA may not be able to compete effectively in its transportation, facilities and supply and logistics activities, and PAA’s business is subject to various risks associated with the general capacity overbuild of midstream energy infrastructure in some of the areas where it operates.
PAA faces competition in all aspects of its business and can give no assurances that it will be able to compete effectively against its competitors. In general, competition comes from a wide variety of participants in a wide variety of contexts, including new entrants and existing participants and in connection with day-to-day business, expansion capital projects, acquisitions and joint venture activities. Some of PAA’s competitors have capital resources many times greater than PAA’s and control greater supplies of crude oil, natural gas or NGL.
A significant driver of competition in some of the markets where PAA operates (including, for example, the Eagle Ford, Permian Basin, and Rockies/Bakken areas) stems from the rapid development of new midstream energy infrastructure capacity that was driven by the combination of (i) significant increases in oil and gas production and development in the applicable production areas, both actual and anticipated, (ii) relatively low barriers to entry and (iii) generally widespread access to relatively low cost capital. While this environment presented opportunities for PAA, many of these areas have become
54
overbuilt, resulting in an excess of midstream energy infrastructure capacity. In addition, as an established participant in some markets, PAA also faces competition from aggressive new entrants to the market who are willing to provide services at a lower rate of return in order to establish relationships and gain a foothold in the market. Current expectations for oil and gas development in many of the areas where PAA operates are not as robust as they were during the last few years. This adversely impacts both PAA’s existing assets and growth projects in such areas. PAA also faces competition for incremental volumes from shippers on third-party pipelines who overcommitted relative to their actual production or committed supplies and are now purchasing barrels on the open market and shipping them on such third-party pipelines in order to satisfy their minimum commitment levels. This puts downward pressure on PAA’s throughput and margins and, together with other adverse competitive effects, could have a significant adverse impact on PAA’s financial position, cash flows and ability to pay or increase distributions to its unitholders.
With respect to PAA’s crude oil activities, its competitors include other crude oil pipelines, the major integrated oil companies, their marketing affiliates, refiners, private equity-backed entities, and independent gatherers, brokers and marketers of widely varying sizes, financial resources and experience. PAA competes against these companies on the basis of many factors, including geographic proximity to production areas, market access, rates, terms of service, connection costs and other factors.
With respect to PAA’s natural gas storage operations, the principal elements of competition are rates, terms of service, supply and market access and flexibility of service. PAA’s natural gas storage facilities compete with several other storage providers, including regional storage facilities and utilities. Certain pipeline companies have existing storage facilities connected to their systems that compete with some of PAA’s facilities.
With regard to PAA’s NGL operations, it competes with large oil, natural gas and natural gas liquids companies that may, relative to PAA, have greater financial resources and access to supplies of natural gas and NGL. The principal elements of competition are rates, processing fees, geographic proximity to the natural gas or NGL mix, available processing and fractionation capacity, transportation alternatives and their associated costs, and access to end-user markets.
Fluctuations in supply and demand, which can be caused by a variety of factors outside of PAA’s control, can negatively affect its operating results.
Supply and demand for crude oil and other hydrocarbon products PAA handles is dependent upon a variety of factors, including price, the impact of future economic conditions, fuel conservation measures, alternative fuel adoption, governmental regulation, including climate change regulations, and technological advances in fuel economy and energy generation devices. For example, the adoption of legislation or regulatory programs to reduce emissions of greenhouse gases could increase the cost of consuming crude oil and other hydrocarbon products, thereby causing a reduction in the demand for such products. Demand also depends on the ability and willingness of shippers having access to PAA’s transportation assets to satisfy their demand by deliveries through those assets. The supply of crude oil depends on a variety of global political and economic factors, including the reliance of foreign governments on petroleum revenues. Excess global supply of crude oil may negatively impact PAA’s operating results by decreasing the price of crude oil and making production and transportation less profitable in areas PAA services.
Fluctuations in demand for crude oil, such as those caused by refinery downtime or shutdowns, can have a negative effect on PAA’s operating results. Specifically, reduced demand in an area serviced by PAA’s transportation systems will negatively affect the throughput on such systems. Although the negative impact may be mitigated or overcome by PAA’s ability to capture differentials created by demand fluctuations, this ability is dependent on location and grade of crude oil, and thus is unpredictable.
Fluctuations in demand for NGL products, whether because of general or industry specific economic conditions, new government regulations, global competition, reduced demand by consumers for products made with NGL products, increased competition from petroleum-based feedstocks due to pricing differences, mild winter weather for some NGL products, particularly propane, or other reasons, could result in a decline in the volume of NGL products PAA handles or a reduction of the fees it charges for its services. Also, increased supply of NGL products could reduce the value of NGL PAA handles and reduce the margins realized by it.
NGL and products produced from NGL also compete with products from global markets. Any reduced demand or increased supply for ethane, propane, normal butane, iso-butane or natural gasoline in the markets PAA accesses for any of the reasons stated above could adversely affect demand for the services PAA provides as well as NGL prices, which could negatively impact its operating results.
55
PAA’s results of operations are influenced by the overall forward market for crude oil, and certain market structures or the absence of pricing volatility may adversely impact its results.
Results from PAA’s Supply and Logistics segment are influenced by the overall forward market for crude oil. A contango market is favorable to commercial strategies that are associated with storage capacity as it allows a party to simultaneously purchase crude oil at current prices for storage and sell at higher prices for future delivery. Wide contango spreads combined with price structure volatility generally have a favorable impact on PAA’s results. A backwardated market (meaning that the price of crude oil for future deliveries is lower than current prices) can have a positive impact on lease gathering margins because in certain circumstances crude oil gatherers can capture a premium for prompt deliveries; however, in this environment there is little incentive to store crude oil as current prices are above future delivery prices. In either case, margins can be improved when prices are volatile. The periods between these two market structures are referred to as transition periods. If the market is in a backwardated to transitional structure, PAA’s results from its Supply and Logistics segment may be less than those generated during the more favorable contango market conditions. Additionally, a prolonged transition period or a lack of volatility in the pricing structure may further negatively impact PAA’s results. Depending on the overall duration of these transition periods, how PAA has allocated its assets to particular strategies and the time length of its crude oil purchase and sale contracts and storage agreements, these transition periods may have either an adverse or beneficial effect on its aggregate segment results. A prolonged transition from a backwardated market to a contango market, or vice versa (essentially a market that is neither in pronounced backwardation nor contango), represents the least beneficial environment for PAA’s Supply and Logistics segment.
A natural disaster, catastrophe, terrorist attack (including eco-terrorist attacks), process safety failure or other event, including pipeline or facility accidents and attacks on PAA’s electronic and computer systems, could interrupt its operations and/or result in severe personal injury, property damage and environmental damage, which could have a material adverse effect on its financial position, results of operations and cash flows.
Some of PAA’s operations involve risks of personal injury, property damage and environmental damage that could curtail its operations and otherwise materially adversely affect its cash flow. Virtually all of PAA’s operations are exposed to potential natural disasters or other natural events, including hurricanes, tornadoes, storms, floods, earthquakes, shifting soil and/or landslides. The location of some of PAA’s assets and its customers’ assets in the U.S. Gulf Coast region makes them particularly vulnerable to hurricane or tropical storm risk. PAA’s facilities and operations are also vulnerable to accidents caused by process safety failures, equipment failures or human error. In addition, since the September 11, 2001 terrorist attacks, the U.S. government has issued warnings that energy assets, specifically the nation’s pipeline infrastructure, may be future targets of terrorist organizations. Terrorists may target PAA’s physical facilities and hackers may attack its electronic and computer systems.
If one or more of PAA’s pipelines or other facilities, including electronic and computer systems, or any facilities or businesses that deliver products, supplies or services to PAA or that it relies on in order to operate its business, are damaged by severe weather or any other disaster, accident, catastrophe, terrorist attack or event, its operations could be significantly interrupted. These interruptions could involve significant damage or injury to people, property or the environment, and repairs could take from a week or less for minor incidents to six months or more for major interruptions. Any such event that interrupts the revenues generated by its operations, or which causes PAA to make significant expenditures not covered by insurance, could reduce its cash available for paying distributions to its partners and, accordingly, adversely affect its financial condition and the market price of its securities.
PAA may also suffer damage (including reputational damage) as a result of a disaster, accident, catastrophe, terrorist attack or other such event. The occurrence of such an event, or a series of such events, especially if one or more of them occurs in a highly populated or sensitive area, could negatively impact public perception of PAA’s operations and/or make it more difficult for PAA to obtain the approvals, permits, licenses or real property interests PAA needs in order to operate its assets or complete planned growth projects.
PAA may face opposition to the development or operation of its pipelines and facilities from various groups.
PAA may face opposition to the development or operation of its pipelines and facilities from environmental groups, landowners, tribal groups, local groups and other advocates. Such opposition could take many forms, including organized protests, attempts to block or sabotage PAA’s operations, intervention in regulatory or administrative proceedings involving PAA’s assets, or lawsuits or other actions designed to prevent, disrupt or delay the development or operation of PAA’s assets and business. For example, repairing PAA’s pipelines often involves securing consent from individual landowners to access their property; one or more landowners may resist PAA’s efforts to make needed repairs, which could lead to an interruption in the operation of the affected pipeline or other facility for a period of time that is significantly longer than would have otherwise
56
been the case. In addition, acts of sabotage or eco-terrorism could cause significant damage or injury to people, property or the environment or lead to extended interruptions of PAA’s operations. Any such event that interrupts the revenues generated by PAA’s operations, or which causes PAA to make significant expenditures not covered by insurance, could reduce PAA’s cash available for paying distributions to its partners and, accordingly, adversely affect PAA’s financial condition and the market price of PAA’s securities.
Recently, activists concerned about the potential effects of climate change have directed their attention towards sources of funding for fossil-fuel energy companies, which has resulted in certain financial institutions, funds and other sources of capital restricting or eliminating their investment in energy-related activities. Ultimately, this could make it more difficult to secure funding for exploration and production activities or energy infrastructure related projects, and consequently could both indirectly affect demand for PAA’s services and directly affect its ability to fund construction or other capital projects.
Cybersecurity breaches and other disruptions could compromise PAA’s information and operations, and expose it to liability, which would cause its business and reputation to suffer.
In the ordinary course of its business, PAA collects and stores sensitive data in its data centers and on its networks, including intellectual property, proprietary business information, information regarding its customers, suppliers, royalty owners and business partners, and personally identifiable information of its employees. The secure processing, maintenance and transmission of this information is critical to PAA’s operations and business strategy. Despite PAA’s security measures, its information technology and infrastructure may be vulnerable to attacks by hackers or breached due to employee error, malfeasance or other disruptions. Any such breach could compromise PAA’s networks and the information stored there could be accessed, publicly disclosed, lost or stolen. Any such access, disclosure or other loss of information could result in legal claims or proceedings, liability under laws that protect the privacy of personal information, regulatory penalties for divulging shipper information, disruption of PAA’s operations, damage to its reputation, and loss of confidence in its services, which could adversely affect its business.
PAA’s information technology infrastructure is critical to the efficient operation of its business and essential to its ability to perform day-to-day operations. Breaches in PAA’s information technology infrastructure or physical facilities, or other disruptions, could result in damage to its assets, safety incidents, damage to the environment, potential liability or the loss of contracts, and have a material adverse effect on its operations, financial position and results of operations.
Loss of PAA’s investment grade credit rating or the ability to receive open credit could negatively affect its borrowing costs, ability to purchase crude oil, NGL and natural gas supplies or to capitalize on market opportunities.
PAA believes that, because of its strategic asset base and complementary business model, PAA will continue to benefit from swings in market prices and shifts in market structure during periods of volatility in the crude oil, NGL and natural gas markets. The extent to which PAA is able to capture that benefit, however, is subject to numerous risks and uncertainties, including whether PAA will be able to maintain an attractive credit rating and continue to receive open credit from its suppliers and trade counterparties. PAA’s senior unsecured debt is currently rated as “investment grade” by Standard & Poor’s and Fitch Ratings Inc. In August 2017, Moody’s Investors Service downgraded its rating of PAA’s senior unsecured debt to a level below investment grade. A further downgrade by Standard & Poor’s or Fitch Ratings, Inc. to a level below PAA’s current ratings levels assigned by such rating agencies could increase its borrowing costs, reduce its borrowing capacity and cause its counterparties to reduce the amount of open credit we receive from them. This could negatively impact PAA’s ability to capitalize on market opportunities. For example, PAA’s ability to utilize its crude oil storage capacity for merchant activities to capture contango market opportunities is dependent upon having adequate credit facilities, both in terms of the total amount of credit facilities and the cost of such credit facilities, which enables PAA to finance the storage of the crude oil from the time it completes the purchase of the crude oil until the time it completes the sale of the crude oil. Loss of PAA’s remaining investment grade credit ratings could also adversely impact its cash flows, its ability to make distributions at its current levels and the value of its outstanding equity and debt securities.
If PAA makes acquisitions that fail to perform as anticipated, its future growth may be limited.
In evaluating acquisitions, PAA generally prepares one or more financial cases based on a number of business, industry, economic, legal, regulatory, and other assumptions applicable to the proposed transaction. Although PAA expects a reasonable basis will exist for those assumptions, the assumptions will generally involve current estimates of future conditions. Realization of many of the assumptions will be beyond PAA’s control. Moreover, the uncertainty and risk of inaccuracy associated with any financial projection will increase with the length of the forecasted period. Some acquisitions may not be accretive in the near term, and will be accretive in the long term only if PAA is able to timely and effectively integrate the underlying assets and such assets perform at or near the levels anticipated in its acquisition projections.
57
Acquisitions and divestitures involve risks that may adversely affect PAA’s business.
Any acquisition involves potential risks, including:
• | performance from the acquired businesses or assets that is below the forecasts PAA used in evaluating the acquisition; |
• | a significant increase in PAA’s indebtedness and working capital requirements; |
• | the inability to timely and effectively integrate the operations of recently acquired businesses or assets; |
• | the incurrence of substantial unforeseen environmental and other liabilities arising out of the acquired businesses or assets for which PAA is either not fully insured or indemnified, including liabilities arising from the operation of the acquired businesses or assets prior to PAA’s acquisition; |
• | risks associated with operating in lines of business that are distinct and separate from PAA’s historical operations; |
• | customer or key employee loss from the acquired businesses; and |
• | the diversion of management’s attention from other business concerns. |
Any of these factors could adversely affect PAA’s ability to achieve anticipated levels of cash flows from its acquisitions, realize other anticipated benefits and its ability to pay distributions to its partners or meet its debt service requirements.
PAA has also undertaken a strategic divestiture program involving sales of non-core assets and partial sales of other assets to strategic partners. If PAA is unable to successfully implement our divestiture program, it may be unable to fund its capital needs or may have to raise additional funding in the capital markets. In addition, in connection with PAA’s divestitures, it may agree to retain responsibility for certain liabilities that relate to its period of ownership, which could adversely impact PAA’s future financial performance.
PAA’s growth strategy requires access to new capital. Tightened capital markets or other factors that increase its cost of capital could impair its ability to grow.
PAA continuously considers potential acquisitions and opportunities for expansion capital projects. Acquisition transactions can be effected quickly, may occur at any time and may be significant in size relative to its existing assets and operations. PAA’s ability to fund its capital projects and make acquisitions depends on whether it can access the necessary financing to fund these activities. Any limitations on its access to capital or increase in the cost of that capital could significantly impair its growth strategy. PAA’s ability to maintain its targeted credit profile, including maintaining its credit ratings, could affect PAA’s cost of capital as well as its ability to execute its growth strategy. In addition, a variety of factors beyond its control could impact the availability or cost of capital, including domestic or international economic conditions, increases in key benchmark interest rates and/or credit spreads, the adoption of new or amended banking or capital market laws or regulations, the re-pricing of market risks and volatility in capital and financial markets.
In addition, PAA’s ability to achieve and maintain its target credit profile is in part dependent on its ability to consummate previously announced divestiture transactions. The closing of such transactions is not entirely within PAA’s control and depends in part on the satisfaction of closing conditions that require action or inaction by governmental authorities or others. To the extent PAA is unable to consummate such transactions, PAA may be forced to incur additional indebtedness or issue more equity than it would have otherwise preferred, which could make it harder for PAA to achieve its targeted credit profile.
Due to these factors, PAA cannot be certain that funding for its capital needs will be available from bank credit arrangements, capital markets or other sources on acceptable terms. If funding is not available when needed, or is available only on unfavorable terms, PAA may be unable to implement its development plans, enhance its existing business, complete acquisitions and construction projects, take advantage of business opportunities or respond to competitive pressures, any of which could have a material adverse effect on its revenues and results of operations.
58
PAA may not be able to fully implement or capitalize upon planned growth projects.
PAA has a number of organic growth projects that involve the construction of new midstream energy infrastructure assets or the expansion or modification of existing assets. Many of these projects involve numerous regulatory, environmental, commercial, economic, weather-related, political and legal uncertainties that are beyond its control, including the following:
• | As these projects are undertaken, required approvals, permits and licenses may not be obtained, may be delayed, may be obtained with conditions that materially alter the expected return associated with the underlying projects or may be granted and then subsequently withdrawn; |
• | PAA may face opposition to its planned growth projects from environmental groups, landowners, local groups and other advocates, including lawsuits or other actions designed to disrupt or delay PAA’s planned projects; |
• | PAA may not be able to obtain, or PAA may be significantly delayed in obtaining, all of the rights of way or other real property interests it needs to complete such projects, or the costs PAA incurs in order to obtain such rights of way or other interests may be greater than PAA anticipated; |
• | Despite the fact that PAA will expend significant amounts of capital during the construction phase of these projects, revenues associated with these organic growth projects will not materialize until the projects have been completed and placed into commercial service, and the amount of revenue generated from these projects could be significantly lower than anticipated for a variety of reasons; |
• | PAA may construct pipelines, facilities or other assets in anticipation of market demand that dissipates or market growth that never materializes; |
• | Due to unavailability or costs of materials, supplies, power, labor or equipment, including increased costs associated with any import duties or requirements to source certain supplies or materials from U.S. suppliers or manufacturers, the cost of completing these projects could turn out to be significantly higher than PAA budgeted and the time it takes to complete construction of these projects and place them into commercial service could be significantly longer than planned; and |
• | The completion or success of PAA’s projects may depend on the completion or success of third-party facilities over which PAA have no control. |
As a result of these uncertainties, the anticipated benefits associated with PAA’s capital projects may not be achieved or could be delayed. In turn, this could negatively impact PAA’s cash flow and its ability to make or increase cash distributions to its partners.
PAA is exposed to the credit risk of its customers and other counterparties it transacts within the ordinary course of its business activities.
Risks of nonpayment and nonperformance by customers or other counterparties are a significant consideration in PAA’s business and are of increased concern in the current low commodity price environment. Although PAA has credit risk management policies and procedures that are designed to mitigate and limit its exposure in this area, there can be no assurance that PAA has adequately assessed and managed the creditworthiness of its existing or future counterparties or that there will not be an unanticipated deterioration in their creditworthiness or unexpected instances of nonpayment or nonperformance, all of which could have an adverse impact on PAA’s cash flow and its ability to pay or increase its cash distributions to its partners.
PAA has a number of minimum volume commitment contracts that support pipelines in its Transportation segment. In addition, certain of the pipelines in which PAA owns a joint venture interest have minimum volume commitment contracts. Pursuant to such contracts, shippers are obligated to pay for a minimum volume of transportation service regardless of whether such volume is actually shipped (typically referred to as a deficiency payment), subject to the receipt of credits that typically expire if not used by a certain date. While such contracts provide greater revenue certainty, if the applicable shipper fails to transport the minimum required volume and is required to make a deficiency payment, under applicable accounting rules, the revenue associated with such deficiency payment may not be recognized until the applicable transportation credit has expired or has been used. Deferred revenue associated with non-performance by shippers under minimum volume contracts could be significant and could adversely affect PAA’s profitability and earnings.
In addition, in those cases in which PAA provides division order services for crude oil purchased at the wellhead, it may be responsible for distribution of proceeds to all parties. In other cases, PAA pays all of or a portion of the production proceeds to an operator who distributes these proceeds to the various interest owners. These arrangements expose PAA to
59
operator credit risk, and there can be no assurance that PAA will not experience losses in dealings with such operators and other parties.
Further, to the extent one or more of PAA’s major customers experiences financial distress or commences bankruptcy proceedings, contracts with such customers (including contracts that are supported by acreage dedications) may be subject to renegotiation or rejection under applicable provisions of the United States Bankruptcy Code. Any such renegotiation or rejection could have an adverse effect on PAA’s revenue and cash flows and its ability to make cash distributions to its unitholders.
PAA has also undertaken numerous projects that require cooperation with and performance by joint venture co-owners. In addition, in connection with various acquisition, divestiture, joint venture and other transactions, PAA often receives indemnifications from various parties for certain risks or liabilities. Nonperformance by any of these parties could result in increased costs or other adverse consequences that could decrease PAA’s earnings and returns.
PAA also relies to a significant degree on the banks that lend to it under its revolving credit facility for financial liquidity, and any failure of those banks to perform on their obligations to PAA could significantly impair its liquidity. Furthermore, nonpayment by the counterparties to PAA’s interest rate, commodity and/or foreign currency derivatives could expose it to additional interest rate, commodity price and/or foreign currency risk.
PAA’s risk policies cannot eliminate all risks. In addition, any non-compliance with its risk policies could result in significant financial losses.
Generally, it is PAA’s policy to establish a margin for crude oil or other products it purchases by selling such products for physical delivery to third-party users, or by entering into a future delivery obligation under derivative contracts. Through these transactions, PAA seeks to maintain a position that is substantially balanced between purchases on the one hand, and sales or future delivery obligations on the other hand. PAA’s policy is not to acquire and hold physical inventory or derivative products for the purpose of speculating on commodity price changes. These policies and practices cannot, however, eliminate all risks. For example, any event that disrupts PAA’s anticipated physical supply of crude oil or other products could expose it to risk of loss resulting from price changes. PAA is also exposed to basis risk when crude oil or other products are purchased against one pricing index and sold against a different index. Moreover, PAA is exposed to some risks that are not hedged, including risks on certain of its inventory, such as linefill, which must be maintained in order to transport crude oil on its pipelines. In an effort to maintain a balanced position, specifically authorized personnel can purchase or sell crude oil, refined products and NGL, up to predefined limits and authorizations. Although this activity is monitored independently by PAA’s risk management function, it exposes PAA to commodity price risks within these limits.
In addition, PAA’s operations involve the risk of non-compliance with its risk policies. PAA has taken steps within its organization to implement processes and procedures designed to detect unauthorized trading; however, PAA can provide no assurance that these steps will detect and prevent all violations of its risk policies and procedures, particularly if deception, collusion or other intentional misconduct is involved.
PAA’s operations are also subject to laws and regulations relating to protection of the environment and wildlife, operational safety, climate change and related matters that may expose it to significant costs and liabilities.
PAA’s operations involving the storage, treatment, processing, and transportation of liquid hydrocarbons, including crude oil, NGL and refined products, as well as PAA’s operations involving the storage of natural gas, are subject to stringent federal, state, and local laws and regulations governing the discharge of materials into the environment. PAA’s operations are also subject to laws and regulations relating to protection of the environment and wildlife, operational safety, climate change and related matters. Compliance with all of these laws and regulations increases its overall cost of doing business, including its capital costs to construct, maintain and upgrade equipment and facilities. For example, the adoption of legislation or regulatory programs to reduce emissions of greenhouse gases (such as carbon dioxide and methane), including cap and trade programs, could require PAA to incur increased operating costs, such as costs to purchase and operate emissions control systems, to acquire emissions allowances or comply with new regulatory or reporting requirements. In addition, with respect to our railcar operations, the adoption of new regulations designed to enhance the overall safety of crude oil and natural gas liquids transportation by rail could result in increased operating costs and potentially involve substantial capital expenditures. Also, the failure to comply with any such laws and regulations could result in the assessment of administrative, civil, and criminal penalties, the imposition of investigatory and remedial liabilities, the issuance of injunctions that may subject PAA to additional operational requirements and constraints, or claims of damages to property or persons resulting from its operations. In addition, criminal violations of certain environmental laws, or in some cases even the allegation of criminal violations, may result in the temporary suspension or outright debarment from participating in government contracts. The laws and regulations applicable to
60
PAA’s operations are subject to change and interpretation by the relevant governmental agency, including the possibility that exemptions it currently qualifies for may be modified or changed in ways that require PAA to incur significant additional compliance costs. Any such change or interpretation adverse to PAA could have a material adverse effect on its operations, revenues, expenses and profitability.
PAA has a history of incremental additions to the miles of pipelines it owns, both through acquisitions and expansion capital projects. PAA has also increased its terminal and storage capacity and operate several facilities on or near navigable waters and domestic water supplies. Although PAA has implemented programs intended to maintain the integrity of its assets (discussed below), as it acquires additional assets it is at risk for an increase in the number of releases of liquid hydrocarbons into the environment. These releases expose PAA to potentially substantial expense, including clean-up and remediation costs, fines and penalties, and third party claims for personal injury or property damage related to past or future releases. Some of these expenses could increase by amounts disproportionately higher than the relative increase in pipeline mileage and the increase in revenues associated therewith. PAA’s refined products terminal assets are also subject to significant compliance costs and liabilities. In addition, because of the increased volatility of refined products and their tendency to migrate farther and faster than crude oil when released, releases of refined products into the environment can have a more significant impact than crude oil and require significantly higher expenditures to respond and remediate. The incurrence of such expenses not covered by insurance, indemnity or reserves could materially adversely affect PAA’s results of operations.
PAA currently devotes substantial resources to comply with DOT-mandated pipeline integrity rules. The 2006 Pipeline Safety Act requires the DOT to issue regulations for certain pipelines that were not previously subject to regulation. The DOT regulations include requirements for the establishment of pipeline integrity management programs and for protection of “high consequence areas” where a pipeline leak or rupture could produce significant adverse consequences. PAA has also developed and implemented certain pipeline integrity measures that it believes go beyond regulatory mandates. See Items 1 and 2 “Business and Properties—Regulation.”
For 2018 and beyond, PAA will continue to focus on pipeline integrity management as a primary operational emphasis. In that regard, PAA has implemented programs intended to maintain the integrity of its assets, with a continued focus on risk reduction through testing, enhanced corrosion control, leak detection, and damage prevention. PAA has an internal review process pursuant to which it examines various aspects of its pipeline and gathering systems that are not subject to the DOT pipeline integrity management mandate. The purpose of this process is to review the surrounding environment, condition and operating history of these pipeline and gathering assets to determine if such assets warrant additional investment or replacement. Accordingly, in addition to potential cost increases related to unanticipated regulatory changes or injunctive remedies resulting from regulatory agency enforcement actions, PAA may elect (as a result of its own internal initiatives) to spend substantial sums to enhance the integrity of and upgrade its pipeline systems to maintain environmental compliance and, in some cases, PAA may take pipelines out of service if it believes the cost of upgrades will exceed the value of the pipelines. PAA cannot provide any assurance as to the ultimate amount or timing of future pipeline integrity expenditures but any such expenditures could be significant. See “Environmental — General” in Note 17 to our Consolidated Financial Statements. In addition, despite PAA’s pipeline and facility integrity management efforts, it can provide no assurance that its pipelines and facilities will not experience leaks or releases or that PAA will be able to fully comply with all of the federal, state and local laws and regulations applicable to the operation of PAA’s pipelines or facilities; any such leaks or releases could be material and could have a significant adverse impact on PAA’s reputation, financial position, cash flows and ability to pay or increase distributions to its unitholders.
PAA’s assets are subject to federal, state and provincial regulation. Rate regulation or a successful challenge to the rates PAA charges on its U.S. and Canadian pipeline systems may reduce the amount of cash it generates.
PAA’s U.S. interstate common carrier liquids pipelines are subject to regulation by the FERC under the ICA. The ICA requires that tariff rates and terms and conditions of services for liquids pipelines be just and reasonable and non-discriminatory. PAA is also subject to the Pipeline Safety Regulations of the DOT. PAA’s intrastate pipeline transportation activities are subject to various state laws and regulations as well as orders of regulatory bodies.
For PAA’s U.S. interstate common carrier liquids pipelines subject to FERC regulation under the ICA, shippers may protest its pipeline tariff filings or file complaints against its existing rates or complaints alleging that we are engaging in discriminating behavior. The FERC can also investigate on its own initiative. Under certain circumstances, the FERC could limit PAA’s ability to set rates based on its costs, or could order PAA to reduce its rates and could require the payment of reparations to complaining shippers for up to two years prior to the complaint. Natural gas storage facilities are subject to regulation by the FERC and certain state agencies.
61
In addition, PAA routinely monitors the public filings and proceedings of other parties with the FERC and other regulatory agencies in an effort to identify issues that could potentially impact its business. Under certain circumstances PAA may choose to intervene in such third-party proceedings in order to express its support for, or its opposition to, various issues raised by the parties to such proceedings. For example, if PAA believes that a petition filed with, or order issued by, the FERC is improper, overbroad other otherwise flawed, PAA may attempt to intervene in such proceedings for the purpose of protesting such petition or order and requesting appropriate action such as a clarification, rehearing or other remedy. Despite such efforts, PAA can provide no assurance that the FERC and other agencies that regulate its business will not issue future orders or declarations that increase its costs or otherwise adversely affect its operations.
PAA’s Canadian pipelines are subject to regulation by the NEB and by provincial authorities. Under the National Energy Board Act, the NEB could investigate the tariff rates or the terms and conditions of service relating to a jurisdictional pipeline on its own initiative upon the filing of a toll or tariff application, or upon the filing of a written complaint. If the NEB found the rates or terms of service relating to such pipeline to be unjust or unreasonable or unjustly discriminatory, the NEB could require PAA to change its rates, provide access to other shippers, or change its terms of service. A provincial authority could, on the application of a shipper or other interested party, investigate the tariff rates or PAA’s terms and conditions of service relating to its provincially-regulated proprietary pipelines. If it found PAA’s rates or terms of service to be contrary to statutory requirements, it could impose conditions it considers appropriate. A provincial authority could declare a pipeline to be a common carrier pipeline, and require PAA to change its rates, provide access to other shippers, or otherwise alter its terms of service. Any reduction in PAA’s tariff rates would result in lower revenue and cash flows.
Some of PAA’s operations cross the U.S./Canada border and are subject to cross-border regulation.
PAA’s cross border activities subject it to regulatory matters, including import and export licenses, tariffs, Canadian and U.S. customs and tax issues and toxic substance certifications. Such regulations include the Short Supply Controls of the EAA, the NAFTA and the TSCA. Violations of these licensing, tariff and tax reporting requirements could result in the imposition of significant administrative, civil and criminal penalties.
PAA’s purchases and sales of crude oil, natural gas and NGL, and hedging activities, expose it to potential regulatory risks.
The FTC, the FERC and the CFTC hold statutory authority to monitor certain segments of the physical and futures energy commodities markets. These agencies have imposed broad regulations prohibiting fraud and manipulation of such markets. With regard to PAA’s physical purchases and sales of crude oil, natural gas or NGL and any related hedging activities that it undertakes, PAA is required to observe the market-related regulations enforced by these agencies, which hold substantial enforcement authority. PAA’s purchases and sales may also be subject to certain reporting and other requirements. Additionally, to the extent that PAA enters into transportation contracts with common carrier pipelines that are subject to FERC regulation, it is subject to FERC requirements related to the use of such capacity. Any failure on PAA’s part to comply with the regulations and policies of the FERC, the FTC or the CFTC could result in the imposition of civil and criminal penalties. Failure to comply with such regulations, as interpreted and enforced, could have a material adverse effect on PAA’s business, results of operations, financial condition and its ability to make cash distributions to its unitholders.
The enactment and implementation of derivatives legislation could have an adverse impact on PAA’s ability to use derivative instruments to reduce the effect of commodity price, interest rate and other risks associated with its business and increase the working capital requirement to conduct these hedging activities.
The Dodd-Frank Wall Street Reform and Consumer Protection Act (the “Dodd-Frank Act”), enacted on July 21, 2010, established federal oversight and regulation of derivative markets and entities, such as PAA, that participate in those markets. The Dodd-Frank Act requires the CFTC and the SEC to promulgate rules and regulations implementing the Dodd-Frank Act. Although the CFTC has finalized certain regulations, others remain to be finalized or implemented and it is not possible at this time to predict when this will be accomplished.
In October 2011, the CFTC issued regulations to set position limits for certain futures and option contracts in the major energy markets. The initial position limits rule was vacated by the United States District Court for the District of Columbia in September 2012. However, in November 2013, the CFTC proposed new rules that would place limits on positions in certain core futures and equivalent swaps contracts for, or linked to, certain physical commodities, subject to exceptions for certain bona fide hedging transactions. As these new position limit rules are not yet final, the impact of those provisions on PAA is uncertain at this time.
62
The CFTC has designated certain interest rate swaps and credit default swaps for mandatory clearing, and the associated rules require PAA, in connection with covered derivative activities, to comply with clearing and trade-execution requirements or take steps to qualify for an exemption from such requirements. PAA does not utilize credit default swaps and PAA qualifies for, and expects to continue to qualify for, the end-user exception from the mandatory clearing requirements for swaps entered into to hedge its interest rate risks. Should the CFTC designate commodity derivatives for mandatory clearing, PAA would expect to qualify for an end-user exception from the mandatory clearing requirements for swaps entered into to hedge its commodity price risk. However, the majority of PAA’s financial derivative transactions used for hedging commodity price risks are currently executed and cleared over exchanges that require the posting of margin or letters of credit based on initial and variation margin requirements. Pursuant to the Dodd Frank Act, however, the CFTC or federal banking regulators may require the posting of collateral with respect to uncleared interest rate and commodity derivative transactions.
Certain banking regulators and the CFTC have adopted final rules establishing minimum margin requirements for uncleared swaps. Although PAA qualifies for the end-user exception from margin requirements for swaps entered into to hedge commercial risks, if any of PAA’s swaps do not qualify for the commercial end-user exception, a requirement to post additional cash margin or collateral could reduce PAA’s ability to execute hedges necessary to reduce commodity price exposures and protect cash flows. Posting of additional cash margin or collateral could affect PAA’s liquidity (defined as unrestricted cash on hand plus available capacity under its credit facilities) and reduce PAA’s ability to use cash for capital expenditures or other partnership purposes.
Even if PAA itself is not required to post additional cash margin or collateral for its derivative contracts, the banks and other derivatives dealers who are PAA’s contractual counterparties will be required to comply with other new requirements under the Dodd-Frank Act and related rules. The costs of such compliance may be passed on to customers such as PAA, thus decreasing the benefits to PAA of hedging transactions or reducing its profitability. In addition, implementation of the Dodd-Frank Act and related rules and regulations could reduce the overall liquidity and depth of the markets for financial and other derivatives PAA utilizes in connection with its business, which could expose PAA to additional risks or limit the opportunities PAA is able to capture by limiting the extent to which PAA is able to execute its hedging strategies.
Finally, the Dodd-Frank Act was intended, in part, to reduce the volatility of oil and gas prices, which some legislators attributed to speculative trading in derivatives and commodity instruments related to oil and gas. PAA’s financial results could be adversely affected if a consequence of the Dodd-Frank Act and implementing regulations is lower commodity prices.
The full impact of the Dodd-Frank Act and related regulatory requirements upon PAA’s business will not be known until the regulations are implemented and the market for derivatives contracts has adjusted. The Dodd-Frank Act and any new regulations could significantly increase the cost of derivative contracts, materially alter the terms of derivative contracts, reduce the availability of derivatives to protect against risks PAA encounters, reduce PAA’s ability to monetize or restructure its existing derivative contracts. If PAA reduces its use of derivatives as a result of the Dodd-Frank Act and regulations implementing the Dodd-Frank Act, PAA’s results of operations may become more volatile and its cash flows may be less predictable. Any of these consequences could have a material adverse effect on PAA, its financial condition and its results of operations.
Legislation and regulatory initiatives relating to hydraulic fracturing could reduce domestic production of crude oil and natural gas.
Hydraulic fracturing is an important and common practice that is used to stimulate production of hydrocarbons from unconventional geological formations. Recent advances in hydraulic fracturing techniques have resulted in significant increases in crude oil and natural gas production in many basins in the United States and Canada. The process involves the injection of water, sand and chemicals under pressure into the formation to fracture the surrounding rock and stimulate production, and it is typically regulated by state and provincial oil and gas commissions. We do not perform hydraulic fracturing, but many of the producers using our pipelines do. Hydraulic fracturing has been subject to increased scrutiny due to public concerns that it could result in contamination of drinking water supplies, and there have been a variety of legislative and regulatory proposals to prohibit, restrict, or more closely regulate various forms of hydraulic fracturing. Any legislation or regulatory initiatives that curtail hydraulic fracturing could reduce the production of crude oil and natural gas in the United States or Canada, and could thereby reduce demand for PAA’s transportation, terminalling and storage services as well as its supply and logistics services.
63
PAA may in the future encounter increased costs related to, and lack of availability of, insurance.
Over the last several years, as the scale and scope of PAA’s business activities has expanded, the breadth and depth of available insurance markets has contracted. As a result of these factors and other market conditions, as well as the fact that PAA has experienced several incidents over the last 3 to 5 years, premiums and deductibles for certain insurance policies have increased substantially. Accordingly, PAA can give no assurance that it will be able to maintain adequate insurance in the future at rates or on other terms PAA considers commercially reasonable. In addition, although PAA believes that it currently maintains adequate insurance coverage, insurance will not cover many types of interruptions or events that might occur and will not cover all risks associated with its operations. In addition, the proceeds of any such insurance may not be paid in a timely manner and may be insufficient if such an event were to occur. The occurrence of a significant event, the consequences of which are either not covered by insurance or not fully insured, or a significant delay in the payment of a major insurance claim, could materially and adversely affect PAA’s financial position, results of operations and cash flows.
The terms of PAA’s indebtedness may limit its ability to borrow additional funds or capitalize on business opportunities. In addition, PAA’s future debt level may limit its future financial and operating flexibility.
As of December 31, 2017, the face value of PAA’s consolidated debt outstanding was approximately $10.0 billion, consisting of approximately $9.3 billion face value of long-term debt (including senior notes and long-term commercial paper and credit facility borrowings) and approximately $0.7 billion of short-term borrowings. As of December 31, 2017, PAA had approximately $3.0 billion of liquidity available, including cash and cash equivalents and available borrowing capacity under its senior unsecured revolving credit facility, its senior secured hedged inventory facility and its senior unsecured 364-day credit facility, subject to continued covenant compliance. Lower Adjusted EBITDA could increase PAA’s leverage ratios and effectively reduce its ability to incur additional indebtedness.
The amount of PAA’s current or future indebtedness could have significant effects on its operations, including, among other things:
• | a significant portion of PAA’s cash flow will be dedicated to the payment of principal and interest on its indebtedness and may not be available for other purposes, including the payment of distributions on its units and capital expenditures; |
• | credit rating agencies may view PAA’s debt level negatively; |
• | covenants contained in PAA’s existing debt arrangements will require it to continue to meet financial tests that may adversely affect its flexibility in planning for and reacting to changes in its business; |
• | PAA’s ability to obtain additional financing for working capital, capital expenditures, acquisitions and general partnership purposes may be limited; |
• | PAA may be at a competitive disadvantage relative to similar companies that have less debt; and |
• | PAA may be more vulnerable to adverse economic and industry conditions as a result of its significant debt level. |
PAA’s credit agreements prohibit distributions on, or purchases or redemptions of, units if any default or event of default is continuing. In addition, the agreements contain various covenants limiting PAA’s ability to, among other things, incur indebtedness if certain financial ratios are not maintained, grant liens, engage in transactions with affiliates, enter into sale-leaseback transactions, and sell substantially all of its assets or enter into a merger or consolidation. PAA’s credit facilities treat a change of control as an event of default and also requires PAA to maintain a certain debt coverage ratio. PAA’s senior notes do not restrict distributions to unitholders, but a default under its credit agreements will be treated as a default under the senior notes. Please read Item 7. “Management’s Discussion and Analysis of Financial Condition and Results of Operations—Liquidity and Capital Resources—Credit Agreements, Commercial Paper Program and Indentures.”
PAA’s ability to access capital markets to raise capital on favorable terms will be affected by its debt level, its operating and financial performance, the amount of its current maturities and debt maturing in the next several years, and by prevailing market conditions. Moreover, if the rating agencies were to downgrade PAA’s credit ratings, then it could experience an increase in its borrowing costs, face difficulty accessing capital markets or incurring additional indebtedness, be unable to receive open credit from its suppliers and trade counterparties, be unable to benefit from swings in market prices and shifts in market structure during periods of volatility in the crude oil market or suffer a reduction in the market price of its common units. If PAA is unable to access the capital markets on favorable terms at the time a debt obligation becomes due in the future, it might be forced to refinance some of its debt obligations through bank credit, as opposed to long-term public debt securities or equity securities, or sell assets. The price and terms upon which PAA might receive such extensions or additional bank credit, if at all, could be more onerous than those contained in existing debt agreements. Any such arrangements could, in turn,
64
increase the risk that PAA’s leverage may adversely affect its future financial and operating flexibility and thereby impact its ability to pay cash distributions at expected rates.
Increases in interest rates could adversely affect PAA’s business and the trading price of its units.
As of December 31, 2017, the face value of PAA’s consolidated debt was approximately $10.0 billion, of which approximately $9.1 billion was at fixed interest rates and approximately $0.9 billion was at variable interest rates. PAA is exposed to market risk due to the short-term nature of its commercial paper borrowings and the floating interest rates on its credit facilities. PAA’s results of operations, cash flows and financial position could be adversely affected by significant increases in interest rates above current levels. Additionally, increases in interest rates could adversely affect PAA’s Supply and Logistics segment results by increasing interest costs associated with the storage of hedged crude oil and NGL inventory. Further, the trading price of PAA’s common units may be sensitive to changes in interest rates and any rise in interest rates could adversely impact such trading price.
Changes in currency exchange rates could adversely affect PAA’s operating results.
Because PAA is a U.S. dollar reporting company and also conducts operations in Canada, it is exposed to currency fluctuations and exchange rate risks that may adversely affect the U.S. dollar value of its earnings, cash flow and partners’ capital under applicable accounting rules. For example, as the U.S. dollar appreciates against the Canadian dollar, the U.S. dollar value of PAA’s Canadian dollar denominated earnings is reduced for U.S. reporting purposes.
An impairment of long-term assets could reduce PAA’s earnings.
At December 31, 2017, PAA had approximately $14.1 billion of net property and equipment, $872 million of linefill and base gas, $2.6 billion of goodwill, $2.8 billion of investments accounted for under the equity method of accounting and $844 million of net intangible assets capitalized on its balance sheet. GAAP requires an assessment for impairment on an annual basis or in certain circumstances, including when there is an indication that the carrying value of property and equipment may not be recoverable or a determination that it is more likely than not that a reporting unit’s carrying value is in excess of the reporting unit’s fair value. If PAA was to determine that any of its property and equipment, linefill and base gas, goodwill, intangibles or equity method investments was impaired, it could be required to take an immediate charge to earnings, which could adversely impact its operating results, with a corresponding reduction of partners’ capital and increase in balance sheet leverage as measured by debt-to-total capitalization. During the year ended December 31, 2017, PAA recognized non-cash charges of approximately $152 million related to the write-down of certain property and equipment due to asset impairments and accelerated depreciation. See Note 5 to our Consolidated Financial Statements for additional information.
Rail and marine transportation of crude oil have inherent operating risks.
PAA’s supply and logistics operations include purchasing crude oil that is carried on railcars, tankers or barges. Such cargos are at risk of being damaged or lost because of events such as derailment, marine disaster, inclement weather, mechanical failures, grounding or collision, fire, explosion, environmental accidents, piracy, terrorism and political instability. Such occurrences could result in death or injury to persons, loss of property or environmental damage, delays in the delivery of cargo, loss of revenues, termination of contracts, governmental fines, penalties or restrictions on conducting business, higher insurance rates and damage to PAA’s reputation and customer relationships generally. Although certain of these risks may be covered under PAA’s insurance program, any of these circumstances or events could increase its costs or lower its revenues.
PAA is dependent on use of third-party assets for certain of its operations.
Certain of PAA’s business activities require the use of third-party assets over which it may have little or no control. If at any time PAA’s access to these assets was denied, and if access to alternative assets could not be arranged, it could have an adverse effect on PAA’s business, results of operations and cash flow.
Non-utilization of certain assets, such as PAA’s leased railcars, could significantly reduce its profitability due to fixed costs incurred to obtain the right to use such assets.
From time to time in connection with its business, PAA may lease or otherwise secure the right to use certain third-party assets (such as railcars, trucks, barges, ships, pipeline capacity, storage capacity and other similar assets) with the expectation that the revenues it generates through the use of such assets will be greater than the fixed costs it incurs pursuant to the applicable leases or other arrangements. However, when such assets are not utilized or are under-utilized, PAA’s profitability could be negatively impacted because the revenues it earns are either non-existent or reduced, but it remains
65
obligated to continue paying any applicable fixed charges, in addition to the potential of incurring other costs attributable to the non-utilization of such assets. For example, in connection with PAA’s rail operations, it leases a significant number of its railcars, typically pursuant to multi-year leases that obligate PAA to pay the applicable lease rate without regard to utilization. If business conditions are such that a portion of PAA’s rail fleet is not utilized for any period of time due to reduced demand for the services they provide, PAA will still be obligated to pay the applicable fixed lease rate for such railcars. In addition, during the period of time that PAA is not utilizing such railcars, it will incur incremental costs associated with the cost of storing such railcars and will continue to incur costs for maintenance and upkeep. Non-utilization of its leased assets in connection with PAA’s business could have a significant negative impact on PAA’s profitability and cash flows.
Many of PAA’s assets have been in service for many years and require significant expenditures to maintain them. As a result, its maintenance or repair costs may increase in the future.
PAA’s pipelines, terminals and storage assets are generally long-lived assets, and many of them have been in service for many years. The age and condition of its assets could result in increased maintenance or repair expenditures in the future. Any significant increase in these expenditures could adversely affect PAA’s results of operations, financial position or cash flows, as well as its ability to make cash distributions to our unitholders.
PAA does not own all of the land on which its pipelines and facilities are located, which could result in disruptions to its operations.
PAA does not own all of the land on which its pipelines and facilities have been constructed, and therefore are potentially subject to more onerous terms and/or increased costs to retain necessary land use if PAA does not have valid rights-of-way or if such rights-of-way lapse or terminate. In some instances, PAA obtains the rights to construct and operate its pipelines on land owned by third parties and governmental agencies for a specific period of time. Following a decision issued in May 2017 by the Tenth Circuit Court of Appeals, tribal ownership of even a very small fractional interest in tribal land owned or at one time owned by an individual Indian landowner, bars condemnation of any interest in the allotment. Consequently, the inability to condemn such allotted lands under circumstances where existing pipeline rights-of-way may soon lapse or terminate serves as an additional potential impediment for pipeline operations. PAA cannot guarantee that it will always be able to renew existing rights-of-way or obtain new rights-of-way on favorable terms or without experiencing significant delays and costs. Any loss of rights with respect to real property, through PAA’s inability to renew right-of-way contracts or otherwise, could have a material adverse effect on its business, results of operations, and financial position.
For various operating and commercial reasons, PAA may not be able to perform all of its obligations under its contracts, which could lead to increased costs and negatively impact its financial results.
Various operational and commercial factors could result in an inability on PAA’s part to satisfy its contractual commitments and obligations. For example, in connection with the provision of firm storage services and hub services to its natural gas storage customers, PAA enters into contracts that obligate PAA to honor its customers’ requests to inject gas into its storage facilities, withdraw gas from its facilities and wheel gas through its facilities, in each case subject to volume, timing and other limitations set forth in such contracts. The following factors could adversely impact PAA’s ability to perform its obligations under these contracts:
• | a failure on the part of PAA’s storage facilities to perform as it expects them to, whether due to malfunction of equipment or facilities or realization of other operational risks; |
• | the operating pressure of PAA’s storage facilities (affected in varying degree, depending on the type of storage cavern, by total volume of working and base gas, and temperature); |
• | a variety of commercial decisions PAA makes from time to time in connection with the management and operation of its storage facilities. Examples include, without limitation, decisions with respect to matters such as (i) the aggregate amount of commitments PAA is willing to make with respect to wheeling, injection, and withdrawal services, which could exceed PAA’s capabilities at any given time for various reasons, (ii) the timing of scheduled and unplanned maintenance or repairs, which can impact equipment availability and capacity, (iii) the schedule for and rate at which PAA conducts opportunistic leaching activities at its facilities in connection with the expansion of existing salt caverns, which can impact the amount of storage capacity PAA has available to satisfy its customers’ requests, (iv) the timing and aggregate volume of any base gas park and/or loan transactions PAA consummates, which can directly affect the operating pressure of PAA’s storage facilities and (v) the amount of compression capacity and other gas handling equipment that PAA installs at its facilities to support gas wheeling, injection and withdrawal activities; and |
66
• | adverse operating conditions due to hurricanes, extreme weather events or conditions, and operational problems or issues with third-party pipelines, storage or production facilities. |
Although PAA manages and monitors all of these various factors in connection with the ongoing operation of its natural gas storage facilities with the goal of performing all of its contractual commitments and obligations and optimizing revenue, one or more of the above factors may adversely impact PAA’s ability to satisfy its injection, withdrawal or wheeling obligations under its storage contracts. In such event, PAA may be liable to its customers for losses or damages they suffer and/or PAA may need to incur costs or expenses in order to permit it to satisfy its obligations.
If PAA fails to obtain materials in the quantity and the quality it needs, and at commercially acceptable prices, PAA’s results of operations, financial condition and cash flows could be materially and adversely affected.
PAA’s business requires access to steel and other materials to construct and maintain new and existing pipelines and facilities. If PAA experiences a shortage in the supply of these materials or is unable to source sufficient quantities of high quality materials at acceptable prices and in a timely manner, it could materially and adversely affect PAA’s ability to construct new infrastructure and maintain its existing assets.
In addition, some of the materials used in PAA’s business are imported. A material increase in the import duties on the materials PAA relies on to construct and maintain its pipelines could make it more difficult or costly to obtain such materials and could delay completion of PAA’s infrastructure projects. A material increase in PAA’s costs of construction and maintenance or any significant delays in its ability to complete its infrastructure projects could have a material adverse effect on PAA’s financial position, results of operations and cash flows.
Cost reimbursements due to PAA’s general partner may be substantial and will reduce PAA’s cash available for distribution to its unitholders.
Prior to making any distribution on its common units, PAA will reimburse PAA GP and its affiliates, including officers and directors of its general partner, for all expenses incurred on PAA’s behalf. In addition, PAA is required to pay all direct and indirect expenses of the Plains Entities, other than income taxes of any of the PAGP Entities. The reimbursement of expenses and the payment of fees and expenses could adversely affect PAA’s ability to make distributions. PAA GP has sole discretion to determine the amount of these expenses. In addition, PAA GP and its affiliates may provide PAA with services for which PAA will be charged reasonable fees as determined by its general partner.
Cash distributions are not guaranteed and may fluctuate with PAA’s performance and the establishment of financial reserves.
Because distributions on PAA’s common units are dependent on the amount of cash it generates, distributions may fluctuate based on PAA’s performance, which will result in fluctuations in the amount of distributions ultimately received by AAP. The actual amount of cash that is available to be distributed each quarter will depend on numerous factors, some of which are beyond PAA’s control and the control of PAA GP. Cash distributions are dependent primarily on cash flow, including cash flow from financial reserves and working capital borrowings, and not solely on profitability, which is affected by non-cash items. Therefore, cash distributions might be made during periods when PAA records losses and might not be made during periods when it records profits.
PAA’s preferred units have rights, preferences and privileges that are not held by, and are preferential to the rights of, holders of PAA’s common units.
PAA’s Series A preferred units and PAA’s Series B preferred units (together, “PAA’s preferred units”), rank senior to all of PAA’s other classes or series of equity securities with respect to distribution rights and rights upon liquidation. These preferences could adversely affect the market price for PAA’s common units, or could make it more difficult for PAA to sell common units in the future.
In addition, distributions on the PAA preferred units accrue and are cumulative, at the rate of 8% per annum with respect to PAA’s Series A preferred units and 6.125% with respect to PAA’s Series B preferred units on the original issue price. PAA’s Series A preferred units are convertible into PAA common units by the holders of such units or by PAA in certain circumstances. PAA’s Series B preferred units are not convertible into PAA common units, but are redeemable by PAA in certain circumstances. PAA’s obligation to pay distributions on its preferred units, or on the common units issued following the conversion of PAA’s Series A preferred units, could impact its liquidity and reduce the amount of cash flow available for working capital, capital expenditures, growth opportunities, acquisitions, and other general partnership purposes. PAA’s
67
obligations to the holders of preferred units could also limit its ability to obtain additional financing or increase our borrowing costs, which could have an adverse effect on PAA’s financial condition.
Tax Risks
As our only cash-generating assets consist of our partnership interest in AAP and its related direct and indirect interests in PAA, our tax risks are primarily derivative of the tax risks associated with an investment in PAA.
The tax treatment of PAA depends on its status as a partnership for U.S. federal income tax purposes, as well as it not being subject to a material amount of additional entity-level taxation by individual states. If the Internal Revenue Service (“IRS”) were to treat PAA as a corporation for federal income tax purposes or if PAA becomes subject to additional amounts of entity-level taxation for state or foreign tax purposes, it would reduce the amount of cash available for distribution to us and increase the portion of our distributions treated as taxable dividends.
At December 31, 2017, we owned an approximate 55% limited partner interest in AAP, which directly owned a limited partner interest in PAA through its ownership of 283,960,248 PAA common units (approximately 36% of PAA’s total Series A preferred units and common units). Accordingly, the value of our indirect investment in PAA, as well as the anticipated after-tax economic benefit of an investment in our Class A shares, depends largely on PAA being treated as a partnership for federal income tax purposes, which requires that 90% or more of PAA’s gross income for every taxable year consist of qualifying income, as defined in Section 7704 of the Internal Revenue Code of 1986, as amended (the “Code”). The IRS issued final regulations on January 24, 2017, that are effective January 19, 2017, that define the activities that generate qualifying income from exploration, development, mining or production, processing, refining, transportation, and marketing of minerals or natural resources within the meaning of Section 7704. These regulations are intended to provide regulatory guidance on whether income from activities with respect to minerals or natural resources is qualifying income. Based on PAA’s current operations, PAA believes that it is treated as a partnership rather than a corporation for such purposes; however, a change in PAA’s business could cause it to be treated as a corporation for federal income tax purposes.
Current law may change, causing PAA to be treated as a corporation for federal income tax purposes or otherwise subjecting PAA to additional entity-level taxation. In addition, several states are evaluating ways to subject partnerships to entity-level taxation through the imposition of state income, franchise and other forms of taxation. For example, PAA is subject to entity-level tax on the portion of its income apportioned to Texas in the prior year. Imposition of any similar taxes on PAA in additional states will reduce its cash available for distribution to its partners.
If PAA were treated as a corporation for federal income tax purposes, it would pay federal income tax on its taxable income at the corporate tax rate and would likely pay state income taxes at varying rates. Distributions to PAA’s partners, including AAP, would generally be taxed again as corporate distributions, and no income, gains, losses or deductions would flow through to PAA’s partners. Because a tax would be imposed upon PAA as a corporation, its cash available for distribution would be substantially reduced. Therefore, treatment of PAA as a corporation would result in a material reduction in the anticipated cash flow and after-tax return to us, likely causing a substantial reduction in the value of our Class A shares.
PAA’s partnership agreement provides that if a law is enacted or existing law is modified or interpreted in a manner that subjects PAA to taxation as a corporation or otherwise subjects PAA to entity-level taxation for federal income tax purposes, PAA’s minimum quarterly distribution and target distribution amounts will be adjusted downward by a percentage that is based on the applicable entity-level tax rate, including both federal and state tax burdens. Although it is impossible to make an accurate assessment of the impact without the specific details of any such new law or modification, in such event, it is likely the amount of distributions AAP receives from PAA and our resulting cash flows could be reduced substantially, which would adversely affect our ability to pay distributions to our shareholders.
Moreover, if PAA were treated as a corporation we would not be entitled to the deductions associated with our initial acquisition of interests in AAP or subsequent exchanges of retained AAP interests and Class B shares for our Class A shares. As a result, if PAA were treated as a corporation, (i) our liability for taxes would likely be higher, further reducing our cash available for distribution, and (ii) a greater portion of the cash we are able to distribute will be treated as a taxable dividend.
68
The tax treatment of publicly traded partnerships such as PAA could be subject to potential legislative, judicial or administrative changes and differing interpretations, possibly on a retroactive basis.
Legislative changes to the IRS audit rules, starting with partnership tax years beginning after 2017, will allow the IRS to assess and collect tax on audit adjustments at the partnership level as opposed to the partner level unless the partnership makes an election or exercises certain alternatives. Changes were also made to limit partner representation in the event of an audit.
Pursuant to the Bipartisan Budget Act of 2015, for tax years beginning after December 31, 2017, if the IRS makes audit adjustments to PAA’s income tax returns, it (and some states) may assess and collect any taxes (including any applicable penalties and interest) resulting from such audit adjustments directly from PAA. To the extent possible under the new rules, PAA’s general partner may elect to either pay the taxes (including any applicable penalties and interest) directly to the IRS or, if PAA is eligible, issue a revised information statement to each unitholder and former unitholder with respect to an audited and adjusted return. Although PAA’s general partner may elect to have PAA’s unitholders and former unitholders take such audit adjustment into account and pay any resulting taxes (including applicable penalties or interest) in accordance with their interests in PAA during the tax year under audit, there can be no assurance that such election will be practical, permissible or effective in all circumstances. As a result, PAA’s current unitholders, including us, may bear some or all of the tax liability resulting from such audit adjustment, even if such unitholders did not own units in PAA during the tax year under audit. If, as a result of any such audit adjustment, PAA is required to make payments of taxes, penalties and interest, PAA’s cash available for distribution to its unitholders might be substantially reduced. These rules are not applicable for tax years beginning on or prior to December 31, 2017.
Also for partnership tax years beginning after 2017, the Act eliminated rights that certain individual partners might previously have had in the audit process by now restricting it to a single “partnership representative”
The present U.S. federal income tax treatment of publicly traded partnerships, including PAA, may be modified by administrative, legislative or judicial changes or differing interpretations at any time. For example, the Obama administration’s budget proposal for fiscal year 2016 recommended that certain publicly traded partnerships earning income from activities related to fossil fuels be taxed as corporations beginning in 2021. From time to time, members of Congress propose and consider such substantive changes to the existing federal income tax laws that affect publicly traded partnerships. Although there is no current legislative proposal, a prior legislative proposal would have eliminated the qualifying income exception to the treatment of all publicly-traded partnerships as corporations upon which PAA relies for its treatment as a partnership for U.S. federal income tax purposes.
Any modification to the U.S. federal income tax laws may be applied retroactively and could make it more difficult or impossible for PAA to meet the exception for certain publicly traded partnerships to be treated as partnerships for U.S. federal income tax purposes. We are unable to predict whether any of these changes or other proposals will ultimately be enacted. Any such changes could negatively impact the value of our indirect investment in PAA.
Taxable gain or loss on the sale of our Class A shares could be more or less than expected.
If a holder sells our Class A shares, the holder will recognize a gain or loss equal to the difference between the amount realized and the holder’s tax basis in those Class A shares. To the extent that the amount of our distributions exceeds our current and accumulated earnings and profits, the distributions will be treated as a tax free return of capital and will reduce a holder’s tax basis in the Class A shares. We did not have any earnings and profits in 2017 and we do not expect to have any earnings and profits for an extended period of time, which we estimate will include, at a minimum, each of the periods ending December 31, 2018 through 2020. Because our distributions in excess of our earnings and profits decrease a holder’s tax basis in Class A shares, such excess distributions will result in a corresponding increase in the amount of gain, or a corresponding decrease in the amount of loss, recognized by the holder upon the sale of the Class A shares. Please read “Summary of Tax Considerations—Gain on Disposition of Class A Shares” for a further discussion of the foregoing.
Our current tax treatment may change, which could affect the value of our Class A shares or reduce our cash available for distribution.
Our expectation that tax deductions associated with our initial and subsequent acquisitions of interests in AAP (as a result of the exercise by Legacy Owners of their exchange rights) will offset all of our current taxable income for an extended period of time, and thus result in our distributions not constituting taxable dividends for an extended period of time, is based on current law with respect to the amortization of basis adjustments associated with our acquisition of interests in AAP. Changes in federal income tax law relating to such tax treatment could result in (i) our being subject to additional taxation at the entity
69
level with the result that we would have less cash available for distribution, and (ii) a greater portion of our distributions being treated as taxable dividends. Moreover, we are subject to tax in numerous jurisdictions. Changes in current law in these jurisdictions, particularly relating to the treatment of deductions attributable to acquisitions of interests in AAP, could result in our being subject to additional taxation at the entity level with the result that we would have less cash available for distribution.
Any decrease in our Class A share price could adversely affect our amount of cash available for distribution.
Changes in certain market conditions may cause our Class A share price to decrease. If our Legacy Owners exchange their retained interests in AAP and Class B shares in us for our Class A shares at a point in time when our Class A share price is below the price at which Class A shares were sold in our initial public offering or in any subsequent exchange, the ratio of our income tax deductions to gross income would decline. This decline could result in our being subject to tax sooner than expected, our tax liability being greater than expected, or a greater portion of our distributions being treated as taxable dividends.
The IRS Forms 1099-DIV that our shareholders receive from their brokers may over-report dividend income with respect to our shares for U.S. federal income tax purposes, and failure to report dividend income in a manner consistent with the IRS Forms 1099-DIV may cause the IRS to assert audit adjustments to a shareholder’s U.S. federal income tax return. For non-U.S. holders of our shares, brokers or other withholding agents may overwithhold taxes from dividends paid, in which case a shareholder generally would have to timely file a U.S. tax return or an appropriate claim for refund in order to claim a refund of the overwithheld taxes.
Distributions we pay with respect to our shares will constitute “dividends” for U.S. federal income tax purposes only to the extent of our current and accumulated earnings and profits. Distributions we pay in excess of our earnings and profits will not be treated as “dividends” for U.S. federal income tax purposes; instead, they will be treated first as a tax-free return of capital to the extent of a shareholder’s tax basis in their shares and then as capital gain realized on the sale or exchange of such shares. We may be unable to timely determine the portion of our distributions that is a “dividend” for U.S. federal income tax purposes.
For a U.S. holder of our shares, the IRS Forms 1099-DIV may not be consistent with our determination of the amount that constitutes a “dividend” for U.S. federal income tax purposes or a shareholder may receive a corrected IRS Form 1099-DIV (and may therefore need to file an amended federal, state or local income tax return). We will attempt to timely notify our shareholders of available information to assist with income tax reporting (such as posting the correct information on our website). However, the information that we provide to our shareholders may be inconsistent with the amounts reported by a broker on IRS Form 1099-DIV, and the IRS may disagree with any such information and may make audit adjustments to a shareholder’s tax return.
For a non-U.S. holder of our shares, “dividends” for U.S. federal income tax purposes will be subject to withholding of U.S. federal income tax at a 30% rate (or such lower rate as may be specified by an applicable income tax treaty) unless the dividends are effectively connected with conduct of a U.S. trade or business. Please read “Summary of Tax Considerations—Consequences to Non-U.S. Holders.” In the event that we are unable to timely determine the portion of our distributions that is a “dividend” for U.S. federal income tax purposes, or a shareholder’s broker or withholding agent chooses to withhold taxes from distributions in a manner inconsistent with our determination of the amount that constitutes a “dividend” for such purposes, a shareholder’s broker or other withholding agent may overwithhold taxes from distributions paid. In such a case, a shareholder generally would have to timely file a U.S. tax return or an appropriate claim for refund in order to obtain a refund of the overwithheld tax.
Item 1B. Unresolved Staff Comments
None.
Item 3. Legal Proceedings
The information required by this item is included in Note 17 to our Consolidated Financial Statements, and is incorporated herein by reference thereto.
Item 4. Mine Safety Disclosures
Not applicable.
70
PART II
Item 5. Market for Registrant’s Shares, Related Shareholder Matters and Issuer Purchases of Equity Securities
Market Information, Holders and Dividends
Our Class A shares are listed and traded on the New York Stock Exchange under the symbol “PAGP.” In connection with the closing of the Simplification Transactions on November 15, 2016, as discussed further below, we effected a reverse split of our Class A and Class B shares, in each case, at a ratio of approximately 1-for-2.663. The effect of this reverse split has been retroactively applied to all share and per share amounts presented in this Form 10-K.
As of February 12, 2018, the closing market price for our Class A shares was $21.88 per share and there were approximately 20,100 record holders and beneficial owners (held in street name). As of February 12, 2018, there were 157,011,139 Class A shares outstanding.
The following table sets forth high and low sales prices for our Class A shares and the cash distributions declared per Class A share:
Class A Share Price Range | Cash Distributions (1) | ||||||||||
High | Low | ||||||||||
2017 | |||||||||||
4th Quarter | $ | 22.31 | $ | 18.98 | $ | 0.30 | |||||
3rd Quarter | $ | 27.75 | $ | 19.60 | $ | 0.30 | |||||
2nd Quarter | $ | 31.77 | $ | 23.33 | $ | 0.55 | |||||
1st Quarter | $ | 35.58 | $ | 30.38 | $ | 0.55 | |||||
2016 | |||||||||||
4th Quarter | $ | 36.59 | $ | 28.84 | $ | 0.55 | |||||
3rd Quarter | $ | 35.10 | $ | 25.59 | $ | 0.55 | |||||
2nd Quarter | $ | 30.70 | $ | 20.98 | $ | 0.62 | |||||
1st Quarter | $ | 25.80 | $ | 12.57 | $ | 0.62 | |||||
(1) | Cash distributions pertaining to the quarter presented. These distributions were declared and paid in the following calendar quarter. See the “Cash Distribution Policy” section below for a discussion of our policy regarding distribution payments. |
Our Class A shares are also used as a form of compensation to our directors. See Note 16 to our Consolidated Financial Statements for additional information regarding our equity-indexed compensation plans.
Our Class B shares and Class C shares are not listed or traded on any stock exchange.
71
Performance Graph
The following graph compares the total unitholder return performance of our Class A shares with the performance of: (i) the Standard & Poor’s 500 Stock Index (“S&P 500”) and (ii) the Alerian MLP Index. The Alerian MLP Index is a composite of the 50 most prominent energy master limited partnerships that provides investors with a comprehensive benchmark for this asset class. The graph assumes that $100 was invested in our Class A shares and each comparison index beginning on October 16, 2013, the date our Class A shares began trading on the NYSE, and that all distributions were reinvested on a quarterly basis.
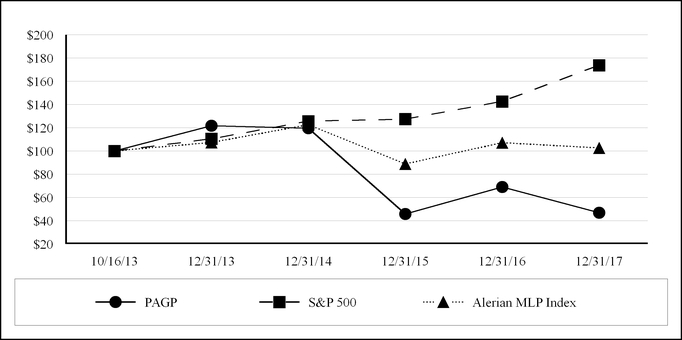
10/16/2013 | 12/31/2013 | 12/31/2014 | 12/31/2015 | 12/31/2016 | 12/31/2017 | ||||||||||||||||||
PAGP | $ | 100.00 | $ | 121.68 | $ | 119.57 | $ | 45.73 | $ | 68.94 | $ | 46.79 | |||||||||||
S&P 500 | $ | 100.00 | $ | 110.51 | $ | 125.64 | $ | 127.38 | $ | 142.61 | $ | 173.75 | |||||||||||
Alerian MLP Index | $ | 100.00 | $ | 107.29 | $ | 122.55 | $ | 88.72 | $ | 107.00 | $ | 102.64 | |||||||||||
This information shall not be deemed to be “soliciting material” or to be “filed” with the Commission or subject to Regulation 14A or 14C under the Exchange Act, other than as provided in Item 201(e) of Regulation S-K, or to the liabilities of Section 18 of the Exchange Act, and shall not be deemed to be incorporated by reference into any filing under the Securities Act of 1933, as amended, or the Exchange Act, except to the extent that we specifically request that such information be treated as soliciting material or specifically incorporate it by reference into a filing under the Securities Act or the Exchange Act.
Recent Sales of Unregistered Securities
In connection with our IPO and related transactions, the Legacy Owners acquired the following interests (collectively, the “Stapled Interests”): (i) AAP units representing an economic limited partner interest in AAP; (ii) general partner units representing a non-economic membership interest in our general partner; and (iii) Class B shares representing a non-economic limited partner interest in us. The Legacy Owners and any permitted transferees of their Stapled Interests have the right to exchange (the “Exchange Right”) all or a portion of such Stapled Interests for an equivalent number of Class A shares. In connection with the exercise of the Exchange Right, the Stapled Interests are transferred to us and the applicable Class B shares are canceled. Although we issue one Class A share for each Stapled Interest that is exchanged, we also receive one AAP unit and one general partner unit. As a result, the exercise by Legacy Owners of the Exchange Right is not dilutive. During the three months ended December 31, 2017, certain Legacy Owners or their permitted transferees exercised the Exchange Right, which resulted in the issuance of 1,567,946 Class A shares. The issuance of Class A shares in connection with the exercise of the Exchange Rights was exempt from the registration requirements of the Securities Act of 1933, as amended, pursuant to Section 4(a)(2) thereof.
72
Issuer Purchases of Equity Securities
None.
Simplification Transactions
On November 15, 2016, the Plains Entities closed a series of transactions and executed several organizational and ancillary documents (the “Simplification Transactions”) intended to simplify our capital structure, better align the interests of our stakeholders and improve our overall credit profile. See Note 1 to our Consolidated Financial Statements for further discussion of the Simplification Transactions.
Cash Distribution Policy
Our partnership agreement requires that, within 55 days following the end of each quarter, we distribute all of our available cash to Class A shareholders of record on the applicable record date. Available cash generally means, for any quarter ending prior to liquidation, all cash on hand at the date of determination of available cash for the distribution in respect of such quarter (including expected distributions from AAP in respect of such quarter), less the amount of cash reserves established by our general partner, which will not be subject to a cap, to:
• | comply with applicable law or any agreement binding upon us or our subsidiaries (exclusive of PAA and its subsidiaries); |
• | provide funds for distributions to shareholders; |
• | provide for future capital expenditures, debt service and other credit needs as well as any federal, state, provincial or other income tax that may affect us in the future; or |
• | provide for the proper conduct of our business, including with respect to the matters described under our partnership agreement. |
Our available cash also includes cash on hand resulting from borrowings, if any, made after the end of the quarter.
Our principal sources of cash flow are derived from our indirect investment in PAA. As of December 31, 2017, we directly and indirectly owned approximately 156.1 million AAP units, which represented an approximate 55% limited partner interest in AAP. AAP currently receives all of its cash flows from its ownership of PAA common units. Therefore, our cash flow and resulting ability to make distributions will be completely dependent upon the ability of PAA to make distributions to AAP in respect of the common units AAP owns. As of December 31, 2017, AAP owned approximately 284.0 million PAA common units. The actual amount of cash that PAA, and correspondingly AAP, will have available for distribution will primarily depend on the amount of cash PAA generates from its operations. Also, under the terms of the agreements governing PAA’s debt, PAA is prohibited from declaring or paying any distribution to unitholders if a default or event of default (as defined in such agreements) exists. No such default has occurred. See Item 7. “Management’s Discussion and Analysis of Financial Condition and Results of Operations—Liquidity and Capital Resources—Credit Agreements, Commercial Paper Program and Indentures.”
Our general partner owns a non-economic general partner interest in us, which does not entitle it to receive cash distributions.
73
Item 6. Selected Financial Data
The following tables set forth selected historical consolidated financial and other information for PAGP as of the dates and for the periods indicated. The selected consolidated statements of operations data for the year ended December 31, 2013 include results attributable to PAGP from October 21, 2013 (the date of closing PAGP’s IPO) through December 31, 2013, plus results for GP LLC, the predecessor entity to PAGP, prior to October 21, 2013.
The financial information below was derived from the audited financial statements of PAGP (and GP LLC as discussed above) as of December 31, 2017, 2016, 2015, 2014 and 2013 and for the years then ended.
The selected financial data should be read in conjunction with Item 7. “Management’s Discussion and Analysis of Financial Condition and Results of Operations,” and the Consolidated Financial Statements, including the notes thereto, in Item 8. “Financial Statements and Supplementary Data.”
Year Ended December 31, | |||||||||||||||||||
2017 | 2016 | 2015 | 2014 | 2013 | |||||||||||||||
(in millions, except per share data and volumes) | |||||||||||||||||||
Statement of operations data: | |||||||||||||||||||
Total revenues | $ | 26,223 | $ | 20,182 | $ | 23,152 | $ | 43,464 | $ | 42,249 | |||||||||
Operating income | $ | 1,147 | $ | 990 | $ | 1,258 | $ | 1,791 | $ | 1,734 | |||||||||
Net income/(loss) (1) | $ | (41 | ) | $ | 660 | $ | 809 | $ | 1,328 | $ | 1,374 | ||||||||
Net income/(loss) attributable to PAGP (1) | $ | (731 | ) | $ | 94 | $ | 118 | $ | 70 | $ | 15 | ||||||||
Per share data: | |||||||||||||||||||
Basic net income/(loss) per Class A share (1) (2) | $ | (5.03 | ) | $ | 0.94 | $ | 1.41 | $ | 1.28 | $ | 0.25 | ||||||||
Diluted net income/(loss) per Class A share (1) (2) | $ | (5.03 | ) | $ | 0.94 | $ | 1.41 | $ | 1.25 | $ | 0.25 | ||||||||
Declared distributions per Class A share (3) | $ | 1.95 | $ | 2.40 | $ | 2.35 | $ | 1.78 | N/A | ||||||||||
Balance sheet data (at end of period): | |||||||||||||||||||
Property and equipment, net | $ | 14,105 | $ | 13,890 | $ | 13,493 | $ | 12,292 | $ | 10,841 | |||||||||
Total assets | $ | 26,753 | $ | 26,103 | $ | 24,142 | $ | 23,923 | $ | 21,411 | |||||||||
Long-term debt | $ | 9,183 | $ | 10,124 | $ | 10,932 | $ | 9,238 | $ | 7,188 | |||||||||
Total debt | $ | 9,920 | $ | 11,839 | $ | 11,931 | $ | 10,525 | $ | 8,301 | |||||||||
Partners’ capital: | |||||||||||||||||||
Partners’ capital (excluding Noncontrolling interests) | $ | 1,695 | $ | 1,737 | $ | 1,762 | $ | 1,657 | $ | 1,035 | |||||||||
Noncontrolling interests | $ | 10,663 | $ | 8,970 | $ | 7,472 | $ | 7,724 | $ | 7,244 | |||||||||
Total Partners’ capital | $ | 12,358 | $ | 10,707 | $ | 9,234 | $ | 9,381 | $ | 8,279 | |||||||||
Other data: | |||||||||||||||||||
Net cash provided by operating activities (4) | $ | 2,496 | $ | 718 | $ | 1,347 | $ | 2,007 | $ | 1,966 | |||||||||
Net cash used in investing activities | $ | (1,570 | ) | $ | (1,273 | ) | $ | (2,530 | ) | $ | (3,296 | ) | $ | (1,653 | ) | ||||
Net cash provided by/(used in) financing activities (4) | $ | (940 | ) | $ | 571 | $ | 813 | $ | 1,653 | $ | (292 | ) | |||||||
Capital expenditures: | |||||||||||||||||||
Acquisition capital | $ | 1,323 | $ | 289 | $ | 105 | $ | 1,099 | $ | 19 | |||||||||
Expansion capital | $ | 1,135 | $ | 1,405 | $ | 2,170 | $ | 2,026 | $ | 1,622 | |||||||||
Maintenance capital | $ | 247 | $ | 186 | $ | 220 | $ | 224 | $ | 176 | |||||||||
74
Year Ended December 31, | |||||||||||||||||||
2017 | 2016 | 2015 | 2014 | 2013 | |||||||||||||||
Volumes (5) (6) | |||||||||||||||||||
Transportation segment (average daily volumes in thousands of barrels per day): | |||||||||||||||||||
Tariff activities | 5,083 | 4,523 | 4,340 | 3,952 | 3,595 | ||||||||||||||
Trucking | 103 | 114 | 113 | 127 | 117 | ||||||||||||||
Transportation segment total volumes | 5,186 | 4,637 | 4,453 | 4,079 | 3,712 | ||||||||||||||
Facilities segment: | |||||||||||||||||||
Liquids storage (average monthly capacity in millions of barrels) | 112 | 107 | 100 | 95 | 94 | ||||||||||||||
Natural gas storage (average monthly working capacity in billions of cubic feet) | 82 | 97 | 97 | 97 | 96 | ||||||||||||||
NGL fractionation (average volumes in thousands of barrels per day) | 126 | 115 | 103 | 96 | 96 | ||||||||||||||
Facilities segment total volumes (average monthly volumes in millions of barrels) | 130 | 127 | 120 | 114 | 113 | ||||||||||||||
Supply and Logistics segment (average daily volumes in thousands of barrels per day): | |||||||||||||||||||
Crude oil lease gathering purchases | 945 | 894 | 943 | 949 | 859 | ||||||||||||||
NGL sales | 274 | 259 | 223 | 208 | 215 | ||||||||||||||
Supply and Logistics segment total volumes | 1,219 | 1,153 | 1,166 | 1,157 | 1,074 | ||||||||||||||
(1) | During the year ended December 31, 2017, we recorded approximately $823 million related to the re-measurement of our existing deferred tax asset as a result of the reduction in our effective tax rate from the change in corporate federal income tax rate from 35% to 21%. See Note 13 to our Consolidated Financial Statements for additional information. |
(2) | Basic and diluted net income per Class A share for 2013 were calculated based on net income attributable to PAGP for the period following the closing of our initial public offering on October 21, 2013 and basic weighted average Class A shares outstanding weighted for the same period. |
(3) | Represents cash distributions declared and paid per share during the year presented. See Note 11 to our Consolidated Financial Statements for further discussion regarding our distributions. |
(4) | Amounts for 2013 through 2016 have been retroactively restated to reflect the impact of our adoption of Accounting Standards Update 2016-09, Compensation—Stock Compensation (Topic 718): Improvements to Employee Share-Based Payment Accounting. See Note 2 to our Consolidated Financial Statements for additional information. |
(5) | Average volumes are calculated as the total volumes (attributable to our interest) for the year divided by the number of days or months in the year. |
(6) | Facilities segment total is calculated as the sum of: (i) liquids storage capacity; (ii) natural gas storage working capacity divided by 6 to account for the 6:1 thousand cubic feet (“mcf”) of natural gas to crude British thermal unit (“Btu”) equivalent ratio and further divided by 1,000 to convert to monthly volumes in millions; and (iii) NGL fractionation volumes multiplied by the number of days in the year and divided by the number of months in the year. |
75
Item 7. Management’s Discussion and Analysis of Financial Condition and Results of Operations
Introduction
The following discussion is intended to provide investors with an understanding of our financial condition and results of our operations and should be read in conjunction with our historical consolidated financial statements and accompanying notes. Unless the context otherwise requires, references to “we,” “us,” “our,” and “PAGP” are intended to mean the business and operations of PAGP and its consolidated subsidiaries.
Our discussion and analysis includes the following:
• | Executive Summary |
• | Acquisitions and Capital Projects |
• | Critical Accounting Policies and Estimates |
• | Recent Accounting Pronouncements |
• | Results of Operations |
• | Outlook |
• | Liquidity and Capital Resources |
Executive Summary
Company Overview
We are a Delaware limited partnership formed on July 17, 2013 that has elected to be taxed as a corporation for United States federal income tax purposes. As of December 31, 2017, our sole assets consisted of (i) a 100% managing member interest in GP LLC, an entity that has also elected to be taxed as a corporation for United States federal income tax purposes and (ii) an approximate 55% limited partner interest in AAP through our direct ownership of approximately 155.1 million AAP units and indirect ownership of approximately 1.0 million AAP units through GP LLC. GP LLC is a Delaware limited liability company that also holds the non-economic general partner interest in AAP. AAP is a Delaware limited partnership that, as of December 31, 2017, directly owned a limited partner interest in PAA through its ownership of approximately 284.0 million PAA common units (approximately 36% of PAA Common Unit Equivalents). AAP is the sole member of PAA GP, a Delaware limited liability company that directly holds the non-economic general partner interest in PAA.
PAA owns and operates midstream energy infrastructure and provides logistics services primarily for crude oil, NGL and natural gas. PAA owns an extensive network of pipeline transportation, terminalling, storage, and gathering assets in key crude oil and NGL producing basins and transportation corridors and at major market hubs in the United States and Canada.
Overview of Operating Results, Capital Investments and Other Significant Activities
The crude oil market downturn over the last three years created a challenging environment for the overall midstream industry. See the “Outlook—Market Overview and Outlook” section below for further discussion. We recognized a net loss of $41 million in 2017 as compared to net income of $660 million recognized in 2016. The net loss in 2017 was primarily due to $823 million of deferred income tax expense recognized in the fourth quarter of 2017 related to the re-measurement of PAGP’s deferred tax asset following the signing into law of the Tax Cuts and Jobs Act of 2017. The remaining variance between the comparative periods also reflects:
• | Contributions from our recently completed acquisitions and capital expansion projects and favorable variances from the mark-to-market impact of certain derivative instruments, partially offset by less favorable crude oil and NGL market conditions and margin compression caused by continued competition; |
• | Higher depreciation and amortization expense largely driven by (i) an increase in impairments, accelerated depreciation and canceled projects during the 2017 period, (ii) additional depreciation associated with acquisitions and the completion of various capital expansion projects and (iii) smaller net gains from non-core assets sales and joint venture formations recognized in the 2017 period; |
76
• | Higher interest expense primarily related to financing activities associated with our capital investments; |
• | A net loss of $40 million recognized in 2017 related to the early redemption of senior notes; and |
• | The mark-to-market of the Preferred Distribution Rate Reset Option, resulting in a smaller gain recognized in 2017 compared to the gain recognized in the 2016 period. |
See further discussion of our segment operating results in the “—Results of Operations—Analysis of Operating Segments” and “—Other Income and Expenses” sections below.
We invested approximately $1.1 billion in midstream infrastructure projects during 2017, which included the newly constructed Diamond and STACK extension joint venture pipelines, both of which were placed in service in late 2017, as well as capacity expansions for the Cactus I and BridgeTex pipelines. Additionally, we completed $1.3 billion of acquisitions in 2017, which primarily consisted of pipeline assets in the Permian Basin. See the “—Acquisitions and Capital Projects” section below for additional information.
To fund such capital activities, we sold (i) PAGP and PAA equity securities for net proceeds of approximately $1.7 billion (all of which occurred in the first four months of the year) and (ii) 800,000 newly issued PAA Series B preferred units in October 2017 for net proceeds of $788 million. In addition, we continued to advance our divestiture program, completing non-core asset sales during 2017 for cash proceeds of approximately $1.1 billion, and progressed the PAA Leverage Reduction Plan, as discussed below. We also paid approximately $1.4 billion of cash distributions to our Class A Shareholders and noncontrolling interests during 2017.
PAA Leverage Reduction Plan
On August 25, 2017, PAA announced that it was implementing an action plan to strengthen its balance sheet, reduce leverage, enhance its distribution coverage, minimize new issuances of common equity and position PAA for future distribution growth. The action plan (“PAA Leverage Reduction Plan”), which was endorsed by our Board, included PAA’s intent to achieve certain objectives. As of early 2018, the status of PAA’s efforts to implement the PAA Leverage Reduction Plan is summarized below:
PAA Leverage Reduction Plan Objective | PAA Status | |
Reset PAA’s annualized distribution per common unit to $1.20, starting with the third-quarter distribution payable in November 2017, which would reduce PAA’s annual distribution outflow by approximately $725 million per year, representing approximately $1.1 billion over 6 quarters | The reduction of PAA’s annualized distribution per common unit to $1.20 commenced with the November 2017 distribution, resulting in an improved distribution coverage ratio | |
Complete pending and/or in-progress non-core/strategic asset sales totaling approximately $700 million | Since announcing the PAA Leverage Reduction Plan in August 2017, PAA has closed on approximately $700 million of non-core/strategic asset sales | |
Reduce hedged crude oil and NGL inventory volumes and related debt by approximately $300 million (based on current prices) relative to June 30, 2017 levels | As of December 31, 2017, PAA reduced its hedged inventory debt by approximately $375 million relative to June 30, 2017 levels | |
Fund second-half 2017 and full-year 2018 expansion capital program with a combination of non-convertible, perpetual preferred PAA equity (target of approximately $600 million) and asset sales proceeds | In October 2017, PAA completed an $800 million offering ($200 million over target) of 6.125% non-convertible Series B preferred units for net proceeds of $788 million | |
Apply retained cash flows and remaining asset sales proceeds to steadily reduce PAA’s total debt as of June 30, 2017 by approximately $1.4 billion through March 31, 2019 | In December 2017, PAA retired two series of senior notes totaling $950 million that would otherwise have matured in 2018 and 2019 | |
77
There can be no assurance that the objectives of PAA’s Leverage Reduction Plan remaining to be achieved will be achieved, or that they will be achieved within PAA’s desired time frame or in the desired amounts. Achievement of such objectives is subject to risks and uncertainties, many of which are outside of PAA’s control. Please see “Risk Factors—Risks Related to PAA’s Business.”
Acquisitions and Capital Projects
We completed a number of acquisitions and capital projects in 2017, 2016 and 2015 that have impacted our results of operations. The following table summarizes our expenditures for acquisition capital, expansion capital and maintenance capital for such periods (in millions):
Year Ended December 31, | ||||||||||||
2017 | 2016 | 2015 | ||||||||||
Acquisition capital (1) | $ | 1,323 | $ | 289 | $ | 105 | ||||||
Expansion capital (1) (2) | 1,135 | 1,405 | 2,170 | |||||||||
Maintenance capital (2) | 247 | 186 | 220 | |||||||||
$ | 2,705 | $ | 1,880 | $ | 2,495 | |||||||
(1) | Acquisitions of initial investments or additional interests in unconsolidated entities are included in “Acquisition capital.” Subsequent contributions to unconsolidated entities related to expansion projects of such entities are recognized in “Expansion capital.” We account for our investments in such entities under the equity method of accounting. |
(2) | Capital expenditures made to expand the existing operating and/or earnings capacity of our assets are classified as “Expansion capital.” Capital expenditures for the replacement and/or refurbishment of partially or fully depreciated assets in order to maintain the operating and/or earnings capacity of our existing assets are classified as “Maintenance capital.” |
Acquisitions
Acquisitions are financed using a combination of equity and debt, including borrowings under the PAA commercial paper program or credit facilities and the issuance of PAA senior notes. In addition, we use proceeds from sales of non-core assets for funding. Businesses acquired impact our results of operations commencing on the closing date of each acquisition. Our acquisition, divestiture and capital expansion activities are discussed further in “—Liquidity and Capital Resources.” Information regarding acquisitions completed in 2017, 2016 and 2015 is set forth in the table below (in millions):
Acquisition | Effective Date | Acquisition Price | Operating Segment | |||||
Alpha Crude Connector Gathering System | February 2017 | $ | 1,215 | Transportation | ||||
Other | Various | 108 | Transportation and Facilities | |||||
2017 Total | $ | 1,323 | ||||||
Western Canada NGL Assets | August 2016 | $ | 204 | Transportation and Facilities | ||||
Other | Various | 85 | Transportation | |||||
2016 Total | $ | 289 | ||||||
2015 Total | Various | $ | 105 | Transportation and Facilities | ||||
78
Expansion Capital Projects
Our 2017 projects primarily included the construction and expansion of pipeline systems and storage and terminal facilities. The following table summarizes our 2017, 2016 and 2015 projects (in millions):
Projects | 2017 | 2016 | 2015 | |||||||||
Diamond Pipeline (1) | $ | 318 | $ | 104 | $ | 6 | ||||||
Permian Basin Area Projects (2) | 243 | 200 | 470 | |||||||||
Fort Saskatchewan Facility Projects (2) | 83 | 200 | 272 | |||||||||
STACK JV Projects (3) | 60 | 12 | — | |||||||||
Cushing Terminal Expansions (2) | 37 | 62 | 39 | |||||||||
Eagle Ford JV Projects (2) (4) | 27 | 29 | 93 | |||||||||
St. James Terminal Expansions (2) | 13 | 51 | 45 | |||||||||
Red River Pipeline | 10 | 306 | 143 | |||||||||
Cactus I Pipeline | 10 | 26 | 134 | |||||||||
Saddlehorn Pipeline (5) | 5 | 108 | 103 | |||||||||
Other Projects | 329 | 307 | 865 | |||||||||
Total | $ | 1,135 | $ | 1,405 | $ | 2,170 | ||||||
(1) | Represents contributions related to our 50% interest in Diamond Pipeline LLC. |
(2) | These projects will continue into 2018. See “—Liquidity and Capital Resources—Acquisitions, Investments, Expansion Capital Expenditures and Divestitures —2018 Capital Projects.” |
(3) | Represents contributions related to our 50% interest in STACK Pipeline LLC. |
(4) | Represents contributions related to our 50% interest in Eagle Ford Pipeline and our 50% interest in Eagle Ford Terminals. |
(5) | Represents contributions related to our 40% interest in Saddlehorn Pipeline. |
Our recent expansion capital programs were primarily driven by investment in midstream infrastructure projects to address the need for additional takeaway capacity in regions impacted by the increase in crude oil and liquids-rich gas production growth in North America, as well as the long-term needs of both the upstream and downstream sectors of the crude oil space. Substantially all of the expansion capital spent in the years presented was invested in our fee-based Transportation and Facilities segments.
We currently expect to spend approximately $1.4 billion for expansion capital in 2018. See “—Liquidity and Capital Resources—Acquisitions, Investments, Expansion Capital Expenditures and Divestitures —2018 Capital Projects” and “Outlook—Market Overview and Outlook” for additional information.
Divestitures
During 2016, we initiated a program to evaluate potential sales of non-core assets and/or sales of partial interests in assets to strategic joint venture partners to optimize our asset portfolio and strengthen our balance sheet and leverage metrics. Information regarding non-core asset sales completed since 2016 is set forth in the table below (in millions):
Year | Operating Segment | Proceeds | |||||
2017 Total | Transportation and Facilities | $ | 1,083 | ||||
2016 Total | Transportation and Facilities | $ | 569 | (1) | |||
(1) | Net of amounts paid for the remaining interest in a non-core pipeline that was subsequently sold. |
79
Critical Accounting Policies and Estimates
The preparation of financial statements in conformity with GAAP and rules and regulations of the SEC requires us to make estimates and assumptions that affect the reported amounts of assets and liabilities, as well as the disclosure of contingent assets and liabilities, at the date of the financial statements. Such estimates and assumptions also affect the reported amounts of revenues and expenses during the reporting period. Although we believe these estimates are reasonable, actual results could differ from these estimates. On a regular basis, we evaluate our assumptions, judgments and estimates. We also discuss our critical accounting policies and estimates with the Audit Committee of the Board of Directors.
We believe that the assumptions, judgments and estimates involved in the accounting for our (i) estimated fair value of assets and liabilities acquired and identification of associated goodwill and intangible assets, (ii) impairment assessments of goodwill and intangible assets, (iii) fair value of derivatives, (iv) accruals and contingent liabilities, (v) equity-indexed compensation plan accruals, (vi) property and equipment, depreciation and amortization expense, asset retirement obligations and impairments, (vii) allowance for doubtful accounts and (viii) inventory valuations have the greatest potential impact on our Consolidated Financial Statements. These areas are key components of our results of operations and are based on complex rules which require us to make judgments and estimates. Therefore, we consider these to be our critical accounting policies and estimates, which are discussed further as follows. For further information on all of our significant accounting policies, see Note 2 to our Consolidated Financial Statements.
Fair Value of Assets and Liabilities Acquired and Identification of Associated Goodwill and Intangible Assets. In accordance with FASB guidance regarding business combinations, with each acquisition, we allocate the cost of the acquired entity to the assets and liabilities assumed based on their estimated fair values at the date of acquisition. If the initial accounting for the business combination is incomplete when the combination occurs, an estimate will be recorded. With exception to acquisitions of equity method investments, we also expense the transaction costs as incurred in connection with each acquisition. In addition, we are required to recognize intangible assets separately from goodwill.
Determining the fair value of assets and liabilities acquired, as well as intangible assets that relate to such items as customer relationships, acreage dedications and other contracts, involves professional judgment and is ultimately based on acquisition models and management’s assessment of the value of the assets acquired and, to the extent available, third party assessments.
Impairment Assessments of Goodwill and Intangible Assets. Goodwill and intangible assets with indefinite lives are not amortized but are instead periodically assessed for impairment. See Note 7 to our Consolidated Financial Statements for further discussion of goodwill. Intangible assets with finite lives are amortized over their estimated useful life as determined by management.
Impairment testing entails estimating future net cash flows relating to the business, based on management’s estimate of future revenues, future cash flows and market conditions including pricing, demand, competition, operating costs and other factors, such as weighted average cost of capital. Uncertainties associated with these estimates include changes in production decline rates, production interruptions, fluctuations in refinery capacity or product slates, economic obsolescence factors in the area and potential future sources of cash flow. We cannot provide assurance that actual amounts will not vary significantly from estimated amounts. Resolutions of these uncertainties have resulted, and in the future may result, in impairments that impact our results of operations and financial condition.
Fair Value of Derivatives. The fair value of a derivative at a particular period end does not reflect the end results of a particular transaction, and will most likely not reflect the gain or loss at the conclusion of a transaction. We reflect estimates for these items based on our internal records and information from third parties. We have commodity derivatives, interest rate derivatives and foreign currency derivatives that are accounted for as assets and liabilities at fair value in our Consolidated Balance Sheets. The valuations of our derivatives that are exchange traded are based on market prices on the applicable exchange on the last day of the period. For our derivatives that are not exchange traded, the estimates we use are based on indicative broker quotations or an internal valuation model. Our valuation models utilize market observable inputs such as price, volatility, correlation and other factors and may not be reflective of the price at which they can be settled due to the lack of a liquid market. Less than 1% of total annual revenues are based on estimates derived from internal valuation models.
We also have embedded derivatives in PAA’s Series A preferred units that are recorded at fair value on our Consolidated Balance Sheets. These embedded derivatives are valued using a model that contains inputs, including PAA common unit price, ten-year U.S. Treasury rates, default probabilities and timing estimates, which involve management judgment.
80
Although the resolution of these uncertainties has not historically had a material impact on our results of operations or financial condition, we cannot provide assurance that actual amounts will not vary significantly from estimated amounts. See Item 7A. Quantitative and Qualitative Disclosures About Market Risk and Note 12 to our Consolidated Financial Statements for a discussion regarding our derivatives and risk management activities.
Accruals and Contingent Liabilities. We record accruals or liabilities for, among other things, environmental remediation, natural resource damage assessments, governmental fines and penalties, potential legal claims and fees for legal services associated with loss contingencies, and bonuses. Accruals are made when our assessment indicates that it is probable that a liability has occurred and the amount of liability can be reasonably estimated. Our estimates are based on all known facts at the time and our assessment of the ultimate outcome. Among the many uncertainties that impact our estimates are the necessary regulatory approvals for, and potential modification of, our environmental remediation plans, the limited amount of data available upon initial assessment of the impact of soil or water contamination, changes in costs associated with environmental remediation services and equipment, the duration of the natural resource damage assessment and the ultimate amount of damages determined, the determination and calculation of fines and penalties, the possibility of existing legal claims giving rise to additional claims and the nature, extent and cost of legal services that will be required in connection with lawsuits, claims and other matters. Our estimates for contingent liability accruals are increased or decreased as additional information is obtained or resolution is achieved. A hypothetical variance of 5% in our aggregate estimate for the accruals and contingent liabilities discussed above would have an impact on earnings of up to approximately $16 million. Although the resolution of these uncertainties has not historically had a material impact on our results of operations or financial condition, we cannot provide assurance that actual amounts will not vary significantly from estimated amounts.
Equity-Indexed Compensation Plan Accruals. We accrue compensation expense (referred to herein as equity-indexed compensation expense) for outstanding equity-indexed compensation awards. Under GAAP, we are required to estimate the fair value of our outstanding equity-indexed compensation awards and recognize that fair value as compensation expense over the service period. For equity-indexed compensation awards that contain a performance condition, the fair value of the award is recognized as equity-indexed compensation expense only if the attainment of the performance condition is considered probable. Uncertainties involved in this estimate include future distribution levels and whether or not a performance condition will be attained. In addition, the unit price at the end of each period (and at the time of vesting) will impact the amount of compensation expense recorded in each period for certain awards. We cannot provide assurance that the actual fair value of our equity-indexed compensation awards will not vary significantly from estimated amounts.
We recognized equity-indexed compensation expense of $41 million, $60 million and $27 million in 2017, 2016 and 2015, respectively, related to awards granted under our various equity-indexed compensation plans. A hypothetical variance of 5% in our aggregate estimate for the equity-indexed compensation expense would have an impact on our total costs and expenses of less than 1%. See Note 16 to our Consolidated Financial Statements for a discussion regarding our equity-indexed compensation plans.
Property and Equipment, Depreciation and Amortization Expense, Asset Retirement Obligations and Impairments. We compute depreciation and amortization using the straight-line method based on estimated useful lives. These estimates are based on various factors including condition, manufacturing specifications, technological advances and historical data concerning useful lives of similar assets. Uncertainties that impact these estimates include changes in laws and regulations relating to restoration and abandonment requirements, economic conditions and supply and demand in the area. When assets are put into service, we make estimates with respect to useful lives and salvage values that we believe are reasonable. However, subsequent events could cause us to change our estimates, thus impacting the future calculation of depreciation and amortization.
We record retirement obligations associated with tangible long-lived assets based on estimates related to the costs associated with cleaning, purging and, in some cases, completely removing the assets and returning the land to its original state. In addition, our estimates include a determination of the settlement date or dates for the potential obligation, which may or may not be determinable. Uncertainties that impact these estimates include the costs associated with these activities and the timing of incurring such costs.
81
We periodically evaluate property and equipment for impairment when events or circumstances indicate that the carrying value of these assets may not be recoverable. Any evaluation is highly dependent on the underlying assumptions of related cash flows. We consider the fair value estimate used to calculate impairment of property and equipment a critical accounting estimate. In determining the existence of an impairment of carrying value, we make a number of subjective assumptions as to:
• | whether there is an event or circumstance that may be indicative of an impairment; |
• | the grouping of assets; |
• | the intention of “holding”, “abandoning” or “selling” an asset; |
• | the forecast of undiscounted expected future cash flow over the asset’s estimated useful life; and |
• | if an impairment exists, the fair value of the asset or asset group. |
In addition, when we evaluate property and equipment and other long-lived assets for recoverability, it may also be necessary to review related depreciation estimates and methods.
As discussed in the “—Outlook— Market Overview and Outlook” section below, the downturn in the crude oil industry that started in mid-to-late 2014 has adversely impacted most companies in the midstream industry, including us. As a result of such market conditions, during 2017 and 2016, we recognized approximately $152 million and $80 million, respectively, of non-cash charges related to the write-down of certain of our long-lived rail and other terminal assets included in our Facilities segment due to asset impairments and accelerated depreciation. Despite the modest recovery in crude oil prices at the end of 2017 and early 2018, we continue to monitor appropriate indicators of potential impairment.
We did not recognize any material impairment of long-lived assets during the year ended December 31, 2015. See Note 5 to our Consolidated Financial Statements for further discussion regarding impairments.
Allowance for Doubtful Accounts. We perform credit evaluations of our customers and grant credit based on past payment history, financial conditions and anticipated industry conditions. Customer payments are regularly monitored and a provision for doubtful accounts is established based on specific situations and overall industry conditions. Our history of bad debt losses has been minimal (less than $2 million in the aggregate over the years ended December 31, 2017, 2016 and 2015) and generally limited to specific customer circumstances; however, credit risks can change suddenly and without notice. See Note 2 to our Consolidated Financial Statements for additional discussion.
Inventory Valuations. Inventory, including long-term inventory, primarily consists of crude oil, NGL and natural gas and is valued at the lower of cost or net realizable value, with cost determined using an average cost method within specific inventory pools. At the end of each reporting period, we assess the carrying value of our inventory and use estimates and judgment when making any adjustments necessary to reduce the carrying value to net realizable value. Among the uncertainties that impact our estimates are the applicable quality and location differentials to include in our net realizable value analysis. Additionally, we estimate the upcoming liquidation timing of the inventory. Changes in assumptions made as to the timing of a sale can materially impact net realizable value. During the years ended December 31, 2017, 2016 and 2015, we recorded charges of $35 million, $3 million and $117 million, respectively, related to the valuation adjustment of our crude oil, NGL and natural gas inventory due to declines in prices. See Note 4 to our Consolidated Financial Statements for further discussion regarding inventory.
Recent Accounting Pronouncements
See Note 2 to our Consolidated Financial Statements for information regarding the effect of recent accounting pronouncements on our Consolidated Financial Statements, including the impact of our adoption of revised employee share-based payment accounting guidance on prior period financial statements.
82
Results of Operations
The following table sets forth an overview of our consolidated financial results calculated in accordance with GAAP (in millions, except per share amounts):
Variance | |||||||||||||||||||||||||||
Year Ended December 31, | 2017-2016 | 2016-2015 | |||||||||||||||||||||||||
2017 | 2016 | 2015 | $ | % | $ | % | |||||||||||||||||||||
Transportation segment adjusted EBITDA (1) | $ | 1,287 | $ | 1,141 | $ | 1,056 | $ | 146 | 13 | % | $ | 85 | 8 | % | |||||||||||||
Facilities segment adjusted EBITDA (1) | 734 | 667 | 588 | 67 | 10 | % | 79 | 13 | % | ||||||||||||||||||
Supply and Logistics segment adjusted EBITDA (1) | 60 | 359 | 568 | (299 | ) | (83 | )% | (209 | ) | (37 | )% | ||||||||||||||||
Adjustments: | |||||||||||||||||||||||||||
Depreciation and amortization of unconsolidated entities | (45 | ) | (50 | ) | (45 | ) | 5 | 10 | % | (5 | ) | (11 | )% | ||||||||||||||
Selected items impacting comparability - segment adjusted EBITDA | 33 | (434 | ) | (290 | ) | 467 | ** | (144 | ) | ** | |||||||||||||||||
Unallocated general and administrative expenses | (4 | ) | (3 | ) | (3 | ) | (1 | ) | (33 | )% | — | — | % | ||||||||||||||
Depreciation and amortization | (628 | ) | (495 | ) | (433 | ) | (133 | ) | (27 | )% | (62 | ) | (14 | )% | |||||||||||||
Interest expense, net | (510 | ) | (480 | ) | (443 | ) | (30 | ) | (6 | )% | (37 | ) | (8 | )% | |||||||||||||
Other income/(expense), net | (31 | ) | 33 | (7 | ) | (64 | ) | ** | 40 | ** | |||||||||||||||||
Income tax expense | (937 | ) | (78 | ) | (182 | ) | (859 | ) | ** | 104 | 57 | % | |||||||||||||||
Net income/(loss) | (41 | ) | 660 | 809 | (701 | ) | (106 | )% | (149 | ) | (18 | )% | |||||||||||||||
Net income attributable to noncontrolling interests | (690 | ) | (566 | ) | (691 | ) | (124 | ) | (22 | )% | 125 | 18 | % | ||||||||||||||
Net income/(loss) attributable to PAGP | $ | (731 | ) | $ | 94 | $ | 118 | $ | (825 | ) | ** | $ | (24 | ) | (20 | )% | |||||||||||
Basic and diluted net income/(loss) per Class A share | $ | (5.03 | ) | $ | 0.94 | $ | 1.41 | $ | (5.97 | ) | ** | $ | (0.47 | ) | (33 | )% | |||||||||||
Basic and diluted weighted average Class A shares outstanding | 145 | 99 | 83 | 46 | 46 | % | 16 | 19 | % | ||||||||||||||||||
** | Indicates that variance as a percentage is not meaningful. |
(1) | Segment adjusted EBITDA is the measure of segment performance that is utilized by our Chief Operating Decision Maker (“CODM”) to assess performance and allocate resources among our operating segments. This measure is adjusted for certain items, including those that our CODM believes impact comparability of results across periods. See Note 19 to our Consolidated Financial Statements for additional discussion of such adjustments. |
83
Non-GAAP Financial Measures
To supplement our financial information presented in accordance with GAAP, management uses additional measures known as “non-GAAP financial measures” in its evaluation of past performance and prospects for the future. The primary additional measure used by management is earnings before interest, taxes, depreciation and amortization (including our proportionate share of depreciation and amortization and gains and losses on significant asset sales of unconsolidated entities) and adjusted for certain selected items impacting comparability (“Adjusted EBITDA”).
Management believes that the presentation of such additional financial measure provides useful information to investors regarding our performance and results of operations because this measure, when used to supplement related GAAP financial measures, (i) provide additional information about our core operating performance, (ii) provide investors with the same financial analytical framework upon which management bases financial, operational, compensation and planning/budgeting decisions and (iii) present measurements that investors, rating agencies and debt holders have indicated are useful in assessing us and our results of operations. This non-GAAP measure may exclude, for example, (i) charges for obligations that are expected to be settled with the issuance of equity instruments, (ii) gains or losses on derivative instruments that are related to underlying activities in another period (or the reversal of such adjustments from a prior period), the mark-to-market related to our Preferred Distribution Rate Reset Option, gains and losses on derivatives that are related to investing activities (such as the purchase of linefill) and inventory valuation adjustments, as applicable, (iii) long-term inventory costing adjustments, (iv) items that are not indicative of our core operating results and business outlook and/or (v) other items that we believe should be excluded in understanding our core operating performance. This measure may further be adjusted to include amounts related to deficiencies associated with minimum volume commitments whereby we have billed the counterparties for their deficiency obligation and such amounts are recognized as deferred revenue in “Accounts payable and accrued liabilities” in our Consolidated Financial Statements. Such amounts are presented net of applicable amounts subsequently recognized into revenue. We have defined all such items as “selected items impacting comparability.” We do not necessarily consider all of our selected items impacting comparability to be non-recurring, infrequent or unusual, but we believe that an understanding of these selected items impacting comparability is material to the evaluation of our operating results and prospects.
Although we present selected items impacting comparability that management considers in evaluating our performance, you should also be aware that the items presented do not represent all items that affect comparability between the periods presented. Variations in our operating results are also caused by changes in volumes, prices, exchange rates, mechanical interruptions, acquisitions, expansion projects and numerous other factors as discussed, as applicable, in “Analysis of Operating Segments.”
Our definition and calculation of certain non-GAAP financial measures may not be comparable to similarly-titled measures of other companies. Adjusted EBITDA is reconciled to Net Income, the most directly comparable measure as reported in accordance with GAAP, and should be viewed in addition to, and not in lieu of, our Consolidated Financial Statements and footnotes.
84
The following table sets forth the reconciliation of our non-GAAP financial performance measure from Net Income (in millions):
Variance | |||||||||||||||||||||||||||
Year Ended December 31, | 2017-2016 | 2016-2015 | |||||||||||||||||||||||||
2017 | 2016 | 2015 | $ | % | $ | % | |||||||||||||||||||||
Net income/(loss) | $ | (41 | ) | 660 | $ | 809 | $ | (701 | ) | (106 | )% | $ | (149 | ) | (18 | )% | |||||||||||
Add/(Subtract): | |||||||||||||||||||||||||||
Interest expense, net | 510 | 480 | 443 | 30 | 6 | % | 37 | 8 | % | ||||||||||||||||||
Income tax expense | 937 | 78 | 182 | 859 | ** | (104 | ) | (57 | )% | ||||||||||||||||||
Depreciation and amortization | 628 | 495 | 433 | 133 | 27 | % | 62 | 14 | % | ||||||||||||||||||
Depreciation and amortization of unconsolidated entities (1) | 45 | 50 | 45 | (5 | ) | (10 | )% | 5 | 11 | % | |||||||||||||||||
Selected Items Impacting Comparability - Adjusted EBITDA: | |||||||||||||||||||||||||||
(Gains)/losses from derivative activities net of inventory valuation adjustments (2) | (46 | ) | 404 | 110 | (450 | ) | ** | 294 | ** | ||||||||||||||||||
Long-term inventory costing adjustments (3) | (24 | ) | (58 | ) | 99 | 34 | ** | (157 | ) | ** | |||||||||||||||||
Deficiencies under minimum volume commitments, net (4) | 2 | 46 | — | (44 | ) | ** | 46 | ** | |||||||||||||||||||
Equity-indexed compensation expense (5) | 23 | 33 | 27 | (10 | ) | ** | 6 | ** | |||||||||||||||||||
Net (gain)/loss on foreign currency revaluation (6) | (26 | ) | 9 | (29 | ) | (35 | ) | ** | 38 | ** | |||||||||||||||||
Line 901 incident (7) | 32 | — | 83 | 32 | ** | (83 | ) | ** | |||||||||||||||||||
Significant acquisition-related expenses (8) | 6 | — | — | 6 | ** | — | ** | ||||||||||||||||||||
Selected Items Impacting Comparability - segment adjusted EBITDA | (33 | ) | 434 | 290 | (467 | ) | ** | 144 | ** | ||||||||||||||||||
Gains from derivative activities (2) | (13 | ) | (30 | ) | — | 17 | ** | (30 | ) | ** | |||||||||||||||||
Net (gain)/loss on foreign currency revaluation (6) | 5 | (1 | ) | 8 | 6 | ** | (9 | ) | ** | ||||||||||||||||||
Net loss on early repayment of senior notes (9) | 40 | — | — | 40 | ** | — | ** | ||||||||||||||||||||
Selected Items Impacting Comparability - Adjusted EBITDA (10) | (1 | ) | 403 | 298 | (404 | ) | ** | 105 | ** | ||||||||||||||||||
Adjusted EBITDA (10) | $ | 2,078 | $ | 2,166 | $ | 2,210 | $ | (88 | ) | (4 | )% | $ | (44 | ) | (2 | )% | |||||||||||
** Indicates that variance as a percentage is not meaningful.
(1) | Over the past several years, we have increased our participation in pipeline strategic joint ventures, which are accounted for under the equity method of accounting. We exclude our proportionate share of the depreciation and amortization expense and gains and losses on significant asset sales of such unconsolidated entities when reviewing Adjusted EBITDA, similar to our consolidated assets. |
(2) | We use derivative instruments for risk management purposes, and our related processes include specific identification of hedging instruments to an underlying hedged transaction. Although we identify an underlying transaction for each derivative instrument we enter into, there may not be an accounting hedge relationship between the instrument and the underlying transaction. In the course of evaluating our results of operations, we identify the earnings that were recognized during the period related to derivative instruments for which the identified underlying transaction does not occur in the current period and exclude the related gains and losses in determining Adjusted EBITDA. In addition, we exclude gains and losses on derivatives that are related to investing activities, such as the purchase of linefill. We also exclude the impact of corresponding inventory valuation adjustments, as applicable, as well as the mark-to-market adjustment related to our Preferred Distribution Rate Reset Option. See Note 12 to our Consolidated Financial Statements for a comprehensive discussion regarding our derivatives and risk management activities and our Preferred Distribution Rate Reset Option. |
85
(3) | We carry crude oil and NGL inventory that is comprised of minimum working inventory requirements in third-party assets and other working inventory that is needed for our commercial operations. We consider this inventory necessary to conduct our operations and we intend to carry this inventory for the foreseeable future. Therefore, we classify this inventory as long-term on our balance sheet and do not hedge the inventory with derivative instruments (similar to linefill in our own assets). We treat the impact of changes in the average cost of the long-term inventory (that result from fluctuations in market prices) and writedowns of such inventory that result from price declines as a selected item impacting comparability. See Note 4 to our Consolidated Financial Statements for additional inventory disclosures. |
(4) | We have certain agreements that require counterparties to deliver, transport or throughput a minimum volume over an agreed upon period. Substantially all of such agreements were entered into with counterparties to economically support the return on our capital expenditure necessary to construct the related asset. Some of these agreements include make-up rights if the minimum volume is not met. We record a receivable from the counterparty in the period that services are provided or when the transaction occurs, including amounts for deficiency obligations from counterparties associated with minimum volume commitments. If a counterparty has a make-up right associated with a deficiency, we defer the revenue attributable to the counterparty’s make-up right and subsequently recognize the revenue at the earlier of when the deficiency volume is delivered or shipped, when the make-up right expires or when it is determined that the counterparty’s ability to utilize the make-up right is remote. We include the impact of amounts billed to counterparties for their deficiency obligation, net of applicable amounts subsequently recognized into revenue, as a selected item impacting comparability. We believe the inclusion of the contractually committed revenues associated with that period is meaningful to investors as the related asset has been constructed, is standing ready to provide the committed service and the fixed operating costs are included in the current period results. Amounts for years prior to 2016 were not significant. |
(5) | Our total equity-indexed compensation expense includes expense associated with awards that will or may be settled in PAA common units and awards that will or may be settled in cash. The awards that will or may be settled in PAA common units are included in PAA’s diluted net income per unit calculation when the applicable performance criteria have been met. We consider the compensation expense associated with these awards as a selected item impacting comparability as the dilutive impact of the outstanding awards is included in PAA’s diluted net income per unit calculation, as applicable, and the majority of the awards are expected to be settled in PAA common units. The portion of compensation expense associated with awards that are certain to be settled in cash is not considered a selected item impacting comparability. See Note 16 to our Consolidated Financial Statements for a comprehensive discussion regarding our equity-indexed compensation plans. |
(6) | During the periods presented, there were fluctuations in the value of the Canadian dollar (“CAD”) to the U.S. dollar (“USD”), resulting in gains and losses that were not related to our core operating results for the period and were thus classified as a selected item impacting comparability. See Note 12 to our Consolidated Financial Statements for discussion regarding our currency exchange rate risk hedging activities. |
(7) | Includes costs recognized during the period related to the Line 901 incident that occurred in May 2015, net of amounts we believe are probable of recovery from insurance. See Note 17 to our Consolidated Financial Statements for additional information regarding the Line 901 incident. |
(8) | Includes acquisition-related expenses associated with the ACC Acquisition. See Note 6 to our Consolidated Financial Statements for additional information. |
(9) | Includes net losses incurred in connection with the early redemption of our (i) $600 million, 6.50% senior notes due May 2018 and (ii) $350 million, 8.75% senior notes due May 2019. See Note 10 to our Consolidated Financial Statements for additional information. |
(10) | Adjusted EBITDA includes Other income/(expense), net adjusted for selected items impacting comparability comprised of net gains of $1 million, $2 million and $1 million for the years ended December 31, 2017, 2016 and 2015, respectively. Segment adjusted EBITDA does not include adjusted Other income/(expense), net. |
Analysis of Operating Segments
We manage our operations through three operating segments: Transportation, Facilities and Supply and Logistics. Our CODM (our Chief Executive Officer) evaluates segment performance based on a variety of measures including segment adjusted EBITDA, segment volumes, segment adjusted EBITDA per barrel and maintenance capital investment.
We define segment adjusted EBITDA as revenues and equity earnings in unconsolidated entities less (a) purchases and related costs, (b) field operating costs and (c) segment general and administrative expenses, plus our proportionate share of the depreciation and amortization expense and gains or losses on significant asset sales of unconsolidated entities, and further
86
adjusted for certain selected items including (i) the mark-to-market of derivative instruments that are related to underlying activities in another period (or the reversal of such adjustments from a prior period), gains and losses on derivatives that are related to investing activities (such as the purchase of linefill) and inventory valuation adjustments, as applicable, (ii) long-term inventory costing adjustments, (iii) charges for obligations that are expected to be settled with the issuance of equity instruments, (iv) amounts related to deficiencies associated with minimum volume commitments, net of applicable amounts subsequently recognized into revenue and (v) other items that our CODM believes are integral to understand our core segment operating performance. See Note 19 to our Consolidated Financial Statements for a reconciliation of segment adjusted EBITDA to net income attributable to PAGP.
Our segment analysis involves an element of judgment relating to the allocations between segments. In connection with its operations, the Supply and Logistics segment secures transportation and facilities services from our other two segments as well as third-party service providers under month-to-month and multi-year arrangements. Intersegment transportation service rates are conducted at posted tariff rates, rates similar to those charged to third parties or rates that we believe approximate market. Facilities segment services are also obtained at rates generally consistent with rates charged to third parties for similar services. Intersegment activities are eliminated in consolidation and we believe that the estimates with respect to these rates are reasonable. Also, our segment operating and general and administrative expenses reflect direct costs attributable to each segment; however, we also allocate certain operating expenses and general and administrative overhead expenses between segments based on management’s assessment of the business activities for the period. The proportional allocations by segment require judgment by management and may be adjusted in the future based on the business activities that exist during each period. We believe that the estimates with respect to these allocations are reasonable.
Revenues and expenses from our Canadian based subsidiaries, which use CAD as their functional currency, are translated at the prevailing average exchange rates for each month.
Transportation Segment
Our Transportation segment operations generally consist of fee-based activities associated with transporting crude oil and NGL on pipelines, gathering systems, trucks and barges. The Transportation segment generates revenue through a combination of tariffs, third-party pipeline capacity agreements and other transportation fees.
The following tables set forth our operating results from our Transportation segment:
Variance | |||||||||||||||||||||||||||
Operating Results (1) (in millions, except per barrel data) | Year Ended December 31, | 2017-2016 | 2016-2015 | ||||||||||||||||||||||||
2017 | 2016 | 2015 | $ | % | $ | % | |||||||||||||||||||||
Revenues | $ | 1,718 | $ | 1,584 | $ | 1,594 | $ | 134 | 8 | % | $ | (10 | ) | (1 | )% | ||||||||||||
Purchases and related costs | (123 | ) | (94 | ) | (108 | ) | (29 | ) | (31 | )% | 14 | 13 | % | ||||||||||||||
Field operating costs | (593 | ) | (551 | ) | (657 | ) | (42 | ) | (8 | )% | 106 | 16 | % | ||||||||||||||
Segment general and administrative expenses (2) | (101 | ) | (103 | ) | (95 | ) | 2 | 2 | % | (8 | ) | (8 | )% | ||||||||||||||
Equity earnings in unconsolidated entities | 290 | 195 | 183 | 95 | 49 | % | 12 | 7 | % | ||||||||||||||||||
Adjustments (3): | |||||||||||||||||||||||||||
Depreciation and amortization of unconsolidated entities | 45 | 50 | 45 | (5 | ) | (10 | )% | 5 | 11 | % | |||||||||||||||||
Deficiencies under minimum volume commitments, net | 2 | 44 | — | (42 | ) | ** | 44 | ** | |||||||||||||||||||
Equity-indexed compensation expense | 11 | 16 | 11 | (5 | ) | ** | 5 | ** | |||||||||||||||||||
Line 901 incident | 32 | — | 83 | 32 | ** | (83 | ) | ** | |||||||||||||||||||
Significant acquisition-related expenses | 6 | — | — | 6 | ** | — | ** | ||||||||||||||||||||
Segment adjusted EBITDA | $ | 1,287 | $ | 1,141 | $ | 1,056 | $ | 146 | 13 | % | $ | 85 | 8 | % | |||||||||||||
Maintenance capital | $ | 120 | $ | 121 | $ | 144 | $ | (1 | ) | (1 | )% | $ | (23 | ) | (16 | )% | |||||||||||
Segment adjusted EBITDA per barrel | $ | 0.68 | $ | 0.67 | $ | 0.65 | $ | 0.01 | 1 | % | $ | 0.02 | 3 | % | |||||||||||||
87
Variance | ||||||||||||||||||||||
Average Daily Volumes (in thousands of barrels per day) (4) | Year Ended December 31, | 2017-2016 | 2016-2015 | |||||||||||||||||||
2017 | 2016 | 2015 | Volumes | % | Volumes | % | ||||||||||||||||
Tariff activities volumes | ||||||||||||||||||||||
Crude oil pipelines (by region): | ||||||||||||||||||||||
Permian Basin (5) | 2,855 | 2,146 | 1,849 | 709 | 33 | % | 297 | 16 | % | |||||||||||||
South Texas / Eagle Ford (5) | 360 | 284 | 306 | 76 | 27 | % | (22 | ) | (7 | )% | ||||||||||||
Central (5) | 420 | 394 | 413 | 26 | 7 | % | (19 | ) | (5 | )% | ||||||||||||
Gulf Coast | 349 | 497 | 532 | (148 | ) | (30 | )% | (35 | ) | (7 | )% | |||||||||||
Rocky Mountain (5) | 393 | 449 | 440 | (56 | ) | (12 | )% | 9 | 2 | % | ||||||||||||
Western | 184 | 188 | 215 | (4 | ) | (2 | )% | (27 | ) | (13 | )% | |||||||||||
Canada | 352 | 381 | 392 | (29 | ) | (8 | )% | (11 | ) | (3 | )% | |||||||||||
Crude oil pipelines | 4,913 | 4,339 | 4,147 | 574 | 13 | % | 192 | 5 | % | |||||||||||||
NGL pipelines | 170 | 184 | 193 | (14 | ) | (8 | )% | (9 | ) | (5 | )% | |||||||||||
Tariff activities total volumes | 5,083 | 4,523 | 4,340 | 560 | 12 | % | 183 | 4 | % | |||||||||||||
Trucking volumes | 103 | 114 | 113 | (11 | ) | (10 | )% | 1 | 1 | % | ||||||||||||
Transportation segment total volumes | 5,186 | 4,637 | 4,453 | 549 | 12 | % | 184 | 4 | % | |||||||||||||
** Indicates that variance as a percentage is not meaningful.
(1) | Revenues and costs and expenses include intersegment amounts. |
(2) | Segment general and administrative expenses reflect direct costs attributable to each segment and an allocation of other expenses to the segments. The proportional allocations by segment require judgment by management and are based on the business activities that exist during each period. |
(3) | Represents adjustments included in the performance measure utilized by our CODM in the evaluation of segment results. See Note 19 to our Consolidated Financial Statements for additional discussion of such adjustments. |
(4) | Average daily volumes are calculated as the total volumes (attributable to our interest) for the year divided by the number of days in the year. |
(5) | Region includes volumes (attributable to our interest) from pipelines owned by unconsolidated entities. |
Tariffs and other fees on our pipeline systems vary by receipt point and delivery point. The segment results generated by our tariff and other fee-related activities depend on the volumes transported on the pipeline and the level of the tariff and other fees charged, as well as the fixed and variable field costs of operating the pipeline. As is common in the pipeline transportation industry, our tariffs incorporate a loss allowance factor that is intended to offset losses due to evaporation, measurement and other losses in transit. We value the allowance volumes and actual losses at the estimated net realizable value (including the impact of gains and losses from derivative related activities) in the month of occurrence.
The following is a discussion of items impacting Transportation segment operating results for the periods indicated.
88
Revenues, Purchases and Related Costs, Equity Earnings in Unconsolidated Entities and Volumes. The following table presents variances in revenues, purchases and related costs and equity earnings in unconsolidated entities by region for the comparative periods presented:
Favorable/(Unfavorable) Variance 2017-2016 | Favorable/(Unfavorable) Variance 2016-2015 | ||||||||||||||||||||||
(in millions) | Revenues | Purchases and Related Costs | Equity Earnings | Revenues | Purchases and Related Costs | Equity Earnings | |||||||||||||||||
Tariff activities: | |||||||||||||||||||||||
Permian Basin region | $ | 196 | (22 | ) | $ | 30 | $ | 98 | — | $ | 7 | ||||||||||||
South Texas / Eagle Ford region | (2 | ) | — | 40 | (7 | ) | — | (1 | ) | ||||||||||||||
Central region | — | — | 14 | (23 | ) | — | 2 | ||||||||||||||||
Gulf Coast region | (22 | ) | — | — | (19 | ) | — | — | |||||||||||||||
Rocky Mountain region | (20 | ) | — | 9 | (18 | ) | — | 10 | |||||||||||||||
Other (including trucking and pipeline loss allowance revenue) | (18 | ) | (7 | ) | 2 | (41 | ) | 14 | (6 | ) | |||||||||||||
Total variance | $ | 134 | (29 | ) | $ | 95 | $ | (10 | ) | 14 | $ | 12 | |||||||||||
• | Permian Basin region. The increase in revenues for 2017 compared to 2016 was largely driven by (i) higher volumes on our Basin and Cactus pipelines, which also favorably impacted volumes on our McCamey pipeline system, (ii) results from the ACC gathering system, which we acquired in February 2017, and (iii) higher volumes from increased production and new lease connections to our gathering systems in the Permian Basin. Equity earnings also increased in 2017 compared to 2016 due to higher earnings from our 50% interest in BridgeTex resulting from higher volumes in the 2017 period. These increases were partially offset by an increase in purchases and related costs for the year ended December 31, 2017 over the year ended December 31, 2016. |
The increase in revenues for 2016 compared to 2015 was primarily driven by (i) higher volumes associated with the expansion of our pipeline systems in the Delaware Basin, (ii) higher volumes on our takeaway pipelines and (iii) a full year of service of our Cactus pipeline, which was placed in service in April 2015.
• | South Texas / Eagle Ford region. Equity earnings from our 50% interest in Eagle Ford Pipeline LLC increased in 2017 compared to 2016 primarily due to higher volumes from our Cactus pipeline. |
• | Central region. Revenues for the year ended December 31, 2017 were flat compared to the year ended December 31, 2016, as increases from the start-up of our Red River pipeline in December 2016 were offset by (i) lower volumes on certain pipelines due to production declines and (ii) volumes shifting to our recently formed joint venture pipelines. The decrease in revenues for 2016 compared to 2015 was largely driven by lower volumes due to production declines in the Mid-Continent area, as well as the sale of 50% of our investment in STACK in August 2016, subsequent to which it was accounted for under the equity method of accounting. |
Equity earnings increased in 2017 compared to 2016 primarily due to earnings from (i) our 50% interest in STACK, which was formed in mid-2016 and which completed extensions of the joint venture pipeline in 2017, (ii) our 50% interest in Caddo, which placed the joint venture pipeline in service in late 2016, and (iii) our 50% interest in Diamond, which placed the joint venture pipeline in service in late 2017.
• | Gulf Coast region. Revenues and volumes decreased for each of the comparative periods primarily due to the sale of certain of our Gulf Coast pipelines in March and July 2016. Such decreases were partially offset during 2016 as compared to 2015 by increased volumes on the Capline and Pascagoula pipelines, which were favorably impacted by higher refinery demand, but were at lower tariff rates than the pipelines that were sold. |
89
• | Rocky Mountain region. The decrease in revenues in 2017 compared to 2016 was largely driven by (i) lower volumes on certain Salt Lake City area pipelines due to proactively shutting down our Wahsatch pipeline for approximately 30 days during the first quarter of 2017 as a precautionary measure in response to indications of soil movement identified by our monitoring systems, (ii) the sale of certain Bakken and Salt Lake City area pipelines in October 2017 and (iii) the sale of 50% of our investment in Cheyenne in June 2016, subsequent to which it was accounted for under the equity method of accounting. The decrease in revenues for 2016 compared to 2015 was largely driven by (i) lower volumes due to production declines and increased competition and (ii) the sale of 50% of our investment in Cheyenne Pipeline. |
Equity earnings increased for each of the comparative periods due to earnings from (i) our 40% investment in Saddlehorn, which began operations in the third quarter of 2016, and (ii) our 50% investment in Cheyenne, as discussed above. Such increases were partially offset during 2017 as compared to 2016 by decreased equity earnings from our 35.67% interest in White Cliffs due to lower volumes on the joint venture pipeline.
• | Other. The revenues variance for the year ended December 31, 2016 compared to the same 2015 period was primarily related to lower pipeline loss allowance revenue due to a lower average realized price per barrel. The decrease in purchases and related costs for the year ended December 31, 2016 compared to the same 2015 period was due to lower trucking costs driven by lower contract services rates. |
Adjustments: Deficiencies under minimum volume commitments, net. Many industry infrastructure projects developed and completed over the last several years were underpinned by long-term minimum volume commitment contracts whereby the shipper, based on an expectation of continued production growth, agreed to either: (i) ship and pay for certain stated volumes or (ii) pay the agreed upon price for a minimum contract quantity. During 2016 and 2017, as presented in the table above, we had net collections for deficiencies under minimum volume commitments resulting in deferred revenues and an increase to segment adjusted EBITDA. However, such net collections in 2017 were substantially offset by (i) shippers utilizing credits associated with previous deficiencies or (ii) credits expiring, which resulted in the recognition of previously deferred revenue. Such amounts were not material to periods prior to 2016 and, thus, are not included in the table for 2015.
Field Operating Costs. Field operating costs increased for the year ended December 31, 2017 compared to the year ended December 31, 2016 primarily due to an increase in estimated costs associated with the Line 901 incident (which impact our field operating costs but are excluded from segment adjusted EBITDA and thus are reflected as an “Adjustment” in the table above). See Note 17 to our Consolidated Financial Statements for additional information regarding the Line 901 incident. The increase in field operating costs was further driven by an increase in power costs resulting from higher volumes and incremental operating costs from the ACC gathering system acquisition in February 2017, partially offset by cost reduction efforts and decreased costs due to the sale of certain Gulf Coast pipelines in March and July 2016.
The decrease in field operating costs for the year ended December 31, 2016 compared to the year ended December 31, 2015 was primarily due to net estimated costs of $83 million recognized during 2015 associated with the Line 901 incident (which impact our field operating costs but are excluded from segment adjusted EBITDA and thus are reflected as an “Adjustment” in the table above). The decrease in field operating costs was further driven by lower utilities and maintenance costs, costs associated with a release of crude oil at a pump station in Illinois (the MP 29 release) during 2015, lower operating costs due to the sale of certain of our Gulf Coast pipelines in 2016, as noted above, and a favorable foreign exchange impact of $5 million, partially offset by an increase in insurance premiums.
Maintenance Capital. Maintenance capital consists of capital expenditures for the replacement and/or refurbishment of partially or fully depreciated assets in order to maintain the operating and/or earnings capacity of our existing assets. The decrease in maintenance capital for the year ended December 31, 2016 compared to the year ended December 31, 2015 was primarily driven by completion of several large projects in earlier years and lower third-party service costs.
90
Facilities Segment
Our Facilities segment operations generally consist of fee-based activities associated with providing storage, terminalling and throughput services primarily for crude oil, NGL and natural gas, as well as NGL fractionation and isomerization services and natural gas and condensate processing services. The Facilities segment generates revenue through a combination of month-to-month and multi-year agreements.
The following tables set forth our operating results from our Facilities segment:
Variance | |||||||||||||||||||||||||||
Operating Results (1) (in millions, except per barrel data) | Year Ended December 31, | 2017-2016 | 2016-2015 | ||||||||||||||||||||||||
2017 | 2016 | 2015 | $ | % | $ | % | |||||||||||||||||||||
Revenues | $ | 1,173 | $ | 1,107 | $ | 1,050 | $ | 66 | 6 | % | $ | 57 | 5 | % | |||||||||||||
Natural gas related costs | (24 | ) | (26 | ) | (24 | ) | 2 | 8 | % | (2 | ) | (8 | )% | ||||||||||||||
Field operating costs | (350 | ) | (352 | ) | (377 | ) | 2 | 1 | % | 25 | 7 | % | |||||||||||||||
Segment general and administrative expenses (2) | (73 | ) | (68 | ) | (70 | ) | (5 | ) | (7 | )% | 2 | 3 | % | ||||||||||||||
Adjustments (3): | |||||||||||||||||||||||||||
(Gains)/losses from derivative activities net of inventory valuation adjustments | 4 | (2 | ) | 4 | 6 | ** | (6 | ) | ** | ||||||||||||||||||
Deficiencies under minimum volume commitments, net | — | 2 | — | (2 | ) | ** | 2 | ** | |||||||||||||||||||
Equity-indexed compensation expense | 4 | 7 | 5 | (3 | ) | ** | 2 | ** | |||||||||||||||||||
Net gain on foreign currency revaluation | — | (1 | ) | — | 1 | ** | (1 | ) | ** | ||||||||||||||||||
Segment adjusted EBITDA | $ | 734 | $ | 667 | $ | 588 | $ | 67 | 10 | % | $ | 79 | 13 | % | |||||||||||||
Maintenance capital | $ | 114 | $ | 55 | $ | 68 | $ | 59 | 107 | % | $ | (13 | ) | (19 | )% | ||||||||||||
Segment adjusted EBITDA per barrel | $ | 0.47 | $ | 0.44 | $ | 0.41 | $ | 0.03 | 7 | % | $ | 0.03 | 7 | % | |||||||||||||
Variance | ||||||||||||||||||||||
Year Ended December 31, | 2017-2016 | 2016-2015 | ||||||||||||||||||||
Volumes (4) | 2017 | 2016 | 2015 | Volumes | % | Volumes | % | |||||||||||||||
Liquids storage (average monthly capacity in millions of barrels) | 112 | 107 | 100 | 5 | 5 | % | 7 | 7 | % | |||||||||||||
Natural gas storage (average monthly working capacity in billions of cubic feet) (5) | 82 | 97 | 97 | (15 | ) | (15 | )% | — | — | % | ||||||||||||
NGL fractionation (average volumes in thousands of barrels per day) | 126 | 115 | 103 | 11 | 10 | % | 12 | 12 | % | |||||||||||||
Facilities segment total volumes (average monthly volumes in millions of barrels) (6) | 130 | 127 | 120 | 3 | 2 | % | 7 | 6 | % | |||||||||||||
** Indicates that variance as a percentage is not meaningful.
(1) | Revenues and costs and expenses include intersegment amounts. |
(2) | Segment general and administrative expenses reflect direct costs attributable to each segment and an allocation of other expenses to the segments. The proportional allocations by segment require judgment by management and are based on the business activities that exist during each period. |
(3) | Represents adjustments included in the performance measure utilized by our CODM in the evaluation of segment results. See Note 19 to our Consolidated Financial Statements for additional discussion of such adjustments. |
91
(4) | Average monthly volumes are calculated as total volumes for the year divided by the number of months in the year. |
(5) | The decrease in average monthly working capacity of natural gas storage facilities in 2017 was driven by adjustments for (i) the sale of our Bluewater natural gas storage facility in June 2017, (ii) changes in base gas and (iii) the net capacity change between capacity additions from fill and dewater operations and capacity losses from salt creep. |
(6) | Facilities segment total volumes is calculated as the sum of: (i) liquids storage capacity; (ii) natural gas storage working capacity divided by 6 to account for the 6:1 mcf of natural gas to crude Btu equivalent ratio and further divided by 1,000 to convert to monthly volumes in millions; and (iii) NGL fractionation volumes multiplied by the number of days in the year and divided by the number of months in the year. |
The following is a discussion of items impacting Facilities segment operating results for the periods indicated.
Revenues and Volumes. Variances in revenues and average monthly volumes for the comparative periods were primarily driven by:
• | NGL Storage, NGL Fractionation and Canadian Gas Processing — Revenues increased by $99 million and $53 million, respectively, for the comparative periods presented primarily due to contributions from (i) the Western Canada NGL assets we acquired in August 2016, (ii) ongoing expansion projects at our Fort Saskatchewan facility, which have increased storage and fractionation capacity, and (iii) higher rates at certain of our NGL storage and fractionation facilities, which were largely incurred in our Supply and Logistics segment. The increased revenue for the year ended December 31, 2016 compared to the same period in 2015 was partially offset by unfavorable foreign exchange fluctuation impacts of $10 million, which were also largely offset in our Supply and Logistics segment results. |
• | Crude Oil Storage — Revenues for the year ended December 31, 2017 were relatively flat compared to the year ended December 31, 2016. Higher 2017 revenues from our Cushing terminal driven by increased terminal throughput and capacity expansions of approximately 2 million barrels were offset by (i) decreased utilization at certain of our Southern California terminals and (ii) the sale of certain of our East Coast terminals in April 2016. |
For the year ended December 31, 2016, crude oil storage revenues increased by $24 million over the year ended December 31, 2015 primarily due to (i) aggregate capacity expansions of approximately 4 million barrels at our St. James and Cushing terminals and (ii) increased utilization at certain of our West Coast terminals. Such increases were partially offset by lower results due to the sale of certain of our East Coast terminals in April 2016.
• | Natural Gas Storage — Revenues decreased slightly for the year ended December 31, 2017 compared to the same 2016 period. Lower results due to the June 2017 sale of our Bluewater natural gas storage facility were largely offset by contributions from higher rates on new contracts replacing expiring contracts and more favorable market conditions for hub services. |
• | Rail Terminals — Revenues decreased by $26 million for the year ended December 31, 2017 compared to the year ended December 31, 2016 primarily due to lower activity at our U.S. terminals resulting from less favorable market conditions, partially offset by revenues and volumes from our Fort Saskatchewan, Alberta rail terminal that came online in April 2016. |
For the year ended December 31, 2016, rail terminals revenues decreased by $17 million compared to the year ended December 31, 2015 primarily due to lower activity at our U.S. terminals as a result of production declines in the Bakken and less favorable market conditions, partially offset by (i) revenue associated with minimum volume commitments at certain of our terminals and (ii) revenues and volumes from our Fort Saskatchewan rail terminal.
Field Operating Costs. Field operating costs decreased for the year ended December 31, 2017 compared to the same 2016 period due to reduced rail activity, cost reduction efforts and the sales of our Bluewater natural gas storage facility in June 2017 and certain of our East Coast terminals in April 2016. Such decreases were largely offset by an increase in operating costs associated with the Western Canada NGL assets acquired in August 2016 and increased power costs.
The decrease in field operating costs for the year ended December 31, 2016 compared to December 31, 2015 was primarily due to (i) lower costs related to contract services, largely at our rail terminals and, to a lesser extent, at our processing facilities, (ii) the impact from the sale of certain of our East Coast terminals in April 2016, (iii) lower turnaround and inspection costs and (iv) favorable foreign exchange fluctuation impacts of $4 million. Such decreases were partially offset by an increase in operating costs due to the Western Canada NGL assets acquired in August 2016.
92
Maintenance Capital. The increase in maintenance capital for 2017 compared to 2016 was primarily due to increased investment in our integrity management program, primarily on assets at our Southern California terminals. Total maintenance costs related to our integrity management program at these terminals increased by approximately $49 million for 2017 compared to 2016. While routine assessments and repairs will be required in the future, we expect significant reductions to our maintenance capital costs at these terminals going forward.
The decrease in maintenance capital for 2016 compared to 2015 was primarily due to lower spending on various tank and other maintenance capital projects, partially due to the timing of certain 2015 projects at our NGL storage and fractionation facilities.
Supply and Logistics Segment
Our revenues from supply and logistics activities reflect the sale of gathered and bulk-purchased crude oil, as well as sales of NGL volumes and natural gas sales attributable to activities that were previously performed by the natural gas storage commercial optimization group. Generally, our segment results are impacted by (i) increases or decreases in our Supply and Logistics segment volumes (which consist of lease gathering crude oil purchases volumes and NGL sales volumes), (ii) the effects of competition on our lease gathering and NGL margins and (iii) the overall volatility and strength or weakness of market conditions and the allocation of our assets among our various risk management strategies. In addition, the execution of our risk management strategies in conjunction with our assets can provide upside in certain markets. Although our segment results may be adversely affected during certain transitional periods as discussed further below, our crude oil and NGL supply, logistics and distribution operations are not directly affected by the absolute level of prices, but are affected by overall levels of supply and demand for crude oil and NGL, market structure and relative fluctuations in market-related indices and regional differentials.
93
The following tables set forth our operating results from our Supply and Logistics segment:
Variance | |||||||||||||||||||||||||||
Operating Results (1) (in millions, except per barrel data) | Year Ended December 31, | 2017-2016 | 2016-2015 | ||||||||||||||||||||||||
2017 | 2016 | 2015 | $ | % | $ | % | |||||||||||||||||||||
Revenues | $ | 25,065 | $ | 19,018 | $ | 21,945 | $ | 6,047 | 32 | % | $ | (2,927 | ) | (13 | )% | ||||||||||||
Purchases and related costs | (24,557 | ) | (18,627 | ) | (21,018 | ) | (5,930 | ) | (32 | )% | 2,391 | 11 | % | ||||||||||||||
Field operating costs | (254 | ) | (292 | ) | (433 | ) | 38 | 13 | % | 141 | 33 | % | |||||||||||||||
Segment general and administrative expenses (2) | (102 | ) | (108 | ) | (113 | ) | 6 | 6 | % | 5 | 4 | % | |||||||||||||||
Adjustments (3): | |||||||||||||||||||||||||||
(Gains)/losses from derivative activities net of inventory valuation adjustments | (50 | ) | 406 | 106 | (456 | ) | ** | 300 | ** | ||||||||||||||||||
Long-term inventory costing adjustments | (24 | ) | (58 | ) | 99 | 34 | ** | (157 | ) | ** | |||||||||||||||||
Equity-indexed compensation expense | 8 | 10 | 11 | (2 | ) | ** | (1 | ) | ** | ||||||||||||||||||
Net (gain)/loss on foreign currency revaluation | (26 | ) | 10 | (29 | ) | (36 | ) | ** | 39 | ** | |||||||||||||||||
Segment adjusted EBITDA | $ | 60 | $ | 359 | $ | 568 | $ | (299 | ) | (83 | )% | $ | (209 | ) | (37 | )% | |||||||||||
Maintenance capital | $ | 13 | $ | 10 | $ | 8 | $ | 3 | 30 | % | $ | 2 | 25 | % | |||||||||||||
Segment adjusted EBITDA per barrel | $ | 0.13 | $ | 0.85 | $ | 1.33 | $ | (0.72 | ) | (85 | )% | $ | (0.48 | ) | (36 | )% | |||||||||||
Variance | |||||||||||||||||||||||||||
Average Daily Volumes (in thousands of barrels per day) | Year Ended December 31, | 2017-2016 | 2016-2015 | ||||||||||||||||||||||||
2017 | 2016 | 2015 | Volume | % | Volume | % | |||||||||||||||||||||
Crude oil lease gathering purchases | 945 | 894 | 943 | 51 | 6 | % | (49 | ) | (5 | )% | |||||||||||||||||
NGL sales | 274 | 259 | 223 | 15 | 6 | % | 36 | 16 | % | ||||||||||||||||||
Supply and Logistics segment total volumes | 1,219 | 1,153 | 1,166 | 66 | 6 | % | (13 | ) | (1 | )% | |||||||||||||||||
** Indicates that variance as a percentage is not meaningful.
(1) | Revenues and costs include intersegment amounts. |
(2) | Segment general and administrative expenses reflect direct costs attributable to each segment and an allocation of other expenses to the segments. The proportional allocations by segment require judgment by management and are based on the business activities that exist during each period. |
(3) | Represents adjustments included in the performance measure utilized by our CODM in the evaluation of segment results. See Note 19 to our Consolidated Financial Statements for additional discussion of such adjustments. |
The following table presents the range of the NYMEX West Texas Intermediate benchmark price of crude oil (in dollars per barrel):
NYMEX WTI Crude Oil Price | ||||||||
During the Year Ended December 31, | Low | High | ||||||
2017 | $ | 43 | $ | 60 | ||||
2016 | $ | 26 | $ | 54 | ||||
2015 | $ | 35 | $ | 61 | ||||
94
Because the commodities that we buy and sell are generally indexed to the same pricing indices for both sales and purchases, revenues and costs related to purchases will fluctuate with market prices. However, the margins related to those sales and purchases will not necessarily have a corresponding increase or decrease. The absolute amount of our revenues and purchases increased for the year ended December 31, 2017 compared to the year ended December 31, 2016 primarily due to higher crude oil prices and volumes during the 2017 period. The absolute amount of our revenues and purchases decreased for the year ended December 31, 2016 compared to the same 2015 period primarily due to lower crude oil and NGL prices and lower NGL volumes during the period. Additionally, revenues and purchases were impacted by net gains and losses from certain derivative activities during the periods.
Our NGL operations are sensitive to weather-related demand, particularly during the approximate five-month peak heating season of November through March, and temperature differences from period-to-period may have a significant effect on NGL demand and thus our financial performance.
The following is a discussion of items impacting Supply and Logistics segment operating results for the periods indicated.
Net Revenues and Volumes. Our Supply and Logistics results have been impacted by crude oil and NGL margin compression and reduced arbitrage opportunities. However, for the year ended December 31, 2017, segment revenues, net of purchases and related costs, increased by $117 million over the year ended December 31, 2016 as lower results from these less favorable market conditions were offset by a favorable impact from certain derivative activities (as discussed further below). Revenues, net of purchases and related costs, decreased by $536 million for the year ended December 31, 2016 compared to the same 2015 period (of which $144 million was related to the mark-to-market impact of certain derivatives and long-term inventory costing adjustments). The following summarizes the significant items impacting the comparative periods:
• | Crude Oil Operations — Net revenues from our crude oil supply and logistics operations decreased for each comparative period primarily due to lower unit margins from continued and intensifying competition, largely due to overbuilt infrastructure underwritten with volume commitments, and the effect of such on differentials, which reduced arbitrage opportunities. See the “Market Overview and Outlook” section below for additional discussion of recent market conditions. |
• | NGL Operations — Net revenues from our NGL operations decreased for the year ended December 31, 2017 compared to the year ended December 31, 2016, largely due to (i) higher supply costs and tighter differentials driven by competition, which more than offset higher sales volume from the Western Canada NGL assets acquired in August 2016, (ii) warmer weather during the first-quarter 2017 heating season and (iii) higher storage and processing fees for the 2017 period, which were largely offset in our Facilities segment results. |
Net revenues from our NGL operations decreased for the year ended December 31, 2016 compared to the year ended December 31, 2015, largely due to (i) higher storage and processing fees for the 2016 periods, which were largely offset in our Facilities segment, and (ii) higher supply costs driven by competition, which more than offset higher sales volumes.
• | Impact from Certain Derivative Activities, Net of Inventory Valuation Adjustments — The impact from certain derivative activities on our net revenues includes mark-to-market and other gains and losses resulting from certain derivative instruments that are related to underlying activities in another period (or the reversal of mark-to-market gains and losses from a prior period) and inventory valuation adjustments, as applicable. See Note 12 to our Consolidated Financial Statements for a comprehensive discussion regarding our derivatives and risk management activities. These gains and losses impact our net revenues but are excluded from segment adjusted EBITDA and thus are reflected as an “Adjustment” in the table above. |
• | Long-Term Inventory Costing Adjustments — Our net revenues are impacted by changes in the weighted average cost of our crude oil and NGL inventory pools that result from price movements during the periods. These costing adjustments related to long-term inventory necessary to meet our minimum inventory requirements in third-party assets and other working inventory that was needed for our commercial operations. We consider this inventory necessary to conduct our operations and we intend to carry this inventory for the foreseeable future. These costing adjustments impact our net revenues but are excluded from segment adjusted EBITDA and thus are reflected as an “Adjustment” in the table above. |
95
• | Foreign Exchange Impacts — Our net revenues are impacted by fluctuations in the value of CAD to USD, resulting in foreign exchange gains and losses on U.S. denominated net assets within our Canadian operations. These gains and losses impact our net revenues but are excluded from segment adjusted EBITDA and thus are reflected as an “Adjustment” in the table above. |
Field Operating Costs. Field operating costs decreased for the year ended December 31, 2017 compared to the same 2016 period primarily due to lower trucking costs as pipeline expansion projects were placed into service.
The decrease in field operating costs for the year ended December 31, 2016 compared to the year ended December 31, 2015 was primarily due to a combination of (i) lower lease gathering volumes, (ii) shorter truck hauls and reduced use of third-party trucking services as pipeline expansion projects were placed into service, (iii) lower driver wages and (iv) a decrease in fuel prices.
Other Income and Expenses
Depreciation and Amortization
Depreciation and amortization expense increased for the year ended December 31, 2017 compared to the same period in 2016 largely driven by (i) an increase in impairments, accelerated depreciation and canceled projects during the 2017 period primarily associated with certain of our rail and other terminal assets, (ii) additional depreciation associated with acquisitions and the completion of various capital expansion projects and (iii) smaller net gains from non-core asset sales and joint venture formations recognized in the 2017 period.
Depreciation and amortization expense for the year ended December 31, 2016 includes net gains of approximately $100 million, which were primarily associated with non-core asset sales and joint venture formations during the period. Excluding such gains, depreciation and amortization expense increased for the year ended December 31, 2016 compared to the same period in 2015 primarily due to (i) additional depreciation associated with the completion of various capital expansion projects, (ii) the write-off of $33 million of costs associated with the discontinuation of certain capital projects during 2016 and (iii) an $18 million charge in 2016 related to assets taken out of service. In addition, the 2016 period was further impacted by impairments of $80 million associated with certain of our rail and other terminal assets.
See Note 5 and Note 6 to our Consolidated Financial Statements for additional information.
Interest Expense
Interest expense is primarily impacted by:
• | our weighted average debt balances; |
• | the level and maturity of fixed rate debt and interest rates associated therewith; |
• | market interest rates and our interest rate hedging activities on floating rate debt; and |
• | interest capitalized on capital projects. |
96
The following table summarizes the components impacting the interest expense variance (in millions, except percentages):
Average LIBOR | Weighted Average Interest Rate (1) | |||||||||
Interest expense for the year ended December 31, 2015 | $ | 443 | 0.2 | % | 4.4 | % | ||||
Impact of issuance and retirement of PAA senior notes | 15 | |||||||||
Impact of borrowings under credit facilities and PAA commercial paper program | 14 | |||||||||
Impact of lower capitalized interest | 10 | |||||||||
Other | (2 | ) | ||||||||
Interest expense for the year ended December 31, 2016 | $ | 480 | 0.5 | % | 4.4 | % | ||||
Impact of borrowings under credit facilities and PAA commercial paper program | 4 | |||||||||
Impact of lower capitalized interest | 12 | |||||||||
Other | 14 | |||||||||
Interest expense for the year ended December 31, 2017 | $ | 510 | 1.1 | % | 4.4 | % | ||||
(1) | Excludes commitment and other fees. |
See Note 10 to our Consolidated Financial Statements for additional information regarding our debt activities during the periods presented.
Other Income/(Expense), Net
The following table summarizes the components impacting Other income/(expense), net (in millions):
Year Ended December 31, | ||||||||||||
2017 | 2016 | 2015 | ||||||||||
Loss on early redemption of senior notes (1) | $ | (40 | ) | $ | — | $ | — | |||||
Gains related to mark-to-market adjustment of the Preferred Distribution Rate Reset Option (2) | 13 | 30 | — | |||||||||
Other | (4 | ) | 3 | (7 | ) | |||||||
$ | (31 | ) | $ | 33 | $ | (7 | ) | |||||
(1) | See Note 10 to our Consolidated Financial Statements for additional information. |
(2) | See Note 12 to our Consolidated Financial Statements for additional information. |
Income Tax Expense
Income tax expense increased for the year ended December 31, 2017 compared to the year ended December 31, 2016 due to (i) deferred tax expense recorded in the fourth quarter of 2017 related to the re-measurement of our deferred tax asset as a result of the enactment on December 22, 2017 of the Tax Cuts and Jobs Act, (ii) higher year-over-year income as impacted by fluctuations in derivative mark-to-market valuations in our Canadian operations during the 2017 period and (iii) higher deferred tax expense recorded in the first quarter of 2017 related to a change in our effective tax rate. See Note 13 to our Consolidated Financial Statements for additional information regarding the re-measurement of our deferred tax asset.
The decrease in income tax expense for the year ended December 31, 2016 compared to the year ended December 31, 2015 was primarily due to lower year-over-year income as impacted by fluctuations in derivative mark-to-market valuations in our Canadian operations during the 2016 period and the cumulative revaluation of Canadian net deferred tax liabilities resulting from a 2% Alberta, Canada provincial tax increase in the second quarter of 2015.
97
Outlook
Market Overview and Outlook
2017 marked the third full calendar year of a harsh downturn in the crude oil industry that started in mid-to-late 2014. This downturn has adversely impacted both the upstream and midstream sectors, but the near-term and long-term implications for each have varied. For example, the upstream sector was severely impacted initially, however, improvements in drilling and completion technology and efficiency and reductions in cost per barrel substantially reduced the oil price level required to generate attractive returns. In a +/- $50 per barrel oil price environment, these advancements provide long-term visibility for sustained U.S. production levels generally and significant growth opportunities in several regions, particularly with respect to the Permian Basin. Oil prices increased near the end of 2017 and have averaged above $60 per barrel in early 2018.
With respect to the crude oil midstream sector, the initial adverse impacts were somewhat muted as volume growth continued through mid-2015, but soon thereafter were adversely impacted by a variety of interrelated issues. These included production decreases or lower than anticipated growth throughout the U.S. which, in combination with the completion of multi-year infrastructure projects and new midstream entrants backed by private institutional capital, created excess takeaway capacity. The excess takeaway capacity resulted in competition that was amplified by excess minimum volume commitments, which also had a dramatic impact on historical regional differentials. The net effect of these developments lowered minimum return thresholds, increased risk and decreased margins of many of the larger established business platforms. As one of the largest U.S. crude oil midstream businesses, we experienced all of these challenges.
We believe the long-term view for the crude oil midstream sector and for PAA is strong. Underpinned by technological advancements, U.S. Lower 48 crude oil production is positioned to grow significantly over the next several years, with the Permian Basin representing the most attractive and significant growth region. We believe we are well positioned to grow our fee-based businesses due to our leading crude oil midstream positions in substantially all U.S. regions and crude oil hubs, including our significant Permian Basin gathering, marketing, pipeline and terminalling network. In addition, PAA has made a number of meaningful investments that will be commencing operations in the near future or continuing to ramp up to full run-rate cash flow.
Despite this positive long-term positioning, over the last few years we have generated lower than expected multi-year growth in our fee-based segments and experienced reduced profitability in our Supply and Logistics segment; in turn, these developments have elevated our credit metrics relative to our targeted range and our trailing distribution coverage has been below levels we consider sustainable. Additionally, access to conventional financial markets historically relied upon by master limited partnerships (“MLP”) to finance growth-oriented projects and manage debt levels has been both challenging and limited.
Taking all these factors into account, as well as the dilutive costs of accessing traditional MLP equity markets to reduce leverage or finance growth in a weak MLP equity environment, in August 2017 we announced a number of significant actions designed to enable us to deliver operating and financial performance in line with our plans and enhance the long-term franchise value for all of our stakeholders. The cumulative effect of these actions should meaningfully reduce debt, improve our credit metrics, significantly reduce and/or eliminate the need to issue incremental common equity for routine expansion activities and enhance our ability to capitalize on attractive industry opportunities. Importantly, these actions are consistent with our objective to defend our investment grade credit metrics, restore strong distribution coverage and drive sustainable distribution growth capacity.
Relative to mid-year 2017 balances, the leverage reduction plan is designed to reduce debt by approximately $1.4 billion over a six quarter period ending March 31, 2019. We believe we are on track with our plan and we expect to achieve our deleveraging objectives and targeted credit metrics by the original March 31, 2019 target date, while maintaining a strong distribution coverage ratio comprised predominantly of fee-based cash flow sources.
However, we can provide no assurance that we will be able to achieve the objectives set forth above or that our efforts will generate targeted results. See Item 1A. “Risk Factors—Risks Related to PAA’s Business.”
98
Outlook for Certain Idled and Underutilized Assets
During 2015, we shut down Line 901 and a portion of Line 903 in California following the release of crude oil from Line 901 (see Note 17 to our Consolidated Financial Statements for additional information). During the period since these pipelines were idled, we have been assessing potential alternatives in order to return them to operation. Some of the alternatives under consideration could result in incurring costs associated with retiring certain assets or an impairment of some or all of the carrying value of the idled property and equipment, which was approximately $127 million as of December 31, 2017.
We own a 54% undivided joint interest in the Capline system, which originates in St. James, Louisiana and terminates in Patoka, Illinois. The construction of new crude oil pipeline infrastructure and the ongoing changing crude oil flows in the United States may result in a decline in volumes on the Capline system to levels that cannot sustain operations. The owners of the Capline system are considering various alternatives for the use of the pipeline system, including an assessment of the commercial potential to reverse the pipeline direction within the next several years. In early October 2017, the Capline owners launched a non-binding open season to gauge shipper interest in a possible reversal of the Capline system. This non-binding open season concluded in November, and in December 2017 the operator of the Capline system announced that the owners are proceeding with planning for a potential reversal of the Capline system and are planning to evaluate next steps required for a potential binding open season. If the Capline system were to not be reversed, this could result in the Capline owners incurring costs associated with retiring certain assets and/or an impairment of the carrying value of our interest in the Capline system, which was $195 million as of December 31, 2017.
Liquidity and Capital Resources
General
On a consolidated basis, our primary sources of liquidity are (i) cash flow from operating activities as further discussed below in the section entitled “—Cash Flow from Operating Activities,” (ii) borrowings under PAA’s credit facilities or the PAA commercial paper program and (iii) funds received from sales of equity and debt securities. In addition, we may supplement these sources of liquidity with proceeds from our asset sales program, as further discussed below in the section entitled “—Acquisitions, Investments, Expansion Capital Expenditures and Divestitures.” Our primary cash requirements include, but are not limited to, (i) ordinary course of business uses, such as the payment of amounts related to the purchase of crude oil, NGL and other products, other expenses and interest payments on outstanding debt, (ii) expansion and maintenance activities, (iii) acquisitions of assets or businesses, (iv) repayment of principal on long-term debt and (v) distributions to our Class A shareholders and noncontrolling interests. We generally expect to fund our short-term cash requirements through cash flow generated from operating activities and/or borrowings under the PAA commercial paper program or PAA’s credit facilities. In addition, we generally expect to fund our long-term needs, such as those resulting from expansion activities or acquisitions and refinancing long-term debt, through a variety of sources (either separately or in combination), which may include the sources mentioned above as funding for short-term needs and/or the issuance of additional equity or debt securities and the sale of assets. As of December 31, 2017, although we had a working capital deficit of $530 million, we had approximately $3.0 billion of liquidity available to meet our ongoing operating, investing and financing needs, subject to continued covenant compliance, as noted below (in millions):
As of December 31, 2017 | |||
Availability under PAA senior unsecured revolving credit facility (1) (2) | $ | 1,534 | |
Availability under PAA senior secured hedged inventory facility (1) (2) | 515 | ||
Availability under PAA senior unsecured 364-day revolving credit facility | 1,000 | ||
Amounts outstanding under PAA commercial paper program | (126 | ) | |
Subtotal | 2,923 | ||
Cash and cash equivalents | 40 | ||
Total | $ | 2,963 | |
(1) | Represents availability prior to giving effect to amounts outstanding under the PAA commercial paper program, which reduce available capacity under the facilities. |
(2) | Available capacity under the PAA senior unsecured revolving credit facility and the PAA senior secured hedged inventory facility was reduced by outstanding letters of credit of $66 million and $100 million, respectively. |
99
We believe that we have, and will continue to have, the ability to access the PAA commercial paper program and credit facilities, which we use to meet our short-term cash needs. We believe that our financial position remains strong and we have sufficient liquidity; however, extended disruptions in the financial markets and/or energy price volatility that adversely affect our business may have a materially adverse effect on our financial condition, results of operations or cash flows. In addition, usage of the PAA credit facilities, which provide a financial backstop for the PAA commercial paper program, is subject to ongoing compliance with covenants. As of December 31, 2017, PAA was in compliance with all such covenants. Also, see Item 1A. “Risk Factors” for further discussion regarding such risks that may impact our liquidity and capital resources.
Cash Flow from Operating Activities
The primary drivers of cash flow from operating activities are (i) the collection of amounts related to the sale of crude oil, NGL and other products, the transportation of crude oil and other products for a fee, and the provision of storage and terminalling services for a fee and (ii) the payment of amounts related to the purchase of crude oil, NGL and other products and other expenses, principally field operating costs, general and administrative expenses and interest expense.
Cash flow from operating activities can be materially impacted by the storage of crude oil in periods of a contango market, when the price of crude oil for future deliveries is higher than current prices. In the month we pay for the stored crude oil, we borrow under the credit facilities or the PAA commercial paper program (or use cash on hand) to pay for the crude oil, which negatively impacts operating cash flow. Conversely, cash flow from operating activities increases during the period in which we collect the cash from the sale of the stored crude oil. Similarly, the level of NGL and other product inventory stored and held for resale at period end affects our cash flow from operating activities.
In periods when the market is not in contango, we typically sell our crude oil during the same month in which we purchase it and we do not rely on borrowings under the credit facilities or the PAA commercial paper program to pay for the crude oil. During such market conditions, our accounts payable and accounts receivable generally move in tandem as we make payments and receive payments for the purchase and sale of crude oil in the same month, which is the month following such activity. In periods during which we build inventory, regardless of market structure, we may rely on the credit facilities or the PAA commercial paper program to pay for the inventory. In addition, we use derivative instruments to manage the risks associated with the purchase and sale of our commodities. Therefore, our cash flow from operating activities may be impacted by the margin deposit requirements related to our derivative activities. See Note 12 to our Consolidated Financial Statements for a discussion regarding our derivatives and risk management activities.
Net cash provided by operating activities for the years ended December 31, 2017, 2016 and 2015 was approximately $2.5 billion, $0.7 billion and $1.3 billion, respectively, and primarily resulted from earnings from our operations. Additionally, as discussed further below, changes in our inventory levels during these years impacted our cash flow from operating activities.
During 2017, net cash provided by operating activities for the 2017 period was positively impacted by decreases in (i) the volume of crude oil inventory that we held and (ii) the margin balances required as part of our hedging activities, both of which had been funded by short-term debt. This was consistent with our plan to reduce our hedged inventory volumes, and the cash inflows associated with these items resulted in a favorable impact on our cash provided by operating activities. However, the favorable effects from such activities were partially offset by higher weighted average prices and volumes for NGL inventory that was purchased and stored at the end of the 2017 period in anticipation of the 2017-2018 heating season.
During 2016, we increased our inventory levels and margin balances required as part of our hedging activities that were funded by short-term debt, resulting in an unfavorable impact on our cash provided by operating activities. Furthermore, cash provided by operating activities as compared to prior periods was unfavorably impacted by the decrease in cash from overall earnings.
During 2015, we increased the amount of our inventory; however, these volumetric increases were largely offset by lower prices for our inventory stored at the end of the year compared to prior year amounts.
Acquisitions, Investments, Expansion Capital Expenditures and Divestitures
In addition to our operating needs discussed above, on a consolidated basis, we also use cash for our acquisition activities and expansion capital projects. Historically, we have financed these expenditures primarily with cash generated by operating activities and the financing activities discussed in “—Equity and Debt Financing Activities” below. In the near term, we also intend to use proceeds from our asset sales program, as discussed further below. We have made and will continue to make capital expenditures for acquisitions, expansion capital projects and maintenance activities. Also see “—Acquisitions and Capital Projects” for further discussion of such capital expenditures.
100
Acquisitions. The price of acquisitions includes cash paid, assumed liabilities and net working capital items. Because of the non-cash items included in the total price of the acquisition and the timing of certain cash payments, the net cash paid may differ significantly from the total price of the acquisitions completed during the year. During the years ended December 31, 2017, 2016 and 2015, we paid cash of $1.280 billion (net of cash acquired of $4 million), $282 million (net of cash acquired of $7 million) and $105 million, respectively, for acquisitions.
Acquisitions completed in 2017 primarily included the ACC System located in the Northern Delaware Basin in Southeastern New Mexico and West Texas. The ACC acquisition was initially funded through borrowings under PAA’s senior unsecured revolving credit facility. Such borrowings were subsequently repaid with proceeds from PAA’s March 2017 issuance of its common units to AAP pursuant to the Omnibus Agreement and in connection with our underwritten equity offering. Additionally, we and an affiliate of Noble Midstream Partners LP completed the acquisition of Advantage Pipeline, L.L.C. through a newly formed 50/50 joint venture. For our 50% share ($66.5 million), PAA contributed approximately 1.3 million of its common units and approximately $26 million in cash. See Note 6 to our Consolidated Financial Statements for discussion of our acquisition activities.
Divestitures. In 2016, we initiated a program to evaluate potential sales of non-core assets and/or sales of partial interests in assets to strategic joint venture partners to optimize our asset portfolio and strengthen our balance sheet and leverage metrics. During the years ended December 31, 2017 and 2016, we received proceeds of $1.083 billion and $569 million (net of $85 million paid for a remaining interest in a pipeline that was subsequently sold during 2016), respectively. Such proceeds were used to fund a portion of our expansion capital projects during each year and for general partnership purposes. See Note 6 to our Consolidated Financial Statements for additional information regarding these asset sales and divestitures.
2018 Capital Projects. The majority of our 2018 expansion capital program will be invested in our fee-based Transportation and Facilities segments. We expect that our investments will have minimal contributions to our 2018 results, but will provide growth for 2019 and beyond. Our 2018 capital program includes the following projects as of February 2018 with the estimated cost for the entire year (in millions):
Projects | 2018 | |||
Permian Basin Takeaway Pipeline Projects | $ | 765 | ||
Complementary Permian Basin Projects | 375 | |||
Selected Facilities Projects (1) | 50 | |||
Other Projects | 210 | |||
Total Projected 2018 Expansion Capital Expenditures (2) | $ | 1,400 | ||
(1) | Includes projects at our St. James, Fort Saskatchewan and other terminals. |
(2) | Amounts reflect our expectation that certain projects will be owned in a joint venture structure with a proportionate share of the project cost dispersed among the partners. |
Credit Agreements, Commercial Paper Program and Indentures
At December 31, 2017, PAA had four primary credit arrangements. These include a $1.6 billion senior unsecured revolving credit facility maturing in 2022, a $1.4 billion senior secured hedged inventory facility maturing in 2020 and a $1 billion, 364-day senior unsecured credit facility maturing in August 2018. Additionally, PAA has a $3.0 billion unsecured commercial paper program that is backstopped by its revolving credit facility and its hedged inventory facility. The PAA credit agreements (which impact the ability to access the PAA commercial paper program because they provide the financial backstop that supports PAA’s short-term credit ratings) and the indentures governing PAA’s senior notes contain cross-default provisions. A default under PAA’s credit agreements would permit the lenders to accelerate the maturity of the outstanding debt. As long as PAA is in compliance with the provisions in its credit agreements, PAA’s ability to make distributions of available cash is not restricted. PAA was in compliance with the covenants contained in its credit agreements and indentures as of December 31, 2017.
101
During the year ended December 31, 2017, we had net repayments on the credit facilities and PAA commercial paper program of $654 million. The net repayments resulted primarily from cash flow from operating activities and cash received from PAA’s equity activities and asset divestitures, which offset borrowings during the period related to funding needs for (i) acquisition and capital investments, (ii) repayment of PAA’s $400 million, 6.13% senior notes in January 2017, (iii) repayment of PAA’s $600 million, 6.50% senior notes and $350 million, 8.75% senior notes in December 2017 and (iv) other general partnership purposes.
During the year ended December 31, 2016, we had net repayments under the credit facilities and PAA commercial paper program of $676 million. The net repayments resulted primarily from cash flow from operating activities as well as cash received from PAA’s equity issuances and asset divestitures, which offset borrowings during the period related to funding needs for (i) inventory purchases and related margin balances required as part of our hedging activities, (ii) capital investments, (iii) repayment of PAA’s $175 million senior notes in August 2016, (iv) repayment of $642 million of borrowings that PAA assumed under AAP’s senior secured credit agreement in connection with the Simplification Transactions and (v) other general partnership purposes.
During the year ended December 31, 2015, we had net borrowings under the credit facilities and PAA commercial paper program of $954 million. These net borrowings resulted primarily from funding needs for (i) capital investments, (ii) repayment of PAA senior notes that matured during 2015 and (iii) other general partnership purposes, and were partially offset by repayments from cash received from PAA’s debt and equity issuances.
Equity and Debt Financing Activities
On a consolidated basis, our financing activities primarily relate to funding expansion capital projects, acquisitions and refinancing of debt maturities, as well as short-term working capital and hedged inventory borrowings related to our NGL business and contango market activities. Our financing activities have primarily consisted of PAA equity offerings, PAA senior notes offerings and borrowings and repayments under the credit facilities or the PAA commercial paper program, as well as payment of distributions to our Class A shareholders and noncontrolling interests.
PAGP Registration Statements. We have filed with the SEC a shelf registration statement that, subject to effectiveness at the time of use, allows us to issue up to an aggregate of $1.0 billion of equity securities ( the “PAGP Traditional Shelf”). Our issuances of equity securities associated with our Continuous Offering Program have been issued pursuant to the PAGP Traditional Shelf. At December 31, 2017, we had approximately $939 million of unsold securities available under the PAGP Traditional Shelf. Additionally, in February 2017, we filed a universal shelf registration statement (the “PAGP WKSI Shelf”), which provides us with the ability to offer and sell an unlimited amount of equity securities, subject to market conditions and capital needs. Our 2017 underwritten equity offering was conducted under the PAGP WKSI Shelf.
Sales of Class A Shares. The following table summarizes our sales of Class A shares during the year ended December 31, 2017, all of which occurred in the first four months of the year (net proceeds in millions). We did not sell any Class A shares during the years ended December 31, 2016 or 2015.
Type of Offering | Class A Shares Issued | Net Proceeds (1) | ||||||
Continuous Offering Program | 1,786,326 | $ | 61 | (2) (3) | ||||
Underwritten Offering | 48,300,000 | 1,474 | (3) | |||||
50,086,326 | $ | 1,535 | ||||||
(1) | Amounts are net of costs associated with the offerings. |
(2) | We pay commissions to our sales agents in connection with issuances of Class A shares under our Continuous Offering Program. We paid $1 million of such commissions during the year ended December 31, 2017. |
(3) | Pursuant to the Omnibus Agreement entered into in conjunction with the Simplification Transactions, we used the net proceeds from the sale of our Class A shares, after deducting the sales agents’ commissions and offering expenses, to purchase from AAP a number of AAP units equal to the number of Class A shares sold in such offering at a price equal to the net proceeds from such offering. Also pursuant to the Omnibus Agreement, immediately following such purchase and sale, AAP used the net proceeds it received from such sale of AAP units to us to purchase from PAA an equivalent number of common units of PAA. |
102
PAA Registration Statements. PAA periodically accesses the capital markets for both equity and debt financing. PAA has filed with the SEC a universal shelf registration statement that, subject to effectiveness at the time of use, allows PAA to issue up to an aggregate of $2.0 billion of debt or equity securities (the “ PAA Traditional Shelf”). All issuances of PAA equity securities associated with PAA’s continuous offering program have been issued pursuant to the PAA Traditional Shelf. At December 31, 2017, PAA had approximately $1.1 billion of unsold securities available under the PAA Traditional Shelf. PAA also has access to a universal shelf registration statement (“PAA WKSI Shelf”), which provides it with the ability to offer and sell an unlimited amount of debt and equity securities, subject to market conditions and capital needs. The issuance of PAA’s Series B preferred units in October 2017, discussed below, was conducted under the PAA WKSI Shelf.
PAA Sales of Common Units. The following table summarizes the sales of PAA’s common units during the three years ended December 31, 2017 (net proceeds in millions):
Year | Type of Offering | Units Issued | Net Proceeds (1) | |||||||
2017 Total | Continuous Offering Program | 4,033,567 | $ | 129 | (2) | |||||
2016 Total | Continuous Offering Program | 26,278,288 | $ | 796 | (2) | |||||
2015 | Continuous Offering Program | 1,133,904 | $ | 58 | (2) | |||||
2015 | Underwritten Offering | 21,000,000 | 1,041 | (3) | ||||||
2015 Total | 22,133,904 | $ | 1,099 | |||||||
(1) | Amounts are net of costs associated with the offerings. |
(2) | PAA pays commissions to its sales agents in connection with common unit issuances under its Continuous Offering Program. PAA paid $1 million, $8 million and $1 million of such commissions during 2017, 2016 and 2015, respectively. The net proceeds from these offerings were used for general partnership purposes. |
(3) | A portion of the net proceeds from such offering was used to repay borrowings under the PAA commercial paper program and the remaining net proceeds were used for general partnership purposes, including expenditures for our 2015 capital program. |
Omnibus Agreement. PAA may sell common units to AAP pursuant to the Omnibus Agreement entered into by the Plains Entities. During the year ended December 31, 2017, pursuant to the Omnibus Agreement, PAA sold (i) approximately 1.8 million common units to AAP in connection with our issuance of Class A shares under our Continuous Offering Program and (ii) 48.3 million common units to AAP in connection with our March 2017 underwritten offering. See Note 11 to our Consolidated Financial Statements for additional information.
PAA Series A Preferred Units. In January 2016, PAA completed the private placement of approximately 61.0 million Series A preferred units at a price of $26.25 per unit resulting in total net proceeds, after deducting offering expenses and the 2% transaction fee due to the purchasers, of approximately $1.6 billion. The net proceeds were used for capital expenditures, repayment of debt and general partnership purposes. See Note 11 to our Consolidated Financial Statements for further discussion of PAA’s Series A preferred units.
PAA Series B Preferred Units. On October 10, 2017, PAA issued 800,000 Series B preferred units at a price to the public of $1,000 per unit. PAA used the net proceeds of $788 million, after deducting the underwriters’ discounts and offering expenses, from the issuance of the Series B preferred units to repay amounts outstanding under its credit facilities and commercial paper program and for general partnership purposes, including expenditures for our capital program. See Note 11 to our Consolidated Financial Statements for additional information regarding PAA’s Series B preferred units.
While PAA’s Series A and Series B preferred units are considered equity securities and are classified within partners’ capital on our Consolidated Balance Sheet, two out of the three rating agencies only ascribe 50% equity credit with the remaining 50% considered debt for purposes of determining PAA’s credit ratings. The remaining rating agency ascribes 100% equity credit.
103
Issuances of PAA Senior Notes. During 2016 and 2015, PAA issued senior unsecured notes as summarized in the table below (in millions). PAA did not issue any senior unsecured notes during the year ended December 31, 2017.
Year | Description | Maturity | Face Value | Gross Proceeds(1) | Net Proceeds(2) | |||||||||||
2016 | 4.50% PAA Senior Notes issued at 99.716% of face value (3) | December 2026 | $ | 750 | $ | 748 | $ | 741 | ||||||||
2015 | 4.65% PAA Senior Notes issued at 99.846% of face value (3) | October 2025 | $ | 1,000 | $ | 998 | $ | 990 | ||||||||
(1) | Face value of notes less the applicable premium or discount (before deducting for initial purchaser discounts, commissions and offering expenses). |
(2) | Face value of notes less the applicable premium or discount, initial purchaser discounts, commissions and offering expenses. |
(3) | The net proceeds from this offering were used to repay outstanding borrowings under PAA’s credit facilities or the PAA commercial paper program and for general partnership purposes. |
Repayments of PAA Senior Notes. During the last three years, PAA repaid the following senior unsecured notes (in millions):
Year | Description | Repayment Date | ||||
2017 | $400 million 6.13% PAA Senior Notes due January 2017 | January 2017 | (1) | |||
2017 | $600 million 6.50% PAA Senior Notes due May 2018 | December 2017 | (1) (2) | |||
2017 | $350 million 8.75% PAA Senior Notes due May 2019 | December 2017 | (1) (2) | |||
2016 | $175 million 5.88% PAA Senior Notes due August 2016 | August 2016 | (1) | |||
2015 | $150 million 5.25% PAA Senior Notes due June 2015 | June 2015 | (3) | |||
2015 | $400 million 3.95% PAA Senior Notes due September 2015 | September 2015 | (3) | |||
(1) | These senior notes were repaid with cash on hand and proceeds from borrowings under the PAA credit facilities and commercial paper program. |
(2) | In conjunction with the early redemptions of these PAA senior notes, we recognized a loss of approximately $40 million, recorded to Other income/(expense), net in our Consolidated Statement of Operations. |
(3) | These senior notes were repaid with proceeds from borrowings under the PAA commercial paper program. |
Distributions to our Class A shareholders
We distribute 100% of our available cash within 55 days following the end of each quarter to Class A shareholders of record. Available cash is generally defined as all of our cash and cash equivalents on hand at the end of each quarter less reserves established in the discretion of our general partner for future requirements. On February 14, 2018, we paid a quarterly distribution of $0.30 per Class A share ($1.20 per Class A share on an annualized basis). See Note 11 to our Consolidated Financial Statements for details of distributions paid during the three years ended December 31, 2017. Also, see Item 5. “Market for Registrant’s Shares, Related Shareholder Matters and Issuer Purchases of Equity Securities—Cash Distribution Policy” for additional discussion regarding distributions.
Distributions to noncontrolling interests. During the years ended December 31, 2017, 2016 and 2015, distributions of approximately $1.1 billion, $1.4 billion and $1.5 billion, respectively, were paid to noncontrolling interests. These amounts represent distributions paid on interests in PAA, AAP and SLC Pipeline LLC that were not owned by us.
104
We believe that we have sufficient liquid assets, cash flow from operating activities and borrowing capacity under the credit agreements to meet our financial commitments, debt service obligations, contingencies and anticipated capital expenditures. We are, however, subject to business and operational risks that could adversely affect our cash flow. A prolonged material decrease in our cash flows would likely produce an adverse effect on our borrowing capacity.
Contingencies
For a discussion of contingencies that may impact us, see Note 17 to our Consolidated Financial Statements.
Commitments
Contractual Obligations. In the ordinary course of doing business, we purchase crude oil and NGL from third parties under contracts, the majority of which range in term from thirty-day evergreen to five years, with a limited number of contracts with remaining terms extending up to ten years. We establish a margin for these purchases by entering into various types of physical and financial sale and exchange transactions through which we seek to maintain a position that is substantially balanced between purchases on the one hand and sales and future delivery obligations on the other. The table below includes purchase obligations related to these activities. Where applicable, the amounts presented represent the net obligations associated with our counterparties (including giving effect to netting buy/sell contracts and those subject to a net settlement arrangement). We do not expect to use a significant amount of internal capital to meet these obligations, as the obligations will be funded by corresponding sales to entities that we deem creditworthy or who have provided credit support we consider adequate.
The following table includes our best estimate of the amount and timing of these payments as well as others due under the specified contractual obligations as of December 31, 2017 (in millions):
2018 | 2019 | 2020 | 2021 | 2022 | 2023 and Thereafter | Total | ||||||||||||||||||||||
Long-term debt and related interest payments (1) | $ | 657 | $ | 910 | $ | 870 | $ | 941 | $ | 1,073 | $ | 9,987 | $ | 14,438 | ||||||||||||||
Leases, rights-of-way easements and other (2) | 188 | 155 | 127 | 107 | 90 | 363 | 1,030 | |||||||||||||||||||||
Other obligations (3) | 297 | 192 | 155 | 161 | 122 | 452 | 1,379 | |||||||||||||||||||||
Subtotal | 1,142 | 1,257 | 1,152 | 1,209 | 1,285 | 10,802 | 16,847 | |||||||||||||||||||||
Crude oil, natural gas, NGL and other purchases (4) | 8,250 | 5,307 | 4,488 | 4,156 | 3,742 | 9,032 | 34,975 | |||||||||||||||||||||
Total | $ | 9,392 | $ | 6,564 | $ | 5,640 | $ | 5,365 | $ | 5,027 | $ | 19,834 | $ | 51,822 | ||||||||||||||
(1) | Includes debt service payments, interest payments due on PAA’s senior notes and the commitment fee on assumed available capacity under the PAA credit facilities and long-term borrowings under the PAA commercial paper program. Although there may be short-term borrowings under the PAA credit facilities and the PAA commercial paper program, we historically repay and borrow at varying amounts. As such, we have included only the maximum commitment fee (as if no short-term borrowings were outstanding on the PAA credit facilities or the PAA commercial paper program) in the amounts above. For additional information regarding our debt obligations, see Note 10 to our Consolidated Financial Statements. |
(2) | Leases are primarily for (i) railcars, (ii) land and surface rentals, (iii) office buildings, (iv) pipeline assets and (v) vehicles and trailers. Includes operating and capital leases as defined by FASB guidance, as well as obligations for rights-of-way easements. |
(3) | Includes (i) other long-term liabilities, (ii) storage, processing and transportation agreements and (iii) non-cancelable commitments related to our capital expansion projects, including projected contributions for our share of the capital spending of our equity method investments. The transportation agreements include approximately $760 million associated with an agreement to transport crude oil at posted tariff rates on a pipeline that is owned by an equity method investee, in which we own a 50% interest. Our commitment to transport is supported by crude oil buy/sell agreements with third parties (including Oxy) with commensurate quantities. |
105
(4) | Amounts are primarily based on estimated volumes and market prices based on average activity during December 2017. The actual physical volume purchased and actual settlement prices will vary from the assumptions used in the table. Uncertainties involved in these estimates include levels of production at the wellhead, weather conditions, changes in market prices and other conditions beyond our control. |
Letters of Credit. In connection with supply and logistics activities, we provide certain suppliers with irrevocable standby letters of credit to secure our obligation for the purchase and transportation of crude oil, NGL and natural gas. Our liabilities with respect to these purchase obligations are recorded in accounts payable on our balance sheet in the month the product is purchased. Generally, these letters of credit are issued for periods of up to seventy days and are terminated upon completion of each transaction. Additionally, we issue letters of credit to support insurance programs, derivative transactions and construction activities. At December 31, 2017 and 2016, we had outstanding letters of credit of approximately $166 million and $73 million, respectively.
Off-Balance Sheet Arrangements
We have no off-balance sheet arrangements as defined by Item 303 of Regulation S-K.
Investments in Unconsolidated Entities
We have invested in entities that are not consolidated in our financial statements. None of these entities are borrowers under credit facilities, and we are neither a co-borrower nor a guarantor under any facilities of such entities. We may elect at any time to make additional capital contributions to any of these entities. The following table sets forth selected information regarding these entities as of December 31, 2017 (unaudited, dollars in millions):
Entity | Type of Operation | Our Ownership Interest | Total Entity Assets | Total Cash and Restricted Cash | Total Entity Debt | |||||||||||
Advantage Pipeline, L.L.C. | Crude Oil Pipeline | 50% | $ | 140 | $ | 6 | $ | — | ||||||||
BridgeTex Pipeline Company, LLC | Crude Oil Pipeline | 50% | $ | 909 | $ | 46 | $ | — | ||||||||
Caddo Pipeline LLC | Crude Oil Pipeline (1) | 50% | $ | 130 | $ | 4 | $ | — | ||||||||
Cheyenne Pipeline LLC | Crude Oil Pipeline (1) | 50% | $ | 58 | $ | 4 | $ | — | ||||||||
Diamond Pipeline LLC | Crude Oil Pipeline (1) | 50% | $ | 904 | $ | 2 | $ | — | ||||||||
Eagle Ford Pipeline LLC | Crude Oil Pipeline (1) | 50% | $ | 808 | $ | 19 | $ | — | ||||||||
Eagle Ford Terminals Corpus Christi LLC | Crude Oil Terminal and Dock (2) | 50% | $ | 138 | $ | 2 | $ | — | ||||||||
Midway Pipeline LLC | Crude Oil Pipeline (1) | 50% | $ | 40 | $ | 2 | $ | — | ||||||||
Saddlehorn Pipeline Company, LLC | Crude Oil Pipeline | 40% | $ | 583 | $ | 32 | $ | — | ||||||||
Settoon Towing, LLC | Barge Transportation Services | 50% | $ | 74 | $ | 6 | $ | — | ||||||||
STACK Pipeline LLC | Crude Oil Pipeline (1) | 50% | $ | 160 | $ | 16 | $ | — | ||||||||
White Cliffs Pipeline, L.L.C. | Crude Oil Pipeline | 36% | $ | 529 | $ | 7 | $ | — | ||||||||
(1) | We serve as operator of the pipeline. |
(2) | Asset is currently under construction by the entity and has not yet been placed in service. |
106
Item 7A. Quantitative and Qualitative Disclosures About Market Risk
We are exposed to various market risks, including (i) commodity price risk, (ii) interest rate risk and (iii) currency exchange rate risk. We use various derivative instruments to manage such risks and, in certain circumstances, to realize incremental margin during volatile market conditions. Our risk management policies and procedures are designed to help ensure that our hedging activities address our risks by monitoring our exchange-cleared and over-the-counter positions, as well as physical volumes, grades, locations, delivery schedules and storage capacity. We have a risk management function that has direct responsibility and authority for our risk policies, related controls around commercial activities and certain aspects of corporate risk management. Our risk management function also approves all new risk management strategies through a formal process. The following discussion addresses each category of risk.
Commodity Price Risk
We use derivative instruments to hedge price risk associated with the following commodities:
• | Crude oil |
We utilize crude oil derivatives to hedge commodity price risk inherent in our Supply and Logistics and Transportation segments. Our objectives for these derivatives include hedging anticipated purchases and sales, stored inventory, and storage capacity utilization. We manage these exposures with various instruments including exchange-traded and over-the-counter futures, forwards, swaps and options.
• | Natural gas |
We utilize natural gas derivatives to hedge commodity price risk inherent in our Supply and Logistics and Facilities segments. Our objectives for these derivatives include hedging anticipated purchases of natural gas. We manage these exposures with various instruments including exchange-traded futures, swaps and options.
• | NGL and other |
We utilize NGL derivatives, primarily propane and butane derivatives, to hedge commodity price risk inherent in our Supply and Logistics segment. Our objectives for these derivatives include hedging anticipated purchases and sales and stored inventory. We manage these exposures with various instruments including exchange-traded and over-the-counter futures, forwards, swaps and options.
See Note 12 to our Consolidated Financial Statements for further discussion regarding our hedging strategies and objectives.
The fair value of our commodity derivatives and the change in fair value as of December 31, 2017 that would be expected from a 10% price increase or decrease is shown in the table below (in millions):
Fair Value | Effect of 10% Price Increase | Effect of 10% Price Decrease | |||||||||
Crude oil | $ | (62 | ) | $ | 7 | $ | (5 | ) | |||
Natural gas | (39 | ) | $ | 7 | $ | (7 | ) | ||||
NGL and other | (180 | ) | $ | (61 | ) | $ | 61 | ||||
Total fair value | $ | (281 | ) | ||||||||
The fair values presented in the table above reflect the sensitivity of the derivative instruments only and do not include the effect of the underlying hedged commodity. Price-risk sensitivities were calculated by assuming an across-the-board 10% increase or decrease in price regardless of term or historical relationships between the contractual price of the instruments and the underlying commodity price. In the event of an actual 10% change in near-term commodity prices, the fair value of our derivative portfolio would typically change less than that shown in the table as changes in near-term prices are not typically mirrored in delivery months further out.
107
Interest Rate Risk
Our use of variable rate debt and any forecasted issuances of fixed rate debt expose us to interest rate risk. Therefore, from time to time, we use interest rate derivatives to hedge interest rate risk associated with anticipated interest payments and, in certain cases, outstanding debt instruments. All of PAA’s senior notes are fixed rate notes and thus are not subject to interest rate risk. Our variable rate debt outstanding at December 31, 2017, approximately $911 million, was subject to interest rate re-sets that range from less than one week to approximately three weeks. The average interest rate on variable rate debt that was outstanding during the year ended December 31, 2017 was 2.1%, based upon rates in effect during the year. The fair value of our interest rate derivatives was a liability of $36 million as of December 31, 2017. A 10% increase in the forward LIBOR curve as of December 31, 2017 would have resulted in an increase of $32 million to the fair value of our interest rate derivatives. A 10% decrease in the forward LIBOR curve as of December 31, 2017 would have resulted in a decrease of $32 million to the fair value of our interest rate derivatives. See Note 12 to our Consolidated Financial Statements for a discussion of our interest rate risk hedging activities.
Currency Exchange Rate Risk
We use foreign currency derivatives to hedge foreign currency exchange rate risk associated with our exposure to fluctuations in the USD-to-CAD exchange rate. Because a significant portion of our Canadian business is conducted in CAD we use certain financial instruments to minimize the risks of unfavorable changes in exchange rates. These instruments include foreign currency exchange contracts, forwards and options. The fair value of our foreign currency derivatives was an asset of $4 million as of December 31, 2017. A 10% increase in the exchange rate (USD-to-CAD) would have resulted in a decrease of $56 million to the fair value of our foreign currency derivatives. A 10% decrease in the exchange rate (USD-to-CAD) would have resulted in an increase of $56 million to the fair value of our foreign currency derivatives. See Note 12 to our Consolidated Financial Statements for a discussion of our currency exchange rate risk hedging.
Preferred Distribution Rate Reset Option
The Preferred Distribution Rate Reset Option of PAA’s Series A preferred units is an embedded derivative that must be bifurcated from the related host contract, PAA’s partnership agreement, and recorded at fair value on our Consolidated Balance Sheets. The valuation model utilized for this embedded derivative contains inputs including PAA’s common unit price, ten-year U.S. treasury rates and default probabilities to ultimately calculate the fair value of PAA’s Series A preferred units with and without the Preferred Distribution Rate Reset Option. The fair value of this embedded derivative was a liability of $22 million as of December 31, 2017. A 10% increase or decrease in the fair value would have an impact of $2 million. See Note 12 to our Consolidated Financial Statements for a discussion of embedded derivatives.
Item 8. Financial Statements and Supplementary Data
See “Index to the Consolidated Financial Statements” on page F-1.
Item 9. Changes In and Disagreements With Accountants on Accounting and Financial Disclosure
None.
Item 9A. Controls and Procedures
Disclosure Controls and Procedures
We maintain written disclosure controls and procedures, which we refer to as our “DCP.” Our DCP is designed to ensure that information required to be disclosed by us in reports that we file under the Securities Exchange Act of 1934 (the “Exchange Act”) is (i) recorded, processed, summarized and reported within the time periods specified in the SEC’s rules and forms, and (ii) accumulated and communicated to management, including our Chief Executive Officer and Chief Financial Officer, to allow for timely decisions regarding required disclosure.
Applicable SEC rules require an evaluation of the effectiveness of our DCP. Management, under the supervision and with the participation of our Chief Executive Officer and Chief Financial Officer, has evaluated the effectiveness of our DCP as of December 31, 2017, the end of the period covered by this report, and, based on such evaluation, our Chief Executive Officer and Chief Financial Officer have concluded that our DCP is effective.
108
Internal Control over Financial Reporting
Management is responsible for establishing and maintaining adequate internal control over financial reporting. “Internal control over financial reporting” is a process designed by, or under the supervision of, our Chief Executive Officer and our Chief Financial Officer, and effected by our Board of Directors, management and other personnel, to provide reasonable assurance regarding the reliability of financial reporting and the preparation of financial statements for external purposes in accordance with GAAP. Our management, including our Chief Executive Officer and our Chief Financial Officer, has evaluated the effectiveness of our internal control over financial reporting as of December 31, 2017. See “Management’s Report on Internal Control Over Financial Reporting” on page F-2 of our Consolidated Financial Statements.
Our independent registered public accounting firm, PricewaterhouseCoopers LLP, assessed the effectiveness of our internal control over financial reporting, as stated in the firm’s report. See “Report of Independent Registered Public Accounting Firm” on page F-3 of our Consolidated Financial Statements.
Changes in Internal Control over Financial Reporting
There have been no changes in our internal control over financial reporting during the fourth quarter of 2017 that have materially affected, or are reasonably likely to materially affect, our internal control over financial reporting.
Certifications
The certifications of our Chief Executive Officer and Chief Financial Officer pursuant to Exchange Act Rules 13a-14(a) and 15d-14(a) are filed with this report as Exhibits 31.1 and 31.2. The certifications of our Chief Executive Officer and Chief Financial Officer pursuant to 18 U.S.C. 1350 are furnished with this report as Exhibits 32.1 and 32.2.
Item 9B. Other Information
There was no information that was required to be disclosed in a report on Form 8-K during the fourth quarter of 2017 that has not previously been reported.
109
PART III
Item 10. Directors and Executive Officers of Our General Partner and Corporate Governance
The information required by this item will be set forth in the Proxy Statement for our 2018 Annual Meeting, which will be filed with the SEC within 120 days after the end of the fiscal year ended December 31, 2017, and is incorporated herein by reference thereto.
Directors and Executive Officers
As of the date of filing this report, the following individuals were serving as our executive officers (for purposes of Item 401(b) of Regulation S-K) and/or directors:
Name | Principal Occupation or Employment | |
Greg L. Armstrong(1)(2) | Chairman of the Board and Chief Executive Officer | |
Harry N. Pefanis(1)(2) | President, Chief Commercial Officer and Director | |
Willie Chiang(1)(2) | Executive Vice President, Chief Operating Officer and Director | |
Al Swanson(1) | Executive Vice President and Chief Financial Officer | |
Richard K. McGee(1) | Executive Vice President, General Counsel and Secretary | |
Daniel J. Nerbonne(1) | Executive Vice President, Operations and Engineering | |
Chris Herbold(1) | Vice President, Accounting and Chief Accounting Officer | |
Oscar K. Brown(2) | Senior Vice President, Corporate Strategy and Development, Occidental Petroleum Corporation | |
Victor Burk(2) | Managing Director, Alvarez and Marsal | |
Everardo Goyanes(2) | Founder, Ex Cathedra LLC | |
Gary R. Petersen(2) | Managing Partner, EnCap Investments L.P. | |
John T. Raymond(2) | Managing Partner and Chief Executive Officer, The Energy & Minerals Group | |
Bobby S. Shackouls(2) | Former Chairman and CEO, Burlington Resources Inc. | |
Robert V. Sinnott(2) | Co-Chairman, Kayne Anderson Capital Advisors, L.P. | |
J. Taft Symonds(2) | Chairman, Symonds Investment Company, Inc. | |
Christopher M. Temple(2) | President, DelTex Capital LLC | |
(1) | Executive officer (for purposes of Item 401(b) of Regulation S-K) |
(2) | Director |
A complete list of our officers, including the executive officers listed above, is available on our website at plainsallamerican.com under Investor Relations - Company Information - Management.
Item 11. Executive Compensation
The information required by this item will be set forth in the Proxy Statement for our 2018 Annual Meeting, which will be filed with the SEC within 120 days after the end of the fiscal year ended December 31, 2017, and is incorporated herein by reference thereto.
Item 12. Security Ownership of Certain Beneficial Owners and Management and Related Shareholder Matters
The information required by this item will be set forth in the Proxy Statement for our 2018 Annual Meeting, which will be filed with the SEC within 120 days after the end of the fiscal year ended December 31, 2017, and is incorporated herein by reference thereto.
110
Item 13. Certain Relationships and Related Transactions, and Director Independence
The information required by this item will be set forth in the Proxy Statement for our 2018 Annual Meeting, which will be filed with the SEC within 120 days after the end of the fiscal year ended December 31, 2017, and is incorporated herein by reference thereto.
Item 14. Principal Accountant Fees and Services
The information required by this item will be set forth in the Proxy Statement for our 2018 Annual Meeting, which will be filed with the SEC within 120 days after the end of the fiscal year ended December 31, 2017, and is incorporated herein by reference thereto.
111
PART IV
Item 15. Exhibits and Financial Statement Schedules
(a) (1) Financial Statements
See “Index to the Consolidated Financial Statements” set forth on Page F-1.
(2) Financial Statement Schedules
All schedules are omitted because they are either not applicable or the required information is shown in the Consolidated Financial Statements or notes thereto.
(3) Exhibits
Exhibit No. | Description | |||
2.1* | — | |||
2.2 | — | |||
2.3** | — | |||
2.4** | — | |||
2.5** | — | |||
3.1 | — | |||
3.2 | — | |||
3.3 | — | |||
3.4 | — | |||
3.5 | — | |||
3.6 | — | |||
112
3.7 | — | |||
3.8 | — | |||
4.1 | — | |||
4.2 | — | |||
4.3 | — | |||
4.4 | — | |||
4.5 | — | |||
4.6 | — | |||
4.7 | — | |||
4.8 | — | |||
4.9 | — | |||
4.10 | — | |||
4.11 | — | |||
4.12 | — | |||
4.13 | — | |||
113
4.14 | — | |||
4.15 | — | |||
4.16 | — | |||
4.17 | — | |||
10.1 | — | |||
10.2 | — | |||
10.3 | — | |||
10.4 | — | |||
10.5 | — | |||
10.6 | — | |||
10.7 | — | |||
10.8 | — | |||
114
10.9 | — | |||
10.10 | — | |||
10.11 | — | |||
10.12 | — | |||
10.13 | — | |||
10.14 | — | |||
10.15 | — | |||
10.16 | — | |||
10.17 | — | |||
10.18 | — | |||
10.19*** | — | |||
115
10.20 | — | |||
10.21 | — | |||
10.22 | — | |||
10.23 | — | |||
10.24 | — | |||
10.25 | — | |||
10.26 | — | |||
10.27 | — | |||
10.28 | — | |||
10.29 | — | |||
10.30*** | — | |||
10.31*** | — | |||
10.32*** | — | |||
10.33*** | — | |||
10.34*** | — | |||
10.35*** | — | |||
116
10.36*** | — | |||
10.37*** | — | |||
10.38*** | — | |||
10.39*** | — | |||
10.40*** | — | |||
10.41*** | — | |||
10.42*** | — | |||
10.43*** | — | |||
10.44*** | — | |||
10.45*** | — | |||
10.46*** | ||||
10.47*** | — | |||
10.48*** | — | |||
10.49*** | — | |||
10.50*** | — | |||
10.51*** | — | |||
10.52*** | — | |||
10.53*** | — | |||
10.54*** | — | |||
117
10.55*** | — | |||
10.56*** | — | |||
10.57*** | — | |||
10.58*** | — | |||
10.59*** | — | |||
10.60*** | — | |||
10.61*** | — | |||
10.62*** | — | |||
10.63*** | — | |||
10.64*** | ||||
10.65 | — | |||
21.1 † | — | |||
23.1 † | — | |||
31.1 † | — | |||
31.2 † | — | |||
32.1 †† | — | |||
32.2 †† | — | |||
101. INS† | — | XBRL Instance Document | ||
101.SCH† | — | XBRL Taxonomy Extension Schema Document | ||
101.CAL† | — | XBRL Taxonomy Extension Calculation Linkbase Document | ||
101.DEF† | — | XBRL Taxonomy Extension Definition Linkbase Document | ||
101.LAB† | — | XBRL Taxonomy Extension Label Linkbase Document | ||
101.PRE† | — | XBRL Taxonomy Extension Presentation Linkbase Document | ||
† | Filed herewith. |
118
†† | Furnished herewith. |
* Certain confidential portions of this exhibit have been omitted pursuant to an Application for Confidential Treatment under Rule 24b-2 under the Exchange Act. This exhibit, with the omitted language, has been filed separately with the Securities and Exchange Commission.
** Certain schedules have been omitted pursuant to Item 601(b)(2) of Regulation S-K. A copy of any omitted schedule will be furnished supplementally to the SEC upon request.
*** Management compensatory plan or arrangement.
Item 16. Form 10-K Summary
None.
119
SIGNATURES
Pursuant to the requirements of Section 13 or 15(d) of the Securities Exchange Act of 1934, the registrant has duly caused this report to be signed on its behalf by the undersigned, thereunto duly authorized.
PLAINS GP HOLDINGS, L.P. | ||
By: | PAA GP HOLDINGS LLC, | |
its general partner | ||
By: | /s/ Greg L. Armstrong | |
Greg L. Armstrong, | ||
Chairman of the Board, Chief Executive Officer | ||
and Director of PAA GP Holdings LLC | ||
(Principal Executive Officer) | ||
February 26, 2018 | ||
By: | /s/ Al Swanson | |
Al Swanson, | ||
Executive Vice President and Chief Financial Officer | ||
of PAA GP Holdings LLC | ||
(Principal Financial Officer) | ||
February 26, 2018 | ||
By: | /s/ Chris Herbold | |
Chris Herbold, | ||
Vice President—Accounting and Chief Accounting Officer of PAA GP Holdings LLC | ||
(Principal Accounting Officer) | ||
February 26, 2018 | ||
120
Pursuant to the requirements of the Securities Exchange Act of 1934, this report has been signed below by the following persons on behalf of the registrant and in the capacities and on the dates indicated.
Name | Title | Date | ||
/s/ Greg L. Armstrong | Chairman of the Board, Chief Executive Officer and Director of PAA GP Holdings LLC (Principal Executive Officer) | February 26, 2018 | ||
Greg L. Armstrong | ||||
/s/ Harry N. Pefanis | Director, President and Chief Commercial Officer of PAA GP Holdings LLC | February 26, 2018 | ||
Harry N. Pefanis | ||||
/s/ Willie Chiang | Director, Executive Vice President and Chief Operating Officer of PAA GP Holdings LLC | February 26, 2018 | ||
Willie Chiang | ||||
/s/ Al Swanson | Executive Vice President and Chief Financial Officer of PAA GP Holdings LLC (Principal Financial Officer) | February 26, 2018 | ||
Al Swanson | ||||
/s/ Chris Herbold | Vice President—Accounting and Chief Accounting Officer of PAA GP Holdings LLC (Principal Accounting Officer) | February 26, 2018 | ||
Chris Herbold | ||||
/s/ Oscar K. Brown | Director of PAA GP Holdings LLC | February 26, 2018 | ||
Oscar K. Brown | ||||
/s/ Victor Burk | Director of PAA GP Holdings LLC | February 26, 2018 | ||
Victor Burk | ||||
/s/ Everardo Goyanes | Director of PAA GP Holdings LLC | February 26, 2018 | ||
Everardo Goyanes | ||||
/s/ Gary R. Petersen | Director of PAA GP Holdings LLC | February 26, 2018 | ||
Gary R. Petersen | ||||
/s/ John T. Raymond | Director of PAA GP Holdings LLC | February 26, 2018 | ||
John T. Raymond | ||||
/s/ Bobby S. Shackouls | Director of PAA GP Holdings LLC | February 26, 2018 | ||
Bobby S. Shackouls | ||||
/s/ Robert V. Sinnott | Director of PAA GP Holdings LLC | February 26, 2018 | ||
Robert V. Sinnott | ||||
/s/ J. Taft Symonds | Director of PAA GP Holdings LLC | February 26, 2018 | ||
J. Taft Symonds | ||||
/s/ Christopher M. Temple | Director of PAA GP Holdings LLC | February 26, 2018 | ||
Christopher M. Temple | ||||
121
PLAINS GP HOLDINGS, L.P. AND SUBSIDIARIES
INDEX TO THE CONSOLIDATED FINANCIAL STATEMENTS
Page | |
Consolidated Financial Statements | |
F-1
MANAGEMENT’S REPORT ON INTERNAL CONTROL OVER FINANCIAL REPORTING
Plains GP Holdings, L.P.’s management is responsible for establishing and maintaining adequate internal control over financial reporting. Our internal control over financial reporting is a process designed to provide reasonable assurance regarding the reliability of financial reporting and the preparation of financial statements for external purposes in accordance with generally accepted accounting principles.
Internal control over financial reporting has inherent limitations. Internal control over financial reporting is a process that involves human diligence and compliance and is subject to lapses in judgment and breakdowns resulting from human failures. Internal control over financial reporting also can be circumvented by collusion or improper management override. Because of such limitations, there is a risk that material misstatements may not be prevented or detected on a timely basis by internal control over financial reporting. However, these inherent limitations are known features of the financial reporting process. Therefore, it is possible to design into the process safeguards to reduce, though not eliminate, this risk.
Management has used the framework set forth in the report entitled “Internal Control—Integrated Framework” (2013) issued by the Committee of Sponsoring Organizations of the Treadway Commission (“COSO”) to evaluate the effectiveness of the Partnership’s internal control over financial reporting. Based on that evaluation, management has concluded that the Partnership’s internal control over financial reporting was effective as of December 31, 2017.
The effectiveness of the Partnership’s internal control over financial reporting as of December 31, 2017 has been audited by PricewaterhouseCoopers LLP, an independent registered public accounting firm, as stated in their report which appears on Page F-3.
/s/ Greg L. Armstrong | |
Greg L. Armstrong | |
Chairman of the Board, Chief Executive Officer and Director of PAA GP Holdings LLC | |
(Principal Executive Officer) | |
/s/ Al Swanson | |
Al Swanson | |
Executive Vice President and Chief Financial Officer of PAA GP Holdings LLC | |
(Principal Financial Officer) | |
February 26, 2018 | |
F-2
Report of Independent Registered Public Accounting Firm
To the Board of Directors of PAA GP Holdings LLC and Shareholders of
Plains GP Holdings, L.P.:
Opinions on the Financial Statements and Internal Control over Financial Reporting
We have audited the accompanying consolidated balance sheets of Plains GP Holdings, L.P. and its subsidiaries as of December 31, 2017 and 2016, and the related consolidated statements of operations, of comprehensive income/(loss), of changes in accumulated other comprehensive income/(loss), of changes in partners' capital, and of cash flows for each of the three years in the period ended December 31, 2017, including the related notes (collectively referred to as the “consolidated financial statements”). We also have audited the Partnership's internal control over financial reporting as of December 31, 2017, based on criteria established in Internal Control - Integrated Framework (2013) issued by the Committee of Sponsoring Organizations of the Treadway Commission (COSO).
In our opinion, the consolidated financial statements referred to above present fairly, in all material respects, the financial position of the Partnership as of December 31, 2017 and 2016, and the results of their operations and their cash flows for each of the three years in the period ended December 31, 2017 in conformity with accounting principles generally accepted in the United States of America. Also in our opinion, the Partnership maintained, in all material respects, effective internal control over financial reporting as of December 31, 2017, based on criteria established in Internal Control - Integrated Framework (2013) issued by the COSO.
Basis for Opinions
The Partnership's management is responsible for these consolidated financial statements, for maintaining effective internal control over financial reporting, and for its assessment of the effectiveness of internal control over financial reporting, included in the accompanying Management's Report on Internal Control over Financial Reporting. Our responsibility is to express opinions on the Partnership’s consolidated financial statements and on the Partnership's internal control over financial reporting based on our audits. We are a public accounting firm registered with the Public Company Accounting Oversight Board (United States) (“PCAOB”) and are required to be independent with respect to the Partnership in accordance with the U.S. federal securities laws and the applicable rules and regulations of the Securities and Exchange Commission and the PCAOB.
We conducted our audits in accordance with the standards of the PCAOB. Those standards require that we plan and perform the audits to obtain reasonable assurance about whether the consolidated financial statements are free of material misstatement, whether due to error or fraud, and whether effective internal control over financial reporting was maintained in all material respects.
Our audits of the consolidated financial statements included performing procedures to assess the risks of material misstatement of the consolidated financial statements, whether due to error or fraud, and performing procedures that respond to those risks. Such procedures included examining, on a test basis, evidence regarding the amounts and disclosures in the consolidated financial statements. Our audits also included evaluating the accounting principles used and significant estimates made by management, as well as evaluating the overall presentation of the consolidated financial statements. Our audit of internal control over financial reporting included obtaining an understanding of internal control over financial reporting, assessing the risk that a material weakness exists, and testing and evaluating the design and operating effectiveness of internal control based on the assessed risk. Our audits also included performing such other procedures as we considered necessary in the circumstances. We believe that our audits provide a reasonable basis for our opinions.
Definition and Limitations of Internal Control over Financial Reporting
A company’s internal control over financial reporting is a process designed to provide reasonable assurance regarding the reliability of financial reporting and the preparation of financial statements for external purposes in accordance with generally accepted accounting principles. A company’s internal control over financial reporting includes those policies and procedures that (i) pertain to the maintenance of records that, in reasonable detail, accurately and fairly reflect the transactions and dispositions of the assets of the company; (ii) provide reasonable assurance that transactions are recorded as necessary to permit preparation of financial statements in accordance with generally accepted accounting principles, and that receipts and expenditures of the company are being made only in accordance with authorizations of management and directors of the company; and (iii) provide reasonable assurance regarding prevention or timely detection of unauthorized acquisition, use, or disposition of the company’s assets that could have a material effect on the financial statements.
Because of its inherent limitations, internal control over financial reporting may not prevent or detect misstatements. Also, projections of any evaluation of effectiveness to future periods are subject to the risk that controls may become inadequate because of changes in conditions, or that the degree of compliance with the policies or procedures may deteriorate.
/s/ PricewaterhouseCoopers LLP |
Houston, Texas |
February 26, 2018 |
We have served as the Partnership’s auditor since 2013. |
F-3
PLAINS GP HOLDINGS, L.P. AND SUBSIDIARIES
CONSOLIDATED BALANCE SHEETS
(in millions, except share data)
December 31, 2017 | December 31, 2016 | ||||||
ASSETS | |||||||
CURRENT ASSETS | |||||||
Cash and cash equivalents | $ | 40 | $ | 50 | |||
Trade accounts receivable and other receivables, net | 3,029 | 2,279 | |||||
Inventory | 713 | 1,343 | |||||
Other current assets | 221 | 603 | |||||
Total current assets | 4,003 | 4,275 | |||||
PROPERTY AND EQUIPMENT | 16,901 | 16,261 | |||||
Accumulated depreciation | (2,796 | ) | (2,371 | ) | |||
Property and equipment, net | 14,105 | 13,890 | |||||
OTHER ASSETS | |||||||
Goodwill | 2,566 | 2,344 | |||||
Investments in unconsolidated entities | 2,756 | 2,343 | |||||
Deferred tax asset | 1,386 | 1,876 | |||||
Linefill and base gas | 872 | 896 | |||||
Long-term inventory | 164 | 193 | |||||
Other long-term assets, net | 901 | 286 | |||||
Total assets | $ | 26,753 | $ | 26,103 | |||
LIABILITIES AND PARTNERS’ CAPITAL | |||||||
CURRENT LIABILITIES | |||||||
Accounts payable and accrued liabilities | $ | 3,459 | $ | 2,590 | |||
Short-term debt | 737 | 1,715 | |||||
Other current liabilities | 337 | 361 | |||||
Total current liabilities | 4,533 | 4,666 | |||||
LONG-TERM LIABILITIES | |||||||
Senior notes, net of unamortized discounts and debt issuance costs | 8,933 | 9,874 | |||||
Other long-term debt | 250 | 250 | |||||
Other long-term liabilities and deferred credits | 679 | 606 | |||||
Total long-term liabilities | 9,862 | 10,730 | |||||
COMMITMENTS AND CONTINGENCIES (NOTE 17) | |||||||
PARTNERS’ CAPITAL | |||||||
Class A Shareholders (156,111,139 and 101,206,526 shares outstanding, respectively) | 1,695 | 1,737 | |||||
Noncontrolling interests | 10,663 | 8,970 | |||||
Total partners’ capital | 12,358 | 10,707 | |||||
Total liabilities and partners’ capital | $ | 26,753 | $ | 26,103 | |||
The accompanying notes are an integral part of these consolidated financial statements.
F-4
PLAINS GP HOLDINGS, L.P. AND SUBSIDIARIES
CONSOLIDATED STATEMENTS OF OPERATIONS
(in millions, except per share data)
Year Ended December 31, | |||||||||||
2017 | 2016 | 2015 | |||||||||
REVENUES | |||||||||||
Supply and Logistics segment revenues | $ | 25,056 | $ | 19,004 | $ | 21,927 | |||||
Transportation segment revenues | 612 | 632 | 697 | ||||||||
Facilities segment revenues | 555 | 546 | 528 | ||||||||
Total revenues | 26,223 | 20,182 | 23,152 | ||||||||
COSTS AND EXPENSES | |||||||||||
Purchases and related costs | 22,985 | 17,233 | 19,726 | ||||||||
Field operating costs | 1,183 | 1,182 | 1,454 | ||||||||
General and administrative expenses | 280 | 282 | 281 | ||||||||
Depreciation and amortization | 628 | 495 | 433 | ||||||||
Total costs and expenses | 25,076 | 19,192 | 21,894 | ||||||||
OPERATING INCOME | 1,147 | 990 | 1,258 | ||||||||
OTHER INCOME/(EXPENSE) | |||||||||||
Equity earnings in unconsolidated entities | 290 | 195 | 183 | ||||||||
Interest expense (net of capitalized interest of $35, $47 and $57, respectively) | (510 | ) | (480 | ) | (443 | ) | |||||
Other income/(expense), net | (31 | ) | 33 | (7 | ) | ||||||
INCOME BEFORE TAX | 896 | 738 | 991 | ||||||||
Current income tax expense | (28 | ) | (85 | ) | (84 | ) | |||||
Deferred income tax (expense)/benefit | (909 | ) | 7 | (98 | ) | ||||||
NET INCOME/(LOSS) | (41 | ) | 660 | 809 | |||||||
Net income attributable to noncontrolling interests | (690 | ) | (566 | ) | (691 | ) | |||||
NET INCOME/(LOSS) ATTRIBUTABLE TO PAGP | $ | (731 | ) | $ | 94 | $ | 118 | ||||
BASIC AND DILUTED NET INCOME/(LOSS) PER CLASS A SHARE | $ | (5.03 | ) | $ | 0.94 | $ | 1.41 | ||||
BASIC AND DILUTED WEIGHTED AVERAGE CLASS A SHARES OUTSTANDING | 145 | 99 | 83 | ||||||||
The accompanying notes are an integral part of these consolidated financial statements.
F-5
PLAINS GP HOLDINGS, L.P. AND SUBSIDIARIES
CONSOLIDATED STATEMENTS OF COMPREHENSIVE INCOME/(LOSS)
(in millions)
Year Ended December 31, | |||||||||||
2017 | 2016 | 2015 | |||||||||
Net income/(loss) | $ | (41 | ) | $ | 660 | $ | 809 | ||||
Other comprehensive income/(loss) | 239 | 72 | (614 | ) | |||||||
Comprehensive income | 198 | 732 | 195 | ||||||||
Comprehensive income attributable to noncontrolling interests | (881 | ) | (618 | ) | (82 | ) | |||||
Comprehensive income/(loss) attributable to PAGP | $ | (683 | ) | $ | 114 | $ | 113 | ||||
The accompanying notes are an integral part of these consolidated financial statements.
PLAINS GP HOLDINGS, L.P. AND SUBSIDIARIES
CONSOLIDATED STATEMENTS OF CHANGES IN ACCUMULATED
OTHER COMPREHENSIVE INCOME/(LOSS)
(in millions)
Derivative Instruments | Translation Adjustments | Other | Total | ||||||||||||
Balance at December 31, 2014 | $ | (159 | ) | $ | (308 | ) | $ | — | $ | (467 | ) | ||||
Reclassification adjustments | (45 | ) | — | — | (45 | ) | |||||||||
Deferred gain on cash flow hedges | 1 | — | — | 1 | |||||||||||
Currency translation adjustments | — | (570 | ) | — | (570 | ) | |||||||||
2015 Activity | (44 | ) | (570 | ) | — | (614 | ) | ||||||||
Balance at December 31, 2015 | $ | (203 | ) | $ | (878 | ) | $ | — | $ | (1,081 | ) | ||||
Reclassification adjustments | 8 | — | — | 8 | |||||||||||
Deferred loss on cash flow hedges | (33 | ) | — | — | (33 | ) | |||||||||
Currency translation adjustments | — | 96 | — | 96 | |||||||||||
Other | — | — | 1 | 1 | |||||||||||
2016 Activity | (25 | ) | 96 | 1 | 72 | ||||||||||
Balance at December 31, 2016 | $ | (228 | ) | $ | (782 | ) | $ | 1 | $ | (1,009 | ) | ||||
Reclassification adjustments | 21 | — | — | 21 | |||||||||||
Deferred loss on cash flow hedges | (16 | ) | — | — | (16 | ) | |||||||||
Currency translation adjustments | — | 234 | — | 234 | |||||||||||
2017 Activity | 5 | 234 | — | 239 | |||||||||||
Balance at December 31, 2017 | $ | (223 | ) | $ | (548 | ) | $ | 1 | $ | (770 | ) | ||||
The accompanying notes are an integral part of these consolidated financial statements.
F-6
PLAINS GP HOLDINGS, L.P. AND SUBSIDIARIES
CONSOLIDATED STATEMENTS OF CASH FLOWS
(in millions)
Year Ended December 31, | |||||||||||
2017 | 2016 | 2015 | |||||||||
CASH FLOWS FROM OPERATING ACTIVITIES | |||||||||||
Net income/(loss) | $ | (41 | ) | $ | 660 | $ | 809 | ||||
Reconciliation of net income to net cash provided by operating activities: | |||||||||||
Depreciation and amortization | 628 | 495 | 433 | ||||||||
Equity-indexed compensation expense | 41 | 60 | 27 | ||||||||
Inventory valuation adjustments (Note 4) | 35 | 3 | 117 | ||||||||
Deferred income tax expense/(benefit) | 909 | (7 | ) | 98 | |||||||
Settlement of terminated interest rate hedging instruments | (29 | ) | (29 | ) | (48 | ) | |||||
Change in fair value of Preferred Distribution Rate Reset Option (Note 12) | (13 | ) | (30 | ) | — | ||||||
Equity earnings in unconsolidated entities | (290 | ) | (195 | ) | (183 | ) | |||||
Distributions from unconsolidated entities | 304 | 216 | 214 | ||||||||
Other | 10 | 25 | (20 | ) | |||||||
Changes in assets and liabilities, net of acquisitions: | |||||||||||
Trade accounts receivable and other | (511 | ) | (524 | ) | 803 | ||||||
Inventory | 605 | (463 | ) | (90 | ) | ||||||
Accounts payable and other current liabilities | 848 | 507 | (813 | ) | |||||||
Net cash provided by operating activities | 2,496 | 718 | 1,347 | ||||||||
CASH FLOWS FROM INVESTING ACTIVITIES | |||||||||||
Cash paid in connection with acquisitions, net of cash acquired (Note 6) | (1,280 | ) | (282 | ) | (105 | ) | |||||
Investments in unconsolidated entities (Note 8) | (416 | ) | (301 | ) | (253 | ) | |||||
Additions to property, equipment and other | (1,024 | ) | (1,334 | ) | (2,079 | ) | |||||
Proceeds from sales of assets (Note 6) | 1,083 | 654 | 5 | ||||||||
Return of investment from unconsolidated entities (Note 8) | 21 | — | — | ||||||||
Cash received from sales of linefill and base gas | 49 | — | 1 | ||||||||
Cash paid for purchases of linefill and base gas | (2 | ) | (7 | ) | (133 | ) | |||||
Other investing activities | (1 | ) | (3 | ) | 34 | ||||||
Net cash used in investing activities | (1,570 | ) | (1,273 | ) | (2,530 | ) | |||||
CASH FLOWS FROM FINANCING ACTIVITIES | |||||||||||
Net borrowings/(repayments) under PAA commercial paper program (Note 10) | (690 | ) | (564 | ) | 631 | ||||||
Net borrowings under PAA senior secured hedged inventory facility (Note 10) | 36 | 447 | 300 | ||||||||
Net repayments under AAP senior secured revolving credit facility (Note 10) | — | (9 | ) | (27 | ) | ||||||
Proceeds from AAP term loan | — | — | 50 | ||||||||
Repayment of AAP term loan (Note 10) | — | (550 | ) | — | |||||||
Proceeds from the issuance of PAA senior notes (Note 10) | — | 748 | 998 | ||||||||
Repayments of PAA senior notes (Note 10) | (1,350 | ) | (175 | ) | (549 | ) | |||||
Net proceeds from the sale of Class A shares (Note 11) | 1,535 | — | — | ||||||||
Net proceeds from the sale of Series A preferred units by a subsidiary (Note 11) | — | 1,569 | — | ||||||||
Net proceeds from the sale of Series B preferred units by a subsidiary (Note 11) | 788 | — | — | ||||||||
Net proceeds from the sale of common units by a subsidiary (Note 11) | 129 | 796 | 1,099 | ||||||||
Distributions paid to Class A shareholders (Note 11) | (271 | ) | (234 | ) | (195 | ) | |||||
Distributions paid to noncontrolling interests (Note 11) | (1,122 | ) | (1,419 | ) | (1,465 | ) | |||||
Other financing activities | 5 | (38 | ) | (29 | ) | ||||||
Net cash provided by/(used in) financing activities | (940 | ) | 571 | 813 | |||||||
Effect of translation adjustment on cash | 4 | 4 | (4 | ) | |||||||
Net increase/(decrease) in cash and cash equivalents | (10 | ) | 20 | (374 | ) | ||||||
Cash and cash equivalents, beginning of period | 50 | 30 | 404 | ||||||||
Cash and cash equivalents, end of period | $ | 40 | $ | 50 | $ | 30 | |||||
Cash paid for: | |||||||||||
Interest, net of amounts capitalized | $ | 486 | $ | 462 | $ | 405 | |||||
Income taxes, net of amounts refunded | $ | 50 | $ | 98 | $ | 50 | |||||
The accompanying notes are an integral part of these consolidated financial statements.
F-7
PLAINS GP HOLDINGS, L.P. AND SUBSIDIARIES
CONSOLIDATED STATEMENTS OF CHANGES IN PARTNERS’ CAPITAL
(in millions)
Class A Shareholders | Noncontrolling Interests | Total Partners’ Capital | |||||||||
Balance at December 31, 2014 | $ | 1,657 | $ | 7,724 | $ | 9,381 | |||||
Net income | 118 | 691 | 809 | ||||||||
Distributions (Note 11) | (195 | ) | (1,465 | ) | (1,660 | ) | |||||
Deferred tax asset (Note 13) | 205 | — | 205 | ||||||||
Change in ownership interest in connection with Exchange Right exercises (Note 11) | (6 | ) | 6 | — | |||||||
Sales of common units by a subsidiary | — | 1,099 | 1,099 | ||||||||
Other comprehensive loss (Note 11) | (5 | ) | (609 | ) | (614 | ) | |||||
Other | (12 | ) | 26 | 14 | |||||||
Balance at December 31, 2015 | $ | 1,762 | $ | 7,472 | $ | 9,234 | |||||
Net income | 94 | 566 | 660 | ||||||||
Distributions (Note 11) | (234 | ) | (1,419 | ) | (1,653 | ) | |||||
Deferred tax asset (Note 13) | 92 | — | 92 | ||||||||
Change in ownership interest in connection with Exchange Right exercises (Note 11) | (18 | ) | 18 | — | |||||||
Sale of Series A preferred units by a subsidiary | — | 1,509 | 1,509 | ||||||||
Sales of common units by a subsidiary | 37 | 759 | 796 | ||||||||
Other comprehensive income (Note 11) | 20 | 52 | 72 | ||||||||
Other | (16 | ) | 13 | (3 | ) | ||||||
Balance at December 31, 2016 | $ | 1,737 | $ | 8,970 | $ | 10,707 | |||||
Net income/(loss) | (731 | ) | 690 | (41 | ) | ||||||
Distributions (Note 11) | (271 | ) | (1,128 | ) | (1,399 | ) | |||||
Deferred tax asset (Note 13) | 403 | — | 403 | ||||||||
Sales of Class A shares (Note 11) | 462 | 1,073 | 1,535 | ||||||||
Change in ownership interest in connection with Exchange Right exercises (Note 11) | 9 | (9 | ) | — | |||||||
Sale of Series B preferred units by a subsidiary | — | 788 | 788 | ||||||||
Sales of common units by a subsidiary | 13 | 116 | 129 | ||||||||
Issuance of common units by a subsidiary for acquisition of interest in Advantage Joint Venture (Note 6) | 5 | 35 | 40 | ||||||||
Sale of interest in SLC Pipeline LLC by a subsidiary (Note 6) | — | (57 | ) | (57 | ) | ||||||
Other comprehensive income (Note 11) | 48 | 191 | 239 | ||||||||
Other | 20 | (6 | ) | 14 | |||||||
Balance at December 31, 2017 | $ | 1,695 | $ | 10,663 | $ | 12,358 | |||||
The accompanying notes are an integral part of these consolidated financial statements.
F-8
PLAINS GP HOLDINGS, L.P. AND SUBSIDIARIES
NOTES TO THE CONSOLIDATED FINANCIAL STATEMENTS
Note 1—Organization and Basis of Consolidation and Presentation
Organization
Plains GP Holdings, L.P. (“PAGP”) is a Delaware limited partnership formed in July 2013 that has elected to be taxed as a corporation for United States federal income tax purposes. PAGP does not directly own any operating assets; as of December 31, 2017, its principal sources of cash flow are derived from an indirect investment in Plains All American Pipeline, L.P. (“PAA”), a publicly traded Delaware limited partnership. As used in this Form 10-K and unless the context indicates otherwise (taking into account the fact that PAGP has no operating activities apart from those conducted by PAA and its subsidiaries), the terms “Partnership,” “we,” “us,” “our,” “ours” and similar terms refer to PAGP and its subsidiaries.
As of December 31, 2017, our sole assets consisted of (i) a 100% managing member interest in Plains All American GP LLC (“GP LLC”), an entity that has also elected to be taxed as a corporation for United States federal income tax purposes and (ii) an approximate 55% limited partner interest in Plains AAP, L.P. (“AAP”) through our direct ownership of approximately 155.1 million Class A units of AAP (“AAP units”) and indirect ownership of approximately 1.0 million AAP units through GP LLC. GP LLC is a Delaware limited liability company that also holds the non-economic general partner interest in AAP. AAP is a Delaware limited partnership that, as of December 31, 2017, directly owned a limited partner interest in PAA through its ownership of approximately 284.0 million PAA common units (approximately 36% of PAA’s total outstanding common units and Series A preferred units combined (together, “PAA Common Unit Equivalents”)). AAP is the sole member of PAA GP LLC (“PAA GP”), a Delaware limited liability company that directly holds the non-economic general partner interest in PAA.
PAA is a publicly traded master limited partnership that owns and operates midstream energy infrastructure and provides logistics services primarily for crude oil, natural gas liquids (“NGL”) and natural gas. PAA owns an extensive network of pipeline transportation, terminalling, storage and gathering assets in key crude oil and NGL producing basins and transportation corridors and at major market hubs in the United States and Canada. Our business activities are conducted through three operating segments: Transportation, Facilities and Supply and Logistics. See Note 19 for further discussion of our operating segments.
PAA GP Holdings LLC, a Delaware limited liability company, is our general partner. Our general partner manages our operations and activities and is responsible for exercising on our behalf any rights we have as the sole and managing member of GP LLC, including responsibility for conducting the business and managing the operations of AAP and PAA. GP LLC employs our domestic officers and personnel involved in the operation and management of AAP and PAA. PAA’s Canadian officers and personnel are employed by our subsidiary, Plains Midstream Canada ULC (“PMC”).
References to the “Plains Entities” include us, our general partner, GP LLC, AAP, PAA GP and PAA and its subsidiaries.
Simplification Transactions
On November 15, 2016, the Plains Entities closed a series of transactions and executed several organizational and ancillary documents (the “Simplification Transactions”) intended to simplify our capital structure, better align the interests of our stakeholders and improve our overall credit profile. The Simplification Transactions included, among other things:
• | the permanent elimination of PAA’s incentive distribution rights (“IDRs”) and the economic rights associated with its 2% general partner interest in exchange for the issuance by PAA to AAP of 245.5 million PAA common units (including approximately 0.8 million units to be issued in the future) and the assumption by PAA of all of AAP’s outstanding debt ($642 million); |
• | the implementation of a unified governance structure pursuant to which the board of directors of GP LLC was eliminated and an expanded board of directors of our general partner assumed oversight responsibility over both us and PAA; |
F-9
• | the provision for annual shareholder elections beginning in 2018 for the purpose of electing certain directors, and the participation of PAA’s common unitholders and Series A preferred unitholders in such elections through PAA’s ownership of our Class C shares, which provide PAA, as the sole holder of such Class C shares, the right to vote in elections of eligible directors together with the holders of our Class A and Class B shares; |
• | the execution by AAP of a reverse split to adjust the number of AAP units such that the number of outstanding AAP units (assuming the conversion of AAP Class B units (the “AAP Management Units”) into AAP units) equaled the number of PAA common units received by AAP at the closing of the Simplification Transactions. Simultaneously, we executed reverse splits to adjust the number of (i) Class A shares outstanding to equal the number of AAP units we owned following AAP’s reverse unit split and (ii) Class B shares outstanding to equal the number of AAP units owned by AAP’s unitholders other than us following AAP’s reverse unit split. These reverse splits, along with the Omnibus Agreement, resulted in economic alignment between our Class A shareholders and PAA’s common unitholders, such that the number of outstanding Class A shares equals the number of AAP units owned by us, which in turn equals the number of PAA common units held by AAP that are attributable to our interest in AAP. The Plains Entities also entered into an Omnibus Agreement, pursuant to which such one-to-one relationship will be maintained subsequent to the closing of the Simplification Transactions; and |
• | the creation of a right for certain holders of the AAP units to cause AAP to redeem such AAP units in exchange for an equal number of PAA common units held by AAP. Holders of AAP units other than us and GP LLC continue to have the right to exchange their AAP units (together with the corresponding Class B shares and, if applicable, units of our general partner) for our Class A shares on a one-for-one basis. |
The Simplification Transactions were between and among consolidated subsidiaries of PAGP that are considered entities under common control. These equity transactions did not result in a change in the carrying value of the underlying assets and liabilities. In addition, the Simplification Transactions did not result in a change in ownership interest of PAGP in PAA as described in Accounting Standards Codification (“ASC”) 810-10-45-22, but instead were designed to be an exchange of equal economic ownership interests.
As part of the Simplification Transactions, as discussed above, we effected a reverse split of our Class A and Class B shares, in each case, at a ratio of approximately 1-for-2.663. The effect of the reverse split has been retroactively applied to all share and per-share amounts presented in this Form 10-K.
Definitions
Additional defined terms are used in the following notes and shall have the meanings indicated below:
AOCI | = | Accumulated other comprehensive income/(loss) |
ASC | = | Accounting Standards Codification |
ASU | = | Accounting Standards Update |
Bcf | = | Billion cubic feet |
Btu | = | British thermal unit |
CAD | = | Canadian dollar |
DERs | = | Distribution equivalent rights |
EBITDA | = | Earnings before interest, taxes, depreciation and amortization |
EPA | = | United States Environmental Protection Agency |
FASB | = | Financial Accounting Standards Board |
GAAP | = | Generally accepted accounting principles in the United States |
ICE | = | Intercontinental Exchange |
IPO | = | Initial public offering |
LIBOR | = | London Interbank Offered Rate |
LTIP | = | Long-term incentive plan |
Mcf | = | Thousand cubic feet |
NGL | = | Natural gas liquids, including ethane, propane and butane |
NYMEX | = | New York Mercantile Exchange |
Oxy | = | Occidental Petroleum Corporation or its subsidiaries |
PLA | = | Pipeline loss allowance |
USD | = | United States dollar |
WTI | = | West Texas Intermediate |
F-10
Basis of Consolidation and Presentation
The accompanying financial statements and related notes present and discuss our consolidated financial position as of December 31, 2017 and 2016, and the consolidated results of our operations, cash flows, changes in partners’ capital, comprehensive income/(loss) and changes in accumulated other comprehensive income/(loss) for the years ended December 31, 2017, 2016 and 2015. All significant intercompany transactions have been eliminated in consolidation, and certain reclassifications have been made to information from previous years to conform to the current presentation. These reclassifications do not affect net income attributable to PAGP. The accompanying consolidated financial statements include the accounts of PAGP and all of its wholly owned subsidiaries and those entities that it controls. Investments in entities over which we have significant influence but not control are accounted for by the equity method. We apply proportionate consolidation for pipelines and other assets in which we own undivided joint interests.
Management judgment is required to evaluate whether PAGP controls an entity. Key areas of that evaluation include (i) determining whether an entity is a variable interest entity (“VIE”); (ii) determining whether PAGP is the primary beneficiary of a VIE, including evaluating which activities of the VIE most significantly impact its economic performance and the degree of power that PAGP and its related parties have over those activities through variable interests; and (iii) identifying events that require reconsideration of whether an entity is a VIE and continuously evaluating whether PAGP is a VIE’s primary beneficiary.
We have determined that our subsidiaries, PAA and AAP, are VIEs and should be consolidated by PAGP because:
• | The limited partners of PAA and AAP lack (i) substantive “kick-out rights” (i.e., the right to remove the general partner) based on a simple majority or lower vote and (ii) substantive participation rights and thus lack the ability to block actions of the general partner that most significantly impact the economic performance of PAA and AAP, respectively. |
• | AAP is the primary beneficiary of PAA because it has the power to direct the activities that most significantly impact PAA’s performance and the right to receive benefits, and obligation to absorb losses, that could be significant to PAA. |
• | PAGP is the primary beneficiary of AAP because it has the power to direct the activities that most significantly impact AAP’s performance and the right to receive benefits, and obligation to absorb losses, that could be significant to AAP. |
With the exception of a deferred tax asset of $1,386 million and $1,876 million as of December 31, 2017 and 2016, respectively, substantially all assets and liabilities presented on PAGP’s Consolidated Balance Sheets are those of PAA. Only the assets of each respective VIE can be used to settle the obligations of that individual VIE, and the creditors of each/either of those VIEs do not have recourse against the general credit of PAGP. PAGP did not provide any financial support to PAA or AAP during the years ended December 31, 2017, 2016 or 2015. See Note 15 for information regarding the Omnibus Agreement entered into in connection with the Simplification Transactions.
Subsequent events have been evaluated through the financial statements issuance date and have been included in the following footnotes where applicable.
Note 2—Summary of Significant Accounting Policies
Use of Estimates
The preparation of financial statements in conformity with GAAP requires us to make estimates and assumptions that affect the reported amounts of assets and liabilities and disclosure of contingent assets and liabilities at the date of the financial statements and the reported amounts of revenues and expenses during the reporting period. We make significant estimates with respect to (i) estimated fair value of assets and liabilities acquired and identification of associated goodwill and intangible assets, (ii) impairment assessments of goodwill and intangible assets, (iii) fair value of derivatives, (iv) accruals and contingent liabilities, (v) equity-indexed compensation plan accruals, (vi) property and equipment, depreciation and amortization expense, asset retirement obligations and impairments, (vii) allowance for doubtful accounts and (viii) inventory valuations. Although we believe these estimates are reasonable, actual results could differ from these estimates.
F-11
Revenue Recognition
Supply and Logistics Segment Revenues. Revenues from sales of crude oil, NGL and natural gas are recognized at the time title to the product sold transfers to the purchaser, which occurs upon delivery of the product to the purchaser or its designee. Sales of crude oil and NGL consist of outright sales contracts. Inventory purchases and sales under buy/sell transactions are treated as inventory exchanges. The sales under these exchanges are netted to zero in Supply and Logistics segment revenues in our Consolidated Statements of Operations.
Additionally, we may utilize derivatives in connection with the transactions described above. For commodity derivatives that are designated as cash flow hedges, derivative gains and losses are deferred in AOCI and recognized in revenues in the periods during which the underlying physical hedged transaction impacts earnings. Also, the ineffective portion of the change in fair value of cash flow hedges is recognized in revenues each period along with the change in fair value of derivatives that do not qualify for or are not designated for hedge accounting.
Transportation Segment Revenues. Our Transportation segment operations generally consist of fee-based activities associated with transporting crude oil and NGL on pipelines, gathering systems and trucks. Revenues from pipeline tariffs and fees are associated with the transportation of crude oil and NGL at a published tariff, as well as revenues associated with agreements for committed space on various assets. Tariff revenues are recognized when the service is provided pursuant to specifications outlined in the tariffs. Revenues associated with fees are recognized in the month to which the fee applies. As is common in the pipeline transportation industry, our tariffs incorporate a loss allowance factor that is intended to offset losses due to evaporation, measurement and other losses in transit. We value the allowance volumes and actual losses at the estimated net realizable value (including the impact of gains and losses from derivative related activities) in the month of occurrence.
Facilities Segment Revenues. Our Facilities segment operations generally consist of fee-based activities associated with providing storage, terminalling and throughput services primarily for crude oil, NGL and natural gas, as well as NGL fractionation and isomerization services and natural gas and condensate processing services. Revenues generated in this segment include (i) fees that are generated from storage capacity agreements, (ii) terminal throughput fees that are generated when we receive liquids from one connecting source and deliver the applicable product to another connecting carrier, (iii) fees from NGL fractionation and isomerization, (iv) fees from natural gas and condensate processing services, (v) fees associated with natural gas park and loan activities, interruptible storage services and wheeling and balancing services and (vi) loading and unloading fees at our rail terminals.
We generate revenue through a combination of month-to-month and multi-year agreements. Storage fees resulting from short-term and long-term contracts are typically recognized in revenue ratably over the term of the contract regardless of the actual storage capacity utilized. Terminal fees (including throughput and rail fees) are recognized as the liquids enter or exit the terminal and are received from or delivered to the connecting carrier or third-party terminal, as applicable. Hub service fees are recognized in the period the natural gas moves across our header system. Fees from NGL fractionation, isomerization services and gas processing services are recognized in the period when the services are performed.
Minimum Volume Commitments. We have certain agreements that require counterparties to deliver, transport or throughput a minimum volume over an agreed upon period. Some of these agreements include make-up rights if the minimum volume is not met. We record a receivable from the counterparty in the period that services are provided or when the transaction occurs, including amounts for deficiency obligations from counterparties associated with minimum volume commitments. If a counterparty has a make-up right associated with a deficiency, we defer the revenue attributable to the counterparty make-up right and subsequently recognize the revenue at the earlier of when the deficiency volume is delivered or shipped, when the make-up right expires or when it is determined that the counterparty’s ability to utilize the make-up right is remote.
At December 31, 2017 and 2016, counterparty deficiencies associated with agreements that include minimum volume commitments totaled $57 million and $66 million, respectively, of which $37 million and $54 million, respectively, was recorded as deferred revenue. The remaining balance of $20 million and $12 million at each respective date was related to deficiencies for which the counterparties had not met their contractual minimum commitments and were not reflected in our Consolidated Financial Statements as we had not yet billed or collected such amounts.
F-12
Purchases and Related Costs
Purchases and related costs include (i) the cost of crude oil, NGL and natural gas obtained in outright purchases, (ii) fees incurred for storage and transportation, whether by pipeline, truck, rail, ship or barge and (iii) performance-related bonus costs. These costs are recognized when incurred except in the case of products purchased, which are recognized at the time title transfers to us. Purchases that are part of inventory exchanges under buy/sell transactions are netted with the related sales, with any margin presented in “Purchases and related costs” in our Consolidated Statements of Operations.
Field Operating Costs and General and Administrative Expenses
Field operating costs consist of various field operating expenses, including payroll, compensation and benefits costs for operations personnel; fuel and power costs (including the impact of gains and losses from derivative related activities); third-party trucking transportation costs for our U.S. crude oil operations; maintenance and integrity management costs; regulatory compliance; environmental remediation; insurance; costs for usage of third-party owned pipeline, rail and storage assets; vehicle leases; and property taxes. General and administrative expenses consist primarily of payroll, compensation and benefits costs; certain information systems and legal costs; office rent; contract and consultant costs; and audit and tax fees.
Foreign Currency Transactions/Translation
Certain of our subsidiaries use the Canadian dollar as their functional currency. Assets and liabilities of subsidiaries with a Canadian dollar functional currency are translated at period-end rates of exchange, and revenues and expenses are translated at average exchange rates prevailing for each month. The resulting translation adjustments are made directly to a separate component of other comprehensive income, which is reflected in Partners’ Capital on our Consolidated Balance Sheets.
Certain of our subsidiaries also enter into transactions and have monetary assets and liabilities that are denominated in a currency other than the entities’ respective functional currencies. Gains and losses from the revaluation of foreign currency transactions and monetary assets and liabilities are included in the Consolidated Statements of Operations. The revaluation of foreign currency transactions and monetary assets and liabilities resulted in a net gain of $21 million for the year ended December 31, 2017, a net loss of $8 million for the year ended December 31, 2016 and a net gain of $21 million for the year ended December 31, 2015.
Cash and Cash Equivalents
Cash and cash equivalents consist of all unrestricted demand deposits and funds invested in highly liquid instruments with original maturities of three months or less and typically exceed federally insured limits. We periodically assess the financial condition of the institutions where these funds are held and believe that our credit risk is minimal.
In accordance with our policy, outstanding checks are classified as accounts payable rather than negative cash. As of December 31, 2017 and 2016, accounts payable included $61 million and $66 million, respectively, of outstanding checks that were reclassified from cash and cash equivalents.
Accounts Receivable, Net
Our accounts receivable are primarily from purchasers and shippers of crude oil and, to a lesser extent, purchasers of NGL and natural gas. These purchasers include, but are not limited to, refiners, producers, marketing and trading companies and financial institutions. The majority of our accounts receivable relate to our crude oil supply and logistics activities that can generally be described as high volume and low margin activities, in many cases involving exchanges of crude oil volumes.
Prices for crude oil, natural gas and NGLs can fluctuate widely. For example, NYMEX West Texas Intermediate oil prices have been volatile and ranged from a high of $107.26 per barrel in June 2014 to a low of $26.21 per barrel in February 2016. Although prices recovered somewhat in 2017 to close the year at $60.42 per barrel, the sustained decrease in commodity prices since late 2014 has caused liquidity and leverage issues throughout the energy industry, which in turn has increased the potential credit risks associated with certain counterparties with which we do business. To mitigate credit risk related to our accounts receivable, we utilize a rigorous credit review process. We closely monitor market conditions and perform credit reviews of each customer to make a determination with respect to the amount, if any, of open credit to be extended to any given customer and the form and amount of financial performance assurances we require. Such financial assurances are commonly provided to us in the form of advance cash payments, standby letters of credit, credit insurance or parental guarantees. As of December 31, 2017 and 2016, we had received $117 million and $89 million, respectively, of advance cash payments from
F-13
third parties to mitigate credit risk. We also received $54 million and $66 million as of December 31, 2017 and 2016, respectively, of standby letters of credit to support obligations due from third parties, a portion of which applies to future business. Additionally, in an effort to mitigate credit risk, a significant portion of our transactions with counterparties are settled on a net-cash basis. Furthermore, we also enter into netting agreements (contractual agreements that allow us to offset receivables and payables with those counterparties against each other on our balance sheet) for the majority of our net-cash arrangements.
We review all outstanding accounts receivable balances on a monthly basis and record a reserve for amounts that we expect will not be fully recovered. We do not apply actual balances against the reserve until we have exhausted substantially all collection efforts. At December 31, 2017 and 2016, substantially all of our trade accounts receivable (net of allowance for doubtful accounts) were less than 30 days past their scheduled invoice date. Our allowance for doubtful accounts receivable totaled $3 million at both December 31, 2017 and 2016. Although we consider our allowance for doubtful accounts receivable to be adequate, actual amounts could vary significantly from estimated amounts.
Noncontrolling Interests
Noncontrolling interest represents the portion of assets and liabilities in a consolidated subsidiary that is owned by a third party. FASB guidance requires all entities to report noncontrolling interests in subsidiaries as a component of equity in the consolidated financial statements. See Note 11 for additional discussion regarding our noncontrolling interests.
Asset Retirement Obligations
FASB guidance establishes accounting requirements for retirement obligations associated with tangible long-lived assets, including estimates related to (i) the time of the liability recognition, (ii) initial measurement of the liability, (iii) allocation of asset retirement cost to expense, (iv) subsequent measurement of the liability and (v) financial statement disclosures. FASB guidance also requires that the cost for asset retirement should be capitalized as part of the cost of the related long-lived asset and subsequently allocated to expense using a systematic and rational method.
Some of our assets, primarily related to our Transportation and Facilities segments, have contractual or regulatory obligations to perform remediation and, in some instances, dismantlement and removal activities when the assets are abandoned. These obligations include varying levels of activity including disconnecting inactive assets from active assets, cleaning and purging assets, and in some cases, completely removing the assets and returning the land to its original state. These assets have been in existence for many years and with regular maintenance will continue to be in service for many years to come. It is not possible to predict when demand for these transportation or storage services will cease, and we do not believe that such demand will cease for the foreseeable future. Accordingly, we believe the date when these assets will be abandoned is indeterminate. With no reasonably determinable abandonment date, we cannot reasonably estimate the fair value of the associated asset retirement obligations. We will record asset retirement obligations for these assets in the period in which sufficient information becomes available for us to reasonably determine the settlement dates.
A small portion of our contractual or regulatory obligations is related to assets that are inactive or that we plan to take out of service and, although the ultimate timing and costs to settle these obligations are not known with certainty, we have recorded a reasonable estimate of these obligations. We have estimated that the fair value of these obligations was $103 million and $44 million, respectively, at December 31, 2017 and 2016 and were primarily reflected in “Other long-term liabilities and deferred credits” on our Consolidated Balance Sheets.
Fair Value Measurements
Financial assets and liabilities are classified in their entirety based on the lowest level of input that is significant to the fair value measurement. Our assessment of the significance of a particular input to the fair value measurement requires judgment, which affects the placement of assets and liabilities within the fair value hierarchy levels. The determination of the fair values includes not only the credit standing of the counterparties involved and the impact of credit enhancements (such as cash deposits and letters of credit) but also the impact of our nonperformance risk on our liabilities. The fair value of our commodity derivatives, interest rate derivatives and foreign currency derivatives includes adjustments for credit risk. Our credit adjustment methodology uses market observable inputs and requires judgment. There were no changes to any of our valuation techniques during the period. See Note 12 for further discussion.
F-14
Other Significant Accounting Policies
See the respective footnotes for our accounting policies regarding (i) net income per Class A share, (ii) inventory, linefill and base gas and long-term inventory, (iii) property and equipment, (iv) acquisitions, (v) goodwill, (vi) investments in unconsolidated entities, (vii) other long-term assets, net, (viii) derivatives and risk management activities, (ix) income taxes, (x) equity-indexed compensation and (xi) legal and environmental matters.
Recent Accounting Pronouncements
In August 2017, the FASB issued ASU 2017-12, Derivatives and Hedging (Topic 815): Targeted Improvements to Accounting for Hedging Activities to better align an entity’s risk management activities and financial reporting for hedging relationships through changes to both the designation and measurement guidance for qualifying hedging relationships and the presentation of hedge results. Under the new guidance, (i) more financial and nonfinancial hedging strategies will be eligible for hedge accounting, (ii) presentation and disclosure requirements are amended and (iii) companies will change the way they assess effectiveness. This guidance is effective for interim and annual periods beginning after December 15, 2018, with early adoption permitted. We expect to adopt this ASU on January 1, 2019 and are currently evaluating the impact of the adoption on our financial position, results of operations and cash flows.
In May 2017, the FASB issued ASU 2017-09, Compensation—Stock Compensation (Topic 718): Scope of Modification Accounting to provide guidance about which changes to the terms or conditions of a share-based payment award require an entity to apply modification accounting. Under the new guidance, modification accounting is required only if the fair value (or calculated value or intrinsic value, if such alternative method is used), the vesting conditions, or the classification of the award (equity or liability) changes as a result of the change in terms or conditions. This guidance is effective for interim and annual periods beginning after December 15, 2017, with early adoption permitted, and prospective application required. We adopted this ASU on January 1, 2018. Our adoption did not have a material impact on our financial position, results of operations or cash flows.
In February 2017, the FASB issued ASU 2017-05, Other Income—Gains and Losses from the Derecognition of Nonfinancial Assets (Subtopic 610-20): Clarifying the Scope of Asset Derecognition Guidance and Accounting for Partial Sales of Nonfinancial Assets. The ASU clarifies what type of transactions involving nonfinancial assets are covered by the ASU and provides guidance on how to account for those transactions, including partial sales of real estate. Within this guidance, all sales and partial sales of businesses, which may have previously been accounted for using the in-substance real estate guidance, should follow the consolidation guidance. This guidance is effective for interim and annual periods beginning after December 15, 2017, and must be adopted at the same time as Topic 606. We adopted this ASU on January 1, 2018, using the modified retrospective approach. The cumulative effect of our adoption resulted in increases in both the carrying value of investments in unconsolidated entities and retained earnings of approximately $110 million related to the retained non-controlling interest in those entities from partial sales of businesses accounted for under in-substance real estate guidance during 2016 and 2017. See Note 8 for discussion of our investments in unconsolidated entities.
In January 2017, the FASB issued ASU 2017-04, Intangibles—Goodwill and Other (Topic 350): Simplifying the Test for Goodwill Impairment. The amendments within this ASU eliminate Step 2 from the goodwill impairment test, which currently requires an entity to determine goodwill impairment by calculating the implied fair value of goodwill by hypothetically assigning the fair value of a reporting unit to all of its assets and liabilities as if that reporting unit had been acquired in a business combination. Under the amended standard, goodwill impairment will instead be measured using Step 1 of the goodwill impairment test with goodwill impairment being equal to the amount by which a reporting unit’s carrying value exceeds its fair value, not to exceed the carrying value of goodwill. This guidance is effective for interim and annual periods beginning after December 15, 2019, with early adoption permitted. We early adopted this ASU in the first quarter of 2017 and applied the amended standard to our 2017 annual goodwill impairment test.
In January 2017, the FASB issued ASU 2017-01, Business Combinations (Topic 805): Clarifying the Definition of a Business, which improves the guidance for determining whether a transaction involves the purchase or disposal of a business or an asset. This guidance is effective for interim and annual periods beginning after December 15, 2017, with early adoption permitted, and prospective application required. We adopted this ASU on January 1, 2018 and will apply the new guidance to applicable transactions occurring after that date.
F-15
In November 2016, the FASB issued ASU 2016-18, Statement of Cash Flows (Topic 230): Restricted Cash (a consensus of the FASB Emerging Issues Task Force), requiring that a statement of cash flows explain the change in total cash, cash equivalents, and amounts generally described as restricted cash or restricted cash equivalents during the period. Therefore, amounts generally described as restricted cash and restricted cash equivalents should be included with cash and cash equivalents when reconciling the beginning-of-period total amounts shown on the statement of cash flows. This guidance is effective for interim and annual periods beginning after December 31, 2017. We adopted this ASU on January 1, 2018. Our adoption did not have a material impact on our statement of cash flows.
In October 2016, the FASB issued ASU 2016-16, Income Taxes (Topic 740): Intra-Entity Transfers of Assets Other Than Inventory, to improve the accounting for the income tax consequences of intra-entity transfers of assets other than inventory. This guidance is effective for interim and annual periods beginning after December 15, 2017, with early adoption permitted in the first interim period of an annual reporting period. We adopted this ASU on January 1, 2018. Our adoption did not have a material impact on our financial position, results of operations or cash flows.
In October 2016, the FASB issued ASU 2016-17, Consolidation (Topic 810): Interests Held through Related Parties That Are under Common Control, changing how a reporting entity that is the single decision maker of a VIE should treat indirect interests in the entity held through related parties that are under common control with the reporting entity when determining whether it is the primary beneficiary of that VIE. This guidance was effective for interim and annual periods beginning after December 31, 2016. We adopted this ASU on January 1, 2017. Our adoption did not have a material impact on our financial position, results of operations or cash flows.
In June 2016, the FASB issued ASU 2016-13, Financial Instruments—Credit Losses (Topic 326): Measurement of Credit Losses on Financial Instruments. This guidance will become effective for interim and annual periods beginning after December 15, 2019, with early adoption permitted by one year. We expect to adopt this ASU on January 1, 2020, and we are currently evaluating the effect that adopting this guidance will have on our financial position results of operations and cash flows.
In March 2016, the FASB issued ASU 2016-09, Compensation—Stock Compensation (Topic 718): Improvements to Employee Share-Based Payment Accounting, which simplified several aspects of the accounting for share-based payment transactions, including the income tax consequences, forfeitures, classification of awards as either equity or liabilities and classification of certain related payments on the statement of cash flows. This ASU is effective for interim and annual periods beginning after December 15, 2016, with early adoption permitted. We adopted the applicable provisions of the ASU on January 1, 2017 and (i) elected to account for forfeitures as they occur, utilizing the modified retrospective approach of adoption and (ii) classify cash paid for taxes when directly withholding units from an employee’s award for tax-withholding purposes as a financing activity on our Consolidated Statement of Cash Flows. Our adoption did not have a material impact on our financial position or results of operations for the periods presented. We reclassified approximately $7 million and $14 million, respectively, of cash outflows from operating activities to financing activities for the years ended December 31, 2016 and 2015 related to cash paid for minimum statutory withholding requirements for which we withheld PAA common units from employees’ awards.
In February 2016, the FASB issued ASU 2016-02, Leases (Topic 842), that revises the current accounting model for leases. The most significant changes are the clarification of the definition of a lease and required lessee recognition on the balance sheet of lease assets and liabilities with lease terms of more than 12 months, including extensive quantitative and qualitative disclosures. This ASU will become effective for interim and annual periods beginning after December 15, 2018, with a modified retrospective application required. Early adoption is permitted, including adoption in an interim period. We expect to adopt this ASU on January 1, 2019. We are currently evaluating the effect that adopting this ASU will have on our financial position, results of operations and cash flows. Although our evaluation is ongoing, we do expect that the adoption will impact our financial statements as the standard requires the recognition on the balance sheet of a right of use asset and corresponding lease liability. We are currently analyzing our contracts to determine whether they contain a lease under the revised guidance and have not quantified the amount of the asset and liability that will be recognized on our Consolidated Balance Sheet.
In July 2015, the FASB issued ASU 2015-11, Inventory (Topic 330): Simplifying the Measurement of Inventory, which requires entities to measure inventory at the lower of cost and net realizable value; however, inventory measured using last-in, first-out and the retail inventory method is unchanged by this ASU. This guidance was effective for interim and annual periods beginning after December 15, 2016, with prospective application required. We adopted this ASU on January 1, 2017. Our adoption did not have a material impact on our financial position, results of operations or cash flows.
F-16
In May 2014, the FASB issued ASU 2014-09, Revenue from Contracts with Customers, followed by a series of related accounting standard updates (collectively referred to as “Topic 606”) with the underlying principle that an entity will recognize revenue to reflect amounts expected to be received in exchange for the provision of goods and services to customers upon the transfer of those goods or services. Topic 606 also requires additional disclosures. Topic 606 can be adopted either with a full retrospective approach or a modified retrospective approach with a cumulative-effect adjustment as of the date of adoption and is effective for interim and annual periods beginning after December 15, 2017. We implemented a process to evaluate the impact of adopting Topic 606 on each type of revenue contract entered into with customers, and our implementation team effected changes to our business processes, systems and controls to support recognition and disclosure under the new standard. We did not identify any material revenue recognition timing differences under Topic 606 as compared to our policies in effect prior to adoption. In addition, we will have an increase in disclosures about the nature, amount, timing and uncertainty of revenue and the related cash flows. We adopted Topic 606 on January 1, 2018, and applied the modified retrospective approach. The cumulative effect of the adoption of Topic 606 was not material.
Note 3—Net Income/(Loss) Per Class A Share
Basic net income/(loss) per Class A share is determined by dividing net income/(loss) attributable to PAGP by the weighted average number of Class A shares outstanding during the period. Our Class B and Class C shares do not share in the earnings of the Partnership; accordingly, basic and diluted net income/(loss) per Class B and Class C share has not been presented.
Diluted net income/(loss) per Class A share is determined by dividing net income/(loss) attributable to PAGP by the diluted weighted average number of Class A shares outstanding during the period. For purposes of calculating diluted net income/(loss) per Class A share, both the net income/(loss) attributable to PAGP and the diluted weighted average number of Class A shares outstanding consider the impact of possible future exchanges of (i) AAP units and the associated Class B shares into our Class A shares and (ii) certain AAP Management Units into our Class A shares. In addition, the calculation of the diluted weighted average number of Class A shares outstanding considers the effect of potentially dilutive awards under the Plains GP Holdings, L.P. Long-Term Incentive Plan (the “PAGP LTIP”).
All AAP Management Units that have satisfied the applicable performance conditions are considered potentially dilutive. Exchanges of potentially dilutive AAP units and AAP Management Units are assumed to have occurred at the beginning of the period and the incremental income attributable to PAGP resulting from the assumed exchanges is representative of the incremental income that would have been attributable to PAGP if the assumed exchanges occurred on that date. See Note 11 for information regarding exchanges of AAP units and AAP Management Units. PAGP LTIP awards that are deemed to be dilutive are reduced by a hypothetical share repurchase based on the remaining unamortized fair value, as prescribed by the treasury stock method in guidance issued by the FASB. See Note 16 for a complete discussion of PAGP LTIP awards.
For the years ended December 31, 2017, 2016 and 2015, the possible exchange of any AAP units and certain AAP Management Units would have had an antidilutive effect on basic net income/(loss) per Class A share. For the year ended December 31, 2017 our PAGP LTIP awards were antidilutive and for the years ended December 31, 2016 and 2015 our PAGP LTIP awards were dilutive; however, there were less than 0.1 million dilutive LTIP awards those periods, which did not change the presentation of weighted average Class A shares outstanding or net income/(loss) per Class A share. The following table illustrates the calculation of basic and diluted net income/(loss) per Class A share (in millions, except per share data):
Year Ended December 31, | |||||||||||
2017 | 2016 | 2015 | |||||||||
Basic and Diluted Net Income/(Loss) per Class A Share | |||||||||||
Net income/(loss) attributable to PAGP | $ | (731 | ) | $ | 94 | $ | 118 | ||||
Basic and diluted weighted average Class A shares outstanding | 145 | 99 | 83 | ||||||||
Basic and diluted net income/(loss) per Class A share | $ | (5.03 | ) | $ | 0.94 | $ | 1.41 | ||||
F-17
Note 4—Inventory, Linefill and Base Gas and Long-term Inventory
Inventory primarily consists of crude oil, NGL and natural gas in pipelines, storage facilities and railcars that are valued at the lower of cost or net realizable value, with cost determined using an average cost method within specific inventory pools. At the end of each reporting period, we assess the carrying value of our inventory and make any adjustments necessary to reduce the carrying value to the applicable net realizable value. Any resulting adjustments are a component of “Purchases and related costs” on our accompanying Consolidated Statements of Operations. During the years ended December 31, 2017, 2016 and 2015, we recorded charges of $35 million, $3 million and $117 million, respectively, related to the writedown of our crude oil, NGL and natural gas inventory due to declines in prices. A portion of these inventory valuation adjustments was offset by the recognition of gains on derivative instruments being utilized to hedge future sales of our crude oil and NGL inventory. Such gains were recorded to “Supply and Logistics segment revenues” in our accompanying Consolidated Statement of Operations. See Note 12 for discussion of our derivative and risk management activities.
Linefill and base gas in assets we own are recorded at historical cost and consist of crude oil, NGL and natural gas. We classify as linefill or base gas (i) our proportionate share of barrels used to fill a pipeline that we own such that when an incremental barrel is pumped into or enters a pipeline it forces product out at another location, (ii) barrels that represent the minimum working requirements in tanks and caverns that we own and (iii) natural gas required to maintain the minimum operating pressure of natural gas storage facilities we own.
Linefill and base gas carrying amounts are reviewed for impairment in accordance with FASB guidance with respect to accounting for the impairment or disposal of long-lived assets. Carrying amounts that are not expected to be recoverable through future cash flows are written down to estimated fair value. See Note 5 for further discussion regarding impairment of long-lived assets. During 2017, 2016 and 2015, we did not recognize any impairments of linefill and base gas.
Minimum working inventory requirements in third-party assets and other working inventory in our assets that are needed for our commercial operations are included within specific inventory pools in inventory (a current asset) in determining the average cost of operating inventory. At the end of each period, we reclassify the inventory not expected to be liquidated within the succeeding twelve months out of inventory, at the average cost of the applicable inventory pools, and into long-term inventory, which is reflected as a separate line item in “Other assets” on our Consolidated Balance Sheets.
F-18
Inventory, linefill and base gas and long-term inventory consisted of the following (barrels and natural gas volumes in thousands and carrying value in millions):
December 31, 2017 | December 31, 2016 | ||||||||||||||||||||||||
Volumes | Unit of Measure | Carrying Value | Price/ Unit (1) | Volumes | Unit of Measure | Carrying Value | Price/ Unit (1) | ||||||||||||||||||
Inventory | |||||||||||||||||||||||||
Crude oil | 7,800 | barrels | $ | 402 | $ | 51.54 | 23,589 | barrels | $ | 1,049 | $ | 44.47 | |||||||||||||
NGL | 10,774 | barrels | 294 | $ | 27.29 | 13,497 | barrels | 242 | $ | 17.93 | |||||||||||||||
Natural gas | — | Mcf | — | $ | — | 14,540 | Mcf | 32 | $ | 2.20 | |||||||||||||||
Other | N/A | 17 | N/A | N/A | 20 | N/A | |||||||||||||||||||
Inventory subtotal | 713 | 1,343 | |||||||||||||||||||||||
Linefill and base gas | |||||||||||||||||||||||||
Crude oil | 12,340 | barrels | 719 | $ | 58.27 | 12,273 | barrels | 710 | $ | 57.85 | |||||||||||||||
NGL | 1,597 | barrels | 45 | $ | 28.18 | 1,660 | barrels | 45 | $ | 27.11 | |||||||||||||||
Natural gas | 24,976 | Mcf | 108 | $ | 4.32 | 30,812 | Mcf | 141 | $ | 4.58 | |||||||||||||||
Linefill and base gas subtotal | 872 | 896 | |||||||||||||||||||||||
Long-term inventory | |||||||||||||||||||||||||
Crude oil | 1,870 | barrels | 105 | $ | 56.15 | 3,279 | barrels | 163 | $ | 49.71 | |||||||||||||||
NGL | 2,167 | barrels | 59 | $ | 27.23 | 1,418 | barrels | 30 | $ | 21.16 | |||||||||||||||
Long-term inventory subtotal | 164 | 193 | |||||||||||||||||||||||
Total | $ | 1,749 | $ | 2,432 | |||||||||||||||||||||
(1) | Price per unit of measure is comprised of a weighted average associated with various grades, qualities and locations. Accordingly, these prices may not coincide with any published benchmarks for such products. |
Note 5—Property and Equipment
In accordance with our capitalization policy, expenditures made to expand the existing operating and/or earnings capacity of our assets are capitalized. We also capitalize certain costs directly related to the construction of such assets, including related internal labor costs, engineering costs and interest costs. For the years ended December 31, 2017, 2016 and 2015, capitalized interest recorded to property and equipment was $17 million, $34 million and $49 million, respectively. In addition, we capitalize interest related to investments in certain unconsolidated entities. See Note 8 for additional information. We also capitalize expenditures for the replacement and/or refurbishment of partially or fully depreciated assets in order to maintain the operating and/or earnings capacity of our existing assets. Repair and maintenance expenditures incurred in order to maintain the day to day operation of our existing assets are expensed as incurred.
F-19
Property and equipment, net is stated at cost and consisted of the following (in millions):
Estimated Useful Lives (Years) | December 31, | ||||||||
2017 | 2016 | ||||||||
Pipelines and related facilities (1) | 10 - 70 | $ | 9,624 | $ | 9,066 | ||||
Storage, terminal and rail facilities | 30 - 70 | 5,558 | 5,305 | ||||||
Trucking equipment and other | 3 - 15 | 414 | 408 | ||||||
Construction in progress | — | 610 | 826 | ||||||
Office property and equipment | 2 - 50 | 255 | 222 | ||||||
Land and other | N/A | 440 | 434 | ||||||
Property and equipment, gross | 16,901 | 16,261 | |||||||
Accumulated depreciation | (2,796 | ) | (2,371 | ) | |||||
Property and equipment, net | $ | 14,105 | $ | 13,890 | |||||
(1) | We include rights-of-way, which are intangible assets, in our pipeline and related facilities amounts within property and equipment. |
We calculate our depreciation using the straight-line method, based on estimated useful lives and salvage values of our assets. Depreciation expense for the years ended December 31, 2017, 2016 and 2015 was $465 million, $471 million and $381 million, respectively (including amounts related to the discontinuation of certain capital projects). We also classify gains and losses on sales of assets and asset impairments as a component of “Depreciation and amortization” in our Consolidated Statements of Operations. See Note 6 for a discussion of our disposition activities. See “Impairment of Long-Lived Assets” below for a discussion of our policy for the recognition of asset impairments.
Impairment of Long-Lived Assets
Long-lived assets with recorded values that are not expected to be recovered through future cash flows are written down to estimated fair value in accordance with FASB guidance with respect to the accounting for the impairment or disposal of long-lived assets. Under this guidance, a long-lived asset is tested for impairment when events or circumstances indicate that its carrying value may not be recoverable. The carrying value of a long-lived asset is not recoverable if it exceeds the sum of the undiscounted cash flows expected to result from the use and eventual disposition of the asset. If the carrying value exceeds the sum of the undiscounted cash flows, an impairment loss equal to the amount by which the carrying value exceeds the fair value of the asset is recognized.
We periodically evaluate property and equipment and other long-lived assets for impairment when events or circumstances indicate that the carrying value of these assets may not be recoverable. The evaluation is highly dependent on the underlying assumptions of related cash flows. The subjective assumptions used to determine the existence of an impairment in carrying value include:
• | whether there is an indication of impairment; |
• | the grouping of assets; |
• | the intention of “holding,” “abandoning” or “selling” an asset; |
• | the forecast of undiscounted expected future cash flow over the asset’s estimated useful life; and |
• | if an impairment exists, the fair value of the asset or asset group. |
In addition, when we evaluate property and equipment and other long-lived assets for recoverability, it may also be necessary to review related depreciation estimates and methods.
F-20
During the years ended December 31, 2017 and 2016, we recognized $152 million and $80 million, respectively, of non-cash charges related to the write-down of certain of our long-lived rail and other terminal assets included in our Facilities segment due to asset impairments and accelerated depreciation. Such charges are reflected in “Depreciation and amortization” on our Consolidated Financial Statements. The decline in demand for movements of crude oil by rail in the United States due to sustained unfavorable market conditions resulted in expected decreases in future cash flows for certain of our rail terminal assets, which was a triggering event that required us to assess the recoverability of our carrying value of such long-lived assets. As a result of our impairment review, we wrote off the portion of the carrying amount of these long-lived assets that exceeded their fair value. Our estimated fair values were based upon recent sales prices of comparable facilities, as well as management’s expectation of the market values for such assets based on their industry experience. We consider such inputs to be a Level 3 input in the fair value hierarchy.
We did not recognize any impairments during the year ended December 31, 2015.
Note 6—Acquisitions and Dispositions
The following acquisitions, excluding acquired interests accounted for under the equity method of accounting mentioned specifically below, were accounted for using the acquisition method of accounting and the determination of the fair value of the assets and liabilities acquired has been estimated in accordance with the applicable accounting guidance.
Acquisitions
2017
Alpha Crude Connector Acquisition
On February 14, 2017, we acquired all of the issued and outstanding membership interests in Alpha Holding Company, LLC for cash consideration of approximately $1.215 billion, subject to working capital and other adjustments (the “ACC Acquisition”). The ACC Acquisition was initially funded through borrowings under PAA’s senior unsecured revolving credit facility. Such borrowings were subsequently repaid with proceeds from PAA’s March 2017 issuance of its common units to AAP pursuant to the Omnibus Agreement and in connection with our underwritten equity offering. See Note 11 for additional information.
Upon completion of the ACC Acquisition, we became the owner of a crude oil gathering system known as the “Alpha Crude Connector” (the “ACC System”) located in the Northern Delaware Basin in Southeastern New Mexico and West Texas. The ACC System comprises approximately 515 miles of gathering and transmission lines and five market interconnects, including to our Basin Pipeline at Wink. During 2017, we made additional interconnects to our existing Northern Delaware Basin systems as well as additional enhancements to increase the ACC System capacity to approximately 350,000 barrels per day, depending on the level of volume at each delivery point. The ACC System is supported by acreage dedications covering approximately 315,000 gross acres, including a significant acreage dedication from one of the largest producers in the region. The ACC System complements our other Permian Basin assets and enhances the services available to the producers in the Northern Delaware Basin.
The following table reflects the fair value determination (in millions):
Identifiable assets acquired and liabilities assumed: | Estimated Useful Lives (Years) | Recognized amount | ||||
Property and equipment | 3 - 70 | $ | 299 | |||
Intangible assets | 20 | 646 | ||||
Goodwill | N/A | 269 | ||||
Other assets and liabilities, net (including $4 million of cash acquired) | N/A | 1 | ||||
$ | 1,215 | |||||
F-21
Intangible assets are included in “Other long-term assets, net” on our Consolidated Balance Sheets. The determination of fair value to intangible assets above is comprised of five acreage dedication contracts and associated customer relationships that will be amortized over a remaining weighted average useful life of approximately 20 years. The value assigned to such intangible assets will be amortized to earnings using methods that closely resemble the pattern in which the economic benefits will be consumed. Amortization expense was approximately $10 million for the period from February 14, 2017 through December 31, 2017, and the future amortization expense is estimated as follows for the next five years (in millions):
2018 | $ | 25 | ||
2019 | $ | 34 | ||
2020 | $ | 42 | ||
2021 | $ | 48 | ||
2022 | $ | 54 | ||
Goodwill is an intangible asset representing the future economic benefits expected to be derived from other assets acquired that are not individually identified and separately recognized. The goodwill arising from the ACC Acquisition, which is tax deductible, represents the anticipated opportunities to generate future cash flows from undedicated acreage and the synergies created between the ACC System and our existing assets. The assets acquired in the ACC Acquisition, as well as the associated goodwill, are primarily included in our Transportation segment.
During the year ended December 31, 2017, we incurred approximately $6 million of acquisition-related costs associated with the ACC Acquisition. Such costs are reflected as a component of general and administrative expenses in our Consolidated Statements of Operations.
Pro forma financial information assuming the ACC Acquisition had occurred as of the beginning of the calendar year prior to the year of acquisition, as well as the revenues and earnings generated during the period since the acquisition date, were not material for disclosure purposes.
Other Acquisitions
In February 2017, we acquired a propane marine terminal for cash consideration of approximately $41 million. The assets acquired are included in our Facilities segment. We did not recognize any goodwill related to this acquisition.
On April 3, 2017, we and an affiliate of Noble Midstream Partners LP (“Noble”) completed the acquisition of Advantage Pipeline, L.L.C. (“Advantage”) through a newly formed 50/50 joint venture (the “Advantage Joint Venture”). We account for our interest in the Advantage Joint Venture under the equity method of accounting. See Note 8 for additional discussion of our equity method investments.
2016
During the year ended December 31, 2016, we completed two acquisitions for aggregate cash consideration of $289 million. These acquisitions included (i) an integrated system of NGL assets in Western Canada for cash consideration of approximately $204 million and (ii) the remaining interest in a Gulf Coast pipeline that was subsequently sold during the year. The assets acquired were primarily included in our Transportation and Facilities segments. We did not recognize any goodwill related to these acquisitions.
2015
During the year ended December 31, 2015, we completed three acquisitions for aggregate cash consideration of $105 million. These acquisitions included (i) an additional approximate 28% interest in Frontier Aspen LLC, which is accounted for under the equity method of accounting, (ii) a crude oil terminal included in our Facilities segment and (iii) the remaining interest in a pipeline system included in our Transportation segment. We recognized goodwill of $11 million related to these acquisitions. See Note 8 for additional discussion of our equity method investments.
F-22
Dispositions and Divestitures
During the year ended December 31, 2017, we sold certain non-core assets for total proceeds of $1.1 billion, including:
• | certain of our Bay Area terminal assets located in California; |
• | our Bluewater natural gas storage facility located in Michigan; |
• | certain non-core pipelines in the Rocky Mountain and Bakken regions, including PAA’s interest in SLC Pipeline LLC; |
• | non-core pipeline segments primarily located in the Midwestern United States; and |
• | a 40% undivided interest in a segment of our Red River Pipeline extending from Cushing, Oklahoma to the Hewitt Station near Ardmore, Oklahoma for our net book value. |
The Bay Area terminal assets and the Bluewater natural gas storage facility were reported in our Facilities segment. The pipeline assets were reported in our Transportation segment. See Note 8 for additional discussion.
In the aggregate, including non-cash impairments recognized upon reclassifications to assets held for sale, we recognized a net gain related to pending or completed asset sales of approximately $43 million for the year ended December 31, 2017, which is included in “Depreciation and amortization” on our Consolidated Statement of Operations. Such amount is comprised of gains of $123 million and losses of $80 million.
During the year ended December 31, 2016, we sold several non-core assets, including certain of our Gulf Coast pipelines and East Coast refined products terminals. In addition, we sold interests in Cheyenne Pipeline LLC and STACK Pipeline LLC. See Note 8 for additional discussion. In the aggregate, we recognized a net gain of approximately $100 million related to these transactions, which is included in “Depreciation and amortization” on our Consolidated Statement of Operations. Such amount is comprised of gains of $158 million and losses of $58 million, including $15 million of impairment of goodwill that was included in a disposal group classified as held for sale prior to the closing of such transaction.
During 2015, we sold various property and equipment and recognized a net loss of $2 million, which is included in “Depreciation and amortization” on our Consolidated Statement of Operations.
As of December 31, 2017, we classified approximately $80 million of assets as held for sale on our Consolidated Balance Sheet (in “Other current assets”) primarily related to a definitive agreement to sell non-core property and equipment included in our Facilities segment. We expect the sale to be consummated in the first half of 2018, subject to customary closing conditions, as applicable. As of December 31, 2016, we classified approximately $275 million of assets as held for sale on our Consolidated Balance Sheet (in “Other current assets”) primarily related to a definitive agreement to sell non-core assets, which were property and equipment included in our Facilities segment.
Note 7—Goodwill
Goodwill represents the future economic benefits arising from assets acquired in a business combination that are not individually identified and separately recognized.
In accordance with FASB guidance, we test goodwill to determine whether an impairment has occurred at least annually (as of June 30) and on an interim basis if it is more likely than not that a reporting unit’s fair value is less than its carrying value. Goodwill is tested for impairment at a level of reporting referred to as a reporting unit. A reporting unit is an operating segment or one level below an operating segment for which discrete financial information is available and regularly reviewed by segment management. Our reporting units are our operating segments. FASB guidance provides for a quantitative approach to testing goodwill for impairment; however, we may first assess certain qualitative factors to determine whether it is necessary to perform the quantitative goodwill impairment test. In the quantitative test, we compare the fair value of the reporting unit with the respective book values, including goodwill, by using an income approach based on a discounted cash flow analysis. This approach requires us to make long-term forecasts of future revenues, expenses and other expenditures. Those forecasts require the use of various assumptions and estimates, the most significant of which are net revenues (total revenues less purchases and related costs), operating expenses, general and administrative expenses and the weighted average cost of capital. Fair value of the reporting units is determined using significant unobservable inputs, or Level 3 inputs in the fair
F-23
value hierarchy. When the fair value is greater than book value, then the reporting unit’s goodwill is not considered impaired. If the book value is greater than fair value, then goodwill is impaired by the amount by which a reporting unit’s carrying value exceeds its fair value, not to exceed the carrying value of goodwill.
We completed our goodwill impairment test as of June 30, 2017 using a qualitative assessment. We determined that it was more likely than not that the fair value of each reporting unit was greater than its respective book value; therefore, additional impairment testing was not necessary at that time and goodwill was not considered impaired. However, due to a deterioration in the performance of the Supply and Logistics reporting unit and a reduction in projected performance of that reporting unit, we performed a quantitative test for the Supply and Logistics reporting unit as of December 31, 2017.
Through the quantitative test of the Supply and Logistics reporting unit’s goodwill for potential impairment, we determined that the fair value of that reporting unit was greater than its respective book value; therefore, goodwill was not considered impaired. However, a further deterioration in the performance of the Supply and Logistics reporting unit could result in an impairment of goodwill.
We did not perform a quantitative test for our other reporting units as of December 31, 2017 as there were no indicators of possible impairment. We did not recognize any impairments of goodwill during the last three years.
Goodwill by segment and changes in goodwill is reflected in the following table (in millions):
Transportation | Facilities | Supply and Logistics | Total | ||||||||||||
Balance at December 31, 2015 | $ | 815 | $ | 1,087 | $ | 503 | $ | 2,405 | |||||||
Foreign currency translation adjustments | 6 | 3 | 1 | 10 | |||||||||||
Dispositions and reclassifications to assets held for sale | (15 | ) | (56 | ) | — | (71 | ) | ||||||||
Balance at December 31, 2016 | $ | 806 | $ | 1,034 | $ | 504 | $ | 2,344 | |||||||
Acquisitions | 269 | — | — | 269 | |||||||||||
Foreign currency translation adjustments | 16 | 7 | 4 | 27 | |||||||||||
Dispositions and reclassifications to assets held for sale | (21 | ) | (53 | ) | — | (74 | ) | ||||||||
Balance at December 31, 2017 | $ | 1,070 | $ | 988 | $ | 508 | $ | 2,566 | |||||||
Note 8—Investments in Unconsolidated Entities
Investments in entities over which we have significant influence but not control are accounted for under the equity method. We do not consolidate any part of the assets or liabilities of our equity investees. Our share of net income or loss is reflected as one line item on our Consolidated Statements of Operations entitled “Equity earnings in unconsolidated entities” and will increase or decrease, as applicable, the carrying value of our investments in unconsolidated entities on our Consolidated Balance Sheets. We evaluate our equity investments for impairment in accordance with FASB guidance with respect to the equity method of accounting for investments in common stock. An impairment of an equity investment results when factors indicate that the investment’s fair value is less than its carrying value and the reduction in value is other than temporary in nature.
F-24
Our investments in unconsolidated entities consisted of the following (in millions, except percentage data):
Ownership Interest at December 31, 2017 | December 31, | |||||||||||
Entity (1) | Type of Operation | 2017 | 2016 | |||||||||
Advantage Pipeline Holdings LLC (“Advantage Joint Venture”) | Crude Oil Pipeline | 50% | $ | 69 | $ | — | ||||||
BridgeTex Pipeline Company, LLC (“BridgeTex”) | Crude Oil Pipeline | 50% | 1,093 | 1,098 | ||||||||
Butte Pipe Line Company | Crude Oil Pipeline | N/A | — | 11 | ||||||||
Caddo Pipeline LLC | Crude Oil Pipeline | 50% | 67 | 65 | ||||||||
Cheyenne Pipeline LLC (“Cheyenne”) | Crude Oil Pipeline | 50% | 29 | 30 | ||||||||
Diamond Pipeline LLC (“Diamond”) | Crude Oil Pipeline | 50% | 467 | 143 | ||||||||
Eagle Ford Pipeline LLC (“Eagle Ford Pipeline”) | Crude Oil Pipeline | 50% | 378 | 372 | ||||||||
Eagle Ford Terminals Corpus Christi LLC (“Eagle Ford Terminals”) | Crude Oil Terminal and Dock (2) | 50% | 75 | 53 | ||||||||
Frontier Aspen LLC | Crude Oil Pipeline | N/A | — | 45 | ||||||||
Midway Pipeline LLC | Crude Oil Pipeline | 50% | 20 | — | ||||||||
Saddlehorn Pipeline Company, LLC | Crude Oil Pipeline | 40% | 217 | 213 | ||||||||
Settoon Towing, LLC | Barge Transportation Services | 50% | 69 | 87 | ||||||||
STACK Pipeline LLC (“STACK”) | Crude Oil Pipeline | 50% | 73 | 14 | ||||||||
White Cliffs Pipeline, LLC | Crude Oil Pipeline | 36% | 199 | 212 | ||||||||
Total Investments in Unconsolidated Entities | $ | 2,756 | $ | 2,343 | ||||||||
(1) | Except for Eagle Ford Terminals, which is reported in our Facilities segment, the financial results from the entities are reported in our Transportation segment. |
(2) | Asset is currently under construction by the entity and has not yet been placed in service. |
On April 3, 2017, we and an affiliate of Noble completed the acquisition of Advantage Pipeline, L.L.C. for a purchase price of $133 million through a newly formed 50/50 joint venture (the “Advantage Joint Venture”). For our 50% share ($66.5 million), we contributed approximately 1.3 million PAA common units with a value of approximately $40 million and approximately $26 million in cash. Through the acquisition, the Advantage Joint Venture owns a 70-mile, 16-inch crude oil pipeline located in the southern Delaware Basin (the “Advantage Pipeline”), which is contractually supported by a third-party acreage dedication and a volume commitment from our wholly-owned marketing subsidiary. Noble serves as operator of the Advantage Pipeline. We account for our interest in the Advantage Joint Venture under the equity method of accounting.
During the fourth quarter of 2017, we sold certain of our non-core pipelines in the Rocky Mountain region which included our ownership interests in Butte Pipe Line Company and Frontier Aspen LLC. Additionally, we and an affiliate of CVR Refining, LP (“CVR Refining”) formed a 50/50 joint venture, Midway Pipeline LLC, which acquired from us the Cushing to Broome crude oil pipeline system. The Cushing to Broome pipeline system connects CVR Refining’s Coffeyville, Kansas refinery to the Cushing, Oklahoma oil hub. We will continue to serve as operator of the pipeline. We account for our interest in Midway Pipeline LLC under the equity method of accounting.
In June 2016, we sold 50% of our investment in Cheyenne, and in August 2016 we sold 50% of our investment in STACK. As a result of these transactions, we now account for our remaining 50% equity interest in such entities under the equity method of accounting.
See Note 6 for additional information related to certain of these transactions.
F-25
Distributions received from unconsolidated entities are classified based on the nature of the distribution approach, which looks to the activity that generated the distribution. We consider distributions received from unconsolidated entities as a return on investment in those entities to the extent that the distribution was generated through operating results, and therefore classify these distributions as cash flows from operating activities in our Consolidated Statement of Cash Flows. Other distributions received from unconsolidated entities are considered a return of investment and classified as cash flows from investing activities on the Consolidated Statement of Cash Flows. During the year ended December 31, 2017, we received $21 million as a return of investment from Settoon Towing, LLC related to the sale of certain of its marine assets.
We generally fund our portion of development, construction or capital expansion projects of our equity method investees through capital contributions. Our contributions to these entities increase the carrying value of our investments and are reflected in our Consolidated Statements of Cash Flows as cash used in investing activities. During the years ended December 31, 2017, 2016 and 2015, we made cash contributions of $398 million, $288 million and $245 million, respectively, to certain of our equity method investees. The contributions for 2017 and 2015 are net of $6 million and $53 million, respectively, of returns of cash contributions made during the periods. In addition, we capitalized interest of $18 million, $13 million and $8 million during the years ended December 31, 2017, 2016 and 2015, respectively, related to contributions to unconsolidated entities for projects under development and construction. We anticipate that we will make additional contributions to Eagle Ford Terminals, Eagle Ford Pipeline, BridgeTex, Diamond and STACK in 2018 related to ongoing projects by such entities.
Our investments in unconsolidated entities exceeded our share of the underlying equity in the net assets of such entities by $736 million and $758 million at December 31, 2017 and 2016, respectively. Such basis differences are included in the carrying values of our investments on our Consolidated Balance Sheets. The portion of the basis differences attributable to depreciable or amortizable assets is amortized on a straight-line basis over the estimated useful life of the related assets, which reduces “Equity earnings in unconsolidated entities” on our Consolidated Statements of Operations. The portion of the basis differences attributable to goodwill is not amortized. The basis difference at both December 31, 2017 and 2016 is primarily related to our acquisition of an interest in BridgeTex in 2014.
Summarized Financial Information of Unconsolidated Entities
Combined summarized financial information for all of our unconsolidated entities is shown in the tables below (in millions). None of our unconsolidated entities have noncontrolling interests.
December 31, | |||||||
2017 | 2016 | ||||||
Current assets | $ | 311 | $ | 303 | |||
Noncurrent assets | $ | 4,162 | $ | 3,558 | |||
Current liabilities | $ | 129 | $ | 241 | |||
Noncurrent liabilities | $ | 41 | $ | 162 | |||
Year Ended December 31, | |||||||||||
2017 | 2016 | 2015 | |||||||||
Revenues | $ | 938 | $ | 802 | $ | 769 | |||||
Operating income | $ | 650 | $ | 469 | $ | 441 | |||||
Net income | $ | 640 | $ | 452 | $ | 424 | |||||
F-26
Note 9—Other Long-Term Assets, Net
Other long-term assets, net of accumulated amortization, consisted of the following (in millions):
December 31, | |||||||
2017 | 2016 | ||||||
Intangible assets (1) | $ | 1,265 | $ | 603 | |||
Other | 57 | 44 | |||||
1,322 | 647 | ||||||
Accumulated amortization | (421 | ) | (361 | ) | |||
$ | 901 | $ | 286 | ||||
(1) | We include rights-of-way, which are intangible assets, in our pipeline and related facilities amounts within property and equipment. See Note 5 for a discussion of property and equipment. |
The increase in intangible assets for the year ended December 31, 2017 was primarily due to acreage dedication contracts and associated customer relationships associated with our ACC Acquisition. See Note 6 for additional information. Amortization expense for finite-lived intangible assets for the years ended December 31, 2017, 2016 and 2015 was $54 million, $44 million and $49 million, respectively.
Intangible assets that have finite lives are tested for impairment when events or circumstances indicate that the carrying value may not be recoverable. We did not recognize any impairments of finite-lived intangible assets during the three years ended December 31, 2017. Our intangible assets that have finite lives consisted of the following (in millions):
December 31, 2017 | December 31, 2016 | ||||||||||||||||||||||||
Estimated Useful Lives (Years) | Cost | Accumulated Amortization | Net | Cost | Accumulated Amortization | Net | |||||||||||||||||||
Customer contracts and relationships | 1 – 20 | $ | 1,188 | $ | (383 | ) | $ | 805 | $ | 529 | $ | (330 | ) | $ | 199 | ||||||||||
Property tax abatement | 7 – 13 | 38 | (30 | ) | 8 | 38 | (26 | ) | 12 | ||||||||||||||||
Other agreements | 25 – 70 | 39 | (8 | ) | 31 | 36 | (5 | ) | 31 | ||||||||||||||||
$ | 1,265 | $ | (421 | ) | $ | 844 | $ | 603 | $ | (361 | ) | $ | 242 | ||||||||||||
We estimate that our amortization expense related to finite-lived intangible assets for the next five years will be as follows (in millions):
2018 | $ | 63 | |
2019 | $ | 68 | |
2020 | $ | 74 | |
2021 | $ | 75 | |
2022 | $ | 76 | |
F-27
Note 10—Debt
Debt consisted of the following (in millions):
December 31, 2017 | December 31, 2016 | ||||||
SHORT-TERM DEBT | |||||||
PAA commercial paper notes, bearing a weighted-average interest rate of 2.4% and 1.6%, respectively (1) | $ | — | $ | 563 | |||
PAA senior secured hedged inventory facility, bearing a weighted-average interest rate of 2.6% and 1.8%, respectively (1) | 664 | 750 | |||||
PAA senior notes: | |||||||
6.13% senior notes due January 2017 | — | 400 | |||||
Other | 73 | 2 | |||||
Total short-term debt (2) | 737 | 1,715 | |||||
LONG-TERM DEBT | |||||||
PAA senior notes: | |||||||
6.50% senior notes due May 2018 (3) | — | 600 | |||||
8.75% senior notes due May 2019 (3) | — | 350 | |||||
2.60% senior notes due December 2019 | 500 | 500 | |||||
5.75% senior notes due January 2020 | 500 | 500 | |||||
5.00% senior notes due February 2021 | 600 | 600 | |||||
3.65% senior notes due June 2022 | 750 | 750 | |||||
2.85% senior notes due January 2023 | 400 | 400 | |||||
3.85% senior notes due October 2023 | 700 | 700 | |||||
3.60% senior notes due November 2024 | 750 | 750 | |||||
4.65% senior notes due October 2025 | 1,000 | 1,000 | |||||
4.50% senior notes due December 2026 | 750 | 750 | |||||
6.70% senior notes due May 2036 | 250 | 250 | |||||
6.65% senior notes due January 2037 | 600 | 600 | |||||
5.15% senior notes due June 2042 | 500 | 500 | |||||
4.30% senior notes due January 2043 | 350 | 350 | |||||
4.70% senior notes due June 2044 | 700 | 700 | |||||
4.90% senior notes due February 2045 | 650 | 650 | |||||
Unamortized discounts and debt issuance costs | (67 | ) | (76 | ) | |||
PAA senior notes, net of unamortized discounts and debt issuance costs | 8,933 | 9,874 | |||||
Other long-term debt: | |||||||
PAA commercial paper notes and PAA senior secured hedged inventory facility borrowings (4) | 247 | 247 | |||||
Other | 3 | 3 | |||||
Total long-term debt | 9,183 | 10,124 | |||||
Total debt (5) | $ | 9,920 | $ | 11,839 | |||
(1) | We classified these PAA commercial paper notes and credit facility borrowings as short-term as of December 31, 2017 and 2016, as these notes and borrowings were primarily designated as working capital borrowings, were required to be repaid within one year and were primarily for hedged NGL and crude oil inventory and NYMEX and ICE margin deposits. |
(2) | As of December 31, 2017 and 2016, balance includes borrowings of $212 million and $410 million, respectively, for cash margin deposits with NYMEX and ICE, which are associated with financial derivatives used for hedging purposes. |
(3) | In December 2017, PAA redeemed its $600 million, 6.50% senior notes due May 2018 and its $350 million, 8.75% senior notes due May 2019. See the “PAA Senior Notes—PAA Senior Note Repayments and Redemptions” section below for further discussion. |
F-28
(4) | As of December 31, 2017 and 2016, we classified a portion of the PAA commercial paper notes and the PAA senior secured hedged inventory facility borrowings as long-term based on our ability and intent to refinance such amounts on a long-term basis. |
(5) | PAA’s fixed-rate senior notes (including current maturities) had a face value of approximately $9.0 billion and $10.3 billion as of December 31, 2017 and 2016, respectively. We estimated the aggregate fair value of these notes as of December 31, 2017 and 2016 to be approximately $9.1 billion and $10.4 billion, respectively. PAA’s fixed-rate senior notes are traded among institutions, and these trades are routinely published by a reporting service. Our determination of fair value is based on reported trading activity near year end. We estimate that the carrying value of outstanding borrowings under the credit facilities and the PAA commercial paper program approximates fair value as interest rates reflect current market rates. The fair value estimates for the PAA senior notes, the credit facilities and the PAA commercial paper program are based upon observable market data and are classified in Level 2 of the fair value hierarchy. |
PAA Commercial Paper Program
PAA has a commercial paper program under which it may issue (and have outstanding at any time) up to $3.0 billion in the aggregate of privately placed, unsecured commercial paper notes. Such notes are backstopped by the PAA senior unsecured revolving credit facility and the PAA senior secured hedged inventory facility; as such, any borrowings under the PAA commercial paper program reduce the available capacity under these facilities.
Credit Facilities
PAA senior secured hedged inventory facility. PAA has a credit agreement that provides for a senior secured hedged inventory facility with a committed borrowing capacity of $1.4 billion, of which $400 million is available for the issuance of letters of credit. Subject to obtaining additional or increased lender commitments, the committed capacity of the facility may be increased to $1.9 billion. Proceeds from the facility are primarily used to finance purchased or stored hedged inventory, including NYMEX and ICE margin deposits. Such obligations under the committed facility are secured by the financed inventory and the associated accounts receivable and are repaid from the proceeds of the sale of the financed inventory. Borrowings accrue interest based, at PAA’s election, on either the Eurocurrency Rate or the Base Rate, in each case plus a margin based on PAA’s credit rating at the applicable time. The agreement also provides for one or more one-year extensions, subject to applicable approval. In August 2017, PAA amended this agreement to, among other things, extend the maturity date of the facility to August 2020 for each extending lender. The maturity date with respect to each non-extending lender (which represent aggregate commitments of approximately $60 million out of total commitments of $1.4 billion from all lenders) remains August 2019.
PAA senior unsecured revolving credit facility. PAA has a credit agreement that provides for a senior unsecured revolving credit facility with a committed borrowing capacity of $1.6 billion. Subject to obtaining additional or increased lender commitments, the committed capacity may be increased to $2.1 billion. The credit agreement also provides for the issuance of letters of credit. Borrowings accrue interest based, at PAA’s election, on the Eurocurrency Rate, the Base Rate or the Canadian Prime Rate, in each case plus a margin based on PAA’s credit rating at the applicable time. The agreement also provides for one or more one-year extensions, subject to applicable approval. In August 2017, PAA amended this agreement to, among other things, extend the maturity date of the facility to August 2022 for each extending lender. The maturity dates with respect to each non-extending lender (which represent aggregate commitments of $120 million out of total commitments of $1.6 billion from all lenders) remain August 2021 or mature one year earlier.
PAA senior unsecured 364-day revolving credit facility. PAA has a credit agreement that provides for a 364-day senior unsecured revolving credit facility with a borrowing capacity of $1.0 billion. In August 2017, PAA amended this agreement to extend the maturity date to August 2018. Additionally, a provision was added whereby we may elect to have the entire principal balance of any loans outstanding on the maturity date converted to a non-revolving term loan with a maturity date of August 2019. Borrowings accrue interest based, at PAA’s election, on either the Eurocurrency Rate or the Base Rate, as defined in the agreement, in each case plus a margin based on PAA’s credit rating at the applicable time.
AAP senior secured credit agreement. In connection with the Simplification Transactions, on November 15, 2016, PAA assumed all of AAP’s then outstanding borrowings under the AAP senior secured credit agreement, and immediately repaid such amounts and canceled the credit agreement. See Note 1 for further discussion of the Simplification Transactions.
F-29
PAA Senior Notes
PAA’s senior notes are co-issued, jointly and severally, by Plains All American Pipeline, L.P. and a 100%-owned consolidated finance subsidiary (neither of which have independent assets or operations) and are unsecured senior obligations of such entities and rank equally in right of payment with existing and future senior indebtedness of the issuers. PAA may, at its option, redeem any series of senior notes at any time in whole or from time to time in part, prior to maturity, at the redemption prices described in the indentures governing the senior notes. PAA’s senior notes are not guaranteed by any of its subsidiaries.
PAA Senior Notes Issuances
The table below summarizes PAA’s issuances of senior unsecured notes during 2016 and 2015 (in millions):
Year | Description | Maturity | Face Value | Interest Payment Dates | ||||||
2016 | 4.50% PAA Senior Notes issued at 99.716% of face value | December 2026 | $ | 750 | June 15 and December 15 | |||||
2015 | 4.65% PAA Senior Notes issued at 99.846% of face value | October 2025 | $ | 1,000 | April 15 and October 15 | |||||
PAA did not issue any senior unsecured notes during the year ended December 31, 2017.
PAA Senior Note Repayments and Redemptions
PAA’s $400 million, 6.13% senior notes matured and were repaid in January 2017. In December 2017, we redeemed PAA’s $600 million, 6.50% senior notes due May 2018 and PAA’s $350 million, 8.75% senior notes due May 2019. We utilized cash on hand and available capacity under the PAA commercial paper program and credit facilities to repay these notes. In conjunction with the early redemptions, we recognized a loss of approximately $40 million, recorded to Other income/(expense), net in our Consolidated Statements of Operations.
PAA’s $175 million, 5.88% senior notes matured and were repaid in August 2016. We utilized cash on hand and available capacity under the PAA commercial paper program and credit facilities to repay these notes.
PAA’s $150 million, 5.25% senior notes and $400 million, 3.95% senior notes matured and were repaid in June 2015 and September 2015, respectively. We utilized cash on hand and available capacity under the PAA commercial paper program to repay these notes.
Maturities
The weighted average maturity of our long-term debt outstanding at December 31, 2017 was approximately 12 years. The following table presents the aggregate contractually scheduled maturities of such long-term debt for the next five years and thereafter. The amounts presented exclude unamortized discounts and debt issuance costs.
Calendar Year | Payment (in millions) | |||
2018 | $ | 247 | ||
2019 | 500 | |||
2020 | 500 | |||
2021 | 600 | |||
2022 | 750 | |||
Thereafter | 6,653 | |||
F-30
Covenants and Compliance
PAA’s credit agreements (which impact the ability to access the PAA commercial paper program because they provide a financial backstop that supports PAA’s short-term credit ratings) and the indentures governing PAA’s senior notes contain cross-default provisions. PAA’s credit agreements prohibit declaration or payments of distributions on, or purchases or redemptions of, units if any default or event of default is continuing. In addition, PAA’s credit agreements contain various covenants limiting PAA’s ability to, among other things:
• | grant liens on certain property; |
• | incur indebtedness, including capital leases; |
• | sell substantially all of its assets or enter into a merger or consolidation; |
• | engage in certain transactions with affiliates; and |
• | enter into certain burdensome agreements. |
The credit agreements for the PAA senior unsecured revolving credit facility, the PAA senior secured hedged inventory facility and the PAA senior unsecured 364-day revolving credit facility treat a change of control as an event of default and also require PAA to maintain a debt-to-EBITDA coverage ratio that, on a trailing four-quarter basis, will not be greater than 5.00 to 1.00 (or 5.50 to 1.00 on all outstanding debt during an acquisition period (generally, the period consisting of three fiscal quarters following an acquisition greater than $150 million), and/or during the GP Simplification Period (the period beginning on November 15, 2016 and ending on December 31, 2017)). For covenant compliance purposes, Consolidated EBITDA may include certain adjustments, including those for material projects and certain non-recurring expenses. Additionally, letters of credit and borrowings to fund hedged inventory and margin requirements are excluded when calculating the debt coverage ratio.
A default under PAA’s credit facilities would permit the lenders to accelerate the maturity of the outstanding debt. As long as PAA is in compliance with its credit agreements, PAA’s ability to make distributions of available cash is not restricted. As of December 31, 2017, PAA was in compliance with the covenants contained in its credit agreements and indentures.
Borrowings and Repayments
Total borrowings under the credit agreements and the PAA commercial paper program for the years ended December 31, 2017, 2016 and 2015 were approximately $60.8 billion, $60.4 billion and $62.3 billion, respectively. Total repayments under the credit agreements and the PAA commercial paper program were approximately $61.5 billion, $61.0 billion and $61.4 billion for the years ended December 31, 2017, 2016 and 2015, respectively. The variance in total gross borrowings and repayments is impacted by various business and financial factors including, but not limited to, the timing, average term and method of general partnership borrowing activities.
Letters of Credit
In connection with our supply and logistics activities, we provide certain suppliers with irrevocable standby letters of credit to secure our obligation for the purchase and transportation of crude oil, NGL and natural gas. These letters of credit are issued under the PAA senior unsecured revolving credit facility and the PAA senior secured hedged inventory facility, and our liabilities with respect to these purchase obligations are recorded in accounts payable on our balance sheet in the month the crude oil, NGL or natural gas is purchased. Generally, these letters of credit are issued for periods of up to seventy days and are terminated upon completion of each transaction. Additionally, we issue letters of credit to support insurance programs, derivative transactions and construction activities. At December 31, 2017 and 2016, we had outstanding letters of credit of $166 million and $73 million, respectively.
Debt Issuance Costs
Costs incurred in connection with the issuance of senior notes are recorded as a direct deduction from the related debt liability and are amortized using the straight-line method over the term of the related debt. Use of the straight-line method does not differ materially from the “effective interest” method of amortization.
F-31
Note 11—Partners’ Capital and Distributions
Our Shares
Our Class A shares, Class B shares and Class C shares represent limited partner interests in us. The holders of our Class A and Class B shares are entitled to exercise the rights or privileges available to limited partners under our partnership agreement, but only holders of Class A shares are entitled to participate in our distributions.
Our Class C shares, which were established in connection with the Simplification Transactions, are non-economic and provide PAA, as the sole holder of such Class C shares, the right to vote in the election of eligible directors together with the holders of our Class A and Class B shares. Pursuant to the Omnibus Agreement, we issue Class C shares to PAA in an amount equal to the PAA Common Unit Equivalents outstanding excluding common units held by AAP.
Exchange and Redemption Rights
Holders of AAP units and their permitted transferees each have the right to exchange all or a portion of their AAP units for Class A shares at an exchange ratio of one Class A share for each AAP unit exchanged (referred to herein as their “Exchange Right”). This Exchange Right may be exercised only if, simultaneously therewith, an equal number of our Class B shares and general partner units are transferred by the exercising party to us. Additionally, a holder of vested AAP Management Units is entitled to convert his or her AAP Management Units into AAP units and a like number of our Class B shares based on a conversion ratio of approximately 0.941 AAP units for each AAP Management Unit. Following any such conversion, the holder will have the Exchange Right for our Class A shares. Holders of AAP Management Units who convert such units into AAP units and Class B shares will not receive general partner units and thus will not need to include any general partner units in a transfer or the exercise of their Exchange Right. See Note 16 for additional information regarding the AAP Management Units and Note 13 for additional information regarding the deferred tax asset associated with units that have been exchanged.
Additionally, subject to certain limitations, a holder of AAP units (other than us and GP LLC) will have the right (a “Redemption Right”) to cause AAP to redeem any or all of such holder’s AAP units in exchange for the distribution of an equivalent number of PAA common units held by AAP (“AAP Unit Redemption”). In connection with any AAP Unit Redemption, the redeeming holder will transfer the AAP units to AAP and a corresponding number of our Class B shares and general partner units (if any), in each case, to us. The AAP units transferred to AAP will be canceled, the Class B shares transferred to us will be canceled and the general partner units transferred to us will remain outstanding and increase our ownership percentage in our general partner.
F-32
Shares Outstanding
The following table presents the activity for our Class A shares, Class B shares and Class C shares:
Class A Shares | Class B Shares | Class C Shares | ||||||
Balance at December 31, 2014 | 77,707,758 | 149,869,056 | — | |||||
Exchange Right exercises | 8,383,468 | (8,383,468 | ) | — | ||||
Other | 7,811 | — | — | |||||
Balance at December 31, 2015 | 86,099,037 | 141,485,588 | — | |||||
Conversion of AAP Management Units | — | 14,693,093 | — | |||||
Exchange Right exercises | 15,099,678 | (15,099,678 | ) | — | ||||
Redemption Right exercises | (3,035,517 | ) | 3,035,517 | |||||
Issuance of Class C shares in connection with the Simplification Transactions | — | — | 477,648,826 | |||||
Sales of common units by a subsidiary | — | — | 11,226,520 | |||||
Other | 7,811 | — | — | |||||
Balance at December 31, 2016 | 101,206,526 | 138,043,486 | 491,910,863 | |||||
Conversion of AAP Management Units | — | 1,557,860 | — | |||||
Exchange Right exercises | 4,799,227 | (4,799,227 | ) | — | ||||
Redemption Right exercises | — | (7,817,547 | ) | 7,817,547 | ||||
Sales of Class A shares | 50,086,326 | — | — | |||||
Sales of common units by a subsidiary | — | — | 4,033,567 | |||||
Issuance of common units by a subsidiary in connection with acquisition of interest in Advantage Joint Venture (Note 8) | — | — | 1,252,269 | |||||
Issuances of Series A preferred units by a subsidiary | — | — | 5,307,689 | |||||
Other | 19,060 | — | 603,497 | |||||
Balance at December 31, 2017 | 156,111,139 | 126,984,572 | 510,925,432 | |||||
Distributions
We distribute 100% of our available cash within 55 days following the end of each quarter to Class A shareholders of record. Available cash is generally defined as all cash on hand at the date of determination of available cash for the distribution in respect to such quarter (including expected distributions from AAP in respect of such quarter), less reserves established by our general partner for future requirements.
The following table details the distributions paid to Class A shareholders during the periods indicated (in millions, except per share data):
Year | Distributions to Class A Shareholders | Distributions per Class A Share | ||||||
2017 | $ | 271 | $ | 1.95 | ||||
2016 | $ | 234 | $ | 2.40 | ||||
2015 | $ | 195 | $ | 2.35 | ||||
On January 8, 2018, we declared a cash distribution of $0.30 per outstanding Class A share. This distribution of $47 million was paid on February 14, 2018 to shareholders of record at the close of business on January 31, 2018, for the period October 1, 2017 through December 31, 2017.
F-33
Sales of Class A Shares
The following table summarizes our sales of Class A shares during the year ended December 31, 2017, all of which occurred in the first four months of the year (net proceeds in millions). We did not sell any Class A shares during the years ended December 31, 2016 or 2015.
Type of Offering | Class A Shares Issued | Net Proceeds (1) | ||||||
Continuous Offering Program | 1,786,326 | $ | 61 | (2) | ||||
Underwritten Offering | 48,300,000 | 1,474 | ||||||
50,086,326 | $ | 1,535 | ||||||
(1) | Amounts are net of costs associated with the offerings. |
(2) | We pay commissions to our sales agents in connection with issuances of Class A shares under our Continuous Offering Program. We paid $1 million of such commissions during the year ended December 31, 2017. |
Pursuant to the Omnibus Agreement entered into by the Plains Entities in connection with the Simplification Transactions, we used the net proceeds from the sale of our Class A shares, after deducting the sales agents’ commissions and offering expenses, to purchase from AAP a number of AAP units equal to the number of Class A shares sold in such offering at a price equal to the net proceeds from such offering. Also pursuant to the Omnibus Agreement, immediately following such purchase and sale, AAP used the net proceeds it received from such sale of AAP units to us to purchase from PAA an equivalent number of common units of PAA. See “—Subsidiary Sales of Units” below.
The cash purchase by PAGP of additional units issued by AAP and corresponding cash purchase by AAP of additional common units issued by PAA results in the allocation of the fair value of the proceeds between controlling and noncontrolling interests in AAP and PAA based on their respective ownership percentages. Additionally, in accordance with ASC 810, an adjustment in partners' capital based on historical carrying value is recognized by PAGP’s Class A shareholders on their increase in ownership of subsidiary entities and a corresponding adjustment is recognized in partners' capital by PAGP’s noncontrolling interests due to the dilution of their ownership interest. The allocation to noncontrolling interests results from the difference between the fair value per unit of the additional units issued and the historical carrying value per unit. Such amounts are reflected in “Sales of Class A shares” on our Consolidated Statements of Changes in Partners' Capital.
Other Comprehensive Income/(Loss)
Other comprehensive income/(loss) attributable to our Class A shareholders is comprised solely of their proportionate share of PAA’s other comprehensive income/(loss) based on our indirect ownership interest in PAA during the period.
Consolidated Subsidiaries
Noncontrolling Interests in Subsidiaries
As of December 31, 2017, noncontrolling interests in our subsidiaries consisted of (i) an approximate 64% limited partner interest in PAA (which included PAA common units and PAA Series A preferred units, as well as PAA Series B preferred units) and an (ii) an approximate 45% limited partner interest in AAP.
During the fourth quarter of 2017, PAA sold SLC Pipeline LLC, in which it previously owned a 75% interest and was consolidated under GAAP. As a result of this sale, the noncontrolling interest of 25% was derecognized. See Note 6 for additional information regarding the sale of SLC Pipeline LLC.
Subsidiary Sales of Units
Sales of PAA common units. PAA has entered into several equity distribution agreements under its Continuous Offering Program, pursuant to which PAA may offer and sell, through sales agents, common units representing limited partner interests. PAA may also sell its common units through overnight or underwritten offerings. The following table summarizes PAA’s issuance of common units in connection with such sales (net proceeds in millions):
F-34
Year | Type of Offering | Common Units Sold | Net Proceeds (1) | |||||||
2017 Total | Continuous Offering Program | 4,033,567 | $ | 129 | (2) | |||||
2016 Total | Continuous Offering Program | 26,278,288 | $ | 796 | (2) | |||||
2015 | Continuous Offering Program | 1,133,904 | $ | 58 | ||||||
2015 | Underwritten Offering | 21,000,000 | 1,041 | |||||||
2015 Total | 22,133,904 | $ | 1,099 | (2) | ||||||
(1) | Amounts are net of costs associated with the offerings. |
(2) | PAA pays commissions to sales agents in connection with common unit issuances under its Continuous Offering Program. PAA paid $1 million, $8 million and $1 million of such commissions during 2017, 2016 and 2015, respectively. |
For the periods following the Simplification Transactions, the proceeds from the issuance of additional common units are shared pro rata among all of PAA’s common unitholders, including AAP, based on their percentage ownership of common units. Additionally, PAA’s capital attributable to AAP was adjusted, in accordance with ASC 810, to reflect the dilution of its interest in PAA as a result of the issuance of additional common units to the public unitholders. Such adjustments are recognized by PAGP in proportion to PAGP’s ownership interest in AAP, which resulted in a net increase in partners’ capital attributable to PAGP. See Note 13 for additional information regarding the associated impact to the deferred tax asset.
Omnibus Agreement. PAA may sell common units to AAP pursuant to the Omnibus Agreement entered into by the Plains Entities, as discussed above. During the year ended December 31, 2017, pursuant to the Omnibus Agreement, PAA sold (i) approximately 1.8 million common units to AAP in connection with our issuance of Class A shares under our Continuous Offering Program and (ii) 48.3 million common units to AAP in connection with our March 2017 underwritten offering.
PAA Series A Preferred Unit Issuance. On January 28, 2016 (the “Issuance Date”), PAA completed the private placement of approximately 61.0 million Series A preferred units representing limited partner interests in PAA for a cash purchase price of $26.25 per unit (the “Issue Price”), resulting in total net proceeds, after deducting offering expenses and the 2% transaction fee due to the purchasers, of approximately $1.6 billion. Certain of the purchasers or their affiliates are related parties. See Note 15 for additional information.
The PAA Series A preferred units rank pari passu with the PAA Series B preferred units, and senior to PAA’s common units and to each other class or series of equity securities in PAA with respect to distribution rights and rights upon liquidation. The holders of the PAA Series A preferred units receive cumulative quarterly distributions, subject to customary antidilution adjustments, equal to $0.525 per unit ($2.10 per unit annualized). With respect to each quarter ending on or prior to December 31, 2017 (the “Initial Distribution Period”), PAA elected to pay distributions on the PAA Series A preferred units in additional Series A preferred units. With respect to any quarter ending after the Initial Distribution Period, PAA must pay distributions on the PAA Series A preferred units in cash.
The Series A preferred units are convertible at the purchasers’ option into PAA common units, generally on a one-for-one basis, at any time after January 28, 2018, subject to certain conditions, and are convertible at PAA’s option in certain circumstances after January 28, 2019. For a period of 30 days following (a) the fifth anniversary of the Issuance Date of the PAA Series A preferred units and (b) each subsequent anniversary of the Issuance Date, the holders of the PAA Series A preferred units, acting by majority vote, may make a one-time election to reset the distribution rate to equal the then applicable rate of the ten-year U.S. Treasury plus 5.85% (the “Preferred Distribution Rate Reset Option”). The Preferred Distribution Rate Reset Option is accounted for as an embedded derivative. See Note 12 for additional information.
PAA Series B Preferred Unit Issuance. On October 10, 2017, PAA issued 800,000 Series B Fixed-to-Floating Rate Cumulative Redeemable Perpetual Preferred Units representing limited partner interests in PAA (the “Series B preferred units”) at a price to the public of $1,000 per unit. PAA used the net proceeds of $788 million, after deducting the underwriters’ discounts and offering expenses, from the issuance of the Series B preferred units to repay amounts outstanding under its credit facilities and commercial paper program and for general partnership purposes.
F-35
The Series B preferred units represent perpetual equity interests in PAA, and they have no stated maturity or mandatory redemption date and are not redeemable at the option of the holders under any circumstances. Holders of the Series B preferred units generally have no voting rights, except for limited voting rights with respect to (i) potential amendments to PAA’s partnership agreement that would have a material adverse effect on the existing preferences, rights, powers or duties of the Series B preferred units, (ii) the creation or issuance of any parity securities if the cumulative distributions payable on then outstanding Series B preferred units are in arrears, (iii) the creation or issuance of any senior securities and (iv) the payment of distributions to PAA’s common unitholders out of capital surplus. The Series B preferred units rank, as to the payment of distributions and amounts payable on a liquidation event, on par with PAA’s outstanding Series A preferred units.
The Series B preferred units have a liquidation preference of $1,000 per unit. Holders of PAA’s Series B preferred units are entitled to receive, when, as and if declared by PAA’s general partner out of legally available funds for such purpose, cumulative semiannual or quarterly cash distributions, as applicable. Distributions on the Series B preferred units accrue and are cumulative from October 10, 2017, the date of original issue, and are payable semiannually in arrears on the 15th day of May and November through and including November 15, 2022, and after November 15, 2022, quarterly in arrears on the 15th day of February, May, August and November of each year. The initial distribution rate for the Series B preferred units from and including October 10, 2017 to, but not including, November 15, 2022 is 6.125% per year of the liquidation preference per unit (equal to $61.25 per unit per year). On and after November 15, 2022, distributions on the Series B preferred units will accumulate for each distribution period at a percentage of the liquidation preference equal to the then-current three-month LIBOR plus a spread of 4.11%.
Upon the occurrence of certain rating agency events, PAA may redeem the Series B preferred units, in whole but not in part, at a price of $1,020 (102% of the liquidation preference) per Series B preferred unit plus an amount equal to all accumulated and unpaid distributions thereon to, but not including, the date of redemption, whether or not declared. In addition, at any time on or after November 15, 2022, PAA may redeem the Series B preferred units, at its option, in whole or in part, at a redemption price of $1,000 per Series B preferred unit plus an amount equal to all accumulated and unpaid distributions thereon to, but not including, the date of redemption, whether or not declared.
Deferred Tax Asset Impact from the Sale of Subsidiary Units
In connection with the sales of AAP units and PAA common units referenced above, a deferred asset was created. The tax basis of PAGP’s purchase of the additional units was accounted for at fair market value for U.S. federal income tax purposes, but the GAAP basis was impacted by the adjustments that are based on historical carrying value. The resulting basis difference resulted in a deferred tax asset that was recorded as a component of partner’s capital as it results from transactions with shareholders. See Note 13 for additional information.
Subsidiary Distributions
PAA Common Unit Distributions. PAA distributes 100% of its available cash within 45 days following the end of each quarter to common unitholders of record, including AAP. Available cash is generally defined as all of PAA’s cash and cash equivalents on hand at the end of each quarter, less reserves established in the reasonable discretion of its general partner for future requirements.
The following table details distributions paid by PAA (in millions, except per unit data):
Distributions Paid | Distributions per common unit | ||||||||||||||||
Year | Public | AAP (1) | Total | ||||||||||||||
2017 | $ | 849 | $ | 537 | $ | 1,386 | $ | 1.95 | |||||||||
2016 | $ | 1,062 | $ | 565 | $ | 1,627 | $ | 2.65 | |||||||||
2015 | $ | 1,081 | $ | 590 | $ | 1,671 | $ | 2.76 | |||||||||
(1) | Prior to the Simplification Transactions, AAP was entitled to receive (i) distributions with respect to its 2% indirect general partner interest in PAA and (ii) as the holder of PAA’s IDRs, incentive distributions if the amount PAA distributed with respect to any quarter exceeded certain specified levels. The Simplification Transactions, which closed on November 15, 2016, included the permanent elimination of PAA’s IDRs and the economic rights associated with its 2% general partner interest in exchange for the issuance by PAA to AAP of approximately 244.7 million common units. As such, beginning with the distribution pertaining to the fourth quarter of 2016, AAP is no longer entitled to receive distributions on the IDRs or general partner interest. During the year ended December 31, 2017, AAP received distributions on the PAA common units it owned. |
F-36
On January 8, 2018, PAA declared a cash distribution of $0.30 per unit on its outstanding common units. The total distribution of $218 million was paid on February 14, 2018 to unitholders of record on January 31, 2018, for the period October 1, 2017 through December 31, 2017. Of this amount, approximately $85 million was paid to AAP.
PAA Series A Preferred Unit Distributions. In 2017, PAA issued 5,307,689 Series A preferred units in lieu of cash distributions of $139 million. In 2016, PAA issued 3,358,726 Series A preferred units in lieu of cash distributions of $89 million.
On February 14, 2018, PAA issued 1,393,926 Series A preferred units in lieu of a cash distribution of $37 million.
PAA Series B Preferred Unit Distributions. PAA paid a pro-rated initial distribution on its Series B preferred units on November 15, 2017 to holders of record at the close of business on November 1, 2017 in an amount equal to approximately $5.9549 per unit (a total distribution of approximately $5 million). At December 31, 2017, we had accrued approximately $6 million of distributions payable to PAA’s Series B preferred unitholders.
AAP Distributions. AAP distributes all of the cash received from PAA distributions on a quarterly basis, less reserves established in the discretion of its general partner for future requirements. Generally, distributions are paid to its partners in proportion to their percentage interest in AAP. The following table details the distributions to AAP’s partners paid during the periods indicated from distributions received from PAA (in millions):
Distributions to AAP’s Partners | ||||||||||||||||||||
Year | Available Cash Before Reserves | Cash Reserves | Total | Noncontrolling Interests | PAGP | |||||||||||||||
2017 | $ | 537 | $ | — | $ | 537 | $ | 266 | $ | 271 | ||||||||||
2016 | $ | 598 | (1) | $ | (11 | ) | (2) | $ | 587 | $ | 353 | $ | 234 | |||||||
2015 | $ | 590 | $ | (14 | ) | $ | 576 | $ | 380 | $ | 196 | |||||||||
(1) | Includes $33 million that was borrowed under the AAP senior secured revolving credit facility. AAP agreed to borrow funds under its credit agreement as necessary to make a special true-up distribution to its partners that, when added to the distributions paid to AAP in respect of its 2% general partner interest in PAA and the IDRs, equaled the total distribution its partners would have received if the closing of the Simplification Transactions had occurred immediately prior to the record date for the third quarter distribution. |
(2) | The amount of the distribution paid to AAP’s partners in November 2016 assumed that the Simplification Transactions had closed as of the date of record for the third quarter distribution. Pursuant to the Omnibus Agreement entered into as part of the Simplification Transactions, AAP’s expenses will be paid by PAA. Therefore, no cash was reserved from this distribution for future expenses of AAP. |
On February 14, 2018, AAP distributed $85 million to its partners from distributions received from PAA. Of this amount, $38 million was distributed to noncontrolling interests and $47 million was distributed to us.
Other Distributions. During the years ended December 31, 2017, 2016 and 2015, distributions of $2 million, $4 million and $3 million, respectively, were paid to noncontrolling interests in SLC Pipeline LLC.
F-37
Note 12—Derivatives and Risk Management Activities
We identify the risks that underlie our core business activities and use risk management strategies to mitigate those risks when we determine that there is value in doing so. Our policy is to use derivative instruments for risk management purposes and not for the purpose of speculating on hydrocarbon commodity (referred to herein as “commodity”) price changes. We use various derivative instruments to manage our exposure to (i) commodity price risk, as well as to optimize our profits, (ii) interest rate risk and (iii) currency exchange rate risk. Our commodity price risk management policies and procedures are designed to help ensure that our hedging activities address our risks by monitoring our derivative positions, as well as physical volumes, grades, locations, delivery schedules and storage capacity. Our interest rate and currency exchange rate risk management policies and procedures are designed to monitor our derivative positions and ensure that those positions are consistent with our objectives and approved strategies. When we apply hedge accounting, our policy is to formally document all relationships between hedging instruments and hedged items, as well as our risk management objectives for undertaking the hedge. This process includes specific identification of the hedging instrument and the hedged transaction, the nature of the risk being hedged and how the hedging instrument’s effectiveness will be assessed. Both at the inception of the hedge and throughout the hedging relationship, we assess whether the derivatives employed are highly effective in offsetting changes in cash flows of anticipated hedged transactions.
Commodity Price Risk Hedging
Our core business activities involve certain commodity price-related risks that we manage in various ways, including through the use of derivative instruments. Our policy is to (i) only purchase inventory for which we have a market, (ii) structure our sales contracts so that price fluctuations do not materially affect our operating income and (iii) not acquire and hold physical inventory or derivatives for the purpose of speculating on commodity price changes. The material commodity-related risks inherent in our business activities can be divided into the following general categories:
Commodity Purchases and Sales — In the normal course of our operations, we purchase and sell commodities. We use derivatives to manage the associated risks and to optimize profits. As of December 31, 2017, net derivative positions related to these activities included:
• | A net long position of 3.3 million barrels associated with our crude oil purchases, which was unwound ratably during January 2018 to match monthly average pricing. |
• | A net short time spread position of 5.2 million barrels, which hedges a portion of our anticipated crude oil lease gathering purchases through February 2019. |
• | A crude oil grade basis position of 30.3 million barrels through December 2019. These derivatives allow us to lock in grade basis differentials. |
• | A net short position of 16.5 million barrels through December 2020 related to anticipated net sales of our crude oil and NGL inventory. |
Pipeline Loss Allowance Oil — As is common in the pipeline transportation industry, our tariffs incorporate a loss allowance factor that is intended to, among other things, offset losses due to evaporation, measurement and other losses in transit. We utilize derivative instruments to hedge a portion of the anticipated sales of the allowance oil that is to be collected under our tariffs. As of December 31, 2017, our PLA hedges included a net short position consisting of crude oil futures of 1.1 million barrels and a long call option position of 0.9 million barrels through December 2019.
Natural Gas Processing/NGL Fractionation — We purchase natural gas for processing and operational needs. Additionally, we purchase NGL mix for fractionation and sell the resulting individual specification products (including ethane, propane, butane and condensate). In conjunction with these activities, we hedge the price risk associated with the purchase of the natural gas and the subsequent sale of the individual specification products. As of December 31, 2017, we had a long natural gas position of 54.3 Bcf which hedges our natural gas processing and operational needs through December 2020. We also had a short propane position of 8.6 million barrels through December 2018, a short butane position of 2.6 million barrels through December 2018 and a short WTI position of 1.0 million barrels through December 2018. In addition, we had a long power position of 0.4 million megawatt hours, which hedges a portion of our power supply requirements at our Canadian natural gas processing and fractionation plants through December 2019.
Physical commodity contracts that meet the definition of a derivative but are ineligible, or not designated, for the normal purchases and normal sales scope exception are recorded on the balance sheet at fair value, with changes in fair value recognized in earnings. We have determined that substantially all of our physical commodity contracts qualify for the normal purchases and normal sales scope exception.
F-38
Interest Rate Risk Hedging
We use interest rate derivatives to hedge the benchmark interest rate associated interest payments occurring as a result of debt issuances. The derivative instruments we use to manage this risk consist of forward starting interest rate swaps and treasury locks. These derivatives are designated as cash flow hedges. As such, changes in fair value are deferred in AOCI and are reclassified to interest expense as we incur the interest expense associated with the underlying debt.
The following table summarizes the terms of our outstanding interest rate derivatives as of December 31, 2017 (notional amounts in millions):
Hedged Transaction | Number and Types of Derivatives Employed | Notional Amount | Expected Termination Date | Average Rate Locked | Accounting Treatment | ||||||||
Anticipated interest payments | 16 forward starting swaps (30-year) | $ | 400 | 6/15/2018 | 2.86 | % | Cash flow hedge | ||||||
Anticipated interest payments | 8 forward starting swaps (30-year) | $ | 200 | 6/14/2019 | 2.83 | % | Cash flow hedge | ||||||
Currency Exchange Rate Risk Hedging
Because a significant portion of our Canadian business is conducted in CAD we use foreign currency derivatives to minimize the risk of unfavorable changes in exchange rates. These instruments include foreign currency exchange contracts and forwards.
As of December 31, 2017, our outstanding foreign currency derivatives include derivatives we use to hedge currency exchange risk (i) associated with USD-denominated commodity purchases and sales in Canada and (ii) created by the use of USD-denominated commodity derivatives to hedge commodity price risk associated with CAD-denominated commodity purchases and sales.
The following table summarizes our open forward exchange contracts as of December 31, 2017 (in millions):
USD | CAD | Average Exchange Rate USD to CAD | |||||||||
Forward exchange contracts that exchange CAD for USD: | |||||||||||
2018 | $ | 87 | $ | 109 | $1.00 - $1.26 | ||||||
Forward exchange contracts that exchange USD for CAD: | |||||||||||
2018 | $ | 645 | $ | 816 | $1.00 - $1.27 | ||||||
Preferred Distribution Rate Reset Option
A derivative feature embedded in a contract that does not meet the definition of a derivative in its entirety must be bifurcated and accounted for separately if the economic characteristics and risks of the embedded derivative are not clearly and closely related to those of the host contract. The Preferred Distribution Rate Reset Option of the PAA Series A preferred units is an embedded derivative that must be bifurcated from the related host contract, the PAA partnership agreement, and recorded at fair value on our Consolidated Balance Sheet. Corresponding changes in fair value are recognized in “Other income/(expense), net” in our Consolidated Statement of Operations. At December 31, 2017 and 2016, the fair value of this embedded derivative was a liability of approximately $22 million and $32 million, respectively. We recognized gains of approximately $13 million and $30 million for the years ended December 31, 2017 and 2016, respectively. See Note 11 for additional information regarding the PAA Series A preferred units and the Preferred Distribution Rate Reset Option.
F-39
Summary of Financial Impact
We record all open derivatives on the balance sheet as either assets or liabilities measured at fair value. Changes in the fair value of derivatives are recognized currently in earnings unless specific hedge accounting criteria are met. For derivatives that qualify as cash flow hedges, changes in fair value of the effective portion of the hedges are deferred in AOCI and recognized in earnings in the periods during which the underlying physical transactions are recognized in earnings. Derivatives that do not qualify for hedge accounting and the portion of cash flow hedges that are not highly effective in offsetting changes in cash flows of the hedged items are recognized in earnings each period. Cash settlements associated with our derivative activities are classified within the same category as the related hedged item in our Consolidated Statements of Cash Flows.
A summary of the impact of our derivatives recognized in earnings is as follows (in millions):
Year Ended December 31, 2017 | |||||||||||||
Location of Gain/(Loss) | Derivatives in Hedging Relationships (1) (2) | Derivatives Not Designated as a Hedge | Total | ||||||||||
Commodity Derivatives | |||||||||||||
Supply and Logistics segment revenues | $ | — | $ | (188 | ) | $ | (188 | ) | |||||
Field operating costs | — | (10 | ) | (10 | ) | ||||||||
Depreciation and amortization | (3 | ) | — | (3 | ) | ||||||||
Interest Rate Derivatives | |||||||||||||
Interest expense, net | (18 | ) | — | (18 | ) | ||||||||
Foreign Currency Derivatives | |||||||||||||
Supply and Logistics segment revenues | — | 8 | 8 | ||||||||||
Preferred Distribution Rate Reset Option | |||||||||||||
Other income/(expense), net | — | 13 | 13 | ||||||||||
Total Gain/(Loss) on Derivatives Recognized in Net Income | $ | (21 | ) | $ | (177 | ) | $ | (198 | ) | ||||
F-40
Year Ended December 31, 2016 | |||||||||||||
Location of Gain/(Loss) | Derivatives in Hedging Relationships (1) (2) | Derivatives Not Designated as a Hedge | Total | ||||||||||
Commodity Derivatives | |||||||||||||
Supply and Logistics segment revenues | $ | 2 | $ | (344 | ) | $ | (342 | ) | |||||
Transportation segment revenues | — | 5 | 5 | ||||||||||
Interest Rate Derivatives | |||||||||||||
Interest expense, net | (14 | ) | — | (14 | ) | ||||||||
Foreign Currency Derivatives | |||||||||||||
Supply and Logistics segment revenues | — | (3 | ) | (3 | ) | ||||||||
Preferred Distribution Rate Reset Option | |||||||||||||
Other income/(expense), net | — | 30 | 30 | ||||||||||
Total Gain/(Loss) on Derivatives Recognized in Net Income | $ | (12 | ) | $ | (312 | ) | $ | (324 | ) | ||||
Year Ended December 31, 2015 | |||||||||||||
Location of Gain/(Loss) | Derivatives in Hedging Relationships (1) (2) | Derivatives Not Designated as a Hedge | Total | ||||||||||
Commodity Derivatives | |||||||||||||
Supply and Logistics segment revenues | $ | 56 | $ | 152 | $ | 208 | |||||||
Transportation segment revenues | — | 8 | 8 | ||||||||||
Field operating costs | — | (18 | ) | (18 | ) | ||||||||
Interest Rate Derivatives | |||||||||||||
Interest expense, net | (11 | ) | — | (11 | ) | ||||||||
Foreign Currency Derivatives | |||||||||||||
Supply and Logistics segment revenues | — | (31 | ) | (31 | ) | ||||||||
Total Gain/(Loss) on Derivatives Recognized in Net Income | $ | 45 | $ | 111 | $ | 156 | |||||||
(1) | During the year ended December 31, 2017, we reclassified losses of approximately $10 million to Interest expense, net. During the year ended December 31, 2016, we reclassified losses of approximately $2 million to Supply and Logistics segment revenues and $2 million to Interest expense, net. During the year ended December 31, 2015, we reclassified a loss of approximately $4 million to Interest expense, net. Each reclassification from AOCI to earnings was due to anticipated hedged transactions being probable of not occurring. |
F-41
(2) | Amounts in Interest expense, net include a loss of $4 million during the year ended December 31, 2016 attributable to the ineffective portion of cash flow hedges. No ineffectiveness was recognized for cash flow hedges during the years ended December 31, 2017 or 2015. |
The following table summarizes the derivative assets and liabilities on our Consolidated Balance Sheet on a gross basis as of December 31, 2017 (in millions):
Asset Derivatives | Liability Derivatives | |||||||||||
Balance Sheet Location | Fair Value | Balance Sheet Location | Fair Value | |||||||||
Derivatives designated as hedging instruments: | ||||||||||||
Interest rate derivatives | Other current liabilities | $ | 2 | Other current liabilities | $ | (27 | ) | |||||
Other long-term liabilities and deferred credits | (11 | ) | ||||||||||
Total derivatives designated as hedging instruments | $ | 2 | $ | (38 | ) | |||||||
Derivatives not designated as hedging instruments: | ||||||||||||
Commodity derivatives | Other current assets | $ | 73 | Other current assets | $ | (227 | ) | |||||
Other long-term assets, net | 1 | Other current liabilities | (131 | ) | ||||||||
Other current liabilities | 5 | Other long-term liabilities and deferred credits | (5 | ) | ||||||||
Other long-term liabilities and deferred credits | 3 | |||||||||||
Foreign currency derivatives | Other current assets | 6 | Other current assets | (2 | ) | |||||||
Preferred Distribution Rate Reset Option | — | Other long-term liabilities and deferred credits | (22 | ) | ||||||||
Total derivatives not designated as hedging instruments | $ | 88 | $ | (387 | ) | |||||||
Total derivatives | $ | 90 | $ | (425 | ) | |||||||
F-42
The following table summarizes the derivative assets and liabilities on our Consolidated Balance Sheet on a gross basis as of December 31, 2016 (in millions):
Asset Derivatives | Liability Derivatives | |||||||||||
Balance Sheet Location | Fair Value | Balance Sheet Location | Fair Value | |||||||||
Derivatives designated as hedging instruments: | ||||||||||||
Interest rate derivatives | $ | — | Other current liabilities | $ | (23 | ) | ||||||
Other long-term liabilities and deferred credits | (27 | ) | ||||||||||
Total derivatives designated as hedging instruments | $ | — | $ | (50 | ) | |||||||
Derivatives not designated as hedging instruments: | ||||||||||||
Commodity derivatives | Other current assets | $ | 101 | Other current assets | $ | (344 | ) | |||||
Other long-term assets, net | 2 | Other long-term assets, net | (1 | ) | ||||||||
Other long-term liabilities and deferred credits | 2 | Other current liabilities | (14 | ) | ||||||||
Other long-term liabilities and deferred credits | (34 | ) | ||||||||||
Foreign currency derivatives | Other current liabilities | 3 | Other current liabilities | (6 | ) | |||||||
Preferred Distribution Rate Reset Option | — | Other long-term liabilities and deferred credits | (32 | ) | ||||||||
Total derivatives not designated as hedging instruments | $ | 108 | $ | (431 | ) | |||||||
Total derivatives | $ | 108 | $ | (481 | ) | |||||||
Our derivative transactions (other than the Preferred Distribution Rate Reset Option) are governed through ISDA (International Swaps and Derivatives Association) master agreements and clearing brokerage agreements. These agreements include stipulations regarding the right of set off in the event that we or our counterparty default on performance obligations. If a default were to occur, both parties have the right to net amounts payable and receivable into a single net settlement between parties.
Our accounting policy is to offset derivative assets and liabilities executed with the same counterparty when a master netting arrangement exists. Accordingly, we also offset derivative assets and liabilities with amounts associated with cash margin. Our exchange-traded derivatives are transacted through clearing brokerage accounts and are subject to margin requirements as established by the respective exchange. On a daily basis, our account equity (consisting of the sum of our cash balance and the fair value of our open derivatives) is compared to our initial margin requirement resulting in the payment or return of variation margin. The following table provides the components of our net broker receivable/(payable):
December 31, 2017 | December 31, 2016 | |||||||
Initial margin | $ | 48 | $ | 119 | ||||
Variation margin posted | 164 | 291 | ||||||
Net broker receivable | $ | 212 | $ | 410 | ||||
F-43
The following table presents information about derivative financial assets and liabilities that are subject to offsetting, including enforceable master netting arrangements (in millions):
December 31, 2017 | December 31, 2016 | |||||||||||||||
Derivative Asset Positions | Derivative Liability Positions | Derivative Asset Positions | Derivative Liability Positions | |||||||||||||
Netting Adjustments: | ||||||||||||||||
Gross position - asset/(liability) | $ | 90 | $ | (425 | ) | $ | 108 | $ | (481 | ) | ||||||
Netting adjustment | (239 | ) | 239 | (350 | ) | 350 | ||||||||||
Cash collateral paid | 212 | — | 410 | — | ||||||||||||
Net position - asset/(liability) | $ | 63 | $ | (186 | ) | $ | 168 | $ | (131 | ) | ||||||
Balance Sheet Location After Netting Adjustments: | ||||||||||||||||
Other current assets | $ | 62 | $ | — | $ | 167 | $ | — | ||||||||
Other long-term assets, net | 1 | — | 1 | — | ||||||||||||
Other current liabilities | — | (151 | ) | — | (40 | ) | ||||||||||
Other long-term liabilities and deferred credits | — | (35 | ) | — | (91 | ) | ||||||||||
$ | 63 | $ | (186 | ) | $ | 168 | $ | (131 | ) | |||||||
As of December 31, 2017, there was a net loss of $223 million deferred in AOCI. The deferred net loss recorded in AOCI is expected to be reclassified to future earnings contemporaneously with (i) the earnings recognition of the underlying hedged commodity transaction or (ii) interest expense accruals associated with underlying debt instruments. Of the total net loss deferred in AOCI at December 31, 2017, we expect to reclassify a net loss of $8 million to earnings in the next twelve months. The remaining deferred loss of $215 million is expected to be reclassified to earnings through 2049. A portion of these amounts is based on market prices as of December 31, 2017; thus, actual amounts to be reclassified will differ and could vary materially as a result of changes in market conditions.
The following table summarizes the net deferred gain/(loss) recognized in AOCI for derivatives (in millions):
Year Ended December 31, | |||||||||||
2017 | 2016 | 2015 | |||||||||
Commodity derivatives, net | $ | — | $ | — | $ | 33 | |||||
Interest rate derivatives, net | (16 | ) | (33 | ) | (32 | ) | |||||
Total | $ | (16 | ) | $ | (33 | ) | $ | 1 | |||
At December 31, 2017 and December 31, 2016, none of our outstanding derivatives contained credit-risk related contingent features that would result in a material adverse impact to us upon any change in PAA’s credit ratings. Although we may be required to post margin on our cleared derivatives as described above, we do not require our non-cleared derivative counterparties to post collateral with us.
F-44
Recurring Fair Value Measurements
Derivative Financial Assets and Liabilities
The following table sets forth by level within the fair value hierarchy our financial assets and liabilities that were accounted for at fair value on a recurring basis (in millions):
Fair Value as of December 31, 2017 | Fair Value as of December 31, 2016 | ||||||||||||||||||||||||||||||||
Recurring Fair Value Measures (1) | Level 1 | Level 2 | Level 3 | Total | Level 1 | Level 2 | Level 3 | Total | |||||||||||||||||||||||||
Commodity derivatives | $ | 5 | $ | (278 | ) | $ | (8 | ) | $ | (281 | ) | $ | (113 | ) | $ | (171 | ) | $ | (4 | ) | $ | (288 | ) | ||||||||||
Interest rate derivatives | — | (36 | ) | — | (36 | ) | — | (50 | ) | — | (50 | ) | |||||||||||||||||||||
Foreign currency derivatives | — | 4 | — | 4 | — | (3 | ) | — | (3 | ) | |||||||||||||||||||||||
Preferred Distribution Rate Reset Option | — | — | (22 | ) | (22 | ) | — | — | (32 | ) | (32 | ) | |||||||||||||||||||||
Total net derivative asset/(liability) | $ | 5 | $ | (310 | ) | $ | (30 | ) | $ | (335 | ) | $ | (113 | ) | $ | (224 | ) | $ | (36 | ) | $ | (373 | ) | ||||||||||
(1) | Derivative assets and liabilities are presented above on a net basis but do not include related cash margin deposits. |
Level 1
Level 1 of the fair value hierarchy includes exchange-traded commodity derivatives such as futures and options. The fair value of exchange-traded commodity derivatives is based on unadjusted quoted prices in active markets.
Level 2
Level 2 of the fair value hierarchy includes exchange-cleared commodity derivatives and over-the-counter commodity, interest rate and foreign currency derivatives that are traded in active markets. In addition, it includes certain physical commodity contracts. The fair value of these derivatives is based on broker price quotations which are corroborated with market observable inputs.
Level 3
Level 3 of the fair value hierarchy includes certain physical commodity contracts and the Preferred Distribution Rate Reset Option contained in PAA’s partnership agreement which is classified as an embedded derivative.
The fair value of our Level 3 physical commodity contracts is based on a valuation model utilizing timing estimates, which involve management judgment. Significant changes in timing could result in a material change in fair value to our physical commodity contracts. We report unrealized gains and losses associated with these physical commodity contracts in our Consolidated Statements of Operations as Supply and Logistics segment revenues.
The fair value of the embedded derivative feature contained in PAA’s partnership agreement is based on a valuation model that estimates the fair value of the PAA Series A preferred units with and without the Preferred Distribution Rate Reset Option. This model contains inputs, including PAA’s common unit price, ten-year U.S. treasury rates, default probabilities and timing estimates which involve management judgment. A significant increase or decrease in the value of these inputs could result in a material change in fair value to this embedded derivative feature. We report unrealized gains and losses associated with this embedded derivative in our Consolidated Statements of Operations as “Other income/(expense), net.”
To the extent any transfers between levels of the fair value hierarchy occur, our policy is to reflect these transfers as of the beginning of the reporting period in which they occur.
F-45
Rollforward of Level 3 Net Asset/(Liability)
The following table provides a reconciliation of changes in fair value of the beginning and ending balances for our derivatives classified as Level 3 (in millions):
Year Ended December 31, | |||||||
2017 | 2016 | ||||||
Beginning Balance | $ | (36 | ) | $ | 11 | ||
Net gains for the period included in earnings | 12 | 28 | |||||
Settlements | 4 | (10 | ) | ||||
Derivatives entered into during the period | (10 | ) | (65 | ) | |||
Ending Balance | $ | (30 | ) | $ | (36 | ) | |
Change in unrealized gains/(losses) included in earnings relating to Level 3 derivatives still held at the end of the period | $ | 5 | $ | (36 | ) | ||
Note 13—Income Taxes
Income tax expense is estimated using the tax rate in effect or to be in effect during the relevant periods in the jurisdictions in which we operate. Deferred income tax assets and liabilities are recognized for temporary differences between the basis of assets and liabilities for financial reporting and tax purposes and are stated at enacted tax rates expected to be in effect when taxes are actually paid or recovered. To the extent we do not consider it more likely than not that a deferred tax asset will be recovered, a valuation allowance is established. Changes in tax legislation are included in the relevant computations in the period in which such changes are effective. We review contingent tax liabilities for estimated exposures on a more likely than not standard related to our current tax positions.
Pursuant to FASB guidance related to accounting for uncertainty in income taxes, we may recognize the tax benefit from an uncertain tax position only if it is more likely than not that the tax position will be sustained upon examination by the taxing authorities, based on the technical merits of the tax position and also the past administrative practices and precedents of the taxing authority. As of December 31, 2017 and 2016, we had not recognized any material amounts in connection with uncertainty in income taxes.
U.S. Federal and State Taxes
Although we are organized as a limited partnership, we have elected to be treated as a corporation for U.S. federal income tax purposes and are therefore subject to both U. S. federal and state income taxes.
Canadian Federal and Provincial Taxes
All of our Canadian operations are conducted by entities that are treated as corporations for Canadian tax purposes (flow through for U.S. income tax purposes) and that are subject to Canadian federal and provincial taxes. Additionally, payments of interest and dividends from our Canadian entities to other Plains entities are subject to Canadian withholding tax that is treated as income tax expense.
F-46
Tax Components
Components of income tax expense are as follows (in millions):
Year Ended December 31, | |||||||||||
2017 | 2016 | 2015 | |||||||||
Current income tax expense: | |||||||||||
State income tax | $ | 1 | $ | 2 | $ | 1 | |||||
Canadian federal and provincial income tax | 27 | 83 | 83 | ||||||||
Total current income tax expense | $ | 28 | $ | 85 | $ | 84 | |||||
Deferred income tax expense/(benefit): | |||||||||||
Federal income tax | $ | 872 | $ | 57 | $ | 75 | |||||
State income tax | 21 | (4 | ) | 7 | |||||||
Canadian federal and provincial income tax | 16 | (60 | ) | 16 | |||||||
Total deferred income tax expense/(benefit) | $ | 909 | $ | (7 | ) | $ | 98 | ||||
Total income tax expense | $ | 937 | $ | 78 | $ | 182 | |||||
The difference between income tax expense based on the statutory federal income tax rate and our effective income tax expense is summarized as follows (in millions):
Year Ended December 31, | |||||||||||
2017 | 2016 | 2015 | |||||||||
Income before tax | $ | 896 | $ | 738 | $ | 991 | |||||
Net income attributable to noncontrolling interests | (690 | ) | (566 | ) | (691 | ) | |||||
Income taxes attributable to noncontrolling interests | (44 | ) | (25 | ) | (100 | ) | |||||
$ | 162 | $ | 147 | $ | 200 | ||||||
Federal statutory income tax rate | 35 | % | 35 | % | 35 | % | |||||
Income tax at statutory rate | $ | 57 | $ | 51 | $ | 70 | |||||
Deferred tax impact of federal 2017 Tax Act | 823 | — | — | ||||||||
Deferred tax rate adjustment | 10 | (1 | ) | 8 | |||||||
State income tax, net of federal benefit | 3 | 3 | 4 | ||||||||
Income taxes attributable to noncontrolling interests: | |||||||||||
Canadian federal and provincial income tax | 41 | 10 | 85 | ||||||||
Canadian withholding tax | 2 | 13 | 14 | ||||||||
State income tax | 1 | 2 | 1 | ||||||||
Total income tax expense | $ | 937 | $ | 78 | $ | 182 | |||||
F-47
Deferred tax assets and liabilities are aggregated by the applicable tax paying entity and jurisdiction and result from the following (in millions):
December 31, | |||||||
2017 | 2016 | ||||||
Deferred tax assets: | |||||||
Investment in partnerships | $ | 1,154 | $ | 1,685 | |||
Net operating losses | 232 | 191 | |||||
Derivative instruments | 74 | 49 | |||||
Book accruals in excess of current tax deductions | 22 | 24 | |||||
Total deferred tax assets | 1,482 | 1,949 | |||||
Deferred tax liabilities: | |||||||
Property and equipment in excess of tax values | (455 | ) | (394 | ) | |||
Other | (50 | ) | (41 | ) | |||
Total deferred tax liabilities | (505 | ) | (435 | ) | |||
Net deferred tax assets | $ | 977 | $ | 1,514 | |||
Balance sheet classification of deferred tax assets/(liabilities): | |||||||
Deferred tax asset | $ | 1,386 | $ | 1,876 | |||
Other long-term liabilities and deferred credits | (409 | ) | (362 | ) | |||
$ | 977 | $ | 1,514 | ||||
As a result of the exchange of the ownership interest in AAP in connection with our IPO and all subsequent exchanges, a deferred tax asset was created.These transfers of ownership were accounted for at the historical carrying basis for GAAP accounting purposes, but were recorded at the fair market value of the Class A shares at the time of exchange for U.S. federal income tax purposes. The resulting basis difference resulted in a deferred tax asset that was recorded as a component of partners’ capital as it results from transactions among shareholders. The deferred tax asset is amortized to deferred income tax expense as the associated basis step-up is realized on our tax returns. In connection with the issuance of AAP units and PAA common units in the periods following the Simplification Transactions and the associated adjustments to partners' capital attributable to PAGP, a corresponding change to the deferred tax balance was recorded to partners’ capital. See Note 11 for additional information regarding the issuance of units by AAP and PAA.
On December 22, 2017, the Tax Cuts and Jobs Act (the “2017 Tax Act”) was signed into law. The 2017 Tax Act changed existing U.S. tax law and included numerous provisions that will affect businesses, including a decrease in the corporate federal income tax rate. Prior to the 2017 Tax Act, the value of our deferred tax asset was calculated based on the effective corporate income tax rate of 35%. As a result of the 2017 Tax Act, the value of our deferred tax asset was re-measured as of December 31, 2017 based on the new 21% corporate federal income tax rate, and the reduction in value was recognized as deferred income tax expense for the year ended December 31, 2017.
As of December 31, 2017, we had net operating loss carryforwards for (i) U.S. federal income tax purposes of $998 million, which will expire from 2033 to 2037, (ii) state income tax purposes of $353 million, which will expire from 2018 to 2037, and (iii) foreign income tax purposes of $9 million, which will expire from 2034 to 2036. Under the 2017 Tax Act, U.S. federal NOLs generated after 2017 will have an indefinite carryforward period but may only reduce up to 80% of taxable income in any given year. Our U.S. federal NOLs generated prior to 2018 will not be subject to the taxable income limitation and will remain subject to a 20 year carryforward period.
Generally, tax returns for our Canadian entities are open to audit from 2008 through 2017. Our U.S. and state tax years are generally open to examination from 2014 to 2017.
F-48
Note 14—Major Customers and Concentration of Credit Risk
Marathon Petroleum Corporation and its subsidiaries accounted for 19%, 18% and 17% of our revenues for the years ended December 31, 2017, 2016 and 2015, respectively. ExxonMobil Corporation and its subsidiaries accounted for 11%, 14% and 13% of our revenues for the years ended December 31, 2017, 2016 and 2015, respectively. Phillips 66 Company and its subsidiaries accounted for 11% of our revenues in each of the years ended December 31, 2017 and 2016. No other customers accounted for 10% or more of our revenues during any of the three years ended December 31, 2017. The majority of revenues from these customers pertain to our supply and logistics operations. The sales to these customers occur at multiple locations and we believe that the loss of these customers would have only a short-term impact on our operating results. There is risk, however, that we would not be able to identify and access a replacement market at comparable margins.
Financial instruments that potentially subject us to concentrations of credit risk consist principally of trade receivables. Our accounts receivable are primarily from purchasers and shippers of crude oil and, to a lesser extent, purchasers of NGL and natural gas. This industry concentration has the potential to impact our overall exposure to credit risk in that the customers may be similarly affected by changes in economic, industry or other conditions. We review credit exposure and financial information of our counterparties and generally require letters of credit for receivables from customers that are not considered creditworthy, unless the credit risk can otherwise be reduced. See Note 2 for additional discussion of our accounts receivable and our review of credit exposure.
Note 15—Related Party Transactions
PAA’s Ownership of our Class C Shares
As of December 31, 2017 and 2016, PAA owned 510,925,432 and 491,910,863, respectively, Class C shares. The Class C shares represent a non-economic limited partner interest in us that provides PAA, as the sole holder, a “pass-through” voting right through which PAA’s common unitholders and Series A preferred unitholders have the effective right to vote, pro rata with the holders of our Class A and Class B shares, for the election of eligible directors, commencing in May 2018.
Omnibus Agreement
In connection with the Simplification Transactions completed in November 2016, the Plains Entities entered into an Omnibus Agreement, which, among other things, provides for the following:
• | our ability to issue additional Class A shares and use the net proceeds therefrom to purchase a like number of AAP units from AAP, and the corresponding ability of AAP to use the net proceeds therefrom to purchase a like number of PAA common units; and |
• | our ability to lend proceeds of any future indebtedness incurred by us to AAP, and AAP’s corresponding ability to lend such proceeds to PAA, in each case on substantially the same terms as incurred by us. |
See Note 1 for discussion of the Simplification Transactions.
Transactions with Oxy
As of December 31, 2017, Oxy had a representative on the board of directors of our general partner and owned approximately 11% of the limited partner interests in AAP. During the three years ended December 31, 2017, we recognized sales and transportation revenues and purchased petroleum products from Oxy. These transactions were conducted at posted tariff rates or prices that we believe approximate market. Included in these transactions was a crude oil buy/sell agreement that includes a multi-year minimum volume commitment. The impact to our Consolidated Statements of Operations from those transactions is included below (in millions):
Year Ended December 31, | |||||||||||
2017 | 2016 | 2015 | |||||||||
Revenues | $ | 920 | $ | 655 | $ | 866 | |||||
Purchases and related costs (1) | $ | (253 | ) | $ | 42 | $ | 41 | ||||
F-49
(1) | Crude oil purchases that are part of inventory exchanges under buy/sell transactions are netted with the related sales, with any margin presented in “Purchases and related costs” in our Consolidated Statements of Operations. |
We currently have a netting arrangement with Oxy. Our gross receivable and payable amounts with Oxy were as follows (in millions):
December 31, | |||||||
2017 | 2016 | ||||||
Trade accounts receivable and other receivables | $ | 1,075 | $ | 789 | |||
Accounts payable | $ | 990 | $ | 836 | |||
Transactions with Equity Method Investees
We also have transactions with companies in which we hold an investment accounted for under the equity method of accounting (see Note 8 for information related to these investments). We recorded revenues of $3 million, $14 million and $17 million during the years ended December 31, 2017, 2016 and 2015, respectively. During the three years ended December 31, 2017, we utilized transportation services and purchased petroleum products provided by these companies. Costs related to these services totaled $434 million, $209 million and $164 million for the years ended December 31, 2017, 2016 and 2015, respectively. These transactions were conducted at posted tariff rates or contracted rates or prices that we believe approximate market.
Receivables from our equity method investees totaled $26 million and $39 million at December 31, 2017 and 2016, respectively, and primarily included amounts related to transportation services. In addition, at December 31, 2016, we had prepaid tariff costs related to our equity method investees of $14 million. Accounts payable to our equity method investees were $41 million and $35 million at December 31, 2017 and 2016, respectively, and primarily included amounts related to transportation services.
In addition, we have an agreement to transport crude oil at posted tariff rates on a pipeline that is owned by an equity method investee, in which we own a 50% interest. Our commitment to transport is supported by crude oil buy/sell agreements with third parties (including Oxy) with commensurate quantities.
PAA Series A Preferred Unit Issuance
In January 2016, PAA completed a private placement of Series A preferred units. Certain of the purchasers of the PAA Series A preferred units or their affiliates are related parties. Kayne Anderson Capital Advisors, L.P. and certain of its affiliates and an affiliate of The Energy Minerals Group hold ownership interests in AAP. In addition, certain of the current directors of our general partner are affiliated with certain of the purchasers. See Note 11 for additional information about the Series A preferred units.
Note 16—Equity-Indexed Compensation Plans
PAGP and PAA Long-Term Incentive Plan Awards
Our LTIP awards include both liability-classified and equity-classified awards. In accordance with FASB guidance regarding share-based payments, the fair value of liability-classified LTIP awards is calculated based on the closing market price of the underlying PAGP share or PAA unit at each balance sheet date and adjusted for the present value of any distributions that are estimated to occur on the underlying shares or units over the vesting period that will not be received by the award recipients. The fair value of equity-classified LTIP awards is calculated based on the closing market price of the underlying PAGP share or PAA unit on the respective grant dates and adjusted for the present value of any distributions that are estimated to occur on the underlying shares or units over the vesting period that will not be received by the award recipient. This fair value is recognized as compensation expense over the service period.
Certain LTIP awards contain performance conditions based on the attainment of certain annualized distribution levels and vest upon the later of a certain date or the attainment of such levels. For awards with performance conditions (such as distribution targets), expense is accrued over the service period only if the performance condition is considered probable of occurring. When awards with performance conditions that were previously considered improbable become probable, we incur
F-50
additional expense in the period that the probability assessment changes. This is necessary to bring the accrued obligation associated with these awards up to the level it would be if we had been accruing for these awards since the grant date.
The following is a summary of the awards authorized under our LTIPs as of December 31, 2017 (in millions):
LTIP | LTIP Awards Authorized | ||
Plains GP Holdings, L.P. Long-Term Incentive Plan | 3.8 | ||
Plains All American 2013 Long-Term Incentive Plan | 13.1 | ||
Plains All American PNG Successor Long-Term Incentive Plan | 1.3 | ||
Plains All American GP LLC 2006 Long-Term Incentive Tracking Unit Plan | 10.8 | ||
Total | 29.0 | ||
Although other types of awards are contemplated under certain of the LTIPs, currently outstanding awards are limited to “phantom units,” which mature into the right to receive Class A shares of PAGP or common units of PAA (or cash equivalent) upon vesting, and “tracking units,” which, upon vesting, represent the right to receive a cash payment in an amount based upon the market value of a PAA common unit at the time of vesting. Some awards also include DERs, which, subject to applicable vesting criteria, entitle the grantee to a cash payment equal to the cash distribution paid on an outstanding PAGP Class A share or PAA common unit. The DERs terminate with the vesting or forfeiture of the underlying LTIP award.
As of December 31, 2017, 7.3 million PAA LTIP awards and less than 0.1 million PAGP LTIP awards were outstanding. Of this amount, 2.6 million PAA LTIP awards and less than 0.1 million PAGP LTIP awards include DERs. The outstanding and probable LTIP awards are expected to vest at various dates between January 1, 2018 and December 31, 2022.
Our accrued liability at December 31, 2017 related to all outstanding liability-classified LTIP awards and DERs was $27 million, of which $15 million was classified as short-term and $12 million was classified as long-term. These short- and long-term accrued LTIP liabilities are reflected in “Accounts payable and accrued liabilities” and “Other long-term liabilities and deferred credits,” respectively, on our Consolidated Balance Sheets. At December 31, 2016, the accrued liability was $38 million, of which $25 million was classified as short-term and $13 million was classified as long-term.
Activity for PAA LTIP awards under our equity-indexed compensation plans denominated in PAA units is summarized in the following table (units in millions):
PAA Units (1) (2) | ||||||
Units | Weighted Average Grant Date Fair Value per Unit | |||||
Outstanding at December 31, 2014 | 7.3 | $ | 41.45 | |||
Granted | 2.1 | $ | 28.76 | |||
Vested | (2.1 | ) | $ | 28.91 | ||
Cancelled or forfeited | (0.4 | ) | $ | 44.56 | ||
Outstanding at December 31, 2015 | 6.9 | $ | 41.23 | |||
Granted | 4.5 | $ | 23.38 | |||
Vested | (1.9 | ) | $ | 45.91 | ||
Modified | — | $ | (8.21 | ) | ||
Cancelled or forfeited | (0.6 | ) | $ | 37.19 | ||
Outstanding at December 31, 2016 | 8.9 | $ | 29.62 | |||
Granted | 0.9 | $ | 23.52 | |||
Vested | (1.7 | ) | $ | 42.12 | ||
Modified | — | $ | (6.04 | ) | ||
Cancelled or forfeited | (0.8 | ) | $ | 26.99 | ||
Outstanding at December 31, 2017 | 7.3 | $ | 24.68 | |||
F-51
(1) | Amounts do not include AAP Management Units or PAGP LTIP awards. |
(2) | Approximately 0.6 million, 0.5 million and 0.5 million PAA common units were issued, net of tax withholding of approximately 0.2 million, 0.3 million and 0.3 million units during 2017, 2016 and 2015, respectively, in connection with the settlement of vested awards. The remaining PAA awards (approximately 0.9 million, 1.1 million and 1.3 million units) that vested during 2017, 2016 and 2015, respectively, were settled in cash. |
AAP Management Units
In August 2007, the owners of AAP authorized the issuance of AAP Management Units (a profits interest) to provide additional long-term incentives and encourage retention for certain members of our senior management. This plan has been discontinued and there will be no new grants of AAP Management Units; however, as of December 31, 2017, 0.8 million outstanding AAP Management Units were unearned. These AAP Management Units will become earned based on the attainment of certain PAA distribution levels and additional performance conditions based on distributable cash flow measures determined by management. Once earned, PAA will issue to AAP approximately 0.941 PAA common units for each AAP Management Unit, and each AAP Management Unit will be entitled to a distribution equal to approximately 94.1% of the distribution paid by AAP to an AAP unit on a quarterly basis. Once vested, each AAP Management Unit holder is entitled to convert his or her AAP Management Units into AAP units and a like number of our Class B shares based on a conversion ratio of approximately 0.941 AAP units and Class B shares for each AAP Management Unit. Following any such conversion, the holder will have the Exchange Right for our Class A shares and the Redemption Right for PAA common units. See Note 11 for additional information.
Equity-Indexed Compensation Plan Information
We refer to all of the LTIPs and AAP Management Units collectively as our “equity-indexed compensation plans.” The table below summarizes the expense recognized and the value of vested LTIP awards (settled in PAA common units, PAGP shares and cash) under our equity-indexed compensation plans and includes both liability-classified and equity-classified awards (in millions):
Year Ended December 31, | |||||||||||
2017 | 2016 | 2015 | |||||||||
Equity-indexed compensation expense | $ | 41 | $ | 60 | $ | 27 | |||||
LTIP unit- or share-settled vestings | $ | 16 | $ | 24 | $ | 37 | |||||
LTIP cash-settled vestings | $ | 25 | $ | 28 | $ | 66 | |||||
Based on the December 31, 2017 fair value measurement and probability assessment regarding future distributions, we expect to recognize $76 million of additional expense over the life of outstanding awards related to the remaining unrecognized fair value. Actual amounts may differ materially as a result of a change in the market price of PAA’s common units and PAGP’s Class A shares and/or probability assessments regarding future distributions. We estimate that the remaining fair value will be recognized in expense as shown below (in millions):
Year | Equity-Indexed Compensation Plan Fair Value Amortization (1) | |||
2018 | $ | 42 | ||
2019 | 22 | |||
2020 | 9 | |||
2021 | 2 | |||
2022 | 1 | |||
Total | $ | 76 | ||
(1) | Amounts do not include fair value associated with awards containing performance conditions that are not considered to be probable of occurring at December 31, 2017. |
F-52
Note 17—Commitments and Contingencies
Commitments
We have commitments, some of which are leases, related to real property, equipment and operating facilities. We also incur costs associated with leased land, rights-of-way, permits and regulatory fees. Future non-cancelable commitments related to these items at December 31, 2017 are summarized below (in millions):
2018 | 2019 | 2020 | 2021 | 2022 | Thereafter | Total | |||||||||||||||||||||
Leases, rights-of-way easements and other (1) | $ | 188 | $ | 155 | $ | 127 | $ | 107 | $ | 90 | $ | 363 | $ | 1,030 | |||||||||||||
Other commitments (2) | 205 | 178 | 145 | 127 | 109 | 299 | 1,063 | ||||||||||||||||||||
Total | $ | 393 | $ | 333 | $ | 272 | $ | 234 | $ | 199 | $ | 662 | $ | 2,093 | |||||||||||||
(1) | Includes operating and capital leases as defined by FASB guidance, as well as obligations for rights-of-way easements. Leases are primarily for (i) railcars, (ii) land and surface rentals, (iii) office buildings, (iv) pipeline assets and (v) vehicles and trailers. We recognize expense on a straight-line basis over the life of the agreement, as applicable. Lease expense for 2017, 2016 and 2015 was $207 million, $198 million and $164 million, respectively. |
(2) | Primarily includes third-party storage and transportation agreements and pipeline throughput agreements, as well as approximately $760 million associated with an agreement to transport crude oil on a pipeline that is owned by an equity method investee, in which we own a 50% interest. Our commitment to transport is supported by crude oil buy/sell agreements with third parties (including Oxy) with commensurate quantities. Expense associated with these storage, transportation and throughput agreements was approximately $197 million, $157 million and $85 million for 2017, 2016 and 2015, respectively |
Loss Contingencies — General
To the extent we are able to assess the likelihood of a negative outcome for a contingency, our assessments of such likelihood range from remote to probable. If we determine that a negative outcome is probable and the amount of loss is reasonably estimable, we accrue an undiscounted liability equal to the estimated amount. If a range of probable loss amounts can be reasonably estimated and no amount within the range is a better estimate than any other amount, then we accrue an undiscounted liability equal to the minimum amount in the range. In addition, we estimate legal fees that we expect to incur associated with loss contingencies and accrue those costs when they are material and probable of being incurred.
We do not record a contingent liability when the likelihood of loss is probable but the amount cannot be reasonably estimated or when the likelihood of loss is believed to be only reasonably possible or remote. For contingencies where an unfavorable outcome is reasonably possible and the impact would be material to our consolidated financial statements, we disclose the nature of the contingency and, where feasible, an estimate of the possible loss or range of loss.
Legal Proceedings — General
In the ordinary course of business, we are involved in various legal proceedings, including those arising from regulatory and environmental matters. Although we are insured against various risks to the extent we believe it is prudent, there is no assurance that the nature and amount of such insurance will be adequate, in every case, to fully protect us from losses arising from current or future legal proceedings.
Taking into account what we believe to be all relevant known facts and circumstances, and based on what we believe to be reasonable assumptions regarding the application of those facts and circumstances to existing laws and regulations, we do not believe that the outcome of the legal proceedings in which we are currently involved (including those described below) will, individually or in the aggregate, have a material adverse effect on our consolidated financial condition, results of operations or cash flows.
F-53
Environmental — General
Although over the course of the last several years we have made significant investments in our maintenance and integrity programs, and have hired additional personnel in those areas, we have experienced (and likely will experience future) releases of hydrocarbon products into the environment from our pipeline, rail, storage and other facility operations. These releases can result from accidents or from unpredictable man-made or natural forces and may reach surface water bodies, groundwater aquifers or other sensitive environments. Damages and liabilities associated with any such releases from our existing or future assets could be significant and could have a material adverse effect on our consolidated financial condition, results of operations or cash flows.
We record environmental liabilities when environmental assessments and/or remedial efforts are probable and the amounts can be reasonably estimated. Generally, our recording of these accruals coincides with our completion of a feasibility study or our commitment to a formal plan of action. We do not discount our environmental remediation liabilities to present value. We also record environmental liabilities assumed in business combinations based on the estimated fair value of the environmental obligations caused by past operations of the acquired company. We record receivables for amounts recoverable from insurance or from third parties under indemnification agreements in the period that we determine the costs are probable of recovery.
Environmental expenditures that pertain to current operations or to future revenues are expensed or capitalized consistent with our capitalization policy for property and equipment. Expenditures that result from the remediation of an existing condition caused by past operations and that do not contribute to current or future profitability are expensed.
At December 31, 2017, our estimated undiscounted reserve for environmental liabilities (including liabilities related to the Line 901 incident, as discussed further below) totaled $162 million, of which $72 million was classified as short-term and $90 million was classified as long-term. At December 31, 2016, our estimated undiscounted reserve for environmental liabilities (including liabilities related to the Line 901 incident) totaled $147 million, of which $61 million was classified as short-term and $86 million was classified as long-term. The short- and long-term environmental liabilities referenced above are reflected in “Accounts payable and accrued liabilities” and “Other long-term liabilities and deferred credits,” respectively, on our Consolidated Balance Sheets. At December 31, 2017, we had recorded receivables totaling $55 million for amounts probable of recovery under insurance and from third parties under indemnification agreements, of which $29 million was reflected in “Trade accounts receivable and other receivables, net” and $26 million was reflected in “Other long-term assets, net” on our Consolidated Balance Sheet. At December 31, 2016, we had recorded $56 million of such receivables, of which $39 million was reflected in “Trade accounts receivable and other receivables, net” and $17 million was reflected in “Other long-term assets, net” on our Consolidated Balance Sheet.
In some cases, the actual cash expenditures associated with these liabilities may not occur for three years or longer. Our estimates used in determining these reserves are based on information currently available to us and our assessment of the ultimate outcome. Among the many uncertainties that impact our estimates are the necessary regulatory approvals for, and potential modification of, our remediation plans, the limited amount of data available upon initial assessment of the impact of soil or water contamination, changes in costs associated with environmental remediation services and equipment and the possibility of existing or future legal claims giving rise to additional liabilities. Therefore, although we believe that the reserve is adequate, actual costs incurred (which may ultimately include costs for contingencies that are currently not reasonably estimable or costs for contingencies where the likelihood of loss is currently believed to be only reasonably possible or remote) may be in excess of the reserve and may potentially have a material adverse effect on our consolidated financial condition, results of operations or cash flows.
Specific Legal, Environmental or Regulatory Matters
Line 901 Incident. In May 2015, we experienced a crude oil release from our Las Flores to Gaviota Pipeline (Line 901) in Santa Barbara County, California. A portion of the released crude oil reached the Pacific Ocean at Refugio State Beach through a drainage culvert. Following the release, we shut down the pipeline and initiated our emergency response plan. A Unified Command, which included the United States Coast Guard, the EPA, the California Office of Spill Prevention and Response and the Santa Barbara Office of Emergency Management, was established for the response effort. Clean-up and remediation operations with respect to impacted shoreline and other areas has been determined by the Unified Command to be complete, and the Unified Command has been dissolved. Our estimate of the amount of oil spilled, based on relevant facts, data and information, is approximately 2,934 barrels; of this amount, we estimate that 598 barrels reached the Pacific Ocean.
F-54
As a result of the Line 901 incident, several governmental agencies and regulators initiated investigations into the Line 901 incident, various claims have been made against us and a number of lawsuits have been filed against us. We may be subject to additional claims, investigations and lawsuits, which could materially impact the liabilities and costs we currently expect to incur as a result of the Line 901 incident. Set forth below is a brief summary of actions and matters that are currently pending:
On May 21, 2015, we received a corrective action order from the United States Department of Transportation’s Pipeline and Hazardous Materials Safety Administration (“PHMSA”), the governmental agency with jurisdiction over the operation of Line 901 as well as over a second stretch of pipeline extending from Gaviota Pump Station in Santa Barbara County to Emidio Pump Station in Kern County, California (Line 903), requiring us to shut down, purge, review, remediate and test Line 901. The corrective action order was subsequently amended on June 3, 2015; November 13, 2015; and June 16, 2016 to require us to take additional corrective actions with respect to both Lines 901 and 903 (as amended, the “CAO”). Among other requirements, the CAO obligated us to conduct a root cause failure analysis with respect to Line 901 and present remedial work plans and restart plans to PHMSA prior to returning Line 901 and 903 to service; the CAO also imposed a pressure restriction on the section of Line 903 between Pentland Pump Station and Emidio Pump Station and required us to take other specified actions with respect to both Lines 901 and 903. We intend to continue to comply with the CAO and to cooperate with any other governmental investigations relating to or arising out of the release. Excavation and removal of the affected section of the pipeline was completed on May 28, 2015. Line 901 and Line 903 have been purged and are not currently operational, with the exception of the Pentland to Emidio segment of Line 903, which remains in service under a pressure restriction. No timeline has been established for the restart of Line 901 or Line 903.
On February 17, 2016, PHMSA issued a Preliminary Factual Report of the Line 901 failure, which contains PHMSA’s preliminary findings regarding factual information about the events leading up to the accident and the technical analysis that has been conducted to date. On May 19, 2016, PHMSA issued its final Failure Investigation Report regarding the Line 901 incident. PHMSA’s findings indicate that the direct cause of the Line 901 incident was external corrosion that thinned the pipe wall to a level where it ruptured suddenly and released crude oil. PHMSA also concluded that there were numerous contributory causes of the Line 901 incident, including ineffective protection against external corrosion, failure to detect and mitigate the corrosion and a lack of timely detection and response to the rupture. The report also included copies of various engineering and technical reports regarding the incident. By virtue of its statutory authority, PHMSA has the power and authority to impose fines and penalties on us and cause civil or criminal charges to be brought against us. While to date PHMSA has not imposed any such fines or penalties or any such civil or criminal charges with respect to the Line 901 release, their investigation is still open and we may have fines or penalties imposed upon us, or civil or criminal charges brought against us, in the future.
On September 11, 2015, we received a Notice of Probable Violation and Proposed Compliance Order from PHMSA arising out of its inspection of Lines 901 and 903 in August, September and October of 2013 (the “2013 Audit NOPV”). The 2013 Audit NOPV alleges that the Partnership committed probable violations of various federal pipeline safety regulations by failing to document, or inadequately documenting, certain activities. On October 12, 2015, the Partnership filed a response to the 2013 Audit NOPV. By letter dated September 21, 2017, PHMSA issued a Final Order in this matter withdrawing one alleged violation and affirming a second. With regard to the second violation, PHMSA further determined that compliance had been achieved and included no compliance terms related to it in the Final Order. We therefore consider this matter closed.
In late May of 2015, the California Attorney General’s Office and the District Attorney’s office for the County of Santa Barbara began investigating the Line 901 incident to determine whether any applicable state or local laws had been
violated. On May 16, 2016, PAA and one of its employees were charged by a California state grand jury, pursuant to an
indictment filed in California Superior Court, Santa Barbara County (the “May 2016 Indictment”), with alleged violations of California law in connection with the Line 901 incident. The May 2016 Indictment included a total of 46 counts. On July 28, 2016, at an arraignment hearing held in California Superior Court in Santa Barbara County, PAA pled not guilty to all counts. Since May of 2016, 33 of the criminal charges against PAA (including one felony charge) and all of the criminal charges against our employee, have been dismissed. Seven of the remaining 13 charges are misdemeanor charges relating to wildlife allegedly taken as a result of the accidental release. The remaining six counts relate to the release of crude oil or reporting of the release. PAA believes that the criminal charges (including the three felony charges) are unwarranted and that neither PAA nor any of its employees engaged in any criminal behavior at any time in connection with this accident. PAA continues to vigorously defend itself against the charges.
Also in late May of 2015, the United States Attorney for the Department of Justice, Central District of California, Environmental Crimes Section (“DOJ”) began an investigation into whether there were any violations of federal criminal statutes in connection with the Line 901 incident, including potential violations of the federal Clean Water Act. We are cooperating with the DOJ’s investigation by responding to their requests for documents and access to our employees. The DOJ has already spoken to several of our employees and has expressed an interest in talking to other employees; consistent with the
F-55
terms of our governing organizational documents, we are funding our employees’ defense costs, including the costs of separate counsel engaged to represent such individuals. On August 26, 2015, we received a Request for Information from the EPA relating to Line 901. We have provided various responsive materials to date and we will continue to do so in the future in cooperation with the EPA. While to date no civil actions or criminal charges with respect to the Line 901 release, other than those brought pursuant to the May 2016 Indictment, have been brought against PAA or any of its affiliates, officers or employees by PHMSA, DOJ, EPA, the California Attorney General, the Santa Barbara District Attorney or the California Department of Fish and Wildlife, and no fines or penalties have been imposed by such governmental agencies, the investigations being conducted by such agencies are still open and we may have fines or penalties imposed upon us, our officers or our employees, or civil actions or criminal charges brought against us, our officers or our employees in the future, whether by those or other governmental agencies.
Shortly following the Line 901 incident, we established a claims line and encouraged any parties that were damaged by the release to contact us to discuss their damage claims. We have received a number of claims through the claims line and we are processing those claims for payment as we receive them. In addition, we have also had nine class action lawsuits filed against us, six of which have been administratively consolidated into a single proceeding in the United States District Court for the Central District of California. In general, the plaintiffs are seeking to establish different classes of claimants that have allegedly been damaged by the release. To date, the court has certified two sub-classes of claimants and denied certification of the other proposed sub-classes. The sub-classes that have been certified include (i) commercial fishermen who landed fish in certain specified fishing blocks in the waters adjacent to Santa Barbara County or persons or businesses who resold commercial seafood landed in such areas, and (ii) individuals or businesses who were employed by or had contracts with certain designated oil platforms and related on shore processing facilities in the vicinity of the release as of the date of the release. We are appealing the oil industry class certification. We are also defending a separate class action lawsuit proceeding in the United States District Court for the Central District of California brought on behalf of the Line 901 and Line 903 easement holders seeking injunctive relief as well as compensatory damages.
There have also been two securities law class action lawsuits filed on behalf of certain purported investors in PAA and/or PAGP against PAA, PAGP and/or certain of their respective officers, directors and underwriters. Both of these lawsuits have been consolidated into a single proceeding in the United States District Court for the Southern District of Texas. In general, these lawsuits allege that the various defendants violated securities laws by misleading investors regarding the integrity of PAA’s pipelines and related facilities through false and misleading statements, omission of material facts and concealing of the true extent of the spill. The plaintiffs claim unspecified damages as a result of the reduction in value of their investments in PAA and PAGP, which they attribute to the alleged wrongful acts of the defendants. PAA and PAGP, and the other defendants, denied the allegations in, and moved to dismiss these lawsuits. On March 29, 2017, the Court ruled in our favor dismissing all claims against all defendants. Plaintiffs have refiled their complaint and we are opposing their claims. Consistent with and subject to the terms of our governing organizational documents (and to the extent applicable, insurance policies), we are indemnifying and funding the defense costs of our officers and directors in connection with this lawsuit; we are also indemnifying and funding the defense costs of our underwriters pursuant to the terms of the underwriting agreements we previously entered into with such underwriters.
In addition, four unitholder derivative lawsuits have been filed by certain purported investors in PAA against PAA, certain of its affiliates and certain officers and directors. Two of these lawsuits were filed in the United States District Court for the Southern District of Texas and were administratively consolidated into one action and later dismissed on the basis that Plains Partnership agreements require that derivative suits be filed in Delaware Chancery Court. Following the order dismissing the Texas Federal Court suits, a new derivative suit brought by different plaintiffs was filed in Delaware Chancery Court. The other remaining lawsuit was filed in State District Court in Harris County, Texas and subsequently dismissed by the Court. In general, these lawsuits allege that the various defendants breached their fiduciary duties, engaged in gross mismanagement and made false and misleading statements, among other similar allegations, in connection with their management and oversight of PAA during the period of time leading up to and following the Line 901 release. The plaintiffs in the remaining lawsuit claim that PAA suffered unspecified damages as a result of the actions of the various defendants and seek to hold the defendants liable for such damages, in addition to other remedies. The defendants deny the allegations in this lawsuit and have responded accordingly. Consistent with and subject to the terms of our governing organizational documents (and to the extent applicable, insurance policies), we are indemnifying and funding the defense costs of our officers and directors in connection with this lawsuit.
We have also received several other individual lawsuits and complaints from companies and individuals alleging damages arising out of the Line 901 incident. These lawsuits and claims generally seek compensatory and punitive damages, and in some cases permanent injunctive relief.
F-56
In addition to the foregoing, as the “responsible party” for the Line 901 incident we are liable for various costs and for certain natural resource damages under the Oil Pollution Act, and we also have exposure to the payment of additional fines, penalties and costs under other applicable federal, state and local laws, statutes and regulations. To the extent any such costs are reasonably estimable, we have included an estimate of such costs in the loss accrual described below.
Taking the foregoing into account, as of December 31, 2017, we estimate that the aggregate total costs we have incurred or will incur with respect to the Line 901 incident will be approximately $335 million, which estimate includes actual and projected emergency response and clean-up costs, natural resource damage assessments and certain third party claims settlements, as well as estimates for fines, penalties and certain legal fees. We accrued such estimate of aggregate total costs to “Field operating costs” in our Consolidated Statements of Operations. This estimate considers our prior experience in environmental investigation and remediation matters and available data from, and in consultation with, our environmental and other specialists, as well as currently available facts and presently enacted laws and regulations. We have made assumptions for (i) the duration of the natural resource damage assessment process and the ultimate amount of damages determined, (ii) the resolution of certain third party claims and lawsuits, but excluding claims and lawsuits with respect to which losses are not probable and reasonably estimable, and excluding future claims and lawsuits, (iii) the determination and calculation of fines and penalties, but excluding fines and penalties that are not probable and reasonably estimable and (iv) the nature, extent and cost of legal services that will be required in connection with all lawsuits, claims and other matters requiring legal or expert advice associated with the Line 901 incident. Our estimate does not include any lost revenue associated with the shutdown of Line 901 or 903 and does not include any liabilities or costs that are not reasonably estimable at this time or that relate to contingencies where we currently regard the likelihood of loss as being only reasonably possible or remote. We believe we have accrued adequate amounts for all probable and reasonably estimable costs; however, this estimate is subject to uncertainties associated with the assumptions that we have made. For example, the amount of time it takes for us to resolve all of the current and future lawsuits, claims and investigations that relate to the Line 901 incident could turn out to be significantly longer than we have assumed, and as a result the costs we incur for legal services could be significantly higher than we have estimated. In addition, with respect to fines and penalties, the ultimate amount of any fines and penalties assessed against us depends on a wide variety of factors, many of which are not estimable at this time. Where fines and penalties are probable and estimable, we have included them in our estimate, although such estimates could turn out to be wrong. Accordingly, our assumptions and estimates may turn out to be inaccurate and our total costs could turn out to be materially higher; therefore, we can provide no assurance that we will not have to accrue significant additional costs in the future with respect to the Line 901 incident.
As of December 31, 2017, we had a remaining undiscounted gross liability of $94 million related to this event, of which approximately $62 million is presented as a current liability in “Accounts payable and accrued liabilities” on our Consolidated Balance Sheet, with the remainder presented in “Other long-term liabilities and deferred credits”. We maintain insurance coverage, which is subject to certain exclusions and deductibles, in the event of such environmental liabilities. Subject to such exclusions and deductibles, we believe that our coverage is adequate to cover the current estimated total emergency response and clean-up costs, claims settlement costs and remediation costs and we believe that this coverage is also adequate to cover any potential increase in the estimates for these costs that exceed the amounts currently identified. Through December 31, 2017, we had collected, subject to customary reservations, $174 million out of the approximate $220 million of release costs that we believe are probable of recovery from insurance carriers, net of deductibles. Therefore, as of December 31, 2017, we have recognized a receivable of approximately $47 million for the portion of the release costs that we believe is probable of recovery from insurance, net of deductibles and amounts already collected. Of this amount, approximately $22 million is recognized as a current asset in “Trade accounts receivable and other receivables, net” on our Consolidated Balance Sheet, with the remainder in “Other long-term assets, net”. We have completed the required clean-up and remediation work as determined by the Unified Command and the Unified Command has been dissolved; however, we expect to make payments for additional costs associated with restoration of the impacted areas, as well as natural resource damage assessment and compensation, legal, professional and regulatory costs, in addition to fines and penalties, during future periods.
Mesa to Basin Pipeline. On January 6, 2016, PHMSA issued a Notice of Probable Violation and Proposed Civil Penalty relating to an approximate 500 barrel release of crude oil that took place on January 1, 2015 on our Mesa to Basin 12” pipeline in Midland, Texas. PHMSA conducted an accident investigation and reviewed documentation related to the incident, and concluded that we had committed probable violations of certain pipeline safety regulations. In the Notice, PHMSA maintains that we failed to carry out our written damage prevention program and to follow our pipeline excavation/ditching and backfill procedures on four separate occasions, and that such failures resulted in outside force damage that led to the January 1, 2015 release. In early March 2017, PHMSA issued a final order that concluded that we followed our pipeline excavation/ditching and backfill procedures, but maintained that we failed to carry out our written damage prevention program and imposed a civil penalty of $184,300 that was promptly paid.
F-57
Environmental Remediation
We currently own or lease, and in the past have owned and leased, properties where hazardous liquids, including hydrocarbons, are or have been handled. These properties and the hazardous liquids or associated wastes disposed thereon may be subject to the U.S. federal Comprehensive Environmental Response, Compensation and Liability Act, as amended, and the U.S. federal Resource Conservation and Recovery Act, as amended, as well as state and Canadian federal and provincial laws and regulations. Under such laws and regulations, we could be required to remove or remediate hazardous liquids or associated wastes (including wastes disposed of or released by prior owners or operators) and to clean up contaminated property (including contaminated groundwater).
We maintain insurance of various types with varying levels of coverage that we consider adequate under the circumstances to cover our operations and properties. The insurance policies are subject to deductibles and retention levels that we consider reasonable and not excessive. Consistent with insurance coverage generally available in the industry, in certain circumstances our insurance policies provide limited coverage for losses or liabilities relating to gradual pollution, with broader coverage for sudden and accidental occurrences.
Assets we have acquired or will acquire in the future may have environmental remediation liabilities for which we are not indemnified. We have in the past experienced and in the future likely will experience releases of crude oil into the environment from our pipeline and storage operations. We also may discover environmental impacts from past releases that were previously unidentified.
Insurance
Pipelines, terminals, trucks or other facilities or equipment may experience damage as a result of an accident, natural disaster, terrorist attack, cyber event or other event. These hazards can cause personal injury and loss of life, severe damage to and destruction of property and equipment, pollution or environmental damage and suspension of operations. We maintain various types and varying levels of insurance coverage that we consider adequate under the circumstances to cover our operations and properties, and we self-insure certain risks, including gradual pollution and named windstorm. With respect to our insurance, our policies are subject to deductibles and retention levels that we consider reasonable and not excessive. However, such insurance does not cover every potential risk that might occur, associated with operating pipelines, terminals and other facilities and equipment, including the potential loss of significant revenues and cash flows.
The occurrence of a significant event not fully insured, indemnified or reserved against, or the failure of a party to meet its indemnification obligations, could materially and adversely affect our operations and financial condition. We believe that we maintain adequate insurance coverage, although insurance will not cover many types of interruptions that might occur, will not cover amounts up to applicable deductibles and will not cover all risks associated with certain of our assets and operations. Additionally we self-insure certain risks including, gradual pollution and named windstorm. With respect to our insurance coverage, no assurance can be given that we will be able to maintain adequate insurance in the future at rates we consider reasonable. As a result, we may elect to self-insure or utilize higher deductibles in certain other insurance programs. In addition, although we believe that we have established adequate reserves and liquidity to the extent such risks are not insured, costs incurred in excess of these reserves may be higher or we may not receive insurance proceeds in a timely manner, which may potentially have a material adverse effect on our financial conditions, results of operations or cash flows.
F-58
Note 18—Quarterly Financial Data (Unaudited)
First Quarter | Second Quarter | Third Quarter | Fourth Quarter | Total (1) | |||||||||||||||
(in millions, except per share data) | |||||||||||||||||||
2017 | |||||||||||||||||||
Total revenues | $ | 6,667 | $ | 6,078 | $ | 5,873 | $ | 7,605 | $ | 26,223 | |||||||||
Gross margin (2) | $ | 664 | $ | 325 | $ | 111 | $ | 327 | $ | 1,427 | |||||||||
Operating income | $ | 589 | $ | 256 | $ | 43 | $ | 260 | $ | 1,147 | |||||||||
Net income/(loss) | $ | 402 | $ | 174 | $ | 31 | $ | (647 | ) | $ | (41 | ) | |||||||
Net income/(loss) attributable to PAGP | $ | 41 | $ | 24 | $ | 4 | $ | (800 | ) | $ | (731 | ) | |||||||
Basic and diluted net income/(loss) per Class A share | $ | 0.34 | $ | 0.16 | $ | 0.03 | $ | (5.16 | ) | $ | (5.03 | ) | |||||||
Cash distributions per Class A share (3) | $ | 0.55 | $ | 0.55 | $ | 0.55 | $ | 0.30 | $ | 1.95 | |||||||||
2016 | |||||||||||||||||||
Total revenues | $ | 4,111 | $ | 4,950 | $ | 5,170 | $ | 5,952 | $ | 20,182 | |||||||||
Gross margin (2) | $ | 349 | $ | 218 | $ | 419 | $ | 286 | $ | 1,272 | |||||||||
Operating income | $ | 281 | $ | 145 | $ | 348 | $ | 217 | $ | 990 | |||||||||
Net income | $ | 177 | $ | 82 | $ | 279 | $ | 122 | $ | 660 | |||||||||
Net income/(loss) attributable to PAGP | $ | 36 | $ | 42 | $ | 24 | $ | (8 | ) | $ | 94 | ||||||||
Basic net income/(loss) per Class A share | $ | 0.39 | $ | 0.41 | $ | 0.24 | $ | (0.08 | ) | $ | 0.94 | ||||||||
Diluted net income/(loss) per Class A share | $ | 0.37 | $ | 0.40 | $ | 0.24 | $ | (0.08 | ) | $ | 0.94 | ||||||||
Cash distributions per Class A share (3) | $ | 0.62 | $ | 0.62 | $ | 0.62 | $ | 0.55 | $ | 2.40 | |||||||||
(1) | The sum of the four quarters may not equal the total year due to rounding. |
(2) | Gross margin is calculated as Total revenues less (i) Purchases and related costs, (ii) Field operating costs and (iii) Depreciation and amortization. |
(3) | Represents cash distributions declared and paid in the period presented. |
Note 19—Operating Segments
We manage our operations through three operating segments: Transportation, Facilities and Supply and Logistics. See “Revenue Recognition” in Note 2 for a summary of the types of products and services from which each segment derives its revenues. Our Chief Operating Decision Maker (“CODM”) (our Chief Executive Officer) evaluates segment performance based on measures including segment adjusted EBITDA (as defined below) and maintenance capital investment.
The measure of segment adjusted EBITDA forms the basis of our internal financial reporting and is the primary performance measure used by our CODM in assessing performance and allocating resources among our operating segments. We define segment adjusted EBITDA as revenues and equity earnings in unconsolidated entities less (a) purchases and related costs, (b) field operating costs and (c) segment general and administrative expenses, plus our proportionate share of the depreciation and amortization expense and gains or losses on significant asset sales of unconsolidated entities, and further adjusted for certain selected items including (i) gains or losses on derivative instruments that are related to underlying activities in another period (or the reversal of such adjustments from a prior period), gains and losses on derivatives that are related to investing activities (such as the purchase of linefill) and inventory valuation adjustments, as applicable, (ii) long-term inventory costing adjustments, (iii) charges for obligations that are expected to be settled with the issuance of equity instruments, (iv) amounts related to deficiencies associated with minimum volume commitments, net of applicable amounts subsequently recognized into revenue and (v) other items that our CODM believes are integral to understanding our core segment operating performance.
Segment adjusted EBITDA excludes depreciation and amortization. Maintenance capital consists of capital expenditures for the replacement and/or refurbishment of partially or fully depreciated assets in order to maintain the operating and/or earnings capacity of our existing assets. We look at each period’s earnings before non-cash depreciation and amortization as an important measure of segment performance. The exclusion of depreciation and amortization expense could be viewed as limiting the usefulness of segment adjusted EBITDA as a performance measure because it does not account in
F-59
current periods for the implied reduction in value of our capital assets, such as crude oil pipelines and facilities, caused by age-related decline and wear and tear. We compensate for this limitation by recognizing that depreciation and amortization are largely offset by repair and maintenance investments, which act to partially offset the aging and wear and tear in the value of our principal fixed assets. These maintenance investments are a component of field operating costs included in segment adjusted EBITDA or in maintenance capital, depending on the nature of the cost. Capital expenditures made to expand the existing operating and/or earnings capacity of our assets are classified as expansion capital. Capital expenditures for the replacement and/or refurbishment of partially or fully depreciated assets in order to maintain the operating and/or earnings capacity of our existing assets are classified as maintenance capital. Repair and maintenance expenditures incurred in order to maintain the day to day operation of our existing assets are charged to expense as incurred.
The following tables reflect certain financial data for each segment (in millions):
Transportation | Facilities | Supply and Logistics | Intersegment Adjustment | Total | |||||||||||||||
Year Ended December 31, 2017 | |||||||||||||||||||
Revenues: | |||||||||||||||||||
External customers (1) | $ | 1,021 | $ | 555 | $ | 25,056 | $ | (409 | ) | $ | 26,223 | ||||||||
Intersegment (2) | 697 | 618 | 9 | 409 | 1,733 | ||||||||||||||
Total revenues of reportable segments | $ | 1,718 | $ | 1,173 | $ | 25,065 | $ | — | $ | 27,956 | |||||||||
Equity earnings in unconsolidated entities | $ | 290 | $ | — | $ | — | $ | 290 | |||||||||||
Segment adjusted EBITDA | $ | 1,287 | $ | 734 | $ | 60 | $ | 2,081 | |||||||||||
Capital expenditures (3) | $ | 2,126 | $ | 312 | $ | 20 | $ | 2,458 | |||||||||||
Maintenance capital | $ | 120 | $ | 114 | $ | 13 | $ | 247 | |||||||||||
As of December 31, 2017 | |||||||||||||||||||
Total assets | $ | 13,362 | $ | 7,593 | $ | 5,798 | $ | 26,753 | |||||||||||
Investments in unconsolidated entities | $ | 2,681 | $ | 75 | $ | — | $ | 2,756 | |||||||||||
Transportation | Facilities | Supply and Logistics | Intersegment Adjustment | Total | |||||||||||||||
Year Ended December 31, 2016 | |||||||||||||||||||
Revenues: | |||||||||||||||||||
External customers (1) | $ | 954 | $ | 546 | $ | 19,004 | $ | (322 | ) | $ | 20,182 | ||||||||
Intersegment (2) | 630 | 561 | 14 | 322 | 1,527 | ||||||||||||||
Total revenues of reportable segments | $ | 1,584 | $ | 1,107 | $ | 19,018 | $ | — | $ | 21,709 | |||||||||
Equity earnings in unconsolidated entities | $ | 195 | $ | — | $ | — | $ | 195 | |||||||||||
Segment adjusted EBITDA | $ | 1,141 | $ | 667 | $ | 359 | $ | 2,167 | |||||||||||
Capital expenditures (3) | $ | 1,063 | $ | 577 | $ | 54 | $ | 1,694 | |||||||||||
Maintenance capital | $ | 121 | $ | 55 | $ | 10 | $ | 186 | |||||||||||
As of December 31, 2016 | |||||||||||||||||||
Total assets | $ | 11,863 | $ | 7,878 | $ | 6,362 | $ | 26,103 | |||||||||||
Investments in unconsolidated entities | $ | 2,290 | $ | 53 | $ | — | $ | 2,343 | |||||||||||
F-60
Transportation | Facilities | Supply and Logistics | Intersegment Adjustment | Total | |||||||||||||||
Year Ended December 31, 2015 | |||||||||||||||||||
Revenues: | |||||||||||||||||||
External customers (1) | $ | 953 | $ | 528 | $ | 21,927 | $ | (256 | ) | $ | 23,152 | ||||||||
Intersegment (2) | 641 | 522 | 18 | 256 | 1,437 | ||||||||||||||
Total revenues of reportable segments | $ | 1,594 | $ | 1,050 | $ | 21,945 | $ | — | $ | 24,589 | |||||||||
Equity earnings in unconsolidated entities | $ | 183 | $ | — | $ | — | $ | 183 | |||||||||||
Segment adjusted EBITDA | $ | 1,056 | $ | 588 | $ | 568 | $ | 2,212 | |||||||||||
Capital expenditures (3) | $ | 1,278 | $ | 813 | $ | 184 | $ | 2,275 | |||||||||||
Maintenance capital | $ | 144 | $ | 68 | $ | 8 | $ | 220 | |||||||||||
As of December 31, 2015 | |||||||||||||||||||
Total assets | $ | 11,272 | $ | 7,645 | $ | 5,225 | $ | 24,142 | |||||||||||
Investments in unconsolidated entities | $ | 1,998 | $ | 29 | $ | — | $ | 2,027 | |||||||||||
(1) | Transportation revenues from external customers include inventory exchanges that are substantially similar to tariff-like arrangements with our customers. Under these arrangements, our Supply and Logistics segment has transacted the inventory exchange and serves as the shipper on our pipeline systems. See Note 2 for a discussion of our related accounting policy. We have included an estimate of the revenues from these inventory exchanges in our Transportation segment revenue presented above and adjusted those revenues out such that Total revenue from External customers reconciles to our Consolidated Statements of Operations. This presentation is consistent with the information provided to our CODM. |
(2) | Segment revenues include intersegment amounts that are eliminated in Purchases and related costs and Field operating costs in our Consolidated Statements of Operations. Intersegment sales are conducted at posted tariff rates, rates similar to those charged to third parties or rates that we believe approximate market. |
(3) | Expenditures for acquisition capital and expansion capital, including investments in unconsolidated entities. |
F-61
Segment Adjusted EBITDA Reconciliation
The following table reconciles segment adjusted EBITDA to net income attributable to PAGP (in millions):
Year Ended December 31, | |||||||||||
2017 | 2016 | 2015 | |||||||||
Segment adjusted EBITDA | $ | 2,081 | $ | 2,167 | $ | 2,212 | |||||
Adjustments (1): | |||||||||||
Depreciation and amortization of unconsolidated entities (2) | (45 | ) | (50 | ) | (45 | ) | |||||
Gains/(losses) from derivative activities net of inventory valuation adjustments (3) | 46 | (404 | ) | (110 | ) | ||||||
Long-term inventory costing adjustments (4) | 24 | 58 | (99 | ) | |||||||
Deficiencies under minimum volume commitments, net (5) | (2 | ) | (46 | ) | — | ||||||
Equity-indexed compensation expense (6) | (23 | ) | (33 | ) | (27 | ) | |||||
Net gain/(loss) on foreign currency revaluation (7) | 26 | (9 | ) | 29 | |||||||
Line 901 incident (8) | (32 | ) | — | (83 | ) | ||||||
Significant acquisition-related expenses (9) | (6 | ) | — | — | |||||||
Unallocated general and administrative expenses | (4 | ) | (3 | ) | (3 | ) | |||||
Depreciation and amortization | (628 | ) | (495 | ) | (433 | ) | |||||
Interest expense, net | (510 | ) | (480 | ) | (443 | ) | |||||
Other income/(expense), net | (31 | ) | 33 | (7 | ) | ||||||
Income before tax | 896 | 738 | 991 | ||||||||
Income tax expense | (937 | ) | (78 | ) | (182 | ) | |||||
Net income/(loss) | (41 | ) | 660 | 809 | |||||||
Net income attributable to noncontrolling interests | (690 | ) | (566 | ) | (691 | ) | |||||
Net income/(loss) attributable to PAGP | $ | (731 | ) | $ | 94 | $ | 118 | ||||
(1) | Represents adjustments utilized by our CODM in the evaluation of segment results. |
(2) | Includes our proportionate share of the depreciation and amortization and gains or losses on significant asset sales of equity method investments. |
(3) | We use derivative instruments for risk management purposes and our related processes include specific identification of hedging instruments to an underlying hedged transaction. Although we identify an underlying transaction for each derivative instrument we enter into, there may not be an accounting hedge relationship between the instrument and the underlying transaction. In the course of evaluating our results, we identify the earnings that were recognized during the period related to derivative instruments for which the identified underlying transaction does not occur in the current period and exclude the related gains and losses in determining segment adjusted EBITDA. In addition, we exclude gains and losses on derivatives that are related to investing activities, such as the purchase of linefill. We also exclude the impact of corresponding inventory valuation adjustments, as applicable. |
(4) | We carry crude oil and NGL inventory that is comprised of minimum working inventory requirements in third-party assets and other working inventory that is needed for our commercial operations. We consider this inventory necessary to conduct our operations and we intend to carry this inventory for the foreseeable future. Therefore, we classify this inventory as long-term on our balance sheet and do not hedge the inventory with derivative instruments (similar to linefill in our own assets). We exclude the impact of changes in the average cost of the long-term inventory (that result from fluctuations in market prices) and writedowns of such inventory that result from price declines from segment adjusted EBITDA. |
F-62
(5) | We have certain agreements that require counterparties to deliver, transport or throughput a minimum volume over an agreed upon period. Substantially all of such agreements were entered into with counterparties to economically support the return on our capital expenditure necessary to construct the related asset. Some of these agreements include make-up rights if the minimum volume is not met. We record a receivable from the counterparty in the period that services are provided or when the transaction occurs, including amounts for deficiency obligations from counterparties associated with minimum volume commitments. If a counterparty has a make-up right associated with a deficiency, we defer the revenue attributable to the counterparty’s make-up right and subsequently recognize the revenue at the earlier of when the deficiency volume is delivered or shipped, when the make-up right expires or when it is determined that the counterparty’s ability to utilize the make-up right is remote. We include the impact of amounts billed to counterparties for their deficiency obligation, net of applicable amounts subsequently recognized into revenue, as a selected item impacting comparability. Our CODM views the inclusion of the contractually committed revenues associated with that period as meaningful to segment adjusted EBITDA as the related asset has been constructed, is standing ready to provide the committed service and the fixed operating costs are included in the current period results. Amounts for the year prior to 2016 were not significant to segment adjusted EBITDA ($13 million for the year ended December 31, 2015). |
(6) | Includes equity-indexed compensation expense associated with awards that will or may be settled in units. |
(7) | Includes gains and losses from the revaluation of foreign currency transactions and monetary assets and liabilities. |
(8) | Includes costs recognized during the period related to the Line 901 incident that occurred in May 2015, net of amounts we believe are probable of recovery from insurance. See Note 17 for additional information regarding the Line 901 incident. |
(9) | Includes acquisition-related expenses associated with the ACC Acquisition. See Note 6 for additional discussion. An adjustment for these non-recurring expenses is included in the calculation of segment adjusted EBITDA for the year ended December 31, 2017 as our CODM does not view such expenses as integral to understanding our core segment operating performance. Acquisition-related expenses for the 2016 and 2015 periods were not significant to segment adjusted EBITDA. |
Geographic Data
We have operations in the United States and Canada. Set forth below are revenues and long-lived assets attributable to these geographic areas (in millions):
Year Ended December 31, | |||||||||||
Revenues (1) | 2017 | 2016 | 2015 | ||||||||
United States | $ | 21,443 | $ | 15,599 | $ | 18,701 | |||||
Canada | 4,780 | 4,583 | 4,451 | ||||||||
$ | 26,223 | $ | 20,182 | $ | 23,152 | ||||||
(1) | Revenues are primarily attributed to each region based on where the services are provided or the product is shipped. |
December 31, | |||||||
Long-Lived Assets (1) | 2017 | 2016 | |||||
United States | $ | 17,183 | $ | 16,055 | |||
Canada | 4,179 | 3,895 | |||||
$ | 21,362 | $ | 19,950 | ||||
(1) | Excludes long-term derivative assets and long-term deferred tax assets. |
F-63