Attached files
| file | filename |
|---|---|
| EX-32.2 - EX-32.2 - MOODYS CORP /DE/ | d540752dex322.htm |
| EX-32.1 - EX-32.1 - MOODYS CORP /DE/ | d540752dex321.htm |
| EX-31.2 - EX-31.2 - MOODYS CORP /DE/ | d540752dex312.htm |
| EX-31.1 - EX-31.1 - MOODYS CORP /DE/ | d540752dex311.htm |
| EX-23.1 - EX-23.1 - MOODYS CORP /DE/ | d540752dex231.htm |
| EX-21 - EX-21 - MOODYS CORP /DE/ | d540752dex21.htm |
| EX-12 - EX-12 - MOODYS CORP /DE/ | d540752dex12.htm |
| EX-10.10 - EX-10.10 - MOODYS CORP /DE/ | d540752dex1010.htm |
| EX-10.4.6 - EX-10.4.6 - MOODYS CORP /DE/ | d540752dex1046.htm |
| EX-10.4.1 - EX-10.4.1 - MOODYS CORP /DE/ | d540752dex1041.htm |
| EX-10.2.3 - EX-10.2.3 - MOODYS CORP /DE/ | d540752dex1023.htm |
| EX-10.2.1 - EX-10.2.1 - MOODYS CORP /DE/ | d540752dex1021.htm |
Table of Contents
UNITED STATES
SECURITIES AND EXCHANGE COMMISSION
WASHINGTON, D.C. 20549
FORM 10-K
(MARK ONE)
☑ ANNUAL REPORT PURSUANT TO SECTION 13 OR 15(d) OF THE SECURITIES EXCHANGE ACT OF 1934
FOR THE FISCAL YEAR ENDED DECEMBER 31, 2017
OR
☐ TRANSITION REPORT PURSUANT TO SECTION 13 OR 15(d) OF THE SECURITIES EXCHANGE ACT OF 1934
FOR THE TRANSITION PERIOD FROM TO .
COMMISSION FILE NUMBER 1-14037
MOODY’S CORPORATION
(EXACT NAME OF REGISTRANT AS SPECIFIED IN ITS CHARTER)
| DELAWARE | 13-3998945 | |
| (STATE OF INCORPORATION) | (I.R.S. EMPLOYER IDENTIFICATION NO.) |
7 World Trade Center at 250 Greenwich Street, NEW YORK, NEW YORK 10007
(ADDRESS OF PRINCIPAL EXECUTIVE OFFICES)
(ZIP CODE)
REGISTRANT’S TELEPHONE NUMBER, INCLUDING AREA CODE: (212) 553-0300.
SECURITIES REGISTERED PURSUANT TO SECTION 12(b) OF THE ACT:
| TITLE OF EACH CLASS | NAME OF EACH EXCHANGE ON WHICH REGISTERED | |
| COMMON STOCK, PAR VALUE $.01 PER SHARE | NEW YORK STOCK EXCHANGE | |
| 1.75% SENIOR NOTES DUE 2027 | NEW YORK STOCK EXCHANGE |
SECURITIES REGISTERED PURSUANT TO SECTION 12(g) OF THE ACT:
NONE
Indicate by check mark if the registrant is a well-known seasoned issuer, as defined in Rule 405 of the Securities Act. Yes ☑ No ☐
Indicate by check mark if the registrant is not required to file reports pursuant to Section 13 or Section 15(d) of the Act. Yes ☐ No ☑
Indicate by check mark whether the registrant (1) has filed all reports required to be filed by Section 13 or 15(d) of the Securities Exchange Act of 1934 during the preceding 12 months (or for such shorter period that the registrant was required to file such reports), and (2) has been subject to such filing requirements for the past 90 days. Yes ☑ No ☐
Indicate by check mark whether the registrant has submitted electronically and posted on its corporate Web site, if any, every Interactive Data File required to be submitted and posted pursuant to Rule 405 of Regulation S-T (§232.405 of this chapter) during the preceding 12 months (or for such shorter period that the registrant was required to submit and post such files). Yes ☑ No ☐
Indicate by check mark if disclosure of delinquent filers pursuant to Item 405 of Regulation S-K (§ 229.405 of this chapter) is not contained herein, and will not be contained, to the best of registrant’s knowledge, in definitive proxy or information statements incorporated by reference in Part III of this Form 10-K or any amendment to this Form 10-K. ☐
Indicate by check mark whether the registrant is a large accelerated filer, an accelerated filer, a non-accelerated filer, a smaller reporting company, or emerging growth company. See the definitions of “large accelerated filer,” “accelerated filer,” “smaller reporting company,” and “emerging growth company” in Rule 12b-2 of the Exchange Act.
Large Accelerated Filer ☑ Accelerated Filer ☐ Non-accelerated Filer ☐ Smaller reporting company ☐ Emerging growth company ☐
If an emerging growth company, indicate by check mark if the Registrant has elected not to use the extended transition period for complying with any new or revised financial accounting standards pursuant to Section 13(a) of the Exchange Act. ☐
Indicate by check mark whether the registrant is a shell company (as defined in Rule 12b-2 of the Act). Yes ☐ No ☑
The aggregate market value of Moody’s Corporation Common Stock held by nonaffiliates* on June 30, 2017 (based upon its closing transaction price on the Composite Tape on such date) was approximately $23.0 billion.
As of January 31, 2018, 191.1 million shares of Common Stock of Moody’s Corporation were outstanding.
DOCUMENTS INCORPORATED BY REFERENCE
Portions of the Registrant’s definitive proxy statement for use in connection with its annual meeting of stockholders scheduled to be held on April 24, 2018, are incorporated by reference into Part III of this Form 10-K.
The Index to Exhibits is included as Part IV, Item 15(3) of this Form 10-K.
| * | Calculated by excluding all shares held by executive officers and directors of the Registrant without conceding that all such persons are “affiliates” of the Registrant for purposes of federal securities laws. |
| MOODY’S 2017 10-K |
Table of Contents
MOODY’S CORPORATION
| 2 | MOODY’S 2017 10-K |
Table of Contents
|
|
Page(s) | |||||
| PART III. |
||||||
| Item 10. | DIRECTORS, EXECUTIVE OFFICERS AND CORPORATION GOVERNANCE | 118 | ||||
| Item 11. | EXECUTIVE COMPENSATION | 118 | ||||
| Item 12. | SECURITY OWNERSHIP OF CERTAIN BENEFICIAL OWNERS AND MANAGEMENT AND RELATED STOCKHOLDER MATTERS | 118 | ||||
| Item 13. | CERTAIN RELATIONSHIPS AND RELATED TRANSACTIONS, AND DIRECTOR INDEPENDENCE | 118 | ||||
| Item 14. | PRINCIPAL ACCOUNTING FEES AND SERVICES | 118 | ||||
| PART IV. |
||||||
| Item 15. | EXHIBITS AND FINANCIAL STATEMENT SCHEDULES | 119 | ||||
| SIGNATURES | 120 | |||||
| INDEX TO EXHIBITS | 121-124 | |||||
|
|
|
|
||||
| Exhibits filed Herewith |
| |
| 10.2.1 | 1998 Moody’s Corporation Non-Employee Directors’ Stock Incentive Plan (Adopted September 8, 2000; Amended and Restated as of December 11, 2012, October 20, 2015, December 14, 2015 and December 18, 2017) | |
| 10.2.3 | Form of Non-Employee Director Restricted Stock Unit Grant Agreement (for awards after 2017) for the 1998 Moody’s Corporation Non-Employee Directors’ Stock Incentive Plan (Adopted September 8, 2000; Amended and Restated as of December 11, 2012, October 20, 2015, December 14, 2015 and December 18, 2017) | |
| 10.4.1 | Amended and Restated 2001 Moody’s Corporation Key Employees’ Stock Incentive Plan (as amended, December 18, 2017) | |
| 10.4.6 | Form of Performance Share Award Letter (for awards granted after 2017) for the Amended and Restated 2001 Moody’s Corporation Key Employees’ Stock Incentive Plan. | |
| 10.10 | Moody’s Corporation Change in Control Severance Plan (as amended December 18, 2017). | |
| 12 | Statement of Computation of Ratios of Earnings to Fixed Charges | |
| 21 | SUBSIDIARIES OF THE REGISTRANT | |
| 23.1 | CONSENT OF INDEPENDENT REGISTERED PUBLIC ACCOUNTING FIRM | |
| 31.1 | Chief Executive Officer Certification Pursuant to Section 302 of the Sarbanes-Oxley Act of 2002 | |
| 31.2 | Chief Financial Officer Certification Pursuant to Section 302 of the Sarbanes-Oxley Act of 2002 | |
| 32.1 | Chief Executive Officer Certification Pursuant to Section 906 of the Sarbanes-Oxley Act of 2002 | |
| 32.2 | Chief Financial Officer Certification Pursuant to Section 906 of the Sarbanes-Oxley Act of 2002 | |
| 101.DEF | XBRL Definitions Linkbase Document | |
| 101.INS | XBRL Instance Document | |
| 101.SCH | XBRL Taxonomy Extension Schema Document | |
| 101. CAL | XBRL Taxonomy Extension Calculation Linkbase Document | |
| 101.LAB | XBRL Taxonomy Extension Labels Linkbase Document | |
| 101.PRE | XBRL Taxonomy Extension Presentation Linkbase Document |
| MOODY’S 2017 10-K | 3 |
Table of Contents
GLOSSARY OF TERMS AND ABBREVIATIONS
The following terms, abbreviations and acronyms are used to identify frequently used terms in this report:
| TERM |
DEFINITION | |
| Acquisition-Related Amortization | Amortization of acquired definite-lived intangible assets acquired by the Company from all business combination transactions | |
| Acquisition-Related Expenses | Consists of expenses incurred to complete and integrate the acquisition of Bureau van Dijk for which the integration will be a multi-year effort | |
| Adjusted Diluted EPS | Diluted EPS excluding the impact of certain items as detailed in Item 7 in the section entitled “Non-GAAP Financial Measures” | |
| Adjusted Net Income | Net Income excluding the impact of certain items as detailed in Item 7 in the section entitled “Non-GAAP Financial Measures” | |
| Adjusted Operating Income | Operating income excluding certain items as detailed in Item 7 in the section entitled “Non-GAAP Financial Measures” | |
| Adjusted Operating Margin | Adjusted Operating Income divided by revenue | |
| Americas | Represents countries within North and South America, excluding the U.S. | |
| AOCI | Accumulated other comprehensive income (loss); a separate component of shareholders’ (deficit) equity | |
| ASC | The FASB Accounting Standards Codification; the sole source of authoritative GAAP as of July 1, 2009 except for rules and interpretive releases of the SEC, which are also sources of authoritative GAAP for SEC registrants | |
| Asia-Pacific | Represents countries in Asia including but not limited to: Australia, China, India, Indonesia, Japan, Korea, Malaysia, Singapore, Sri Lanka and Thailand | |
| ASU | The FASB Accounting Standards Update to the ASC. It also provides background information for accounting guidance and the bases for conclusions on the changes in the ASC. ASUs are not considered authoritative until codified into the ASC | |
| Basel II | Capital adequacy framework published in June 2004 by the Basel Committee on Banking Supervision | |
| Basel III | A new global regulatory standard on bank capital adequacy and liquidity agreed by the members of the Basel Committee on Banking Supervision. Basel III was developed in a response to the deficiencies in financial regulation revealed by the global financial crisis. Basel III strengthens bank capital requirements and introduces new regulatory requirements on bank liquidity and bank leverage | |
| BlackBox | BlackBox Logic; a leading provider of Residential Mortgage-Backed securities loan level data. The Company acquired the customer base and products of BlackBox Logic in December 2015 | |
| Board | The board of directors of the Company | |
| BPS | Basis points | |
| Bureau van Dijk | Bureau van Dijk Electronic Publishing, B.V., a global provider of business intelligence and company information; acquired by the company on August 10, 2017 via acquisition of yellow Maple I B.V., an indirect parent of Bureau van Dijk | |
| CCAR | Comprehensive Capital Analysis and Review; annual review by the Federal Reserve in the U.S. to ensure that financial institutions have sufficient capital in times of economic and financial stress and that they have robust, forward-looking capital-planning processes that account for their unique risks. | |
| CCXI | China Chen Xin International Credit Rating Co. Ltd.; China’s first and largest domestic credit rating agency approved by the People’s Bank of China; the Company acquired a 49% interest in 2006; currently Moody’s owns 30% of CCXI | |
| CCXI Gain | In the first quarter of 2017 CCXI, as a part of a strategic business realignment, issued additional capital to its majority shareholder in exchange for a ratings business wholly-owned by the majority shareholder and which has the right to rate a different class of debt instruments in the Chinese market. The capital issuance by CCXI in exchange for the ratings business diluted Moody’s ownership interest in CCXI to 30% of a larger business and resulted in a $59.7 million non-cash, non-taxable gain | |
| 4 | MOODY’S 2017 10-K |
Table of Contents
| TERM |
DEFINITION | |
|
CFG |
Corporate finance group; an LOB of MIS | |
| CLO | Collateralized loan obligation | |
| CMBS | Commercial mortgage-backed securities; part of the CREF asset class within SFG | |
| Commission | European Commission | |
| Common Stock | The Company’s common stock | |
| Company | Moody’s Corporation and its subsidiaries; MCO; Moody’s | |
| Copal | Copal Partners; an acquisition completed in November 2011; part of the MA segment; leading provider of offshore research and analytical services to institutional investors | |
| Council | Council of the European Union | |
| CP | Commercial paper | |
| CP Notes | Unsecured commercial paper issued under the CP Program | |
| CP Program | A program entered into on August 3, 2016 allowing the Company to privately place CP up to a maximum of $1 billion for which the maturity may not exceed 397 days from the date of issue. | |
| CRAs | Credit rating agencies | |
| CREF | Commercial real estate finance, which includes REITs, commercial real estate CDOs and mortgage-backed securities; part of SFG | |
| CSI | CSI Global Education, Inc.; an acquisition completed in November 2010; part of the PS LOB and FSTC reporting unit within the MA segment; a provider of financial learning, credentials, and certification services primarily in Canada | |
| CSPP | Corporate Sector Purchase Programme; quantitative easing program implemented by the ECB. This program allows the central bank to purchase bonds issued by European companies, as well as provide access to the secondary bond market in which existing corporate bonds trade | |
| D&A | Depreciation and amortization | |
| DBPPs | Defined benefit pension plans | |
| DBRS | Dominion Bond Rating Service | |
| DCF | Discounted cash flow; a fair value calculation methodology whereby future projected cash flows are discounted back to their present value | |
| Debt/EBITDA | Ratio of Total Debt to EBITDA | |
| Directors’ Plan | The 1998 Moody’s Corporation Non-Employee Directors’ Stock Incentive Plan | |
| Distribution Date | September 30, 2000; the date which Old D&B separated into two publicly traded companies—Moody’s Corporation and New D&B | |
| DOJ | U.S. Department of Justice | |
| E&P | Earnings and profits | |
| EBITDA | Earnings before interest, taxes, depreciation and amortization | |
| ECB | European Central Bank | |
| ECCA | Economics and Consumer Credit Analytics; a business within the RD&A LOB which provides economic and consumer credit trend analytics | |
| MOODY’S 2017 10-K | 5 |
Table of Contents
| TERM |
DEFINITION | |
|
EMEA |
Represents countries within Europe, the Middle East and Africa | |
| EPS | Earnings per share | |
| Equilibrium | A leading provider of credit rating and research services in Peru and Panama; acquired by Moody’s in May 2015 | |
| ERS | The enterprise risk solutions LOB within MA, which offers risk management software products as well as software implementation services and related risk management advisory engagements | |
| ESA | Economics and Structured Analytics; part of the RD&A line of business within MA | |
| ESG | Environmental, Social and Governance | |
| ESMA | European Securities and Markets Authority | |
| ESP | Estimated Selling Price; estimate of selling price, as defined in the ASC, at which the vendor would transact if the deliverable were sold by the vendor regularly on a stand-alone basis | |
| ESPP | The 1999 Moody’s Corporation Employee Stock Purchase Plan | |
| ETR | Effective tax rate | |
| EU | European Union | |
| EUR | Euros | |
| European Ratings Platform | Central credit ratings website administered by ESMA | |
| Excess Tax Benefits | The difference between the tax benefit realized at exercise of an option or delivery of a restricted share and the tax benefit recorded at the time the option or restricted share is expensed under GAAP | |
| Exchange Act | The Securities Exchange Act of 1934, as amended | |
| FASB | Financial Accounting Standards Board | |
| FIG | Financial institutions group; an LOB of MIS | |
| Fitch | Fitch Ratings, a part of the Fitch Group | |
| Financial Reform Act | Dodd-Frank Wall Street Reform and Consumer Protection Act | |
| Free Cash Flow | Net cash provided by operating activities less cash paid for capital additions | |
| FSTC | Financial Services Training and Certifications; part of the PS LOB and a reporting unit within the MA reportable segment; consists of on-line and classroom-based training services and CSI | |
| FX | Foreign exchange | |
| GAAP | U.S. Generally Accepted Accounting Principles | |
| GBP | British pounds | |
| GDP | Gross domestic product | |
| GGY | Gilliland Gold Young; a leading provider of advanced actuarial software for the global insurance industry. The Company acquired GGY on March 1, 2016; Part of the ERS LOB and reporting unit within the MA reportable segment | |
| ICRA | ICRA Limited; a leading provider of credit ratings and research in India. The Company previously held 28.5% equity ownership and in June 2014, increased that ownership stake to just over 50% through the acquisition of additional shares | |
| ICRA Acquisition | The June 2014 purchase of an additional interest in ICRA resulting in a majority ownership of ICRA; ICRAs results are consolidated into Moody’s financial statements on a three-month lag and accordingly the Company began including the results of operations for ICRA in its consolidated financial statements beginning in the fourth quarter of 2014 | |
| 6 | MOODY’S 2017 10-K |
Table of Contents
| TERM |
DEFINITION | |
|
ICRA Gain |
Gain relating to the ICRA Acquisition; U.S. GAAP requires the remeasurement to fair value of the previously held non-controlling shares upon obtaining a controlling interest in a step-acquisition. This remeasurement of the Company’s equity investment in ICRA to fair value resulted in a pre-tax gain of $102.8 million ($78.5 million after tax) in the second quarter of 2014 | |
| ICTEAS | ICRA Techno Analytics; formerly a wholly-owned subsidiary of ICRA; divested by ICRA in the fourth quarter of 2016 | |
| Intellectual Property | The Company’s intellectual property, including but not limited to proprietary information, trademarks, research, software tools and applications, models and methodologies, databases, domain names, and other proprietary materials | |
| IRS | Internal Revenue Service | |
| IT | Information technology | |
| KIS | Korea Investors Service, Inc; a leading Korean rating agency and consolidated subsidiary of the Company | |
| KIS Pricing | Korea Investors Service Pricing, Inc; a leading Korean provider of fixed income securities pricing and consolidated subsidiary of the Company | |
| KIS Research | Korea Investors Service Research; a Korean provider of financial research and consolidated subsidiary of the Company | |
| Korea | Republic of South Korea | |
| Legacy Tax Matter(s) | Exposures to certain potential tax liabilities assumed in connection with the Company’s spin-off from Dun & Bradstreet in 2000 | |
| LIBOR | London Interbank Offered Rate | |
| LOB | Line of business | |
| M&A | Mergers and acquisitions | |
| MA | Moody’s Analytics—a reportable segment of MCO formed in January 2008 which provides a wide range of products and services that support financial analysis and risk management activities of institutional participants in global financial markets; consists of three LOBs—RD&A, ERS and PS | |
| Make Whole Amount | The prepayment penalty amount relating to the Series 2007-1 Notes, 2010 Senior Notes, 2012 Senior Notes, 2013 Senior Notes, 2014 Senior Notes (5-year), 2014 Senior Notes (30-year), 2015 Senior Notes, 2017 Senior Notes, 2017 Private Placement Notes Due 2023 and 2028 which is a premium based on the excess, if any, of the discounted value of the remaining scheduled payments over the prepaid principal | |
| MAKS | Moody’s Analytics Knowledge Services; formerly known as Copal Amba; provides offshore research and analytic services to the global financial and corporate sectors; part of the PS LOB and a reporting unit within the MA reportable segment | |
| MCO | Moody’s Corporation and its subsidiaries; the Company; Moody’s | |
| MD&A | Management’s Discussion and Analysis of Financial Condition and Results of Operations | |
| MIS | Moody’s Investors Service—a reportable segment of MCO; consists of five LOBs—SFG, CFG, FIG, PPIF and MIS Other | |
| MIS Other | Consists of non-ratings revenue from ICRA, KIS Pricing and KIS Research. These businesses are components of MIS; MIS Other is an LOB of MIS | |
| Moody’s | Moody’s Corporation and its subsidiaries; MCO; the Company | |
| Net Income | Net income attributable to Moody’s Corporation, which excludes net income from consolidated noncontrolling interests belonging to the minority interest holder | |
| New D&B | The New D&B Corporation—which comprises the D&B business after September 30, 2000 | |
| MOODY’S 2017 10-K | 7 |
Table of Contents
| TERM |
DEFINITION | |
|
NM |
Percentage change is not meaningful | |
| Non-GAAP | A financial measure not in accordance with GAAP; these measures, when read in conjunction with the Company’s reported results, can provide useful supplemental information for investors analyzing period-to-period comparisons of the Company’s performance, facilitate comparisons to competitors’ operating results and to provide greater transparency to investors of supplemental information used by management in its financial and operational decision making | |
| NRSRO | Nationally Recognized Statistical Rating Organization | |
| OCI | Other comprehensive income (loss); includes gains and losses on cash flow and net investment hedges, unrealized gains and losses on available for sale securities, certain gains and losses relating to pension and other retirement benefit obligations and foreign currency translation adjustments | |
| Old D&B | The former Dun and Bradstreet Company which distributed New D&B shares on September 30, 2000, and was renamed Moody’s Corporation | |
| Other Retirement Plan | The U.S. retirement healthcare and U.S. retirement life insurance plans | |
| PPIF | Public, project and infrastructure finance; an LOB of MIS | |
| Profit Participation Plan | Defined contribution profit participation plan that covers substantially all U.S. employees of the Company | |
| PS | Professional Services, an LOB within MA consisting of MAKS and FSTC that provides offshore research and analytical services as well as financial training and certification programs | |
| Purchase Price Hedge | Foreign currency collar and forward contracts entered by the Company to economically hedge the Bureau van Dijk euro denominated purchase price | |
| Purchase Price Hedge Gain | Gain on foreign currency collars to economically hedge the Bureau van Dijk euro denominated purchase price | |
| RD&A | Research, Data and Analytics; an LOB within MA that produces, sells and distributes research, data and related content. Includes products generated by MIS, such as analyses on major debt issuers, industry studies, and commentary on topical credit events. Also includes economic research, data, quantitative risk scores, and other analytical tools that are produced within MA and business intelligence and company information products | |
| Reform Act | Credit Rating Agency Reform Act of 2006 | |
| REIT | Real Estate Investment Trust | |
| Relationship Revenue | For MIS represents monitoring of a rated debt obligation and/or entities that issue such obligations, as well as revenue from programs such as commercial paper, medium-term notes and shelf registrations. For MIS Other represents subscription-based revenue. For MA, represents subscription-based license and maintenance revenue | |
| Retirement Plans | Moody’s funded and unfunded pension plans, the healthcare plans and life insurance plans | |
| S&P | S&P Global Ratings, a division of S&P Global Inc. | |
| SAV | Structured Analytics and Valuation; a business within the RD&A LOB which provides data and analytics for securitized assets | |
| SCDM | SCDM Financial, a leading provider of analytical tools for participants in securitization markets. Moody’s acquired SCDM’s structured finance data and analytics business in February 2017 | |
| SEC | U.S. Securities and Exchange Commission | |
| Securities Act | Securities Act of 1933, as amended | |
| Series 2007-1 Notes | Principal amount of $300 million, 6.06% senior unsecured notes due in September 2017 pursuant to the 2007 Agreement; prepaid in March 2017 | |
| 8 | MOODY’S 2017 10-K |
Table of Contents
| TERM |
DEFINITION | |
|
Settlement Charge |
Charge of $863.8 million recorded in the fourth quarter of 2016 related to an agreement entered into on January 13, 2017 with the U.S. Department of Justice and the attorneys general of 21 U.S. states and the District of Columbia to resolve pending and potential civil claims related to credit ratings that MIS assigned to certain structured finance instruments in the financial crisis era | |
| SFG | Structured finance group; an LOB of MIS | |
| SG&A | Selling, general and administrative expenses | |
| Solvency II | EU directive 2009/138/EC that codifies the amount of capital that EU insurance companies must hold to reduce insolvency | |
| Stock Plans | The Old D&B’s 1998 Key Employees’ Stock Incentive Plan and the Restated 2001 Moody’s Corporation Key Employees’ Stock Incentive Plan | |
| Tax Act | The “Tax Cuts and Jobs Act” enacted into U.S. law on December 22, 2017 which significantly amends the tax code in the U.S. | |
| Total Debt | All indebtedness of the Company as reflected on the consolidated balance sheets | |
| TPE | Third party evidence, as defined in the ASC, used to determine selling price based on a vendor’s or any competitor’s largely interchangeable products or services in standalone sales transactions to similarly situated customers | |
| Transaction Revenue | For MIS, represents the initial rating of a new debt issuance as well as other one-time fees. For MIS Other, represents revenue from professional services as well as data services, research and analytical engagements. For MA, represents software license fees and revenue from risk management advisory projects, training and certification services, and research and analytical engagements | |
| U.K. | United Kingdom | |
| U.S. | United States | |
| USD | U.S. dollar | |
| UTBs | Unrecognized tax benefits | |
| UTPs | Uncertain tax positions | |
| VSOE | Vendor specific objective evidence; as defined in the ASC, evidence of selling price limited to either of the following: the price charged for a deliverable when it is sold separately, or for a deliverable not yet being sold separately, the price established by management having the relevant authority | |
| WACC | Weighted average cost of capital | |
| 1998 Plan | Old D&B’s 1998 Key Employees’ Stock Incentive Plan | |
| 2001 Plan | The Amended and Restated 2001 Moody’s Corporation Key Employees’ Stock Incentive Plan | |
| 2007 Agreement | Note purchase agreement dated September 7, 2007, relating to the Series 2007-1 Notes | |
| 2010 Indenture | Supplemental indenture and related agreements dated August 19, 2010, relating to the 2010 Senior Notes | |
| 2010 Senior Notes | Principal amount of $500 million, 5.50% senior unsecured notes due in September 2020 pursuant to the 2010 Indenture | |
| 2012 Facility | Revolving credit facility of $1 billion entered into on April 18, 2012; was replaced with the 2015 Facility | |
| 2012 Indenture | Supplemental indenture and related agreements dated August 18, 2012, relating to the 2012 Senior Notes | |
| 2012 Senior Notes | Principal amount of $500 million, 4.50% senior unsecured notes due in September 2022 pursuant to the 2012 Indenture | |
| 2013 Indenture | Supplemental indenture and related agreements dated August 12, 2013, relating to the 2013 Senior Notes | |
| MOODY’S 2017 10-K | 9 |
Table of Contents
| TERM |
DEFINITION | |
| 2013 Senior Notes | Principal amount of the $500 million, 4.875% senior unsecured notes due in February 2024 pursuant to the 2013 Indenture | |
| 2014 Indenture | Supplemental indenture and related agreements dated July 16, 2014, relating to the 2014 Senior Notes | |
| 2014 Senior Notes (5-Year) | Principal amount of $450 million, 2.75% senior unsecured notes due in July 2019 | |
| 2014 Senior Notes (30-Year) | Principal amount of $600 million, 5.25% senior unsecured notes due in July 2044 | |
| 2015 Facility | Five-year unsecured revolving credit facility, with capacity to borrow up to $1 billion; replaces the 2012 Facility | |
| 2015 Indenture | Supplemental indenture and related agreements dated March 9, 2015, relating to the 2015 Senior Notes | |
| 2015 Senior Notes | Principal amount €500 million, 1.75% senior unsecured notes issued March 9, 2015 and due in March 2027 | |
| 2017 Bridge Credit Facility | Bridge Credit Agreement entered into in May 2017 pursuant to the definitive agreement to acquire Bureau van Dijk; this facility was terminated in June 2017 upon issuance of the 2017 Private Placement Notes Due 2023 and 2028 | |
| 2017 Floating Rate Senior Notes | Principal amount of $300 million, floating rate senior unsecured notes due in September 2018 | |
| 2017 Indenture | Collectively the Supplemental indenture and related agreements dated March 2, 2017, relating to the 2017 Floating Rate Senior Notes and 2017 Senior Notes and the Supplemental indenture and related agreements dated June 12, 2017, relating to the 2017 Private Placement Notes Due 2023 and 2028 | |
| 2017 Private Placement Notes due 2023 | Principal amount of $500 million, 2.625% senior unsecured notes due January 15, 2023 | |
| 2017 Private Placement Notes Due 2028 | Principal amount $500 million, 3.250% senior unsecured notes due January 15, 2028 | |
| 2017 Senior Notes | Principal amount of $500 million, 2.75% unsecured notes due December 2021 | |
| 2017 Term Loan | $500 million, three-year term loan facility entered into on June 6, 2017 for which the Company drew down $500 million on August 8, 2017 to fund the acquisition of Bureau van Dijk | |
| 7WTC | The Company’s corporate headquarters located at 7 World Trade Center in New York, NY | |
| 10 | MOODY’S 2017 10-K |
Table of Contents
PART I
| ITEM | 1. BUSINESS |
As used in this report, except where the context indicates otherwise, the terms “Moody’s” or the “Company” refer to Moody’s Corporation, a Delaware corporation, and its subsidiaries. The Company’s executive offices are located at 7 World Trade Center at 250 Greenwich Street, New York, NY 10007 and its telephone number is (212) 553-0300.
Moody’s is a provider of (i) credit ratings; (ii) credit, capital markets and economic research, data and analytical tools; (iii) software solutions that support financial risk management activities; (iv) quantitatively derived credit scores; (v) financial services training and certification services; (vi) offshore financial research and analytical services; and (vii) company information and business intelligence products. Moody’s reports in two reportable segments: MIS and MA. Financial information and operating results of these segments, including revenue, expenses and operating income, are included in Part II, Item 8. Financial Statements of this annual report, and are herein incorporated by reference.
MIS publishes credit ratings on a wide range of debt obligations and the entities that issue such obligations in markets worldwide, including various corporate and governmental obligations, structured finance securities and commercial paper programs. Ratings revenue is derived from the originators and issuers of such transactions who use MIS ratings to support the distribution of their debt issues to investors. MIS provides ratings in more than 120 countries. Ratings are disseminated via press releases to the public through a variety of print and electronic media, including the Internet and real-time information systems widely used by securities traders and investors. As of December 31, 2017, MIS had the following ratings relationships:
| » | Approximately 4,700 rated non-financial corporate issuers; |
| » | Approximately 4,100 rated financial institutions issuers; |
| » | Approximately 18,000 rated public finance issuers (including sovereign, sub-sovereign and supranational issuers); |
| » | Approximately 11,000 rated structured finance transactions; and |
| » | Approximately 1,000 rated infrastructure and project finance issuers. |
Additionally, MIS earns revenue from certain non-ratings-related operations, which primarily consist of financial instruments pricing services in the Asia-Pacific region as well as revenue from ICRA non-rating operations. The revenue from these operations is included in the MIS Other LOB and is not material to the results of the MIS segment.
The MA segment develops a wide range of products and services that support financial analysis and risk management activities of institutional participants in global financial markets. Within its Research, Data and Analytics business, MA distributes research and data developed by MIS as part of its ratings process, including in-depth research on major debt issuers, industry studies, commentary on topical credit related events. The RD&A LOB also provides economic research and credit data and analytical tools such as quantitative credit risk scores as well as business intelligence and company information products. Within its Enterprise Risk Solutions business, MA provides software solutions as well as related risk management services. Within its Professional Services business it provides offshore research and analytical services along with financial training and certification programs. MA customers represent more than 10,500 institutions worldwide operating in over 155 countries. During 2017 Moody’s research website was accessed by over 252,000 individuals including 36,000 customer users.
Over recent decades, global fixed-income markets have grown significantly both in terms of the amount and types of securities or other obligations outstanding. Beginning in mid-2007, there was a severe market disruption and associated financial crisis both in the devel-
| MOODY’S 2017 10-K | 11 |
Table of Contents
oped and emerging markets resulting in a global decline in debt issuance activity for some significant asset classes and weak economic performance in advanced economies. Since this financial crisis, many markets and economies have recovered and Moody’s believes the overall long-term outlook remains favorable for continued growth of the global fixed-income market and related financial information market, which includes information such as credit opinions, research, data, analytics, risk management tools and related services.
Moody’s growth is influenced by a number of trends that impact financial information markets including:
| » | Health of the world’s major economies; |
| » | Debt capital markets activity; |
| » | Disintermediation of credit markets; |
| » | Fiscal and monetary policy of governments; and |
| » | Business investment spending, including mergers and acquisitions. |
In an environment of increasing financial complexity and heightened attention to credit analysis and risk management, Moody’s is well positioned to benefit from continued growth in global fixed-income market activity and a more widespread use of credit ratings, research and related analytical products. Moody’s expects that these developments will support continued long-term demand for high quality, independent credit opinions, research, data, analytics, risk management tools and related services.
Strong secular trends should continue to provide long-term growth opportunities. For MIS, key growth drivers include debt market issuance driven by global GDP growth, continued disintermediation of fixed-income markets in both developed and emerging economies driving issuance and demand for new ratings products and services. Growth in MA is likely to be driven by deeper and broader penetration of its customer base as regulatory compliance and other analytical requirements drive demand for MA’s products and expertise. Moreover, pricing opportunities aligned with customer value creation and advances in information technology present growth opportunities for Moody’s.
Growth in global fixed income markets in a given year is dependent on many macroeconomic and capital market factors including interest rates, business investment spending, corporate refinancing needs, merger and acquisition activity, issuer profits, consumer borrowing levels and securitization activity. Rating fees paid by debt issuers account for most of the revenue of MIS. Therefore, a substantial portion of MIS’s revenue is dependent upon the dollar-equivalent volume and number of ratable debt securities issued in the global capital markets. MIS’s results can be affected by factors such as the performance and prospects for growth of the major world economies, the fiscal and monetary policies pursued by their governments, and the decisions of issuers to request MIS ratings to aid investors in their investment decisions. However, annual fee arrangements with frequent debt issuers, annual debt monitoring fees and annual fees from commercial paper and medium-term note programs, bank deposit ratings, insurance company financial strength ratings, mutual fund ratings, and other areas partially mitigate MIS’s dependence on the volume or number of new debt securities issued in the global fixed-income markets. Furthermore, the strong growth seen in the issuance of structured finance securities from the mid-1990’s reversed dramatically in 2008 due to market turmoil, with continued declines seen in 2009 and 2010, before stabilizing in 2011 with Moody’s experiencing revenue growth in this market beginning in 2012. Despite significant declines from peak market issuance levels, Moody’s believes that structured finance securities will continue to play a role in global fixed-income markets and provide opportunities for long-term revenue growth.
The pace of change in technology and communication over the past two decades makes information about investment alternatives widely available throughout the world and facilitates issuers’ ability to place securities outside their national markets and similarly investors’ ability to obtain information about securities issued outside their national markets. Technology also allows issuers and investors the ability to more readily obtain information about new financing techniques and new types of securities that they may wish to purchase or sell, which in the absence of the appropriate technology might not be readily or easily obtainable. This availability of information promotes the ongoing integration and expansion of financial markets worldwide, giving issuers and investors access to a wider range of both established and newer capital markets. As technology provides broader access to worldwide markets, it also results in a greater need for credible, globally comparable opinions about credit risk, data, analytics and related services. Additionally, information technology also provides opportunities to further build a global platform to support Moody’s continued expansion in developing markets.
An ongoing trend in the world’s capital markets is the disintermediation of financial systems. Issuers increasingly raise capital in the global public capital markets, in addition to, or in substitution for, traditional financial intermediaries. Moreover, financial intermediaries have sold assets in the global public capital markets, in addition to, or instead of, retaining those assets. Moody’s believes that issuer use of global debt capital markets offer advantages in capacity and efficiency compared to traditional banking systems and that the trend of increased disintermediation will continue. Further, disintermediation has continued because of the ongoing low interest rate environment and bank deleveraging, which has encouraged a number of corporations and other entities to seek alternative funding in the bond markets.
| 12 | MOODY’S 2017 10-K |
Table of Contents
Moody’s also observes disintermediation in key emerging markets where economic growth may outpace internal banking system capacity. Thus, disintermediation is expected to continue over the longer-term, with Moody’s targeting investment and resources to those markets where disintermediation and bond issuance is expected to remain robust.
In the aftermath of the global financial crisis, banking, insurance and capital markets authorities promulgated a wide range of new regulations to restore stability and confidence in financial institutions under their oversight. Programs such as Basel III, Solvency II, and CCAR — among many others — prompted banks, insurers, securities dealers, and asset managers to invest in more robust risk management practices and systems. Many of these investments drew on expertise and tools offered by MA, resulting in strong revenue growth in the post-crisis period. As banking and capital markets continue to stabilize, and with financial institutions better capitalized, regulatory-driven demand for MA products will moderate. Nonetheless, we expect that MA products and services that enable compliance with financial regulation will continue to be adopted by institutions worldwide, prompted by periodic revisions to regulatory frameworks such as the Basel capital adequacy protocols. Moreover, having responded to regulatory imperatives, financial institutions are increasingly seeking to leverage investments in regulatory compliance systems to gain business insights and front-office efficiencies; MA is well-positioned to realize revenue growth by assisting in these efforts to apply back-office analytics in support of front-line business decisions. Finally, in order to respond to other sources of demand and drive growth, MA is actively investing in new products, including enhanced data sets and improved delivery methods (e.g., software-as-a-service). These efforts will support broader distribution of MA’s capabilities, deepen relationships with existing customers and facilitate more new customer acquisition.
Legislative bodies and regulators in the U.S., Europe and other jurisdictions continue to conduct regulatory reviews of CRAs, which may result in, for example, an increased number of competitors, changes to the business model or restrictions on certain business activities of MIS, removal of references to ratings in certain regulations, or increased costs of doing business for MIS. Therefore, in order to broaden the potential for expansion of non-ratings services, Moody’s reorganized in January 2008 into two distinct businesses: MIS, consisting primarily of the ratings business, and MA, which conducts activities including the sale of credit research produced by MIS and the production and sale of other economic and credit-related products and services. The reorganization broadened the opportunities for expansion by MA into activities that may have otherwise been restricted for MIS, due to the potential for conflicts of interest with the ratings business. At present, Moody’s is unable to assess the nature and effect that any regulatory changes may have on future growth opportunities.
Moody’s operations are subject to various risks, as more fully described in Part I, Item 1A “Risk Factors,” inherent in conducting business on a global basis. Such risks include currency fluctuations and possible nationalization, expropriation, exchange and price controls, changes in the availability of data from public sector sources, limits on providing information across borders and other restrictive governmental actions.
MIS competes with other CRAs and with investment banks and brokerage firms that offer credit opinions and research. Many users of MIS’s ratings also have in-house credit research capabilities. MIS’s largest competitor in the global credit rating business is S&P Global Ratings (S&P), a division of S&P Global. There are some rating markets, based on industry, geography and/or instrument type, in which Moody’s has made investments and obtained market positions superior to S&P, while in other markets, the reverse is true.
In addition to S&P, MIS’s competitors include Fitch Ratings, Dominion Bond Rating Service (DBRS), A.M. Best Company, Japan Credit Rating Agency Ltd., Kroll Bond Rating Agency Inc., Morningstar Inc. and Egan-Jones Ratings Company. In Europe, there are approximately 30 companies currently registered with ESMA, which include both purely domestic European CRAs and International CRAs such as S&P, Fitch and DBRS. There are additional competitors in other regions and countries, for example, in China, where Moody’s participates through a joint venture. These competitors include China Lianhe Credit Rating Co Ltd., Shanghai Brilliance Credit Rating & Investors Service Co Ltd., Dagong Global Credit Rating Co Ltd. and Pengyuan Credit Rating Co Ltd.
MA competes broadly in the financial information industry against diversified competitors such as Thomson Reuters, Bloomberg, S&P Global Market Intelligence, Fitch Solutions, Dun & Bradstreet, IBM, Wolters Kluwer, Fidelity National Information Services, SAS, Fiserv, MSCI and IHS Markit among others. MA’s main competitors within RD&A include S&P Global Market Intelligence, CreditSights, Thomson Reuters, Intex, IHS Markit, BlackRock Solutions, FactSet and other providers of fixed income analytics, valuations, economic data and research. In ERS, MA faces competition from both large software providers such as IBM Algorithmics, Fidelity National Information Services, SAS, Oracle, Misys, Oliver Wyman, Verisk Analytics and various other vendors and in-house solutions. Within Professional Services, MA competes with a host of financial training and education firms such as Omega Performance and providers of offshore research and analytical services such as Evalueserve and CRISIL Global Research & Analytics.
Moody’s corporate strategy is to be the world’s most respected authority serving financial risk-sensitive markets. The key aspects to implement this strategy are to:
| » | Defend and enhance the core ratings and research business of MIS; |
| MOODY’S 2017 10-K | 13 |
Table of Contents
| » | Build MA’s position as a leading provider of data, analytics and risk management solutions to financial institutions, corporations, and governmental authorities; and |
| » | Invest in strategic growth opportunities. |
Moody’s will make investments to defend and enhance its core businesses in an attempt to position the Company to fully capture market opportunities resulting from global debt capital market expansion and increased business investment spending. Moody’s will also make strategic investments to achieve scale in attractive financial information markets, move into attractive product and service adjacencies where the Company can leverage its brand, extend its thought leadership and expand its geographic presence in high growth emerging markets.
To broaden the Company’s potential, MA provides a wide range of products and services to enable financial institutions, corporations and governmental authorities to better manage risk. As such, MA adds to the Company’s value proposition in three ways. First, MA’s subscription businesses provide a significant base of recurring revenue to offset cyclicality in ratings issuance volumes that may result in volatility in MIS’s revenues. Second, MA products and services, such as financial training and professional services on research and risk management best practices, provide opportunities for entry into emerging markets before banking systems and debt capital markets fully develop and thus present long-term growth opportunities for the ratings business. Finally, MA’s integrated risk management software platform embeds Moody’s solutions deep into the technology infrastructure of banks and insurance companies worldwide.
Moody’s invests in initiatives to implement the Company’s strategy, including internally led organic development and targeted acquisitions. Example initiatives include:
| » | Enhancements to ratings quality and product extensions; |
| » | Investments that extend ownership and participation in joint ventures and strategic alliances; |
| » | New products, services, content (e.g., non-credit risk assessments such as ESG and cybersecurity risk), and technology capabilities to meet customer demands; |
| » | Selective bolt-on acquisitions that accelerate the ability to scale and grow Moody’s businesses; and |
| » | Expansion in emerging markets. |
During 2017, Moody’s continued to invest in and acquire complementary businesses in MIS and MA. In February 2017, Moody’s acquired the structured finance data and analytics business of SCDM, a leading provider of analytical tools for participants in securitization markets in Europe. The acquisition further extended the geographic footprint of MA’s structured finance analytics business, which includes extensive loan- and pool-level data for securitized assets, as well as cash flow analytics, risk monitoring and credit modelling tools that cover all major asset classes worldwide. In June 2017, Moody’s invested in CompStak, a provider of commercial real estate lease information. Leveraging lease data provided by CompStak will help MA expand its product offering and develop new products and technologies that serve the needs of commercial real estate finance and risk professionals. In August 2017, Moody’s completed the acquisition of Bureau van Dijk, a global provider of business intelligence and company information, for €3.0 billion. The acquisition of Bureau van Dijk extended MA’s offerings of small and medium size enterprise and private company information, strengthening Moody’s position as a leader in financial risk data and analytical insight. Also in August 2017, Moody’s invested in SecurityScorecard, a leading provider of cybersecurity ratings. SecurityScorecard’s innovative cyber risk ratings, data and analytics are used by information security, risk management, supply chain, and compliance practitioners to assess and monitor their security posture and secure their partner and vendor ecosystem. In November 2017, Moody’s invested in Rockport VAL, a provider of cloud-based commercial real estate valuation and cash flow modeling tools.
MIS and many of the securities that it rates are subject to extensive regulation in both the U.S. and in other countries (including by state and local authorities). Thus, existing and proposed laws and regulations can impact the Company’s operations and the markets for securities that it rates. Additional laws and regulations have been adopted but not yet implemented or have been proposed or are being considered. Each of the existing, adopted, proposed and potential laws and regulations can increase the costs and legal risk associated with the issuance of credit ratings and may negatively impact Moody’s operations or profitability, the Company’s ability to compete, or result in changes in the demand for credit ratings, in the manner in which ratings are utilized and in the manner in which Moody’s operates.
The regulatory landscape has changed rapidly in recent years, and continues to evolve. In the EU, the CRA industry is registered and supervised through a pan-European regulatory framework. The European Securities and Markets Authority has direct supervisory responsibility for the registered CRA industry throughout the EU. MIS is a registered entity and is subject to formal regulation and periodic inspection. Applicable rules include procedural requirements with respect to ratings of sovereign issuers, liability for intentional or grossly negligent failure to abide by applicable regulations, mandatory rotation requirements of CRAs hired by issuers of securities for
| 14 | MOODY’S 2017 10-K |
Table of Contents
ratings of resecuritizations, restrictions on CRAs or their shareholders if certain ownership thresholds are crossed, reporting requirements to ESMA regarding fees, and additional procedural and substantive requirements on the pricing of services. In 2016, the Commission published a report concluding that no new European legislation was needed for the industry at that time, but that it would continue to monitor the credit rating industry and analyze approaches that may strengthen existing regulation. In addition, from time to time, ESMA publishes interpretive guidance or thematic reports regarding various aspects of the regulation. Over the past quarter, two such reports have been published. The first report provides further guidance from ESMA regarding the endorsement mechanism that CRAs will need to employ for those ratings that are produced outside of the EU but are used inside the EU by EU-regulated entities. The second report discusses ESMA’s observations on CRAs fee practices.
Separately, on June 23, 2016, the U.K. voted through a referendum to exit the EU. The UK officially launched the exit process by submitting its Article 50 letter to the EU, informing it of the UK’s intention to exit. The submission of this letter “starts the clock” on the negotiation of the terms of exit which will take up to two years. The specifics regarding the “new relationship” or any transitional arrangements (bridging the UK’s exit from its re-engagement with the EU) will only begin once the broad terms of exit have been agreed upon by all parties.
The longer-term impacts of the decision to leave the EU on the overall regulatory framework for the U.K. will depend, in part, on the relationship that the U.K. negotiates with the EU in the future. In the interim, however, the U.K.’s markets regulator (the Financial Conduct Authority) has said that all EU financial regulations will stay in place and that firms must continue to abide by their existing obligations. As a consequence, at this point in time, there is no change to the regulatory framework under which MIS operates and ESMA remains MIS’s regulator both in the EU and in the U.K.
In the U.S., CRAs are subject to extensive regulation primarily pursuant to the Reform Act and the Financial Reform Act. The SEC is required by these legislative acts to publish two annual reports to Congress on NRSROs. The Financial Reform Act requires the SEC to examine each NRSRO once a year and issue an annual report summarizing the examination findings, among other requirements. The annual report required by the Reform Act details the SEC’s views on the state of competition, transparency and conflicts of interests among NRSROs, among other requirements. The SEC voted in August 2014 to adopt its final rules for NRSROs as required by the Financial Reform Act. The Company has made and continues to make substantial IT and other investments, and has implemented the relevant compliance obligations.
In light of the regulations that have gone into effect in both the EU and the U.S. (as well as many other countries), periodically and as a matter of course pursuant to their enabling legislation these regulatory authorities have and will continue to publish reports that describe their oversight activities over the industry. In addition, other legislation and/or interpretation of existing regulation relating to credit rating and research services is being considered by local, national and multinational bodies and this type of activity is likely to continue in the future. Finally, in certain countries, governments may provide financial or other support to locally-based rating agencies. For example, governments may from time to time establish official rating agencies or credit ratings criteria or procedures for evaluating local issuers. If enacted, any such legislation and regulation could change the competitive landscape in which MIS operates. The legal status of rating agencies has been addressed by courts in various decisions and is likely to be considered and addressed in legal proceedings from time to time in the future. Management of the Company cannot predict whether these or any other proposals will be enacted, the outcome of any pending or possible future legal proceedings, or regulatory or legislative actions, or the ultimate impact of any such matters on the competitive position, financial position or results of operations of Moody’s.
Moody’s and its affiliates own and control a variety of intellectual property, including but not limited to proprietary information, trademarks, research, software tools and applications, models and methodologies, databases, domain names, and other proprietary materials that, in the aggregate, are of material importance to Moody’s business. Management of Moody’s believes that each of the trademarks and related corporate names, marks and logos containing the term “Moody’s” are of material importance to the Company.
The Company, primarily through MA (including its Bureau van Dijk business), licenses certain of its databases, software applications, credit risk models, training courses in credit risk and capital markets, research and other publications and services that contain intellectual property to its customers. These licenses are provided pursuant to standard fee-bearing agreements containing customary restrictions and intellectual property protections.
In addition, Moody’s licenses certain technology, data and other intellectual property rights owned and controlled by others. Specifically, Moody’s licenses financial information (such as market and index data, financial statement data, third party research, default data, and security identifiers) as well as software development tools and libraries. In addition, the Company’s Bureau van Dijk business obtains from third party information providers certain financial, credit risk, compliance, management, ownership and other data on companies worldwide, which Bureau van Dijk distributes through its company information products. The Company obtains such technology and intellectual property rights from generally available commercial sources. The Company also utilizes generally available open source software and libraries for internal use and also, subject to appropriately permissive open source licenses, to carry out rou-
| MOODY’S 2017 10-K | 15 |
Table of Contents
tine functions in certain of the Company’s software products. Most of such technology and intellectual property is available from a variety of sources. Although certain financial information (particularly security identifiers, certain pricing or index data, and certain company financial data in selected geographic markets sourced by Bureau van Dijk) is available only from a limited number of sources, Moody’s does not believe it is dependent on any one data source for a material aspect of its business.
The Company considers its Intellectual Property to be proprietary, and Moody’s relies on a combination of copyright, trademark, trade secret, patent, non-disclosure and other contractual safeguards for protection. Moody’s also pursues instances of third-party infringement of its Intellectual Property in order to protect the Company’s rights. The Company owns two patents. None of the Intellectual Property is subject to a specific expiration date, except to the extent that the patents and the copyright in items that the Company authors (such as credit reports, research, software, and other written opinions) expire pursuant to relevant law.
The names of Moody’s products and services referred to herein are trademarks, service marks or registered trademarks or service marks owned by or licensed to Moody’s or one or more of its subsidiaries.
As of December 31, 2017 the number of full-time equivalent employees of Moody’s was approximately 12,000.
Moody’s investor relations Internet website is http://ir.moodys.com/. Under the “SEC Filings” tab at this website, the Company makes available free of charge its annual reports on Form 10-K, quarterly reports on Form 10-Q, current reports on Form 8-K and amendments to those reports as soon as reasonably practicable after they are filed with, or furnished to, the SEC.
The SEC maintains an internet site that contains annual, quarterly and current reports, proxy and other information statements that the Company files electronically with the SEC. The SEC’s internet site is http://www.sec.gov/.
Executive Officers of the Registrant
| Name, Age and Position |
Biographical Data | |
| Mark E. Almeida, 58 President, Moody’s Analytics |
Mr. Almeida has served as President of Moody’s Analytics since January 2008. Prior to this position, Mr. Almeida was Senior Vice President of Moody’s Corporation from August 2007 to January 2008, Senior Managing Director of the Investor Services Group (ISG) at Moody’s Investors Service, Inc. from December 2004 to January 2008 and was Group Managing Director of ISG from June 2000 to December 2004. Mr. Almeida joined Moody’s Investors Service, Inc. in April 1988 and has held a variety of positions with the company in both the U.S. and overseas. | |
| Richard Cantor, 60 Chief Risk Officer |
Mr. Cantor has served as Chief Risk Officer of Moody’s Corporation since December 2008 and as Chief Credit Officer of Moody’s Investors Service, Inc. since November 2008. From July 2008 to November 2008, Mr. Cantor served as Acting Chief Credit Officer. Prior thereto, Mr. Cantor was Managing Director of Moody’s Credit Policy Research Group from June 2001 to July 2008, after serving as Senior Vice President in the Financial Guarantors Rating Group. Mr. Cantor joined Moody’s in 1997 from the Federal Reserve Bank of New York, where he served as Assistant Vice President in the Research Group and was Staff Director at the Discount Window. Prior to the Federal Reserve, Mr. Cantor taught Economics at UCLA and Ohio State and has taught on an adjunct basis at the business schools of Columbia University and New York University. | |
| Michael S. Crimmins, 47 Senior Vice President and Corporate Controller |
Mr. Crimmins has served as the Company’s Senior-Vice President—Corporate Controller since August 2016. Mr. Crimmins joined Moody’s in November 2004 as Assistant Controller. Prior to joining the Company, Mr. Crimmins worked at Deloitte where his last position held was a Senior Manager in their Assurance and Advisory Practice. He also served at PricewaterhouseCoopers as a consultant. | |
| 16 | MOODY’S 2017 10-K |
Table of Contents
| MOODY’S 2017 10-K | 17 |
Table of Contents
| ITEM 1A. | RISK FACTORS |
The following risk factors and other information included in this annual report on Form 10-K should be carefully considered. The risks and uncertainties described below are not the only ones the Company faces. Additional risks and uncertainties not presently known to the Company or that the Company’s management currently deems minor or insignificant also may impair its business operations. If any of the following risks occur, Moody’s business, financial condition, operating results and cash flows could be materially and adversely affected. These risk factors should be read in conjunction with the other information in this annual report on Form 10-K.
U.S. Laws and Regulations Affecting the Credit Rating Industry May Negatively Impact the Nature and Economics of the Company’s Business.
Moody’s operates in a highly regulated industry and is subject to extensive regulation by federal, state and local authorities in the U.S., including the Reform Act and the Financial Reform Act. These regulations are complex, continually evolving and have tended to become more stringent over time. See “Regulation” in Part 1, Item 1 of this annual report on Form 10-K for more information. These laws and regulations:
| » | seek to encourage, and may result in, increased competition among rating agencies and in the credit rating business; |
| » | may result in alternatives to credit ratings or changes in the pricing of credit ratings; |
| » | restrict the use of information in the development or maintenance of credit ratings; |
| » | increase regulatory oversight of the credit markets and CRA operations; |
| » | provide for direct jurisdiction of the SEC over CRAs that seek NRSRO status, and grant authority to the SEC to inspect the operations of CRAs; and |
| » | authorize the adoption of enhanced oversight standards and new pleading standards, which may result in increases in the number of legal proceedings claiming liability for losses suffered by investors on rated securities and aggregate legal defense costs. |
These laws and regulations, and any future rulemaking or court rulings, could result in reduced demand for credit ratings and increased costs, which Moody’s may be unable to pass through to customers. In addition, there may be uncertainty over the scope, interpretation and administration of such laws and regulations. The Company may be required to incur significant expenses in order to ensure compliance and mitigate the risk of fines, penalties or other sanctions. Legal proceedings could become increasingly lengthy and there may be uncertainty over and exposure to liability. It is difficult to accurately assess the future impact of legislative and regulatory requirements on Moody’s business and its customers’ businesses. For example, new laws and regulations may affect MIS’s communications with issuers as part of the rating assignment process, alter the manner in which MIS’s ratings are developed, assigned and communicated, affect the manner in which MIS or its customers or users of credit ratings operate, impact the demand for MIS’s ratings and alter the economics of the credit ratings business, including by restricting or mandating business models for rating agencies. Further, speculation concerning the impact of legislative and regulatory initiatives and the increased uncertainty over potential liability and adverse legal or judicial determinations may negatively affect Moody’s stock price. Although these legislative and regulatory initiatives apply to rating agencies and credit markets generally, they may affect Moody’s in a disproportionate manner. Each of these developments increase the costs and legal risk associated with the issuance of credit ratings and may have a material adverse effect on Moody’s operations, profitability and competitiveness, the demand for credit ratings and the manner in which such ratings are utilized.
Financial Reforms Outside the U.S. Affecting the Credit Rating Industry May Negatively Impact the Nature and Economics of the Company’s Business.
In addition to the extensive and evolving U.S. laws and regulations governing the industry, foreign jurisdictions have taken measures to increase regulation of rating agencies and the markets for ratings. In particular, the EU has adopted a common regulatory framework for rating agencies operating in the EU. As a result, ESMA has direct supervisory authority for CRAs in the EU and has the power to take enforcement action against non-compliant CRAs, including through the issuance of public notices, withdrawal of registration and, in some cases, the imposition of fines.
MIS is a registered entity and is therefore subject to formal regulation and periodic inspection in the EU. Applicable rules include procedural requirements with respect to ratings of sovereign issuers, liability for intentional or grossly negligent failure to abide by applicable regulations, mandatory rotation requirements of CRAs hired by issuers of securities for ratings of resecuritizations, and restrictions on CRAs or their shareholders if certain ownership thresholds are crossed. Additional procedural and substantive requirements include conditions for the issuance of credit ratings, rules regarding the organization of CRAs, restrictions on activities deemed to create a conflict of interest, including fees that are based on costs and are non-discriminatory, and special requirements for the rating of structured finance instruments. Compliance with the EU regulations may increase costs of operations and could have a significant negative effect on Moody’s operations, profitability or ability to compete, or the markets for its products and services, including in ways that Moody’s presently is unable to predict. In addition, exposure to increased liability under the EU regulations may further increase costs and legal risks associated with the issuance of credit ratings and materially and adversely impact Moody’s results of operations.
| 18 | MOODY’S 2017 10-K |
Table of Contents
The EU and other jurisdictions engage in rulemaking on an ongoing basis that could significantly impact operations or the markets for Moody’s products and services, including regulations extending to products and services not currently regulated and regulations affecting the need for debt securities to be rated, expansion of supervisory remit to include non-EU ratings used for regulatory purposes, increasing the level of competition in the market for credit ratings, establishing criteria for credit ratings or limiting the entities authorized to provide credit ratings. Moody’s cannot predict the extent of such future laws and regulations, and the effect that they will have on Moody’s business or the potential for increased exposure to liability could be significant. Financial reforms in the EU and other foreign jurisdictions may have a material adverse effect on Moody’s business, operating results and financial condition.
The Company Faces Exposure to Litigation and Government Regulatory Proceedings, Investigations and Inquiries Related to Rating Opinions and Other Business Practices.
Moody’s faces exposure to litigation and government and regulatory proceedings, investigations and inquiries related to MIS’s ratings actions, as well as other business practices and products. If the market value of credit-dependent instruments declines or defaults, whether as a result of difficult economic times, turbulent markets or otherwise, the number of investigations and legal proceedings that Moody’s faces could increase significantly. Parties who invest in securities rated by MIS may pursue claims against MIS or Moody’s for losses they face in their portfolios. Moody’s has faced numerous class action lawsuits and other litigation, government investigations and inquiries concerning events linked to the U.S. subprime residential mortgage sector and broader deterioration in the credit markets during the financial crisis of 2007-2008. Legal proceedings impose additional expenses on the Company and require the attention of senior management to an extent that may significantly reduce their ability to devote time addressing other business issues, and any of these proceedings, investigations or inquiries could ultimately result in adverse judgments, damages, fines, penalties or activity restrictions. Risks relating to legal proceedings may be heightened in foreign jurisdictions that lack the legal protections or liability standards comparable to those that exist in the U.S. In addition, new laws and regulations have been and may continue to be enacted that establish lower liability standards, shift the burden of proof or relax pleading requirements, thereby increasing the risk of successful litigations in the U.S. and in foreign jurisdictions. These litigation risks are often difficult to assess or quantify. Moody’s may not have adequate insurance or reserves to cover these risks, and the existence and magnitude of these risks often remains unknown for substantial periods of time. Furthermore, to the extent that Moody’s is unable to achieve dismissals at an early stage and litigation matters proceed to trial, the aggregate legal defense costs incurred by Moody’s increase substantially, as does the risk of an adverse outcome. Additionally, as litigation or the process to resolve pending matters progresses, Moody’s may change its accounting estimates, which could require Moody’s to record liabilities in the consolidated financial statements in future periods. See Note 19 to the consolidated financial statements for more information regarding ongoing investigations and civil litigation that the Company currently faces. Due to the number of these proceedings and the significant amount of damages sought, there is a risk that Moody’s will be subject to judgments, settlements, fines, penalties or other adverse results that could have a material adverse effect on its business, operating results and financial condition.
The Company is Exposed to Legal, Economic, Operational and Regulatory Risks of Operating in Multiple Jurisdictions.
Moody’s conducts operations in various countries outside the U.S. and derives a significant portion of its revenue from foreign sources. Changes in the economic condition of the various foreign economies in which the Company operates may have an impact on the Company’s business. For example, economic uncertainty in the Eurozone or elsewhere could affect the number of securities offerings undertaken within those particular areas. In addition, operations abroad expose Moody’s to a number of legal, economic and regulatory risks such as:
| » | exposure to exchange rate movements between foreign currencies and USD; |
| » | restrictions on the ability to convert local currency into USD and the costs, including the tax impact, of repatriating cash held by entities outside the U.S.; |
| » | U.S. laws affecting overseas operations including domestic and foreign export and import restrictions, tariffs and other trade barriers; |
| » | differing and potentially conflicting legal or civil liability, compliance and regulatory standards, including as a result of the U.K.’s referendum vote to withdraw from the EU, Brexit; |
| » | current and future regulations relating to the imposition of mandatory rotation requirements on CRAs hired by issuers of securities; |
| » | uncertain and evolving laws and regulations, including those applicable to the financial services industries, such as the European Union’s implementation of the Markets in Financial Instruments Directive II, MiFID II, in January 2018, and to the protection of intellectual property; |
| » | economic, political and geopolitical market conditions; |
| » | the possibility of nationalization, expropriation, price controls and other restrictive governmental actions; |
| MOODY’S 2017 10-K | 19 |
Table of Contents
| » | competition with local rating agencies that have greater familiarity, longer operating histories and/or support from local governments or other institutions; |
| » | uncertainties of obtaining data and creating products and services relevant to particular geographic markets; |
| » | reduced protection for intellectual property rights; |
| » | longer payment cycles and possible problems in collecting receivables; |
| » | differing accounting principles and standards; |
| » | difficulties in staffing and managing foreign operations; |
| » | difficulties and delays in translating documentation into foreign languages; and |
| » | potentially adverse tax consequences. |
Additionally, Moody’s is subject to complex U.S., foreign and other local laws and regulations that are applicable to its operations abroad, such as the Foreign Corrupt Practices Act of 1977, the U.K. Bribery Act of 2010 and other anti-bribery and anti-corruption laws. Although the Company has implemented internal controls, policies and procedures and employee training and compliance programs to deter prohibited practices, such measures may not be effective in preventing employees, contractors or agents from violating or circumventing such internal policies and violating applicable laws and regulations. Any determination that the Company has violated anti-bribery or anti-corruption laws could have a material adverse effect on Moody’s business, operating results and financial condition. Compliance with international and U.S. laws and regulations that apply to the Company’s international operations increases the cost of doing business in foreign jurisdictions. Violations of such laws and regulations may result in severe fines and penalties, criminal sanctions, administrative remedies, restrictions on business conduct and could have a material adverse effect on Moody’s reputation, its ability to attract and retain employees, its business, operating results and financial condition.
Moody’s Operations and Infrastructure May Malfunction or Fail.
Moody’s ability to conduct business may be materially and adversely impacted by a disruption in the infrastructure that supports its businesses and the communities in which Moody’s is located, including New York City, the location of Moody’s headquarters, major cities worldwide in which Moody’s has offices, and locations in China used for certain Moody’s back office work. This may include a disruption involving physical or technological infrastructure (whether or not controlled by the Company), including the Company’s electronic delivery systems, data center facilities, or the Internet, used by the Company or third parties with or through whom Moody’s conducts business. Many of the Company’s products and services are delivered electronically and the Company’s customers depend on the Company’s ability to receive, store, process, transmit and otherwise rapidly handle very substantial quantities of data and transactions on computer-based networks. The Company’s customers also depend on the continued capacity, reliability and security of the Company’s telecommunications, data centers, networks and other electronic delivery systems, including its websites and connections to the Internet. The Company’s employees also depend on these systems for internal use. Any significant failure, compromise, cyber-breach, interruption or a significant slowdown of operations of the Company’s infrastructure, whether due to human error, capacity constraints, hardware failure or defect, natural disasters, fire, power loss, telecommunication failures, break-ins, sabotage, intentional acts of vandalism, acts of terrorism, political unrest, war or otherwise, may impair the Company’s ability to deliver its products and services.
Moody’s efforts to secure and plan for potential disruptions of its major operating systems may not be successful. The Company relies on third-party providers to provide certain essential services. While the Company believes that such providers are reliable, the Company has limited control over the performance of such providers. To the extent any of the Company’s third-party providers ceases to provide these services in an efficient, cost-effective manner or fails to adequately expand its services to meet the Company’s needs and the needs of the Company’s customers, the Company could experience lower revenues and higher costs. Additionally, although the Company maintains processes to prevent, detect and recover from a disruption, the Company also does not have fully redundant systems for most of its smaller office locations and low-risk systems, and its disaster recovery plan does not include restoration of non-essential services. If a disruption occurs in one of Moody’s locations or systems and its personnel in those locations or those who rely on such systems are unable to utilize other systems or communicate with or travel to other locations, such persons’ ability to service and interact with Moody’s customers may suffer. The Company cannot predict with certainty all of the adverse effects that could result from the Company’s failure, or the failure of a third party, to efficiently address and resolve these delays and interruptions. A disruption to Moody’s operations or infrastructure may have a material adverse effect on its reputation, business, operating results and financial condition.
The Company is Exposed to Risks Related to Cybersecurity and Protection of Confidential Information.
The Company’s operations rely on the secure processing, storage and transmission of confidential, sensitive, proprietary and other types of information relating to its business operations and confidential and sensitive information about its customers and employees in the
| 20 | MOODY’S 2017 10-K |
Table of Contents
Company’s computer systems and networks, and in those of its third party vendors. The cyber risks the Company faces range from cyber-attacks common to most industries, to more advanced threats that target the Company because of its prominence in the global marketplace, or due to its ratings of sovereign debt. Breaches of Moody’s or Moody’s vendors’ technology and systems, whether from circumvention of security systems, denial-of-service attacks or other cyber-attacks, hacking, “phishing” attacks, computer viruses, ransomware, or malware, employee or insider error, malfeasance, social engineering, physical breaches or other actions, may result in manipulation or corruption of sensitive data, material interruptions or malfunctions in the Company’s or such vendors’ web sites, applications, data processing, or disruption of other business operations, or may compromise the confidentiality and integrity of material information held by the Company (including information about Moody’s business, employees or customers), as well as sensitive personally identifiable information (“PII”), the disclosure of which could lead to identity theft. Measures that Moody’s takes to avoid, detect, mitigate or recover from material incidents can be expensive, and may be insufficient, circumvented, or may become ineffective. To conduct its operations, the Company regularly moves data across national borders, and consequently is subject to a variety of continuously evolving and developing laws and regulations in the United States and abroad regarding privacy, data protection and data security. The scope of the laws that may be applicable to Moody’s is often uncertain and may be conflicting, particularly with respect to foreign laws. For example, the European Union’s General Data Protection Regulation (“GDPR”), which greatly increases the jurisdictional reach of European Union law and adds a broad array of requirements for handling personal data, including the public disclosure of significant data breaches, becomes effective in May 2018. Additionally, other countries have enacted or are enacting data localization laws that require data to stay within their borders. All of these evolving compliance and operational requirements impose significant costs that are likely to increase over time.
The Company has invested and continues to invest in risk management and information security measures in order to protect its systems and data, including employee training, disaster plans, and technical defenses, in order to protect its systems and data. The cost and operational consequences of implementing, maintaining and enhancing further data or system protection measures could increase significantly to overcome increasingly intense, complex, and sophisticated global cyber threats. Despite the Company’s best efforts, it is not fully insulated from data breaches and system disruptions. Recent well-publicized security breaches at other companies have led to enhanced government and regulatory scrutiny of the measures taken by companies to protect against cyber-attacks, and may in the future result in heightened cybersecurity requirements, including additional regulatory expectations for oversight of vendors and service providers. Any material breaches of cybersecurity or media reports of perceived security vulnerabilities to the Company’s systems or those of the Company’s third parties, even if no breach has been attempted or occurred, could cause the Company to experience reputational harm, loss of customers and revenue, regulatory actions and scrutiny, sanctions or other statutory penalties, litigation, liability for failure to safeguard the Company’s customers’ information, or financial losses that are either not insured against or not fully covered through any insurance maintained by the Company. Any of the foregoing may have a material adverse effect on Moody’s business, operating results and financial condition.
Changes in the Volume of Debt Securities Issued in Domestic and/or Global Capital Markets, Asset Levels and Flows into Investment Levels and Changes in Interest Rates and Other Volatility in the Financial Markets May Negatively Impact the Nature and Economics of the Company’s Business.
Moody’s business is impacted by general economic conditions and volatility in the U.S. and world financial markets. Furthermore, issuers of debt securities may elect to issue securities without ratings or securities which are rated or evaluated by non-traditional parties such as financial advisors, rather than traditional CRAs, such as MIS. A majority of Moody’s credit-rating-based revenue is transaction-based, and therefore it is especially dependent on the number and dollar volume of debt securities issued in the capital markets. Market disruptions and economic slowdown and uncertainty have in the past negatively impacted the volume of debt securities issued in global capital markets and the demand for credit ratings. The Tax Act, in addition to other changes to U.S. tax laws and policy, could negatively affect the volume of debt securities issued in the U.S. For example, the Tax Act will limit deductibility on interest payments and significantly reduce the tax cost associated with the repatriation of cash held outside the U.S., both of which could negatively affect the volume of debt securities issued. Conditions that reduce issuers’ ability or willingness to issue debt securities, such as market volatility, declining growth, currency devaluations or other adverse economic trends, reduce the number and dollar-equivalent volume of debt issuances for which Moody’s provides ratings services and thereby adversely affect the fees Moody’s earns in its ratings business.
Economic and government factors such as a long-term continuation of difficult economic conditions or a re-emergence of the sovereign debt crisis in Europe may have an adverse impact on the Company’s business. Future debt issuances also could be negatively affected by increases in interest rates, widening credit spreads, regulatory and political developments, growth in the use of alternative sources of credit, and defaults by significant issuers. Declines or other changes in the markets for debt securities may materially and adversely affect the Company’s business, operating results and financial condition.
Moody’s initiatives to reduce costs to counteract a decline in its business may not be sufficient and cost reductions may be difficult or impossible to obtain in the short term, due in part to rent, technology, compliance and other fixed costs associated with some of the Company’s operations as well as the need to monitor outstanding ratings. Further, cost-reduction initiatives, including those under-
| MOODY’S 2017 10-K | 21 |
Table of Contents
taken to date, could make it difficult for the Company to rapidly expand operations in order to accommodate any unexpected increase in the demand for ratings. Volatility in the financial markets, including changes in the volumes of debt securities and changes in interest rates, may have a material adverse effect on the business, operating results and financial condition, which the Company may not be able to successfully offset with cost reductions.
The Company Faces Increased Pricing Pressure from Competitors and/or Customers.
There is price competition in the credit rating, research, credit risk management markets, research and analytical services and financial training and certification services. Moody’s faces competition globally from other CRAs and from investment banks and brokerage firms that offer credit opinions in research, as well as from in-house research operations. Competition for customers and market share has spurred more aggressive tactics by some competitors in areas such as pricing and services, as well as increased competition from non-NRSROs that evaluate debt risk for issuers or investors. At the same time, a challenging business environment and consolidation among customers, particularly those involved in structured finance products, and other factors affecting demand may enhance the market power of competitors and reduce the Company’s customer base. Weak economic growth intensifies competitive pricing pressures and can result in customers’ use of free or lower-cost information that is available from alternative sources. While Moody’s seeks to compete primarily on the basis of the quality of its products and services, it may lose market share if its pricing is not sufficiently competitive. In addition, the Reform Act was designed to encourage competition among rating agencies. The formation of additional NRSROs may increase pricing and competitive pressures. Furthermore, in some of the countries in which Moody’s operates, governments may provide financial or other support to local rating agencies. Any inability of Moody’s to compete successfully with respect to the pricing of its products and services could have a material adverse impact on its business, operating results and financial condition.
The Company is Exposed to Reputation and Credibility Concerns.
Moody’s reputation and the strength of its brand are key competitive strengths. To the extent that the rating agency business as a whole or Moody’s, relative to its competitors, suffers a loss in credibility, Moody’s business could be significantly impacted. Factors that may have already affected credibility and could potentially continue to have an impact in this regard include the appearance of a conflict of interest, the performance of securities relative to the rating assigned to such securities, the timing and nature of changes in ratings, a major compliance failure, negative perceptions or publicity and increased criticism by users of ratings, regulators and legislative bodies, including as to the ratings process and its implementation with respect to one or more securities and intentional or unintentional misrepresentations of Moody’s products and services in advertising materials, public relations information, social media or other external communications. Operational errors, whether by Moody’s or a Moody’s competitor, could also harm the reputation of the Company or the credit rating industry. Damage to reputation and credibility could have a material adverse impact on Moody’s business, operating results and financial condition, as well as on the Company’s ability to find suitable candidates for acquisition.
The Introduction of Competing Products or Technologies by Other Companies May Negatively Impact the Nature and Economics of the Company’s Business.
The markets for credit ratings, research, credit risk management services, research and analytical services and financial training and certification services are highly competitive and characterized by rapid technological change, changes in customer demands, and evolving regulatory requirements, industry standards and market preferences. The ability to develop and successfully launch and maintain innovative products and technologies that anticipate customers’ changing requirements and utilize emerging technological trends is a key factor in maintaining market share. Moody’s competitors include both established companies with significant financial resources, brand recognition, market experience and technological expertise, and smaller companies which may be better poised to quickly adopt new or emerging technologies or respond to customer requirements. Competitors may develop quantitative methodologies or related services for assessing credit risk that customers and market participants may deem preferable, more cost-effective or more valuable than the credit risk assessment methods currently employed by Moody’s, or may position, price or market their products in manners that differ from those utilized by Moody’s. Moody’s also competes indirectly against consulting firms and technology and information providers; these indirect competitors could in the future choose to compete directly with Moody’s, cease doing business with Moody’s or change the terms under which it does business with Moody’s in a way that could negatively impact our business. In addition, customers or others may develop alternative, proprietary systems for assessing credit risk. Such developments could affect demand for Moody’s products and services and its growth prospects. Further, the increased availability in recent years of free or relatively inexpensive Internet information may reduce the demand for Moody’s products and services. For example, in December 2016, ESMA launched a database providing access to free, current information on certain credit ratings and rating outlooks. Moody’s growth prospects also could be adversely affected by Moody’s failure to make necessary or optimal capital infrastructure expenditures and improvements and the inability of its information technologies to provide adequate capacity and capabilities to meet increased demands of producing quality ratings and research products at levels achieved by competitors. Any inability of Moody to compete successfully may have a material adverse effect on its business, operating results and financial condition.
Possible Loss of Key Employees and Related Compensation Cost Pressures May Negatively Impact the Company.
Moody’s success depends upon its ability to recruit, retain and motivate highly skilled, experienced financial analysts and other professionals. Competition for skilled individuals in the financial services industry is intense, and Moody’s ability to attract high quality
| 22 | MOODY’S 2017 10-K |
Table of Contents
employees could be impaired if it is unable to offer competitive compensation and other incentives or if the regulatory environment mandates restrictions on or disclosures about individual employees that would not be necessary in competing industries. As greater focus has been placed on executive compensation at public companies, in the future, Moody’s may be required to alter its compensation practices in ways that could adversely affect its ability to attract and retain talented employees. Investment banks, investors and competitors may seek to attract analyst talent by providing more favorable working conditions or offering significantly more attractive compensation packages than Moody’s. Moody’s also may not be able to identify and hire the appropriate qualified employees in some markets outside the U.S. with the required experience or skills to perform sophisticated credit analysis. There is a risk that even if the Company invests significant resources in attempting to attract, train and retain qualified personnel, it will not succeed in its efforts, and its business could be harmed.
Moody’s is highly dependent on the continued services of Raymond W. McDaniel, Jr., the President and Chief Executive Officer, and other senior officers and key employees. The loss of the services of skilled personnel for any reason and Moody’s inability to replace them with suitable candidates quickly or at all, as well as any negative market perception resulting from such loss, could have a material adverse effect on Moody’s business, operating results and financial condition.
Moody’s Acquisitions, Dispositions and Other Strategic Transactions or Internal Technology Investments May Not Produce Anticipated Results Exposing the Company to Future Significant Impairment Charges Relating to its Goodwill, Intangible Assets or Property and Equipment.
Moody’s has entered into and expects to continue to enter into acquisition, disposition or other strategic transactions and expects to make various investments to strengthen its business and grow the Company. Such transactions as well as internal technology investments present significant challenges and risks. The market for acquisition targets, dispositions and other strategic transactions is highly competitive, especially in light of industry consolidation, which may affect Moody’s ability to complete such transactions. If Moody’s is unsuccessful in completing such transactions or if opportunities for expansion do not arise, its business, operating results and financial condition could be materially adversely affected. Additionally, we make significant investments in technology including software developed for internal-use which is time-intensive and complex to implement. Such investments may not be successful or may not result in the anticipated benefits resulting in asset write-offs.
In August 2017, Moody’s acquired Bureau van Dijk for $3,542.0 million. The anticipated growth, synergies and other strategic objectives of the Bureau van Dijk acquisition, as well as other completed transactions, may not be fully realized, and a variety of factors may adversely affect any anticipated benefits from such transactions. Any strategic transaction can involve a number of risks, including unanticipated challenges regarding integration of operations, technologies and new employees; the existence of liabilities or contingencies not disclosed to or otherwise known by the Company prior to closing a transaction; unexpected regulatory and operating difficulties and expenditures; scrutiny from competition and antitrust authorities; failure to retain key personnel of the acquired business; future developments may impair the value of purchased goodwill or intangible assets; diverting management’s focus from other business operations; failing to implement or remediate controls, procedures and policies appropriate for a larger public company at acquired companies that prior to the acquisition lacked such controls, procedures and policies; challenges retaining the customers of the acquired business; and for foreign transactions, additional risks related to the integration of operations across different cultures and languages, and the economic, political, and regulatory risks associated with specific countries. The anticipated benefits from an acquisition or other strategic transaction may not be realized fully, or may take longer to realize than expected. As a result, the failure of acquisitions, dispositions and other strategic transactions to perform as expected may have a material adverse effect on Moody’s business, operating results and financial condition.
At December 31, 2017, Moody’s had $3,753.2 million of goodwill and $1,631.6 million of intangible assets on its balance sheet, both of which increased significantly due to the acquisition of Bureau van Dijk. Approximately 92% of the goodwill and intangible assets reside in the MA business, including those related to Bureau van Dijk, and are allocated to the five reporting units within MA: RD&A; ERS; Financial Services Training and Certifications; Moody’s Analytics Knowledge Services; and Bureau van Dijk. The remaining 8% of goodwill and intangible assets reside in MIS and primarily relate to ICRA. Failure to achieve business objectives and financial projections in any of these reporting units could result in a significant asset impairment charge, which would result in a non-cash charge to operating expenses. Goodwill and intangible assets are tested for impairment on an annual basis and also when events or changes in circumstances indicate that impairment may have occurred. Determining whether an impairment of goodwill exists can be especially difficult in periods of market or economic uncertainty and turmoil, and requires significant management estimates and judgment. In addition, the potential for goodwill impairment is increased during periods of economic uncertainty. An asset impairment charge could have a material adverse effect on Moody’s business, operating results and financial condition.
The Company’s Compliance and Risk Management Programs May Not be Effective and May Result in Outcomes That Could Adversely Affect the Company’s Reputation, Financial Condition and Operating Results.
Moody’s operates in a number of countries, and as a result the Company is required to comply and quickly adapt with numerous international and U.S. federal, state and local laws and regulations. The Company’s ability to comply with applicable laws and regulations,
| MOODY’S 2017 10-K | 23 |
Table of Contents
including anti-corruption laws, is largely dependent on its establishment and maintenance of compliance, review and reporting systems, as well as its ability to attract and retain qualified compliance and risk management personnel. Moody’s policies and procedures to identify, evaluate and manage the Company’s risks, including risks resulting from acquisitions, may not be fully effective, and Moody’s employees or agents may engage in misconduct, fraud or other errors. It is not always possible to deter such errors, and the precautions the Company takes to prevent and detect this activity may not be effective in all cases. If Moody’s employees violate its policies or if the Company’s risk management methods are not effective, the Company could be subject to criminal and civil liability, the suspension of the Company’s employees, fines, penalties, regulatory sanctions, injunctive relief, exclusion from certain markets or other penalties, and may suffer harm to its reputation, financial condition and operating results.
Legal Protections for the Company’s Intellectual Property Rights may not be Sufficient or Available to Protect the Company’s Competitive Advantages.
Moody’s considers many aspects of its products and services to be proprietary. Failure to protect the Company’s intellectual property adequately could harm its reputation and affect the Company’s ability to compete effectively. Businesses the Company acquires also involve intellectual property portfolios, which increase the challenges the Company faces in protecting its strategic advantage. In addition, the Company’s operating results may be adversely affected by inadequate or changing legal and technological protections for intellectual property and proprietary rights in some jurisdictions and markets. On January 6, 2015, a rule with direct relevance to the CRA industry was published in the Official Journal of the European Union regarding the types of information that CRAs are to provide about certain ratings (those that were paid for by issuers) for publication on a central website administered by ESMA (the European Ratings Platform). This rule directly relates to the Company’s intellectual property as it requires that the Company provide proprietary information at no cost that the Company currently sells, which could result in lost revenue. ESMA launched the European Rating Platform for public use on December 1, 2016.
Unauthorized third parties may also try to obtain and use technology or other information that the Company regards as proprietary. It is also possible that Moody’s competitors or other entities could obtain patents related to the types of products and services that Moody’s offers, and attempt to require Moody’s to stop developing or marketing the products or services, to modify or redesign the products or services to avoid infringing, or to obtain licenses from the holders of the patents in order to continue developing and marketing the products and services. Even if Moody’s attempts to assert or protect its intellectual property rights through litigation, it may require considerable cost, time and resources to do so, and there is no guarantee that the Company will be successful. These risks, and the cost, time and resources needed to address them, may increase as the Company’s business grows and its profile rises in countries with intellectual property regimes that are less protective than the rules and regulations applied in the United States.
The Company is Dependent on the Use of Third-Party Software, Data, Hosted Solutions, Data Centers, Cloud and Network Infrastructure (Together, “Third Party Technology”), and Any Reduction in Third-Party Product Quality or Service Offerings, Could Have a Material Adverse Effect on the Company’s Business, Financial Condition or Results of Operations.
Moody’s relies on Third Party Technology in connection with its product development and offerings and operations. The Company depends on the ability of Third Party Technology providers to deliver and support reliable products, enhance their current products, develop new products on a timely and cost-effective basis, and respond to emerging industry standards and other technological changes. The Third Party Technology Moody’s uses may become obsolete, incompatible with future versions of the Company’s products, unavailable or fail to operate effectively, and Moody’s business could be adversely affected if the Company is unable to timely or effectively replace such Third Party Technology. The Company also monitors its use of Third Party Technology to comply with applicable license and other contractual requirements. Despite the Company’s efforts, the Company cannot ensure that such third parties will permit Moody’s use in the future, resulting in increased Third Party Technology acquisition costs and loss of rights. In addition, the Company’s operating costs could increase if license or other usage fees for Third Party Technology increase or the efforts to incorporate enhancements to Third Party Technology are substantial. Some of these third-party suppliers are also Moody’s competitors, increasing the risks noted above. If any of these risks materialize, they could have a material adverse effect on the Company’s business, financial condition or results of operations.
Changes in Tax Rates or Tax Rules Could Affect Future Results.
As a global company, Moody’s is subject to taxation in the United States and various other countries and jurisdictions. As a result, our effective tax rate is determined based on the pre-tax income and applicable tax rates in the various jurisdictions in which we operate. Moody’s future tax rates could be affected by changes in the composition of earnings in countries or states with differing tax rates or other factors, including by increased earnings in jurisdictions where Moody’s faces higher tax rates, losses incurred in jurisdictions for which Moody’s is not able to realize the related tax benefit, or changes in foreign currency exchange rates. Changes in the tax, accounting and other laws, treaties, regulations, policies and administrative practices, or changes to their interpretation or enforcement, including changes applicable to multinational corporations such as the Base Erosion Profit Shifting project being conducted by the Organization for Economic Co-operation and Development and the European Union’s state aid rulings, could have a material adverse effect on the Company’s effective tax rate, results of operations and financial condition. The Tax Act made significant changes to the U.S. federal tax laws. Many aspects of the new legislation are currently uncertain or unclear and may not be clarified for some time. As
| 24 | MOODY’S 2017 10-K |
Table of Contents
additional regulatory guidance is issued interpreting or clarifying the Tax Act or if the tax accounting rules are modified, there may be adjustments or changes to our estimate of the mandatory one-time deemed repatriation tax liability (“transition tax”) on previously untaxed accumulated earnings of foreign subsidiaries recorded in 2017. Additional regulatory guidance may also affect our expected future effective tax rates and tax assets and liabilities which could have a material adverse effect on Moody’s business, results of operations, cash flows and financial condition. Furthermore, the Tax Act may impact the volume of debt securities issued as discussed in the Risk Factor, Changes in the Volume of Debt Securities Issued in Domestic and/or Global Capital Markets, Asset Levels and Flows into Investment Levels and Changes in Interest Rates and Other Volatility in the Financial Markets May Negatively Impact the Nature and Economics of the Company’s Business.
In addition, Moody’s is subject to regular examination of its income tax returns by the Internal Revenue Service and other tax authorities, and the Company is experiencing increased scrutiny as its business grows. Moody’s regularly assesses the likelihood of favorable or unfavorable outcomes resulting from these examinations to determine the adequacy of its provision for income taxes, including unrecognized tax benefits; however, developments in an audit or litigation could materially and adversely affect the Company. Although the Company believes its tax estimates and accruals are reasonable, there can be no assurance that any final determination will not be materially different than the treatment reflected in its historical income tax provisions, accruals and unrecognized tax benefits, which could materially and adversely affect the Company’s business, operating results, cash flows and financial condition.
| ITEM 1B. | UNRESOLVED STAFF COMMENTS |
None.
| ITEM 2. | PROPERTIES |
Moody’s corporate headquarters is located at 7 World Trade Center at 250 Greenwich Street, New York, New York 10007, with approximately 797,537 square feet of leased space. As of December 31, 2017, Moody’s operations were conducted from 17 U.S. offices and 114 non-U.S. office locations, all of which are leased. These properties are geographically distributed to meet operating and sales requirements worldwide. These properties are generally considered to be both suitable and adequate to meet current operating requirements.
| ITEM 3. | LEGAL PROCEEDINGS |
For information regarding legal proceedings, see Part II, Item 8 –“Financial Statements”, Note 19 “Contingencies” in this Form 10-K.
| ITEM 4. | MINE SAFETY DISCLOSURES |
Not applicable.
| MOODY’S 2017 10-K | 25 |
Table of Contents
PART II
| ITEM 5. | MARKET FOR THE REGISTRANT’S COMMON EQUITY, RELATED SHAREHOLDER MATTERS AND ISSUER PURCHASES OF EQUITY SECURITIES |
Information in response to this Item is set forth under the captions below.
MOODY’S PURCHASES OF EQUITY SECURITIES
For the three months ended December 31, 2017
| Period |
Total Number of Shares Purchased (1) |
Average Price Paid per Share |
Total Number of Shares Purchased as Part of Publicly Announced Program |
Approximate Dollar Value of Shares That May yet be Purchased Under the Program (2) |
||||||||||||
| October 1 – 31 | 69,062 | $ | 143.01 | 68,249 | $ | 553.4 million | ||||||||||
| November 1 – 30 | 78,562 | $ | 145.80 | 78,186 | $ | 542.0 million | ||||||||||
| December 1 – 31 | 101,898 | $ | 150.31 | 99,769 | $ | 527.0 million | ||||||||||
|
|
|
|
|
|||||||||||||
| Total | 249,522 | $ | 146.84 | 246,204 | ||||||||||||
|
|
|
|
|
|||||||||||||
| (1) | Includes surrender to the Company of 813, 376 and 2,129 shares of common stock in October, November and December, respectively, to satisfy tax withholding obligations in connection with the vesting of restricted stock issued to employees. |
| (2) | As of the last day of each of the months. On December 15, 2015, the Board authorized a $1 billion share repurchase program. There is no established expiration date for the remaining authorization. |
During the fourth quarter of 2017, Moody’s issued 0.1 million shares under employee stock-based compensation plans.
COMMON STOCK INFORMATION AND DIVIDENDS
The Company’s common stock trades on the New York Stock Exchange under the symbol “MCO”. The table below indicates the high and low sales price of the Company’s common stock and the dividends declared and paid for the periods shown. The number of registered shareholders of record at January 31, 2018 was 2,020. A substantially greater number of the Company’s common stock is held by beneficial holders whose shares are held of record by banks, brokers and other financial institutions.
| Price Per Share | Dividends Per Share | |||||||||||||||
| High | Low | Declared | Paid | |||||||||||||
| 2017: | ||||||||||||||||
| First quarter | $ | 114.03 | $ | 93.51 | $ | — | $ | 0.38 | ||||||||
| Second quarter | $ | 122.99 | $ | 110.82 | 0.38 | 0.38 | ||||||||||
| Third quarter | $ | 139.94 | $ | 121.53 | 0.38 | 0.38 | ||||||||||
| Fourth quarter | $ | 153.86 | $ | 139.33 | 0.38 | 0.38 | ||||||||||
|
|
|
|
|
|||||||||||||
| Year ended December 31, 2017 | $ | 1.14 | $ | 1.52 | ||||||||||||
|
|
|
|
|
|||||||||||||
| 2016: | ||||||||||||||||
| First quarter | $ | 99.09 | $ | 77.76 | $ | — | $ | 0.37 | ||||||||
| Second quarter | $ | 101.70 | $ | 87.30 | 0.37 | 0.37 | ||||||||||
| Third quarter | $ | 110.83 | $ | 90.98 | 0.37 | 0.37 | ||||||||||
| Fourth quarter | $ | 110.00 | $ | 93.85 | 0.75 | 0.37 | ||||||||||
|
|
|
|
|
|||||||||||||
| Year Ended December 31, 2016 | $ | 1.49 | $ | 1.48 | ||||||||||||
|
|
|
|
|
|||||||||||||
| 26 | MOODY’S 2017 10-K |
Table of Contents
EQUITY COMPENSATION PLAN INFORMATION
The table below sets forth, as of December 31, 2017, certain information regarding the Company’s equity compensation plans.
| Number of Securities to be Issued Upon Exercise of Outstanding Options, Warrants and Rights |
Weighted-Average Exercise Price of Outstanding Options, Warrants and Rights (2) |
Number of Securities Remaining Available for Future Issuance Under Equity Compensation Plans (excluding Securities Reflected in Column (a)) |
||||||||||
| Plan Category |
(a) | (b) | (c) | |||||||||
| Equity compensation plans approved by security holders | 6,499,733 | (1) | $ | 57.48 | 20,026,669 | (3) | ||||||
| Equity compensation plans not approved by security holders | — | $ | — | — | ||||||||
|
|
|
|
|
|||||||||
| Total |
6,499,733 | $ | 49.68 | 20,026,669 | ||||||||
|
|
|
|
|
|||||||||
| (1) | Includes 5,216,663 options and unvested restricted shares outstanding under the Company’s 2001 Key Employees’ Stock Incentive Plan, 12,100 options outstanding under the Company’s 1998 Key Employees’ Stock Incentive Plan, and 12,761 unvested restricted shares outstanding under the 1998 Non-Employee Directors’ Stock Incentive Plan. This number also includes a maximum of 1,258,209 performance shares outstanding under the Company’s 2001 Key Employees’ Stock Incentive Plan, which is the maximum number of shares issuable pursuant to performance share awards assuming the maximum payout at 225% of the target award for performance shares granted in 2015, 2016 and 2017. Assuming payout at target, the number of shares to be issued upon the vesting of outstanding performance share awards is 559,204. |
| (2) | Does not reflect unvested restricted shares or performance share awards included in column (a) because these awards have no exercise price. |
| (3) | Includes 16,324,164 shares available for issuance as under the 2001 Stock Incentive Plan, of which all may be issued as options and 9,843,708 may be issued as restricted stock, performance shares or other stock-based awards under the 2001 Stock Incentive Plan and 914,711 shares available for issuance as options, shares of restricted stock or performance shares under the 1998 Directors Plan, and 2,787,794 shares available for issuance under the Company’s Employee Stock Purchase Plan. No new grants may be made under the 1998 Stock Incentive Plan, which expired by its terms in June 2008. |
| MOODY’S 2017 10-K | 27 |
Table of Contents
The following graph compares the total cumulative shareholder return of the Company to the performance of Standard & Poor’s Stock 500 Composite Index and the Russell 3000 Financial Services Index. Both of the aforementioned indexes are easily accessible to the Company’s shareholders in newspapers, the internet and other readily available sources for purposes of the following graph.
The comparison assumes that $100.00 was invested in the Company’s common stock and in each of the foregoing indices on December 31, 2012. The comparison also assumes the reinvestment of dividends, if any. The total return for the common stock was 214% during the performance period as compared with a total return during the same period of 196% for the Russell 3000 Financial Services Index and 108% for the S&P 500 Composite Index.
Comparison of Cumulative Total Return
Moody’s Corporation, Russell 3000 Financial Services Index and S&P 500 Composite Index
COMPARISON OF 5 YEAR CUMULATIVE TOTAL RETURN*
Among Moody’s Corporation, the S&P 500 Index
and the Russell 3000 Financial Services Index
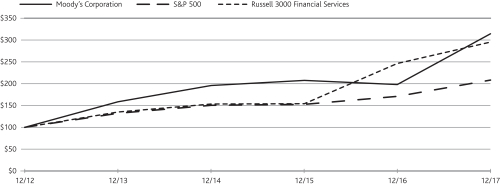
| Year Ended December 31, | ||||||||||||||||||||||||
| 2012 | 2013 | 2014 | 2015 | 2016 | 2017 | |||||||||||||||||||
| Moody’s Corporation | $ | 100.00 | $ | 158.22 | $ | 195.66 | $ | 207.57 | $ | 198.05 | $ | 313.93 | ||||||||||||
| S&P 500 Composite Index | $ | 100.00 | $ | 132.39 | $ | 150.51 | $ | 152.59 | $ | 170.84 | $ | 208.14 | ||||||||||||
| Russell 3000—Financial Services Index | $ | 100.00 | $ | 134.63 | $ | 153.55 | $ | 154.32 | $ | 246.42 | $ | 295.57 | ||||||||||||
The comparisons in the graph above are provided in response to disclosure requirements of the SEC and are not intended to forecast or be indicative of future performance of the Company’s common stock.
| 28 | MOODY’S 2017 10-K |
Table of Contents
| ITEM 6. | SELECTED FINANCIAL DATA |
The Company’s selected consolidated financial data should be read in conjunction with Item 7. “MD&A” and the Moody’s Corporation consolidated financial statements and notes thereto.
| Year Ended December 31, | ||||||||||||||||||||
| amounts in millions, except per share data |
2017 | 2016 | 2015 | 2014 | 2013 | |||||||||||||||
| Results of operations | ||||||||||||||||||||
| Revenue | $ | 4,204.1 | $ | 3,604.2 | $ | 3,484.5 | $ | 3,334.3 | $ | 2,972.5 | ||||||||||
| Expenses | ||||||||||||||||||||
| Operating and SG&A expenses |
2,214.2 | 1,963.0 | 1,897.6 | 1,799.6 | 1,644.5 | |||||||||||||||
| Depreciation and amortization |
158.3 | 126.7 | 113.5 | 95.6 | 93.4 | |||||||||||||||
| Acquisition-Related Expenses |
22.5 | — | — | — | — | |||||||||||||||
| Settlement Charge |
— | 863.8 | — | — | — | |||||||||||||||
| Restructuring |
— | 12.0 | — | — | — | |||||||||||||||
|
|
|
|
|
|
|
|
|
|
|
|||||||||||
| Total Expenses | 2,395.0 | 2,965.5 | 2,011.1 | 1,895.2 | 1,737.9 | |||||||||||||||
|
|
|
|
|
|
|
|
|
|
|
|||||||||||
| Operating income (1) | 1,809.1 | 638.7 | 1,473.4 | 1,439.1 | 1,234.6 | |||||||||||||||
| Non-operating (expense) income, net (4) |
(22.3 | ) | (80.7 | ) | (93.8 | ) | 21.9 | (65.3 | ) | |||||||||||
|
|
|
|
|
|
|
|
|
|
|
|||||||||||
| Income before provision for income taxes (1) | 1,786.8 | 558.0 | 1,379.6 | 1,461.0 | 1,169.3 | |||||||||||||||
| Provision for income taxes (3) |
779.1 | 282.2 | 430.0 | 455.0 | 353.4 | |||||||||||||||
|
|
|
|
|
|
|
|
|
|
|
|||||||||||
| Net income (1) | 1,007.7 | 275.8 | 949.6 | 1,006.0 | 815.9 | |||||||||||||||
| Less: Net income attributable to noncontrolling interests |
7.1 | 9.2 | 8.3 | 17.3 | 11.4 | |||||||||||||||
|
|
|
|
|
|
|
|
|
|
|
|||||||||||
| Net income attributable to Moody’s (1)(5) | $ | 1,000.6 | $ | 266.6 | $ | 941.3 | $ | 988.7 | $ | 804.5 | ||||||||||
|
|
|
|
|
|
|
|
|
|
|
|||||||||||
| Earnings per share | ||||||||||||||||||||
| Basic (1) |
$ | 5.24 | $ | 1.38 | $ | 4.70 | $ | 4.69 | $ | 3.67 | ||||||||||
| Diluted (1) |
$ | 5.15 | $ | 1.36 | $ | 4.63 | $ | 4.61 | $ | 3.60 | ||||||||||
| Weighted average shares outstanding | ||||||||||||||||||||
| Basic |
191.1 | 192.7 | 200.1 | 210.7 | 219.4 | |||||||||||||||
| Diluted |
194.2 | 195.4 | 203.4 | 214.7 | 223.5 | |||||||||||||||
| Dividends declared per share | $ | 1.14 | $ | 1.49 | $ | 1.39 | $ | 1.18 | $ | 0.98 | ||||||||||
| Operating margin (1) | 43.0 | % | 17.7 | % | 42.3 | % | 43.2 | % | 41.5 | % | ||||||||||
| Operating Cash Flow (2) | $ | 747.5 | $ | 1,259.2 | $ | 1,198.1 | $ | 1,077.3 | $ | 965.6 | ||||||||||
|
December 31, |
||||||||||||||||||||
| 2017 | 2016 | 2015 | 2014 | 2013 | ||||||||||||||||
| Balance sheet data | ||||||||||||||||||||
| Total assets | $ | 8,594.2 | $ | 5,327.3 | $ | 5,103.0 | $ | 4,653.8 | $ | 4,384.6 | ||||||||||
| Long-term debt (6) | $ | 5,111.1 | $ | 3,063.0 | $ | 3,380.6 | $ | 2,532.1 | $ | 2,091.3 | ||||||||||
| Total shareholders’ (deficit) equity | $ | (114.9 | ) | $ | (1,027.3 | ) | $ | (333.0 | ) | $ | 42.9 | $ | 347.9 | |||||||
| (1) | The significant change in 2016 and 2017 is primarily driven by the $863.8 million Settlement Charge ($700.7 million, net of tax, or $3.59 per diluted share) in 2016. |
| (2) | The decline in operating cash flow in 2017 is primarily due to payments made relating to the Settlement Charge. Additionally, in the first quarter of 2017, the Company adopted ASU No. 2016-09 “Improvements to Employee Share-Based Payment Accounting”. As required by ASU 2016-09, Excess Tax Benefits or shortfalls relating to employee stock-based compensation are reflected in operating cash flow and the Company has applied this provision on a retrospective basis. Under previous accounting guidance, Excess Tax Benefits or shortfalls were shown as a reduction to operating cash flow and an increase to financing cash flow. |
| (3) | Provision for income taxes in the year ended December 31, 2017 includes a net charge of $245.6 million related to the impact of U.S. tax reform and a statutory tax rate reduction in Belgium as more fully discussed in Note 15 to the consolidated financial statements in Item 8 of this Form 10-K. |
| (4) | The 2017 amount includes a $111.1 million Purchase Price Hedge Gain as well as the $59.7 million CCXI Gain. The 2016 amount includes an approximate $35 million FX gain relating to the substantial liquidation of a subsidiary. The 2015, 2014 and 2013 amounts include benefits of $7.1 million, $7.1 million and $22.8 million, respectively, related to the favorable resolution of certain Legacy Tax Matters. The 2014 amount also includes the ICRA Gain of $102.8 million. |
| MOODY’S 2017 10-K | 29 |
Table of Contents
| (5) | The 2017 amount includes: i) a $245.6 million ($1.27 per share) net charge related to the impact of U.S. tax reform and a statutory tax rate reduction in Belgium; ii) a $72.3 million ($0.37 per share) Purchase Price Hedge Gain; and iii) the $59.7 million ($0.31 per share) CCXI Gain. The 2016 amount includes: i) a $700.7 million ($3.59 per share) Settlement Charge; ii) $8.1 million ($0.04 per share) restructuring charge; and iii) a $34.8 million ($0.18 per share) FX gain relating to the substantial liquidation of a subsidiary. The 2015, 2014 and 2013 amounts include benefits of $6.4 million ($0.03 per share), $6.4 million ($0.03 per share) and $21.3 million ($0.09 per share), respectively, related to the resolution of certain Legacy Tax Matters. Also, the 2014 amount includes the ICRA Gain of $78.5 million ($0.37 per share) and the 2013 amount includes a litigation settlement charge of $0.14 per share. |
| 30 | MOODY’S 2017 10-K |
Table of Contents
| ITEM 7. | MANAGEMENT’S DISCUSSION AND ANALYSIS OF FINANCIAL CONDITION AND RESULTS OF OPERATIONS |
This discussion and analysis of financial condition and results of operations should be read in conjunction with the Moody’s Corporation consolidated financial statements and notes thereto included elsewhere in this annual report on Form 10-K.
This MD&A contains Forward-Looking Statements. See “Forward-Looking Statements” commencing on page 58 and Item 1A. “Risk Factors” commencing on page 18 for a discussion of uncertainties, risks and other factors associated with these statements.
Moody’s is a provider of (i) credit ratings; (ii) credit, capital markets and economic research, data and analytical tools; (iii) software solutions that support financial risk management activities; (iv) quantitatively derived credit scores; (v) financial services training and certification services; (vi) offshore financial research and analytical services; and (vii) company information and business intelligence products. Moody’s reports in two reportable segments: MIS and MA.
MIS, the credit rating agency, publishes credit ratings on a wide range of debt obligations and the entities that issue such obligations in markets worldwide. Revenue is primarily derived from the originators and issuers of such transactions who use MIS ratings in the distribution of their debt issues to investors. Additionally, MIS earns revenue from certain non-ratings-related operations which consist primarily of financial instruments pricing services in the Asia-Pacific region as well as revenue from ICRA’s non-ratings operations. The revenue from these operations is included in the MIS Other LOB and is not material to the results of the MIS segment.
The MA segment develops a wide range of products and services that support financial analysis and risk management activities of institutional participants in global financial markets. Within its RD&A business, MA distributes research and data developed by MIS as part of its ratings process, including in-depth research on major debt issuers, industry studies and commentary on topical credit-related events. The RD&A business also produces economic research and data and analytical tools such as quantitative credit risk scores as well as business intelligence and company information products. Within its ERS business, MA provides software solutions as well as related risk management services. The PS business provides offshore research and analytical services and financial training and certification programs.
Moody’s discussion and analysis of its financial condition and results of operations are based on the Company’s consolidated financial statements, which have been prepared in accordance with GAAP. The preparation of these financial statements requires Moody’s to make estimates and judgments that affect reported amounts of assets and liabilities and related disclosures of contingent assets and liabilities at the dates of the financial statements and revenue and expenses during the reporting periods. These estimates are based on historical experience and on other assumptions that are believed to be reasonable under the circumstances. On an ongoing basis, Moody’s evaluates its estimates, including those related to revenue recognition, accounts receivable allowances, contingencies, goodwill and intangible assets (including the estimated useful lives of amortizable intangible assets), pension and other retirement benefits and UTBs. Actual results may differ from these estimates under different assumptions or conditions. The following accounting estimates are considered critical because they are particularly dependent on management’s judgment about matters that are uncertain at the time the accounting estimates are made and changes to those estimates could have a material impact on the Company’s consolidated results of operations or financial condition.
Revenue Recognition
Revenue is recognized when persuasive evidence of an arrangement exists, delivery has occurred or the services have been provided and accepted by the customer when applicable, fees are determinable and the collection of resulting receivables is considered probable.
Pursuant to ASC Topic 605, when a sales arrangement contains multiple deliverables, the Company allocates revenue to each deliverable based on its relative selling price which is determined based on its vendor specific objective evidence if available, third party evidence if VSOE is not available, or estimated selling price if neither VSOE nor TPE is available.
The Company’s products and services will generally qualify as separate units of accounting under ASC Topic 605. The Company evaluates each deliverable in an arrangement to determine whether it represents a separate unit of accounting. A deliverable constitutes a separate unit of accounting when it has stand-alone value to the customers and if the arrangement includes a customer refund or return right relative to the delivered item and the delivery and performance of the undelivered item is considered probable and substantially in the Company’s control. In instances where the aforementioned criteria are not met, the deliverable is combined with the undelivered items and revenue recognition is determined as one single unit.
| MOODY’S 2017 10-K | 31 |
Table of Contents
The Company determines whether its selling price in a multi-element transaction meets the VSOE criteria by using the price charged for a deliverable when sold separately or, if the deliverable is not yet being sold separately, the price established by management having the relevant authority to establish such a price. In instances where the Company is not able to establish VSOE for all deliverables in a multiple element arrangement, which may be due to the Company infrequently selling each element separately, not selling products within a reasonably narrow price range, or only having a limited sales history, the Company attempts to establish TPE for deliverables. The Company determines whether TPE exists by evaluating largely similar and interchangeable competitor products or services in standalone sales to similarly situated customers. However, due to the difficulty in obtaining third party pricing, possible differences in its market strategy from that of its peers and the potential that products and services offered by the Company may contain a significant level of differentiation and/or customization such that the comparable pricing of products with similar functionality cannot be obtained, the Company generally is unable to reliably determine TPE. Based on the selling price hierarchy established by ASC Topic 605, when the Company is unable to establish selling price using VSOE or TPE, the Company will establish an ESP. ESP is the price at which the Company would transact a sale if the product or service were sold on a stand-alone basis. The Company establishes its best estimate of ESP considering internal factors relevant to is pricing practices such as costs and margin objectives, standalone sales prices of similar products, percentage of the fee charged for a primary product or service relative to a related product or service, and customer segment and geography. Additional consideration is also given to market conditions such as competitor pricing strategies and market trend. The Company reviews its determination of VSOE, TPE and ESP on an annual basis or more frequently as needed.
In the MIS segment, revenue attributed to initial ratings of issued securities is recognized when the rating is delivered to the issuer. Revenue attributed to monitoring of issuers or issued securities is recognized ratably over the period in which the monitoring is performed, generally one year. In the case of commercial mortgage-backed securities, structured credit, international residential mortgage-backed and asset-backed securities, issuers can elect to pay the monitoring fees upfront. These fees are deferred and recognized over the future monitoring periods based on the expected lives of the rated securities, which was approximately 24 years on a weighted average basis at December 31, 2017. At December 31, 2017, 2016 and 2015, deferred revenue related to these securities was approximately $140.1 million, $133.0 million, and $121.0 million.
Multiple element revenue arrangements in the MIS segment are generally comprised of an initial rating and the related monitoring service. In instances where monitoring fees are not charged for the first year monitoring effort, fees are allocated to the initial rating and monitoring services based on the relative selling price of each service to the total arrangement fees. The Company generally uses ESP in determining the selling price for its initial ratings as the Company rarely provides initial ratings separately without providing related monitoring services and thus is unable to establish VSOE or TPE for initial ratings.
MIS estimates revenue for ratings of commercial paper for which, in addition to a fixed annual monitoring fee, issuers are billed quarterly based on amounts outstanding. Revenue is accrued each quarter based on estimated amounts outstanding and is billed when actual data is available. The estimate is determined based on the issuers’ most recent reported quarterly data. At December 31, 2017, 2016 and 2015, accounts receivable included approximately $27.0 million, $25.0 million, and $24.0 million, respectively, related to accrued commercial paper revenue. Historically, MIS has not had material differences between the estimated revenue and the actual billings. Furthermore, for certain annual monitoring services, fees are not invoiced until the end of the annual monitoring period and revenue is accrued ratably over the monitoring period. At December 31, 2017, 2016 and 2015, accounts receivable included approximately $185.0 million, $159.1 million, and $146.4 million, respectively, relating to accrued annual monitoring service revenue.
In the MA segment, products and services offered by the Company include software licenses and related maintenance, subscriptions, and professional services. Revenue from subscription based products, such as research and data subscriptions and certain software-based credit risk management subscription products, is recognized ratably over the related subscription period, which is principally one year. Revenue from sale of perpetual licenses of credit processing software is generally recognized at the time the product master or first copy is delivered or transferred to and accepted by the customer. If uncertainty exists regarding customer acceptance of the product or service, revenue is not recognized until acceptance occurs. Software maintenance revenue is recognized ratably over the annual maintenance period. Revenue from professional services rendered is generally recognized as the services are performed. A large portion of annual research and data subscriptions and annual software maintenance are invoiced in the months of November, December and January.
Products and services offered within the MA segment are sold either stand-alone or together in various combinations. In instances where a multiple element arrangement includes software and non-software deliverables, revenue is allocated to the non-software deliverables and to the software deliverables, as a group, using the relative selling prices of each of the deliverables in the arrangement based on the aforementioned selling price hierarchy. Revenue is recognized for each element based upon the conditions for revenue recognition noted above.
If the arrangement contains more than one software deliverable, the arrangement consideration allocated to the software deliverables as a group is allocated to each software deliverable using VSOE. In the instances where the Company is not able to determine VSOE for all of the deliverables of an arrangement, the Company allocates the revenue to the undelivered elements equal to its VSOE and the
| 32 | MOODY’S 2017 10-K |
Table of Contents
residual revenue to the delivered elements. If the Company is unable to determine VSOE for an undelivered element, the Company defers all revenue allocated to the software deliverables until the Company has delivered all of the elements or when VSOE has been determined for the undelivered elements. In cases where software implementation services are considered essential and VSOE of fair value exists for post-contract customer support (“PCS”), once the delivery criteria has been met on the standard software, license and service revenue is recognized on a percentage-of-completion basis as implementation services are performed, while PCS is recognized over the coverage period. If VSOE of fair value does not exist for PCS, once the delivery criteria has been met on the standard software, service revenue is recognized on a zero profit margin basis until essential services are complete, at which point total remaining arrangement revenue is then spread ratably over the remaining PCS coverage period. If VSOE does not exist for PCS at the beginning of an arrangement but is established during implementation, revenue not recognized due to the absence of VSOE will be recognized on a cumulative basis.
Accounts Receivable Allowance
Moody’s records an allowance for estimated future adjustments to customer billings as a reduction of revenue, based on historical experience and current conditions. Such amounts are reflected as additions to the accounts receivable allowance. Additionally, estimates of uncollectible accounts are recorded as bad debt expense and are reflected as additions to the accounts receivable allowance. Actual billing adjustments and uncollectible account write-offs are charged against the allowance. Moody’s evaluates its accounts receivable allowance by reviewing and assessing historical collection and invoice adjustment experience as well as the current aging status of customer accounts. Moody’s also considers the economic environment of the customers, both from an industry and geographic perspective, in evaluating the need for allowances. Based on its analysis, Moody’s adjusts its allowance as considered appropriate in the circumstances. This process involves a high degree of judgment and estimation and could involve significant dollar amounts. Accordingly, Moody’s results of operations can be affected by adjustments to the allowance. Management believes that the allowance for uncollectible accounts receivable is adequate to cover anticipated adjustments and write-offs under current conditions. However, significant changes in any of the above factors, or actual write-offs or adjustments that differ from the estimated amounts could impact the Company’s consolidated results of operations.
Contingencies
Accounting for contingencies, including those matters described in Note 19 to the consolidated financial statements, is highly subjective and requires the use of judgments and estimates in assessing their magnitude and likely outcome. In many cases, the outcomes of such matters will be determined by third parties, including governmental or judicial bodies. The provisions made in the consolidated financial statements, as well as the related disclosures, represent management’s best estimates of the current status of such matters and their potential outcome based on a review of the facts and in consultation with outside legal counsel where deemed appropriate. The Company regularly reviews contingencies and as new information becomes available may, in the future, adjust its associated liabilities.
For claims, litigation and proceedings and governmental investigations and inquiries not related to income taxes, where it is both probable that a liability has been incurred and the amount of loss can be reasonably estimated, the Company records liabilities in the consolidated financial statements and periodically adjusts these as appropriate. When the reasonable estimate of the loss is within a range of amounts, the minimum amount of the range is accrued unless some higher amount within the range is a better estimate than another amount within the range. In other instances, where a loss is reasonably possible, management does not record a liability because of uncertainties related to the probable outcome and/or the amount or range of loss, but discloses the contingency if material. As additional information becomes available, the Company adjusts its assessments and estimates of such matters accordingly. In view of the inherent difficulty of predicting the outcome of litigation, regulatory, governmental investigations and inquiries, enforcement and similar matters and contingencies, particularly where the claimants seek large or indeterminate damages or where the parties assert novel legal theories or the matters involve a large number of parties, the Company cannot predict what the eventual outcome of the pending matters will be or the timing of any resolution of such matters. The Company also cannot predict the impact (if any) that any such matters may have on how its business is conducted, on its competitive position or on its financial position, results of operations or cash flows. As the process to resolve any pending matters progresses, management will continue to review the latest information available and assess its ability to predict the outcome of such matters and the effects, if any, on its operations and financial condition. However, in light of the large or indeterminate damages sought in some of them, the absence of similar court rulings on the theories of law asserted and uncertainties regarding apportionment of any potential damages, an estimate of the range of possible losses cannot be made at this time.
The Company’s wholly-owned insurance subsidiary insures the Company against certain risks including but not limited to deductibles for worker’s compensation, employment practices litigation, employee medical claims and terrorism, for which the claims are not material to the Company. In addition, for claim years 2008 and 2009, the insurance subsidiary insured the Company for defense costs
| MOODY’S 2017 10-K | 33 |
Table of Contents
related to professional liability claims. For matters insured by the Company’s insurance subsidiary, Moody’s records liabilities based on the estimated total claims expected to be paid and total projected costs to defend a claim through its anticipated conclusion. The Company determines liabilities based on an assessment of management’s best estimate of claims to be paid and legal defense costs as well as actuarially determined estimates. Defense costs for matters not self-insured by the Company’s wholly-owned insurance subsidiary are expensed as services are provided.
For income tax matters, the Company employs the prescribed methodology of Topic 740 of the ASC which requires a company to first determine whether it is more-likely-than-not (defined as a likelihood of more than fifty percent) that a tax position will be sustained based on its technical merits as of the reporting date, assuming that taxing authorities will examine the position and have full knowledge of all relevant information. A tax position that meets this more-likely-than-not threshold is then measured and recognized at the largest amount of benefit that is greater than fifty percent likely to be realized upon effective settlement with a taxing authority.
Goodwill and Other Acquired Intangible Assets
As of July 31 of each year, Moody’s evaluates its goodwill for impairment at the reporting unit level, defined as an operating segment or one level below an operating segment.
The Company has seven primary reporting units: two within the Company’s ratings business (one for the ICRA business and one that encompasses all of Moody’s other ratings operations) and five reporting units within MA: RD&A, ERS, FSTC, MAKS and Bureau van Dijk. The RD&A reporting unit encompasses the distribution of investor-oriented research and data developed by MIS as part of its ratings process, in-depth research on major debt issuers, industry studies, economic research and commentary on topical events and credit analytic tools. The ERS reporting unit provides products and services that support the credit risk management and regulatory compliance activities of financial institutions and also provides advanced actuarial software for the life insurance industry. These products and services are primarily delivered via software that is licensed on a perpetual basis or sold on a subscription basis. The FSTC reporting unit consists of the portion of the MA business that offers both credit training as well as other professional development training and implementation services. The MAKS reporting unit provides offshore research and analytical services. The Bureau van Dijk reporting unit consists of the newly acquired Bureau van Dijk business, which was acquired on August 10, 2017, and primarily provides business intelligence and company information products.
The Company evaluates the recoverability of goodwill using a two-step impairment test approach at the reporting unit level. In the first step, the Company assesses various qualitative factors to determine whether the fair value of a reporting unit may be less than its carrying amount. If a determination is made based on the qualitative factors that an impairment does not exist, the Company is not required to perform further testing. If the aforementioned qualitative assessment results in the Company concluding that it is more likely than not that the fair value of a reporting unit may be less than its carrying amount, the fair value of the reporting unit will be determined and compared to its carrying value including goodwill. If the fair value of the reporting unit exceeds the carrying value of the net assets assigned to that unit, goodwill is not impaired and the Company is not required to perform further testing. If the fair value of the reporting unit is less than the carrying value, the Company will record a goodwill impairment charge for the amount by which the carrying value exceeds the reporting unit’s fair value. The Company evaluates its reporting units on an annual basis, or more frequently if there are changes in the reporting structure of the Company due to acquisitions or realignments. For the reporting units where the Company is consistently able to conclude that no impairment exists using only a qualitative approach, the Company’s accounting policy is to perform the second step of the aforementioned goodwill impairment assessment at least once every three years. At July 31, 2017, the Company performed a qualitative assessment on all reporting units except for MAKS, which resulted in no indicators of impairment of goodwill.
In January 2017 there was a management change in the MAKS business. A quantitative impairment assessment for the MAKS reporting unit was performed as of July 31, 2017 to reflect the completion of a new strategic plan for this reporting unit under new management (the Company’s annual strategic plan is completed in the third quarter of each year). This quantitative assessment resulted in no impairment of goodwill for the MAKS reporting unit at July 31, 2017.
Determining the fair value of a reporting unit or an indefinite-lived acquired intangible asset involves the use of significant estimates and assumptions. These estimates and assumptions include revenue growth rates and operating margins used to calculate projected future cash flows, risk-adjusted discount rates, future economic and market conditions, and appropriate comparable market metrics. However, as these estimates and assumptions are unpredictable and inherently uncertain, actual future results may differ from these estimates. In addition, the Company also makes certain judgments and assumptions in allocating shared assets and liabilities to determine the carrying values for each of its reporting units.
Other assets and liabilities, including applicable corporate assets, are allocated to the extent they are related to the operation of respective reporting units.
| 34 | MOODY’S 2017 10-K |
Table of Contents
Sensitivity Analyses and Key Assumptions for Deriving the Fair Value of a Reporting Unit
The following table identifies the amount of goodwill allocated to each reporting unit as of December 31, 2017 as well as the amount by which the net assets of each reporting unit would exceed the fair value under Step 2 of the goodwill impairment test as prescribed in ASC Topic 350, assuming hypothetical reductions in their fair values as of the date of the last quantitative goodwill impairment assessment for each reporting unit.
| Sensitivity Analysis | ||||||||||||||||||||
| Deficit Caused by a Hypothetical Reduction to Fair Value | ||||||||||||||||||||
| Goodwill | 10% | 20% | 30% | 40% | ||||||||||||||||
| MIS | $ | 50.1 | $ | — | $ | — | $ | — | $ | — | ||||||||||
| RD&A | 187.3 | — | — | — | — | |||||||||||||||
| ERS | 340.8 | — | — | — | — | |||||||||||||||
| FSTC | 90.8 | — | — | (14.4 | ) | (34.6 | ) | |||||||||||||
| MAKS | 160.9 | — | — | (2.9 | ) | (35.6 | ) | |||||||||||||
| ICRA | 238.5 | — | — | — | — | |||||||||||||||
| Bureau van Dijk* | 2,684.8 | N/A | N/A | N/A | N/A | |||||||||||||||
|
|
|
|
|
|
|
|
|
|
|
|||||||||||
| Totals |
$ | 3,753.2 | $ | — | $ | — | $ | (17.3 | ) | $ | (70.2 | ) | ||||||||
|
|
|
|
|
|
|
|
|
|
|
|||||||||||
| * | Bureau van Dijk was acquired subsequent to the Company’s annual goodwill impairment assessment as of July 31, 2017. Due to the close proximity of the Bureau van Dijk acquisition to December 31, 2017, the purchase price approximates the fair value of the reporting unit. Additionally, the Company has not completed its allocation of certain of the goodwill acquired to other MA reporting units that are anticipated to benefit from synergies resulting from the Bureau van Dijk acquisition. |
Methodologies and significant estimates utilized in determining of the fair value of reporting units:
The following is a discussion regarding the Company’s methodology for determining the fair value of its reporting units, excluding ICRA, as of the date of each reporting unit’s last quantitative assessment (July 31, 2017 for MAKS; July 31, 2016 for the remaining reporting units). As ICRA is a publicly traded company in India, the Company was able to observe its fair value based on its market capitalization.
The fair value of each reporting unit, excluding ICRA, was estimated using a discounted cash flow methodology and comparable public company and precedent transaction multiples. The DCF analysis requires significant estimates, including projections of future operating results and cash flows of each reporting unit that is based on internal budgets and strategic plans, expected long-term growth rates, terminal values, weighted average cost of capital and the effects of external factors and market conditions. Changes in these estimates and assumptions could materially affect the estimated fair value of each reporting unit which could result in an impairment charge to reduce the carrying value of goodwill, which could be material to the Company’s financial position and results of operations. Moody’s allocates newly acquired goodwill to reporting units based on the reporting unit expected to benefit from the acquisition.
The sensitivity analyses on the future cash flows and WACC assumptions described below are as of the date of the last quantitative goodwill impairment assessment for each reporting unit. The following discusses the key assumptions utilized in the discounted cash flow valuation methodology that requires significant management judgment:
| » | Future cash flow assumptions—The projections for future cash flows utilized in the models are derived from historical experience and assumptions regarding future growth and profitability of each reporting unit. These projections are consistent with the Company’s operating and strategic plan. Cash flows for the five years subsequent to the date of the quantitative goodwill impairment analysis were utilized in the determination of the fair value of each reporting unit. The growth rates assumed a gradual increase in revenue based on a continued improvement in the global economy and capital markets, new customer acquisition and new products. Beyond five years, a terminal value was determined using a perpetuity growth rate based on expected inflation and real GDP growth rates. A sensitivity analysis of the revenue growth rates was performed on all reporting units. For all reporting units, a 10% decrease in the revenue growth rates used would not have resulted in the carrying value of the reporting unit exceeding its respective estimated fair value. |
| » | WACC—The WACC is the rate used to discount each reporting unit’s estimated future cash flows. The WACC is calculated based on the proportionate weighting of the cost of debt and equity. The cost of equity is based on a risk-free interest rate, an equity risk factor which is derived from public companies similar to the reporting unit and which captures the perceived risks and uncertainties associated with the reporting unit’s cash flows. The cost of debt component is calculated as the weighted average cost associated with all of the Company’s outstanding borrowings as of the date of the impairment test and was immaterial to the computation of the WACC. The cost of debt and equity is weighted based on the debt to market capitalization ratio of publicly traded companies with similarities to the reporting unit being tested. The WACC for all reporting units ranged from 8.5% to 10.5%. Differences in the WACC used between reporting units is primarily due to distinct risks and uncertainties regarding the cash flows of the different reporting units. A sensitivity analysis of the WACC was performed on all reporting units whereby an increase in the WACC of one percentage point would not result in the carrying value of the reporting unit exceeding its fair value. |
| MOODY’S 2017 10-K | 35 |
Table of Contents
Amortizable intangible assets are reviewed for recoverability whenever events or changes in circumstances indicate that the carrying amount may not be recoverable. There were no such events or changes during 2017 that would indicate that the carrying amount of amortizable intangible assets in any of the Company’s reporting units may not be recoverable. This determination was made based on continued growth, consistent with operating and strategic plans for the reporting unit where the intangible asset resides.
Pension and Other Retirement Benefits
The expenses, assets and liabilities that Moody’s reports for its Retirement Plans are dependent on many assumptions concerning the outcome of future events and circumstances. These significant assumptions include the following:
| » | future compensation increases are based on the Company’s long-term actual experience and future outlook; |
| » | long-term expected return on pension plan assets is based on historical portfolio results and the expected future average annual return for each major asset class within the plan’s portfolio (which is principally comprised of equity and fixed-income investments); and |
| » | discount rates are based on current yields on high-grade corporate long-term bonds. |
The discount rates used to measure the present value of the Company’s benefit obligation for its Retirement Plans as of December 31, 2017 were derived using a cash flow matching method whereby the Company compares each plan’s projected payment obligations by year with the corresponding yield on the Citibank pension discount curve. The cash flows by plan are then discounted back to present value to determine the discount rate applicable to each plan.
Moody’s major assumptions vary by plan and assumptions used are set forth in Note 13 to the consolidated financial statements. In determining these assumptions, the Company consults with third-party actuaries and other advisors as deemed appropriate. While the Company believes that the assumptions used in its calculations are reasonable, differences in actual experience or changes in assumptions could have a significant effect on the expenses, assets and liabilities related to the Company’s Retirement Plans. Additionally, the Company has updated its mortality assumption by adopting the newly released mortality improvement scale MP-2017 to accompany the RP-2014 mortality tables to reflect the latest information regarding future mortality expectations by the Society of Actuaries.
When actual plan experience differs from the assumptions used, actuarial gains or losses arise. Excluding differences between the expected long-term rate of return assumption and actual returns on plan assets, the Company amortizes, as a component of annual pension expense, total outstanding actuarial gains or losses over the estimated average future working lifetime of active plan participants to the extent that the gain/loss exceeds 10% of the greater of the beginning-of-year projected benefit obligation or the market-related value of plan assets. For Moody’s Retirement Plans, the total actuarial losses as of December 31, 2017 that have not been recognized in annual expense are $123.2 million, and Moody’s expects to recognize a net periodic expense of $6.0 million in 2018 related to the amortization of actuarial losses.
For Moody’s funded U.S. pension plan, the differences between the expected long-term rate of return assumption and actual experience could also affect the net periodic pension expense. As permitted under ASC Topic 715, the Company spreads the impact of asset experience over a five-year period for purposes of calculating the market-related value of assets that is used in determining the expected return on assets’ component of annual expense and in calculating the total unrecognized gain or loss subject to amortization. As of December 31, 2017, the Company has an unrecognized asset loss of $16.1 million, of which $2.1 million will be recognized in the market-related value of assets that is used to calculate the expected return on assets’ component of 2019 expense.
The table below shows the estimated effect that a one percentage-point decrease in each of these assumptions will have on Moody’s 2018 income before provision for income taxes. These effects have been calculated using the Company’s current projections of 2018 expenses, assets and liabilities related to Moody’s Retirement Plans, which could change as updated data becomes available.
| (dollars in millions) | Assumption Used for 2018 | Estimated Impact on 2018 income before provision for income taxes (Decrease)/Increase |
||||||
| Weighted Average Discount Rates* | 3.46%/3.45% | $ | (11.4 | ) | ||||
| Weighted Average Assumed Compensation Growth Rate | 3.71% | $ | 1.6 | |||||
| Assumed Long-Term Rate of Return on Pension Assets | 4.50% | $ | (3.4 | ) | ||||
| * | Weighted average discount rates of 3.46% and 3.45% for pension plans and Other Retirement Plans, respectively. |
A one percentage-point increase in assumed healthcare cost trend rates will not affect 2018 projected expenses. Based on current projections, the Company estimates that expenses related to Retirement Plans will be approximately $31 million in 2018, a decrease compared to the $32.6 million recognized in 2017.
| 36 | MOODY’S 2017 10-K |
Table of Contents
Income Taxes
The Company is subject to income taxes in the U.S. and various foreign jurisdictions. The Company’s tax assets and liabilities are affected by the amounts charged for services provided and expenses incurred as well as other tax matters such as intercompany transactions. The Company accounts for income taxes under the asset and liability method in accordance with ASC Topic 740. Therefore, income tax expense is based on reported income before income taxes, and deferred income taxes reflect the effect of temporary differences between the amounts of assets and liabilities that are recognized for financial reporting purposes and the amounts that are recognized for income tax purposes.
The Company is subject to tax audits in various jurisdictions. The Company regularly assesses the likely outcomes of such audits in order to determine the appropriateness of liabilities for UTBs. The Company classifies interest related to income taxes as a component of interest expense in the Company’s consolidated financial statements and associated penalties, if any, as part of other non-operating expenses.
For UTBs, ASC Topic 740 requires a company to first determine whether it is more-likely-than-not (defined as a likelihood of more than fifty percent) that a tax position will be sustained based on its technical merits as of the reporting date, assuming that taxing authorities will examine the position and have full knowledge of all relevant information. A tax position that meets this more-likely-than-not threshold is then measured and recognized at the largest amount of benefit that is greater than fifty percent likely to be realized upon effective settlement with a taxing authority. As the determination of liabilities related to UTBs and associated interest and penalties requires significant estimates to be made by the Company, there can be no assurance that the Company will accurately predict the outcomes of these audits, and thus the eventual outcomes could have a material impact on the Company’s operating results or financial condition.
On December 22, 2017, the Tax Act was signed into law which resulted in significant changes to U.S. corporate tax laws. The Tax Act includes a mandatory one-time deemed repatriation tax (“transition tax”) on previously untaxed accumulated earnings of foreign subsidiaries and reduces the statutory federal corporate income tax rate from 35% to 21%. Due to the complexities involved in applying the provisions of the Tax Act, in 2017 the Company recorded a provisional estimate of $247.3 million related to the transition tax. A portion of this amount will be payable over eight years, starting in 2018, and will not accrue interest. Also in 2017, a provisional estimate of $56.2 million was recorded decreasing net deferred tax assets resulting from the reduction in the federal corporate income tax rate. The above provisional estimates may be impacted by a number of additional considerations, including but not limited to the issuance of regulations and our ongoing analysis of the new law.
Other Estimates
In addition, there are other accounting estimates within Moody’s consolidated financial statements, including recoverability of deferred tax assets, valuation of investments in affiliates and the estimated lives of amortizable intangible assets. Management believes the current assumptions and other considerations used to estimate amounts reflected in Moody’s consolidated financial statements are appropriate. However, if actual experience differs from the assumptions and other considerations used in estimating amounts reflected in Moody’s consolidated financial statements, the resulting changes could have a material adverse effect on Moody’s consolidated results of operations or financial condition.
See Note 2 to the consolidated financial statements for further information on significant accounting policies that impact Moody’s.
The Company is organized into two reportable segments at December 31, 2017: MIS and MA.
The MIS segment is comprised primarily of all of the Company’s ratings operations consisting of five LOBs—CFG, SFG, FIG, PPIF and MIS Other. The ratings LOBs generate revenue principally from fees for the assignment and ongoing monitoring of credit ratings on debt obligations and the entities that issue such obligations in markets worldwide. The MIS Other LOB consists of certain non-ratings operations managed by MIS which consists of non-rating revenue from ICRA and fixed income pricing service operations in the Asia-Pacific region.
The MA segment develops a wide range of products and services that support financial analysis and risk management activities of institutional participants in global financial markets as well as serving as provider of business intelligence and company information. The MA segment consists of three lines of business—RD&A, ERS and PS. The results of operations for MA and revenue for the RD&A LOB for the fourth quarter and year ended December 31, 2017 include the financial results from Bureau van Dijk which was acquired on August 10, 2017.
The following is a discussion of the results of operations of the Company and its reportable segments. Total MIS revenue and total MA expenses include the intersegment royalty revenue for MIS and expense charged to MA for the rights to use and distribute content, data and products developed by MIS. The royalty rate charged by MIS approximates the fair value of the aforementioned content, data and products developed by MIS. Total MA revenue and total MIS expenses include intersegment fees charged to MIS from MA for the
| MOODY’S 2017 10-K | 37 |
Table of Contents
use of certain MA products and services in MIS’s ratings process. These fees charged by MA are generally equal to the costs incurred by MA to provide these products and services. Overhead charges and corporate expenses that exclusively benefit one segment are fully charged to that segment. Additionally, overhead costs and corporate expenses of the Company that benefit both segments are generally allocated to each segment based on a revenue-split methodology. Overhead expenses include costs such as rent and occupancy, information technology and support staff such as finance, human resources and information technology.
Beginning in the third quarter of 2017, in conjunction with the acquisition of Bureau van Dijk, the Company modified its definition of Adjusted Net Income and Adjusted Diluted EPS to exclude the impact of amortization of all acquisition-related intangible assets. Refer to the section entitled “Non-GAAP Financial Measures” of this Management Discussion and Analysis for further information regarding this measure.
Year ended December 31, 2017 compared with year ended December 31, 2016
Executive Summary
| » | Moody’s completed the acquisition of Bureau van Dijk on August 10, 2017. Moody’s results of operations include Bureau van Dijk’s operating results beginning as of August 10, 2017. |
| » | Moody’s revenue in 2017 totaled $4,204.1 million, an increase of $599.9 million, or 17%, compared to 2016 reflecting strong growth in both segments. |
| » | MIS revenue was 17% higher compared to the prior year with growth across all ratings LOBs. The most notable growth was in the CFG LOB mainly due to strong leveraged finance issuance across all regions reflecting favorable market conditions and increased investor demand for higher yielding securities. |
| » | MA revenue grew 16% compared to the prior year reflecting growth across all LOBs. The most notable growth was in the RD&A LOB which reflected increases in credit research subscriptions and licensing of credit data as well as an approximate $92 million contribution from Bureau van Dijk (net of an approximate $36 million reduction relating to a deferred revenue adjustment required as part of acquisition accounting as further described in Note 7 to the financial statements), providing approximately seven percentage points to growth. |
| » | Total operating expenses excluding D&A decreased $602.1 million, or 21% compared to 2016 reflecting the $863.8 million Settlement Charge in 2016. This decrease is partially offset by higher compensation costs in 2017 which reflects growth in performance-based compensation resulting from strong financial performance in 2017 coupled with annual merit increases. Additionally, there was approximately $64 million in Bureau van Dijk operating expenses and $22.5 million in Acquisition-Related Expenses in 2017. |
| » | D&A increased $31.6 million primarily due to amortization of intangible assets acquired as part of the Bureau van Dijk acquisition. |
| » | Operating income of $1,809.1 million in 2017 increased $1,170.4 million compared to 2016 and resulted in an operating margin of 43.0%, compared to 17.7% in the prior year. Operating income and operating margin in 2016 were suppressed by the $863.8 million Settlement Charge. Adjusted Operating Income of $1,989.9 million in 2017 increased $348.7 million compared to 2016, resulting in an Adjusted Operating Margin of 47.3% compared to 45.5% in the prior year. |
| » | The decrease in non-operating expense, net, compared to the prior year is primarily due to: |
| » | the $59.7 million CCXI Gain in 2017; |
| » | the $111.1 million Purchase Price Hedge Gain in 2017; |
Partially offset by:
| » | higher interest expense of $50.6 million primarily reflecting additional financing in 2017 utilized to fund the payment of the 2016 Settlement Charge, repay the Series 2007-1 Notes and fund the Bureau van Dijk acquisition. |
| » | FX losses of approximately $17 million in the 2017 compared to FX gains of approximately $50 million in the prior year. The FX gains in 2016 included approximately $35 million related to the liquidation of a non-U.S. subsidiary. |
| » | The ETR of 43.6% in 2017 includes a net charge of approximately $246 million in the fourth quarter related to the impacts of tax reform in the U.S. and Belgium partially offset by the non-taxable CCXI Gain and an approximate $40 million benefit relating to Excess Tax Benefits on stock-based compensation. The 2016 ETR of 50.6% included the non-deductible nature of the federal portion of the Settlement Charge. |
| 38 | MOODY’S 2017 10-K |
Table of Contents
| » | Diluted EPS of $5.15 increased $3.79 compared to 2016. Diluted EPS in 2017 and 2016 included the following items, detailed in the table below, which impacted year-over-year comparability: |
| Year Ended December 31, | ||||||||
| Per share benefit (charge) to Diluted EPS | 2017 | 2016 | ||||||
| CCXI Gain | $ | 0.31 | — | |||||
| Purchase Price Hedge Gain | $ | 0.37 | — | |||||
| Restructuring | — | $ | (0.04 | ) | ||||
| Settlement Charge | — | $ | (3.59 | ) | ||||
| FX gain on liquidation of a subsidiary | — | $ | 0.18 | |||||
| Acquisition-Related Expenses | $ | (0.10 | ) | — | ||||
| Amortization of acquired intangible assets | $ | (0.23 | ) | $ | (0.13 | ) | ||
| Impact of U.S. tax reform / Belgium statutory tax rate change | $ | (1.27 | ) | — | ||||
Excluding all of the items in the table above, Adjusted Diluted EPS of $6.07, which included $0.20 relating to Excess Tax Benefits on stock-based compensation and $0.03 in financing costs incurred between the execution of the agreement to acquire Bureau van Dijk and the closing of the acquisition, increased $1.13 compared to 2016.
| MOODY’S 2017 10-K | 39 |
Table of Contents
Moody’s Corporation
| Year ended December 31, | % Change Favorable (Unfavorable) |
|||||||||||
| 2017 | 2016 | |||||||||||
| Revenue: | ||||||||||||
| United States |
$ | 2,348.4 | $ | 2,105.5 | 12 | % | ||||||
|
|
|
|
|
|||||||||
| International: |
||||||||||||
| EMEA |
1,131.7 | 904.4 | 25 | % | ||||||||
| Asia-Pacific |
471.4 | 373.2 | 26 | % | ||||||||
| Americas |
252.6 | 221.1 | 14 | % | ||||||||
|
|
|
|
|
|||||||||
| Total International |
1,855.7 | 1,498.7 | 24 | % | ||||||||
|
|
|
|
|
|||||||||
| Total |
4,204.1 | 3,604.2 | 17 | % | ||||||||
|
|
|
|
|
|||||||||
| Expenses: | ||||||||||||
| Operating |
1,222.8 | 1,026.6 | (19 | %) | ||||||||
| SG&A |
991.4 | 936.4 | (6 | %) | ||||||||
| Restructuring |
— | 12.0 | 100 | % | ||||||||
| Depreciation and amortization |
158.3 | 126.7 | (25 | %) | ||||||||
| Acquisition-Related Expenses |
22.5 | — | NM | |||||||||
| Settlement Charge |
— | 863.8 | 100 | % | ||||||||
|
|
|
|
|
|||||||||
| Total |
2,395.0 | 2,965.5 | 19 | % | ||||||||
|
|
|
|
|
|||||||||
| Operating income | $ | 1,809.1 | $ | 638.7 | 183 | % | ||||||
|
|
|
|
|
|||||||||
| Adjusted Operating Income (1) | $ | 1,989.9 | $ | 1,641.2 | 21 | % | ||||||
|
|
|
|
|
|||||||||
| Interest expense, net | $ | (188.4 | ) | $ | (137.8 | ) | (37 | %) | ||||
| Other non-operating (expense) income, net | $ | (4.7 | ) | $ | 57.1 | (108 | %) | |||||
| Purchase Price Hedge Gain | $ | 111.1 | $ | — | NM | |||||||
| CCXI Gain | $ | 59.7 | $ | — | NM | |||||||
|
|
|
|
|
|||||||||
| Non-operating expense, net |
$ | (22.3 | ) | $ | (80.7 | ) | 72 | % | ||||
|
|
|
|
|
|||||||||
| Net income attributable to Moody’s | $ | 1,000.6 | $ | 266.6 | 275 | % | ||||||
| Diluted weighted average shares outstanding | $ | 194.2 | 195.4 | 1 | % | |||||||
| Diluted EPS attributable to Moody’s common shareholders | $ | 5.15 | $ | 1.36 | 279 | % | ||||||
| Adjusted Diluted EPS attributable to Moody’s common shareholders (1) | $ | 6.07 | $ | 4.94 | 23 | % | ||||||
| Operating margin | 43.0 | % | 17.7 | % | ||||||||
| Adjusted Operating Margin (1) | 47.3 | % | 45.5 | % | ||||||||
| (1) | Adjusted Operating Income, Adjusted Operating Margin and Adjusted Diluted EPS attributable to Moody’s common shareholders are non-GAAP financial measures. Refer to the section entitled “Non-GAAP Financial Measures” of this Management Discussion and Analysis for further information regarding these measures. |
The table below shows Moody’s global staffing by geographic area:
| December 31, | % Change | |||||||||||
| 2017 | 2016 | |||||||||||
| United States | 3,591 | 3,386 | 6 | % | ||||||||
| International | 8,305 | 7,231 | 15 | % | ||||||||
|
|
|
|
|
|||||||||
| Total | 11,896 | * | 10,617 | 12 | % | |||||||
|
|
|
|
|
|||||||||
| * | Includes 874 employees from the acquisition of Bureau van Dijk |
Global revenue of $4,204.1 million in 2017 increased $599.9 million, or 17%, compared to 2016 and reflected strong growth in both MIS and MA.
The $403.0 million increase in MIS revenue primarily reflects strong global leveraged finance rated issuance volumes in CFG as issuers took advantage of favorable market conditions to refinance obligations in 2017 as well as growth in the banking sector within FIG and in CLO issuance in SFG. Additionally, the increase over prior year reflects benefits from changes in the mix of fee type, new fee initiatives and pricing increases. These increases were partially offset by lower U.S. public finance refunding volumes.
| 40 | MOODY’S 2017 10-K |
Table of Contents
The $196.9 million increase in MA revenue primarily reflects higher RD&A revenue across all regions driven by growth in credit research subscriptions and licensing of ratings data as well as the contribution from the Bureau van Dijk acquisition of approximately $92 million (net of an approximate $36 million reduction relating to a deferred revenue adjustment required as part of acquisition accounting as further described in Note 7 to the financial statements).
Transaction revenue accounted for 50% of global MCO revenue in 2017, compared to 49% in 2016.
U.S. revenue of $2,348.4 million in 2017 increased $242.9 million over the prior year, reflecting growth in both reportable segments.
Non-U.S. revenue increased $357.0 million from 2016 reflecting growth in both reportable segments.
Operating expenses were $1,222.8 million in 2017, up $196.2 million from 2016, primarily due to an increase in performance-based compensation expenses (including annual bonuses, a profit sharing contribution and performance-based equity compensation), which is correlated with the strong financial performance of the Company in 2017. This increase also reflects higher salaries and employee benefit expenses resulting from the impact of annual compensation increases and increases in headcount coupled with Bureau van Dijk expenses.
SG&A expenses of $991.4 million in 2017 increased $55.0 million from the prior year period primarily due to higher performance-based compensation costs (including annual bonuses, a profit sharing contribution and performance-based equity compensation), which is correlated with the strong financial performance of the Company in 2017 coupled with Bureau van Dijk expenses. These increases were partially offset by the impact of cost management initiatives implemented in 2016 that have benefited 2017 as well as lower legal costs.
D&A increased $31.6 million primarily due to amortization of intangible assets acquired as part of the Bureau van Dijk acquisition.
Acquisition-Related Expenses represent expenses incurred to complete and integrate the acquisition of Bureau van Dijk.
Operating income of $1,809.1 million increased $1,170.4 million from 2016. Operating margin was 43.0% compared to 17.7% in 2016. Operating income and operating margin in 2016 were suppressed by the $863.8 million Settlement Charge. Adjusted Operating Income was $1,989.9 million in 2017, an increase of $348.7 million compared to 2016. Adjusted Operating Margin of 47.3% increased 180 BPS compared to the prior year.
Interest (expense) income, net in 2017 was $(188.4) million, a $50.6 million increase in expense compared to 2016 primarily due to: i) interest on the 2017 Senior Notes and 2017 Floating Rate Senior Notes which were issued in the first quarter of 2017 to fund the payment of the 2016 Settlement Charge and repayment of the Series 2007-1 Notes; ii) interest on the 2017 Private Placement Notes Due 2023 and 2028 both issued in June 2017 coupled with interest on the 2017 Term Loan drawn down in August 2017, all of which were issued to fund the acquisition of Bureau van Dijk; and iii) fees on the undrawn 2017 Bridge Credit Facility also related to the acquisition of Bureau van Dijk.
Other non-operating (expense) income, net was $(4.7) million in 2017, a $61.8 million change compared to 2016 primarily reflecting approximately $17 million in FX losses in 2017 compared to approximately $50 million in FX gains in the prior year. The FX gains in 2016 included an approximate $35 million gain related to the liquidation of a non-U.S. subsidiary.
Additionally, Moody’s recognized the $59.7 million CCXI Gain and the $111.1 million Purchase Price Hedge Gain in 2017.
The ETR of 43.6% in 2017 includes a net charge of approximately $246 million in the fourth quarter related to the impacts of corporate tax reform in the U.S. and Belgium partially offset by the non-taxable CCXI Gain and an approximate $40 million benefit reflecting the adoption on a prospective basis of a new accounting standard relating to Excess Tax Benefits on stock-based compensation. In accordance with a new accounting standard, these Excess Tax Benefits are now recorded to the provision for income taxes, whereas in the prior year were recorded to capital surplus (refer to Note 1 to the consolidated financial statements for further discussion on this new accounting standard). The 2016 ETR of 50.6% included the non-deductible nature of the federal portion of the Settlement Charge. The impact of the aforementioned tax reform in the U.S. is expected to reduce the Company’s ETR in years subsequent to 2017. For the full-year ended December 31, 2018, the Company expects the ETR to be between 22% and 23%.
| MOODY’S 2017 10-K | 41 |
Table of Contents
Diluted EPS increased $3.79 compared to 2016. Diluted EPS in 2017 and 2016 included the following items detailed in the table below which impacted year-over-year comparability:
| Year Ended December 31, | ||||||||
| Per share benefit (charge) to Diluted EPS | 2017 | 2016 | ||||||
| CCXI Gain | $ | 0.31 | — | |||||
| Purchase Price Hedge Gain | $ | 0.37 | — | |||||
| Restructuring | — | (0.04 | ) | |||||
| Settlement Charge | — | $ | (3.59 | ) | ||||
| FX gain on liquidation of a subsidiary | $ | 0.18 | ||||||
| Acquisition-Related Expenses | $ | (0.10 | ) | — | ||||
| Amortization of acquired intangible assets | $ | (0.23 | ) | $ | (0.13 | ) | ||
| Impact of U.S. tax reform / Belgium statutory tax rate change | $ | (1.27 | ) | — | ||||
Excluding all of the items in the table above, Adjusted Diluted EPS of $6.07, which included $0.20 relating to Excess Tax Benefits on stock-based compensation and $0.03 in financing costs incurred between the execution of the agreement to acquire Bureau van Dijk and the closing of the acquisition, increased $1.13 compared to 2016 reflecting higher Net Income and a 1% reduction in diluted weighted average shares outstanding. Refer to the section entitled “Non-GAAP Financial Measures” of this Management’s Discussion and Analysis for the impact to Net Income relating to the aforementioned per-share amounts.
Segment Results
Moody’s Investors Service
The table below provides a summary of revenue and operating results, followed by further insight and commentary:
| Year ended December 31, | % Change Favorable (Unfavorable) |
|||||||||||
| 2017 | 2016 | |||||||||||
| Revenue: | ||||||||||||
| Corporate finance (CFG) |
$ | 1,392.7 | $ | 1,122.3 | 24 | % | ||||||
| Structured finance (SFG) |
495.5 | 436.8 | 13 | % | ||||||||
| Financial institutions (FIG) |
435.8 | 368.9 | 18 | % | ||||||||
| Public, project and infrastructure finance (PPIF) |
431.3 | 412.2 | 5 | % | ||||||||
|
|
|
|
|
|||||||||
| Total ratings revenue |
2,755.3 | 2,340.2 | 18 | % | ||||||||
|
|
|
|
|
|||||||||
| MIS Other |
18.5 | 30.6 | (40 | %) | ||||||||
|
|
|
|
|
|||||||||
| Total external revenue |
2,773.8 | 2,370.8 | 17 | % | ||||||||
|
|
|
|
|
|||||||||
| Intersegment royalty |
111.7 | 100.2 | 11 | % | ||||||||
|
|
|
|
|
|||||||||
| Total MIS Revenue |
2,885.5 | 2,471.0 | 17 | % | ||||||||
|
|
|
|
|
|||||||||
| Expenses: | ||||||||||||
| Operating and SG&A (external) |
1,230.9 | 1,102.1 | (12 | %) | ||||||||
| Operating and SG&A (intersegment) |
16.0 | 13.5 | (19 | %) | ||||||||
|
|
|
|
|
|||||||||
| Adjusted Operating Income | 1,638.6 | 1,355.4 | 21 | % | ||||||||
|
|
|
|
|
|||||||||
| Depreciation and amortization |
74.7 | 73.8 | (1 | %) | ||||||||
| Restructuring |
— | 10.2 | 100 | % | ||||||||
| Settlement Charge |
— | 863.8 | 100 | % | ||||||||
|
|
|
|
|
|||||||||
| Operating income | $ | 1,563.9 | $ | 407.6 | 284 | % | ||||||
|
|
|
|
|
|||||||||
| Operating margin | 54.2 | % | 16.5 | % | ||||||||
| Adjusted Operating Margin | 56.8 | % | 54.9 | % | ||||||||
The following is a discussion of external MIS revenue and operating expenses:
Global MIS revenue of $2,773.8 million in 2017 was up 17% compared to 2016, most notably from strong leveraged finance rated issuance volumes within CFG coupled with strong growth in banking-related revenue in FIG and increases across most asset classes in SFG. Also contributing to the growth was the favorable impact of changes in the mix of fee type, new fee initiatives and pricing increases.
| 42 | MOODY’S 2017 10-K |
Table of Contents
Transaction revenue for MIS was 65% in 2017 compared to 61% in 2016.
In the U.S., revenue was $1,702.8 million in 2017, an increase of $200.9 million or 13%, compared to 2016 primarily reflecting strong growth in CFG, SFG and FIG revenue being partially offset by declines in PPIF and MIS Other revenue.
Non-U.S. revenue was $1,071.0 million in 2017, an increase of $202.1 million or 23%, compared to 2016 reflecting growth across all LOBs excluding MIS Other.
Global CFG revenue of $1,392.7 million in 2017 was up 24% compared to 2016 primarily due to strength in leveraged finance issuance in the U.S., EMEA and Asia-Pacific as issuers took advantage of favorable market conditions to refinance obligations and fund M&A activity. The growth in leveraged finance revenue also reflects benefits from a favorable issuance mix in 2017 compared to the prior year where issuance volumes included a greater number of lower-yielding jumbo deals. The increase over the prior year also reflects higher investment-grade corporate debt revenue in the U.S. reflecting continued favorable market conditions and benefits from changes in the mix of fee type, new fee initiatives and pricing increases as well as growth in monitoring fees across all regions. Transaction revenue represented 73% of total CFG revenue in 2017, compared to 68% in the prior year period. In the U.S., revenue was $909.7 million, or 19% higher compared to the prior year. Internationally, revenue of $483.0 million increased 34% compared to the prior year.
Global SFG revenue of $495.5 million in 2017 increased $58.7 million, or 13%, compared to 2016. In the U.S., revenue of $340.1 million increased $46.8 million over 2016 primarily due to strong growth in CLO issuance reflecting an increase in bank loan supply and favorable market conditions which enabled both new securitizations and a surge in refinancing activity. Non-U.S. revenue in 2017 of $155.4 million increased $11.9 million compared to the prior year primarily reflecting growth across most asset classes in the EMEA region. Transaction revenue was 65% of total SFG revenue in 2017 compared to 62% in the prior year.
Global FIG revenue of $435.8 million in 2017 increased $66.9 million, or 18%, compared to 2016. In the U.S., revenue of $186.1 million increased $26.0 million compared to the prior year primarily reflecting higher issuance in the banking sector and benefits from changes in the mix of fee type, new fee initiatives and price increases. Internationally, revenue was $249.7 million in 2017, up $40.9 million compared to 2016 primarily due to higher banking revenue in EMEA from opportunistic issuance amidst current favorable market conditions as well as benefits from changes in the mix of fee type, new fee initiatives and pricing increases. The non-U.S. growth also reflects strength in banking revenue in the Asia-Pacific region reflecting higher cross-border issuance from Chinese banks and the non-bank financial sector. Transaction revenue was 45% of total FIG revenue in 2017 compared to 37% in 2016.
Global PPIF revenue was $431.3 million in 2017 and increased $19.1 million, or 5%, compared to 2016. In the U.S., revenue in 2017 was $266.4 million and decreased $9.8 million compared to 2016 primarily due to strong PFG refunding volumes in 2016. These decreases were partially offset by growth in infrastructure finance revenue coupled with benefits from changes in the mix of fee type, new fee initiatives and pricing increases. Outside the U.S., PPIF revenue was $164.9 million and increased $28.9 million compared to 2016 reflecting strong growth in infrastructure finance revenue in the Asia-Pacific region and growth in public finance revenue in EMEA. Transaction revenue was 65% of total PPIF revenue in 2017 compared to 63% in the prior year.
Operating and SG&A expenses in 2017 increased $128.8 million compared to 2016 primarily due to growth in performance-based compensation resulting from strong financial performance in 2017 coupled with increased headcount and higher salaries and employee benefits costs reflecting annual compensation increases. These increases were partially offset by lower legal fees and continued cost control initiatives.
Adjusted Operating Income and operating income in 2017, which includes intersegment royalty revenue and intersegment expenses, were $1,638.6 million and $1,563.9 million, respectively, and increased $283.2 million and $1,156.3 million, respectively, compared to 2016. Adjusted Operating Margin was 56.8% or 190 BPS higher than the prior year. Operating margin was 54.2% in 2017 compared to 16.5% in the prior year. Operating income and operating margin in 2016 were suppressed due to the Settlement Charge.
| MOODY’S 2017 10-K | 43 |
Table of Contents
Moody’s Analytics
The table below provides a summary of revenue and operating results, followed by further insight and commentary:
| Year ended December 31, | % Change Favorable (Unfavorable) |
|||||||||||
| 2017 | 2016 | |||||||||||
| Revenue: | ||||||||||||
| Research, data and analytics (RD&A) |
$ | 832.7 | $ | 667.6 | 25 | % | ||||||
| Enterprise risk solutions (ERS) |
448.6 | 418.8 | 7 | % | ||||||||
| Professional services (PS) |
149.0 | 147.0 | 1 | % | ||||||||
|
|
|
|
|
|||||||||
| Total external revenue |
1,430.3 | 1,233.4 | 16 | % | ||||||||
|
|
|
|
|
|||||||||
| Intersegment revenue |
16.0 | 13.5 | 19 | % | ||||||||
|
|
|
|
|
|||||||||
| Total MA Revenue |
1,446.3 | 1,246.9 | 16 | % | ||||||||
|
|
|
|
|
|||||||||
| Expenses: | ||||||||||||
| Operating and SG&A (external) |
983.3 | 860.9 | (14 | %) | ||||||||
| Operating and SG&A (intersegment) |
111.7 | 100.2 | (11 | %) | ||||||||
|
|
|
|
|
|||||||||
| Adjusted Operating Income | 351.3 | 285.8 | 23 | % | ||||||||
|
|
|
|
|
|||||||||
| Depreciation and amortization |
83.6 | 52.9 | (58 | %) | ||||||||
| Restructuring |
— | 1.8 | 100 | % | ||||||||
| Acquisition-Related Expenses |
22.5 | — | NM | |||||||||
|
|
|
|
|
|||||||||
| Operating income | $ | 245.2 | $ | 231.1 | 6 | % | ||||||
|
|
|
|
|
|||||||||
| Operating margin | 17.0 | % | 18.5 | % | ||||||||
| Adjusted Operating Margin | 24.3 | % | 22.9 | % | ||||||||
The following is a discussion of external MA revenue and operating expenses:
Global MA revenue increased $196.9 million, or 16%, compared to 2016 primarily due to growth in RD&A (which included approximately $92 million in revenue, or 7 percentage points of the growth, from the Bureau van Dijk acquisition) coupled with growth in ERS, which included revenue from the first quarter 2016 acquisition of GGY. Additionally, the growth over the prior year reflects benefits from higher fees within MA’s recurring revenue base due to enhanced content and continued alignment of usage and licensing parameters. Recurring revenue comprised 78% and 75% of total MA revenue in 2017 and 2016, respectively.
In the U.S., revenue of $645.6 million in 2017 increased $42.0 million, and reflected growth across all LOBs.
Non-U.S. revenue of $784.7 million in 2017 was $154.9 million higher than in 2016 reflecting growth in RD&A, which included approximately $82 million in non-U.S. Bureau van Dijk revenue, and higher ERS revenue.
Global RD&A revenue of $832.7 million, which comprised 58% and 54% of total external MA revenue in 2017 and 2016, respectively, increased $165.1 million, or 25%, over the prior year period. In the U.S., revenue of $424.4 million increased $35.1 million compared to 2016. Non-U.S. revenue of $408.3 million increased $130.0 million compared to the prior year. RD&A revenue in 2017 included approximately $92 million in revenue, or 14 percentage points of the growth, from the Bureau van Dijk acquisition (net of an approximate $36 million reduction relating to a deferred revenue adjustment required as part of acquisition accounting as further described in Note 7 to the financial statements). RD&A revenue growth also reflects strong results in the credit research and rating data feeds product lines, where enhanced content and continued alignment of usage and licensing parameters have generated higher fees.
Global ERS revenue of $448.6 million in 2017 increased $29.8 million, or 7%, over 2016. The growth is primarily due to higher revenue from risk and finance analytics products coupled with incremental revenue from GGY, which was acquired in March 2016. Additionally, the revenue growth reflects benefits from pricing increases within ERS’s recurring revenue base. Revenue in ERS is subject to quarterly volatility resulting from the variable nature of project timing and the concentration of software implementation and license revenue in a relatively small number of engagements. In the U.S., revenue of $166.6 million increased $3.7 million compared to the prior year. Non-U.S. revenue of $282.0 million increased $26.1 million compared to the prior year.
Global PS revenue of $149.0 million in 2017 increased 1% compared to 2016 reflecting higher revenue from analytical and research services in the U.S. mostly offset by lower revenue from these services internationally. In the U.S., revenue in 2017 was $54.6 million, up 6% compared to 2016. International revenue was $94.4 million, down 1% compared to 2016.
Operating and SG&A expenses in 2017 increased $122.4 million compared to 2016. The expense growth includes an approximate $74 million increase in compensation costs reflecting $32 million in Bureau van Dijk compensation costs coupled with annual salary
| 44 | MOODY’S 2017 10-K |
Table of Contents
increases, higher performance-based compensation and higher severance costs partially offset by the impact of cost control initiatives. Non-compensation costs increased approximately $48 million primarily due to Bureau van Dijk expenses.
There were $22.5 million in Acquisition-Related Expenses incurred to complete and integrate the acquisition of Bureau van Dijk.
Depreciation and amortization increased $30.7 million primarily due to the amortization of Bureau van Dijk’s intangible assets.
Adjusted Operating Income was $351.3 million in 2017 and increased $65.5 million compared to the same period in 2016. Operating income of $245.2 million in 2017 increased $14.1 million compared to the same period in 2016. Adjusted Operating Margin in 2017 was 24.3%, up 140BPS from 2016. Operating margin was 17.0% in 2017, down 150BPS from the prior year reflecting the aforementioned $22.5 million in Bureau van Dijk Acquisition-Related Expenses coupled with approximately $31 million of higher D&A primarily relating to Bureau van Dijk’s intangible assets. Adjusted Operating Income and operating income both include intersegment revenue and expense.
RESULTS OF OPERATIONS
Year ended December 31, 2016 compared with year ended December 31, 2015
Executive Summary
| » | Moody’s revenue in 2016 totaled $3,604.2 million, an increase of $119.7 million, or 3%, compared to 2015 reflecting good growth in MA revenue coupled with modest growth in MIS revenue. |
| » | MIS revenue was 2% higher compared to the prior year reflecting robust rated issuance volumes for high-yield corporate debt and bank loans as well as for public finance related activity in the second half of 2016. The growth also reflected benefits from changes in the mix of fee type, new fee initiatives and pricing increases. These increases were mostly offset by challenges in the first half of 2016 in the high-yield and investment-grade corporate debt sectors due to elevated credit spreads and market volatility. Additionally, there was lower securitization activity in the U.S. in the first half of 2016, most notably in the U.S. CLO and CMBS asset classes, which reflected the aforementioned elevated credit spreads and market volatility as well as uncertainty relating to the implementation of risk retention regulatory requirements for these asset classes. |
| » | MA revenue grew 7% compared to the prior year reflecting growth in ERS and RD&A, most notably in the U.S. Revenue grew in most product areas of ERS and included revenue from the acquisition of GGY. In RD&A, revenue growth was primarily driven by credit research subscriptions and licensing of ratings data. Excluding unfavorable changes in FX translation rates, MA revenue grew 10%. |
| » | Total operating expenses increased $954.4 million or 47%, reflecting: |
| » | an $863.8 million Settlement Charge relating to the MIS segment pursuant to an agreement with the DOJ and the attorneys general of 21 U.S. states and the District of Columbia; |
| » | higher compensation costs of $88.1 million associated with headcount growth in MA (including costs from the acquisition of GGY) and annual compensation increases company-wide partially offset by cost reduction initiatives in response to the challenging business conditions in MIS during the first half of 2016; and |
| » | a restructuring charge of $12.0 million associated with cost management initiatives in the MIS segment as well as in certain corporate overhead functions. |
| » | Operating income of $638.7 million in 2016, which included the aforementioned $863.8 million Settlement Charge, was down $834.7 million compared to 2015 and resulted in an operating margin of 17.7%, compared to 42.3% in the prior year. Adjusted Operating Income of $1,641.2 million in 2016 was up modestly compared to 2015, while Adjusted Operating Margin of 45.5% remained flat compared to 2015. |
| » | The change in non-operating income (expense) net, compared to the prior year is primarily due to higher FX gains which included an approximate $35 million gain related to the liquidation of a non-U.S. subsidiary and an approximate $15 million gain relating to the appreciation of the euro relative to the British pound during 2016. Partially offsetting these increases was higher interest expense reflecting the 2015 Senior Notes issued in March 2015 and the $300 million of additional borrowings under the 2014 Senior Notes (30-Year) in November 2015. |
| » | The ETR was 50.6% in 2016 compared to 31.2% in the prior year with the increase primarily reflecting the non-deductible nature of the federal portion of the aforementioned Settlement Charge. |
| MOODY’S 2017 10-K | 45 |
Table of Contents
| » | Diluted EPS of $1.36 in 2016, which included: i) a $3.59 Settlement Charge; ii) a $0.04 restructuring charge; iii) an $0.18 FX gain relating to the substantial liquidation of a subsidiary; and iv) $0.13 in Acquisition-Related Intangible Amortization, decreased $3.27 compared to 2015. Excluding all of the aforementioned items in 2016 and a $0.03 benefit from a Legacy Tax Matter and $0.11 in Acquisition-Related Intangible Amortization in the prior year, Adjusted Diluted EPS of $4.94 in 2016 increased $0.23. |
Moody’s Corporation
| Year ended December 31, | % Change Favorable (Unfavorable) |
|||||||||||
| 2016 | 2015 | |||||||||||
| Revenue: | ||||||||||||
| United States |
$ | 2,105.5 | $ | 2,009.0 | 5 | % | ||||||
|
|
|
|
|
|||||||||
| International: |
||||||||||||
| EMEA |
904.4 | 882.3 | 3 | % | ||||||||
| Asia-Pacific |
373.2 | 364.2 | 2 | % | ||||||||
| Americas |
221.1 | 229.0 | (3 | %) | ||||||||
|
|
|
|
|
|||||||||
| Total International |
1,498.7 | 1,475.5 | 2 | % | ||||||||
|
|
|
|
|
|||||||||
| Total |
3,604.2 | 3,484.5 | 3 | % | ||||||||
|
|
|
|
|
|||||||||
| Expenses: | ||||||||||||
| Operating |
1,026.6 | 976.3 | (5 | %) | ||||||||
| SG&A |
936.4 | 921.3 | (2 | %) | ||||||||
| Restructuring |
12.0 | — | NM | |||||||||
| Depreciation and amortization |
126.7 | 113.5 | (12 | %) | ||||||||
| Settlement Charge |
863.8 | — | NM | |||||||||
|
|
|
|
|
|||||||||
| Total |
2,965.5 | 2,011.1 | (47 | %) | ||||||||
|
|
|
|
|
|||||||||
| Operating income | $ | 638.7 | $ | 1,473.4 | (57 | %) | ||||||
|
|
|
|
|
|||||||||
| Adjusted Operating Income (1) | $ | 1,641.2 | $ | 1,586.9 | 3 | % | ||||||
|
|
|
|
|
|||||||||
| Interest expense, net | $ | (137.8 | ) | $ | (115.1 | ) | (20 | %) | ||||
| Other non-operating income, net | $ | 57.1 | $ | 21.3 | 168 | % | ||||||
|
|
|
|
|
|||||||||
| Non-operating expense, net |
$ | (80.7 | ) | $ | (93.8 | ) | 14 | % | ||||
|
|
|
|
|
|||||||||
| Net income attributable to Moody’s | $ | 266.6 | $ | 941.3 | (72 | %) | ||||||
| Diluted EPS attributable to Moody’s common shareholders | $ | 1.36 | $ | 4.63 | (71 | %) | ||||||
| Adjusted Diluted EPS attributable to Moody’s common shareholders (1) | $ | 4.94 | $ | 4.71 | 5 | % | ||||||
| Operating margin | 17.7 | % | 42.3 | % | ||||||||
| Adjusted Operating Margin (1) | 45.5 | % | 45.5 | % | ||||||||
| (1) | Adjusted Operating Income, Adjusted Operating Margin and Adjusted Diluted EPS attributable to Moody’s common shareholders are non-GAAP financial measures. Refer to the section entitled “Non-GAAP Financial Measures” of this Management Discussion and Analysis for further information regarding these measures. |
The table below shows Moody’s global staffing by geographic area:
| December 31, | % Change | |||||||||||
| 2016 | 2015 | |||||||||||
| United States | 3,386 | 3,364 | 1 | % | ||||||||
| International | 7,231 | 7,006 | 3 | % | ||||||||
|
|
|
|
|
|||||||||
| Total | 10,617 | 10,370 | 2 | % | ||||||||
|
|
|
|
|
|||||||||
Global revenue of $3,604.2 million in 2016 increased $119.7 million, or 3%, compared to 2015 and reflected good growth in MA revenue, which included revenue from the first quarter 2016 acquisition of GGY, coupled with modest growth in MIS revenue.
The $36.6 million increase in MIS revenue reflected robust rated issuance volumes for high-yield corporate debt and bank loans as well as for public finance related activity in the second half of 2016 reflecting both opportunistic refinancing and new issuance activity. The growth also reflected benefits from changes in the mix of fee type, new fee initiatives and pricing increases. These increases were mostly offset by challenges in the first half of 2016 in the high-yield and investment-grade corporate debt sectors due to elevated credit spreads and market volatility. Additionally, there was lower securitization activity in the U.S. in the first half of 2016, most nota-
| 46 | MOODY’S 2017 10-K |
Table of Contents
bly in the U.S. CLO and CMBS asset classes, which reflected the aforementioned elevated credit spreads and market volatility as well as uncertainty earlier in the year relating to the implementation of certain risk retention regulatory requirements by the end of 2016 for these asset classes.
The $83.1 million increase in MA revenue reflects growth in ERS and RD&A, most notably in the U.S. Revenue grew in most product areas of ERS and included revenue from the 2016 acquisition of GGY. In RD&A, revenue growth was primarily driven by credit research, subscriptions and licensing of ratings data partially offset by the impact of unfavorable changes in FX rates. Excluding unfavorable changes in FX translation rates, MA revenue grew 10%.
Transaction revenue accounted for 49% of global MCO revenue in 2016 compared 50% of global MCO revenue in 2015.
U.S. revenue of $2,105.5 million in 2016 increased $96.5 million over the prior year, reflecting strong growth in MA coupled with modest growth in MIS.
Non-U.S. revenue increased $23.2 million from 2015 reflecting modest growth in both reportable segments.
Operating expenses were $1,026.6 million in 2016 up $50.3 million from 2015 and included an increase in compensation costs of approximately $71 million. This increase reflects higher salaries and employee benefit expenses resulting from the impact of annual compensation increases and headcount growth in MA which includes headcount from the acquisition of GGY. The increase in compensation expenses also reflects higher incentive compensation reflecting greater achievement relative to targeted results compared to the prior year. These increases were partially offset by an approximate $21 million decrease in non-compensation expenses reflecting cost reduction initiatives in response to challenging business conditions in MIS earlier in the year.
SG&A expenses of $936.4 million in 2016 increased $15.1 million from the prior year period reflecting increased compensation costs primarily due to annual compensation increases company-wide and headcount growth in MA which included headcount from the GGY acquisition. The increase in compensation expenses also reflects higher incentive compensation reflecting greater achievement relative to targeted results compared to the prior year. Additionally, there was an increase in non-compensation expenses reflecting higher rent and occupancy costs being mostly offset by the impact of cost reduction initiatives in response to challenging business conditions in MIS earlier in the year.
The restructuring charge of $12.0 million relates to cost management initiatives in 2016 in the MIS segment as well as in certain corporate overhead functions.
D&A increased $13.2 million reflecting amortization of intangible assets from acquisitions as well as higher depreciation reflecting an increase in capital expenditures to support IT infrastructure and business growth.
The $863.8 million Settlement Charge relates to an agreement with the U.S. DOJ and the attorneys general of 21 U.S. states and the District of Columbia to resolve pending and potential civil claims related to the MIS segment.
Operating income of $638.7 million in 2016, which included the aforementioned $863.8 million Settlement Charge, was down $834.7 million compared to 2015 and resulted in an operating margin of 17.7%, compared to 42.3% in the prior year. Adjusted Operating Income of $1,641.2 million in 2016 was up modestly compared to 2015, while Adjusted Operating Margin of 45.5% remained flat compared to 2015.
Interest expense, net in 2016 was ($137.8) million, a $22.7 million increase in expense compared to 2015 reflecting interest on the 2015 Senior Notes which were issued in March 2015 as well as interest on the $300 million of additional borrowings under the 2014 Senior Notes (30-Year) in November 2015.
Other non-operating income, net was $57.1 million in 2016, a $35.8 million increase in income compared to 2015. This increase reflected FX gains of approximately $35 million related to the substantial liquidation of a subsidiary and approximately $15 million of gains relating to the appreciation of the euro relative to the British pound during 2016. FX gains in 2015 were immaterial. This increase in income was partially offset by a $6.4 million benefit from a Legacy Tax Matter in 2015 compared to a $1.6 million benefit in 2016.
The ETR was 50.6% in 2016 compared to 31.2% in the prior year with the increase primarily reflecting the non-deductible nature of the federal portion of the aforementioned Settlement Charge.
Net Income in 2016, which included an approximate $701 million net Settlement Charge more fully described above, was $266.6 million, or $674.7 million lower than prior year. Diluted EPS of $1.36 in 2016, which included: i) a $3.59 Settlement Charge; ii) a $0.04 restructuring charge and iii) an $0.18 FX gain relating to the substantial liquidation of a subsidiary; and iv) $0.13 in Acquisition-Related Intangible Amortization, decreased $3.27 compared to 2015. Excluding all of the aforementioned items in 2016 and a $0.03 benefit from a Legacy Tax Matter and $0.11 in Acquisition-Related Intangible Amortization in the prior year, Adjusted Diluted EPS of $4.94 in 2016 increased $0.23 primarily reflecting lower diluted weighted average shares outstanding. The reduction in diluted weighted average shares outstanding reflects share repurchases under the Company’s Board authorized share repurchase program partially offset by shares issued under the employee stock-based compensation programs.
| MOODY’S 2017 10-K | 47 |
Table of Contents
Segment Results
Moody’s Investors Service
The table below provides a summary of revenue and operating results, followed by further insight and commentary:
| Year ended December 31, | % Change Favorable (Unfavorable) |
|||||||||||
| 2016 | 2015 | |||||||||||
| Revenue: | ||||||||||||
| Corporate finance (CFG) |
$ | 1,122.3 | $ | 1,112.7 | 1 | % | ||||||
| Structured finance (SFG) |
436.8 | 449.1 | (3 | %) | ||||||||
| Financial institutions (FIG) |
368.9 | 365.6 | 1 | % | ||||||||
| Public, project and infrastructure finance (PPIF) |
412.2 | 376.4 | 10 | % | ||||||||
|
|
|
|
|
|||||||||
| Total ratings revenue |
2,340.2 | 2,303.8 | 2 | % | ||||||||
|
|
|
|
|
|||||||||
| MIS Other |
30.6 | 30.4 | 1 | % | ||||||||
|
|
|
|
|
|||||||||
| Total external revenue |
2,370.8 | 2,334.2 | 2 | % | ||||||||
|
|
|
|
|
|||||||||
| Intersegment royalty |
100.2 | 93.5 | 7 | % | ||||||||
|
|
|
|
|
|||||||||
| Total MIS Revenue |
2,471.0 | 2,427.7 | 2 | % | ||||||||
|
|
|
|
|
|||||||||
| Expenses: | ||||||||||||
| Operating and SG&A (external) |
1,102.1 | 1,107.2 | — | |||||||||
| Operating and SG&A (intersegment) |
13.5 | 13.1 | (3 | %) | ||||||||
|
|
|
|
|
|||||||||
| Adjusted Operating Income | 1,355.4 | 1,307.4 | 4 | % | ||||||||
|
|
|
|
|
|||||||||
| Depreciation and amortization |
73.8 | 66.0 | (12 | %) | ||||||||
| Restructuring |
10.2 | — | NM | |||||||||
| Settlement Charge |
863.8 | — | NM | |||||||||
|
|
|
|
|
|||||||||
| Operating income | $ | 407.6 | $ | 1,241.4 | (67 | %) | ||||||
|
|
|
|
|
|||||||||
| Operating margin | 16.5 | % | 51.1 | % | ||||||||
| Adjusted Operating Margin | 54.9 | % | 53.9 | % | ||||||||
The following is a discussion of external MIS revenue and operating expenses:
Global MIS revenue of $2,370.8 million in 2016 was up 2% compared to 2015 reflecting robust rated issuance volumes for high-yield corporate debt, bank loans and public finance in the second half of 2016 as capital market volatility and elevated credit spreads that hindered issuance in the first half of 2016 subsided. Additionally, the growth reflects the favorable impact of changes in the mix of fee type, new fee initiatives and pricing increases. These increases were mostly offset by challenges in the first half of 2016 in both the speculative-grade and investment-grade corporate debt sectors due to elevated credit spreads and market volatility at the time coupled with an unfavorable shift in issuance mix for investment-grade corporate debt. Additionally, there was lower securitization activity in the U.S. in the first half of 2016, primarily in the U.S. CLO and CMBS asset classes, which reflected the aforementioned elevated credit spreads and market volatility as well as uncertainty earlier in the year relating to the December 2016 implementation deadline for certain risk retention regulatory requirements for these asset classes.
Transaction revenue for MIS was 61% in both 2016 and 2015.
In the U.S., revenue was $1,501.9 million in 2016, an increase of $27.6 million compared to 2015 and reflected benefits from changes in the mix of fee type, new fee initiatives and pricing increases coupled with second half of 2016 growth in rated issuance volumes for high-yield corporate debt and bank loans as well as strong public finance issuance. These increases were partially offset by lower rated issuance volumes for high-yield corporate debt in the first half of 2016 and a decline in investment-grade corporate debt rated issuance volumes which was most notable in the fourth quarter of 2016. Additionally, there were declines in securitization activity in the CLO and CMBS asset classes within SFG in the first half of 2016.
Non-U.S. revenue was $868.9 million in 2016, an increase of $9.0 million compared to 2015 primarily reflecting second half of 2016 growth in high-yield corporate debt and bank loans as well as investment-grade corporate debt. This growth in the second half reflected improved market sentiment following volatility in the first half of 2016 as well as the ECB sponsored CSPP providing a ballast to corporate debt issuance in the EMEA region. The growth over the prior year also reflects changes in the mix of fee type, new fee initiatives and pricing increases. These increases were partially offset by lower revenue in the first half of 2016 primarily reflecting declines in investment-grade and high-yield corporate debt across all regions.
| 48 | MOODY’S 2017 10-K |
Table of Contents
Global CFG revenue of $1,122.3 million in 2016 was up 1% compared to 2015. The increase reflects benefits from changes in the mix of fee type, new fee initiatives and pricing increases coupled with robust rated issuance volumes for high-yield corporate debt and bank loans in the U.S. and EMEA in the second half of 2016 as capital market volatility and elevated credit spreads that hindered issuance in the first half of 2016 subsided. The increase also reflects higher investment-grade rated issuance volumes in EMEA in the second half of 2016 reflecting additional liquidity in the region resulting from the ECB sponsored CSPP. These increases were partially offset by lower rated issuance volumes in the first half of 2016 for investment-grade and speculative-grade corporate debt across all regions due to elevated credit spreads and capital market volatility at the time. Also, there were lower U.S. investment-grade rated issuance volumes in the fourth quarter of 2016 reflecting an increase in benchmark interest rates immediately following the U.S. presidential election in November. Transaction revenue represented 68% of total CFG revenue in 2016, compared to 69% in the prior year period. In the U.S., revenue in 2016 was $762.9 million, or $10.0 million higher than the prior year. Internationally, revenue of $359.4 million in the 2016 was flat compared to the prior year.
Global SFG revenue of $436.8 million in 2016 decreased $12.3 million, or 3%, compared to 2015. In the U.S., revenue of $293.3 million decreased $18.2 million compared to 2015. This decrease primarily reflected lower CLO formation in the first half of 2016 due to elevated credit spreads and declining availability of collateral for these instruments earlier in the year. Additionally, the decrease reflected lower securitization activity in the CMBS asset class reflecting higher average credit spreads over the course of 2016, particularly in the first quarter, as well as uncertainties relating to the implementation of certain risk retention regulatory requirements for this asset class. These declines were partially offset by benefits from changes in the mix of fee type, new fee initiatives and pricing increases. Non-U.S. revenue in 2016 of $143.5 million increased $5.9 million compared to the prior year primarily reflecting growth in RMBS and ABS in EMEA. Transaction revenue was 62% of total SFG revenue in 2016 compared to 64% in the prior year.
Global FIG revenue of $368.9 million in 2016 increased $3.3 million, or 1%, compared to 2015. In the U.S., revenue of $160.1 million increased $3.7 million compared to the prior year primarily reflecting benefits from changes in the mix of fee type, new fee initiatives and pricing increases as well as higher M&A related issuance volumes in the insurance sector. These increases were partially offset by reduced banking-related issuance volumes due to market volatility in the first half of 2016. Internationally, revenue was $208.8 million in 2016, or flat compared to 2015 with benefits from changes in the mix of fee type, new fee initiatives and pricing increases and growth in the Asia-Pacific region reflecting higher cross-border issuance from Chinese banks and asset managers being offset by declines in banking-related issuance in EMEA. Transaction revenue was 37% of total FIG revenue in both 2016 and 2015.
Global PPIF revenue was $412.2 million in 2016 and increased $35.8 million, or 10%, compared to 2015. In the U.S., revenue in 2016 was $276.2 million and increased $31.5 million compared to 2015 primarily due to benefits from changes in the mix of fee type, new fee initiatives and pricing increases as well as strong growth in public finance issuance in the second half of 2016. This growth in issuance reflects opportunistic refunding activity amidst favorable market conditions as well as higher new issuance volumes to fund municipal infrastructure investment needs. Additionally, the growth in the U.S. reflects higher infrastructure finance revenue. Outside the U.S., PPIF revenue was $136.0 million and increased $4.3 million compared to 2015 reflecting benefits from changes in the mix of fee type, new fee initiatives and pricing increases as well as higher infrastructure finance revenue in the Americas region. These increases were partially offset by lower project finance revenue across all non-U.S. regions. Transaction revenue was 63% of total PPIF revenue in 2016 compared to 60% in the prior year.
Global MIS Other revenue of $30.6 million in 2016 was flat compared to 2015.
Operating and SG&A expenses in 2016 decreased $5.1 million compared to 2015 primarily reflecting lower non-compensation costs of approximately $25.0 million reflecting overall cost control initiatives. This decrease was partially offset by higher compensation expenses of approximately $20 million compared to the prior year reflecting annual salary increases coupled with higher incentive compensation costs resulting from higher achievement against full-year targeted results compared to the prior year.
The increase in D&A compared to the prior year reflects capital expenditures related to investments in the Company’s IT and operational infrastructure.
The restructuring charge in 2016 relates to cost management initiatives in the MIS segment as well as in certain corporate overhead functions.
The Settlement Charge is pursuant to an agreement with the DOJ and the attorneys general of 21 U.S. states and the District of Columbia.
Adjusted Operating Income was $1,355.4 million and increased $48.0 million compared to the prior year. Operating income in 2016, which includes the aforementioned $863.8 million Settlement Charge, was $407.6 million and decreased $833.8 million compared to the prior year. Adjusted Operating Margin was 54.9% or 100 BPS higher than the prior year. Operating margin was 16.5% in 2016 compared to 51.1% in the prior year, with the decline primarily due to the aforementioned Settlement Charge. Adjusted Operating Income and operating income both include intersegment revenue and expense.
| MOODY’S 2017 10-K | 49 |
Table of Contents
Moody’s Analytics
The table below provides a summary of revenue and operating results, followed by further insight and commentary:
| Year ended December 31, | % Change Favorable (Unfavorable) |
|||||||||||
| 2016 | 2015 | |||||||||||
| Revenue: | ||||||||||||
| Research, data and analytics (RD&A) |
$ | 667.6 | $ | 626.4 | 7 | % | ||||||
| Enterprise risk solutions (ERS) |
418.8 | 374.0 | 12 | % | ||||||||
| Professional services (PS) |
147.0 | 149.9 | (2 | %) | ||||||||
|
|
|
|
|
|||||||||
| Total external revenue |
1,233.4 | 1,150.3 | 7 | % | ||||||||
|
|
|
|
|
|||||||||
| Intersegment revenue |
13.5 | 13.1 | 3 | % | ||||||||
|
|
|
|
|
|||||||||
| Total MA Revenue |
1,246.9 | 1,163.4 | 7 | % | ||||||||
|
|
|
|
|
|||||||||
| Expenses: | ||||||||||||
| Operating and SG&A (external) |
860.9 | 790.4 | (9 | %) | ||||||||
| Operating and SG&A (intersegment) |
100.2 | 93.5 | (7 | %) | ||||||||
|
|
|
|
|
|||||||||
| Adjusted Operating Income | 285.8 | 279.5 | 2 | % | ||||||||
|
|
|
|
|
|||||||||
| Depreciation and amortization |
52.9 | 47.5 | (11 | %) | ||||||||
| Restructuring |
1.8 | — | NM | |||||||||
|
|
|
|
|
|||||||||
| Operating income | $ | 231.1 | $ | 232.0 | — | |||||||
|
|
|
|
|
|||||||||
| Operating margin | 18.5 | % | 19.9 | % | ||||||||
| Adjusted Operating Margin | 22.9 | % | 24.0 | % | ||||||||
The following is a discussion of external MA revenue and operating expenses:
Global MA revenue increased $83.1 million, or 7%, compared to 2015 and reflected growth in RD&A as well as ERS, which included revenue from the acquisition of GGY. Additionally, the growth over the prior year reflects benefits from pricing increases within MA’s recurring revenue base. Excluding unfavorable changes in FX rates, MA revenue grew 10% compared to the prior year. Recurring revenue comprised 75% and 74% of total MA revenue in 2016 and 2015, respectively.
In the U.S., revenue of $603.6 million in 2016 increased $68.9 million, and reflected growth in RD&A and ERS. The growth in RD&A reflected strength in credit research subscriptions and licensing of ratings data as well as higher revenue within SAV and ECCA. The increase in ERS revenue reflected growth across all product verticals and included revenue from the acquisition of GGY in March 2016.
Non-U.S. revenue of $629.8 million in 2016 was $14.2 million higher than in 2015 reflecting growth in RD&A and ERS partially offset by unfavorable changes in FX rates. The growth in RD&A primarily reflects strength in credit research subscriptions and licensing of ratings data in the Asia-Pacific region. The increase in ERS was primarily due to higher revenue from the Assets Liability & Capital and Credit Assessment & Origination product verticals in the EMEA region coupled with revenue from the acquisition of GGY. These increases were partially offset by declines in the Credit Assessment & Origination product vertical in the Americas region.
Global RD&A revenue of $667.6 million, which comprised 54% of total external MA revenue in both 2016 and 2015, increased $41.2 million, or 7%, over the prior year period. Excluding unfavorable changes in FX rates, RD&A revenue increased 9% over the prior year. The growth reflected strength in credit research subscriptions and licensing of ratings data as well as higher revenue within SAV and ECCA. The growth compared to 2015 also reflects the benefits of pricing increases. In the U.S., revenue of $389.3 million increased $37.4 million compared to 2015. Non-U.S. revenue of $278.3 million increased $3.8 million compared to the prior year.
Global ERS revenue of $418.8 million in 2016 increased $44.8 million, or 12%, over 2015. Excluding unfavorable changes in FX rates, ERS revenue grew 15% reflecting increases across most product offerings and included revenue from the acquisition of GGY in March of 2016. Additionally, the revenue growth reflects benefits from pricing increases within ERS’s recurring revenue base. Revenue in ERS is subject to quarterly volatility resulting from the variable nature of project timing and the concentration of software implementation and license revenue in a relatively small number of engagements. In the U.S., revenue of $162.9 million increased $31.7 million compared to the prior year. Non-U.S. revenue of $255.9 million increased $13.1 million compared to the prior year.
Global PS revenue of $147.0 million in 2016 decreased $2.9 million, or 2%, from 2015. Excluding the unfavorable impact from changes in FX translation rates, PS revenue was flat compared to the prior year. In the U.S. and internationally revenue was $51.4 million and $95.6 million, respectively, or flat and down 3%, respectively.
| 50 | MOODY’S 2017 10-K |
Table of Contents
The increase in D&A compared to the prior year reflects capital expenditures related to investments in the Company’s IT and operational infrastructure as well as amortization of acquired intangible assets.
Operating and SG&A expenses in 2016 increased $70.5 million compared to 2015. The expense growth primarily reflects an approximate $68 million increase in compensation costs primarily due to higher headcount to support business growth as well as headcount from the acquisition of GGY coupled with annual merit increases.
Adjusted Operating Income was $285.8 million in 2016 and increased $6.3 million compared to the same period in 2015. Operating income of $231.1 million in 2016 decreased $0.9 million compared to the same period in 2015. Adjusted Operating Margin in 2016 was 22.9%, down 110bps from 2015. Operating margin was 18.5% in 2016, down 140bps from the prior year. Operating margin and Adjusted Operating Margin in 2016 were suppressed due to a larger proportion of overhead costs allocated to MA under the Company’s revenue-split methodology. Adjusted operating income and operating income both include intersegment revenue and expense.
Foreign exchange risk:
Moody’s maintains a presence in 40 countries outside the U.S. In 2017, approximately 40% and 39% of both the Company’s revenue and expenses, respectively were denominated in functional currencies other than the U.S. dollar, principally in the British pound and the euro. As such, the Company is exposed to market risk from changes in FX rates. As of December 31, 2017, approximately 81% of Moody’s assets were located outside the U.S. making the Company susceptible to fluctuations in FX rates. The effects of translating assets and liabilities of non-U.S. operations with non-U.S. functional currencies to the U.S. dollar are charged or credited to OCI.
The effects of revaluing assets and liabilities that are denominated in currencies other than a subsidiary’s functional currency are charged to other non-operating income (expense), net in the Company’s consolidated statements of operations. Accordingly, the Company enters into foreign exchange forwards to partially mitigate the change in fair value on certain assets and liabilities denominated in currencies other than a subsidiary’s functional currency. The following table shows the impact to the fair value of the forward contracts if foreign currencies strengthened against the U.S. dollar:
| Foreign Currency Forwards * |
Impact on fair value of contract if foreign currency strengthened by 10% | |||
| Sell |
Buy | |||
| U.S. dollar | British pound | $47 million unfavorable impact | ||
| U.S. dollar | Canadian dollar | $6 million unfavorable impact | ||
| U.S. dollar | Euro | $47 million unfavorable impact | ||
| U.S. dollar | Japanese yen | $3 million unfavorable impact | ||
| U.S. dollar | Singapore dollar | $4 million unfavorable impact | ||
| * | Refer to Note 5 to the consolidated financial statements in Item 8 of this Form 10-K for further detail on the forward contracts. |
The change in fair value of the foreign exchange forward contracts would be offset by FX revaluation gains or losses on underlying assets and liabilities denominated in currencies other than a subsidiary’s functional currency.
Also, the Company has designated €500 million of the 2015 Senior Notes as a net investment hedge to mitigate FX exposure relating to euro denominated net investments in subsidiaries. If the euro were to strengthen 10% relative to the U.S. dollar, there would be an approximate $56 million unfavorable adjustment to OCI related to this net investment hedge. This adjustment would be offset by favorable translation adjustments on the Company’s euro net investment in subsidiaries.
Moody’s aggregate cash and cash equivalents and short- term investments of $1.2 billion at December 31, 2017 included $1 billion located outside the U.S. Approximately 62% of the Company’s aggregate cash and cash equivalents and short term investments at December 31, 2017 were held in currencies other than USD. As such, a decrease in the value of foreign currencies against the U.S. dollar, particularly the euro and GBP, could reduce the reported amount of USD cash and cash equivalents and short-term investments.
Credit and Interest rate risk:
The Company’s interest rate risk management objectives are to reduce the funding cost and volatility to the Company and to alter the interest rate exposure to the desired risk profile. Moody’s uses interest rate swaps as deemed necessary to assist in accomplishing these objectives.
The Company is exposed to interest rate risk on its various outstanding fixed rate debt for which the fair value of the outstanding fixed rate debt fluctuates based on changes in interest rates. The Company has entered into interest rate swaps to convert the fixed rate of interest on certain of its borrowings to a floating rate based on the 3-month LIBOR. These swaps are adjusted to fair market value
| MOODY’S 2017 10-K | 51 |
Table of Contents
based on prevailing interest rates at the end of each reporting period and fluctuations are recorded as a reduction or addition to the carrying value of the borrowing, while net interest payments are recorded as interest expense/income in the Company’s consolidated statement of operations. A hypothetical change of 100bps in the LIBOR-based swap rate would result in an approximate $26 million change to the fair value of these interest rate swaps.
Additional information on these interest rate swaps is disclosed in Note 5 to the consolidated financial statements located in Item 8 of this Form 10-K.
Moody’s cash equivalents consist of investments in high-quality investment-grade securities within and outside the U.S. with maturities of three months or less when purchased. The Company manages its credit risk exposure by allocating its cash equivalents among various money market mutual funds, money market deposit accounts, certificates of deposit and issuers of high-grade commercial paper and by limiting the amount it can invest with any single issuer. Short-term investments primarily consist of certificates of deposit.
LIQUIDITY AND CAPITAL RESOURCES
Cash Flow
The Company is currently financing its operations, capital expenditures, acquisitions and share repurchases from operating and financing cash flows.
The following is a summary of the changes in the Company’s cash flows followed by a brief discussion of these changes:
| Year Ended December 31, | Year Ended December 31, | |||||||||||||||||||||||
| 2017 | 2016 | $ Change Favorable (unfavorable) |
2016 | 2015 | $ Change Favorable (unfavorable) |
|||||||||||||||||||
| Net cash provided by operating activities | $ | 747.5 | $ | 1,259.2 | $ | (511.7 | ) | $ | 1,259.2 | $ | 1,198.1 | $ | 61.1 | |||||||||||
| Net cash (used in) provided by investing activities | $ | (3,420.0 | ) | $ | 102.0 | $ | (3,522.0 | ) | $ | 102.0 | $ | (92.0 | ) | $ | 194.0 | |||||||||
| Net cash provided by (used in) financing activities | $ | 1,607.2 | $ | (1,042.9 | ) | $ | 2,650.1 | $ | (1,042.9 | ) | $ | (505.5 | ) | $ | (537.4 | ) | ||||||||
| Free Cash Flow * | $ | 656.9 | $ | 1,144.0 | $ | (487.1 | ) | $ | 1,144.0 | $ | 1,109.1 | $ | 34.9 | |||||||||||
| * | Free Cash Flow is a non-GAAP measure and is defined by the Company as net cash provided by operating activities minus cash paid for capital expenditures. Refer to “Non-GAAP Financial Measures” of this MD&A for further information on this financial measure. |
Net cash provided by operating activities
Year ended December 31, 2017 compared to the year ended December 31, 2016:
Net cash flows from operating activities decreased $511.7 million compared to the prior year primarily due to the approximate $701 million net payment for the Settlement Charge in 2017 (net of an approximate $163 million tax benefit relating to the charge). This was partially offset by an increase in cash flows primarily relating to the Company’s strong Adjusted Net Income growth in 2017.
Additionally, the Company made approximately $26 million and $22 million in contributions to its funded U.S. pension plan in 2017 and 2016, respectively.
Year ended December 31, 2016 compared to the year ended December 31, 2015:
Net cash flows from operating activities increased $61.1 million compared to the prior year primarily due to:
| » | an approximate $64 million increase due to the timing of income tax payments; |
| » | an approximate $43 million increase relating to higher deferred revenue reflecting overall business growth; |
| » | an approximate $43 million increase reflecting higher incentive compensation payouts in 2015 compared to 2016 as well as higher incentive compensation accruals reflecting greater achievement against full-year targeted results in 2016 compared to 2015 |
partially offset by:
| » | approximate $79 million decrease in cash flow from changes in accounts receivable balances primarily reflecting greater growth in accounts receivable in 2016 compared to 2015. Approximately 30% and 33% of the Company’s accounts receivable at December 31, 2016 and 2015, respectively, represent unbilled receivables which primarily reflect certain annual fees in MIS which are billed in arrears. |
Additionally, the Company made approximately $22 million to its funded U.S. pension plan in both 2016 and 2015.
| 52 | MOODY’S 2017 10-K |
Table of Contents
Net cash provided by (used in) investing activities
Year ended December 31, 2017 compared to the year ended December 31, 2016:
The $3,522.0 million increase in cash flows used in investing activities compared to 2016 primarily reflects:
| » | a $3.4 billion increase in cash paid for acquisitions compared to the prior year primarily reflecting the acquisition of Bureau van Dijk in the third quarter of 2017; |
| » | lower net maturities of short-term investments of $251.2 million; |
Partially offset by:
| » | cash received of $111.1 million relating to the Purchase Price Hedge. |
Year ended December 31, 2016 compared to the year ended December 31, 2015:
The $194.0 million increase in cash flows provided by investing activities compared to 2015 primarily reflects:
| » | higher net maturities of short-term investments of $354.7 million; |
Partially offset by:
| » | a $73.2 million increase in cash paid for acquisitions and equity investments primarily due to the acquisition of GGY in 2016; |
| » | net cash paid of $23.1 million for the settlement of forward contracts designated as net investment hedges in 2016 compared to cash received of $39.7 million in 2015; and |
| » | higher capital expenditures of approximately $26 million reflecting investment in the Company’s IT and operational infrastructure. |
Net cash provided by financing activities
Year ended December 31, 2017 compared to the year ended December 31, 2016:
The $2,650.1 million increase in cash provided by financing activities was primarily attributed to:
| » | proceeds of $1.5 billion from notes and a term loan issued as well as $0.1 billion in net proceeds from commercial paper to fund the acquisition of Bureau van Dijk. Additionally, reflects $0.8 billion of notes issued in the first quarter of 2017 to fund the payment of the 2016 Settlement Charge and the early repayment of the Series 2007-1 Notes; |
| » | treasury shares repurchased of $199.7 million in 2017 compared to $738.8 million in 2016; |
partially offset by:
| » | repayment of the $300 million Series 2007-1 Notes. |
Year ended December 31, 2016 compared to the year ended December 31, 2015:
The $537.4 million increase in cash used in financing activities was primarily attributed to:
| » | $852.8 million from the issuance of long-term debt in 2015, no long-term debt was issued in 2016; |
| » | $45.4 million paid to acquire the non-controlling interest of KIS and additional shares of KIS Pricing; |
partially offset by:
| » | treasury shares repurchased of $738.8 million in 2016 compared to $1,098.1 million repurchased in 2015. |
Cash and short-term investments held in non-U.S. jurisdictions
The Company’s aggregate cash and cash equivalents and short-term investments of $1.2 billion at December 31, 2017 included approximately $1 billion located outside of the U.S. Approximately 27% of the Company’s aggregate cash and cash equivalents and short-term investments is denominated in euros and British pounds. The Company manages both its U.S. and international cash flow to maintain sufficient liquidity in all regions to effectively meet its operating needs.
Other Material Future Cash Requirements
The Company believes that it has the financial resources needed to meet its cash requirements and expects to have positive operating cash flow in 2018. Cash requirements for periods beyond the next twelve months will depend, among other things, on the Company’s profitability and its ability to manage working capital requirements. The Company may also borrow from various sources.
The Company remains committed to using its strong cash flow to create value for shareholders by investing in growing areas of the business, reinvesting in ratings quality initiatives, making selective acquisitions, repurchasing stock and paying a dividend, all in a manner consistent with maintaining sufficient liquidity after giving effect to any additional indebtedness that may be incurred.
In January 2018, the Board of Directors of the Company declared a quarterly dividend of $0.44 per share of Moody’s common stock, payable March 12, 2018 to shareholders of record at the close of business on February 20, 2018. The continued payment of dividends
| MOODY’S 2017 10-K | 53 |
Table of Contents
at this rate, or at all, is subject to the discretion of the Board. In December 2015, the Board authorized $1.0 billion of share repurchase authority, which had a remaining repurchase authority of approximately $0.5 million at December 31, 2017. Full-year 2018 total share repurchases are expected to be approximately $200 million, subject to available cash, market conditions and other ongoing capital allocation decisions.
The Company has future cash requirements, including operating leases and debt service and principal payments, as noted in the tables that follow as well as future payments related to the transition tax under the Tax Act:
Indebtedness
At December 31, 2017, Moody’s had $5.5 billion of outstanding debt and approximately $0.9 billion of additional capacity available under the Company’s CP program which is backstopped by the 2015 Facility as more fully discussed in Note 16 to the consolidated financial statements. At December 31, 2017, the Company was in compliance with all covenants contained within all of the debt agreements. All of the Company’s long-term debt agreements contain cross default provisions which state that default under one of the aforementioned debt instruments could in turn permit lenders under other debt instruments to declare borrowings outstanding under those instruments to be immediately due and payable. At December 31, 2017, there were no such cross defaults.
The repayment schedule for the Company’s borrowings outstanding at December 31, 2017 is as follows:
| Year Ended |
2010 Senior Notes due 2020 |
2012 Senior Notes due 2022 |
2013 Senior Notes due 2024 |
2014 Senior Notes (5-Year) due 2019 |
2014 Senior Notes (30-Year) due 2044 |
2015 Senior Notes due 2027 |
Term Loan Facility due 2020 |
2017 Floating Rate Senior Notes due 2018 |
2017 Senior Notes due 2021 |
2017 Private Placement Notes due 2023 |
2017 Private Placement Notes due 2028 |
Commercial Paper |
Total | |||||||||||||||||||||||||||||||||||||||
| 2018 | $ | — | $ | — | $ | — | $ | — | $ | — | $ | — | $ | — | $ | 300.0 | $ | — | $ | — | $ | — | $ | 130.0 | $ | 430.0 | ||||||||||||||||||||||||||
| 2019 | — | — | — | 450.0 | — | — | — | — | — | — | — | — | 450.0 | |||||||||||||||||||||||||||||||||||||||
| 2020 | 500.0 | — | — | — | — | — | 500.0 | — | — | — | — | — | 1,000.0 | |||||||||||||||||||||||||||||||||||||||
| 2021 | — | — | — | — | — | — | — | — | 500.0 | — | — | — | 500.0 | |||||||||||||||||||||||||||||||||||||||
| 2022 | — | 500.0 | — | — | — | — | — | — | — | — | — | — | 500.0 | |||||||||||||||||||||||||||||||||||||||
| Thereafter | — | — | 500.0 | — | 600.0 | 600.4 | — | — | — | 500.0 | 500.0 | — | 2,700.4 | |||||||||||||||||||||||||||||||||||||||
|
|
|
|
|
|
|
|
|
|
|
|
|
|
|
|
|
|
|
|
|
|
|
|
|
|
|
|||||||||||||||||||||||||||
| Total | $ | 500.0 | $ | 500.0 | $ | 500.0 | $ | 450.0 | $ | 600.0 | $ | 600.4 | $ | 500.0 | $ | 300.0 | $ | 500.0 | $ | 500.0 | $ | 500.0 | $ | 130.0 | $ | 5,580.4 | ||||||||||||||||||||||||||
|
|
|
|
|
|
|
|
|
|
|
|
|
|
|
|
|
|
|
|
|
|
|
|
|
|
|
|||||||||||||||||||||||||||
Management may consider pursuing additional long-term financing when it is appropriate in light of cash requirements for operations, share repurchases and other strategic opportunities, which would result in higher financing costs.
Off-Balance Sheet Arrangements
At December 31, 2017, Moody’s did not have any relationships with unconsolidated entities or financial partnerships, such as entities often referred to as special purpose or variable interest entities where Moody’s is the primary beneficiary, which would have been established for the purpose of facilitating off-balance sheet arrangements or other contractually narrow or limited purposes. As such, Moody’s is not exposed to any financing, liquidity, market or credit risk that could arise if it had engaged in such relationships.
Contractual Obligations
The following table presents payments due under the Company’s contractual obligations as of December 31, 2017:
| Payments Due by Period | ||||||||||||||||||||
| (in millions) |
Total | Less Than 1 Year |
1-3 Years | 3-5 Years | Over 5 Years | |||||||||||||||
| Indebtedness (1) | $ | 7,232.9 | $ | 615.0 | $ | 2,423.1 | $ | 1,205.3 | 2,989.5 | |||||||||||
| Operating lease obligations | 715.1 | 108.3 | 167.8 | 148.4 | 290.6 | |||||||||||||||
| Purchase obligations | 152.8 | 80.6 | 58.7 | 11.4 | 2.1 | |||||||||||||||
| Capital lease obligations | 0.2 | 0.2 | — | — | — | |||||||||||||||
| Pension obligations (2) | 134.0 | 8.0 | 40.0 | 18.0 | 68.0 | |||||||||||||||
|
|
|
|
|
|
|
|
|
|
|
|||||||||||
| Total (3) | $ | 8,235.0 | $ | 812.1 | $ | 2,689.6 | $ | 1,383.1 | $ | 3,350.2 | ||||||||||
|
|
|
|
|
|
|
|
|
|
|
|||||||||||
| (1) | Reflects principal payments, related interest and applicable fees due on all indebtedness outstanding as described in Note 16 to the consolidated financial statements. |
| (2) | Reflects projected benefit payments relating to the Company’s U.S. unfunded DBPPs and Retirement and Other Plans described in Note 13 to the consolidated financial statements |
| 54 | MOODY’S 2017 10-K |
Table of Contents
| (3) | The table above does not include the Company’s net long-term tax liabilities of $389.1 million relating to UTPs, since the expected cash outflow of such amounts by period cannot be reasonably estimated. Additionally, the table above does not include approximately $247 million relating to the deemed repatriation liability resulting from the Tax Act enacted into law in the U.S. in December 2017. |
Non-GAAP Financial Measures:
In addition to its reported results, Moody’s has included in this MD&A certain adjusted results that the SEC defines as “non-GAAP financial measures.” Management believes that such non-GAAP financial measures, when read in conjunction with the Company’s reported results, can provide useful supplemental information for investors analyzing period-to-period comparisons of the Company’s performance, facilitate comparisons to competitors’ operating results and can provide greater transparency to investors of supplemental information used by management in its financial and operational decision-making. These non-GAAP measures, as defined by the Company, are not necessarily comparable to similarly defined measures of other companies. Furthermore, these non-GAAP measures should not be viewed in isolation or used as a substitute for other GAAP measures in assessing the operating performance or cash flows of the Company. Below are descriptions of the Company’s non-GAAP financial measures accompanied by a reconciliation of the non-GAAP measure to its most directly comparable GAAP measure:
Adjusted Operating Income and Adjusted Operating Margin:
The Company presents Adjusted Operating Income because management deems this metric to be a useful measure of assessing the operating performance of Moody’s. Adjusted Operating Income excludes depreciation and amortization, Acquisition-Related Expenses, restructuring and the Settlement Charge. Depreciation and amortization are excluded because companies utilize productive assets of different ages and use different methods of acquiring and depreciating productive assets. Acquisition-Related Expenses consist of expenses incurred to complete and integrate the acquisition of Bureau van Dijk and are excluded due to the material nature of these expenses which are not expected to recur at this dollar magnitude subsequent to the completion of the multi-year integration effort. Acquisition related expenses from previous acquisitions were not material. Restructuring charges are excluded as the frequency and magnitude of these charges may vary widely across periods and companies. The Settlement Charge is a material non-recurring event that is not expected to recur in the future at this magnitude. Management believes that the exclusion of depreciation and amortization, Acquisition-Related Expenses, restructuring and the Settlement Charge, as detailed in the reconciliation below, allows for an additional perspective on the Company’s operating results from period to period and across companies. The Company defines Adjusted Operating Margin as Adjusted Operating Income divided by revenue.
| Year Ended December 31, | ||||||||||||
| 2017 | 2016 | 2015 | ||||||||||
| Operating income | $ | 1,809.1 | $ | 638.7 | $ | 1,473.4 | ||||||
| Adjustments: | ||||||||||||
| Restructuring |
— | 12.0 | — | |||||||||
| Depreciation and amortization |
158.3 | 126.7 | 113.5 | |||||||||
| Acquisition-Related Expenses |
22.5 | — | — | |||||||||
| Settlement Charge |
— | 863.8 | — | |||||||||
|
|
|
|
|
|
|
|||||||
| Adjusted Operating Income | $ | 1,989.9 | $ | 1,641.2 | $ | 1,586.9 | ||||||
|
|
|
|
|
|
|
|||||||
| Operating margin | 43.0 | % | 17.7 | % | 42.3 | % | ||||||
| Adjusted Operating Margin | 47.3 | % | 45.5 | % | 45.5 | % | ||||||
Adjusted Net Income and Adjusted Diluted EPS attributable to Moody’s common shareholders:
Beginning in the third quarter of 2017, the Company modified this adjusted measure to exclude the impact of amortization of acquired intangible assets as companies utilize intangible assets with different ages and have different methods of acquiring and amortizing intangible assets. Furthermore, the timing and magnitude of business combination transactions are not predictable and the purchase price allocated to amortizable intangible assets and the related amortization period are unique to each acquisition and can vary significantly from period to period and across companies. Also, management believes that excluding acquisition-related amortization expense provides additional perspective when comparing operating results from period to period, and with both acquisitive and non-acquisitive peer companies. Furthermore, U.S. tax reform as well as changes in statutory tax rates in Belgium were both enacted in the fourth quarter of 2017, resulting in significant adjustments to the tax provision. The Company modified the adjusted measures to exclude these adjustments to provide additional perspective when comparing net income and diluted EPS from period to period and across companies. In addition to excluding acquisition-related amortization expense and the effects of U.S. tax reform as well as the statutory tax rate change in Belgium, current and prior-year adjusted net income and adjusted diluted earnings per share exclude the CCXI Gain, the Purchase Price Hedge Gain, Acquisition-Related Expenses, restructuring charges and the Settlement Charge. The Company excludes these items to provide additional perspective on the Company’s operating results from period to period and across companies as the frequency and magnitude of similar transactions may vary widely across periods. Additionally, the Acquisition-Related Expenses are excluded due to the material nature of these expenses which are not expected to recur at this dollar magnitude subsequent to the completion of the multi-year integration effort relating to Bureau van Dijk. Acquisition-Related Expenses from previous acquisitions were not material.
| MOODY’S 2017 10-K | 55 |
Table of Contents
Below is a reconciliation of this measure to its most directly comparable U.S. GAAP amount.
| Year ended December 31, | ||||||||||||||||||||||||
| 2017 | 2016 | 2015 | ||||||||||||||||||||||
| Net income attributable to Moody’s common shareholders | $ | 1,000.6 | $ | 266.6 | $ | 941.3 | ||||||||||||||||||
| Transition tax related to U.S. tax reform |
247.3 | |||||||||||||||||||||||
| Net Impact of U.S. tax reform/Belgium statutory tax rate change on deferred taxes |
(1.7 | ) | ||||||||||||||||||||||
| CCXI Gain |
(59.7 | ) | — | |||||||||||||||||||||
| Pre-Tax Purchase Price Hedge Gain |
$ | (111.1 | ) | $ | — | $ | — | |||||||||||||||||
| Tax on Purchase Price Hedge Gain |
38.8 | — | — | |||||||||||||||||||||
|
|
|
|
|
|
|
|||||||||||||||||||
| Net Purchase Price Hedge Gain |
(72.3 | ) | — | — | ||||||||||||||||||||
| Pre-Tax Acquisition-Related Expenses |
$ | 22.5 | $ | — | $ | — | ||||||||||||||||||
| Tax on Acquisition-Related Expenses |
(3.6 | ) | — | — | ||||||||||||||||||||
|
|
|
|
|
|
|
|||||||||||||||||||
| Acquisition-Related Expenses (1) |
18.9 | — | — | |||||||||||||||||||||
| Pre-Tax Acquisition-Related Intangible Amortization Expenses |
$ | 61.4 | $ | 34.2 | $ | 31.9 | ||||||||||||||||||
| Tax on Acquisition-Related Intangible Amortization Expenses |
(16.2 | ) | (9.8 | ) | (9.1 | ) | ||||||||||||||||||
|
|
|
|
|
|
|
|||||||||||||||||||
| Net Acquisition-Related Intangible Amortization Expenses |
45.2 | 24.4 | 22.8 | |||||||||||||||||||||
| Pre-Tax Restructuring |
$ | — | $ | 12.0 | $ | — | ||||||||||||||||||
| Tax on Restructuring |
— | (3.9 | ) | — | ||||||||||||||||||||
|
|
|
|
|
|
|
|||||||||||||||||||
| Net Restructuring |
— | $ | 8.1 | $ | — | |||||||||||||||||||
| Pre-tax Settlement Charge |
$ | 863.8 | $ | — | ||||||||||||||||||||
| Tax on Settlement Charge |
(163.1 | ) | — | |||||||||||||||||||||
|
|
|
|||||||||||||||||||||||
| Net Settlement Charge |
700.7 | — | ||||||||||||||||||||||
| FX gain on liquidation of a subsidiary |
(34.8 | ) | — | |||||||||||||||||||||
| Legacy Tax benefit |
— | (6.4 | ) | |||||||||||||||||||||
|
|
|
|
|
|
|
|||||||||||||||||||
| Adjusted Net Income | $ | 1,178.3 | $ | 965.0 | $ | 957.7 | ||||||||||||||||||
|
|
|
|
|
|
|
|||||||||||||||||||
| (1) | Certain of these Acquisition-Related Expenses are not deductible for tax |
| 56 | MOODY’S 2017 10-K |
Table of Contents
| Year ended December 31, | ||||||||||||||||||||||||
| 2017 | 2016 | 2015 | ||||||||||||||||||||||
| Earnings per share attributable to Moody’s common shareholders | $ | 5.15 | $ | 1.36 | $ | 4.63 | ||||||||||||||||||
| Transition tax related to U.S. tax reform |
1.28 | |||||||||||||||||||||||
| Net Impact of U.S. tax reform/Belgium statutory tax rate change on deferred taxes |
(0.01 | ) | ||||||||||||||||||||||
| CCXI Gain |
(0.31 | ) | — | |||||||||||||||||||||
| Pre-Tax Purchase Price Hedge Gain |
$ | (0.57 | ) | $ | — | $ | — | |||||||||||||||||
| Tax on Purchase Price Hedge Gain |
0.20 | — | — | |||||||||||||||||||||
|
|
|
|
|
|
|
|||||||||||||||||||
| Net Purchase Price Hedge Gain |
(0.37 | ) | — | |||||||||||||||||||||
| Pre-Tax Acquisition-Related Expenses |
$ | 0.12 | $ | — | $ | — | ||||||||||||||||||
| Tax on Acquisition-Related Expenses |
(0.02 | ) | — | — | ||||||||||||||||||||
|
|
|
|
|
|
|
|||||||||||||||||||
| Acquisition-Related Expenses (1) |
0.10 | — | ||||||||||||||||||||||
| Pre-Tax Acquisition-Related Intangible Amortization Expenses |
$ | 0.32 | $ | 0.18 | $ | 0.16 | ||||||||||||||||||
| Tax on Acquisition-Related Intangible Amortization Expenses |
(0.09 | ) | (0.05 | ) | (0.05 | ) | ||||||||||||||||||
|
|
|
|
|
|
|
|||||||||||||||||||
| Net Acquisition-Related Intangible Amortization Expenses |
0.23 | 0.13 | 0.11 | |||||||||||||||||||||
| Pre-Tax Restructuring |
— | $ | 0.06 | $ | — | |||||||||||||||||||
| Tax on Restructuring |
— | (0.02 | ) | — | ||||||||||||||||||||
|
|
|
|
|
|
|
|||||||||||||||||||
| Net Restructuring |
— | 0.04 | — | |||||||||||||||||||||
| Pre-tax Settlement Charge |
— | $ | 4.42 | $ | — | |||||||||||||||||||
| Tax on Settlement Charge |
— | (0.83 | ) | — | ||||||||||||||||||||
|
|
|
|
|
|||||||||||||||||||||
| Net Settlement Charge |
— | 3.59 | — | |||||||||||||||||||||
| FX gain on liquidation of a subsidiary |
— | (0.18 | ) | — | ||||||||||||||||||||
| Legacy Tax benefit |
— | (0.03 | ) | |||||||||||||||||||||
|
|
|
|
|
|
|
|||||||||||||||||||
| Adjusted Diluted EPS | $ | 6.07 | $ | 4.94 | $ | 4.71 | ||||||||||||||||||
|
|
|
|
|
|
|
|||||||||||||||||||
| (1) | Certain of these Acquisition-Related Expenses are not deductible for tax |
| MOODY’S 2017 10-K | 57 |
Table of Contents
Free Cash Flow:
The Company defines Free Cash Flow as net cash provided by operating activities minus payments for capital additions. Management believes that Free Cash Flow is a useful metric in assessing the Company’s cash flows to service debt, pay dividends and to fund acquisitions and share repurchases. Management deems capital expenditures essential to the Company’s product and service innovations and maintenance of Moody’s operational capabilities. Accordingly, capital expenditures are deemed to be a recurring use of Moody’s cash flow. Below is a reconciliation of the Company’s net cash flows from operating activities to Free Cash Flow:
Recently Issued Accounting Pronouncements
Refer to Note 2 to the consolidated financial statements located in Item 8 on this Form 10-K for a discussion on the impact to the Company relating to recently issued accounting pronouncements.
For information regarding legal proceedings, see Part II, Item 8 –“Financial Statements”, Note 19 “Contingencies” in this Form 10-K.
Certain statements contained in this annual report on Form 10-K are forward-looking statements and are based on future expectations, plans and prospects for the Company’s business and operations that involve a number of risks and uncertainties. Such statements involve estimates, projections, goals, forecasts, assumptions and uncertainties that could cause actual results or outcomes to differ materially from those contemplated, expressed, projected, anticipated or implied in the forward-looking statements. Those statements appear at various places throughout this annual report on Form 10-K, including in the sections entitled “Contingencies” under Item 7. “MD&A”, commencing on page 31 of this annual report on Form 10-K, under “Legal Proceedings” in Part I, Item 3, of this Form 10-K, and elsewhere in the context of statements containing the words “believe”, “expect”, “anticipate”, “intend”, “plan”, “will”, “predict”, “potential”, “continue”, “strategy”, “aspire”, “target”, “forecast”, “project”, “estimate”, “should”, “could”, “may” and similar expressions or words and variations thereof relating to the Company’s views on future events, trends and contingencies. Stockholders and investors are cautioned not to place undue reliance on these forward-looking statements. The forward-looking statements and other information are made as of the date of this annual report on Form 10-K, and the Company undertakes no obligation (nor does it intend) to publicly supplement, update or revise such statements on a going-forward basis, whether as a result of subsequent developments, changed expectations or otherwise. In connection with the “safe harbor” provisions of the Private Securities Litigation Reform Act of 1995, the Company is identifying examples of factors, risks and uncertainties that could cause actual results to differ, perhaps materially, from those indicated by these forward-looking statements.
Those factors, risks and uncertainties include, but are not limited to, world-wide credit market disruptions or an economic slowdown, which could affect the volume of debt and other securities issued in domestic and/or global capital markets; other matters that could affect the volume of debt and other securities issued in domestic and/or global capital markets, including regulation, credit quality concerns, changes in interest rates and other volatility in the financial markets such as that due to the U.K.’s referendum vote whereby the U.K. citizens voted to withdraw from the EU; the level of merger and acquisition activity in the U.S. and abroad; the uncertain effectiveness and possible collateral consequences of U.S. and foreign government actions affecting world-wide credit markets, international trade and economic policy; concerns in the marketplace affecting our credibility or otherwise affecting market perceptions of the integrity or utility of independent credit agency ratings; the introduction of competing products or technologies by other companies; pricing pressure from competitors and/or customers; the level of success of new product development and global expansion; the impact of regulation as an NRSRO, the potential for new U.S., state and local legislation and regulations, including provisions in the Financial Reform Act and regulations resulting from that Act; the potential for increased competition and regulation in the EU and other foreign jurisdictions; exposure to litigation related to our rating opinions, as well as any other litigation, government and regulatory proceedings, investigations and inquires to which the Company may be subject from time to time; provisions in the Financial Reform Act legislation modifying the pleading standards, and EU regulations modifying the liability standards, applicable to credit rating agencies in a manner adverse to credit rating agencies; provisions of EU regulations imposing additional procedural and substantive requirements on
| 58 | MOODY’S 2017 10-K |
Table of Contents
the pricing of services and the expansion of supervisory remit to include non-EU ratings used for regulatory purposes; the possible loss of key employees; failures or malfunctions of our operations and infrastructure; any vulnerabilities to cyber threats or other cybersecurity concerns; the outcome of any review by controlling tax authorities of the Company’s global tax planning initiatives; exposure to potential criminal sanctions or civil remedies if the Company fails to comply with foreign and U.S. laws and regulations that are applicable in the jurisdictions in which the Company operates, including sanctions laws, anti-corruption laws, and local laws prohibiting corrupt payments to government officials; the impact of mergers, acquisitions or other business combinations and the ability of the Company to successfully integrate acquired businesses; currency and foreign exchange volatility; the level of future cash flows; the levels of capital investments; and a decline in the demand for credit risk management tools by financial institutions. Other factors, risks and uncertainties relating to our acquisition of Bureau van Dijk could cause our actual results to differ, perhaps materially, from those indicated by these forward-looking statements, including risks relating to the integration of Bureau van Dijk’s operations, products and employees into Moody’s and the possibility that anticipated synergies and other benefits of the acquisition will not be realized in the amounts anticipated or will not be realized within the expected timeframe; risks that the acquisition could have an adverse effect on the business of Bureau van Dijk or its prospects, including, without limitation, on relationships with vendors, suppliers or customers; claims made, from time to time, by vendors, suppliers or customers; changes in the European or global marketplaces that have an adverse effect on the business of Bureau van Dijk. These factors, risks and uncertainties as well as other risks and uncertainties that could cause Moody’s actual results to differ materially from those contemplated, expressed, projected, anticipated or implied in the forward-looking statements are described in greater detail under “Risk Factors” in Part I, Item 1A of the Company’s annual report on Form 10-K for the year ended December 31, 2017, and in other filings made by the Company from time to time with the SEC or in materials incorporated herein or therein. Stockholders and investors are cautioned that the occurrence of any of these factors, risks and uncertainties may cause the Company’s actual results to differ materially from those contemplated, expressed, projected, anticipated or implied in the forward-looking statements, which could have a material and adverse effect on the Company’s business, results of operations and financial condition. New factors may emerge from time to time, and it is not possible for the Company to predict new factors, nor can the Company assess the potential effect of any new factors on it.
| ITEM 7A. | QUANTITATIVE AND QUALITATIVE DISCLOSURES ABOUT MARKET RISK |
Information in response to this item is set forth under the caption “Market Risk” in Part II, Item 7 on page 51 of this annual report on Form 10-K.
| MOODY’S 2017 10-K | 59 |
Table of Contents
| ITEM 8. | FINANCIAL STATEMENTS |
Index to Financial Statements
|
|
Page(s) | |||
| Management’s Report on Internal Control Over Financial Reporting | 61 | |||
| Report of Independent Registered Public Accounting Firm | 62-63 | |||
| Consolidated Financial Statements: | ||||
| 64 | ||||
| 65 | ||||
| 66 | ||||
| 67 | ||||
| 68-70 | ||||
| Notes to Consolidated Financial Statements
|
|
71-116
|
| |
|
Schedules are omitted as not required or inapplicable or because the required information is provided in the consolidated financial statements, including the notes thereto. |
||||
| 60 | MOODY’S 2017 10-K |
Table of Contents
MANAGEMENT’S REPORT ON INTERNAL CONTROL OVER FINANCIAL REPORTING
Management of Moody’s Corporation is responsible for establishing and maintaining adequate internal control over financial reporting and for the assessment of the effectiveness of internal control over financial reporting. As defined by the SEC in Rules 13a-15(f) and 15d-15(f) under the Securities Exchange Act of 1934, internal control over financial reporting is a process designed by, or under the supervision of, the Company’s principal executive and principal financial officers, or persons performing similar functions, and effected by the Company’s Board, management and other personnel, to provide reasonable assurance regarding the reliability of financial reporting and the preparation of financial statements for external purposes in accordance with generally accepted accounting principles.
Moody’s internal control over financial reporting includes those policies and procedures that (1) pertain to the maintenance of records that, in reasonable detail, accurately and fairly reflect the transactions and dispositions of assets of the Company; (2) provide reasonable assurance that transactions are recorded as necessary to permit preparation of financial statements in accordance with generally accepted accounting principles, and that receipts and expenditures of the Company are being made only in accordance with authorizations of Moody’s management and directors; and (3) provide reasonable assurance regarding prevention or timely detection of unauthorized acquisition, use or disposition of the Company’s assets that could have a material effect on the financial statements.
Because of its inherent limitations, internal control over financial reporting may not prevent or detect misstatements. Also, projections of any evaluation of effectiveness to future periods are subject to the risk that controls may become inadequate because of changes in conditions, or that the degree of compliance with the policies or procedures may deteriorate.
Management of the Company has undertaken an assessment of the design and operational effectiveness of the Company’s internal control over financial reporting as of December 31, 2017 based on criteria established in the Internal Control—Integrated Framework (2013) issued by the Committee of Sponsoring Organizations of the Treadway Commission (COSO).
Our assessment of and conclusion on the effectiveness of our internal control over financial reporting as of December 31, 2017 did not include the internal controls of Bureau van Dijk, which was acquired during our fiscal year ended December 31, 2017 and will be included in our assessment of and conclusion on the effectiveness of our internal control over financial reporting for the fiscal year ending December 31, 2018. The total assets (excluding acquired goodwill and intangible assets which are included within the scope of this assessment) and revenues of Bureau van Dijk represents approximately $322 million and $92 million, respectively, of the corresponding amounts in our consolidated financial statements for the fiscal year ended December 31, 2017.
Based on the assessment performed, management has concluded that Moody’s maintained effective internal control over financial reporting as of December 31, 2017.
The effectiveness of our internal control over financial reporting as of December 31, 2017 has been audited by KPMG LLP, an independent registered public accounting firm, as stated in their report which appears herein.
/s/ RAYMOND W. MCDANIEL, JR.
Raymond W. McDaniel, Jr.
President and Chief Executive Officer
/s/ LINDA S. HUBER
Linda S. Huber
Executive Vice President and Chief Financial Officer
February 26, 2018
| MOODY’S 2017 10-K | 61 |
Table of Contents
Report of Independent Registered Public Accounting Firm
The Shareholders and Board of Directors of Moody’s Corporation:
Opinions on the Consolidated Financial Statements and Internal Control over Financial Reporting
We have audited the accompanying consolidated balance sheets of Moody’s Corporation (the Company) as of December 31, 2017 and 2016, and the related consolidated statements of operations, comprehensive income, shareholders’ equity (deficit), and cash flows for each of the years in the three-year period ended December 31, 2017, and the related notes (collectively, the consolidated financial statements). We also have audited the Company’s internal control over financial reporting as of December 31, 2017, based on criteria established in Internal Control—Integrated Framework (2013) issued by the Committee of Sponsoring Organizations of the Treadway Commission.
In our opinion, the consolidated financial statements referred to above present fairly, in all material respects, the financial position of the Company as of December 31, 2017 and 2016, and the results of its operations and its cash flows for each of the years in the three-year period ended December 31, 2017, in conformity with U.S. generally accepted accounting principles. Also in our opinion, the Company maintained, in all material respects, effective internal control over financial reporting as of December 31, 2017, based on criteria established in Internal Control—Integrated Framework (2013) issued by the Committee of Sponsoring Organizations of the Treadway Commission.
The Company acquired Bureau Van Dijk in August 2017, and management excluded from its assessment of the effectiveness of the Company’s internal control over financial reporting as of December 31, 2017, Bureau Van Dijk’s internal control over financial reporting, which is associated with total assets (excluding goodwill and intangibles which are included within the scope of the assessment) of $322 million and total revenues of $92 million included in the consolidated financial statements of the Company as of and for the year ended December 31, 2017. Our audit of internal control over financial reporting of the Company also excluded an evaluation of the internal control over financial reporting of Bureau Van Dijk.
Basis for Opinions
The Company’s management is responsible for these consolidated financial statements, for maintaining effective internal control over financial reporting, and for its assessment of the effectiveness of internal control over financial reporting included in the accompanying Management’s Report on Internal Control over Financial Reporting. Our responsibility is to express an opinion on the Company’s consolidated financial statements and an opinion on the Company’s internal control over financial reporting based on our audits. We are a public accounting firm registered with the Public Company Accounting Oversight Board (United States) (“PCAOB”) and are required to be independent with respect to the Company in accordance with the U.S. federal securities laws and the applicable rules and regulations of the Securities and Exchange Commission and the PCAOB.
We conducted our audits in accordance with the standards of the PCAOB. Those standards require that we plan and perform the audit to obtain reasonable assurance about whether the consolidated financial statements are free of material misstatement, whether due to error or fraud, and whether effective internal control over financial reporting was maintained in all material respects.
Our audits of the consolidated financial statements included performing procedures to assess the risks of material misstatement of the consolidated financial statements, whether due to error or fraud, and performing procedures that respond to those risks. Such procedures included examining, on a test basis, evidence regarding the amounts and disclosures in the consolidated financial statements. Our audits also included evaluating the accounting principles used and significant estimates made by management, as well as evaluating the overall presentation of the consolidated financial statements. Our audit of internal control over financial reporting included obtaining an understanding of internal control over financial reporting, assessing the risk that a material weakness exists, and testing and evaluating the design and operating effectiveness of internal control based on the assessed risk. Our audits also included performing such other procedures as we considered necessary in the circumstances. We believe that our audits provide a reasonable basis for our opinions.
Definition and Limitations of Internal Control over Financial Reporting
A company’s internal control over financial reporting is a process designed to provide reasonable assurance regarding the reliability of financial reporting and the preparation of financial statements for external purposes in accordance with generally accepted accounting principles. A company’s internal control over financial reporting includes those policies and procedures that (1) pertain to the maintenance of records that, in reasonable detail, accurately and fairly reflect the transactions and dispositions of the assets of the company; (2) provide reasonable assurance that transactions are recorded as necessary to permit preparation of financial statements in accordance with generally accepted accounting principles, and that receipts and expenditures of the company are being made only in accordance with authorizations of management and directors of the company; and (3) provide reasonable assurance regarding prevention or timely detection of unauthorized acquisition, use, or disposition of the company’s assets that could have a material effect on the financial statements.
| 62 | MOODY’S 2017 10-K |
Table of Contents
Because of its inherent limitations, internal control over financial reporting may not prevent or detect misstatements. Also, projections of any evaluation of effectiveness to future periods are subject to the risk that controls may become inadequate because of changes in conditions, or that the degree of compliance with the policies or procedures may deteriorate.
/s/ KPMG LLP
We have served as the Company’s auditor since 2008.
New York, New York
| MOODY’S 2017 10-K | 63 |
Table of Contents
MOODY’S CORPORATION
CONSOLIDATED STATEMENTS OF OPERATIONS
(Amounts in millions, except per share data)
| Year Ended December 31, | ||||||||||||
| 2017 | 2016 | 2015 | ||||||||||
| Revenue | $ | 4,204.1 | $ | 3,604.2 | $ | 3,484.5 | ||||||
|
|
|
|
|
|
|
|||||||
| Expenses | ||||||||||||
| Operating |
1,222.8 | 1,026.6 | 976.3 | |||||||||
| Selling, general and administrative |
991.4 | 936.4 | 921.3 | |||||||||
| Restructuring |
— | 12.0 | — | |||||||||
| Depreciation and amortization |
158.3 | 126.7 | 113.5 | |||||||||
| Acquisition-Related Expenses |
22.5 | — | — | |||||||||
| Settlement Charge |
— | 863.8 | — | |||||||||
|
|
|
|
|
|
|
|||||||
| Total expenses |
2,395.0 | 2,965.5 | 2,011.1 | |||||||||
|
|
|
|
|
|
|
|||||||
| Operating income | 1,809.1 | 638.7 | 1,473.4 | |||||||||
|
|
|
|
|
|
|
|||||||
| Non-operating (expense) income, net | ||||||||||||
| Interest expense, net |
(188.4 | ) | (137.8 | ) | (115.1 | ) | ||||||
| Other non-operating (expense) income , net |
(4.7 | ) | 57.1 | 21.3 | ||||||||
| Purchase Price Hedge Gain |
111.1 | — | — | |||||||||
| CCXI Gain |
59.7 | — | — | |||||||||
|
|
|
|
|
|
|
|||||||
| Non-operating (expense) income, net |
(22.3 | ) | (80.7 | ) | (93.8 | ) | ||||||
|
|
|
|
|
|
|
|||||||
| Income before provision for income taxes | 1,786.8 | 558.0 | 1,379.6 | |||||||||
| Provision for income taxes |
779.1 | 282.2 | 430.0 | |||||||||
|
|
|
|
|
|
|
|||||||
| Net income | 1,007.7 | 275.8 | 949.6 | |||||||||
| Less: Net income attributable to noncontrolling interests |
7.1 | 9.2 | 8.3 | |||||||||
|
|
|
|
|
|
|
|||||||
| Net income attributable to Moody’s | $ | 1,000.6 | $ | 266.6 | $ | 941.3 | ||||||
|
|
|
|
|
|
|
|||||||
| Earnings per share | ||||||||||||
| Basic |
$ | 5.24 | $ | 1.38 | $ | 4.70 | ||||||
|
|
|
|
|
|
|
|||||||
| Diluted |
$ | 5.15 | $ | 1.36 | $ | 4.63 | ||||||
|
|
|
|
|
|
|
|||||||
| Weighted average shares outstanding | ||||||||||||
| Basic |
191.1 | 192.7 | 200.1 | |||||||||
|
|
|
|
|
|
|
|||||||
| Diluted |
194.2 | 195.4 | 203.4 | |||||||||
|
|
|
|
|
|
|
|||||||
The accompanying notes are an integral part of the consolidated financial statements.
| 64 | MOODY’S 2017 10-K |
Table of Contents
MOODY’S CORPORATION
CONSOLIDATED STATEMENTS OF COMPREHENSIVE INCOME
(Amounts in millions)
| Year Ended December 31, 2017 | Year Ended December 31, 2016 | Year Ended December 31, 2015 | ||||||||||||||||||||||||||||||||||
| Pre-tax amounts |
Tax amounts |
After-tax amounts |
Pre-tax amounts |
Tax amounts |
After-tax amounts |
Pre-tax amounts |
Tax amounts |
After-tax amounts |
||||||||||||||||||||||||||||
| Net Income | $ | 1,007.7 | $ | 275.8 | $ | 949.6 | ||||||||||||||||||||||||||||||
|
|
|
|
|
|
|
|||||||||||||||||||||||||||||||
| Other Comprehensive Income (Loss): | ||||||||||||||||||||||||||||||||||||
| Foreign Currency Adjustments: |
||||||||||||||||||||||||||||||||||||
| Foreign currency translation adjustments, net |
$ | 166.2 | $ | 23.1 | 189.3 | $ | (22.2 | ) | $ | (5.4 | ) | (27.6 | ) | $ | (110.5 | ) | $ | (14.7 | ) | (125.2 | ) | |||||||||||||||
| Foreign currency translation adjustments – reclassification of (gains) losses included in net income |
— | — | — | (36.6 | ) | — | (36.6 | ) | (0.1 | ) | — | (0.1 | ) | |||||||||||||||||||||||
| Cash Flow Hedges: |
||||||||||||||||||||||||||||||||||||
| Net realized and unrealized gains on cash flow hedges |
9.6 | (3.7 | ) | 5.9 | (1.4 | ) | 0.5 | (0.9 | ) | (1.1 | ) | — | (1.1 | ) | ||||||||||||||||||||||
| Reclassification of (gains) losses included in net income |
(11.5 | ) | 4.8 | (6.7 | ) | 6.0 | (2.3 | ) | 3.7 | — | — | — | ||||||||||||||||||||||||
| Available for Sale Securities: |
||||||||||||||||||||||||||||||||||||
| Net unrealized gains on available for sale securities |
2.0 | — | 2.0 | 2.6 | — | 2.6 | 3.3 | — | 3.3 | |||||||||||||||||||||||||||
| Reclassification of gains included in net income |
(3.5 | ) | — | (3.5 | ) | — | — | — | (0.9 | ) | — | (0.9 | ) | |||||||||||||||||||||||
| Pension and Other Retirement Benefits: |
||||||||||||||||||||||||||||||||||||
| Amortization of actuarial losses and prior service costs included in net income |
8.7 | (3.3 | ) | 5.4 | 9.7 | (3.7 | ) | 6.0 | 13.5 | (5.2 | ) | 8.3 | ||||||||||||||||||||||||
| Net actuarial gains and prior service costs |
20.9 | (8.3 | ) | 12.6 | 0.3 | (0.1 | ) | 0.2 | 18.5 | (7.1 | ) | 11.4 | ||||||||||||||||||||||||
|
|
|
|
|
|
|
|
|
|
|
|
|
|
|
|
|
|
|
|||||||||||||||||||
| Total Other Comprehensive Income (loss) | $ | 192.4 | $ | 12.6 | $ | 205.0 | $ | (41.6 | ) | $ | (11.0 | ) | $ | (52.6 | ) | $ | (77.3 | ) | $ | (27.0 | ) | $ | (104.3 | ) | ||||||||||||
|
|
|
|
|
|
|
|
|
|
|
|
|
|
|
|
|
|
|
|||||||||||||||||||
| Comprehensive Income | 1,212.7 | 223.2 | 845.3 | |||||||||||||||||||||||||||||||||
| Less: comprehensive income (loss) attributable to noncontrolling interests |
19.4 | (18.0 | ) | 8.3 | ||||||||||||||||||||||||||||||||
|
|
|
|
|
|
|
|||||||||||||||||||||||||||||||
| Comprehensive Income Attributable to Moody’s | $ | 1,193.3 | $ | 241.2 | $ | 837.0 | ||||||||||||||||||||||||||||||
|
|
|
|
|
|
|
|||||||||||||||||||||||||||||||
The accompanying notes are an integral part of the consolidated financial statements.
| MOODY’S 2017 10-K | 65 |
Table of Contents
MOODY’S CORPORATION
(Amounts in millions, except share and per share data)
| December 31, | ||||||||
| 2017 | 2016 | |||||||
| ASSETS | ||||||||
| Current assets: | ||||||||
| Cash and cash equivalents |
$ | 1,071.5 | $ | 2,051.5 | ||||
| Short-term investments |
111.8 | 173.4 | ||||||
| Accounts receivable, net of allowances of $36.6 in 2017 and $25.7 in 2016 |
1,147.2 | 887.4 | ||||||
| Other current assets |
250.1 | 140.8 | ||||||
|
|
|
|
|
|||||
| Total current assets |
2,580.6 | 3,253.1 | ||||||
| Property and equipment, net | 325.1 | 325.9 | ||||||
| Goodwill | 3,753.2 | 1,023.6 | ||||||
| Intangible assets, net | 1,631.6 | 296.4 | ||||||
| Deferred tax assets, net | 143.8 | 316.1 | ||||||
| Other assets | 159.9 | 112.2 | ||||||
|
|
|
|
|
|||||
| Total assets |
$ | 8,594.2 | $ | 5,327.3 | ||||
|
|
|
|
|
|||||
| LIABILITIES, NONCONTROLLING INTERESTS AND SHAREHOLDERS’ DEFICIT | ||||||||
| Current liabilities: | ||||||||
| Accounts payable and accrued liabilities |
$ | 750.3 | $ | 1,444.3 | ||||
| Commercial paper |
129.9 | — | ||||||
| Current portion of long-term debt |
299.5 | 300.0 | ||||||
| Deferred revenue |
883.6 | 683.9 | ||||||
|
|
|
|
|
|||||
| Total current liabilities |
2,063.3 | 2,428.2 | ||||||
| Non-current portion of deferred revenue | 140.0 | 134.1 | ||||||
| Long-term debt | 5,111.1 | 3,063.0 | ||||||
| Deferred tax liabilities, net | 341.6 | 104.3 | ||||||
| Unrecognized tax benefits | 389.1 | 199.8 | ||||||
| Other liabilities | 664.0 | 425.2 | ||||||
|
|
|
|
|
|||||
| Total liabilities |
8,709.1 | 6,354.6 | ||||||
|
|
|
|
|
|||||
| Contingencies (Note 19) | — | — | ||||||
| Shareholders’ deficit: | ||||||||
| Preferred stock, par value $.01 per share; 10,000,000 shares authorized; no shares issued and outstanding |
— | — | ||||||
| Series common stock, par value $.01 per share; 10,000,000 shares authorized; no shares issued and outstanding |
— | — | ||||||
| Common stock, par value $.01 per share; 1,000,000,000 shares authorized; 342,902,272 shares issued At December 31, 2017 and December 31, 2016, respectively. |
3.4 | 3.4 | ||||||
| Capital surplus |
528.6 | 477.2 | ||||||
| Retained earnings |
7,465.4 | 6,688.9 | ||||||
| Treasury stock, at cost; 151,932,157 and 152,208,231 shares of common stock at December 31, 2017 and December 31, 2016, respectively |
(8,152.9 | ) | (8,029.6 | ) | ||||
| Accumulated other comprehensive loss |
(172.2 | ) | (364.9 | ) | ||||
|
|
|
|
|
|||||
| Total Moody’s shareholders’ deficit |
(327.7 | ) | (1,225.0 | ) | ||||
| Noncontrolling interests |
212.8 | 197.7 | ||||||
|
|
|
|
|
|||||
| Total shareholders’ deficit |
(114.9 | ) | (1,027.3 | ) | ||||
|
|
|
|
|
|||||
| Total liabilities, noncontrolling interests and shareholders’ deficit |
$ | 8,594.2 | $ | 5,327.3 | ||||
|
|
|
|
|
|||||
The accompanying notes are an integral part of the consolidated financial statements.
| 66 | MOODY’S 2017 10-K |
Table of Contents
MOODY’S CORPORATION
CONSOLIDATED STATEMENTS OF CASH FLOWS
(Amounts in millions)
| Year Ended December 31, | ||||||||||||
| 2017 | 2016 | 2015 | ||||||||||
| Cash flows from operating activities | ||||||||||||
| Net income |
$ | 1,007.7 | $ | 275.8 | $ | 949.6 | ||||||
| Reconciliation of net income to net cash provided by operating activities: |
||||||||||||
| Depreciation and amortization |
158.3 | 126.7 | 113.5 | |||||||||
| Stock-based compensation |
122.9 | 98.1 | 87.2 | |||||||||
| CCXI Gain |
(59.7 | ) | — | — | ||||||||
| Purchase Price Hedge Gain |
(111.1 | ) | — | — | ||||||||
| FX gain relating to liquidation and sale of subsidiaries |
— | (36.6 | ) | — | ||||||||
| Deferred income taxes |
88.3 | (153.1 | ) | 18.1 | ||||||||
| Legacy Tax Matters |
— | (1.6 | ) | (6.4 | ) | |||||||
| Changes in assets and liabilities: |
||||||||||||
| Accounts receivable |
(148.1 | ) | (104.8 | ) | (25.4 | ) | ||||||
| Other current assets |
(70.3 | ) | 37.0 | (28.9 | ) | |||||||
| Other assets |
12.1 | 6.6 | (13.1 | ) | ||||||||
| Accounts payable and accrued liabilities |
(651.4 | ) | 908.7 | 51.4 | ||||||||
| Deferred revenue |
72.9 | 74.9 | 31.6 | |||||||||
| Unrecognized tax benefits and other non-current tax liabilities |
63.0 | 2.2 | (10.9 | ) | ||||||||
| Other liabilities |
262.9 | 25.3 | 31.4 | |||||||||
|
|
|
|
|
|
|
|||||||
| Net cash provided by operating activities |
747.5 | 1,259.2 | 1,198.1 | |||||||||
|
|
|
|
|
|
|
|||||||
| Cash flows from investing activities | ||||||||||||
| Capital additions |
(90.6 | ) | (115.2 | ) | (89.0 | ) | ||||||
| Purchases of investments |
(170.1 | ) | (379.9 | ) | (688.2 | ) | ||||||
| Sales and maturities of investments |
238.5 | 699.5 | 653.1 | |||||||||
| Receipts from Purchase Price Hedge |
111.1 | — | — | |||||||||
| Cash paid for acquisitions, net of cash acquired and equity investments |
(3,511.0 | ) | (80.8 | ) | (7.6 | ) | ||||||
| Receipts from settlements of net investment hedges |
2.1 | 3.8 | 39.7 | |||||||||
| Payments for settlements of net investment hedges |
— | (26.9 | ) | — | ||||||||
| Cash received upon disposal of a subsidiary, net of cash transferred to purchaser |
— | 1.5 | — | |||||||||
|
|
|
|
|
|
|
|||||||
| Net cash (used in) provided by investing activities |
(3,420.0 | ) | 102.0 | (92.0 | ) | |||||||
|
|
|
|
|
|
|
|||||||
| Cash flows from financing activities | ||||||||||||
| Issuance of notes |
2,291.9 | — | 852.8 | |||||||||
| Repayment of notes |
(300.0 | ) | — | — | ||||||||
| Issuance of commercial paper |
1,837.1 | — | — | |||||||||
| Repayment of commercial paper |
(1,707.2 | ) | — | — | ||||||||
| Proceeds from stock-based compensation plans |
55.6 | 77.8 | 89.2 | |||||||||
| Repurchase of shares related to stock-based compensation |
(48.8 | ) | (44.4 | ) | (59.5 | ) | ||||||
| Treasury shares |
(199.7 | ) | (738.8 | ) | (1,098.1 | ) | ||||||
| Dividends |
(290.4 | ) | (285.1 | ) | (272.1 | ) | ||||||
| Dividends to noncontrolling interests |
(3.2 | ) | (6.7 | ) | (6.8 | ) | ||||||
| Payment for noncontrolling interest |
(8.5 | ) | (45.4 | ) | — | |||||||
| Contingent consideration |
— | (0.2 | ) | (1.5 | ) | |||||||
| Debt issuance costs and related fees |
(19.6 | ) | (0.1 | ) | (9.5 | ) | ||||||
|
|
|
|
|
|
|
|||||||
| Net cash provided by (used in) financing activities |
1,607.2 | (1,042.9 | ) | (505.5 | ) | |||||||
|
|
|
|
|
|
|
|||||||
| Effect of exchange rate changes on cash and cash equivalents |
85.3 | (24.2 | ) | (62.7 | ) | |||||||
|
|
|
|
|
|
|
|||||||
| (Decrease) Increase in cash and cash equivalents |
(980.0 | ) | 294.1 | 537.9 | ||||||||
| Cash and cash equivalents, beginning of period |
2,051.5 | 1,757.4 | 1,219.5 | |||||||||
|
|
|
|
|
|
|
|||||||
| Cash and cash equivalents, end of period |
$ | 1,071.5 | $ | 2,051.5 | $ | 1,757.4 | ||||||
|
|
|
|
|
|
|
|||||||
The accompanying notes are an integral part of the consolidated financial statements
| MOODY’S 2017 10-K | 67 |
Table of Contents
MOODY’S CORPORATION
CONSOLIDATED STATEMENTS OF SHAREHOLDERS’ EQUITY (DEFICIT)
(Amounts in millions)
| Shareholders’ of Moody’s Corporation | ||||||||||||||||||||||||||||||||||||||||
| Common Stock | Treasury Stock | Accumulated Other Comprehensive Loss |
Total Moody’s Shareholders’ Deficit |
Non- Controlling Interests |
Total Shareholders’ Equity (Deficit) |
|||||||||||||||||||||||||||||||||||
| Shares | Amount | Capital Surplus |
Retained Earnings |
Shares | Amount | |||||||||||||||||||||||||||||||||||
| Balance at December 31, 2014 | 342.9 | $ | 3.4 | $ | 383.9 | $ | 6,044.3 | (138.5 | ) | $ | (6,384.2 | ) | $ | (235.2 | ) | $ | (187.8 | ) | $ | 230.7 | $ | 42.9 | ||||||||||||||||||
|
|
|
|
|
|
|
|
|
|
|
|
|
|
|
|
|
|
|
|
|
|||||||||||||||||||||
| Net income |
941.3 | 941.3 | 8.3 | 949.6 | ||||||||||||||||||||||||||||||||||||
| Dividends |
(276.6 | ) | (276.6 | ) | (7.0 | ) | (283.6 | ) | ||||||||||||||||||||||||||||||||
| Stock-based compensation |
87.5 | 87.5 | 87.5 | |||||||||||||||||||||||||||||||||||||
| Shares issued for stock-based compensation plans at average cost, net |
(63.5 | ) | 2.6 | 93.1 | 29.6 | 29.6 | ||||||||||||||||||||||||||||||||||
| Net excess tax benefits upon settlement of stock-based compensation awards |
43.4 | 43.4 | 43.4 | |||||||||||||||||||||||||||||||||||||
| Treasury shares repurchased |
(10.9 | ) | (1,098.1 | ) | (1,098.1 | ) | (1,098.1 | ) | ||||||||||||||||||||||||||||||||
| Currency translation adjustment (net of tax of $14.7 million) |
(125.3 | ) | (125.3 | ) | (125.3 | ) | ||||||||||||||||||||||||||||||||||
| Net actuarial losses and prior service cost (net of tax of $7.1 million) |
11.4 | 11.4 | 11.4 | |||||||||||||||||||||||||||||||||||||
| Amortization of prior service costs and actuarial losses, (net of tax of $5.2 million) |
8.3 | 8.3 | 8.3 | |||||||||||||||||||||||||||||||||||||
| Net unrealized gain on available for sale securities |
2.4 | 2.4 | 2.4 | |||||||||||||||||||||||||||||||||||||
| Net realized loss on cash flow hedges |
(1.1 | ) | (1.1 | ) | (1.1 | ) | ||||||||||||||||||||||||||||||||||
|
|
|
|
|
|
|
|
|
|
|
|
|
|
|
|
|
|
|
|
|
|||||||||||||||||||||
| Balance at December 31, 2015 | 342.9 | $ | 3.4 | $ | 451.3 | $ | 6,709.0 | (146.8 | ) | $ | (7,389.2 | ) | $ | (339.5 | ) | $ | (565.0 | ) | $ | 232.0 | (333.0 | ) | ||||||||||||||||||
|
|
|
|
|
|
|
|
|
|
|
|
|
|
|
|
|
|
|
|
|
|||||||||||||||||||||
The accompanying notes are an integral part of the consolidated financial statements.
(continued on next page)
| 68 | MOODY’S 2017 10-K |
Table of Contents
MOODY’S CORPORATION
CONSOLIDATED STATEMENTS OF SHAREHOLDERS’ EQUITY (DEFICIT) continued
(Amounts in millions)
| Shareholders’ of Moody’s Corporation | ||||||||||||||||||||||||||||||||||||||||
| Common Stock | Treasury Stock | Accumulated Other Comprehensive Loss |
Total Moody’s Shareholders’ Deficit |
Non- Controlling Interests |
Total Shareholders’ Deficit |
|||||||||||||||||||||||||||||||||||
| Shares | Amount | Capital Surplus |
Retained Earnings |
Shares | Amount | |||||||||||||||||||||||||||||||||||
| Balance at December 31, 2015 | 342.9 | $ | 3.4 | $ | 451.3 | $ | 6,709.0 | (146.8 | ) | $ | (7,389.2 | ) | $ | (339.5 | ) | $ | (565.0 | ) | $ | 232.0 | $ | (333.0 | ) | |||||||||||||||||
|
|
|
|
|
|
|
|
|
|
|
|
|
|
|
|
|
|
|
|
|
|||||||||||||||||||||
| Net income |
266.6 | 266.6 | 9.2 | 275.8 | ||||||||||||||||||||||||||||||||||||
| Dividends |
(286.7 | ) | (286.7 | ) | (6.7 | ) | (293.4 | ) | ||||||||||||||||||||||||||||||||
| Stock-based compensation |
98.4 | 98.4 | 98.4 | |||||||||||||||||||||||||||||||||||||
| Shares issued for stock-based compensation plans at average cost, net |
(65.0 | ) | 2.3 | 98.4 | 33.4 | 33.4 | ||||||||||||||||||||||||||||||||||
| Net excess tax benefits upon settlement of stock-based compensation awards |
32.0 | 32.0 | 32.0 | |||||||||||||||||||||||||||||||||||||
| Purchase of noncontrolling interest |
(39.5 | ) | (39.5 | ) | (9.6 | ) | (49.1 | ) | ||||||||||||||||||||||||||||||||
| Treasury shares repurchased |
(7.7 | ) | (738.8 | ) | (738.8 | ) | (738.8 | ) | ||||||||||||||||||||||||||||||||
| Currency translation adjustment (net of tax of $5.4 million) |
(34.2 | ) | (34.2 | ) | (30.0 | ) | (64.2 | ) | ||||||||||||||||||||||||||||||||
| Net actuarial losses and prior service cost (net of tax of $0.1 million) |
0.2 | 0.2 | 0.2 | |||||||||||||||||||||||||||||||||||||
| Amortization of prior service costs and actuarial losses, (net of tax of $3.7 million) |
6.0 | 6.0 | 6.0 | |||||||||||||||||||||||||||||||||||||
| Net unrealized gain on available for sale securities |
(0.2 | ) | (0.2 | ) | 2.8 | 2.6 | ||||||||||||||||||||||||||||||||||
| Net realized and unrealized gain on cash flow hedges (net of tax of $1.8 million) |
2.8 | 2.8 | 2.8 | |||||||||||||||||||||||||||||||||||||
|
|
|
|
|
|
|
|
|
|
|
|
|
|
|
|
|
|
|
|
|
|||||||||||||||||||||
| Balance at December 31, 2016 | 342.9 | $ | 3.4 | $ | 477.2 | $ | 6,688.9 | (152.2 | ) | $ | (8,029.6 | ) | $ | (364.9 | ) | $ | (1,225.0 | ) | $ | 197.7 | $ | (1,027.3 | ) | |||||||||||||||||
|
|
|
|
|
|
|
|
|
|
|
|
|
|
|
|
|
|
|
|
|
|||||||||||||||||||||
The accompanying notes are an integral part of the consolidated financial statements.
(continued on next page)
| MOODY’S 2017 10-K | 69 |
Table of Contents
MOODY’S CORPORATION
CONSOLIDATED STATEMENTS OF SHAREHOLDERS’ EQUITY (DEFICIT) continued
(Amounts in millions)
| Shareholders’ of Moody’s Corporation | ||||||||||||||||||||||||||||||||||||||||
| Common Stock | Treasury Stock | Accumulated Other Comprehensive Loss |
Total Moody’s Shareholders’ Deficit |
Non- Controlling Interests |
Total Shareholders’ Deficit |
|||||||||||||||||||||||||||||||||||
| Shares | Amount | Capital Surplus |
Retained Earnings |
Shares | Amount | |||||||||||||||||||||||||||||||||||
| Balance at December 31, 2016 | 342.9 | $ | 3.4 | $ | 477.2 | $ | 6,688.9 | (152.2 | ) | $ | (8,029.6 | ) | $ | (364.9 | ) | $ | (1,225.0 | ) | $ | 197.7 | $ | (1,027.3 | ) | |||||||||||||||||
|
|
|
|
|
|
|
|
|
|
|
|
|
|
|
|
|
|
|
|
|
|||||||||||||||||||||
| Net income |
1,000.6 | 1,000.6 | 7.1 | 1,007.7 | ||||||||||||||||||||||||||||||||||||
| Dividends |
(219.5 | ) | (219.5 | ) | (3.3 | ) | (222.8 | ) | ||||||||||||||||||||||||||||||||
| Adoption of ASU 2016-16 (See Note 15) |
(4.6 | ) | (4.6 | ) | (4.6 | ) | ||||||||||||||||||||||||||||||||||
| Stock-based compensation |
123.2 | 123.2 | 123.2 | |||||||||||||||||||||||||||||||||||||
| Shares issued for stock-based compensation plans at average cost, net |
(67.1 | ) | 1.9 | 76.4 | 9.3 | 9.3 | ||||||||||||||||||||||||||||||||||
| Purchase of noncontrolling interest |
(4.7 | ) | (4.7 | ) | (1.0 | ) | (5.7 | ) | ||||||||||||||||||||||||||||||||
| Treasury shares repurchased |
(1.6 | ) | (199.7 | ) | (199.7 | ) | (199.7 | ) | ||||||||||||||||||||||||||||||||
| Currency translation adjustment (net of tax of $23.1 million) |
176.3 | 176.3 | 13.0 | 189.3 | ||||||||||||||||||||||||||||||||||||
| Net actuarial losses and prior service cost (net of tax of $8.3 million) |
12.6 | 12.6 | 12.6 | |||||||||||||||||||||||||||||||||||||
| Amortization of prior service costs and actuarial losses, (net of tax of $3.3 million) |
5.4 | 5.4 | 5.4 | |||||||||||||||||||||||||||||||||||||
| Net realized and unrealized gain on available for sale securities |
(0.8 | ) | (0.8 | ) | (0.7 | ) | (1.5 | ) | ||||||||||||||||||||||||||||||||
| Net realized and unrealized gain on cash flow hedges (net of tax of $1.1 million) |
(0.8 | ) | (0.8 | ) | (0.8 | ) | ||||||||||||||||||||||||||||||||||
|
|
|
|
|
|
|
|
|
|
|
|
|
|
|
|
|
|
|
|
|
|||||||||||||||||||||
| Balance at December 31, 2017 | 342.9 | $ | 3.4 | $ | 528.6 | $ | 7,465.4 | (151.9 | ) | $ | (8,152.9 | ) | $ | (172.2 | ) | $ | (327.7 | ) | $ | 212.8 | $ | (114.9 | ) | |||||||||||||||||
|
|
|
|
|
|
|
|
|
|
|
|
|
|
|
|
|
|
|
|
|
|||||||||||||||||||||
The accompanying notes are an integral part of the consolidated financial statements.
| 70 | MOODY’S 2017 10-K |
Table of Contents
NOTES TO CONSOLIDATED FINANCIAL STATEMENTS
(tabular dollar and share amounts in millions, except per share data)
| NOTE 1 | DESCRIPTION OF BUSINESS AND BASIS OF PRESENTATION |
Moody’s is a provider of (i) credit ratings; (ii) credit, capital markets and economic research, data and analytical tools; (iii) software solutions that support financial risk management activities; (iv) quantitatively derived credit scores; (v) financial services training and certification services; (vi) offshore financial research and analytical services; and (vii) company information and business intelligence products. Moody’s reports in two reportable segments: MIS and MA.
MIS, the credit rating agency, publishes credit ratings on a wide range of debt obligations and the entities that issue such obligations in markets worldwide. Revenue is primarily derived from the originators and issuers of such transactions who use MIS ratings in the distribution of their debt issues to investors. Additionally, MIS earns revenue from certain non-ratings-related operations which consist primarily of financial instrument pricing services in the Asia-Pacific region as well as revenue from ICRA’s non-ratings operations. The revenue from these operations is included in the MIS Other LOB and is not material to the results of the MIS segment.
The MA segment develops a wide range of products and services that support financial analysis and risk management activities of institutional participants in global financial markets. Within its RD&A business, MA distributes research and data developed by MIS as part of its ratings process, including in-depth research on major debt issuers, industry studies and commentary on topical credit-related events. The RD&A business also produces economic research and data and analytical tools such as quantitative credit risk scores as well as business intelligence and company information products. Within its ERS business, MA provides software solutions as well as related risk management services. The PS business provides offshore analytical and research services along with financial training and certification programs.
Certain reclassifications have been made to prior period amounts to conform to the current presentation.
Adoption of New Accounting Standard
In the first quarter of 2017, the Company adopted ASU No. 2016-09 “Improvements to Employee Share-Based Payment Accounting”. As required by ASU 2016-09, Excess Tax Benefits or shortfalls recognized on stock-based compensation are reflected in the consolidated statement of operations as a component of the provision for income taxes on a prospective basis. Prior to the adoption of this ASU, Excess Tax Benefits and shortfalls were recorded to capital surplus within shareholders’ deficit. The impact of this adoption was a $39.5 million benefit to the provision for income taxes for the year end December 31, 2017.
Additionally, in accordance with this ASU, Excess Tax Benefits or shortfalls recognized on stock-based compensation are classified as operating cash flows in the consolidated statement of cash flows, and the Company has applied this provision on a retrospective basis. Under previous accounting guidance, the Excess Tax Benefits or shortfalls were shown as a reduction to operating activity and an increase to financing activity. Furthermore, the Company has elected to continue to estimate the number of stock-based awards expected to vest, rather than accounting for award forfeitures as they occur, to determine the amount of stock-based compensation cost recognized in each period. The impact to the Company’s statement of cash flows for prior year relating to the adoption of this provision of the ASU is set forth in the table below:
| As reported December 31, 2016 |
Reclassification | December 31, 2016 as adjusted |
As reported December 31, 2015 |
Reclassification | December 31, 2015 as adjusted |
|||||||||||||||||||
| Net cash provided by operating activities | $ | 1,226.1 | $ | 33.1 | $ | 1,259.2 | $ | 1,153.6 | $ | 44.5 | $ | 1,198.1 | ||||||||||||
| Net cash used in financing activities | $ | (1,009.8 | ) | $ | (33.1 | ) | $ | (1,042.9 | ) | $ | (461.0 | ) | $ | (44.5 | ) | $ | (505.5 | ) | ||||||
| NOTE 2 | SUMMARY OF SIGNIFICANT ACCOUNTING POLICIES |
Basis of Consolidation
The consolidated financial statements include those of Moody’s Corporation and its majority- and wholly-owned subsidiaries. The effects of all intercompany transactions have been eliminated. Investments in companies for which the Company has significant influ-
| MOODY’S 2017 10-K | 71 |
Table of Contents
ence over operating and financial policies but not a controlling interest are accounted for on an equity basis whereby the Company records its proportional share of the investment’s net income or loss as part of other non-operating income (expense), net and any dividends received reduce the carrying amount of the investment. The Company applies the guidelines set forth in Topic 810 of the ASC in assessing its interests in variable interest entities to decide whether to consolidate that entity. The Company has reviewed the potential variable interest entities and determined that there are no consolidation requirements under Topic 810 of the ASC. The Company consolidates its ICRA subsidiaries on a three month lag.
Cash and Cash Equivalents
Cash equivalents principally consist of investments in money market mutual funds and money market deposit accounts as well as high-grade commercial paper and certificates of deposit with maturities of three months or less when purchased.
Short-term Investments
Short-term investments are securities with maturities greater than 90 days at the time of purchase that are available for operations in the next 12 months. The Company’s short-term investments primarily consist of certificates of deposit and their cost approximates fair value due to the short-term nature of the instruments. Interest and dividends on these investments are recorded into income when earned.
Property and Equipment
Property and equipment are stated at cost and are depreciated using the straight-line method over their estimated useful lives. Expenditures for maintenance and repairs that do not extend the economic useful life of the related assets are charged to expense as incurred.
Research and Development Costs
All research and development costs are expensed as incurred. These costs primarily reflect the development of credit processing software and quantitative credit risk assessment products sold by the MA segment.
Research and development costs were $42.0 million, $40.1 million, and $29.1 million for the years ended December 31, 2017, 2016 and 2015, respectively, and are included in operating expenses within the Company’s consolidated statements of operations. These costs generally consist of professional services provided by third parties and compensation costs of employees.
Costs for internally developed computer software that will be sold, leased or otherwise marketed are capitalized when technological feasibility has been established. These costs primarily relate to the development or enhancement of products in the ERS business and generally consist of professional services provided by third parties and compensation costs of employees that develop the software. Judgment is required in determining when technological feasibility of a product is established and the Company believes that technological feasibility for its software products is reached after all high-risk development issues have been resolved through coding and testing. Generally, this occurs shortly before the products are released to customers. Accordingly, costs for internally developed computer software that will be sold, leased or otherwise marketed that were eligible for capitalization under Topic 985 of the ASC were immaterial for the years ended December 31, 2017, 2016 and 2015.
Computer Software Developed or Obtained for Internal Use
The Company capitalizes costs related to software developed or obtained for internal use. These assets, included in property and equipment in the consolidated balance sheets, relate to the Company’s financial, website and other systems. Such costs generally consist of direct costs for third-party license fees, professional services provided by third parties and employee compensation, in each case incurred either during the application development stage or in connection with upgrades and enhancements that increase functionality. Such costs are depreciated over their estimated useful lives on a straight-line basis. Costs incurred during the preliminary project stage of development as well as maintenance costs are expensed as incurred.
Long-Lived Assets, Including Goodwill and Other Acquired Intangible Assets
Moody’s evaluates its goodwill for impairment at the reporting unit level, defined as an operating segment or one level below an operating segment, annually as of July 31 or more frequently if impairment indicators arise in accordance with ASC Topic 350.
The Company evaluates the recoverability of goodwill using a two-step impairment test approach at the reporting unit level. In the first step, the Company assesses various qualitative factors to determine whether the fair value of a reporting unit may be less than its carrying amount. If a determination is made that, based on the qualitative factors, an impairment does not exist, the Company is not required to perform further testing. If the aforementioned qualitative assessment results in the Company concluding that it is more likely than not that the fair value of a reporting unit may be less than its carrying amount, the fair value of the reporting unit will be determined and compared to its carrying value including goodwill. If the fair value of the reporting unit exceeds the carrying value of the net assets assigned to that unit, goodwill is not impaired and the Company is not required to perform further testing. If the fair value of the reporting unit is less than the carrying value, the Company will recognize the difference as an impairment charge.
The Company evaluates its reporting units for impairment on an annual basis, or more frequently if there are changes in the reporting structure of the Company due to acquisitions or realignments or if there are indicators of potential impairment. For the reporting units
| 72 | MOODY’S 2017 10-K |
Table of Contents
where the Company is consistently able to conclude that an impairment does not exist using only a qualitative approach, the Company’s accounting policy is to perform the second step of the aforementioned goodwill impairment assessment at least once every three years. Goodwill is assigned to a reporting unit at the date when an acquisition is integrated into one of the established reporting units, and is based on which reporting unit is expected to benefit from the synergies of the acquisition.
For purposes of assessing the recoverability of goodwill, the Company has seven primary reporting units at December 31, 2017: two within the Company’s ratings business (one for the ICRA business and one that encompasses all of Moody’s other ratings operations) and five reporting units within MA: RD&A, ERS, FSTC, MAKS and Bureau van Dijk. The RD&A reporting unit encompasses the distribution of investor-oriented research and data developed by MIS as part of its ratings process, in-depth research on major debt issuers, industry studies, economic research and commentary on topical events and credit analytic tools. The ERS reporting unit consists of credit risk management and compliance software that is sold on a license or subscription basis as well as related advisory services for implementation and maintenance. The FSTC reporting unit consists of the portion of the MA business that offers both credit training as well as other professional development training and certification services. The MAKS reporting unit consists of offshore research and analytical services. The Bureau van Dijk reporting unit consists of business intelligence and company information products.
Amortizable intangible assets are reviewed for recoverability whenever events or changes in circumstances indicate that the carrying amount may not be recoverable.
Rent Expense
The Company records rent expense on a straight-line basis over the life of the lease. In cases where there is a free rent period or future fixed rent escalations the Company will record a deferred rent liability. Additionally, the receipt of any lease incentives will be recorded as a deferred rent liability which will be amortized over the lease term as a reduction of rent expense.
Stock-Based Compensation
The Company records compensation expense for all share-based payment award transactions granted to employees based on the fair value of the equity instrument at the time of grant. This includes shares issued under stock option and restricted stock plans. The accounting for Excess Tax Benefits or shortfalls on stock-based compensation is more fully discussed in Note 1.
Derivative Instruments and Hedging Activities
Based on the Company’s risk management policy, from time to time the Company may use derivative financial instruments to reduce exposure to changes in foreign exchange rates and interest rates. The Company does not enter into derivative financial instruments for speculative purposes. All derivative financial instruments are recorded on the balance sheet at their respective fair values. The changes in the value of derivatives that qualify as fair value hedges are recorded with a corresponding adjustment to the carrying value of the item being hedged. Changes in the derivative’s fair value that qualify as cash flow hedges are recorded to other comprehensive income or loss, to the extent the hedge is effective, and such amounts are reclassified from accumulated other comprehensive income or loss to earnings in the same period or periods during which the hedged transaction affects income. Changes in the derivative’s fair value that qualify as net investment hedges are recorded to other comprehensive income or loss, to the extent the hedge is effective. Any changes in the fair value of derivatives that the Company does not designate as hedging instruments under Topic 815 of the ASC are recorded in the consolidated statements of operations in the period in which they occur.
Revenue Recognition
Revenue is recognized when persuasive evidence of an arrangement exists, delivery has occurred or the services have been provided and accepted by the customer when applicable, fees are determinable and the collection of resulting receivables is considered probable.
Pursuant to ASC Topic 605, when a sales arrangement contains multiple deliverables, the Company allocates revenue to each deliverable based on its relative selling price which is determined based on its vendor specific objective evidence if available, third party evidence if VSOE is not available, or estimated selling price if neither VSOE nor TPE is available.
The Company’s products and services will generally qualify as separate units of accounting under ASC Topic 605. The Company evaluates each deliverable in an arrangement to determine whether it represents a separate unit of accounting. A deliverable constitutes a separate unit of accounting when it has stand-alone value to the customers and if the arrangement includes a customer refund or return right relative to the delivered item and the delivery and performance of the undelivered item is considered probable and substantially in the Company’s control. In instances where the aforementioned criteria are not met, the deliverable is combined with the undelivered items and revenue recognition is determined as one single unit.
The Company determines whether its selling price in a multi-element transaction meets the VSOE criteria by using the price charged for a deliverable when sold separately or, if the deliverable is not yet being sold separately, the price established by management having the relevant authority to establish such a price. In instances where the Company is not able to establish VSOE for all deliverables in a multiple element arrangement, which may be due to the Company infrequently selling each element separately, not selling products
| MOODY’S 2017 10-K | 73 |
Table of Contents
within a reasonably narrow price range, or only having a limited sales history, the Company attempts to establish TPE for deliverables. The Company determines whether TPE exists by evaluating largely similar and interchangeable competitor products or services in standalone sales to similarly situated customers. However, due to the difficulty in obtaining third party pricing, possible differences in its market strategy from that of its peers and the potential that products and services offered by the Company may contain a significant level of differentiation and/or customization such that the comparable pricing of products with similar functionality cannot be obtained, the Company generally is unable to reliably determine TPE. Based on the selling price hierarchy established by ASC Topic 605, when the Company is unable to establish selling price using VSOE or TPE, the Company will establish an ESP. ESP is the price at which the Company would transact a sale if the product or service were sold on a stand-alone basis. The Company establishes its best estimate of ESP considering internal factors relevant to is pricing practices such as costs and margin objectives, standalone sales prices of similar products, percentage of the fee charged for a primary product or service relative to a related product or service, and customer segment and geography. Additional consideration is also given to market conditions such as competitor pricing strategies and market trend. The Company reviews its determination of VSOE, TPE and ESP on an annual basis or more frequently as needed.
In the MIS segment, revenue attributed to initial ratings of issued securities is recognized when the rating is delivered to the issuer. Revenue attributed to monitoring of issuers or issued securities is recognized ratably over the period in which the monitoring is performed, generally one year. In the case of commercial mortgage-backed securities, structured credit, international residential mortgage-backed and asset-backed securities, issuers can elect to pay the monitoring fees upfront. These fees are deferred and recognized over the future monitoring periods based on the expected lives of the rated securities, which was approximately 24 years on a weighted average basis at December 31, 2017. At December 31, 2017, 2016 and 2015, deferred revenue related to these securities was approximately $140.1 million, $133.0 million, and $121.0 million, respectively.
Multiple element revenue arrangements in the MIS segment are generally comprised of an initial rating and the related monitoring service. In instances where monitoring fees are not charged for the first year monitoring effort, fees are allocated to the initial rating and monitoring services based on the relative selling price of each service to the total arrangement fees. The Company generally uses ESP in determining the selling price for its initial ratings as the Company rarely provides initial ratings separately without providing related monitoring services and thus is unable to establish VSOE or TPE for initial ratings.
MIS estimates revenue for ratings of commercial paper for which, in addition to a fixed annual monitoring fee, issuers are billed quarterly based on amounts outstanding. Revenue is accrued each quarter based on estimated amounts outstanding and is billed when actual data is available. The estimate is determined based on the issuers’ most recent reported quarterly data. At December 31, 2017, 2016 and 2015, accounts receivable included approximately $27.0 million, $25.0 million, and $24.0 million, respectively, related to accrued commercial paper revenue. Historically, MIS has not had material differences between the estimated revenue and the actual billings. Furthermore, for certain annual monitoring services, fees are not invoiced until the end of the annual monitoring period and revenue is accrued ratably over the monitoring period. At December 31, 2017, 2016, and 2015, accounts receivable included approximately $185.0 million, $159.1 million, and $146.4 million, respectively, relating to accrued annual monitoring service revenue.
In the MA segment, products and services offered by the Company include software licenses and related maintenance, subscriptions, and professional services. Revenue from subscription-based products, such as research and data subscriptions and certain software-based credit risk management subscription products, is recognized ratably over the related subscription period, which is principally one year. Revenue from sale of perpetual licenses of credit processing software is generally recognized at the time the product master or first copy is delivered or transferred to and accepted by the customer. If uncertainty exists regarding customer acceptance of the product or service, revenue is not recognized until acceptance occurs. Software maintenance revenue is recognized ratably over the annual maintenance period. Revenue from professional services rendered is generally recognized as the services are performed. A large portion of annual research and data subscriptions and annual software maintenance are invoiced in the months of November, December and January.
Products and services offered within the MA segment are sold either stand-alone or together in various combinations. In instances where a multiple element arrangement includes software and non-software deliverables, revenue is allocated to the non-software deliverables and to the software deliverables, as a group, using the relative selling prices of each of the deliverables in the arrangement based on the aforementioned selling price hierarchy. Revenue is recognized for each element based upon the conditions for revenue recognition noted above.
If the arrangement contains more than one software deliverable, the arrangement consideration allocated to the software deliverables as a group is allocated to each software deliverable using VSOE. In the instances where the Company is not able to determine VSOE for all of the deliverables of an arrangement, the Company allocates the revenue to the undelivered elements equal to its VSOE and the residual revenue to the delivered elements. If the Company is unable to determine VSOE for an undelivered element, the Company defers all revenue allocated to the software deliverables until the Company has delivered all of the elements or when VSOE has been determined for the undelivered elements. In cases where software implementation services are considered essential and VSOE of fair value exists for post-contract customer support (“PCS”), once the delivery criteria has been met on the standard software, license and service revenue is recognized on a percentage-of-completion basis as implementation services are performed, while PCS is recognized
| 74 | MOODY’S 2017 10-K |
Table of Contents
over the coverage period. If VSOE of fair value does not exist for PCS, once the delivery criteria has been met on the standard software, service revenue is recognized on a zero profit margin basis until essential services are complete, at which point total remaining arrangement revenue is then spread ratably over the remaining PCS coverage period. If VSOE does not exist for PCS at the beginning of an arrangement but is established during implementation, revenue not recognized due to the absence of VSOE will be recognized on a cumulative basis.
Accounts Receivable Allowances
Moody’s records an allowance for estimated future adjustments to customer billings as a reduction of revenue, based on historical experience and current conditions. Such amounts are reflected as additions to the accounts receivable allowance. Additionally, estimates of uncollectible accounts are recorded as bad debt expense and are reflected as additions to the accounts receivable allowance. Actual billing adjustments and uncollectible account write-offs are recorded against the allowance. Moody’s evaluates its accounts receivable allowance by reviewing and assessing historical collection and adjustment experience and the current status of customer accounts. Moody’s also considers the economic environment of the customers, both from an industry and geographic perspective, in evaluating the need for allowances. Based on its analysis, Moody’s adjusts its allowance as considered appropriate in the circumstances.
Contingencies
Moody’s is involved in legal and tax proceedings, governmental, regulatory and legislative investigations and inquiries, claims and litigation that are incidental to the Company’s business, including claims based on ratings assigned by MIS. Moody’s is also subject to ongoing tax audits in the normal course of business. Management periodically assesses the Company’s liabilities and contingencies in connection with these matters based upon the latest information available. Moody’s discloses material pending legal proceedings pursuant to SEC rules and other pending matters as it may determine to be appropriate.
For claims, litigation and proceedings and governmental investigations and inquires not related to income taxes, where it is both probable that a liability has been incurred and the amount of loss can be reasonably estimated, the Company records liabilities in the consolidated financial statements and periodically adjusts these as appropriate. When the reasonable estimate of the loss is within a range of amounts, the minimum amount of the range is accrued unless some higher amount within the range is a better estimate than another amount within the range. In other instances, where a loss is reasonably possible, management may not record a liability because of uncertainties related to the probable outcome and/or the amount or range of loss, but discloses the contingency if significant. As additional information becomes available, the Company adjusts its assessments and estimates of such matters accordingly. In view of the inherent difficulty of predicting the outcome of litigation, regulatory, governmental investigations and inquiries, enforcement and similar matters, particularly where the claimants seek large or indeterminate damages or where the parties assert novel legal theories or the matters involve a large number of parties, the Company cannot predict what the eventual outcome of the pending matters will be or the timing of any resolution of such matters. The Company also cannot predict the impact (if any) that any such matters may have on how its business is conducted, on its competitive position or on its financial position, results of operations or cash flows. As the process to resolve any pending matters progresses, management will continue to review the latest information available and assess its ability to predict the outcome of such matters and the effects, if any, on its operations and financial condition. However, in light of the large or indeterminate damages sought in some of them, the absence of similar court rulings on the theories of law asserted and uncertainties regarding apportionment of any potential damages, an estimate of the range of possible losses cannot be made at this time.
The Company’s wholly-owned insurance subsidiary insures the Company against certain risks including but not limited to deductibles for worker’s compensation, employment practices litigation and employee medical claims and terrorism, for which the claims are not material to the Company. In addition, for claim years 2008 and 2009, the insurance subsidiary insured the Company for defense costs related to professional liability claims. For matters insured by the Company’s insurance subsidiary, Moody’s records liabilities based on the estimated total claims expected to be paid and total projected costs to defend a claim through its anticipated conclusion. The Company determines liabilities based on an assessment of management’s best estimate of claims to be paid and legal defense costs as well as actuarially determined estimates. Defense costs for matters not self-insured by the Company’s wholly-owned insurance subsidiary are expensed as services are provided.
For income tax matters, the Company employs the prescribed methodology of Topic 740 of the ASC which requires a company to first determine whether it is more-likely-than-not (defined as a likelihood of more than fifty percent) that a tax position will be sustained based on its technical merits as of the reporting date, assuming that taxing authorities will examine the position and have full knowledge of all relevant information. A tax position that meets this more-likely-than-not threshold is then measured and recognized at the largest amount of benefit that is greater than fifty percent likely to be realized upon effective settlement with a taxing authority.
Operating Expenses
Operating expenses include costs associated with the development and production of the Company’s products and services and their delivery to customers. These expenses principally include employee compensation and benefits and travel costs that are incurred in
| MOODY’S 2017 10-K | 75 |
Table of Contents
connection with these activities. Operating expenses are charged to income as incurred, except for certain costs related to software implementation services which may be deferred until related revenue is recognized. Additionally, certain costs incurred to develop internal use software are capitalized and depreciated over their estimated useful life.
Selling, General and Administrative Expenses
SG&A expenses include such items as compensation and benefits for corporate officers and staff and compensation and other expenses related to sales. They also include items such as office rent, business insurance, professional fees and gains and losses from sales and disposals of assets. SG&A expenses are charged to income as incurred, except for certain expenses incurred to develop internal use software (which are capitalized and depreciated over their estimated useful life) and the deferral of sales commissions in the MA segment (which are recognized in the period in which the related revenue is recognized).
Foreign Currency Translation
For all operations outside the U.S. where the Company has designated the local currency as the functional currency, assets and liabilities are translated into U.S. dollars using end of year exchange rates, and revenue and expenses are translated using average exchange rates for the year. For these foreign operations, currency translation adjustments are recorded to other comprehensive income.
Comprehensive Income
Comprehensive income represents the change in net assets of a business enterprise during a period due to transactions and other events and circumstances from non-owner sources including foreign currency translation impacts, net actuarial losses and net prior service costs related to pension and other retirement plans, gains and losses on derivative instruments designated as net investment hedges or cash flow hedges and unrealized gains and losses on securities designated as ‘available-for-sale’ under Topic 320 of the ASC. Comprehensive income items, including cumulative translation adjustments of entities that are less-than-wholly-owned subsidiaries, will be reclassified to noncontrolling interests and thereby, adjusting accumulated other comprehensive income proportionately in accordance with the percentage of ownership interest of the NCI shareholder.
Income Taxes
The Company accounts for income taxes under the asset and liability method in accordance with ASC Topic 740. Therefore, income tax expense is based on reported income before income taxes and deferred income taxes reflect the effect of temporary differences between the amounts of assets and liabilities that are recognized for financial reporting purposes and the amounts that are recognized for income tax purposes. On January 1, 2017, the Company adopted ASU No. 2016-16, “ Accounting for Income Taxes, Intra-Entity Asset Transfers of Assets Other than Inventory. Under previous guidance, the tax effects of intra-entity asset transfers (intercompany sales) were deferred until the transferred asset was sold to a third party or otherwise recovered through use. The new guidance eliminates the exception for all intra-entity sales of assets other than inventory. Upon adoption, a $4.6 million cumulative-effect adjustment was recorded in retained earnings as of the beginning of the period of adoption.
The Company classifies interest related to unrecognized tax benefits as a component of interest expense in its consolidated statements of operations. Penalties are recognized in other non-operating expenses. For uncertain tax positions (“UTPs”), the Company first determines whether it is more-likely-than-not (defined as a likelihood of more than fifty percent) that a tax position will be sustained based on its technical merits as of the reporting date, assuming that taxing authorities will examine the position and have full knowledge of all relevant information. A tax position that meets this more-likely-than-not threshold is then measured and recognized at the largest amount of benefit that is greater than fifty percent likely to be realized upon effective settlement with a taxing authority.
On December 22, 2017, the Tax Act was signed into law, resulting in all previously undistributed foreign earnings being subject to U.S. tax. However, the Company currently intends to continue to indefinitely reinvest these earnings outside the U.S. The Company has not provided non-U.S. deferred income taxes on these indefinitely reinvested earnings. It is not practicable to determine the amount of non-U.S. deferred taxes that might be required to be provided if such earnings were distributed in the future, due to complexities in the tax laws and in the hypothetical calculations that would have to be made.
Fair Value of Financial Instruments
The Company’s financial instruments include cash, cash equivalents, trade receivables and payables, all of which are short-term in nature and, accordingly, approximate fair value. Additionally, the Company invests in certain short-term investments consisting primarily of certificates of deposit that are carried at cost, which approximates fair value due to their short-term maturities.
The Company also has certain investments in closed-ended and open-ended mutual funds in India which are designated as ‘available for sale’ under Topic 320 of the ASC. Accordingly, unrealized gains and losses on these investments are recorded to other comprehensive income and are reclassified out of accumulated other comprehensive income to the statement of operations when the investment matures or is sold using a specific identification method.
Also, the Company uses derivative instruments, as further described in Note 5, to manage certain financial exposures that occur in the normal course of business. These derivative instruments are carried at fair value on the Company’s consolidated balance sheets.
| 76 | MOODY’S 2017 10-K |
Table of Contents
Fair value is defined by the ASC as the price that would be received from selling an asset or paid to transfer a liability (i.e., an exit price) in an orderly transaction between market participants at the measurement date. The determination of this fair value is based on the principal or most advantageous market in which the Company could commence transactions and considers assumptions that market participants would use when pricing the asset or liability, such as inherent risk, transfer restrictions and risk of nonperformance. Also, determination of fair value assumes that market participants will consider the highest and best use of the asset.
The ASC establishes a fair value hierarchy whereby the inputs contained in valuation techniques used to measure fair value are categorized into three broad levels as follows:
Level 1: quoted market prices in active markets that the reporting entity has the ability to access at the date of the fair value measurement;
Level 2: inputs other than quoted market prices described in Level 1 that are observable for the asset or liability, either directly or indirectly, such as quoted prices in active markets for similar assets or liabilities, quoted prices for identical or similar assets or liabilities in markets that are not active or other inputs that are observable or can be corroborated by observable market data for substantially the full term of the assets or liabilities;
Level 3: unobservable inputs that are supported by little or no market activity and that are significant to the fair value measurement of the assets or liabilities.
Concentration of Credit Risk
Financial instruments that potentially subject the Company to concentration of credit risk principally consist of cash and cash equivalents, short-term investments, trade receivables and derivatives.
The Company manages its credit risk exposure by allocating its cash equivalents among various money market mutual funds, money market deposit accounts, certificates of deposits and high-grade commercial paper. Short-term investments primarily consist of certificates of deposit as of December 31, 2017 and 2016. The Company manages its credit risk exposure on cash equivalents and short-term investments by limiting the amount it can invest with any single entity. No customer accounted for 10% or more of accounts receivable at December 31, 2017 or 2016.
Earnings (Loss) per Share of Common Stock
Basic shares outstanding is calculated based on the weighted average number of shares of common stock outstanding during the reporting period. Diluted shares outstanding is calculated giving effect to all potentially dilutive common shares, assuming that such shares were outstanding and dilutive during the reporting period.
Pension and Other Retirement Benefits
Moody’s maintains various noncontributory DBPPs as well as other contributory and noncontributory retirement plans. The expense and assets/liabilities that the Company reports for its pension and other retirement benefits are dependent on many assumptions concerning the outcome of future events and circumstances. These assumptions represent the Company’s best estimates and may vary by plan. The differences between the assumptions for the expected long-term rate of return on plan assets and actual experience is spread over a five-year period to the market-related value of plan assets which is used in determining the expected return on assets component of annual pension expense. All other actuarial gains and losses are generally deferred and amortized over the estimated average future working life of active plan participants.
The Company recognizes as an asset or liability in its consolidated balance sheet the funded status of its defined benefit retirement plans, measured on a plan-by-plan basis. Changes in the funded status due to actuarial gains/losses are recorded as part of other comprehensive income during the period the changes occur.
Use of Estimates
The preparation of financial statements in conformity with GAAP requires management to make estimates and assumptions that affect the reported amounts of assets and liabilities, the disclosure of contingent assets and liabilities at the date of the financial statements, and the reported amounts of revenue and expenses during the period. Actual results could differ from those estimates. Estimates are used for, but not limited to, revenue recognition, accounts receivable allowances, income taxes, contingencies, valuation and useful lives of long-lived and intangible assets, goodwill, pension and other retirement benefits, stock-based compensation, and depreciable lives for property and equipment and computer software.
Recently Issued Accounting Pronouncements
In May 2014, the FASB issued ASU No. 2014-09, “Revenue from Contracts with Customers (Topic 606)”. This ASU outlines a comprehensive new revenue recognition model that requires a company to recognize revenue to depict the transfer of goods or services to a customer at an amount that reflects the consideration it expects to receive in exchange for those goods or services by performing a five-step process. In August 2015, the FASB issued ASU No. 2015-14 “Revenue from Contracts with Customers (Topic 606), Deferral of
| MOODY’S 2017 10-K | 77 |
Table of Contents
the Effective Date” which defers the effective date of the ASU for annual and interim reporting periods beginning after December 15, 2017, with early adoption permitted up to the original effective date of December 15, 2016. In addition, during 2016, the FASB issued additional updates clarifying the implementation guidance for the new revenue recognition standard.
The Company will adopt the new revenue guidance as of January 1, 2018 using the modified retrospective transition method. Under this adoption method, the Company will record a cumulative adjustment to retained earnings at January 1, 2018 and apply the provisions of the ASU prospectively. As of the date of this filing, the Company has made a full assessment of the changes to its accounting policies relating to the adoption of the new revenue accounting standard. This ASU will have an impact on, which is not limited to: i) the accounting for certain software subscription revenue in MA whereby the license rights within the arrangement will be recognized at the inception of the contract based on estimated stand-alone selling price with the remainder recognized over the subscription period (compared to ASC 605 whereby all software subscription revenue is currently recognized over the subscription period); ii) the accounting for certain ERS and ESA revenue arrangements where VSOE is not currently available under ASC 605 will result in the acceleration of revenue recognition (compared to ASC 605 whereby revenue is currently deferred due to lack of VSOE until all elements without VSOE have been delivered); iii) the capitalization and related amortization period for sales commissions, which are incurred in the MA segment; iv) the expensing of software implementation project costs to fulfill a contract for its ERS and ESA businesses which under ASC 605 were capitalized and expensed when related project revenue was recognized; v) the capitalization of work-in-process costs for in-progress MIS ratings at the end of each reporting period; and vi) the timing of when fees for certain MIS ratings products are recognized to match when the performance obligation to the customer is satisfied and the determination of the transaction price to account for variable consideration at contract inception. This ASU will also require new comprehensive disclosures about contracts with customers including the significant reasonable judgments the Company has made when applying the ASU.
The Company is in the process of finalizing the implementation of a software solution in order to support the accounting under the new standard for MA revenue arrangements with multiple performance obligations.
Under this adoption method, the Company will record a cumulative non-cash adjustment to retained earnings at January 1, 2018 and apply the provisions of the ASU prospectively. The table below reflects an approximation of anticipated impacts to January 1, 2018 retained earnings for each type of adjustment required under the new revenue standard based on the Company’s assessment and best estimates to date.
| Transition adjustment |
Estimated benefit to / (reduction of) January 1, 2018 Retained Earnings | |
| Recognition of MA deferred revenue (1) | Approximately $105 million | |
| Increase to capitalized MA sales commissions (2) | Approximately $76 million | |
| Capitalization of work-in-process for in-progress ratings | Approximately $9 million | |
| Net impact of all other adjustments | Approximately $4 million | |
| Net increase in tax liability on the above | (Approximately $45 million) | |
| Total anticipated post-tax adjustment | Approximately $149 million |
| (1) | Represents anticipated deferred revenue as of December 31, 2017 that would have been recognized as revenue in 2017 or earlier if the new standard was then in effect. The transition adjustment will continue to be refined as the Company finalizes its implementation of the aforementioned software solution. |
| (2) | Pending finalization of the final fourth quarter MA sales commission payout to be made during the first quarter. |
Note that the above range of expected impacts from adopting the new revenue standard pertains solely to the impact to retained earnings as of January 1, 2018 on the Company’s consolidated balance sheet, and is not indicative of the impact the new ASU is expected to have on the Company’s consolidated statement of operations post-adoption. The impact that the provisions of the new ASU will have on the consolidated statement of operations subsequent to adoption will depend heavily on the volume and impact of new sales contracts realized in future periods, particularly in the ERS and ESA businesses. The Company does not have any material software implementation arrangements in progress as of December 31, 2017 with terms longer than two years, and therefore the impact to the consolidated statement of operations under the provisions of the new standard will be dependent on each future period’s sales activity. Generally, however, the Company does not anticipate that applying the provisions of the new standard will have a material impact to its 2018 consolidated Net Income. However, there could be quarterly fluctuations in the financial results of both MIS and MA, or there could be increases or decreases in revenues and expenses which would largely offset and not be material at a total Company level for the full year. Furthermore, as part of the disclosure requirements in the first year of adoption, there will be disclosures of the Company’s consolidated statement of operations for 2018 as if the new revenue standard was not adopted and the Company continued to account for revenue and related transactions under the existing standards. Importantly, the application of this new guidance has no effect on the cash the Company expects to receive nor on the economics of the business, but rather affects the timing of revenue and expense recognition with the expectation that revenue recognition will more closely align with cash received.
In January 2016, the FASB issued ASU No. 2016-01 “Financial Instruments—Overall (Subtopic 825-10), Recognition and Measurement of Financial Assets and Financial Liabilities”. The amendments in this ASU update various aspects of recognition, measurement, presentation and disclosures relating to financial instruments. This ASU is effective for fiscal years beginning after December 15, 2017. The
| 78 | MOODY’S 2017 10-K |
Table of Contents
Company has determined that the most pertinent impact to its financial statements upon the adoption of this ASU will relate to the discontinuance of the available-for-sale classification for investments in equity securities (unrealized gains and losses were recorded through OCI). Accordingly, subsequent to adoption of this ASU, changes in the fair value of equity securities held by the Company will be recorded through earnings. The Company does not expect the adoption of this ASU to have a material impact on its financial statements.
In February 2016, the FASB issued ASU No. 2016-02, “Leases (Topic 842)” requiring lessees to recognize a right-of-use asset and lease liability for all leases with terms of more than 12 months. Recognition, measurement and presentation of expenses and cash flows will depend on classification as either a finance or operating lease. This ASU is effective for fiscal years beginning after December 15, 2018, with early adoption permitted. This standard must be adopted using a modified retrospective approach whereby leases will be presented in accordance with the new standard as of the earliest period presented. The Company is currently evaluating the impact of this ASU on the Company’s financial statements. The Company believes that the most notable impact to its financial statements upon the adoption of this ASU will be the recognition of a material right-of-use asset and lease liability for its real estate leases.
In June 2016, the FASB issued ASU No. 2016-13, “Financial Instruments—Credit Losses (Topic 326), Measurement of Credit Losses on Financial Instruments”. The amendments in this ASU require the use of an “expected credit loss” impairment model for most financial assets reported at amortized cost which will require entities to estimate expected credit losses over the lifetime of the instrument. This may result in the earlier recognition of allowances for losses. For available-for-sale debt securities with unrealized losses, an allowance for credit losses will be recognized as a contra account to the amortized cost carrying value of the asset rather than a direct reduction to the carrying value, with changes in the allowance impacting earnings. This ASU is effective for annual and interim reporting periods beginning after December 15, 2019, with early adoption permitted in annual and interim reporting periods beginning after December 15, 2018. Entities will apply the standard’s provisions as a cumulative-effect adjustment to retained earnings as of the beginning of the first effective reporting period. The Company is currently evaluating the impact of this ASU on its financial statements. Currently, the Company believes that the most notable impact of this ASU will relate to its processes around the assessment of the adequacy of its allowance for doubtful accounts on accounts receivable.
In August 2016, the FASB issued ASU No. 2016-15, “Statement of Cash Flows (Topic 230), Classification of Certain Cash Receipts and Cash Payments”. This ASU adds or clarifies guidance on the classification of certain cash receipts and payments in the statement of cash flows with the intent to alleviate diversity in practice for classifying various types of cash flows. This ASU is effective for annual and interim reporting periods beginning after December 15, 2017. The Company will apply this clarification guidance in its statements of cash flows upon adoption.
In January 2017, the FASB issued ASU No. 2017-01, “Business Combinations (Topic 805), Clarifying the Definition of a Business”. This ASU clarifies the definition of a business with the objective of adding guidance to assist entities with evaluating whether transactions should be accounted for as acquisitions (or disposals) of assets or businesses. This ASU is effective for annual and interim reporting periods beginning after December 15, 2017 and should be applied prospectively. Upon adoption, the Company will apply the guidance in this ASU when evaluating whether acquired assets and activities constitute a business.
In March 2017, the FASB issued ASU No. 2017-07, “Compensation—Retirement Benefits (Topic 715), Improving the Presentation of Net Periodic Pension Cost and Net Periodic Postretirement Benefit Cost”. This ASU impacts the presentation of net periodic pension costs in the statement of operations. Entities will be required to report the service cost component in the same line item or items as other compensation costs (either Operating or SG&A in Moody’s statement of operations). The other components of net benefit cost are required to be presented in the statement of operations separately from the service cost component and outside of operating income. The ASU permits only the service cost component of net periodic pension cost to be eligible for capitalization, when applicable. This ASU is effective for annual and interim reporting periods beginning after December 15, 2017. Upon adoption, the Company will bifurcate its net periodic pension costs reported in its statements of operations in accordance with this ASU.
In May 2017, the FASB issued ASU No. 2017-09, “Compensation—Stock Compensation (Topic 718), Scope of Modification Accounting”. This ASU clarifies when changes to the terms or conditions of a share-based payment award must be accounted for as modifications. Under this ASU, an entity will not apply modification accounting to a share-based payment award if the award’s fair value, vesting conditions and classification as an equity or liability instrument are the same immediately before and after the change. The new guidance will reduce diversity in practice and result in fewer changes to the terms of an award being accounted for as modifications. This ASU is effective for annual and interim reporting periods beginning after December 15, 2017 and should be applied prospectively to awards modified on or after the adoption date. The Company does not expect the adoption of this ASU to have a material impact on its financial statements.
In July 2017, the FASB issued ASU No. 2017-12, “Derivatives and Hedging (Topic 815): Targeted Improvements to Accounting for Hedging Activities”. This ASU enables entities to enhance transparency relating to risk management activities and simplifies the application of hedge accounting in certain circumstances. This ASU is effective for fiscal years beginning after December 15, 2018, including interim
| MOODY’S 2017 10-K | 79 |
Table of Contents
periods within those years with early adoption permitted. The Company is currently in the process of assessing the impact that this ASU will have on its financial statements.
In December 2017, the SEC issued Staff Accounting Bulletin No. 118 (“SAB 118”) to address the application of U.S. GAAP in situations when a registrant does not have the necessary information available, prepared, or analyzed (including computations) in reasonable detail to finalize the calculations for the 2017 income tax effects of the Tax Act. SAB 118 provides entities with a one year measurement period from the December 22, 2017 enactment date, in order to complete the accounting for the effects of the Tax Act. Further information pertaining to the provisional estimates recorded by the Company as of and for the year ended December 31, 2017 are detailed in Note 15 to the consolidated financial statements.
In February 2018, FASB issued ASU 2018-02, “Reclassification of Certain Tax Effects from Accumulated Other Comprehensive Income”. Under current GAAP, adjustments to deferred tax assets and liabilities related to a change in tax laws or rates are included in income from continuing operations, even in situations where the related items were originally recognized in OCI (commonly referred to as a “stranded tax effect”). The provisions of this ASU permit the reclassification of the stranded tax effect related to the Tax Act from AOCI to retained earnings. This ASU is effective for all entities for fiscal years beginning after December 15, 2018, and interim periods within those fiscal years, with early adoption permitted. Adoption of this ASU is to be applied either in the period of adoption or retrospectively to each period in which the effect of the Tax Act were recognized. The Company is currently evaluating the impact of this ASU on its financial statements.
| NOTE 3 | RECONCILIATION OF WEIGHTED AVERAGE SHARES OUTSTANDING |
Below is a reconciliation of basic to diluted shares outstanding:
| Year Ended December 31, | ||||||||||||
| 2017 | 2016 | 2015 | ||||||||||
| Basic | 191.1 | 192.7 | 200.1 | |||||||||
| Dilutive effect of shares issuable under stock-based compensation plans | 3.1 | 2.7 | 3.3 | |||||||||
|
|
|
|
|
|
|
|||||||
| Diluted | 194.2 | 195.4 | 203.4 | |||||||||
|
|
|
|
|
|
|
|||||||
| Antidilutive options to purchase common shares and restricted stock as well as contingently issuable restricted stock which are excluded from the table above |
0.6 | 0.6 | 0.7 | |||||||||
|
|
|
|
|
|
|
|||||||
The calculation of diluted EPS requires certain assumptions regarding the use of both cash proceeds and assumed proceeds that would be received upon the exercise of stock options and vesting of restricted stock outstanding as of December 31, 2017, 2016 and 2015. The assumed proceeds in 2017 do not include Excess Tax Benefits pursuant to the prospective adoption of ASU 2016-09 in the first quarter of 2017. The assumed proceeds in 2016 and 2015 include Excess Tax Benefits.
The decrease in the diluted shares outstanding primarily reflects treasury share repurchases under the Company’s Board authorized share repurchase program.
| NOTE 4 | CASH EQUIVALENTS AND INVESTMENTS |
The table below provides additional information on the Company’s cash equivalents and investments:
| As of December 31, 2017 | ||||||||||||||||||||||||
| Cost | Gross Unrealized Gains |
Fair Value | Balance sheet location | |||||||||||||||||||||
| Cash and cash equivalents |
Short-term investments |
Other assets |
||||||||||||||||||||||
| Money market mutual funds | $ | 42.2 | $ | — | $ | 42.2 | $ | 42.2 | $ | — | $ | — | ||||||||||||
| Certificates of deposit and money market deposit accounts (1) | $ | 351.4 | $ | — | $ | 351.4 | $ | 238.6 | $ | 111.8 | $ | 1.0 | ||||||||||||
| Fixed maturity and open ended mutual funds (2) | $ | 16.8 | $ | 4.3 | $ | 21.1 | $ | — | $ | — | $ | 21.1 | ||||||||||||
| As of December 31, 2016 | ||||||||||||||||||||||||
| Cost | Gross Unrealized Gains |
Fair Value | Balance sheet location | |||||||||||||||||||||
| Cash and cash equivalents |
Short-term investments |
Other assets |
||||||||||||||||||||||
| Money market mutual funds | $ | 189.0 | $ | — | $ | 189.0 | $ | 189.0 | $ | — | $ | — | ||||||||||||
| Certificates of deposit and money market deposit accounts (1) | $ | 1,190.5 | $ | — | $ | 1,190.5 | $ | 1,017.0 | $ | 173.4 | $ | 0.1 | ||||||||||||
| Fixed maturity and open ended mutual funds (2) | $ | 27.0 | $ | 5.6 | $ | 32.6 | $ | — | $ | — | $ | 32.6 | ||||||||||||
| 80 | MOODY’S 2017 10-K |
Table of Contents
| (1) | Consists of time deposits and money market deposit accounts. The remaining contractual maturities for the certificates of deposits classified as short-term investments were one to 12 months at December 31, 2017 and at December 31, 2016. The remaining contractual maturities for the certificates of deposits classified in other assets are 15 to 48 months at December 31, 2017 and 13 months to 15 months at December 31, 2016. Time deposits with a maturity of less than 90 days at time of purchase are classified as cash and cash equivalents. |
| (2) | Consists of investments in fixed maturity mutual funds and open-ended mutual funds. The remaining contractual maturities for the fixed maturity instruments range from six months to seven months and six months to 19 months at December 31, 2017 and December 31,2016 respectively. |
The money market mutual funds as well as the fixed maturity and open ended mutual funds in the table above are deemed to be ‘available for sale’ under ASC Topic 320 and the fair value of these instruments is determined using Level 1 inputs as defined in the ASC.
| NOTE 5 | DERIVATIVE INSTRUMENTS AND HEDGING ACTIVITIES |
The Company is exposed to global market risks, including risks from changes in FX rates and changes in interest rates. Accordingly, the Company uses derivatives in certain instances to manage the aforementioned financial exposures that occur in the normal course of business. The Company does not hold or issue derivatives for speculative purposes.
Derivatives and non-derivative instruments designated as accounting hedges:
Interest Rate Swaps
The Company has entered into interest rate swaps to convert the fixed interest rate on certain of its long-term debt to a floating interest rate based on the 3-month LIBOR. The purpose of these hedges is to mitigate the risk associated with changes in the fair value of the long-term debt, thus the Company has designated these swaps as fair value hedges. The fair value of the swaps is adjusted quarterly with a corresponding adjustment to the carrying value of the debt. The changes in the fair value of the swaps and the underlying hedged item generally offset and the net cash settlements on the swaps are recorded each period within interest expense, net in the Company’s consolidated statement of operations.
The following table summarizes the Company’s interest rate swaps designated as fair value hedges:
| Nature of Swap |
Notional
Amount As of December 31, |
Floating Interest Rate | ||||||||||
| Hedged Item |
2017 | 2016 | ||||||||||
| 2010 Senior Notes due 2020 | Pay Floating/Receive Fixed | $500.0 | $500.0 | 3-month LIBOR | ||||||||
| 2014 Senior Notes due 2019 | Pay Floating/Receive Fixed | $450.0 | $450.0 | 3-month LIBOR | ||||||||
| 2012 Senior Notes due 2022 | Pay Floating/Receive Fixed | $80.0 | $80.0 | 3-month LIBOR | ||||||||
The following table summarizes the impact to the statement of operations of the Company’s interest rate swaps designated as fair value hedges:
| Amount of Income Recognized in the Consolidated Statements of Operations |
||||||||||||||
| Year Ended December 31, | ||||||||||||||
| 2017 | 2016 | 2015 | ||||||||||||
| Derivatives Designated as Fair Value Accounting Hedges |
Location on Consolidated Statement of Operations |
|||||||||||||
| Interest rate swaps | Interest expense, net | $ | 6.7 | $ | 11.2 | $ | 15.2 | |||||||
Cross-currency swaps
In conjunction with the issuance of the 2015 Senior Notes, the Company entered into a cross-currency swap to exchange €100 million for U.S. dollars on the date of the settlement of the notes. The purpose of this cross-currency swap was to mitigate FX risk on the remaining principal balance on the 2015 Senior Notes that initially was not designated as a net investment hedge. Under the terms of the swap, the Company paid the counterparty interest on the $110.5 million received at 3.945% per annum and the counterparty paid the Company interest on the €100 million paid at 1.75% per annum. These interest payments were settled in March of each year, beginning in 2016, until either the maturity of the cross-currency swap in 2027 or upon early termination at the discretion of the Company. The principal payments on this cross currency swap were to be settled in 2027, concurrent with the repayment of the 2015 Senior Notes at maturity or upon early termination at the discretion of the Company. In March 2016, the Company designated these cross-currency swaps as cash flow hedges. Accordingly, changes in fair value subsequent to the date the swaps were designated as cash flow hedges were recognized in OCI. Gains and losses on the swaps initially recognized in OCI were reclassified to the statement of operations in the period in which changes in the underlying hedged item affects net income. On December 18, 2017, the Company terminated the cross-currency swap and designated the full €500 million principal of the 2015 Senior Notes as a net investment hedge as discussed below.
| MOODY’S 2017 10-K | 81 |
Table of Contents
Net Investment Hedges
The Company had entered into foreign currency forward contracts that were designated as net investment hedges which were discontinued during 2017. Additionally, the Company has designated €500 million of the 2015 Senior Notes Due 2027 as a net investment hedge. These hedges are intended to mitigate FX exposure related to non-U.S. dollar net investments in certain foreign subsidiaries against changes in foreign exchange rates. These net investment hedges are designated as accounting hedges under the applicable sections of Topic 815 of the ASC. The net investment hedge relating to the 2015 Senior Notes will end upon the repayment of the notes in 2027 unless terminated earlier at the discretion of the Company.
Hedge effectiveness is assessed based on the overall changes in the fair value of the hedge. For hedges that meet the effectiveness requirements, any change in the fair value is recorded in OCI in the foreign currency translation account. Any change in the fair value of the Company’s outstanding net investment hedges that is the result of ineffectiveness would be recognized immediately in other non-operating (expense) income, net in the Company’s consolidated statement of operations.
The following table summarizes the notional amounts of the Company’s outstanding forward contracts that were designated as net investment hedges:
| December 31, 2017 | December 31, 2016 | |||||||||||||||
| Sell | Buy | Sell | Buy | |||||||||||||
| Notional amount of net investment hedges: | ||||||||||||||||
| Contracts to sell GBP for euros | £ | — | € | — | £ | 22.1 | € | 26.4 | ||||||||
The following table provides information on the gains/(losses) on the Company’s net investment and cash flow hedges:
| Amount of Gain/(Loss) Recognized in AOCI on Derivative (Effective Portion), net of Tax |
Amount of Gain/(Loss) Reclassified from AOCI into Income (Effective Portion), net of tax |
|||||||||||||||||||||||
| Derivatives and Non-Derivative Instruments in Net Investment Hedging Relationships |
Year Ended December 31, | Year Ended December 31, | ||||||||||||||||||||||
| 2017 | 2016 | 2015 | 2017 | 2016 | 2015 | |||||||||||||||||||
| FX forwards |
$ | 1.2 | $ | (12.0 | ) | $ | 13.4 | $ | — | $ | — | $ | — | |||||||||||
| Long-term debt |
(37.2 | ) | 7.8 | 4.7 | — | — | — | |||||||||||||||||
|
|
|
|
|
|
|
|
|
|
|
|
|
|||||||||||||
| Total net investment hedges |
$ | (36.0 | ) | $ | (4.2 | ) | $ | 18.1 | $ | — | $ | — | $ | — | ||||||||||
|
|
|
|
|
|
|
|
|
|
|
|
|
|||||||||||||
| Derivatives in Cash Flow Hedging Relationships | ||||||||||||||||||||||||
| Cross currency swap |
$ | 6.3 | $ | (0.9 | ) | $ | — | $ | 7.8 | * | $ | (3.7 | )* | $ | — | |||||||||
| Interest rate contracts |
(0.4 | ) | — | (1.1 | ) | (1.1 | ) | — | — | |||||||||||||||
|
|
|
|
|
|
|
|
|
|
|
|
|
|||||||||||||
| Total cash flow hedges |
5.9 | (0.9 | ) | (1.1 | ) | 6.7 | (3.7 | ) | — | |||||||||||||||
|
|
|
|
|
|
|
|
|
|
|
|
|
|||||||||||||
| Total | $ | (30.1 | ) | $ | (5.1 | ) | $ | 17.0 | $ | 6.7 | $ | (3.7 | ) | $ | — | |||||||||
|
|
|
|
|
|
|
|
|
|
|
|
|
|||||||||||||
| * | Reflects $12.6 million in gains and $6 million in losses in 2017 and 2016, respectively, recorded in other non-operating income (expense), net of $4.8 million and $2.3 million in 2017 and 2016, respectively, relating to the tax effect of the aforementioned items. |
The cumulative amount of realized and unrecognized net investment and cash flow hedge gains/(losses) recorded in AOCI is as follows:
| Cumulative Gains/(Losses), net of tax | ||||||||
| December 31, 2017 | December 31, 2016 | |||||||
| Net investment hedges | ||||||||
| FX forwards |
$ | 23.5 | $ | 22.3 | ||||
| Long-term debt |
(24.7 | ) | 12.5 | |||||
|
|
|
|
|
|||||
| Total net investment hedges |
$ | (1.2 | ) | $ | 34.8 | |||
|
|
|
|
|
|||||
| Cash flow hedges | ||||||||
| Interest rate contracts |
$ | (0.4 | ) | $ | (1.1 | ) | ||
| Cross currency swap |
1.3 | 2.8 | ||||||
|
|
|
|
|
|||||
| Total losses on cash flow hedges |
0.9 | 1.7 | ||||||
|
|
|
|
|
|||||
| Total net (losses) gains in AOCI | $ | (0.3 | ) | $ | 36.5 | |||
|
|
|
|
|
|||||
| 82 | MOODY’S 2017 10-K |
Table of Contents
Derivatives not designated as accounting hedges:
Foreign exchange forwards
The Company also enters into foreign exchange forwards to mitigate the change in fair value on certain assets and liabilities denominated in currencies other than a subsidiary’s functional currency. These forward contracts are not designated as accounting hedges under the applicable sections of Topic 815 of the ASC. Accordingly, changes in the fair value of these contracts are recognized immediately in other non-operating (expense), income net in the Company’s consolidated statements of operations along with the FX gain or loss recognized on the assets and liabilities denominated in a currency other than the subsidiary’s functional currency. These contracts have expiration dates at various times through May 2018.
The following table summarizes the notional amounts of the Company’s outstanding foreign exchange forwards:
| December 31, 2017 | December 31, 2016 | |||||||||||||||
| Notional Amount of Currency Pair: | Sell | Buy | Sell | Buy | ||||||||||||
| Contracts to sell USD for GBP | $ | 484.7 | £ | 362.3 | $ | — | £ | — | ||||||||
| Contracts to sell USD for Japanese yen | $ | 24.3 | ¥ | 2,700.0 | $ | — | ¥ | — | ||||||||
| Contracts to sell USD for Canadian dollars | $ | 51.7 | C$ | 64.0 | $ | — | C$ | — | ||||||||
| Contracts to sell Singapore dollars for EUR | S$ | — | € | — | S$ | 55.5 | € | 36.0 | ||||||||
| Contracts to sell euros for GBP | € | — | £ | — | € | 31.0 | £ | 25.9 | ||||||||
| Contracts to sell USD for Singapore dollars | $ | 39.2 | S$ | 53.0 | $ | — | S$ | — | ||||||||
| Contracts to sell USD for EUR | $ | 465.2 | € | 390.0 | $ | — | € | — | ||||||||
| NOTE: € = Euro, £ = British pound, S$ = Singapore dollar, $ = U.S. dollar, ¥ = Japanese yen, C$ = Canadian dollar | ||||||||
Foreign Exchange Options and forward contracts relating to the acquisition of Bureau van Dijk
The Company entered into a foreign currency collar consisting of option contracts to economically hedge the Bureau van Dijk euro denominated purchase price (as further discussed in Note 7). These option contracts were not designated as accounting hedges under the applicable sections of Topic 815 of the ASC. The foreign currency option contracts consisted of separate put and call options each in the aggregate notional amount of €2.7 billion. This collar was settled at the end of July 2017, in advance of the August 10, 2017 closing of the Bureau van Dijk acquisition.
The Company entered into foreign exchange forwards to hedge the Bureau van Dijk purchase price for the period from the settlement of the aforementioned foreign currency collar until the closing date on August 10, 2017. These forward contracts were not designated as accounting hedges under the applicable sections of Topic 815 of the ASC. The foreign exchange contracts were to sell $2.8 billion and buy €2.4 billion and sell $41 million and buy £31 million.
The following table summarizes the impact to the consolidated statements of operations relating to the net gain (loss) on the Company’s derivatives which are not designated as hedging instruments:
| Year Ended December 31, | ||||||||||||||
| Derivatives Not Designated as Accounting Hedges |
Location on Statement of Operations | 2017 | 2016 | 2015 | ||||||||||
| Foreign exchange forwards | Other non-operating income, net | $ | 21.5 | $ | (7.2 | ) | $ | (2.8 | ) | |||||
| Foreign exchange forwards relating to Bureau van Dijk acquisition | Purchase Price Hedge Gain | 10.3 | — | — | ||||||||||
| FX collar relating to Bureau van Dijk acquisition | Purchase Price Hedge Gain | 100.8 | — | — | ||||||||||
|
|
|
|
|
|
|
|||||||||
| $ | 132.6 | $ | (7.2 | ) | $ | (2.8 | ) | |||||||
|
|
|
|
|
|
|
|||||||||
| MOODY’S 2017 10-K | 83 |
Table of Contents
The table below shows the classification between assets and liabilities on the Company’s consolidated balance sheets for the fair value of the derivative instrument as well as the carrying value of its non-derivative debt instruments designated and qualifying as net investment hedges:
| Derivative and Non-derivative Instruments |
||||||||||
| Balance Sheet Location |
December 31, 2017 |
December 31, 2016 |
||||||||
| Assets: | ||||||||||
| Derivatives designated as accounting hedges: | ||||||||||
| FX forwards on net investment in certain foreign subsidiaries |
Other current assets | $ | — | $ | 0.6 | |||||
| Interest rate swaps |
Other assets | 0.5 | 7.0 | |||||||
|
|
|
|
|
|||||||
| Total derivatives designated as accounting hedges |
0.5 | 7.6 | ||||||||
|
|
|
|
|
|||||||
| Derivatives not designated as accounting hedges: | ||||||||||
| FX forwards on certain assets and liabilities |
Other current assets | 12.5 | — | |||||||
|
|
|
|
|
|||||||
| Total assets | $ | 13.0 | $ | 7.6 | ||||||
|
|
|
|
|
|||||||
| Liabilities: | ||||||||||
| Derivatives designated as accounting hedges: | ||||||||||
| Cross-currency swap |
Other non-current liabilities | $ | — | $ | 3.8 | |||||
| Interest rate swaps |
Other non-current liabilities | 3.5 | 0.8 | |||||||
|
|
|
|
|
|||||||
| Total derivatives designated as accounting hedges |
3.5 | 4.6 | ||||||||
|
|
|
|
|
|||||||
| Non-derivative instrument designated as accounting hedge: | ||||||||||
| Long-term debt designated as net investment hedge |
Long-term debt | 600.4 | 421.9 | |||||||
| Derivatives not designated as accounting hedges: | ||||||||||
| FX forwards on certain assets and liabilities |
Accounts payable and accrued liabilities | 2.0 | 0.8 | |||||||
|
|
|
|
|
|||||||
| Total liabilities | $ | 605.9 | $ | 427.3 | ||||||
|
|
|
|
|
|||||||
| NOTE 6 | PROPERTY AND EQUIPMENT, NET |
Property and equipment, net consisted of:
| December 31, | ||||||||
| 2017 | 2016 | |||||||
| Office and computer equipment (3 – 10 year estimated useful life) | $ | 219.5 | $ | 189.1 | ||||
| Office furniture and fixtures (3 – 10 year estimated useful life) | 50.5 | 47.1 | ||||||
| Internal-use computer software (1 – 10 year estimated useful life) | 520.3 | 452.1 | ||||||
| Leasehold improvements and building (2 – 20 year estimated useful life) | 240.8 | 233.1 | ||||||
|
|
|
|
|
|||||
| Total property and equipment, at cost |
1,031.1 | 921.4 | ||||||
| Less: accumulated depreciation and amortization | (706.0 | ) | (595.5 | ) | ||||
|
|
|
|
|
|||||
| Total property and equipment, net | $ | 325.1 | $ | 325.9 | ||||
|
|
|
|
|
|||||
Depreciation and amortization expense related to the above assets was $96.9 million, $92.5 million, and $81.6 million for the years ended December 31, 2017, 2016 and 2015, respectively.
| NOTE 7 | ACQUISITIONS |
The business combinations described below are accounted for using the acquisition method of accounting whereby assets acquired and liabilities assumed were recognized at fair value on the date of the transaction. Any excess of the purchase price over the fair value of the assets acquired and liabilities assumed was recorded to goodwill. For all acquisitions excluding Bureau van Dijk, the Company has not presented pro forma combined results for these acquisitions because the impact on previously reported statements of operations
| 84 | MOODY’S 2017 10-K |
Table of Contents
would not have been material. Additionally, the near term impact to the Company’s operations and cash flows for these acquisitions (excluding Bureau van Dijk) is not material.
Bureau van Dijk
On August 10, 2017, a subsidiary of the Company acquired 100% of Yellow Maple I B.V., an indirect parent company of Bureau van Dijk Electronic Publishing B.V., a global provider of business intelligence and company information products. The cash payment of $3,542.0 million was funded with a combination of cash on hand, primarily offshore, and new debt financing. The acquisition extends Moody’s position as a leader in risk data and analytical insight.
Shown below is the purchase price allocation, which summarizes the fair value of the assets and liabilities assumed, at the date of acquisition:
| (Amounts in millions) | ||||||||
| Current assets | $ | 158.4 | ||||||
| Property and equipment, net | 4.2 | |||||||
| Intangible assets: | ||||||||
| Customer relationships (23 year weighted average life) |
$ | 998.7 | ||||||
| Product technology (12 year weighted average life) |
258.5 | |||||||
| Trade name (18 year weighted average life) |
82.3 | |||||||
| Database (10 year weighted average life) |
12.9 | |||||||
|
|
|
|||||||
| Total intangible assets (21 year weighted average life) |
1,352.4 | |||||||
| Goodwill | 2,619.0 | |||||||
| Other assets | 5.9 | |||||||
| Liabilities | ||||||||
| Deferred revenue |
$ | (101.1 | ) | |||||
| Accounts payable and accrued liabilities |
(48.6 | ) | ||||||
| Deferred tax liabilities, net |
(329.8 | ) | ||||||
| Other liabilities |
(118.4 | ) | ||||||
|
|
|
|||||||
| Total liabilities |
(597.9 | ) | ||||||
|
|
|
|||||||
| Net assets acquired | $ | 3,542.0 | ||||||
|
|
|
The Company has performed a preliminary valuation analysis of the fair market value of assets and liabilities of the Bureau van Dijk business. The final purchase price allocation will be determined when the Company has completed and fully reviewed the detailed valuations. The final allocation could differ materially from the preliminary allocation. The final allocation may include changes in allocations to acquired intangible assets as well as goodwill and other changes to assets and liabilities including reserves for uncertain tax positions and deferred tax liabilities. The estimated useful lives of acquired intangibles assets are also preliminary. Additionally, at December 31, 2017, the Company has not completed its allocation of certain of the goodwill acquired to other MA reporting units that are anticipated to benefit from synergies resulting from the Bureau van Dijk acquisition.
Current assets in the table above include acquired cash of $36 million. Additionally, current assets include accounts receivable of approximately $88 million (net of an allowance for uncollectible accounts of $3.7 million).
The amount of Bureau van Dijk’s revenue and Net Income from August 10, 2017 through December 31, 2017 included in the Company’s statement of operations was $92.4 million and $63.7 million, respectively. The aforementioned net income includes a $57.9 million tax benefit, as further described in Note 15, relating to a statutory tax rate reduction in Belgium which resulted in a decrease in deferred tax liabilities relating to acquired intangible assets. The acquired deferred revenue balance of approximately $154 million was reduced by $53 million as part of acquisition accounting to establish the fair value of deferred revenue. This will reduce reported revenue by $53 million over the remaining contractual period of in-progress customer arrangements assumed as of the acquisition date. This resulted in approximately $36 million less in reported revenue for the period from August 10, 2017 to December 31, 2017 with the remaining $17 million to reduce revenue in 2018. Amortization of acquired intangible assets was approximately $28 million for the period from August 10, 2017 through December 31, 2017.
Goodwill
Under the acquisition method of accounting for business combinations, the excess of the purchase price over the fair value of the net assets acquired is allocated to goodwill. Goodwill typically results through expected synergies from combining operations of an
| MOODY’S 2017 10-K | 85 |
Table of Contents
acquiree and an acquirer, anticipated new customer acquisition and products, as well as from intangible assets that do not qualify for separate recognition. The goodwill recognized as a result of this acquisition includes, among other things, the value of combining the complementary product portfolios of the Company and Bureau van Dijk which is expected to extend the Company’s reach to new and evolving market segments as well as cost savings synergies, expected new customer acquisitions and products.
Goodwill, which has been assigned to the MA segment, is not deductible for tax purposes.
Bureau van Dijk will be a separate reporting unit for purposes of the Company’s annual goodwill impairment assessment.
Other Liabilities Assumed
In connection with the acquisition, the Company assumed liabilities relating to UTBs as well as deferred tax liabilities which relate to acquired intangible assets. These items are included in other liabilities in the table above.
Transaction and Non-Recurring Integration Costs.
In connection with the acquisition, the Company incurred transaction and non-recurring integration costs (Acquisition-Related Expenses) through December 2017. Acquisition-Related Expenses of $22.5 million were comprised of transaction costs (consisting primarily of legal and advisory costs) of $8.6 million and non-recurring integration costs of $13.9 million for the year ended December 31, 2017.
Supplementary Unaudited Pro Forma Information
Supplemental information on an unaudited pro forma basis is presented below for the year ended December 31, 2017 and 2016 as if the acquisition of Bureau van Dijk occurred on January 1, 2016. The pro forma financial information is presented for comparative purposes only, based on certain estimates and assumptions, which the Company believes to be reasonable but not necessarily indicative of future results of operations or the results that would have been reported if the acquisition had been completed at January 1, 2016. The unaudited pro forma information includes amortization of acquired intangible assets, based on the preliminary purchase price allocation and an estimate of useful lives reflected above, and incremental financing costs resulting from the acquisition, net of income tax, which was estimated using the weighted average statutory tax rates in effect in the jurisdiction for which the pro forma adjustment relates.
| (Amounts in millions) | For the year ended December 31, 2017 |
For the year ended December 31, 2016 |
||||||
| Pro forma Revenue | $ | 4,414.8 | $ | 3,825.8 | ||||
| Pro forma Net Income attributable to Moody’s | $ | 1,011.6 | $ | 240.6 | ||||
The unaudited pro forma results do not include any anticipated cost savings or other effects of the planned integration of Bureau van Dijk. Accordingly, the pro forma results above are not necessarily indicative of the results that would have been reported if the acquisition had occurred on the dates indicated, nor are the pro forma results indicative of results which may occur in the future. The Bureau van Dijk results included in the table above have been converted to U.S. GAAP from IFRS as issued by the IASB and have been translated to USD at rates in effect for the periods presented. As the unaudited pro forma results give effect to the acquisition of Bureau van Dijk as if it had occurred on January 1, 2016, the Bureau van Dijk amounts in the pro forma results include a reduction in revenue of approximately $58 million and $1 million relating to a fair value adjustment to deferred revenue required as part of acquisition accounting for the year ended December 31, 2016 and 2017, respectively. In addition, a corresponding pro forma adjustment was included to add back the approximate $36 million reduction to reported revenue for the period from August 10, 2017 to December 31, 2017 relating to the deferred revenue adjustment required as part of acquisition accounting as of the actual August 10, 2017 acquisition date.
SCDM Financial
On February 13, 2017, a subsidiary of the Company acquired the structured finance data and analytics business of SCDM Financial. The aggregate purchase price was not material and the near term impact to the Company’s operations and cash flow is not expected to be material. This business unit operates in the MA reportable segment and goodwill related to this acquisition has been allocated to the RD&A reporting unit.
Korea Investor Service (KIS)
In July 2016, a subsidiary of the Company acquired the non-controlling interest of KIS and additional shares of KIS Pricing. The aggregate purchase price was not material and the near term impact to the Company’s operations and cash flow is not expected to be material. KIS and KIS Pricing are a part of the MIS segment.
Gilliland Gold Young (GGY)
On March 1, 2016, subsidiaries of the Company acquired 100% of GGY, a leading provider of advanced actuarial software for the life insurance industry. The cash payments noted in the table below were funded with cash on hand. The acquisition of GGY will allow MA to provide an industry-leading enterprise risk offering for global life insurers and reinsurers.
| 86 | MOODY’S 2017 10-K |
Table of Contents
The table below details the total consideration relating to the acquisition:
| Cash paid at closing | $ | 83.4 | ||
| Additional consideration paid to sellers in the third quarter 2016(1) | 3.1 | |||
|
|
|
|||
| Total consideration | $ | 86.5 | ||
|
|
|
| (1) | Represents additional consideration paid to the sellers for amounts withheld at closing pending the completion of certain administrative matters |
Shown below is the purchase price allocation, which summarizes the fair value of the assets and liabilities assumed, at the date of acquisition:
| Current assets | $ | 11.7 | ||||||
| Property and equipment, net | 2.0 | |||||||
| Indemnification assets | 1.5 | |||||||
| Intangible assets: | ||||||||
| Trade name (19 year weighted average life) |
$ | 3.7 | ||||||
| Customer relationships (21 year weighted average life) |
13.8 | |||||||
| Software (7 year weighted average life) |
16.6 | |||||||
|
|
|
|||||||
| Total intangible assets (14 year weighted average life) |
34.1 | |||||||
| Goodwill | 59.4 | |||||||
| Liabilities | (22.2 | ) | ||||||
|
|
|
|||||||
| Net assets acquired | $ | 86.5 | ||||||
|
|
|
Current assets in the table above include acquired cash of $7.5 million. Additionally, current assets include accounts receivable of $2.9 million. Goodwill, which has been assigned to the MA segment, is not deductible for tax.
In connection with the acquisition, the Company assumed liabilities relating to UTBs and certain other tax exposures which are included in the liabilities assumed in the table above. The sellers have contractually indemnified the Company against any potential payments that may have to be made regarding these amounts. Accordingly, the Company carries an indemnification asset on its consolidated balance sheet at December 31, 2017 and December 31, 2016.
The Company incurred $0.9 million of costs directly related to the GGY acquisition of which $0.6 million was incurred in 2015 and $0.3 million was incurred in the first quarter of 2016. These costs are recorded within selling, general and administrative expenses in the Company’s consolidated statements of operations.
GGY is part of the ERS reporting unit for purposes of the Company’s annual goodwill impairment assessment.
BlackBox Logic
On December 9, 2015, a subsidiary of the Company acquired the RMBS data and analytics business of BlackBox Logic. The aggregate purchase price was not material and the near term impact to the Company’s operations and cash flows is not expected to be material. This business operates in the MA reportable segment and goodwill related to this acquisition has been allocated to the RD&A reporting unit.
Equilibrium
On May 21, 2015, a subsidiary of the Company acquired 100% of Equilibrium, a provider of credit rating and research services in Peru and Panama. The aggregate purchase price was not material and the near term impact to the Company’s operations and cash flows is not expected to be material. Equilibrium operates in the MIS reportable segment and goodwill related to this acquisition has been allocated to the MIS reporting unit.
| MOODY’S 2017 10-K | 87 |
Table of Contents
| NOTE 8 | GOODWILL AND OTHER ACQUIRED INTANGIBLE ASSETS |
The following table summarizes the activity in goodwill:
| Year Ended December 31, 2017 | ||||||||||||||||||||||||||||||||||||
| MIS | MA | Consolidated | ||||||||||||||||||||||||||||||||||
| Gross goodwill |
Accumulated impairment charge |
Net goodwill |
Gross goodwill |
Accumulated impairment charge |
Net goodwill |
Gross goodwill |
Accumulated impairment charge |
Net goodwill |
||||||||||||||||||||||||||||
| Balance at beginning of year | $ | 277.0 | $ | — | $ | 277.0 | $ | 758.8 | $ | (12.2 | ) | $ | 746.6 | $ | 1,035.8 | $ | (12.2 | ) | $ | 1,023.6 | ||||||||||||||||
| Additions/adjustments | — | — | — | 2,622.6 | — | 2,622.6 | 2,622.6 | — | 2,622.6 | |||||||||||||||||||||||||||
| Foreign currency translation adjustments | 8.2 | — | 8.2 | 98.8 | — | 98.8 | 107.0 | — | 107.0 | |||||||||||||||||||||||||||
|
|
|
|
|
|
|
|
|
|
|
|
|
|
|
|
|
|
|
|||||||||||||||||||
| Ending balance | $ | 285.2 | $ | — | $ | 285.2 | $ | 3,480.2 | $ | (12.2 | ) | $ | 3,468.0 | $ | 3,765.4 | $ | (12.2 | ) | $ | 3,753.2 | ||||||||||||||||
|
|
|
|
|
|
|
|
|
|
|
|
|
|
|
|
|
|
|
|||||||||||||||||||
| Year Ended December 31, 2016 | ||||||||||||||||||||||||||||||||||||
| MIS | MA | Consolidated | ||||||||||||||||||||||||||||||||||
| Gross goodwill |
Accumulated impairment charge |
Net goodwill |
Gross goodwill |
Accumulated impairment charge |
Net goodwill |
Gross goodwill |
Accumulated impairment charge |
Net goodwill |
||||||||||||||||||||||||||||
| Balance at beginning of year | $ | 284.4 | $ | — | $ | 284.4 | $ | 704.1 | $ | (12.2 | ) | $ | 691.9 | $ | 988.5 | $ | (12.2 | ) | $ | 976.3 | ||||||||||||||||
| Additions/adjustments | — | — | — | 61.0 | — | 61.0 | 61.0 | — | 61.0 | |||||||||||||||||||||||||||
| Goodwill derecognized upon sale of subsidiary | (3.2 | ) | — | (3.2 | ) | — | — | — | (3.2 | ) | — | (3.2 | ) | |||||||||||||||||||||||
| Foreign currency translation adjustments | (4.2 | ) | — | (4.2 | ) | (6.3 | ) | — | (6.3 | ) | (10.5 | ) | — | (10.5 | ) | |||||||||||||||||||||
|
|
|
|
|
|
|
|
|
|
|
|
|
|
|
|
|
|
|
|||||||||||||||||||
| Ending balance | $ | 277.0 | $ | — | $ | 277.0 | $ | 758.8 | $ | (12.2 | ) | $ | 746.6 | $ | 1,035.8 | $ | (12.2 | ) | $ | 1,023.6 | ||||||||||||||||
|
|
|
|
|
|
|
|
|
|
|
|
|
|
|
|
|
|
|
|||||||||||||||||||
The 2017 additions/adjustments for the MA segment in the table above relate to the acquisition of Bureau van Dijk and the structured finance data and analytics business of SCDM. The 2016 additions/adjustments for the MA segment in the table above relate to the acquisition of GGY. The 2016 goodwill derecognized for the MIS segment in the table above relates to the divestiture of ICTEAS in the fourth quarter of 2016.
| 88 | MOODY’S 2017 10-K |
Table of Contents
Acquired intangible assets and related amortization consisted of:
| December 31, | ||||||||
| 2017 | 2016 | |||||||
| Customer relationships | $ | 1,345.1 | $ | 310.1 | ||||
| Accumulated amortization | (159.9 | ) | (124.4 | ) | ||||
|
|
|
|
|
|||||
| Net customer relationships |
1,185.2 | 185.7 | ||||||
|
|
|
|
|
|||||
| Trade secrets | 30.2 | 29.9 | ||||||
| Accumulated amortization | (28.1 | ) | (25.6 | ) | ||||
|
|
|
|
|
|||||
| Net trade secrets |
2.1 | 4.3 | ||||||
|
|
|
|
|
|||||
| Software/product technology | 358.6 | 87.7 | ||||||
| Accumulated amortization | (78.0 | ) | (54.9 | ) | ||||
|
|
|
|
|
|||||
| Net software/product technology |
280.6 | 32.8 | ||||||
|
|
|
|
|
|||||
| Trade names | 161.6 | 75.3 | ||||||
| Accumulated amortization | (26.7 | ) | (19.9 | ) | ||||
|
|
|
|
|
|||||
| Net trade names |
134.9 | 55.4 | ||||||
|
|
|
|
|
|||||
| Other (1) | 57.4 | 43.5 | ||||||
| Accumulated amortization | (28.6 | ) | (25.3 | ) | ||||
|
|
|
|
|
|||||
| Net other |
28.8 | 18.2 | ||||||
|
|
|
|
|
|||||
| Total |
$ | 1,631.6 | $ | 296.4 | ||||
|
|
|
|
|
|||||
| (1) | Other intangible assets primarily consist of databases, covenants not to compete, and acquired ratings methodologies and models. |
Amortization expense relating to acquired intangible assets is as follows:
| Year Ended December 31, | ||||||||||||
| 2017 | 2016 | 2015 | ||||||||||
| Amortization expense | $ | 61.4 | $ | 34.2 | $ | 31.9 | ||||||
Estimated future annual amortization expense for intangible assets subject to amortization is as follows:
| Year Ending December 31, |
|
|||
| 2018 | $ | 101.0 | ||
| 2019 | 97.0 | |||
| 2020 | 94.7 | |||
| 2021 | 94.6 | |||
| 2022 | 94.1 | |||
| Thereafter | 1,150.2 | |||
|
|
|
|||
| Total estimated future amortization | $ | 1,631.6 | ||
|
|
|
|||
Amortizable intangible assets are reviewed for recoverability whenever events or changes in circumstances indicate that the carrying amount may not be recoverable. For all intangible assets, there were no such events or changes during 2017, 2016 or 2015 that would indicate that the carrying amount of amortizable intangible assets in any of the Company’s reporting units may not be recoverable.
| NOTE 9 | RESTRUCTURING |
In September 2016, the Company approved a restructuring plan relating to cost management initiatives in the MIS segment as well as in certain corporate overhead functions. This restructuring plan consisted solely of headcount reductions, which when combined with an immaterial restructuring in the first half of 2016, represented approximately 1% of the Company’s workforce. The cumulative amount of expense incurred from inception through December 31, 2016 for these actions was $12.0 million. Actions under these plans were substantially complete at September 30, 2016.
| MOODY’S 2017 10-K | 89 |
Table of Contents
Total expenses included in the accompanying consolidated statements of operations are as follows:
| Year Ended December 31, | ||||||||||||
| 2017 | 2016 | 2015 | ||||||||||
| Restructuring | $ | — | $ | 12.0 | $ | — | ||||||
Changes to the restructuring liability were as follows:
| Employee Termination Costs | Employee Termination Costs | |||||||
| 2017 | 2016 | |||||||
| Balance as of January 1, | $ | 6.3 | $ | — | ||||
| Cost incurred and adjustments | — | 12.0 | ||||||
| Cash payments and adjustments | (5.9 | ) | (5.7 | ) | ||||
|
|
|
|
|
|||||
| Balance as of December 31, | $ | 0.4 | $ | 6.3 | ||||
|
|
|
|
|
|||||
As of December 31, 2017 the remaining restructuring liability of $0.4 million relating to severance is expected to be fully paid out during the year ending December 31, 2018. The liabilities in the table above were recorded within accounts payable and accrued liabilities in the Company’s consolidated balance sheet at December 31, 2017 and 2016.
| NOTE 10 | FAIR VALUE |
The table below presents information about items which are carried at fair value on a recurring basis at December 31, 2017 and December 31, 2016:
| Fair Value Measurement as of December 31, 2017 | ||||||||||||||
| Description |
Balance | Level 1 | Level 2 | |||||||||||
| Assets: | ||||||||||||||
| Derivatives (a) | $ | 13.0 | $ | — | $ | 13.0 | ||||||||
| Money market mutual funds | 42.2 | 42.2 | — | |||||||||||
| Fixed maturity and open ended mutual funds | 21.1 | 21.1 | — | |||||||||||
|
|
|
|
|
|
|
|||||||||
| Total | $ | 76.3 | $ | 63.3 | $ | 13.0 | ||||||||
|
|
|
|
|
|
|
|||||||||
| Liabilities: | ||||||||||||||
| Derivatives (a) | $ | 5.5 | $ | — | $ | 5.5 | ||||||||
|
|
|
|
|
|
|
|||||||||
| Total | $ | 5.5 | $ | — | $ | 5.5 | ||||||||
|
|
|
|
|
|
|
|||||||||
| Fair Value Measurement as of December 31, 2016 | ||||||||||||||
| Description |
Balance | Level 1 | Level 2 | |||||||||||
| Assets: | ||||||||||||||
| Derivatives (a) | $ | 7.6 | $ | — | $ | 7.6 | ||||||||
| Money market mutual funds | 189.0 | 189.0 | — | |||||||||||
| Fixed maturity and open ended mutual funds | 32.6 | 32.6 | — | |||||||||||
|
|
|
|
|
|
|
|||||||||
| Total | $ | 229.2 | $ | 221.6 | $ | 7.6 | ||||||||
|
|
|
|
|
|
|
|||||||||
| Liabilities: | ||||||||||||||
| Derivatives (a) | $ | 5.4 | $ | — | $ | 5.4 | ||||||||
|
|
|
|
|
|
|
|||||||||
| Total | $ | 5.4 | $ | — | $ | 5.4 | ||||||||
|
|
|
|
|
|
|
|||||||||
| (a) | Information on the Company’s derivative instruments is more fully described in Note 5 to the consolidated financial statements. |
| 90 | MOODY’S 2017 10-K |
Table of Contents
The following are descriptions of the methodologies utilized by the Company to estimate the fair value of its derivative contracts, fixed maturity plans, and money market mutual funds:
Derivatives:
In determining the fair value of the derivative contracts in the table above, the Company utilizes industry standard valuation models. Where applicable, these models project future cash flows and discount the future amounts to a present value using spot rates, forward points, currency volatilities, interest rates as well as the risk of non-performance of the Company and the counterparties with whom it has derivative contracts. The Company established strict counterparty credit guidelines and only enters into transactions with financial institutions that adhere to these guidelines. Accordingly, the risk of counterparty default is deemed to be minimal.
Fixed maturity and open ended mutual funds:
The fixed maturity mutual funds and open ended mutual funds primarily represent exchange traded funds in India and are classified as securities available-for-sale. Accordingly, any unrealized gains and losses are recognized through OCI until the instruments mature or are sold.
Money market mutual funds:
The money market mutual funds represent publicly traded funds with a stable $1 net asset value.
| NOTE 11 | OTHER BALANCE SHEET AND STATEMENT OF OPERATIONS INFORMATION |
The following tables contain additional detail related to certain balance sheet captions:
| December 31, | ||||||||
| 2017 | 2016 | |||||||
| Other current assets: | ||||||||
| Prepaid taxes |
$ | 94.9 | $ | 47.0 | ||||
| Prepaid expenses |
107.6 | 65.7 | ||||||
| Other |
47.6 | 28.1 | ||||||
|
|
|
|
|
|||||
| Total other current assets |
$ | 250.1 | $ | 140.8 | ||||
|
|
|
|
|
|||||
| December 31, | ||||||||
| 2017 | 2016 | |||||||
| Other assets: | ||||||||
| Investments in joint ventures |
$ | 99.1 | $ | 26.3 | ||||
| Deposits for real-estate leases |
12.3 | 10.8 | ||||||
| Indemnification assets related to acquisitions |
17.0 | 16.5 | ||||||
| Mutual funds and fixed deposits |
22.1 | 32.7 | ||||||
| Other |
9.4 | 25.9 | ||||||
|
|
|
|
|
|||||
| Total other assets |
$ | 159.9 | $ | 112.2 | ||||
|
|
|
|
|
|||||
| MOODY’S 2017 10-K | 91 |
Table of Contents
| December 31, | ||||||||
| 2017 | 2016 | |||||||
| Accounts payable and accrued liabilities: | ||||||||
| Salaries and benefits |
$ | 129.6 | $ | 89.3 | ||||
| Incentive compensation |
246.7 | 151.1 | ||||||
| Accrued settlement charge |
— | 863.8 | ||||||
| Customer credits, advanced payments and advanced billings |
22.2 | 28.4 | ||||||
| Self-insurance reserves |
8.1 | 11.1 | ||||||
| Dividends |
6.2 | 78.5 | ||||||
| Professional service fees |
47.1 | 40.4 | ||||||
| Interest accrued on debt |
73.9 | 59.2 | ||||||
| Accounts payable |
21.8 | 28.4 | ||||||
| Income taxes (see Note 15) |
79.2 | 16.8 | ||||||
| Restructuring (see Note 9) |
0.4 | 6.3 | ||||||
| Pension and other retirement employee benefits (see Note 13) |
5.9 | 6.1 | ||||||
| Accrued royalties (1) |
26.4 | 1.8 | ||||||
| Other |
82.8 | 63.1 | ||||||
|
|
|
|
|
|||||
| Total accounts payable and accrued liabilities |
$ | 750.3 | $ | 1,444.3 | ||||
|
|
|
|
|
|||||
| (1) | Primarily relates to fees due to Bureau van Dijk’s data providers |
| December 31, | ||||||||
| 2017 | 2016 | |||||||
| Other liabilities: | ||||||||
| Pension and other retirement employee benefits (see Note 13) |
$ | 244.5 | $ | 264.1 | ||||
| Deferred rent-non-current portion |
103.1 | 98.3 | ||||||
| Interest accrued on UTPs |
54.7 | 34.1 | ||||||
| Legacy and other tax matters |
1.3 | 1.2 | ||||||
| Income tax liability – non current* |
232.2 | — | ||||||
| Other |
28.2 | 27.5 | ||||||
|
|
|
|
|
|||||
| Total other liabilities | $ | 664.0 | $ | 425.2 | ||||
|
|
|
|
|
|||||
| * | The 2017 amount primarily reflects the transition tax pursuant to the Tax Act, which was enacted into law in December 2017. See Note 15 for further information. |
Changes in the Company’s self-insurance reserves for claims insured by the Company’s wholly-owned insurance subsidiary, which primarily relate to legal defense costs for claims from prior years, are as follows:
| Year Ended December 31, | ||||||||||||
|
|
2017 | 2016 | 2015 | |||||||||
| Balance January 1, | $ | 11.1 | $ | 19.7 | $ | 21.5 | ||||||
| Accruals (reversals), net |
9.6 | 12.1 | 22.2 | |||||||||
| Payments |
(12.6 | ) | (20.7 | ) | (24.0 | ) | ||||||
|
|
|
|
|
|
|
|||||||
| Balance December 31, | $ | 8.1 | $ | 11.1 | $ | 19.7 | ||||||
|
|
|
|
|
|
|
|||||||
Purchase Price Hedge Gain:
There was a $111.1 million realized gain reflecting gains on an FX collar and foreign exchange forwards to economically hedge the euro denominated purchase price for Bureau van Dijk as more fully discussed in Note 5 to the condensed consolidated financial statements.
Settlement Charge
There was a charge of $863.8 million recorded in the fourth quarter of 2016 related to an agreement entered into on January 13, 2017 with the U.S. Department of Justice and the attorneys general of 21 U.S. states and the District of Columbia to resolve pending and potential civil claims related to credit ratings that MIS assigned to certain structured finance instruments in the financial crisis era.
| 92 | MOODY’S 2017 10-K |
Table of Contents
CCXI Gain:
CCXI is a Chinese credit rating agency in which Moody’s acquired a 49% stake in 2006. Moody’s accounts for this investment under the equity method of accounting. On March 21, 2017, CCXI, as part of a strategic business realignment, issued additional capital to its majority shareholder in exchange for a ratings business wholly-owned by the majority shareholder and which has the right to rate a different class of debt instrument in the Chinese market. The capital issuance by CCXI in exchange for this ratings business diluted Moody’s ownership interest in CCXI to 30% of a larger business and resulted in a $59.7 million non-cash, non-taxable gain. The issuance of additional capital by CCXI is treated as if Moody’s sold a 19% interest in CCXI at fair value. The fair value of the 19% interest in CCXI that Moody’s hypothetically sold was estimated using both a discounted cash flow methodology and comparable public company multiples. A DCF analysis requires significant estimates, including projections of future operating results and cash flows based on the budgets and forecasts of CCXI, expected long-term growth rates, terminal values, WACC and the effects of external factors and market conditions. Moody’s will continue to account for its 30% interest in CCXI under the equity method of accounting.
| NOTE 12. | COMPREHENSIVE INCOME AND ACCUMULATED OTHER COMPREHENSIVE INCOME |
The following table provides details about the reclassifications out of AOCI:
| Year Ended December 31, | Affected line in the consolidated statement of | |||||||||||||
| 2017 | 2016 | 2015 | ||||||||||||
| Gains on currency translation adjustments | ||||||||||||||
| Liquidation/sale of foreign subsidiary |
$ | — | $ | 36.6 | $ | 0.1 | Other non-operating income (expense), net | |||||||
|
|
|
|
|
|
|
|||||||||
| Total gains on currency translation adjustments | — | 36.6 | 0.1 | |||||||||||
|
|
|
|
|
|
|
|||||||||
| Gains (losses) on cash flow hedges | ||||||||||||||
| Cross-currency swap |
12.6 | (6.0 | ) | — | Other non-operating income (expense), net | |||||||||
| Interest rate contract |
(1.1 | ) | — | — | Interest expense, net | |||||||||
|
|
|
|
|
|
|
|||||||||
| Total before income taxes |
11.5 | (6.0 | ) | — | ||||||||||
| Income tax effect of item above |
(4.8 | ) | 2.3 | — | Provision for income taxes | |||||||||
|
|
|
|
|
|
|
|||||||||
| Total net gains (losses) on cash flow hedges | 6.7 | (3.7 | ) | — | ||||||||||
|
|
|
|
|
|
|
|||||||||
| Gains on available for sale securities: | ||||||||||||||
| Gains on available for sale securities |
1.8 | — | 0.9 | Other income | ||||||||||
| Income tax effect of item above |
— | — | — | Provision for income taxes | ||||||||||
|
|
|
|
|
|
|
|||||||||
| Total gains on available for sale securities | 1.8 | — | 0.9 | |||||||||||
|
|
|
|
|
|
|
|||||||||
| Pension and other retirement benefits | ||||||||||||||
| Amortization of actuarial losses and prior service costs included in net income |
(5.5 | ) | (5.8 | ) | (8.5 | ) | Operating expense | |||||||
| Amortization of actuarial losses and prior service costs included in net income |
(3.2 | ) | (3.9 | ) | (5.0 | ) | SG&A expense | |||||||
|
|
|
|
|
|
|
|||||||||
| Total before income taxes | (8.7 | ) | (9.7 | ) | (13.5 | ) | ||||||||
| Income tax effect of item above |
3.3 | 3.7 | 5.2 | Provision for income taxes | ||||||||||
|
|
|
|
|
|
|
|||||||||
| Total pension and other retirement benefits | (5.4 | ) | (6.0 | ) | (8.3 | ) | ||||||||
|
|
|
|
|
|
|
|||||||||
| Total gains (losses) included in Net Income attributable to reclassifications out of AOCI | $ | 3.1 | $ | 26.9 | $ | (7.3 | ) | |||||||
|
|
|
|
|
|
|
|||||||||
| MOODY’S 2017 10-K | 93 |
Table of Contents
The following table shows changes in AOCI by component (net of tax):
| Year Ended December 31, 2017 | ||||||||||||||||||||
| Pension and Other Retirement Benefits |
Gains / (Losses) on Cash Flow Hedges |
Foreign Currency Translation Adjustments |
Gains on Available for Sale Securities |
Total | ||||||||||||||||
| Balance December 31, 2016 | $ | (79.5 | ) | $ | 1.7 | $ | (290.2 | ) | $ | 3.1 | $ | (364.9 | ) | |||||||
| Other comprehensive income before reclassifications |
12.6 | 5.9 | 176.3 | 1.0 | 195.8 | |||||||||||||||
| Amounts reclassified from AOCI |
5.4 | (6.7 | ) | — | (1.8 | ) | (3.1 | ) | ||||||||||||
|
|
|
|
|
|
|
|
|
|
|
|||||||||||
| Other comprehensive income/(loss) | 18.0 | (0.8 | ) | 176.3 | (0.8 | ) | 192.7 | |||||||||||||
|
|
|
|
|
|
|
|
|
|
|
|||||||||||
| Balance December 31, 2017 | $ | (61.5 | ) | $ | 0.9 | $ | (113.9 | ) | $ | 2.3 | $ | (172.2 | ) | |||||||
|
|
|
|
|
|
|
|
|
|
|
|||||||||||
| Year Ended December 31, 2016 | ||||||||||||||||||||
| Balance December 31, 2015 | $ | (85.7 | ) | $ | (1.1 | ) | $ | (256.0 | ) | $ | 3.3 | $ | (339.5 | ) | ||||||
| Other comprehensive income/(loss) before reclassifications |
0.2 | (0.9 | ) | 2.4 | (0.2 | ) | 1.5 | |||||||||||||
| Amounts reclassified from AOCI |
6.0 | 3.7 | (36.6 | ) | — | (26.9 | ) | |||||||||||||
|
|
|
|
|
|
|
|
|
|
|
|||||||||||
| Other comprehensive income/(loss) | 6.2 | 2.8 | (34.2 | ) | (0.2 | ) | (25.4 | ) | ||||||||||||
|
|
|
|
|
|
|
|
|
|
|
|||||||||||
| Balance December 31, 2016 | $ | (79.5 | ) | $ | 1.7 | $ | (290.2 | ) | $ | 3.1 | $ | (364.9 | ) | |||||||
|
|
|
|
|
|
|
|
|
|
|
|||||||||||
| Year Ended December 31, 2015 | ||||||||||||||||||||
| Balance December 31, 2014 | $ | (105.4 | ) | $ | — | $ | (130.7 | ) | $ | 0.9 | $ | (235.2 | ) | |||||||
| Other comprehensive income/(loss) before reclassifications |
11.4 | (1.1 | ) | (125.2 | ) | 3.3 | (111.6 | ) | ||||||||||||
| Amounts reclassified from AOCI |
8.3 | — | (0.1 | ) | (0.9 | ) | 7.3 | |||||||||||||
|
|
|
|
|
|
|
|
|
|
|
|||||||||||
| Other comprehensive income/(loss) | 19.7 | (1.1 | ) | (125.3 | ) | 2.4 | (104.3 | ) | ||||||||||||
|
|
|
|
|
|
|
|
|
|
|
|||||||||||
| Balance December 31, 2015 | $ | (85.7 | ) | $ | (1.1 | ) | $ | (256.0 | ) | $ | 3.3 | $ | (339.5 | ) | ||||||
|
|
|
|
|
|
|
|
|
|
|
|||||||||||
| NOTE 13 | PENSION AND OTHER RETIREMENT BENEFITS |
U.S. Plans
Moody’s maintains funded and unfunded noncontributory Defined Benefit Pension Plans. The U.S. plans provide defined benefits using a cash balance formula based on years of service and career average salary or final average pay for selected executives. The Company also provides certain healthcare and life insurance benefits for retired U.S. employees. The retirement healthcare plans are contributory; the life insurance plans are noncontributory. Moody’s funded and unfunded U.S. pension plans, the U.S. retirement healthcare plans and the U.S. retirement life insurance plans are collectively referred to herein as the “Retirement Plans”. The U.S. retirement healthcare plans and the U.S. retirement life insurance plans are collectively referred to herein as the “Other Retirement Plans”. Effective at the Distribution Date, Moody’s assumed responsibility for the pension and other retirement benefits relating to its active employees. New D&B has assumed responsibility for the Company’s retirees and vested terminated employees as of the Distribution Date.
Through 2007, substantially all U.S. employees were eligible to participate in the Company’s DBPPs. Effective January 1, 2008, the Company no longer offers DBPPs to U.S. employees hired or rehired on or after January 1, 2008 and new hires in the U.S. instead will receive a retirement contribution in similar benefit value under the Company’s Profit Participation Plan. Current participants of the Company’s Retirement Plans and Other Retirement Plans continue to accrue benefits based on existing plan benefit formulas.
| 94 | MOODY’S 2017 10-K |
Table of Contents
Following is a summary of changes in benefit obligations and fair value of plan assets for the Retirement Plans for the years ended December 31:
| Pension Plans | Other Retirement Plans | |||||||||||||||
| 2017 | 2016 | 2017 | 2016 | |||||||||||||
| Change in benefit obligation: | ||||||||||||||||
| Benefit obligation, beginning of the period |
$ | (489.5 | ) | $ | (459.2 | ) | $ | (29.5 | ) | $ | (27.0 | ) | ||||
| Service cost |
(18.4 | ) | (20.1 | ) | (2.5 | ) | (2.2 | ) | ||||||||
| Interest cost |
(18.5 | ) | (18.2 | ) | (1.1 | ) | (1.0 | ) | ||||||||
| Plan participants’ contributions |
— | — | (0.4 | ) | (0.4 | ) | ||||||||||
| Benefits paid |
15.0 | 9.9 | 1.4 | 0.9 | ||||||||||||
| Actuarial gain (loss) |
7.4 | 4.2 | (0.1 | ) | 0.7 | |||||||||||
| Assumption changes |
(14.1 | ) | (6.1 | ) | 1.0 | (0.5 | ) | |||||||||
|
|
|
|
|
|
|
|
|
|||||||||
| Benefit obligation, end of the period |
$ | (518.1 | ) | $ | (489.5 | ) | $ | (31.2 | ) | $ | (29.5 | ) | ||||
|
|
|
|
|
|
|
|
|
|||||||||
| Change in plan assets: | ||||||||||||||||
| Fair value of plan assets, beginning of the period |
$ | 297.1 | $ | 260.9 | $ | — | $ | — | ||||||||
| Actual return on plan assets |
44.3 | 19.7 | — | — | ||||||||||||
| Benefits paid |
(15.0 | ) | (9.9 | ) | (1.4 | ) | (0.9 | ) | ||||||||
| Employer contributions |
31.0 | 26.4 | 1.0 | 0.5 | ||||||||||||
| Plan participants’ contributions |
— | — | 0.4 | 0.4 | ||||||||||||
|
|
|
|
|
|
|
|
|
|||||||||
| Fair value of plan assets, end of the period |
$ | 357.4 | $ | 297.1 | $ | — | $ | — | ||||||||
|
|
|
|
|
|
|
|
|
|||||||||
| Funded Status of the plans | $ | (160.7 | ) | $ | (192.4 | ) | $ | (31.2 | ) | $ | (29.5 | ) | ||||
|
|
|
|
|
|
|
|
|
|||||||||
| Amounts recorded on the consolidated balance sheets: | ||||||||||||||||
| Pension and retirement benefits liability – current |
$ | (4.9 | ) | $ | (5.1 | ) | $ | (1.0 | ) | $ | (1.0 | ) | ||||
| Pension and retirement benefits liability – non current |
(155.8 | ) | (187.3 | ) | (30.2 | ) | (28.5 | ) | ||||||||
|
|
|
|
|
|
|
|
|
|||||||||
| Net amount recognized | $ | (160.7 | ) | $ | (192.4 | ) | $ | (31.2 | ) | $ | (29.5 | ) | ||||
|
|
|
|
|
|
|
|
|
|||||||||
| Accumulated benefit obligation, end of the period | $ | (461.5 | ) | $ | (433.1 | ) | ||||||||||
|
|
|
|
|
|||||||||||||
The following information is for those pension plans with an accumulated benefit obligation in excess of plan assets:
| December 31, | ||||||||
| 2017 | 2016 | |||||||
| Aggregate projected benefit obligation | $ | 518.1 | $ | 489.5 | ||||
| Aggregate accumulated benefit obligation | $ | 461.5 | $ | 433.1 | ||||
| Aggregate fair value of plan assets | $ | 357.4 | $ | 297.1 | ||||
The following table summarizes the pre-tax net actuarial losses and prior service cost recognized in AOCI for the Company’s Retirement Plans as of December 31:
| Pension Plans | Other Retirement Plans | |||||||||||||||
| 2017 | 2016 | 2017 | 2016 | |||||||||||||
| Net actuarial losses | $ | (104.0 | ) | $ | (133.9 | ) | $ | (3.0 | ) | $ | (4.0 | ) | ||||
| Net prior service costs | 4.5 | 4.5 | 0.6 | 0.9 | ||||||||||||
|
|
|
|
|
|
|
|
|
|||||||||
| Total recognized in AOCI – pretax | $ | (99.5 | ) | $ | (129.4 | ) | $ | (2.4 | ) | $ | (3.1 | ) | ||||
|
|
|
|
|
|
|
|
|
|||||||||
| MOODY’S 2017 10-K | 95 |
Table of Contents
The following table summarizes the estimated pre-tax net actuarial losses and prior service cost for the Company’s Retirement Plans that will be amortized from AOCI and recognized as components of net periodic expense during the next fiscal year:
| Pension Plans | Other Retirement Plans | |||||||
| Net actuarial losses | $ | 6.0 | $ | — | ||||
| Net prior service costs | (0.3 | ) | (0.3 | ) | ||||
|
|
|
|
|
|||||
| Total to be recognized as components of net periodic expense | $ | 5.7 | $ | (0.3 | ) | |||
|
|
|
|
|
|||||
Net periodic benefit expenses recognized for the Retirement Plans for years ended December 31:
| Pension Plans | Other Retirement Plans | |||||||||||||||||||||||
| 2017 | 2016 | 2015 | 2017 | 2016 | 2015 | |||||||||||||||||||
| Components of net periodic expense | ||||||||||||||||||||||||
| Service cost | $ | 18.4 | $ | 20.1 | $ | 21.6 | $ | 2.5 | $ | 2.2 | $ | 2.2 | ||||||||||||
| Interest cost | 18.5 | 18.2 | 16.9 | 1.1 | 1.0 | 1.0 | ||||||||||||||||||
| Expected return on plan assets | (16.5 | ) | (17.0 | ) | (14.4 | ) | — | — | — | |||||||||||||||
| Amortization of net actuarial loss from earlier periods | 8.8 | 9.8 | 12.5 | 0.1 | 0.2 | 0.3 | ||||||||||||||||||
| Amortization of net prior service costs from earlier periods | — | 0.1 | 0.7 | (0.3 | ) | (0.3 | ) | — | ||||||||||||||||
|
|
|
|
|
|
|
|
|
|
|
|
|
|||||||||||||
| Net periodic expense | $ | 29.2 | $ | 31.2 | $ | 37.3 | $ | 3.4 | $ | 3.1 | $ | 3.5 | ||||||||||||
|
|
|
|
|
|
|
|
|
|
|
|
|
|||||||||||||
The following table summarizes the pre-tax amounts recorded in OCI related to the Company’s Retirement Plans for the years ended December 31:
| Pension Plans | Other Retirement Plans | |||||||||||||||||||||||
| 2017 | 2016 | 2015 | 2017 | 2016 | 2015 | |||||||||||||||||||
| Amortization of net actuarial losses | $ | 8.8 | $ | 9.8 | $ | 12.5 | $ | 0.1 | $ | 0.2 | $ | 0.3 | ||||||||||||
| Amortization of prior service costs | — | 0.1 | 0.7 | (0.3 | ) | (0.3 | ) | — | ||||||||||||||||
| Prior service costs | — | — | 6.5 | — | — | 1.2 | ||||||||||||||||||
| Net actuarial gain (loss) arising during the period | 21.1 | 0.8 | 8.4 | 0.9 | 0.2 | 1.3 | ||||||||||||||||||
|
|
|
|
|
|
|
|
|
|
|
|
|
|||||||||||||
| Total recognized in OCI – pre-tax | $ | 29.9 | $ | 10.7 | $ | 28.1 | $ | 0.7 | $ | 0.1 | $ | 2.8 | ||||||||||||
|
|
|
|
|
|
|
|
|
|
|
|
|
|||||||||||||
ADDITIONAL INFORMATION:
Assumptions — Retirement Plans
Weighted-average assumptions used to determine benefit obligations at December 31:
| Pension Plans | Other Retirement Plans | |||||||||||||||
| 2017 | 2016 | 2017 | 2016 | |||||||||||||
| Discount rate | 3.46 | % | 3.89 | % | 3.45 | % | 3.85 | % | ||||||||
| Rate of compensation increase | 3.71 | % | 3.72 | % | — | — | ||||||||||
Weighted-average assumptions used to determine net periodic benefit expense for years ended December 31:
| Pension Plans | Other Retirement Plans | |||||||||||||||||||||||
| 2017 | 2016 | 2015 | 2017 | 2016 | 2015 | |||||||||||||||||||
| Discount rate | 3.89 | % | 4.04 | % | 3.78 | % | 3.85 | % | 4.00 | % | 3.65 | % | ||||||||||||
| Expected return on plan assets | 5.40 | % | 6.10 | % | 5.80 | % | — | — | — | |||||||||||||||
| Rate of compensation increase | 3.72 | % | 3.74 | % | 3.76 | % | — | — | — | |||||||||||||||
| 96 | MOODY’S 2017 10-K |
Table of Contents
The expected rate of return on plan assets represents the Company’s best estimate of the long-term return on plan assets and is determined by using a building block approach, which generally weighs the underlying long-term expected rate of return for each major asset class based on their respective allocation target within the plan portfolio, net of plan paid expenses. As the assumption reflects a long-term time horizon, the plan performance in any one particular year does not, by itself, significantly influence the Company’s evaluation. For 2017, the expected rate of return used in calculating the net periodic benefit costs was 5.40%. For 2018, the Company’s expected rate of return assumption is 4.50% to reflect the Company’s current view of long-term capital market outlook. In addition, the Company has updated its mortality assumption by adopting the newly released mortality improvement scale MP-2017 to accompany the RP-2014 mortality tables to reflect the latest information regarding future mortality expectations by the Society of Actuaries. Additionally, the assumed healthcare cost trend rate assumption is not material to the valuation of the other retirement plans.
Plan Assets
Moody’s investment objective for the assets in the funded pension plan is to earn total returns that will minimize future contribution requirements over the long-term within a prudent level of risk. The Company works with its independent investment consultants to determine asset allocation targets for its pension plan investment portfolio based on its assessment of business and financial conditions, demographic and actuarial data, funding characteristics, and related risk factors. Other relevant factors, including historical and forward looking views of inflation and capital market returns, are also considered. Risk management practices include monitoring plan asset performance, diversification across asset classes and investment styles, and periodic rebalancing toward asset allocation targets. The Company’s Asset Management Committee is responsible for overseeing the investment activities of the plan, which includes selecting acceptable asset classes, defining allowable ranges of holdings by asset class and by individual investment managers, defining acceptable securities within each asset class, and establishing investment performance expectations. Ongoing monitoring of the plan includes reviews of investment performance and managers on a regular basis, annual liability measurements, and periodic asset/liability studies.
In 2014, the Company implemented a revised investment policy, which uses risk-controlled investment strategies by increasing the plan’s asset allocation to fixed income securities and specifying ranges of acceptable target allocation by asset class based on different levels of the plan’s accounting funded status. In addition, the investment policy also requires the investment-grade fixed income assets be rebalanced between shorter and longer duration bonds as the interest rate environment changes. This revised investment policy is designed to help protect the plan’s funded status and to limit volatility of the Company’s contributions. Based on the revised policy, the Company’s current target asset allocation is approximately 53% (range of 48% to 58%) in equity securities, 40% (range of 35% to 45%) in fixed income securities and 7% (range of 4% to 10%) in other investments and the plan will use a combination of active and passive investment strategies and different investment styles for its investment portfolios within each asset class. The plan’s equity investments are diversified across U.S. and non-U.S. stocks of small, medium and large capitalization. The plan’s fixed income investments are diversified principally across U.S. and non-U.S. government and corporate bonds which are expected to help reduce plan exposure to interest rate variation and to better align assets with obligations. The plan also invests in other fixed income investments such as debts rated below investment grade, emerging market debt, and convertible securities. The plan’s other investment, which is made through a private real estate debt fund, is expected to provide additional diversification benefits and absolute return enhancement to the plan assets.
| MOODY’S 2017 10-K | 97 |
Table of Contents
Fair value of the assets in the Company’s funded pension plan by asset category at December 31, 2017 and 2016 are as follows:
| Fair Value Measurement as of December 31, 2017 | ||||||||||||||||||||
| Asset Category | Balance | Level 1 | Level 2 | Measured using NAV practical expedient (a) |
% of total assets |
|||||||||||||||
| Cash and cash equivalent | $ | 16.5 | $ | — | $ | 16.5 | $ | — | 4 | % | ||||||||||
|
|
|
|
|
|
|
|
|
|||||||||||||
| Common/collective trust funds—equity securities | ||||||||||||||||||||
| U.S. large-cap |
140.3 | — | 140.3 | — | 39 | % | ||||||||||||||
| U.S. small and mid-cap |
23.3 | — | 23.3 | — | 7 | % | ||||||||||||||
| Emerging markets |
28.1 | — | 28.1 | — | 8 | % | ||||||||||||||
|
|
|
|
|
|
|
|
|
|||||||||||||
| Total equity investments | 191.7 | — | 191.7 | — | 54 | % | ||||||||||||||
|
|
|
|
|
|
|
|
|
|||||||||||||
| Emerging markets bond fund | 12.1 | 12.1 | — | — | 3 | % | ||||||||||||||
| Common/collective trust funds—fixed income securities | ||||||||||||||||||||
| Intermediate-term investment grade U.S. government/ corporate bonds |
83.7 | — | 83.7 | — | 23 | % | ||||||||||||||
| U.S. Treasury Inflation-Protected Securities (TIPs) |
13.4 | — | 13.4 | — | 4 | % | ||||||||||||||
| Private investment fund—convertible securities | 9.9 | — | — | 9.9 | 3 | % | ||||||||||||||
| Private investment fund—high yield securities | 9.7 | — | — | 9.7 | 3 | % | ||||||||||||||
|
|
|
|
|
|
|
|
|
|||||||||||||
| Total fixed-income investments | 128.8 | 12.1 | 97.1 | 19.6 | 36 | % | ||||||||||||||
|
|
|
|
|
|
|
|
|
|||||||||||||
| Other investment—private real estate debt fund | 20.4 | — | — | 20.4 | 6 | % | ||||||||||||||
|
|
|
|
|
|
|
|
|
|||||||||||||
| Total Assets | $ | 357.4 | $ | 12.1 | $ | 305.3 | $ | 40.0 | 100 | % | ||||||||||
|
|
|
|
|
|
|
|
|
|||||||||||||
| Fair Value Measurement as of December 31, 2016 | ||||||||||||||||||||
| Asset Category | Balance | Level 1 | Level 2 | Measured using NAV practical expedient (a) |
% of total assets |
|||||||||||||||
| Cash and cash equivalent | $ | 1.2 | $ | — | $ | 1.2 | $ | — | — | |||||||||||
|
|
|
|
|
|
|
|
|
|||||||||||||
| Common/collective trust funds—equity securities | ||||||||||||||||||||
| U.S. large-cap |
130.1 | — | 130.1 | — | 44 | % | ||||||||||||||
| U.S. small and mid-cap |
19.7 | — | 19.7 | — | 7 | % | ||||||||||||||
| Emerging markets |
20.8 | — | 20.8 | — | 7 | % | ||||||||||||||
|
|
|
|
|
|
|
|
|
|||||||||||||
| Total equity investments | 170.6 | — | 170.6 | — | 58 | % | ||||||||||||||
|
|
|
|
|
|
|
|
|
|||||||||||||
| Emerging markets bond fund | 11.4 | 11.4 | — | — | 4 | % | ||||||||||||||
| Common/collective trust funds—fixed income securities | ||||||||||||||||||||
| Intermediate-term investment grade U.S. government/ corporate bonds |
74.3 | — | 74.3 | — | 25 | % | ||||||||||||||
| U.S. Treasury Inflation-Protected Securities (TIPs) |
13.1 | — | 13.1 | — | 4 | % | ||||||||||||||
| Private investment fund—convertible securities | 9.1 | — | — | 9.1 | 3 | % | ||||||||||||||
| Private investment fund—high yield securities | 9.0 | — | — | 9.0 | 3 | % | ||||||||||||||
|
|
|
|
|
|
|
|
|
|||||||||||||
| Total fixed-income investments | 116.9 | 11.4 | 87.4 | 18.1 | 39 | % | ||||||||||||||
|
|
|
|
|
|
|
|
|
|||||||||||||
| Other investment—private real estate fund | 8.4 | — | — | 8.4 | 3 | % | ||||||||||||||
|
|
|
|
|
|
|
|
|
|||||||||||||
| Total Assets | $ | 297.1 | $ | 11.4 | $ | 259.2 | $ | 26.5 | 100 | % | ||||||||||
|
|
|
|
|
|
|
|
|
|||||||||||||
| (a) | Investments are measured using the net asset value per share (or its equivalent) practical expedient and have not been categorized in the fair value hierarchy. The fair value amounts presented in the table are intended to permit a reconciliation of the fair value hierarchy to the value of the total plan assets. |
Cash and cash equivalents are primarily comprised of investment in money market mutual funds. In determining fair value, Level 1 investments are valued based on quoted market prices in active markets. Investments in common/collective trust funds are valued
| 98 | MOODY’S 2017 10-K |
Table of Contents
using the net asset value (NAV) per unit in each fund. The NAV is based on the value of the underlying investments owned by each trust, minus its liabilities, and then divided by the number of shares outstanding. Common/collective trust funds are categorized in Level 2 to the extent that they are considered to have a readily determinable fair value. Investments for which fair value is estimated by using the NAV per share (or its equivalent) as a practical expedient are not categorized in the fair value hierarchy.
Except for the Company’s U.S. funded pension plan, all of Moody’s Retirement Plans are unfunded and therefore have no plan assets.
Cash Flows
The Company contributed $25.9 million and $22.4 million to its U.S. funded pension plan during the years ended December 31, 2017 and 2016, respectively. The Company made payments of $5.1 million and $4.0 million related to its U.S. unfunded pension plan obligations during the years ended December 31, 2017 and 2016, respectively. The Company made payments of $1.0 million and $0.5 million to its Other Retirement Plans during the years ended December 31, 2017 and 2016, respectively. The Company is currently evaluating whether to make a contribution to its funded pension plan in 2018, and anticipates making payments of $4.9 million related to its unfunded U.S. pension plans and $1.0 million related to its Other Retirement Plans during the year ended December 31, 2018.
Estimated Future Benefits Payable
Estimated future benefits payments for the Retirement Plans are as follows as of year ended December 31, 2017:
| Year Ending December 31, |
Pension Plans | Other Retirement Plans |
||||||
| 2018 | $ | 12.2 | $ | 1.0 | ||||
| 2019 | 13.0 | 1.1 | ||||||
| 2020 | 41.4 | 1.2 | ||||||
| 2021 | 17.8 | 1.3 | ||||||
| 2022 | 19.5 | 1.4 | ||||||
| 2023 – 2027 | $ | 135.7 | $ | 10.2 | ||||
Defined Contribution Plans
Moody’s has a Profit Participation Plan covering substantially all U.S. employees. The Profit Participation Plan provides for an employee salary deferral and the Company matches employee contributions, equal to 50% of employee contribution up to a maximum of 3% of the employee’s pay. Moody’s also makes additional contributions to the Profit Participation Plan based on year-to-year growth in the Company’s EPS. Effective January 1, 2008, all new hires are automatically enrolled in the Profit Participation Plan when they meet eligibility requirements unless they decline participation. As the Company’s U.S. DBPPs are closed to new entrants effective January 1, 2008, all eligible new hires will instead receive a retirement contribution into the Profit Participation Plan in value similar to the pension benefits. Additionally, effective January 1, 2008, the Company implemented a deferred compensation plan in the U.S., which is unfunded and provides for employee deferral of compensation and Company matching contributions related to compensation in excess of the IRS limitations on benefits and contributions under qualified retirement plans. Total expenses associated with U.S. defined contribution plans were $43.3 million, $28.3 million and $21.1 million in 2017, 2016, and 2015, respectively. The full year 2017 expense includes an accrued profit sharing contribution.
Effective January 1, 2008, Moody’s has designated the Moody’s Stock Fund, an investment option under the Profit Participation Plan, as an Employee Stock Ownership Plan and, as a result, participants in the Moody’s Stock Fund may receive dividends in cash or may reinvest such dividends into the Moody’s Stock Fund. Moody’s paid approximately $0.7 million during each of the years ended December 31, 2017, 2016 and 2015, respectively, for the Company’s common shares held by the Moody’s Stock Fund. The Company records the dividends as a reduction of retained earnings in the Consolidated Statements of Shareholders’ Equity (Deficit). The Moody’s Stock Fund held approximately 457,000 and 471,000 shares of Moody’s common stock at December 31, 2017 and 2016, respectively.
International Plans
Certain of the Company’s international operations provide pension benefits to their employees. The non-U.S. defined benefit pension plans are immaterial. For defined contribution plans, company contributions are primarily determined as a percentage of employees’ eligible compensation. Moody’s also makes contributions to non-U.S. employees under a profit sharing plan which is based on year-to-year growth in the Company’s diluted EPS. Expenses related to these defined contribution plans for the years ended December 31, 2017, 2016 and 2015 were $23.9 million, $24.5 million and $26.7 million, respectively.
| NOTE 14 | STOCK-BASED COMPENSATION PLANS |
Under the 1998 Plan, 33.0 million shares of the Company’s common stock have been reserved for issuance. The 2001 Plan, which is shareholder approved, permits the granting of up to 50.6 million shares, of which not more than 14.0 million shares are available for grants of awards other than stock options. The Stock Plans also provide for the granting of restricted stock. The Stock Plans provide that options are exercisable not later than ten years from the grant date. The vesting period for awards under the Stock Plans is generally
| MOODY’S 2017 10-K | 99 |
Table of Contents
determined by the Board at the date of the grant and has been four years except for employees who are at or near retirement eligibility, as defined, for which vesting is between one and four years. Additionally, the vesting period is three years for certain performance-based restricted stock that contain a condition whereby the number of shares that ultimately vest are based on the achievement of certain non-market based performance metrics of the Company. Options may not be granted at less than the fair market value of the Company’s common stock at the date of grant.
The Company maintains the Directors’ Plan for its Board, which permits the granting of awards in the form of non-qualified stock options, restricted stock or performance shares. The Directors’ Plan provides that options are exercisable not later than ten years from the grant date. The vesting period is determined by the Board at the date of the grant and is generally one year for both options and restricted stock. Under the Directors’ Plan, 1.7 million shares of common stock were reserved for issuance. Any director of the Company who is not an employee of the Company or any of its subsidiaries as of the date that an award is granted is eligible to participate in the Directors’ Plan.
Presented below is a summary of the stock-based compensation expense and associated tax benefit in the accompanying Consolidated Statements of Operations:
| Year Ended December 31, | ||||||||||||
| 2017 | 2016 | 2015 | ||||||||||
| Stock-based compensation expense | $ | 122.9 | $ | 98.1 | $ | 87.2 | ||||||
| Tax benefit | $ | 13.3 | * | $ | 31.9 | $ | 28.6 | |||||
| * | Amount includes a decrease in deferred tax assets resulting from a future reduction in the U.S. federal corporate income tax rate in accordance with the Tax Act, more fully described in Note 15. |
The fair value of each employee stock option award is estimated on the date of grant using the Black-Scholes option-pricing model that uses the assumptions noted below. The expected dividend yield is derived from the annual dividend rate on the date of grant. The expected stock volatility is based on an assessment of historical weekly stock prices of the Company as well as implied volatility from Moody’s traded options. The risk-free interest rate is based on U.S. government zero coupon bonds with maturities similar to the expected holding period. The expected holding period was determined by examining historical and projected post-vesting exercise behavior activity.
The following weighted average assumptions were used for options granted:
| Year Ended December 31, | ||||||||||||
| 2017 | 2016 | 2015 | ||||||||||
| Expected dividend yield | 1.34 | % | 1.83 | % | 1.39 | % | ||||||
| Expected stock volatility | 27 | % | 32 | % | 39 | % | ||||||
| Risk-free interest rate | 2.19 | % | 1.60 | % | 1.88 | % | ||||||
| Expected holding period | 6.5 years | 6.8 years | 6.9 years | |||||||||
| Grant date fair value | $ | 30.00 | $ | 22.98 | $ | 36.08 | ||||||
A summary of option activity as of December 31, 2017 and changes during the year then ended is presented below:
| Options |
Shares | Weighted Average Exercise Price Per Share |
Weighted Average Remaining Contractual Term |
Aggregate Intrinsic Value |
||||||||||||
| Outstanding, December 31, 2016 | 3.9 | $ | 49.68 | |||||||||||||
| Granted | 0.2 | $ | 113.80 | |||||||||||||
| Exercised | (1.2 | ) | $ | 42.52 | ||||||||||||
|
|
|
|||||||||||||||
| Outstanding, December 31, 2017 | 2.9 | $ | 57.48 | 4.7 years | $ | 261.6 | ||||||||||
|
|
|
|||||||||||||||
| Vested and expected to vest, December 31, 2017 | 2.8 | $ | 56.50 | 4.6 years | $ | 257.7 | ||||||||||
|
|
|
|||||||||||||||
| Exercisable, December 31, 2017 | 2.1 | $ | 43.30 | 3.4 years | $ | 216.8 | ||||||||||
|
|
|
|||||||||||||||
The aggregate intrinsic value in the table above represents the total pre-tax intrinsic value (the difference between Moody’s closing stock price on the last trading day of the year ended December 31, 2017 and the exercise prices, multiplied by the number of in-the-money options) that would have been received by the option holders had all option holders exercised their options as of December 31, 2017. This amount varies based on the fair value of Moody’s stock. As of December 31, 2017 there was $6.6 million of total unrecognized compensation expense related to options. The expense is expected to be recognized over a weighted average period of 1.4 years.
| 100 | MOODY’S 2017 10-K |
Table of Contents
The following table summarizes information relating to stock option exercises:
| Year Ended December 31, | ||||||||||||
| 2017 | 2016 | 2015 | ||||||||||
| Proceeds from stock option exercises | $ | 48.8 | $ | 71.8 | $ | 83.9 | ||||||
| Aggregate intrinsic value | $ | 88.3 | $ | 71.3 | $ | 72.9 | ||||||
| Tax benefit realized upon exercise | $ | 31.2 | $ | 24.3 | $ | 26.0 | ||||||
A summary of the status of the Company’s nonvested restricted stock as of December 31, 2017 and changes during the year then ended is presented below:
| Nonvested Restricted Stock |
Shares | Weighted Average Grant Date Fair Value Per Share |
||||||
| Balance, December 31, 2016 | 2.4 | $ | 81.17 | |||||
| Granted |
1.0 | $ | 113.48 | |||||
| Vested |
(1.0 | ) | $ | 75.06 | ||||
| Forfeited |
(0.1 | ) | $ | 97.06 | ||||
|
|
|
|||||||
| Balance, December 31, 2017 | 2.3 | $ | 97.17 | |||||
|
|
|
|||||||
As of December 31, 2017, there was $126.6 million of total unrecognized compensation expense related to nonvested restricted stock. The expense is expected to be recognized over a weighted average period of 1.6 years.
The following table summarizes information relating to the vesting of restricted stock awards:
| Year Ended December 31, | ||||||||||||
| 2017 | 2016 | 2015 | ||||||||||
| Fair value of shares vested | $ | 110.5 | $ | 92.9 | $ | 111.9 | ||||||
| Tax benefit realized upon vesting | $ | 34.9 | $ | 29.4 | $ | 38.1 | ||||||
A summary of the status of the Company’s performance-based restricted stock as of December 31, 2017 and changes during the year then ended is presented below:
| Performance-based restricted stock |
Shares | Weighted Average Grant Date Fair Value Per Share |
||||||
| Balance, December 31, 2016 | 0.5 | $ | 80.70 | |||||
| Granted |
0.2 | $ | 109.36 | |||||
| Vested |
(0.2 | ) | $ | 76.36 | ||||
| Adjustment to shares expected to vest* |
0.2 | $ | 98.88 | |||||
|
|
|
|||||||
| Balance, December 31, 2017 | 0.7 | $ | 94.30 | |||||
|
|
|
|||||||
| * | Reflects an adjustment to shares expected to vest based on the Company’s projected achievement of certain non-market based performance metrics as of December 31, 2017. |
The following table summarizes information relating to the vesting of the Company’s performance-based restricted stock awards:
| Year Ended December 31, | ||||||||||||
| 2017 | 2016 | 2015 | ||||||||||
| Fair value of shares vested | $ | 19.5 | $ | 23.6 | $ | 43.1 | ||||||
| Tax benefit realized upon vesting | $ | 6.9 | $ | 8.4 | $ | 15.6 | ||||||
As of December 31, 2017, there was $31.0 million of total unrecognized compensation expense related to this plan. The expense is expected to be recognized over a weighted average period of 1.0 years.
The Company has a policy of issuing treasury stock to satisfy shares issued under stock-based compensation plans.
In addition, the Company also sponsors the ESPP. Under the ESPP, 6.0 million shares of common stock were reserved for issuance. The ESPP allows eligible employees to purchase common stock of the Company on a monthly basis at a discount to the average of the high and the low trading prices on the New York Stock Exchange on the last trading day of each month. This discount was 5% in 2017, 2016 and 2015 resulting in the ESPP qualifying for non-compensatory status under Topic 718 of the ASC. Accordingly, no compensation
| MOODY’S 2017 10-K | 101 |
Table of Contents
expense was recognized for the ESPP in 2017, 2016, and 2015. The employee purchases are funded through after-tax payroll deductions, which plan participants can elect from one percent to ten percent of compensation, subject to the annual federal limit.
| NOTE 15 | INCOME TAXES |
Components of the Company’s provision for income taxes are as follows:
| Year Ended December 31, | ||||||||||||
| 2017 | 2016 | 2015 | ||||||||||
| Current: | ||||||||||||
| Federal |
$ | 453.8 | $ | 292.9 | $ | 278.2 | ||||||
| State and Local |
30.0 | 39.5 | 40.1 | |||||||||
| Non-U.S. |
207.0 | 102.9 | 93.6 | |||||||||
|
|
|
|
|
|
|
|||||||
| Total current |
690.8 | 435.3 | 411.9 | |||||||||
|
|
|
|
|
|
|
|||||||
| Deferred: | ||||||||||||
| Federal |
155.5 | (125.8 | ) | 14.7 | ||||||||
| State and Local |
17.5 | (20.3 | ) | 7.6 | ||||||||
| Non-U.S. |
(84.7 | ) | (7.0 | ) | (4.2 | ) | ||||||
|
|
|
|
|
|
|
|||||||
| Total deferred |
88.3 | (153.1 | ) | 18.1 | ||||||||
|
|
|
|
|
|
|
|||||||
| Total provision for income taxes | $ | 779.1 | $ | 282.2 | $ | 430.0 | ||||||
|
|
|
|
|
|
|
|||||||
A reconciliation of the U.S. federal statutory tax rate to the Company’s effective tax rate on income before provision for income taxes is as follows:
| Year Ended December 31, | ||||||||||||
| 2017 | 2016 | 2015 | ||||||||||
| U.S. statutory tax rate | 35.0 | % | 35.0 | % | 35.0 | % | ||||||
| State and local taxes, net of federal tax benefit | 1.9 | 2.2 | 3.0 | |||||||||
| Benefit of foreign operations | (9.9 | ) | (13.3 | ) | (5.8 | ) | ||||||
| Settlement charge | — | 27.4 | — | |||||||||
| Legacy tax items | — | (0.1 | ) | (0.2 | ) | |||||||
| U.S. Tax Act Impact | 17.0 | — | — | |||||||||
| Other | (0.4 | ) | (0.6 | ) | (0.8 | ) | ||||||
|
|
|
|
|
|
|
|||||||
| Effective tax rate | 43.6 | % | 50.6 | % | 31.2 | % | ||||||
|
|
|
|
|
|
|
|||||||
| Income tax paid | $ | 366.4 | $ | 355.7 | $ | 397.4 | ||||||
|
|
|
|
|
|
|
|||||||
The source of income before provision for income taxes is as follows:
| Year Ended December 31, | ||||||||||||
| 2017 | 2016 | 2015 | ||||||||||
| United States | $ | 1,098.5 | $ | 37.2 | $ | 913.9 | ||||||
| International | 688.3 | 520.8 | 465.7 | |||||||||
|
|
|
|
|
|
|
|||||||
| Income before provision for income taxes | $ | 1,786.8 | $ | 558.0 | $ | 1,379.6 | ||||||
|
|
|
|
|
|
|
|||||||
| 102 | MOODY’S 2017 10-K |
Table of Contents
The components of deferred tax assets and liabilities are as follows:
| December 31, | ||||||||
| 2017 | 2016 | |||||||
| Deferred tax assets: | ||||||||
| Account receivable allowances |
$ | 6.0 | $ | 6.0 | ||||
| Accumulated depreciation and amortization |
1.2 | 1.3 | ||||||
| Stock-based compensation |
39.6 | 54.4 | ||||||
| Accrued compensation and benefits |
79.2 | 119.3 | ||||||
| Deferred rent and construction allowance |
21.2 | 30.1 | ||||||
| Deferred revenue |
41.9 | 46.2 | ||||||
| Foreign net operating loss (1) |
13.3 | 3.7 | ||||||
| Settlement Charge |
— | 163.2 | ||||||
| Legal and professional fees |
1.2 | 4.2 | ||||||
| Restructuring |
0.2 | 2.2 | ||||||
| Uncertain tax positions |
28.6 | 37.3 | ||||||
| Self-insured related reserves |
7.5 | 15.1 | ||||||
| Capitalized cost |
4.3 | — | ||||||
| Other |
19.0 | 4.5 | ||||||
|
|
|
|
|
|||||
| Total deferred tax assets | $ | 263.2 | $ | 487.5 | ||||
|
|
|
|
|
|||||
| Deferred tax liabilities: | ||||||||
| Accumulated depreciation and amortization of intangible assets and capitalized software |
$ | (408.8 | ) | $ | (189.8 | ) | ||
| Foreign earnings to be repatriated |
— | (7.5 | ) | |||||
| Capital gains |
(25.6 | ) | (24.1 | ) | ||||
| Self-insured related income |
(7.5 | ) | (15.1 | ) | ||||
| Stock based compensation |
(3.3 | ) | (2.9 | ) | ||||
| Unrealized gain on net investment hedges - OCI |
— | (21.0 | ) | |||||
| Other liabilities |
(3.0 | ) | (12.1 | ) | ||||
|
|
|
|
|
|||||
| Total deferred tax liabilities | (448.2 | ) | (272.5 | ) | ||||
|
|
|
|
|
|||||
| Net deferred tax (liabilities) asset | (185.0 | ) | 215.0 | |||||
| Valuation allowance | (12.8 | ) | (3.2 | ) | ||||
|
|
|
|
|
|||||
| Total net deferred tax (liabilities) assets | $ | (197.8 | ) | $ | 211.8 | |||
|
|
|
|
|
|||||
| (1) | Amounts are primarily set to expire beginning in 2018, if unused. |
On December 22, 2017, the Tax Cut and Jobs Act was signed into law which resulted in significant changes to U.S. corporate tax laws. The Tax Act includes a mandatory one-time deemed repatriation tax (“transition tax”) on previously untaxed accumulated earnings of foreign subsidiaries and beginning in 2018 reduces the statutory federal corporate income tax rate from 35% to 21%. Due to the complexities of the Tax Act, the SEC issued guidance requiring that companies provide a reasonable estimate of the impact of the Tax Act to the extent such reasonable estimate has been determined. Accordingly, the Company recorded a provisional estimate for the transition tax of $247.3 million, a portion of which will be payable over eight years, starting in 2018, and will not accrue interest. Additionally, the Company recorded a provisional estimate decreasing net deferred tax assets by $56.2 million resulting from the future reduction in the federal corporate income tax rate. Separately, a statutory tax rate reduction in Belgium resulted in a $57.9 million decrease of deferred tax liabilities pertaining to Bureau van Dijk’s acquired intangible assets.
The above provisional estimates may be impacted by a number of additional considerations, including but not limited to the issuance of regulations and our ongoing analysis of the new law.
As a result of the Tax Act, all previously undistributed foreign earnings have now been subject to U.S. tax. However, the Company intends to continue to indefinitely reinvest these earnings outside the U.S. and accordingly the Company has not provided non-U.S. deferred income taxes on these indefinitely reinvested earnings. It is not practicable to determine the amount of non-U.S. deferred taxes that might be required to be provided if such earnings were distributed in the future, due to complexities in the tax laws and in the hypothetical calculations that would have to be made.
On March 30, 2016, the FASB issued Accounting Standards Update (ASU) 2016-09, Improvements to Employee Share Based Payment Accounting as more fully discussed in Note 1 to the condensed consolidated financial statements. The new guidance requires all tax effects related to share based payments to be recorded through the income statement. The Company has adopted the new guidance as
| MOODY’S 2017 10-K | 103 |
Table of Contents
of the first quarter of 2017 and the adoption resulted in a reduction in its income tax provision of approximately $40 million, or 220BPS, for the full year of 2017.
In the first quarter of 2017, the Company adopted Accounting Standards Update 2016-16, “Accounting for Income Taxes: Intra-Entity Asset Transfers of Assets Other than Inventory.” Under previous guidance, the tax effects of intra-entity asset transfers (intercompany sales) were deferred until the transferred asset was sold to a third party or otherwise recovered through use. The new guidance eliminates the exception for all intra-entity sales of assets other than inventory. Upon adoption, a cumulative-effect adjustment is recorded in retained earnings as of the beginning of the period of adoption. The net impact upon adoption is a reduction to retained earnings of $4.6 million. The Company does not expect any material impact on its future operations as a result of the adoption of this guidance.
The Company had valuation allowances of $12.8 million and $3.2 million at December 31, 2017 and 2016, respectively, related to foreign net operating losses for which realization is uncertain.
As of December 31, 2017 the Company had $389.1 million of UTPs of which $353.0 million represents the amount that, if recognized, would impact the effective tax rate in future periods. The increase in UTPs results primarily from the acquisition of Bureau van Dijk.
A reconciliation of the beginning and ending amount of UTPs is as follows:
| Year Ended December 31, | ||||||||||||
| 2017 | 2016 | 2015 | ||||||||||
| Balance as of January 1 | $ | 199.8 | $ | 203.4 | $ | 220.3 | ||||||
| Additions for tax positions related to the current year | 86.3 | 21.9 | 24.1 | |||||||||
| Additions for tax positions of prior years | 120.2 | 12.4 | 14.0 | |||||||||
| Reductions for tax positions of prior years | (4.1 | ) | (27.6 | ) | (41.6 | ) | ||||||
| Settlements with taxing authorities | (2.2 | ) | (8.3 | ) | (7.8 | ) | ||||||
| Lapse of statute of limitations | (10.9 | ) | (2.0 | ) | (5.6 | ) | ||||||
|
|
|
|
|
|
|
|||||||
| Balance as of December 31 | $ | 389.1 | $ | 199.8 | $ | 203.4 | ||||||
|
|
|
|
|
|
|
|||||||
The Company classifies interest related to UTPs in interest expense in its consolidated statements of operations. Penalties, if incurred, would be recognized in other non-operating expenses. During the years ended December 31, 2017 and 2016, the Company incurred a net interest expense of $15.3 million and $7.8 million respectively, related to UTPs. An additional $5.6 million of accrued interest was recorded in connection with the Company’s acquisition of Bureau van Dijk. As of December 31, 2017 and 2016, the amount of accrued interest recorded in the Company’s consolidated balance sheets related to UTPs was $54.7 million and $34.1 million, respectively.
Moody’s Corporation and subsidiaries are subject to U.S. federal income tax as well as income tax in various state, local and foreign jurisdictions. The Company’s U.S. federal income tax returns for the years 2011 and 2012 are under examination and its 2013 to 2016 returns remain open to examination. The Company’s New York State income tax returns for 2011 to 2016 are under examination. The Company’s New York City tax return for 2014 is under examination and 2015 to 2016 remain open to examination. The Company’s U.K. tax return for 2012 is under examination. Tax filings in the U.K. remain open to examination for 2013 through 2016.
For current ongoing audits related to open tax years, the Company estimates that it is possible that the balance of UTPs could decrease in the next twelve months as a result of the effective settlement of these audits, which might involve the payment of additional taxes, the adjustment of certain deferred taxes and/or the recognition of tax benefits. It is also possible that new issues might be raised by tax authorities which might necessitate increases to the balance of UTPs. As the Company is unable to predict the timing of conclusion of these audits, the Company is unable to estimate the amount of changes to the balance of UTPs at this time.
| 104 | MOODY’S 2017 10-K |
Table of Contents
| NOTE 16 | INDEBTEDNESS |
The following table summarizes total indebtedness:
| December 31, 2017 | ||||||||||||||||||||
| Principal Amount |
Fair Value of Interest Rate Swaps (1) |
Unamortized (Discount) Premium |
Unamortized Debt Issuance Costs |
Carrying Value |
||||||||||||||||
| Notes Payable: | ||||||||||||||||||||
| 5.50% 2010 Senior Notes, due 2020 |
$ | 500.0 | $ | — | $ | (1.0 | ) | $ | (1.2 | ) | $ | 497.8 | ||||||||
| 4.50% 2012 Senior Notes, due 2022 |
500.0 | (0.8 | ) | (2.0 | ) | (1.7 | ) | 495.5 | ||||||||||||
| 4.875% 2013 Senior Notes, due 2024 |
500.0 | — | (1.8 | ) | (2.4 | ) | 495.8 | |||||||||||||
| 2.75% 2014 Senior Notes (5-Year), due 2019 |
450.0 | (2.2 | ) | (0.2 | ) | (1.1 | ) | 446.5 | ||||||||||||
| 5.25% 2014 Senior Notes (30-Year), due 2044 |
600.0 | — | 3.3 | (5.7 | ) | 597.6 | ||||||||||||||
| 1.75% 2015 Senior Notes, due 2027 |
600.4 | — | — | (3.6 | ) | 596.8 | ||||||||||||||
| 2.75% 2017 Senior Notes, due 2021 |
500.0 | — | (1.3 | ) | (3.2 | ) | 495.5 | |||||||||||||
| 2017 Floating Rate Senior Notes, due 2018 |
300.0 | — | — | (0.5 | ) | 299.5 | ||||||||||||||
| 2.625% 2017 Private Placement Notes, due 2023 |
500.0 | — | (1.1 | ) | (3.5 | ) | 495.4 | |||||||||||||
| 3.25% 2017 Private Placement Notes, due 2028 |
500.0 | — | (5.2 | ) | (3.9 | ) | 490.9 | |||||||||||||
| 2017 Term Loan Facility, due 2020 |
500.0 | — | — | (0.7 | ) | 499.3 | ||||||||||||||
| Commercial Paper |
130.0 | — | (0.1 | ) | — | 129.9 | ||||||||||||||
|
|
|
|
|
|
|
|
|
|
|
|||||||||||
| Total debt | $ | 5,580.4 | $ | (3.0 | ) | $ | (9.4 | ) | $ | (27.5 | ) | $ | 5,540.5 | |||||||
|
|
|
|
|
|
|
|
|
|
|
|||||||||||
| Current portion | (429.4 | ) | ||||||||||||||||||
|
|
|
|||||||||||||||||||
| Total long-term debt | $ | 5,111.1 | ||||||||||||||||||
|
|
|
|||||||||||||||||||
| December 31, 2016 | ||||||||||||||||||||
| Principal Amount |
Fair Value of Interest Rate Swaps (1) |
Unamortized (Discount) Premium |
Unamortized Debt Issuance Costs |
Carrying Value |
||||||||||||||||
| Notes Payable: | ||||||||||||||||||||
| 6.06% Series 2007-1 Notes due 2017 |
$ | 300.0 | $ | — | $ | — | $ | — | $ | 300.0 | ||||||||||
| 5.50% 2010 Senior Notes, due 2020 |
500.0 | 5.5 | (1.3 | ) | (1.6 | ) | 502.6 | |||||||||||||
| 4.50% 2012 Senior Notes, due 2022 |
500.0 | (0.2 | ) | (2.4 | ) | (2.1 | ) | 495.3 | ||||||||||||
| 4.875% 2013 Senior Notes, due 2024 |
500.0 | — | (2.1 | ) | (2.7 | ) | 495.2 | |||||||||||||
| 2.75% 2014 Senior Notes (5-Year), due 2019 |
450.0 | 0.9 | (0.4 | ) | (1.7 | ) | 448.8 | |||||||||||||
| 5.25% 2014 Senior Notes (30-Year), due 2044 |
600.0 | — | 3.3 | (5.9 | ) | 597.4 | ||||||||||||||
| 1.75% 2015 Senior Notes, due 2027 |
527.4 | — | — | (3.7 | ) | 523.7 | ||||||||||||||
|
|
|
|
|
|
|
|
|
|
|
|||||||||||
| Total long-term debt | $ | 3,377.4 | $ | 6.2 | $ | (2.9 | ) | $ | (17.7 | ) | $ | 3,363.0 | ||||||||
|
|
|
|
|
|
|
|
|
|
|
|||||||||||
| Current portion | (300.0 | ) | ||||||||||||||||||
|
|
|
|||||||||||||||||||
| Total long-term debt | $ | 3,063.0 | ||||||||||||||||||
|
|
|
|||||||||||||||||||
| (1) | The Company has entered into interest rate swaps on the 2010 Senior Notes, the 2012 Senior Notes and the 2014 Senior Notes (5-Year) which are more fully discussed in Note 5 above. |
Term Loan Facility
On June 6, 2017, the Company entered into a three-year term loan facility with the capacity to borrow up to $500.0 million. On August 8, 2017, the Company borrowed $500 million under the 2017 Term Loan for which the proceeds were used to fund the acquisition of Bureau van Dijk and to pay acquisition-related fees and expenses. At the Company’s election, interest on borrowings under the 2017 Term Loan is payable at rates that are based on either (a) Alternate Base Rate (as defined in the 2017 Term Loan Facility agreement) plus an applicable rate (ranging from 0 BPS to 50 BPS per annum) or (b) the Adjusted LIBO Rate (as defined in the 2017 Term Loan Facility agreement) plus an applicable rate (ranging from 87.5 BPS to 150 BPS per annum), in each case, depending on the Company’s index debt rating, as set forth in the 2017 Term Loan agreement.
The 2017 Term Loan contains covenants that, among other things, restrict the ability of the Company to engage in mergers, consolidations, asset sales, transactions with affiliates, sale and leaseback transactions or to incur liens, with exceptions as set forth in the 2017 Term Loan Facility agreement. The 2017 Term Loan also contains a financial covenant that requires the Company to maintain a
| MOODY’S 2017 10-K | 105 |
Table of Contents
debt to EBITDA ratio of not more than: (i) 4.5 to 1.0 as of the end of each fiscal quarter ending on September 30, 2017, December 31, 2017 and March 31, 2018 and (ii) 4.0 to 1.0 as of the end of the fiscal quarter ended on June 30, 2018. The 2017 Term Loan also contains customary events of default.
Credit Facility
On May 11, 2015, the Company entered into a five-year senior, unsecured revolving credit facility with the capacity to borrow up to $1 billion. This replaced the $1 billion five-year 2012 Facility that was scheduled to expire in April 2017. On June 6, 2017, the Company entered into an amendment to the 2015 Facility. Pursuant to the amendment, the applicable rate for borrowings under the 2015 Facility will range from 0 BPS to 32.5 BPS per annum for Alternate Base Rate loans (as defined in the 2015 Facility agreement) and 79.5 BPS to 132.5 BPS per annum for Eurocurrency loans (as defined in the 2015 Facility agreement) depending on the Company’s ratio of total debt to EBITDA. In addition, the Company also pays quarterly facility fees, regardless of borrowing activity under the 2015 Facility. Pursuant to the amendment, the facility fee paid by the Company ranges from 8 BPS to 17.5 BPS on the daily amount of commitments (whether used or unused), in each case, depending on the Company’s index debt rating. The amendment also modifies, among other things, the existing financial covenant, so that, the Company’s debt to EBITDA ratio shall not exceed 4.5 to 1.0 as of the end of each fiscal quarter ending on September 30, 2017, December 31, 2017 and March 31, 2018 and shall not exceed 4.0 to 1.0 as of the end of the fiscal quarter ended on June 30, 2018 and each fiscal quarter thereafter. Upon the occurrence of certain financial or economic events, significant corporate events or certain other events of default constituting a default under the 2015 Facility, all loans outstanding under the 2015 Facility (including accrued interest and fees payable thereunder) may be declared immediately due and payable and all lending commitments under the 2015 Facility may be terminated. In addition, certain other events of default under the 2015 Facility would automatically result in amounts outstanding becoming immediately due and payable and the termination of all lending commitments.
Commercial Paper
On August 3, 2016, the Company entered into a private placement commercial paper program under which the Company may issue CP notes up to a maximum amount of $1.0 billion. Borrowings under the CP Program are backstopped by the 2015 Facility. Amounts under the CP Program may be re-borrowed. The maturity of the CP Notes will vary, but may not exceed 397 days from the date of issue. The CP Notes are sold at a discount from par, or alternatively, sold at par and bear interest at rates that will vary based upon market conditions. The rates of interest will depend on whether the CP Notes will be a fixed or floating rate. The interest on a floating rate may be based on the following: (a) certificate of deposit rate; (b) commercial paper rate; (c) the federal funds rate; (d) the LIBOR; (e) prime rate; (f) Treasury rate; or (g) such other base rate as may be specified in a supplement to the private placement agreement. The CP Program contains certain events of default including, among other things: non-payment of principal, interest or fees; entrance into any form of moratorium; and bankruptcy and insolvency events, subject in certain instances to cure periods. As of December 31, 2017, the Company has CP borrowings outstanding of $130 million with a weighted average maturity date at the time of issuance of 30 days. At December 31, 2017, the weighted average remaining maturity and interest rate on CP outstanding was 15 days and 1.76% respectively.
Notes Payable
On September 7, 2007, the Company issued and sold through a private placement transaction, $300.0 million aggregate principal amount of its 6.06% Series 2007-1 Senior Unsecured Notes due 2017 pursuant to the 2007 Agreement. The Series 2007-1 Notes had a ten-year term and bore interest at an annual rate of 6.06%, payable semi-annually on March 7 and September 7. The Company could prepay the Series 2007-1 Notes, in whole or in part, at any time at a price equal to 100% of the principal amount being prepaid, plus accrued and unpaid interest and a Make Whole Amount. In the first quarter of 2017, the Company repaid the Series 2007-1 Notes along with a Make-Whole Amount of approximately $7 million.
On August 19, 2010, the Company issued $500 million aggregate principal amount of senior unsecured notes in a public offering. The 2010 Senior Notes bear interest at a fixed rate of 5.50% and mature on September 1, 2020. Interest on the 2010 Senior Notes is due semi-annually on September 1 and March 1 of each year, commencing March 1, 2011. The Company may prepay the 2010 Senior Notes, in whole or in part, at any time at a price equal to 100% of the principal amount being prepaid, plus accrued and unpaid interest and a Make-Whole Amount. Additionally, at the option of the holders of the notes, the Company may be required to purchase all or a portion of the notes upon occurrence of a “Change of Control Triggering Event,” as defined in the 2010 Indenture, at a price equal to 101% of the principal amount thereof, plus accrued and unpaid interest to the date of purchase. The 2010 Indenture contains covenants that limit the ability of the Company and certain of its subsidiaries to, among other things, incur or create liens and enter into sale and leaseback transactions. In addition, the 2010 Indenture contains a covenant that limits the ability of the Company to consolidate or merge with another entity or to sell all or substantially all of its assets to another entity. The 2010 Indenture contains customary default provisions. In addition, an event of default will occur if the Company or certain of its subsidiaries fail to pay the principal of any indebtedness (as defined in the 2010 Indenture) when due at maturity in an aggregate amount of $50 million or more, or a
| 106 | MOODY’S 2017 10-K |
Table of Contents
default occurs that results in the acceleration of the maturity of the Company’s or certain of its subsidiaries’ indebtedness in an aggregate amount of $50 million or more. Upon the occurrence and during the continuation of an event of default under the 2010 Indenture, the notes may become immediately due and payable either automatically or by the vote of the holders of more than 25% of the aggregate principal amount of all of the notes then outstanding.
On November 4, 2011, in connection with the acquisition of Copal, a subsidiary of the Company issued a $14.2 million non-interest bearing note to the sellers which represented a portion of the consideration transferred to acquire the Copal entities. If a seller subsequently transfers to the Company all of its shares, the Company must repay the seller its proportion of the principal on the later of (i) the fourth anniversary date of the note or (ii) within a time frame set forth in the acquisition agreement relating to the resolution of certain income tax uncertainties pertaining to the transaction. The Company has the right to offset payment of the note against certain indemnification assets associated with UTPs related to the acquisition. Accordingly, the Company has offset the liability for this note against the indemnification asset, thus no balance for this note is carried on the Company’s consolidated balance sheet at December 31, 2017 and 2016. In the event that the Company would not be required to settle amounts related to the UTPs, the Company would be required to pay the sellers the principal in accordance with the note agreement. The Company may prepay the note in accordance with certain terms set forth in the acquisition agreement.
On August 20, 2012, the Company issued $500 million aggregate principal amount of unsecured notes in a public offering. The 2012 Senior Notes bear interest at a fixed rate of 4.50% and mature on September 1, 2022. Interest on the 2012 Senior Notes is due semi-annually on September 1 and March 1 of each year, commencing March 1, 2013. The Company may prepay the 2012 Senior Notes, in whole or in part, at any time at a price equal to 100% of the principal amount being prepaid, plus accrued and unpaid interest and a Make-Whole Amount. Additionally, at the option of the holders of the notes, the Company may be required to purchase all or a portion of the notes upon occurrence of a “Change of Control Triggering Event,” as defined in the 2012 Indenture, at a price equal to 101% of the principal amount thereof, plus accrued and unpaid interest to the date of purchase. The 2012 Indenture contains covenants that limit the ability of the Company and certain of its subsidiaries to, among other things, incur or create liens and enter into sale and leaseback transactions. In addition, the 2012 Indenture contains a covenant that limits the ability of the Company to consolidate or merge with another entity or to sell all or substantially all of its assets to another entity. The 2012 Indenture contains customary default provisions. In addition, an event of default will occur if the Company or certain of its subsidiaries fail to pay the principal of any indebtedness (as defined in the 2012 Indenture) when due at maturity in an aggregate amount of $50 million or more, or a default occurs that results in the acceleration of the maturity of the Company’s or certain of its subsidiaries’ indebtedness in an aggregate amount of $50 million or more. Upon the occurrence and during the continuation of an event of default under the 2012 Indenture, the 2012 Senior notes may become immediately due and payable either automatically or by the vote of the holders of more than 25% of the aggregate principal amount of all of the notes then outstanding.
On August 12, 2013, the Company issued $500 million aggregate principal amount of senior unsecured notes in a public offering. The 2013 Senior Notes bear interest at a fixed rate of 4.875% and mature on February 15, 2024. Interest on the 2013 Senior Notes is due semi-annually on February 15 and August 15 of each year, commencing February 15, 2014. The Company may prepay the 2013 Senior Notes, in whole or in part, at any time at a price equal to 100% of the principal amount being prepaid, plus accrued and unpaid interest and a Make-Whole Amount. Notwithstanding the immediately preceding sentence, the Company may redeem the 2013 Senior Notes, in whole or in part, at any time or from time to time on or after November 15, 2023 (three months prior to their maturity), at a redemption price equal to 100% of the principal amount of the notes to be redeemed, plus accrued and unpaid interest, if any, to, but excluding the redemption date. Additionally, at the option of the holders of the notes, the Company may be required to purchase all or a portion of the notes upon occurrence of a “Change of Control Triggering Event,” as defined in the 2013 Indenture, at a price equal to 101% of the principal amount thereof, plus accrued and unpaid interest to the date of purchase. The 2013 Indenture contains covenants that limit the ability of the Company and certain of its subsidiaries to, among other things, incur or create liens and enter into sale and leaseback transactions. In addition, the 2013 Indenture contains a covenant that limits the ability of the Company to consolidate or merge with another entity or to sell all or substantially all of its assets to another entity. The 2013 Indenture contains customary default provisions. In addition, an event of default will occur if the Company or certain of its subsidiaries fail to pay the principal of any indebtedness (as defined in the 2013 Indenture) when due at maturity in an aggregate amount of $50 million or more, or a default occurs that results in the acceleration of the maturity of the Company’s or certain of its subsidiaries’ indebtedness in an aggregate amount of $50 million or more. Upon the occurrence and during the continuation of an event of default under the 2013 Indenture, the 2013 Senior Notes may become immediately due and payable either automatically or by the vote of the holders of more than 25% of the aggregate principal amount of all of the notes then outstanding.
On July 16, 2014, the Company issued $300 million aggregate principal amount of senior unsecured notes in a public offering. The 2014 Senior Notes (30-year) bear interest at a fixed rate of 5.25% and mature on July 15, 2044. Interest on the 2014 Senior Notes (30-year) is due semi-annually on January 15 and July 15 of each year, commencing January 15, 2015. The Company may prepay the 2014 Senior Notes (30-year), in whole or in part, at any time at a price equal to 100% of the principal amount being prepaid, plus
| MOODY’S 2017 10-K | 107 |
Table of Contents
accrued and unpaid interest and a Make-Whole Amount. Additionally, at the option of the holders of the notes, the Company may be required to purchase all or a portion of the notes upon occurrence of a “Change of Control Triggering Event,” as defined in the 2014 Indenture, at a price equal to 101% of the principal amount thereof, plus accrued and unpaid interest to the date of purchase. The 2014 Indenture contains covenants that limit the ability of the Company and certain of its subsidiaries to, among other things, incur or create liens and enter into sale and leaseback transactions. In addition, the 2014 Indenture contains a covenant that limits the ability of the Company to consolidate or merge with another entity or to sell all or substantially all of its assets to another entity. The 2014 Indenture contains customary default provisions. In addition, an event of default will occur if the Company or certain of its subsidiaries fail to pay the principal of any indebtedness (as defined in the 2014 Indenture) when due at maturity in an aggregate amount of $50 million or more, or a default occurs that results in the acceleration of the maturity of the Company’s or certain of its subsidiaries’ indebtedness in an aggregate amount of $50 million or more. Upon the occurrence and during the continuation of an event of default under the 2014 Indenture, the 2014 Senior Notes (30-year) may become immediately due and payable either automatically or by the vote of the holders of more than 25% of the aggregate principal amount of all of the notes then outstanding. On November 13, 2015, the Company issued an additional $300 million aggregate principal amount of the 2014 Senior Notes (30-year) in a public offering. This issuance constitutes an additional issuance of, and a single series with, the $300 million 2014 Senior Notes (30-year) issued on July 16, 2014 and have the same terms as the 2014 Senior Notes (30-year).
On July 16, 2014, the Company issued $450 million aggregate principal amount of senior unsecured notes in a public offering. The 2014 Senior Notes (5-year) bear interest at a fixed rate of 2.75% and mature July 15, 2019. Interest on the 2014 Senior Notes (5-year) is due semi-annually on January 15 and July 15 of each year, commencing January 15, 2015. The Company may prepay the 2014 Senior Notes (5-year), in whole or in part, at any time at a price prior to June 15, 2019, equal to 100% of the principal amount being prepaid, plus accrued and unpaid interest and a Make-Whole Amount. Notwithstanding the immediately preceding sentence, the Company may redeem the 2014 Senior Notes (5-year), in whole or in part, at any time or from time to time on or after June 15, 2019 (one month prior to their maturity), at a redemption price equal to 100% of the principal amount of the notes to be redeemed, plus accrued and unpaid interest, if any, to, but excluding the redemption date. Additionally, at the option of the holders of the notes, the Company may be required to purchase all or a portion of the notes upon occurrence of a “Change of Control Triggering Event,” as defined in the 2014 Indenture, at a price equal to 101% of the principal amount thereof, plus accrued and unpaid interest to the date of purchase. The 2014 Indenture contains covenants that limit the ability of the Company and certain of its subsidiaries to, among other things, incur or create liens and enter into sale and leaseback transactions. In addition, the 2014 Indenture contains a covenant that limits the ability of the Company to consolidate or merge with another entity or to sell all or substantially all of its assets to another entity. The 2014 Indenture contains customary default provisions. In addition, an event of default will occur if the Company or certain of its subsidiaries fail to pay the principal of any indebtedness (as defined in the 2014 Indenture) when due at maturity in an aggregate amount of $50 million or more, or a default occurs that results in the acceleration of the maturity of the Company’s or certain of its subsidiaries’ indebtedness in an aggregate amount of $50 million or more. Upon the occurrence and during the continuation of an event of default under the 2014 Indenture, the 2014 Senior Notes (5-year) may become immediately due and payable either automatically or by the vote of the holders of more than 25% of the aggregate principal amount of all of the notes then outstanding.
On March 9, 2015, the Company issued €500 million aggregate principal amount of senior unsecured notes in a public offering. The 2015 Senior Notes bear interest at a fixed rate of 1.75% and mature on March 9, 2027. Interest on the 2015 Senior Notes is due annually on March 9 of each year, commencing March 9, 2016. The Company may prepay the 2015 Senior Notes, in whole or in part, at any time at a price equal to 100% of the principal amount being prepaid, plus accrued and unpaid interest and a Make-Whole Amount. Additionally, at the option of the holders of the notes, the Company may be required to purchase all or a portion of the notes upon occurrence of a “Change of Control Triggering Event,” as defined in the 2015 Indenture, at a price equal to 101% of the principal amount thereof, plus accrued and unpaid interest to the date of purchase. The 2015 Indenture contains covenants that limit the ability of the Company and certain of its subsidiaries to, among other things, incur or create liens and enter into sale and leaseback transactions. In addition, the 2015 Indenture contains a covenant that limits the ability of the Company to consolidate or merge with another entity or to sell all or substantially all of its assets to another entity. The 2015 Indenture contains customary default provisions. In addition, an event of default will occur if the Company or certain of its subsidiaries fail to pay the principal of any indebtedness (as defined in the 2015 Indenture) when due at maturity in an aggregate amount of $50 million or more, or a default occurs that results in the acceleration of the maturity of the Company’s or certain of its subsidiaries’ indebtedness in an aggregate amount of $50 million or more. Upon the occurrence and during the continuation of an event of default under the 2015 Indenture, the 2015 Senior Notes may become immediately due and payable either automatically or by the vote of the holders of more than 25% of the aggregate principal amount of all of the notes then outstanding. The Company has designated the entire balance of the 2015 Senior Notes as a net investment hedge as more fully discussed in Note 5.
On March 2, 2017, the Company issued $500 million aggregate principal amount of senior unsecured notes in a public offering. The 2017 Senior Notes bear interest at a fixed rate of 2.750% and mature on December 15, 2021. Interest on the 2017 Senior Notes is due semiannually on June 15 and December 15 of each year, commencing June 15, 2017. The Company may redeem the 2017 Senior
| 108 | MOODY’S 2017 10-K |
Table of Contents
Notes, in whole or in part, at any time at a price equity to 100% of the principal amount being redeemed, plus accrued and unpaid interest and a Make-Whole Amount.
On March 2, 2017, the Company issued $300 million aggregate principal amount of senior unsecured floating rate notes in a public offering. The 2017 Floating Rate Senior Notes bear interest at a floating rate which is to be calculated by Wells Fargo Bank, National Association, equal to three-month LIBOR as determined on the interest determination date plus 0.35%. The interest determination date for an interest period is the second London business day preceding the first day of such interest period. The 2017 Floating Rate Senior Notes mature on September 4, 2018. Interest on the 2017 Floating Rate Senior Notes will accrue from March 2, 2017, and will be paid quarterly in arrears on June 4, 2017, September 4, 2017, December 4, 2017, March 4, 2018, June 4, 2018 and on the maturity date, to the record holders at the close of business on the business date preceding the interest payment date. The 2017 Floating Rate Senior Notes are not redeemable prior to their maturity.
On June 12, 2017, the Company issued and sold through a private placement transaction, $500 million aggregate principal amount of its 2017 Private Placement Notes Due 2023 and $500 million aggregate principal amount of its 2017 Private Placement Notes Due 2028. The 2017 Private Placement Notes Due 2023 bear interest at the fixed rate of 2.625% per year and mature on January 15, 2023. The 2017 Private Placement Notes Due 2028 bear interest at the fixed rate of 3.250% per year and mature on January 15, 2028. Interest on each tranche of notes will be due semiannually on January 15 and July 15 of each year, commencing January 15, 2018. The Company entered into a registration rights agreement, dated as of June 12, 2017, with the representatives of the initial purchasers of the notes, which sets forth, among other things, the Company’s obligations to register the notes under the Securities Act, within 365 days of issuance. The net proceeds of the note offering were used to finance, in part, the acquisition of Bureau van Dijk. In addition, the Company may redeem each of the notes in whole or in part, at any time at a price equity to 100% of the principal amount being redeemed, plus accrued interest and a Make-Whole Amount.
For the 2017 Floating Rate Notes, 2017 Senior Notes, 2017 Private Placement Notes Due 2023 and 2017 Private Placement Notes Due 2028, at the option of the holders of the notes, the Company may be required to purchase all or a portion of the notes upon occurrence of a “Change of Control Triggering Event,” as defined in the 2017 Indenture, at a price equal to 101% of the principal amount, thereof, plus accrued and unpaid interest to the date of purchase. The 2017 Indenture contains covenants that limit the ability of the Company and certain of its subsidiaries to, among other things, incur or create liens and enter into sale and leaseback transactions. In addition, the 2017 Indenture contains a covenant that limits the ability of the Company to consolidate or merge with another entity or to sell all or substantially all of its assets to another entity. The 2017 Indenture also contains customary default provisions. In addition, an event of default will occur if the Company or certain of its subsidiaries fail to pay the principal of any indebtedness (as defined in the 2017 Indenture) when due at maturity in an aggregate amount of $50 million or more, or a default occurs that results in the acceleration of the maturity of the Company’s or certain of its subsidiaries’ indebtedness in an aggregate amount of $50 million or more. Upon the occurrence and during the continuation of an event of default under the 2017 Indenture, all the aforementioned notes may become immediately due and payable either automatically or by the vote of the holders of more than 25% of the aggregate principal amount of all of the notes of the applicable series then outstanding.
2017 Bridge Credit Facility
On May 15, 2017, the Company entered into a 364-Day Bridge Credit Agreement providing for a $1.5 billion bridge facility. On June 12, 2017, the commitments under this facility were terminated upon the issuance of the 2017 Private Placement Notes Due 2023, the 2017 Private Placement Notes Due 2028 and the 2017 Term Loan Facility.
At December 31, 2017, the Company was in compliance with all covenants contained within all of the debt agreements. All the debt agreements contain cross default provisions which state that default under one of the aforementioned debt instruments could in turn permit lenders under other debt instruments to declare borrowings outstanding under those instruments to be immediately due and payable. As of December 31, 2017, there were no such cross defaults.
| MOODY’S 2017 10-K | 109 |
Table of Contents
The repayment schedule for the Company’s borrowings is as follows:
| Year Ending December 31, |
2010 Senior Notes due 2020 |
2012 Senior Notes due 2022 |
2013 Senior Notes due 2024 |
2014 Senior Notes (5-year) due 2019 |
2014 Senior Notes (30-year) due 2044 |
2015 Senior Notes due 2027 |
Term Loan Facility due 2020 |
2017 Floating Rate Senior Notes due 2018 |
2017 Senior Notes due 2021 |
2017 Private Placement Notes due 2023 |
2017 Private Placement Notes due 2028 |
Commercial Paper |
Total | |||||||||||||||||||||||||||||||||||||||
| 2018 | $ | — | $ | — | $ | — | $ | — | $ | — | $ | — | $ | — | $ | 300.0 | $ | — | $ | — | $ | — | $ | 130.0 | $ | 430.0 | ||||||||||||||||||||||||||
| 2019 | — | — | — | 450.0 | — | — | — | — | — | — | — | 450.0 | ||||||||||||||||||||||||||||||||||||||||
| 2020 | 500.0 | — | — | — | — | — | 500.0 | — | — | — | — | — | 1,000.0 | |||||||||||||||||||||||||||||||||||||||
| 2021 | — | — | — | — | — | — | — | — | 500.0 | — | — | — | 500.0 | |||||||||||||||||||||||||||||||||||||||
| 2022 | — | 500.0 | — | — | — | — | — | — | — | — | — | — | 500.0 | |||||||||||||||||||||||||||||||||||||||
| Thereafter | — | — | 500.0 | — | 600.0 | 600.4 | — | — | — | 500.0 | 500.0 | — | 2,700.4 | |||||||||||||||||||||||||||||||||||||||
|
|
|
|
|
|
|
|
|
|
|
|
|
|
|
|
|
|
|
|
|
|
|
|
|
|
|
|||||||||||||||||||||||||||
| Total | $ | 500.0 | $ | 500.0 | $ | 500.0 | $ | 450.0 | $ | 600.0 | $ | 600.4 | $ | 500.0 | $ | 300.0 | $ | 500.0 | $ | 500.0 | $ | 500.0 | $ | 130.0 | $ | 5,580.4 | ||||||||||||||||||||||||||
|
|
|
|
|
|
|
|
|
|
|
|
|
|
|
|
|
|
|
|
|
|
|
|
|
|
|
|||||||||||||||||||||||||||
INTEREST EXPENSE, NET
The following table summarizes the components of interest as presented in the consolidated statements of operations:
| Year Ended December 31, | ||||||||||||
| 2017 | 2016 | 2015 | ||||||||||
| Income | $ | 16.0 | $ | 10.9 | $ | 9.7 | ||||||
| Expense on borrowings | (190.1 | ) | (141.9 | ) | (120.6 | ) | ||||||
| Expense on UTPs and other tax related liabilities (a) | (15.3 | ) | (7.8 | ) | (5.3 | ) | ||||||
| Legacy Tax (b) | — | 0.2 | 0.7 | |||||||||
| Capitalized | 1.0 | 0.8 | 0.4 | |||||||||
|
|
|
|
|
|
|
|||||||
| Total | $ | (188.4 | ) | $ | (137.8 | ) | $ | (115.1 | ) | |||
|
|
|
|
|
|
|
|||||||
| Interest paid (c) | $ | 158.2 | $ | 136.7 | $ | 108.3 | ||||||
|
|
|
|
|
|
|
|||||||
| (a) | The 2015 amount includes approximately $2 million in interest income on a tax refund and a $4 million interest reversal relating to the favorable resolution of a tax audits. |
| (b) | Represents a reduction of accrued interest related to the favorable resolution of Legacy Tax Matters. |
| (c) | Interest paid includes net settlements on interest rate swaps more fully discussed in Note 5. |
The Company’s debt is recorded at its carrying amount, which represents the issuance amount plus or minus any issuance premium or discount, except for the 2010 Senior Notes, the 2014 Senior Notes (5-Year) and the 2012 Senior Notes which are recorded at the carrying amount adjusted for the fair value of an interest rate swap used to hedge the fair value of the note.
| 110 | MOODY’S 2017 10-K |
Table of Contents
The fair value and carrying value of the Company’s debt (excluding Commercial Paper) as of December 31, 2017 and 2016 are as follows:
| December 31, 2017 | December 31, 2016 | |||||||||||||||
| Carrying Amount | Estimated Fair Value |
Carrying Amount | Estimated Fair Value |
|||||||||||||
| Series 2007-1 Notes | $ | — | $ | — | $ | 300.0 | $ | 308.9 | ||||||||
| 2010 Senior Notes | 497.8 | 537.9 | 502.6 | 548.3 | ||||||||||||
| 2012 Senior Notes | 495.5 | 535.6 | 495.3 | 535.3 | ||||||||||||
| 2013 Senior Notes | 495.8 | 547.8 | 495.2 | 539.9 | ||||||||||||
| 2014 Senior Notes (5-Year) | 446.5 | 452.8 | 448.8 | 456.2 | ||||||||||||
| 2014 Senior Notes (30-Year) | 597.6 | 722.4 | 597.4 | 661.5 | ||||||||||||
| 2015 Senior Notes | 596.8 | 617.7 | 523.7 | 534.8 | ||||||||||||
| 2017 Senior Notes (5-Year) | 495.5 | 500.0 | — | — | ||||||||||||
| 2017 Floating Rate Senior Notes | 299.5 | 300.2 | — | — | ||||||||||||
| 2.65% 2017 Private Placement Notes, due 2023 | 495.4 | 494.8 | — | — | ||||||||||||
| 3.25% 2017 Private Placement Notes, due 2028 | 490.9 | 493.6 | — | — | ||||||||||||
| 2017 Term Loan Facility, due 2020 | 499.3 | 499.3 | — | — | ||||||||||||
|
|
|
|
|
|
|
|
|
|||||||||
| Total | $ | 5,410.6 | $ | 5,702.1 | $ | 3,363.0 | $ | 3,584.9 | ||||||||
|
|
|
|
|
|
|
|
|
|||||||||
The fair value of the Company’s debt is estimated based on quoted market prices for similar instruments. Accordingly, the inputs used to estimate the fair value of the Company’s long-term debt are classified as Level 2 inputs within the fair value hierarchy.
| NOTE 17 | CAPITAL STOCK |
Authorized Capital Stock
The total number of shares of all classes of stock that the Company has authority to issue under its Restated Certificate of Incorporation is 1.02 billion shares with a par value of $0.01, of which 1.0 billion are shares of common stock, 10.0 million are shares of preferred stock and 10.0 million are shares of series common stock. The preferred stock and series common stock can be issued with varying terms, as determined by the Board.
Share Repurchase Program
The Company implemented a systematic share repurchase program in the third quarter of 2005 through an SEC Rule 10b5-1 program. Moody’s may also purchase opportunistically when conditions warrant. As a result, Moody’s share repurchase activity will continue to vary from quarter to quarter. The table below summarizes the Company’s remaining authority under its share repurchase program as of December 31, 2017:
| Date Authorized |
Amount Authorized | Remaining Authority | ||||||
| December 15, 2015 | $ | 1,000.0 | $ | 527.0 | ||||
During 2017, Moody’s repurchased 1.6 million shares of its common stock under its share repurchase program and issued 2.4 million shares under employee stock-based compensation plans.
Dividends
The Company’s cash dividends were:
| Dividends Per Share | ||||||||||||||||||||||||
| Year ended December 31, | ||||||||||||||||||||||||
| 2017 | 2016 | 2015 | ||||||||||||||||||||||
| Declared | Paid | Declared | Paid | Declared | Paid | |||||||||||||||||||
| First quarter | $ | — | $ | 0.38 | $ | — | $ | 0.37 | $ | — | $ | 0.34 | ||||||||||||
| Second quarter | 0.38 | 0.38 | 0.37 | 0.37 | 0.34 | 0.34 | ||||||||||||||||||
| Third quarter | 0.38 | 0.38 | 0.37 | 0.37 | 0.34 | 0.34 | ||||||||||||||||||
| Fourth quarter | 0.38 | 0.38 | 0.75 | 0.37 | 0.71 | 0.34 | ||||||||||||||||||
|
|
|
|
|
|
|
|
|
|
|
|
|
|||||||||||||
| Total | $ | 1.14 | $ | 1.52 | $ | 1.49 | $ | 1.48 | $ | 1.39 | $ | 1.36 | ||||||||||||
|
|
|
|
|
|
|
|
|
|
|
|
|
|||||||||||||
| MOODY’S 2017 10-K | 111 |
Table of Contents
On January 24, 2018, the Board approved the declaration of a quarterly dividend of $0.44 per share of Moody’s common stock, payable on March 12, 2018 to shareholders of record at the close of business on February 20, 2018. The continued payment of dividends at the rate noted above, or at all, is subject to the discretion of the Board.
| NOTE 18 | LEASE COMMITMENTS |
Moody’s operates its business from various leased facilities, which are under operating leases that expire over the next 10 years. Moody’s also leases certain computer and other equipment under operating leases that expire over the next five years. Rent expense, including lease incentives, is amortized on a straight-line basis over the related lease term. Rent expense under operating leases for the years ended December 31, 2017, 2016 and 2015 was $97.0 million, $95.4 million and $87.6 million, respectively.
The 21-year operating lease for the Company’s headquarters at 7WTC which commenced on October 20, 2006 contains a total of 20 years of renewal options. These renewal options apply to both the original lease as well as additional floors leased by the Company beginning in 2014. Additionally, the 17.5 year operating lease for the Company’s London, England office which commenced on February 6, 2008 contains a total of 15 years of renewal options.
The minimum rent for operating leases at December 31, 2017 is as follows:
| Year Ending December 31, |
Operating Leases | |||
| 2018 | $ | 108.3 | ||
| 2019 | 87.1 | |||
| 2020 | 80.8 | |||
| 2021 | 75.7 | |||
| 2022 | 72.6 | |||
| Thereafter | 290.6 | |||
|
|
|
|||
| Total minimum lease payments | $ | 715.1 | ||
|
|
|
|||
| NOTE 19 | CONTINGENCIES |
Given the nature of their activities, Moody’s and its subsidiaries are subject to legal and tax proceedings, governmental, regulatory and legislative investigations and inquiries, and claims and litigation that are based on ratings assigned by MIS or that are otherwise incidental to the Company’s business. The Company periodically receives and responds to subpoenas and other inquiries which may relate to Moody’s activities or to activities of others that may result in claims and litigation, proceedings or investigations by private litigants or governmental, regulatory or legislative authorities. Moody’s also is subject to ongoing tax audits as addressed in Note 15 to the financial statements.
Management periodically assesses the Company’s liabilities and contingencies in connection with these matters based upon the latest information available. For claims, litigation and proceedings and governmental investigations and inquiries not related to income taxes, the Company records liabilities in the consolidated financial statements when it is both probable that a liability has been incurred and the amount of loss can be reasonably estimated and periodically adjusts these as appropriate. When the reasonable estimate of the loss is within a range of amounts, the minimum amount of the range is accrued unless some higher amount within the range is a better estimate than another amount within the range. In instances when a loss is reasonably possible but uncertainties exist related to the probable outcome and/or the amount or range of loss, management does not record a liability but discloses the contingency if material. As additional information becomes available, the Company adjusts its assessments and estimates of such matters accordingly. Moody’s also discloses material pending legal proceedings pursuant to SEC rules and other pending matters as it may determine to be appropriate.
In view of the inherent difficulty of assessing the potential outcome of legal proceedings, governmental, regulatory and legislative investigations and inquiries, claims and litigation and similar matters and contingencies, particularly when the claimants seek large or indeterminate damages or assert novel legal theories or the matters involve a large number of parties, the Company often cannot predict what the eventual outcome of the pending matters will be or the timing of any resolution of such matters. The Company also may be unable to predict the impact (if any) that any such matters may have on how its business is conducted, on its competitive position or on its financial position, results of operations or cash flows. As the process to resolve any pending matters progresses, management will continue to review the latest information available and assess its ability to predict the outcome of such matters and the effects, if any, on its operations and financial condition and to accrue for and disclose such matters as and when required. However, because such matters are inherently unpredictable and unfavorable developments or resolutions can occur, the ultimate outcome of such matters, including the amount of any loss, may differ from those estimates.
| 112 | MOODY’S 2017 10-K |
Table of Contents
| NOTE 20 | SEGMENT INFORMATION |
The Company is organized into two operating segments: MIS and MA and accordingly, the Company reports in two reportable segments: MIS and MA.
The MIS segment consists of five LOBs. The CFG, SFG, FIG and PPIF LOBs generate revenue principally from fees for the assignment and ongoing monitoring of credit ratings on debt obligations and the entities that issue such obligations in markets worldwide. The MIS Other LOB primarily consists of financial instruments pricing services in the Asia-Pacific region as well as ICRA non-ratings revenue.
The MA segment develops a wide range of products and services that support the risk management activities of institutional participants in global financial markets. The MA segment consists of three LOBs—RD&A, ERS and PS.
On August 10, 2017, a subsidiary of the Company acquired Yellow Maple I B.V., an indirect parent of Bureau van Dijk, a global provider of business intelligence and company information products. Bureau van Dijk is part of the MA reportable segment and its revenue is included in the RD&A LOB. Refer to Note 7 for further discussion on the acquisition.
Revenue for MIS and expenses for MA include an intersegment royalty charged to MA for the rights to use and distribute content, data and products developed by MIS. The royalty rate charged by MIS approximates the fair value of the aforementioned content, data and products and is generally based on comparable market transactions. Also, revenue for MA and expenses for MIS include an intersegment fee charged to MIS from MA for certain MA products and services utilized in MIS’s ratings process. These fees charged by MA are generally equal to the costs incurred by MA to produce these products and services. Additionally, overhead costs and corporate expenses of the Company that exclusively benefit only one segment are fully charged to that segment. Overhead costs and corporate expenses of the Company that benefit both segments are allocated to each segment based on a revenue-split methodology. Accordingly, a reportable segment’s share of these costs will increase as its proportion of revenue relative to Moody’s total revenue increases. Overhead expenses include costs such as rent and occupancy, information technology and support staff such as finance, human resources and information technology. “Eliminations” in the table below represent intersegment revenue/expense. Moody’s does not report the Company’s assets by reportable segment, as this metric is not used by the chief operating decision maker to allocate resources to the segments. Consequently, it is not practical to show assets by reportable segment.
Financial Information by Segment
The table below shows revenue, Adjusted Operating Income and operating income by reportable segment. Adjusted Operating Income is a financial metric utilized by the Company’s chief operating decision maker to assess the profitability of each reportable segment.
| Year Ended December 31, | ||||||||||||||||||||||||||||||||
| 2017 | 2016 | |||||||||||||||||||||||||||||||
| MIS | MA | Eliminations | Consolidated | MIS | MA | Eliminations | Consolidated | |||||||||||||||||||||||||
| Revenue | $ | 2,885.5 | $ | 1,446.3 | $ | (127.7 | ) | $ | 4,204.1 | $ | 2,471.0 | $ | 1,246.9 | $ | (113.7 | ) | $ | 3,604.2 | ||||||||||||||
| Operating, SG&A | 1,246.9 | 1,095.0 | (127.7 | ) | 2,214.2 | 1,115.6 | 961.1 | (113.7 | ) | 1,963.0 | ||||||||||||||||||||||
|
|
|
|
|
|
|
|
|
|
|
|
|
|
|
|
|
|||||||||||||||||
| Adjusted Operating Income |
1,638.6 | 351.3 | — | 1,989.9 | 1,355.4 | 285.8 | — | 1,641.2 | ||||||||||||||||||||||||
| Less: Depreciation and amortization |
74.7 | 83.6 | — | 158.3 | 73.8 | 52.9 | — | 126.7 | ||||||||||||||||||||||||
| Restructuring |
— | — | — | — | 10.2 | 1.8 | — | 12.0 | ||||||||||||||||||||||||
| Acquisition-Related Expenses |
— | 22.5 | — | 22.5 | — | — | — | — | ||||||||||||||||||||||||
| Settlement Charge |
— | — | — | — | 863.8 | — | — | 863.8 | ||||||||||||||||||||||||
|
|
|
|
|
|
|
|
|
|
|
|
|
|
|
|
|
|||||||||||||||||
| Operating income | $ | 1,563.9 | $ | 245.2 | $ | — | $ | 1,809.1 | $ | 407.6 | $ | 231.1 | $ | — | $ | 638.7 | ||||||||||||||||
|
|
|
|
|
|
|
|
|
|
|
|
|
|
|
|
|
|||||||||||||||||
| MOODY’S 2017 10-K | 113 |
Table of Contents
| Year Ended December 31, | ||||||||||||||||||||||||||||||||
| 2015 | ||||||||||||||||||||||||||||||||
| MIS | MA | Eliminations | Consolidated | |||||||||||||||||||||||||||||
| Revenue | $ | 2,427.7 | $ | 1,163.4 | $ | (106.6 | ) | $ | 3,484.5 | |||||||||||||||||||||||
| Operating, SG&A | 1,120.3 | 883.9 | (106.6 | ) | 1,897.6 | |||||||||||||||||||||||||||
|
|
|
|
|
|
|
|
|
|||||||||||||||||||||||||
| Adjusted Operating Income |
1,307.4 | 279.5 | — | 1,586.9 | ||||||||||||||||||||||||||||
| Less: |
66.0 | 47.5 | — | 113.5 | ||||||||||||||||||||||||||||
|
|
|
|
|
|
|
|
|
|||||||||||||||||||||||||
| Operating income | $ | 1,241.4 | $ | 232.0 | $ | — | $ | 1,473.4 | ||||||||||||||||||||||||
|
|
|
|
|
|
|
|
|
|||||||||||||||||||||||||
The cumulative restructuring charges related to actions taken in 2016 as more fully discussed in Note 9 for the MIS and MA reportable segments are $10.2 and $1.8 million, respectively. The charge in MA reflects cost management initiatives in certain corporate overhead functions of which portion is allocated to MA based on a revenue-split methodology.
MIS AND MA REVENUE BY LINE OF BUSINESS
The tables below present revenue by LOB:
| Year Ended December 31, | ||||||||||||
| 2017 | 2016 | 2015 | ||||||||||
| MIS: | ||||||||||||
| Corporate finance (CFG) | $ | 1,392.7 | $ | 1,122.3 | $ | 1,112.7 | ||||||
| Structured finance (SFG) | 495.5 | 436.8 | 449.1 | |||||||||
| Financial institutions (FIG) | 435.8 | 368.9 | 365.6 | |||||||||
| Public, project and infrastructure finance (PPIF) | 431.3 | 412.2 | 376.4 | |||||||||
|
|
|
|
|
|
|
|||||||
| Total ratings revenue |
2,755.3 | 2,340.2 | 2,303.8 | |||||||||
| MIS Other | 18.5 | 30.6 | 30.4 | |||||||||
|
|
|
|
|
|
|
|||||||
| Total external revenue |
2,773.8 | 2,370.8 | 2,334.2 | |||||||||
| Intersegment royalty | 111.7 | 100.2 | 93.5 | |||||||||
|
|
|
|
|
|
|
|||||||
| Total |
2,885.5 | 2,471.0 | 2,427.7 | |||||||||
|
|
|
|
|
|
|
|||||||
| MA: | ||||||||||||
| Research, data and analytics (RD&A) | 832.7 | 667.6 | 626.4 | |||||||||
| Enterprise risk solutions (ERS) | 448.6 | 418.8 | 374.0 | |||||||||
| Professional services (PS) | 149.0 | 147.0 | 149.9 | |||||||||
|
|
|
|
|
|
|
|||||||
| Total external revenue |
1,430.3 | 1,233.4 | 1,150.3 | |||||||||
| Intersegment revenue | 16.0 | 13.5 | 13.1 | |||||||||
|
|
|
|
|
|
|
|||||||
| Total |
1,446.3 | 1,246.9 | 1,163.4 | |||||||||
|
|
|
|
|
|
|
|||||||
| Eliminations | (127.7 | ) | (113.7 | ) | (106.6 | ) | ||||||
|
|
|
|
|
|
|
|||||||
| Total MCO |
$ | 4,204.1 | $ | 3,604.2 | $ | 3,484.5 | ||||||
|
|
|
|
|
|
|
|||||||
| 114 | MOODY’S 2017 10-K |
Table of Contents
CONSOLIDATED REVENUE AND LONG-LIVED ASSETS INFORMATION BY GEOGRAPHIC AREA
| Year Ended December 31, | ||||||||||||
| 2017 | 2016 | 2015 | ||||||||||
| Revenue: | ||||||||||||
| U.S. | $ | 2,348.4 | $ | 2,105.5 | $ | 2,009.0 | ||||||
| International: | ||||||||||||
| EMEA |
1,131.7 | 904.4 | 882.3 | |||||||||
| Asia-Pacific |
471.4 | 373.2 | 364.2 | |||||||||
| Americas |
252.6 | 221.1 | 229.0 | |||||||||
|
|
|
|
|
|
|
|||||||
| Total International |
1,855.7 | 1,498.7 | 1,475.5 | |||||||||
|
|
|
|
|
|
|
|||||||
| Total | $ | 4,204.1 | $ | 3,604.2 | $ | 3,484.5 | ||||||
|
|
|
|
|
|
|
|||||||
| Long-lived assets at December 31: | ||||||||||||
| United States | $ | 672.5 | $ | 681.9 | $ | 657.5 | ||||||
| International | 5,037.4 | 964.0 | 924.3 | |||||||||
|
|
|
|
|
|
|
|||||||
| Total | $ | 5,709.9 | $ | 1,645.9 | $ | 1,581.8 | ||||||
|
|
|
|
|
|
|
|||||||
| NOTE 21 | VALUATION AND QUALIFYING ACCOUNTS |
Accounts receivable allowances primarily represent adjustments to customer billings that are estimated when the related revenue is recognized and also represents an estimate for uncollectible accounts. The valuation allowance on deferred tax assets relates to foreign
net operating tax losses for which realization is uncertain. Below is a summary of activity:
| Year Ended December 31, |
Balance at Beginning of the Year |
Charged to costs and expenses |
Deductions(1) | Balance at End of the Year |
||||||||||||
| 2017 | ||||||||||||||||
| Accounts receivable allowance |
$ | (25.7 | ) | $ | (19.6 | ) | $ | 8.7 | $ | (36.6 | ) | |||||
| Deferred tax assets—valuation allowance |
$ | (3.2 | ) | $ | (9.9 | ) | $ | 0.3 | $ | (12.8 | ) | |||||
| 2016 | ||||||||||||||||
| Accounts receivable allowance |
$ | (27.5 | ) | $ | (6.2 | ) | $ | 8.0 | $ | (25.7 | ) | |||||
| Deferred tax assets—valuation allowance |
$ | (4.3 | ) | $ | (0.9 | ) | $ | 2.0 | $ | (3.2 | ) | |||||
| 2015 | ||||||||||||||||
| Accounts receivable allowance |
$ | (29.4 | ) | $ | (9.0 | ) | $ | 10.9 | $ | (27.5 | ) | |||||
| Deferred tax assets—valuation allowance |
$ | (6.9 | ) | $ | 2.4 | $ | 0.2 | $ | (4.3 | ) | ||||||
| (1) | Reflects write off of uncollectible accounts receivable or expiration of foreign net operating tax losses. |
| NOTE 22 | OTHER NON-OPERATING (EXPENSE) INCOME, NET |
The following table summarizes the components of other non-operating (expense) income, net as presented in the consolidated statements of operations:
| Year Ended December 31, | ||||||||||||
| 2017 | 2016 | 2015 | ||||||||||
| FX (loss)/gain (a) | $ | (16.8 | ) | $ | 50.1 | $ | 1.1 | |||||
| Legacy Tax (b) | — | 1.6 | 6.4 | |||||||||
| Joint venture income | 13.3 | 11.4 | 11.8 | |||||||||
| Other | (1.2 | ) | (6.0 | ) | 2.0 | |||||||
|
|
|
|
|
|
|
|||||||
| Total |
$ | (4.7 | ) | $ | 57.1 | $ | 21.3 | |||||
|
|
|
|
|
|
|
|||||||
| (a) | The FX gain in 2016 includes an approximate $35 million net gain relating to the substantial liquidation/sale of certain non-U.S. subsidiaries. Pursuant to ASC 830, cumulative translation gains relating to these subsidiaries were reclassified to other non operating income, net in the consolidated statement of operations. |
| (b) | The 2016 and 2015 amount relate to the expiration of a statute of limitations for Legacy Tax Matters. |
| MOODY’S 2017 10-K | 115 |
Table of Contents
| NOTE 23 | RELATED PARTY TRANSACTIONS |
Moody’s Corporation made grants of $12 million, $4 million and $0 to The Moody’s Foundation during years ended December 31, 2017, 2016 and 2015, respectively. The Foundation carries out philanthropic activities primarily in the areas of education and health and human services. Certain members of Moody’s senior management are on the board of the Foundation.
| NOTE 24 | QUARTERLY FINANCIAL DATA (UNAUDITED) |
| Three Months Ended | ||||||||||||||||
| (amounts in millions, except EPS) |
March 31 | June 30 | September 30 | December 31 | ||||||||||||
| 2017 | ||||||||||||||||
| Revenue | $ | 975.2 | $ | 1,000.5 | $ | 1,062.9 | $ | 1,165.5 | ||||||||
| Operating income | $ | 443.4 | $ | 457.5 | $ | 445.4 | $ | 462.8 | ||||||||
| Net income attributable to Moody’s | $ | 345.6 | $ | 312.2 | $ | 317.3 | $ | 25.5 | ||||||||
| EPS: | ||||||||||||||||
| Basic |
$ | 1.81 | $ | 1.63 | $ | 1.66 | $ | 0.13 | ||||||||
| Diluted |
$ | 1.78 | $ | 1.61 | $ | 1.63 | $ | 0.13 | ||||||||
| 2016 | ||||||||||||||||
| Revenue | $ | 816.1 | $ | 928.9 | $ | 917.1 | $ | 942.1 | ||||||||
| Operating income (loss) | $ | 304.1 | $ | 410.2 | $ | 397.5 | $ | (473.1 | ) | |||||||
| Net income (loss) attributable to Moody’s | $ | 184.4 | $ | 255.5 | $ | 255.3 | $ | (428.6 | ) | |||||||
| EPS: | ||||||||||||||||
| Basic |
$ | 0.95 | $ | 1.32 | $ | 1.33 | $ | (2.25 | ) | |||||||
| Diluted |
$ | 0.93 | $ | 1.30 | $ | 1.31 | $ | (2.25 | ) | |||||||
Basic and diluted EPS are computed for each of the periods presented. The number of weighted average shares outstanding changes as common shares are issued pursuant to employee stock-based compensation plans and for other purposes or as shares are repurchased. Therefore, the sum of basic and diluted EPS for each of the four quarters may not equal the full year basic and diluted EPS.
Net Income attributable to Moody’s for the three months ended March 31, 2017 includes the $59.7 million CCXI Gain. Net Income attributable to Moody’s for the three months ended June 30, 2017 and September 30, 2017 include $41.2 million ($25.3 million net of tax) and $69.9 million ($44.4 million net of tax), respectively, related to gains from FX collars and forward contracts executed to hedge against variability in the euro-denominated purchase price for Bureau van Dijk. Net Income attributable to Moody’s in the three months ended December 31, 2017 includes a net charge of $245.6 million relating to the U.S. corporate tax reform and changes in statutory tax rates in Belgium as more fully discussed in Note 15. Both the operating loss and the net loss attributable to Moody’s in the three months ended December 31, 2016 primarily reflect the Settlement Charge of $863.8 million ($700.7 million, net-of-tax). In addition, the net loss attributable to Moody’s for the three months ended December 31, 2016 includes an approximate $35 million FX gain related to the liquidation of a subsidiary as well as benefits of $1.6 million to net income related to the resolution of Legacy Tax Matters.
| NOTE 25 | SUBSEQUENT EVENT |
On January 24, 2018, the Board approved the declaration of a quarterly dividend of $0.44 per share for Moody’s common stock, payable March 12, 2018 to shareholders of record at the close of business on February 20, 2018.
| 116 | MOODY’S 2017 10-K |
Table of Contents
| ITEM 9. | CHANGES IN AND DISAGREEMENTS WITH ACCOUNTANTS ON ACCOUNTING AND FINANCIAL DISCLOSURE |
Not applicable
| ITEM 9A. | CONTROLS AND PROCEDURES |
Evaluation of Disclosure Controls and Procedures
The Company carried out an evaluation, as required by Rule 13a-15(b) under the Exchange Act, under the supervision and with the participation of the Company’s management, including the Company’s Chief Executive Officer and Chief Financial Officer, of the effectiveness of the design and operation of the Company’s disclosure controls and procedures, as defined in Rule 13a-15(e) of the Exchange Act, as of the end of the period covered by this report (the “Evaluation Date”). Based on such evaluation, such officers have concluded that, as of the Evaluation Date, the Company’s disclosure controls and procedures were effective to provide reasonable assurance that information required to be disclosed by the Company in reports that it files or submits under the Exchange Act is recorded, processed, summarized and reported within the time periods specified in the communication to the Company’s management, including the Company’s Chief Executive Officer and Chief Financial Officer, as appropriate to allow timely decisions regarding required disclosure. During the fiscal year ended December 31, 2017, the Company acquired Bureau van Dijk and management has excluded this acquired business from its assessment of the effectiveness of disclosure controls and procedures as of the Evaluation Date. The total assets (excluding acquired goodwill and intangible assets which are included within the scope of this assessment) and revenues of Bureau van Dijk represents approximately $322 million and $92 million, respectively, of the corresponding amounts in our consolidated financial statements for the fiscal year ended December 31, 2017.
Changes In Internal Control Over Financial Reporting
Information in response to this Item is set forth under the caption “Management’s Report on Internal Control Over Financial Reporting”, in Part II, Item 8 of this annual report on Form 10-K.
Except as described below, the Company’s management, including the Company’s Chief Executive Officer and Chief Financial Officer, has determined that there were no changes in the Company’s internal control over financial reporting that have materially affected, or are reasonably likely to materially affect, these internal controls over financial reporting during the period covered by this report.
During the fiscal year ended December 31, 2017, the Company acquired Bureau van Dijk, and we are in the process of integrating the acquired entity into the Company’s financial reporting processes and procedures and internal controls over financial reporting. Additionally, during the fiscal year ended December 31, 2017, the Company implemented internal controls relating to the adoption and assessment of the impact of the new accounting standard relating to revenue recognition which will be adopted by Moody’s on January 1, 2018.
| ITEM 9B. | OTHER INFORMATION |
Not applicable.
| MOODY’S 2017 10-K | 117 |
Table of Contents
PART III
Except for the information relating to the executive officers of the Company set forth in Part I of this annual report on Form 10-K, the information called for by Items 10-14 is contained in the Company’s definitive proxy statement for use in connection with its annual meeting of stockholders scheduled to be held on April 24, 2018, and is incorporated herein by reference.
| ITEM 10. | DIRECTORS, EXECUTIVE OFFICERS AND CORPORATE GOVERNANCE |
| ITEM 11. | EXECUTIVE COMPENSATION |
| ITEM 12. | SECURITY OWNERSHIP OF CERTAIN BENEFICIAL OWNERS AND MANAGEMENT AND RELATED STOCKHOLDER MATTERS |
| ITEM 13. | CERTAIN RELATIONSHIPS AND RELATED TRANSACTIONS, AND DIRECTOR INDEPENDENCE |
| ITEM 14. | PRINCIPAL ACCOUNTING FEES AND SERVICES |
| 118 | MOODY’S 2017 10-K |
Table of Contents
PART IV
| ITEM 15. | EXHIBITS AND FINANCIAL STATEMENT SCHEDULES |
LIST OF DOCUMENTS FILED AS PART OF THIS REPORT.
(1) Financial Statements.
See Index to Financial Statements on page 60, in Part II. Item 8 of this Form 10-K.
(2) Financial Statement Schedules.
None.
(3) Exhibits.
See Index to Exhibits on pages 121-124 of this Form 10-K.
| MOODY’S 2017 10-K | 119 |
Table of Contents
| SIGNATURES |
Pursuant to the requirements of Section 13 or 15(d) of the Securities Exchange Act of 1934, the Registrant has duly caused this report to be signed on its behalf by the undersigned, thereunto duly authorized.
MOODY’S CORPORATION
(Registrant)
By: /s/ RAYMOND W. MCDANIEL, JR.
Raymond W. McDaniel, Jr.
President and Chief Executive Officer
Date: February 26, 2018
Pursuant to the requirements of the Securities Exchange Act of 1934, this report has been signed below by the following persons on behalf of the Registrant and in the capacities and on the date indicated.
| 120 | MOODY’S 2017 10-K |
Table of Contents
| MOODY’S 2017 10-K | 121 |
Table of Contents
| 122 | MOODY’S 2017 10-K |
Table of Contents
| MOODY’S 2017 10-K | 123 |
Table of Contents
| * | Filed herewith |
| † | Management contract of compensatory plan or arrangement |
| 124 | MOODY’S 2017 10-K |