Attached files
| file | filename |
|---|---|
| EX-99.1 - EXHIBIT 99.1 - Priority Technology Holdings, Inc. | tv487195_ex99-1.htm |
| 8-K - 8-K - Priority Technology Holdings, Inc. | tv487195_8k.htm |
Exhibit 99.2

Technology Holdings Investor Presentation February 2018

Disclaimer Important Notice Regarding Forward - Looking Statements and Non - GAAP Measures This presentation contains certain “forward - looking statements” within the meaning of the Securities Act of 1933 and the Securit ies Exchange Act of 1934, both as amended by the Private Securities Litigation Reform Act of 1995. Statements that are not historical facts, including statements about the pending tr ans action between M I Acquisitions, Inc. ("M I") and Priority Holdings, LLC ("Priority") and the transactions contemplated thereby, and the parties perspectives and expectations, are forward lookin g s tatements. Such statements include, but are not limited to, statements regarding the proposed transaction, including the anticipated initial enterprise value and post - closing equity value, the benefits of the proposed transaction, integration plans, expected synergies and revenue opportunities, anticipated future financial and operating performance and results, including e sti mates for growth, the expected management and governance of the combined company, and the expected timing of the transactions contemplated by the Purchase Agreement. The words “expect,” “b elieve,” “estimate,” “intend,” “plan” and similar expressions indicate forward - looking statements. These forward - looking statements are not guarantees of future performance and a re subject to various risks and uncertainties, assumptions (including assumptions about general economic, market, industry and operational factors), known or unknown, which could cause th e actual results to vary materially from those indicated or anticipated. Such risks and uncertainties include, but are not limited to: (i) risks related to the expected timing and likelihood of completio n o f the pending transaction, including the risk that the transaction may not close due to one or more closing conditions to the transaction not being satisfied or waived, such as regulatory appr ova ls not being obtained, on a timely basis or otherwise, or that a governmental entity prohibited, delayed or refused to grant approval for the consummation of the transaction or required cert ain conditions, limitations or restrictions in connection with such approvals, or that the required approval of the Purchase Agreement by the stockholders of Priority was not obtained; (ii) ris ks related to the ability of M I and Priority to successfully integrate the businesses; (iii) the occurrence of any event, change or other circumstances that could give rise to the termination of the P urc hase Agreement (including circumstances requiring a party to pay the other party a termination fee pursuant to the Purchase Agreement); (iv) the risk that there may be a material adverse cha nge with respect to the financial position, performance, operations or prospects of Priority or M I; (v) risks related to disruption of management time from ongoing business operations due to the proposed transaction; (vi) the ri sk that any announcements relating to the proposed transaction could have adverse effects on the market price of M I’s common stock; (vii) the risk that the proposed transaction and its announcement could have an adverse effect on the ability of Priority and M I to retain customers and retain and hire key personnel and maintain relationships with their suppliers and customers and on th eir operating results and businesses generally; (viii) risks related to successfully integrating the businesses of the companies, which may result in the combined company not operating as effectively and efficiently as expected; (ix) the risk that the combined company may be unable to achieve cost - cutting synergies or it may take longer than exp ected to achieve those synergies; and (x) risks associated with the financing of the proposed transaction. A further list and description of risks and uncertainties can be found in M I’s Annual Report on Form 10 - K for the fiscal year ending December 31, 2016 filed with the SEC, in M I’s quarterly reports on Form 10 - Q filed with the SEC subsequent thereto and in the proxy statement on Schedule 14A that will be filed with the SEC by M I in connection with the proposed transaction, and other documents that the parties may file or furnish with the SEC, which you are encouraged to read. Should one or more of these r isk s or uncertainties materialize, or should underlying assumptions prove incorrect, actual results may vary materially from those indicated or anticipated by such forward - looking statements. Acco rdingly, you are cautioned not to place undue reliance on these forward - looking statements. Forward - looking statements relate only to the date they were made, and M I, Priority, and their subsidiaries undertake no obligation to update forward - looking statements to reflect events or circumstances after the date they were made except as required by law or applicable regulatio n . Adjusted EBITDA is not calculated in accordance with U.S. GAAP. It is a performance measure that provides supplemental inform ati on that M I and Priority believe is useful to analysts and investors to evaluate ongoing results of operations, when considered alongside GAAP measures such as net income, operating in com e and gross profit. Adjusted EBITDA excludes the financial impact of items management does not consider in assessing the ongoing operating performance of M I, Priority, or the combined company, and thereby facilitates review of its operating performance on a period - to - period basis. Other companies may have different capital structures or different lease terms, and com parability to the results of operations of M I, Priority or the combined company may be impacted by the effects of acquisition accounting on its depreciation and amortization. As a result o f t he effects of these factors and factors specific to other companies, M I and Priority believe Adjusted EBITDA provides helpful information to analysts and investors to facilitate a comparison of the ir operating performance to that of other companies. The presentation of Adjusted EBITDA in these materials should not be construed as an inference that Priority’s future results wi ll be unaffected by unusual or non - recurring items.

Disclaimer (Cont’d) Additional Information and Where to Find It In connection with the transaction described herein, M I will file relevant materials with the Securities and Exchange Commission (the “SEC”), including a proxy statement on Schedule 14 A. Promptly after filing its definitive proxy statement with the SEC, M I will mail the definitive proxy statement and a proxy card to each stockholder entitled to vote at the special meeting relatin g t o the transaction. INVESTORS AND SECURITY HOLDERS OF PRIORITY ARE URGED TO READ THESE MATERIALS (INCLUDING ANY AMENDMENTS OR SU PPL EMENTS THERETO) AND ANY OTHER RELEVANT DOCUMENTS IN CONNECTION WITH THE TRANSACTION THAT M I WILL FILE WITH THE SEC WHEN THEY BECOME AVAILABLE BECAUSE THEY WILL CONTAIN IMPORTANT INFORMATION ABOUT M I, PRIORITY AND THE TRANSACTION. The definitive proxy statement, the preliminary proxy statement and other relevant materials in co nnection with the transaction (when they become available), and any other documents filed by M I with the SEC, may be obtained free of charge at the SEC’s website ( www.sec.gov ) or at M I’s website ( www.miacquisitions.com ) or by writing to M I, c/o Magna Management LLC, 40 Wall Street, 58th Floor, New York, NY 10005 . Participants in Solicitation Priority, M I, and their respective directors, executive officers and employees and other persons may be deemed to be participants in the so lic itation of proxies from the holders of M I common stock in respect of the proposed transaction. Information about M I’s directors and executive officers and their ownership of M I’s common stock is set forth in M I’s Annual Report on Form 10 - K for the year ended December 31, 2016 filed with the SEC, as modified or supplemented by any Form 3 or Form 4 filed with the S EC since the date of such filing. Other information regarding the interests of the participants in the proxy solicitation will be included in the proxy statement pertaining to the proposed tr ans action when it becomes available. These documents can be obtained free of charge from the sources indicated above. 1

TABLE OF CONTENTS 1. INTRODUCTION 3 2. COMPANY OVERVIEW 5 3. INDUSTRY OVERVIEW 18 4. TRANSACTION OVERVIEW 21 5. FINANCIAL OVERVIEW 25 6. APPENDIX 28 2

Technology Holdings 1. INTRODUCTION

Transaction Overview Background • M I Acquisitions, Inc. (NASDAQ: “MACQ”; “M I”) has entered into a definitive agreement to combine via the acquisition of 100 % o f the equity interests of Priority Holdings, LLC (“Priority”) • The combined company will apply to be listed on the NASDAQ as Priority Technology Holdings, Inc. (PRTH) • Transaction is expected to close 2Q 2018 Valuation & Structure (1,2,3,4) • Enterprise value of approximately $1bn and Equity Value of approximately $690m based on a share price of $10.30 per share – Priority equityholders will roll 100% of their equity, resulting in over 90% pro forma ownership • Attractive valuation of 12.5x 2018E Pro Forma Adj. EBITDA of $80.2m • Restructuring of M I private placement units and founder shares – Priority will purchase private placement units and founder shares; the purchase will result in the Priority equityholders own ing 50 % of M I’s sponsor equity pre - closing – 421,107 private placement units and 453,210 founder shares at the initial blended cost to M I sponsors – M I will forfeit 174,863 founder shares at close, with possible re - issuance if earn - out targets are met – Payable in common shares or in cash at the election of the go - forward company – Payable in first year Priority receives earn - out consideration Earn - Out (5) • Additional 9.8m share consideration to Priority equityholders and certain other individuals and / or organizations pursuant to an incentive plan in the event business performance and stock price exceed certain threshold targets. – Adj. EBITDA targets: $82.5m in fiscal year ended Dec. 31, 2018; $91.5m in fiscal year ended Dec. 31, 2019 – Stock price thresholds: $12.00 for any 20 - trading days within any consecutive 30 - trading day period during fiscal years Dec. 31, 2018 & 2019; $14.00 for any 20 - trading days within any consecutive 30 - trading day period during fiscal years Dec. 31, 2019 & 2020 • If the 2018 earn - out threshold is not met, contingent shares rollover and are available if the Adj. EBITDA and stock price thres holds are met in 2019 (1) Based on fully diluted shares outstanding. Excludes outstanding out - of - the money warrants exercisable at a share price of $11.50 per share, 300,000 unit purchase option exercisable at a share price of $12.00 per share and Thomas Priore’s call option on all or a portion of M I Sponsor shares post - close. (2) Assumes no redemptions from existing M I shareholders. (3) Anticipated initial enterprise value based on cash in trust price of $10.30 per share (not including interest earned on the t rus t account and any funds deposited in the trust account to extend the time M I has to complete a business combination) and expected cash and debt balances at close. (4) See pages 28 & 29 for reconciliation of estimated net income to estimated Adjusted EBITDA. (5) See page 27 for full earn - out detail. 3 INTRODUCTION

Large Market Opportunity Coupled with Strong Secular Tailwinds (1,2) • Electronic consumer payment volume in the U.S. is projected to increase from $7.5tn in 2016 to $10.0tn by 2021, representing a 5.9% compound annual growth rate (“CAGR”) • The larger B2B market is somewhat less penetrated with card and other electronic payments, and we believe is poised for growt h – 2014 volume of $16.5tn projected to increase to $23.1tn by 2020 , representing a 5.8% CAGR • We believe the long - term trend toward electronic payments and growth of SMBs provide strong tailwinds for the Company Scalable, Innovative Technology Platform Delivering Compelling Value (3) • Purpose - built, agile platform provides merchants with a fully customizable suite of enterprise solutions to help manage critical workflows – Results in attrition well below industry average • Integrated processing ecosystem with direct connections to card networks • Technology agnostic, developer friendly software Predictable, High Growth Business with Strong Free Cash Flow (1,4,5,6) • Priority has demonstrated significant growth in processing volume, leaping from the 38th - largest acquirer in 2013 to the 15th - la rgest in 2016; currently the 7th largest non - bank acquirer in the U.S. • 12.5% pro forma net revenue CAGR and 19.4% pro forma adj. EBITDA CAGR from 2015A – 2019E • 46.8% Pro Forma Adj. EBITDA margin in 2018E • High free cash flow conversion of 91.6% in 2018E Platform for Organic & Non - Organic Growth • We believe there are multi - faceted growth opportunities supported by our purpose - built infrastructure • Priority views public currency as an avenue to increase M&A activity Attractive Valuation (7) • Valuation of 12.5x 2018E Pro Forma Adj. EBITDA is 18.9% below the median for public merchant acquirers • 2018 and 2019 earn - outs align management and shareholders’ interests Investment Highlights (1) Source: The Nilson Report. (2) Deloitte “B2B Payments Market is a Significant Untapped O pportunity” and Business Insider: “THE B2B PAYMENTS EXPLAINER: Why business payments have been slow to digitize, and what's changing that in 201 7.” (3) Source: Adil Consulting. (4) Vantiv and WorldPay considered a single entity due to merger. (5) See pages 28 & 29 for pro forma adj . EBITDA bridge. (6) Free cash flow = (pro forma adj. EBITDA – capex) / pro forma adj. EBITDA. (7) Source: Capital IQ as of 2/23/2018. See page 21 for detail. 4 INTRODUCTION

Technology Holdings 2. COMPANY OVERVIEW

Company Overview (1) The Nilson Report; Vantiv and WorldPay considered a single entity due to merger. (2) Net revenue = gross revenue less interchange, network and association fees and residual and commission expenses . (3) Source: Adil Consulting. PRIORITY IS A LEADING PROVIDER OF MERCHANT ACQUIRING AND COMMERC IAL PAYMENT SOLUTIONS, OFFERING UNIQUE PRODUCT CAPABILITIES TO ITS MERCHANT AND DISTRIBUTION PARTNERS • Priority operates two main business segments: Consumer Payments and Commercial Payments – Consumer Payments – full - service payment processing solutions for business - to - consumer (“B2C”) transactions, through Independent Sales Organizations (“ISOs”), Financial Institutions, Independent Software Vendors (“ISVs”) and other Referral Partners – Commercial Payments – AP automation solutions and curated managed services to industry leading financial institutions and networks such as Citi, MasterCard and AMEX • Priority’s solutions are delivered via its internally - developed MX and CPX enterprise suites – MX Merchant – customizable virtual terminal with proprietary business management tools and add - on “apps” – MX Connect – portfolio and customer relationship management system for Priority’s reseller partners – Commercial Payments Exchange (“CPX”) – buyer / supplier payment enablement platform • Priority generates revenue primarily from volume - based payment processing fees, as well as product subscription fees and management and performance fees for facilitating AMEX and MasterCard B2B services Net Revenue (2) Bankcard Volume Priority vs. Industry Attrition Rates (3) 13% CAGR ($ millions) 13% CAGR ($ billions) 0.01% 0.01% 0.01% 2015A 2016A 2017A By the Numbers ~$35bn Bankcard Volume Processed 4K New Boards per Month in 2017 7 th Largest U.S. Non - Bank Acquirer (1) 1 74K Merchants Serviced Historical Losses (As % of total bankcard volume) $27.2 $30.4 $34.7 $39.8 $44.4 2015A 2016A 2017A 2018E 2019E 23% 12% Industry Priority $116.6 $130.4 $149.3 $171.5 $186.5 2015A 2016A 2017A 2018E 2019E 5 COMPANY OVERVIEW

MX Connect launched Priority Commercial Payments becomes VISA issuer Released next - gen MX Merchant ISO/Agent Launched MX ISO/Agent Company Evolution FORWARD THINKING AND EXECUTION HAVE TRANSFORMED PRIORITY INTO A LEADING PAYMENT SERVICES PROVIDER IN THE U.S. Founded by experienced payments executives SaaS version launched 2006 2005 2008 AMEX commercial payments programs launched 4 Rings & Resolve service standard 2010 Commercial Payments hits 100 employees with launch of AMEX Merchant Finance 2011 Vortex Curated Cloud Launched 2012 COMMERCIAL PAYMENTS MasterCard commercial payments programs launched 2013 Cynergy Merger 2014 Priority ranked 7 th largest non - bank merchant acquirer in the U.S. (1) 2016 (1) Source: The Nilson Report; Vantiv and WorldPay considered a single entity due to merger. 2017 Connect 6 COMPANY OVERVIEW

Experienced Management Team Led by Industry Veterans Name Title Years of Experience Prior Experience Sean Kiewiet Chief Technology Officer 21 Afshin Yazdian President of Priority Payments 17 David McMiller President of Commercial Business Services 37 Cindy O’Neill President of Commercial Payments 26 PRIORITY’S LEADERSHIP TEAM HAS OVER 150 YEARS OF INDUSTRY EXPERI ENCE John Priore Chief Executive Officer 26 Bruce Mattox Chief Financial Officer 31 Tom Priore Executive Chairman 13 7 COMPANY OVERVIEW

Shared Common Services Vortex Cloud Operating System CURATED CLOUD AND & API DRIVEN OPERATING INFRASTRUCTURE BUILT FOR SCALE AND AGILITY Vortex Cloud Layer Vortex OS Layer Vortex UI Layer Accounting & Finance Legal & HR Risk & Underwriting IT Support & Development Payment & Settlement Ops Marketing & Investor Service MX Connect MX Insights ACH.com CPXchange MX Retail Payments Security (Crypto) Data Eventing Neural (AI) Storage Audit VDI Telephony VSI Custom Dev Retail Wholesale eComm ISV Networks FIs Corps. Dedicated Sales, Revenue Activation and Client Service Teams Payment Enabled Technology Partnerships Healthcare Hospitality Data & Analytics Education Real Estate Lending 8 COMPANY OVERVIEW

PRIORITY’S PURPOSE - BUILT COMMON PLATFORM SUPPORTS DISCRETE APPLICATIONS AND DELIVERS DIF FERENTIATED CUSTOMER EXPERIENCES Differentiated Technology Platform for Merchants and Distribution Partners MX Enterprise Suite CPX Enterprise Suite Commercial Payments Exchange Portal Merchant Portal x Electronic payment processing across all channels x Operates on a standalone basis or integrates into third - party software x Customizable virtual terminal x Omni - channel payment acceptance x Transaction monitoring and reporting x Technology “agnostic” architecture x Business management tools and add - on “apps ” Connect Portal x Fully customizable CRM for resellers x Secure, feature - rich suite of APIs x Actively manage pricing and client services matters on merchant portfolios x Detailed merchant processing reporting x Manage downstream commissions x Automated onboarding to multiple backend processors x Priority brand licensing x CPX Access - Interactive buyer and supplier portal for processing and reporting x CPX Payments - complete suite of traditional and transitional payment solutions to completely automate AP files – Supports one - time virtual card, P - Card, electronic fund transfer, ACH and check payment x CPX Gateway - accepts single payment files and intelligently routes each transaction via the optimal payment method x CPX Commercial Acceptance - optimizes payment programs with its full suite of targeted solutions and outreach campaign management MX Platform creates an integrated and “stickier” relationship, reflecting the following benefits: Drives additional volume by meeting resellers and merchants’ omni - channel payment acceptance needs 1 Allows Priority to become more integrated in a merchant’s workflow, creating “sticky” relationships and industry - low attrition rates 2 Add - on “apps” differentiate Priority from other providers with less expansive workflow tools 3 Technology “agnostic” architecture enables integration with current payment tools reducing “friction” for merchants 4 Complete commercial solution that monetizes payments while maximizing automation B2B solution that maximizes supplier sophistication 1 Seamlessly integrates into existing platform 2 Expert pre - sales support for spend analytics 3 Consultative approach with proven supplier enablement programs 4 9 COMPANY OVERVIEW

$78.3 $84.6 $96.9 $103.3 $109.8 2015A 2016A 2017A 2018E 2019E $27.1 $30.3 $34.5 $39.0 $43.1 2015A 2016A 2017A 2018E 2019E Organic Inorganic 45% 46% PRIORITY’S CONSUMER PAYMENTS SEGMENT PROVIDES FULL - SERVICE PAYME NT PROCESSING SOLUTIONS FOR B2C TRANSACTIONS Consumer Payments – Overview • Priority enables merchants to accept electronic payments (e.g. credit, debit) at the point - of - sale (“POS”), online and via mobile payment technologies • The Company provides a full suite of agile tools for both resellers and merchants via its SaaS based MX enterprise suite • ~123,000 of Priority’s merchants are integrated with MX Merchant, eCommerce or ISVs; represents ~67% of processing volume − Results in high retention of merchants and resellers; with attrition rates well below the industry average (1) Integrated Merchants = Merchants on MX or integrated through ISVs & eCommerce. (2) Priority’s 2018E Net Revenue, Gross Profit and Adj. EBITDA excludes the anticipated impact of $9m of identified acquisitions . Overview (1) Reseller Channels Contribution by Volume & Gross Profit Gross Profit (2) 9 % CAGR Bankcard Volume 12% CAGR Retail Resellers eCommerce / Wholesale Resellers ISVs / VARs • Non - risk bearing resellers leverage Priority's complete operating infrastructure and brand recognition • eCommerce and wholesale resellers bear 100% of processing and chargeback risk • Priority’s ISVs & VARs directly integrate with Priority’s MX Payments and onboarding API s for a seamless customer experience 57% 27% 9% 16% % Gross Profit % Volume % Gross Profit % Volume % Gross Profit % Volume ($ billions) ($ millions) 10 COMPANY OVERVIEW

Priority’s Purpose - Built Payment Cloud: Monetizing Merchant Networks Associations Banks & FIs VARs ISVs Wholesale/ Retail Resellers Merchant Community Reseller Community Vortex Core Processing & Transaction System Connect Merchant Application UI Layer Proprietary Apps 3 rd Party Products • MX Merchant: virtual payment processing terminal and business management tool that creates an integrated merchant experience − Fully customizable platform through proprietary & 3 rd party add - on applications • MX Connect: powerful reseller CRM and business operating system − Low - friction electronic onboarding to improve merchant acquisition − Superior data sharing capability, enabling resellers to better manage client service needs and retain merchants 11 COMPANY OVERVIEW

ILLUSTRATIVE $100 TRANSACTION, WITH 2.5% MERCHANT DISCOUNT RATE Illustrative Consumer Payments Transaction Consumer ($100.00) Payment Network $0.16 Merchant $97.50 Merchant Acquiring / Payment Processing Card Issuing Bank $1.60 Merchant Acquirer Sponsor Bank Resellers / ISVs $0.28 $0.40 $0.01 Processor <$0.05 Payment / Item Flow Authorization / Data Flow 12 COMPANY OVERVIEW

$11.6 $16.7 $18.4 $22.4 $27.7 2015A 2016A 2017A 2018E 2019E PRIORITY’S COMMERCIAL PAYMENTS SEGMENT PROVIDES FULL - SERVICE B2B PAYMENT PROCESSING Commercial Payments & Managed Services – Overview • Provides account automation solutions and curated managed services to industry leading financial institutions and networks such as Citi, MasterCard and American Express • Leveraging CPX, clients are able to increase efficiencies across the AP process while creating new revenue streams • Managed Services programs include receivable finance management, consulting services, closed loop acquiring services as well as supplier adoption and education Overview CPX Volume Cumulative AMEX Funded Loan Count & BIP Volume Commercial Payments Net Revenue (1) 24% CAGR $2,702 $3,802 $5,098 17,790 28,943 42,099 0 10,000 20,000 30,000 40,000 50,000 $- $1,000 $2,000 $3,000 $4,000 $5,000 $6,000 2015A 2016A 2017A AMEX BIP $ Volume AMEX Funded Loan Count (1) Net revenue = gross revenue less interchange, network and association fees and residual and commission expenses. $46.9 $95.8 $190.3 $805.2 $1,295.7 2015A 2016A 2017A 2018E 2019E ($ millions) ($ millions) ($ millions) 13 COMPANY OVERVIEW

CPX Direct , 25% ACH , 20% Check , 10% CPX ACH+ , 10% DD , 5% Virtual Card , 30% Check , 53% Wire , 10% P - Card , 13% ACH , 24% Typical Commercial Payments (1) 100% Commercial Payments with CPX DELIVERING SUBSTANTIAL VALUE TO THE FAST GROWING, MASSIVE B2B PAYMENTS MAR KET Commercial Payments – Priority CPX • CPX Payments leverages a complete suite of traditional and transitional payment solutions to fully automate B2B AP files • Supports one - time virtual cards, P - Cards, electronic fund transfers, ACH and check payments • Based on the payment type, Priority earns a percentage of the total dollar volume processed, which is paid for by the supplier accepting the payment (i.e. a merchant discount) • CPX Gateway accepts single payment files and intelligently routes each transaction via the optimal payment method Buyers / Payers Simple Pay File Integration Upload Pay File Fund Settlement With Record (*$) and CTX Reconciliation Activate Suppliers Short form Electronic Onboarding & Automated Underwriting Payment Processing VCard, BIP, Dynamic Discount EFT Simplifying Buyer / Supplier Transactions (2) CPX Overview CPX: Transforming & Monetizing Through Automation (1) PayStream Advisors. (2) Refer to following page for detailed CPX payment process flow. 14 COMPANY OVERVIEW

Vortex UI Layer Detailed CPX Process Flow Buyer ERP System Con s o l i d a ted Payment File CPX Gateway ACH / Dynamic Discounting Ch e c k Virtual Card Supplier Initiated Buyer Initiated (Networks) VISA / MC Settl e ment CPX Settl e ment CPX Settl e ment Print / Pos tag e / Ma i l Settlement R epository Access Repository CPX D i re c t MERCHANTS / SUPPLIERS CPX CAN BE DELIVERED AS A COMPLETE SOLUTION OR AN ENHANCEMENT TO AN EXISTING PAYMENT PROCESS Buyer / Supplier Portal Reconciliation & Reporting 15 COMPANY OVERVIEW
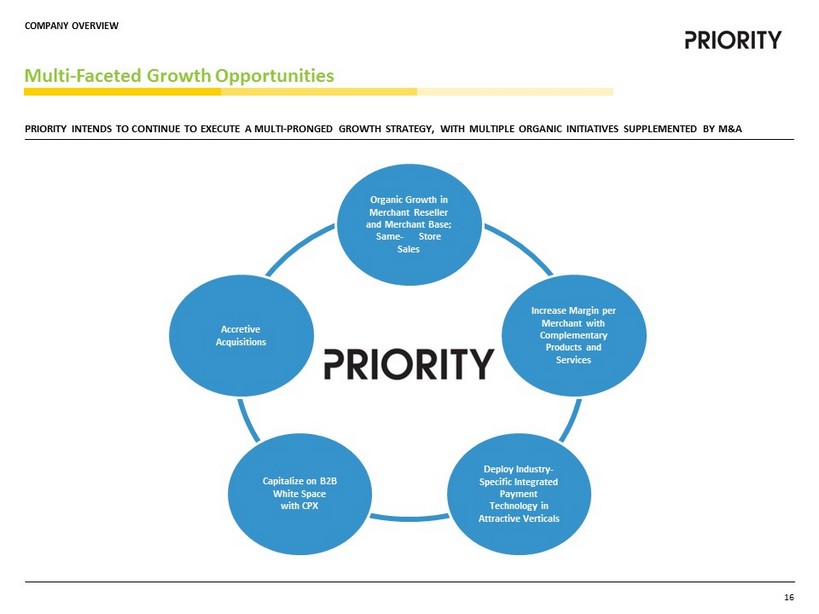
Multi - Faceted Growth Opportunities Organic Growth in Merchant Reseller and Merchant Base; Same - Store Sales Capitalize on B2B White Space with CPX Deploy Industry - Specific Integrated Payment Technology in Attractive Verticals Accretive Acquisitions Increase Margin per Merchant with Complementary Products and Services PRIORITY INTENDS TO CONTINUE TO EXECUTE A MULTI - PRONGED GROWTH S TRATEGY, WITH MULTIPLE ORGANIC INITIATIVES SUPPLEMENTED BY M&A 16 COMPANY OVERVIEW

Accretive Acquisition Strategy PRIORITY INTENDS TO SELECTIVELY PURSUE STRATEGIC AND TACTICAL AC QUISITIONS THAT MEET CERTAIN CRITERIA, WITH A CONSISTENT, LONG - TERM GOAL OF MAXIMIZING SHAREHOLDER VALUE; THE VORTEX CLOUD WAS PURPOSE BUILT TO RAPIDLY AND SEAMLESSLY CONSOLIDATE COMPLEMENTARY BUSINESSES Acquisition Target Categories Acquisition Criteria Integrated Payments Vertical & Horizontal Software B2B Payments Scale + Accretive to revenue growth + Accretive to cash EPS + Predictable, recurring revenue + Scalable, leverageable + Low capital intensity / high cash conversion + Complementary technology offerings + Strong chemistry / cultural fit Innovative Products / Technology Opportunistic / Financial Vortex Common Platform 17 COMPANY OVERVIEW

Technology Holdings 3. INDUSTRY OVERVIEW

Strong Industry Tailwinds Drive Continued Growth for Consumer Payments Paper Cards Electronic $8TN 36% 51% 13% 2011 $10TN 2016 25% 61% 14% $12TN 17% 69% 14% 2021 Historical & Projected Payment Type % (1) Customer Segmentation of the Merchant Acquiring Industry (2) Micro Small Mega Large Mid - Size $1,562 $750 $462 $350 <$300 $0.5 $1.1 $2.3 $3.6 <$2.2 125 50K 185K 7,000K 20,000K Merchant Size Est. Credit/Debit Value ($BN) Est. # of Businesses Est. Merchant Acquirer Net Rev ($BN) (1) The Nilson Report, December 2017. (2) First Annapolis. WE BELIEVE THE SHIFTING PAYMENT LANDSCAPE FROM CASH AND CHECKS T O CARD - BASED PAYMENTS COUPLED WITH GROWTH OF THE SMALL AND MID - S IZE MERCHANT SEGMENT PROVIDES STRONG TAILWINDS FOR PRIORITY Continued Shift from Cash to Credit Large Addressable End - Market 18 INDUSTRY OVERVIEW
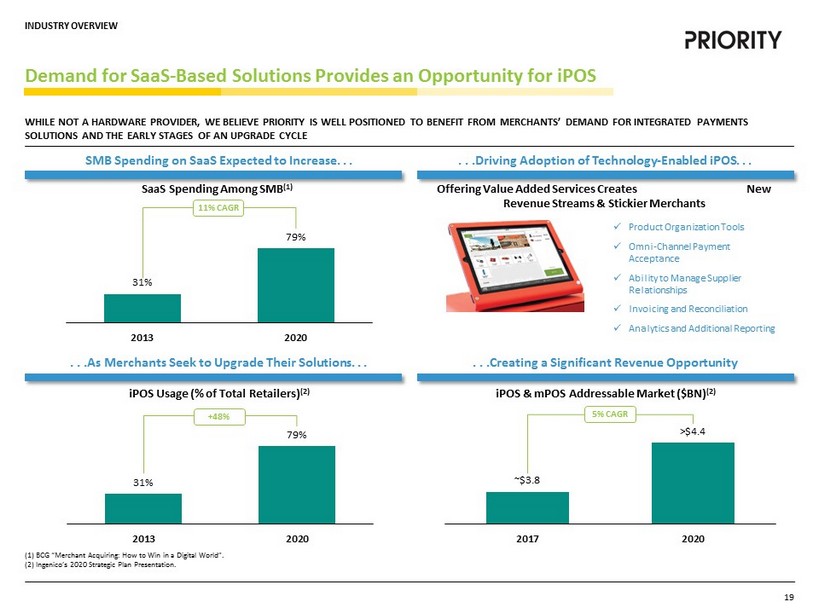
31% 79% 2013 2020 31% 79% 2013 2020 ~$3.8 >$4.4 2017 2020 . . .Creating a Significant Revenue Opportunity Demand for SaaS - Based Solutions Provides an Opportunity for iPOS (1) BCG “Merchant Acquiring: How to Win in a Digital World”. (2) Ingenico’s 2020 Strategic Plan Presentation. Offering Value Added Services Creates New Revenue Streams & Stickier Merchants x Product Organization Tools x Omni - Channel Payment Acceptance x Ability to Manage Supplier Relationships x Invoicing and Reconciliation x Analytics and Additional Reporting 5 % CAGR iPOS Usage (% of Total Retailers ) (2) iPOS & mPOS Addressable Market ($BN ) (2) SaaS Spending Among SMB (1) WHILE NOT A HARDWARE PROVIDER, WE BELIEVE PRIORITY IS WELL POSIT IONED TO BENEFIT FROM MERCHANTS’ DEMAND FOR INTEGRATED PAYMENTS SOLUTIONS AND THE EARLY STAGES OF AN UPGRADE CYCLE SMB Spending on SaaS Expected to Increase. . . . . .Driving Adoption of Technology - Enabled iPOS. . . . . .As Merchants Seek to Upgrade Their Solutions. . . +48% 11% CAGR 19 INDUSTRY OVERVIEW

81% 74% 67% 50% 51% 0% 20% 40% 60% 80% 100% 2004 2007 2010 2013 2016 $16.5 $23.1 2014 2020 B2B PAYMENTS IS THE LARGEST PAYMENT MARKET IN THE U.S. AND PRESE NT A SIGNIFICANT REVENUE OPPORTUNITY FOR PROVIDERS TO CONVERT CH ECK TO ELECTRONIC PAYMENTS, INCLUDING CARD - BASED B2B Payments Presents a Significant Revenue Opportunity (1) Business Insider: “THE B2B PAYMENTS EXPLAINER: Why business payments have been slow to digitize, and what's changing that in 2017.” (2) Deloitte “B2B payments market is a significant untapped opportunity.” Organization’s B2B Payments Made by Check (1) B2B Payment Volume ($TN) (2) U.S. Payment Market Size (1) B2B $18TN B2C $9TN C2C $709BN Despite an increase in electronic payments, 51% of B2B volume is still paid via check • B2B payments present a vast opportunity for payment providers at ~2x the size of B2C payments • With businesses looking for efficiency and cost - savings, electrification of B2B payments has gained momentum • B2B payments represent one of the fastest - growing markets in the U.S. • Domestic B2B Payments makes up nearly 75% of the market with cross - boarder payments accounting for the remaining 25% of payments • The largest opportunity is large businesses with more than $1BN in revenue • Nearly 51% of B2B volume is still paid via check • This is due to the complex and cumbersome process such as invoicing , delayed payment terms and multiple banks / platforms • Companies with the ability to eliminate this friction will be best positioned to benefit B2B Leads Total Payment Volume. . . . . . Continues to Grow. . . . . .and Represents Opportunity for Disruption 5.8% CAGR 20 INDUSTRY OVERVIEW

Technology Holdings 4. TRANSACTION OVERVIEW

91.0% 8.0% 1.0% Priority Equityholders M I Public Shareholders M I Sponsors Sources & Uses (1) Based on fully diluted shares outstanding; inclusive of 5.3m MACQ shares and 1.2m net founder shares. Excludes outstandin g o ut - of - the money warrants exercisable at a share price of $11.50 per share, 300,000 unit purchase option exercisable at a share price of $12.00 per share and Thomas Priore’s call option on all or a portion of M I Sponsor shares post - close . (2) Assumes no redemptions from cash in trust by M I’s existing shareholders and includes all in - the - money options and warrants. Actual results may differ. (3) Excludes shares contingent upon earn - out thresholds being met. (4) Includes $9.0m of additional EBITDA from identified acquisitions; see pages 28 & 29 for Pro Forma Adj. EBITDA bridge. (5) Projected cash and debt balances at close. (6) Anticipated initial enterprise value based on cash in trust price of $10.30 per share (not including interest earned on the t rus t account and any funds deposited in the trust account to extend the time M I has to complete a business combination) and expected cash and debt balances at close . Transaction Detail ($mm) (1,2,3,4,5,6) Cash Sources & Uses ($mm) (2,5) Pro Forma Ownership (1,2,3) • Pro Forma Enterprise Value of $1.0bn and EV / 2018 Pro Forma Adj. EBITDA of 12.5x • Priority equityholders will roll 100% of their equity Share Price $10.30 ( x ) Total Shares Outstanding 66.7 Equity Value $687.5 (+) Priority Existing Debt at Close 351.1 (-) Pro Forma Cash (35.7) Enterprise Value $1,003.0 Priority 2018E Pro Forma Adj. EBITDA $80.2 Priority 2019E Pro Forma Adj. EBITDA $88.4 2018 Pro Forma Adj. EBITDA Multiple 12.5x Net Debt / 2018 Pro Forma Adj. EBITDA 3.9x 2019 Pro Forma Adj. EBITDA Multiple 11.4x Net Debt / 2019 Pro Forma Adj. EBITDA 3.6x Sources M I Cash In Trust $55.1 Existing Cash on Balance Sheet 19.9 Total Sources $75.0 Uses Identified Acquisitions $25.0 Transaction Fees & Expenses 14.4 Cash to Balance Sheet 35.7 Total Uses $75.0 21 TRANSACTION OVERVIEW

12.5x 11.0x 16.3x 14.5x 16.3x PPS FDC GPN TSS WP Valuation Benchmarking Priority’s 12.5x multiple represents a ~19% discount to the peer median of 15.4x EV / 2018E Adj . EBITDA Valuation Highlights Source: Capital IQ as of 2/23/2018. Note: Priority’s Adj. EBITDA includes anticipated impact of $9m of identified acquisitions. Attractive Growth Profile Strong Visibility Differentiated Margin Profile Consistent Cash Conversion • Estimates 2015 - 2019E net revenue and adj. EBITDA CAGR of 12% and 19%, respectively • Recurring transaction / volume - based revenue • Minimal historical losses and strong merchant retention • Estimated 45%+ 2018 pro forma adj. EBITDA margin • 90%+ free cash flow conversion 22 TRANSACTION OVERVIEW

21.3% 15.3% 36.7% 8.6% 17.8% 10.8% 15.1% PPS FDC GPN TSS WP 8.9% 4.4% 8.5% 7.0% 8.0% 6.0% 1.4% 3.6% 3.0% 3.1% 14.9% 5.8% 12.1% 10.0% 11.1% PPS FDC GPN TSS WP Organic Inorganic 2017A – 2018E Net Revenue Organic & Inorganic Growth (1,2) Operational Benchmarking Source: Capital IQ and Wall Street Research. Note: FDC, GPN, TSS not pro forma for acquisitions; WP pro forma for VNTV & WP merger. (1) TSS organic growth represents its Merchant Services segment; FDC organic growth represents its Global Business Solutions segm ent ; WP organic growth represents VNTV pre - merger with WorldPay. (2) Priority’s 2018E Adj. EBITDA and Net Revenue include the anticipated impact of $9m of identified acquisitions. (3) See pages 28 & 29 for pro forma adj. EBITDA bridge. Total Peer Median: 10.6% 2017A – 2018E Adj . EBITDA Growth (2,3) Peer Median 13.0% Organic Peer Median: 7.5% Includes anticipated impact of $9m of identified acquisitions Includes anticipated impact of $9m of identified acquisitions 23 TRANSACTION OVERVIEW
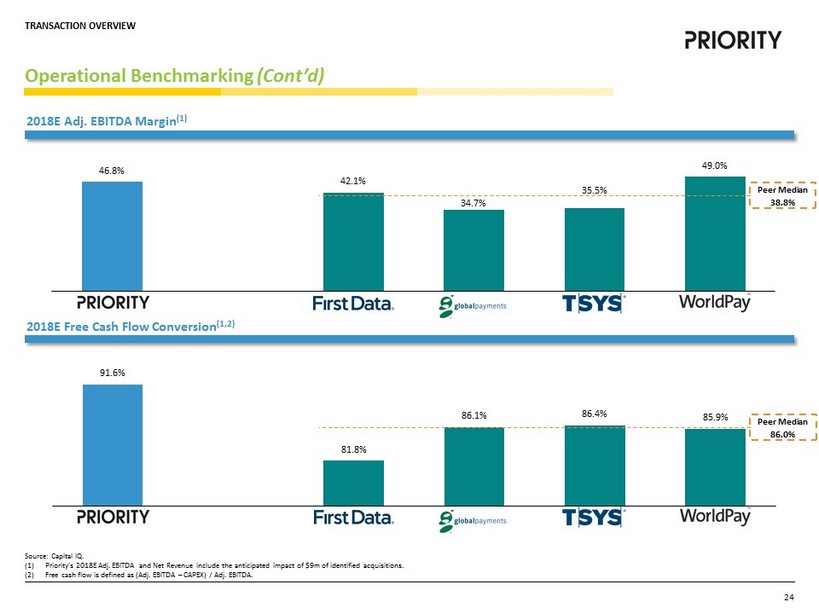
2018E Free Cash Flow Conversion (1,2 ) 91.6% 81.8% 86.1% 86.4% 85.9% PPS FDC GPN TSS WP 46.8% 42.1% 34.7% 35.5% 49.0% PPS FDC GPN TSS WP Operational Benchmarking (Cont’d) Source: Capital IQ. (1) Priority’s 2018E Adj. EBITDA and Net Revenue include the anticipated impact of $ 9m of identified acquisitions. (2) Free cash flow is defined as (Adj. EBITDA – CAPEX) / Adj. EBITDA. Peer Median 38.8% Peer Median 86.0% 2018E Adj. EBITDA Margin (1) 24 TRANSACTION OVERVIEW

Technology Holdings 5. FINANCIAL OVERVIEW

$162.5 $9.0 $116.6 $130.4 $149.3 $171.5 $186.5 2015A 2016A 2017A 2018E 2019E $71.2 $9.0 $43.4 $51.9 $58.7 $80.2 $88.4 2015A 2016A 2017A 2018E 2019E Historical & Forecasted Financials - Consolidated (1) Net revenue = gross revenue less interchange, network and association fees and residual and commission expenses. (2) See pages 28 & 29 for pro forma adj. EBITDA bridge. Adj. EBITDA (2) Net Revenue (1) ($ millions) ($ millions) 19% CAGR 12% CAGR Includes anticipated impact of $9m of identified acquisitions Includes anticipated impact of $9m of identified acquisitions 25 FINANCIAL OVERVIEW

$78.3 $84.6 $96.9 $103.3 $109.8 75% 74% 74% 74% 73% 0% 20% 40% 60% 80% 100% 120% 2015A 2016A 2017A 2018E 2019E $0.0 $20.0 $40.0 $60.0 $80.0 $100.0 $120.0 Gross Profit % Net Revenue $42.1 $48.9 $56.4 $65.2 $69.7 40% 43% 43% 47% 46% 0% 25% 50% 75% 100% $0.0 $20.0 $40.0 $60.0 $80.0 2015A 2016A 2017A 2018E 2019E EBITDA % Net Revenue $105.1 $113.7 $130.8 $140.1 $149.8 2015A 2016A 2017A 2018E 2019E $27.1 $30.3 $34.5 $39.0 $43.1 2015A 2016A 2017A 2018E 2019E Organic Inorganic Historical & Forecasted KPIs – Consumer (1) Organic volume represents all volume generated on Priority platforms; Non - Organic volume represents merchants acquired through p urchase (active and open pre - acquisition). (2) Net revenue = gross revenue less interchange, network and association fees and residual and commission expenses. (3) Priority’s 2018E Net Revenue, Gross Profit and Adj. EBITDA excludes the anticipated impact of $9m of identified acquisitions . Processing Volume (1) Consumer Payments Net Revenue (2,3) ($ millions) 9 % CAGR ($ millions) ($ millions) Gross Profit and Gross Margin Adj. EBITDA and Margin (3) 9 % CAGR 13% CAGR ($ billions) 12% CAGR 26 FINANCIAL OVERVIEW
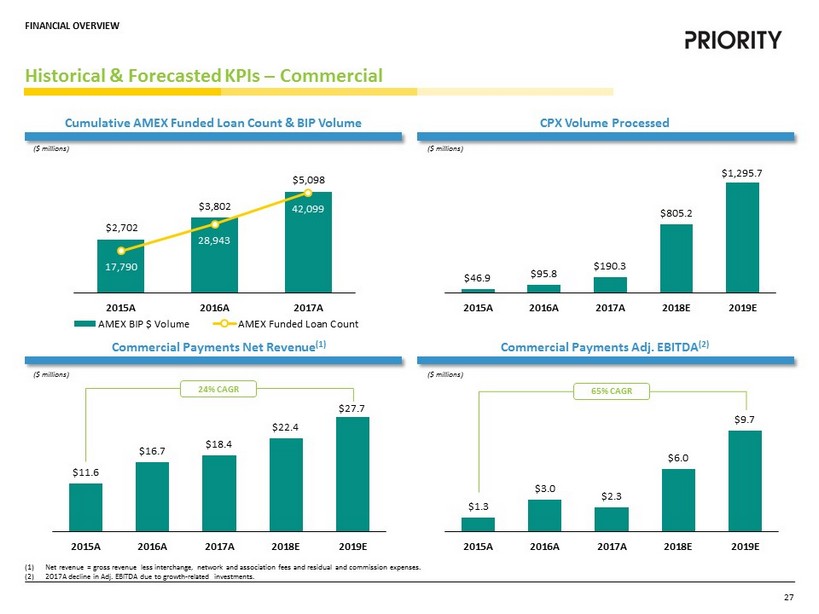
$1.3 $3.0 $2.3 $6.0 $9.7 2015A 2016A 2017A 2018E 2019E $11.6 $16.7 $18.4 $22.4 $27.7 2015A 2016A 2017A 2018E 2019E Historical & Forecasted KPIs – Commercial Cumulative AMEX Funded Loan Count & BIP Volume CPX Volume Processed ($ millions) Commercial Payments Net Revenue (1) Commercial Payments Adj. EBITDA (2) ($ millions) ($ millions) 24% CAGR $2,702 $3,802 $5,098 17,790 28,943 42,099 0 10,000 20,000 30,000 40,000 50,000 $- $1,000 $2,000 $3,000 $4,000 $5,000 $6,000 2015A 2016A 2017A AMEX BIP $ Volume AMEX Funded Loan Count $46.9 $95.8 $190.3 $805.2 $1,295.7 2015A 2016A 2017A 2018E 2019E ($ millions) (1) Net revenue = gross revenue less interchange, network and association fees and residual and commission expenses . (2) 2017A decline in Adj. EBITDA due to growth - related investments. 65% CAGR 27 FINANCIAL OVERVIEW

Technology Holdings 6. APPENDIX
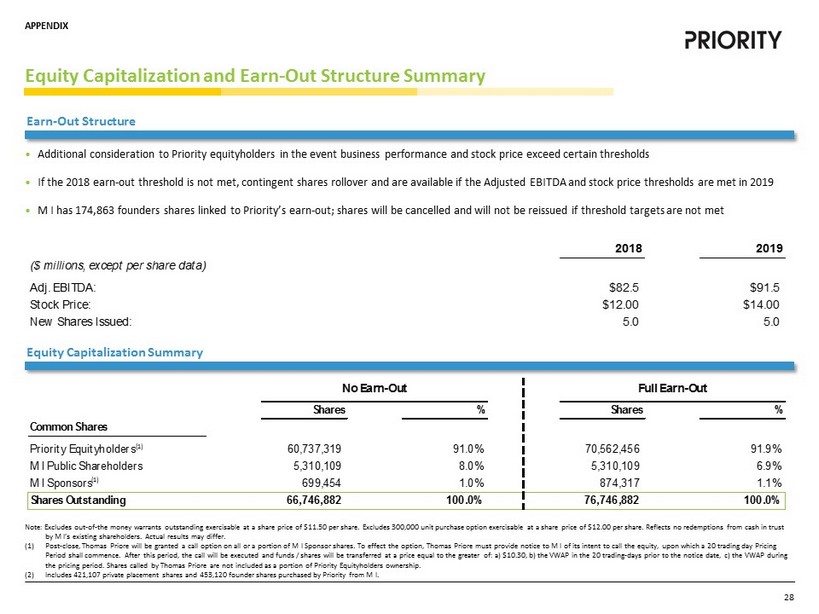
No Earn-Out Full Earn-Out Shares % Shares % Common Shares Priority Equityholders 60,737,319 91.0% 70,562,456 91.9% M I Public Shareholders 5,310,109 8.0% 5,310,109 6.9% M I Sponsors 699,454 1.0% 874,317 1.1% Shares Outstanding 66,746,882 100.0% 76,746,882 100.0% Equity Capitalization and Earn - Out Structure Summary Note: Excludes out - of - the money warrants outstanding exercisable at a share price of $11.50 per share. Excludes 300,000 unit pur chase option exercisable at a share price of $12.00 per share. Reflects no redemptions from cash in trust by M I’s existing shareholders. Actual results may differ. (1) Post - close, Thomas Priore will be granted a call option on all or a portion of M I Sponsor shares. To effect the option, Thomas Priore must provide notice to M I of its intent to call the equity, upon which a 20 trading day Pricing Period shall commence. After this period, the call will be executed and funds / shares will be transferred at a price equal t o t he greater of: a) $10.30, b) the VWAP in the 20 trading - days prior to the notice date, c) the VWAP during the pricing period. Shares called by Thomas Priore are not included as a portion of Priority Equityholders ownership. (2) Includes 421,107 private placement shares and 453,120 founder shares purchased by Priority from M I. (1) Earn - Out Structure • Additional consideration to Priority equityholders in the event business performance and stock price exceed certain threshold s • If the 2018 earn - out threshold is not met, contingent shares rollover and are available if the Adjusted EBITDA and stock price t hresholds are met in 2019 • M I has 174,863 founders shares linked to Priority’s earn - out; shares will be cancelled and will not be reissued if threshold ta rgets are not met 2018 2019 ($ millions, except per share data) Adj. EBITDA: $82.5 $91.5 Stock Price: $12.00 $14.00 New Shares Issued: 5.0 5.0 Equity Capitalization Summary (1) 28 APPENDIX

Pro Forma Adj. EBITDA Bridge 2017A – 2018E Pro Forma Adj. EBITDA Bridge ($ millions) $52.0 $58.7 $61.5 $80.2 $6.7 $2.8 $9.7 $9.0 29 APPENDIX
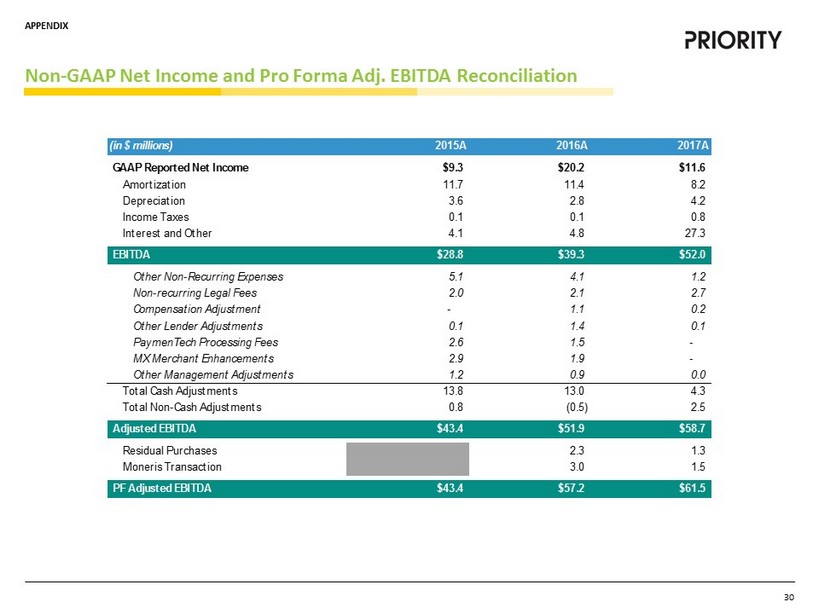
Non - GAAP Net Income and Pro Forma Adj. EBITDA Reconciliation (in $ millions) 2015A 2016A 2017A GAAP Reported Net Income $9.3 $20.2 $11.6 Amortization 11.7 11.4 8.2 Depreciation 3.6 2.8 4.2 Income Taxes 0.1 0.1 0.8 Interest and Other 4.1 4.8 27.3 EBITDA $28.8 $39.3 $52.0 Other Non-Recurring Expenses 5.1 4.1 1.2 Non-recurring Legal Fees 2.0 2.1 2.7 Compensation Adjustment - 1.1 0.2 Other Lender Adjustments 0.1 1.4 0.1 PaymenTech Processing Fees 2.6 1.5 - MX Merchant Enhancements 2.9 1.9 - Other Management Adjustments 1.2 0.9 0.0 Total Cash Adjustments 13.8 13.0 4.3 Total Non-Cash Adjustments 0.8 (0.5) 2.5 Adjusted EBITDA $43.4 $51.9 $58.7 Residual Purchases 2.3 1.3 Moneris Transaction 3.0 1.5 PF Adjusted EBITDA $43.4 $57.2 $61.5 30 APPENDIX

Q & A