Attached files
| file | filename |
|---|---|
| EX-32.1 - EXHIBIT 32.1 - GIBRALTAR INDUSTRIES, INC. | q42017exhibit321.htm |
| EX-32.2 - EXHIBIT 32.2 - GIBRALTAR INDUSTRIES, INC. | q42017exhibit322.htm |
| EX-31.2 - EXHIBIT 31.2 - GIBRALTAR INDUSTRIES, INC. | q42017exhibit312.htm |
| EX-31.1 - EXHIBIT 31.1 - GIBRALTAR INDUSTRIES, INC. | q42017exhibit311.htm |
| EX-23.1 - EXHIBIT 23.1 - GIBRALTAR INDUSTRIES, INC. | q42017exhibit231-eyconsent.htm |
| EX-21 - EXHIBIT 21 - GIBRALTAR INDUSTRIES, INC. | q42017exhibit21.htm |
UNITED STATES SECURITIES AND EXCHANGE COMMISSION
Washington, D.C. 20549

FORM 10-K
x | ANNUAL REPORT PURSUANT TO SECTION 13 OR 15 (d) OF THE SECURITIES ACT OF 1934 |
For the fiscal year ended December 31, 2017 | |
OR | |
¨ | TRANSITION REPORT PURSUANT TO SECTION 13 OR 15 (d) OF THE SECURITIES EXCHANGE ACT OF 1934 |
For the transition period from to | |
Commission File Number 0-22462 | |
GIBRALTAR INDUSTRIES, INC.
(Exact name of Registrant as specified in its charter)
Delaware | 16-1445150 | |
(State or other jurisdiction of incorporation organization) | (I.R.S. Employer Identification No.) | |
3556 Lake Shore Road, P.O. Box 2028 Buffalo, New York | 14219-0228 | |
(address of principal executive offices) | (zip code) | |
Registrant’s telephone number, including area code: (716) 826-6500 | ||
Securities registered pursuant to Section 12(b) of the Act: | ||
Title of each class | Name of each exchange on which registered | |
Common Stock, $0.01 par value | NASDAQ Global Select Market | |
Securities registered pursuant to Section 12(g) of the Act: NONE
Indicate by checkmark if the registrant is a well-known seasoned issuer, as defined in Rule 405 of the Securities Act. Yes ¨ No x.
Indicate by checkmark if the registrant is not required to file report pursuant to Section 13 or Section 15(d) of the Act. Yes ¨ No x.
Indicate by check mark whether the registrant (1) has filed all reports required to be filed by Section 13 or 15(d) of the Securities Exchange Act of 1934 during the preceding 12 months (or for such shorter period that the registrant was required to file such reports), and (2) has been subject to such filing requirements for the past 90 days. Yes x No ¨.
Indicate by check mark whether the registrant has submitted electronically and posted on its corporate Website, if any, every Interactive Data File required to be submitted and posted pursuant to Rule 405 of Regulation S-T (§232.405 of this chapter) during the preceding 12 months (or for such shorter period that the registrant was required to submit and post such files). Yes x No ¨.
Indicate by check mark if disclosure of delinquent filers pursuant to Item 405 of Regulation S-K is not contained herein, and will not be contained, to the best of the Registrant’s knowledge, in definitive proxy or information statements incorporated by reference in Part III of the Form 10-K or any amendment to this Form 10-K. ¨
Indicate by checkmark whether the registrant is a large accelerated filer, an accelerated filer, a non-accelerated filer, a smaller reporting company, or an emerging growth company. See the definition of “large accelerated filer”, “accelerated filer”, “small reporting company”, and "emerging growth company" in Rule 12b-2 of the Exchange Act.
If an emerging growth company, indicate by check mark if the registrant has elected not to use the extended transition period for complying with any new or revised financial accounting standards provided pursuant to Section 13(a) of the Exchange Act. ¨
Large accelerated filer | x | Accelerated filer | ¨ | Non-accelerated filer | ¨ | Smaller reporting company | ¨ | Emerging growth company | ¨ |
Indicate by checkmark whether the registrant is a shell company (as defined in Rule 12b-2 of the Act). Yes ¨ No x
The aggregate market value of the Common Stock outstanding and held by non-affiliates (as defined in Rule 405 under the Securities Act of 1933) of the registrant based upon the closing sale price of the Common Stock on the NASDAQ Global Select Market on June 30, 2017, the last business day of the registrant’s most recently completed second quarter, was approximately $1.1 billion.
As of February 23, 2018, the number of common shares outstanding was: 31,748,874
DOCUMENTS INCORPORATED BY REFERENCE
Portions of the Registrant’s Definitive Proxy Statement to be filed for its Annual Meeting of Shareholders
are incorporated by reference into Part III of this Annual Report on Form 10-K.
Form 10-K Index
Page Number | ||
Item 1 | ||
Item 1A | ||
Item 1B | ||
Item 2 | ||
Item 3 | ||
Item 4 | ||
Item 5 | ||
Item 6 | ||
Item 7 | ||
Item 7A | ||
Item 8 | ||
Item 9 | ||
Item 9A | ||
Item 10 | ||
Item 11 | ||
Item 12 | ||
Item 13 | ||
Item 14 | ||
Item 15 | ||
2
Safe Harbor Statement
Certain information set forth herein includes statements that express our opinions, expectations, beliefs, plans, objectives, assumptions or projections regarding future events or future results and, therefore, are, or may be deemed to be, “forward-looking statements.” These forward-looking statements can generally be identified by the use of forward-looking terminology, including the terms “believes,” “estimates,” “anticipates,” “expects,” “seeks,” “projects,” “intends,” “plans,” “may,” “will” or “should” or, in each case, their negative or other variations or comparable terminology. These forward-looking statements include all matters that are not historical facts. They include statements regarding our intentions, beliefs or current expectations concerning, among other things, our results of operations, financial condition, liquidity, prospects, growth, competition, strategies and the industries in which we operate. By their nature, forward-looking statements involve risks and uncertainties because they relate to events and depend on circumstances that may or may not occur in the future. We believe that these risks and uncertainties include, but are not limited to, those described in Item 1A “Risk Factors.” Those factors should not be construed as exhaustive and should be read with the other cautionary statements in Item 1A “Risk Factors.” Although we base these forward-looking statements on assumptions that we believe are reasonable when made, we caution you that forward-looking statements are not guarantees of future performance and that our actual results of operations, financial condition and liquidity and the development of the industries in which we operate may differ materially from those made in or suggested by the forward-looking statements contained herein. In addition, even if our results of operations, financial condition and liquidity and the development of the industries in which we operate are consistent with the forward-looking statements contained in this document, those results or developments may not be indicative of results or developments in subsequent periods. Given these risks and uncertainties, you are cautioned not to place undue reliance on these forward-looking statements. Any forward-looking statements that we make herein speak only as of the date of those statements, and we undertake no obligation to update those statements or to publicly announce the results of any revisions to any of those statements to reflect future events or developments. Comparisons of results for current and any prior periods are not intended to express any future trends or indications of future performance, unless expressed as such, and should only be viewed as historical data.
PART I
Item 1. | Business |
The Company
Gibraltar Industries, Inc. (the "Company") is a leading manufacturer and distributor of building products for residential, industrial, infrastructure, renewable energy and conservation markets. Our business strategy focuses on significantly elevating and accelerating the growth and financial returns of the Company. We strive to deliver best-in-class, sustainable value creation for our shareholders for the long-term. We believe this can be achieved from a transformational change in the Company’s portfolio and its financial results. Our business strategy has four key elements, or "pillars," which are: operational excellence, product innovation, portfolio management, and acquisitions as a strategic accelerator.
Operational excellence is our first pillar in this strategy. 80/20 simplification ("80/20") is a core part of the operational excellence pillar and is based on the analysis that 25% of the customers typically generate 89% of the revenue in a business, and 150% of the profitability. Through the application of data analysis generated by 80/20 practice, we are focusing on our largest and best opportunities (the “80”) and eliminating complexity associated with less profitable opportunities (the “20”) in order to generate more earnings year over year, at a higher rate of return with a more efficient use of capital.
We have recently completed the third year of our multi-year simplification initiative. Since initiation of 80/20 in 2015, we have generated operating margin improvements from 80/20 simplification initiatives and have exceeded our initial five-year target ending 2019 of $25 million of pre-tax savings. We are currently in the middle innings of this 80/20 initiative, which means that there is both more work and more opportunity ahead. We are targeting greater structural changes affecting the balance sheet. We are starting the follow-on management tools of in-lining our manufacturing processes linked with market-rate-of-demand replenishment tools. These follow-on tools are focused on process manufacturing the highest-volume products for our largest customers, and on a much higher level of capacity utilization. We expect these methods will yield additional benefits including lower manufacturing costs, lower inventories and fixed assets, and an even higher level of service to customers.
Product innovation is our second strategic pillar. Innovation is centered on the allocation of new and existing resources to opportunities that we believe will produce sustainable returns. Our focus is on driving top line growth with new and innovative products. We are focused on those products and technologies that have relevance to the end-user and can be differentiated from our competition. Our initiatives will be tailored toward reallocating sales and marketing talent to target specific end user groups in order to better understand their needs and the various market opportunities that may be available. This effort is
3
expected to produce ideas and opportunities that generate profitable growth. Our focus on innovation is centered on four markets: postal and parcel products, residential air management, infrastructure and renewable energy. These respective markets are expected to grow based on demand for: centralized mail and parcel delivery systems; zero carbon footprint homes; the need for repairs to elevated bridges that are deficient or functionally obsolete; and energy sources not dependent on fossil fuels.
The third pillar of our strategy is portfolio management, which is a natural adjunct to the 80/20 initiative. Using the 80/20 process, we conduct strategic reviews of our customers and end markets, and allocate leadership time, capital and resources to the highest-potential platforms and businesses. During 2016, we sold our European industrial manufacturing business to a third party and initiated the divestitures of our small European residential solar racking business and U.S. bar grating product line, both of which proceeded as planned and are essentially complete. These portfolio changes have helped contribute to the Company's realization of a higher rate of return on invested capital in both 2017 and 2016. We have now acted on all near-term portfolio assessments. While we do not have any planned activities in the near future, we view portfolio management as a continuous process that will remain an important part of our strategy as we look to improve Gibraltar's long-term financial performance.
The fourth pillar of our strategy is acquisitions. We have targeted four key markets in which to make strategic acquisitions which are served by existing platforms within the Company. The existing platforms include the same areas in which we are targeting the development of innovative products: postal, parcel and storage solutions; infrastructure; residential air management; and renewable energy. These platforms are all in large markets in which the underlying trends for customer convenience and safety, energy-savings and resource conservation are of increasing importance and are expected to drive long-term demand. We believe these markets also offer the opportunity for higher returns on our investments than those we have generated in the past. The acquisitions of Rough Brothers Manufacturing, Inc., RBI Solar, Inc., and affiliates, collectively known as "RBI" in June 2015 and more recently, Nexus Corporation ("Nexus") in October 2016 and Package Concierge in February 2017, were the direct result of this fourth pillar strategy. We also consider businesses outside of these four markets, as we continually search out opportunities to grow our business in large markets with expected growth in demand for the foreseeable future, where we can add value through our manufacturing expertise, 80/20 process and purchasing synergies.
The Company serves customers primarily throughout North America and, to a lesser extent, Asia. Our customers include major home improvement retailers, wholesalers, industrial distributors, contractors, solar developers and institutional and commercial growers of plants. As of December 31, 2017, we operated 42 facilities, comprised of 30 manufacturing facilities, six distribution centers, and six offices, which are located in 17 states, Canada, China, and Japan. These facilities give us a base of operations to provide customer support, delivery, service and quality to a number of regional and national customers and providing us with manufacturing and distribution efficiencies in North America, as well as a presence in the Asian markets.
The Company operates and reports its results in the following three reporting segments:
• | Residential Products; |
• | Industrial and Infrastructure Products; and |
• | Renewable Energy and Conservation |
The following table sets forth the primary products, applications, and end markets for each segment:
Residential Products Segment
Product | Applications | End Market | ||||
Roof and foundation ventilation products | Ventilation and whole-house air flow |  | Residential: new construction and repair and remodeling | |||
Centralized mail systems and electronic package solutions | Secure storage for mail and package deliveries | |||||
Rain dispersion, trims and flashings, other accessories | Water protection; sun protection | |||||
4
Industrial and Infrastructure Products Segment
Product | Applications | End Market | ||
Fabricated expanded metal and perforated metal products | Perimeter security barriers; walkways / catwalks; filtration; architectural facades |  | Industrial and commercial construction, automotive, energy and power generation | |
Structural bearings, expansion joints and pavement sealant for bridges and roadways | Preserve functionality under varying weight, wind, temperature and seismic conditions | Bridge and elevated highway construction, airport pavements | ||
Renewable Energy and Conservation Segment
Product | Applications | End Users | ||
Solar racking systems: design, engineer, manufacture and installation | Small scale commercial solar installations |  | Solar developers; power companies; solar energy EPC contractors | |
Greenhouses: design, engineer, manufacture and installation | Retail, commercial, institutional and conservatories | Retail garden centers; conservatories and botanical gardens; commercial growers; public and private agricultural research | ||
We believe our operating segments have established reputations as industry leaders with respect to quality, service and innovation and have achieved strong competitive positions in our markets. We attribute their competitive standing in the markets primarily to the following strengths:
Leading market share. We have a leading market position in many of the products and services we offer, and we estimate that a majority of our net sales for the year ended December 31, 2017 were derived from the sale of products in which we had one of the leading U.S. market shares. We believe we have leading market shares in five distinct product families: roof-related ventilation; postal and parcel storage; structural bearings and expansion joints for bridges and other structures; institutional and retail greenhouses; and fixed-tilt ground mount racking for photovoltaic (PV) solar systems.
Provider of value-added products and related services. We increasingly focus on providing innovative value-added products and related services, such as centralized mail systems and electronic package solutions, expansion joints and structural bearings for roadways and bridges, roof and foundation ventilation products, solar racking systems, and greenhouses which can solve end customer needs while also helping to improve our margins and profitability. Our products use complex and demanding production and treatment processes that require advanced production equipment, sophisticated technology and exacting quality control measures, along with specialized design and engineering skills. We also focus our acquisition strategy on manufacturers offering engineered products and services in key growth markets.
Commitment to quality. Gibraltar’s quality management systems are designed to ensure that we meet the needs and desired level of excellence, of our customers and other stakeholders, while meeting statutory and regulatory requirements related to our products or services. Our policies, processes and procedures required for planning and execution, are based on the principles of: customer focus, leadership, engagement of people, process approach, improvement, evidence-based decision-making and relationship management.
Strong liquidity profile. We strive to manage our cash resources to ensure we have sufficient liquidity to support the seasonality of our businesses, potential downturns in economic activity, and to fund growth initiatives. During the years ended December 31, 2017 and 2016, we purchased Package Concierge for approximately $19 million and Nexus for approximately $24 million, respectively, funded by our cash on hand. Our liquidity as of December 31, 2017 was $511 million, including $222 million of cash and $289 million of availability under our revolving credit facility. We believe that our current low leverage and ample liquidity allow us to successfully manage our business, meet the demands of our customers, weather the cyclicality of certain end markets and take advantage of growth opportunities.
5
Recent developments
On February 22, 2017, the Company acquired all of the outstanding stock of Package Concierge for $19 million. The acquisition was financed through cash on hand. Package Concierge is a leading provider of multifamily electronic package delivery locker systems in the United States. The results of operations of Package Concierge have been included within the Company's Residential Products segment of the Company's consolidated financial statements from the date of acquisition.
On December 2, 2016, as part of its portfolio management initiative, the Company announced its intentions to exit its U.S. bar grating product line and its European residential solar racking business, within the Company’s Industrial and Infrastructure Products, and Renewable Energy and Conservation, segments, respectively. On February 6, 2017, the Company completed the sale of substantially all of its U.S. bar grating product line assets to a third party. In addition, the Company shut down the operations of its European residential solar racking business during the first quarter of 2017. These businesses contributed a combined $75 million in revenue and pre-tax operating losses of $6 million in 2016. This initiative resulted in the sale and closing of 3 facilities in 2017.
On October 11, 2016, the Company acquired all of the outstanding stock of Nexus for $24 million. The acquisition was financed through cash on hand. Nexus is a leading provider of commercial-scale greenhouses to customers in the United States. The results of operations of Nexus have been included within the Renewable Energy and Conservation segment of the Company's consolidated financial statements from the date of acquisition.
On April 15, 2016, the Company sold its European industrial manufacturing business to a third party for net of cash proceeds of $8 million. This business, which supplied expanded metal products for filtration and other applications, contributed $36 million in revenue to the Company's Industrial & Infrastructure Products segment in 2015 and had nearly break-even operating results. The divestiture of this business is in alignment with the Company's portfolio management assessments.
On June 9, 2015, the Company acquired RBI for $148 million. RBI is one of North America’s fastest-growing providers of solar racking solutions and is also one of the largest manufacturers of commercial greenhouses in the United States. RBI is a full service provider that designs, engineers, manufactures and installs solar racking systems for solar developers and power companies. In addition, RBI designs, engineers, manufactures and erects greenhouses for commercial, institutional and retail customers. The acquisition of RBI has enabled the Company to leverage its expertise in structural metals manufacturing, materials sourcing and logistics to help meet the growing demand for solar racking solutions. The results of RBI have been included in the Company’s consolidated financial results since the date of the acquisition. The acquisition was financed through cash on hand and short-term borrowings under our revolving credit facility.
Customers and Products
Our customers are located primarily throughout North America and, to a lesser extent, Asia. One customer, a home improvement retailer which purchases from both the Residential Products segment and Renewable Energy and Conservation segment, represented 12% of our consolidated net sales for 2017 and 11% for both 2016 and 2015. No other customer in any segment accounted for more than 10% of our consolidated net sales.
Our products are primarily distributed to our customers using common carriers. We maintain distribution centers that complement our manufacturing plants from which we ship products and ensure on-time delivery while maintaining efficiency within our distribution process. Our customers and product offerings by segment are described below.
Residential Products
Our Residential Products segment services the residential repair and remodeling and the housing construction markets in North America with products including roof and foundation ventilation products, centralized mail systems and electronic package solutions, out-door living products (retractable sun-shades), rain dispersion products and other roofing and related accessories. Our residential product offerings are sold through a number of sales channels including major retail home centers, building material wholesalers, building product distributors, buying groups, roofing distributors, residential contractors, and postal services distributors and providers. This segment operates 12 manufacturing facilities throughout the United States giving it a base of operations to provide manufacturing capability of high quality products, customer service, delivery and technical support to a broad network of regional and national customers across North America.
Our roof and foundation ventilation products and accessories include solar powered units. Our centralized mail and electronic package solutions include single mailboxes, cluster style mail and parcel boxes for single and multi-family housing and electronic package locker systems. Our remaining residential product offerings consist of roof edging and flashing, soffits and trim, drywall corner bead, metal roofing and accessories, rain dispersion products, including gutters and accessories, and exterior retractable awnings. Each of these product offerings can be sold separately or as part of a system solution.
6
Within our Residential Products businesses, we are constantly striving to improve our product/solution offerings by introducing new products, enhancing existing products, adapting to building code and regulatory changes, and providing new and innovative solutions to homeowners and contractors. New products introduced in recent years include adhesive roofing applications, electronic parcel lockers, roof top safety kits, chimney caps, heat trace coils, exterior, remote-controlled deck awnings for sun protection, and high-efficiency and solar-powered ventilation products. Our electronic parcel lockers and parcel room systems provide residents in multi-family communities a secure storage receptacle to handle both package deliveries and receipt of other delivered goods. Our ventilation and roof flashing products provide protection and extend the life of structures while providing a safer, healthier environment for residents. Our cluster box mail delivery products provide delivery cost savings to the postal service while offering secure storage for delivered mail and packages. Our building products are manufactured primarily from galvanized and painted steel, anodized and painted aluminum, and various resins.
Within our manufacturing facilities, we leverage significant production capabilities which allow us to process a wide range of metals and plastics for our residential products. Most of our production is completed using automatic roll forming machines, stamping presses, welding, paint lines, and injection molding equipment. We maintain our equipment according to a thorough preventive maintenance program allowing us to meet the demanding quality and delivery requirements of our customers. In some cases, the Company sources products from third-party vendors to optimize cost and quality in order to provide the very best and affordable solution for our customers.
Industrial and Infrastructure Products
Our Industrial and Infrastructure Products segment serves a variety of end markets such as industrial and commercial construction, highway and bridge construction, automotive, airports and energy and power generation through a number of sales channels including discrete and process manufacturers, steel fabricators and distributors, commercial and transportation contractors, and power generating utilities. Our Industrial and Infrastructure product offerings include perimeter security, expanded and perforated metal, plank grating, as well as, expansion joints and structural bearings for roadways and bridges. We operate 11 manufacturing facilities and 4 distribution centers throughout the United States and Canada giving us a base of operations to provide customer support, delivery, service, and quality to a number of regional and national customers, and providing us with manufacturing and distribution efficiencies in North America.
Our expanded and perforated metal and plank grating is used in walkways, catwalks, architectural facades, perimeter security barriers, shelving, and other applications where both visibility and security are necessary. Our fiberglass grating is used by our customers where high strength, light weight, low maintenance, corrosion resistance and non-conductivity are required. Our remaining product offerings in this segment includes expansion joint systems, bearing assemblies, and pavement sealing systems used in bridges, elevated highways, airport runways, and rail crossings.
We strive to improve our offerings of industrial and infrastructure products by introducing new products, enhancing existing products, adjusting product specifications to respond to commercial building code and regulatory changes, and providing additional solutions to original equipment manufacturers and contractors. New products introduced in recent years include customized perforated and expanded metal to penetrate a range of new markets such as architectural facades for buildings (museums, sports stadiums and retail outlets) and perimeter security barriers for protecting critical infrastructure. In addition, we have extended our transportation infrastructure products into new markets. For example, long-lasting pavement sealants for roadways are now being installed on airport runways, structural bearings for elevated highways and bridges have been installed on an offshore oil production platform, and corrosion-protection products for cable-suspension bridges are now marketed and sold internationally.
Our production capabilities allow us to process a wide range of metals necessary for manufacturing industrial products. Most of our production is completed using computer numerical control ("CNC") machines, shears, slitters, press brakes, milling, welding, and numerous automated assembly machines. We maintain our equipment according to a thorough preventive maintenance program, including in-house tool and die shops, allowing us to meet the demanding service requirements of many of our customers.
7
Renewable Energy and Conservation
The Renewable Energy and Conservation segment is primarily a designer and manufacturer of fully-engineered solutions for solar mounting systems and greenhouse structures. This segment offers a fully integrated approach to the design, engineering, manufacturing and installation of solar racking systems and commercial, institutional, and retail greenhouse structures servicing customers, such as solar owners and developers, retail garden centers, conservatories and botanical gardens, commercial growers, and schools and universities. We have 7 manufacturing facilities and 2 distribution centers and operate in the United States, China and Japan.
An integral part of each customer project is the fabrication of specifically designed metal structures for highly-engineered applications including: racking for ground-mounted solar arrays; carports that integrate solar PV panels; as well as commercial-scale greenhouses and other glass structures. Both the solar racking and greenhouse projects involve holding glass and plastic to metal and use the same raw materials including steel and aluminum. Most of our production is completed using CNC machines, roll forming machines, laser cutters and other fabrication tools. The structural metal components are designed, engineered, fabricated and installed in accordance with applicable structural steel and aluminum guidelines.
We strive to improve our offerings of products by introducing new products, enhancing existing products, adjusting product specifications to respond to commercial building codes and regulatory changes, and providing solutions to contractors and end users. New products introduced in recent years include metal framed canopy structures for car washes and pool enclosures, and solar racking systems for carports and canopies. Our car washes and canopy structures serve a market preference for light- transparent structures. Solar racking systems for carports serve as protection for cars from the effects of the sun and intense heat while providing a renewable energy resource. Similarly, solar racking systems installed on idle land, such as solid waste landfills, converts such land into a useful property by providing power generating capabilities.
Engineering and Technical Services
Our businesses employ engineers and other technical personnel to perform a variety of key tasks. These personnel staff fully-equipped, modern laboratories to support our operations. These laboratories enable us to verify, analyze, and document the physical, chemical, metallurgical, and mechanical properties of our raw materials and products. In addition, our engineering staff employs a range of drafting software to design highly specialized and technically precise products. In our Renewable Energy and Conservation segment, drawings are designed, signed and sealed by licensed engineers. Technical service personnel also work in conjunction with our sales force to determine the types of products and services that suit the particular needs of our customers.
Suppliers and Raw Materials
Our business is required to maintain sufficient quantities of raw material inventory in order to accommodate our customers’ short lead times. Accordingly, we plan our purchases to maintain raw materials at sufficient levels to satisfy the anticipated needs of our customers. We have implemented enterprise resource planning systems to better manage our inventory, forecast customer orders, enable efficient supply chain management, and allow for more timely counter-measures to changing customer demand and market conditions.
The primary raw materials we purchase are flat-rolled and plate steel, aluminum, and resins. We purchase flat-rolled and plate steel and aluminum at regular intervals on an as-needed basis, primarily from the major North American mills, as well as, a limited amount from domestic service centers and foreign steel importers. Substantially all of our resins are purchased from domestic vendors, primarily through distributors, with a small amount direct from manufacturers. Supply has historically been adequate from these sources to fulfill our needs. Because of our strategy to develop longstanding relationships in our supply chain, we have been able to adjust our deliveries of raw materials to match our required inventory positions to support our on-time deliveries to customers while allowing us to manage our investment in inventory and working capital. Management continually examines and improves our purchasing practices across our geographically dispersed facilities in order to streamline purchasing across similar commodities.
We purchase natural gas and electricity from suppliers in proximity to our operations.
Intellectual Property
We actively protect our proprietary rights by the use of trademark, copyright, and patent registrations. While we do not believe that any individual item of our intellectual property is material, we believe our trademarks, copyrights, and patents provide us with a competitive advantage when marketing our products to customers. We also believe our brands are well recognized in the markets we serve and we believe they stand for high-quality manufactured goods at a competitive price. These trademarks, copyrights, and patent registrations allow us to help maintain product leadership positions for the goods we offer.
8
Sales and Marketing
Our products and services are sold primarily by channel partners who are called on by our sales personnel and outside sales representatives located throughout the United States, Canada and Asia. We have organized sales teams to focus on specific customers and national accounts through which we provide enhanced supply solutions and improve our ability to increase the number of products that we sell. Our sales staff works with certain retail customers to optimize shelf space for our products which is expected to increase sales at these locations. Our sales regularly involve competitive bidding processes, and our reputation for meeting delivery time lines and strict specifications make us a preferred provider for many customers.
We focus on providing our customers with industry leading customer service. Our retail customers are provided with point-of-sale marketing aids to encourage consumer spending on our products in their stores. Continual communication with our customers allows us to understand their concerns and provides us with the opportunity to identify solutions that will meet their needs. We are able to meet our customers’ demand requirements due to our efficient manufacturing processes and extensive distribution network.
Backlog
While the majority of our products have short lead time order cycles, we have aggregated approximately $153 million of backlog at December 31, 2017. The backlog primarily relates to certain business units in our Industrial and Infrastructure Products and our Renewable Energy and Conservation segments. We believe that the majority of our backlog will be shipped, completed and installed during 2018.
Competition
The Company operates in highly competitive markets. We compete against several competitors in all three of our segments with different competitors in each major product category. We compete with competitors based on the range of products offered, quality, price, and delivery, as well as, serving as a full service provider for project management in certain segments. Although some of our competitors are large companies, the majority are small to medium-sized and do not offer the large range of building products that we offer.
We believe our broad range of products, high quality, and sustained ability to meet exacting customer delivery requirements gives us a competitive advantage over many of our competitors. We also believe that execution of our business strategy further differentiates us from many of our competitors and allows us to capitalize on those areas that give us a competitive advantage over many of our competitors.
Seasonality
The Company’s business has historically been subjected to seasonal influences, with higher sales typically realized in the second and third quarters. General economic forces, such as tax credit expirations and pending tariffs, along with changes in the Company’s customer mix have shifted traditional seasonal fluctuations in revenue over the past few years.
Governmental Regulation
Our production processes involve the use of environmentally sensitive materials. We believe that we operate our business in material compliance with all federal, state and local environmental laws and regulations, and do not anticipate any material adverse effect on our financial condition or results of operations to maintain compliance with such laws and regulations. However, we could incur operating costs or capital expenditures in complying with new or more stringent environmental requirements in the future or with current requirements if they are applied to our manufacturing facilities or distribution centers in a way we do not anticipate. In addition, new or more stringent regulation of our energy suppliers could cause them to increase the price of energy.
Our operations are also governed by many other laws and regulations covering our labor relationships, the import and export of goods, the zoning of our facilities, taxes, our general business practices, and other matters. We believe that we are in material compliance with these laws and regulations and do not believe that future compliance with such laws and regulations will have a material adverse effect on our financial condition or results of operations.
9
Internet Information
Copies of the Company’s Proxy Statements on Schedule 14A filed pursuant to Section 14 of the Securities Exchange Act of 1934 and Annual Reports on Form 10-K, Quarterly Reports on Form 10-Q, Current Reports on Form 8-K, and amendments to those reports filed or furnished pursuant to Section 13(a) or 15(d) of the Securities Exchange Act of 1934 are available free of charge through the Company’s website (www.gibraltar1.com) as soon as reasonably practicable after the Company electronically files the material with, or furnishes it to, the Securities and Exchange Commission.
Employees
At December 31, 2017 and 2016, we employed 2,022 and 2,311 employees, respectively.
Senior Management Team
Our senior management team is composed of talented and experienced managers possessing broad experience in operational excellence, new product development, and driving profitable growth gained over multiple business cycles:
Frank Heard - Chief Executive Officer (CEO) and a member of the Board of Directors. Mr. Heard was appointed CEO and a member of the Board of Directors effective January 1, 2015. Mr. Heard was first hired in May 2014 as President and Chief Operating Officer. Mr. Heard joined our Company with extensive experience in the building products industry, including his 32 years of employment at Illinois Tool Works, Inc.
Timothy Murphy - Chief Financial Officer (CFO) and Senior Vice President (SVP). Mr. Murphy was appointed CFO and SVP of the Company on April 1, 2017. Mr. Murphy joined the Company in 2004 as Director of Financial Reporting, and subsequently served as the Company's Vice President, Treasurer and Secretary. Mr. Murphy was appointed as successor to the former CFO and SVP , Kenneth Smith. Mr. Smith's retirement in May of 2017 was announced by the Company in November 2016.
Cherri Syvrud - SVP of Human Resources and Organizational Development. Ms. Syvrud was appointed SVP of Human Resources and Organizational Development on April 1, 2016. Ms. Syvrud joined the Company with significant experience in human resources and organization development, including her 25 years of employment at Illinois Tool Works, Inc. Ms. Syvrud was appointed as successor to the former SVP of Human Resources and Organizational Development, Paul Murray. Mr. Murray's retirement in March of 2017 was announced by the Company in March 2016.
Jeffrey Watorek - Vice President, Treasurer and Secretary. Mr. Watorek was appointed as Vice President, Treasurer and Secretary on April 1, 2017. Mr. Watorek joined the Company in 2008 as Manager of Financial Reporting, and subsequently served as the Company's Director of Financial Performance and Analysis. Mr. Watorek was appointed as successor to the former Vice President, Treasurer and Secretary, Mr. Murphy, upon his appointment to CFO and SVP.
The Company conducted other recent senior leadership changes in 2017. The Company hired John Mehltretter as successor to David McCartney as Vice President of Information Services upon announcement of Mr. McCartney’s retirement in 2017; and William Vietas was promoted as successor to Richard Reilly as Group President of Renewable Energy and Conservation upon announcement of Mr. Reilly's retirement in 2017.
Item 1A. | Risk Factors |
Our business, financial condition and results of operations, and the market price for the Company's common shares are subject to numerous risks, many of which are driven by factors that cannot be controlled or predicted. The following discussion, as well as, other sections of this Annual Report on Form 10-K, including “Part II, Item 7, Management’s Discussion and Analysis of Financial Condition and Results of Operations,” describe certain business and other risks affecting the Company. Consideration should be given to the risk factors described below as well as those in the Safe Harbor Statement at the beginning of this Annual Report on Form 10-K, in conjunction with reviewing the forward-looking statements and other information contained in this Annual Report on Form 10-K. These risks are not the only risks we face. Our business operations and market for our securities could also be adversely affected by additional factors that are not presently known to us or that we currently consider to be immaterial in our operations.
10
Macroeconomic factors outside of our control may adversely affect our business, our industry, and the businesses and industries of many of our customer and suppliers.
Macroeconomic factors have a significant impact on our business, customer demand and the availability of credit and other capital, affecting our ability to generate profitable margins. Our operations are subject to the effects of domestic and international economic conditions including government monetary and trade policies, tax laws and regulations, as well as, the relative debt levels of the U.S. and the other countries where we sell our products. Significant fluctuations in energy costs have, and may continue to, negatively impact demand for our expanded metal products. Tariffs placed on imported products used by our customers, such as solar panels, may negatively impact demand for our solar racking systems. In addition, fluctuations in the U.S. dollar impacts the prices we charge and costs we incur to export and import products.
We are unable to predict the impact on our business of changes in domestic and international economic conditions. The markets in which we operate have been challenging in the past, and the possibility remains that the domestic or global economies, or certain industry sectors of those economies that are key to our sales, may deteriorate, which could result in a corresponding decrease in demand for our products and negatively impact our results of operations and financial condition.
Our amount of leverage and debt service obligations could adversely affect our ability to raise additional capital to fund our operations, limit our ability to react to changes in the economy or our industry, and prevent us from meeting our obligations.
We had total indebtedness of $212.4 million, before unamortized debt issuance costs, as of December 31, 2017, of which $209.6 million is long-term debt. Our current level of indebtedness and the debt we may need to incur in the future to fund strategic acquisitions, investments or for other purposes could have significant adverse consequences to our business, including the following:
• | A significant level of outstanding debt could make us more vulnerable to changes in economic conditions and subject us to increases in prevailing interest rates; |
• | Increases in interest rates could increase our interest expense; |
• | A substantial portion of our cash flow from operations could be restricted to paying principal, premium, if any, and interest on our indebtedness; |
• | Limiting our ability to use cash flow from operations or to obtain additional debt or equity financing to execute on business strategy; and |
• | Limiting our ability to adjust to changing market conditions and place us at a competitive disadvantage compared to our competitors which have less debt. |
Our debt instruments impose operational and financial restrictive covenants which may limit our operational and financial prospects.
The Senior Credit Agreement and the indenture governing our 6.25% Notes contain several financial and other restrictive covenants. A significant decline in our operating income could cause us to violate these covenants, which could result in incurring additional financing fees that would be costly and adversely affect our profitability and cash flows. We may also incur additional debt for acquisitions, operations and capital expenditures that could adversely impact our ability to meet these covenants.
We apply judgments and make estimates in accounting for contracts, and changes in these judgments or estimates may have significant impacts on our earnings.
Changes in judgments or required estimates and any subsequent adjustments to those judgments or estimates (such as performance incentives, penalties, contract claims and contract modifications) could have a material adverse effect on sales and profits. Due to the substantial judgments applied and estimations involved with this process, our actual results could differ materially or could be settled unfavorably from our estimates. Revenue representing approximately 28% and 26% of 2017 and 2016 sales, respectively, were accounted for using the percentage of completion, cost-to-cost method of accounting. Refer to “Critical Accounting Estimates” within Item 7 of this Form 10-K for more detail of how our financial statements can be affected by accounting for revenue from contracts with customers.
A significant portion of our net sales are concentrated with a few customers. The loss of those customers would adversely affect our business, results of operations, and cash flows.
A loss of sales, whether due to decreased demand from the end markets we serve or from any significant customer in these markets, a decrease in the prices that we can realize from sales of our products to customers in these markets, or a loss, bankruptcy, or significant decrease in business from any of our major customers, could have a significant adverse effect on our profitability and cash flows. Our ten largest customers accounted for approximately 36%, 30%, and 34%, of our net sales
11
during 2017, 2016, and 2015, respectively, with our largest customer, a retail home improvement center, accounting for approximately 12% of our consolidated net sales during 2017 and 11% of our consolidated net sales for both 2016 and 2015.
The volatility of the commodity market on our pricing of our principal raw materials, and the highly competitive market environment in which we do business could significantly impact our gross profit, net income, and cash flow.
Our principal raw materials are commodity products consisting of steel, aluminum, and resins, for which, at times, availability and pricing can be volatile due to a number of factors beyond our control, including general economic conditions, domestic and worldwide demand, labor costs, competition, import duties, tariffs, and currency exchange rates. Commodity price fluctuations and increased competition could force us to lower our prices or to offer additional services or enhanced products at a higher cost to us, which could reduce our gross profit, net income, and cash flow and cause us to lose market share.
Our business is highly competitive and increased competition could reduce our gross profit, net income, and cash flow.
The principal markets that we serve are highly competitive. Competition is based primarily on product functionality, quality, price, raw material and inventory availability, and the ability to meet delivery schedules dictated by customers. We compete in our principal markets with companies of various sizes, some of which have greater financial and other resources than we do and some of which have better established brand names in the markets we serve. Increased competition could force us to lower our prices or to offer additional services or enhanced products at a higher cost to us, which could reduce our gross profit, net income, and cash flow and cause us to lose market share.
Our business and financial performance may be adversely affected by information systems interruptions, cybersecurity attacks, equipment failures, and technology integration.
Our business may be impacted by disruptions to our own or third-party information technology (“IT”) infrastructure, which could result from (among other causes) cyber-attacks on, or failures of, such infrastructure or compromises to its physical security, as well as from damaging weather or other acts of nature. Cyber-based risks, in particular, are evolving and include, but are not limited to, both attacks on our IT infrastructure and attacks on the IT infrastructure of third parties (both on premises and in the cloud) attempting to gain unauthorized access to our confidential or other proprietary information, classified information, or information relating to our employees, customers and other third parties.
Due to the evolving threat landscape, cyber-based attacks will continue and we may experience them going forward, potentially
with more frequency. We continue to make investments and adopt measures designed to enhance our protection, detection, response, and recovery capabilities, and to mitigate potential risks to our technology, products, services and operations from potential cyber-attacks. However, given the unpredictability, nature and scope of cyber-attacks, it is possible that potential vulnerabilities could go undetected for an extended period. We could potentially be subject to production downtimes, operational delays, other detrimental impacts on our operations or ability to provide products and services to our customers, the compromise of confidential or otherwise protected information, misappropriation, destruction or corruption of data, security breaches, other manipulation or improper use of our or third-party systems, networks or products, financial losses from remedial actions, loss of business or potential liability, and/or damage to our reputation, any of which could have a material adverse effect on our competitive position, results of operations, cash flows or financial condition. Due to the evolving nature of such risks, the impact of any potential incident cannot be predicted.
If the subcontractors and suppliers we rely upon do not perform to their contractual obligations, our revenues and cash flows would be adversely affected.
Some of our contracts with customers involve subcontracts with other companies that perform a portion of the services we provide to our customers. There is a risk that our subcontractors may not perform to their contractual obligations and therefore may cause disputes regarding the quality and timeliness of work performed by our subcontractors or customer concerns with the subcontractor. Any such disputes or concerns could materially and adversely impact our ability to perform our obligations as the prime contractor. Similarly, the failure by our suppliers to deliver raw materials, components or equipment parts according to schedule, or at all, may affect our ability to meet our customers' needs and may have an adverse effect upon our profitability. Failure of our raw materials or components to conform to our specification could also result in delays in our ability to timely deliver and may have an adverse impact on our relationships with our customers, and our ability to fully realize the revenue expected from sales to those customers.
12
Our strategy depends on identification, management and successful integration of future acquisitions.
Historically, we have grown through a combination of internal growth plus external expansion through acquisitions. Although we intend to continue to seek additional acquisition opportunities in accordance with our business strategy, we cannot provide any assurance that we will be able to identify appropriate acquisition candidates, or, if we do, that we will be able to negotiate successfully the terms of an acquisition, finance the acquisition or integrate the acquisition into our existing operations. Failure to integrate any acquisition successfully may cause significant operating inefficiencies, result in the incurring of unforeseen obligations or loss of customers and could adversely affect our profitability. Consummating an acquisition could require us to raise additional funds through additional equity or debt financing, which could increase our interest expense and reduce our cash flows and available funds.
Systems integration and implementation issues could disrupt our internal operations.
In connection with the acquisitions we make, we customarily must integrate legacy information technology systems of the acquired business with our information technology infrastructure, and in some cases, implement new information technology systems for the business. In addition, as the functionality of available information systems increases, we may need to implement significant upgrades or even replace some of our primary information technology systems across significant parts of our businesses and operations. The implementation of new information technology solutions could lead to interruptions of information flow internally and to our customers and suppliers while the implementation project is being completed. Any failure to integrate legacy systems of acquisitions or to implement new systems properly could negatively impact our operations and financial results.
We depend on our senior management team, and the unexpected loss of any member could adversely affect our operations.
Our success is dependent on the management and leadership skills of our senior executive and divisional management teams. The unexpected loss of any of these individuals, or our inability to attract and retain additional personnel could prevent us from successfully executing our business strategy. We cannot assure you that we will be able to retain our existing senior management personnel or to attract additional qualified personnel when needed. We have not entered into employment agreements with any of our senior management personnel other than Frank G. Heard, our President and Chief Executive Officer.
We could incur substantial costs in order to comply with, or to address any violations of, environmental, health and safety laws.
Our operations and facilities are subject to a variety of stringent federal, state, local, and foreign laws and regulations relating to the protection of the environment and human health and safety. Compliance with these laws and regulations sometimes involves substantial operating costs and capital expenditures, and failure to maintain or achieve compliance with these laws and regulations or with the permits required for our operations could result in substantial costs, such as fines and civil or criminal sanctions, third-party claims for property damage or personal injury, cleanup costs or temporary or permanent discontinuance of operations, including claims arising from the businesses and facilities that we have sold. For certain businesses we have divested, we have provided limited indemnifications for environmental contamination to the successor owners. We have also acquired and continue to acquire businesses and facilities to add to our operations. While we sometimes receive indemnification for pre-existing environmental contamination, the party providing the indemnification may not have sufficient resources to cover the cost of any required measures. Certain facilities of ours have been in operation for many years and we may be liable for remediation of any contamination at our current or former facilities; or at off-site locations where wastes have been sent for disposal, regardless of fault or whether we, our predecessors or others are responsible for such contamination. We have been responsible for remediation of contamination at some of our locations and, while such costs have not been material to date, the cost of remediation of any of these and any newly-discovered contamination cannot be quantified, and we cannot assure you that it will not materially affect our profits or cash flows. Changes in environmental laws, regulations or enforcement policies, including without limitation new or additional regulations affecting disposal of hazardous substances and waste, greenhouse gas emissions or use of fossil fuels, could have a material adverse effect on our business, financial condition, or results of operations.
Our operations are subject to seasonal fluctuations that may impact our cash flow.
Our net sales are generally lower in the first and fourth quarters primarily as a result of reduced activity in the building industry due to inclement weather. In addition, quarterly results may be affected by the timing of shipments of large customer orders. Therefore, our cash flow from operations may vary from quarter to quarter. If, as a result of any such fluctuation, our quarterly cash flows were significantly reduced, we may not be able to service our indebtedness or maintain covenant compliance.
13
Economic, political, and other risks associated with foreign operations could adversely affect our financial results and cash flows.
Although the large majority of our business activity takes place in the United States, we derive a portion of our revenues and earnings from operations in Canada, China and Japan, and are subject to risks associated with doing business internationally. Our sales originating outside the United States represented approximately 4% of our consolidated net sales during the year ended December 31, 2017. We believe that our business activities outside of the United States involve a higher degree of risk than our domestic activities, such as the possibility of unfavorable circumstances arising from host country laws or regulations, changes in tariff and trade barriers and import or export licensing requirements. In addition, any local or global health issue or uncertain political climates, international hostilities, natural disasters, or any terrorist activities could adversely affect customer demand, our operations and our ability to source and deliver products and services to our customers.
Future terror attacks, war, natural disasters or other catastrophic events beyond our control could negatively impact our operations and financial results.
Terror attacks, war, or other civil disturbances, natural disasters and other catastrophic events could lead to economic instability, decreased capacity to produce our products and decreased demand for our products. From time to time, terrorist attacks worldwide have caused instability in global financial markets. Concerns over global climate changes and environmental sustainability over time may influence the Company's strategic direction, supply chain, or delivery channels. Also, our facilities could be subject to damage from fires, floods, earthquakes or other natural or man-made disasters. Such interruptions could have an adverse effect on our operations, cash flows and financial results.
The nature of our business exposes us to product liability, product warranty and other claims, and other legal proceedings.
We are involved in product liability, product warranty and other claims relating to the products we manufacture and distribute. Although we currently maintain what we believe to be suitable and adequate insurance in excess of our self-insured amounts, there can be no assurance that we will be able to maintain such insurance on acceptable terms or that such insurance will provide adequate protection against potential liabilities. Product liability claims can be expensive to defend and can divert the attention of management and other personnel for significant periods, regardless of the ultimate outcome. Claims of this nature could also have a negative impact on customer confidence in our products and our Company. We cannot assure you that any current or future claims will not adversely affect our reputation, financial condition, operating results, and cash flows.
If events occur or indicators of impairment are present that may cause the carrying value of long-lived and indefinite-lived assets to no longer be recoverable, to exceed the fair value of the asset, or may lead to a reduction in the fair value of the asset, significant non-cash impairment charges to earnings may be taken that have a material impact on our results of operations.
In prior years, we have recorded significant non-cash impairment charges for goodwill and other intangible assets as a result of reductions in the estimated fair values of certain businesses. It is possible that we will be required to record additional non-cash impairment charges to our earnings in the future, which could be significant and have a material impact on our results of operations. Refer to “Critical Accounting Estimates” within Item 7 of this Form 10-K for more detail of how our financial statements can be affected by asset impairment.
The expiration, elimination or reduction of solar rebates, credits and incentives may adversely impact our business.
A variety of federal, state and local government agencies provide incentives to promote electricity generation from renewable sources such as solar power. These incentives are in the form of rebates, tax credits and other financial incentives which help to motivate end users, distributors, system integrators and others to install solar powered generating systems. Any changes to reduce, shorten or eliminate the scope and availability of these incentive programs could materially impact the demand for our related products, our financial condition and results of operations.
Item 1B. | Unresolved Staff Comments |
None.
Item 2. | Properties |
Our principal executive office and headquarters is located in Buffalo, New York, in a leased facility. As of December 31, 2017, we operated 34 domestic facilities and 8 foreign facilities, of which 29 were leased and 13 were owned. We believe the facilities we operate and their equipment are effectively utilized, well maintained, in good condition, and will be able to accommodate our capacity needs to meet current levels of demand. Our North American and Asian manufacturing sites are located to optimize customer service, market requirements, distribution capability and freight costs. We continuously review
14
our anticipated requirements for facilities and, on the basis of that review, may from time to time acquire additional facilities and/or dispose of existing facilities. Most recently, our operational excellence initiatives and portfolio changes have enabled us to reduce, and may further reduce in the future, the number of facilities necessary to meet our customer needs.
Item 3. | Legal Proceedings |
From time to time, the Company is named a defendant in legal actions arising out of the normal course of business. The Company is not a party to any material pending legal proceedings. The Company is also not a party to any other pending legal proceedings other than ordinary, routine litigation incidental to its business. The Company maintains liability insurance against risks arising out of the normal course of business.
Item 4. | Mine Safety Disclosures |
Not applicable.
15
PART II
Item 5. | Market for Common Equity and Related Stockholder Matters |
As of December 31, 2017, there were 69 shareholders of record of the Company’s common stock. However, the Company believes that it has a significantly higher number of shareholders because of the number of shares that are held by nominees.
The Company’s common stock is traded in the over-the-counter market and quoted on the NASDAQ Global Select Market (“NASDAQ”) under the symbol “ROCK.” The following table sets forth the high and low sale prices per share for the Company’s common stock for each quarter of 2017 and 2016 as reported on the NASDAQ Stock Exchange.
2017 | 2016 | ||||||||||||||
High | Low | High | Low | ||||||||||||
Fourth Quarter | $ | 33.25 | $ | 29.85 | $ | 47.85 | $ | 34.65 | |||||||
Third Quarter | $ | 35.85 | $ | 26.85 | $ | 39.28 | $ | 31.92 | |||||||
Second Quarter | $ | 40.45 | $ | 30.90 | $ | 32.10 | $ | 25.12 | |||||||
First Quarter | $ | 44.60 | $ | 38.70 | $ | 28.60 | $ | 18.78 | |||||||
The Company did not declare cash dividends during the years ended December 31, 2017 and 2016. Cash dividends are declared at the discretion of the Company’s Board of Directors. The Board of Directors determines to pay dividends based upon such factors as the Company’s cash flow, financial condition, capital requirements, debt covenant requirements, and other relevant conditions.
Equity Compensation Plan Information
The following table summarizes information as of December 31, 2017 concerning securities authorized for issuance under the Company’s equity based incentive compensation plans:
Plan Category | Number of Securities to be Issued Upon Exercise of Outstanding Options | Weighted- Average Exercise Price of Outstanding Options | Number of Securities Remaining Available for Future Issuance Under Equity Compensation Plans (1) | ||||||
Equity Compensation Plans Approved by Security Holders | 247,666 | $ | 17.01 | 427,007 | |||||
1 | Consists of the Gibraltar Industries, Inc. 2016 Stock Plan for Non-Employee Directors and the 2015 Equity Incentive Plan (the Plans). Note 12 of the Company’s audited consolidated financial statements included in Item 8 of this Annual Report on Form 10-K provides additional information regarding the Plans and securities issuable upon exercise of options. All currently effective equity compensation plans have been approved by the Company’s shareholders. |
16
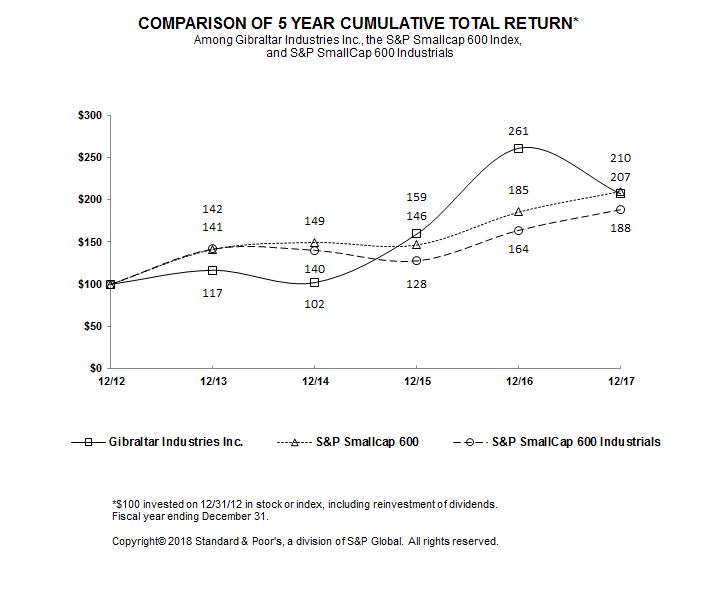
Performance Graph
The performance graph shown below compares the cumulative total shareholder return on the Company’s common stock, based on the market price of the common stock, with the total return of the S&P SmallCap 600 Index and the S&P SmallCap 600 Industrials Index for the five-year period ended December 31, 2017. The comparison of total return assumes that a fixed investment of $100 was invested on December 31, 2012 in common stock and in each of the foregoing indices and further assumes the reinvestment of dividends. The stock price performance shown on the graph is not necessarily indicative of future price performance.
17
Item 6. | Selected Financial Data |
The selected historical consolidated financial data for each of the five years presented ended December 31 (in thousands, except per share data) are derived from the Company’s audited financial statements as reclassified for discontinued operations. The selected historical consolidated financial data should be read in conjunction with the Company’s audited consolidated financial statements and notes thereto contained in Item 8 and “Management’s Discussion and Analysis of Financial Condition and Results of Operations” set forth in Item 7 of this Annual Report on Form 10-K.
Years Ended December 31, | |||||||||||||||||||
2017 | 2016 | 2015 | 2014 | 2013 | |||||||||||||||
Net sales | $ | 986,918 | $ | 1,007,981 | $ | 1,040,873 | $ | 862,087 | $ | 827,567 | |||||||||
Intangible asset impairment | $ | 247 | $ | 10,175 | $ | 4,863 | $ | 107,970 | $ | 23,160 | |||||||||
Income (loss) from operations | $ | 92,849 | $ | 73,488 | $ | 48,732 | $ | (70,417 | ) | $ | 21,480 | ||||||||
Interest expense | $ | 14,032 | $ | 14,577 | $ | 15,003 | $ | 14,421 | $ | 22,489 | |||||||||
Income (loss) before taxes | $ | 77,908 | $ | 49,983 | $ | 37,100 | $ | (84,750 | ) | $ | (832 | ) | |||||||
Provision for (benefit of) income taxes | $ | 14,943 | $ | 16,264 | $ | 13,624 | $ | (2,958 | ) | $ | 4,797 | ||||||||
Income (loss) from continuing operations | $ | 62,965 | $ | 33,719 | $ | 23,476 | $ | (81,792 | ) | $ | (5,629 | ) | |||||||
Income (loss) from continuing operations per share – Basic | $ | 1.98 | $ | 1.07 | $ | 0.75 | $ | (2.63 | ) | $ | (0.18 | ) | |||||||
Weighted average shares outstanding – Basic | 31,701 | 31,536 | 31,233 | 31,066 | 30,930 | ||||||||||||||
Income (loss) from continuing operations per share – Diluted | $ | 1.95 | $ | 1.05 | $ | 0.74 | $ | (2.63 | ) | $ | (0.18 | ) | |||||||
Weighted average shares outstanding – Diluted | 32,250 | 32,069 | 31,545 | 31,066 | 30,930 | ||||||||||||||
Current assets | $ | 462,764 | $ | 391,197 | $ | 351,422 | $ | 360,431 | $ | 322,400 | |||||||||
Current liabilities | $ | 171,033 | $ | 152,088 | $ | 185,395 | $ | 134,085 | $ | 119,913 | |||||||||
Total assets | $ | 991,385 | $ | 918,245 | $ | 889,772 | $ | 810,471 | $ | 889,571 | |||||||||
Total debt | $ | 210,021 | $ | 209,637 | $ | 209,282 | $ | 209,911 | $ | 209,416 | |||||||||
Total shareholders’ equity | $ | 531,719 | $ | 460,880 | $ | 410,086 | $ | 387,229 | $ | 471,749 | |||||||||
Capital expenditures | $ | 11,399 | $ | 10,779 | $ | 12,373 | $ | 23,291 | $ | 14,940 | |||||||||
Depreciation | $ | 12,929 | $ | 14,477 | $ | 17,869 | $ | 19,712 | $ | 20,478 | |||||||||
Amortization | $ | 8,761 | $ | 9,637 | $ | 12,679 | $ | 5,720 | $ | 6,572 | |||||||||
18
Item 7. | Management’s Discussion and Analysis of Financial Condition and Results of Operations |
The following Management’s Discussion and Analysis of Financial Condition and Results of Operations should be read in conjunction with the Company’s risk factors and its consolidated financial statements and notes thereto included in Item 1A and Item 8, respectively, of this Annual Report on Form 10-K. Certain information set forth herein Item 7 constitutes “forward-looking statements” as that term is used in the Private Securities Litigation Reform Act of 1995. Such forward-looking statements are based, in whole or in part, on management’s beliefs, estimates, assumptions, and currently available information. For a more detailed discussion of what constitutes a forward-looking statement and of some of the factors that could cause actual results to differ materially from such forward-looking statements, please refer to the “Safe Harbor Statement” on page 3 of this Annual Report on Form 10-K.
Company Overview
Gibraltar Industries, Inc. (the "Company") is a leading manufacturer and distributor of building products for residential, industrial, infrastructure, renewable energy and conservation markets. Our business strategy focuses on significantly elevating and accelerating the growth and financial returns of the Company. We strive to deliver best-in-class, sustainable value creation for our shareholders for the long-term. This strategy is intended to drive a transformational change in the Company’s portfolio and its financial results. It has four key elements which are: operational excellence, product innovation, portfolio management, and acquisitions as a strategic accelerator.
The Company serves customers primarily throughout North America and, to a lesser extent, Asia. Our customers include major home improvement retailers, wholesalers, industrial distributors, contractors, solar developers and institutional and commercial growers of plants. As of December 31, 2017, we operated 42 facilities in 17 states, Canada, China and Japan which includes 30 manufacturing facilities and six distribution centers, giving us a base of operations to provide customer support, delivery, service and quality to a number of regional and national customers and providing us with manufacturing and distribution efficiencies in North America, as well as a presence in Asian markets.
The Company operates and reports its results in the following three reporting segments:
• | Residential Products; |
• | Industrial and Infrastructure Products; and |
• | Renewable Energy and Conservation |
The end markets our businesses serve include residential housing, industrial manufacturing, transportation infrastructure, and renewable energy and conservation. These end markets are subject to economic conditions that are influenced by various factors. These factors include but are not limited to changes in general economic conditions, interest rates, exchange rates, commodity costs, demand for residential construction, demand for repair and remodeling, governmental policies and funding, tax policies and incentives, the level of non-residential construction and infrastructure projects, need for protection of high value assets, demand for renewable energy sources and climate change.
Residential construction markets remain relatively steady with U.S. new housing starts of 1.2 million up modestly from 2016. Residential repair, remodeling and re-roofing related activity increased impacting demand for our roof-related products. Demand for safe, secure and convenient delivery of packages in a fast-growing on-line consumer sales environment drove demand for our electronic package solutions.
Increased levels of state matching-funds for infrastructure projects increased bridge repair and maintenance projects. This growing demand is reflected in the growth of our infrastructure backlog. Protection standards created to secure high value power utility sites and transportation infrastructure impacts demand for perimeter security products.
The long-term attractiveness of renewable energy continues to drive additional investment in solar electricity generation, while governmental policy changes have created uncertainty in the industry. Concerns around climate change are increasing demand for locally sourced food and need for seed development which impacts demand for greenhouses.
Commodity prices for materials such as steel and aluminum rose steadily during 2017. These fluctuations impact the cost of raw materials we purchase and the pricing we offer to our customers.
We believe the key elements of our strategy will allow us to respond timely to changes in these factors. We have and expect to continue to examine the need for restructuring of our operations, including consolidation of facilities, reducing overhead costs, curtailing investments in inventory, and managing our business to generate incremental cash. Additionally, we believe our
19
current strategy has enabled us to better react to fluctuations in commodity costs and customer demand, and has helped in improving margins. We have used the improved cash flows generated by these initiatives to maintain low levels of debt, improve our liquidity position, and invest in growth initiatives. Overall, we are striving to achieve stronger financial results, make more efficient use of capital, and deliver higher shareholder returns.
Results of Operations
Year Ended December 31, 2017 Compared to Year Ended December 31, 2016
The following table sets forth selected results of operations data (in thousands) and its percentages of net sales for the years ended December 31:
2017 | 2016 | ||||||||||||
Net sales | $ | 986,918 | 100.0 | % | $ | 1,007,981 | 100.0 | % | |||||
Cost of sales | 750,374 | 76.0 | % | 763,219 | 75.7 | % | |||||||
Gross profit | 236,544 | 24.0 | % | 244,762 | 24.3 | % | |||||||
Selling, general, and administrative expense | 143,448 | 14.6 | % | 161,099 | 16.0 | % | |||||||
Intangible asset impairment | 247 | — | % | 10,175 | 1.0 | % | |||||||
Income from operations | 92,849 | 9.4 | % | 73,488 | 7.3 | % | |||||||
Interest expense | 14,032 | 1.4 | % | 14,577 | 1.4 | % | |||||||
Other expense | 909 | 0.1 | % | 8,928 | 0.9 | % | |||||||
Income before taxes | 77,908 | 7.9 | % | 49,983 | 5.0 | % | |||||||
Provision for income taxes | 14,943 | 1.5 | % | 16,264 | 1.7 | % | |||||||
Income from continuing operations | 62,965 | 6.4 | % | 33,719 | 3.3 | % | |||||||
Loss from discontinued operations | (405 | ) | (0.1 | )% | (44 | ) | — | % | |||||
Net income | $ | 62,560 | 6.3 | % | $ | 33,675 | 3.3 | % | |||||
The following table sets forth the Company’s net sales by reportable segment for the years ended December 31 (in thousands):
Change due to | |||||||||||||||||||||||
2017 | 2016 | Total Change | Divestitures | Acquisitions | Operations | ||||||||||||||||||
Net sales: | |||||||||||||||||||||||
Residential Products | $ | 466,603 | $ | 430,938 | $ | 35,665 | $ | — | $ | 5,669 | $ | 29,996 | |||||||||||
Industrial and Infrastructure Products | 215,211 | 296,513 | (81,302 | ) | (73,419 | ) | — | (7,883 | ) | ||||||||||||||
Less Inter-Segment Sales | (1,247 | ) | (1,495 | ) | 248 | — | — | 248 | |||||||||||||||
213,964 | 295,018 | (81,054 | ) | (73,419 | ) | — | (7,635 | ) | |||||||||||||||
Renewable Energy and Conservation | 306,351 | 282,025 | 24,326 | (8,197 | ) | 17,109 | 15,414 | ||||||||||||||||
Consolidated | $ | 986,918 | $ | 1,007,981 | $ | (21,063 | ) | $ | (81,616 | ) | $ | 22,778 | $ | 37,775 | |||||||||
Consolidated net sales decreased by $21.1 million, or 2.1%, to $986.9 million for 2017 compared to $1.01 billion for 2016. The decrease in sales was the result of divestitures related to the Company's portfolio management activities during 2016 along with a slight decline in net sales volumes in our Industrial and Infrastructure segment. During 2016, the Company sold its European industrial manufacturing business to a third party and exited both the European residential solar racking business and the Company's U.S. bar grating product line. These divestitures resulted in a decrease in revenues of $81.6 million from the prior year. Largely offsetting these decreases were increased net sales volumes from both our Residential Products and Renewable Energy and Conservation Segments, including contributions from our recent acquisitions of Nexus in October 2016 and Package Concierge in February 2017, respectively. The above results include a net increase in volume of 2.3% as well as a modest 1.5% increase in pricing to customers.
Net sales in our Residential Products segment increased 8.3%, or $35.7 million, to $466.6 million in 2017 compared to $430.9 million in 2016. The increase from prior year was primarily the result of a 4.0% net increase in volume along with $5.7 million of sales generated from the acquisition of Package Concierge and a 3.0% increase in pricing to customers. The higher volume
20
was due to a strong demand for building products in the repair and remodel and new housing construction markets and growing demand for the Company’s centralized mail systems and electronic package solutions.
Net sales in our Industrial and Infrastructure Products segment decreased 27.5%, or $81.1 million, to $214.0 million in 2017 compared to $295.0 million in 2016. The decrease in net sales was the combined result of the Company's exit from its U.S. bar grating product line and the divestiture of our European industrial manufacturing business, along with a 3.0% decrease in volume as compared to the prior year. Excluding the impact of the divestitures, a decrease in demand for our infrastructure products, which include components for bridges and elevated highways, further contributed to the overall segment revenue decline due to continued delay in infrastructure projects. We expect this decline to be temporary as evidenced by an increase in segment backlog during the current year. Partially offsetting the above decrease was increased volume in our industrial products as new products in these businesses continue to gain traction.
Net sales in our Renewable Energy and Conservation segment increased 8.6%, or $24.3 million, to $306.4 million in 2017 compared to $282.0 million in 2016. The increase in 2017 was due to sales generated from the acquisition of Nexus in October 2016 along with increased volume in our domestic markets, partially offset by the exit of the Company's small European residential solar racking business.
Our consolidated gross margin decreased to 24.0% for 2017 compared to 24.3% for 2016. The decline was primarily the result of a less favorable alignment of material costs to customer selling prices. Largely offsetting this less favorable alignment were benefits from portfolio management actions and the Company's 80/20 restructuring initiatives taken during 2016. Furthermore, the related costs associated with those actions decreased by $9.0 million as compared to the prior year. In 2016, the Company sold or exited less profitable businesses or products lines in order to enable the Company to re-allocate leadership, time, capital and resources to the platforms and businesses with the highest potential revenue and margins. In addition, other portfolio management actions and restructuring activities were taken resulting from our 80/20 initiatives and contributed to the margin as well.
Selling, general, and administrative ("SG&A") expenses decreased by $17.7 million, or 11.0%, to $143.4 million for 2017 from $161.1 million for 2016. The $17.7 million decrease was due to a $15.3 million decrease in performance-based compensation expenses, a combination of the lower price of the Company's shares as compared to the prior year and lower achievement under the Company's performance base compensation programs, along with a reduction of expenses as a result of the Company's 2016 divestitures. These decreases were partially offset by incremental expense recorded in 2017 from the acquisitions of Nexus and Package Concierge. SG&A expenses as a percentage of net sales decreased to 14.6% for 2017 compared to 16.0% for 2016.
In 2017, we recognized intangible asset impairment charges of $0.2 million related to indefinite-lived trademarks in our Renewable Energy and Conservation segment due to a realignment of businesses within this segment. During 2016, we recognized intangible asset impairment charges of $10.2 million. These charges primarily resulted from the decision in the fourth quarter of 2016 to discontinue the Company's U.S. bar grating product line and its European residential solar racking business which resulted in lower cash flows and estimated fair values of certain reporting units. The largest portion of the impairment was $8.0 million related to indefinite-lived intangibles in our Industrial and Infrastructure Products segment, with the balance of the charges occurring in the Renewable Energy and Conservation segment.
The following table sets forth the Company’s income from operations and income from operations as a percentage of net sales by reportable segment for the years ended December 31 (in thousands):
2017 | 2016 | Total Change | |||||||||||||
Income from operations: | |||||||||||||||
Residential Products | $ | 76,893 | 16.5 | % | $ | 65,241 | 15.1 | % | $ | 11,652 | |||||
Industrial and Infrastructure Products | 8,159 | 3.8 | % | 1,306 | 0.4 | % | 6,853 | ||||||||
Renewable Energy and Conservation | 30,218 | 9.9 | % | 43,214 | 15.3 | % | (12,996 | ) | |||||||
Unallocated Corporate Expenses | (22,421 | ) | (2.3 | )% | (36,273 | ) | (3.6 | )% | 13,852 | ||||||
Consolidated income from operations | $ | 92,849 | 9.4 | % | $ | 73,488 | 7.3 | % | $ | 19,361 | |||||
Our Residential Products segment generated an operating margin of 16.5% in 2017 compared to an operating margin of 15.1% in 2016. The increase of $11.7 million of operating profit is primarily due to the benefits of operational efficiencies and
21
contributions from 80/20 simplification initiatives, along with lower costs incurred related to these initiatives as compared to the prior year.
Our Industrial and Infrastructure Products segment operating margin increased to 3.8% in 2017 compared to 0.4% in 2016. The increase in the current year was a result of lower charges for portfolio management and restructuring initiatives of $16.2 million as compared to the prior year and operational efficiencies resulting from the Company’s 80/20 initiatives, partially offset by a less favorable alignment of material costs to customer selling prices.
The Renewable Energy and Conservation segment generated an operating margin of 9.9% in 2017 compared to 15.3% in 2016. The decrease was primarily due to an unfavorable alignment of material costs to customer selling prices net of pricing actions, partially offset by operational improvements resulting from the Company’s 80/20 initiatives and lower charges for portfolio management and restructuring initiatives as compared to the prior year.
Unallocated corporate expenses decreased $13.9 million, or 38.2%, for 2017 from $36.3 million for 2016 to $22.4 million for 2017. The lower expenses in the current year were primarily the result of a $13.4 million decrease in performance-based compensation expenses, a combination of the lower price of the Company's shares and lower achievement under the Company's performance based compensation programs as compared to the prior year, along with a reduction in senior leadership transition costs of $2.0 million.
The Company recorded other expense of $0.9 million in 2017. Other expense of $8.9 million in 2016 is primarily comprised of the $8.8 million pre-tax loss on the sale of our European industrial manufacturing business.
Interest expense decreased $0.6 million to $14.0 million for 2017 from $14.6 million for 2016. During 2017 and 2016, no amounts were outstanding under our revolving credit facility.
We recognized a provision for income taxes of $14.9 million, an effective tax rate of 19.2%, for 2017 compared with a provision for income taxes of $16.3 million, an effective tax rate of 32.5%, for 2016. On December 22, 2017, the United States enacted the Tax Reform Act which significantly changes U.S. tax laws by lowering the federal corporate income tax rate from 35% to 21%, imposing a one-time transition tax on deemed repatriated foreign earnings, moving to a territorial tax system, broadening the tax base and other changes. Due to this new legislation, a net benefit of $12.5 million was recorded in 2017, the result of a $16.2 million benefit primarily from the re-measurement of our net U.S. deferred tax liabilities at the lower corporate tax rate partially offset by an expense of $3.7 million related to foreign earnings.
The difference between the Company’s recorded charge for 2016 and the expense that would result from applying the U.S. statutory rate of 35% is due to deductible permanent differences and favorable discrete items partially offset by state taxes. The aforementioned favorable discrete items were primarily comprised of the $6.7 million benefit recorded by the Company in 2016 related to the worthless stock deduction and the associated inter-company debt discharge resulting from the sale of its European industrial manufacturing business to a third party in the same period.
Results of Operations
Year Ended December 31, 2016 Compared to Year Ended December 31, 2015
The following table sets forth selected results of operations data (in thousands) and its percentages of net sales for the years ended December 31:
22
2016 | 2015 | ||||||||||||
Net sales | $ | 1,007,981 | 100.0 | % | $ | 1,040,873 | 100.0 | % | |||||
Cost of sales | 763,219 | 75.7 | % | 853,897 | 82.0 | % | |||||||
Gross profit | 244,762 | 24.3 | % | 186,976 | 18.0 | % | |||||||
Selling, general, and administrative expense | 161,099 | 16.0 | % | 133,381 | 12.8 | % | |||||||
Intangible asset impairment | 10,175 | 1.0 | % | 4,863 | 0.5 | % | |||||||
Income from operations | 73,488 | 7.3 | % | 48,732 | 4.7 | % | |||||||
Interest expense | 14,577 | 1.4 | % | 15,003 | 1.4 | % | |||||||
Other expense (income) | 8,928 | 0.9 | % | (3,371 | ) | (0.3 | )% | ||||||
Income before taxes | 49,983 | 5.0 | % | 37,100 | 3.6 | % | |||||||
Provision for income taxes | 16,264 | 1.7 | % | 13,624 | 1.3 | % | |||||||
Income from continuing operations | 33,719 | 3.3 | % | 23,476 | 2.3 | % | |||||||
Loss from discontinued operations | (44 | ) | — | % | (28 | ) | — | % | |||||
Net income | $ | 33,675 | 3.3 | % | $ | 23,448 | 2.3 | % | |||||
The following table sets forth the Company’s net sales by reportable segment for the years ended December 31 (in thousands):
Change due to | |||||||||||||||||||||||
2016 | 2015 | Total Change | Foreign Currency | Acquisition/Divestiture | Operations | ||||||||||||||||||
Net sales: | |||||||||||||||||||||||
Residential Products | $ | 430,938 | $ | 475,653 | $ | (44,715 | ) | $ | 8,087 | $ | — | $ | (52,802 | ) | |||||||||
Industrial and Infrastructure Products | 296,513 | 378,224 | (81,711 | ) | (1,790 | ) | (26,339 | ) | (53,582 | ) | |||||||||||||
Less Inter-Segment Sales | (1,495 | ) | (1,536 | ) | 41 | — | — | 41 | |||||||||||||||
295,018 | 376,688 | (81,670 | ) | (1,790 | ) | (26,339 | ) | (53,541 | ) | ||||||||||||||
Renewable Energy and Conservation | 282,025 | 188,532 | 93,493 | — | 107,438 | (13,945 | ) | ||||||||||||||||
Consolidated | $ | 1,007,981 | $ | 1,040,873 | $ | (32,892 | ) | $ | 6,297 | $ | 81,099 | $ | (120,288 | ) | |||||||||
Consolidated net sales decreased by $32.9 million, or 3.2%, to $1.01 billion for 2016 compared to $1.04 billion for 2015. The decrease was the result of a combined 13.0% decrease in volume, a 0.7% decrease in pricing to customers, and a reduction in sales of $26.3 million due to the divestiture of our European industrial manufacturing business in April 2016. These decreases were partially offset by incremental sales generated from acquisitions in our Renewable Energy and Conservation segment, which contains the results of RBI acquired in June 2015 and Nexus acquired in October 2016. Favorable currency fluctuations also contributed to the offset.
Net sales in our Residential Products segment decreased 9.4%, or $44.7 million, to $430.9 million in 2016 compared to $475.7 million in 2015. The decrease from prior year was primarily the result of a $53.2 million, or 11.2%, decline in volume for our cluster mailboxes related to the completion of a discrete two-year contract at the end of 2015. Favorable currency fluctuations of $8.1 million partially offset this decrease. A decline in volume of 0.9% for our other residential product offerings, including reduced sales to small volume customers under our 80/20 simplification initiatives, also contributed to the net decrease in revenues for the year. These decreases were slightly offset by a 1.0% increase in pricing to customers.
Net sales in our Industrial and Infrastructure Products segment decreased 21.7%, or $81.7 million, to $295.0 million in 2016 compared to $376.7 million in 2015. The decrease in net sales was the combined result of the April 2016 divestiture of our European industrial manufacturing business which previously contributed 7.0% of sales, as well as, lower shipment volume of 11.3%, and a 3.2% decrease in pricing offered to customers, as compared to the prior year. This segment was primarily impacted by a decline in demand for our industrial products generated from domestic energy-related end markets that have been depressed by reduced prices for oil and other commodities. Demand for our infrastructure products, including components for bridges and elevated highways, related to these projects was also lower as compared to the prior year. While a new infrastructure bill was passed in December 2015 authorizing U.S. federal funding for five years, the FAST Act, the matching state funding required to obtain the federal funds was not available in key states we serve.
Net sales in our Renewable Energy and Conservation segment increased 49.6%, or $93.5 million, to $282.0 million in 2016 compared to $188.5 million in 2015. The increase in 2016 was primarily due to the benefit of incremental revenues earned by
23
RBI in the current year as compared to the prior year in which RBI was acquired in June of 2015. Sales from the acquisition of Nexus in October 2016 also contributed to the increase.
Our consolidated gross margin increased to 24.3% for 2016 compared to 18.0% for 2015. Our consolidated gross profit also increased for the comparable period.
In our Residential Products segment, both gross profit and gross margin, as a percentage of sales, increased as compared to 2015. This segment largely benefited from operational efficiencies, an improved alignment of material costs to customer selling prices and contributions from our 80/20 initiatives to simplify our business processes and product lines. Also contributing to the margin increase were favorable currency fluctuations, as compared to the same period in the prior year.
Both gross profit and gross margin, as a percentage of sales, decreased as compared to the prior year within our Industrial and Infrastructure Products segment. The profit decrease was due to a significant decrease in sales volume in industrial products, the disposition of our European industrial manufacturing business in April 2016, decrease in pricing offered to customers, along with currency fluctuations. The margin decrease was partially offset by manufacturing efficiencies, savings from our company-wide 80/20 initiatives and better alignment of material costs to customer selling prices.
Within our Renewable Energy and Conservation segment, both gross profit and gross margin, as a percentage of sales, increased as compared to the prior year. The increase in gross profit largely resulted from the benefit of incremental revenue earned in 2016 as compared to the prior year in which RBI was acquired in June 2015. The execution of operational efficiencies in the segment, including rising synergies from raw material sourcing, freight management, and strategic make-versus-buy decisions also contributed to the increase in gross margin. To a lesser extent, the acquisition of Nexus in October 2016 contributed to the increase in gross profit as well.
Selling, general, and administrative ("SG&A") expenses increased by $27.7 million, or 20.8%, to $161.1 million for 2016 from $133.4 million for 2015. The $27.7 million increase was the result of $15.8 million of incremental SG&A expense recorded year over year at RBI, acquired in June 2015, along with $1.9 million of SG&A expenses recorded at Nexus, acquired in October 2016, and $10.5 million of higher performance-based compensation costs. The net benefit of a $6.8 million gain on the sale leaseback of one of our facilities recorded during 2015 largely offset by acquisition-related costs of $6.1 million recorded during 2015, also contributed to the increase year over year. The higher performance-based compensation costs are the result of improvements in two key performance metrics. One metric is improved operating results which is measured by the Company's increased earnings per share and return on invested capital year over year. The other metric is the higher price of the Company's shares which increased 64% during 2016. SG&A expenses as a percentage of net sales increased to 16.0% for 2016 compared to 12.8% for 2015.
During 2016, we recognized intangible asset impairment charges of $10.2 million. These charges primarily resulted from the decision in the fourth quarter of 2016 to discontinue the Company's U.S. bar grating product line and its European residential solar racking business which resulted in lower cash flows and estimated fair values of certain reporting units. The largest portion of the impairment was $8.0 million related to indefinite-lived intangibles in our Industrial and Infrastructure Products segment, with the balance of the charges occurring in the Renewable Energy and Conservation segment. In 2015, we recognized intangible asset impairment charges of $4.9 million, due to a reduction in estimated fair values of indefinite-lived trademarks at certain reporting units. The largest portion of the 2015 impairment was $4.4 million related to intangibles in our Industrial and Infrastructure Products segment.
24
The following table sets forth the Company’s income from operations and income from operations as a percentage of net sales by reportable segment for the years ended December 31 (in thousands):
Change Due To | |||||||||||||||||||||||||||
2016 | 2015 | Total Change | Intangible Impairment | Foreign Currency | Operations | ||||||||||||||||||||||
Income (loss) from operations: | |||||||||||||||||||||||||||
Residential Products | $ | 65,241 | 15.1 | % | $ | 46,804 | 9.8 | % | $ | 18,437 | $ | 440 | $ | 8,087 | $ | 9,910 | |||||||||||
Industrial and Infrastructure Products | 1,306 | 0.4 | % | 15,581 | 4.1 | % | (14,275 | ) | (3,557 | ) | (400 | ) | (10,318 | ) | |||||||||||||
Renewable Energy and Conservation | 43,214 | 15.3 | % | 12,659 | 6.7 | % | 30,555 | (2,195 | ) | — | 32,750 | ||||||||||||||||
Unallocated Corporate Expenses | (36,273 | ) | (3.6 | )% | (26,312 | ) | (2.5 | )% | (9,961 | ) | — | — | (9,961 | ) | |||||||||||||
Consolidated income (loss) | $ | 73,488 | 7.3 | % | $ | 48,732 | 4.7 | % | $ | 24,756 | $ | (5,312 | ) | $ | 7,687 | $ | 22,381 | ||||||||||
Our Residential Products segment generated an operating margin of 15.1% in 2016 compared to an operating margin of 9.8% in 2015. Apart from the impact of the gain of $6.8 million on the sale leaseback of a facility during the first quarter of 2015, the increase to its income from operations of $11.6 million was primarily due to the benefits of operational efficiencies and contributions from the 80/20 simplification initiative, along with favorable effects of currency fluctuations as compared to 2015. Partially offsetting these benefits were lower sales volumes primarily for postal products.
Our Industrial and Infrastructure Products segment operating margin decreased to 0.4% in 2016 compared to 4.1% in 2015. Excluding the impact of a net change in intangible asset impairment charges and foreign currency fluctuations, this segment's decrease in income from operations was $10.3 million. Decreased sales volume resulted in the margin decline, partially offset by an improved alignment of material costs to customer selling prices and benefits from cost reductions compared to the prior year.
The Renewable Energy and Conservation segment generated an operating margin of 15.3% in 2016 compared to 6.7% in 2015. The increase in its income from operations was aided by contribution from incremental revenue for 2016 compared to the prior year in which RBI was acquired in June of 2015, along with $5.1 million of amortization expense incurred for RBI's backlog acquired in 2015. Additionally, the execution of operational efficiencies in the segment, including rising synergies from raw material sourcing, freight management, and strategic make-versus-buy decisions also contributed to the increase in income and margin for the current year.
Unallocated corporate expenses increased $10.0 million, or 37.9%, for 2016 from $26.3 million for 2015 to $36.3 million for 2016. The increase from the prior year was primarily the result of an increase of $10.7 million in performance based compensation expense, the result of improvements in two key performance metrics. One metric is improved operating results which is measured by the Company's increased earnings per share and return on invested capital year over year. The other metric is the higher price of the Company's shares which increased 64% during 2016.
Other expense of $8.9 million in 2016 is primarily comprised of the $8.8 million pre-tax loss on the sale of our European industrial manufacturing business. Other income of $3.4 million in 2015 is primarily comprised of net gains on derivative contracts for hedges on foreign currencies and select raw materials related to a customer contract in our Residential Products segment, offset by foreign currency translation losses.
Interest expense decreased $0.4 million to $14.6 million for 2016 from $15.0 million for 2015. During 2016, no amounts were outstanding under our revolving credit facility. In 2015, we borrowed funds under our revolving credit facility to help finance the acquisition of RBI in June 2015. These borrowings were paid in full prior to the end of 2015.
We recognized a provision for income taxes of $16.3 million, an effective tax rate of 32.5%, for 2016 compared with a provision for income taxes of $13.6 million, an effective tax rate of 36.7%, for 2015. The difference between the Company’s recorded charge for 2016 and the expense that would result from applying the U.S. statutory rate of 35% is due to deductible permanent differences and favorable discrete items partially offset by state taxes. The aforementioned favorable discrete items were primarily comprised of the $6.7 million benefit recorded by the Company related to the worthless stock deduction and the associated inter-company debt discharge resulting from the sale of its European industrial manufacturing business to a third party. The effective tax rate for 2015 exceeded the U.S. federal statutory rate of 35% due to the tax impact of state taxes, partially offset by favorable permanent differences and favorable discrete items.
25
Outlook
In 2018, we plan to drive sustainable organic growth through the acceleration of new product development initiatives, continue to implement operational improvement projects, and to seek value-added acquisitions in attractive end markets. On a comparative basis, excluding the $12.5 million, or $0.39 per share, one-time benefit from tax reform recorded in 2017, we expect one again to have generated increased profits at a higher rate of return with a more efficient use of capital in 2018.
The Company is providing its guidance for revenues and earnings for the full year 2018. Gibraltar expects 2018 consolidated revenues to exceed $1 billion, considering modest growth across our end markets and continued traction from innovative products. GAAP EPS for the full year 2018 is expected to be between $1.75 and $1.87 per diluted share, as compared to $1.95 in 2017.
For the first quarter of 2018, the Company is expecting revenue in the range of $218 million to $225 million as a result of growth across all end markets and continued traction from innovative products. GAAP EPS for the first quarter 2018 is expected to be between $0.20 and $0.25 per diluted share.
Liquidity and Capital Resources
General
Our principal capital requirements are to fund our operations' working capital and capital improvements and to fund acquisitions. We will continue to invest in growth opportunities as appropriate while focusing on working capital efficiency and profit improvement opportunities to minimize the cash invested to operate our business. We have successfully generated positive cash flows from operating activities which have funded our capital requirements and recent acquisitions as noted below in “Cash Flows.”
On December 9, 2015, we entered into the Company's Fifth Amended and Restated Credit Agreement (the "Senior Credit Agreement") which includes a 5-year, $300 million revolving credit facility and provides the Company with access to capital and improved financial flexibility. As of December 31, 2017, our liquidity of $511.1 million consisted of $222.3 million of cash and $288.8 million of availability under our revolving credit facility as compared to liquidity of $457.4 million as of December 31, 2016. We believe this liquidity, together with the cash expected to be generated from operations, should be sufficient to fund working capital needs and simplification initiatives that likely will need cash to fund transitions and future growth. We continue to search for strategic acquisitions and larger acquisitions may require additional borrowings and/or the issuance of our common stock.
Our Senior Credit Agreement provides the Company with liquidity and capital resources for use by our U.S. operations. Historically, our foreign operations have generated cash flow from operations sufficient to invest in working capital and fund their capital improvements. As of December 31, 2017, our foreign subsidiaries held $29.7 million of cash. As a result of the Tax Cuts and Jobs Act ("Tax Reform Act") signed into law on December 22, 2017, $25.7 million of cash held by foreign subsidiaries is expected to be repatriated to the U.S. See Note 15 of this Form 10K for tax consequences of repatriation of foreign cash.
Over the long-term, we expect that future investments, including strategic business opportunities such as acquisitions, may be financed through a number of sources, including internally available cash, availability under our revolving credit facility, new debt financing, the issuance of equity securities, or any combination of the above. Any potential acquisitions are evaluated based on our acquisition strategy, which includes the enhancement of our existing products, operations, or capabilities, expanding our access to new products, markets, and customers, and the improvement of shareholder value. Our 2017 acquisition of Package Concierge and our 2016 acquisition of Nexus were funded by cash on hand.
These expectations are forward-looking statements based upon currently available information and may change if conditions in the credit and equity markets deteriorate or other circumstances change. To the extent that operating cash flows are lower than current levels, or sources of financing are not available or not available at acceptable terms, our future liquidity may be adversely affected.
26
Cash Flows
The following table sets forth selected cash flow data for the years ended December 31 (in thousands):
2017 | 2016 | ||||||
Cash provided by (used in): | |||||||
Operating activities of continuing operations | $ | 70,070 | $ | 123,987 | |||
Investing activities of continuing operations | (16,797 | ) | (23,870 | ) | |||
Financing activities of continuing operations | (2,598 | ) | 1,348 | ||||
Effect of exchange rate changes | 1,428 | (146 | ) | ||||
Net increase in cash and cash equivalents | $ | 52,103 | $ | 101,319 | |||
During the year ended December 31, 2017, we generated net cash from operating activities totaling $70.1 million, composed of net income of $63.0 million plus non-cash net charges totaling $22.1 million that included depreciation, amortization, deferred income taxes, stock compensation, and non-cash exit activity costs, partially offset by a net investment in working capital of $15.0 million. Net cash provided by operating activities for the year ended December 31, 2016 was $124.0 million and was primarily driven by non-cash net charges totaling $54.0 million that included depreciation, amortization, deferred income taxes, stock compensation, non-cash exit activity costs, intangible asset impairment charges, and the loss on sale of a business, along with income from continuing operations of $33.7 million and a decrease in working capital and other net assets of $36.3 million.
During 2017, the cash invested in working capital and other net assets of $15.0 million included $21.8 and $2.7 million increase in accounts receivable and other current assets and other assets, respectively, along with a $2.7 million decrease in accrued expenses and other non-current liabilities, partially offset by a $11.3 million increase in accounts payable and $0.9 million decrease in inventory. The increase in accounts receivable, which includes costs in excess of billings on contracts, is a direct result of higher net sales volume in our Renewable Energy & Conservation segment during the fourth quarter of 2017. The increase in other current assets and other assets is mainly due to the timing of prepaid expense. The decrease in accrued expenses and other non-current liabilities was partially due to a decrease in liabilities for equity based incentive plans resulting from resulting from the lower price of the Company's shares in 2017 compared with 2016, partially offset by billings in excess of costs related to the timing of customer contracts. The $11.3 million increase in accounts payable is primarily due to higher project volumes in our Renewable Energy & Conservation segment during the fourth quarter of 2017. The decrease in inventory continues to be a result of continued 80/20 simplification process efforts.
Net cash used in investing activities for 2017 of $16.8 million primarily consisted of $18.3 million of net cash paid for the acquisition of Package Concierge, capital expenditures of $11.4 million and a payment of $0.2 million related to the final purchase adjustment for the acquisition of Nexus. These payments were partially offset by net proceeds of $13.1 million from the sale of property and equipment. Net cash used in investing activities for 2016 of $23.9 million primarily consisted of $21.1 million of net cash paid for the acquisition of Nexus, along with capital expenditures of $10.8 million and $2.3 million paid for the final RBI acquisition purchase adjustment partially offset by net proceeds of $8.3 million received from the sale of our European industrial manufacturing business.
Net cash used in financing activities for 2017 of $2.6 million consisted of the purchase of treasury stock of $2.9 million and payments of long-term debt borrowings of $0.4 million offset by the proceeds received from the issuance of common stock of $0.7 million. Net cash provided by financing activities for 2016 of $1.4 million consisted of proceeds received from the issuance of common stock of $3.3 million offset by the purchase of treasury stock of $1.5 million and payments of long-term debt borrowings of $0.4 million.
Senior Credit Agreement and Senior Subordinated Notes
Our Senior Credit Agreement is committed through December 9, 2020. Borrowings under the 2015 Senior Credit Agreement are secured by the trade receivables, inventory, personal property, equipment, and certain real property of the Company’s significant domestic subsidiaries. The Senior Credit Agreement provides for a revolving credit facility and letters of credit in an aggregate amount of $300 million. The Company can request additional financing from the banks to increase the revolving credit facility to $500 million or enter into a term loan of up to $200 million subject to conditions set forth in the Senior Credit Agreement. The Senior Credit Agreement contains three financial covenants. As of December 31, 2017, the Company is in compliance with all three covenants.
27
Interest rates on the revolving credit facility are based on the LIBOR plus an additional margin that ranges from 1.25% to 2.25% for LIBOR loans based on the Total Leverage Ratio. In addition, the revolving credit facility is subject to an undrawn commitment fee ranging between 0.20% and 0.30% based on the Total Leverage Ratio and the daily average undrawn balance.
As of December 31, 2017, we had $288.8 million of availability under the Senior Credit Agreement net of outstanding letters of credit of $11.2 million. No amounts were outstanding under our revolving credit facility as of December 31, 2017, or our predecessor credit facility as of December 31, 2016.
In addition to our Senior Credit Agreement, the Company issued $210.0 million of 6.25% Notes in January 2013 which are due February 1, 2021. Provisions of the 6.25% Notes include, without limitation, restrictions on indebtedness, liens, and distributions from restricted subsidiaries, asset sales, affiliate transactions, dividends, and other restricted payments. Dividend payments are subject to annual limits and interest is paid semiannually on February 1 and August 1 of each year.
Off Balance Sheet Arrangements
The Company does not have any off balance sheet arrangements, other than operating leases, that have or are reasonably likely to have a current or future material effect on our financial condition, changes in financial condition, revenues or expenses, results of operations, liquidity, capital expenditures, or capital resources.
Contractual Obligations
The following table summarizes by category our Company’s expected future cash outflows associated with contractual obligations in effect at December 31, 2017 (in thousands):
Payments Due by Period | |||||||||||||||||||
Contractual Obligation | Total | Less than One Year | One to Three Years | Three to Five Years | More Than Five Years | ||||||||||||||
Fixed rate debt | $ | 210,000 | $ | — | $ | — | $ | 210,000 | $ | — | |||||||||
Interest on fixed rate debt | 40,469 | 13,125 | 26,250 | 1,094 | — | ||||||||||||||
Operating lease obligations | 40,668 | 11,072 | 15,795 | 8,590 | 5,211 | ||||||||||||||
Pension and other post-retirement payments | 5,618 | 1,156 | 1,051 | 960 | 2,451 | ||||||||||||||
Management stock purchase plan (1) | 16,983 | 4,923 | 7,843 | 3,999 | 218 | ||||||||||||||
Variable rate debt (including interest) (2) | 2,529 | 439 | 857 | 829 | 404 | ||||||||||||||
Performance stock unit awards | 20,096 | 13,774 | 6,322 | — | — | ||||||||||||||
Other | 314 | — | 314 | — | — | ||||||||||||||
Total | $ | 336,677 | $ | 44,489 | $ | 58,432 | $ | 225,472 | $ | 8,284 | |||||||||
(1) Includes amounts due to retired participants of the Management Stock Purchase Plan (MSPP). Excludes the future payments due to active participants of the MSPP, which represents a liability of $11.0 million as of December 31, 2017. The timing of future payments to active participants cannot be accurately estimated as we are uncertain of when active participants’ service to the Company will terminate. Active participants include those with pending retirements. Our policy does not recognize the contractual obligation until the participant has officially retired.
(2) Calculated using the interest rate in effect of 1.75% at December 31, 2017.
Critical Accounting Estimates
The preparation of the financial statements in conformity with accounting principles generally accepted in the United States of America requires management to make decisions based upon estimates, assumptions, and factors it considers relevant to the circumstances. Such decisions include the selection of applicable principles and the use of judgment in their application, the results of which could differ from those anticipated.
A summary of the Company’s significant accounting policies are described in Note 1 of the Company’s consolidated financial statements included in Part II, Item 8, Financial Statements and Supplementary Data, of this Annual Report on Form 10-K.
Our most critical accounting estimates include:
• | revenue recognition on contracts; |
28
• | valuation of accounts receivable; |
• | valuation of inventory; |
• | the allocation of the purchase price of acquisitions to the fair value of acquired assets and liabilities; |
• | the assessment of recoverability of depreciable and amortizable long-lived assets; |
• | the assessment of recoverability of goodwill and other indefinite-lived intangible assets; and |
• | accounting for income taxes and deferred tax assets and liabilities. |
Management reviews these estimates, including the allowance for doubtful accounts and inventory reserves, on a regular basis and makes adjustments based on historical experience, current conditions, and future expectations. Management believes these estimates are reasonable, but actual results could differ from these estimates.
Revenue Recognition on Contracts
The vast majority of our sales agreements are for standard products and services, with revenue recognized on the accrual basis at the time of shipment of goods, transfer of title and customer acceptance, where required. However, revenue representing 28% and 26% of 2017 and 2016 consolidated net sales was accounted for using the percentage of completion, cost-to-cost method of accounting. This method of revenue recognition only pertains to the activities of RBI which was acquired on June 9, 2015.
Revenue on contracts using the percentage of completion method of accounting is recognized as work progresses toward completion as determined by the ratio of cumulative costs incurred to date to estimated total contract costs at completion, multiplied by the total contract revenue. Changes in estimates affecting sales, costs and profits are recognized in the period in which the change becomes known using the cumulative catch-up method of accounting, resulting in the cumulative effect of changes reflected in the period. Estimates are reviewed and updated quarterly for substantially all contracts. A significant change in an estimate on one or more contracts could have a material effect on our results of operations.
Contract costs include all direct costs related to contract performance. Selling and administrative expenses are charged to operations as incurred. Provisions for estimated losses on uncompleted contracts are made in the period in which such losses are determined. Because of inherent uncertainties in estimating costs, it is reasonably possible that changes in performance could result in revisions to cost and revenue, which are recognized in the period when the revisions are determined.
Valuation of Accounts Receivable
Our accounts receivable represent those amounts that have been billed to our customers but not yet collected, as well as, costs in excess of billings which principally represent revenues recognized on contracts that were not billable as of the balance sheet date. As of December 31, 2017 and 2016, allowances for doubtful accounts of $6.4 million and $5.3 million were recorded, or approximately 4% of gross accounts receivable for both periods, respectively. We record an allowance for doubtful accounts based on the portion of those accounts receivable that we believe are potentially uncollectible based on various factors, including experience, creditworthiness of customers, and current market and economic conditions. If the financial condition of customers were to deteriorate, resulting in impairment of their ability to make payments, additional allowances may be required. Changes in judgments on these factors could impact the timing of costs recognized.
Valuation of Inventories
We record our inventories at the lower of cost or net realizable value. We determine the cost basis of our inventory on a first-in, first-out basis using a standard cost methodology that approximates actual cost. On a regular basis, we calculate an estimated market value of our inventory, considered to be the prevailing selling price for the inventory less the cost to complete and sell the product. We compare the current carrying value of our inventory to the estimated market value to determine whether a reserve to value inventory at the lower of cost or net realizable value is necessary. We recorded insignificant charges during the three year periods ended December 31, 2017, 2016, and 2015 to value our inventory at the lower of cost or net realizable value.
We regularly review inventory on hand and record provisions for excess, obsolete, and slow-moving inventory based on historical and current sales trends. We recorded reserves for excess, obsolete, and slow-moving inventory of $3.7 million and $3.8 million at December 31, 2017 and 2016, respectively, or approximately 4% of gross inventories for both periods. Changes in product demand and our customer base may affect the value of inventory on hand, which may require higher provisions for obsolete inventory.
In addition, as a result of the Company's 80/20 simplification initiative and portfolio management, we have identified low-volume, internally-produced products which have been or will be planned to be outsourced or discontinued. We have recorded
29
charges of $1.2 million and $3.6 million during the years ended December 31, 2017 and 2016, respectively, related to the write-down of inventory associated with either discontinued product lines or the reduction of manufactured goods offered within a product line. These assets were written down to their sale or scrap value, and were subsequently sold or disposed of. Further simplification initiatives in 2018 could be identified which may result in additional write-downs of inventory.
Accounting for Acquired Assets and Liabilities
When we acquire a business, we allocate the purchase price to the assets acquired and liabilities assumed in the transaction at their respective estimated fair values. We record any premium over the fair value of net assets acquired as goodwill. Significant judgment is necessary to determine the fair value of the purchase price. The allocation of the purchase price involves judgments and estimates both in characterizing the assets and in determining their fair value. The way we characterize the assets has important implications, as long-lived assets with definitive lives, for example, are depreciated or amortized, whereas goodwill is tested annually for impairment, as explained below.
With respect to determining the fair value of the purchase price, the most subjective estimates involve valuations of contingent consideration. We engage independent third party valuation specialists to assist in the determination of the fair value of contingent consideration. Key assumptions used to value the contingent consideration include future projections and discount rates.
With respect to determining the fair value of assets, the most subjective estimates involve valuations of long-lived assets, such as property, plant, and equipment as well as identified intangible assets. We use all available information to make these fair value determinations and engage independent valuation specialists to assist in the fair value determination of the acquired long-lived assets. The fair values of long-lived assets are determined using valuation techniques that use discounted cash flow methods, independent market appraisals, and other acceptable valuation techniques.
Due to the subjectivity inherent in determining the fair value of long-lived assets and the significant number of acquisitions we have completed, we believe the allocation of purchase price to acquired assets and liabilities is a critical accounting policy.
Impairment of Depreciable and Amortizable Long-lived Assets
We test long-lived assets for impairment when events or changes in circumstances indicate that the carrying amount of those assets may not be recoverable and exceeds their fair value, or on an annual basis at minimum. During our annual test, we perform a recoverability test by comparing the carrying amount of asset groups to future undiscounted cash flows expected to result from the use of the assets. The impairment loss would be measured as the amount by which the carrying amount of a long-lived asset exceeds its fair value as determined by discounted cash flow method, an independent market appraisal of the asset, or another acceptable valuation technique.
In 2017, after completing the recoverability test, none of the Company's reporting unit's future undiscounted cash flows were less than the carrying amount of its assets. However, as a result of the Company's 80/20 simplification initiative and portfolio management, we have identified low-volume, internally-produced products which have been or are planned to be outsourced or discontinued. We have recorded charges or recoveries related to the impairment of property, plant and equipment associated with either discontinued product lines or the reduction of manufactured goods offered within a product line. These assets were written down to their sale or scrap value, and were subsequently sold or disposed of. For the year ended December 31, 2017, we recorded a net recovery of $3.0 million on assets sold that were previously identified or impaired during the year ended December 31, 2016. We recorded charges of $3.9 million during the year ended December 31, 2016 related to these initiatives. Further simplification initiatives in 2018 could be identified which may result in additional impairments.
Goodwill and Other Indefinite-lived Intangible Asset Impairment Testing
Our goodwill and indefinite-lived intangible asset balances of $321.1 million and $45.1 million, respectively, which in aggregate represent 37% of total assets as of December 31, 2017, are subject to impairment testing. We test goodwill and indefinite-lived intangible assets for impairment on an annual basis as of October 31 and at interim dates when indicators of impairment are present. Indicators of impairment could include a significant long-term adverse change in business climate, poor indicators of operating performance, or a sale or disposition of a significant portion of a reporting unit.
We test goodwill for impairment at the reporting unit level. We identify our reporting units by assessing whether the components of our Company constitute businesses for which discrete financial information is available and segment management regularly reviews the operating results of those components. We have eleven reporting units, ten of which have goodwill.
30
During interim periods, we evaluate the potential for goodwill impairment using a qualitative assessment by considering factors such as, but not limited to, macroeconomic conditions, industry conditions, the competitive environment, changes in the market for our products and services, regulatory and political developments, entity specific factors such as strategy, changes in key personnel, and overall financial performance. If, after completing this assessment, it is determined that it is more likely than not that the fair value of a reporting unit is less than its carrying value, we proceed to a quantitative impairment test. During the interim periods of 2017, we concluded that no indicators of impairment existed at interim dates and did not perform any interim impairment tests related to goodwill and indefinite-lived intangible assets.
The Company conducts its annual impairment test on all eleven reporting units as of October 31, during which we test goodwill and other indefinite-lived intangible assets for impairment. On an annual basis, the quantitative goodwill impairment test consists of comparing the fair value of a reporting unit, as determined using two valuation methodologies described below, with the carrying amount of the reporting unit including goodwill. If the carrying amount of the reporting unit exceeds the reporting unit’s fair value, an impairment loss is recognized in the amount by which the carrying value of the reporting unit exceeds the fair value of the reporting unit.
As a result of our quantitative testing, none of the reporting units with goodwill as of our testing date had carrying values in excess of their fair values, nor were any of the reporting units at risk of impairment. There were no impairment charges against goodwill recorded during the years ended December 31, 2017 and 2015. In 2016, the Company discontinued its European residential solar racking business which resulted in an impairment charge against goodwill of $0.9 million.
The fair value of each reporting unit is determined using a weighted average of the fair values calculated under two valuation techniques: an income approach and a market approach.
The income approach included a discounted cash flow model relying on significant assumptions consisting of revenue growth rates and profit margins based on internal forecasts, terminal value, and the weighted average cost of capital ("WACC") used to discount future cash flows. Internal forecasts of revenue growth, operating margins, and working capital needs of each reporting unit over the next five years were developed with consideration of macroeconomic factors, historical performance, and planned activities. We made a terminal value assumption that cash flows would grow 3.0% each year subsequent to 2022 based on our approximation of gross domestic product growth. To determine the WACC, we used a standard valuation method, the capital asset pricing model, based on readily available and current market data of peer companies considered market participants. Acknowledging the varying degrees of risk inherent in each reporting units’ ability to achieve long-term forecasted cash flows in applying the income approach, we applied a reporting unit-specific risk premium to the WACC of each reporting unit, the extent of which was determined based upon each reporting unit’s past operating performance and their relative ability to achieve the forecasted cash flows. The income approach is weighted at 67% when arriving at our concluded estimate of the fair value of each reporting unit, as this technique uses a long-term approach that considers the expected operating profit of each reporting unit during periods where macroeconomic indicators are nearer historical averages. This weighting approach is consistent with prior years.
The market approach consisted of applying the Earnings Before Interest, Taxes, Depreciation and Amortization ("EBITDA") multiple to the forecasted EBITDA to be generated in the next two years in determining an estimated fair value for the reporting unit. The market approach also relied on the same significant assumptions used in the discounted cash flow model, consisting of revenue growth rates and profit margins based on internal forecasts and the EBITDA multiple selected from an analysis of peer companies. Similar to the WACC analysis, we assessed the risk of each reporting unit achieving its forecasts with consideration given to how each reporting unit has performed historically compared to forecasts. We also evaluated each reporting units' expected growth and historical performance relative to that of the peer companies and made adjustments to the multiples where the growth rates and historical performance deviated from the peer companies. The market approach is weighted at 33% when arriving at our concluded estimate of the fair value of each reporting unit. This weighting approach is consistent with prior years.
Indefinite-Lived Intangibles
We test our indefinite-lived intangible assets for impairment by comparing the fair value of the indefinite-lived intangible asset, determined using a discounted cash flow model, with its carrying amount. Each reporting period, we perform an evaluation of the remaining useful life of our indefinite-lived intangible assets to determine whether events and circumstances continue to support an indefinite useful life. If an indefinite-lived intangible asset is subsequently determined to have a finite useful life, the asset is tested for impairment and then amortized prospectively over its estimated remaining useful life, and accounted for in the same manner as other intangible assets that are subject to amortization.
31
The assumptions used to determine the fair value of our indefinite-lived intangible assets are consistent with the assumptions employed in the determination of the fair values of our reporting units. An impairment loss would be recognized for the carrying amount in excess of its fair value. The fair values of the impaired trademarks were determined using an income approach consisting of the relief-from-royalty method. During 2017, the Company recognized $0.2 million of impairment charges on our indefinite-lived intangible assets. In 2016, the Company incurred $7.8 million of impairment charges related to the Company's discontinued European residential solar racking business and U.S. bar grating product line, and an additional $1.2 million of impairment charges were recognized in 2016 as a result of the Company's annual impairment test. The Company recognized total impairment charges of $9.0 million in 2016 related to indefinite-lived intangible assets, and $4.9 million in 2015.
Accounting for Income Taxes and Deferred Tax Assets and Liabilities
Significant management judgment is required in determining our provision for income taxes, deferred tax assets and liabilities, and any valuation allowances. Our effective tax rates differ from the statutory rate due to the impact of permanent differences between income or loss reported for financial statement purposes and tax purposes, provisions for uncertain tax positions, state taxes, and income generated by international operations. Our effective tax rate was 19.2% for the year ended December 31, 2017. The effective tax rates were 32.5% and 36.7% for the years ended December 2016 and 2015, respectively. Our future effective tax rates could be adversely affected by earnings being lower than anticipated in countries where we have lower statutory rates and vice versa. Changes in the valuation of our deferred tax assets or liabilities or changes in tax laws or interpretations thereof may also adversely affect our future effective tax rate. In addition, we are subject to the continuous examination of our income tax returns by the Internal Revenue Service and other tax authorities. We regularly assess the likelihood of adverse outcomes resulting from these examinations to determine the adequacy of our provision for income taxes.
Deferred tax assets and liabilities are determined based upon the differences between the financial statement and tax bases of assets and liabilities as measured by the enacted tax rates that will be in effect when these differences reverse. On December 22, 2017, the President of the United States signed into law the Tax Cuts and Jobs Act (the “Tax Reform Act”), which permanently reduces the U.S. corporate income tax rate from a maximum of 35% to a flat 21% rate, effective January 1, 2018. See Note 15 of the consolidated financial statements for the Company's income tax disclosures.
Valuation allowances are provided if, based upon the weight of available evidence, it is more likely than not that some or all of the deferred tax assets will not be realized. We maintained a valuation allowance of $2.2 million and $1.4 million as of December 31, 2017 and 2016, respectively, due to uncertainties related to our ability to realize these assets, primarily consisting of state net operating losses and other deferred tax assets. The valuation allowances are based on estimates of taxable income in each of the jurisdictions in which we operate and the period over which our deferred tax assets will be recoverable. If market conditions improve and future results of operations exceed our current expectations, our existing tax valuation allowances may be adjusted. Alternatively, if market conditions deteriorate further or future operating results do not meet expectations, future assessments may result in a determination that some or all of the deferred tax assets are not realizable. As a result, we may need to establish additional tax valuation allowances for all or a portion of the gross deferred tax assets, which may have a material adverse effect on our results of operations and financial condition.
It is our policy to classify estimated interest and penalties due to tax authorities as income tax. Insignificant amounts of interest and penalties were recognized in the provision for income taxes for the years ended December 31, 2017, 2016 and 2015. Additionally, we classify tax credits as a reduction to income tax expense.
The Company recognizes the tax benefit from an uncertain tax position only if it is more likely than not that the tax position will be sustained on examination by tax authorities, based on the technical merits of each position. The tax benefits recognized in the financial statements from such a position are measured based on the largest benefit that has a greater than fifty percent likelihood of being realized upon ultimate resolution. As of December 31, 2017 and 2016, the liability for uncertainty in income tax positions was $3.5 million. Due to the high degree of uncertainty regarding the timing of potential future cash flows associated with these liabilities, we are unable to make a reasonably reliable estimate of the amount and period in which these liabilities might be paid.
Recent Accounting Pronouncements
See Note 1 to the Company's consolidated financial statements in Part II, Item 8, Financial Statements and Supplementary Data, of this Form 10-K for further information on recent accounting pronouncements.
32
Item 7A. | Quantitative and Qualitative Disclosures about Market Risk |
In the ordinary course of business, the Company is exposed to various market risk factors, including changes in general economic conditions, competition, and raw materials pricing and availability. In addition, the Company is exposed to other financial market risks, primarily related to its long-term debt and foreign operations.
Raw Material Pricing Risk
We are subject to market risk exposure related to volatility in the price of steel, aluminum and resins. A significant amount of our cost of sales relates to material costs. Our business is heavily dependent on the price and supply of our raw materials. The commodity market, which includes the steel, aluminum, and resin industries, is highly cyclical in nature, and commodity costs have been volatile in recent years, and may become more volatile in the future. Commodity costs are influenced by numerous factors beyond our control, including general economic conditions, the availability of raw materials, competition, labor costs, freight and transportation costs, production costs, import duties and other trade restrictions.
The Company principally manages its exposures to the market fluctuations in the steel and resins industries through management of its core business activities. Although we have the ability to purchase steel from a number of suppliers, a production cutback by one or more of our current suppliers could create challenges in meeting delivery schedules to our customers. The prices we offer to our customers are also impacted by changes in commodity costs. We manage the alignment of the cost of our raw materials and prices offered to customers and attempt to pass changes to raw material costs through to our customers. To improve our management of commodity costs, we attempt to maintain inventory levels not in excess of our production requirements.
We have not entered into long-term contractual commitments for the purchase of raw materials however, from time to time, we may purchase raw materials in advance of commodity cost increases.
We rely on major suppliers for our supply of raw materials. During 2017, we purchased our raw materials from domestic and foreign suppliers in an effort to purchase the lowest cost material as possible.
We cannot accurately calculate the pre-tax impact a one percent change in the commodity costs would have on our 2017 operating results as the change in commodity costs would both impact the cost to purchase materials and the selling prices we offer our customers. The impact to our operating results would significantly depend on the competitive environment and the costs of other alternative building products, which could impact our ability to pass commodity costs to our customers.
Interest Rate Risk
To manage interest rate risk, the Company uses both fixed and variable interest rate debt. Our fixed rate debt consists of the Company’s Senior Subordinated 6.25% Notes and was the only significant debt that remains outstanding at year end. We believe we limited our exposure to interest rate risk as a result of repaying substantially all variable rate debt and the long-term nature of our fixed rate debt. However, the Company will continue to monitor changes in its debt levels and access to capital ensuring interest rate risk is appropriately managed.
At December 31, 2017, our fixed rate debt consisted primarily of $210.0 million of our 6.25% Notes. The Company’s $210.0 million of 6.25% Notes were issued in January 2013 and are due February 1, 2021.
Our variable rate debt consists primarily of the revolving credit facility under the Senior Credit Agreement, which was amended and restated on December 9, 2015, and other debt. No amounts are outstanding on the revolving credit facility as of December 31, 2017. Borrowings under the revolving credit facility bear interest at a variable interest rate based upon the LIBOR plus an additional margin. A hypothetical 1% increase or decrease in interest rates would have changed the 2017 interest expense by less than $0.1 million.
33
Foreign Exchange Risk
The Company has foreign exchange risk due to our international operations, primarily in Canada and Asia and through sales and purchases from foreign customers and vendors. Changes in the values of currencies of foreign countries affect our financial position and cash flows when translated into U.S. dollars. The Company principally manages its exposures to many of these foreign exchange rate risks solely through management of its core business activities. We cannot accurately calculate the pre-tax impact that a one percent change in the exchange rates of foreign currencies would have on our 2017 operating results as the changes in exchange rates would impact the cost of materials, the U.S. dollar revenue equivalents, and potentially the prices offered to our overseas customers.
34
Item 8. | Financial Statements and Supplementary Data |
Page Number | |
Financial Statements: | |
Supplementary Data: | |
35
Report of Independent Registered Public Accounting Firm
To the Board of Directors and Shareholders of Gibraltar Industries, Inc.
Opinion on the Financial Statements
We have audited the accompanying consolidated balance sheets of Gibraltar Industries, Inc. (the Company) as of December 31, 2017 and 2016, the related consolidated statements of operations, comprehensive income (loss), shareholders’ equity and cash flows for each of the three years in the period ended December 31, 2017, and the related notes (collectively referred to as the "consolidated financial statements"). In our opinion, the consolidated financial statements present fairly, in all material respects, the financial position of the Company at December 31, 2017 and 2016, and the results of its operations and its cash flows for each of the three years in the period ended December 31, 2017, in conformity with US generally accepted accounting principles.
We also have audited, in accordance with the standards of the Public Company Accounting Oversight Board (United States) (PCAOB), the Company’s internal control over financial reporting as of December 31, 2017, based on criteria established in Internal Control-Integrated Framework issued by the Committee of Sponsoring Organizations of the Treadway Commission (2013 framework) and our report dated February 27, 2018 expressed an unqualified opinion thereon.
Basis for Opinion
These financial statements are the responsibility of the Company‘s management. Our responsibility is to express an opinion on the Company’s financial statements based on our audits. We are a public accounting firm registered with the PCAOB and are required to be independent with respect to the Company in accordance with the U.S. federal securities laws and the applicable rules and regulations of the Securities and Exchange Commission and the PCAOB.
We conducted our audits in accordance with the standards of the PCAOB. Those standards require that we plan and perform the audit to obtain reasonable assurance about whether the financial statements are free of material misstatement, whether due to error or fraud. Our audits included performing procedures to assess the risks of material misstatement of the financial statements, whether due to error or fraud, and performing procedures that respond to those risks. Such procedures included examining, on a test basis, evidence regarding the amounts and disclosures in the financial statements. Our audits also included evaluating the accounting principles used and significant estimates made by management, as well as evaluating the overall presentation of the financial statements. We believe that our audits provide a reasonable basis for our opinion.
/s/ Ernst & Young LLP
We have served as the Company‘s auditor since 2005.
Buffalo, New York
February 27, 2018
36
GIBRALTAR INDUSTRIES, INC.
CONSOLIDATED STATEMENTS OF OPERATIONS
(in thousands, except per share data)
Years Ended December 31, | |||||||||||
2017 | 2016 | 2015 | |||||||||
Net sales | $ | 986,918 | $ | 1,007,981 | $ | 1,040,873 | |||||
Cost of sales | 750,374 | 763,219 | 853,897 | ||||||||
Gross profit | 236,544 | 244,762 | 186,976 | ||||||||
Selling, general, and administrative expense | 143,448 | 161,099 | 133,381 | ||||||||
Intangible asset impairment | 247 | 10,175 | 4,863 | ||||||||
Income from operations | 92,849 | 73,488 | 48,732 | ||||||||
Interest expense | 14,032 | 14,577 | 15,003 | ||||||||
Other expense (income) | 909 | 8,928 | (3,371 | ) | |||||||
Income before taxes | 77,908 | 49,983 | 37,100 | ||||||||
Provision for income taxes | 14,943 | 16,264 | 13,624 | ||||||||
Income from continuing operations | 62,965 | 33,719 | 23,476 | ||||||||
Discontinued operations: | |||||||||||
Loss before taxes | (644 | ) | (70 | ) | (44 | ) | |||||
Benefit of income taxes | (239 | ) | (26 | ) | (16 | ) | |||||
Loss from discontinued operations | (405 | ) | (44 | ) | (28 | ) | |||||
Net income | $ | 62,560 | $ | 33,675 | $ | 23,448 | |||||
Net earnings per share – Basic: | |||||||||||
Income from continuing operations | $ | 1.98 | $ | 1.07 | $ | 0.75 | |||||
Loss from discontinued operations | (0.01 | ) | — | — | |||||||
Net income | $ | 1.97 | $ | 1.07 | $ | 0.75 | |||||
Weighted average shares outstanding – Basic | 31,701 | 31,536 | 31,233 | ||||||||
Net earnings per share – Diluted: | |||||||||||
Income from continuing operations | $ | 1.95 | $ | 1.05 | $ | 0.74 | |||||
Loss from discontinued operations | (0.01 | ) | — | — | |||||||
Net income | $ | 1.94 | $ | 1.05 | $ | 0.74 | |||||
Weighted average shares outstanding – Diluted | 32,250 | 32,069 | 31,545 | ||||||||
37
GIBRALTAR INDUSTRIES, INC.
CONSOLIDATED STATEMENTS OF COMPREHENSIVE INCOME (LOSS)
(in thousands)
Years Ended December 31, | |||||||||||
2017 | 2016 | 2015 | |||||||||
Net income | $ | 62,560 | $ | 33,675 | $ | 23,448 | |||||
Other comprehensive income (loss): | |||||||||||
Foreign currency translation adjustment | 3,150 | 6,945 | (6,228 | ) | |||||||
Reclassification of loss on cash flow hedges, net of tax | — | — | 143 | ||||||||
Adjustment to retirement benefit liability, net of tax | (9 | ) | 55 | 49 | |||||||
Adjustment to post-retirement healthcare benefit liability, net of tax | 214 | 695 | 171 | ||||||||
Other comprehensive income (loss) | 3,355 | 7,695 | (5,865 | ) | |||||||
Total comprehensive income | $ | 65,915 | $ | 41,370 | $ | 17,583 | |||||
38
GIBRALTAR INDUSTRIES, INC.
CONSOLIDATED BALANCE SHEETS
(in thousands)
December 31, 2017 | December 31, 2016 | ||||||
Assets | |||||||
Current assets: | |||||||
Cash and cash equivalents | $ | 222,280 | $ | 170,177 | |||
Accounts receivable, net | 145,385 | 124,072 | |||||
Inventories | 86,372 | 89,612 | |||||
Other current assets | 8,727 | 7,336 | |||||
Total current assets | 462,764 | 391,197 | |||||
Property, plant, and equipment, net | 97,098 | 108,304 | |||||
Goodwill | 321,074 | 304,032 | |||||
Acquired intangibles | 105,768 | 110,790 | |||||
Other assets | 4,681 | 3,922 | |||||
$ | 991,385 | $ | 918,245 | ||||
Liabilities and Shareholders’ Equity | |||||||
Current liabilities: | |||||||
Accounts payable | $ | 82,387 | $ | 69,944 | |||
Accrued expenses | 75,467 | 70,392 | |||||
Billings in excess of cost | 12,779 | 11,352 | |||||
Current maturities of long-term debt | 400 | 400 | |||||
Total current liabilities | 171,033 | 152,088 | |||||
Long-term debt | 209,621 | 209,237 | |||||
Deferred income taxes | 31,237 | 38,002 | |||||
Other non-current liabilities | 47,775 | 58,038 | |||||
Shareholders’ equity: | |||||||
Preferred stock, $0.01 par value; authorized 10,000 shares; none outstanding | — | — | |||||
Common stock, $0.01 par value; authorized 50,000 shares; 32,332 and 32,085 shares outstanding in 2017 and 2016 | 323 | 320 | |||||
Additional paid-in capital | 271,957 | 264,418 | |||||
Retained earnings | 274,562 | 211,748 | |||||
Accumulated other comprehensive loss | (4,366 | ) | (7,721 | ) | |||
Cost of 615 and 530 common shares held in treasury in 2017 and 2016 | (10,757 | ) | (7,885 | ) | |||
Total shareholders’ equity | 531,719 | 460,880 | |||||
$ | 991,385 | $ | 918,245 | ||||
39
GIBRALTAR INDUSTRIES, INC.
CONSOLIDATED STATEMENTS OF CASH FLOWS
(in thousands)
Years Ended December 31, | |||||||||||
2017 | 2016 | 2015 | |||||||||
Cash Flows from Operating Activities | |||||||||||
Net income | $ | 62,560 | $ | 33,675 | $ | 23,448 | |||||
Loss from discontinued operations | (405 | ) | (44 | ) | (28 | ) | |||||
Income from continuing operations | 62,965 | 33,719 | 23,476 | ||||||||
Adjustments to reconcile net income to net cash provided by operating activities: | |||||||||||
Depreciation and amortization | 21,690 | 24,114 | 30,548 | ||||||||
Intangible asset impairment | 247 | 10,175 | 4,863 | ||||||||
Loss on sale of business | — | 8,763 | — | ||||||||
Stock compensation expense | 7,122 | 6,373 | 3,891 | ||||||||
Net gain on sale of assets | (123 | ) | (42 | ) | (6,431 | ) | |||||
Exit activity (recoveries) costs, non-cash | (1,877 | ) | 7,530 | 8,504 | |||||||
Benefit of deferred income taxes | (7,105 | ) | (4,893 | ) | (2,051 | ) | |||||
Other, net | 2,118 | 1,934 | 4,759 | ||||||||
Changes in operating assets and liabilities (excluding the effects of acquisitions): | |||||||||||
Accounts receivable | (21,806 | ) | 37,828 | (17,215 | ) | ||||||
Inventories | 870 | 11,782 | 22,271 | ||||||||
Other current assets and other assets | (2,629 | ) | 2,511 | 759 | |||||||
Accounts payable | 11,332 | (17,060 | ) | (5,157 | ) | ||||||
Accrued expenses and other non-current liabilities | (2,734 | ) | 1,253 | 19,004 | |||||||
Net cash provided by operating activities | 70,070 | 123,987 | 87,221 | ||||||||
Cash Flows from Investing Activities | |||||||||||
Purchases of property, plant, and equipment | (11,399 | ) | (10,779 | ) | (12,373 | ) | |||||
Acquisitions, net of cash acquired | (18,494 | ) | (23,412 | ) | (140,621 | ) | |||||
Net proceeds from sale of property and equipment | 13,096 | 953 | 26,500 | ||||||||
Net proceeds from sale of business | — | 8,250 | — | ||||||||
Other, net | — | 1,118 | 1,154 | ||||||||
Net cash used in investing activities | (16,797 | ) | (23,870 | ) | (125,340 | ) | |||||
Cash Flows from Financing Activities | |||||||||||
Long-term debt payments | (400 | ) | (400 | ) | (73,642 | ) | |||||
Proceeds from long-term debt | — | — | 73,242 | ||||||||
Payment of debt issuance costs | — | (54 | ) | (1,166 | ) | ||||||
Purchase of treasury stock at market prices | (2,872 | ) | (1,539 | ) | (956 | ) | |||||
Net proceeds from issuance of common stock | 674 | 3,341 | 1,801 | ||||||||
Net cash (used in) provided by financing activities | (2,598 | ) | 1,348 | (721 | ) | ||||||
Effect of exchange rate changes on cash | 1,428 | (146 | ) | (2,912 | ) | ||||||
Net increase (decrease) in cash and cash equivalents | 52,103 | 101,319 | (41,752 | ) | |||||||
Cash and cash equivalents at beginning of year | 170,177 | 68,858 | 110,610 | ||||||||
Cash and cash equivalents at end of year | $ | 222,280 | $ | 170,177 | $ | 68,858 | |||||
40
GIBRALTAR INDUSTRIES, INC.
CONSOLIDATED STATEMENTS OF SHAREHOLDERS’ EQUITY
(in thousands)
Common Stock | Additional Paid-In Capital | Retained Earnings | Accumulated Other Comprehensive Loss | Treasury Stock | Total Shareholders’ Equity | ||||||||||||||||||||||||
Shares | Amount | Shares | Amount | ||||||||||||||||||||||||||
Balance at December 31, 2014 | 31,342 | $ | 313 | $ | 247,232 | $ | 154,625 | $ | (9,551 | ) | 429 | $ | (5,390 | ) | $ | 387,229 | |||||||||||||
Net income | — | — | — | 23,448 | — | — | — | 23,448 | |||||||||||||||||||||
Foreign currency translation adjustment | — | — | — | — | (6,228 | ) | — | — | (6,228 | ) | |||||||||||||||||||
Adjustment to retirement benefit liability, net of taxes of $26 | — | — | — | — | 49 | — | — | 49 | |||||||||||||||||||||
Adjustment to post-retirement healthcare benefit liability, net of taxes of $99 | — | — | — | — | 171 | — | — | 171 | |||||||||||||||||||||
Unrealized loss on cash flow hedges, net of tax of $82 | — | — | — | — | 143 | — | — | 143 | |||||||||||||||||||||
Stock compensation expense | — | — | 3,891 | — | — | — | — | 3,891 | |||||||||||||||||||||
Excess tax benefit from stock compensation | — | — | 537 | — | — | — | — | 537 | |||||||||||||||||||||
Net settlement of restricted stock units | 297 | 3 | (3 | ) | — | — | 55 | (956 | ) | (956 | ) | ||||||||||||||||||
Issuance of restricted stock | 21 | — | — | — | — | — | — | — | |||||||||||||||||||||
Stock options exercised | 119 | 1 | 1,801 | — | — | — | — | 1,802 | |||||||||||||||||||||
Balance at December 31, 2015 | 31,779 | $ | 317 | $ | 253,458 | $ | 178,073 | $ | (15,416 | ) | 484 | $ | (6,346 | ) | $ | 410,086 | |||||||||||||
Net income | — | — | — | 33,675 | — | — | — | 33,675 | |||||||||||||||||||||
Foreign currency translation adjustment | — | — | — | — | 6,945 | — | — | 6,945 | |||||||||||||||||||||
Adjustment to retirement benefit liability, net of taxes of $24 | — | — | — | — | 55 | — | — | 55 | |||||||||||||||||||||
Adjustment to post-retirement healthcare benefit liability, net of taxes of $406 | — | — | — | — | 695 | — | — | 695 | |||||||||||||||||||||
Stock compensation expense | — | — | 6,373 | — | — | — | — | 6,373 | |||||||||||||||||||||
Excess tax benefit from stock compensation | — | — | 1,249 | — | — | — | — | 1,249 | |||||||||||||||||||||
Net settlement of restricted stock units | 131 | 1 | (1 | ) | — | — | 46 | (1,539 | ) | (1,539 | ) | ||||||||||||||||||
Stock options exercised | 175 | 2 | 3,339 | — | — | — | — | 3,341 | |||||||||||||||||||||
Balance at December 31, 2016 | 32,085 | $ | 320 | $ | 264,418 | $ | 211,748 | $ | (7,721 | ) | 530 | $ | (7,885 | ) | $ | 460,880 | |||||||||||||
Net income | — | — | — | 62,560 | — | — | — | 62,560 | |||||||||||||||||||||
Foreign currency translation adjustment | — | — | — | — | 3,150 | — | — | 3,150 | |||||||||||||||||||||
Adjustment to retirement benefit liability, net of taxes of $(17) | — | — | — | — | (9 | ) | — | — | (9 | ) | |||||||||||||||||||
Adjustment to post-retirement healthcare benefit liability, net of taxes of $127 | — | — | — | — | 214 | — | — | 214 | |||||||||||||||||||||
Stock compensation expense | — | — | 7,122 | — | — | — | — | 7,122 | |||||||||||||||||||||
Cumulative effect of accounting change (see Note 1) | — | — | (254 | ) | 254 | — | — | — | — | ||||||||||||||||||||
Net settlement of restricted stock units | 203 | 3 | (3 | ) | — | — | 85 | (2,872 | ) | (2,872 | ) | ||||||||||||||||||
Issuance of restricted stock | 2 | — | — | — | — | — | — | — | |||||||||||||||||||||
Stock options exercised | 42 | — | 674 | — | — | — | — | 674 | |||||||||||||||||||||
Balance at December 31, 2017 | 32,332 | $ | 323 | $ | 271,957 | $ | 274,562 | $ | (4,366 | ) | 615 | $ | (10,757 | ) | $ | 531,719 | |||||||||||||
41
GIBRALTAR INDUSTRIES, INC.
NOTES TO CONSOLIDATED FINANCIAL STATEMENTS
1. SUMMARY OF SIGNIFICANT ACCOUNTING POLICIES
Principles of consolidation
The consolidated financial statements include the accounts of Gibraltar Industries, Inc. and subsidiaries (the "Company"). All intercompany accounts and transactions have been eliminated in consolidation.
Use of estimates
The preparation of the consolidated financial statements in conformity with accounting principles generally accepted in the United States of America requires management to make estimates and assumptions that affect the amounts reported in the consolidated financial statements and accompanying notes. Actual results could differ from those estimates.
Revenue recognition
The majority of the Company's revenue is recognized when products are shipped or service is provided, the customer takes ownership and assumes the risk of loss, collection of the corresponding receivable is probable, persuasive evidence of an arrangement exists, and the sales price is fixed or determinable. Sales returns, allowances, and customer incentives, including rebates, are treated as reductions to sales and are provided for based on historical experience and current estimates.
Revenues representing 28.0% and 25.8% of sales for the years ended December 31, 2017 and 2016, respectively, were recognized under the percentage of completion accounting method as calculated by the cost-to-cost measurement method on contracts. The recognition of revenue under this method is utilized in the Renewable Energy and Conservation segment.
Revenue from contracts using the percentage of completion method of accounting is recognized as work progresses toward completion as determined by the ratio of cumulative costs incurred to date to estimated total contract costs at completion, multiplied by the total contract revenue. Changes in estimates affecting sales, costs and profits are recognized in the period in which the change becomes known using the cumulative catch-up method of accounting, resulting in the cumulative effect of changes reflected in the period. Estimates are reviewed and updated quarterly for all contracts. A significant change in an estimate on one or more contracts could have a material effect on our results of operations.
Contract costs include all direct costs related to contract performance. Selling and administrative expenses are charged to operations as incurred. Provisions for estimated losses on uncompleted contracts are recognized in the period in which such losses are determined. Because of inherent uncertainties in estimating costs, it is reasonably possible that changes in performance could result in revisions to cost and revenue, which are recognized in the period when the revisions are determined.
Cash and cash equivalents
All highly liquid investments with a maturity of three months or less are considered cash equivalents.
Accounts receivable and allowance for doubtful accounts
Accounts receivable are composed of trade and contract receivables recorded at either the invoiced amount or costs in excess of billings, are expected to be collected within one year, and do not bear interest. The allowance for doubtful accounts is the Company’s best estimate of the probable amount of uncollectible accounts in the Company’s existing accounts receivable. The Company determines the allowance based on a number of factors, including historical experience, credit worthiness of customers, and current market and economic conditions. The Company reviews the allowance for doubtful accounts on a regular basis. Account balances are charged against the allowance after all means of collection have been exhausted and the potential for recovery is considered remote. The following table summarizes activity recorded within the allowance for doubtful accounts balances for the years ended December 31 (in thousands):
42
2017 | 2016 | 2015 | |||||||||
Beginning balance | $ | 5,272 | $ | 4,868 | $ | 4,280 | |||||
Bad debt expense | 1,253 | 2,519 | 1,404 | ||||||||
Accounts written off and other adjustments | (91 | ) | (2,115 | ) | (816 | ) | |||||
Ending balance | $ | 6,434 | $ | 5,272 | $ | 4,868 | |||||
Concentrations of credit risk on accounts receivable are limited to those from significant customers that are believed to be financially sound. As of December 31, 2017 and 2016, the Company's most significant customer is a home improvement retailer. The home improvement retailer purchases from the Residential Products segment. Accounts receivable as a percentage of consolidated accounts receivable from the home improvement retailer as of December 31, 2017 was 13.6%. Accounts receivable as a percentage of consolidated accounts receivable from the home improvement retailer as of December 31, 2016, was 13.7%.
Net sales as a percentage of consolidated net sales to the home improvement retailer were 12% , 11% and 11% for the years ended December 31, 2017, 2016 and 2015, respectively. Note 2 "Accounts Receivable" contains additional information on the Company's accounts receivable.
Inventories
Inventories are valued at the lower of cost, determined using the first-in, first-out method, or net realizable value. Shipping and handling costs are recognized as a component of cost of sales.
Property, plant, and equipment
Property, plant, and equipment are stated at cost and depreciated over their estimated useful lives using the straight-line method. Interest is capitalized in connection with construction of qualified assets. Expenditures that exceed an established dollar threshold and that extend the useful lives of assets are capitalized, while repair and maintenance costs are expensed as incurred. The estimated useful lives of land improvements, buildings, and building improvements are 15 to 40 years, while the estimated useful lives for machinery and equipment are 3 to 20 years.
The table below sets forth the amount of interest capitalized and depreciation expense recognized during the years ended December 31 (in thousands):
2017 | 2016 | 2015 | |||||||||
Capitalized interest | $ | 137 | $ | 138 | $ | 166 | |||||
Depreciation expense | $ | 12,929 | $ | 14,477 | $ | 17,869 | |||||
Acquisition related assets and liabilities
Accounting for the acquisition of a business as a purchase transaction requires an allocation of the purchase price to the assets acquired and the liabilities assumed in the transaction at their respective estimated fair values. The most complex estimations of individual fair values are those involving long-lived assets, such as property, plant, and equipment and intangible assets. The Company uses all available information to make these fair value determinations and, for major business acquisitions, engages independent valuation specialists to assist in the fair value determination of the acquired long-lived assets.
Goodwill and other intangible assets
The Company tests goodwill for impairment at the reporting unit level on an annual basis at October 31, or more frequently if an event occurs, or circumstances change, that indicate that the fair value of a reporting unit could be below its carrying value. The reporting units are at the component level, or one level below the operating segment level. Goodwill is assigned to each reporting unit as of the date the reporting unit is acquired and based upon the expected synergies of the acquisition.
The Company may elect to perform a qualitative assessment that considers economic, industry and company-specific factors for some or all of our selected reporting units. If, after completing the assessment, it is determined that it is more likely than not that the fair value of a reporting unit is less than its carrying value, the Company proceeds to a quantitative test. The Company may also elect to perform a quantitative test instead of a qualitative test for any or all of the Company's reporting units.
43
The quantitative impairment test consists of comparing the fair value of a reporting unit, determined using two valuation techniques, to its carrying value. If the carrying value of the reporting unit exceeds its fair value, goodwill is considered impaired, and a loss measured by the excess of the carrying value of the reporting unit over the fair value of the reporting unit must be recorded.
The Company also tests its indefinite-lived intangible assets for impairment on an annual basis as of October 31, or more frequently if an event occurs, or circumstances change, that indicate that the fair value of an indefinite-lived intangible asset could be below its carrying value. The impairment test consists of comparing the fair value of the indefinite-lived intangible asset, determined using discounted cash flows on a relief-from-royalty basis, with its carrying amount. An impairment loss would be recognized for the carrying amount in excess of its fair value. Acquired identifiable intangible assets are recorded at cost. Identifiable intangible assets with finite useful lives are amortized over their estimated useful lives.
Impairment of long-lived assets
Long-lived assets, including acquired identifiable intangible assets, are reviewed for impairment whenever events or changes in circumstances indicate that the carrying amount of those assets may not be recoverable. In specific situations, when the Company has selected individual assets to be sold or scrapped, the Company obtains market value data for those specific assets and measures and records the impairment loss based on such data. Otherwise, the Company uses undiscounted cash flows to determine whether impairment exists and measures any impairment loss by approximating fair value using acceptable valuation techniques, including discounted cash flow models and third-party appraisals. The Company recognized impairment charges related to intangible assets during the years ended December 31, 2017, 2016 and 2015. Several of these impairment charges related to exit activities during the three year period ended December 31, 2017 as described in Note 14 of the consolidated financial statements.
Deferred charges
Deferred charges associated with initial costs incurred to enter into new debt arrangements are included as a component of long-term debt and are amortized as a part of interest expense over the terms of the associated debt agreements.
Advertising
The Company expenses advertising costs as incurred. For the years ended December 31, 2017, 2016 and 2015, advertising costs were $4.9 million, $5.1 million, and $4.7 million, respectively.
Research and Development
The Company expenses research and development costs as incurred. For the years ended December 31, 2017, 2016 and 2015, research and development costs were $2.9 million, $2.2 million, and $0.9 million, respectively.
Foreign currency transactions and translation
The assets and liabilities of the Company’s foreign subsidiaries are translated into U.S. dollars at the rate of exchange in effect at the balance sheet date. Income and expense items are translated at the average exchange rates prevailing during the period.
Income taxes
The provision for income taxes is determined using the asset and liability approach. Under this approach, deferred income taxes represent the expected future tax consequences of temporary differences between the carrying amounts and tax basis of assets and liabilities. The Company records a valuation allowance to reduce deferred tax assets when uncertainty exists regarding their realization. On December 22, 2017, the President of the United States signed into law the Tax Cuts and Jobs Act (the “Tax Reform Act”). Further information on the impact of the Tax Reform Act is included in Note 15 of the consolidated financial statements.
44
Equity-based compensation
The Company measures the cost of equity-based compensation based on grant date fair value and recognizes the cost over the period in which the employee is required to provide service in exchange for the award reduced by forfeitures. Equity-based compensation consists of grants of stock options, deferred stock units, restricted stock, restricted stock units, and performance stock units. Equity-based compensation expense is included as a component of selling, general, and administrative expenses. The Company’s equity-based compensation plans are discussed in more detail in Note 12 of the consolidated financial statements.
Sale-Leaseback Transactions
During the first quarter of 2015, in order to capitalize on favorable real estate market conditions, the Company entered into a transaction to sell one of its real estate properties to an independent third party for $26.4 million. The Company leased back the entire property under a five year operating lease agreement. In accordance with the U.S. generally accepted accounting principles, the Company accounted for the transaction as a sale-leaseback. The net present value of the Company's future minimum lease payments of $5.8 million were less than the gain on sale of $13.1 million. As such, the portion of the gain equal to the fair value of the future minimum lease payments was deferred and is being amortized on a straight-line basis over the five year term of the lease. The gain exceeding the fair value of the minimum lease payments amounted to $7.4 million and was recognized during the quarter ended March 31, 2015 as a component of selling, general, and administrative expenses. The minimum lease payment for each of the five years is $1.4 million.
These amounts have been included in the future minimum lease payments table in Note 17 of the consolidated financial statements.
45
Recent accounting pronouncements
Recent Accounting Pronouncements Adopted
Standard | Description | Financial Statement Effect or Other Significant Matters |
ASU No. 2016-09 Compensation - Stock Compensation (Topic 718): Improvements to Employee Share-Based Payment Accounting | The standard simplifies the accounting for share-based payment award transactions including: income tax consequences, classification of awards as either equity or liabilities and classification on the statement of cash flows. The provisions of this standard are effective for fiscal years beginning after December 15, 2016, including interim periods within those fiscal years. Early adoption is permitted. | The Company has adopted all amendments included in this standard under each required transition method. The Company concluded there were no material changes to prior periods, except for the following: the Company (a) reclassified its prior periods excess tax benefit for stock compensation of $1,249,000 in 2016 and $537,000 in 2015 on its consolidated statement of cash flows from a financing activity to an operating activity; and (b) recognized a cumulative-effect adjustment of $254,000 as an increase to retained earnings and decrease to additional paid-in capital on the Company's consolidated statement of shareholders' equity as of January 1, 2017 to reflect the change in value for a restricted stock unit liability award as of December 31, 2016, as if the award had been classified as an equity award since its respective grant date. Date of adoption: Q1 2017 |
ASU No. 2017-04 Intangibles - Goodwill and Other (Topic 350): Simplifying the Test for Goodwill Impairment | The standard eliminates the "Step 2" analysis to determine the amount of impairment realized when a reporting unit's carrying amount exceeds its fair value in its "Step 1" analysis of accounting for impairment of goodwill. The impairment charge would be the amount determined in "Step 1." The provisions of this standard are effective for fiscal years beginning after December 15, 2019, including interim periods within those fiscal years. Early adoption is permitted for annual and interim goodwill impairment testing dates after January 1, 2017. | The Company has adopted this standard and it did not have any impact on the Company's consolidated financial statements. Date of adoption: Q1 2017 |
ASU No. 2017-07 Compensation - Retirement Benefits (Topic 715): Improving the Presentation of Net Periodic Pension Cost and Net Periodic Postretirement Benefit Cost | The standard requires an employer to recognize the service cost component of net periodic pension costs and net periodic postretirement benefit costs in the same line item(s) as other compensation costs from services rendered by pertinent employees during the period. Other components of net benefit cost are required to be presented separately from the service cost component and outside a subtotal of income from operations. The provisions of this standard are effective for annual reporting periods beginning after December 15, 2017, including interim periods within those annual periods. Early adoption is permitted as of the beginning of an annual period for which financial statements (interim or annual) have not been issued or made available for issuance. | The Company has adopted this standard and has applied it retrospectively for the presentation of the service cost component, as well as, other components of net periodic pension cost and net periodic postretirement benefit cost in our statement of operations. The adoption decreased selling, general, and administrative expense by $524,000 and $647,000 for the twelve months ended December 31, 2016 and 2015, respectively, and comparably increased other expense by the same amounts, respectively. This guidance did not have any impact on our balance sheet or our statement of cash flows. Date of adoption: Q1 2017 |
46
Recent Accounting Pronouncements Not Yet Adopted
Standard | Description | Financial Statement Effect or Other Significant Matters |
ASU No. 2014-09 Revenue from Contracts with Customers (Topic 606) And All Related ASUs | The standard requires an entity to recognize revenue to depict the transfer of promised goods or services to customers in an amount that reflects the consideration to which the entity expects to be entitled in exchange for those goods or services. The standard also requires additional disclosures about the nature, amount, timing, and uncertainty of revenue and cash flows arising from customer contracts, including significant judgments and assets recognized from costs incurred to obtain or fulfill a contract. The provisions of the standard, as well as all subsequently issued clarifications to the standard, are effective for fiscal years beginning after December 15, 2017 and interim periods within those fiscal years. The standard can be adopted using either a full retrospective or modified retrospective approach. | The Company currently believes the most significant impact of this standard upon adoption relates to the revenue recognition for certain custom fabricated products for which there is no alternative use and where the Company has written enforceable rights to payment for performance to date should the customer terminate the contract. These products are within the Company's Industrial and Infrastructure Products segment. Under this standard, the Company expects to recognize revenue on an over time basis on these custom fabricated products in the Industrial and Infrastructure Products segment which is a change from our current revenue recognition policy of point-in-time basis. The Company expects revenue recognition related to the remaining Industrial and Infrastructure Products segment, Residential Products segment and Renewable Energy and Conservation segment to remain substantially unchanged upon adoption of this standard. The Company has identified and implemented appropriate changes to the Company's business processes, systems and internal controls to support recognition and disclosure under this standard. The Company will use the modified retrospective transition method approach and apply it to open contracts as of January 1, 2018. Under this method, incremental disclosures will be provided to present each financial statement line item for 2018 under the prior standard. The Company estimates the cumulative effect of adoption to be approximately $750,000 increase to opening retained earnings, as of January 1, 2018. Planned date of adoption: Q1 2018 |
ASU No. 2016-02 Leases (Topic 842) | The standard requires lessees to recognize most leases as assets and liabilities on the balance sheet, but record expenses on the statement of operations in a manner similar to current accounting. For lessors, the guidance modifies the classification criteria and accounting for sales-type and direct financing leases. The standard also requires additional disclosures about leasing arrangements and requires a modified retrospective transition approach for existing leases, whereby the standard will be applied to the earliest year presented. The provisions of the standard are effective for fiscal years beginning after December 15, 2018, including interim periods within those fiscal years. Early adoption is permitted. | The Company is currently evaluating the impact of this standard on the Company's consolidated financial statements and related disclosures, including the impact on the Company's current lease portfolio from both a lessor and lessee perspective. The adoption of this standard will primarily result in an increase in the assets and liabilities on the Company's consolidated balance sheet and related disclosures. Planned date of adoption: Q1 2019 |
47
Standard | Description | Financial Statement Effect or Other Significant Matters |
ASU No. 2016-15 Statement of Cash Flows (Topic 230): Classification of Certain Cash Receipts and Cash Payments | The standard provides guidance on eight specific cash flow issues to reduce diversity in reporting. The provisions of this standard are effective for fiscal years beginning after December 15, 2017, including interim periods within those fiscal years. Early adoption is permitted. | The Company is evaluating the requirements of this standard and anticipates its impact on the Company's consolidated financial statements to be immaterial. Planned date of adoption: Q1 2018 |
ASU No. 2016-16 Income Taxes (Topic 740): Intra-Entity Transfers of Assets Other Than Inventory | The standard allows an entity to recognize income tax consequences of an intra-entity transfer of an asset other than inventory when the transfer occurs. The provisions of this standard are effective for annual reporting periods beginning after December 15, 2017, including interim reporting periods within those annual reporting periods. Early adoption is permitted as of the beginning of an annual reporting period for which financial statements (interim or annual) have not been issued or made available for issuance. | The Company is evaluating the requirements of this standard and anticipates its impact on the Company's consolidated financial statements to be immaterial. Planned date of adoption: Q1 2018 |
ASU No. 2018-02 Income Statement-Reporting Comprehensive Income (Topic 220): Reclassification of Certain Tax Effects from Accumulated Other Comprehensive Income | The standard allows a reclassification from accumulated other comprehensive income to retained earnings for stranded tax effects resulting from the Tax Cuts and Jobs Act. The provisions of this standard are effective for fiscal years beginning after December 15, 2018, and interim periods within those fiscal years. Early adoption of the standard is permitted, including adoption in any interim period. | The Company is evaluating the requirements of this standard and anticipates its impact on the Company's consolidation financial statements to be immaterial. The Company plans to apply the amendments in the period of adoption with an adjustment in the consolidated statement of shareholders' equity as of the beginning of the reporting period and any subsequent period, if changes to provisional amounts result in additional amounts stranded in accumulated other comprehensive income. Planned date of adoption: Q1 2018 |
We consider the applicability and impact of all ASUs. ASUs not listed above were assessed and determined to be either not applicable, or had or are expected to have minimal impact on our financial statements and related disclosures.
2. ACCOUNTS RECEIVABLE
Accounts receivable at December 31 consisted of the following (in thousands):
2017 | 2016 | ||||||
Trade accounts receivable | $ | 78,858 | $ | 81,193 | |||
Contract receivables: | |||||||
Amounts billed | 61,351 | 41,569 | |||||
Costs in excess of billings | 11,610 | 6,582 | |||||
Total contract receivables | 72,961 | 48,151 | |||||
Total accounts receivables | 151,819 | 129,344 | |||||
Less allowance for doubtful accounts | (6,434 | ) | (5,272 | ) | |||
Accounts receivable | $ | 145,385 | $ | 124,072 | |||
Contract receivables are primarily associated with developers, contractors and customers in connection with the Renewable Energy and Conservation segment. Costs in excess of billings principally represent revenues recognized on contracts that were not billable as of the balance sheet date. These amounts will be billed in accordance with contract terms, generally as certain milestones are reached or upon shipment. All of the costs in excess of billings are expected to be collected within one year. In situations where billings exceed revenues recognized, the excess is included in billings in excess of cost in the consolidated balance sheet.
48
3. INVENTORIES
Inventories at December 31 consisted of the following (in thousands):
2017 | 2016 | ||||||
Raw material | $ | 42,661 | $ | 41,758 | |||
Work-in-process | 10,598 | 12,268 | |||||
Finished goods | 33,113 | 35,586 | |||||
Total inventories | $ | 86,372 | $ | 89,612 | |||
The following table summarizes activity recorded within the reserve for excess, obsolete and slow moving inventory for the years ended December 31 (in thousands):
2017 | 2016 | 2015 | |||||||||
Beginning balance | $ | 3,801 | $ | 7,428 | $ | 5,575 | |||||
Excess, obsolete and slow moving inventory expense | 1,276 | (239 | ) | 1,539 | |||||||
Scrapped inventory and other adjustments | (1,382 | ) | (3,388 | ) | 314 | ||||||
Ending balance | $ | 3,695 | $ | 3,801 | $ | 7,428 | |||||
4. PROPERTY, PLANT, AND EQUIPMENT
Components of property, plant, and equipment at December 31 consisted of the following (in thousands):
2017 | 2016 | ||||||
Land and land improvements | $ | 6,301 | $ | 7,102 | |||
Building and improvements | 46,562 | 50,283 | |||||
Machinery and equipment | 195,301 | 212,774 | |||||
Construction in progress | 8,522 | 2,202 | |||||
Property, plant, and equipment, gross | 256,686 | 272,361 | |||||
Less: accumulated depreciation | (159,588 | ) | (164,057 | ) | |||
Property, plant, and equipment, net | $ | 97,098 | $ | 108,304 | |||
5. ACQUISITIONS
2017 Acquisition
On February 22, 2017, the Company acquired all of the outstanding stock of Package Concierge. Package Concierge is a leading provider of multifamily electronic package delivery locker systems in the United States.
The acquisition of Package Concierge is expected to enable the Company to expand its position in the fast-growing package delivery solutions market. The results of Package Concierge have been included in the Company's consolidated financial results since the date of acquisition (within the Company's Residential Products segment). The final aggregate purchase consideration for the acquisition of Package Concierge was $18.9 million, which includes a working capital adjustment and certain other adjustments provided for in the stock purchase agreement.
The purchase price for the acquisition was allocated to the assets acquired and liabilities assumed based upon their respective fair values. The excess consideration was recorded as goodwill and approximated $16.8 million, which is not deductible for tax purposes. Goodwill represents future economic benefits arising from other assets acquired that could not be individually identified including workforce additions, growth opportunities, and increased presence in the building products markets.
The allocation of the purchase consideration to the fair value of the assets acquired and liabilities assumed is as follows as of the date of the acquisition (in thousands):
49
Cash | $ | 590 | |
Working capital | (1,998 | ) | |
Property, plant, and equipment | 55 | ||
Acquired intangible assets | 3,600 | ||
Other assets | 8 | ||
Deferred income taxes | (128 | ) | |
Goodwill | 16,790 | ||
Fair value of purchase consideration | $ | 18,917 | |
The intangible assets acquired in this acquisition consisted of the following (in thousands):
Fair Value | Estimated Useful Life | ||||
Trademarks | $ | 600 | Indefinite | ||
Technology | 1,300 | 10 years | |||
Customer relationships | 1,700 | 7 years | |||
Total | $ | 3,600 | |||
2016 Acquisition
On October 11, 2016, the Company acquired all of the outstanding stock of Nexus Corporation ("Nexus"). Nexus is a leading provider of commercial-scale greenhouses to customers in the United States.
The acquisition of Nexus is expected to enable the Company to strengthen its position in the commercial greenhouse market in the United States. The results of Nexus have been included in the Company's consolidated financial results since the date of acquisition (within the Company's Renewable Energy and Conservation segment). The final aggregate purchase consideration for the acquisition of Nexus was $23.8 million, which includes a working capital adjustment and certain other adjustments provided for in the stock purchase agreement. At December 31, 2016, $1.0 million of the estimated purchase price was accrued. Upon settlement of the final purchase adjustments, $0.2 million was paid in cash by the Company during the first quarter of 2017, with the difference of $0.8 million recorded as a reduction to goodwill in 2017 upon finalization of the purchase price allocation.
The purchase price for the acquisition was allocated to the assets acquired and liabilities assumed based upon their respective fair values. The excess consideration was recorded as goodwill and approximated $11.5 million, of which all is deductible for tax purposes.
The allocation of the purchase consideration to the fair value of the assets acquired and liabilities assumed is as follows as of the date of the acquisition (in thousands):
Cash | $ | 2,495 | |
Working capital | (1,109 | ) | |
Property, plant, and equipment | 4,702 | ||
Acquired intangible assets | 6,200 | ||
Other assets | 23 | ||
Goodwill | 11,451 | ||
Fair value of purchase consideration | $ | 23,762 | |
The intangible assets acquired in this acquisition consisted of the following (in thousands):
50
Fair Value | Estimated Useful Life | ||||
Trademarks | $ | 3,200 | Indefinite | ||
Technology | 1,300 | 15 years | |||
Customer relationships | 800 | 11 years | |||
Backlog | 900 | 0.25 years | |||
Total | $ | 6,200 | |||
2015 Acquisition
On June 9, 2015, the Company acquired all of the outstanding stock of Rough Brothers Manufacturing, Inc., RBI Solar, Inc., and affiliates, collectively known as "RBI." RBI has established itself during the past decade among North America’s fastest-growing providers of racking and mounting systems for solar energy installations and is among the largest commercial greenhouse manufacturers in North America.
RBI is a full service provider that engineers, manufactures and installs racking systems for solar power developers, contractors and companies. In addition, RBI designs and manufactures greenhouses for commercial, institutional and retail customers. The acquisition of RBI enables the Company to leverage its expertise in structural metals manufacturing, materials sourcing and logistics to help meet the fast-growing demand for solar racking solutions. The results of RBI have been included in the Company’s consolidated financial results since the date of acquisition (within the Company's Renewable Energy and Conservation segment). The final aggregate purchase consideration for the acquisition of RBI was $147.6 million, which includes payments for working capital and certain other adjustments provided for in the stock purchase agreement.
The purchase price for the acquisition was allocated to the assets acquired and liabilities assumed based upon their respective fair values. The excess consideration of $57.2 million, was recorded as goodwill of which $38.0 million is deductible for tax purposes.
The allocation of the purchase consideration to the fair value of the assets acquired and liabilities assumed is as follows as of the date of the acquisition (in thousands):
Cash | $ | 4,651 | |
Working capital | 21,436 | ||
Property, plant, and equipment | 12,797 | ||
Acquired intangible assets | 56,392 | ||
Other assets | 3,049 | ||
Deferred income taxes | (4,892 | ) | |
Other liabilities | (3,028 | ) | |
Goodwill | 57,180 | ||
Fair value of purchase consideration | $ | 147,585 | |
The Company recorded an indemnification asset and liability of $3.0 million on the opening balance sheet related to the seller’s obligation to fully indemnify the Company for the outcome of potential contingent liabilities related to the uncertainty of income tax positions in foreign jurisdictions. The liability and related indemnification asset may or may not be realized, and any unrealized liability is scheduled to expire in 2018.
The intangible assets acquired in this acquisition consisted of the following (in thousands):
51
Fair Value | Estimated Useful Life | ||||
Trademarks | $ | 13,550 | Indefinite | ||
Technology | 3,550 | 7-15 years | |||
Customer relationships | 32,892 | 11-17 years | |||
Non-compete agreements | 1,300 | 5 years | |||
Backlog | 5,100 | 0.5 years | |||
Total | $ | 56,392 | |||
The following unaudited pro forma financial information presents the combined results of continuing operations as if the acquisition of RBI had occurred as of January 1, 2014. The pro forma information includes certain adjustments, including depreciation and amortization expense, interest expense and certain other adjustments, together with related income tax effects. The pro forma amounts may not be indicative of the results that actually would have been achieved had the acquisitions occurred as of January 1, 2014 and are not necessarily indicative of future results of the combined companies (in thousands, except per share data):
Twelve Months Ended December 31, | |||||||
2015 | 2014 | ||||||
Net sales | $ | 1,128,915 | $ | 1,026,014 | |||
Net income (loss) | $ | 33,587 | $ | (46,714 | ) | ||
Net income (loss) per share - Basic | $ | 1.08 | $ | (1.50 | ) | ||
Net income (loss) per share - Diluted | $ | 1.06 | $ | (1.50 | ) | ||
The acquisitions of Package Concierge and Nexus were funded from available cash on hand. The 2015 acquisition of RBI was financed through a combination of cash on hand and borrowings under the Company's revolving credit facility. The Company incurred certain acquisition-related costs composed of legal and consulting fees, and these costs were recognized as a component of selling, general, and administrative expenses in the consolidated statement of operations. The Company also recognized costs related to the sale of inventory at fair value as a result of allocating the purchase price of recent acquisitions.
All acquisition related costs consisted of the following for the years ended December 31 (in thousands):
2017 | 2016 | 2015 | |||||||||
Selling, general and administrative costs | $ | 146 | $ | 228 | $ | 732 | |||||
Cost of sales | — | 81 | 230 | ||||||||
Total acquisition related costs | $ | 146 | $ | 309 | $ | 962 | |||||
52
6. GOODWILL AND RELATED INTANGIBLE ASSETS
Goodwill
The changes in the carrying amount of goodwill for the years ended December 31 were as follows (in thousands):
Residential Products | Industrial and Infrastructure Products | Renewable Energy and Conservation | Total | ||||||||||||
Balance at December 31, 2015 | $ | 181,285 | $ | 53,704 | $ | 57,401 | $ | 292,390 | |||||||
Acquired goodwill | — | — | 12,283 | 12,283 | |||||||||||
Impairment | — | — | (929 | ) | (929 | ) | |||||||||
Foreign currency translation | — | 180 | 108 | 288 | |||||||||||
Balance at December 31, 2016 | $ | 181,285 | $ | 53,884 | $ | 68,863 | $ | 304,032 | |||||||
Acquired goodwill | 16,790 | — | — | 16,790 | |||||||||||
Adjustments to prior year acquisitions | — | — | (832 | ) | (832 | ) | |||||||||
Foreign currency translation | — | 396 | 688 | 1,084 | |||||||||||
Balance at December 31, 2017 | $ | 198,075 | $ | 54,280 | $ | 68,719 | $ | 321,074 | |||||||
Goodwill is recognized net of accumulated impairment losses of $235.4 million as of December 31, 2017 and 2016, respectively. No goodwill impairment charges were recognized by the Company during 2017.
Annual Impairment Testing
The Company performed its annual goodwill impairment test as of October 31, 2017, 2016, and 2015. The Company did not recognize any impairment charges during 2017, 2016, and 2015 as a result of the annual goodwill impairment test. However, subsequent to the annual goodwill impairment test as of October 31, 2016, the Company discontinued its European residential solar racking business which resulted in an impairment charge against goodwill of $0.9 million which was recorded for the year ended December 31, 2016.
During the October 31, 2017 impairment test, the Company conducted a quantitative analysis for all eleven of the Company’s reporting units. The quantitative impairment test consists of comparing the fair value of a reporting unit with its carrying value including goodwill. The fair value of each reporting unit evaluated under the quantitative test was determined using two valuation techniques: an income approach and a market approach. Each valuation approach relies on significant assumptions including a weighted average cost of capital ("WACC") based upon the capital structure of market participants in the Company’s peer groups, projected revenue growth, forecasted cash flows, and earnings multiples based on the market value of the Company and market participants within its peer groups.
As a result of our annual testing for 2017 and 2016, none of the reporting units with goodwill as of our testing date had carrying values in excess of their fair values.
Interim Impairment Testing
We test goodwill and indefinite-lived intangible assets for impairment on an annual basis as of October 31 and at interim dates when indicators of impairment are present. In 2017, 2016 and 2015, no indicators of impairment were identified as of interim dates; therefore, no interim tests were performed.
Acquired Intangible Assets
53
Acquired intangible assets consist of the following (in thousands):
December 31, 2017 | December 31, 2016 | ||||||||||||||||
Gross Carrying Amount | Accumulated Amortization | Gross Carrying Amount | Accumulated Amortization | Estimated Useful Life | |||||||||||||
Indefinite-lived intangible assets: | |||||||||||||||||
Trademarks | $ | 45,107 | $ | — | $ | 44,720 | $ | — | Indefinite | ||||||||
Finite-lived intangible assets: | |||||||||||||||||
Trademarks | 5,876 | 3,062 | 5,808 | 2,427 | 5 to 15 Years | ||||||||||||
Unpatented technology | 28,107 | 12,033 | 26,720 | 10,041 | 5 to 20 Years | ||||||||||||
Customer relationships | 80,707 | 39,652 | 78,569 | 33,585 | 5 to 17 Years | ||||||||||||
Non-compete agreements | 1,649 | 931 | 1,649 | 623 | 4 to 10 Years | ||||||||||||
Backlog | — | — | 900 | 900 | .5 to 2 Years | ||||||||||||
116,339 | 55,678 | 113,646 | 47,576 | ||||||||||||||
Total acquired intangible assets | $ | 161,446 | $ | 55,678 | $ | 158,366 | $ | 47,576 | |||||||||
The Company recognized impairment charges related to indefinite-lived trademark intangible assets for the years ended December 31, 2017, 2016 and 2015. The Company also recognized impairment charges related to finite-lived intangible assets for the year ended December 31, 2016.
The following table summarizes the impairment charges for the years ended December 31 (in thousands):
2017 | 2016 | 2015 | |||||||||||||||||||||
Indefinite-lived intangibles (1) | Definite-lived intangibles | Indefinite-lived intangibles (2) | Definite-lived intangibles (3) | Indefinite-lived intangibles (4) | Definite-lived intangibles | ||||||||||||||||||
Residential Products | $ | — | $ | — | $ | — | $ | — | $ | 440 | $ | — | |||||||||||
Industrial and Infrastructure Products | — | — | 7,980 | — | 4,423 | — | |||||||||||||||||
Renewable Energy and Conservation | 247 | — | 1,068 | 198 | — | — | |||||||||||||||||
Impairment charges | $ | 247 | $ | — | $ | 9,048 | $ | 198 | $ | 4,863 | $ | — | |||||||||||
(1) Renewable Energy and Conservation impairment charges due to the discontinuation of its domestic greenhouse business in China.
(2) Industrial and Infrastructure Products impairment charges due to discontinuation of U.S. bar grating product line and annual testing. Renewable Energy and Conservation impairment due to discontinuation of European residential solar racking business and annual testing.
(3) Renewable Energy and Conservation impairment due to discontinuation of European residential solar racking business.
(4) 2015 impairment charges recognized as a result of the Company’s annual impairment test of indefinite-lived intangibles.
The Company recognized amortization expense related to the definite-lived intangible assets. The following table summarizes amortization expense for the years ended December 31 (in thousands):
2017 | 2016 | 2015 | |||||||||
Amortization expense | $ | 8,761 | $ | 9,637 | $ | 12,679 | |||||
54
Amortization expense related to acquired intangible assets for the next five years ended December 31 is estimated as follows (in thousands):
2018 | 2019 | 2020 | 2021 | 2022 | |||||||||||||||
Amortization expense | $ | 8,289 | $ | 7,618 | $ | 7,106 | $ | 6,504 | $ | 6,093 | |||||||||
7. ACCRUED EXPENSES
Accrued expenses at December 31 consist of the following (in thousands):
2017 | 2016 | ||||||
Compensation | $ | 34,752 | $ | 27,669 | |||
Interest and taxes | 8,002 | 13,102 | |||||
Customer rebates | 10,517 | 10,303 | |||||
Insurance | 7,261 | 7,584 | |||||
Other | 14,935 | 11,734 | |||||
Total accrued expenses | $ | 75,467 | $ | 70,392 | |||
Accrued expenses for insurance are primarily for general liability, workers’ compensation and employee healthcare policies for which the Company is self-insured up to certain per-occurrence and aggregate limits. The amounts accrued represent the Company's best estimates of the probable amount of claims to be paid. Differences between the amounts accrued and the amount that may be reasonably possible of payment are not material.
8. DEBT
Long-term debt at December 31 consists of the following (in thousands):
2017 | 2016 | ||||||
Senior Subordinated 6.25% Notes | $ | 210,000 | $ | 210,000 | |||
Other debt | 2,400 | 2,800 | |||||
Less unamortized debt issuance costs | (2,379 | ) | (3,163 | ) | |||
Total debt | 210,021 | 209,637 | |||||
Less current maturities | 400 | 400 | |||||
Total long-term debt | $ | 209,621 | $ | 209,237 | |||
The Company's Fifth Amended and Restated Credit Agreement dated December 9, 2015 (the "Senior Credit Agreement") was amended to convert our revolving credit facility into a secured cash flow revolver, and terminates on December 9, 2020.
The Senior Credit Agreement provides for a revolving credit facility and letters of credit in an aggregate amount of $300 million. The Company has the option to request additional financing from the banks to either increase the revolving credit facility to $500 million or in the form of a term loan of up to $200 million. The Senior Credit Agreement contains three financial covenants. As of December 31, 2017, the Company is in compliance with all three covenants.
Borrowings under the Senior Credit Agreement are secured by the trade receivables, inventory, personal property, equipment, and certain real property of the Company’s significant domestic subsidiaries. Interest rates on the revolving credit facility are based on the LIBOR plus an additional margin that ranges from 1.25% to 2.25% for LIBOR loans based on the Total Leverage Ratio.
In addition, the revolving credit facility is subject to an undrawn commitment fee ranging between 0.20% and 0.30% based on the Total Leverage Ratio and the daily average undrawn balance.
Standby letters of credit of $11.2 million have been issued under the Senior Credit Agreement to third parties on behalf of the Company as of December 31, 2017. These letters of credit reduce the amount otherwise available under the revolving credit facility. The Company had $288.8 million and $287.2 million of availability under the revolving credit facility at December 31, 2017 and 2016, respectively.
On January 31, 2013, the Company issued $210 million of 6.25% Senior Subordinated Notes ("6.25% Notes") due February 1, 2021. The provisions of the 6.25% Notes include, without limitation, restrictions on indebtedness, liens, and distributions from
55
restricted subsidiaries, asset sales, affiliate transactions, dividends, and other restricted payments. Dividend payments are subject to annual limits and interest is paid semiannually on February 1 and August 1 of each year.
The aggregate maturities of long-term debt for the next five years and thereafter are as follows (in thousands):
2018 | 2019 | 2020 | 2021 | 2022 | Thereafter | |||||||||||||||||||
Long-term debt payments | $ | 400 | $ | 400 | $ | 400 | $ | 210,400 | $ | 400 | $ | 400 | ||||||||||||
Total cash paid for interest in the years ended December 31 was (in thousands):
2017 | 2016 | 2015 | |||||||||
Cash paid for interest | $ | 13,385 | $ | 13,906 | $ | 15,374 | |||||
9. EMPLOYEE RETIREMENT PLANS
Pension
The Company has an unfunded supplemental pension plan which provides defined pension benefits to certain former salaried employees upon retirement. Benefits under the plan are based on the salaries of individual plan participants in the year they were admitted into the plan. The plan has been frozen, no additional participants will be added to the plan in the future and there are no active employees in the plan.
The following table presents the changes in the plan’s projected benefit obligation, fair value of plan assets, and funded status for the years ended December 31 (in thousands):
2017 | 2016 | ||||||
Projected benefit obligation at January 1 | $ | 1,377 | $ | 1,685 | |||
Interest cost | 46 | 59 | |||||
Actuarial losses (gains) | 7 | 5 | |||||
Benefits paid | (360 | ) | (372 | ) | |||
Projected benefit obligation at December 31 | 1,070 | 1,377 | |||||
Fair value of plan assets | — | — | |||||
Under funded status | (1,070 | ) | (1,377 | ) | |||
Unamortized prior service cost | 2 | 4 | |||||
Unrecognized actuarial gain | (173 | ) | (200 | ) | |||
Net amount recognized | $ | (1,241 | ) | $ | (1,573 | ) | |
Amounts recognized in the consolidated financial statements consisted of (in thousands):
2017 | 2016 | ||||||
Accrued pension liability: | |||||||
Current portion | $ | 327 | $ | 360 | |||
Long term portion | 743 | 1,016 | |||||
Pre-tax accumulated other comprehensive income – retirement benefit liability adjustment | 171 | 197 | |||||
Net amount recognized | $ | 1,241 | $ | 1,573 | |||
The plan’s accumulated benefit obligation equaled the projected benefit obligation as of December 31, 2017 and 2016. The measurement date used to determine pension benefit measures was December 31.
56
Components of net periodic pension cost for the years ended December 31 were as follows (in thousands):
2017 | 2016 | 2015 | |||||||||
Interest cost | $ | 46 | $ | 59 | $ | 66 | |||||
Amortization of unrecognized prior service cost | 2 | 6 | 14 | ||||||||
Gain amortization | (19 | ) | (13 | ) | — | ||||||
Net periodic pension cost | $ | 29 | $ | 52 | $ | 80 | |||||
Assumptions used to calculate the benefit obligation: | |||||||||||
Discount rate | 3.55 | % | 3.81 | % | 3.94 | % | |||||
Expected benefit payments from the plan for the years ended December 31 are as follows (in thousands):
2018 | 2019 | 2020 | 2021 | 2022 | 2023 - 2027 | |||||||||||||||||||
Expected benefit payments | $ | 327 | $ | 228 | $ | 137 | $ | 100 | $ | 100 | $ | 292 | ||||||||||||
401(k)
Employees of all U.S. subsidiaries are eligible to participate in the Company’s 401(k) Plan.
Multiemployer Pension Plans
In addition, the Company contributes to a number of multiemployer defined benefit pension plans under the terms of collective-bargaining agreements that cover union-represented employees. The risks of participating in these multiemployer plans are different from single-employer plans in the following aspects:
a) | Assets contributed to the multiemployer plan by one employer may be used to provide benefits to employees of other participating employers. |
b) | If a participating employer stops contributing to the plan, the unfunded obligations of the plan may be borne by the remaining participating employers. |
c) | If the Company chooses to stop participating in some of the multiemployer plans, the Company may be required to pay those plans an amount based on the underfunded status of the plan, referred to as a withdrawal liability. |
At December 31, 2017, the Company employed 2,022 people, of which approximately 11% were represented by unions through various collective bargaining agreements (CBAs). Three of the Company's six CBAs expired and were successfully renegotiated in 2016. None of our CBA's expire until April 30, 2018.
The Company’s participation in these plans for the year ended December 31, 2017 is outlined in the table below. The “EIN/ Pension Plan Number” column provides the Employee Identification Number (EIN) and three-digit plan number, if applicable. Unless otherwise noted, the most recent Pension Protection Act (PPA) zone status available in 2017 and 2016 is for the plan’s year ended December 31, 2016 and 2015, respectively. The zone status is based on information that the Company received from the plans and is certified by the plans’ actuaries. Among other factors, plans in the red zone are generally less than 65% funded, plans in the yellow zone are less than 80% funded, and plans in the green zone are at least 80% funded.
EIN/ Pension | PPA Zone Status | Surcharge | |||||
Pension Fund | Plan Number | 2016 | 2015 | Imposed | |||
National Integrated Group Pension Plan | 22-6190618-001 | Red | Red | Yes | |||
Sheet Metal Workers’ National Pension Plan | 52-6112463-001 | Yellow | Yellow | Yes | |||
Sheet Metal Workers’ Pension Plan of Northern California | 51-6115939-001 | Red | Red | Yes | |||
All of the funds have rehabilitation plans in place. Each plan with a rehabilitation plan requires minimum contributions from the Company. Given the status of these plans, it is reasonably possible that future contributions to the plans will increase although the Company cannot reasonably estimate a possible range of increased contributions as of December 31, 2017.
57
The Company did not contribute more than 5% of any fund’s total contributions in any of the three years in the period ended December 31, 2017. The table below sets forth the contributions made by the Company to each multiemployer plan for the years ended December 31 (in thousands):
Pension Fund | 2017 | 2016 | 2015 | ||||||||
National Integrated Group Pension Plan | $ | 220 | $ | 218 | $ | 246 | |||||
Sheet Metal Workers’ National Pension Plan | 42 | 50 | 56 | ||||||||
Sheet Metal Workers’ Pension Plan of Northern California | 30 | 28 | 31 | ||||||||
$ | 292 | $ | 296 | $ | 333 | ||||||
At the date the financial statements were issued, Forms 5500 were not available for the plan year ended December 31, 2017.
Total Retirement Plan Expense
Total expense for all retirement plans for the years ended December 31 was (in thousands):
2017 | 2016 | 2015 | ||||||||
$ | 3,044 | $ | 2,887 | $ | 2,934 | |||||
10. OTHER POSTRETIREMENT BENEFITS
The Company has an unfunded postretirement healthcare plan which provides health insurance to certain employees and their spouses upon retirement. This plan has been frozen and no additional participants will be added to the plan in the future.
The following table presents the changes in the accumulated postretirement benefit obligation related to the Company’s unfunded postretirement healthcare benefits at December 31 (in thousands):
2017 | 2016 | ||||||
Projected benefit obligation at January 1 | $ | 7,202 | $ | 8,149 | |||
Service cost | 17 | 22 | |||||
Interest cost | 269 | 272 | |||||
Actuarial gain | (150 | ) | (923 | ) | |||
Benefits paid, net of contributions | (318 | ) | (318 | ) | |||
Projected benefit obligation at December 31 | 7,020 | 7,202 | |||||
Fair value of plan assets | — | — | |||||
Under funded status | (7,020 | ) | (7,202 | ) | |||
Unamortized prior service cost | 427 | 471 | |||||
Unrecognized actuarial loss | 2,382 | 2,679 | |||||
Net amount recognized | $ | (4,211 | ) | $ | (4,052 | ) | |
Amounts recognized in the consolidated financial statements consisted of (in thousands):
2017 | 2016 | ||||||
Accrued postretirement benefit liability | |||||||
Current portion | $ | 314 | $ | 294 | |||
Long term portion | 6,706 | 6,908 | |||||
Pre-tax accumulated other comprehensive loss – unamortized post-retirement healthcare costs | (2,809 | ) | (3,150 | ) | |||
Net amount recognized | $ | 4,211 | $ | 4,052 | |||
The measurement date used to determine postretirement benefit obligation measures was December 31.
58
Components of net periodic postretirement benefit cost charged to expense for the years ended December 31 were as follows (in thousands):
2017 | 2016 | 2015 | |||||||||
Service cost | $ | 17 | $ | 22 | $ | 26 | |||||
Interest cost | 269 | 272 | 300 | ||||||||
Amortization of unrecognized prior service cost | 44 | 44 | 44 | ||||||||
Loss amortization (2) | 146 | 134 | 197 | ||||||||
Net periodic benefit cost | $ | 476 | $ | 472 | $ | 567 | |||||
Assumptions used to calculate the benefit obligation: | |||||||||||
Discount rate | 3.4 | % | 3.8 | % | 3.9 | % | |||||
Annual rate of increase in the per capita cost of: | |||||||||||
Medical costs before age 65 (1) | 7.3 | % | 7.5 | % | 7.8 | % | |||||
Medical costs after age 65 (1) | 6.3 | % | 6.5 | % | 6.8 | % | |||||
Prescription drug costs (1) | 10.5 | % | 10.5 | % | 11.0 | % | |||||
(1) It was assumed that these rates would gradually decline to 4% by 2075.
(2) Actuarial (gains)/losses are amortized utilizing the corridor approach. Differences between actual experience and the actuarial assumptions are reflected in (gain)/loss. If the total net (gain) or loss exceeds 10 percent of the greater of the accumulated postretirement benefit obligation or plan asset, this excess must be amortized over the average remaining service period of the active plan participants. If most of the plan participants are inactive, the amortization period is the expected future lifetime of inactive plan participants.
A 1% change in the annual medical inflation rate issued would have the following impact on the amounts reported at December 31 as follows (in thousands):
2017 | 2016 | ||||||
Effect on accumulated postretirement benefit obligation | |||||||
1% increase | $ | 950 | $ | 975 | |||
1% decrease | $ | (803 | ) | $ | (824 | ) | |
Effect on annual service and interest costs | |||||||
1% increase | $ | 41 | $ | 42 | |||
1% decrease | $ | (34 | ) | $ | (35 | ) | |
Expected benefit payments from the plan for the years ended December 31 are as follows (in thousands):
2018 | 2019 | 2020 | 2021 | 2022 | 2023 - 2027 | |||||||||||||||||||
Expected benefit payments | $ | 314 | $ | 333 | $ | 353 | $ | 371 | $ | 389 | $ | 2,159 | ||||||||||||
59
11. ACCUMULATED OTHER COMPREHENSIVE (LOSS) INCOME
The cumulative balance of each component of accumulated other comprehensive (loss) income is as follows (in thousands):
Foreign Currency Translation Adjustment | Minimum Pension Liability Adjustment | Unamortized Post-Retirement Health Care Costs | Total Pre-Tax Amount | Tax (Benefit) Expense | Accumulated Other Comprehensive (Loss) Income | ||||||||||||||||||
Balance at December 31, 2015 | $ | (12,793 | ) | $ | 118 | $ | (4,251 | ) | $ | (16,926 | ) | $ | (1,510 | ) | $ | (15,416 | ) | ||||||
Minimum pension and post retirement health care plan adjustments | — | 79 | 1,101 | 1,180 | 430 | 750 | |||||||||||||||||
Foreign currency translation adjustment | 6,945 | — | — | 6,945 | — | 6,945 | |||||||||||||||||
Balance at December 31, 2016 | $ | (5,848 | ) | $ | 197 | $ | (3,150 | ) | $ | (8,801 | ) | $ | (1,080 | ) | $ | (7,721 | ) | ||||||
Minimum pension and post retirement health care plan adjustments | — | (26 | ) | 341 | 315 | 110 | 205 | ||||||||||||||||
Foreign currency translation adjustment | 3,150 | — | — | 3,150 | — | 3,150 | |||||||||||||||||
Balance at December 31, 2017 | $ | (2,698 | ) | $ | 171 | $ | (2,809 | ) | $ | (5,336 | ) | $ | (970 | ) | $ | (4,366 | ) | ||||||
The realized adjustments relating to the Company’s minimum pension liability and post retirement health care costs were reclassified from accumulated other comprehensive loss and included in other expense in the consolidated statements of operations.
The realized adjustments relating to the Company’s foreign currency translation adjustment were reclassified from accumulated other comprehensive loss and included in other expense in the consolidated statements of operations. The 2016 reclassification above includes $6.9 million of foreign currency loss on the divestiture of European industrial manufacturing business in April 2016.
12. EQUITY-BASED COMPENSATION
The Company awards equity-based compensation to employees and directors, which is recognized in the statements of operations based on the grant-date fair value of the award. The Company uses the straight-line method for recording compensation expense over a vesting period generally up to four years with either graded or cliff vesting. Stock compensation expense recognized during the period is based on the value of the portion of equity-based awards that is ultimately expected to vest during the period reduced by the unvested expense on awards forfeited during the period.
The shareholders of the Company authorized the Gibraltar Industries, Inc. 2015 Equity Incentive Plan (the "Plan") that allows the Company to grant equity-based incentive compensation awards to eligible participants, and the Gibraltar Industries, Inc. 2016 Stock Plan for Non-Employee Directors ("Non-Employee Directors Plan") that allows the Company to grant awards of shares of the Company's common stock to non-employee Directors of the Company. The Company's the 2005 Equity Incentive Plan (the "Prior Plan") was amended in 2015 to terminate issuance of further awards from the Prior Plan.
At December 31, 2017, 354,000 shares were available for issuance under the Plan as incentive stock options or other stock awards and 73,000 shares were available for issuance under the Non-Employee Directors Plan as awards of shares of the Company's common stock.
60
The Company recognized the following compensation expense in connection with awards that vested under the Plan, the Prior Plan, and the Non-Employee Directors Plan along with the related tax benefits recognized during the years ended December 31 (in thousands):
2017 | 2016 | 2015 | |||||||||
Expense recognized under the Prior Plan | $ | 1,059 | $ | 1,937 | $ | 1,953 | |||||
Expense recognized under the Plan | 5,643 | 3,993 | 1,938 | ||||||||
Expense recognized under the Non-Employee Directors Plan | 420 | 443 | — | ||||||||
Total stock compensation expense | $ | 7,122 | $ | 6,373 | $ | 3,891 | |||||
Tax benefits recognized related to stock compensation expense | $ | 2,133 | $ | 2,485 | $ | 1,518 | |||||
Equity Based Awards - Settled in Stock
The following table provides the number of stock unit awards granted and restricted shares issued during the years ended December 31, along with the weighted-average grant-date fair value of each award:
2017 | 2016 | 2015 | ||||||||||||||||||
Awards | Number of Awards | Weighted Average Grant Date Fair Value | Number of Awards | Weighted Average Grant Date Fair Value | Number of Awards | Weighted Average Grant Date Fair Value | ||||||||||||||
Options | 25,000 | $ | 12.85 | — | $ | — | 37,500 | $ | 7.67 | |||||||||||
Deferred stock units | 10,170 | $ | 34.42 | 11,945 | $ | 29.30 | — | $ | — | |||||||||||
Restricted shares | 2,034 | $ | 34.42 | 3,185 | $ | 29.30 | 21,318 | $ | 17.48 | |||||||||||
Restricted stock units | 133,548 | $ | 36.56 | 141,982 | $ | 25.44 | 212,419 | $ | 17.78 | |||||||||||
Performance stock units | 108,748 | $ | 42.72 | — | $ | — | 396,714 | $ | 19.78 | |||||||||||
Stock Options
The fair value of stock options granted during the years ended December 31, 2017 and December 31, 2015 were estimated on the date of grant using the Black-Scholes option pricing model. No options were granted in 2016. Expected stock volatility was based on volatility of the Company’s stock price using a historical period commensurate with the expected life of the options. The following table provides the weighted average assumptions used to value stock options issued during the year ended December 31:
Year of Grant | Fair Value | Expected Life (in years) | Expected Stock Volatility | Risk-free Interest Rate | Expected Dividend Yield | ||||||||||
2017 | $ | 12.85 | 4.00 | 35.7 | % | 1.7 | % | — | % | ||||||
2015 | $ | 7.67 | 4.00 | 35.7 | % | 1.5 | % | — | % | ||||||
61
The following table summarizes the ranges of outstanding and exercisable options at December 31, 2017:
Range of Exercise Prices | Options Outstanding | Weighted Average Remaining Contractual Life (in years) | Weighted Average Exercise Price | Options Exercisable | Weighted Average Exercise Price | ||||||||||
$8.90 – $9.32 | 28,750 | 2.70 | $ | 8.90 | 28,750 | $ | 8.90 | ||||||||
$9.33 – $11.73 | 92,441 | 3.70 | $ | 9.74 | 92,441 | $ | 9.74 | ||||||||
$11.74 – $17.94 | 39,475 | 1.70 | $ | 13.72 | 39,475 | $ | 13.72 | ||||||||
$17.95 – $23.80 | 37,000 | 0.69 | $ | 22.16 | 37,000 | $ | 22.16 | ||||||||
$23.81 – $43.05 | 50,000 | 8.57 | $ | 33.90 | — | $ | — | ||||||||
247,666 | 197,666 | ||||||||||||||
The following table summarizes information about stock option transactions:
Options | Weighted Average Exercise Price | Weighted Average Remaining Contractual Life (in years) | Aggregate Intrinsic Value | |||||||||
Balance at January 1, 2015 | 569,319 | $ | 15.88 | |||||||||
Granted | 37,500 | 25.44 | ||||||||||
Exercised | (119,096 | ) | 15.13 | |||||||||
Expired / Forfeited | (29,374 | ) | 20.28 | |||||||||
Balance at December 31, 2015 | 458,349 | $ | 16.57 | |||||||||
Exercised | (175,125 | ) | 19.08 | |||||||||
Forfeited | (6,000 | ) | 18.22 | |||||||||
Balance at December 31, 2016 | 277,224 | $ | 14.95 | |||||||||
Granted | 25,000 | 42.35 | ||||||||||
Exercised | (42,058 | ) | 16.02 | |||||||||
Forfeited | (12,500 | ) | 25.44 | |||||||||
Balance at December 31, 2017 | 247,666 | $ | 17.01 | 5.27 | $ | 4,194,000 | ||||||
The aggregate intrinsic value in the preceding table represents the total pre-tax intrinsic value, based on the $33.00 per share market price of the Company’s common stock as of December 31, 2017, which would have been received by the option holders had all option holders with an exercise price below the per share market price on December 31, 2017, exercised their options as of that date.
Stock units and Restricted Shares
The following table summarizes information about non-vested restricted stock units, performance stock units (that will convert to shares upon vesting) and restricted shares:
Restricted Stock Units | Weighted Average Grant Date Fair Value | Restricted Shares | Weighted Average Grant Date Fair Value | Performance Stock Units (2) (3) | Weighted Average Grant Date Fair Value | Deferred Stock Units (1) | Weighted Average Grant Date Fair Value | ||||||||||||||||||||
Balance at December 31, 2016 | 536,164 | $ | 17.79 | 7,361 | $ | 17.07 | 396,714 | $ | 19.78 | 11,945 | $ | 29.30 | |||||||||||||||
Granted | 133,548 | 36.56 | 2,034 | 34.42 | 108,748 | 42.72 | 10,170 | 34.42 | |||||||||||||||||||
Vested | (202,788 | ) | 15.71 | (5,137 | ) | 23.75 | — | — | — | — | |||||||||||||||||
Forfeited | (25,108 | ) | 25.88 | — | — | (25,000 | ) | 25.44 | — | — | |||||||||||||||||
Balance at December 31, 2017 | 441,816 | $ | 23.96 | 4,258 | $ | 17.30 | 480,462 | $ | 24.68 | 22,115 | $ | 31.65 | |||||||||||||||
(1) Vested and issued upon retirement.
62
(2) Amount granted in 2017 represents 78,482 units awarded in February 2017 and 5,266 units awarded in April 2017 that will convert to shares based upon the Company's actual return on invested capital ("ROIC") compared to targeted ROIC thresholds. The remaining 25,000 units were awarded in February 2017 and April 2017. The number of these shares to be issued to the recipients will be determined based upon the ranking of the Company's total shareholder return ("TSR") over a three (3) year performance period ended December 31, 2020 compared to the TSR of companies in the S&P Small Cap Industrial Sector over the same three year period.
(3) The December 31, 2016 balance includes 321,714 units awarded in June 2015 that convert to shares based on RBI's gross profit performance relative to their targeted gross profit for 2016 and 2017. RBI achieved its targeted gross profit performance, and the Company will issue 321,714 shares to the recipients in 2018. The remaining 75,000 units were awarded in December 2015; of which 25,000 were forfeited in 2017 and 50,000 remain outstanding as of December 31, 2017. The number of these shares to be issued to the recipient will be determined based upon the ranking of the Company's total shareholder return over a three (3) year performance period ended December 31, 2018 compared to the total shareholder return of companies in the S&P Small Cap Industrial Sector over such period.
The fair value of the restricted shares, restricted stock units, and deferred stock units, as well as, the performance stock units ("PSUs") payable based on the Company's ROIC or targeted gross profit performance issued during the three years ended December 31, 2017 was based on the Company stock price at grant date of the award. The fair values of the PSU's payable based on TSR ranking issued during the three years ended December 31, 2017 were determined using a Monte Carlo simulation.
The following table sets forth the aggregate intrinsic value of options exercised and aggregate fair value of restricted stock units and restricted shares that vested during the years ended December 31 (in thousands):
2017 | 2016 | 2015 | |||||||||
Aggregate intrinsic value of options exercised | $ | 628 | $ | 2,439 | $ | 1,089 | |||||
Aggregate fair value of vested restricted stock units | $ | 6,756 | $ | 4,368 | $ | 6,578 | |||||
Aggregate fair value of vested restricted shares | $ | 70 | $ | 247 | $ | 111 | |||||
Aggregate fair value of vested deferred stock units | $ | 350 | $ | 443 | $ | — | |||||
As of December 31, 2017, there was $9.2 million of total unrecognized compensation cost related to non-vested options, restricted shares, and restricted stock units. That cost is expected to be recognized over a weighted average period of 2.0 years.
Equity Based Awards - Settled in Cash
As of December 31, 2017, the Company's total share-based liabilities recorded on the consolidated balance sheet was $48.0 million, of which $29.3 million was included in non-current liabilities. Total share-based liabilities at December 31, 2016 was $45.5 million, of which $40.2 million was included in non-current liabilities. The Company's equity based awards that are settled in cash include performance stock units settled in cash and a management stock purchase plan.
Performance Stock Units - Settled in Cash
The Company has also PSUs that will convert to cash after three years based upon a one year performance period. The cost of these awards is recognized over the requisite vesting period. The PSUs earned over the performance period are determined based on the Company's actual ROIC relative to the ROIC targeted for the performance period.
The following table provides the number of PSUs which will convert to cash for the years ending December 31:
2016 | 2015 | ||||||||||||
Awards | Number of Units (2) | Grant Date Fair Value (in $000s) | Number of Units (3) | Grant Date Fair Value (in $000s) | |||||||||
Performance stock units (1) | 128,000 | $ | 3,100 | 219,000 | $ | 4,039 | |||||||
(1) There were no performance stock units that convert to cash granted to participants in 2017.
(2) The participants earned 200% of target aggregating 256,000 PSUs earned. This award will convert to cash and be payable in January 2019.
63
(3) The participants earned 200% of target aggregating 438,000 PSUs earned. This award will be converted to cash and will be paid to participants in the first quarter of 2018 at the trailing 90-day closing price of the Company's common stock as of December 31, 2017.
The following table summarizes the compensation expense recognized from the change in fair value and vesting of performance stock units awarded for the years ended December 31 (in thousands):
2017 | 2016 | 2015 | |||||||||
Performance stock unit compensation expense | $ | 3,591 | $ | 10,377 | $ | 6,965 | |||||
Management Stock Purchase Plan
The Management Stock Purchase Plan ("MSPP") provides participants the ability to defer a portion of their compensation or Directors’ fees, which deferral is converted to restricted stock units, and credited to an account. Participants eligible to defer a portion of their compensation also receive a company-matching award in restricted stock units equal to a percentage of their compensation. The account represents a share-based liability that is converted to and settled in cash payable to participants upon retirement or a termination of their service to the Company.
The following table provides the number of restricted stock units credited to active participant accounts, balance of vested and unvested restricted stock units within active participant accounts, payments made with respect to restricted stock units issued under the MSPP, and MSPP expense during years ended December 31:
2017 | 2016 | 2015 | |||||||||
Restricted stock units credited | 84,299 | 198,155 | 94,047 | ||||||||
Restricted stock units balance, vested and unvested | 389,189 | 646,669 | 519,668 | ||||||||
Share-based liabilities paid, in thousands | $ | 6,058 | $ | 3,137 | $ | 1,901 | |||||
MSPP expense, in thousands | $ | 2,432 | $ | 8,565 | $ | 2,767 | |||||
13. FAIR VALUE MEASUREMENTS
Fair value is defined as the price that would be received to sell an asset or paid to transfer a liability in an orderly transaction between market participants at the measurement date. Depending on the nature of the asset or liability, various techniques and assumptions can be used to estimate fair value. A financial asset or liability’s classification within the hierarchy is determined based on the lowest level input that is significant to the fair value measurement as follows:
• | Level 1 - Quoted prices in active markets for identical assets or liabilities. |
• | Level 2 - Observable inputs other than quoted prices in active markets for similar assets and liabilities. |
• | Level 3 - Inputs that are unobservable inputs for the asset or liability. |
The Company had no financial assets or liabilities measured at fair value on a recurring basis at December 31, 2017 and 2016. The Company's only financial instrument for which carrying value differs from its fair value is long-term debt. At December 31, 2017 and 2016, the fair value of outstanding debt net of unamortized debt issuance costs was $213.8 million and $219.9 million, respectively, compared to its carrying value of $210.0 million and $209.6 million, respectively. The fair value of the Company's Senior Subordinated 6.25% Notes is classified as Level 2 within the fair value hierarchy and was estimated based on quoted market prices adjusted for unamortized debt issuance costs.
The Company’s other financial instruments primarily consist of cash and cash equivalents, accounts receivable, notes receivable, and accounts payable. The carrying values for our financial instruments approximate fair value. The Company did not have any other material assets or liabilities carried at fair value and measured on a recurring basis as of December 31, 2017 and 2016.
Other non-recurring fair value measurements
The Company recognized the impairment of certain intangible assets and property, plant, and equipment during the years ended December 31, 2017, 2016 and 2015. The Company uses unobservable inputs, classified as Level 3 inputs, in determining the
64
fair value of these assets. See Note 6 and Note 14 of the consolidated financial statements for more disclosure regarding the impairment of certain intangible assets and property, plant, and equipment, respectively.
The Company also applied fair value principles for the goodwill impairment tests performed during 2017, 2016, and 2015. The Company used two valuation models to estimate the fair values of its reporting units, both of which primarily use Level 3 inputs. See Note 6 of the consolidated financial statements for the results of the Company’s goodwill impairment tests.
Additionally, the Company's recent acquisition activity, as described in Note 5 of the consolidated financial statements, used Level 3 inputs to estimate fair values allocated to the assets acquired and liabilities assumed.
14. EXIT ACTIVITY COSTS AND ASSET IMPAIRMENTS
The Company completed the third year of its five year planned transformation strategy formulated to transform its operations and improve its financial results over this five year period. This strategy includes an 80/20 simplification initiative which, in part, focuses the Company’s internal resources on further increasing the value provided to our customers. A result of this initiative was the identification of low-volume, low margin, internally-produced products which have been or will be outsourced or discontinued. Portfolio management, another key part of the strategy and a natural adjunct to the 80/20 initiative, is another initiative in which management conducts strategic reviews of our current portfolio for future profitable growth and greater shareholder returns. This initiative has resulted in the sale and exiting of less profitable businesses or products lines in order to enable the Company to re-allocate leadership, time, capital and resources to the highest potential platforms and businesses. Exit activity costs and asset impairment charges were incurred as a result of these initiatives.
In 2017, the 80/20 simplification initiative was initiated at additional business units as well as continued at those business units which commenced activity in 2016 and 2015. Correspondingly, the Company executed the portfolio management strategy in 2016, which had carryover effect in 2017. The portfolio management resulted in the execution of three transactions directly related to this strategy: the sale of its European industrial manufacturing business to a third party in April 2016, the exiting of its small European residential solar racking business and the exiting of its U.S. bar grating product line. Both the exit of the Company's small European residential solar racking business and the exit of the Company's U.S. bar grating product line commenced in the fourth quarter of 2016 and were essentially completed in 2017.
During 2017, asset impairment charges incurred by the Company were more than offset by a gain on sale of assets previously impaired in 2016 as a result of businesses and product lines discontinued. Specifically, asset sales related to the exit of both the Company's small European residential solar racking business and U.S. bar grating product line during 2017 resulted in a net gain. Asset impairments relate to the write-down of inventory and impairment of machinery, equipment and facilities associated with either businesses sold or exited, discontinued product lines or the reduction of manufactured goods offered within a product line. These assets were written down to their sale or scrap value, and were subsequently sold or disposed of.
The Company also incurred exit activity costs in 2017 which related to contract termination costs, severance costs, and other moving and closing costs. The above initiatives led to the closing and consolidation of three facilities in 2017. The Company closed and consolidated seven facilities during 2016 and four facilities in 2015, which resulted in asset impairment charges and exit activity costs in both years. In addition, the Company sold and leased back a facility in 2015.
The following table sets forth the inventory write-downs, asset impairment charges, exit activity costs and gain on facilities sold in conjunction with these efforts, incurred by segment during the years ended December 31 related to the restructuring activities described above (in thousands):
65
2017 | 2016 | 2015 | |||||||||||||||||||||||||||||||||||||
Inventory write-downs &/or asset impairment charges | Exit activity costs | Total | Inventory write-downs &/or asset impairment charges | Exit activity costs | Total | Inventory write-downs &/or asset impairment charges | Exit activity costs | Gain on sale leaseback | Total | ||||||||||||||||||||||||||||||
Residential Products | $ | 345 | $ | 1,058 | $ | 1,403 | $ | 1,459 | $ | 1,074 | $ | 2,533 | $ | 6,495 | $ | 1,256 | $ | (6,799 | ) | $ | 952 | ||||||||||||||||||
Industrial & Infrastructure Products | (2,484 | ) | 2,820 | 336 | 4,221 | 4,546 | 8,767 | 2,009 | 162 | — | 2,171 | ||||||||||||||||||||||||||||
Renewable Energy & Conservation | 509 | 2,986 | 3,495 | 1,850 | 539 | 2,389 | — | — | — | — | |||||||||||||||||||||||||||||
Corporate | — | 261 | 261 | — | 58 | 58 | — | — | — | — | |||||||||||||||||||||||||||||
Total exit activity costs & asset impairments | $ | (1,630 | ) | $ | 7,125 | $ | 5,495 | $ | 7,530 | $ | 6,217 | $ | 13,747 | $ | 8,504 | $ | 1,418 | $ | (6,799 | ) | $ | 3,123 | |||||||||||||||||
The following table provides a summary of where the above exit activity costs and asset impairments are recorded in the consolidated statements of operations for the years ended December 31 (in thousands):
2017 | 2016 | 2015 | |||||||||
Cost of sales | $ | 911 | $ | 9,922 | $ | 9,381 | |||||
Selling, general, and administrative expense | 4,584 | 3,825 | (6,258 | ) | |||||||
Total exit activity costs and asset impairments | $ | 5,495 | $ | 13,747 | $ | 3,123 | |||||
The following table reconciles the beginning and ending liability for exit activity costs relating to the Company’s facility consolidation efforts (in thousands):
2017 | 2016 | ||||||
Balance as of January 1 | $ | 3,744 | $ | 603 | |||
Exit activity costs recognized | 7,125 | 6,217 | |||||
Cash payments | (9,908 | ) | (3,076 | ) | |||
Balance as of December 31 | $ | 961 | $ | 3,744 | |||
As noted above, the Company sold its European industrial manufacturing business to a third party on April 15, 2016, from its Industrial and Infrastructure Products segment. The pretax loss on the disposal was $8.8 million. The sale resulted in a net loss of $2.0 million on net proceeds of $8.3 million. This divestiture did not meet the criteria to be reported as a discontinued operation as it does not represent a strategic shift that has or will have a major effect on the Company’s operations. Therefore, prior period results of continuing operations have not been restated to exclude the impact of the divested business’s financial results. The pretax loss on disposal is presented within other expense (income) in the consolidated statement of operations. Neither the exit of the Company’s small European residential solar racking business nor its U.S. bar grating product line met the criteria to be reported as a discontinued operation. The costs related to exiting this business and product line are reflected in the above tables.
15. INCOME TAXES
On December 22, 2017, the President of the United States signed into law the Tax Cuts and Jobs Act (“Tax Reform Act”). The legislation significantly changes U.S. tax law by, among other things, lowering corporate income tax rates, implementing a territorial tax system and imposing a transition tax on deemed repatriated earnings of foreign subsidiaries. The Tax Reform Act permanently reduces the U.S. corporate income tax rate from a maximum of 35% to a flat 21% rate, effective January 1, 2018. As a result of the reduction in the U.S. corporate income tax rate from 35% to 21% under the Tax Reform Act, the Company revalued its ending U.S. net deferred tax liabilities at December 31, 2017 and recognized a provisional $16.2 million tax benefit in the Company’s consolidated statement of operations for the year ended December 31, 2017.
66
The Company uses the asset and liability method of accounting for income taxes. Under this method, deferred tax assets and liabilities are recognized for the future tax consequences attributable to differences between the financial statement carrying amounts of existing assets and liabilities and their respective tax basis. Deferred tax assets and liabilities are measured using enacted tax rates expected to apply to taxable income in the years in which those temporary differences are expected to reverse.
The Tax Reform Act provided for a one-time transition tax on post-1986 undistributed foreign subsidiary earnings and profits (“E&P”). The Company recognized a provisional $3.7 million of income tax expense as a result of the transition tax and related repatriation in the Company’s consolidated statement of operations for the year ended December 31, 2017.
While the Tax Reform Act provides for a territorial tax system, beginning in 2018, it includes two new U.S. tax base erosion provisions, the global intangible low-taxed income (“GILTI”) provisions and the base-erosion and anti-abuse tax (“BEAT”) provisions.
The GILTI provisions require the Company to include in its U.S. income tax return foreign subsidiary earnings in excess of an allowable return on the foreign subsidiary’s tangible assets. The Company expects that it will be subject to incremental U.S. tax on GILTI income beginning in 2018, due to expense allocations required by the U.S. foreign tax credit rules. The Company has elected to account for GILTI tax in the period in which it is incurred, and therefore has not provided any deferred tax impacts of GILTI in its consolidated financial statements for the year ended December 31, 2017.
The BEAT provisions in the Tax Reform Act eliminates the deduction of certain base-erosion payments made to related foreign corporations, and impose a minimum tax if greater than regular tax. The Company does not expect it will be subject to this tax.
On December 22, 2017, the SEC staff issued Staff Accounting Bulletin No. 118 (“SAB 118”) to address the application of U.S. GAAP in situations when a registrant does not have the necessary information available, prepared, or analyzed (including computations) in reasonable detail to complete the accounting for certain income tax effects of the Tax Reform Act. The Company has recognized the provisional tax impacts related to the one-time transition tax, withholding tax and the revaluation of deferred tax assets and liabilities and included these amounts in its consolidated financial statements for the year ended December 31, 2017. As there is some uncertainty around the grandfathering provisions related to performance-based executive compensation, we have not included a provisional amount for deferred tax assets related to performance-based executive compensation as we believe that all of our plans are grandfathered. Our preliminary estimate of the one-time transition tax and the re-measurement of our deferred tax assets and liabilities is subject to the finalization of management’s analysis related to certain matters, such as developing interpretations of the provisions of the 2017 Tax Reform Act, changes to certain estimates and amounts related to the earnings and profits of certain subsidiaries and the filing of our tax returns, U.S. Treasury regulations, administrative interpretations or court decisions interpreting the 2017 Tax Reform Act may require further adjustments and changes in our estimates.
The final determination of the one-time transition tax and the re-measurement of our deferred assets and liabilities will be completed as additional information becomes available, but no later than one year from the enactment of the 2017 Tax Reform Act.
The components of income (loss) before taxes from continuing operations consisted of the following for the years ended December 31 (in thousands):
2017 | 2016 | 2015 | |||||||||
Domestic | $ | 78,468 | $ | 37,316 | $ | 40,176 | |||||
Foreign | (560 | ) | 12,667 | (3,076 | ) | ||||||
Income before taxes from continuing operations | $ | 77,908 | $ | 49,983 | $ | 37,100 | |||||
67
The provision for (benefit of) income taxes from continuing operations for the years ended December 31 consisted of the following (in thousands):
2017 | 2016 | 2015 | |||||||||
Current: | |||||||||||
U.S. Federal | $ | 16,882 | $ | 14,703 | $ | 12,294 | |||||
State | 2,479 | 2,987 | 2,010 | ||||||||
Foreign | 2,687 | 3,467 | 1,371 | ||||||||
Total current | 22,048 | 21,157 | 15,675 | ||||||||
Deferred: | |||||||||||
U.S. Federal | (7,466 | ) | (5,404 | ) | (178 | ) | |||||
State | 1,246 | 1,595 | 273 | ||||||||
Foreign | (885 | ) | (1,084 | ) | (2,146 | ) | |||||
Total deferred | (7,105 | ) | (4,893 | ) | (2,051 | ) | |||||
Provision for income taxes | $ | 14,943 | $ | 16,264 | $ | 13,624 | |||||
The benefit of income taxes from discontinued operations for the years ended December 31 consisted of the following (in thousands):
2017 | 2016 | 2015 | |||||||||
Current: | |||||||||||
U.S. Federal | $ | 219 | $ | 24 | $ | 15 | |||||
State | 20 | 2 | 1 | ||||||||
Foreign | — | — | — | ||||||||
Benefit of income taxes | $ | 239 | $ | 26 | $ | 16 | |||||
The provision for income taxes from continuing operations differs from the federal statutory rate of 35% for the years ended December 31 due to the following (in thousands):
2017 | 2016 | 2015 | ||||||||||||||||||
Statutory rate | $ | 27,268 | 35.0 | % | $ | 17,494 | 35.0 | % | $ | 12,985 | 35.0 | % | ||||||||
State taxes, less federal effect | 2,442 | 3.1 | % | 3,033 | 6.1 | % | 1,845 | 5.0 | % | |||||||||||
Tax effect of Tax Reform Act | (12,535 | ) | (16.1 | )% | — | — | % | — | — | % | ||||||||||
Domestic manufacturer's deduction | (1,578 | ) | (2.0 | )% | (1,363 | ) | (2.7 | )% | (795 | ) | (2.1 | )% | ||||||||
Excess tax benefit on stock based compensation | (1,415 | ) | (1.8 | )% | — | — | % | — | — | % | ||||||||||
Federal tax credits | (373 | ) | (0.5 | )% | (439 | ) | (0.9 | )% | (242 | ) | (0.7 | )% | ||||||||
Uncertain tax positions | (148 | ) | (0.2 | )% | (154 | ) | (0.3 | )% | (344 | ) | (0.9 | )% | ||||||||
Change in valuation allowance | 660 | 0.8 | % | 685 | 1.4 | % | 284 | 0.7 | % | |||||||||||
Non-deductible expenses | 499 | 0.7 | % | 556 | 1.1 | % | 2 | — | % | |||||||||||
Foreign rate differential | 2 | — | % | (677 | ) | (1.4 | )% | (6 | ) | — | % | |||||||||
Intangible asset impairment | — | — | % | 341 | 0.7 | % | — | — | % | |||||||||||
Worthless stock deduction | — | — | % | (868 | ) | (1.7 | )% | — | — | % | ||||||||||
Intercompany debt discharge | — | — | % | (2,389 | ) | (4.8 | )% | — | — | % | ||||||||||
Other | 121 | 0.2 | % | 45 | — | % | (105 | ) | (0.3 | )% | ||||||||||
$ | 14,943 | 19.2 | % | $ | 16,264 | 32.5 | % | $ | 13,624 | 36.7 | % | |||||||||
68
Deferred tax liabilities (assets) at December 31 consist of the following (in thousands):
2017 | 2016 | ||||||
Depreciation | $ | 9,563 | $ | 17,367 | |||
Goodwill | 32,662 | 43,562 | |||||
Intangible assets | 10,928 | 14,731 | |||||
Foreign withholding tax | 1,014 | — | |||||
Other | 652 | 892 | |||||
Gross deferred tax liabilities | 54,819 | 76,552 | |||||
Equity compensation | (12,577 | ) | (21,439 | ) | |||
Other | (13,247 | ) | (18,473 | ) | |||
Gross deferred tax assets | (25,824 | ) | (39,912 | ) | |||
Valuation allowances | 2,242 | 1,362 | |||||
Deferred tax assets, net of valuation allowances | (23,582 | ) | (38,550 | ) | |||
Net deferred tax liabilities | $ | 31,237 | $ | 38,002 | |||
At December 31, 2017, the Company had net operating loss carry forwards for federal, state, and foreign income tax purposes totaling $22.5 million. The federal and state net operating loss carry forwards will expire between 2018 and 2037. The foreign net operating loss carry forwards have an indefinite carry forward period, except for Japan that expires between 2023 and 2026. The Company recognized $3.5 million of deferred tax assets, net of the federal tax benefit, related to these net operating losses prior to any valuation allowances.
Deferred taxes include net deferred tax assets relating to certain state and foreign tax jurisdictions. A reduction of the carrying amount of deferred tax assets by a valuation allowance is required if it is more likely than not that such assets will not be realized. The following sets forth a reconciliation of the beginning and ending amount of the Company’s valuation allowance (in thousands):
2017 | 2016 | 2015 | |||||||||
Balance as of January 1 | $ | 1,362 | $ | 766 | $ | 400 | |||||
Cost charged to the tax provision | 1,505 | 983 | 286 | ||||||||
Reductions | (820 | ) | (338 | ) | (78 | ) | |||||
Currency translation | 195 | (49 | ) | — | |||||||
Balance as of December 31 | $ | 2,242 | $ | 1,362 | $ | 766 | |||||
The Company made net payments for income taxes for the following amounts for the years ended December 31 (in thousands):
2017 | 2016 | 2015 | |||||||||
Payments made for income taxes, net | $ | 26,186 | $ | 17,700 | $ | 11,879 | |||||
At December 31, 2017, the Company had $27.2 million of undistributed earnings of foreign subsidiaries. The Company expects to execute a one-time repatriation of $24.4 million in cash to the U.S., net of withholding tax. The funds will be used for general corporate purposes. The Company continues to maintain its assertion that all remaining foreign earnings will be indefinitely reinvested. Any excess earnings could be used to grow the Company's foreign operations through launches of new capital projects or additional acquisitions. Determination of the amount of unrecognized deferred U.S. income tax liability related to our remaining unremitted foreign earnings is not practicable due to the complexities associated with its hypothetical calculation.
69
A reconciliation of the beginning and ending amount of unrecognized tax benefits is as follows (in thousands):
2017 | 2016 | 2015 | |||||||||
Balance as of January 1 | $ | 3,466 | $ | 3,876 | $ | 1,414 | |||||
Additions for tax positions of the current year | 99 | 33 | 148 | ||||||||
Additions for tax positions of prior years | — | — | 2,955 | ||||||||
Reductions for tax positions of prior years for: | |||||||||||
Settlements and changes in judgment | (422 | ) | (256 | ) | (331 | ) | |||||
Lapses of applicable statute of limitations | — | — | (310 | ) | |||||||
Divestitures and foreign currency translation | 393 | (187 | ) | — | |||||||
Balance as of December 31 | $ | 3,536 | $ | 3,466 | $ | 3,876 | |||||
In 2017 and 2016, the unrecognized tax benefits of $0.3 million and $0.6 million, respectively, would affect the effective tax rate, if recognized as of December 31, 2017 and 2016. $3.2 million and $2.8 million of unrecognized tax benefits related to the acquisition of RBI on June 9, 2015, if recognized would be offset by an equal indemnification asset at December 31, 2017 and 2016. The Company classifies accrued interest and penalties related to unrecognized tax benefits in income tax expense.
The Company and its U.S. subsidiaries file a U.S. federal consolidated income tax return. Foreign and U.S. state jurisdictions have statute of limitations generally ranging from four to ten years. Currently, the Company is under examination in Germany for 2009 through 2012. The Company's U.S. federal consolidated income tax return remains subject to examination for 2015, 2016 and 2017.
Interest (net of federal tax benefit) and penalties recognized during the years ended December 31 were (in thousands):
2017 | 2016 | 2015 | |||||||||
Interest and penalties recognized as income | $ | 130 | $ | 122 | $ | 87 | |||||
16. EARNINGS PER SHARE
Basic earnings per share is based on the weighted average number of common shares outstanding. Diluted earnings per share is based on the weighted average number of common shares outstanding, as well as dilutive common shares which include shares issuable under the equity compensation plans described in Note 12 of the consolidated financial statements. The weighted average number of diluted shares does not include potential anti-dilutive common shares aggregating 468,000, 653,000 and 643,000 at December 31, 2017, 2016 and 2015, respectively. The treasury stock method is used to calculate dilutive shares, which reduces the gross number of dilutive shares by the number of shares purchasable from the proceeds of the options assumed to be exercised and the unrecognized expense related to the restricted stock and restricted stock awards assumed to have vested.
Basic earnings and diluted weighted-average shares outstanding are as follows for the years ended December 31 (in thousands):
2017 | 2016 | 2015 | |||||||||
Numerator: | |||||||||||
Income from continuing operations | $ | 62,965 | $ | 33,719 | $ | 23,476 | |||||
Loss from discontinued operations | (405 | ) | (44 | ) | (28 | ) | |||||
Net income available to common shareholders | $ | 62,560 | $ | 33,675 | $ | 23,448 | |||||
Denominator for basic earnings per share: | |||||||||||
Weighted average shares outstanding | 31,701 | 31,536 | 31,233 | ||||||||
Denominator for diluted earnings per share: | |||||||||||
Common stock options and restricted stock | 549 | 533 | 312 | ||||||||
Weighted average shares and conversions | 32,250 | 32,069 | 31,545 | ||||||||
70
17. COMMITMENTS AND CONTINGENCIES
The Company leases certain facilities and equipment under operating leases. As leases expire, it can be expected that, in the normal course of business, certain leases will be renewed or replaced. Certain lease agreements include escalating rent payments over the lease terms. The Company expenses rent on a straight-line basis over the lease term which commences on the date the Company has the right to control the property. Rent expense under operating leases for the years ended December 31 aggregated (in thousands):
2017 | 2016 | 2015 | |||||||||
Rent expense | $ | 11,964 | $ | 13,652 | $ | 13,959 | |||||
Future minimum lease payments under these noncancelable operating leases as of December 31, 2017 are as follows (in thousands):
2018 | 2019 | 2020 | 2021 | 2022 | Thereafter | ||||||||||||
Future minimum lease payments | 11,072 | 9,274 | 6,521 | 4,773 | 3,817 | 5,211 | |||||||||||
The Company is a party to certain claims and legal actions generally incidental to its business. For certain divestiture transactions completed in prior years, the Company has agreed to indemnify the buyer for various liabilities that may arise after the disposal date, subject to limits of time and amount. The Company is a party to certain claims made under these indemnification provisions. As of December 31, 2017, the Company has a contingent liability recorded for such provisions related to discontinued operations. Management does not believe that the outcome of this claim, or other claims which are not clearly determinable at the present time, would significantly affect the Company's financial condition or results of operation.
18. RELATED PARTY TRANSACTIONS
A former officer of one of the Company's operating segments is the owner of certain real estate properties leased for manufacturing and distribution purposes by that operating segment. The leases are in effect until June 2018 and June 2020. For the years ended December 31, 2017 and 2016, the Company incurred $1.1 million and $1.0 million of lease expense for these properties. All amounts incurred during 2017 and 2016 were expensed as a component of cost of sales.
19. SEGMENT INFORMATION
The Company is organized into three reportable segments on the basis of the production process and products and services provided by each segment, identified as follows:
(i) | Residential Products, which primarily includes roof and foundation ventilation products, centralized mail systems and electronic package solutions, rain dispersion products and roofing accessories; |
(ii) | Industrial and Infrastructure Products, which primarily includes expanded and perforated metal, expansion joints and structural bearings; and |
(iii) | Renewable Energy and Conservation, which primarily includes designing, engineering, manufacturing and installation of solar racking systems and greenhouse structures. |
When determining the reportable segments, the Company aggregated operating segments based on their similar economic and operating characteristics.
71
The following table illustrates certain measurements used by management to assess the performance of the segments described above as of and for the years ended December 31 (in thousands):
2017 | 2016 | 2015 | |||||||||
Net sales: | |||||||||||
Residential Products | $ | 466,603 | $ | 430,938 | $ | 475,653 | |||||
Industrial and Infrastructure Products | 215,211 | 296,513 | 378,224 | ||||||||
Less: Intersegment sales | (1,247 | ) | (1,495 | ) | (1,536 | ) | |||||
213,964 | 295,018 | 376,688 | |||||||||
Renewable Energy and Conservation | 306,351 | 282,025 | 188,532 | ||||||||
Total consolidated net sales | $ | 986,918 | $ | 1,007,981 | $ | 1,040,873 | |||||
Income (loss) from operations: | |||||||||||
Residential Products | $ | 76,893 | $ | 65,241 | $ | 46,804 | |||||
Industrial and Infrastructure Products | 8,159 | 1,306 | 15,581 | ||||||||
Renewable Energy and Conservation | 30,218 | 43,214 | 12,659 | ||||||||
Unallocated corporate expenses | (22,421 | ) | (36,273 | ) | (26,312 | ) | |||||
$ | 92,849 | $ | 73,488 | $ | 48,732 | ||||||
Depreciation and Amortization | |||||||||||
Residential Products | $ | 9,183 | $ | 9,297 | $ | 9,967 | |||||
Industrial and Infrastructure Products | 6,529 | 8,237 | 12,108 | ||||||||
Renewable Energy and Conservation | 5,657 | 6,203 | 7,811 | ||||||||
Unallocated corporate expenses | 321 | 377 | 662 | ||||||||
$ | 21,690 | $ | 24,114 | $ | 30,548 | ||||||
Total assets | |||||||||||
Residential Products | $ | 358,838 | $ | 331,975 | $ | 363,339 | |||||
Industrial and Infrastructure Products | 203,455 | 225,691 | 273,987 | ||||||||
Renewable Energy and Conservation | 219,806 | 207,241 | 215,211 | ||||||||
Unallocated corporate assets | 209,286 | 153,338 | 37,235 | ||||||||
$ | 991,385 | $ | 918,245 | $ | 889,772 | ||||||
Capital expenditures | |||||||||||
Residential Products | $ | 5,236 | $ | 5,182 | $ | 3,328 | |||||
Industrial and Infrastructure Products | 2,094 | 2,060 | 4,846 | ||||||||
Renewable Energy and Conservation | 3,648 | 3,160 | 3,871 | ||||||||
Unallocated corporate expenditures | 421 | 377 | 328 | ||||||||
$ | 11,399 | $ | 10,779 | $ | 12,373 | ||||||
72
Net sales by region or origin and long-lived assets by region of domicile for the years ended and as of December 31 are as follows (in thousands):
2017 | 2016 | 2015 | |||||||||
Net sales | |||||||||||
North America | $ | 977,942 | $ | 963,797 | $ | 968,414 | |||||
Europe | 1,131 | 19,447 | 48,216 | ||||||||
Asia | 7,845 | 24,737 | 24,243 | ||||||||
Total | $ | 986,918 | $ | 1,007,981 | $ | 1,040,873 | |||||
Long-lived assets | |||||||||||
North America | $ | 97,956 | $ | 108,334 | $ | 110,571 | |||||
Europe | 3,222 | 2,900 | 11,084 | ||||||||
Asia | 601 | 992 | 1,292 | ||||||||
Total | $ | 101,779 | $ | 112,226 | $ | 122,947 | |||||
20. SUPPLEMENTAL FINANCIAL INFORMATION
The following information sets forth the consolidating summary financial statements of the issuer (Gibraltar Industries, Inc.) and guarantors, which guarantee the Senior Subordinated 6.25% Notes due February 1, 2021, and the non-guarantors. The guarantors are 100% owned domestic subsidiaries of the issuer and the guarantees are full, unconditional, joint and several.
Investments in subsidiaries are accounted for by the parent using the equity method of accounting. The guarantor subsidiaries and non-guarantor subsidiaries are presented on a combined basis. The principal elimination entries eliminate investments in subsidiaries and intercompany balances and transactions.
73
GIBRALTAR INDUSTRIES, INC.
CONSOLIDATING STATEMENT OF OPERATIONS
YEAR ENDED DECEMBER 31, 2017
(in thousands)
Gibraltar Industries, Inc. | Guarantor Subsidiaries | Non-Guarantor Subsidiaries | Eliminations | Total | |||||||||||||||
Net sales | $ | — | $ | 947,604 | $ | 52,738 | $ | (13,424 | ) | $ | 986,918 | ||||||||
Cost of sales | — | 719,587 | 43,187 | (12,400 | ) | 750,374 | |||||||||||||
Gross profit | — | 228,017 | 9,551 | (1,024 | ) | 236,544 | |||||||||||||
Selling, general, and administrative expense | 147 | 133,409 | 9,892 | — | 143,448 | ||||||||||||||
Intangible asset impairment | — | 200 | 47 | — | 247 | ||||||||||||||
(Loss) income from operations | (147 | ) | 94,408 | (388 | ) | (1,024 | ) | 92,849 | |||||||||||
Interest expense (income) | 13,609 | 512 | (89 | ) | — | 14,032 | |||||||||||||
Other expense | — | 500 | 409 | — | 909 | ||||||||||||||
(Loss) income before taxes | (13,756 | ) | 93,396 | (708 | ) | (1,024 | ) | 77,908 | |||||||||||
(Benefit of) provision for income taxes | (5,079 | ) | 19,787 | 235 | — | 14,943 | |||||||||||||
(Loss) income from continuing operations | (8,677 | ) | 73,609 | (943 | ) | (1,024 | ) | 62,965 | |||||||||||
Discontinued operations: | |||||||||||||||||||
Loss before taxes | — | (644 | ) | — | — | (644 | ) | ||||||||||||
Benefit of income taxes | — | (239 | ) | — | — | (239 | ) | ||||||||||||
Loss from discontinued operations | — | (405 | ) | — | — | (405 | ) | ||||||||||||
Equity in earnings from subsidiaries | 72,261 | (943 | ) | — | (71,318 | ) | — | ||||||||||||
Net income (loss) | $ | 63,584 | $ | 72,261 | $ | (943 | ) | $ | (72,342 | ) | $ | 62,560 | |||||||
74
GIBRALTAR INDUSTRIES, INC.
CONSOLIDATING STATEMENT OF OPERATIONS
YEAR ENDED DECEMBER 31, 2016
(in thousands)
Gibraltar Industries, Inc. | Guarantor Subsidiaries | Non-Guarantor Subsidiaries | Eliminations | Total | |||||||||||||||
Net sales | $ | — | $ | 950,945 | $ | 78,184 | $ | (21,148 | ) | $ | 1,007,981 | ||||||||
Cost of sales | — | 722,315 | 62,729 | (21,825 | ) | 763,219 | |||||||||||||
Gross profit | — | 228,630 | 15,455 | 677 | 244,762 | ||||||||||||||
Selling, general, and administrative expense | 14,302 | 137,343 | 9,454 | — | 161,099 | ||||||||||||||
Intangible asset impairment | — | 7,980 | 2,195 | — | 10,175 | ||||||||||||||
(Loss) income from operations | (14,302 | ) | 83,307 | 3,806 | 677 | 73,488 | |||||||||||||
Interest expense (income) | 13,609 | 1,042 | (74 | ) | — | 14,577 | |||||||||||||
Other expense (income) | 8,716 | 512 | (300 | ) | — | 8,928 | |||||||||||||
(Loss) income before taxes | (36,627 | ) | 81,753 | 4,180 | 677 | 49,983 | |||||||||||||
(Benefit of) provision for income taxes | (11,768 | ) | 27,551 | 481 | — | 16,264 | |||||||||||||
(Loss) income from continuing operations | (24,859 | ) | 54,202 | 3,699 | 677 | 33,719 | |||||||||||||
Discontinued operations: | |||||||||||||||||||
Loss before taxes | — | (70 | ) | — | — | (70 | ) | ||||||||||||
Benefit of income taxes | — | (26 | ) | — | — | (26 | ) | ||||||||||||
Loss from discontinued operations | — | (44 | ) | — | — | (44 | ) | ||||||||||||
Equity in earnings from subsidiaries | 57,857 | 3,699 | — | (61,556 | ) | — | |||||||||||||
Net income | $ | 32,998 | $ | 57,857 | $ | 3,699 | $ | (60,879 | ) | $ | 33,675 | ||||||||
75
GIBRALTAR INDUSTRIES, INC.
CONSOLIDATING STATEMENT OF OPERATIONS
YEAR ENDED DECEMBER 31, 2015
(in thousands)
Gibraltar Industries, Inc. | Guarantor Subsidiaries | Non-Guarantor Subsidiaries | Eliminations | Total | |||||||||||||||
Net sales | $ | — | $ | 960,614 | $ | 109,984 | $ | (29,725 | ) | $ | 1,040,873 | ||||||||
Cost of sales | — | 785,085 | 94,949 | (26,137 | ) | 853,897 | |||||||||||||
Gross profit | — | 175,529 | 15,035 | (3,588 | ) | 186,976 | |||||||||||||
Selling, general, and administrative expense | 133 | 115,882 | 17,366 | — | 133,381 | ||||||||||||||
Intangible asset impairment | — | 4,863 | — | — | 4,863 | ||||||||||||||
(Loss) income from operations | (133 | ) | 54,784 | (2,331 | ) | (3,588 | ) | 48,732 | |||||||||||
Interest expense (income) | 13,609 | 1,469 | (75 | ) | — | 15,003 | |||||||||||||
Other expense (income) | 50 | (3,154 | ) | (267 | ) | — | (3,371 | ) | |||||||||||
(Loss) income before taxes | (13,792 | ) | 56,469 | (1,989 | ) | (3,588 | ) | 37,100 | |||||||||||
(Benefit of) provision for income taxes | (4,427 | ) | 18,827 | (776 | ) | — | 13,624 | ||||||||||||
(Loss) income from continuing operations | (9,365 | ) | 37,642 | (1,213 | ) | (3,588 | ) | 23,476 | |||||||||||
Discontinued operations: | |||||||||||||||||||
Loss before taxes | — | (44 | ) | — | — | (44 | ) | ||||||||||||
Benefit of income taxes | — | (16 | ) | — | — | (16 | ) | ||||||||||||
Loss from discontinued operations | — | (28 | ) | — | — | (28 | ) | ||||||||||||
Equity in earnings from subsidiaries | 36,401 | (1,213 | ) | — | (35,188 | ) | — | ||||||||||||
Net income (loss) | $ | 27,036 | $ | 36,401 | $ | (1,213 | ) | $ | (38,776 | ) | $ | 23,448 | |||||||
76
GIBRALTAR INDUSTRIES, INC.
CONSOLIDATING STATEMENTS OF COMPREHENSIVE INCOME
(in thousands)
Gibraltar Industries, Inc. | Guarantor Subsidiaries | Non-Guarantor Subsidiaries | Eliminations | Total | |||||||||||||||
Year ended December 31, 2017 | |||||||||||||||||||
Net income (loss) | $ | 63,584 | $ | 72,261 | $ | (943 | ) | $ | (72,342 | ) | $ | 62,560 | |||||||
Other comprehensive income: | |||||||||||||||||||
Foreign currency translation adjustment | — | — | 3,150 | — | 3,150 | ||||||||||||||
Adjustment to retirement benefit liability, net of tax | — | (9 | ) | — | — | (9 | ) | ||||||||||||
Adjustment to post-retirement healthcare benefit liability, net of tax | — | 214 | — | — | 214 | ||||||||||||||
Other comprehensive income | — | 205 | 3,150 | — | 3,355 | ||||||||||||||
Total comprehensive income | $ | 63,584 | $ | 72,466 | $ | 2,207 | $ | (72,342 | ) | $ | 65,915 | ||||||||
Gibraltar Industries, Inc. | Guarantor Subsidiaries | Non-Guarantor Subsidiaries | Eliminations | Total | |||||||||||||||
Year ended December 31, 2016 | |||||||||||||||||||
Net income | $ | 32,998 | $ | 57,857 | $ | 3,699 | $ | (60,879 | ) | $ | 33,675 | ||||||||
Other comprehensive income: | |||||||||||||||||||
Foreign currency translation adjustment | — | — | 6,945 | — | 6,945 | ||||||||||||||
Adjustment to retirement benefit liability, net of tax | — | 55 | — | — | 55 | ||||||||||||||
Adjustment to post-retirement healthcare benefit liability, net of tax | — | 695 | — | — | 695 | ||||||||||||||
Other comprehensive income | — | 750 | 6,945 | — | 7,695 | ||||||||||||||
Total comprehensive income | $ | 32,998 | $ | 58,607 | $ | 10,644 | $ | (60,879 | ) | $ | 41,370 | ||||||||
Gibraltar Industries, Inc. | Guarantor Subsidiaries | Non-Guarantor Subsidiaries | Eliminations | Total | |||||||||||||||
Year ended December 31, 2015 | |||||||||||||||||||
Net income (loss) | $ | 27,036 | $ | 36,401 | $ | (1,213 | ) | $ | (38,776 | ) | $ | 23,448 | |||||||
Other comprehensive income (loss): | |||||||||||||||||||
Foreign currency translation adjustment | — | — | (6,228 | ) | — | (6,228 | ) | ||||||||||||
Adjustment to retirement benefit liability, net of tax | — | 34 | 15 | — | 49 | ||||||||||||||
Adjustment to post-retirement healthcare benefit liability, net of tax | — | 171 | — | — | 171 | ||||||||||||||
Unrealized loss on cash flow hedges, net of tax | — | 143 | — | — | 143 | ||||||||||||||
Other comprehensive income (loss) | — | 348 | (6,213 | ) | — | (5,865 | ) | ||||||||||||
Total comprehensive income (loss) | $ | 27,036 | $ | 36,749 | $ | (7,426 | ) | $ | (38,776 | ) | $ | 17,583 | |||||||
77
GIBRALTAR INDUSTRIES, INC.
CONSOLIDATING BALANCE SHEET
DECEMBER 31, 2017
(in thousands)
Gibraltar Industries, Inc. | Guarantor Subsidiaries | Non-Guarantor Subsidiaries | Eliminations | Total | |||||||||||||||
Assets | |||||||||||||||||||
Current assets: | |||||||||||||||||||
Cash and cash equivalents | $ | — | $ | 192,604 | $ | 29,676 | $ | — | $ | 222,280 | |||||||||
Accounts receivable, net | — | 138,903 | 6,482 | — | 145,385 | ||||||||||||||
Intercompany balances | 324 | 4,166 | (4,490 | ) | — | — | |||||||||||||
Inventories | — | 82,457 | 3,915 | — | 86,372 | ||||||||||||||
Other current assets | 5,415 | (368 | ) | 3,680 | — | 8,727 | |||||||||||||
Total current assets | 5,739 | 417,762 | 39,263 | — | 462,764 | ||||||||||||||
Property, plant, and equipment, net | — | 93,906 | 3,192 | — | 97,098 | ||||||||||||||
Goodwill | — | 298,258 | 22,816 | — | 321,074 | ||||||||||||||
Acquired intangibles | — | 97,171 | 8,597 | — | 105,768 | ||||||||||||||
Other assets | — | 4,681 | — | — | 4,681 | ||||||||||||||
Investment in subsidiaries | 739,970 | 61,746 | — | (801,716 | ) | — | |||||||||||||
$ | 745,709 | $ | 973,524 | $ | 73,868 | $ | (801,716 | ) | $ | 991,385 | |||||||||
Liabilities and Shareholders’ Equity | |||||||||||||||||||
Current liabilities: | |||||||||||||||||||
Accounts payable | $ | — | $ | 77,786 | $ | 4,601 | $ | — | $ | 82,387 | |||||||||
Accrued expenses | 5,469 | 67,746 | 2,252 | — | 75,467 | ||||||||||||||
Billings in excess of cost | — | 9,840 | 2,939 | — | 12,779 | ||||||||||||||
Current maturities of long-term debt | — | 400 | — | — | 400 | ||||||||||||||
Total current liabilities | 5,469 | 155,772 | 9,792 | — | 171,033 | ||||||||||||||
Long-term debt | 208,521 | 1,100 | — | — | 209,621 | ||||||||||||||
Deferred income taxes | — | 28,907 | 2,330 | — | 31,237 | ||||||||||||||
Other non-current liabilities | — | 47,775 | — | — | 47,775 | ||||||||||||||
Shareholders’ equity | 531,719 | 739,970 | 61,746 | (801,716 | ) | 531,719 | |||||||||||||
$ | 745,709 | $ | 973,524 | $ | 73,868 | $ | (801,716 | ) | $ | 991,385 | |||||||||
78
GIBRALTAR INDUSTRIES, INC.
CONSOLIDATING BALANCE SHEET
DECEMBER 31, 2016
(in thousands)
Gibraltar Industries, Inc. | Guarantor Subsidiaries | Non-Guarantor Subsidiaries | Eliminations | Total | |||||||||||||||
Assets | |||||||||||||||||||
Current assets: | |||||||||||||||||||
Cash and cash equivalents | $ | — | $ | 143,826 | $ | 26,351 | $ | — | $ | 170,177 | |||||||||
Accounts receivable, net | — | 117,526 | 6,546 | — | 124,072 | ||||||||||||||
Intercompany balances | (615 | ) | 6,152 | (5,537 | ) | — | — | ||||||||||||
Inventories | — | 85,483 | 4,129 | — | 89,612 | ||||||||||||||
Other current assets | 13,783 | (10,070 | ) | 3,623 | — | 7,336 | |||||||||||||
Total current assets | 13,168 | 342,917 | 35,112 | — | 391,197 | ||||||||||||||
Property, plant, and equipment, net | — | 104,642 | 3,662 | — | 108,304 | ||||||||||||||
Goodwill | — | 282,300 | 21,732 | — | 304,032 | ||||||||||||||
Acquired intangibles | — | 101,520 | 9,270 | — | 110,790 | ||||||||||||||
Other assets | — | 3,922 | — | — | 3,922 | ||||||||||||||
Investment in subsidiaries | 663,118 | 58,477 | — | (721,595 | ) | — | |||||||||||||
$ | 676,286 | $ | 893,778 | $ | 69,776 | $ | (721,595 | ) | $ | 918,245 | |||||||||
Liabilities and Shareholders’ Equity | |||||||||||||||||||
Current liabilities: | |||||||||||||||||||
Accounts payable | $ | — | $ | 66,363 | $ | 3,581 | $ | — | $ | 69,944 | |||||||||
Accrued expenses | 7,369 | 60,004 | 3,019 | — | 70,392 | ||||||||||||||
Billings in excess of cost | — | 9,301 | 2,051 | — | 11,352 | ||||||||||||||
Current maturities of long-term debt | — | 400 | — | — | 400 | ||||||||||||||
Total current liabilities | 7,369 | 136,068 | 8,651 | — | 152,088 | ||||||||||||||
Long-term debt | 208,037 | 1,200 | — | — | 209,237 | ||||||||||||||
Deferred income taxes | — | 35,354 | 2,648 | — | 38,002 | ||||||||||||||
Other non-current liabilities | — | 58,038 | — | — | 58,038 | ||||||||||||||
Shareholders’ equity | 460,880 | 663,118 | 58,477 | (721,595 | ) | 460,880 | |||||||||||||
$ | 676,286 | $ | 893,778 | $ | 69,776 | $ | (721,595 | ) | $ | 918,245 | |||||||||
79
GIBRALTAR INDUSTRIES, INC.
CONDENSED CONSOLIDATING STATEMENT OF CASH FLOWS
DECEMBER 31, 2017
(in thousands)
Gibraltar Industries, Inc. | Guarantor Subsidiaries | Non-Guarantor Subsidiaries | Eliminations | Total | |||||||||||||||
Cash Flows from Operating Activities | |||||||||||||||||||
Net cash (used in) provided by operating activities | $ | (15,172 | ) | $ | 83,114 | $ | 2,128 | $ | — | $ | 70,070 | ||||||||
Cash Flows from Investing Activities | |||||||||||||||||||
Purchases of property, plant, and equipment | — | (11,026 | ) | (373 | ) | — | (11,399 | ) | |||||||||||
Acquisitions, net of cash acquired | — | (18,494 | ) | — | — | (18,494 | ) | ||||||||||||
Net proceeds from sale of property and equipment | — | 12,905 | 191 | — | 13,096 | ||||||||||||||
Net cash used in investing activities | — | (16,615 | ) | (182 | ) | — | (16,797 | ) | |||||||||||
Cash Flows from Financing Activities | |||||||||||||||||||
Long-term debt payments | — | (400 | ) | — | — | (400 | ) | ||||||||||||
Purchase of treasury stock at market prices | (2,872 | ) | — | — | — | (2,872 | ) | ||||||||||||
Intercompany financing | 17,370 | (17,321 | ) | (49 | ) | — | — | ||||||||||||
Net proceeds from issuance of common stock | 674 | — | — | — | 674 | ||||||||||||||
Net cash provided by (used in) financing activities | 15,172 | (17,721 | ) | (49 | ) | — | (2,598 | ) | |||||||||||
Effect of exchange rate changes on cash | — | — | 1,428 | — | 1,428 | ||||||||||||||
Net increase in cash and cash equivalents | — | 48,778 | 3,325 | — | 52,103 | ||||||||||||||
Cash and cash equivalents at beginning of year | — | 143,826 | 26,351 | — | 170,177 | ||||||||||||||
Cash and cash equivalents at end of year | $ | — | $ | 192,604 | $ | 29,676 | $ | — | $ | 222,280 | |||||||||
80
GIBRALTAR INDUSTRIES, INC.
CONDENSED CONSOLIDATING STATEMENT OF CASH FLOWS
DECEMBER 31, 2016
(in thousands)
Gibraltar Industries, Inc. | Guarantor Subsidiaries | Non-Guarantor Subsidiaries | Eliminations | Total | |||||||||||||||
Cash Flows from Operating Activities | |||||||||||||||||||
Net cash (used in) provided by operating activities | $ | (34,243 | ) | $ | 140,890 | $ | 17,340 | $ | — | $ | 123,987 | ||||||||
Cash Flows from Investing Activities | |||||||||||||||||||
Purchases of property, plant, and equipment | — | (10,321 | ) | (458 | ) | — | (10,779 | ) | |||||||||||
Acquisitions, net of cash acquired | — | (23,412 | ) | — | — | (23,412 | ) | ||||||||||||
Net proceeds from sale of property and equipment | — | 230 | 723 | — | 953 | ||||||||||||||
Net proceeds from sale of business | — | — | 8,250 | — | 8,250 | ||||||||||||||
Other, net | — | 1,118 | — | — | 1,118 | ||||||||||||||
Net cash (used in) provided by investing activities | — | (32,385 | ) | 8,515 | — | (23,870 | ) | ||||||||||||
Cash Flows from Financing Activities | |||||||||||||||||||
Long-term debt payments | — | (400 | ) | — | — | (400 | ) | ||||||||||||
Payment of debt issuance costs | — | (54 | ) | — | — | (54 | ) | ||||||||||||
Purchase of treasury stock at market prices | (1,539 | ) | — | — | — | (1,539 | ) | ||||||||||||
Intercompany financing | 32,441 | (3,822 | ) | (28,619 | ) | — | — | ||||||||||||
Net proceeds from issuance of common stock | 3,341 | — | — | — | 3,341 | ||||||||||||||
Net cash provided by (used in) financing activities | 34,243 | (4,276 | ) | (28,619 | ) | — | 1,348 | ||||||||||||
Effect of exchange rate changes on cash | — | — | (146 | ) | — | (146 | ) | ||||||||||||
Net increase (decrease) in cash and cash equivalents | — | 104,229 | (2,910 | ) | — | 101,319 | |||||||||||||
Cash and cash equivalents at beginning of year | — | 39,597 | 29,261 | — | 68,858 | ||||||||||||||
Cash and cash equivalents at end of year | $ | — | $ | 143,826 | $ | 26,351 | $ | — | $ | 170,177 | |||||||||
81
GIBRALTAR INDUSTRIES, INC.
CONDENSED CONSOLIDATING STATEMENT OF CASH FLOWS
DECEMBER 31, 2015
(in thousands)
Gibraltar Industries, Inc. | Guarantor Subsidiaries | Non-Guarantor Subsidiaries | Eliminations | Total | |||||||||||||||
Cash Flows from Operating Activities | |||||||||||||||||||
Net cash (used in) provided by operating activities | $ | (13,309 | ) | $ | 94,977 | $ | 5,553 | $ | — | $ | 87,221 | ||||||||
Cash Flows from Investing Activities | |||||||||||||||||||
Purchases of property, plant, and equipment | — | (11,754 | ) | (619 | ) | — | (12,373 | ) | |||||||||||
Acquisitions, net of cash acquired | — | (114,145 | ) | (26,476 | ) | — | (140,621 | ) | |||||||||||
Net proceeds from sale of property and equipment | — | 26,500 | — | — | 26,500 | ||||||||||||||
Other, net | — | 1,154 | 1,154 | ||||||||||||||||
Net cash used in investing activities | — | (98,245 | ) | (27,095 | ) | — | (125,340 | ) | |||||||||||
Cash Flows from Financing Activities | |||||||||||||||||||
Long-term debt payments | — | (73,642 | ) | — | — | (73,642 | ) | ||||||||||||
Proceeds from long-term debt | — | 73,242 | 73,242 | ||||||||||||||||
Payment of debt issuance costs | — | (1,166 | ) | — | — | (1,166 | ) | ||||||||||||
Purchase of treasury stock at market prices | (956 | ) | — | — | — | (956 | ) | ||||||||||||
Intercompany financing | 12,464 | (47,035 | ) | 34,571 | — | — | |||||||||||||
Net proceeds from issuance of common stock | 1,801 | — | — | — | 1,801 | ||||||||||||||
Net cash provided by (used in) financing activities | 13,309 | (48,601 | ) | 34,571 | — | (721 | ) | ||||||||||||
Effect of exchange rate changes on cash | — | — | (2,912 | ) | — | (2,912 | ) | ||||||||||||
Net (decrease) increase in cash and cash equivalents | — | (51,869 | ) | 10,117 | — | (41,752 | ) | ||||||||||||
Cash and cash equivalents at beginning of year | — | 91,466 | 19,144 | — | 110,610 | ||||||||||||||
Cash and cash equivalents at end of year | $ | — | $ | 39,597 | $ | 29,261 | $ | — | $ | 68,858 | |||||||||
82
21. QUARTERLY UNAUDITED FINANCIAL DATA
GIBRALTAR INDUSTRIES, INC.
QUARTERLY UNAUDITED FINANCIAL DATA
(in thousands, except per share data)
2017 Quarters Ended | |||||||||||||||||||
March 31 | June 30 | September 30 | December 31 | Total | |||||||||||||||
Net sales | $ | 206,605 | $ | 247,627 | $ | 274,574 | $ | 258,112 | $ | 986,918 | |||||||||
Gross profit | $ | 49,255 | $ | 61,825 | $ | 68,735 | $ | 56,729 | $ | 236,544 | |||||||||
Income from operations | $ | 9,679 | $ | 24,930 | $ | 35,693 | $ | 22,547 | $ | 92,849 | |||||||||
Interest expense | $ | 3,576 | $ | 3,550 | $ | 3,486 | $ | 3,420 | $ | 14,032 | |||||||||
Net income from continuing operations | $ | 3,996 | $ | 13,174 | $ | 20,619 | $ | 25,176 | $ | 62,965 | |||||||||
Net loss from discontinued operations | $ | — | $ | (405 | ) | $ | — | $ | — | $ | (405 | ) | |||||||
Total net income | $ | 3,996 | $ | 12,769 | $ | 20,619 | $ | 25,176 | $ | 62,560 | |||||||||
Income per share from continuing operations: | |||||||||||||||||||
Basic | $ | 0.13 | $ | 0.41 | $ | 0.65 | $ | 0.79 | $ | 1.98 | |||||||||
Diluted | $ | 0.12 | $ | 0.41 | $ | 0.64 | $ | 0.78 | $ | 1.95 | |||||||||
Loss per share from discontinued operations: | |||||||||||||||||||
Basic | $ | — | $ | (0.01 | ) | $ | — | $ | — | $ | (0.01 | ) | |||||||
Diluted | $ | — | $ | (0.01 | ) | $ | — | $ | — | $ | (0.01 | ) | |||||||
2016 Quarters Ended | |||||||||||||||||||
March 31 | June 30 | September 30 | December 31 | Total | |||||||||||||||
Net sales | $ | 237,671 | $ | 265,738 | $ | 272,734 | $ | 231,838 | $ | 1,007,981 | |||||||||
Gross profit | $ | 54,150 | $ | 68,843 | $ | 67,887 | $ | 53,882 | $ | 244,762 | |||||||||
Income from operations | $ | 17,761 | $ | 28,576 | $ | 26,522 | $ | 629 | $ | 73,488 | |||||||||
Interest expense | $ | 3,691 | $ | 3,666 | $ | 3,625 | $ | 3,595 | $ | 14,577 | |||||||||
Net income (loss) from continuing operations | $ | 9,029 | $ | 18,612 | $ | 13,786 | $ | (7,708 | ) | $ | 33,719 | ||||||||
Net loss from discontinued operations | $ | — | $ | — | $ | — | $ | (44 | ) | $ | (44 | ) | |||||||
Total net income (loss) | $ | 9,029 | $ | 18,612 | $ | 13,786 | $ | (7,752 | ) | $ | 33,675 | ||||||||
Income (loss) per share from continuing operations: | |||||||||||||||||||
Basic | $ | 0.29 | $ | 0.59 | $ | 0.44 | $ | (0.24 | ) | $ | 1.07 | ||||||||
Diluted | $ | 0.28 | $ | 0.58 | $ | 0.43 | $ | (0.24 | ) | $ | 1.05 | ||||||||
Loss per share from discontinued operations: | |||||||||||||||||||
Basic | $ | — | $ | — | $ | — | $ | — | $ | — | |||||||||
Diluted | $ | — | $ | — | $ | — | $ | — | $ | — | |||||||||
83
Item 9. | Changes in and Disagreements with Accountants on Accounting and Financial Disclosure |
Not applicable.
Item 9A. | Controls and Procedures |
Evaluation of Disclosure Controls and Procedures
The Company maintains a system of disclosure controls and procedures (as defined in Rule 13a-15(e) and 15d-15(e) under the Securities Exchange Act of 1934). The Company’s Chief Executive Officer and the Chief Financial Officer evaluated the effectiveness of the Company’s disclosure controls as of the end of the period covered in this report. Based upon that evaluation and the definition of disclosure controls and procedures contained in Rule 13a-15(e) and 15d-15(e) under the Securities Exchange Act of 1934, the Company’s Chief Executive Officer, and Chief Financial Officer have concluded that as of the end of such period the Company’s disclosure controls and procedures were effective.
Management’s Annual Report on Internal Control Over Financial Reporting
The management of Gibraltar Industries, Inc. is responsible for establishing and maintaining adequate internal control over financial reporting for the Company, as such term is defined in Rule 13a-15(f) under the Securities Exchange Act of 1934. Under the supervision and with the participation of management, including the Company’s Chief Executive Officer and the Chief Financial Officer, the Company conducted an evaluation of the effectiveness of internal control over financial reporting based on the framework in Internal Control – Integrated Framework issued by the Committee of Sponsoring Organizations of the Treadway Commission (2013 framework). Based on the Company’s evaluation, management concluded that the Company’s internal control over financial reporting was effective as of December 31, 2017.
The Company completed the acquisition of Package Concierge in 2017, which was excluded from management's annual report on internal control over financial reporting as of December 31, 2017. The Company acquired the outstanding stock of Package Concierge on February 22, 2017, and its results have been included in our 2017 consolidated financial statements. Total and net assets constituted $21.7 million and $19.6 million, respectively, as of December 31, 2017 and net sales and net income constituted $13.2 million and $0.3 million, respectively, for the year then ended.
The effectiveness of the Company’s internal control over financial reporting as of December 31, 2017 has been audited by Ernst & Young LLP, an independent registered public accounting firm, as stated in their report which is included below in this Item 9A of this Annual Report on Form 10-K.
Changes in Internal Control over Financial Reporting
There have been no changes in the Company’s internal control over financial reporting (as defined by Rule 13a-15(f)) that occurred during the three months ended December 31, 2017 that have materially affected the Company’s internal control over financial reporting.
84
Report of Independent Registered Public Accounting Firm
To the Board of Directors and Shareholders of Gibraltar Industries, Inc.
Opinion on Internal Control over Financial Reporting
We have audited Gibraltar Industries, Inc.’s internal control over financial reporting as of December 31, 2017, based on criteria established in Internal Control - Integrated Framework issued by the Committee of Sponsoring Organizations of the Treadway Commission (2013 framework) (the COSO criteria). In our opinion, Gibraltar Industries, Inc. (the Company) maintained, in all material respects, effective internal control over financial reporting as of December 31, 2017, based on the COSO criteria.
As indicated in the accompanying Management’s Annual Report on Internal Control Over Financial Reporting, management’s assessment of and conclusion on the effectiveness of internal control over financial reporting did not include the internal controls of Package Concierge, Inc., which is included in the 2017 consolidated financial statements of the Company and constituted 2% and 4% of total and net assets, respectively, as of December 31, 2017 and 1% and 1% of net sales and net income, respectively, for the year then ended. Our audit of internal control over financial reporting of the Company also did not include an evaluation of the internal control over financial reporting of Package Concierge, Inc.
We have also audited, in accordance with the standards of the Public Company Accounting Oversight Board (United States) (PCAOB), the consolidated balance sheets of the Company as of December 31, 2017 and 2016, and the related consolidated statement of operations, comprehensive income (loss), shareholders’ equity and cash flows for each of the three years in the period ended December 31, 2017, and the related notes and our report dated February 27, 2018 expressed an unqualified opinion thereon.
Basis for Opinion
The Company’s management is responsible for maintaining effective internal control over financial reporting, and for its assessment of the effectiveness of internal control over financial reporting included in the accompanying Management’s Annual Report on Internal Control Over Financial Reporting. Our responsibility is to express an opinion on the Company’s internal control over financial reporting based on our audit. We are a public accounting firm registered with the PCAOB and are required to be independent with respect to the Company in accordance with the U.S. federal securities laws and applicable rules and regulations of the Securities and Exchange Commission and the PCAOB.
We conducted our audit in accordance with the standards of the PCAOB. Those standards require that we plan and perform the audit to obtain reasonable assurance about whether effective internal control over financial reporting was maintained in all material respects.
Our audit included obtaining an understanding of internal control over financial reporting, assessing the risk that a material weakness exists, testing and evaluating the design and operating effectiveness of internal control based on the assessed risk, and performing such other procedures as we considered necessary in the circumstances. We believe that our audit provides a reasonable basis for our opinion.
Definition and Limitations of Internal Control Over Financial Reporting
A company’s internal control over financial reporting is a process designed to provide reasonable assurance regarding the reliability of financial reporting and the preparation of financial statements for external purposes in accordance with generally accepted accounting principles. A company’s internal control over financial reporting includes those policies and procedures that (1) pertain to the maintenance of records that, in reasonable detail, accurately and fairly reflect the transactions and dispositions of the assets of the company; (2) provide reasonable assurance that transactions are recorded as necessary to permit preparation of financial statements in accordance with generally accepted accounting principles, and that receipts and expenditures of the company are being made only in accordance with authorizations of management and directors of the company; and (3) provide reasonable assurance regarding prevention or timely detection of unauthorized acquisition, use, or disposition of the company’s assets that could have a material effect on the financial statements.
Because of its inherent limitations, internal control over financial reporting may not prevent or detect misstatements. Also, projections of any evaluation of effectiveness to future periods are subject to the risk that controls may become inadequate because of changes in conditions, or that the degree of compliance with the policies or procedures may deteriorate.
/s/ Ernst & Young LLP
Buffalo, New York
February 27, 2018
85
PART III
Item 10. | Directors, Executive Officers, and Corporate Governance |
Information regarding directors and executive officers of the Company, as well as the required disclosures with respect to the Company’s audit committee financial expert, is incorporated herein by reference to the information included in the Company’s 2018 Proxy Statement which will be filed with the Commission within 120 days after the end of the Company’s 2017 fiscal year.
The Company has adopted a Code of Ethics that applies to all of our directors, officers, employees and representatives. The complete text of this Code of Ethics is available in the corporate governance section of our website at www.gibraltar1.com. The Company does not intend to incorporate the contents of our website into this Annual Report on Form 10-K.
Item 11. | Executive Compensation |
Information regarding executive compensation is incorporated herein by reference to the information included in the Company’s 2018 Proxy Statement which will be filed with the Commission within 120 days after the end of the Company’s 2017 fiscal year.
Item 12. | Security Ownership of Certain Beneficial Owners and Management and Related Stockholder Matters |
Information regarding security ownership of certain beneficial owners and management is incorporated herein by reference to the information included in the Company’s 2018 Proxy Statement which will be filed with the Commission within 120 days after the end of the Company’s 2017 fiscal year.
Item 13. | Certain Relationships and Related Transactions and Director Independence |
Information regarding certain relationships and related transactions is incorporated herein by reference to the information included in the Company’s 2018 Proxy Statement which will be filed with the Commission within 120 days after the end of the Company’s 2017 fiscal year.
Item 14. | Principal Accounting Fees and Services |
Information regarding principal accounting fees and services is incorporated herein by reference to the information included in the Company’s 2018 Proxy Statement which will be filed with the Commission within 120 days after the end of the Company’s 2017 fiscal year.
86
PART IV
Item 15. | Exhibits and Financial Statement Schedules |
(a) | Documents filed as part of this report: | ||||
(1) | The following financial statements are included: | ||||
(i) | Report of Independent Registered Public Accounting Firm | ||||
(ii) | Consolidated Statements of Operations for the Years Ended December 31, 2017, 2016, and 2015 | ||||
(iii) | Consolidated Statements of Comprehensive Income for the Years Ended December 31, 2017, 2016, and 2015 | ||||
(iv) | Consolidated Balance Sheets as of December 31, 2017 and 2016 | ||||
(v) | Consolidated Statements of Cash Flows for the Years Ended December 31, 2017, 2016, and 2015 | ||||
(vi) | Consolidated Statements of Shareholders’ Equity and Comprehensive Income for the Years Ended December 31, 2017, 2016, and 2015 | ||||
(vii) | Notes to Consolidated Financial Statements | ||||
(2) | The following financial statement schedules for the years ended December 31, 2017, 2016, and 2015 are included in this Annual Report on Form 10-K: | ||||
(i) | Quarterly Unaudited Financial Data (included in notes to consolidated financial statements) | ||||
Schedules other than those listed above are omitted because the conditions requiring their filing do not exist, or because the required information is provided in the consolidated financial statements, including the notes thereto. | |||||
(3) | Exhibits: the index of exhibits to this Annual Report on Form 10-K included herein is set forth on the attached Exhibit Index. | ||||
(b) | Other Information: | ||||
Not applicable | |||||
87
Exhibit Index
No. | Exhibit | |
Certificate of Incorporation of registrant (incorporated by reference to Exhibit 3.1 to the Company’s Registration Statement on Form S-4 (Registration No. 333-135908)), as amended by Certificate of Amendment of Certificate of Incorporation of Gibraltar Industries, Inc. filed May 22, 2012 (incorporated by reference to Exhibit 3.1 of the Company’s Current Report on Form 8-K filed May 22, 2012), and further amended by Certification of Amendment of Certificate of Incorporation of Gibraltar Industries, Inc. filed on May 11, 2015 (incorporated by reference to Exhibit 3.1 of the Company's Current Report on Form 8-K filed May 12, 2015) | ||
Amended and Restated By Laws of Gibraltar Industries, Inc. effective January 1, 2015 (incorporated by reference to Exhibit 3.1 to the Company’s Current Report on Form 8-K filed on January 5, 2015) | ||
Specimen Common Share Certificate (incorporated by reference number to Exhibit 4.1 to the Company’s Registration Statement on Form S-1 (Registration No. 33-69304)) | ||
Indenture for 6.25% Notes dated as of January 31, 2013, among the Company, the Guarantors (as defined therein) and the Trustee (incorporated by reference to Exhibit 4.1 to the Company’s Current Report on Form 8-K filed on February 1, 2013). | ||
10.1* | Employment Agreement dated as of May 9, 2014 between the Registrant and Frank G. Heard (incorporated by reference to Exhibit 10.1 to the Company’s Current Report on Form 8-K filed May 15, 2014), as amended by Employment Agreement, dated January 1, 2015 (incorporated by reference to Exhibit 10.2 to the Company’s Current Report on Form 8-K filed January 5, 2015) | |
10.2* | Change in Control Agreement between the Company and Frank G. Heard dated January 1, 2015 (incorporated by reference to Exhibit 10.3 to the Company’s Current Report on Form 8-K filed January 5, 2015) | |
10.3* | Change in Control Agreement between the Company and Timothy F. Murphy (incorporated by reference to Exhibit 10.2 to the Company’s Quarterly Report on Form 10-Q filed May 5, 2017) | |
10.4* | Change in Control Agreement between the Company and Kenneth W. Smith (incorporated by reference to Exhibit 10.3 to the Company’s Current Report on Form 8-K filed February 24, 2009) | |
10.5* | Consulting Agreement between the Company and Kenneth W. Smith (incorporated by reference to Exhibit 10.1 to the Company's Quarterly Report on Form 10-Q filed May 5, 2017) | |
10.6* | Gibraltar 401(k) Plan Amendment and Restatement Effective October 1, 2004 as amended by the First, Second, and Third Amendments to the Amendment and Restatement Effective October 1, 2004 (incorporated by reference to Exhibit 10.19 to the Company’s Annual Report on Form 10-K for the year ended December 31, 2004) | |
10.7* | Gibraltar Deferred Compensation Plan Amended and Restated, effective January 1, 2009 (incorporated by reference to Exhibit 10.2 to the Company’s Current Report on Form 8-K filed February 24, 2009) | |
10.8* | Amended and Restated Gibraltar Industries, Inc. 2005 Equity Incentive Plan (incorporated by reference to Exhibit 10.1 to the Company’s Current Report on Form 8-K filed December 21, 2006), as amended by Second Amendment to Third Amendment and Restatement of Equity Incentive Plan, dated May 7, 2015 (incorporated by reference to Exhibit 10.2 to the Company’s Current Report on Form 8-K filed May 12, 2015) | |
10.9* | Gibraltar Industries, Inc. Omnibus Code Section 409A Compliance Policy, dated December 30, 2008 (incorporated by reference to Exhibit 10.3 to the Company’s Current Report on Form 8-K filed January 6, 2009) | |
88
No. | Exhibit | |
Summary Description of Annual Management Incentive Compensation Plan (incorporated by reference to Exhibit 10.1 to the Company’s Current Report on Form 8-K filed February 24, 2009) | ||
Fifth Amended and Restated Credit Agreement dated December 9, 2015 among Gibraltar Industries, Inc. and Gibraltar Steel Corporation of New York, as borrowers, the lenders parties thereto, Key Bank National Association, as administrative agent, KeyBank Capital Markets Inc. as joint lead arranger, JPMorgan Chase Bank, N.A., as joint lead arranger, Bank of America, N.A., as co-documentation agent, M&T Bank, as co-documentation agent, Citizens Bank, N.A., as co-documentation agent, and PNC Bank, National Association, as co-documentation agent (incorporated by reference to Exhibit 10.1 of the Company’s Current Report on Form 8-K filed December 15, 2015) | ||
Gibraltar Industries, Inc. 2015 Equity Incentive Plan dated December 31, 2015 (incorporated by reference to Exhibit 10.4 to the Company's Current Report on Form 8-K filed January 7, 2016), and as amended by Gibraltar Industries, Inc. 2015 Equity Incentive Plan First Amendment dated May 5, 2017 (incorporated by reference to Exhibit 10.1 of the Company's Current Report on Form 8-K filed May 9, 2017) | ||
Gibraltar Industries, Inc. 2015 Management Stock Purchase Plan dated May 7, 2015 (incorporated by reference to Exhibit 10.5 to the Company's Current Report on Form 8-K filed May 12, 2015), as amended by Management Stock Purchase Plan dated December 31, 2015 (incorporated by reference to Exhibit 10.5 to the Company's Current Report on Form 8-K filed January 7, 2016), and further amended by the Gibraltar Industries, Inc. Management Stock Purchase Plan Second Amendment dated January 28, 2016 (incorporated by reference to Exhibit 10.1 to the Company's Current Report on Form 8-K filed January 28, 2016) | ||
Gibraltar Industries, Inc. 2015 Equity Incentive Plan Form of Award of Restricted Stock dated May 7, 2015 (incorporated by reference to Exhibit 10.3 to the Company's Current Report on Form 8-K filed May 12, 2015) | ||
Gibraltar Industries, Inc. 2015 Equity Incentive Plan Form of Award of Performance Units dated December 31, 2015 (incorporated by reference to Exhibit 10.1 to the Company's Current Report on Form 8-K filed February 3, 2017) | ||
Gibraltar Industries, Inc. 2015 Equity Incentive Plan Form of Award of Non-Qualified Options dated December 31, 2015 (incorporated by reference to Exhibit 10.2 to the Company's Current Report on Form 8-K filed January 7, 2016) | ||
Gibraltar Industries, Inc. 2015 Equity Incentive Plan Form of Award of Restricted Units dated December 31, 2015 (incorporated by reference to Exhibit 10.2 to the Company's Current Report on Form 8-K filed February 5, 2016) | ||
Gibraltar Industries, Inc. 2015 Equity Incentive Plan Form of Award of Restricted Units dated December 31, 2015 (incorporated by reference to Exhibit 10.3 to the Company's Current Report on Form 8-K filed February 5, 2016) | ||
Gibraltar Industries, Inc. 2016 Stock Plan for Non-Employee Directors (incorporated by reference to Exhibit 10.1 to the Company's Current Report on Form 8-K filed May 10, 2016) | ||
Gibraltar Industries, Inc. Non-Employee Director Stock Deferral Plan (incorporated by reference to Exhibit 10.2 to the Company's Current Report on Form 8-K filed May 10, 2016) | ||
Subsidiaries of the Registrant | ||
89
No. | Exhibit | |
Consent of Independent Registered Public Accounting Firm | ||
Certification of President and Chief Executive Officer pursuant to Section 302 of the Sarbanes-Oxley Act of 2002 | ||
Certification of Senior Vice President and Chief Financial Officer pursuant to Section 302 of the Sarbanes-Oxley Act of 2002 | ||
Certification of President and Chief Executive Officer pursuant to Title 18, United States Code, Section 1350, as adopted pursuant to Section 906 of the Sarbanes-Oxley Act of 2002 | ||
Certification of Senior Vice President and Chief Financial Officer pursuant to Title 18, United States Code, Section 1350, as adopted pursuant to Section 906 of the Sarbanes-Oxley Act of 2002 | ||
101.INS | XBRL Instance Document ** | |
101.SCH | XBRL Taxonomy Extension Schema Document** | |
101.CAL | XBRL Taxonomy Extension Calculation Linkbase Document** | |
101.LAB | XBRL Taxonomy Extension Label Linkbase Document ** | |
101.PRE | XBRL Taxonomy Extension Presentation Linkbase Document ** | |
101.DEF | XBRL Taxonomy Extension Definition Linkbase Document ** | |
* | Document is a management contract or compensatory plan or agreement. |
** | Submitted electronically with this Annual Report on Form 10-K. |
90
SIGNATURES
Pursuant to the requirements of Section 13 or 15(d) of the Securities and Exchange Act of 1934, the Registrant has duly caused this report to be signed on its behalf by the undersigned, thereunto duly authorized.
GIBRALTAR INDUSTRIES, INC. | |||
By | /s/ Frank G. Heard | ||
Frank G. Heard | |||
President and Chief Executive Officer | |||
Dated: February 27, 2018 | |||
In accordance with the Securities and Exchange Act of 1934, this report has been signed below by the following persons on behalf of the Registrant and in the capacities and on the dates indicated.
SIGNATURE | TITLE | DATE | ||
/s/ Frank G. Heard | President, Chief Executive Officer (principal executive officer) and Director | February 27, 2018 | ||
Frank G. Heard | ||||
/s/ Timothy F. Murphy | Senior Vice President and Chief Financial Officer (principal financial and accounting officer) | February 27, 2018 | ||
Timothy F. Murphy | ||||
/s/ William P. Montague | Chairman of the Board | February 27, 2018 | ||
William P. Montague | ||||
/s/ Sharon M. Brady | Director | February 27, 2018 | ||
Sharon M. Brady | ||||
/s/ Jane L. Corwin | Director | February 27, 2018 | ||
Jane L. Corwin | ||||
/s/ Craig A. Hindman | Director | February 27, 2018 | ||
Craig A. Hindman | ||||
/s/ Vinod M. Khilnani | Director | February 27, 2018 | ||
Vinod M. Khilnani | ||||
/s/ James B. Nish | Director | February 27, 2018 | ||
James B. Nish | ||||
91