Attached files
| file | filename |
|---|---|
| EX-32.1 - EXHIBIT 32.1 - Foundation Building Materials, Inc. | fbm-123117xex321.htm |
| EX-31.2 - EXHIBIT 31.2 - Foundation Building Materials, Inc. | fbm-123117xex312.htm |
| EX-31.1 - EXHIBIT 31.1 - Foundation Building Materials, Inc. | fbm-123117xex311.htm |
| EX-23.1 - EXHIBIT 23.1 - Foundation Building Materials, Inc. | fbm-123117xex231.htm |
| EX-21.1 - EXHIBIT 21.1 - Foundation Building Materials, Inc. | fbm-123117xex211.htm |
UNITED STATES
SECURITIES AND EXCHANGE COMMISSION
Washington, D.C. 20549
Form 10-K
FOR ANNUAL AND TRANSITION REPORTS
PURSUANT TO SECTIONS 13 OR 15(d) OF THE
SECURITIES EXCHANGE ACT OF 1934
(Mark One)
ý | ANNUAL REPORT PURSUANT TO SECTION 13 OR 15(d) OF THE SECURITIES EXCHANGE ACT OF 1934 |
For the fiscal year ended December 31, 2017
¨ | TRANSITION REPORT PURSUANT TO SECTION 13 OR 15(d) OF THE SECURITIES EXCHANGE ACT OF 1934 |
For the transition period from to
Commission file number: 001-38009
Foundation Building Materials, Inc.
(Exact Name of Registrant as Specified in its Charter)
Delaware | 81-4259606 | |
(State or Other Jurisdiction of Incorporation or Organization) | (I.R.S. Employer Identification No.) | |
2741 Walnut Avenue, Suite 200 Tustin, CA | 92780 (Zip Code) | |
(Address of Principal Executive Offices) | ||
(714) 380-3127
(Registrant’s telephone number, including area code)
Securities registered pursuant to Section 12(b) of the Act:
Title of Each Class | Name of Each Exchange on Which Registered | |
Common Shares, par value $0.001 per share | New York Stock Exchange | |
Securities registered pursuant to Section 12(g) of the Act:
None
Indicate by check mark if the registrant is a well-known seasoned issuer, as defined in Rule 405 of the Securities Act. Yes ¨ No ý
Indicate by check mark if the registrant is not required to file reports pursuant to Section 13 or Section 15(d) of the Act. Yes ¨ No ý
Indicate by check mark whether the registrant: (1) has filed all reports required to be filed by Section 13 or 15(d) of the Securities Exchange Act of 1934 during the preceding 12 months (or for such shorter period that the registrant was required to file such reports), and (2) has been subject to such filing requirements for the past 90 days. Yes ý No ¨
Indicate by check mark whether the registrant has submitted electronically and posted on its corporate Web site, if any, every Interactive Data File required to be submitted and posted pursuant to Rule 405 of Regulation S-T (§ 232.405 of this chapter) during the preceding 12 months (or for such shorter period that the registrant was required to submit and post such files). Yes ý No ¨
Indicate by check mark if disclosure of delinquent filers pursuant to Item 405 of Regulation S-K (§ 229.405 of this chapter) is not contained herein, and will not be contained, to the best of registrant’s knowledge, in definitive proxy or information statements incorporated by reference in Part III of this Form 10-K or any amendment to this Form 10-K. ¨
Indicate by check mark whether the registrant is a large accelerated filer, an accelerated filer, a non-accelerated filer, or a smaller reporting company. See the definitions of "large accelerated filer," "accelerated filer," "smaller reporting company" and "emerging growth company" in Rule 12b-2 of the Exchange Act.
Large accelerated filer ☐ | Accelerated filer ☐ | |
Non-accelerated filer ý | Smaller reporting company ☐ | |
(Do not check if smaller reporting company) | Emerging growth company ☐ | |
If an emerging growth company, indicate by check if the registrant has elected not to use the extended transition period for complying with any new or revised financial accounting standards provided pursuant to Section 13(a) of the Exchange Act ☐ | ||
Indicate by check mark whether registrant is a shell company (as defined in Rule 12b-2 of the Exchange Act). Yes ¨ No ý
The aggregate market value of the common stock of the registrant held by non-affiliates on June 30, 2017, based upon the closing price of $12.86 of the registrant's common stock as reported on the New York Stock Exchange, was $188.3 million.
There were 42,865,407 common shares outstanding as of February 20, 2018.
DOCUMENTS INCORPORATED BY REFERENCE
Portions of the registrant’s definitive proxy statement to be filed with the Securities and Exchange Commission pursuant to Regulation 14A not later than 120 days after the conclusion of the registrant’s fiscal year ended December 31, 2017, are incorporated by reference into Part III of this Form 10‑K.
TABLE OF CONTENTS
Page | |||
Item 1. | |||
Item 1A. | |||
Item 1B. | |||
Item 2. | |||
Item 3. | |||
Item 4. | |||
Item 5. | |||
Item 6. | |||
Item 7. | |||
Item 7A. | |||
Item 8. | |||
Item 9. | |||
Item 9A. | |||
Item 9B. | |||
Item 10. | |||
Item 11. | Executive Compensation | ||
Item 12. | Security Ownership of Certain Beneficial Owners and Management and Related Stockholder Matters | ||
Item 13. | Certain Relationships and Related Transactions, and Director Independence | ||
Item 14. | Principal Accountant Fees and Services | ||
PART IV | |||
Item 15. | Exhibits and Financial Statement Schedules | ||
Item 16. | Form 10-K Summary | ||
PART I
FORWARD-LOOKING STATEMENTS
This Annual Report on Form 10-K contains "forward-looking statements," which reflect our current views about future events and financial results. We have made these statements in reliance on the safe harbor created by the Private Securities Litigation Reform Act of 1995 (set forth in Section 27A of the Securities Act of 1933, as amended, or the Securities Act, and Section 21E of the Securities Exchange Act of 1934, as amended, or the Exchange Act). These forward-looking statements relate to matters such as our industry, business strategy, goals and expectations concerning our market position, rebates, acquisitions, future operations, margins, profitability, capital expenditures, liquidity, capital resources and other financial and operating information. We have used the words "approximately," "anticipate," "assume," "believe," "contemplate," "continue," "could," "estimate," "expect," "future," "intend," "may," "plan," "potential," "predict," "project," "seek," "should," "target," "will" and similar terms and phrases to identify forward-looking statements in this Annual Report on Form 10-K. All of our forward-looking statements are subject to risks and uncertainties that may cause actual results to differ materially from those that we are expecting, including:
• | our ability to effectively manage any downturns in the commercial or residential new construction markets, the commercial or residential repair and remodel markets and the industrial construction and maintenance markets; |
• | the consequences of any continued financial uncertainty following the recent worldwide recession and the impact on the markets we serve; |
• | our ability to effectively manage any changes in economic, political and social conditions; |
• | fluctuating demand for the products and services we offer; |
• | our ability to effectively compete in a highly competitive industry; |
• | our ability to realize the anticipated financial and strategic goals of future acquisitions or investments, including the identification of acquisition targets and the integration and performance of acquired branches and businesses, including integration of financial systems; |
• | our ability to achieve the intended benefits of our acquisitions, including the realization of synergies; |
• | diversion of management’s attention from ongoing business concerns to matters related to acquisitions we may make in the future; |
• | our ability to maintain our existing contractual and business relationships; |
• | the change in any exclusive rights or relationships we have with suppliers that provide us access to leading brands; |
• | a material disruption at our suppliers’ facilities due to weather, environmental incidents, transportation disruption or other operational problems; |
• | our ability to manage the unique risks involved with our mechanical insulation segment; |
• | the effects of laws and regulations, including those governing environmental, health and safety matters, and any new changes to those laws and regulations; |
• | our ability to attract and retain key management personnel and other talent required for our business; |
• | our exposure to legal claims and proceedings related to our business; |
• | our ability to manage the impact of debt and equity financing transactions; |
• | our ability to generate a sufficient amount of cash to service our indebtedness and fund our operations; |
• | our ability to operate our business under agreements governing certain of our indebtedness containing financial covenants and other restrictions; |
• | the effects of incurring a substantial amount of indebtedness under our asset-based lending credit facility and our senior secured notes due 2021; |
• | the volatility of the trading price of our common stock; |
• | our relationship with Lone Star and its significant ownership of our common stock; and |
• | additional factors discussed under the sections entitled "Risk Factors," "Management’s Discussion and Analysis of Financial Condition and Results of Operations" and "Business." |
1
The forward-looking statements contained in this Annual Report on Form 10-K are based on historical performance and management’s current plans, estimates and expectations in light of information currently available to us and are subject to uncertainty and changes in circumstances. There can be no assurance that future developments affecting us will be those that we have anticipated. Actual results may differ materially from these expectations due to changes in global, regional or local political, economic, business, competitive, market, regulatory and other factors, many of which are beyond our control, as well as the other factors in Item 1A. Risk Factors. Additional factors or events that could cause our actual results to differ may also emerge from time to time, and it is not possible for us to predict all of them. Comparisons of results for current and any prior periods are not intended to express any future trends, or indications of future performance, unless expressed as such, and should only be viewed as historical data. Should one or more of these risks or uncertainties materialize, or should any of our assumptions prove to be incorrect, our actual results may vary in material respects from what we may have expressed or implied by these forward-looking statements. We caution that you should not place undue reliance on any of our forward-looking statements. Any forward-looking statement made by us in this Annual Report on Form 10-K speaks only as of the date hereof. We undertake no obligation to publicly update any forward-looking statement, whether as a result of new information, future developments or otherwise, except as may be required by applicable securities laws.
2
Item 1. Business.
On October 9, 2015, the Company and its assets and operations were acquired by LSF9 Cypress Parent, LLC now known as FBM Alpha LLC through a newly formed company, LSF9 Cypress Holdings, LLC now known as Foundation Building Materials Holding Company LLC, which we refer to as the Lone Star Acquisition. Unless otherwise specified, references in this Annual Report on Form 10-K to "we," "our," "us" and "the Company" refer to (i) for the predecessor periods prior to the completion of the Lone Star Acquisition, the business of FBM Intermediate Holdings, LLC, (ii) for the successor periods after completion of the Lone Star Acquisition, but prior to the internal reorganization transaction in which the business was transferred to Foundation Building Materials, Inc., the business of Foundation Building Materials Holding Company LLC and its subsidiaries and (iii) for the successor periods after completion of the internal reorganization transaction, the business of Foundation Building Materials, Inc., in each case together with its consolidated subsidiaries.
Our Company
We are the second largest specialty distributor of wallboard and suspended ceiling systems in the United States and Canada, and the fastest growing by sales and branch count since our founding in 2011. We are also the second largest specialty distributor and one of the largest fabricators of commercial and industrial mechanical insulation in the United States. We have expanded from a single branch in Southern California to more than 220 branches across the United States and Canada as of December 31, 2017, carrying a broad array of more than 35,000 SKUs. Our organic growth initiatives and disciplined acquisition strategy have enabled us to grow rapidly. Our net sales in 2013 were $113.7 million and we reached net sales of $2.1 billion for the year ended December 31, 2017. Our goal is to be the leading company within specialty building products distribution and to continue expanding into complementary markets.
We serve as a critical link between our supplier base and a diverse and highly fragmented set of more than 28,000 customers. Our specialty building products segment, which distributes wallboard, metal framing, suspended ceiling systems and complementary and other products, accounted for approximately 86.9% of our net sales for the year ended December 31, 2017. Within the specialty building products segment, we distribute products to contractors who install them in commercial and residential buildings for both new construction and repair and remodeling projects. Our mechanical insulation segment, which distributes commercial and industrial insulation products to provide insulation solutions for pipes and mechanical systems, accounted for approximately 13.1% of our net sales for the year ended December 31, 2017. We fabricate and distribute these products for specialty contractors seeking to improve or maintain energy efficiency in a diverse range of commercial and industrial buildings. Our customers use these products in maintenance, repair and operations, or MRO, and new construction. In the year ended December 31, 2016, 92.9% and 7.1% of our net sales were derived from our specialty building products segment and our mechanical insulation segment, respectively. For the periods from October 9, 2015 to December 31, 2015 and January 1, 2015 to October 8, 2015, 100% of net sales were derived from our specialty building products segment because we had not yet entered into the mechanical insulation segment.
We have an expansive branch network that serves attractive markets across the United States and Canada. The ability to leverage our branches, together with our organic growth initiatives and disciplined acquisition strategy, has allowed us to drive share gains in the specialty building products distribution market.
We believe that our customers select and trust us because we have the expertise to efficiently and effectively handle and deliver a broad product offering, including wallboard, metal framing, suspended ceiling systems, commercial and industrial insulation and complementary and other products, and to manage the complex logistics required to safely deliver and stock the right products to the appropriate locations at each jobsite. It is critical for our contractor customers to have the correct product, when they need it, in order to complete their projects on time and on budget without costly delays. We also provide our customers with technical product expertise, including proper installation techniques for new products. We typically deliver wallboard and other products directly to the floor where it will be installed, from the first floor to the penthouse of a major high rise. For ceiling contractors, we carry a wide range of products and have the technical sales expertise to assist our customers in selecting the appropriate acoustical product for their project. For our commercial and industrial insulation customers, we fabricate the insulation into specific shapes and sizes prior to delivery rather than on site depending on its ultimate application, thereby decreasing our customers’ labor costs. Our North American scale gives us the ability to serve contractors and homebuilders that operate across multiple geographic markets. Most of our customer accounts are managed by salespeople and managers who communicate with customers on a regular basis and, as a result, have developed longstanding and trusted relationships.
3
We have close relationships with our suppliers at both the executive and local branch level. We believe we are a preferred distributor for our suppliers due to our scale, nationwide footprint, leading market positions, knowledgeable professionals, high service levels and strong relationships with a broad set of contractor customers. We also believe our suppliers seek our business because we are one of the highest growth distributors in our industry and have a demonstrated ability to achieve above market growth. In suspended ceiling systems, we have exclusive distribution relationships in select geographies for certain products. These relationships include contractual exclusivity with Armstrong World Industries, Inc., or Armstrong, and relationship-based exclusivity with USG Corporation, or USG. Armstrong has supported our expansion by renewing our contractual exclusivity or extending our contractual exclusivity into additional territories after we acquired certain companies. This contractual exclusivity makes us the sole distributor carrying Armstrong products in certain markets. We also possess semi-exclusive distribution rights in other markets.
We serve a balanced mix of end markets across the new non-residential construction, new residential construction and non-residential repair and remodel sectors. Our products are used in the construction and repair and remodel of new commercial buildings, single-family, multi-family homes and industrial facilities. We believe activity in the new construction end markets will continue to grow, since new non-residential activity and residential housing starts in the United States remain below historical averages. Our products are used for the maintenance, repair and remodel of existing structures, including industrial MRO, which we believe provides a stable source of sales across economic cycles.
The table below summarizes our major product categories, applications and end markets.
Our Products | |||||||
Specialty Building Products | Mechanical Insulation | ||||||
Wallboard(1) | Suspended Ceiling Systems | Metal Framing | Complementary and Other Products(1) | Commercial and Industrial Insulation and Non-Industrial Insulation | |||
% of net sales for the year ended December 31, 2017 | 34% | 16% | 14% | 23% | 13% | ||
% of net sales for the year ended December 31, 2016 | 38% | 14% | 16% | 25% | 7% | ||
Applications | Interior walls and ceilings | Suspended ceiling systems including suspension grid, ceiling tile, panels and architectural specialties | Wallboard structural support, typically sold as part of a package with wallboard, insulation, or suspended ceiling systems | Safety accessories and fasteners, building insulation, tools, stucco/exterior insulation and finishing system | Insulation solutions for pipes and mechanical systems | ||
New Non-Residential | ✓ | ✓ | ✓ | ✓ | ✓ | ||
Primary End Markets | New Residential | ✓ | ✓ | ✓ | |||
Non-Residential, Repair and Remodel | ✓ | ✓ | ✓ | ✓ | ✓ | ||
(1) For the year ended December 31, 2017, certain product classification categories have changed. Wallboard accessories have been reclassified from "Wallboard" to "Complementary and other products." All prior periods presented have been reclassified to conform to the current year presentation. | |||||||
4
We were founded in 2011 by our President and Chief Executive Officer Ruben Mendoza, our Chief Financial Officer John Gorey and one of our Regional Vice Presidents, Tom Fischbeck. Mr. Mendoza previously served as CEO of Acoustical Material Services where he oversaw the successful growth of the company before it was acquired by Allied Building Products in 2007. In founding our company, Mr. Mendoza applied a proven customer-centric operating model to an organization that would combine strong organic growth with an effective acquisition and integration program across a fragmented industry. In November 2013, we strengthened our management team with the addition of our Chief Operating Officer, Pete Welly, who has over 35 years of experience in our industry. Other members of our management team have spent the majority of their careers in the wallboard and suspended ceiling systems distribution industry. As a result of long and close personal relationships with many of the private owners of wallboard and suspended ceiling systems distributors, our acquisitions generally have been completed on a privately negotiated, non-auction basis. Since 2013, the majority of senior level leaders who have sold us their businesses have elected to stay on as active employees and are often our best references to owners considering a sale to us.
On October 9, 2015, 100% of the outstanding equity of FBM Intermediate Holdings LLC was acquired by investment funds, or affiliates of investment funds, advised, managed or controlled by Lone Star Fund IX (U.S.) L. P., which we refer to in this Annual Report on Form 10-K together with certain of its affiliates and associates (excluding us and other companies it owns as a result of its investment activities), as Lone Star, along with certain members of management for approximately $560.0 million.
Our acquisition activity is described in greater detail in Item 7, Management’s Discussion and Analysis of Financial Condition and Results of Operations and in Note 3 to the consolidated financial statements.
Our Competitive Strengths
Market leader with significant size and scale advantages
Our coast-to-coast footprint enables us to distribute our comprehensive product offering to a large, diverse set of customers and provides us with significant economies of scale that we believe give us cost advantages versus our smaller competitors. As a leading specialty building products distributor, we are able to negotiate volume discounts and preferential pricing terms with our key suppliers. As we continue to grow, we believe we will realize additional cost savings and other benefits from scale. Smaller competitors generally lack the resources to properly handle the logistical complexities of large scale specialty building products distribution. We have also been able to realize procurement discounts on our large fleet of over 3,000 vehicles, and we leverage this fleet to realize operational cost advantages from economies of scale. Additionally, our local market scale adds route density, which increases our profit margins. We believe our consolidated information technology systems and centralized administrative functions, which are shared nationally across our platform, generate additional operating cost efficiencies.
Proven operating model
We believe that our national operating model supported by local market expertise, entrepreneurial and customer centric-culture, acquisition and integration expertise and strong national brand has established us as the distributor of choice for leading suppliers and over 28,000 customers across a balanced mix of construction-related end markets. Our management team originally utilized elements of this operating model while overseeing prior companies and has applied those elements to us. Since our inception, we have invested heavily in identifying, recruiting, training and retaining highly dedicated employees. We invest in ongoing talent development and focus on rewarding performance based on profitability goals instead of pursuing sales growth at the expense of profit margins.
Our technology infrastructure and "One Company" platform allows us to manage our information technology efficiently. We have established a broad, integrated business platform that allows our branch network to leverage a centralized ERP system and other back office support functions to minimize costs, while retaining important and timely decision making authority at the local level where we conduct business with our customers and can tailor our service and product offerings to their needs. This autonomy at the local level has fostered our entrepreneurial culture, while our national infrastructure support allows employees to focus on customer-first solutions.
5
Local market excellence
We are a North American company focused on supplying the local building material needs of each geographical area we cover according to climate, building codes, customer preference and other considerations. We believe that we are able to maintain our local market excellence due to our longstanding customer and supplier relationships in local regions, dependable customer service, brand recognition and market-specific product offerings that cater to local trends and preferences. We actively track local and regional construction opportunities for our customers to help drive business for both them and ourselves, and our senior executives complement the local sales efforts by maintaining key relationships with major national and regional accounts. We seek to cultivate an entrepreneurial culture and empower branch managers with the independence and authority to make important business decisions locally under the Foundation Building Materials, or FBM, brand. We believe that this attracts highly dedicated employees who endeavor to provide our customers with dependable customer service that differentiates us from our competition. Our goal is to be the distributor of choice for our customers in all of the local markets we serve.
Strong customer relationships
We sell to a diverse and highly fragmented base of over 28,000 customers, including commercial, residential and other specialty contractors. In addition to local contractors, we maintain strong regional relationships with regional non-residential construction companies and leading national homebuilders. Most customer accounts are serviced by managers and salespeople who communicate regularly with these accounts and have developed meaningful relationships built over many years. We believe customer loyalty has been built through our high-quality customer service and technical support, strong logistics capabilities, trade credit offerings, exclusive relationships to key suppliers in critical markets and product expertise across our comprehensive selection of premier products and brands. We are able to safely and efficiently deliver products to our customers at the right time and in the specified place. Based on our customer surveys, contractors often prioritize on-time delivery over price as they consider the negative repercussions that project delays create, particularly increased labor costs. We have an integrated delivery, dispatch and order tracking system that allows us to optimize routes and dispatch efficiencies. Optimization of delivery and dispatch results in lower costs for both delivery and fleet management. Additionally, for many of our products, we facilitate purchasing relationships between suppliers and our highly fragmented customer base by providing technical product knowledge, educating contractors on proper installation techniques for new products, enabling local product availability and extending trade credit.
Longstanding relationships with leading suppliers
We maintain longstanding relationships with a base of over 4,000 suppliers for whom we provide a direct channel to a large, diverse customer base across our national footprint. We are one of the largest customers for several of our top suppliers across the wallboard, suspended ceiling systems and metal framing product categories. We believe that suppliers find our scale, rapid growth, nationwide footprint, leading market positions, knowledgeable professionals, quality customer service and strong relationships with a broad set of contractors attractive. All key supplier relationships are led by our executive management team to foster long-term growth and maximize national pricing programs. We have access to leading brands and maintain exclusive distribution relationships to sell key products, such as suspended ceiling systems, in selected markets. Interior contractors often purchase wallboard and suspended ceiling systems from the same distributor, and carrying a ceilings product line helps to drive sales of wallboard and complementary products. We believe that our suppliers view us as a key facilitator to market and grow their businesses. We regularly discuss both acquisitions and greenfield expansion with our key suppliers, who may proactively recommend expansion opportunities to us.
6
Demonstrated ability to identify, execute and integrate acquisitions
Our management team has built the Company from a single branch in 2011 into one of the leading specialty building products distributors in the United States and Canada. Since 2013, we have completed 28 acquisitions and believe that the large, highly fragmented nature of our market and our reputation throughout the industry provides us access to a robust acquisition pipeline at attractive valuations that will continue to supplement our strong, organic growth. Our acquisitions generally have been initiated through our senior management team’s business relationships developed over their many years in the industry, and we believe we have become a buyer of choice for owners of specialty distribution companies because we offer them the opportunity to gain liquidity while remaining involved in the active management of their business going forward. We generally avoid auction processes, and we believe we are often the only buyer involved in advanced discussions with these companies. This has led to a substantial pipeline of potential acquisition candidates that management is continuously cultivating. We have dedicated integration leaders who work closely with acquired branch personnel to unify acquisitions under a single brand with a common ERP system. We consolidate our acquired companies’ purchasing into our supplier purchasing programs, which generally have had more advantageous terms due to our greater scale. Our objective is to integrate each acquired company into our back office accounting, human resources and IT systems as quickly as possible after closing, with many transitioning to some of our systems on day one and most fully transitioning within 90 days of closing. Post-acquisition, we transition acquired companies exclusively to the FBM brand, and we have typically achieved additional remaining cost savings from the elimination of redundant overhead costs and branch consolidations. Our acquisitions have historically realized purchasing synergies almost immediately by taking advantage of our volume discounts.
Since 2013, many of the owners and senior management of companies that we have acquired have elected to remain employed with us post-acquisition and many invested in our majority shareholder prior to our initial public offering, which has proven to be successful in aligning incentives and ensuring smooth transitions. Currently, over 100 former owners, managers and employees of acquired businesses have an equity interest in our majority shareholder and remain engaged in the successful operation of our business.
Experienced management team with strong track record of growth
Our management team, including our senior management and vice presidents, collectively have an average of over 25 years of industry experience. Our founder, President and Chief Executive Officer Ruben Mendoza, is an accomplished leader with over 25 years of industry experience. Our Chief Financial Officer John Gorey brings over 30 years of industry experience, our Chief Operating Officer Pete Welly brings over 35 years of industry experience to the oversight of our operations and our Senior Vice President of Sales & Marketing Kirby Thompson has been working in the industry for over 35 years. By fostering an entrepreneurial and customer-centric culture and a proven ability to quickly and effectively integrate acquisitions under a common brand, this team has built the Company from a single branch into one of the leading specialty building products distributors in the United States and Canada.
Our Business Strategy
Our objective is to strengthen our competitive position, achieve profitable growth that exceeds market rates and increase shareholder value through the following key strategies:
Continue to drive organic growth through strategic initiatives
We believe there are significant opportunities to continue to expand our existing geographic footprint by opening greenfield branches, expand our product offerings to existing customers, target new customers and expand our mechanical insulation platform.
• | Expand product offerings across all branches. Our management team has identified opportunities in several of our regions for product line growth and expansion. We offer a number of products that are complementary to our wallboard sales including tools, fasteners and wallboard accessories, building insulation, exterior insulation finishing systems, stucco, plaster and fiberglass reinforced panels. These products typically generate higher profit margins than our core product offerings, and we believe there is opportunity for additional expansion of our complementary product sales. We monitor sales of our complementary products and look for opportunities to introduce new products across our entire network that have been successful in a subset of our branches. |
7
• | Target new customers and increasing share with existing customers. We believe our scale and supplier relationships allow us to more efficiently offer a full suite of products than many of our competitors. We believe these advantages help us win new customers, and we have a proven track record of growing customer relationships and expanding wallboard market share. We plan to continue this growth by leveraging our experienced and driven sales force of more than 320 field sales personnel who develop new customer relationships at the local level. We also believe our product breadth, extensive operating experience, technical knowledge and specialized delivery fleet will allow us to continue to capture new customers and expand our sales to those customers over time. We have released a mobile application that allows our customers to easily access critical information, such as order and delivery status. |
• | Grow by selectively opening new branches. We believe that significant opportunities exist to continue to expand our geographic footprint by opening new branches that are adjacent to our existing operations. A greenfield branch has historically required approximately $0.6 million in capital expenditures and working capital to open and typically generates positive cash flow within one year. Key steps in the greenfield process include identifying growth markets where current customers or suppliers have identified a market need that we can support, conducting a market assessment, determining branch staffing and sales force and developing a comprehensive forecast to determine if the location can meet profitability targets. In 2017, we opened 3 greenfield branches and, in 2018, we plan to open four to seven greenfield branches. |
• | Expand the mechanical insulation platform. Through the acquisition of the Construction Products Distribution business division of Superior Plus Corp, or Winroc-SPI, we gained exposure to the mechanical insulation distribution market in North America. The mechanical insulation distribution market has experienced several macroeconomic trends in recent years that are favorable to our business, including stable distribution channels, distributor consolidation and stringent codes and regulations demanding more efficient processes and energy performance. Additionally, because mechanical insulation also targets the industrial end market, we believe this business can offer greater diversification and cyclical stability to our existing platform. |
In the mechanical insulation segment, we are actively pursuing growth opportunities to further expand our operational footprint and drive financial results. Opportunities such as product line expansion, acquisitions and new branches will allow us to expand our volumes and market share, enhancing the growth expected from the broader market expansion.
Continue to expand and strengthen existing relationships with key suppliers
We believe our established relationships with market-leading suppliers serve as a key competitive advantage and support continued volume growth and purchasing power. Our suppliers benefit from our position as a single point of contact to over 28,000 customers and our ability as a partner to market and introduce new products efficiently and on a national scale. We maintain exclusive and semi-exclusive distribution rights in certain key markets. By expanding these relationships with suppliers, whether by adding more exclusive products or expanding exclusivity into new regions, we believe we will be able to further accelerate our growth. Additionally, our suppliers are critical partners in our growth, and we regularly discuss greenfield candidates with them, with suppliers sometimes proactively identifying expansion opportunities.
Enhance financial performance through improved operational efficiencies
We believe we have the potential for continued operating margin improvement through operational initiatives including optimizing pricing, improving fleet utilization, maximizing working capital efficiency from inventory and accounts receivable management, and strategic procurement processes. In addition, as our end markets continue to grow, we expect to generate higher operating margins on incremental volume as we leverage our fixed costs across our existing branch footprint.
We strive to continuously improve our operational efficiency, and are currently pursuing a number of initiatives to drive operating margin expansion, including efforts to:
• | Monitor critical daily metrics to improve branch efficiencies, including overtime, revenue per truck and revenue per employee; |
• | Leverage the "Track My Truck" feature on the new FBM mobile application to provide real time delivery status for customer deliveries; |
• | Use our GPS truck tracking system throughout our company to reduce fleet costs, improve route planning and provide required electronic driver logs; and |
• | Leverage our increased investment in electronic data interchange to improve efficiency for both the purchasing and accounts payable teams. |
8
To further drive operational efficiencies, we unify all of our completed acquisitions under a single brand and a common ERP system. Our information technology systems are scalable and coordinated, which gives us operational efficiencies through the sharing of best practices and information across this common platform. We believe our information technology infrastructure allows for effective, data-driven management and is built to empower local decision-making and enhance visibility across our branch network.
We incentivize our branch managers and customer-facing branch-level employees based on branch-level operating income, which we believe leads to improved branch-level performance.
Continue to be a leading industry consolidator
From 2013 through the end of 2017, our management team has identified and closed 28 acquisitions. We have successfully integrated all 28 of these acquisitions. We believe our national footprint, market leadership, entrepreneurial culture and ability to retain key leadership makes us an attractive buyer. We are generally selective and pursue acquisitions that both expand our footprint and generate synergies. We have a dedicated team of professionals to manage the acquisition and integration process. Due to the large and highly fragmented nature of our market and our reputation throughout the industry, we believe that we have access to a robust acquisition pipeline at attractive valuations that will continue to supplement our organic growth. We will also consider expansion into complementary specialty distribution markets through acquisitions.
Focus on culture and continuous improvement
We believe that our employees are one of the key drivers of our success, and we intend to continue to recruit, train, promote and retain entrepreneurial and successful people. We believe that we have created a culture where our people feel valued and supported and see that their efforts are instrumental to our continued success. We are focused on providing our employees with regular training and development to improve customer service, workplace safety and job satisfaction. We implemented "FBM University" to provide our employees with extensive training and development programs, utilizing new learning management systems and in-person training programs, which we view as essential for new hires and the development of existing employees. We also selected and implemented a new Learning Management System or LMS that is user friendly, easily modified, fully compatible with our other existing programs and systems, and extremely cost effective. We also invested substantially in leadership training and team building through our annual "Key Leaders Summit" meeting. By improving our employees’ knowledge base and sharing best practices, we are able to empower our people at the branch-level to better serve local customers.
Commitment to safety
Our commitment to safety is one of our core foundational values. This effort begins immediately with new employees through a comprehensive onboarding orientation that focuses on safety awareness, risk identification and other essential safety protocols. Training is delivered through a variety of media, including online modules and classroom settings, so that managers can employ the method that fits the employee’s needs.
9
Our Products
We are a leading specialty distributor of a diversified mix of building products, including wallboard, suspended ceiling systems, metal framing, commercial and industrial insulation and complementary and other products. We are one of the two largest wallboard and suspended ceiling systems distributors in the United States and Canada based on our 2017 net sales. We provide customers with a comprehensive product offering, with over 35,000 SKUs. Our product breadth, combined with our commitment to quality customer service, has solidified our position as a supplier of choice. Our diversified product offering provides balanced exposure to several construction end markets that are growing.
Wallboard
We specialize in the distribution of high-quality wallboard used to finish the interior walls and ceilings in residential and commercial construction projects. Wallboard is used in the vast majority of new construction and renovation projects due to its ease of installation and superior performance in providing comfort, fire resistance, thermal and sound insulation, mold and moisture resistance, impact resistance and aesthetic and design elements. It is available in a number of standard lengths, widths and thicknesses with a range of characteristics. Panels with greater thickness provide increased durability and sound insulation. In non-residential construction projects, architectural specifications and building codes provide requirements related to the thickness of the panels and, in some cases, other characteristics, such as fire, mold and moisture resistance. Wallboard is an essential building product, with approximately 8,000 square feet of wallboard used on average in each new home. Given the importance of wallboard to the overall building process, contractors have very precise delivery expectations which are best met by experienced specialty building products distributors with a local presence and specialized equipment.
Suspended ceiling systems
Suspended ceiling systems and grid help ensure and enhance the integrity, protection and decorative finishing of interior spaces. Ceilings consist of a higher number of specialized SKUs and less product standardization than the wallboard market. We believe ceiling product availability often pulls in additional business to our branches, as contractors often look to source additional interior products from a single distributor. The ceilings industry has enjoyed price stability through various cycles. Commoditization risk is limited as customers often seek specific design and aesthetic characteristics unique to their space. The market is characterized by high manufacturer concentration. Ceilings are sold into both non-residential repair and remodel and new non-residential construction markets.
We maintain exclusive distribution rights in certain markets with Armstrong, the leading manufacturer of suspended ceiling systems in the United States and Canada. Armstrong’s products are highly sought after by designers, contractors, builders and distributors. We have exclusive distribution rights for Armstrong ceilings in multiple markets across seven states and six Canadian provinces and non-exclusive distribution rights with Armstrong in multiple markets across twenty-five states and two other Canadian provinces. Armstrong closely oversees the marketing of its products, leading to its preference for granting distribution rights to only one or two companies in a given market. In addition, we have relationship-based exclusivity with USG in select markets in three states and non-exclusive relationships with USG in select markets across two states.
Metal framing
We provide metal framing and other framing products for multiple uses, including interior partitions and load bearing walls. We source our products from local, regional and national manufacturers in accordance with building standards and codes. Commercial contractors typically purchase these materials with wallboard, suspended ceiling systems, building insulation and other related building products from us as part of a commercial package.
Commercial and industrial insulation and non-industrial insulation
We distribute and fabricate commercial and industrial insulation products through 65 branches in the United States and Canada as of December 31, 2017. Commercial and industrial insulation products are marketed on a wholesale basis to insulation contractors, HVAC contractors, general contractors and to operators of large industrial facilities. Commercial and industrial insulation products are used to protect and insulate HVAC systems and piping and equipment systems for commercial buildings, metal buildings and industrial facilities. Other commercial and industrial insulation products include fire protection and wall and ceiling specialty products. Across our commercial and industrial insulation distribution network, we provide insulation fabrication services that customize products to fit specific systems. We believe our customers value our fabrication capabilities and quality as well as the labor savings they create. Fabrication provides significant value to our customers and ensures significant pull-through sales.
10
Complementary and other products
We offer complementary and other products, tools and accessories such as wallboard accessories, stucco and exterior insulation and finishing systems, building insulation, safety accessories, fasteners, doors and roofing products. Certain products are provided on a regional basis to address local preferences. These complementary products allow us to provide a full suite of products across our entire business, enhancing our margins and creating value for our customers.
Wallboard accessories are generally sold as a package in conjunction with wallboard and include most products used for the installation and finishing of wallboard. Key wallboard accessories include joint compounds, trims, tapes and various other accessories.
Customers and Suppliers
Customers
We sell to a diverse and highly fragmented base of over 28,000 customers, including commercial, residential and other specialty contractors. In addition to local contractors, we maintain strong relationships with regional construction companies and leading national homebuilders. Most customer accounts are serviced by managers and salespeople who communicate regularly with these accounts and have developed meaningful relationships built over many years. During the year ended December 31, 2017, there were no customers that exceeded 10% of net sales.
Suppliers
We maintain longstanding relationships with a base of over 4,000 suppliers, with no single supplier accounting for more than approximately 14% of our purchases for the year ended December 31, 2017. We are one of the largest customers for several of our top suppliers across wallboard, suspended ceiling systems and metal framing. We believe that suppliers find our scale, rapid growth, nationwide footprint, leading market positions, knowledgeable professionals, quality customer service and strong relationships with a broad set of contractors attractive. We have strong relationships with leading wallboard, suspended ceiling systems and metal framing manufacturers and we are able to provide them with a direct channel to a large, diverse customer base and a national footprint. In addition, the Winroc-SPI acquisition in August 2016 brought us long-term relationships with commercial and industrial insulation product manufacturers and access to all product lines within their distribution and custom fabrication network.
Sales and Marketing
We utilize a sales strategy that enables our sales force to develop strong customer relationships at the local level. The sales effort is managed by sales or branch managers and executed by both inside and outside sales teams. Due to the service-oriented and relationship-driven nature of the sales process, it is important to have experienced teams in each local market. To ensure customer expectations are met, our sales teams include both product sales specialists and sales managers who focus on specific products, categories and regions. We also tailor our sales approach to best suit customer needs within each end market. Both the commercial and residential sales processes are largely relationship-driven, although the commercial sales process is also highly technical and requires product knowledge with a sophisticated material delivery plan.
We employ both inside sales and field sales personnel. Inside sales personnel primarily service customers at the branches, by phone or email, while field sales personnel primarily sell to customers face-to-face. These representatives are responsible for driving new customer sales and maintaining as well as growing existing customer relationships. Our executives complement the local sales efforts by continuing to maintain key relationships with major national and regional accounts while sharing their significant experience with various sales organizations and reinforcing a customer-centric philosophy. We also coordinate closely with our major suppliers to optimize specific sales strategies. In addition to providing customer relationship support, our executive team also coordinates the go-to-market strategy and provides ongoing job and product training. Given the importance of strong local relationships, we thoroughly vet the strength of an acquisition target’s long-term customer relationships. Our management views these local relationships and the sales team of any acquired company to be critical to a successful integration.
11
We employ various marketing strategies to reach our customers in the most efficient and effective manner. We market our products and services through our website, mobile app, sample kits, advertisement materials and trade shows. Employees are encouraged to participate in industry associations as another point of customer connectivity. Certain employees are members and have served as officers and directors of numerous industry associations, including the Association of the Wall and Ceiling Industry, Ceilings & Interior Systems Construction Association, EIFS Industry Members Association and selected other regional associations. Furthermore, we sponsor a number of annual conventions and trade shows. Management believes that some of our most effective marketing is "word-of-mouth" given our reputation for high-quality products, superior customer service and product expertise and stellar delivery performance. We also benefit from the marketing and brand strength of several key suppliers, especially those with whom we hold exclusive arrangements.
Employees
As of December 31, 2017, we had a total of 3,782 employees, 175 of whom were unionized. We enjoy a strong relationship with our employees, including our unionized employees. We have not experienced a work stoppage, and we currently have no ongoing labor disputes.
Health and Safety
We approach health and safety through an operationally driven safety program utilizing a common approach encouraging the sharing of best practices across the specialty building products distribution, mechanical insulation and fabrication businesses. Our safety resources have an operational background and work closely with all levels of management on developing and managing our company-wide safety program. We have a strong management commitment in place from the CEO and COO through the branch operating level. We have a clearly defined safety structure that includes dedicated Regional Safety Coordinators to drive harmonization of safety protocols across the entire branch network. The Regional Safety Coordinators support branch Safety Champions whose duties are integrated as a shared responsibility within their operations role. Through branch ownership of the safety program, the Safety Champion works with their local management and Regional Safety Coordinator on day-to-day safety issues including incident reporting and investigation, inspections and training needs. Through our internal protocols and safety training programs, we strive to be an industry leader in developing and promoting a strong safety culture. The effort begins immediately with new employees through a comprehensive orientation that focuses on safety awareness, risk identification, hazard communication and other essential safety protocols. We deliver training through a variety of media, including online modules, hands on training and classroom settings. Our employees share the responsibility to work in a manner that safeguards themselves, their coworkers and the communities they serve. We work diligently with our employees and continually advocate adherence to the highest safety standards. Management’s expectations and policy toward safety is clearly communicated and is supported by our "Safety Absolutes," which are key rules that all of our employees are required to follow.
Competition
We compete primarily against other specialty building product distributors as well as big box retailers and lumberyards. Among specialty building products distributors, we compete against a small number of large national distributors and many small, local, privately-owned distributors. Of the four large national wallboard distributors in our industry, we are one of two active consolidators. Our remaining competitors are generally smaller regional and local firms, many of which we view as attractive acquisition opportunities. The principal competitive factors in our business include, but are not limited to, availability of materials and supplies; technical product knowledge and expertise; advisory or other service capabilities; timely and comprehensive delivery capabilities; pricing of products; and availability of credit.
Seasonality
Use and consumption of our products fluctuate due to seasonality. Nearly all of the products we sell and our customers use are exposed to outdoor elements during delivery or installation. Therefore, seasonal changes and other weather-related conditions, in particular extended rainy and cold weather in the spring and fall and major weather events, such as hurricanes, tornadoes, tropical storms and heavy snows, can adversely affect our business and operations. Our shipment levels also follow activity in the construction industry, which typically increases in the more moderate seasons of spring, summer and fall.
12
Government Regulations
Although we are not engaged in a "regulated industry," we are subject to various federal, state and local government regulations applicable to the business generally in the jurisdictions in which we operate, including laws and regulations relating to our relationships with our employees, public health and safety, work place safety, transportation, zoning and fire codes. We focus on operating each of our branches in accordance with applicable laws, codes and regulations. We believe we are in compliance in all material respects with existing applicable environmental laws and regulations and our employment, workplace health and workplace safety practices. Our operations in domestic interstate commerce are subject to the regulatory jurisdiction of the U.S. Department of Transportation, or the DOT, which has broad administrative powers with respect to our transportation operations. We are subject to safety requirements governing interstate operations prescribed by the DOT. Vehicle dimension and driver hours of service also are subject to both federal and state regulation. See Item 1A, Risk Factors. Our operations are also subject to the regulatory jurisdiction of the Occupational Safety and Health Administration, which has broad administrative powers with respect to workplace and jobsite safety.
Available Information
Our website address is www.fbmsales.com. Information contained on our website or connected thereto does not constitute a part of this Annual Report on Form 10-K or any other filing we make with the Securities and Exchange Commission, or the SEC. We make available free of charge on our website our Annual Reports on Form 10-K, Quarterly Reports on Form 10-Q, Current Reports on Form 8-K and amendments to those reports filed or furnished pursuant to Section 13(a) or 15(d) of the Exchange Act as soon as reasonably practical after we file such material with, or furnish it to, the SEC. Certain of these documents may also be obtained by calling the SEC at 1-800-SEC-0330. The SEC also maintains an Internet website that contains reports, and other information regarding issuers that file electronically with the SEC at www.sec.gov. We also make available free of charge on our website our Principles of Corporate Governance, our Employee Code of Conduct, our Code of Business Conduct and Ethics for Members of the Board of Directors and the Charters of our audit committee, compensation committee and nominating and corporate governance committee of our Board of Directors.
13
Item 1A. Risk Factors
Risks Relating to Our Business and Industry
Our business depends on the construction industry and general business, financial market and economic conditions.
The construction industry is cyclical and significantly affected by changes in general and local economic and real estate conditions, such as employment levels, consumer confidence, demographic trends, housing demand, inflation, deflation, interest rates and credit availability. Changes in these general and local economic conditions or deterioration in the broader economy could negatively impact the level of purchases, capital expenditures and creditworthiness of the Company’s direct and indirect customers and suppliers, and, therefore, the Company’s margins, earnings, orders and financial condition, results of operations and cash flows. Changes in these economic conditions may affect some of our regions or markets more than others. If adverse conditions affect our larger markets, such as California, Arizona, Texas and Florida, they could have a proportionately greater impact on us than on some other companies. In addition, any uncertainty regarding global economic conditions may have an adverse effect on the businesses, results of operations and financial condition of the Company and its customers, distributors and suppliers. A shortage of labor in the construction industry could also have an impact on our financial results.
Our sales depend upon the commercial new construction market, the commercial repair and remodel market and the industrial construction and maintenance markets.
The downturn from 2008 to 2011 in the U.S. commercial new construction market was one of the most severe of the last 40 years. Previously, downturns in the construction industry have typically lasted about two to three years, but the downturn from 2008 to 2011 was much more significant, with a market decline of approximately 49% during those three years. According to Dodge Data & Analytics, square-footage for new commercial construction starts has increased by approximately 58% since 2011 but remains approximately 33% below the peak level of 1.67 billion achieved in 2007. We cannot predict the duration of the current market conditions or the timing or strength of any future recovery of commercial construction activity in our markets. Weakness in the commercial construction market and the commercial repair and remodel market would have a material adverse effect on our business, financial condition and operating results. Continued uncertainty about current economic conditions will continue to pose a risk to our businesses that serve the non-residential markets. If participants in these industries postpone spending in response to tighter credit, negative financial news and declines in income or asset values or other factors, this could have a material negative effect on the demand for our products and services and on our business, financial condition and results of operations.
Homebuilding activity and the mortgage markets affect the demand for products we distribute, which in turn affects our business condition.
The distribution of our products, particularly wallboard, to contractors serving the residential market represents a significant portion of our business. Wallboard demand is highly correlated with housing starts. Housing starts and repair and remodel activity, in turn, are dependent upon a number of factors, including housing demand, housing inventory levels, housing affordability, mortgage and other interest rates, foreclosure rates, geographical shifts in the population and other changes in demographics, the availability of land, local zoning and permitting processes, the availability of construction financing and the health of the economy and mortgage markets. Unfavorable changes in any of these factors beyond our control could adversely affect consumer spending, result in decreased demand for homes and adversely affect our business.
Beginning in mid-2008 and continuing through late-2011, the U.S. homebuilding industry experienced a significant downturn. This decrease in homebuilding activity led to a steep decline in wallboard demand which, in turn, had a significant adverse effect on our industry. Since that time U.S. housing starts have recovered and, according to the U.S. Census Bureau, reached 1.2 million in 2017. Despite the growth over this period, U.S. housing start activity remains below their long-term historical averages. According to the Canada Mortgage and Housing Corporation, Canadian housing starts will remain relatively flat through 2019. In addition, some analysts project that the demand for residential construction may be negatively impacted as the number of renting households has increased in recent years and a shortage in the supply of affordable housing is expected to result in lower home ownership rates. The timing and extent of the continued recovery, if any, in homebuilding and the resulting impact on demand for our products are uncertain. Further, even if homebuilding activity fully recovers, the impact of such recovery on our business may be suppressed if, for example, the average selling price or average size of new single-family homes decreases, which could cause homebuilders to decrease spending on our services and the products we distribute.
14
Beginning in 2007, the mortgage markets were also substantially disrupted as a result of increased defaults, primarily due to weakened credit quality of homeowners. In reaction to the disruption in the mortgage markets, stricter regulations and financial requirements were adopted and the availability of mortgages for potential homebuyers was significantly reduced as a result of a limited credit market and stricter standards to qualify for mortgages. Mortgage financing and commercial credit for smaller homebuilders, as well as for the development of new residential lots, continue to be constrained. If the residential construction industry continues to experience weakness and a reduction in activity, our business, financial condition and operating results could be significantly and adversely affected.
Our business relies on private investment and a slower than expected economy may adversely affect our results.
A significant portion of our sales are for projects with non-public owners, such as non-residential builders and home builders who make investments with private funds into their projects. Construction spending is affected by our customers’ ability to finance projects. Residential and nonresidential construction and industrial construction projects and maintenance could decline if companies and consumers are unable to finance construction projects or if the economy slows or is stalled, which could result in delays or cancellations of capital projects. If the economy or housing starts and nonresidential projects do not increase, sale of our products and related services may decline and our financial position, results of operations and liquidity could be materially adversely affected.
The majority of our net sales are credit sales that are made primarily to customers whose ability to pay is dependent, in part, upon the economic strength of the industry and geographic areas in which they operate, and the failure to collect or timely collect monies owed from customers could adversely affect our business.
The majority of our net sales volume is facilitated through the extension of credit to our customers whose ability to pay is dependent, in part, upon the economic strength of the industry in the areas where they operate. We offer credit to customers, either through unsecured credit that is based solely upon the creditworthiness of the customer, or secured credit for materials sold for a specific construction project where we establish a security interest in the material used in the project. The type of credit we offer depends both on the customer's financial strength and the nature of the business in which the customer is involved. End users, contractors and other non-contractor customers typically purchase more on unsecured credit than secured credit. If any of our customers are unable to repay credit that we have extended in a timely manner, or at all, our financial condition, operating results and cash flows would be adversely affected. Further, our collections efforts with respect to non-paying or slow-paying customers could negatively impact our customer relations going forward.
Because we depend on certain of our customers to repay extensions of credit, if the financial condition of our customers declines, our credit risk could increase as a result. In a slow economy, there is a likelihood that we will not be able to collect on certain of our accounts receivables from our customers. Significant contraction in the commercial and residential construction markets, coupled with limited credit availability and stricter financial institution underwriting standards, could adversely affect the operations and financial stability of certain of our customers. For example, we experienced payment delays and defaults from some of our customers during the recent economic downturn and subsequent slow recovery. Should one or more of our larger customers declare bankruptcy, it could adversely affect the collectability of our accounts receivable, bad debt reserves and net income.
Within our local markets, we operate in a highly competitive industry and any failure to effectively compete could have a material adverse effect on us.
The U.S. and Canadian construction industries are highly fragmented with a large number of independent specialty building products distributors in a number of our markets. Additionally, in most markets, we compete against diversified distribution companies, which may be larger and have broader product lines. Competition with competitors that have greater financial resources and are better capitalized than us could lead to lower prices, lower sales volumes and higher costs in some markets, negatively affecting our financial position, results of operations and liquidity.
We also compete based on service, quality and range of products. Our competitors may be positioned to provide better service and thereby establish stronger relationships with customers and suppliers. Our competitors may also sell preferred products, develop a more comprehensive product portfolio or have more competitive prices. In addition, certain product manufacturers that sell and distribute their products directly to homebuilders may increase the volume of such direct sales.
There is intense competition in a number of markets in which we operate. If we are unable to compete effectively with our existing competitors or new competitors who enter the markets in which we operate, our financial position, results of operations and liquidity may be adversely affected.
15
The trend toward consolidation in our industry and broader markets may negatively impact our business.
The trend toward consolidation in our industry and across the building markets sector as a whole could cause markets to become more competitive as greater economies of scale are achieved by distributors that are able to efficiently expand their operations. We believe these factors could result in fewer overall distributors operating multiple locations. There can be no assurance that we will be able to continue to execute our acquisition growth strategy, and any failure to do so may make it more difficult for us to maintain or increase our economies of scales, including the level of rebates we receive from suppliers, and adversely affect our operating margins. Consolidation could also increase the competition for acquisition targets in our industry, resulting in higher acquisition costs and prices.
The success of our business depends, in part, on our ability to execute on our acquisition strategy.
A significant portion of our historical growth has occurred through acquisitions and our business plan provides for continued growth through acquisitions in the future. We are presently evaluating, and we expect to continue to evaluate on an ongoing basis, a variety of possible acquisition transactions, including both smaller acquisitions and larger acquisitions that would be material. We regularly make, and we expect to continue to make, acquisition proposals, and we may enter into letters of intent for acquisitions. We cannot predict the timing of any contemplated transactions, and there can be no assurances that we will identify suitable acquisition opportunities or, if we do identify such opportunities, that any transaction can be consummated on acceptable terms. Furthermore, a significant change in our business or the economy, an unexpected decrease in our cash flows or any restrictions imposed by our debt may limit our ability to obtain the necessary capital for acquisitions or otherwise impede our ability to complete an acquisition. Our recent growth and our acquisition strategy have placed, and will continue to place, significant demands on our management’s time, which may divert their attention from our business, and may lead to significant due diligence and other expenses regardless of whether we pursue or consummate any acquisition. Failure to identify suitable transaction partners and to consummate transactions on acceptable terms, as well as the commitment of time and resources in connection with such transactions, could have a material adverse effect on our business, financial condition and results of operations.
Our acquisition strategy exposes us to significant risks and additional costs.
Acquisitions also involve risks that the businesses acquired will not perform as expected and that business judgments concerning the value, strengths and weaknesses of acquired businesses will prove incorrect. We may not accurately assess the value, strengths, weaknesses or potential profitability of an acquisition target. We may become liable for certain unforeseen pre-acquisition liabilities of an acquired business, including, among others, tax liabilities, product liabilities, asbestos liabilities, environmental liabilities, pension liabilities and liabilities for employment practices, and these liabilities could be significant. In addition, an acquisition could result in the impairment of customer or vendor relationships or certain acquired assets such as inventory and goodwill. We may also incur costs and inefficiencies to the extent an acquisition expands the industries, products, markets or geographies in which we operate due to our limited exposure to and experience in a given industry, market or region. Large or a number of smaller acquisitions may also require that we incur additional debt to finance the transaction, which could be substantial and limit our flexibility in using our cash flow from operations for other purposes. Acquisitions can also involve post-transaction disputes with the counter party regarding a number of matters, including purchase price, inventory or other working capital adjustment, environmental liabilities or pension obligations. If any of these risks were to occur, our financial position, results of operations and liquidity may be adversely affected.
Any inability to successfully integrate our recent or future acquisitions could have a material adverse effect on us.
Acquisitions may require integration of acquired companies’ sales and marketing, distribution, purchasing, finance and administrative organizations, as well as exposure to different legal and regulatory regimes in jurisdictions in which we have not previously operated. We may not be able to integrate successfully any business we may acquire or have acquired into our existing business, or may not be able to do so in a timely, efficient and cost-effective manner. Our inability to complete the integration of new businesses in a timely and orderly manner could increase costs and lower profits. Factors affecting the successful integration of acquired businesses include, but are not limited to, the following:
• | diverting the attention of our management and that of the acquired business; |
• | merging or linking different accounting and financial reporting systems and systems of internal controls; |
• | merging computer, technology and other information networks and systems; |
• | assimilating personnel, human resources and other administrative departments and potentially contrasting corporate cultures; |
• | incurring or guaranteeing additional indebtedness; |
• | disrupting our relationship with or loss of key customers, suppliers or personnel; |
16
• | interfering with, or loss of momentum in, our ongoing business or that of the acquired company; and |
• | delays or cost-overruns in the integration process. |
Any of our acquisition or other integration-related issues could divert management’s attention and resources from our day-to-day operations, cause significant disruption to our business and lead to substantial additional costs. Our inability to realize the anticipated benefits of an acquisition or to successfully integrate acquired companies as well as other transaction-related issues could have a material adverse effect on our business, financial condition and results of operations.
In addition, possible future acquisitions or dispositions may trigger a review by the U.S. Department of Justice, or the DOJ, and the U.S. Federal Trade Commission, or FTC under their respective regulatory authority, focusing on the effects on competition, including the size or structure of the relevant markets and the pro-competitive benefits of the transaction. Any delay, prohibition or modification required by regulatory authorities could adversely affect the terms of a proposed acquisition or could require us to modify or abandon an otherwise attractive acquisition opportunity.
We cannot assure you that we will achieve synergies and cost savings in connection with acquisitions.
We may not achieve anticipated cost savings in connection with acquisitions within the anticipated time frame or at all. In addition, our results of operations from these acquisitions could, in the future, result in impairment charges for any of our intangible assets, including goodwill, or other long-lived assets, particularly if economic conditions worsen unexpectedly. These changes could materially negatively affect our results of operations, financial condition or liquidity.
An impairment of goodwill could have a material adverse effect on our results of operations.
Acquisitions frequently result in the recording of goodwill and other intangible assets. At December 31, 2017, goodwill represented 33.9% of our total assets. Goodwill is not amortized and is subject to impairment testing at least annually using a fair value based approach. The identification and measurement of goodwill impairment involves the estimation of the fair value of our reporting units, which are consistent with our operating segments. The estimates of fair value of reporting units are based on the best information available as of the date of the assessment and incorporate management assumptions about expected future cash flows and other valuation techniques. Future cash flows can be affected by changes in industry or market conditions, among other factors. The recoverability of goodwill is evaluated at least annually and when events or changes in circumstances indicate that the fair value of a reporting unit has more likely than not declined below its carrying value. The annual impairment test resulted in no impairment of goodwill during years ended December 31, 2017, 2016 and 2015.
We cannot accurately predict the amount and timing of any impairment of assets, and, in the future, we may be required to take additional goodwill or other asset impairment charges relating to certain of our reporting units. Any such non-cash charges would have an adverse effect on our financial results.
The loss of, or a significant decline in business with, one or more of our suppliers, or the development of alternatives to distributors in the supply chain, could adversely affect our business, financial condition, results of operations and cash flows.
Most of our sales are reliant upon maintaining our agreements and other relationships with suppliers of building products including wallboard, suspended ceiling systems, steel and commercial and industrial insulation materials. Some of these relationships with key suppliers, including Armstrong with respect to suspended ceiling systems, provide us with exclusive distribution rights in certain areas while others provide us with access to leading brands in many of our key markets. The loss of distribution rights with any of our key suppliers would have a material adverse impact on our sales and profitability. In addition, many of our suppliers could grant distribution rights in semi-exclusive markets to a competing distributor at any time, which could lead to a loss of market share in these markets, a loss of the share of a customer’s spend related to such products and a reduction in net sales. We cannot assure you that the current level of business with our suppliers can be maintained or that sales and profit will remain at or near current levels.
In addition, our customers could begin purchasing more of their product needs directly from manufacturers, which would result in decreases in our net sales and earnings. Our suppliers could invest in infrastructure to expand their own sales forces and sell more products directly to our customers, which also would negatively impact our business. These changes in the supply chain could adversely affect our financial condition, operating results and cash flows.
17
If we fail to qualify for supplier rebates or are unable to maintain or adequately renegotiate our rebate arrangements, our gross margins and income could be materially adversely affected.
Many of our products are purchased pursuant to rebate arrangements that entitle us to receive a rebate based on the volume of our purchases. Such arrangements generally require us to purchase minimum quantities in certain geographies or product categories and result in higher rebates with increased quantities of purchases. These rebates effectively reduce the costs of our products and we manage our business to take advantage of these programs. When assessing the desirability of acquisitions, we consider the effects of such acquisitions on our ability to qualify for rebates. Rebate arrangements are subject to renegotiation with our suppliers from time to time. In addition, consolidation of suppliers may result in the reduction or elimination of rebate programs in which we participate. If we are unable to qualify for these rebates, are unable to renew rebate programs on desirable terms or are unable to obtain the expected rebate benefits of our acquisitions, or a supplier materially reduces or stops offering rebates, our costs could materially increase and our gross margins and income could be materially adversely affected.
A material disruption at one of our suppliers’ facilities could prevent us from meeting customer demand, reduce our sales and negatively affect our overall financial results.
Any of the following events could cease or limit operations unexpectedly: fires, floods, earthquakes, hurricanes, on site or off site environmental incidents or other catastrophes; utility and transportation infrastructure disruptions; labor difficulties; other operational problems; or war, acts of terrorism or other unexpected events. Any downtime or facility damage at our suppliers, including one of the major wallboard or insulation suppliers, could prevent us from meeting customer demand for our products or require us to make more expensive purchases from a competing supplier. If our suppliers were to incur significant downtime, our ability to satisfy customer requirements could be impaired, resulting in customers seeking products from other distributors as well as decreased customer satisfaction and lower sales and operating income. Because we purchase from a limited number of wallboard manufacturing facilities, the effects of any particular shutdown or facility damage could be significant to our operations as a whole and pronounced in the markets near the facility affected.
In addition, our suppliers of synthetic wallboard are subject to the manufacturing facility disruption risks related to their associated coal plants slowing or shutting down. Our suppliers’ inability to produce or procure the necessary raw materials to supply finished goods to us may adversely impact our results of operations, cash flows and financial position.
Weather can materially affect our business and we are subject to seasonality.
Seasonal changes and other weather-related conditions can adversely affect our business and operations through a decline in both the use and production of our products and demand for our services. Adverse weather conditions, such as extended rainy and cold weather in the spring and fall, can reduce demand for our products and reduce sales or render our distribution operations less efficient. Major weather events such as hurricanes, tornadoes, tropical storms, heavy snows and flooding could also adversely affect sales.
Construction materials production and shipment levels follow activity in the construction industry, which typically occurs in the spring, summer and fall. Warmer and drier weather during the second and third quarters typically result in higher activity and sales levels during those quarters. The first quarter typically has lower levels of activity due to inclement weather conditions. The activity level during the second quarter varies greatly with variations in temperature and precipitation.
Difficult and volatile conditions in the credit markets could affect our financial position, results of operations and liquidity.
In a slow economy, there is a likelihood that we will not be able to collect on certain of our accounts receivable from our customers. We experienced payment delays and defaults from some of our customers during the recent economic downturn and subsequent slow recovery. Such delays and defaults could have a material adverse effect on our financial position, results of operations or liquidity.
18
Our mechanical insulation business is different from our historical business, and we may be unable to effectively operate such segment effectively.
Our mechanical insulation business, which we acquired in August 2016 in connection with the Winroc-SPI acquisition, differs from our historical lines of business. Operating this line of business may require a significant commitment of our management’s time and resources and we may not have the expertise, experience or resources to successfully or profitably operate it. If we are unable to effectively operate or grow this line of business, it may not be profitable or as profitable as we had expected and our operations could be adversely affected.
Our mechanical insulation business involves certain risks which may be different than those risks that previously existed in the Company’s business.
The mechanical insulation market is driven largely by commercial and industrial construction and maintenance and repair spending, as well as economic growth. Demand is influenced by commercial construction and renovation, the construction, maintenance and expansion of industrial process facilities (such as oil refineries, petrochemical plants and power generation facilities) and institutional facilities in the government, healthcare and education sectors. The mechanical insulation business, including the distribution of commercial and industrial insulation products, such as fiberglass, involves additional risks, including risks related to manufacturing or fabricating such products. We have not traditionally been directly involved in the manufacturing or fabrication of products. Additional risks could include warranty claims, manufacturing accidents, product liability claims and production-related injuries to personnel. Such risks could have a material adverse effect upon our financial results.
Most of our facilities are held under long-term, non-cancelable leases and a substantial number of such properties are leased from the former owners of acquired businesses. The interests of such lessors may be in conflict with our interests and we may be unable to renew leases on favorable terms or at all.
Most of our facilities are leased premises, which leases generally are non-cancelable and have initial terms ranging from three to 20 years, with options to renew for specified periods of time. In addition, a substantial portion of such facilities are leased from former owners of businesses we have acquired, and our relationships with such lessors could be adversely affected by unrelated business decisions or conflicts arising from such acquisitions. We cannot assure you that we will be able to renew our current or future leases on favorable terms or at all. In addition, if we close or idle a facility, we generally remain committed to perform our obligations under the applicable lease, which include, among other things, payment of the base rent for the balance of the lease term.
Any significant fuel cost increases or shortages in the supply of fuel could disrupt our ability to transport and distribute our products to customers, which could adversely affect our results of operations.
We currently use our own fleet of owned and leased vehicles to transport and distribute our products to our customers. The cost of fuel for these vehicles is largely unpredictable and has a significant effect on our business and results of operations. Prices and availability of petroleum products are subject to political, economic and market factors that are outside our control. Political events in petroleum-producing regions as well as hurricanes, floods and other weather-related events may cause the price of fuel to increase. A rise in fuel prices could make it unprofitable for us to service certain customers or regions. Significant increases in the cost of fuel or disruptions in the supply of fuel could materially adversely affect our business, sales and results of operations.
19
Environmental, health and safety laws and regulations and any changes to, or liabilities arising under, such laws and regulations could have a material adverse effect on our financial condition, results of operations and liquidity.
We are subject to a variety of federal, state, provincial and local laws and regulations relating to, among other things: the release or discharge of materials into the environment; the management, use, generation, treatment, processing, handling, storage, transport or disposal of solid and hazardous wastes and materials; and the protection of public and employee health and safety and the environment. These laws and regulations impose strict liability in some cases without regard to negligence or fault and expose us to liability for the environmental condition of our currently or formerly owned, leased or operated facilities, and may expose us to liability for the conduct of others or for our actions, even if such actions complied with all applicable laws at the time these actions were taken. These laws and regulations may also expose us to liability for claims of personal injury or property or natural resource damage related to alleged exposure to, or releases of, regulated or hazardous materials. The existence of contamination at properties we own, lease or operate could also result in increased operational costs or restrictions on our ability to use those properties as intended, including for purposes of construction materials distribution. In addition, because our properties are generally situated adjacent to or near industrial companies, our properties may be at an increased risk of having environmental contaminants from other properties spill or migrate onto or otherwise affect our properties.
Despite our compliance efforts, there is an inherent risk of liability in the operation of our business, especially from an environmental standpoint, and, from time to time, we may be in noncompliance with environmental, health and safety laws and regulations. These potential liabilities or non-compliances could have an adverse effect on our operations and profitability. In some instances, we must have government approvals, certificates, permits or licenses in order to conduct our business, which may require us to make significant capital, operating and maintenance expenditures to comply with environmental, health and safety laws and regulations. Our failure to obtain and maintain required approvals, certificates, permits or licenses or to comply with applicable governmental requirements could result in sanctions, including substantial fines or possible revocation of our authority to conduct some or all of our operations. Future changes in law, resulting in stricter laws and regulations, more stringent interpretations of existing laws or regulations or the future discovery of environmental conditions may impose new liabilities on us, reduce operating hours, require additional investment by us in pollution control equipment or impede our ability to open new or expand existing plants or facilities. We have incurred, and may in the future incur, significant capital and operating expenditures to comply with such laws and regulations. The cost of complying with such laws could have a material adverse effect on our financial condition, results of operations and liquidity.
Our business is subject to a wide variety of government laws and regulations. These laws and regulations, as well as any new or changed laws or regulations, could have an adverse effect on our business.
We are subject to a wide variety of laws and regulations, including those governing employment and labor matters like minimum wage and employee benefit matters, trade, transportation and logistics, tax, and other matters relevant to our business. While it is our policy and practice to comply with all applicable legal and regulatory requirements and our procedures and controls are designed to facilitate such compliance, we cannot provide any assurances that our operations will comply at all times. Further, laws and regulations at the federal, state and local levels frequently change and we cannot always reasonably predict the impact from, or the ultimate cost of compliance with, future regulatory or administrative changes. Changes in law, or the enactment of any new or more stringent laws or regulations could also require us to change the way we do business, increase our compliance costs or otherwise have a material adverse impact on our business. If we are found to be in violation of any applicable laws or regulations, or if we fail to appropriately adjust our operations to comply with new or updated legal requirements, we could be subject to fines, penalties, damages or other sanctions as well as potential adverse publicity or litigation exposure, any of which could adversely impact our business, reputation, sales, profitability, cash flows or financial condition.
20
Legal, regulatory or market responses to potential global climate change could have a material adverse effect on our financial condition, results of operation and liquidity.
Concern over the potential for global climate change has led to significant federal, state, provincial and international legislative, regulatory and treaty initiatives to limit greenhouse gas, or GHG, emissions. For example, in recent years, the U.S. Congress has considered but not passed legislation that would regulate GHG emissions. Nonetheless, some form of federal climate change legislation is possible in the future and, in the absence of such legislation, the U.S. Environmental Protection Agency, has taken action to regulate GHG emissions. Such regulation or other measures to limit GHG emissions could cause us to incur substantial costs, including an increase in the cost of the fuel and other energy we purchase and capital costs associated with updating or replacing our internal fleet of trucks and other vehicles prematurely. Further, new laws or future regulation could directly and indirectly affect our customers and suppliers (through an increase in the cost of production or their ability to produce satisfactory products) and our business (through the impact on our inventory availability, cost of sales, operations or demands for the products we sell). Until the timing, scope and extent of any future regulation becomes known, we cannot predict its effect on our cost structure or our operating results. but it is possible that such legislation or regulation potentially could impose material costs on us.
The exportation and importation of building materials into North America could expose us to additional risk.
Certain building materials that we distribute may come from foreign jurisdictions outside the U.S. and Canada. Such materials may be imported because they may not be available for domestic purchase in the United States or Canada or because there may be a shortfall of inventory available locally. Despite our efforts to ensure the merchantability of these products, such products may not adhere to United States and Canadian standards or laws. Importation of such building materials could subject us to greater risk, including lawsuits by customers or governmental entities. Furthermore, the Canadian government has instituted a review of pricing practices for wallboard produced in the United States and exported to Canada. The result of such review could result in higher prices of wallboard in Canada, which could affect construction projects and could affect our sales in Canada.
We may be adversely affected by uncertainty in the economy and financial markets and disruptions to the transportation network as a result of terrorism.
Instability in the economy and financial markets, including as a result of terrorism, may result in a decrease in construction, which would adversely affect our business. In the aftermath of terrorist attacks in the United States, federal, state and local authorities have implemented and continue to implement various security measures that affect many parts of the transportation network in the United States. Our customers typically need quick delivery and rely on our on-time delivery capabilities. If security measures disrupt or impede the timing of our deliveries, we may fail to meet the needs of our customers or may incur increased expenses to do so. In addition, domestic terrorist attacks may affect our ability to keep our operations and services functioning properly and could have a material adverse effect on our financial condition, operating results and cash flows.
Our operating results and financial position could be negatively impacted by accounting policies, rules and regulations.
Our operating results and financial position could be negatively impacted by implementation of our various accounting policies as well as changes to accounting rules and regulations or new interpretations of existing accounting standards. For example, while we are still evaluating the impact of our pending adoption of Accounting Standards Update 2016-02, "Leases" on our consolidated financial statements, we expect that upon adoption we will recognize right of use, or ROU, assets and liabilities that could be material to our financial statements. In addition, from time to time we could incur impairment charges that adversely affect our operating results. For example, changes in economic or operating conditions impacting our estimates and assumptions could result in the impairment of intangible assets (such as goodwill) or long-lived assets in accordance with applicable accounting guidance. In the event that we determine our intangible or long-lived assets are impaired, we may be required to record a significant charge to earnings in our financial statements that could have a material adverse effect on our results of operations.
21
Our business operations could suffer significant losses from natural disasters, catastrophes, fire or other unexpected events.
While we operate our business out of over 220 facilities and maintain insurance covering our facilities, including business interruption insurance, our facilities could be materially damaged by natural disasters, such as floods, tornadoes, hurricanes and earthquakes, or by fire, adverse weather conditions or other unexpected events or disruptions to our facilities. We could incur uninsured losses and liabilities arising from such events, including damage to our reputation and suffer material losses in operational capacity, which could have a material adverse impact on our business, financial condition and results of operations.
We depend on our senior management, and our business may be adversely impacted if we lose any member of our senior management or are unable to recruit additional management and other personnel.
We are dependent upon the services of our senior management, especially our President and Chief Executive Officer Ruben Mendoza, our Chief Financial Officer John Gorey, our Chief Operating Officer Pete Welly and our Senior Vice President of Sales and Marketing Kirby Thompson. The loss of the services of one or more members of our senior management team could harm our business and future development. Our continued growth also will depend upon our ability to attract and retain additional skilled management personnel. We believe there is a limited number of qualified people in our business and the industry in which we compete. As such, there can be no assurance that we will be able to identify and retain the key personnel that may be necessary to grow our business effectively or successfully implement our growth strategy. If we are unable to attract and retain the requisite personnel as needed in the future, our operating results and growth could suffer.
Employee disputes or employee-related cost increases could disrupt operations of our businesses.
While we believe our relationships with our employees are quite good, a failure to maintain good relationships with our employees could have a material adverse effect on the Company. A work disruption or stoppage at one of our facilities could cause us to lose sales, incur increased costs and adversely affect our ability to meet customers’ needs. As of December 31, 2017, approximately 4.6% of our workforce were members of unions. However, if a larger number of our employees were to unionize, including in the wake of any future legislation that makes it easier for employees to unionize, our business could be negatively affected. Sometimes we must compete for employees with necessary skills and experience or in tight labor markets which can also increase costs. We had 3,782 employees as of December 31, 2017. Various federal and state labor laws govern our relationships with our employees and affect our operating costs. These laws include employee classifications as exempt or non-exempt, minimum wage requirements, unemployment tax rates, workers’ compensation rates, overtime, family leave, anti-discrimination laws, safety standards, payroll taxes, citizenship requirements and other wage and benefit requirements for employees classified as non-exempt. As our employees may be paid at rates that relate to the applicable minimum wage, further increases in the minimum wage could increase our labor costs. Any such cost increases, work stoppages or disruptions could have a material adverse effect on our business, financial condition, results of operations and cash flows by limiting production, sales volumes and profitability.
In addition, we compete with other companies for many of our employees, and we invest significant resources to train and motivate our employees to maintain a high level of job satisfaction. If we are unable to effectively retain highly qualified employees in the future, it could adversely impact our operating results.
Our business is cyclical and requires significant working capital to fund operations.
Our business is cyclical and requires that we maintain significant working capital to fund our operations. Our ability to generate sufficient cash flow depends on future performance, which will be subject to general economic conditions, industry cycles and financial, business and other factors affecting our operations, many of which are beyond our control. If we are unable to generate sufficient cash to operate our business and service our outstanding debt and other obligations, we may be required, among other things, to further reduce or delay planned capital or operating expenditures, sell assets or take other measures, including the restructuring of all or a portion of our debt, which may only be available, if at all, on unsatisfactory terms.
22
We may be unable to effectively manage our inventory and working capital as our sales volume increases or the prices of the products we distribute fluctuate, which could have a material adverse effect on our business, financial condition and operating results.
We purchase certain products, including wallboard, suspended ceiling systems, metal framing and other specialty building materials, from manufacturers which are then sold and delivered to customers. We must maintain, and have adequate working capital to purchase, sufficient inventory to meet customer demand. Due to the lead times required by our suppliers, we order products in advance of expected sales. As a result, we are required to forecast our sales and purchase accordingly. In periods characterized by significant changes in economic growth and activity in the commercial and residential building and home repair and remodel industries, it can be especially difficult to forecast our sales accurately. We must also manage our working capital to fund our inventory purchases. Excessive increases in the market prices of certain building products, such as wallboard, suspended ceiling systems and metal framing, can put negative pressure on our operating cash flows by requiring us to invest more in inventory. In the future, if we are unable to effectively manage our inventory and working capital as we attempt to expand our business, our cash flows may be negatively affected, which could have a material adverse effect on our business, financial condition and operating results.
A failure to implement or integrate, or a disruption in, our information technology systems could adversely affect our business and results of operations.
Integration of our acquisitions has required in the past, and will require in the future, significant attention from our employees and substantial resources. Among other matters, we are faced with migrating acquired companies’ information related to purchasing, sales, inventory management and rebates to our systems or, for a time, maintaining multiple systems.
As our operations grow in both size and scope, and as we integrate our acquisitions, we will continuously need to improve and upgrade our systems and infrastructure while maintaining the reliability and integrity of our information systems and infrastructure. These and any other upgrades to our systems and information technology, or new technology, now and in the future, will require that our management and resources be diverted from our core business to assist in compliance with those requirements. In addition, we rely upon the capacity, reliability and security of our information technology infrastructure to maintain our existing business.
A disruption resulting from a problem with the implementation, integration or functioning of an important information technology system or a security breach of such a system could have an adverse effect on our business and results of operations.
We could be subject to cyber-security risks, information technology interruptions, and business continuity risks.
Our cyber-security and processing systems, as well as those of our third-party providers may experience damage or disruption from a number of causes, including power outages, computer and telecommunication failures, computer viruses, malware or other destructive software, internal design, manual or usage errors, cyber-attacks, terrorism, workplace violence or wrongdoing, catastrophic events, natural disasters and severe weather conditions. We may also be impacted by breaches of our third-party processors. Although no breaches have had a direct, material impact on us, we are unable to predict the direct or indirect impact of any future attacks to our business.
In addition, numerous and evolving cybersecurity threats, including advanced and persistent cyber-attacks, phishing and social engineering schemes, particularly on internet applications, could compromise the confidentiality, availability, and integrity of data in our systems. The security measures and procedures we, our clients and third-party service providers have in place to protect sensitive data and other information may not be successful or sufficient to counter all data breaches, cyber-attacks, or system failures. Although we devote resources to our cybersecurity programs and have implemented security measures to protect our systems and data, and to prevent, detect and respond to data security incidents, there can be no assurance that our efforts will prevent these threats.
Because the techniques used to obtain unauthorized access, or to disable or degrade systems change frequently, have become increasingly more complex and sophisticated, and may be difficult to detect for periods of time, we may not anticipate these acts or respond adequately or timely. As these threats continue to evolve and increase, we may be required to devote significant additional resources in order to modify and enhance our security controls and to identify and remediate any security vulnerabilities.
23
Our foreign operations could have a material adverse effect on us.
We distribute products in Canada, and we are therefore subject to a number of risks specific to this country and may become subject to risks specific to countries where we complete acquisitions. These risks include social, political and economic instability, unexpected changes in regulatory requirements, tariffs and other trade barriers, currency exchange fluctuations, acts of war or terrorism and import/export requirements. Our financial statements are reported in U.S. dollars with international transactions being translated into U.S. dollars. There can be no assurances that any of these factors will not materially impact our production cost or otherwise have a material adverse effect on our business, financial condition and results of operations.
We are exposed to product liability, warranty, casualty, construction defect, contract, tort, employment and other claims and legal proceedings related to our business, the products we distribute, the services we provide and services provided for us by third parties.
In the ordinary course of business, we are subject to various claims and litigation. Any such claims, whether with or without merit, could be time consuming and expensive to defend and could divert management’s attention and resources. The building materials industry has been subject to personal injury and property damage claims arising from alleged exposure to raw materials contained in building products as well as claims for incidents of catastrophic loss, such as building fires. As a distributor of building materials, we face an inherent risk of exposure to product liability claims in the event that the use of the products we or our predecessor companies have distributed in the past or may in the future distribute are alleged to have resulted in economic loss, personal injury or property damage or violated environmental, health or safety or other laws. Product liability claims have included and may in the future include allegations of personal injury related to asbestos-containing products, defects in manufacturing, defects in design, a failure to warn of dangers inherent in the product, negligence, strict liability or a breach of warranties.
We are also from time to time subject to casualty, contract, tort and other claims relating to our business, the products we have distributed in the past or may in the future distribute, and the services we have provided in the past or may in the future provide, either directly or through third parties. If any claim were adversely determined, our financial condition, operating results and cash flows could be adversely affected if we were unable to seek indemnification for such claims or were not adequately insured for such claims. We rely on manufacturers and other suppliers to provide us with the wallboard, suspended ceiling systems, metal framing, commercial and industrial insulation and other products we sell or distribute. Since we do not have direct control over the quality of such products that are manufactured or supplied to us by third parties, we are particularly vulnerable to risks relating to the quality of such products. We are also exposed to risk due to our fabrication of materials in our mechanical insulation business. In addition, we are exposed to potential claims arising from the conduct of our employees, builders and their subcontractors and third-party installers for which we may be liable. We and they are subject to regulatory requirements and risks applicable to general contractors, which include management of licensing, permitting and quality of third-party installers. As they apply to our business, if we fail to manage these processes effectively or provide proper oversight of these services, we could suffer lost sales, fines and lawsuits, as well as damage to our reputation, which could adversely affect our business and the results of our operations.
Although we believe we currently maintain suitable and adequate insurance, there can be no assurance that we will be able to maintain such insurance on acceptable terms or that such insurance will provide adequate protection against potential liabilities and the cost of any litigation or other proceeding, even if resolved in our favor, could be substantial. Additionally, we do not carry insurance for all categories of risk that our business may encounter and we also self-insure for certain other risks. Any significant uninsured or self-insured liability may require us to pay substantial amounts. There can be no assurance that any current or future claims will not adversely affect our financial position, cash flows or results of operations.
24
Our operations are subject to special hazards that may cause personal injury or property damage, subjecting us to liabilities and possible losses which may not be covered by insurance.
Operating hazards, such as unloading heavy products, operating large machinery and driving hazards, which are inherent in our business and some of which may be outside of our control, can cause personal injury and loss of life, damage to or destruction of property, plant and equipment and environmental damage. We maintain insurance coverage in amounts and against the risks we believe are consistent with industry practice, but this insurance may not be adequate or available to cover all losses or liabilities we may incur in our operations. Our insurance policies are subject to varying levels of deductibles. Losses up to our deductible amounts are accrued based upon our estimates of the ultimate liability for claims incurred and an estimate of claims incurred but not reported. However, liabilities subject to insurance are difficult to estimate due to unknown factors, including the severity of an injury, the determination of our liability in proportion to other parties, the number of incidents not reported and the effectiveness of our safety programs. If we were to experience insurance claims or costs above our estimates, we might also be required to use working capital to satisfy these claims rather than using working capital to maintain or expand our operations.
Unexpected factors affecting reserve estimates could adversely affect our business.
We use third-party insurance to provide for potential liabilities for completed operations, product liability, workers’ compensation, cargo, general liability, vehicle accident, property and medical benefit claims. Although we believe we have minimized our exposure on individual claims, for the benefit of costs savings we have accepted the risk of multiple independent material claims arising. We estimate the projected losses and liabilities associated with the risks retained by us, in part, by considering historical claims experience, demographic and severity factors and other actuarial assumptions which, by their nature, are subject to a high degree of variability. Among the causes of this variability are unpredictable external factors affecting future inflation rates, discount rates, litigation trends, legal interpretations, benefit level changes and claim settlement patterns. Any such matters could have a material adverse effect on our financial condition, results of operations and liquidity.
Our financial results may be affected by various legal and regulatory proceedings involving us or our suppliers.
We and our suppliers are subject to litigation and regulatory proceedings in the normal course of business and could become subject to additional claims in the future, some of which could materially and adversely affect our results of operations. For instance, during 2015, various lawsuits were filed against certain of our suppliers alleging that such manufacturers had conspired to fix the price of wallboard in violation of antitrust and unfair competition, had agreed to abolish the use of job quotes and had agreed to restrict the supply of wallboard in order to support allegedly collusive price increases. We are not a party to these proceedings, but these proceedings could adversely affect the business and financial condition of our suppliers or result in changes to our suppliers’ business practices that could adversely affect our supply chain. In addition, we may in the future be made party to these or similar lawsuits to the extent we distributed products from affected manufacturers. These events could adversely affect our business or results of operations.
In addition, claims and investigations may arise related to distributor relationships, commercial contracts, antitrust or competition law requirements, employment matters, employee benefits issues and other compliance and regulatory matters, including anti-corruption and anti-bribery matters. While we have processes and policies designed to mitigate these risks and to investigate and address such claims as they arise, we cannot predict or, in some cases, control the costs to defend or resolve such claims.
Our business may be subject to additional obligations to collect and remit sales tax and other taxes and we may be subject to tax liability for past sales. Any successful action by state, foreign or other authorities to collect additional or past sales tax could adversely harm our business.
States and some local taxing jurisdictions have differing rules and regulations governing sales and use taxes and these rules and regulations are subject to varying interpretations that may change over time. We recorded sales and use tax accruals of $5.8 million and $7.3 million as of December 31, 2017 and 2016, respectively, with respect to sales and use tax liabilities in various states and local jurisdictions. It is possible that we could incur additional liabilities that exceed our estimates and we could assume tax liabilities through our acquisitions. Other state tax authorities could still assert that we are obligated to collect additional amounts as taxes from our customers and remit those taxes to those authorities. We could also be subject to audits with respect to states and foreign jurisdictions for which we have not accrued tax liabilities. A successful assertion that we should be collecting additional sales or other taxes on our services in jurisdictions where we have not historically done so and do not accrue for sales taxes could result in substantial tax liabilities for past sales, discourage customers from purchasing our products or otherwise adversely affect our business and results of operations.
25
Risks Relating to our Indebtedness
Our substantial leverage could adversely affect our ability to raise additional capital to fund our operations, limit our ability to react to changes in the economy or our industry, expose us to interest rate risk and exchange rate risk to the extent of our variable rate and foreign currency debt, give creditors secured claims to any collateral securing the debt owed to them and prevent us from meeting our obligations under our senior secured notes due 2021, or the Notes.
We are highly leveraged. As of December 31, 2017, the aggregate principal amount of our debt was approximately $622.5 million, which was comprised of $47.5 million under our 2017 asset-based lending credit facility, or the ABL Credit Facility, and $575 million in Notes. Additionally, we may borrow additional funds under our ABL Credit Facility and increase the borrowing capacity thereunder.
Our high degree of leverage could have important consequences for you, including:
• | making it more difficult for us to make payments on our existing indebtedness; |
• | increasing our vulnerability to general economic and industry conditions; |
• | requiring a substantial portion of cash flow from operations to be dedicated to the payment of principal and interest on our indebtedness, thereby reducing our ability to use our cash flow to fund our operations, capital expenditures and future business opportunities; |
• | exposing us to the risk of increased interest rates on our borrowings under our ABL Credit Facility, which is at variable rates of interest; |
• | restricting us from making strategic acquisitions or causing us to make non-strategic divestitures; |
• | limiting our ability to obtain additional financing for working capital, capital expenditures, debt service requirements, acquisitions and general corporate or other purposes; and |
• | limiting our ability to adjust to changing market conditions and placing us at a competitive disadvantage compared to our competitors who are less highly leveraged. |
Our ability to make payments on debt, to repay existing indebtedness when due and to fund operations and significant planned capital expenditures will depend on our ability to generate cash in the future. Our ability to produce cash from operations is, and will be, subject to a number of risks, including those described in this Annual Report on Form 10-K.
Borrowings under our ABL Credit Facility are at variable rates of interest and allow certain borrowings in Canadian dollars, which may expose us to interest rate and currency risk. If interest rates increase, our debt service obligations on the variable rate indebtedness will increase even though the amount borrowed remained the same, and our net income and cash flows, including cash available for servicing our indebtedness, will correspondingly decrease.
Additional financing, if required, may not be available on commercially reasonable terms, if at all. In addition, our ability to borrow under our ABL Credit Facility is subject to significant conditions, as described in Item 7, Management’s Discussion and Analysis of Financial Condition and Results of Operations.
Despite our current level of indebtedness, we and our subsidiaries may incur more debt.
We and our subsidiaries may be able to incur significant additional indebtedness in the future. For example, we expect to incur additional indebtedness in connection with many future acquisitions. Although the indenture pursuant to which the Notes were issued, or the Indenture, and the credit agreement governing our ABL Credit Facility, or the ABL Credit Agreement, contain restrictions on the incurrence of additional indebtedness, these restrictions are subject to a number of qualifications and exceptions, and the additional indebtedness incurred in compliance with these restrictions could be substantial. These restrictions also do not prevent us from incurring obligations that do not constitute indebtedness. In addition, as of December 31, 2017, our ABL Credit Facility provided for an unused commitment of $252.5 million (without giving effect to any outstanding letters of credit, and subject to borrowing base limitations).
26
We will require a significant amount of cash to service our indebtedness. The ability to generate cash or refinance our indebtedness as it becomes due depends on many factors, some of which are beyond our control.
Our ability to make scheduled payments on, or to refinance our respective obligations under, our indebtedness, and to fund planned capital expenditures and other corporate expenses will depend on our future operating performance and on economic, financial, competitive, legislative, regulatory and other factors and any legal and regulatory restrictions on the payment of distributions and dividends to which we may be subject. Many of these factors are beyond our control. We cannot assure you that our business will generate sufficient cash flow from operations, that currently anticipated cost savings and operating improvements will be realized or that future borrowings will be available to us in an amount sufficient to enable us to satisfy our respective obligations under our indebtedness or to fund our other needs. In order for us to satisfy our obligations under our indebtedness and fund planned capital expenditures, we must continue to execute our business strategy. If we are unable to do so, we may need to reduce or delay our planned capital expenditures or refinance all or a portion of our indebtedness on or before maturity. Significant delays in our planned capital expenditures may materially and adversely affect our future sales prospects. In addition, we cannot assure you that we will be able to refinance any of our indebtedness on commercially reasonable terms or at all. Our tax receivable agreement requires that, after Lone Star no longer controls us, any senior debt document that refinances or replaces our existing indebtedness permit our subsidiaries to make dividends to us, without any conditions, to the extent required for us to make payments under the tax receivable agreement, unless Lone Star otherwise consents. At the time of any such refinancing, it may not be possible to include this term in such senior debt documents, and as a result, we may need Lone Star’s consent to complete such refinancing.
We may not be able to generate sufficient cash to service all of our indebtedness and may be forced to take other actions to satisfy our obligations under our indebtedness, which may not be successful.
Our ability to make scheduled payments on or to refinance our debt obligations depends on our financial condition and operating performance, which is subject to prevailing economic and competitive conditions and to certain financial, business and other factors beyond our control. We may not be able to maintain a level of cash flows from operating activities sufficient to permit us to pay the principal, premium, if any, and interest on our indebtedness. See Item 7A Management’s Discussion and Analysis of Financial Condition and Results of Operations—Liquidity and Capital Resources. If our cash flows and capital resources are insufficient to fund our debt service obligations, we may be forced to reduce or delay investments and capital expenditures, seek additional capital, restructure or refinance our indebtedness or sell assets. These alternative measures may not be successful and may not permit us to meet our scheduled debt service obligations. Our ability to restructure or refinance our debt will depend on the condition of the capital markets and our financial condition at such time. Any refinancing of our debt could be at higher interest rates and may require us to comply with more onerous covenants, which could further restrict our business operations. The ABL Credit Agreement and the Indenture restrict our ability to consummate or use the proceeds from asset sales. We may not be able to consummate those asset sales to raise capital or sell assets at prices that we believe are fair and proceeds that we do receive may not be adequate to meet any debt service obligations then due. In addition, any failure to make payments of interest and principal on our outstanding indebtedness on a timely basis would likely result in a reduction of our credit rating, which could harm our ability to incur additional indebtedness.
The Indenture and the ABL Credit Agreement restrict our ability and the ability of most of our subsidiaries to engage in some business and financial transactions.
Indenture. The Indenture contains restrictive covenants that, among other things, limit our ability to:
• | incur additional indebtedness or issue certain preferred shares; |
• | pay dividends, redeem its or their stock or make other distributions; |
• | make certain investments; |
• | create restrictions on the ability of its restricted subsidiaries to pay dividends or make other intercompany transfers; |
• | create liens; |
• | sell or transfer certain assets; |
• | consolidate, merge, sell or otherwise dispose of all or substantially all of our assets; |
• | enter into certain transactions with our affiliates; and |
• | designate subsidiaries as unrestricted subsidiaries. |
ABL Credit Agreement. The ABL Credit Agreement contains a number of covenants that among other things, limit our
ability and the ability of our restricted subsidiaries to:
• | incur additional indebtedness or guarantees; |
• | create liens on assets; |
• | change our fiscal year; |
27
• | enter into sale and leaseback transactions; |
• | engage in mergers or consolidations; |
• | incur additional liens; |
• | pay dividends and make other restricted payments; |
• | make investments, loans or advances; |
• | repay subordinated indebtedness; |
• make certain acquisitions;
• engage in certain transactions with affiliates;
• | change our lines of business; |
• | restrict distributions by our restricted subsidiaries; |
• | engage in sale and leaseback transactions; |
• | permit Foundation Building Materials Holdings Company, LLC to engage in certain activities; |
• | amend or otherwise modify organizational documents or certain debt agreements; and |
• | manage cash and other assets in our deposit accounts and securities accounts. |
In addition, the ABL Credit Agreement requires us to maintain a minimum fixed charge coverage ratio set at a level of 1.00:1.00, which will only be tested at times when availability under the ABL Credit Facility is less than a certain threshold.
The ABL Credit Agreement also contains certain customary representations and warranties, affirmative covenants and events of default (including, among others, an event of default upon a change of control). If an event of default occurs, the lenders under the ABL Credit Facility will be entitled to take various actions, including the acceleration of amounts due under our ABL Credit Facility and all actions permitted to be taken by a secured creditor.
Any future debt that we incur may contain additional negative covenants and financial maintenance covenants. These restrictions could limit our ability to obtain debt financing, repurchase stock, refinance or pay principal on our outstanding debt, complete acquisitions for cash or debt or react to changes in our operating environment or the economy.
Our failure to comply with obligations under the Indenture, the ABL Credit Agreement or the agreements governing any other indebtedness we may enter into in the future, may result in an event of default under the applicable agreement. A default, if not cured or waived, may permit acceleration of some or all of our indebtedness. We cannot be certain that we will be able to remedy any defaults. If our indebtedness is accelerated, we cannot be certain that we will have sufficient funds available to pay the accelerated indebtedness or that we will have the ability to refinance the accelerated indebtedness on terms favorable to us or at all.
Risks Related to Ownership of Our Common Stock
Because our common stock has only recently started trading in the public market, the trading market for our common stock may not be sustained and the trading price of our common stock may be volatile and could decline substantially.
Prior to the public offering of our stock in February 2017, there had been no market for shares of our common stock. Although our common stock is listed on the New York Stock Exchange, or NYSE, under the symbol "FBM," an active trading market for the shares of our common stock may not be sustained. Accordingly, no assurance can be given as to the following:
• | the likelihood that an active trading market for shares of our common stock will be sustained; |
• | the liquidity of any such market; |
• | the ability of our stockholders to sell their shares of common stock; or |
• | the price that our stockholders may obtain for their common stock. |
If an active market is not maintained, the market price of our common stock may decline and holders of our common stock may not be able to sell their shares. Even in an active trading market for our common stock, the market price of our common stock may be highly volatile and subject to wide fluctuations.
Some of the factors that could negatively affect the market price of our common stock or result in significant fluctuations in price, regardless of our actual operating performance, include:
• | actual or anticipated variations in our quarterly operating results; |
• | changes in market valuations of similar companies; |
• | changes in the markets in which we operate; |
• | additions or departures of key personnel; |
28
• | actions by stockholders, including the sale by Lone Star of any of its shares of our common stock; |
• | speculation in the press or investment community; |
• | general market, economic and political conditions, including an economic slowdown; |
• | changes in interest rates; |
• | our operating performance and the performance of other similar companies; |
• | our ability to accurately project future results and our ability to achieve those and other industry and analyst forecasts; and |
• | new legislation or other regulatory developments that adversely affect us, our markets or our industry. |
Furthermore, in recent years, the stock market has experienced significant price and volume fluctuations. This volatility has had a significant impact on the market price of securities issued by many companies, including companies in our industry, and often occurs without regard to the operating performance of the affected companies. Therefore, factors that have little or nothing to do with us could cause the price of our common stock to fluctuate, and these fluctuations or any fluctuations related to our company could cause the market price of our common stock to decline materially.
We are no longer an "emerging growth company" and, as a result, we are required to or will be required to comply with increased disclosure and governance requirements.
We were an "emerging growth company," as defined in the Jumpstart Our Business Startups Act of 2012, at the time of filing our Registration Statement on Form S-1 in January 2017 and continued to qualify as one through the completion of our initial public offering. However, because our net sales exceeded $1 billion for the year ended December 31, 2016, we no longer qualify as an emerging growth company. As a non-emerging growth company, we will be subject to certain requirements that apply to other public companies but did not previously apply to us due to our status as an emerging growth company. These requirements include full disclosure obligations regarding executive compensation. Additionally, following the applicable transaction period for newly public companies, we will be required to comply with the auditor attestation requirements in the assessment of our internal control over financial reporting as discussed in greater detail below. Failure to comply with these requirements could subject us to enforcement actions by the SEC, divert management’s attention, damage our reputation and adversely affect our business, operating results or financial condition.
We expect that the loss of "emerging growth company" status and compliance with the additional requirements could substantially increase our legal and financial compliance costs and make some activities more time consuming and costly. In particular, we expect to incur significant expenses and devote substantial management effort toward ensuring compliance with the auditor attestation requirements of Section 404 of the Sarbanes-Oxley Act.
Our internal control over financial reporting may not be effective and our independent registered public accounting firm may not be able to certify as to their effectiveness, which could have a significant and adverse effect on our business and reputation.
As a public company, we are required to comply with the SEC’s rules implementing Sections 302 and 404 of the Sarbanes-Oxley Act, which require management to certify financial and other information in our quarterly and annual reports and provide an annual management report on the effectiveness of control over financial reporting. At such time, our independent registered public accounting firm may issue a report that is adverse in the event that it is not satisfied with the level at which our internal control over financial reporting is documented, designed or operating.
To continue to comply with the requirements of being a public company, we may need to undertake various actions, such as implementing additional internal controls and procedures and hiring additional accounting or internal audit staff. Testing and maintaining internal control can divert our management’s attention from other matters that are important to the operation of our business. If we identify material weaknesses in our internal control over financial reporting or are unable to comply with the requirements of Section 404 of the Sarbanes-Oxley Act or assert that our internal control over financial reporting is effective, or if our independent registered public accounting firm is unable to express an opinion as to the effectiveness of our internal control over financial reporting, investors may lose confidence in the accuracy and completeness of our financial reports and the market price of our common stock could be negatively affected, and we could become subject to investigations by the SEC or other regulatory authorities, which could require additional financial and management resources.
29
The coverage of our business or our common stock by securities or industry analysts or the absence thereof could adversely affect our stock price and trading volume.
The trading market for our common stock is influenced in part by the research and other reports that industry or securities analysts may publish about us or our business or industry. We currently have, but may not be able to continue, research coverage by industry or financial analysts. If analysts do not continue coverage of us, the trading price and volume of our stock would likely be negatively impacted. Even if analyst coverage continues, if one or more analysts who do cover us downgrades our stock, or if they issue other unfavorable commentary about us or our industry or inaccurate research, our stock price would likely decline. Furthermore, if one or more of these analysts cease coverage or fail to regularly publish reports on us, we could lose visibility in the financial markets. Any of the foregoing would likely cause our stock price and trading volume to decline.
Lone Star may have conflicts of interest with other stockholders and may limit our minority stockholders' ability to influence corporate matters.
Lone Star beneficially owns approximately 65.4% of our outstanding common stock. As a result of this concentration of stock ownership, Lone Star acting on its own has sufficient voting power to effectively control all matters submitted to our stockholders for approval, including director elections and proposed amendments to our bylaws or certificate of incorporation. Currently, seven of the eleven members of our Board are employees or affiliates of Lone Star.
In addition, this concentration of ownership may delay or prevent a merger, consolidation or other business combination or change in control of our company and make some transactions that might otherwise give our stockholders the opportunity to realize a premium over the then-prevailing market price of our common stock more difficult or impossible without the support of Lone Star. Because we have opted out of Section 203 of the Delaware General Corporation Law, or the DGCL, regulating certain business combinations with interested stockholders, Lone Star may transfer control of us to a third party, which may limit the price that investors are willing to pay in the future for shares of our common stock. Lone Star could transfer control of us to a third-party by transferring its common stock, which would not require the approval of our Board or other stockholders. The interests of Lone Star may not always coincide with our interests as a company or the interests of other stockholders. Accordingly, Lone Star could cause us to enter into transactions or agreements of which our other stockholders would not approve or make decisions with which our other stockholders would disagree. This concentration of ownership may also adversely affect our share price.
Lone Star is in the business of making investments in companies and may from time to time acquire and hold interests in businesses that compete directly or indirectly with us, although it does not currently hold any such interests. Lone Star may also pursue acquisition opportunities that may be complementary to our business, and as a result, those acquisition opportunities may not be available to us. In recognition that principals, members, directors, managers, partners, stockholders, officers, employees and other representatives of Lone Star and its affiliates and investment funds may serve as our directors or officers, our amended and restated certificate of incorporation provides, among other things, that none of Lone Star or any principal, member, director, manager, partner, stockholder, officer, employee or other representative of Lone Star has any duty to refrain from engaging directly or indirectly in the same or similar business activities or lines of business that we do. In the event that any of these persons or entities acquires knowledge of a potential transaction or matter which may be a corporate opportunity for itself and us, we will not have any expectancy in such corporate opportunity, and these persons and entities will not have any duty to communicate or offer such corporate opportunity to us and may pursue or acquire such corporate opportunity for themselves or direct such opportunity to another person. These potential conflicts of interest could have a material adverse effect on our business, financial condition and results of operations if, among other things, attractive corporate opportunities are allocated by Lone Star to themselves or their other affiliates.
30
Lone Star may also have conflicts of interest with the Company and other stockholders as a result of its status as a party to the tax receivable agreement. For example, the tax receivable agreement entered into with Lone Star at the time of the initial public offering gives us the right to terminate the tax receivable agreement with approval of a majority of our independent directors and with Lone Star’s consent by making a payment equal to the present value of future payments under the tax receivable agreement (based on certain assumptions and deemed events in the agreement, including those relating to our and our subsidiaries’ future taxable income). Lone Star may determine to withhold its consent to terminate the tax receivable agreement at a time when such a termination would be favorable to us and the other stockholders or Lone Star may elect to terminate the tax receivable agreement upon certain changes of control or at any time following the fifteenth anniversary of our initial public offering at a time when such a termination would not be favorable to us and the other stockholders. Furthermore, the tax receivable agreement prohibits us from settling any tax audit without Lone Star’s consent (not to be unreasonably withheld, conditioned or delayed) if the outcome of the audit is reasonably expected to affect Lone Star’s rights under the tax receivable agreement. Therefore, Lone Star may determine to withhold consent to a settlement that reduces the payments Lone Star will receive under the tax receivable agreement, even though the settlement might be favorable to us and our stockholders.
We will be required to pay Lone Star for certain tax benefits, and these amounts are expected to be material.
We have entered into a tax receivable agreement with Lone Star that provides for the payment by us to Lone Star of 90% of the amount of cash savings, if any, in U.S. federal, state, local and non-U.S. income tax that we and our subsidiaries realize (or in some circumstances are deemed to realize) as a result of the utilization of certain tax benefits, together with interest accrued at a rate of London Interbank Offered Rate, or LIBOR, plus 300 basis points from the date the applicable tax return is due (without extension) until paid. These tax benefits, or collectively the Covered Tax Benefits, include: (i) all depreciation and amortization deductions, and any offset to taxable income and gain or increase to taxable loss, resulting from the tax basis that we had in our assets as of the time of our initial public offering, (ii) the utilization of our and our subsidiaries’ net operating losses and tax credits, if any, attributable to periods prior to our initial public offering, (iii) deductions in respect of payments made, funded or reimbursed by Lone Star under the LSF9 Cypress Parent, LLC Long Term Incentive Plan, or LTIP, (iv) deductions in respect of transaction expenses attributable to certain acquisitions made by us prior to our initial public offering, (v) deductions in respect of the debt issuance costs and original issue discount associated with certain of our financing agreements, and (vi) deductions in respect of expenses related to our initial public offering and (vii) certain other tax benefits attributable to payments made under the tax receivable agreement.
We expect that the payments we make under the tax receivable agreement could be substantial. Assuming no material changes in the relevant tax law, and that we and our subsidiaries earn sufficient income to realize the full tax benefits subject to the tax receivable agreement, we currently estimate that future payments under the agreement will aggregate to $135.8 million. This amount excludes any payments that may be made to Lone Star under the tax receivable agreement as a result of tax benefits recognized in connection with payments under the LTIP and, thus, the actual payments we ultimately are required to make under the tax receivable agreement could be greater, potentially materially greater, than these amounts. These payment obligations are our obligations and are not obligations of any of our subsidiaries. Furthermore, these payment obligations are not conditioned upon Lone Star maintaining a continued direct or indirect ownership interest in us. The actual utilization of Covered Tax Benefits as well as the timing of any payments under the tax receivable agreement will vary depending upon a number of factors, including the amount, character and timing of our and our subsidiaries’ taxable income in the future.
We will not be reimbursed for any payments made to Lone Star under the tax receivable agreement in the event that the tax benefits are disallowed.
Lone Star will not reimburse us for any payments previously made under the tax receivable agreement if such benefits are subsequently disallowed upon a successful challenge by the Internal Revenue Service, although future payments under the agreement would be adjusted to the extent possible to reflect the result of such disallowance. As a result, in certain circumstances, payments could be made under the tax receivable agreement in excess of our cash tax savings if any, from the Covered Tax Benefits, and we may not be able to recoup those payments, which could adversely affect our liquidity.
31
In certain cases, payments made by us under the tax receivable agreement may be accelerated and/or significantly exceed the actual benefits we realize in respect of the Covered Tax Benefits.
The term of the tax receivable agreement will continue until all Covered Tax Benefits have been utilized or expired, unless we exercise our right to terminate the agreement with approval of a majority of our independent directors and with Lone Star’s consent, we breach any of our material obligations under the agreement, certain credit events occur with respect to us, Lone Star elects to terminate the tax receivable agreement upon certain changes of control or Lone Star exercises its right after the fifteenth anniversary of our initial public offering to terminate the tax receivable agreement, in any of which cases we will be required to make an accelerated payment to Lone Star equal to the present value of future payments under the tax receivable agreement. Such payment would be based on certain assumptions, including the assumption that we have sufficient taxable income and tax liability to fully utilize all Covered Tax Benefits. The tax receivable agreement also provides that upon certain changes of control, in the event that Lone Star does not elect to terminate the tax receivable agreement, our (or our successor’s) payments under the tax receivable agreement for each taxable year after any such event would be based on certain valuation assumptions, including the assumption that we and our subsidiaries have sufficient taxable income to fully utilize the Covered Tax Benefits. Accordingly, payments under the tax receivable agreement may be made years in advance of the actual realization, if any, of the anticipated future tax benefits and may be significantly greater than the benefits we realize in respect of the Covered Tax Benefits.
Even if the payments under the tax receivable agreement are not accelerated as described above, such payments may be significantly greater than the benefits we realize in respect of the Covered Tax Benefits, due to the manner in which payments are calculated under the tax receivable agreement. For example, for purposes of calculating the payments to be made to Lone Star:
• | it is assumed that we will pay state and local taxes at a rate of 5%, even though our actual effective state and local tax rate may be materially lower; |
• | tax benefits existing at the time of our initial public offering are deemed to be utilized before any post-closing/after-acquired tax benefits and, as a result, we could be required to make payments to Lone Star for a particular tax year even if our tax liability for such year would have been materially reduced or eliminated by reason of our utilization of the post-initial public offering/after-acquired tax benefits; |
• | a non-taxable transfer of assets by us to a non-consolidated entity is treated under the tax receivable agreement as a taxable sale at fair market value and, as a result, we could be required to make payments to Lone Star even though such non-taxable transfer would not generate any actual tax benefits to us or our non-consolidated entity; and |
• | a taxable sale or other taxable transfer of subsidiary stock by us is (in cases where the subsidiary’s tax basis in its assets exceeds our tax basis in the subsidiary’s stock) treated under the tax receivable agreement as a taxable sale of the subsidiary’s assets and, as a result, we could be required to make payments to Lone Star that materially exceed the actual tax benefit we realize from such stock sale. |
Because of the foregoing, our obligations under the tax receivable agreement could have a substantial negative impact on our liquidity and could have the effect of delaying, deferring or preventing certain mergers, asset sales, other forms of business combinations or other changes of control.
32
Certain provisions of the tax receivable agreement limit our ability to incur additional indebtedness, which could adversely affect our business and growth strategy.
For so long as the tax receivable agreement remains outstanding, without the prior written consent of Lone Star (not to be unreasonably withheld, conditioned or delayed), we are restricted from (x) entering into any agreement or amendment, after Lone Star ceases to control the Company, that would materially restrict (or in the case of amendments, further restrict beyond the restrictions in the Company’s existing financing agreements) our ability to make payments under the tax receivable agreement, or (y) unless permitted by the terms of the Indenture and the ABL Credit Agreement or any replacement senior debt document to the extent that the terms thereof are no less restrictive in this regard than the Indenture and the ABL Credit Agreement, incurring debt that would cause our consolidated total leverage ratio (the ratio of consolidated total indebtedness for borrowed money less balance sheet cash to consolidated EBITDA) to exceed 6.00 to 1.00. In addition, we are prohibited under the tax receivable agreement from replacing our existing financing agreements with any senior debt document that does not permit our subsidiaries to make dividends to us to the extent necessary to make the payments under the tax receivable agreement, without conditions, unless Lone Star otherwise consents. These restrictions on the incurrence of debt could adversely affect our business, including by preventing us from pursuing an acquisition or other strategic transaction that we believe is in the best interests of our company and our stockholders, thereby impeding our growth strategy. Lone Star has no fiduciary duties to us when deciding whether to enforce these covenants under the tax receivable agreement. Moreover, these restrictions on amending or refinancing our existing indebtedness could result in a requirement to obtain Lone Star’s consent for any such amendment or refinancing. Furthermore, the provision in the tax receivable agreement that requires that we make an accelerated payment to Lone Star equal to the present value of all future payments due under the tax receivable agreement if we breach any of our material obligations under the agreement or certain credit events occur with respect to us, might make it harder for us to obtain financing from third party lenders on favorable terms.
We would be required to make tax gross-up payments to Lone Star if we consummate a corporate inversion or similar transaction that causes payments under the tax receivable agreement to be subject to withholding taxes.
If we were to consummate a change of control transaction that causes us (or our successor) to become a non-U.S. person (e.g., a corporate inversion transaction), and such transaction causes payments under the tax receivable agreement to become subject to withholding taxes, we would be required under the tax receivable agreement to make tax gross-up payments to Lone Star in respect of such withholding taxes in amounts that may exceed the tax savings realized by the Company from the Covered Tax Benefits. Any such tax gross-up payments could have a negative impact on our liquidity and our ability to finance our growth.
We are a controlled company within the meaning of the NYSE rules and, as a result, will qualify for, and are relying on, exemptions from certain corporate governance requirements.
Lone Star controls a majority of the voting power of our outstanding common stock. As a result, we are a controlled company within the meaning of the corporate governance standards of the NYSE. Under the NYSE rules, a company of which more than 50% of the voting power is held by a person or group is a controlled company and need not comply with certain requirements, including the requirement that a majority of the Board consist of independent directors and the requirements that the compensation and nominating and corporate governance committees be composed entirely of independent directors. We are utilizing and, for so long as Lone Star controls a majority of the voting power of our outstanding common stock, we intend to utilize these exemptions. As a result, among other things, we do not have a majority of independent directors and our compensation and nominating and corporate governance committees do not consist entirely of independent directors. Accordingly, our stockholders will not have the same protections afforded to stockholders of companies that are subject to all of the NYSE corporate governance requirements.
33
Future sales of our common stock in the public market could cause our stock price to fall.
Lone Star beneficially owns approximately 65.4% of our outstanding shares of common stock. All shares held by our affiliates are eligible for resale in the public market, subject to applicable securities laws, including the Securities Act. Therefore, unless shares owned by any of our affiliates are registered under the Securities Act, these shares may only be resold into the public markets in accordance with the requirements of an exemption from registration or safe harbor, including Rule 144 and the volume limitations, manner of sale requirements and notice requirements thereof. Lone Star is an affiliate of ours based on its share ownership and representation on our Board. Pursuant to the terms of a registration rights agreement between Lone Star and us, Lone Star has the right to demand that we register its shares under the Securities Act as well as the right to include its shares in any registration statement that we file with the SEC subject to certain exceptions. Any registration of Lone Star’s shares would enable those shares to be sold in the public market, subject to certain restrictions in the registration rights agreement. Any sale by Lone Star or other affiliates or any perception in the public markets that such a transaction may occur could cause the market price of our common stock to decline materially.
We have filed a registration statement on Form S-8 under the Securities Act registering shares under our stock incentive plan. Subject to the terms of the awards pursuant to which these shares may be granted and except for shares held by affiliates who will be subject to the resale restrictions described above, the shares issuable pursuant to our stock incentive plan will be available for sale in the public market.
We have no present intention to pay dividends on our common stock.
We have no present intention to pay dividends on our common stock. Any determination to pay dividends to holders of our common stock will be at the discretion of our Board and will depend upon many factors, including our financial condition, results of operations, projections, liquidity, earnings, legal requirements, restrictions in our credit facilities and agreements governing any other indebtedness we may enter into and other factors that our Board deems relevant. Accordingly, holders of our common stock may need to sell their shares to realize a return on their investment, and may not be able to sell their shares at or above the price paid for them.
Our ability to raise capital in the future may be limited.
Our business and operations may consume resources faster than we anticipate. In the future, we may need to raise additional funds through the issuance of new equity securities, debt or a combination of both. However, any sale or perception of a possible sale by Lone Star, and any related decline in the market price of our common stock, could impair our ability to raise capital. Separately, additional financing may not be available on favorable terms, or at all. If adequate funds are not available on acceptable terms, we may be unable to fund our capital requirements. If we issue new debt securities, the debt holders would have rights senior to common stockholders to make claims on our assets, and the terms of any debt could restrict our operations, including our ability to pay dividends on our common stock. If we issue additional equity securities, existing stockholders will experience dilution, and the new equity securities could have rights senior to those of our common stock. Because our decision to issue securities in any future offering will depend on market conditions and other factors beyond our control, we cannot predict or estimate the amount, timing or nature of our future offerings. Thus, our stockholders bear the risk of our future securities offerings reducing the market price of our common stock and diluting their interest.
We are a holding company and depend on the cash flow of our subsidiaries.
We are a holding company with no material assets other than the equity interests of our subsidiaries. Our subsidiaries conduct substantially all of our operations and own substantially all of our assets. Consequently, our cash flow and our ability to meet our obligations and pay any future dividends to our stockholders depends upon the cash flow of our subsidiaries and their ability to make payments, directly or indirectly, to us in the form of dividends, distributions and other payments. Any inability on the part of our subsidiaries to make payments to us could have a material adverse effect on our business, financial condition and results of operations.
34
Provisions of our amended and restated governing documents, Delaware law and other documents could discourage, delay or prevent a merger or acquisition at a premium price.
Provisions in our amended and restated certificate of incorporation and amended and restated bylaws may have the effect of delaying or preventing a change of control or changes in our management. For example, our amended and restated certificate of incorporation and amended and restated bylaws include provisions that:
• | permit us to issue, without stockholder approval, preferred stock in one or more series and, with respect to each series, fix the number of shares constituting the series and the designation of the series, the voting powers, if any, of the shares of the series and the preferences and other special rights, if any, and any qualifications, limitations or restrictions, of the shares of the series; |
• | prevent stockholders from calling special meetings; |
• | restrict the ability of stockholders to act by written consent after such time as Lone Star owns less than a majority of our common stock; |
• | limit the ability of stockholders to amend our certificate of incorporation and bylaws; |
• | require advance notice for nominations for election to the Board and for stockholder proposals; |
• | do not permit cumulative voting in the election of our directors, which means that the holders of the majority of our common stock may elect all of the directors standing for election; and |
• | establish a classified board of directors with staggered three-year terms. |
These provisions may discourage, delay or prevent a merger or acquisition of our company, including a transaction in which the acquirer may offer a premium price for our common stock.
Our amended and restated certificate of incorporation includes an exclusive forum clause, which could limit our stockholders’ ability to obtain a favorable judicial forum for disputes with us.
Our amended and restated certificate of incorporation provides that, unless we consent in writing to the selection of an alternative forum, the sole and exclusive forum for any stockholder (including any beneficial owner) to bring (i) any derivative action or proceeding brought on our behalf, (ii) any action asserting a claim of breach of a fiduciary duty owed by any of our directors, officers or employees to us or to our stockholders, (iii) any action asserting a claim arising pursuant to any provision of the DGCL or our certificate of incorporation or bylaws or (iv) any action asserting a claim governed by the internal affairs doctrine, will be a state court located within the State of Delaware (or, if no state court located within the State of Delaware has jurisdiction, the federal district court for the District of Delaware); in all cases subject to such court having personal jurisdiction over the indispensable parties named as defendants. Any person or entity purchasing or otherwise acquiring any interest in shares of our capital stock is deemed to have notice of and consented to the foregoing provisions. The exclusive forum clause may limit our stockholders’ ability to obtain a favorable judicial forum for disputes with us. It is also possible that, notwithstanding such exclusive forum clause, a court could rule that such a provision is inapplicable or unenforceable.
We will incur increased costs and obligations as a result of being a publicly-traded company.
As a company with publicly-traded securities, we are subject to the requirements of the Securities Exchange Act of 1934, as amended, or the Exchange Act, the Sarbanes-Oxley Act, the Dodd-Frank Wall Street Reform and Consumer Protection Act, the listing requirements of the NYSE and other applicable securities rules and regulations. These rules and regulations require that we maintain controls and procedures and disclosure, corporate governance and other practices thereby significantly increasing our legal, financial and other compliance costs as compared to when we were a private company. These obligations will also make other aspects of our business more difficult, time-consuming or costly and increase demand on our personnel, systems and other resources. For example, to maintain and improve the effectiveness of our disclosure controls and procedures and internal control over financial reporting, we will need to commit significant resources, hire additional staff and provide additional management oversight. Furthermore, as a result of disclosure of information in our Exchange Act and other filings required of a public company, our business and financial condition will become more visible, which we believe may give some of our competitors who may not be similarly required to disclose this type of information a competitive advantage. In addition to these added costs and burdens, if we are unable to satisfy our obligations as a public company, we could be subject to delisting of our common stock, fines, sanctions, other regulatory actions and civil litigation, any of which could negatively affect the price of our common stock.
35
Item 1B. Unresolved Staff Comments.
None.
Item 2. Properties.
Our corporate headquarters is in Tustin, California. As of December 31, 2017, our 221 branches, 16 of which we own, were located across 33 states and five Canadian provinces enabling us to serve customers across a nationwide footprint in the United States and Canada.
Number of Branches | |||
Location | SBP | MI | Total |
United States | |||
Arizona | 6 | — | 6 |
California | 10 | — | 10 |
Colorado | 2 | 2 | 4 |
Connecticut | — | 1 | 1 |
Florida | 10 | 6 | 16 |
Georgia | 3 | 4 | 7 |
Idaho | — | 2 | 2 |
Illinois | 7 | 3 | 10 |
Indiana | 10 | 2 | 12 |
Iowa | 4 | — | 4 |
Kansas | 3 | 1 | 4 |
Kentucky | 5 | 1 | 6 |
Louisiana | — | 2 | 2 |
Massachusetts | — | 1 | 1 |
Michigan | 14 | — | 14 |
Minnesota | 3 | — | 3 |
Mississippi | 1 | — | 1 |
Missouri | 4 | 1 | 5 |
Nebraska | 2 | — | 2 |
New Jersey | 2 | 1 | 3 |
New York | — | 3 | 3 |
North Carolina | — | 4 | 4 |
Ohio | 7 | 1 | 8 |
Oklahoma | — | 1 | 1 |
Oregon | — | 3 | 3 |
Pennsylvania | 4 | 3 | 7 |
South Carolina | — | 1 | 1 |
Tennessee | 5 | 2 | 7 |
Texas | 9 | 12 | 21 |
Utah | 4 | 1 | 5 |
Virginia | 5 | — | 5 |
Washington | 5 | 3 | 8 |
36
Number of Branches | |||
Wisconsin | 6 | — | 6 |
Total U.S. | 131 | 61 | 192 |
Canada | |||
Alberta | 8 | 3 | 11 |
British Columbia | 7 | 1 | 8 |
Manitoba | 1 | — | 1 |
Ontario | 7 | — | 7 |
Saskatchewan | 2 | — | 2 |
Total Canada | 25 | 4 | 29 |
Total | 156 | 65 | 221 |
While all branches have access to the full product suite, the sales mix varies across regions due to differences relating to weather and other end market preferences. Some locations distribute multiple products to multiple end markets, while other locations distribute selected products to one end market based on local demand. The warehouse space of our branches ranges from 3,000 to 125,000 square feet with an average of 27,500 square feet.
Item 3. Legal Proceedings.
We are not currently a party to any material legal proceedings. We are, however, subject to lawsuits, government investigations, audits and other legal proceedings from time to time in the ordinary course of our business. It is not possible to predict the outcome of any legal proceeding with any certainty. The outcome or costs we incur in connection with a legal proceeding could adversely impact our operating results and financial position.
Item 4. Mine Safety Disclosure.
Not applicable.
37
PART II
Item 5. Market for Registrant’s Common Equity, Related Stockholder Matters and Issuer Purchases of Equity Securities.
Common Stock
Prior to February 10, 2017, our outstanding common stock was privately held and there was no established public trading market for our common stock. On February 10, 2017, our common stock began trading on the New York Stock Exchange, or NYSE, under the symbol "FBM." As of February 20, 2018, there were two holders of record of our common stock. The range of high and low sale price of our common stock as reported by the NYSE is set forth in the table below:
High | Low | ||||||
Fiscal 2017: | |||||||
First quarter (beginning February 10, 2017) | $ | 17.91 | $ | 15.05 | |||
Second quarter | $ | 17.00 | $ | 16.28 | |||
Third quarter | $ | 14.42 | $ | 14.10 | |||
Fourth quarter | $ | 15.68 | $ | 15.13 | |||
Dividend Policy
We have no present intention to pay cash dividends on our common stock. Any determination to pay dividends to holders of our common stock will be at the discretion of our Board and will depend upon many factors, including our financial condition, results of operations, projections, liquidity, earnings, legal requirements, restrictions in the agreements governing our existing indebtedness and any other indebtedness we may enter into and other factors that our Board deems relevant.
The agreements governing our existing indebtedness contain, and debt instruments that we enter into in the future may contain, covenants that place limitations on the amount of dividends we may pay. In addition, under Delaware law, our Board may declare dividends only to the extent of our surplus, which is defined as total assets at fair market value minus total liabilities, minus statutory capital, or, if there is no surplus, only to the extent of our net profits for the then current and immediately preceding year.
38
Performance Graph
The following graph shows a comparison of cumulative total return to holders of shares of FBM Inc.'s common stock against the cumulative total return of the Russell 2000 Index and S&P 1500 Index from February 10, 2017 (the date our common stock commenced trading on the NYSE) through December 29, 2017 (the last trading day in fiscal 2017). The comparison of the cumulative total returns for each investment assumes that $100 was invested in FBM Inc. common stock and the respective indices on February 10, 2017 through December 29, 2017, including reinvestment of any dividends. Historical share price performance should not be relied upon as an indication of future share price performance.
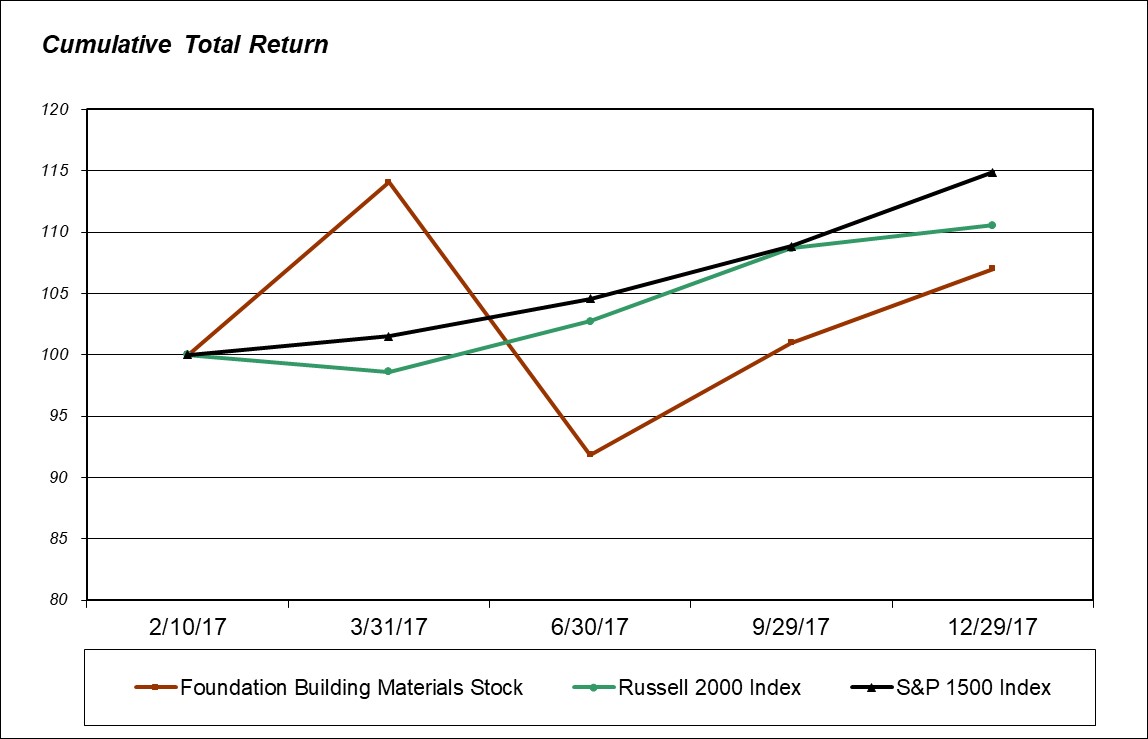
Performance Graph Table ($) | ||||||||||
2/10/2017 | 3/31/2017 | 6/30/2017 | 9/29/2017 | 12/29/2017 | ||||||
Foundation Building Materials | 100.00 | 114.07 | 91.86 | 101.00 | 107.00 | |||||
Russell 2000 Index | 100.00 | 98.62 | 102.72 | 108.69 | 110.56 | |||||
S&P 1500 Index | 100.00 | 101.51 | 104.56 | 108.86 | 114.90 | |||||
This performance graph and related information shall not be deemed "soliciting material" or to be "filed" for purposes of Section 18 of the Exchange Act or otherwise subject to the liabilities under that section, and shall not be deemed to be incorporated by reference into any future filing under the Securities Act or Exchange Act, except to the extent that we specifically incorporate it by reference into such filing.
39
Item 6. Selected Financial Data
The financial information presented below for the years ended December 31, 2017 and 2016 and the period from October 9, 2015 to December 31, 2015 relate to the Successor, and for the period from January 1, 2015 to October 8, 2015 relate to the Predecessor, and is derived from our consolidated financial statements and the notes thereto included in this Annual Report on Form 10-K. Financial information presented below for the year ended December 31, 2014 relates to the Predecessor and is derived from financial statements not included in this Annual Report on Form 10-K. This information should be read in conjunction with Item 7, Management’s Discussion and Analysis of Financial Condition and Results of Operations and the consolidated financial statements and notes thereto included in Item 8, Financial Statements and Supplementary Data of this Annual Report on Form 10-K, to understand fully factors that may affect the comparability of the Predecessor and Successor periods.
The information set forth below is not necessarily indicative of results of future operations, and may not necessarily reflect our financial position, results of operations and cash flows as if we had operated as a stand-alone public company during all periods presented. Accordingly, the historical results should not be relied upon as an indicator of our future performance. As a result of the acquisition of the Predecessor by Lone Star in 2015, or the Lone Star Acquisition, the Predecessor and Successor reporting entities have applied different bases of accounting and are not comparable.
Successor | Predecessor | ||||||||||||||||
Year Ended December 31, 2017 | Year Ended December 31, 2016(1) | October 9, 2015 to December 31, 2015(1) | January 1, 2015 to October 8, 2015 | Year Ended December 31, 2014 | |||||||||||||
(in thousands) | |||||||||||||||||
Consolidated Statement of Operations Data: | |||||||||||||||||
Net sales | $ | 2,060,902 | $ | 1,392,509 | $ | 192,539 | $ | 628,066 | $ | 508,853 | |||||||
Net income (loss) | $ | 82,480 | $ | (28,370 | ) | $ | (7,926 | ) | $ | (29,455 | ) | $ | (1,841 | ) | |||
Income (Loss) per common share: | |||||||||||||||||
Basic | $ | 1.99 | $ | (0.95 | ) | $ | (0.26 | ) | |||||||||
Diluted | $ | 1.99 | $ | (0.95 | ) | $ | (0.26 | ) | |||||||||
Weighted average common shares outstanding (basic): | 41,486 | 29,974 | 29,974 | ||||||||||||||
Weighted average common shares outstanding (diluted): | 41,491 | 29,974 | 29,974 | ||||||||||||||
Balance Sheet Data | |||||||||||||||||
Total assets | $ | 1,354,177 | $ | 1,320,985 | $ | 763,387 | $ | 274,280 | |||||||||
Capital lease obligations, net of current portion | $ | 10,860 | $ | 12,773 | $ | — | $ | — | |||||||||
Asset-based credit facility | $ | 47,486 | $ | 208,469 | $ | — | $ | — | |||||||||
Long-term notes payable | $ | 534,379 | $ | 525,487 | $ | 300,315 | $ | 178,301 | |||||||||
Tax receivable agreement, net of current portion | $ | 119,912 | $ | — | $ | — | $ | — | |||||||||
Other liabilities | $ | 20,598 | $ | 40,232 | $ | 15,428 | $ | 848 | |||||||||
(1) The loss per share data for the year ended December 31, 2016 and Successor period from October 9, 2015 to December 31, 2015, is based on our historical statement of operations after giving effect to the following as if they occurred at the beginning of the period: (1) a reorganization consolidating all entities under a new parent entity (Foundation Building Materials, Inc.); and (2) a 29,974.239 to 1 stock split with respect to the common stock of Foundation Building Materials, Inc. that occurred subsequent to December 31, 2016. See Note 1, Description of Company and Basis of Presentation, to the consolidated financial statements.
40
Item 7. Management's Discussion and Analysis of Financial Condition and Results of Operations
The following discussion and analysis of our financial condition and results of operations should be read in conjunction with our consolidated financial statements and related notes included elsewhere in this Annual Report on Form 10-K. This discussion contains forward-looking statements and involves numerous risks and uncertainties, including, but not limited, to those described in Item 1A, Risk Factors, and elsewhere. Actual results may differ materially from those contained in any forward-looking statements.
Overview
We are the second largest specialty distributor of wallboard and suspended ceiling systems in the United States and Canada, and the fastest growing by sales and branch count since our founding in 2011. We are also the second largest specialty distributor and one of the largest fabricators of commercial and industrial mechanical insulation in the United States. We have expanded from a single branch in Southern California to over 200 branches across North America, carrying a broad array of more than 35,000 SKUs. We have grown sales faster than any U.S. publicly traded building products distributor over the same period. Our goal is to be the leading company within specialty building products distribution and to continue expanding into complementary markets.
We were founded in 2011 by our President and Chief Executive Officer Ruben Mendoza, our Chief Financial Officer John Gorey and one of our Regional Vice Presidents, Tom Fischbeck. Mr. Mendoza previously served as CEO of Acoustical Material Services where he oversaw the successful growth of the company before it was acquired by Allied Building Products in 2007. In founding our company, Mr. Mendoza applied a proven customer-centric operating model to an organization that would combine strong organic growth with an effective acquisition and integration program across a fragmented industry, where he and other members of management had long and close personal relationships with many private acquisition candidates in our industry. In our early years we were focused on opening or acquiring new branches to leverage our founders’ customer focus and strong supplier relationships. In 2012 and 2013, we began rapidly growing through both organic growth and acquisitions, and by the end of 2013, we significantly increased our number of branches and geographic footprint, and expanded from California into the Midwest, Florida and Arizona. This rapid growth resulted in the acquisition of our current ERP platform and information technology structure and added a deep bench of leaders from the acquired companies to prepare for future growth. In addition, in November 2013, we strengthened our management team with the addition of our Chief Operating Officer Pete Welly, who has over 35 years of experience in our industry.
In 2014 and 2015, we expanded into Texas through three acquisitions, and acquired branches in Iowa, Illinois, Wisconsin, Colorado, Kansas, Missouri, Ohio and Pennsylvania. We also increased our market position in California and Arizona with wallboard and metal framing customers. These acquisitions further strengthened our relationship with key suppliers such as Armstrong and USG. Our nationwide presence, as well as our ability to achieve operating efficiencies while leveraging a national purchasing platform, led to favorable margin improvement.
In August 2016, we entered the Canadian market through our acquisition of Winroc-SPI for cash consideration of $314.1 million, subject to customary working capital adjustments, which increased our sales and expanded our relationship with Armstrong. Winroc-SPI’s net sales for the year ended December 31, 2015 were $745.3 million. We also became the second largest specialty distributor and one of the largest fabricators of commercial and industrial mechanical insulation in the United States. The expansion into commercial and industrial insulation products both diversified our customer base and allowed us to capitalize on some of the strengths of our proven operating model given that wallboard distributors and commercial and industrial insulation distributors have similar business models. The Winroc-SPI acquisition strategically opened new markets in both the United States and Canada, added the industry-leading suspended ceiling systems line in additional geographies, and broadened our product offering in many U.S. markets.
Initial Public Offering
On February 15, 2017, we completed our initial public offering of 12,800,000 shares of our common stock at a public offering price of $14.00 per share. Our common stock began trading on the NYSE on February 10, 2017 under the ticker symbol "FBM". After underwriting discounts and commissions and expenses payable by us, net proceeds from the IPO were $164.0 million. We used these proceeds to repay borrowings outstanding under our ABL Credit Facility.
41
Description of Segments
We have two reportable segments. Resources are allocated and performance is assessed by our CEO, whom we have determined to be our Chief Operating Decision Maker, or CODM. Management evaluates performance for each segment based on gross profit. The reportable segments are described below.
Specialty Building Products
Specialty building products, or SBP, distributes wallboard, metal framing, suspended ceiling systems and complementary and other products. Complementary and other products include wallboard accessories, stucco and exterior insulation and finish systems, or EIFS, as well as other offerings, such as tools, safety accessories and fasteners. The primary end markets served are new non-residential, new residential and non-residential repair and remodel construction markets.
Mechanical Insulation
Mechanical insulation, or MI, includes insulation solutions for pipes and mechanical systems and the primary end markets served are new non-residential construction, non-residential repair and remodel construction and industrial markets.
Factors and Trends Affecting Our Business and Results of Operations
General Economic Conditions and Outlook
Demand for our products is impacted by changes in general economic conditions, including, in particular, conditions in the U.S. commercial construction and housing markets. Our end markets are broadly categorized as new non-residential construction, new residential construction, non-residential repair and remodel construction and industrial. We believe each of our end markets is currently in an extended period of recovery following a deep and prolonged recession.
New Non-Residential Construction
Non-residential construction encompasses all construction other than residential structures. Non-residential construction growth is primarily influenced by economic growth, business investment, job growth, vacancy rates and availability and cost of capital. Based on U.S. Census Bureau data, growth in commercial construction spending generally lags new residential spending by approximately 18 months and we believe the commercial construction market remains in the early stages of a recovery. According to Dodge Data & Analytics, non-residential construction starts were 1,112 million square feet in 2017 and would need to increase by 22.6% to achieve the historical annual market average. Given the recent growth in the residential market, management believes that non-residential construction remains in the early stages of its recovery and expects volumes to gain momentum in the coming years in areas such as retail, lodging and healthcare. According to Dodge Data & Analytics, non-residential construction starts are expected to grow at approximately a compound annual growth rate of 4.6% from 2017 to 2019.
New Residential Construction
Job growth is an important factor for a healthy housing market and unemployment has fallen from its peak of 10.0% in 2009 to 4.1% as of December 2017 according to the U.S. Bureau of Labor Statistics. According to the U.S. Bureau of Labor Statistics, total housing starts in 2017 were 1.2 million. While housing starts have significantly recovered from the 0.55 million seen in 2009, they are still 17.3% below the 50-year average of 1.4 million starts per year. National housing affordability has led to higher household formation rates that are up after years of being below the historical trend line.
Non-Residential Repair and Remodel Construction
Non-residential repair and remodeling spending tends to be resilient through economic downturns as new construction spending slows and investments in existing infrastructure increase. From 2013 to 2017 non-residential repair and remodeling starts grew at a 6.7% CAGR and are expected to continue to grow at a 3.5% annual growth rate through 2018 according to Dodge Data & Analytics. The Architectural Billings index also forecasts continued growth, and public construction spending is anticipated to be up modestly in 2018.
42
Industrial
Industrial end markets represent a portion of the U.S. mechanical insulation market. Commercial and industrial insulation products are used in industrial end markets for piping and ducting in facilities. Industrial production is expected to be strong in 2018, while higher energy prices support MRO spending. Management estimates that power generation facilities make up the largest component of the industrial end market. Stable demand for insulation is expected as power generators construct new facilities and expand old ones.
Volume, Costs and Pricing Programs
Our product costs are directly impacted by fluctuations in supplier pricing and our purchasing volume. As one of the leading wallboard, suspended ceiling systems and commercial and industrial insulation distributors in the United States and Canada, we are able to negotiate volume discounts and favorable pricing terms with our suppliers. We have historically realized purchasing synergies almost immediately after an acquisition by taking advantage of our volume discounts. As we have continued to grow, we have negotiated with our suppliers on a national level in an effort to maximize these programs across our entire branch network, and expect to continue this trend in the future.
Acquisitions
We supplement our organic growth strategy with selective acquisitions, and during the year ended December 31, 2017, we completed 10 acquisitions totaling 19 branches. See Note 3, Acquisitions, to the consolidated financial statements. We believe that significant opportunities exist to continue to expand our geographic footprint and product offerings by executing additional strategic acquisitions, and we maintain an extensive and active acquisition pipeline. We are typically evaluating several acquisition opportunities at any given time. In executing our acquisition strategy and integrating acquired companies, we focus on the cost savings we can achieve through integrated procurement and pricing programs and brand consolidation. The 10 acquisitions completed in 2017 contributed approximately $78.4 million of net sales for the twelve months ended December 31, 2017. As of February 26, 2018, all of the acquisitions made through December 31, 2017 have been fully integrated.
Acquisitions | Effective Date of Acquisition | Branch Locations | # of Branches Acquired | |||
Del-Pro Building Supplies, Inc. | November 1, 2017 | Ontario, Canada | 1 | |||
MCS Door & Hardware | October 1, 2017 | TX | 1 | |||
American Wal-Board, LLC, American Materials, LLC, American Drywall & Roofing, LLC and JLS Equipment Leasing, LLC | August 1, 2017 | TN, MS | 2 | |||
Ceiling and Wall Supply, Inc. | July 1, 2017 | MO, IL, KY | 5 | |||
Virginia Builders' Supply, Inc. | July 1, 2017 | VA | 1 | |||
Wallboard, Inc. | May 1, 2017 | MN | 2 | |||
Gypsum Wallboard Supply, Inc. | May 1, 2017 | WA | 1 | |||
Trident Distribution | April 30, 2017 | GA | 1 | |||
Irwin Builders Supply Corporation | April 3, 2017 | PA | 1 | |||
Dominion Interior Supply Corporation and Dominion Interior Supply of Roanoke LLC | January 3, 2017 | VA | 4 | |||
Total | 19 | |||||
As part of our accounting for business combinations, we are required to value inventory acquired in the business combination at its net realizable value. The inventory adjustment is typically fully recognized in cost of goods sold within the first month after completion of an acquisition. This step-up in basis and related expense has a negative effect on margins as the related inventory is sold. For the years ended December 31, 2017, 2016, the period from October 9, 2015 to December 31, 2015 and the period from January 1, 2015 to October 8, 2015, the impact of the acquired step-up in inventory basis to cost of goods sold was $0.8 million, $6.5 million, $7.5 million and $1.6 million, respectively.
43
Seasonality
Our operating results are typically affected by seasonality. Warmer and drier weather during the second and third quarters typically result in higher activity and sales levels. The first and fourth quarters typically have lower levels of activity and lower working capital requirements due to inclement weather conditions.
Basis of Presentation
On October 9, 2015, Lone Star, along with certain members of management, acquired 100% of the outstanding equity of FBM Intermediate Holdings LLC in the Lone Star Acquisition.
The period from January 1, 2015 through October 8, 2015 and the period from October 9, 2015 through December 31, 2015 relate, respectively, to the periods in 2015 preceding and succeeding completion of the Lone Star Acquisition. The terms Predecessor and Successor refer to the pre- and post-Lone Star Acquisition financial position and results of the Company, respectively. Due to the Lone Star Acquisition, the basis of accounting changed and reflects the application of the acquisition method. The new basis of accounting primarily impacted the values of our inventory, long-lived assets and intangible assets, and resulted in increased depreciation and amortization.
Results of Operations
The Year ended December 31, 2017 compared to the Year ended December 31, 2016
The following table summarizes certain consolidated financial information related to our operating results for the periods indicated:
Year Ended December 31, | |||||||||||
2017 | 2016 | ||||||||||
(in thousands) | |||||||||||
Statements of operations data | |||||||||||
Net sales | $ | 2,060,902 | 100.0 | % | $ | 1,392,509 | 100.0 | % | |||
Cost of goods sold | 1,463,041 | 71.0 | % | 995,704 | 71.5 | % | |||||
Gross profit | 597,861 | 29.0 | % | 396,805 | 28.5 | % | |||||
Operating expenses: | |||||||||||
Selling, general and administrative | 461,564 | 22.4 | % | 328,847 | 23.6 | % | |||||
Depreciation and amortization | 76,850 | 3.7 | % | 51,378 | 3.7 | % | |||||
Total operating expenses | 538,414 | 26.1 | % | 380,225 | 27.3 | % | |||||
Income from operations | 59,447 | 2.9 | % | 16,580 | 1.2 | % | |||||
Interest expense | (61,071 | ) | (3.0 | )% | (52,511 | ) | (3.8 | )% | |||
Other income (expense), net | 81,502 | 4.0 | % | (7,172 | ) | (0.5 | )% | ||||
Income (loss) before income taxes | 79,878 | 3.9 | % | (43,103 | ) | (3.1 | )% | ||||
Income tax benefit | (2,602 | ) | (0.1 | )% | (14,733 | ) | (1.1 | )% | |||
Net income (loss) | $ | 82,480 | 4.0 | % | $ | (28,370 | ) | (2.0 | )% | ||
44
The Company’s net sales by segment and major product line, and segment gross profit and gross margin, are as follows:
Year Ended December 31, | Change | |||||||||||||||||
2017 | 2016 | $ | % | |||||||||||||||
(in thousands) | ||||||||||||||||||
SBP Segment | ||||||||||||||||||
Wallboard(1) | $ | 701,467 | 39.2 | % | $ | 525,044 | 40.6 | % | $ | 176,423 | 33.6 | % | ||||||
Suspended ceiling systems | 328,815 | 18.3 | % | 191,964 | 14.8 | % | 136,851 | 71.3 | % | |||||||||
Metal framing | 280,410 | 15.7 | % | 219,994 | 17.0 | % | 60,416 | 27.5 | % | |||||||||
Complementary and other products(1) | 479,422 | 26.8 | % | 356,494 | 27.6 | % | 122,928 | 34.5 | % | |||||||||
Total SBP net sales | $ | 1,790,114 | 100.0 | % | $ | 1,293,496 | 100.0 | % | $ | 496,618 | 38.4 | % | ||||||
MI Segment | ||||||||||||||||||
Commercial and industrial insulation | $ | 206,668 | 76.3 | % | $ | 75,929 | 76.7 | % | $ | 130,739 | 172.2 | % | ||||||
Non-insulation products | 64,120 | 23.7 | % | 23,084 | 23.3 | % | 41,036 | 177.8 | % | |||||||||
Total MI net sales | $ | 270,788 | 100.0 | % | $ | 99,013 | 100.0 | % | $ | 171,775 | 173.5 | % | ||||||
Total net sales | $ | 2,060,902 | $ | 1,392,509 | $ | 668,393 | 48.0 | % | ||||||||||
Gross profit - SBP | $ | 522,189 | $ | 371,715 | $ | 150,474 | 40.5 | % | ||||||||||
Gross profit - MI | 75,672 | 25,090 | 50,582 | 201.6 | % | |||||||||||||
Total gross profit | $ | 597,861 | $ | 396,805 | $ | 201,056 | 50.7 | % | ||||||||||
Gross margin - SBP | 29.2 | % | 28.7 | % | 0.5 | % | ||||||||||||
Gross margin - MI | 27.9 | % | 25.3 | % | 2.6 | % | ||||||||||||
Total gross margin | 29.0 | % | 28.5 | % | 0.5 | % | ||||||||||||
(1) For the year ended December 31, 2017, certain product classification categories have changed. Wallboard accessories have been reclassified from "Wallboard" to "Complementary and other products." All prior periods presented have been reclassified to conform to the current year presentation. | ||||||||||||||||||
Net Sales
Consolidated net sales for the year ended December 31, 2017 were $2,060.9 million compared to $1,392.5 million for the year ended December 31, 2016, representing an increase of $668.4 million, or 48.0%. Net sales from acquired branches and existing branches that were strategically combined contributed $624.0 million of the increase. Base business net sales increased $44.4 million, or 5.8% to $816.0 million, for the year ended December 31, 2017 as compared to the year ended December 31, 2016.
The increase in our base business net sales was primarily driven by the following factors:
• | an increase in wallboard sales of $14.1 million, or 4.3%, due to a wallboard unit volume increase of approximately 1.9% driven by an increase in the commercial and residential end markets, and an increase in average selling price and product mix of 2.4%; |
• | an increase in suspended ceiling systems sales of approximately $11.5 million, or 11.3%, primarily due to increased market share gains in several states; |
• | an increase in metal framing sales of approximately $5.7 million, or 4.1%, primarily due to increased market share gains in several states; and |
• | an increase in complementary and other product sales of $13.2 million, or 6.3%, primarily due to continued product sales growth. |
45
The table below highlights net sales from our base business and acquired and combined branches:
Year Ended December 31, | Change | |||||||||||||
2017 | 2016 | $ | % | |||||||||||
(in thousands) | ||||||||||||||
Base business (1) | $ | 815,987 | $ | 771,571 | $ | 44,416 | 5.8 | % | ||||||
Acquired and combined (2) | 1,244,915 | 620,938 | 623,977 | 100.5 | % | |||||||||
Net sales | $ | 2,060,902 | $ | 1,392,509 | $ | 668,393 | 48.0 | % | ||||||
(1) Represents net sales from branches that were owned by us since January 1, 2016 and branches that were opened by us during such period. | ||||||||||||||
(2) Represents branches acquired and existing branches combined with acquired branches after January 1, 2016. | ||||||||||||||
The table below highlights our changes in base business net sales and net sales from branches acquired and strategically combined by segment and major product line:
Year Ended December 31, 2016 | Base Business Net Sales Increase | Acquired and Combined Net Sales Increase | Year Ended December 31, 2017 | Total Net Sales % Increase | Base Business Net Sales % Increase(1) | Acquired and Combined Net Sales % Increase(2) | |||||||||||||||||
(in thousands) | |||||||||||||||||||||||
Wallboard | $ | 525,044 | $ | 14,085 | $ | 162,338 | $ | 701,467 | 33.6 | % | 4.3 | % | 81.0 | % | |||||||||
Suspended ceiling systems | 191,964 | 11,510 | 125,341 | 328,815 | 71.3 | % | 11.3 | % | 139.3 | % | |||||||||||||
Metal framing | 219,994 | 5,669 | 54,747 | 280,410 | 27.5 | % | 4.1 | % | 66.5 | % | |||||||||||||
Complementary and other products | 356,494 | 13,152 | 109,776 | 479,422 | 34.5 | % | 6.3 | % | 73.5 | % | |||||||||||||
SBP net sales | 1,293,496 | 44,416 | 452,202 | 1,790,114 | 38.4 | % | 5.8 | % | 86.6 | % | |||||||||||||
MI net sales | 99,013 | — | 171,775 | 270,788 | 173.5 | % | — | % | 173.5 | % | |||||||||||||
Total net sales | $ | 1,392,509 | $ | 44,416 | $ | 623,977 | $ | 2,060,902 | 48.0 | % | 5.8 | % | 100.5 | % | |||||||||
Average daily net sales | $ | 5,482 | $ | 200 | $ | 2,496 | $ | 8,178 | 49.2 | % | 6.6 | % | 102.1 | % | |||||||||
(1) Represents base business net sales increase in the year ended December 31, 2017 as a percentage of base business net sales for the year ended December 31, 2016. | |||||||||||||||||||||||
(2) Represents acquired and combined net sales increase in the year ended December 31, 2017 as a percentage of acquired and combined net sales for the year ended December 31, 2016. | |||||||||||||||||||||||
Specialty Building Products. SBP net sales for the year ended December 31, 2017 were $1,790.1 million compared to $1,293.5 million for the year ended December 31, 2016, representing an increase of $496.6 million, or 38.4%. Net sales from acquired branches and existing branches that were strategically combined with acquired branches contributed $452.2 million of the increase, primarily due to the acquisition of Winroc-SPI in August 2016. SBP base business net sales also increased by $44.4 million due to product expansion into new markets and the overall market growth in both the commercial and residential construction markets. The drivers for the increases in net sales of the SBP product categories are consistent with the drivers for consolidated net sales.
Mechanical Insulation. MI net sales for the year ended December 31, 2017 were $270.8 million compared to $99.0 million for the year ended December 31, 2016. We entered the mechanical insulation market as a result of the Winroc-SPI acquisition on August 9, 2016; therefore, there was a shorter period of sales in this segment during the prior year period.
46
Gross Profit and Gross Margin
Consolidated gross profit for the year ended December 31, 2017 was $597.9 million compared to $396.8 million for the year ended December 31, 2016, representing an increase of $201.1 million, or 50.7%. The increase in gross profit was primarily due to the increase in sales volume and contributions from acquisitions. Gross profit from our base business contributed $17.8 million of the increase reflecting a 0.6% margin improvement over the prior year and gross profit from acquired businesses contributed the remaining $183.3 million of the increase reflecting a 1.0% margin improvement. Consolidated gross margin for the year ended December 31, 2017 was 29.0% compared to 28.5% for the year ended December 31, 2016. Gross profit for the year ended December 31, 2017 included a $0.8 million charge for inventory fair value purchase accounting adjustments as compared to $6.5 million for the year ended December 31, 2016. Excluding the effect of these adjustments, gross margin for the years ended December 31, 2017 and 2016 was 29.0% for both years.
Specialty Building Products. SBP gross profit for the year ended December 31, 2017 was $522.2 million compared to $371.7 million for the year ended December 31, 2016, representing an increase of $150.5 million, or 40.5%. SBP gross profit increased with higher sales volume from both acquisitions and base business growth. Gross profit from our base business contributed $17.8 million of the increase reflecting a 0.6% margin improvement over the prior year and gross profit from acquired businesses contributed the remaining $132.7 million of the increase reflecting a 0.8% margin improvement. SBP gross margin for the year ended December 31, 2017 was 29.2% compared to 28.7% for the year ended December 31, 2016. SBP gross profit for the year ended December 31, 2017 included a $0.7 million charge for inventory fair value purchase accounting adjustments as compared to $4.2 million in the year ended December 31, 2016. Excluding the effect of these adjustments, SBP gross margin for the year ended December 31, 2017 was 29.2% as compared to 29.1% for the year ended December 31, 2016. Excluding the effect of the inventory fair value purchase accounting adjustments, the increase in SBP gross margin was primarily due to continued pricing discipline across markets we serve.
Mechanical Insulation. MI gross profit for the year ended December 31, 2017 was $75.7 million compared to $25.1 million for the year ended December 31, 2016, representing an increase of $50.6 million, or 201.6%. MI gross profit increased for the year ended December 31, 2017 as compared to the year ended December 31, 2016 primarily due to the timing of the Winroc-SPI acquisition in August 2016 and not realizing a full year ended of results in the prior year. MI gross margin for the year ended December 31, 2017 was 27.9% compared to 25.3% for the year ended December 31, 2016. MI gross profit for the year ended December 31, 2017 included a $0.1 million charge for inventory fair value purchase accounting adjustments as compared to $2.3 million in the year ended December 31, 2016. Excluding the effect of these adjustments, MI gross margin for the year ended December 31, 2017 was 28.0% as compared to 27.7% for the year ended December 31, 2016. The increase in MI gross margin, excluding the effect of the inventory fair value purchase accounting adjustments, was primarily due to operational efficiencies.
Selling, General & Administrative
Selling, general and administrative, or SG&A, expenses consist of warehouse, delivery and general and administrative expenses. SG&A expenses for the year ended December 31, 2017 were $461.6 million compared to $328.8 million for the year ended December 31, 2016, representing an increase of $132.7 million, or 40.4%. As a percentage of net sales, SG&A expenses were 22.4% for the year ended December 31, 2017 compared to 23.6% for the year ended December 31, 2016. The decrease in SG&A expenses as a percentage of net sales was primarily due to lower transaction costs and improved operating efficiencies.
Depreciation and Amortization
Depreciation and amortization for the year ended December 31, 2017 was $76.9 million compared to $51.4 million for the year ended December 31, 2016, representing an increase of $25.5 million, or 49.6%. The increase in depreciation and amortization was primarily due to the Winroc-SPI acquisition in August 2016, which significantly increased the value of property and equipment and intangible assets subject to depreciation and amortization.
Interest Expense
Interest expense for the year ended December 31, 2017 was $61.1 million compared to $52.5 million for the year ended December 31, 2016, representing an increase of $8.6 million, or 16.3%. The increase in interest expense is due to the senior secured notes, or the Notes, issued for the Winroc-SPI acquisition being outstanding for the full year.
47
Other Income, net
Other income, net for the year ended December 31, 2017 was $81.5 million compared to an expense of $7.2 million for the year ended December 31, 2016. The increase was primarily due to a reduction in our Tax Receivable Agreement, or TRA, liability of $68.0 million and the change in fair value of the embedded derivative of $13.2 million, which represents an early prepayment option of our Notes due 2021. See Note 19, Tax Receivable Agreement, and Note 8, Derivatives and Hedging Activities, of the notes to the consolidated financial statements.
Income Taxes
Our effective tax rate for years ended December 31, 2017 and December 31, 2016 were (3.3%) and 34.2%, respectively. Our tax rates are affected by recurring items, such as non-deductible transaction costs and varying tax rates between the United States and Canada. They are also affected by discrete items that may occur in any given year but are not consistent from year to year. In addition to state income taxes, the items that had the most significant impact on the difference between our statutory U.S. federal income tax rate of 35% and our effective tax rate were the reduction in the corporate income tax rate from 35.0% to 21.0% in the 2017 tax reform legislation, which both significantly reduced our liability under the TRA with our majority stockholder, which resulted in a $68.0 million gain on the write down of the liability that was treated as a non-taxable permanent item and resulted in a 29.8% benefit to the overall effective rate, and the write down of the period-ending deferred tax liability as of December 31, 2017, which resulted in a provisional $9.1 million credit to income tax that gave rise to a provisional 11.4% benefit to the overall effective tax rate. In 2016, non-deductible IPO and acquisition related expenses of $1.5 million resulted in a 3.4% increase to the overall effective tax rate. See Note 5, Income Taxes to the consolidated financial statements.
Year ended December 31, 2016 (Successor)
The following table summarizes certain financial information relating to our operating results for the year ended December 31, 2016.
Successor | |||
Year Ended December 31, 2016 | |||
(in thousands) | |||
Statements of operations data: | |||
Net sales | $ | 1,392,509 | |
Cost of goods sold | 995,704 | ||
Gross profit | 396,805 | ||
Operating expenses: | |||
Selling, general and administrative expenses | 328,847 | ||
Depreciation and amortization | 51,378 | ||
Total operating expenses | 380,225 | ||
Income from operations | 16,580 | ||
Interest expense | (52,511 | ) | |
Other expense, net | (7,172 | ) | |
Loss before income taxes | (43,103 | ) | |
Income tax benefit | (14,733 | ) | |
Net loss | $ | (28,370 | ) |
Net Sales
Net sales were $1,392.5 million for the year ended December 31, 2016. Our base business net sales (net sales from branches that were owned by us since January 1, 2015 and branches that were opened by us during such period) increased $49.7 million, or 9.3%, from $532.8 million to $582.5 million period over period.
48
The table below highlights net sales from our base business and acquired and combined branches:
(in thousands) | |||
Net sales for the year ended December 31, 2015 | $ | 820,605 | |
Increase (decrease) in net sales due to: | |||
Base business net sales(1) | 49,673 | ||
Acquired and combined(2) | 522,231 | ||
Net sales for the year ended December 31, 2016 | $ | 1,392,509 | |
(1) | Represents net sales from branches that were owned by us since January 1, 2015 and branches that were opened by us during such period. |
(2) | Represents branches acquired and existing branches combined with acquired branches after January 1, 2015. |
Specialty Building Products. Net sales were $1,293.5 million for the year ended December 31, 2016, which were driven by the overall market growth in both the commercial and residential construction markets and our increased market share in 2016 versus 2015. Winroc-SPI, which was acquired in August 2016, contributed $193.9 million to the SBP segment. Wallboard accounted for the majority of SBP sales for the year ended December 31, 2016.
Mechanical Insulation. Net sales were $99.0 million for the year ended December 31, 2016. We entered the mechanical insulation market as a result of the Winroc-SPI acquisition on August 9, 2016, therefore, net sales reflects sales from the acquisition date to December 31, 2016.
Cost of Goods Sold
Cost of goods sold was $995.7 million, or 71.5% of net sales, for the year ended December 31, 2016. Cost of goods sold was negatively impacted by $6.5 million of inventory fair value adjustments related to our acquisitions. Excluding the fair value adjustments, cost of goods sold was 71.0% of net sales. Cost of goods sold was impacted by favorable pricing terms with our suppliers as a result of increased purchase volumes.
Specialty Building Products. Cost of goods sold was 71.3% of net sales for the year ended December 31, 2016. Cost of goods sold was positively impacted by favorable pricing terms with our suppliers as a result of increased purchase volumes. Cost of goods sold was negatively impacted by $4.2 million of inventory fair value adjustments related to our acquisitions. Excluding these fair value adjustments, cost of goods sold was 70.9% of sales.
Mechanical Insulation. Cost of goods sold was 74.7% of net sales for the year ended December 31, 2016.
Gross Profit
Gross profit was $396.8 million, or 28.5% of sales, for the year ended December 31, 2016. Gross profit and gross margin were negatively impacted by $6.5 million of inventory fair value adjustments related to our acquisitions. Excluding these fair value adjustments, gross profit was $403.3 million and gross margin was 29.0% of sales. Gross margin was also impacted by favorable pricing terms with our suppliers as a result of increased purchase volumes relative to 2015.
Specialty Building Products. Gross margin was 28.7% for the year ended December 31, 2016. Gross margin was impacted by favorable pricing terms with our suppliers as a result of increased purchase volumes relative to 2015. Gross profit and gross margin were negatively impacted by $4.2 million of inventory fair value adjustments related to our acquisitions. Excluding these fair value adjustments, gross margin was 29.1% of sales.
Mechanical Insulation. Gross margin was 25.3% for the year ended December 31, 2016.
49
Selling, General & Administrative
SG&A expenses were $328.8 million for the year ended December 31, 2016. SG&A expenses were impacted by warehousing and delivery costs driven by increased net sales and acquired branches. Payroll related and other expenses also increased due to our continued investment in infrastructure and support of our operations. We also incurred expenses as a result of our initial public offering and other transaction costs of $23.2 million. ERP system implementation costs for the year were $3.9 million.
Depreciation and Amortization
Depreciation and amortization was $51.4 million for the year ended December 31, 2016, which was affected by an increase in property and equipment and intangible assets as a result of the acquisitions in 2015 and 2016. Additionally, the historical cost basis of property and equipment and intangible assets was increased to fair value as a result of the Lone Star Acquisition.
Interest Expense
Interest expense was $52.5 million for the year ended December 31, 2016, due to outstanding indebtedness related to acquisitions and funding of working capital. In addition, we incurred a loss of $7.0 million related to the refinancing of the 2015 asset-based lending credit facility, or the 2015 Credit Facility, in August 2016.
Other Expense, net
Other expense, net was $7.2 million for the year ended December 31, 2016, primarily due to the $7.1 million change in fair value of the early prepayment option of our Notes.
Income Tax Benefit
An income tax benefit of $14.7 million was recorded for the year ended December 31, 2016, which represents an effective tax rate of 34.2%.
Period from October 9, 2015 to December 31, 2015 (Successor)
The following table summarizes certain financial information relating to our operating results for the period from October 9, 2015 to December 31, 2015:
Successor | |||
(in thousands) | October 9, 2015 to December 31, 2015 | ||
Statements of operations data: | |||
Net sales | $ | 192,539 | |
Cost of goods sold | 143,333 | ||
Gross profit | 49,206 | ||
Operating expenses: | |||
Selling, general and administrative expenses | 47,660 | ||
Depreciation and amortization | 7,170 | ||
Total operating expenses | 54,830 | ||
Loss from operations | (5,624 | ) | |
Interest expense | (7,044 | ) | |
Other income, net | 9 | ||
Loss before income taxes | (12,659 | ) | |
Income tax benefit | (4,733 | ) | |
Net loss | $ | (7,926 | ) |
50
Net Sales
Net sales were $192.5 million, all from the SBP segment, which primarily consisted of wallboard and accessories.
Cost of Goods Sold
Cost of goods sold was $143.3 million, which included $7.5 million of inventory fair value adjustments, and resulted in gross profit of $49.2 million, or gross margin of 25.6%. Excluding inventory fair value adjustments, gross margin was 29.4%.
Selling, General & Administrative
SG&A expenses were $47.7 million, and represented 24.8% of net sales. Acquisition related expenses were $3.5 million and include costs related to legal, accounting and other professional services.
Depreciation and Amortization
Depreciation and amortization was $7.2 million, and represented 3.7% of net sales. Depreciation and amortization includes the impact of the step up in fair value as a result of the Lone Star Acquisition in October 2015.
Interest Expense
Interest expense was $7.0 million as a result of our outstanding indebtedness, which includes the debt incurred to finance the Lone Star Acquisition.
Income Tax Benefit
Income tax benefit was $4.7 million. As of October 9, 2015, we were considered a C-corporation for tax purposes while for periods prior to such date we had subsidiaries that were either nontaxable limited liability companies or taxable C-corporations. The effective tax rate for the period was 37.4%, which differs from the statutory rate primarily due to state taxes.
Period from January 1, 2015 to October 8, 2015 (Predecessor)
The following table summarizes certain financial information relating to our operating results for the period from January 1, 2015 to October 8, 2015:
Predecessor | |||
(in thousands) | January 1, 2015 to October 8, 2015 | ||
Statements of operations data: | |||
Net sales | $ | 628,066 | |
Cost of goods sold | 452,909 | ||
Gross profit | 175,157 | ||
Operating expenses: | |||
Selling, general and administrative expenses | 171,215 | ||
Depreciation and amortization | 15,615 | ||
Total operating expenses | 186,830 | ||
Loss from operations | (11,673 | ) | |
Interest expense | (19,090 | ) | |
Other income, net | 14 | ||
Loss before income taxes | (30,749 | ) | |
Income tax benefit | (1,294 | ) | |
Net loss | $ | (29,455 | ) |
51
Net Sales
Net sales were $628.1 million, all from the SBP segment, which primarily consisted of wallboard and accessories.
Cost of Goods Sold
Cost of goods sold was $452.9 million, which included $1.6 million of inventory fair value adjustments, and resulted in gross profit of $175.2 million, or gross margin of 27.9%. Excluding inventory fair value adjustments, gross margin was 28.1%.
Selling, General & Administrative
SG&A expenses were $171.2 million and represented 27.3% of net sales. Acquisition related expenses were $39.7 million and represents acquisition activity including the Lone Star Acquisition.
Depreciation and Amortization
Depreciation and amortization was $15.6 million, and represented 2.5% of net sales. Depreciation and amortization includes the impact of the addition of property and equipment and intangible assets acquired.
Interest Expense
Interest expense was $19.1 million as a result of our outstanding indebtedness.
Income Tax Benefit
Income tax benefit was $1.3 million and reflected the fact that we had subsidiaries that were either nontaxable limited liability companies or taxable C-corporations.
Liquidity and Capital Resources
Summary
We depend on cash flow from operations, cash on hand and funds available under our ABL Credit Facility, and in the future may depend on other debt financings allowed under the terms of the Indenture and ABL Credit Agreement and equity financings, to finance our acquisition strategy, working capital needs and capital expenditures. We believe that these sources of funds will be adequate to fund debt service requirements and provide cash, as required, to support our strategy, ongoing operations, capital expenditures, lease obligations and working capital for at least the next twelve months. However, we cannot ensure that we will be able to obtain future debt or equity financings adequate for our future cash requirements on commercially reasonable terms or at all. The tax receivable agreement may also have a negative impact on our liquidity if, among other things, payments we make under the tax receivable agreement exceed the actual cash savings we and our subsidiaries realize in respect of the tax benefits covered by the tax receivable agreement after we have paid our taxes and other obligations. In addition, as a result of either an early termination of the tax receivable agreement or a change of control, we could be required to make payments under the agreement that exceed our actual cash savings under the tax receivable agreement. In these situations, our obligations under the tax receivable agreement could have a substantial negative impact on our liquidity and could have the effect of delaying, deferring or preventing, among other things, capital expenditures and acquisitions.
52
If our cash flows and capital resources are insufficient to fund our debt service obligations, we may be forced to reduce or delay additional acquisitions, future investments and capital expenditures, seek additional capital, restructure or refinance our indebtedness, including the Notes, or sell assets. Significant delays in our ability to finance planned acquisitions or capital expenditures may materially and adversely affect our future sales prospects. In addition, we cannot assure you that we will be able to refinance any of our indebtedness, including the Notes and our ABL Credit Facility, on commercially reasonable terms or at all. Our ability to restructure or refinance our debt will depend on the condition of the capital markets and our financial condition at such time. Our tax receivable agreement requires that, after Lone Star no longer controls us, any senior debt document that refinances or replaces our existing indebtedness permit our subsidiaries to make dividends to us, without any conditions, to the extent required for us to make its payments under the tax receivable agreement, unless Lone Star otherwise consents. At the time of any such refinancing, it may not be possible to include this term in such senior debt documents, and as a result, we may need Lone Star’s consent to complete such refinancing. The ABL Credit Agreement and the Indenture restrict our ability to enter into certain asset sales transactions. We may not be able to consummate those asset sales to raise capital or sell assets at prices that we believe are fair, and proceeds that we do receive may not be adequate to meet any debt service obligations then due.
As of December 31, 2017, we had available aggregate undrawn borrowing capacity of approximately $252.5 million under the ABL Credit Facility. For the periods presented, our use of cash was primarily driven by our investing activities, specifically our investments in acquisitions.
Cash Flows
A summary of net cash provided by, or used in, operating, investing and financing activities is shown in the following table.
Successor | Successor | Predecessor | ||||||||||||
Year Ended December 31, 2017 | Year Ended December 31, 2016 | October 9, 2015 to December 31, 2015 | January 1, 2015 to October 8, 2015 | |||||||||||
(in thousands) | ||||||||||||||
Net cash provided by operating activities | $ | 77,261 | $ | 33,130 | $ | 17,610 | $ | 19,176 | ||||||
Net cash used in investing activities | $ | (96,938 | ) | $ | (431,805 | ) | $ | (660,323 | ) | $ | (97,266 | ) | ||
Net cash provided by financing activities | $ | 2,842 | $ | 416,657 | $ | 642,682 | $ | 86,567 | ||||||
Operating Activities
Net cash provided by operating activities consists primarily of net income (loss) adjusted for non-cash items, including depreciation and amortization, provision for doubtful accounts, deferred income taxes and the effects of changes in working capital.
Net cash provided by operating activities increased by $44.2 million to $77.3 million for the year ended December 31, 2017 as compared to $33.1 million in the same period in 2016. The increase was primarily due to an increase in net income of $110.9 million, higher depreciation and amortization of $25.5 million due to an increase in fixed assets and intangibles as a result of acquisitions, higher amortization of debt issuance costs of $4.0 million related to higher levels of debt as a result of acquisitions and changes in deferred income taxes of $11.6 million due to new tax legislation, partially offset by a reduction in the TRA liability of $68.0 million due to new tax legislation, higher working capital expenditures of $9.9 million, increased unrealized gains related to the change in fair value of our derivatives of $20.0 million, lower inventory fair value adjustments of $5.7 million due to the lower value of acquisitions and lower losses on the extinguishment of debt of $5.4 million.
Net cash provided by operating activities for the year ended December 31, 2016, consisted of a net loss of $28.4 million, offset by non-cash items of $61.8 million of which $51.4 million was depreciation and amortization. Cash used for working capital was $0.3 million.
Net cash provided by operating activities for the period from October 9, 2015 to December 31, 2015, consisted of a net loss of $7.9 million, offset by non-cash items of $22.4 million, of which $7.2 million was depreciation and amortization, $7.5 million related to fair value inventory adjustments and $6.5 million related to deferred taxes. Cash provided by working capital was $3.2 million.
53
Net cash provided by operating activities for the period from January 1, 2015 to October 8, 2015, consisted of a net loss of $29.5 million, partially offset by non-cash items of $20.5 million, of which $15.6 million was depreciation and amortization. Cash provided by working capital was $28.1 million.
Investing Activities
Net cash used in investing activities consists primarily of acquisitions and capital expenditures, including purchases of land, buildings, leasehold improvements, fleet assets, information technology and other equipment. Capital expenditures vary depending on prevailing business factors, including current and anticipated market conditions. Historically, capital expenditures generally have been made at relatively low levels in comparison to the operating cash flows generated during the corresponding periods.
Net cash used in investing activities decreased by $334.9 million to $96.9 million for the year ended December 31, 2017, as compared to $431.8 million in the same period in 2016. The decrease was primarily due to a lower aggregate purchase price of acquisitions of $324.0 million and net proceeds related to net working capital adjustments from acquisitions of $8.2 million.
Net cash used in investing activities was $431.8 million for the year ended December 31, 2016. During the year ended December 31, 2016, we acquired Winroc-SPI, Ken Builder Supply, Inc., or Ken API, Kent Gypsum Supply, Co., Mid America Drywall Supply, Inc. and United Drywall Supply for aggregate consideration of $401.9 million. Cash used for capital expenditures was $30.5 million.
Net cash used in investing activities for the 2015 Successor period was $660.3 million and primarily related to $549.3 million used in the Lone Star Acquisition and $103.2 million to acquire Gypsum Supply Co., or GSCIL. Cash used for capital expenditures was $2.8 million.
Net cash used in investing activities for the 2015 Predecessor period was $97.3 million and primarily related to $87.5 million used to acquire Oxnard Building Materials, Inc., Great Western Building Materials, Inc. and ProWall Building Products, Inc. (collectively, "Great Western"). Cash used for capital expenditures was $9.8 million.
Financing Activities
Net cash provided by, or used in, financing activities consists primarily of borrowings and related repayments under our financing agreements and proceeds from capital contributions.
Net cash provided by financing activities decreased by $413.8 million to $2.8 million in the year ended December 31, 2017 as compared to $416.7 million in the same period in 2016. During the year ended December 31, 2017, IPO proceeds of $164.0 million were used for debt repayments, compared to net borrowings of $350.5 million during the year ended December 31, 2016.
Net cash provided by financing activities was $416.7 million for the year ended December 31, 2016. Net borrowings of $350.5 million and capital contributions of $66.2 million were used to finance the acquisitions made in 2016 and fund operations.
Net cash provided by financing activities for the 2015 Successor period was $642.7 million, and primarily consisted of net borrowings of $379.8 million to finance the Lone Star Acquisition and capital contributions of $272.9 million, offset by $10.0 million in debt repayments.
Net cash provided by financing activities for the 2015 Predecessor period was $86.6 million was primarily due to financing related to the Great Western acquisition.
54
Contractual Obligations
The following table summarizes our significant contractual obligations as of December 31, 2017. Some of the amounts included in the table are based on management’s estimates and assumptions about these obligations, including their duration, the possibility of renewal, anticipated actions by third parties and other factors. Because these estimates and assumptions are necessarily subjective, our actual payments may vary from those reflected in the table.
(in thousands) | 2018 | 2019 | 2020 | 2021 | 2022 | Thereafter | Total | ||||||||||||||||||||
Long-term debt | $ | — | $ | — | $ | — | $ | 575,000 | $ | — | $ | — | $ | 575,000 | |||||||||||||
TRA liability(1) | 15,892 | 12,174 | 11,217 | 10,848 | 9,747 | 75,926 | 135,804 | ||||||||||||||||||||
Interest | 47,438 | 47,438 | 47,438 | 46,647 | — | — | 188,961 | ||||||||||||||||||||
Operating leases | 33,071 | 24,866 | 18,997 | 15,412 | 10,214 | 22,080 | 124,640 | ||||||||||||||||||||
Capital leases | 3,004 | 2,939 | 2,816 | 2,369 | 1,456 | 1,236 | 13,820 | ||||||||||||||||||||
Total Commitments | $ | 99,405 | $ | 87,417 | $ | 80,468 | $ | 650,276 | $ | 21,417 | $ | 99,242 | $ | 1,038,225 | |||||||||||||
(1) The TRA liability at December 31, 2017 was $135.8 million. The first payment in the amount of $15.9 million under the TRA will be made in the fourth quarter of 2018 based on the Company's 2017 tax returns. Payments related to the TRA are expected to be funded through one, or a combination of the following: existing cash balances, cash flow from operations, or availability under the ABL Credit Agreement. The discounted present value of the TRA at December 31, 2017, was estimated to be between $85.0 million and $95.0 million. | |||||||||||||||||||||||||||
We lease certain facilities and equipment under various operating lease agreements with expiration dates through 2026. These lease agreements typically contain renewal options of five to ten years. Additionally, with the acquisitions of Winroc-SPI and Ken API in 2016, we assumed capital lease obligations with lease terms ranging from five to 15 years.
ABL Credit Facility
On August 9, 2016, we entered into the ABL Credit Agreement providing for the ABL Credit Facility, a senior secured asset-based revolving credit facility, and on September 23, 2016, we entered into an incremental facility amendment to the ABL Credit Facility, increasing the size of the revolving commitments thereunder by $50.0 million. The ABL Credit Facility provides for a $300.0 million revolving credit facility and matures on February 9, 2021. The ABL Credit Facility includes an option to further increase the maximum commitments up to an aggregate amount not to exceed the greater of (i) $50.0 million and (ii) such amount as would not cause the total revolving credit commitments under the ABL Credit Facility to exceed the aggregate borrowing base under the ABL Credit Facility by more than $50.0 million, in each case as of the date of such incurrence, subject to the conditions set forth in the ABL Credit Agreement.
Interest on borrowings under the ABL Credit Facility accrues at a rate equal to LIBOR or Canadian Dollar Offered Rate, or CDOR (as applicable, based on the currency of the borrowing), plus a margin of 1.25% to 1.75% based on average daily excess availability for the most recent fiscal quarter, or if selected by the borrower, ABR or the Canadian prime rate (as applicable, based on the currency of the borrowings) plus a margin of 0.25% to 0.75% based on average daily excess availability for the most recent fiscal quarter, in all such cases subject to an additional 2.0% on overdue amounts during certain default events.
55
The ABL Credit Agreement contains customary covenants, representations and warranties and events of default, including covenants which generally restrict our business and limit our ability to, among other things: dispose of certain assets; incur or guarantee additional indebtedness; enter into new lines of business; make certain investments, intercompany loans or payments in respect of indebtedness; incur or maintain liens; modify certain terms of our or their organizational documents, certain agreements or certain debt instruments; declare or pay dividends or make other restricted payments (including redemption of our stock); engage in certain transactions with affiliates; enter into certain sale leaseback transactions; modify the terms of certain of our existing contractual agreements; and engage in mergers, consolidations or the sale or disposition of substantially all of its assets. The ABL Credit Agreement also includes representations and warranties which we must be able to make in order to obtain borrowings under the ABL Credit Facility, and a financial maintenance covenant and events of default related to, among other things: the non-payment of principal, interest or fees; violations of covenants; material inaccuracy of representations or warranties; failure to timely deliver a borrowing base certificate; certain bankruptcy events; certain events under the Employee Retirement Income Security Act of 1974, as amended; invalidity of guarantees or security interests; default in payment under or the acceleration of other indebtedness; material judgments; and certain change of control events, each of which could result in the facility being terminated and any outstanding debt becoming due prior to its scheduled maturity. The financial maintenance covenant under the ABL Credit Agreement is a minimum fixed charge coverage ratio test set at a level of 1.00:1.00, which is based in part on our adjusted EBITDA as calculated pursuant to the ABL Credit Agreement. At December 31, 2017, the fixed charge coverage ratio exceeded the minimum requirement. This covenant is only tested at times when availability under the ABL Credit Facility is less than a certain threshold, which was $30.0 million at December 31, 2017. We were in compliance with all covenants under the ABL Credit Agreement as of December 31, 2017.
As of December 31, 2017, the majority of our liquidity was from the $252.5 million available under the ABL Credit Facility. The fixed charge coverage ratio is a material term of the ABL Credit Agreement and we believe information about how the covenant is calculated is material to an investor’s understanding of the Company’s financial condition and liquidity.
Should we not comply with the fixed charge coverage ratio, we would be in technical default of our ABL Credit Facility which could result in the facility being terminated and any outstanding debt becoming due prior to its scheduled maturity. Should all amounts become due immediately, we may be unable to pay all amounts due under the ABL Credit Facility without a material impact to our business, as we may be forced to liquidate assets to pay for all amounts due under the ABL Credit Facility.
Notes
In August 2016, we completed a private offering of $575.0 million in aggregate principal amount of Notes. In the offering we received net proceeds of approximately $563.5 million, which were used in part to repay and terminate the 2015 Credit Facility. The Notes carry a coupon of 8.25% per annum and mature August 15, 2021. The Indenture contains customary covenants, representations and warranties and events of default, including covenants which generally restrict our business and limit our ability to incur additional indebtedness, issue certain preferred shares, pay dividends, redeem our stock or make other distributions, make certain investments, limit the ability of our restricted subsidiaries to pay dividends to us or make other intercompany transfers, create liens, sell or transfer certain assets, engage in certain transactions with respect to all or substantially all of our assets, enter into certain transactions with affiliates and designate subsidiaries as unrestricted subsidiaries. The Indenture also contains events of default related to, among other things: the non-payment of principal, premium or interest on any Note; violations of any agreement or obligation contained in the Indenture and related documents; certain bankruptcy events; invalidity of guarantees or security interests; default in payment under or the acceleration of other indebtedness; and material judgments, any of which could result in the trustee for the Notes declaring the principal of the Notes together with all accrued and unpaid interest thereon to be immediately due and payable. We were in compliance with all covenants under the Indenture as of December 31, 2017.
Off-Balance Sheet Arrangements
As of December 31, 2017, and December 31, 2016, we had no material off-balance sheet arrangements or similar obligations, such as financing or unconsolidated variable interest entities.
56
Critical Accounting Policies
Our management’s discussion and analysis of our financial condition and results of operations is based on our consolidated financial statements, which have been prepared in accordance with generally accepted accounting principles in the United States, or GAAP. The preparation of these financial statements requires management to make estimates and assumptions that affect the reported amounts of assets and liabilities, disclosure of contingent assets and liabilities at the date of the financial statements and the reported amounts of sales and expenses during the reported period.
On an ongoing basis, management evaluates its estimates, including those related to revenue recognition, allowance for doubtful accounts, inventories, taxes, and goodwill. We base our estimates and judgments on historical experience and on various other factors that we believe to be reasonable under the circumstances, the results of which form the basis for making judgments about the carrying values of assets and liabilities that are not readily apparent from other sources. Actual results may materially differ from these estimates under different assumptions or conditions.
Use of Estimates
The preparation of financial statements in conformity with GAAP requires management to make estimates and assumptions that affect the reported amounts of assets and liabilities and disclosure of contingent assets and liabilities as of the date of the financial statements and the reported amounts of sales and expenses during the reporting period. Estimates that are more susceptible to change in the near term are the allowance for doubtful accounts, the allowance for excess and obsolete inventory and recoverability of long-lived assets. Actual results could materially differ from those estimates.
Revenue Recognition
We recognize revenue when the risks and obligations of ownership have been transferred to the customer, which generally occurs at the time of delivery to the customer. At the time that revenue is recognized we record reductions in sales for customer rebates and discounts including volume, cash and other discounts. Rebates and discounts are recorded based on management’s best estimate when products are sold based on historical experience for similar programs and products. Management reviews these rebates and discounts on an ongoing basis and the related accruals are adjusted, if necessary, as additional information becomes available. Historically, our actual customer rebates and discounts have not been materially different from management’s original estimates.
Accounts Receivable
We sell to customers using credit terms customary in our industry. Accounts receivables are recorded at net realizable value. This value includes an appropriate allowance for estimated uncollectible accounts to reflect any loss anticipated on the trade accounts receivable balances and charged to the provision for doubtful accounts. The allowance for doubtful accounts reflects our estimate of credit exposure, determined principally on the basis of our collection experience, aging of our receivables and significant individual account credit risk. If the actual uncollected amounts significantly exceed the estimated allowance, our operating results would be significantly adversely affected.
Other Receivables
Other receivables primarily consist of vendor rebates receivables. Typical arrangements with vendors provide for us to receive a rebate of a specified amount after achieving any of a number of measures generally related to the volume of purchases over a period of time. We record these rebates to effectively reduce the cost of sales in the period in which the product is sold. Throughout the year, our estimates include the amount of rebates receivable for the vendor programs based on the expected level of purchases. We accrue for vendor rebates earned based on purchase volumes and adjust inventories to reflect the reduction in the cost basis for inventories purchased that are subject to vendor rebates. Historically, our actual vendor rebates have not been materially different from management’s original estimates.
Inventories
Inventories, consisting substantially of finished goods, are valued at the lower of cost or market (net realizable value). Cost is determined using the moving weighted-average cost method. We routinely evaluate inventory for excess or obsolescence and consider factors such as historical usage and purchase rates and record a provision for excess and obsolete inventory. If we determine that a smaller or larger reserve is appropriate, we will record a credit or a charge to cost of sales in the period in which we make such a determination.
57
Impairment of Long-Lived Assets
We review property and equipment for impairment when events or circumstances indicate these assets may not be recoverable. Factors considered include significant underperformance relative to expected historical or projected future operating results, significant changes in the manner of use of the acquired assets or the strategy for the overall business and significant negative industry or economic trends. In performing the review for recoverability, future cash flows expected to result from the use of the asset and its eventual disposition are estimated. If the sum of expected future undiscounted cash flows is less than the carrying amount of the asset, an impairment loss is recorded for the amount by which the carrying amount exceeds the estimated fair value. We use our best judgment based on current facts and circumstances related to its business when making these estimates.
Intangible Assets and Goodwill
Intangible assets consist of tradenames, customer relationships and favorable and unfavorable leases under market rent, and are amortized using the straight-line method, which reflects the pattern in which the economic benefits of the assets are expected to be consumed. Intangible assets with definite lives are amortized over their respective estimated useful lives. For favorable and unfavorable leases under market rent, amounts are amortized over their contractual terms.
We review intangible assets with finite lives for impairment when events or circumstances indicate these assets may not be recoverable. In performing the review for recoverability, future cash flows expected to result from the use of the asset are estimated. If the sum of expected future undiscounted cash flows is less than the carrying amount of the asset, an impairment loss is recorded for the amount by which the carrying amount exceeds the estimated fair value.
Goodwill represents the excess of purchase price over fair value of assets acquired and liabilities assumed in a business combination.
We perform our impairment test annually at the reporting unit level or more frequently if impairment indicators arise. We have defined our reporting units consistently with our operating segments. For our goodwill impairment assessment we have adopted a standard that provides us the option to first assess qualitative factors to determine whether the existence of events or circumstances leads to a determination that it is more likely than not (greater than 50 percent chance) that the fair value of a reporting unit is less than its carrying amount. Such qualitative factors may include the following: macroeconomic conditions; industry and market considerations; cost factors; overall financial performance; consistency of customer base; and other relevant entity-specific events. In the absence of sufficient qualitative factors, goodwill impairment is determined utilizing a two-step process. This process involves comparing the fair value to the carrying value of the reporting unit. If the carrying value of the net assets assigned to the reporting unit exceeds the fair value of the reporting unit, then we must determine the implied fair value of the reporting unit’s goodwill and compare it to the carrying value of the reporting unit’s goodwill. We determine the fair value of its reporting units using combinations of both the income and market valuation approaches.
During 2017, we performed our annual impairment assessment of goodwill, which did not indicate that an impairment existed.
Acquisition Accounting
We account for business combinations using the purchase method, which requires us to allocate the cost of an acquired business to the acquired assets and liabilities based on their estimated fair values at the acquisition date. We recognize the excess of an acquired business’s cost over the fair value of the acquired assets and liabilities as goodwill. Determining the fair value of certain assets and liabilities acquired is judgmental in nature and often involves the use of significant estimates and assumptions. We use a variety of information sources to determine the fair value of acquired assets and liabilities and we generally use third party appraisers to assist us in the determination of the fair value and useful lives of identifiable intangible assets.
58
Income Taxes
We use the asset and liability method of accounting for income taxes. Under this method, we recognize income tax expense for the amount of taxes payable or refundable for the current year and for the amount of deferred tax liabilities and assets for the future tax consequences of events that have been recognized in our financial statements or tax returns. We make assumptions, judgments and estimates to determine our current provision for income taxes, our deferred tax assets and liabilities, and our uncertain tax positions. Our judgments, assumptions and estimates relative to the current provision for income tax take into account current tax laws, our interpretation of current tax laws and possible outcomes of current and future audits conducted by foreign and domestic tax authorities. Changes in tax law or our interpretation of tax laws and the resolution of current and future tax audits could significantly affect the amounts provided for income taxes in our consolidated financial statements. Our assumptions, judgments and estimates relative to the value of a deferred tax asset take into account predictions of the amount and category of future taxable income. Actual operating results and the underlying amount and category of income in future years could cause our current assumptions, judgments and estimates of recoverable net deferred taxes to be inaccurate. Changes in any of the assumptions, judgments and estimates mentioned above could cause our actual income tax obligations to differ from our estimates, which could materially affect our financial position and results of operations. Our tax provision for interim periods is determined using an estimate of our annual effective tax rate, adjusted for discrete items, if any, that are taken into account in the relevant period. As the calendar year progresses, we periodically refine our estimate based on actual events and earnings by jurisdiction. This ongoing estimation process can result in changes to our expected effective tax rate for the full calendar year. When this occurs, we adjust the income tax provision during the quarter in which the change in estimate occurs so that our year-to-date provision equals our expected annual effective tax rate.
Recently Adopted and issued Accounting Standards
See Note 2, Summary of Significant Accounting Policies, to the consolidated financial statements for a discussion of recently adopted and recently issued accounting standards.
Non-GAAP Financial Information
In addition to our results under GAAP, we also present Adjusted EBITDA for historical periods. Adjusted EBITDA is a non-GAAP financial measure and has been presented as a supplemental measure of financial performance that is not required by, or presented in accordance with, GAAP. We calculate EBITDA as net income (loss) before interest expense, income tax benefit (expense), depreciation and amortization. We calculate Adjusted EBITDA as EBITDA before unrealized (gains) losses on derivative financial instruments, IPO and public company readiness expenses, stock-based compensation, non-recurring adjustments such as non-cash purchase accounting adjustments, losses on the disposal of property and equipment, hurricane related costs, transaction costs, management fees and changes in the value of the TRA liability.
EBITDA and Adjusted EBITDA are presented because they are important metrics used by management as one of the means by which it assesses our financial performance. EBITDA and Adjusted EBITDA are also frequently used by analysts, investors and other interested parties to evaluate companies in our industry. These measures, when used in conjunction with related GAAP financial measures, provide investors with an additional financial analytical framework that may be useful in assessing our Company and its results of operations.
EBITDA and Adjusted EBITDA have certain limitations. EBITDA and Adjusted EBITDA should not be considered as alternatives to net income (loss), or as any other measures of financial performance derived in accordance with GAAP. These measures also should not be construed as an inference that our future results will be unaffected by unusual or nonrecurring items for which these non-GAAP measures make adjustments. Additionally, EBITDA and Adjusted EBITDA are not intended to be liquidity measures because of certain limitations such as:
• | They do not reflect our cash outlays for capital expenditures or future contractual commitments; |
• | They do not reflect changes in, or cash requirements for, working capital; |
• | They do not reflect interest expense or the cash requirements necessary to service interest or principal payments on indebtedness; |
• | They do not reflect income tax expense or the cash necessary to pay income taxes; and |
• | although depreciation and amortization are non-cash charges, the assets being depreciated and amortized may have to be replaced in the future, and these non-GAAP measures do not reflect cash requirements for such replacements. |
59
Other companies, including other companies in our industry, may not use the measures or may calculate one or both differently than as presented in this Annual Report on Form 10-K, limiting their usefulness as a comparative measure.
In evaluating EBITDA and Adjusted EBITDA, you should be aware that in the future we will incur expenses that are the same as or similar to some of the adjustments made in our calculations, and our presentation of EBITDA and Adjusted EBITDA should not be construed to mean that our future results will be unaffected by such adjustments. Management compensates for these limitations by using EBITDA and Adjusted EBITDA as supplemental financial metrics and in conjunction with our results prepared in accordance with GAAP. The non-GAAP information should be read in conjunction with our consolidated financial statements and the related notes.
The following is a reconciliation of Adjusted EBITDA to the nearest GAAP measure, net income (loss):
Year Ended December 31, | Successor | Predecessor | ||||||||||||
2017 | 2016 | October 9 to December 31, 2015 | January 1 to October 8, 2015 | |||||||||||
(in thousands) | ||||||||||||||
Net income (loss) | $ | 82,480 | $ | (28,370 | ) | $ | (7,926 | ) | $ | (29,455 | ) | |||
Interest expense, net | 60,984 | 52,487 | 7,035 | 19,076 | ||||||||||
Income tax benefit | (2,602 | ) | (14,733 | ) | (4,733 | ) | (1,294 | ) | ||||||
Depreciation and amortization | 76,850 | 51,378 | 7,170 | 15,615 | ||||||||||
EBITDA | 217,712 | 60,762 | 1,546 | 3,942 | ||||||||||
Unrealized (gain) loss on derivative financial instrument | (13,059 | ) | 7,123 | — | — | |||||||||
IPO and public company readiness expenses | 5,085 | — | — | — | ||||||||||
Stock-based compensation | 2,198 | — | — | — | ||||||||||
Non-cash purchase accounting effects(a) | 815 | 6,469 | 7,453 | 1,606 | ||||||||||
Loss on disposal of property and equipment | 275 | 1,791 | (30 | ) | 281 | |||||||||
Hurricane related costs(b) | 430 | — | — | — | ||||||||||
Transaction costs(c)(d) | 4,298 | — | — | — | ||||||||||
Management fees(e) | 353 | 3,622 | — | 20 | ||||||||||
Decrease in TRA liability(f) | (68,033 | ) | — | — | — | |||||||||
Adjusted EBITDA | $ | 150,074 | $ | 79,767 | $ | 8,969 | $ | 5,849 | ||||||
Adjusted EBITDA margin(g) | 7.3 | % | 5.7 | % | 4.7 | % | 1.0 | % | ||||||
(a) | Adjusts for the effect of the purchase accounting step-up in the value of inventory to fair value recognized in cost of goods sold as a result of acquisitions. |
(b) | Represents costs related to payroll and inventory resulting from Hurricanes Harvey and Irma. |
(c) | Represents one-time, third-party advisor costs related to our acquisitions in the period, including fees to financial advisors, accountants, attorneys and other professionals. |
(d) | Certain amounts have been reclassified for the three months ended March 31, 2017 to make our presentation of Adjusted EBITDA consistent. |
(e) | Represents fees paid to our former private equity sponsor for services provided pursuant to past management agreements. These fees are no longer being incurred. |
(f) | Related to adjustment in liability related to federal tax legislation implemented in December 2017. See Note 19, Tax Receivable Agreement, to the notes to the consolidated financial statements. |
(g) | Adjusted EBITDA margin represents Adjusted EBITDA divided by net sales. |
60
Item 7A. Quantitative and Qualitative Disclosures about Market Risk
Interest Rate and Currency Risk
Our indebtedness other than borrowings under the ABL Credit Facility, namely the Notes, principally bear a fixed rate
of interest.
of interest.
Borrowings under our ABL Credit Facility are at variable rates of interest and allow certain borrowings in Canadian dollars, which may expose us to interest rate and currency risk. If interest rates increase, our debt service obligations on the variable rate indebtedness will increase even though the amount borrowed remained the same, and our net income and cash flows, including cash available for servicing our indebtedness, will correspondingly decrease. A hypothetical 1% increase in interest rates would have increased interest expense by $0.5 million for the year ended December 31, 2017.
Derivative Financial Instruments
In August 2016, we executed an $88.0 million, 3-year foreign exchange forward contract to hedge the risk of depreciation in the Canadian dollar related to our net investment in our newly acquired Canadian subsidiaries. We have determined that this derivative qualifies for hedge accounting. As such, the effective portion of changes in the fair value of this hedging instrument are included in our statement of comprehensive income in accumulated other comprehensive income at each period end. The ineffective portion of this hedging instrument, which is insignificant, is recognized directly in our statement of operations at each period end. There is no significant credit risk associated with the net investment hedge. Refer to Note 8 in our consolidated financial statements.
In August 2016, we completed the private offering of the Notes. The Notes include a contingent call option whereby we can use the proceeds of an equity offering to prepay a portion of the Notes at a premium, which constitutes an embedded derivative. We bifurcated this embedded derivative from the host debt instrument, the Notes, and determined that the initial fair value was $6.2 million. As of December 31, 2017, and 2016, the fair value of the embedded derivative was $0 and $13.2 million, respectively. The changes in fair value were recognized in other income, net in the statement of operations. Refer to Note 8 in our consolidated financial statements.
Impact of Inflation
We believe that our results of operations have not been materially impacted by the moderate changes in the economic inflation rate over the past three fiscal years.
61
Item 8. Financial Statements and Supplementary Data.
FOUNDATION BUILDING MATERIALS, INC. | ||
AUDITED CONSOLIDATED FINANCIAL STATEMENTS OF FOUNDATION BUILDING MATERIALS, INC. AND SUBSIDIARIES AS OF DECEMBER 31, 2017 AND 2016 AND FOR THE TWO YEARS ENDED DECEMBER 31, 2017 AND THE PERIODS FROM OCTOBER 9, 2015 ("ACQUISITION DATE"), TO DECEMBER 31, 2015 (SUCCESSOR), AND JANUARY 1, 2015 TO OCTOBER 8, 2015 (PREDECESSOR). | ||
Report of Independent Registered Public Accounting Firm | ||
Consolidated Statements of Operations and Comprehensive Income (Loss) | ||
Consolidated Balance Sheets | ||
Consolidated Statements of Cash Flows | ||
Consolidated Statements of Changes in Stockholders' Equity | ||
Notes to Consolidated Financial Statements | ||
Quarterly Results of Operations (Unaudited) | ||
Financial Statements Schedule: Valuation and Qualifying Accounts | ||
62
REPORT OF INDEPENDENT REGISTERED PUBLIC ACCOUNTING FIRM
To the Stockholders and the Board of Directors of
Foundation Building Materials, Inc.
Opinion on the Financial Statements
We have audited the accompanying consolidated balance sheets of Foundation Building Materials, Inc. and subsidiaries (the "Company") as of December 31, 2017 and 2016, the related consolidated statements of operations and comprehensive income (loss), stockholders' equity, and cash flows, for each of the two years in the period ended December 31, 2017, and for the period from October 9, 2015, to December 31, 2015 (Successor) and for the period from January 1, 2015, to October 8, 2015 (Predecessor), and the related notes and the schedule listed in the Index at Item 15 (collectively referred to as the "financial statements"). In our opinion, the financial statements present fairly, in all material respects, the financial position of the Company as of December 31, 2017 and 2016, and the results of its operations and its cash flows for each of the two years in the period ended December 31, 2017, and for the period from October 9, 2015, to December 31, 2015 (Successor) and for the period from January 1, 2015, to October 8, 2015 (Predecessor), in conformity with accounting principles generally accepted in the United States of America.
We have also audited, in accordance with the standards of the Public Company Accounting Oversight Board (United States) (PCAOB), the Company's internal control over financial reporting as of December 31, 2017, based on criteria established in Internal Control - Integrated Framework (2013) issued by the Committee of Sponsoring Organizations of the Treadway Commission and our report dated February 26, 2018, expressed an unqualified opinion on the Company's internal control over financial reporting.
Basis for Opinion
These financial statements are the responsibility of the Company's management. Our responsibility is to express an opinion on the Company's financial statements based on our audits. We are a public accounting firm registered with the PCAOB and are required to be independent with respect to the Company in accordance with the U.S. federal securities laws and the applicable rules and regulations of the Securities and Exchange Commission and the PCAOB.
We conducted our audits in accordance with the standards of the PCAOB. Those standards require that we plan and perform the audit to obtain reasonable assurance about whether the financial statements are free of material misstatement, whether due to error or fraud. Our audits included performing procedures to assess the risks of material misstatement of the financial statements, whether due to error or fraud, and performing procedures that respond to those risks. Such procedures included examining, on a test basis, evidence regarding the amounts and disclosures in the financial statements. Our audits also included evaluating the accounting principles used and significant estimates made by management, as well as evaluating the overall presentation of the financial statements. We believe that our audits provide a reasonable basis for our opinion.
/s/ Deloitte & Touche LLP
Costa Mesa, CA
February 26, 2018
We have served as the Company's auditor since 2015.
63
FOUNDATION BUILDING MATERIALS, INC.
CONSOLIDATED STATEMENTS OF OPERATIONS AND COMPREHENSIVE INCOME (LOSS)
(in thousands, except share and per share data)
Successor | Predecessor | ||||||||||||||
Year Ended December 31, 2017 | Year Ended December 31, 2016 | October 9, 2015 to December 31, 2015 | January 1, 2015 to October 8, 2015 | ||||||||||||
Net sales | $ | 2,060,902 | $ | 1,392,509 | $ | 192,539 | $ | 628,066 | |||||||
Cost of goods sold | 1,463,041 | 995,704 | 143,333 | 452,909 | |||||||||||
Gross profit | 597,861 | 396,805 | 49,206 | 175,157 | |||||||||||
Operating expenses: | |||||||||||||||
Selling, general and administrative expenses | 461,564 | 328,847 | 47,660 | 171,215 | |||||||||||
Depreciation and amortization | 76,850 | 51,378 | 7,170 | 15,615 | |||||||||||
Total operating expenses | 538,414 | 380,225 | 54,830 | 186,830 | |||||||||||
Income (loss) from operations | 59,447 | 16,580 | (5,624 | ) | (11,673 | ) | |||||||||
Interest expense | (61,071 | ) | (52,511 | ) | (7,044 | ) | (19,090 | ) | |||||||
Other income (expense), net | 81,502 | (7,172 | ) | 9 | 14 | ||||||||||
Income (loss) before income taxes | 79,878 | (43,103 | ) | (12,659 | ) | (30,749 | ) | ||||||||
Income tax benefit | (2,602 | ) | (14,733 | ) | (4,733 | ) | (1,294 | ) | |||||||
Net income (loss) | $ | 82,480 | $ | (28,370 | ) | $ | (7,926 | ) | $ | (29,455 | ) | ||||
Income (loss) per share data: | |||||||||||||||
Basic | $ | 1.99 | $ | (0.95 | ) | $ | (0.26 | ) | — | ||||||
Diluted | $ | 1.99 | $ | (0.95 | ) | $ | (0.26 | ) | — | ||||||
Weighted average shares outstanding: | |||||||||||||||
Basic | 41,486,496 | 29,974,239 | 29,974,239 | — | |||||||||||
Diluted | 41,490,653 | 29,974,239 | 29,974,239 | — | |||||||||||
Comprehensive income (loss): | |||||||||||||||
Net income (loss) | $ | 82,480 | $ | (28,370 | ) | $ | (7,926 | ) | $ | (29,455 | ) | ||||
Foreign currency translation adjustment | 5,327 | (1,464 | ) | — | — | ||||||||||
Unrealized (loss) gain on derivative, net of taxes of $1.8 million and $0.9 million, respectively | (2,970 | ) | 1,461 | — | — | ||||||||||
Total other comprehensive income (loss) | 2,357 | (3 | ) | — | — | ||||||||||
Total comprehensive income (loss) | $ | 84,837 | $ | (28,373 | ) | $ | (7,926 | ) | $ | (29,455 | ) | ||||
See accompanying notes to the consolidated financial statements.
64
FOUNDATION BUILDING MATERIALS, INC.
CONSOLIDATED BALANCE SHEETS
(in thousands)
December 31, 2017 | December 31, 2016 | ||||||
Current assets: | |||||||
Cash and cash equivalents | $ | 12,101 | $ | 28,552 | |||
Accounts receivable—net of allowance for doubtful accounts of $4,651 and $5,685, respectively | 280,023 | 261,686 | |||||
Other receivables | 59,462 | 52,845 | |||||
Inventories | 184,436 | 157,991 | |||||
Prepaid expenses and other current assets | 12,636 | 12,516 | |||||
Total current assets | 548,658 | 513,590 | |||||
Property and equipment, net | 151,408 | 144,387 | |||||
Intangible assets, net | 189,770 | 215,381 | |||||
Goodwill | 458,737 | 437,935 | |||||
Other assets | 5,604 | 9,692 | |||||
Total assets | $ | 1,354,177 | $ | 1,320,985 | |||
Liabilities and stockholders' equity | |||||||
Current liabilities: | |||||||
Accounts payable | $ | 156,345 | $ | 119,788 | |||
Accrued payroll and employee benefits | 21,158 | 26,956 | |||||
Accrued taxes | 7,790 | 9,151 | |||||
Tax receivable agreement | 15,892 | — | |||||
Other current liabilities | 41,093 | 49,613 | |||||
Total current liabilities | 242,278 | 205,508 | |||||
Asset-based revolving credit facility | 47,486 | 208,469 | |||||
Long-term portion of notes payable, net | 534,379 | 525,487 | |||||
Tax receivable agreement | 119,912 | — | |||||
Deferred income taxes, net | 17,819 | 26,867 | |||||
Other liabilities | 13,639 | 26,138 | |||||
Total liabilities | 975,513 | 992,469 | |||||
Commitments and contingencies | |||||||
Stockholders' equity: | |||||||
Preferred stock, $0.001 par value, authorized 10,000,000 shares; 0 shares issued | — | — | |||||
Common stock, $0.001 par value, authorized 190,000,000 shares; 42,865,407 and 29,974,239 shares issued, respectively | 13 | — | |||||
Additional paid-in capital | 330,113 | 364,815 | |||||
Retained earnings (accumulated deficit) | 46,184 | (36,296 | ) | ||||
Accumulated other comprehensive income (loss) | 2,354 | (3 | ) | ||||
Total stockholders' equity | 378,664 | 328,516 | |||||
Total liabilities and stockholders' equity | $ | 1,354,177 | $ | 1,320,985 | |||
See accompanying notes to the consolidated financial statements.
65
FOUNDATION BUILDING MATERIALS, INC.
CONSOLIDATED STATEMENTS OF CASH FLOWS
(in thousands)
Year Ended December 31, | Successor | Predecessor | ||||||||||||
2017 | 2016 | October 9, 2015 to December 31, 2015 | January 1, 2015 to October 8, 2015 | |||||||||||
Cash flows from operating activities: | ||||||||||||||
Net income (loss) | $ | 82,480 | $ | (28,370 | ) | $ | (7,926 | ) | $ | (29,455 | ) | |||
Adjustments to reconcile net income (loss) to net cash provided by operating activities: | ||||||||||||||
Depreciation | 30,582 | 16,487 | 1,973 | 7,808 | ||||||||||
Amortization of intangible assets | 46,268 | 34,891 | 5,197 | 7,807 | ||||||||||
Amortization of debt issuance costs and debt discount | 9,910 | 5,950 | 787 | 3,078 | ||||||||||
Inventory fair value purchase accounting adjustment | 814 | 6,469 | 7,453 | 1,606 | ||||||||||
Loss on extinguishment of debt | — | 5,354 | — | — | ||||||||||
Provision for doubtful accounts | 2,095 | 1,608 | 483 | 1,511 | ||||||||||
Stock-based compensation | 2,199 | — | — | — | ||||||||||
Reduction in tax receivable agreement liability | (68,033 | ) | — | — | — | |||||||||
Unrealized (gain) loss on derivative instruments, net | (13,059 | ) | 6,952 | — | — | |||||||||
Loss (gain) on disposal of property and equipment | 276 | 1,791 | (30 | ) | 281 | |||||||||
Paid-in-kind interest | — | — | — | 250 | ||||||||||
Deferred income taxes | (6,081 | ) | (17,669 | ) | 6,521 | (1,837 | ) | |||||||
Change in assets and liabilities, net of effects of acquisitions: | ||||||||||||||
Accounts receivable | 1,115 | 5,985 | 11,436 | (24,859 | ) | |||||||||
Other receivables | (4,078 | ) | (13,220 | ) | (5,973 | ) | (2,806 | ) | ||||||
Inventories | (16,359 | ) | (9,727 | ) | 89 | 4,862 | ||||||||
Prepaid expenses and other current assets | 260 | (3,588 | ) | 942 | (1,252 | ) | ||||||||
Other assets | 2,980 | (800 | ) | 10,110 | (1,019 | ) | ||||||||
Accounts payable | 25,975 | (21,622 | ) | (13,088 | ) | 21,437 | ||||||||
Accrued payroll and employee benefits | (6,015 | ) | 3,931 | 1,753 | 9,342 | |||||||||
Accrued taxes | (1,385 | ) | 3,392 | (1,399 | ) | 4,019 | ||||||||
Other liabilities | (12,683 | ) | 35,316 | (718 | ) | 18,403 | ||||||||
Net cash provided by operating activities | 77,261 | 33,130 | 17,610 | 19,176 | ||||||||||
Cash flows from investing activities: | ||||||||||||||
Purchases of property and equipment | (29,760 | ) | (30,473 | ) | (2,760 | ) | (9,776 | ) | ||||||
Payment of net working capital adjustments related to acquisitions | (405 | ) | — | — | — | |||||||||
Proceeds from net working capital adjustments related to acquisitions | 8,602 | — | — | — | ||||||||||
Proceeds from the disposal of fixed assets | 2,586 | 587 | — | — | ||||||||||
Acquisitions, net of cash acquired | (77,961 | ) | (401,919 | ) | (657,563 | ) | (87,490 | ) | ||||||
Net cash used in investing activities | (96,938 | ) | (431,805 | ) | (660,323 | ) | (97,266 | ) | ||||||
66
Cash flows from financing activities: | ||||||||||||||
Proceeds from asset-based revolving credit facility | 400,239 | 456,469 | 80,000 | 205,915 | ||||||||||
Repayments of asset-based revolving credit facility | (561,509 | ) | (318,000 | ) | (10,000 | ) | (199,299 | ) | ||||||
Principal borrowings on long-term debt | — | 645,000 | 307,950 | 80,000 | ||||||||||
Principal payments on long-term debt | — | (397,369 | ) | — | — | |||||||||
Debt issuance costs | — | (34,406 | ) | (8,172 | ) | (1,165 | ) | |||||||
Principal repayment of capital lease obligations | (2,837 | ) | (1,175 | ) | — | — | ||||||||
Issuance of common stock | 163,952 | — | — | — | ||||||||||
Capital contributions | 2,997 | 66,205 | 272,904 | 1,116 | ||||||||||
Capital distributions | — | (67 | ) | — | — | |||||||||
Net cash provided by financing activities | 2,842 | 416,657 | 642,682 | 86,567 | ||||||||||
Effect of exchange rate changes on cash | 384 | (92 | ) | — | — | |||||||||
Net (decrease) increase in cash | (16,451 | ) | 17,890 | (31 | ) | 8,477 | ||||||||
Cash and cash equivalents at beginning of period | 28,552 | 10,662 | 10,693 | 2,216 | ||||||||||
Cash and cash equivalents at end of period | $ | 12,101 | $ | 28,552 | $ | 10,662 | $ | 10,693 | ||||||
Supplemental disclosures of cash flow information: | ||||||||||||||
Cash paid for income taxes | $ | 4,129 | $ | 4,448 | $ | 1 | $ | 257 | ||||||
Cash paid for interest | $ | 50,866 | $ | 19,745 | $ | 6,695 | $ | 15,649 | ||||||
Cash paid during the period for early debt repayment penalty | $ | — | $ | 1,600 | $ | — | $ | — | ||||||
Supplemental disclosures of non-cash investing and financing activities: | ||||||||||||||
Change in fair value of derivatives, net of tax | $ | 2,970 | $ | 1,461 | $ | — | $ | — | ||||||
Assets acquired under capital lease | $ | 670 | $ | 3,196 | $ | — | $ | — | ||||||
Goodwill adjustment for purchase price allocation | $ | 519 | $ | 1,210 | $ | — | $ | — | ||||||
Tax receivable agreement | $ | 203,837 | $ | — | $ | — | $ | — | ||||||
Embedded derivative in issued notes | $ | — | $ | 6,200 | $ | — | $ | — | ||||||
Notes received for disposals of equipment | $ | 134 | $ | — | $ | — | $ | — | ||||||
See accompanying notes to the consolidated financial statements.
67
FOUNDATION BUILDING MATERIALS, INC.
CONSOLIDATED STATEMENTS OF CHANGES IN STOCKHOLDERS' EQUITY
(in thousands)
Common Stock | ||||||||||||||||||||||
Predecessor | Shares | Amount | Additional Paid in Capital | Accumulated Deficit | Other Comprehensive (Loss) Income | Total Stockholders' Equity | ||||||||||||||||
Balance at December 31, 2014 | — | $ | — | $ | 49,186 | $ | (3,274 | ) | $ | — | $ | 45,912 | ||||||||||
Capital contributions from parent | — | — | 1,116 | — | — | 1,116 | ||||||||||||||||
Net loss | — | — | — | (29,455 | ) | — | (29,455 | ) | ||||||||||||||
Balance at October 8, 2015 | — | $ | — | $ | 50,302 | $ | (32,729 | ) | $ | — | $ | 17,573 | ||||||||||
Successor | ||||||||||||||||||||||
Balance at October 9, 2015 | — | $ | — | $ | — | $ | — | $ | — | $ | — | |||||||||||
Capital contributions from parent | 29,974,239 | — | 298,677 | — | — | 298,677 | ||||||||||||||||
Net loss | — | — | — | (7,926 | ) | — | (7,926 | ) | ||||||||||||||
Balance at December 31, 2015 | 29,974,239 | $ | — | $ | 298,677 | $ | (7,926 | ) | $ | — | $ | 290,751 | ||||||||||
Capital contributions from current parent | — | — | 66,205 | — | — | 66,205 | ||||||||||||||||
Capital distributions | — | — | (67 | ) | — | — | (67 | ) | ||||||||||||||
Other comprehensive loss | — | — | — | — | (3) | (3 | ) | |||||||||||||||
Net loss | — | — | — | (28,370 | ) | — | (28,370 | ) | ||||||||||||||
Balance at December 31, 2016 | 29,974,239 | $ | — | $ | 364,815 | $ | (36,296 | ) | $ | (3 | ) | $ | 328,516 | |||||||||
Capital contributions from current parent | — | — | 2,997 | — | — | 2,997 | ||||||||||||||||
Proceeds from initial public offering, net | 12,800,000 | 13 | 163,939 | — | — | 163,952 | ||||||||||||||||
Tax receivable agreement liability | — | — | (203,837 | ) | — | — | (203,837 | ) | ||||||||||||||
Stock-based compensation | 91,168 | — | 2,199 | — | — | 2,199 | ||||||||||||||||
Other comprehensive income | — | — | — | — | 2,357 | 2,357 | ||||||||||||||||
Net income | — | — | — | 82,480 | — | 82,480 | ||||||||||||||||
Balance at December 31, 2017 | 42,865,407 | $ | 13 | $ | 330,113 | $ | 46,184 | $ | 2,354 | $ | 378,664 | |||||||||||
See accompanying notes to the consolidated financial statements.
68
1. Description of Company and Basis of Presentation
Description of Company
Foundation Building Materials, Inc. (the "Company") is a specialty distributor of wallboard, suspended ceiling systems, and mechanical insulation throughout the U.S. and Canada. Based in Tustin, California, the Company employs more than 3,700 people and operates more than 200 branches across the U.S. and Canada.
Organization
The Company was formed on October 27, 2016 (inception). The initial stockholder of the Company was LSF9 Cypress Parent 2 LLC ("Parent 2") which held all of the Company's authorized, issued and outstanding shares of common stock. Parent 2 is controlled by investment funds, or affiliates of investment funds, advised, managed or controlled by Lone Star Fund IX (U.S.) L. P., (together with certain of its affiliates and associates, but excluding the Company and other companies it owns as a result of its investment activities, “Lone Star”).
Principles of Consolidation
The consolidated financial statements of the Successor and Predecessor include the accounts of the Company and its consolidated subsidiaries. All intercompany balances and transactions have been eliminated. The Company reports two reportable segments, Specialty Building Products and Mechanical Insulation. Resources are allocated and performance is assessed by the Company's CEO, who is the Chief Operating Decision Maker ("CODM").
Basis of Presentation
The accompanying consolidated financial statements have been prepared in accordance with accounting principles generally accepted in the United States of America ("GAAP").
Reorganization
On February 8, 2017, FBM Alpha LLC, (formerly known as LSF9 Cypress Parent, LLC) ("Alpha"), transferred its wholly owned direct subsidiary Foundation Building Materials Holding Company LLC, (formerly known as FBM Beta LLC and LSF9 Cypress Holdings, LLC), and indirectly FBM Finance, Inc. to the Company, thereby transferring the business for which historical financial information is included in these results of operations, to be indirectly held by the Company (the "Reorganization"). As a result of the Reorganization, the historical share count information reflected in the Consolidated Statement of Changes in Stockholders' Equity reflects a 29,974.239 to 1 stock split with respect to the common stock of the Company that occurred subsequent to December 31, 2016. The stock split is reflected as if it occurred at the beginning of the Successor period.
Initial Public Offering
Following the Reorganization, on February 15, 2017, FBM completed an initial public offering ("IPO") in which it issued 12,800,000 shares of common stock at a public offering price of $14.00 per share. The common stock began trading on the New York Stock Exchange on February 10, 2017 under the ticker symbol "FBM". After underwriting discounts and commissions and estimated expenses, the net proceeds to the Company from the IPO were approximately $164.0 million. the Company used these net proceeds to repay $164.0 million of borrowings outstanding under the asset-based lending credit facility (the "ABL Credit Facility"). The underwriters exercised their option to purchase an additional 1,920,000 shares of common stock from Parent 2 and those shares were purchased on February 24, 2017. The Company did not receive any proceeds from the sale of shares by Parent 2.
69
2. Summary of Significant Accounting Policies
Use of Estimates
The preparation of financial statements in conformity with GAAP requires management to make estimates and assumptions. Such estimates affect the reported amounts of assets and liabilities and disclosure of contingent assets and liabilities as of the date of the financial statements and the reported amounts of sales and expenses during the period. The Company evaluates its estimates and assumptions on an ongoing basis using historical experience and other factors. Significant estimates made by management include, but are not limited to, the allowance for doubtful accounts, the allowance for excess and obsolete inventories, vendor rebates, derivatives, useful lives of property and equipment, deferred tax assets and liabilities, and self-insurance liabilities. Actual results may differ from these estimates.
Cash and Cash Equivalents
Cash and cash equivalents includes deposits in financial institutions. The Company has its cash deposits held at major banks that at times may exceed federally insured limits. Cash and cash equivalents are defined as highly liquid investments with maturities of three months or less when purchased.
Concentration of Risk
Financial instruments, which potentially subject the Company to concentration of credit risk, consist principally of accounts receivable. The Company’s accounts receivable are primarily from customers in the building industry located in the United States and Canada. Concentration of credit risk with respect to accounts receivable is limited due to the large number of customers comprising the Company’s customer base. The Company performs credit evaluations of its customers; however, the Company’s policy is not to require collateral. At December 31, 2017 (Successor) and 2016 (Successor), the Company had no significant concentrations of credit risk.
Accounts Receivable
The Company sells to customers using credit terms customary in the building industry. Accounts receivables are recorded at invoiced amounts and generally do not bear interest. The allowance for doubtful accounts reflects the Company’s estimate of credit exposure, determined principally on the basis of its collection experience, aging of its receivables and significant individual account credit risk.
Other Receivables
Other receivables consist primarily of vendor rebates receivables. The Company receives rebates from certain vendors based on the volume of inventory purchases. Throughout the year, the amount of rebates receivable for the periodic programs are estimated based upon the expected level of purchases. Vendor rebates are accrued at the time the inventory is received. The Company accounts for these rebates as a reduction of inventory until the period in which the product is sold, at which time the reduced costs are included in cost of goods sold. The Company continually revises these estimates to reflect actual rebates earned.
Inventories
Inventories, consisting substantially of finished goods, are valued at the net realizable value. Cost is determined using the moving weighted-average cost method. The Company routinely evaluates inventory for excess or obsolescence and considers factors such as historical usage rates and demand.
70
Property and Equipment
Property and equipment acquired outside of business combinations are stated at cost less accumulated depreciation during both the Successor and Predecessor periods. Major additions and improvements are capitalized and depreciated; maintenance and repairs are charged to expense when incurred. Assets held for sale are not depreciated. Upon disposition, the related cost and accumulated depreciation are removed from the accounts and any resulting gain or loss is recognized in selling, general, and administrative expense. Depreciation and amortization are computed using the straight-line method over the following estimated useful lives:
Buildings | 5 to 25 years |
Vehicles and equipment | 2 to 10 years |
Software and computers | 3 to 5 years |
Furniture and fixtures | 7 years |
Machinery and equipment | 3 to 10 years |
Leasehold improvements | Lesser of useful life or lease term |
Impairment of Long-Lived Assets
The Company reviews property and equipment for impairment when events or circumstances indicate these assets may not be recoverable. Factors considered include significant underperformance relative to expected historical or projected future operating results, significant changes in the manner of use of the acquired assets or the strategy for the overall business and significant negative industry or economic trends. In performing the review for recoverability, future cash flows expected to result from the use of the asset and its eventual disposition are estimated. If the sum of expected future undiscounted cash flows is less than the carrying amount of the asset, an impairment loss is recorded under the discounted cash flow method. As of December 31, 2017 (Successor), and 2016 (Successor), there were no impairments.
The Company assesses impairment of long-lived assets at the lowest level for which identifiable cash flows are largely independent of the cash flows of other assets and liabilities.
Goodwill and Intangible Assets
Intangible assets consisted of trade names, customer relationships, non-compete agreements and favorable and unfavorable leases, and are amortized using the straight-line method, which reflects the pattern in which the economic benefits of the assets are expected to be consumed. Intangible assets with definite lives are amortized over their respective estimated useful lives.
The following table summarizes the life of the intangible assets acquired:
Trade names | 1 to 5 years |
Customer relationships | 5 to 9 years |
Other intangible assets | 1 to 13 years |
The Company reviews intangible assets with finite lives for impairment when events or circumstances indicate these assets may not be recoverable. In performing the review for recoverability, future cash flows expected to result from the use of the asset are estimated. If the sum of expected future undiscounted cash flows is less than the carrying amount of the asset, an impairment loss is recorded for the amount by which the carrying amount exceeds the estimated fair value.
Goodwill represents the excess of purchase price over the fair value of assets acquired and liabilities assumed in a business combination.
71
The Company performs an impairment test of goodwill on an annual basis or more frequently if impairment indicators arise. Impairment is determined utilizing a two-step process. This process involves comparing the fair value to the carrying value of the reporting unit. If the carrying value of the net assets assigned to the reporting unit exceeds the fair value of the reporting unit, then the Company must determine the implied fair value of the reporting unit’s goodwill and compare it to the carrying value of the reporting unit’s goodwill. The Company determines the fair value of its reporting units using combinations of both the income and market valuation approaches. The Company performed its goodwill impairment test as of October 1, 2017 and 2016, and the fair value of each reporting unit substantially exceeded its carrying value, as such, there was no impairment related to goodwill.
Derivatives and Hedge Accounting
The Company has entered into derivative instruments to manage its exposure to certain financial risks. Certain derivative instruments are designated for hedge accounting under Financial Accounting Standards Board ("FASB") Accounting Standards Codification ("ASC") 815-20, Derivatives—Hedging. Instruments that meet hedge criteria are formally designated as hedges at the inception of the instrument. The Company measures hedge effectiveness on a quarterly basis. The Company’s derivative instruments include a net investment hedge and embedded derivatives.
The Company classifies the cash flows at settlement from derivatives in the same category as the cash flows from the related hedged items. For designated net investment hedges, the cash settlement is classified within the "Net cash used in investing activities" component of the consolidated statements of cash flows. For undesignated hedges, the cash settlement is primarily classified within the "Net cash provided by operating activities" component of the consolidated statements of cash flows. For the year ended December 31, 2017 (Successor), year ended December 31, 2016 (Successor), and the periods from October 9, 2015 to December 31, 2015 (Successor) and January 1, 2015 to October 8, 2015 (Predecessor), there were no cash flow settlements from any derivatives.
The Company’s derivative assets and liabilities are measured at fair value. Fair value related to the cash flows occurring within one year are classified as current and the fair value related to the cash flows occurring beyond one year are classified as non-current in the consolidated balance sheets. For those instruments designated as hedges, the Company recognizes the changes in fair value in other comprehensive income ("OCI"), and recognizes any ineffectiveness immediately in earnings.
Valuation of derivative assets and liabilities reflect the value of the instrument including counterparty credit risk. These values also take into account the Company’s own credit standing.
Foreign Currency Translation
Assets and liabilities of the Company’s foreign subsidiaries are translated at the exchange rate prevailing at the balance sheet date, while income and expenses are translated at average rates for the period. Translation gains and losses are reported as a component of other comprehensive income (loss).
Transaction gains and losses that arise from exchange rate fluctuations on transactions denominated in a currency other than the functional currency, except those transactions that have been designated as hedges of identifiable foreign currency commitments, are included in the results of operations as incurred.
Capital Leases
Leased property and equipment meeting capital lease criteria are capitalized at the lower of the present value of the related lease payments or the fair value of the leased asset at the inception of the lease. The corresponding liability is included in the balance sheet as other liabilities current and non-current. Leasehold improvements and assets under capital leases are amortized using the straight-line method over the shorter of their estimated useful lives or the initial term of the related lease.
Revenue Recognition
The Company recognizes revenue at the point of sale or upon delivery to the customer’s site when the following four basic criteria are met:
• | persuasive evidence of an arrangement exists; |
72
• | delivery has occurred or services have been rendered; |
• | the price to the buyer is fixed or determinable; and |
• | collectability is reasonably assured. |
Revenue is recognized when sales transactions occur and title is passed, the related product is delivered, and includes any applicable shipping and handling costs invoiced to the customer. The expense related to such costs is included in "Selling, general and administrative" expenses in the accompanying Consolidated Statements of Operations. All revenues recognized are net of sales taxes collected. Sales taxes collected are subsequently remitted to the appropriate government authorities.
Cost of Goods Sold
Cost of goods sold includes the cost of merchandise, inbound freight, inventory provisions, vendor discounts and vendor rebates.
Operating Expenses
Operating expenses include selling, general and administrative expenses and depreciation and amortization. Selling, general and administrative expenses include expenses related to the Company's selling efforts and includes delivery and warehousing of the products, as well as employee compensation and benefits expenses for employees in the Company's branches and yard support center, other administrative expenses, such as legal, accounting, and information technology costs and acquisition expenses which include legal, valuation, accounting and advisory costs. Shipping and handling costs for the years ended December 31, 2017 (Successor), and December 31, 2016 (Successor), were $252.3 million and $169.1 million, respectively.
Depreciation and amortization expenses include depreciation expense on the Company's property and equipment as well as amortization expense on the Company's finite-lived intangible assets. All depreciation and amortization is related to selling, general and administrative activities and is not inventoriable.
Advertising
Advertising related costs are expensed as incurred. Advertising expense was $2.5 million for the year ended December 31, 2017 (Successor), $1.7 million for the year ended December 31, 2016 (Successor), $0.4 million for the period from October 9, 2015 to December 31, 2015 (Successor) and $0.7 million for the period from January 1, 2015 to October 8, 2015 (Predecessor).
Income Taxes
The Predecessor was a limited liability company, under the provisions of the Internal Revenue Code and applicable state laws is generally not subject to taxation of income. However, included in the Predecessor consolidated financial statements is Home Acres Holdings, LLC, ("HAH") a wholly owned subsidiary of the Company, which made an entity classification election to be taxed as a C-corporation. HAH was merged into another of our subsidiaries, Foundation Building Materials LLC, in late December 2017. The Successor has made an entity classification election to be taxed as a C-Corporation and under the provisions of the Internal Revenue Code and applicable state laws is subject to taxation of income. However, in the Successor consolidated financial statements HAH made an entity classification election as of October 9, 2015 to be disregarded as a separate entity and under the provisions of the Internal Revenue Code and applicable state laws is generally not subject to taxation.
The Company accounts for income taxes in accordance with ASC Topic 740, Accounting for Income Taxes. Under ASC 740, income taxes are accounted for based upon the future tax consequences attributable to differences between the financial statement carrying amounts of existing assets and liabilities and their respective tax basis and operating loss and tax credit carry forwards. Deferred tax expense (benefit) results from the net change in deferred tax assets and liabilities during the year. A valuation allowance is recognized to reduce the carrying value of deferred income tax assets if it is believed to be more likely than not that a component of the deferred income tax assets will not be realized.
73
ASC Topic 740 prescribes a recognition threshold and measurement attribute for the financial statement recognition and measurement of a tax position taken or expected to be taken in a tax return. Based on this guidance, the Company analyzes its filing positions, as well as all open tax years in relevant jurisdictions. Tax benefits from uncertain tax positions are recognized if it is more likely than not that the position is sustainable based solely on its technical merits. The Company had no material uncertain tax positions at December 31, 2017 (Successor) and December 31, 2016 (Successor).
On December 22, 2017, the U.S. government enacted comprehensive tax legislation referred to as the Tax Cuts and Jobs Act (the “Tax Act”). Shortly after the Tax Act was enacted, the staff of the Securities and Exchange Commission issued Staff Accounting Bulletin No. 118, Income Tax Accounting Implications of the Tax Cuts and Jobs Act ("SAB 118"), which provides guidance on accounting for the Tax Act’s impact. SAB 118 provides a measurement period, which should not extend beyond one year from the Tax Act enactment date, during which a company acting in good faith may complete the accounting for the impacts of the Tax Act under ASC Topic 740. In accordance with SAB 118, the Company must reflect the income tax effects of the Tax Act in the reporting period in which the accounting under ASC Topic 740 is complete. To the extent that the Company’s accounting for certain income tax effects of the Tax Act is incomplete, the Company can determine a reasonable estimate for those effects and record a provisional estimate in the consolidated financial statements in the first reporting period in which a reasonable estimate can be determined. If the Company cannot determine a provisional estimate to be included in the consolidated financial statements, the Company should continue to apply ASC 740 based on the provisions of the tax laws that were in effect immediately prior to the Tax Act being enacted. If the Company is unable to provide a reasonable estimate of the impacts of the Tax Act in a reporting period, a provisional amount must be recorded in the first reporting period in which a reasonable estimate can be determined. For further information, see Note 5, Income Taxes.
The Company recognizes interest related to income tax matters as interest expense and penalties related to income tax matters as other expense. The Company did not have any amounts accrued or expensed for interest and penalties as of December 31, 2017 (Successor) and December 31, 2016 (Successor), and for the year ended December 31, 2017 (Successor), year ended December 31, 2016 (Successor) or for the periods from October 9, 2015 to December 31, 2015 (Successor) and January 1, 2015 to October 8, 2015 (Predecessor).
Fair Value of Financial Instruments
Fair value is defined as the price that would be received to sell an asset or price paid to transfer a liability in an orderly transaction between market participants at the measurement date. Authoritative guidance for fair value measurements establishes a hierarchy that prioritizes the inputs to valuation models based upon the degree to which they are observable. The three levels of the fair value measurement hierarchy are as follows:
Level 1: Inputs represent quoted prices in active markets for identical assets or liabilities at the measurement date.
Level 2: Inputs (other than quoted prices included in Level 1) that are either directly or indirectly observable for the asset or liability through correlation with market data at the measurement date for the duration of the instrument’s anticipated life.
Level 3: Inputs are unobservable and therefore reflect management’s best estimate of the assumptions that market participants would use in pricing the asset or liability.
The Company estimates the fair value of its assets and liabilities, which qualify as financial instruments, and includes this additional information in the notes to the consolidated financial statements when the fair value is different from the carrying value of these instruments.
Recently Adopted Accounting Standards
In July 2015, the FASB issued Accounting Standards Update ("ASU") 2015-11, Simplifying the Measurement of Inventory, which applies to inventory valued at first-in, first-out (FIFO) or average cost. ASU 2015-11 requires inventory to be measured at the lower of cost and net realizable value, rather than at the lower of cost or market. ASU 2015-11 is effective on a prospective basis for annual periods beginning after December 15, 2016, and interim periods within those fiscal years. The Company adopted this guidance on January 1, 2017 and the adoption thereof did not have a material impact on the Company’s consolidated financial statements.
74
In March 2016, the FASB issued ASU 2016-09, Compensation — Stock Compensation: Improvements to Employee Share-Based Payment Accounting. This ASU is intended to simplify various aspects related to how share-based payments are accounted for and presented in the financial statements, including the income tax effects of share-based payments and accounting for forfeitures. This guidance requires recognizing the Company’s excess tax benefits on share-based compensation arrangements in the tax provision, instead of in equity as under the current guidance. In addition, these amounts are now classified as an operating activity rather than a financing activity in the statement of cash flows. The amendments in this update are effective for reporting periods beginning after December 15, 2016, with early adoption permitted. The Company adopted this guidance on January 1, 2017 and the adoption thereof did not have a material impact on the Company's consolidated financial statements. However, the adoption of this guidance resulted in excess tax benefits or deficiencies related to the exercise of share-based compensation awards to employees being included in the determination of the Company’s income tax provision, which could significantly impact the Company’s consolidated net income in future periods
Recently Issued Accounting Standards
In May 2014, the FASB issued ASU 2014-09, Revenue from Contracts with Customers (Topic 606). ASU 2014-09 amends the guidance for revenue recognition to replace numerous, industry-specific requirements. The core principle of the ASU is that an entity should recognize revenue for the transfer of goods or services equal to the amount that it expects to be entitled to receive for those goods or services. The ASU implements a five-step process for customer contract revenue recognition that focuses on transfer of control, as opposed to transfer of risk and rewards. The ASU also requires enhanced disclosures regarding the nature, amount, timing and uncertainty of revenues and cash flows arising from contracts with customers. Additional ASUs have been issued to amend or clarify the guidance in this ASU as follows:
• | ASU 2016-12 Revenue from Contracts with Customers (Topic 606): Narrow-Scope Improvements and Practical Expedients was issued in May 2016. ASU 2016-12 amends the new revenue recognition standard to clarify the guidance on assessing collectability, presenting sales taxes, measuring noncash consideration, and certain transition matters. |
• | ASU 2016-10 Revenue from Contracts with Customers (Topic 606): Identifying Performance Obligations and Licensing was issued in April 2016. ASU 2016-10 addresses implementation issues identified by the FASB-International Accounting Standards Board Joint Transition Resource Group for Revenue Recognition. |
• | ASU 2016-08 Revenue from Contracts with Customers (Topic 606): Principal versus Agent Considerations (Reporting Revenue Gross versus Net) was issued in March 2016. ASU 2016-08 requires an entity to determine whether the nature of its promise to provide goods or services to a customer is performed in a principal or agent capacity and to recognize revenue in a gross or net manner based on its principal/agent designation. |
The guidance in these ASUs is effective for annual reporting periods beginning after December 15, 2017, including interim periods within that reporting period, and early adoption is permitted for interim and annual periods beginning after December 15, 2016. The Company adopted the new guidance on January 1, 2018, using the modified retrospective method.
The Company has completed its evaluation of the impact of this standard and has concluded that it did not have a material impact on its consolidated financial statements. The adoption of the guidance will result in additional disclosures regarding the Company's revenue recognition policies beginning with the Company's Quarterly Report on Form 10-Q for the quarter ended March 31, 2018.
In January 2016, the FASB issued ASU 2016-01, Financial Instruments – Overall (Subtopic 825-10): Recognition and Measurement of Financial Assets and Financial Liabilities. The updated guidance enhances the reporting model for financial instruments by modifying how entities measure and recognize equity investments and present changes in the fair value of financial liabilities, and by simplifying the disclosure guidance for financial instruments. The amendments in this update are effective for fiscal years beginning after December 15, 2017. The amendments in this update should be applied prospectively. The Company does not expect the adoption of this guidance to have a material impact on its consolidated financial statements.
75
In February 2016, the FASB issued ASU 2016-02, Leases (Topic 842). ASU 2016-02 establishes a right-of-use model that requires a lessee to record a right-of-use asset and a lease liability on the balance sheet for all leases with terms longer than twelve months. Leases will be classified as either "finance" or "operating," with classification affecting the pattern of expense recognition in the income statement. This update requires a modified retrospective transition as of the beginning of the earliest comparative period presented in the financial statements. This update is effective for fiscal years beginning after December 15, 2018, and interim periods within those fiscal years. The Company will adopt this guidance on January 1, 2019. The Company is currently evaluating the impact of this guidance; however, it does expect the adoption of this guidance to have a material impact on its consolidated financial statements.
In August 2016, the FASB issued ASU 2016-15, Statement of Cash Flows (Topic 230): Classification of Certain Cash Receipts and Cash Payments. ASU 2016-15 amended the existing accounting standards for the statement of cash flows. The amendments provide guidance on eight classification issues related to the statement of cash flows. This update is effective for fiscal years beginning after December 15, 2017, and interim periods within those fiscal years. Early adoption is permitted. The Company does not expect the adoption of this guidance will have a material impact on its consolidated financial statements.
In January 2017, the FASB issued ASU 2017-01, Business Combinations (Topic 805): Clarifying the Definition of a Business, which clarifies the definition of a business with the objective of adding guidance to assist entities with evaluating whether transactions should be accounted for as acquisitions (or disposals) of assets or businesses. This amendment is effective for fiscal years beginning after December 15, 2017, and interim periods within those fiscal years. Early adoption is permitted. The Company does not expect the adoption of this guidance will have a material impact on its consolidated financial statements.
In January 2017, the FASB issued ASU 2017-04, Intangibles and Other (Topic 350): Simplifying the Test for Goodwill Impairment, which eliminates the requirement to calculate the implied fair value of goodwill but rather requires an entity to record an impairment charge based on the excess of a reporting unit’s carrying value over its fair value. This amendment is effective for annual or interim goodwill impairment tests in fiscal years beginning after December 15, 2019. Early adoption is permitted. The Company does not expect the adoption of this guidance will have a material impact on its consolidated financial statements.
3. Acquisitions
The Company accounts for its acquisitions under the acquisition method, and accordingly the results of operations of the acquired entities are included in the Company’s consolidated financial statements from the acquisition dates. The purchase prices are allocated to the assets acquired based on estimated fair values at the acquisition date, with the excess of purchase price over the estimated fair value of the net assets acquired recorded as goodwill. Purchase accounting adjustments associated with the intangible asset valuations have been recorded as of December 31, 2017 (Successor) and December 31, 2016 (Successor). The fair value of acquired intangible assets, primarily related to tradenames and customer relationships was estimated by applying an income approach. That measure is based on significant Level 3 inputs not observable in the market. Key assumptions were developed based on the Company’s historical experience, future projections and comparable market data include future cash flows, long-term growth rates, implied royalty rates, attrition rates and discount rates.
2017 Acquisitions
Dominion Interior Supply
On January 3, 2017, the Company acquired the operations and certain assets of Dominion Interior Supply Corporation and Dominion Interior Supply of Roanoke LLC (collectively "Dominion Interior Supply"). Dominion Interior Supply was a supplier of suspended ceiling systems to commercial and residential developers in Virginia and North Carolina. Dominion Interior Supply operated four branches.
Irwin Builders Supply Corporation
On April 3, 2017, the Company acquired the operations and certain assets of the specialty building products division of Irwin Builders Supply Corporation ("Irwin") located in Irwin, Pennsylvania. Irwin was a provider of a broad range of building products including wallboard, metal framing, ceiling and wall systems, insulation and other complementary products to the Pennsylvania market. Irwin operated one branch in Pennsylvania.
76
Trident Distribution
On April 30, 2017, the Company acquired the operations and certain assets of the Atlanta branch of Trident Distribution, a division of Performance Contracting, Inc. ("Trident"). Trident was a distributor of mechanical insulation and related products. Trident offered insulation fabrication services in addition to a full line of commercial and industrial insulation products and accessories supplying mechanical insulation contractors across the Georgia market.
Wallboard, Inc.
On May 1, 2017, the Company acquired all of the stock of Wallboard, Inc. ("Wallboard") with two branch locations in the Minneapolis-St. Paul metropolitan area. Wallboard was an independent distributor of specialty building products, including wallboard, metal framing, insulation and finishing products primarily servicing the commercial market as well as the multi-family residential market.
Gypsum Wallboard Supply, Inc.
On May 1, 2017, the Company acquired the operations and certain assets of Gypsum Wallboard Supply, Inc. ("GWSI") in Tacoma, Washington. GWSI was an independent distributor of specialty building products including wallboard, metal framing, suspended ceiling systems and other complementary products. GWSI primarily serviced the commercial market as well as the multi-family residential market in the Seattle metropolitan area. GWSI operated one branch in Washington.
Ceiling and Wall Supply, Inc.
On July 1, 2017, the Company acquired the operations and certain assets of Ceiling and Wall Supply, Inc. ("CWS"). CWS was an independent distributor of specialty building products including Armstrong suspended ceiling systems, wallboard, metal framing, insulation, and Dryvit products. CWS primarily serviced the commercial market and operated five branches in Illinois, Kentucky and Missouri.
Virginia Builders' Supply, Inc.
On July 1, 2017, the Company acquired the operations and certain assets of Virginia Builders' Supply, Inc. ("VBS"). VBS was an independent distributor of specialty building products including wallboard, metal framing, insulation, fasteners, tools and other accessory products used by interior contractors in the commercial and residential markets in Virginia. VBS operated one branch in Virginia.
American Wal-Board
On August 1, 2017, the Company acquired the operations and substantially all of the assets of American Wal-Board, LLC, American Materials, LLC, American Drywall & Roofing, LLC and JLS Equipment Leasing, LLC (collectively, "AWB"). AWB was an independent distributor of specialty building products including wallboard, metal framing, insulation, roofing and fireplace products to the commercial and residential markets in Tennessee and Mississippi. AWB operated two branches.
MCS Door & Hardware
On October 1, 2017, the Company acquired the operations and substantially all of the assets of MCS Door & Hardware (“MCS"). MCS was an independent distributor of specialty building products including doors, frames, hardware and toilet partitions in connection with new construction and repair and remodel projects in the commercial market. MCS operated one branch in Texas.
Del-Pro Building Supplies, Inc.
On November 1, 2017, the Company acquired all of the shares of Del-Pro Building Supplies, Inc. ("DPSI"). DPSI was an independent distributor of specialty building products including wallboard, metal framing, insulation, basement blanket and spray foam products in the commercial and residential markets. DPSI operated one branch in Ontario, Canada.
77
For the year ended December 31, 2017 (Successor), the Company completed 10 acquisitions for an aggregate purchase price of $79.6 million. The 2017 acquisitions contributed net sales of $78.4 million and income from operations of $4.4 million in the year ended December 31, 2017 (Successor). The purchase price of the acquisitions ranged from $0.7 million to $20.6 million some of which were or are subject to normal working capital adjustments. These acquisitions are not considered material, individually or in aggregate. The following table summarizes, on an aggregate basis, the estimated fair values of the assets acquired and liabilities assumed as of the acquisition date for the acquisitions summarized above ("2017 acquisitions") (in thousands):
Year Ended December 31, 2017 | ||||
Assets acquired: | ||||
Cash | $ | 1,593 | ||
Accounts receivable | 19,719 | |||
Other receivables | 1,457 | |||
Inventories | 10,907 | |||
Prepaid and other current assets | 300 | |||
Property and equipment | 9,096 | |||
Goodwill | 26,661 | |||
Intangible assets | 20,173 | |||
Other assets | 76 | |||
Total assets acquired: | 89,982 | |||
Liabilities assumed: | ||||
Accounts payable | (9,067 | ) | ||
Accrued expenses and other current liabilities | (1,361 | ) | ||
Long-term liabilities | — | |||
Total liabilities assumed | (10,428 | ) | ||
Total net assets acquired | $ | 79,554 | ||
The excess of purchase price over the fair value amounts assigned to the assets acquired and liabilities assumed represents the goodwill amount resulting from the acquisitions. Goodwill attributable to the acquisitions has been recorded as a non-current asset and is not amortized, but is subject to review at least on an annual basis for impairment. Goodwill recognized was primarily attributable to expected operating efficiencies and expansion opportunities in the businesses acquired. Goodwill and intangible assets recognized from asset acquisitions are expected to be tax deductible, and with the exception of the DPSI acquisition, each of the 2017 acquisitions was treated as an asset purchase for tax purposes. Generally, the most significant intangible asset acquired is customer relationships. The Company's acquisitions are generally subject to working capital adjustments, however, the Company does not expect any such adjustments to have a material impact on its consolidated financial statements. The pro forma impact of the 2017 acquisitions is not presented as the 2017 acquisitions are not considered material to the Company's consolidated financial statements.
2016 Acquisitions
Mid America Drywall Supply, Inc. (Successor)
On April 29, 2016, the Company acquired certain assets and the operations of Mid America Drywall Supply, Inc. ("Mid America") for $1.5 million in cash (including certain adjustments). Mid America was a distributor of interior products such as wallboard, and other related products in Wichita, Kansas.
Ken Builders Supply Inc. (Successor)
On May 31, 2016, the Company acquired certain assets and the operations of Ken Builders Supply Inc. ("Ken API") for $37.0 million. Ken API was a supplier of building materials to commercial and residential developers throughout Ohio, Kentucky, West Virginia, and central Indiana.
78
Kent Gypsum Supply Inc. (Successor)
On May 31, 2016, the Company acquired 100% of the capital stock of Kent Gypsum Supply Inc. ("Kent") for $19.6 million. Kent was a supplier of building materials to commercial and residential developers throughout western Washington.
Winroc-SPI Corporation, Superior Plus Construction Products Corp., 1974303 Alberta Ltd., and The Winroc Corporation (Midwest) (Successor)
On August 9, 2016, the Company acquired 100% of the capital stock of Winroc-SPI Corporation, Superior Plus Construction Products Corp., 1974303 Alberta Ltd., and The Winroc Corporation (Midwest) (collectively referred to as "Winroc-SPI") for cash consideration of $314.1 million, subject to customary working capital adjustments. Winroc-SPI was a supplier of building materials to commercial and residential developers throughout the United States and Canada.
The Company funded the acquisition with the issuance the Notes and the ABL Credit Facility (as further discussed in Note 7), a cash payment of $13.0 million and an equity contribution from Lone Star of $65.0 million.
United Drywall Supply, Inc. (Successor)
On November 30, 2016, the Company acquired the assets of United Drywall Supply, Inc. ("United Drywall Supply") for $30.0 million subject to normal working capital adjustments. United Drywall Supply was a supplier of building materials to commercial and residential developers in the Atlanta, Georgia metropolitan area.
The following table summarizes the preliminary estimated fair values of the assets acquired and liabilities assumed as of the acquisition date of the acquisitions summarized above (the "2016 acquisitions") based on the purchase price during the year ended December 31, 2016 (in thousands):
Year Ended December 31, 2016 | ||||
Assets acquired: | ||||
Cash | $ | 308 | ||
Accounts receivable | 131,282 | |||
Other receivables | 15,184 | |||
Inventories | 83,198 | |||
Prepaids and other current assets | 4,286 | |||
Property and equipment | 63,894 | |||
Goodwill | 150,583 | |||
Intangible assets | 96,030 | |||
Other assets | 168 | |||
Deferred tax asset | — | |||
Total assets acquired | 544,933 | |||
Liabilities assumed: | ||||
Accounts payable | (82,663 | ) | ||
Accrued expenses and other current liabilities | (17,141 | ) | ||
Deferred income taxes | (29,545 | ) | ||
Long-term liabilities | (13,357 | ) | ||
Total liabilities assumed | (142,706 | ) | ||
Total net assets acquired | $ | 402,227 | ||
79
The excess of purchase price over the fair value amounts assigned to the assets acquired and liabilities assumed represents the goodwill amount resulting from the acquisitions. Goodwill attributable to the acquisitions has been recorded as a non-current asset and is not amortized, but is subject to review at least on an annual basis for impairment. Goodwill recognized was primarily attributable to expected operating efficiencies and expansion opportunities in the business acquired. Goodwill and intangible assets recognized from the acquisitions are expected to be deductible for tax purposes with the exception of Kent. Each of the Ken API, Mid America and United Drywall Supply acquisitions was treated as an asset purchase for tax purposes and each of the Kent and Winroc-SPI acquisitions were treated as a stock acquisition for tax purposes. Generally, the most significant intangible asset acquired is customer relationships.
The 2016 acquisitions contributed net sales of $340.5 million and income from operations of $0.8 million in the year ended December 31, 2016 (Successor).
Supplemental Unaudited Pro Forma Information
In accordance with ASC 805, the following information for the years ended December 31, 2016 presents the results of operations of the Company as if the 2016 acquisitions occurred as of January 1, 2015. The supplemental pro forma information has been adjusted to include:
•the pro forma impact of additional amortization and depreciation related to the fair value of acquired tangible and intangible assets,
•the pro forma impact of acquisition costs which consisted of legal, advisory, and due diligence fees and expenses,
•the pro forma impact to conform accounting for leases in the Winroc-SPI historical financial statements presented under International Financial Reporting Standards ("IFRS") to GAAP, inclusive of adjustments for rent expense and interest expense,
•the pro forma impact of interest expense related to additional borrowings incurred as part of the acquisition and
•the pro forma tax effect of the pro forma adjustments, calculated using a tax rate of 35%.
The pro forma results are presented for illustrative purposes only and are not necessarily indicative of, or intended to represent, the results that would have been achieved had the various acquisitions been completed on the dates indicated. For example, the pro forma results do not reflect any operating efficiencies and associated cost savings that the Company might have achieved with respect to the acquisitions (in thousands, except per share data).
Year Ended December 31, 2016 | |||
(Unaudited) | |||
Net sales | $ | 1,925,059 | |
Net loss | $ | (12,843 | ) |
Net loss per share(1): | |||
Basic | $ | (0.43 | ) |
Diluted | $ | (0.43 | ) |
(1) The pro forma loss per share data for the year ended December 31, 2016 is based on the Company's historical statement of operations after giving effect to the following as if they occurred at the beginning of the period: (1) a reorganization consolidating all entities under a new parent entity (Foundation Building Materials, Inc.); and (2) a 29,974.239 to 1 stock split with respect to the common stock of Foundation Building Materials, Inc. that occurred subsequent to December 31, 2016.
80
4. Goodwill and Intangible Assets
Identifiable intangible assets that are separable and have determinable useful lives are valued separately and amortized over their benefit period. The following is the gross carrying value and accumulated amortization of the Company’s identifiable intangible assets as of December 31, 2017 (Successor) and December 31, 2016 (Successor) (in thousands):
December 31, 2017 | December 31, 2016 | ||||||||||||||||||||||
Gross Carrying Amount | Accumulated Amortization | Net Carrying Amount | Gross Carrying Amount | Accumulated Amortization | Net Carrying Amount | ||||||||||||||||||
Trade names | $ | 15,980 | $ | (7,283 | ) | $ | 8,697 | $ | 15,980 | $ | (4,097 | ) | $ | 11,883 | |||||||||
Customer relationships | 256,650 | (78,406 | ) | 178,244 | 235,690 | (35,550 | ) | 200,140 | |||||||||||||||
Other intangible assets | 3,640 | (811 | ) | 2,829 | 3,852 | (494 | ) | 3,358 | |||||||||||||||
$ | 276,270 | $ | (86,500 | ) | $ | 189,770 | $ | 255,522 | $ | (40,141 | ) | $ | 215,381 | ||||||||||
The weighted average amortization period of these intangible assets in the aggregate is 4.3 years. Total amortization expense of intangible assets above was $46.3 million for the year ended December 31, 2017 (Successor), $34.9 million for the year ended December 31, 2016 (Successor), $5.2 million for the period from October 9, 2015 to December 31, 2015 (Successor) and $7.8 million for the period from January 1, 2015 to October 8, 2015 (Predecessor), respectively.
Future amortization for the next five fiscal years and thereafter is as follows (in thousands):
Years Ending December 31, | |||
2018 | $ | 47,366 | |
2019 | 47,481 | ||
2020 | 46,492 | ||
2021 | 28,683 | ||
2022 | 14,034 | ||
Thereafter | 5,714 | ||
$ | 189,770 | ||
Changes in goodwill between December 31, 2016 (Successor) and December 31, 2017 (Successor), consisted of the following (in thousands):
Carrying Value | |||
Balance at December 31, 2016 | $ | 437,935 | |
Goodwill acquired | 26,661 | ||
Purchase price allocation adjustments from prior periods | (7,680 | ) | |
Impact of foreign exchange rates | 1,821 | ||
Balance at December 31, 2017 | $ | 458,737 | |
As of December 31, 2017, goodwill allocated to the SBP and MI segments was $452.8 million and $5.9 million, respectively. As of December 31, 2016, goodwill allocated to the SBP and Ml segments was $432.6 million and $5.3 million, respectively. Changes to initial purchase price allocations related to acquisitions may arise from changes in estimates from conditions that existed at the applicable acquisition date and as a result of net working capital adjustments. The Company performed its goodwill impairment test as of October 1, 2017, and the fair value of each reporting unit substantially exceeded its carrying value, as such, there was no impairment related to goodwill.
81
5. Income Taxes
The components of income (loss) before income taxes for the years ended December 31, 2017 and 2016 are as follows (in thousands):
Year Ended December 31, 2017 | Year Ended December 31, 2016 | ||||||
United States | $ | 70,338 | $ | (44,078 | ) | ||
Foreign | 9,540 | 975 | |||||
Income (loss) before taxes | $ | 79,878 | $ | (43,103 | ) | ||
The following table shows the benefit for income taxes (in thousands):
Year Ended December 31, 2017 | Year Ended December 31, 2016 | ||||||
Current: | |||||||
Federal | $ | 1,065 | $ | (121 | ) | ||
State | 1,110 | 80 | |||||
Foreign | 2,065 | 2,621 | |||||
4,240 | 2,580 | ||||||
Deferred: | |||||||
Federal | (8,627 | ) | (12,376 | ) | |||
State | 1,182 | (2,608 | ) | ||||
Foreign | 603 | (2,329 | ) | ||||
(6,842 | ) | (17,313 | ) | ||||
Income tax benefit | $ | (2,602 | ) | $ | (14,733 | ) | |
The differences between income taxes expected at the U.S. federal statutory rate of 35 percent and the reported income tax benefit are summarized as follows (in thousands):
Year Ended December 31, 2017 | Year Ended December 31, 2016 | ||||||
Tax computed at federal statutory rate | $ | 27,932 | $ | (15,086 | ) | ||
State income tax, net of federal benefit | 2,245 | (1,410 | ) | ||||
Permanent items | 793 | 623 | |||||
Transaction costs | 517 | 1,466 | |||||
Foreign rate differential | (791 | ) | (77 | ) | |||
Gain on tax receivable agreement | (23,812 | ) | — | ||||
Rate change | (9,100 | ) | (126 | ) | |||
Other | (386 | ) | (123 | ) | |||
Income tax benefit | $ | (2,602 | ) | $ | (14,733 | ) | |
82
Deferred income taxes reflect the net tax effects of temporary differences between the carrying amounts of assets and liabilities for financial reporting purposes and the amounts used for income tax purposes. The following table shows significant components of the Company’s deferred tax assets and liabilities (in thousands):
Year Ended December 31, 2017 | Year Ended December 31, 2016 | ||||||
Deferred tax assets (liabilities): | |||||||
Definite-lived intangible assets | $ | (16,806 | ) | $ | (41,087 | ) | |
Indefinite-lived intangible assets | (11,074 | ) | (7,535 | ) | |||
Property, plant and equipment | (13,862 | ) | (19,108 | ) | |||
Inventories and related reserves | 4,625 | 5,372 | |||||
Accrued compensation | 547 | 2,532 | |||||
Allowance for doubtful accounts | 1,458 | 3,054 | |||||
Capital lease obligations | 2,964 | 5,632 | |||||
Derivative on foreign currency | (1,585 | ) | 2,719 | ||||
Net operating loss carryforwards | 14,801 | 19,963 | |||||
Other, net | 1,977 | 1,591 | |||||
Total deferred tax assets (liabilities) | (16,955 | ) | (26,867 | ) | |||
Valuation allowance | (864 | ) | — | ||||
Total deferred tax assets (liabilities), net | $ | (17,819 | ) | $ | (26,867 | ) | |
The Company assesses the available positive and negative evidence to estimate whether sufficient future taxable income will be generated to permit use of the existing deferred tax assets. A significant piece of objective negative evidence evaluated was the cumulative federal tax loss incurred over the three-year period ended December 31, 2017 (Successor) of $40.5 million. Such objective evidence limits the ability to consider other subjective evidence, such as the Company's projections for future growth.
The Company has sufficient taxable temporary differences, excluding those associated with indefinite lived assets and goodwill, to enable the use of the tax benefits of most operating loss carryforwards and deductible temporary differences, irrespective of future taxable income. More specifically, the Company is in a net deferred tax liability position (after excluding those associated with indefinite-lived assets and goodwill) in the United States and Canada because of substantial deferred tax liabilities for depreciable property and equipment, and amortizable intangible assets that will offset the reversal of the deferred tax assets in the future before the expiration of most deferred tax assets. Consolidated deferred tax liabilities associated with indefinite lived assets and goodwill were $11.1 million and $7.5 million at December 31, 2017 and 2016, respectively.
As of December 31, 2017 (Successor), the Company had federal and state income tax net operating loss carryforwards of $54.0 million and $66.7 million, respectively. These carryforwards will expire on various dates in the next 20 years as follows (in millions):
Federal | State | ||||||
2020-2025 | $ | — | $ | 2.8 | |||
2026-2031 | — | 19.3 | |||||
2032-2037 | 54.0 | 44.6 | |||||
$ | 54.0 | $ | 66.7 | ||||
At December 31, 2017 (Successor), the Company had federal tax credit carryforwards of $0.2 million. These carryforwards become refundable and will be refunded by 2022.
83
Based on the positive and negative evidence reviewed, the Company believes that it is more likely than not that the benefit from certain state net operating loss ("NOL") carryforwards related to single filing states of a liquidated subsidiary will not be realized. In recognition of this risk, the Company has provided a valuation allowance of $0.9 million on the deferred tax assets related to these state NOL carryforwards. If or when recognized, the tax benefits related to any reversal of the valuation allowance on deferred tax assets as of December 31, 2017 (Successor), will be accounted for as a reduction of income tax expense.
The Company recognizes a tax benefit from an uncertain tax position when it is more likely than not that the position will be sustained upon examination, including resolutions of any related appeals or litigation processes, based on the technical merits. Income tax positions must meet a more-likely-than-not recognition threshold to be recognized. The Company had no material uncertain tax positions for which it recognized a benefit at December 31, 2017 (Successor) and December 31, 2016 (Successor).
The Company recognizes interest and penalties related to unrecognized tax benefits as income tax expense in the consolidated statements of operations. There were no accrued interest and penalties associated with uncertain tax positions as of December 31, 2017 (Successor) and December 31, 2016 (Successor). The Company does not anticipate a significant change in its unrecognized tax benefits over the next 12 months.
On December 22, 2017, the United States government enacted the Tax Act resulting in significant modifications to existing law. The Company follows the guidance in SAB 118, which provides additional clarification regarding the application of ASC Topic 740 in situations where the Company does not have the necessary information available, prepared, or analyzed in reasonable detail to complete the accounting for certain income tax effects of the Tax Act for the reporting period in which the Tax Act was enacted. SAB 118 provides for a measurement period beginning in the reporting period that includes the Tax Act’s enactment date and ending when the Company has obtained, prepared, and analyzed the information needed in order to complete the accounting requirements but in no circumstances should the measurement period extend beyond one year from the enactment date.
The Company has completed the accounting for the effects of the Tax Act during the year ended December 31, 2017 (Successor), except for the repricing of ending deferred taxes due to the reduction in the corporate tax rate and the impact of the one-time deemed repatriation transition tax on unrepatriated foreign earnings. As a result, the Company's financial statements for the year ended December 31, 2017 (Successor) reflect these effects of the Tax Act as provisional based on a reasonable estimate of the income tax effects. The Company has included a provisional reduction in deferred tax liability and corresponding provisional reduction in tax provision expense of $9.1 million in relation to the repricing of its ending deferred tax balance. The provisional amount is based on information currently available, including estimated book to tax adjustments. The Company continues to gather and analyze information, including any future legislative tax developments at the federal or state jurisdictions, in order to complete the accounting for the repricing of the ending deferred balances as of December 31, 2017 (Successor).
The Company has also included a provisional income tax payable in the amount of $0.5 million related to the one-time deemed repatriation transition tax on unrepatriated foreign earnings. The provisional amount is based on information currently available, including estimated tax earnings and profits and tax pools from foreign investments. In addition, the income tax payable has been calculated by electing out of the use of net operating losses in order to maximize the use of foreign tax credits. The Company has also estimated the state tax impact of the Tax Act. The Company continues to gather and analyze information, including historical adjustments to earnings and profits of foreign subsidiaries and the available elections, in order to complete the accounting for the effects of the estimated transition tax. Any future legislative tax developments at the federal or state jurisdictions will need to be examined for potential application. It is the intention of the Company to complete the necessary analysis within the measurement period.
The Company considers the earnings of non-U.S. subsidiaries to be indefinitely invested outside the United States based on estimates that future domestic cash generation will be sufficient to meet future domestic cash needs and the Company's specific plans for reinvestment of those subsidiary earnings. As required by the Tax Act, the Company has recorded a provisional tax liability related to the U.S. federal income taxes on approximately $10.2 million of undistributed earnings of foreign subsidiaries indefinitely invested outside the United States. However, the Company has not recorded a deferred tax liability for state and foreign withholding taxes associated with the repatriation of those foreign earnings. If the Company decides to repatriate the foreign earnings, it would need to adjust its income tax provision in the period it determined that the earnings will no longer be indefinitely invested outside the United States.
84
6. Property and Equipment
Property and equipment as of December 31, 2017 (Successor) and December 31, 2016 (Successor), consist of the following (in thousands):
Year Ended December 31, 2017 | Year Ended December 31, 2016 | ||||||
Vehicles and equipment | $ | 110,842 | $ | 84,573 | |||
Buildings and leasehold improvements | 23,190 | 20,569 | |||||
Machinery and equipment | 24,025 | 19,118 | |||||
Software and computers | 23,812 | 21,821 | |||||
Land | 14,041 | 14,448 | |||||
Assets to be placed into service | 699 | 194 | |||||
Furniture and fixtures | 1,717 | 1,536 | |||||
198,326 | 162,259 | ||||||
Less: accumulated depreciation | (46,918 | ) | (17,872 | ) | |||
$ | 151,408 | $ | 144,387 | ||||
Depreciation expense for property and equipment was $30.6 million for the year ended December 31, 2017 (Successor) and $16.5 million for the year ended December 31, 2016 (Successor). Depreciation expense was $2.0 million for the period from October 9, 2015 to December 31, 2015 (Successor) and $7.8 million for the period from January 1, 2015 to October 8, 2015 (Predecessor).
7. Asset-Based Credit Facility and Senior Notes Payable
Notes payable consisted of the following at December 31, 2017 (Successor) and December 31, 2016 (Successor) (in thousands):
Year Ended December 31, 2017 | Year Ended December 31, 2016 | ||||||
Senior secured notes | $ | 575,000 | $ | 575,000 | |||
Unamortized debt issuance costs - senior secured notes | (40,621 | ) | (49,513 | ) | |||
Revolving asset-based credit facility | 47,486 | 208,469 | |||||
Unamortized debt issuance costs - asset-based revolving credit facility | (3,164 | ) | (4,182 | ) | |||
$ | 578,701 | $ | 729,774 | ||||
Senior Secured Notes Due 2021
On August 9, 2016, the Company, together with FBM Finance, Inc., its wholly owned subsidiary which was created for the purpose of issuing the Notes (together, the "Issuers"), issued $575 million in aggregate principal amount of 8.25% senior secured notes due 2021 at an issue price of 100% of the principal amount of the Notes in a private placement.
The Notes are fully and unconditionally guaranteed on a senior secured basis, jointly and severally, by Alpha and each of Alpha's domestic wholly owned restricted subsidiaries (other than certain excluded subsidiaries) (the "Guarantors"). The Notes are senior secured obligations that have priority over certain collateral of the Issuers and the Guarantors of the Notes and are effectively subordinated to the obligations under the ABL Credit Facility in respect of certain other collateral of the Issuers and the Guarantors.
The Notes will mature on August 15, 2021 and bear interest at an annual rate of 8.25%. Interest on the Notes is payable semi-annually in arrears in February and August of each year, which commenced on February 2017. The Notes are governed by an indenture, dated August 9, 2016, among the Issuers, the guarantors and Wilmington Trust, National Association, as trustee (the "Indenture").
85
Before August 15, 2018, the Issuers may redeem all or a portion of the Notes, at a redemption price equal to 100% of the principal amount thereof, plus an applicable premium and accrued and unpaid interest, if any, to, but excluding, the applicable redemption date. In addition, prior to August 15, 2018 and in the event of equity offerings, the Issuers are entitled to redeem up to 40% of the aggregate principal amount of the Notes at a redemption price equal to 108.25% of the principal amount of the Notes, plus accrued and unpaid interest, if any, to, but excluding, the applicable redemption date. The Issuers may, at their option, redeem all or a portion of the Notes at any time on or after August 15, 2018 at the applicable redemption prices specified in the Indenture, plus any accrued and unpaid interest to, but excluding, the applicable redemption date.
Upon certain kinds of changes of control, holders of the Notes have the right to require the Issuers to repurchase all or any portion of such holder’s Notes at 101% of the principal amount of the Notes being repurchased, plus any accrued and unpaid interest to, but excluding, the date of repurchase.
ABL Credit Facility
On August 9, 2016, the Company entered into the ABL Credit Facility with Goldman Sachs Bank USA as administrative agent, which matures on February 9, 2021. The ABL Credit Facility bears interest, at the Company’s option, at either a Eurodollar rate or an alternate base rate plus an applicable margin. Based on the historical excess availability under the ABL Credit Facility, the margin can range from 1.25% to 1.75% per annum in the case of Eurodollar rate loans and 0.25% to 0.75% per annum in the case of alternate base rate loans. The available borrowing capacity, or borrowing base, is derived from a percentage of the Company’s eligible receivables and inventory in both the United States and Canada, as defined in the agreement governing the ABL Credit Facility, subject to certain reserves, with a $75 million sub-limit on the Canadian borrowing base. As of the closing of the ABL Credit Facility, the available borrowing capacity was $250 million. A variable commitment fee, ranging from 0.25% to 0.375% and currently 0.25% per annum, is charged on the unused amount of the ABL Credit Facility based on quarterly average loan utilization. Letters of credit under the ABL Credit Facility are assessed at a rate equal to the applicable Eurodollar margin currently 1.50% as well as a fronting fee at a rate of 0.125% per annum.
These fees are payable quarterly in arrears at the end of March, June, September, and December. In addition, an administrative agent fee of $75,000 for the ABL Credit Facility is due and payable each year in quarterly installments on the last day of each quarter. The ABL Credit Facility is a senior secured obligation of the Company, with priority over certain collateral of the Company and its subsidiaries. There are no prepayment premiums associated with the ABL Credit Facility.
In connection with the entry into the ABL Credit Facility and issuance of the Notes, the Company paid off and terminated the existing Senior Lien Term Loan Credit Agreement ("SLCA"), Junior Lien Term Credit Agreement ("JLCA") and 2015 ABL Credit Agreement ("2015 ABL") that were entered into on October 9, 2015 (collectively, the "2015 Credit Facilities"). The Company accounted for the refinancing of the 2015 Credit Facilities as a debt modification with respect to amounts that remained in the syndicate and a debt extinguishment with respect to amounts that exited the syndicate. This resulted in a loss on extinguishment of debt of $7.0 million which has been reflected as a component of interest expense within the statement of operations.
On September 23, 2016, the Company entered into an Incremental Facility Amendment which extended borrowing commitments under the ABL Credit Facility by an additional $50 million, resulting in total borrowing capacity of $300 million. As of December 31, 2017, the Company has $47.5 million outstanding under the ABL Credit Facility.
Debt Issuance Costs
During the year ended December 31, 2017 (Successor) and December 31, 2016 (Successor), the Company incurred $0 million and $34.4 million of debt issuance costs, respectively. Unamortized debt issuance costs as of December 31, 2017 were $43.8 million, of which $40.6 million was included in long-term portion of notes payable, net in the accompanying consolidated balance sheet and $3.2 million for the ABL Credit Facility was included in other long-term assets in the accompanying consolidated balance sheet. Unamortized debt issuance costs as of December 31, 2016 (Successor) were $53.7 million, of which $49.5 million was included in long-term portion of notes payable, net in the accompanying consolidated balance sheet and $4.2 million for the ABL Credit Facility was included in other long-term assets in the accompanying consolidated balance sheet.
As of December 31, 2017, the Company was in compliance with all debt covenants under the ABL Credit Facility and the Indenture.
86
8. Derivatives and Hedging Activities
The Company uses derivatives to manage selected foreign exchange exposures for its investments in foreign subsidiaries. In general, the types of risks hedged are those relating to the variability of future earnings and cash flows caused by movements in foreign currency exchange rates and interest rates. The Company documents its risk management strategy and hedge effectiveness at the inception of and during the term of each hedge.
Net Investment Hedge
As of December 31, 2017 (Successor), the amount of notional foreign exchange contracts outstanding was approximately $88.0 million. There is no significant credit risk associated with the potential failure of any counterparty to perform under the terms of any derivative financial instrument.
The net investment hedge is measured at fair value within the consolidated balance sheet either as an asset or a liability. As of December 31, 2017 (Successor), the fair value of the derivative instrument was $2.4 million and was recorded in other long-term liabilities. As of December 31, 2016 (Successor), the fair value of the derivative instrument was $2.4 million and was recorded in non-current other assets.
For the year ended December 31, 2017 (Successor), the Company recognized a loss of $3.0 million, net of tax of $1.8 million, recorded in comprehensive income (loss). The Company recognized a gain of $1.5 million, net of taxes of $0.9 million, for the year ended December 31, 2016 (Successor), recorded in comprehensive income (loss) related to the net investment hedge.
The Company also recorded a loss of $0.2 million for the year ended December 31, 2017 (Successor), in other income (expense), net related to the ineffective portion of the net investment hedge. The Company recorded a gain of $0.1 million in for the year ended December 31, 2016 (Successor), in other income (expense), net related to the ineffective portion of the net investment hedge.
Embedded Derivative
The Company has the option to prepay the Notes at any time prior to August 15, 2018 at a price equal to 100% of the principal amount, plus the applicable premium and any accrued and unpaid interest.
In addition, prior to August 15, 2018 and in the event of equity offerings, the Company has the option to prepay up to 40% of the Notes using the proceeds from such offering within 180 days from closing of the offering. However, 50% of the principal needs to remain outstanding. The redemption price is determined at 108.25% plus accrued and unpaid interest.
On or after August 15, 2018, the Company may redeem the Notes subject to a redemption price equal to a percentage of the principal amount of the Notes, with such percentage set forth in the Indenture, plus accrued and unpaid interest.
The optional prepayment subsequent to an equity offering constitutes an embedded derivative and is bifurcated from the debt host and accounted for separately. The embedded derivative is recorded at fair value at inception and on an ongoing basis, with any changes in fair value from inception recorded in earnings. The fair value of the embedded derivative at December 31, 2017 (Successor) and December 31, 2016 (Successor) was $0 and $13.2 million, respectively. The fair value of the embedded derivative at December 31, 2017 (Successor) was $0 due to a minimal probability of an equity offering occurring where the proceeds are used to pay down the Notes prior to the expiration of the optional prepayment time period on August 15, 2018. At December 31, 2016 (Successor), the fair value of the embedded derivative was included in the balance sheet as non-current other liabilities.
The change in fair value for the years ended December 31, 2017 (Successor) and December 31, 2016 (Successor) was $13.2 million and $7.1 million, respectively, and was included in the statements of operations in other income, net.
9. Accumulated Other Comprehensive Income (Loss)
Accumulated other comprehensive loss consists of cumulative unrealized foreign currency translation adjustments and unrealized changes in fair value on certain derivative instruments.
87
The components of accumulated other comprehensive loss for the year ended December 31, 2017 (Successor) were as follows (in thousands):
Cumulative unrealized foreign currency translation (losses) and gains | Unrealized gain (loss) on derivative, net of tax | Total | |||||||||
Balance at December 31, 2016 | $ | (1,464 | ) | $ | 1,461 | $ | (3 | ) | |||
Other comprehensive (loss) income | 5,327 | (2,970 | ) | 2,357 | |||||||
Balance at December 31, 2017 | $ | 3,863 | $ | (1,509 | ) | $ | 2,354 | ||||
10. Related Parties
The Company previously paid management fees and certain expenses to an affiliate of its former parent CI (FBM) Holdings, LLC ("CIFBM"). Total management fees and expenses were $1.0 million for the period from January 1, 2015 to October 8, 2015 (Predecessor). The Company reported these management fees and expenses in selling, general and administrative expenses on the consolidated statements of operations. The Company also paid acquisition costs of $1.9 million in the period January 1, 2015 through October 8, 2015 (Predecessor) to an affiliate of CIFBM which were expensed and reported as acquisition related expenses in the consolidated statements of operations.
During the years ended December 31, 2017 (Successor) and 2016 (Successor), the Company paid management fees and certain expenses in the amount $0.4 million and $3.2 million, respectively, to an affiliate of Lone Star. Total management fees were $0.3 million for the period from October 9, 2015 to December 31, 2015 (Successor). The Company also paid acquisition costs of $0.2 million in the year ended December 2015 to an affiliate of Lone Star which were properly expensed and reported as acquisition related expenses in the consolidated statements of operations.
Until the acquisition of the Company's business by Lone Star (the "Lone Star Acquisition") the Company had outstanding debt with related parties totaling $0.9 million at October 9, 2015.
The Company previously sold products to another affiliate company that is owned by one of its executive officers. Total sales for the years ended December 31, 2017 (Successor) and 2016 (Successor) were $0 million and $0.5 million, respectively. Total sales for the period from October 9, 2015 to December 31, 2015 (Successor) and January 1, 2015 to October 8, 2015 (Predecessor) were $0.2 million and $0.6 million, respectively. There were no amounts in accounts receivable balances from such related party as of December 31, 2017 (Successor) and 2016 (Successor), respectively.
11. Lease Commitments
The Company leases certain facilities and equipment under various operating lease agreements with expiration dates through 2027 and typically contain renewal options of 5 to 10 years. These agreements generally require the Company to pay rental amounts and operating expenses, and contain tenant improvement allowances, rent holidays, rent escalation clauses and/or contingent rent provisions.
Leasehold improvement assets, which generally represent non-structural improvements for which the Company receives reimbursement from the landlord, are depreciated over the lesser of 10 years or the initial life of the lease, prior to any lease extensions. For tenant allowances, the Company records a corresponding deferred rent liability in other liabilities on the balance sheet and amortizes the deferred rent over the initial term of the lease as a reduction to rent expense.
The Company’s leases may contain rent holidays and/or escalating rent payments; however, the Company accounts for the rent expense on a straight-line basis over the lease term. The straight-line rent expense is calculated at the inception of the lease, which entails recording a monthly liability for the difference between rent paid to the landlord and straight-line rent expense as calculated at the beginning of the lease.
88
Rent expense was $37.9 million for the year ended December 31, 2017 (Successor), $23.6 million for the year ended December 31, 2016 (Successor), $3.2 million for the period from October 9, 2015 to December 31, 2015 (Successor) and $9.6 million for the period from January 1, 2015 to October 8, 2015 (Predecessor). Minimum annual lease commitments under non-cancelable operating leases are summarized as follows (in thousands):
Years Ending December 31, | Total | ||
2018 | $ | 33,071 | |
2019 | 24,866 | ||
2020 | 18,997 | ||
2021 | 15,412 | ||
2022 | 10,214 | ||
Thereafter | 22,080 | ||
$ | 124,640 | ||
Following is a summary of non-cancelable capital lease commitments (in thousands):
Years Ending December 31, | Total | ||
2018 | $ | 3,004 | |
2019 | 2,939 | ||
2020 | 2,816 | ||
2021 | 2,369 | ||
2022 | 1,456 | ||
Thereafter | 1,236 | ||
$ | 13,820 | ||
12. Stock-Based Compensation
The Company has a 2017 Stock Incentive Plan ("the "Plan") that provides for granting of stock options, restricted stock units and other equity awards. The Plan authorizes 3,636,000 shares of common stock for issuance. The plan is designed to motivate and retain individuals who are responsible for the attainment of our primary long-term performance goals.
The Company utilizes the Black-Scholes option-pricing model to estimate the grant-date fair value of all stock options granted during fiscal year 2017. The Black-Scholes option-pricing model requires the use of weighted average assumptions for estimated expected volatility, estimated expected term of stock options, risk-free rate, estimated expected dividend yield, and the fair value of the underlying common stock at the date of grant. Due to the recent date of the IPO, the Company does not have sufficient history to estimate the expected volatility of its common stock price. Thus, expected volatility has been based on the average volatility of peer public entities that are similar in size and industry. The Company estimates the expected term of all stock options based on the simplified method. The risk-free rate is based on the U.S. Treasury yield curve in effect at the time of grant for the expected term of the stock option. The expected dividend yield is 0.0% as the Company has not declared any common stock dividends to date and does not expect to declare common stock dividends in the near future. The fair value of the underlying common stock at the date of grant was determined based on the value of the common stock at the date of grant. Forfeitures are recorded when incurred. The weighted average assumptions used in the Black-Scholes option-pricing model for the year ended December 31, 2017 (Successor) are set forth below:
89
Year Ended December 31, 2017 | |||
Expected term (in years) | 6.25 | ||
Expected volatility | 49.8 | % | |
Risk-free interest rate | 2.1 | % | |
Expected dividend | — | % | |
Weighted average fair value at grant date | $ | 7.02 | |
During the year ended December 31, 2017, the Company granted 225,745 stock options to employees that vest based on service only. All of these awards vest over a four-year period. The Company did not issue any stock options prior to its IPO in February 2017.
Information related to the stock option granted during the year ended December 31, 2017 (Successor), is as follows:
2017 Stock Incentive Plan | |||||
Options | Weighted Average Exercise Price | ||||
Outstanding at December 31, 2016 | — | — | |||
Option granted | 225,745 | $ | 14.01 | ||
Options exercised | — | — | |||
Options forfeited | (1,390 | ) | $ | 14.00 | |
Outstanding at December 31, 2017 | 224,355 | $ | 14.01 | ||
Options exercisable at December 31, 2017 | — | — | |||
The intrinsic value of all options outstanding at December 31, 2017 (Successor) was $0.2 million.
A summary of the Company’s non‑vested stock options as of December 31, 2017 (Successor) is as follows:
Non-vested Options | Options | Weighted Average Grant Date Fair Value | |||
Non-vested at December 31, 2016 | — | — | |||
Granted | 225,745 | $ | 7.02 | ||
Expired | — | — | |||
Canceled | (1,390 | ) | $ | 7.04 | |
Vested | — | — | |||
Non-vested at December 31, 2017 | 224,355 | $ | 7.02 | ||
During the year ended December 31, 2017 (Successor), the Company recorded stock-based compensation expense related to stock options of $0.3 million. As of December 31, 2017 (Successor), there was approximately $1.2 million of total unrecognized compensation cost related to non‑vested stock options granted under the equity plans. That cost is expected to be recognized over an approximately three‑year period or a weighted average period of approximately 3.1 years.
90
The following tabulation summarizes certain information about outstanding and exercisable options at December 31, 2017 (Successor):
Options Outstanding | Options Exercisable | |||||||||||
Range of Exercise Prices | As of December 31, 2017 | Weighted Average remaining Contractual Life in Years | Weighted Average Exercise Price | As of December 31, 2017 | Weighted Average Exercise Price | |||||||
$11.00 - $12.99 | 6,567 | 9.6 | $ | 11.27 | — | $ | — | |||||
$13.00 - $14.99 | 209,890 | 9.1 | $ | 14.00 | — | — | ||||||
$15.00 - $16.99 | 7,898 | 9.3 | $ | 16.47 | — | — | ||||||
224,355 | 9.1 | $ | 14.00 | — | $ | — | ||||||
The following table summarizes all unvested restricted stock unit activity for the year ended December 31, 2017 (Successor):
Restricted Stock Units Outstanding | Weighted-Average Grant Date Fair Value | ||||
Unvested balance at December 31, 2016 | — | $ | — | ||
Granted | 131,234 | 14.20 | |||
Vested | — | — | |||
Canceled/forfeited | (2,419 | ) | 15.14 | ||
Unvested balance at December 31, 2017 | 128,815 | $ | 14.18 | ||
The intrinsic value of all outstanding restricted stock units at December 31, 2017 (Successor) was $1.9 million.
During the year ended December 31, 2017 (Successor), the Company recorded stock-based compensation expense related to restricted stock units of $0.4 million. As of December 31, 2017 (Successor), there was $1.4 million of total unrecognized compensation cost related to unvested restricted stock units, which is expected to be recognized over a weighted-average period of 3.2 years.
During the year ended December 31, 2017 (Successor), the Company recorded stock-based compensation expense related to a fully vested stock award of $1.5 million. The total number of stock issued related to this award was 91,168.
13. Long-Term Incentive Plan
Following the Lone Star Acquisition, Lone Star implemented the LSF9 Cypress Parent LLC Long-Term Incentive Plan (the "LTIP"). Under the LTIP, participants were granted pool units entitling them, subject to the terms of the LTIP, to a potential cash payout upon a monetization event. The LTIP was effective October 9, 2015. The LTIP was assigned from Parent to the Company in connection with the IPO.
The LTIP was established with the purpose of attracting certain key employees and other service providers of the Company and its subsidiaries and to provide motivation to put forth maximum efforts toward the continued growth, profitability and success of the Company by providing incentives.
The Board of the Company administers the LTIP and awards pool units. Pool units vest 10% each year for the first 3 years. Pool units, whether vested or unvested, that are outstanding on the 5th anniversary of the date the award was granted will be forfeited on that date or, upon the date the participant ceases employment. Pool units will remain outstanding for a period of six months from the date of such termination if the termination is without cause, a resignation for good reason, death or termination due to disability. Total pool units available for grant under the LTIP is 1,000,000. At December 31, 2017 (Successor) and December 31, 2016 (Successor), there were 925,000 pool units outstanding.
91
The Company maintains an incentive pool account and upon a monetization event and obtaining a cumulative internal rate of return of at least 15%, the Company will credit to the incentive pool account amounts as defined in the LTIP and determined by the cumulative internal rate of return achieved at the time of the monetization event. A monetization event, as defined by the LTIP, is one of the following transactions: a) the Company is sold, transferred or otherwise disposed of to an unrelated third party for cash; b) a firm commitment underwritten public offering of the equity interests of the Company; or c) the payment by the Company of any cash distributions to investors. Following a monetization event, the value of any incentive amount to be paid to a participant will be determined by the percentage of a participant’s pool units awarded to the total pool units awarded under the LTIP times the amount in the incentive pool account. Participants will be paid within 60 days following the monetization event.
At December 31, 2017, there had not been a monetization event and therefore no amounts were accrued in the accompanying consolidated balance sheets and no expense has been recognized for the LTIP. On February 15, 2017, the Company completed the IPO; however, the IPO was not a monetization event and no payout has been triggered under the LTIP.
14. Retirement Plan
The Company's subsidiaries have multiple retirement savings plans for all eligible full-time employees under Section 401(k) of the Internal Revenue Code. The plans allow participants to contribute a portion of their earnings to the plans. The plans allow the Company, at its discretion, to match a certain percentage of the employees’ contributions, limited to a certain percentage of eligible compensation. There were contributions to the plans of $4.8 million for the year ended December 31, 2017 (Successor), $3.5 million for the year ended December 31, 2016 (Successor), $0.4 million for the period from October 9, 2015 to December 31, 2015 (Successor) and $0.8 million for the period from January 1, 2015 to October 8, 2015 (Predecessor).
15. Contingencies
The Company is involved in certain legal actions arising in the ordinary course of business. Management believes that such litigation and claims will be resolved without material effect on the Company’s consolidated financial position.
The Company regularly assesses such matters to determine the degree of probability that the Company will incur a material loss as a result of such matters as well as the range of possible loss. An estimated loss contingency is accrued in the Company’s financial statements if it is probable the Company will incur a loss and the amount of the loss can be reasonably estimated. The Company reviews all claims, proceedings and investigations at least quarterly and establishes or adjusts any accruals for such matters to reflect the impact of negotiations, settlements, advice of legal counsel and other information and events pertaining to a particular matter. All legal costs associated with such matters are expensed as incurred.
Historically, the claims, proceedings and investigations brought against the Company, individually and in the aggregate, have not had a material adverse effect on the consolidated results of operations, cash flows or financial position of the Company. As of December 31, 2017 (Successor), there were no proceedings or litigation involving the Company that management believes would have a material adverse impact on its business, financial position, results of operations, or cash flows.
16. Fair Value Measurement
The Company’s financial instruments consist primarily of cash and cash equivalents, trade and other receivables, derivative instruments, accounts payable, long-term debt and accrued liabilities. The carrying value of the Company’s trade receivables, trade payables, the ABL Credit Facility and accrued liabilities approximates fair value due to their short-term maturity. The Company may adjust the carrying amount of certain nonfinancial assets to fair value on a non-recurring basis when they are impaired.
92
The estimated carrying amount and fair value of the Company’s financial instruments and other assets and liabilities measured and recorded at fair value on a recurring basis at December 31, 2017 (Successor) is as follows (in thousands):
Fair Value Measurements at December 31, 2017 | |||||||||||||||
Quoted Prices in Active Markets for Identical Assets (Level 1) | Significant Other Observable Inputs (Level 2) | Significant Unobservable Inputs (Level 3) | Total Fair Value | ||||||||||||
Recurring: | |||||||||||||||
Non-current liabilities | |||||||||||||||
Derivative liability (Note 8) | $ | — | $ | (2,364 | ) | $ | — | $ | (2,364 | ) | |||||
The estimated carrying amount and fair value of the Company’s financial instruments and other assets and liabilities measured and recorded at fair value on a recurring basis at December 31, 2016 (Successor) is as follows (in thousands):
Fair Value Measurements at December 31, 2016 | |||||||||||||||
Quoted Prices in Active Markets for Identical Assets (Level 1) | Significant Other Observable Inputs (Level 2) | Significant Unobservable Inputs (Level 3) | Total Fair Value | ||||||||||||
Recurring: | |||||||||||||||
Non-current asset (liabilities) | |||||||||||||||
Derivative asset (Note 8) | $ | — | $ | 2,475 | $ | — | $ | 2,475 | |||||||
Derivative (liability) (Note 8) | $ | — | $ | (13,250 | ) | $ | — | $ | (13,250 | ) | |||||
The fair values of derivative assets and liabilities are determined using quantitative models that utilize multiple market inputs including interest rates and exchange rates to generate continuous yield or pricing curves and volatility factors to value the position. The majority of market inputs are actively quoted and can be validated through external sources, including brokers, market transactions and third-party pricing services. The fair values of derivative assets and liabilities include adjustments for market liquidity, counterparty credit quality and other instrument-specific factors, where appropriate. In addition, the Company incorporates within its fair value measurements a valuation adjustment to reflect the credit risk associated with the net position. Positions are netted by counterparties, and fair value for net long exposures is adjusted for counterparty credit risk while the fair value for net short exposures is adjusted for the Company’s own credit risk.
The estimated carrying amount and fair value of the Company’s financial instruments and liabilities for which fair value is only disclosed is as follows (in thousands):
Fair Value Measurements at December 31, 2017 | |||||||||||||||||||
Carrying Amount | Quoted Prices in Active Markets for Identical Assets (Level 1) | Significant Other Observable Inputs (Level 2) | Significant Other Unobservable Inputs (Level 3) | Total Fair Value | |||||||||||||||
Senior secured notes | $ | 534,379 | $ | — | $ | 612,375 | $ | — | $ | 612,375 | |||||||||
The fair value of debt is the estimated amount the Company would have to repay its debt, including any premium or discount attributable to the difference between the stated interest rate and market rate of interest at the balance sheet date. Fair values are supported by observable market transactions when available.
93
17. Segments
Segment information is presented in accordance with ASC 280, Segment Reporting, which establishes standards for reporting information about operating segments. It also establishes standards for related disclosures about customers, products and geographic areas. Operating segments are defined as components of an enterprise that engage in business activities that earn revenues, incur expenses and prepare separate financial information that is evaluated regularly by the Company’s CODM in order to allocate resources and assess performance. Resources are allocated and performance is assessed by the CODM.
Based on the provisions of ASC 280, the Company has defined its operating segments by considering management structure and product offerings. This evaluation resulted in the following reportable segments:
• | Specialty Building Products—Specialty building products ("SBP") distributes wallboard, metal framing, suspended ceiling systems and complementary and other products. Other products include wallboard accessories, stucco and EIFS, as well as other offerings, such as tools, safety accessories and fasteners. The primary end markets served are new non-residential, new residential and non-residential repair and remodel construction markets. |
• | Mechanical Insulation—Mechanical insulation ("MI") distributes and fabricates commercial and industrial insulation for pipes and mechanical systems, and the primary end markets served are new non-residential construction, non-residential repair and remodel construction and industrial markets. |
In addition to the two reportable segments, the Company’s consolidated results include corporate activities, which include depreciation and amortization.
For purposes of evaluation under these segment reporting principles, the CODM assesses the Company’s ongoing performance based on the periodic review of net sales and gross profit. The Company has not disclosed asset information by segment as its CODM does not use such information for purposes of allocating resources and assessing performance.
The following tables present net sales, gross profit, and certain other measures for each reportable segment (in thousands):
Year Ended December 31, | |||||||||||||
2017 | 2016 | ||||||||||||
Net Sales | Gross Profit | Net Sales | Gross Profit | ||||||||||
SBP | $ | 1,790,114 | $ | 522,189 | $ | 1,293,496 | $ | 371,715 | |||||
MI | 270,788 | 75,672 | 99,013 | 25,090 | |||||||||
Consolidated | $ | 2,060,902 | $ | 597,861 | $ | 1,392,509 | $ | 396,805 | |||||
Total gross profit | $ | 597,861 | $ | 396,805 | |||||||||
Total operating expenses | (538,414 | ) | (380,225 | ) | |||||||||
Interest expense | (61,071 | ) | (52,511 | ) | |||||||||
Other income (expense), net | 81,502 | (7,172 | ) | ||||||||||
Income (loss) before income taxes | $ | 79,878 | $ | (43,103 | ) | ||||||||
Revenues are attributed to each country based on the location in which sales originate and in which assets are located. The following table provides information about the Company by geographic areas (in thousands):
Year Ended December 31, | |||||||
2017 | 2016 | ||||||
United States | $ | 1,827,392 | $ | 1,305,503 | |||
Canada | 233,510 | 87,006 | |||||
Total | $ | 2,060,902 | $ | 1,392,509 | |||
94
For the year ended December 31, 2017 (Successor), the year ended December 31, 2016 (Successor), for the period from October 9, 2015 to December 31, 2015 (Successor) and for the period from January 1, 2015 to October 8, 2015 (Predecessor), no customer comprised more than 10% of net sales.
The following table sets forth property, plant and equipment, goodwill and intangibles by geographic area (in thousands):
Year Ended December 31, | |||||||
2017 | 2016 | ||||||
Property, plant and equipment, net | |||||||
United States | $ | 135,330 | $ | 128,861 | |||
Canada | 16,078 | 15,526 | |||||
Total property, plant and equipment, net | $ | 151,408 | $ | 144,387 | |||
Goodwill | |||||||
United States | $ | 431,476 | $ | 411,538 | |||
Canada | 27,261 | 26,397 | |||||
Total goodwill | $ | 458,737 | $ | 437,935 | |||
Intangibles, net | |||||||
United States | $ | 182,070 | $ | 207,837 | |||
Canada | 7,700 | 7,544 | |||||
Total intangibles, net | $ | 189,770 | $ | 215,381 | |||
95
The Company’s net sales by segment and major product line, and segment gross profit and gross margin, are as follows (in thousands):
Year Ended December 31, | Change | |||||||||||||||||
2017 | 2016 | $ | % | |||||||||||||||
SBP Segment | ||||||||||||||||||
Wallboard | $ | 701,467 | 39.2 | % | $ | 525,044 | 40.6 | % | $ | 176,423 | 33.6 | % | ||||||
Suspended ceiling systems | 328,815 | 18.3 | % | 191,964 | 14.8 | % | 136,851 | 71.3 | % | |||||||||
Metal framing | 280,410 | 15.7 | % | 219,994 | 17.0 | % | 60,416 | 27.5 | % | |||||||||
Complementary other products | 479,422 | 26.8 | % | 356,494 | 27.6 | % | 122,928 | 34.5 | % | |||||||||
Total SBP net sales | $ | 1,790,114 | 100.0 | % | $ | 1,293,496 | 100.0 | % | $ | 496,618 | 38.4 | % | ||||||
MI Segment | ||||||||||||||||||
Commercial and industrial insulation | $ | 206,668 | 76.3 | % | $ | 75,929 | 76.7 | % | $ | 130,739 | 172.2 | % | ||||||
Non-insulation products | 64,120 | 23.7 | % | 23,084 | 23.3 | % | 41,036 | 177.8 | % | |||||||||
Total MI net sales | $ | 270,788 | 100.0 | % | $ | 99,013 | 100.0 | % | $ | 171,775 | 173.5 | % | ||||||
Total net sales | $ | 2,060,902 | $ | 1,392,509 | $ | 668,393 | 48.0 | % | ||||||||||
Gross profit - SBP | $ | 522,189 | $ | 371,715 | $ | 150,474 | 40.5 | % | ||||||||||
Gross profit - MI | 75,672 | 25,090 | 50,582 | 201.6 | % | |||||||||||||
Total gross profit | $ | 597,861 | $ | 396,805 | $ | 201,056 | 50.7 | % | ||||||||||
Gross margin - SBP | 29.2 | % | 28.7 | % | 0.5 | % | ||||||||||||
Gross margin - MI | 27.9 | % | 25.3 | % | 2.6 | % | ||||||||||||
Total gross margin | 29.0 | % | 28.5 | % | 0.5 | % | ||||||||||||
18. Other Current Liabilities
The balance of other current liabilities consisted of the following as of December 31 of the following years (in thousands):
2017 | 2016 | ||||||
Accrued expenses | $ | 6,919 | $ | 14,572 | |||
Accrued interest | 18,093 | 18,915 | |||||
Accrued other | 16,081 | 16,126 | |||||
Total other current liabilities | $ | 41,093 | $ | 49,613 | |||
96
19. Tax Receivable Agreement
In connection with the IPO, the Company entered into a tax receivable agreement ("TRA") with Parent 2 that provides for the payment by the Company to Parent 2 of 90% of the amount of cash savings, if any, in U.S. federal, state, local and non-U.S. income tax that the Company realizes (or in some circumstances are deemed to realize) as a result of the utilization of the Company and the Company’s subsidiaries’ (i) depreciation and amortization deductions, and any offset to taxable income and gain or increase to taxable loss, resulting from the tax basis the Company has in its assets at the consummation of the IPO, (ii) net operating losses, (iii) tax credits and (iv) certain other tax attributes. In the first quarter of 2017, the Company recorded a liability of $203.8 million, with a corresponding offset to additional paid-in capital for the TRA. At the end of each reporting period, any changes in the Company's estimate of the liability will be recorded in the consolidated statement of operations as a component of other income (expense). The timing and amount of future tax benefits associated with the TRA are subject to change, and future payments may be required which could be materially different from the current estimated liability. The TRA will remain in effect until all tax benefits have been used or expired, unless the agreement is terminated early.
At December 31, 2017, the TRA liability balance was $135.8 million. The initial amount recorded was $203.8 million, and the reduction of $68.0 million was recorded as a gain in the other income (expense) section of the consolidated statement of operations during the fourth quarter of 2017. The reduction in the TRA liability was due primarily to the federal income tax rate being reduced from 35.0% to 21.0% as part of the Tax Cut and Jobs Act of 2017. There have been no payments related to the TRA from inception to December 31, 2017. The first payment related to the TRA is anticipated to be made during the fourth quarter of 2018 and is estimated to be $15.9 million and is reflected in current liabilities.
20. Earnings (Loss) Per Share
Basic earnings (loss) per share represents net income (loss) for the period, divided by the weighted average number of shares of common stock outstanding for the period.
The following are the number of shares of common stock used to compute the basic and diluted earnings (loss) per share for each period:
Year Ended December 31, | October 9, 2015 to December 31, 2015 (1) | ||||||||
2017 | 2016(1) | ||||||||
Weighted average shares used in basic computations | 41,486,496 | 29,974,239 | 29,974,239 | ||||||
Dilutive effect of stock options and restricted stock units | 4,157 | — | — | ||||||
Weighted average shares used in diluted computations | 41,490,653 | 29,974,239 | 29,974,239 | ||||||
(1)The loss per share data for the year ended December 31, 2016 and Successor period from October 9, 2015 to December 31, 2015, is based on the Company's historical combined statement of operations after giving effect to the following as if they occurred at the beginning of the period: (1) a reorganization consolidating all entities under the Company; and (2) a 29,974.239 to 1 stock split with respect to the common stock of the Company that occurred subsequent to December 31, 2016. | |||||||||
For the year ended December 31, 2017 (Successor), there were 104,324 shares not included in the computation of diluted weighted average shares because their effect would have been antidilutive. For year ended December 31, 2016 (Successor) and the period from October 9, 2015 through December 31, 2015 (Successor), there were no stock options, restricted stock units or other potentially dilutive securities outstanding, therefore, the basic and diluted share count were the same.
97
21. Quarterly Results of Operations (Unaudited)
The following tables present selected unaudited consolidated financial data for each of the four quarters in the year ended December 31, 2017 (Successor) and the year ended December 2016 (Successor). In the Company’s opinion, this unaudited information has been prepared on the same basis as the audited information and includes all adjustments (consisting of only normal recurring adjustments) necessary for a fair statement of the financial information for the period presented.
Three Months Ended | |||||||||||||||
March 31, 2017 | June 30, 2017 | September 30, 2017 | December 31, 2017 | ||||||||||||
(in thousands, except per share data) | |||||||||||||||
Year Ended December 31, 2017 | |||||||||||||||
Net sales | $ | 479,457 | $ | 529,230 | $ | 535,446 | $ | 516,769 | |||||||
Gross profit | $ | 139,911 | $ | 149,532 | $ | 154,783 | $ | 153,635 | |||||||
Net income | $ | 3,929 | $ | 1,260 | $ | 1,399 | $ | 75,892 | |||||||
Net income per share - basic (1) | $ | 0.11 | $ | 0.03 | $ | 0.03 | $ | 1.77 | |||||||
Net income per share - diluted (1) | $ | 0.11 | $ | 0.03 | $ | 0.03 | $ | 1.77 | |||||||
(1) Earnings per share is computed independently for each of the quarters presented. The sum of the quarterly earnings per share do not equal the total earnings per share computed for the year due to rounding. | |||||||||||||||
Three Months Ended | |||||||||||||||
March 31, 2016 | June 30, 2016 | September 30, 2016 | December 31, 2016 | ||||||||||||
(in thousands, except per share data) | |||||||||||||||
Year Ended December 31, 2016 | |||||||||||||||
Net sales | $ | 244,605 | $ | 270,147 | $ | 415,563 | $ | 462,194 | |||||||
Gross profit | $ | 72,245 | $ | 79,337 | $ | 112,966 | $ | 132,257 | |||||||
Net loss | $ | (1,261 | ) | $ | (2,961 | ) | $ | (15,344 | ) | $ | (8,804 | ) | |||
Net loss per share - basic (1) | $ | (0.04 | ) | $ | (0.10 | ) | $ | (0.51 | ) | $ | (0.29 | ) | |||
Net loss per share - diluted (1) | $ | (0.04 | ) | $ | (0.10 | ) | $ | (0.51 | ) | $ | (0.29 | ) | |||
(1) Net loss per share is computed independently for each of the quarters presented. The sum of the quarterly net loss per share do not equal the total net loss per share computed for the year due to rounding. | |||||||||||||||
98
22. Subsequent Events
Armcom Distributing Company
On February 1, 2018, the Company acquired the operations and substantially all of the assets of ArmCom Distributing Company, a division of the St. Paul Linoleum and Carpet Company (“ArmCom”). ArmCom was an independent distributor of ceilings products and operated five branches in Minnesota, North Dakota, South Dakota and Nebraska.
RM Supply
On February 1, 2018, the Company acquired all of the stock of RM Supply, Inc. and certain assets of JMB Transportation, L.L.C. (collectively, “RM Supply”). RM Supply was an independent distributor of wallboard, steel framing, insulation, and wallboard accessories. RM Supply operated two branches in Missouri.
Any adjustments to the purchase price allocation of these acquisitions will be made as soon as practicable but no later than one year from the acquisition date.
99
SUPPLEMENTARY DATA
SCHEDULE II - VALUATION AND QUALIFYING ACCOUNTS
(in thousands)
Additions | |||||||||||||||||||
Description | Balance at Beginning of Period | Charged to Costs and Expenses | Charged to Other Accounts | Deductions | Balance at End of Period | ||||||||||||||
Allowance for doubtful accounts: | |||||||||||||||||||
For the year ended December 31, 2017 (Successor) | $ | 5,685 | $ | 1,546 | $ | (2,580 | ) | $ | — | $ | 4,651 | ||||||||
For the year ended December 31, 2016 (Successor) | $ | 6,304 | $ | 3,390 | $ | (4,009 | ) | $ | — | $ | 5,685 | ||||||||
For the period from October 9 to December 31, 2015 (Successor) | $ | 5,518 | $ | 483 | $ | 303 | $ | — | $ | 6,304 | |||||||||
For the period from January 1, 2015 to October 8, 2015 (Predecessor) | $ | 4,733 | $ | 1,511 | $ | — | $ | (726 | ) | $ | 5,518 | ||||||||
Reserve for inventory excess and obsolescence: | |||||||||||||||||||
For the year ended December 31, 2017 (Successor) | $ | 6,722 | $ | 409 | $ | — | $ | — | $ | 7,131 | |||||||||
For the year ended December 31, 2016 (Successor) | $ | 4,025 | $ | 2,540 | $ | 157 | $ | — | $ | 6,722 | |||||||||
100
Item 9. Changes in and Disagreements with Accountants on Accounting and Financial Disclosure.
Not applicable.
Item 9A. Controls and Procedures.
Evaluation of Disclosure Controls and Procedures
We maintain disclosure controls and procedures (as defined in Rule 13a-15(e) of the Exchange Act). As required by Rule 13a-15(b) under the Exchange Act, management carried out an evaluation, under the supervision and with the participation of our Chief Executive Officer and our Chief Financial Officer, of the effectiveness of the design and operation of our disclosure controls and procedures as of the end of the period covered by this report. Based on the foregoing, our Chief Executive Officer and Chief Financial Officer concluded that, as of the end of the period covered by this report, our disclosure controls and procedures were effective.
Management's Report on Internal Control Over Financial Reporting
The SEC, as directed by Section 404 of the Sarbanes-Oxley Act of 2002, adopted rules which require the Company to include in this Annual Report on Form 10-K, an assessment by management of the effectiveness of the Company’s internal control over financial reporting as defined in Rule 13a-15(f) under the Exchange Act. In addition, the Company’s independent auditors must attest to and report on the effectiveness of the Company’s internal control over financial reporting.
Our management is responsible for establishing and maintaining adequate internal control over financial reporting. All internal control systems, no matter how well designed, have inherent limitations. Therefore, even those systems determined to be effective can provide only reasonable assurance with respect to financial statement preparation and presentation.
As required by Rule 13a-15(c) under the Exchange Act, under the supervision and with the participation of our management, including our Chief Executive Officer and Chief Financial Officer, we conducted an evaluation of the effectiveness of our internal control over financial reporting based on the framework in Internal Control-Integrated Framework (2013) issued by the Committee of Sponsoring Organizations of the Treadway Commission. Based on this evaluation, under the framework in Internal Control-Integrated Framework (2013), our management concluded that our internal control over financial reporting was effective as of December 31, 2017.
The effectiveness of our internal control over financial reporting as of December 31, 2017 has been audited by Deloitte & Touche LLP, an independent registered public accounting firm, as stated in their audit report, which is included herein.
Changes Internal Control over Financial Reporting
There were no changes in our internal control over financial reporting that occurred during the quarter ended December 31, 2017 that have materially affected, or are reasonably likely to materially affect, our internal control over financial reporting.
Limitations on Effectiveness of Controls
Our management, including our Chief Executive Officer and Chief Financial Officer, does not expect that our disclosure controls and procedures or our system of internal control over financial reporting will prevent or detect all errors and all fraud. A control system, no matter how well designed or operated, can provide only reasonable, but not absolute, assurance that the objectives of the system of internal control are met. The design of our control system reflects the fact that there are resource constraints, and that the benefits of such control system must be considered relative to their costs. Further, because of the inherent limitations in all control systems, no evaluation of controls can provide absolute assurance that all control failures and instances of fraud, if any, within the Company have been detected. These inherent limitations include the realities that judgments in decision-making can be faulty and that breakdowns can occur because of simple error or mistake. Additionally, controls can be circumvented by the intentional acts of individuals, by collusion of two or more people, or by management override of the controls. The design of any system of controls is also based in part on certain assumptions about the likelihood of future events, and there can be no assurance that the design of any particular control will always succeed in achieving its objective under all potential future conditions.
101
Item 9B. Other Information.
Not applicable.
102
REPORT OF INDEPENDENT REGISTERED PUBLIC ACCOUNTING FIRM
To the Stockholders and the Board of Directors of
Foundation Building Materials, Inc.
Opinion on Internal Control over Financial Reporting
We have audited the internal control over financial reporting of Foundation Building Materials, Inc. and subsidiaries (the “Company”) as of December 31, 2017, based on criteria established in Internal Control - Integrated Framework (2013) issued by the Committee of Sponsoring Organizations of the Treadway Commission (COSO). In our opinion, the Company maintained, in all material respects, effective internal control over financial reporting as of December 31, 2017, based on criteria established in Internal Control - Integrated Framework (2013) issued by COSO.
We have also audited, in accordance with the standards of the Public Company Accounting Oversight Board (United States) (PCAOB), the consolidated financial statements as of and for the year ended December 31, 2017, of the Company and our report dated February 26, 2018, expressed an unqualified opinion on those consolidated financial statements.
Basis for Opinion
The Company’s management is responsible for maintaining effective internal control over financial reporting and for its assessment of the effectiveness of internal control over financial reporting, included in the accompanying Management’s Report on Internal Control Over Financial Reporting. Our responsibility is to express an opinion on the Company’s internal control over financial reporting based on our audit. We are a public accounting firm registered with the PCAOB and are required to be independent with respect to the Company in accordance with the U.S. federal securities laws and the applicable rules and regulations of the Securities and Exchange Commission and the PCAOB.
We conducted our audit in accordance with the standards of the PCAOB. Those standards require that we plan and perform the audit to obtain reasonable assurance about whether effective internal control over financial reporting was maintained in all material respects. Our audit included obtaining an understanding of internal control over financial reporting, assessing the risk that a material weakness exists, testing and evaluating the design and operating effectiveness of internal control based on the assessed risk, and performing such other procedures as we considered necessary in the circumstances. We believe that our audit provides a reasonable basis for our opinion.
Definition and Limitations of Internal Control over Financial Reporting
A company’s internal control over financial reporting is a process designed to provide reasonable assurance regarding the reliability of financial reporting and the preparation of financial statements for external purposes in accordance with generally accepted accounting principles. A company’s internal control over financial reporting includes those policies and procedures that (1) pertain to the maintenance of records that, in reasonable detail, accurately and fairly reflect the transactions and dispositions of the assets of the company; (2) provide reasonable assurance that transactions are recorded as necessary to permit preparation of financial statements in accordance with generally accepted accounting principles, and that receipts and expenditures of the company are being made only in accordance with authorizations of management and directors of the company; and (3) provide reasonable assurance regarding prevention or timely detection of unauthorized acquisition, use, or disposition of the company’s assets that could have a material effect on the financial statements.
Because of its inherent limitations, internal control over financial reporting may not prevent or detect misstatements. Also, projections of any evaluation of effectiveness to future periods are subject to the risk that controls may become inadequate because of changes in conditions, or that the degree of compliance with the policies or procedures may deteriorate.
/s/ Deloitte & Touche LLP
Costa Mesa, CA
February 26, 2018
103
PART III
Item 10. Directors, Executive Officers, and Corporate Governance.
The information required by this Item 10 will be included in the Proxy Statement for our 2018 Annual Meeting of Stockholders, which will be filed no later than 120 days after the close of our fiscal year ended December 31, 2017, and is incorporated by reference herein.
Item 11. Executive Compensation.
The information required by this Item 11 will be included in the Proxy Statement for our 2018 Annual Meeting of Stockholders, which will be filed no later than 120 days after the close of our fiscal year ended December 31, 2017, and is incorporated by reference herein.
Item 12. Security Ownership of Certain Beneficial Owners and Management and Related Stockholder Matters.
The information required by this Item 12 will be included in the Proxy Statement for our 2018 Annual Meeting of Stockholders, which will be filed no later than 120 days after the close of our fiscal year ended December 31, 2017, and is incorporated by reference herein.
Item 13. Certain Relationships and Related Transactions, and Director Independence.
The information required by this Item 13 will be included in the Proxy Statement for our 2018 Annual Meeting of Stockholders, which will be filed no later than 120 days after the close of our fiscal year ended December 31, 2017, and is incorporated by reference herein.
Item 14. Principal Accounting Fees and Services.
The information required by Item 14 will be included in the Proxy Statement for our 2018 Annual Meeting of Stockholders, which will be filed no later than 120 days after the close of our fiscal year ended December 31, 2017, and is incorporated by reference herein.
104
PART IV
Item 15. Exhibits, Financial Statement Schedules.
(a) The following are filed as part of this Annual Report:
1.Financial Statements
The following consolidated financial statements for Foundation Building Materials, Inc. are included in Item 8, Financial Statements and Supplementary Data.
•Balance Sheets at December 31, 2017 and December 31, 2016
•Consolidated Statements of Operations and Comprehensive Income (Loss) for the Year ended December 31, 2017, Year ended December 31, 2016, the Period from October 9, 2015 to December 31, 2015 and the Period from January 1, 2015 to October 8, 2015.
•Consolidated Statements of Stockholders' Equity for the Year ended December 31, 2017, Year ended December 31, 2016, the Period from October 9, 2015 to December 31, 2015 and the Period from January 1, 2015 to October 8, 2015.
•Consolidated Statements of Cash Flows for the Year ended December 31, 2017, Year ended December 31, 2016, the Period from October 9, 2015 to December 31, 2015 and the Period from January 1, 2015 to October 8, 2015.
•Notes to Consolidated Financial Statements
2. Financial Statements Schedules
The following Schedule for Foundation Building Materials, Inc. is included in Item 8, Financial Statements and Supplementary Data:
•Schedule II - Valuation and Qualifying Accounts
3. Exhibits
The exhibits listed in the Exhibit Index immediately below are filed as part of this Annual Report on Form 10-K, or are incorporated by reference herein.
105
EXHIBIT INDEX
Exhibit No. | Description of Exhibit | Form | File No. | Incorporated by Reference Exhibit | Filing Date | Filed Herewithin |
S-1 | 333-215557 | 2.1 | 1/13/2017 | |||
S-1 | 333-215557 | 2.2 | 1/13/2017 | |||
S-1 | 333-215557 | 3.1 | 1/31/2017 | |||
S-1 | 333-215557 | 3.2 | 1/31/2017 | |||
S-1 | 333-215557 | 4.1 | 1/31/2017 | |||
S-1 | 333-215557 | 4.2 | 1/13/2017 | |||
S-1 | 333-215557 | 10.1 | 1/13/2017 | |||
S-1 | 333-215557 | 10.2 | 1/13/2017 | |||
S-1 | 333-215557 | 10.3 | 1/13/2017 | |||
S-1 | 333-215557 | 10.4 | 1/31/2017 | |||
S-1 | 333-215557 | 10.6 | 1/13/2017 | |||
S-1 | 333-215557 | 10.7 | 1/13/2017 | |||
S-1 | 333-215557 | 10.8 | 1/13/2017 | |||
S-8 | 333-216059 | 99.1 | 2/14/2017 | |||
S-1 | 333-215557 | 10.10 | 1/31/2017 | |||
S-1 | 333-215557 | 10.11 | 1/31/2017 | |||
S-1 | 333-215557 | 10.12 | 1/31/2017 | |||
S-1 | 333-215557 | 10.13 | 1/31/2017 | |||
S-1 | 333-215557 | 10.14 | 1/31/2017 | |||
S-1 | 333-215557 | 10.15 | 1/13/2017 | |||
S-1 | 333-215557 | 10.16 | 1/13/2017 | |||
10-K | 10.17 | 3/28/2017 | ||||
10-K | 10.18 | 3/28/2017 | ||||
8-K | 99.1 | 3/30/2017 | ||||
X | ||||||
X | ||||||
X | ||||||
X | ||||||
X | ||||||
101.INS | XBRL Instance Document | X | ||||
101.SCH | XBRL Taxonomy Extension Schema Document | X | ||||
101.CAL | XBRL Taxonomy Extension Calculation Linkbase Document | X | ||||
101.DEF | XBRL Taxonomy Extension Definition Linkbase Document | X | ||||
101.LAB | XBRL Taxonomy Extension Label Linkbase Document | X | ||||
101.PRE | XBRL Taxonomy Extension Presentation Linkase Document | X | ||||
# | Denotes management compensatory plan or arrangement |
+ | Certain schedules to this agreement have been omitted in accordance with Item 601(b)(2) of Regulation S-K. A copy of any omitted schedules will be furnished to the SEC upon request. |
Item 16. Form 10-K Summary
Not applicable.
SIGNATURES
Pursuant to the requirements of Section 13 or 15(d) of the Securities Exchange Act of 1934, the registrant has duly caused this report to be signed on its behalf by the undersigned, thereunto duly authorized.
Foundation Building Materials, Inc. | |
By: /s/ RICHARD TILLEY | |
Name: Richard Tilley | |
Title: Vice President, Secretary and General Counsel | |
Date: February 26, 2018 | |
Pursuant to the requirements of the Securities Exchange Act of 1934, this report has been signed below by the following persons on behalf of the registrant and in the capacities and on the date indicated.
/s/ RUBEN MENDOZA _________________________________ Ruben Mendoza | President and Chief Executive Officer, Director (Principal Executive Officer) | February 26, 2018 |
/s/ JOHN GOREY _________________________________ John Gorey | Chief Financial Officer (Principal Financial Officer) | February 26, 2018 |
/s/ BARBARA BITZER _________________________________ Barbara Bitzer | Chief Accounting Officer (Principal Accounting Officer) | February 26, 2018 |
/s/ KEVIN BARNER _________________________________ Kevin Barner | Director | February 26, 2018 |
/s/ CHASE HAGIN _________________________________ Chase Hagin | Director | February 26, 2018 |
/s/ MATTHEW ESPE _________________________________ MATTHEW ESPE | Director | February 26, 2018 |
/s/ FAREED KHAN _________________________________ Fareed Khan | Director | February 26, 2018 |
/s/ DOMINIC LAVALLE _________________________________ Dominic LaValle | Director | February 26, 2018 |
/s/ CHRIS MEYER _________________________________ Chris Meyer | Director | February 26, 2018 |
/s/ JAMES UNDERHILL _________________________________ James Underhill | Director | February 26, 2018 |
/s/ KYLE VOLLUZ _________________________________ Kyle Volluz | Director | February 26, 2018 |
/s/ GRANT WILBECK _________________________________ Grant Wilbeck | Director | February 26, 2018 |