Attached files
| file | filename |
|---|---|
| 8-K - 8-K - Assertio Therapeutics, Inc | a18-7163_18k.htm |
![]()
Depomed Announces Fourth Quarter and Full Year 2017 Financial Results
- Annual Net Revenues of $381 Million -
- Collegium, Slán Transactions and Expanded Neurology Field Force Position Company for Improved Profitability in 2018 and Beyond —
- New Corporate Headquarters Expected to be Operational in the Third Quarter -
- Conference Call Scheduled for Today at 4:30 PM EST; Dial In Information Below -
NEWARK, California, February 27, 2018 - Depomed, Inc. (Nasdaq: DEPO) today reported financial results for the quarter and twelve months ended December 31, 2017 and provided an update to the business.
“2017 was a challenging year for Depomed, and in response we have taken decisive steps to strengthen and diversify our business,” said Arthur Higgins, President and CEO of Depomed. “During the fourth quarter, we not only introduced but also began to implement our new three pillar strategy of Maintain, Grow and Build positioning the company for improved profitability in 2018 and beyond.”
Business and Financial Highlights
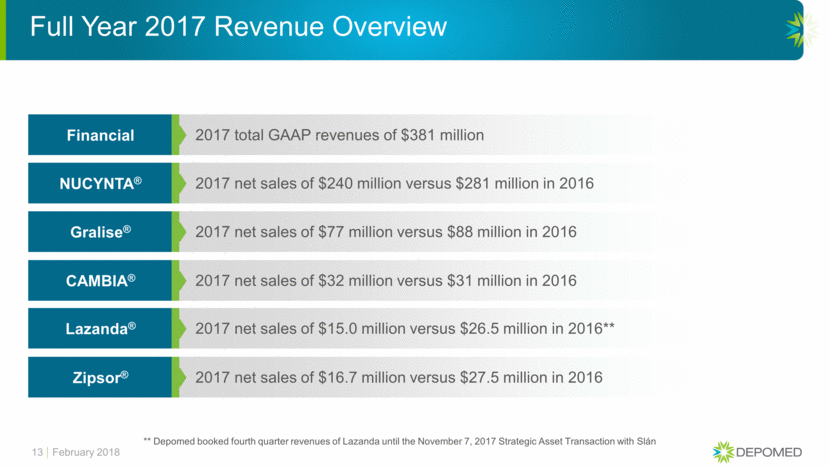
· Full year net revenues were $381 million
· Full year GAAP net loss of ($102) million or ($1.63) per share
· Full year non-GAAP adjusted EBITDA of $117 million
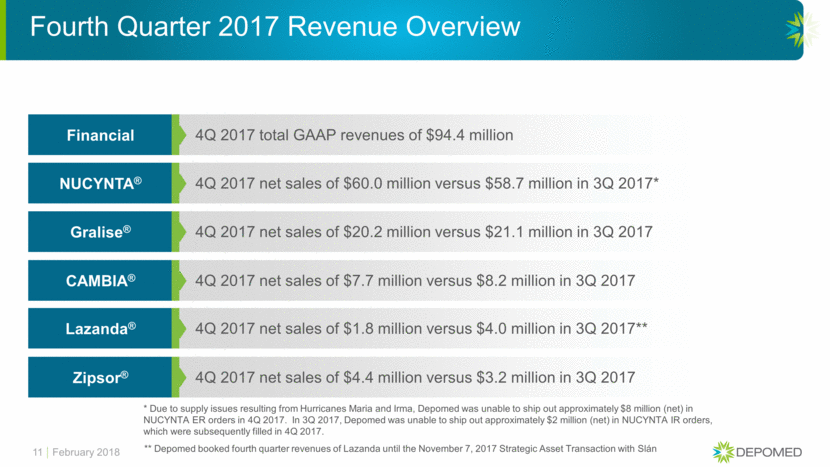
· Fourth quarter 2017 net revenues were $94 million
· Fourth quarter 2017 GAAP net loss of ($33) million or ($0.52) per share
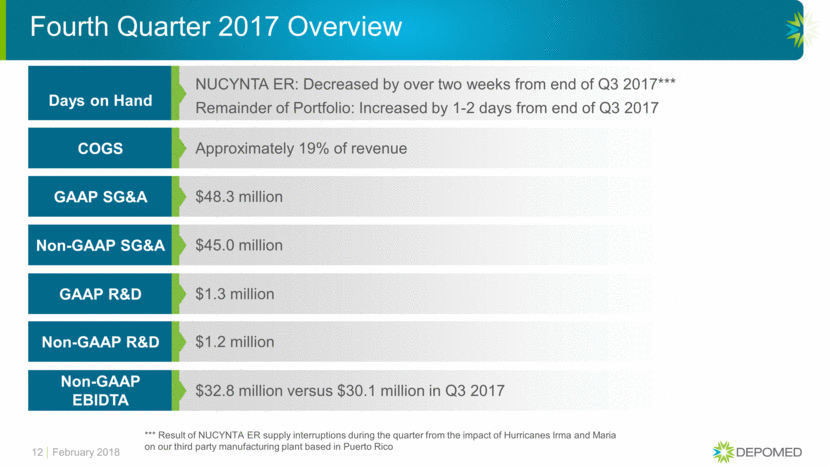
· Fourth quarter 2017 non-GAAP adjusted EBITDA of $33 million
· Fourth quarter 2017 ending cash and marketable securities were $128 million
· NUCYNTA® Commercialization Agreement with Collegium Pharmaceutical provides minimum royalties on net sales of NUCYNTA® and NUCYNTA ER®
· Acquisition of rights to cosyntropin (Synthetic ACTH Depot) creates new specialty/orphan franchise
· Lazanda® sale to Slán Medicinal Holdings
· Company restructuring and corporate headquarters relocation aligns with new business model
Collegium Pharmaceutical Commercialization Agreement Maintains a Strong NUCYNTA® Franchise
In January 2018, Depomed closed a Commercialization Agreement with Collegium Pharmaceutical, Inc. (“Collegium”) under which Collegium will commercialize both NUCYNTA Extended Release and NUCYNTA Immediate Release and, in exchange, for the first four years of the agreement, Depomed expects to receive a minimum royalty of $135 million per year.
Slán Medicinal Holdings Strategic Asset Transaction Diversifies Portfolio and Creates New Specialty/Orphan Franchise
In November 2017, Depomed entered into a Strategic Asset Transaction with Slán Medicinal Holdings Limited (“Slán”) under which Depomed acquired from Slán the rights to market the specialty drug candidate, cosyntropin (Synthetic ACTH Depot) in the United States and divested its Lazanda (fentanyl) nasal spray CII to Slán. This transaction formed the foundation of Depomed’s new Specialty/ Orphan
portfolio. Under the terms of the agreement, West Therapeutic Development, a subsidiary of Slán, is expected to submit a New Drug Application with the U.S. Food and Drug Administration for a to-be-disclosed first indication for cosyntropin in late 2018, with the goal of a potential launch in late 2019 or early 2020. In parallel, Depomed is pursuing a second indication for cosyntropin in infantile spasms, a specific seizure type seen in infantile epilepsy syndrome.
Neurology Salesforce Expansion Expected to Grow Business
In September 2017, Depomed expanded its Neurology salesforce to 90 representatives who are focused on Gralise®, CAMBIA®, and Zipsor®. The Company believes this sales platform will increase sales of these products and allow for the potential addition of other neurology-based product acquisitions.
Corporate Restructuring and Corporate Headquarters Relocation Aligns with New Business Model
In December 2017, Depomed announced a restructuring and headquarters relocation to align Depomed’s staff, office size and location with its new business model. The restructuring reduces headquarters’ staff by approximately 40% and the headquarters’ office space requirement by 50%. The Company is in negotiations to move to a yet to be disclosed location and expects to be fully operational in its new headquarters in the third quarter of 2018.
Puerto Rico Product Supply Update
Results for the fourth quarter of 2017 were negatively impacted by shortages of certain dosage strengths of NUCYNTA ER. While Depomed’s manufacturing partner for NUCYNTA ER has informed us that their plant is now fully operational, they are still working to fill back orders. As a result, there have been spot outages of certain strengths of NUCYNTA ER. While this situation may continue into the future, the Company believes that, based on current information, supply should return to normalized levels by mid-March 2018.
Cebranopadol Development Update
In January 2018, consistent with the Company’s decision to cease commercialization of opioids, Depomed provided to Grünenthal GmbH (“Grünenthal”), 120 days’ written notice of the termination of the December 2015 license agreement between Depomed and Grünenthal and returned to Grünenthal the U.S. and Canadian rights to cebranopadol, an opioid analgesic in development for the treatment of moderate to severe chronic nociceptive and neuropathic pain.
Revenue Summary
REVENUES (GAAP BASIS)
(in thousands, unaudited)
|
|
|
Three Months Ended |
|
Twelve Months Ended |
| ||||||||
|
|
|
December 31, |
|
December 31, |
| ||||||||
|
|
|
2017 |
|
2016 |
|
2017 (1) |
|
2016 |
| ||||
|
|
|
|
|
|
|
|
|
|
| ||||
|
Product sales, net: |
|
|
|
|
|
|
|
|
| ||||
|
Nucynta products |
|
$ |
60,018 |
|
$ |
74,693 |
|
$ |
239,539 |
|
$ |
281,261 |
|
|
Gralise |
|
20,208 |
|
24,995 |
|
77,034 |
|
88,446 |
| ||||
|
Cambia |
|
7,749 |
|
8,373 |
|
31,597 |
|
31,273 |
| ||||
|
Lazanda |
|
1,770 |
|
7,454 |
|
15,010 |
|
26,547 |
| ||||
|
Zipsor |
|
4,415 |
|
8,160 |
|
16,700 |
|
27,539 |
| ||||
|
Total product sales, net |
|
94,160 |
|
123,675 |
|
379,880 |
|
455,066 |
| ||||
|
|
|
|
|
|
|
|
|
|
| ||||
|
Royalties |
|
248 |
|
236 |
|
844 |
|
831 |
| ||||
|
|
|
|
|
|
|
|
|
|
| ||||
|
Total revenues (GAAP Basis) |
|
$ |
94,408 |
|
$ |
123,911 |
|
$ |
380,724 |
|
$ |
455,897 |
|
(1) In the the first quarter of 2017, the Company reserved an incremental $4.7 million associated with a dispute with a pharmacy benefit manager. This dispute was settled in the fourth quarter of 2017 at an amount equal to the Company’s reserve. The $4.7 million has been allocated to the specific products subject to the dispute and settlement.
2018 Financial Guidance
The Company is providing the following 2018 financial guidance.
|
|
|
Guidance |
|
Neurology Franchise Net Sales |
|
$120 to $125 million |
|
GAAP SG&A Expense |
|
$123 to $133 million |
|
GAAP R&D Expense |
|
$11 to $16 million |
|
Non-GAAP SG&A Expense |
|
$110 to $120 million |
|
Non-GAAP R&D Expense |
|
$10 to $15 million |
|
GAAP Net Loss |
|
($72) to ($82) million |
|
Non-GAAP Adjusted EBITDA |
|
$125 to $135 million |
As the Company is no longer responsible for the commercialization of the NUCYNTA franchise, the Company is not providing revenue guidance on total revenue. The difference between GAAP Expenses and Non-GAAP Expenses relates to stock based compensation.
Non-GAAP Financial Measures
To supplement our financial results presented on a U.S. generally accepted accounting principles, or GAAP, basis, we have included information about non-GAAP adjusted earnings, non-GAAP adjusted earnings per share and non-GAAP adjusted EBITDA, non-GAAP financial measures, as useful operating metrics. We believe that the presentation of these non-GAAP financial measures, when viewed with our results under GAAP and the accompanying reconciliation, provides supplementary information to analysts, investors, lenders, and our management in assessing the Company’s performance and results from period to period. We use these non-GAAP measures internally to understand, manage and evaluate the Company’s performance, and in part, in the determination of bonuses for executive officers and employees. These non-GAAP financial measures should be considered in addition to, and not a substitute for, or superior to, net income or other financial measures calculated in accordance with GAAP. Non-GAAP adjusted earnings and non-GAAP adjusted earnings per share are not based on any standardized methodology prescribed by GAAP and represent GAAP net income (loss) and GAAP earnings (loss) per share adjusted to exclude amortization, IPR&D and non-cash adjustments related to product acquisitions, stock-based compensation expense, non-cash interest expense related to debt, costs associated with the special meeting requests made by an activist investor and CEO transition, costs associated with an attempted debt refinancing, restructuring costs, adjustments associated with non-recurring legal settlements and disputes, and to adjust for the tax effect related to each of the non-GAAP adjustments. Non-GAAP adjusted EBITDA is not based on any standardized methodology prescribed by GAAP and represents GAAP net income (loss) adjusted to exclude interest income, interest expense, amortization, IPR&D and non-cash adjustments related to product acquisitions, stock-based compensation expense, depreciation, taxes, transaction costs, restructuring costs, adjustments related to non-recurring legal settlements and disputes, costs associated with an attempted debt refinancing, the special meeting requests made by an activist investor, and CEO transition. Non-GAAP financial measures used by us may be calculated differently from, and therefore may not be comparable to, non-GAAP measures used by other companies.
Conference Call and Webcast
Depomed will host a conference call today, Tuesday, February 27, 2018 beginning at 4:30 p.m. EST (1:30 p.m. PST) to discuss its results. This event can be accessed in three ways:
· From the Depomed website: http://investor.depomedinc.com/ Please access the website 15 minutes prior to the start of the call to download and install any necessary audio software.
· By telephone: Participants can access the call by dialing (844) 839-0046 (United States) or (857) 270-6032 (International) referencing Conference ID 2157887.
· By replay: A replay of the webcast will be located under the Investor Relations section of Depomed’s website approximately two hours after the conclusion of the live call and will be available for three months.
About Depomed
Depomed is a leading specialty pharmaceutical company committed to putting the patient first in everything it does. Depomed is focused on enhancing the lives of patients, families, physicians, providers and payors through the commercialization of products in the areas of pain and neurology, and in the development of drugs in areas of unmet medical need. Depomed currently markets three medicines focused on neuropathic pain and migraine through its neurology and pain franchises and its emerging specialty/orphan franchises is focused on orphan drug indications and areas of unmet medical need. To learn more about Depomed, visit www.depomed.com.
“Safe Harbor” Statement under the Private Securities Litigation Reform Act of 1995. The statements that are not historical facts contained in this release are forward-looking statements that involve risks and uncertainties including, but not limited to, the commercialization of Gralise, CAMBIA, and Zipsor, royalties associated with Collegium’s commercialization of NUCYNTA and NUCYNTA ER, Depomed’s financial outlook for 2018 and expectations regarding financial results and potential business opportunities and other risks detailed in the Company’s Securities and Exchange Commission filings, including the Company’s most recent Annual Report on Form 10-K and most recent Quarterly Report on Form 10-Q. The inclusion of forward-looking statements should not be regarded as a representation that any of the Company’s plans or objectives will be achieved. You are cautioned not to place undue reliance on these forward-looking statements, which speak only as of the date hereof. The Company undertakes no obligation to publicly release the result of any revisions to these forward-looking statements that may be made to reflect events or circumstances after the date hereof or to reflect the occurrence of unanticipated events.
INVESTOR AND MEDIA CONTACTS:
Christopher Keenan
VP, Investor Relations and Corporate Communications
510-744-8000
ckeenan@depomed.com
Dan Peisert
VP, Business Development
dpeisert@depomed.com
CONSOLIDATED STATEMENTS OF OPERATIONS (GAAP BASIS)
(in thousands, except per share amounts)
|
|
|
Three Months Ended |
|
Twelve Months Ended |
| ||||||||
|
|
|
December 31, |
|
December 31, |
| ||||||||
|
|
|
2017 |
|
2016 |
|
2017 |
|
2016 |
| ||||
|
|
|
(unaudited) |
|
(unaudited) |
| ||||||||
|
Revenues: |
|
|
|
|
|
|
|
|
| ||||
|
Product sales, net |
|
$ |
94,160 |
|
$ |
123,675 |
|
$ |
379,880 |
|
$ |
455,066 |
|
|
Royalties |
|
248 |
|
236 |
|
844 |
|
831 |
| ||||
|
Total revenues |
|
94,408 |
|
123,911 |
|
380,724 |
|
455,897 |
| ||||
|
|
|
|
|
|
|
|
|
|
| ||||
|
Costs and expenses: |
|
|
|
|
|
|
|
|
| ||||
|
Cost of sales |
|
17,704 |
|
22,657 |
|
72,598 |
|
87,414 |
| ||||
|
Research and development expense |
|
1,259 |
|
9,154 |
|
13,718 |
|
32,631 |
| ||||
|
Selling, general and administrative expense |
|
48,318 |
|
48,462 |
|
195,695 |
|
204,498 |
| ||||
|
Amortization of intangible assets |
|
25,541 |
|
25,734 |
|
102,745 |
|
106,845 |
| ||||
|
Restructuring charges |
|
9,372 |
|
— |
|
13,247 |
|
— |
| ||||
|
Cosyntropin IPR&D |
|
24,900 |
|
— |
|
24,900 |
|
— |
| ||||
|
Total costs and expenses |
|
127,094 |
|
106,007 |
|
422,904 |
|
431,388 |
| ||||
|
|
|
|
|
|
|
|
|
|
| ||||
|
Loss from operations |
|
(32,685 |
) |
17,904 |
|
(42,180 |
) |
24,509 |
| ||||
|
Interest and other income |
|
77 |
|
175 |
|
681 |
|
485 |
| ||||
|
Loss on prepayment of senior notes |
|
(573 |
) |
— |
|
(5,938 |
) |
(5,777 |
) | ||||
|
Gain on divestiture of Lazanda |
|
17,064 |
|
— |
|
17,064 |
|
— |
| ||||
|
Interest expense |
|
(17,857 |
) |
(20,537 |
) |
(73,552 |
) |
(83,719 |
) | ||||
|
(Provision for)/Benefit from income taxes |
|
870 |
|
(41,910 |
) |
1,429 |
|
(24,218 |
) | ||||
|
Net loss |
|
$ |
(33,104 |
) |
$ |
(44,368 |
) |
$ |
(102,496 |
) |
$ |
(88,720 |
) |
|
|
|
|
|
|
|
|
|
|
| ||||
|
Basic and diluted net loss per share |
|
$ |
(0.52 |
) |
$ |
(0.72 |
) |
$ |
(1.63 |
) |
$ |
(1.45 |
) |
|
Shares used in calculating basic and diluted net loss per share |
|
63,137 |
|
61,695 |
|
62,702 |
|
61,297 |
| ||||
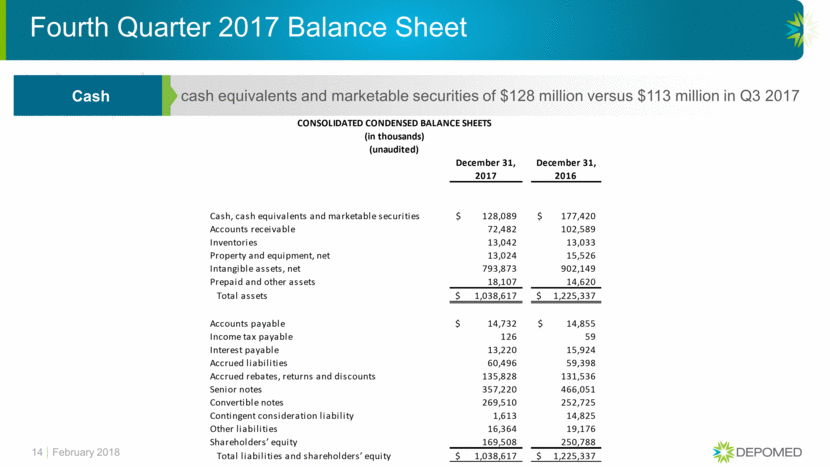
CONSOLIDATED CONDENSED BALANCE SHEETS
(in thousands)
(unaudited)
|
|
|
December 31, |
|
December 31, |
| ||
|
|
|
2017 |
|
2016 |
| ||
|
|
|
|
|
|
| ||
|
Cash, cash equivalents and marketable securities |
|
$ |
128,089 |
|
$ |
177,420 |
|
|
Accounts receivable |
|
72,482 |
|
102,589 |
| ||
|
Inventories |
|
13,042 |
|
13,033 |
| ||
|
Property and equipment, net |
|
13,024 |
|
15,526 |
| ||
|
Intangible assets, net |
|
793,873 |
|
902,149 |
| ||
|
Prepaid and other assets |
|
18,107 |
|
14,620 |
| ||
|
Total assets |
|
$ |
1,038,617 |
|
$ |
1,225,337 |
|
|
|
|
|
|
|
| ||
|
Accounts payable |
|
$ |
14,732 |
|
$ |
14,855 |
|
|
Income tax payable |
|
126 |
|
59 |
| ||
|
Interest payable |
|
13,220 |
|
15,924 |
| ||
|
Accrued liabilities |
|
60,496 |
|
59,398 |
| ||
|
Accrued rebates, returns and discounts |
|
135,828 |
|
131,536 |
| ||
|
Senior notes |
|
357,220 |
|
466,051 |
| ||
|
Convertible notes |
|
269,510 |
|
252,725 |
| ||
|
Contingent consideration liability |
|
1,613 |
|
14,825 |
| ||
|
Other liabilities |
|
16,364 |
|
19,176 |
| ||
|
Shareholders’ equity |
|
169,508 |
|
250,788 |
| ||
|
Total liabilities and shareholders’ equity |
|
$ |
1,038,617 |
|
$ |
1,225,337 |
|
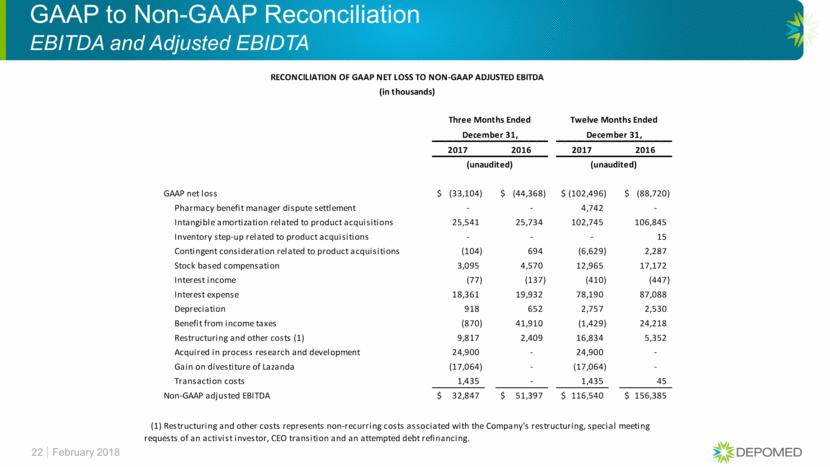
RECONCILIATION OF GAAP NET LOSS TO NON-GAAP ADJUSTED EBITDA
(in thousands)
|
|
|
Three Months Ended |
|
Twelve Months Ended |
| ||||||||
|
|
|
December 31, |
|
December 31, |
| ||||||||
|
|
|
2017 |
|
2016 |
|
2017 |
|
2016 |
| ||||
|
|
|
(unaudited) |
|
(unaudited) |
| ||||||||
|
|
|
|
|
|
|
|
|
|
| ||||
|
GAAP net loss |
|
$ |
(33,104 |
) |
$ |
(44,368 |
) |
$ |
(102,496 |
) |
$ |
(88,720 |
) |
|
Pharmacy benefit manager dispute settlement |
|
— |
|
— |
|
4,742 |
|
— |
| ||||
|
Intangible amortization related to product acquisitions |
|
25,541 |
|
25,734 |
|
102,745 |
|
106,845 |
| ||||
|
Inventory step-up related to product acquisitions |
|
— |
|
— |
|
— |
|
15 |
| ||||
|
Contingent consideration related to product acquisitions |
|
(104 |
) |
694 |
|
(6,629 |
) |
2,287 |
| ||||
|
Stock based compensation |
|
3,095 |
|
4,570 |
|
12,965 |
|
17,172 |
| ||||
|
Interest income |
|
(77 |
) |
(137 |
) |
(410 |
) |
(447 |
) | ||||
|
Interest expense |
|
18,361 |
|
19,932 |
|
78,190 |
|
87,088 |
| ||||
|
Depreciation |
|
918 |
|
652 |
|
2,757 |
|
2,530 |
| ||||
|
Benefit from income taxes |
|
(870 |
) |
41,910 |
|
(1,429 |
) |
24,218 |
| ||||
|
Restructuring and other costs (1) |
|
9,817 |
|
2,409 |
|
16,834 |
|
5,352 |
| ||||
|
Acquired in process research and development |
|
24,900 |
|
— |
|
24,900 |
|
— |
| ||||
|
Gain on divestiture of Lazanda |
|
(17,064 |
) |
— |
|
(17,064 |
) |
— |
| ||||
|
Transaction costs |
|
1,435 |
|
— |
|
1,435 |
|
45 |
| ||||
|
Non-GAAP adjusted EBITDA |
|
$ |
32,847 |
|
$ |
51,397 |
|
$ |
116,540 |
|
$ |
156,385 |
|
(1) Restructuring and other costs represents non-recurring costs associated with the Company’s restructuring, special meeting requests of an activist investor, CEO transition and an attempted debt refinancing.
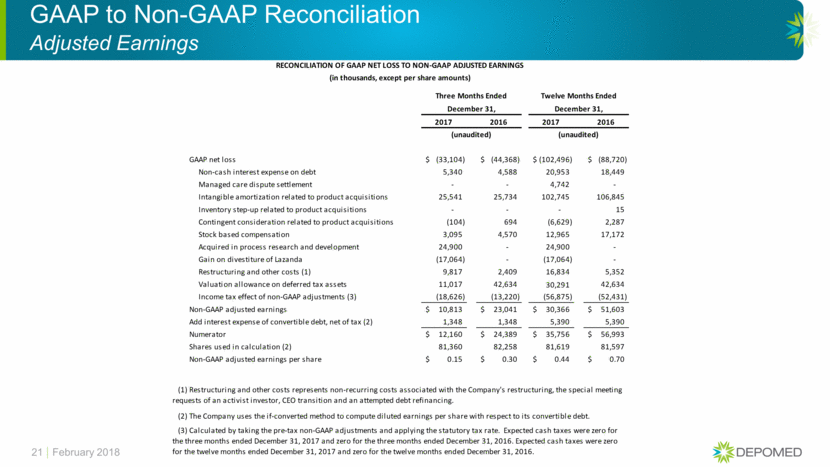
RECONCILIATION OF GAAP NET LOSS TO NON-GAAP ADJUSTED EARNINGS
(in thousands, except per share amounts)
|
|
|
Three Months Ended |
|
Twelve Months Ended |
| ||||||||
|
|
|
December 31, |
|
December 31, |
| ||||||||
|
|
|
2017 |
|
2016 |
|
2017 |
|
2016 |
| ||||
|
|
|
(unaudited) |
|
(unaudited) |
| ||||||||
|
|
|
|
|
|
|
|
|
|
| ||||
|
GAAP net loss |
|
$ |
(33,104 |
) |
$ |
(44,368 |
) |
$ |
(102,496 |
) |
$ |
(88,720 |
) |
|
Non-cash interest expense on debt |
|
5,340 |
|
4,588 |
|
20,953 |
|
18,449 |
| ||||
|
Managed care dispute settlement |
|
— |
|
— |
|
4,742 |
|
— |
| ||||
|
Intangible amortization related to product acquisitions |
|
25,541 |
|
25,734 |
|
102,745 |
|
106,845 |
| ||||
|
Inventory step-up related to product acquisitions |
|
— |
|
— |
|
— |
|
15 |
| ||||
|
Contingent consideration related to product acquisitions |
|
(104 |
) |
694 |
|
(6,629 |
) |
2,287 |
| ||||
|
Stock based compensation |
|
3,095 |
|
4,570 |
|
12,965 |
|
17,172 |
| ||||
|
Acquired in process research and development |
|
24,900 |
|
— |
|
24,900 |
|
— |
| ||||
|
Gain on divestiture of Lazanda |
|
(17,064 |
) |
— |
|
(17,064 |
) |
— |
| ||||
|
Restructuring and other costs (1) |
|
9,817 |
|
2,409 |
|
16,834 |
|
5,352 |
| ||||
|
Valuation allowance on deferred tax assets |
|
11,017 |
|
42,634 |
|
30,291 |
|
42,634 |
| ||||
|
Income tax effect of non-GAAP adjustments (3) |
|
(18,626 |
) |
(13,220 |
) |
(56,875 |
) |
(52,431 |
) | ||||
|
Non-GAAP adjusted earnings |
|
$ |
10,813 |
|
$ |
23,041 |
|
$ |
30,366 |
|
$ |
51,603 |
|
|
Add interest expense of convertible debt, net of tax (2) |
|
1,348 |
|
1,348 |
|
5,390 |
|
5,390 |
| ||||
|
Numerator |
|
$ |
12,160 |
|
$ |
24,389 |
|
$ |
35,756 |
|
$ |
56,993 |
|
|
Shares used in calculation (2) |
|
81,360 |
|
82,258 |
|
81,619 |
|
81,597 |
| ||||
|
Non-GAAP adjusted earnings per share |
|
$ |
0.15 |
|
$ |
0.30 |
|
$ |
0.44 |
|
$ |
0.70 |
|
(1) Restructuring and other costs represents non-recurring costs associated with the Company’s restructuring, the special meeting requests of an activist investor, CEO transition and an attempted debt refinancing.
(2) The Company uses the if-converted method to compute diluted earnings per share with respect to its convertible debt.
(3) Calculated by taking the pre-tax non-GAAP adjustments and applying the statutory tax rate. Expected cash taxes were zero for the three months ended December 31, 2017 and zero for the three months ended December 31, 2016. Expected cash taxes were zero for the twelve months ended December 31, 2017 and zero for the twelve months ended December 31, 2016.
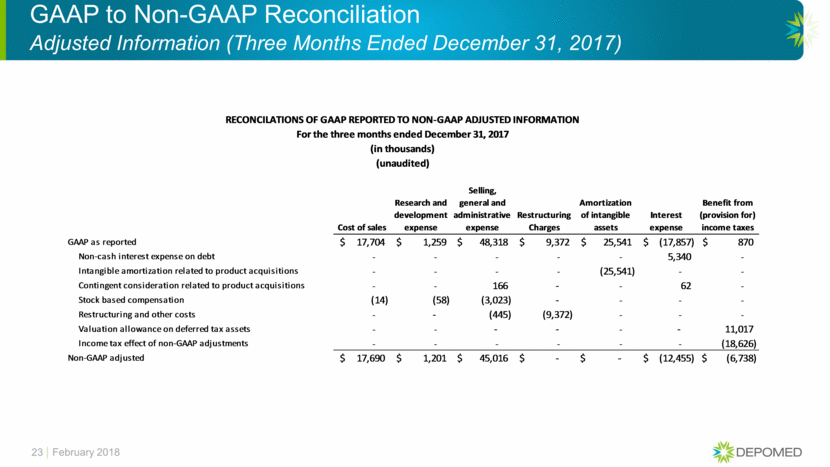
RECONCILATIONS OF GAAP REPORTED TO NON-GAAP ADJUSTED INFORMATION
For the three months ended December 31, 2017
(in thousands)
(unaudited)
|
|
|
Cost of sales |
|
Research and |
|
Selling, |
|
Restructuring |
|
Amortization |
|
Interest |
|
Benefit from |
| |||||||
|
GAAP as reported |
|
$ |
17,704 |
|
$ |
1,259 |
|
$ |
48,318 |
|
$ |
9,372 |
|
$ |
25,541 |
|
$ |
(17,857 |
) |
$ |
870 |
|
|
Non-cash interest expense on debt |
|
— |
|
— |
|
— |
|
— |
|
— |
|
5,340 |
|
— |
| |||||||
|
Intangible amortization related to product acquisitions |
|
— |
|
— |
|
— |
|
— |
|
(25,541 |
) |
— |
|
— |
| |||||||
|
Contingent consideration related to product acquisitions |
|
— |
|
— |
|
166 |
|
— |
|
— |
|
62 |
|
— |
| |||||||
|
Stock based compensation |
|
(14 |
) |
(58 |
) |
(3,023 |
) |
— |
|
— |
|
— |
|
— |
| |||||||
|
Restructuring and other costs |
|
— |
|
— |
|
(445 |
) |
(9,372 |
) |
— |
|
— |
|
— |
| |||||||
|
Valuation allowance on deferred tax assets |
|
— |
|
— |
|
— |
|
— |
|
— |
|
— |
|
11,017 |
| |||||||
|
Income tax effect of non-GAAP adjustments |
|
— |
|
— |
|
— |
|
— |
|
— |
|
— |
|
(18,626 |
) | |||||||
|
Non-GAAP adjusted |
|
$ |
17,690 |
|
$ |
1,201 |
|
$ |
45,016 |
|
$ |
— |
|
$ |
— |
|
$ |
(12,455 |
) |
$ |
(6,738 |
) |
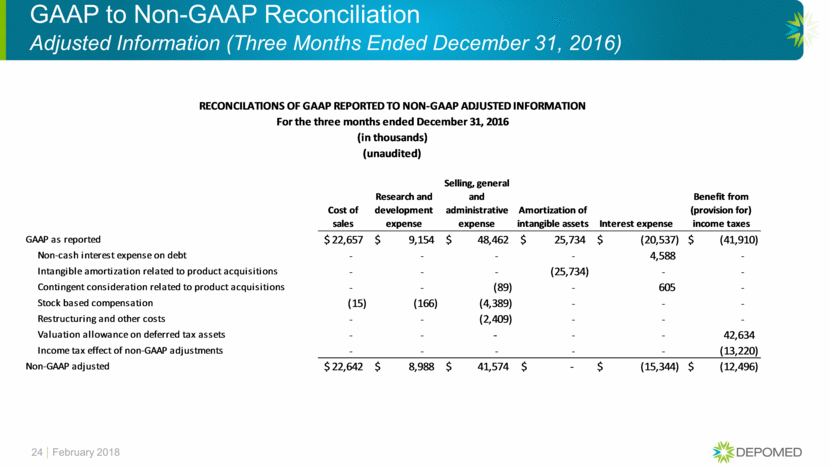
For the three months ended December 31, 2016
(in thousands)
(unaudited)
|
|
|
Cost of |
|
Research and |
|
Selling, general |
|
Amortization of |
|
Interest expense |
|
Benefit from |
| ||||||
|
GAAP as reported |
|
$ |
22,657 |
|
$ |
9,154 |
|
$ |
48,462 |
|
$ |
25,734 |
|
$ |
(20,537 |
) |
$ |
(41,910 |
) |
|
Non-cash interest expense on debt |
|
— |
|
— |
|
— |
|
— |
|
4,588 |
|
— |
| ||||||
|
Intangible amortization related to product acquisitions |
|
— |
|
— |
|
— |
|
(25,734 |
) |
— |
|
— |
| ||||||
|
Contingent consideration related to product acquisitions |
|
— |
|
— |
|
(89 |
) |
— |
|
605 |
|
— |
| ||||||
|
Stock based compensation |
|
(15 |
) |
(166 |
) |
(4,389 |
) |
— |
|
— |
|
— |
| ||||||
|
Restructuring and other costs |
|
— |
|
— |
|
(2,409 |
) |
— |
|
— |
|
— |
| ||||||
|
Valuation allowance on deferred tax assets |
|
— |
|
— |
|
— |
|
— |
|
— |
|
42,634 |
| ||||||
|
Income tax effect of non-GAAP adjustments |
|
— |
|
— |
|
— |
|
— |
|
— |
|
(13,220 |
) | ||||||
|
Non-GAAP adjusted |
|
$ |
22,642 |
|
$ |
8,988 |
|
$ |
41,574 |
|
$ |
— |
|
$ |
(15,344 |
) |
$ |
(12,496 |
) |
RECONCILATIONS OF GAAP REPORTED TO NON-GAAP ADJUSTED INFORMATION
For the twelve months ended December 31, 2017
(in thousands)
(unaudited)
|
|
|
Product Sales |
|
Cost of sales |
|
Research and |
|
Selling, |
|
Restructuring |
|
Amortization |
|
Interest |
|
Benefit from |
| ||||||||
|
GAAP as reported |
|
$ |
380,724 |
|
$ |
72,598 |
|
$ |
13,718 |
|
$ |
195,695 |
|
$ |
13,247 |
|
$ |
102,745 |
|
$ |
(73,552 |
) |
$ |
1,429 |
|
|
Non-cash interest expense on debt |
|
— |
|
— |
|
— |
|
— |
|
— |
|
— |
|
20,953 |
|
— |
| ||||||||
|
Managed care dispute settlement |
|
4,742 |
|
— |
|
— |
|
— |
|
— |
|
— |
|
— |
|
— |
| ||||||||
|
Intangible amortization related to product acquisitions |
|
— |
|
— |
|
— |
|
— |
|
— |
|
(102,745 |
) |
— |
|
— |
| ||||||||
|
Contingent consideration related to product acquisitions |
|
— |
|
— |
|
— |
|
7,708 |
|
— |
|
— |
|
1,079 |
|
— |
| ||||||||
|
Stock based compensation |
|
— |
|
(98 |
) |
(710 |
) |
(12,157 |
) |
— |
|
— |
|
— |
|
— |
| ||||||||
|
Restructuring and other costs |
|
— |
|
— |
|
— |
|
(3,587 |
) |
(13,247 |
) |
— |
|
— |
|
— |
| ||||||||
|
Valuation allowance on deferred tax assets |
|
— |
|
— |
|
— |
|
— |
|
— |
|
— |
|
— |
|
30,291 |
| ||||||||
|
Income tax effect of non-GAAP adjustments |
|
— |
|
— |
|
— |
|
— |
|
— |
|
— |
|
— |
|
(56,875 |
) | ||||||||
|
Non-GAAP adjusted |
|
$ |
385,466 |
|
$ |
72,500 |
|
$ |
13,008 |
|
$ |
187,659 |
|
$ |
— |
|
$ |
— |
|
$ |
(51,520 |
) |
$ |
(25,155 |
) |
RECONCILATIONS OF GAAP REPORTED TO NON-GAAP ADJUSTED INFORMATION
For the twelve months ended December 31, 2016
(in thousands)
(unaudited)
|
|
|
Cost of sales |
|
Research and |
|
Selling, |
|
Amortization |
|
Interest |
|
Benefit from |
| ||||||
|
GAAP as reported |
|
$ |
87,414 |
|
$ |
32,631 |
|
$ |
204,498 |
|
$ |
106,845 |
|
$ |
(83,719 |
) |
$ |
(24,218 |
) |
|
Non-cash interest expense on debt |
|
— |
|
— |
|
— |
|
— |
|
18,449 |
|
— |
| ||||||
|
Intangible amortization related to product acquisitions |
|
— |
|
— |
|
— |
|
(106,845 |
) |
— |
|
— |
| ||||||
|
Inventory step-up related to product acquisitions |
|
(15 |
) |
— |
|
— |
|
— |
|
— |
|
— |
| ||||||
|
Contingent consideration related to product acquisitions |
|
— |
|
— |
|
120 |
|
— |
|
2,407 |
|
— |
| ||||||
|
Stock based compensation |
|
(43 |
) |
(496 |
) |
(16,633 |
) |
— |
|
— |
|
— |
| ||||||
|
Restructuring and other costs |
|
— |
|
— |
|
(5,352 |
) |
— |
|
— |
|
— |
| ||||||
|
Valuation allowance on deferred tax assets |
|
— |
|
— |
|
— |
|
— |
|
— |
|
42,634 |
| ||||||
|
Income tax effect of non-GAAP adjustments |
|
— |
|
— |
|
— |
|
— |
|
— |
|
(52,431 |
) | ||||||
|
Non-GAAP adjusted |
|
$ |
87,356 |
|
$ |
32,135 |
|
$ |
182,633 |
|
$ |
— |
|
$ |
(62,863 |
) |
$ |
(34,015 |
) |
RECONCILIATION OF GAAP NET LOSS PER SHARE TO NON-GAAP ADJUSTED EARNINGS PER SHARE
(unaudited)
|
|
|
Three Months Ended |
|
Twelve Months Ended |
| ||||||||
|
|
|
December 31, |
|
December 31, |
| ||||||||
|
|
|
2017 |
|
2016 |
|
2017 (1) |
|
2016 |
| ||||
|
|
|
|
|
|
|
|
|
|
| ||||
|
GAAP net loss per share |
|
$ |
(0.52 |
) |
$ |
(0.72 |
) |
$ |
(1.63 |
) |
$ |
(1.45 |
) |
|
Conversion from basic shares to diluted shares |
|
0.12 |
|
0.18 |
|
0.38 |
|
0.36 |
| ||||
|
Non-cash interest expense on debt |
|
0.07 |
|
0.06 |
|
0.26 |
|
0.23 |
| ||||
|
Managed care dispute settlement |
|
— |
|
— |
|
0.06 |
|
— |
| ||||
|
Intangible amortization related to product acquisitions |
|
0.31 |
|
0.31 |
|
1.25 |
|
1.31 |
| ||||
|
Contingent consideration related to product acquisitions |
|
(0.00 |
) |
0.01 |
|
(0.08 |
) |
0.03 |
| ||||
|
Stock based compensation |
|
0.04 |
|
0.06 |
|
0.16 |
|
0.21 |
| ||||
|
Acquired in process research and development |
|
0.30 |
|
— |
|
0.30 |
|
— |
| ||||
|
Gain on divestiture of Lazanda |
|
(0.21 |
) |
— |
|
(0.21 |
) |
— |
| ||||
|
Restructuring and other costs |
|
0.12 |
|
0.03 |
|
0.21 |
|
0.06 |
| ||||
|
Valuation allowance on deferred tax assets |
|
0.14 |
|
0.52 |
|
0.37 |
|
0.52 |
| ||||
|
Income tax effect of non-GAAP adjustments |
|
(0.23 |
) |
(0.16 |
) |
(0.70 |
) |
(0.64 |
) | ||||
|
Add interest expense of convertible debt, net of tax |
|
0.02 |
|
0.02 |
|
0.07 |
|
0.07 |
| ||||
|
Non-GAAP adjusted earnings per share |
|
$ |
0.15 |
|
$ |
0.30 |
|
$ |
0.44 |
|
$ |
0.70 |
|
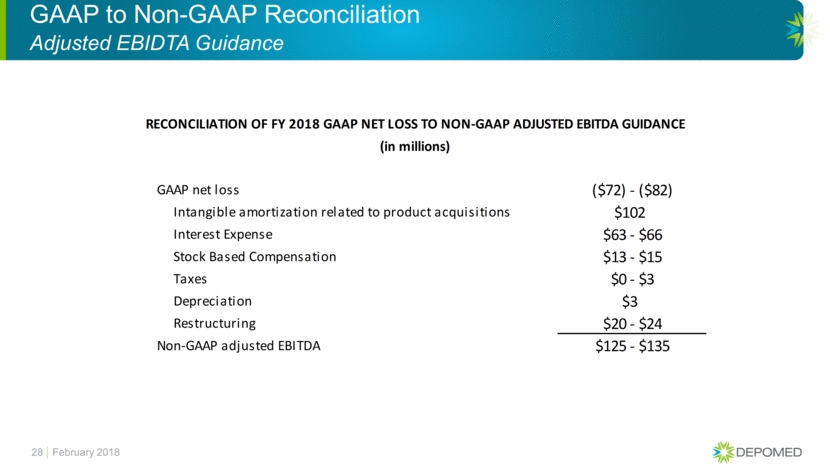
RECONCILIATION OF FY 2018 GAAP NET LOSS TO NON-GAAP ADJUSTED EBITDA GUIDANCE
(in millions)
|
GAAP net loss |
|
($72) - ($82) |
|
|
Intangible amortization related to product acquisitions |
|
$102 |
|
|
Interest Expense |
|
$63 - $66 |
|
|
Stock Based Compensation |
|
$13 - $15 |
|
|
Taxes |
|
$0 - $3 |
|
|
Depreciation |
|
$3 |
|
|
Restructuring |
|
$20 - $24 |
|
|
Non-GAAP adjusted EBITDA |
|
$125 - $135 |
|
Fourth Quarter and Full Year 2017 Financial Update February 27, 2018

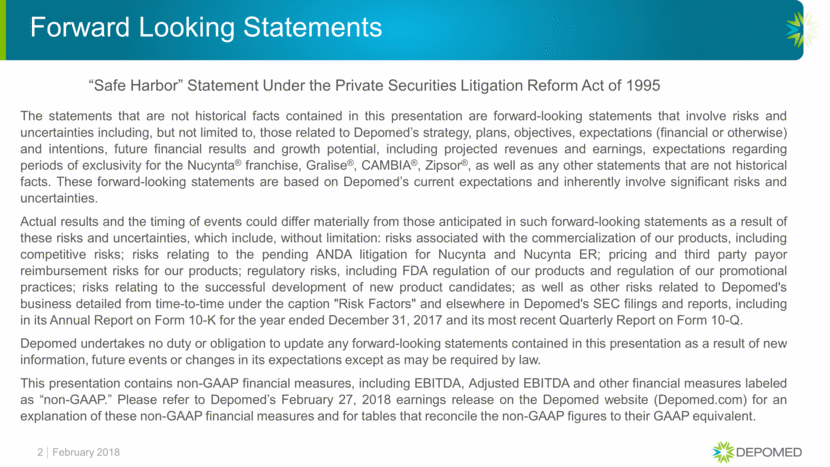
Forward Looking Statements 2 The statements that are not historical facts contained in this presentation are forward-looking statements that involve risks and uncertainties including, but not limited to, those related to Depomed’s strategy, plans, objectives, expectations (financial or otherwise) and intentions, future financial results and growth potential, including projected revenues and earnings, expectations regarding periods of exclusivity for the Nucynta® franchise, Gralise®, CAMBIA®, Zipsor®, as well as any other statements that are not historical facts. These forward-looking statements are based on Depomed’s current expectations and inherently involve significant risks and uncertainties. Actual results and the timing of events could differ materially from those anticipated in such forward-looking statements as a result of these risks and uncertainties, which include, without limitation: risks associated with the commercialization of our products, including competitive risks; risks relating to the pending ANDA litigation for Nucynta and Nucynta ER; pricing and third party payor reimbursement risks for our products; regulatory risks, including FDA regulation of our products and regulation of our promotional practices; risks relating to the successful development of new product candidates; as well as other risks related to Depomed's business detailed from time-to-time under the caption "Risk Factors" and elsewhere in Depomed's SEC filings and reports, including in its Annual Report on Form 10-K for the year ended December 31, 2017 and its most recent Quarterly Report on Form 10-Q. Depomed undertakes no duty or obligation to update any forward-looking statements contained in this presentation as a result of new information, future events or changes in its expectations except as may be required by law. This presentation contains non-GAAP financial measures, including EBITDA, Adjusted EBITDA and other financial measures labeled as “non-GAAP.” Please refer to Depomed’s February 27, 2018 earnings release on the Depomed website (Depomed.com) for an explanation of these non-GAAP financial measures and for tables that reconcile the non-GAAP figures to their GAAP equivalent. “Safe Harbor” Statement Under the Private Securities Litigation Reform Act of 1995 February 2018
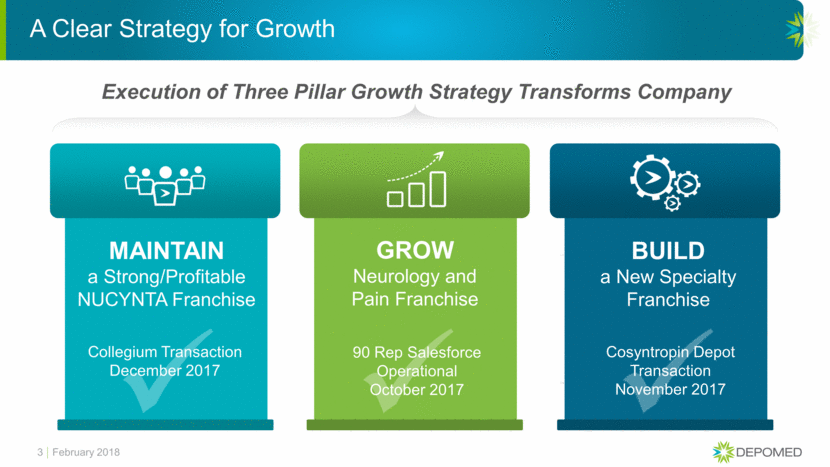
A Clear Strategy for Growth Execution of Three Pillar Growth Strategy Transforms Company 3 MAINTAIN a Strong/Profitable NUCYNTA Franchise GROW Neurology and Pain Franchise BUILD a New Specialty Franchise Collegium Transaction December 2017 90 Rep Salesforce Operational October 2017 Cosyntropin Depot Transaction November 2017 February 2018
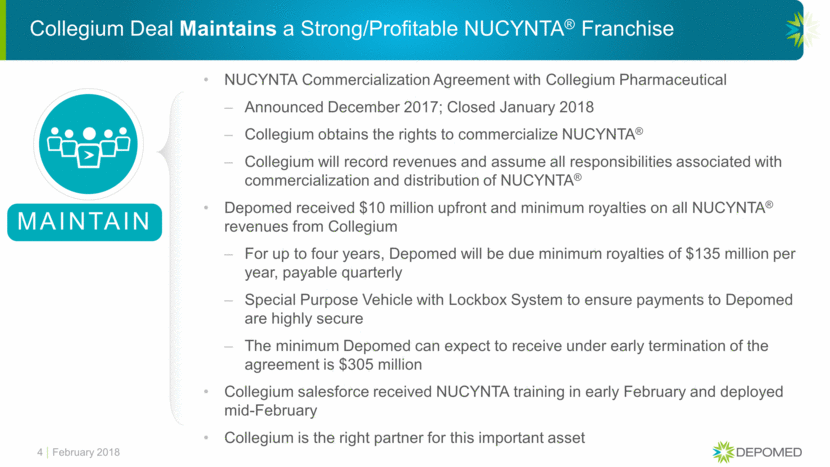
Collegium Deal Maintains a Strong/Profitable NUCYNTA® Franchise 4 MAINTAIN NUCYNTA Commercialization Agreement with Collegium Pharmaceutical Announced December 2017; Closed January 2018 Collegium obtains the rights to commercialize NUCYNTA® Collegium will record revenues and assume all responsibilities associated with commercialization and distribution of NUCYNTA® Depomed received $10 million upfront and minimum royalties on all NUCYNTA® revenues from Collegium For up to four years, Depomed will be due minimum royalties of $135 million per year, payable quarterly Special Purpose Vehicle with Lockbox System to ensure payments to Depomed are highly secure The minimum Depomed can expect to receive under early termination of the agreement is $305 million Collegium salesforce received NUCYNTA training in early February and deployed mid-February Collegium is the right partner for this important asset February 2018
Collegium: Ideal Partner to Take NUCYNTA® to the Next Level Recognized as an emerging leader in pain management and committed to building a leading pain company Xtampza® ER is the fastest growing Extended Release branded opioid Strong home office, commercial and managed care infrastructures Salesforce focused on Pain Specialists with significant overlap with NUCYNTA customers Collegium desired an Immediate Release product and viewed NUCYNTA® IR as best-in-class Xtampza® ER and NUCYNTA® ER’s different MOAs will be positioned as complementary products: Xtampza® ER: Abuse deterrent oxycodone of choice NUCYNTA® ER: Dual MOA and Diabetic Peripheral Neuropathy (DPN) Offering improves the continuum of care for patients with chronic pain 5 Collegium and Depomed Share a Commitment to Putting the Patient First February 2018
GROW Salesforce Optimization Grows Our Neurology and Pain Franchise Relaunch of our 90 representative Neurology salesforce in September Salesforce fully operationalized in October Promotion of Gralise®, Cambia® and for the first time in January 2018, Zipsor® Successful National Sales Meeting held in January Opportunity to examine physician base and reevaluate traditional pharmaceutical targeting Aim is to return to growth by year-end Targeting growing the portfolio with at least one new product in 2018 Goal is to make the franchise EBITDA positive in 2H 2018 6 February 2018
Slán Transaction Builds A New Specialty Franchise November 2017 Asset Transfer Agreement with Slán Establishes a New Specialty Products Business Unit Diversifies portfolio with Cosyntropin (Synthetic ACTH Depot) First of a portfolio of high-value, high-touch specialty/ orphan products positioned to address the needs of patients, physicians and payors 1st Indication (Confidential) NDA filing in late 2018; Potential launch late 2019/ early 2020 2nd Indication (Infantile Spasms) Investigational New Drug (IND) Trial ongoing The Pediatric Epilepsy Research Consortium (Kelly Knupp, M.D., Principal Investigator) Investigator Meeting held in January 15 sites enrolling approximately 400 patients 3 year trial 7 BUILD February 2018
Headquarters Relocation Final negotiations between two sites underway New office is ~31,000 square feet, current office is ~60,000 square feet New location expected to provide better access to specialty pharmaceutical talent Employee migration to commence in second quarter Mirroring of select groups at each location, such as finance, will occur in the second quarter Goal is to have new headquarters fully operational in the third quarter February 2018 8
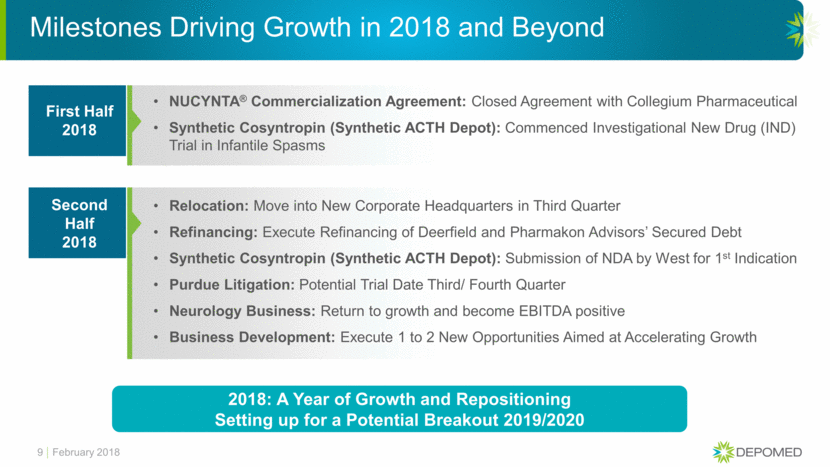
NUCYNTA® Commercialization Agreement: Closed Agreement with Collegium Pharmaceutical Synthetic Cosyntropin (Synthetic ACTH Depot): Commenced Investigational New Drug (IND) Trial in Infantile Spasms Milestones Driving Growth in 2018 and Beyond 9 First Half 2018 Relocation: Move into New Corporate Headquarters in Third Quarter Refinancing: Execute Refinancing of Deerfield and Pharmakon Advisors’ Secured Debt Synthetic Cosyntropin (Synthetic ACTH Depot): Submission of NDA by West for 1st Indication Purdue Litigation: Potential Trial Date Third/ Fourth Quarter Neurology Business: Return to growth and become EBITDA positive Business Development: Execute 1 to 2 New Opportunities Aimed at Accelerating Growth Second Half 2018 2018: A Year of Growth and Repositioning Setting up for a Potential Breakout 2019/2020 February 2018
Fourth Quarter and Full Year 2017 Financial Results August Moretti, SVP Finance and Chief Financial Officer

11 4Q 2017 total GAAP revenues of $94.4 million Financial 4Q 2017 net sales of $60.0 million versus $58.7 million in 3Q 2017* NUCYNTA® 4Q 2017 net sales of $20.2 million versus $21.1 million in 3Q 2017 Gralise® 4Q 2017 net sales of $7.7 million versus $8.2 million in 3Q 2017 CAMBIA® 4Q 2017 net sales of $1.8 million versus $4.0 million in 3Q 2017** Lazanda® 4Q 2017 net sales of $4.4 million versus $3.2 million in 3Q 2017 Zipsor® Fourth Quarter 2017 Revenue Overview February 2018 * Due to supply issues resulting from Hurricanes Maria and Irma, Depomed was unable to ship out approximately $8 million (net) in NUCYNTA ER orders in 4Q 2017. In 3Q 2017, Depomed was unable to ship out approximately $2 million (net) in NUCYNTA IR orders, which were subsequently filled in 4Q 2017. ** Depomed booked fourth quarter revenues of Lazanda until the November 7, 2017 Strategic Asset Transaction with Slán
12 Approximately 19% of revenue COGS $48.3 million GAAP SG&A $45.0 million Non-GAAP SG&A $1.3 million GAAP R&D $1.2 million Non-GAAP R&D $32.8 million versus $30.1 million in Q3 2017 Non-GAAP EBIDTA Fourth Quarter 2017 Overview NUCYNTA ER: Decreased by over two weeks from end of Q3 2017*** Days on Hand February 2018 *** Result of NUCYNTA ER supply interruptions during the quarter from the impact of Hurricanes Irma and Maria on our third party manufacturing plant based in Puerto Rico Remainder of Portfolio: Increased by 1-2 days from end of Q3 2017
13 2017 total GAAP revenues of $381 million Financial 2017 net sales of $240 million versus $281 million in 2016 NUCYNTA® 2017 net sales of $77 million versus $88 million in 2016 Gralise® 2017 net sales of $32 million versus $31 million in 2016 CAMBIA® 2017 net sales of $15.0 million versus $26.5 million in 2016** Lazanda® 2017 net sales of $16.7 million versus $27.5 million in 2016 Zipsor® Full Year 2017 Revenue Overview February 2018 ** Depomed booked fourth quarter revenues of Lazanda until the November 7, 2017 Strategic Asset Transaction with Slán
Fourth Quarter 2017 Balance Sheet 14 cash equivalents and marketable securities of $128 million versus $113 million in Q3 2017 Cash February 2018 CONSOLIDATED CONDENSED BALANCE SHEETS (in thousands) (unaudited) December 31, December 31, 2017 2016 Cash, cash equivalents and marketable securities 128,089 $ 177,420 $ Accounts receivable 72,482 102,589 Inventories 13,042 13,033 Property and equipment, net 13,024 15,526 Intangible assets, net 793,873 902,149 Prepaid and other assets 18,107 14,620 Total assets 1,038,617 $ 1,225,337 $ Accounts payable 14,732 $ 14,855 $ Income tax payable 126 59 Interest payable 13,220 15,924 Accrued liabilities 60,496 59,398 Accrued rebates, returns and discounts 135,828 131,536 Senior notes 357,220 466,051 Convertible notes 269,510 252,725 Contingent consideration liability 1,613 14,825 Other liabilities 16,364 19,176 Shareholders’ equity 169,508 250,788 Total liabilities and shareholders’ equity 1,038,617 $ 1,225,337 $
2018 Full-Year Guidance Guidance Neurology Franchise Net Sales $120 to $125 million GAAP SG&A Expense $123 to $133 million GAAP R&D Expense $11 to $16 million Non-GAAP SG&A Expense $110 to $120 million Non-GAAP R&D Expense $10 to $15 million GAAP Net Loss ($72) to ($82) million Non-GAAP Adjusted EBITDA $125 to $135 million As the Company is no longer responsible for the commercialization of the NUCYNTA franchise, the Company is not providing revenue guidance on total revenue. The difference between GAAP Expenses and Non-GAAP Expenses relates to stock based compensation. February 2018 15

Summary Arthur Higgins, President and Chief Executive Officer

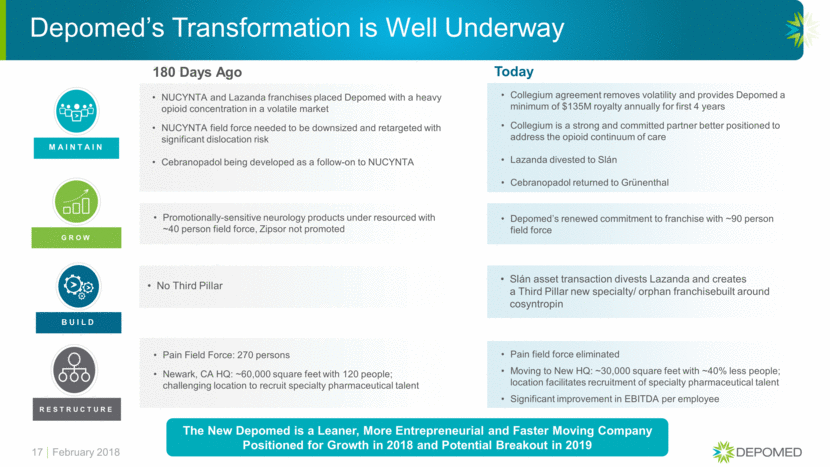
180 Days Ago NUCYNTA and Lazanda franchises placed Depomed with a heavy opioid concentration in a volatile market NUCYNTA field force needed to be downsized and retargeted with significant dislocation risk Cebranopadol being developed as a follow-on to NUCYNTA Promotionally-sensitive neurology products under resourced with ~40 person field force, Zipsor not promoted No Third Pillar Pain Field Force: 270 persons Newark, CA HQ: ~60,000 square feet with 120 people; challenging location to recruit specialty pharmaceutical talent Depomed’s Transformation is Well Underway 17 Today Collegium agreement removes volatility and provides Depomed a minimum of $135M royalty annually for first 4 years Collegium is a strong and committed partner better positioned to address the opioid continuum of care Lazanda divested to Slán Cebranopadol returned to Grünenthal Depomed’s renewed commitment to franchise with ~90 person field force Slán asset transaction divests Lazanda and creates a Third Pillar new specialty/ orphan franchisebuilt around cosyntropin Pain field force eliminated Moving to New HQ: ~30,000 square feet with ~40% less people; location facilitates recruitment of specialty pharmaceutical talent Significant improvement in EBITDA per employee MAINTAIN GROW BUILD RESTRUCTURE February 2018 The New Depomed is a Leaner, More Entrepreneurial and Faster Moving Company Positioned for Growth in 2018 and Potential Breakout in 2019
Questions and Answers

Appendix
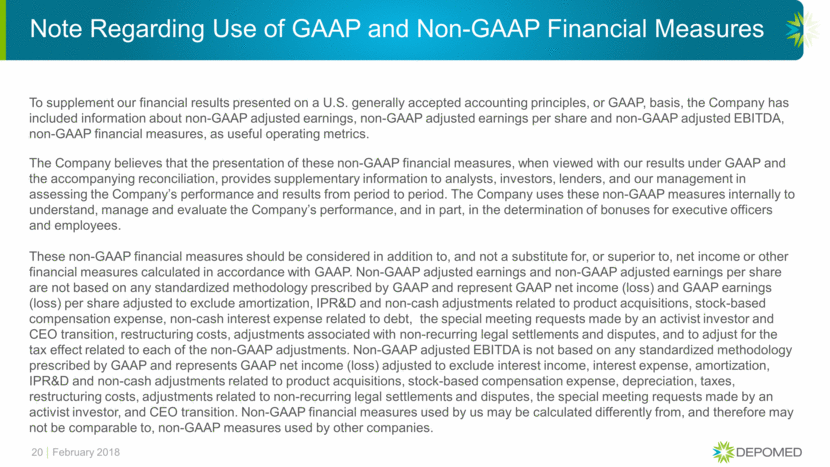
Note Regarding Use of GAAP and Non-GAAP Financial Measures To supplement our financial results presented on a U.S. generally accepted accounting principles, or GAAP, basis, the Company has included information about non-GAAP adjusted earnings, non-GAAP adjusted earnings per share and non-GAAP adjusted EBITDA, non-GAAP financial measures, as useful operating metrics. The Company believes that the presentation of these non-GAAP financial measures, when viewed with our results under GAAP and the accompanying reconciliation, provides supplementary information to analysts, investors, lenders, and our management in assessing the Company’s performance and results from period to period. The Company uses these non-GAAP measures internally to understand, manage and evaluate the Company’s performance, and in part, in the determination of bonuses for executive officers and employees. These non-GAAP financial measures should be considered in addition to, and not a substitute for, or superior to, net income or other financial measures calculated in accordance with GAAP. Non-GAAP adjusted earnings and non-GAAP adjusted earnings per share are not based on any standardized methodology prescribed by GAAP and represent GAAP net income (loss) and GAAP earnings (loss) per share adjusted to exclude amortization, IPR&D and non-cash adjustments related to product acquisitions, stock-based compensation expense, non-cash interest expense related to debt, the special meeting requests made by an activist investor and CEO transition, restructuring costs, adjustments associated with non-recurring legal settlements and disputes, and to adjust for the tax effect related to each of the non-GAAP adjustments. Non-GAAP adjusted EBITDA is not based on any standardized methodology prescribed by GAAP and represents GAAP net income (loss) adjusted to exclude interest income, interest expense, amortization, IPR&D and non-cash adjustments related to product acquisitions, stock-based compensation expense, depreciation, taxes, restructuring costs, adjustments related to non-recurring legal settlements and disputes, the special meeting requests made by an activist investor, and CEO transition. Non-GAAP financial measures used by us may be calculated differently from, and therefore may not be comparable to, non-GAAP measures used by other companies. 20 February 2018
GAAP to Non-GAAP Reconciliation Adjusted Earnings 21 February 2018 RECONCILIATION OF GAAP NET LOSS TO NON-GAAP ADJUSTED EARNINGS (in thousands, except per share amounts) Three Months Ended Twelve Months Ended December 31, December 31, 2017 2016 2017 2016 (unaudited) (unaudited) GAAP net loss (33,104) $ (44,368) $ (102,496) $ (88,720) $ Non-cash interest expense on debt 5,340 4,588 20,953 18,449 Managed care dispute settlement - - 4,742 - Intangible amortization related to product acquisitions 25,541 25,734 102,745 106,845 Inventory step-up related to product acquisitions - - - 15 Contingent consideration related to product acquisitions (104) 694 (6,629) 2,287 Stock based compensation 3,095 4,570 12,965 17,172 Acquired in process research and development 24,900 - 24,900 - Gain on divestiture of Lazanda (17,064) - (17,064) - Restructuring and other costs (1) 9,817 2,409 16,834 5,352 Valuation allowance on deferred tax assets 11,017 42,634 30,291 42,634 Income tax effect of non-GAAP adjustments (3) (18,626) (13,220) (56,875) (52,431) Non-GAAP adjusted earnings 10,813 $ 23,041 $ 30,366 $ 51,603 $ Add interest expense of convertible debt, net of tax (2) 1,348 1,348 5,390 5,390 Numerator 12,160 $ 24,389 $ 35,756 $ 56,993 $ Shares used in calculation (2) 81,360 82,258 81,619 81,597 Non-GAAP adjusted earnings per share 0.15 $ 0.30 $ 0.44 $ 0.70 $ (2) The Company uses the if-converted method to compute diluted earnings per share with respect to its convertible debt. (3) Calculated by taking the pre-tax non-GAAP adjustments and applying the statutory tax rate. Expected cash taxes were zero for the three months ended December 31, 2017 and zero for the three months ended December 31, 2016. Expected cash taxes were zero for the twelve months ended December 31, 2017 and zero for the twelve months ended December 31, 2016. (1) Restructuring and other costs represents non-recurring costs associated with the Company's restructuring, the special meeting requests of an activist investor, CEO transition and an attempted debt refinancing.
GAAP to Non-GAAP Reconciliation EBITDA and Adjusted EBIDTA 22 February 2018 RECONCILIATION OF GAAP NET LOSS TO NON-GAAP ADJUSTED EBITDA (in thousands) Three Months Ended Twelve Months Ended December 31, December 31, 2017 2016 2017 2016 (unaudited) (unaudited) GAAP net loss (33,104) $ (44,368) $ (102,496) $ (88,720) $ Pharmacy benefit manager dispute settlement - - 4,742 - Intangible amortization related to product acquisitions 25,541 25,734 102,745 106,845 Inventory step-up related to product acquisitions - - - 15 Contingent consideration related to product acquisitions (104) 694 (6,629) 2,287 Stock based compensation 3,095 4,570 12,965 17,172 Interest income (77) (137) (410) (447) Interest expense 18,361 19,932 78,190 87,088 Depreciation 918 652 2,757 2,530 Benefit from income taxes (870) 41,910 (1,429) 24,218 Restructuring and other costs (1) 9,817 2,409 16,834 5,352 Acquired in process research and development 24,900 - 24,900 - Gain on divestiture of Lazanda (17,064) - (17,064) - Transaction costs 1,435 - 1,435 45 Non-GAAP adjusted EBITDA 32,847 $ 51,397 $ 116,540 $ 156,385 $ (1) Restructuring and other costs represents non-recurring costs associated with the Company's restructuring, special meeting requests of an activist investor, CEO transition and an attempted debt refinancing.
GAAP to Non-GAAP Reconciliation Adjusted Information (Three Months Ended December 31, 2017) 23 February 2018 Cost of sales Research and development expense Selling, general and administrative expense Restructuring Charges Amortization of intangible assets Interest expense Benefit from (provision for) income taxes GAAP as reported 17,704 $ 1,259 $ 48,318 $ 9,372 $ 25,541 $ (17,857) $ 870 $ Non-cash interest expense on debt - - - - - 5,340 - Intangible amortization related to product acquisitions - - - - (25,541) - - Contingent consideration related to product acquisitions - - 166 - - 62 - Stock based compensation (14) (58) (3,023) - - - - Restructuring and other costs - - (445) (9,372) - - - Valuation allowance on deferred tax assets - - - - - - 11,017 Income tax effect of non-GAAP adjustments - - - - - - (18,626) Non-GAAP adjusted 17,690 $ 1,201 $ 45,016 $ - $ - $ (12,455) $ (6,738) $ RECONCILATIONS OF GAAP REPORTED TO NON-GAAP ADJUSTED INFORMATION For the three months ended December 31, 2017 (in thousands) (unaudited)
GAAP to Non-GAAP Reconciliation Adjusted Information (Three Months Ended December 31, 2016) 24 February 2018 Cost of sales Research and development expense Selling, general and administrative expense Amortization of intangible assets Interest expense Benefit from (provision for) income taxes GAAP as reported 22,657 $ 9,154 $ 48,462 $ 25,734 $ (20,537) $ (41,910) $ Non-cash interest expense on debt - - - - 4,588 - Intangible amortization related to product acquisitions - - - (25,734) - - Contingent consideration related to product acquisitions - - (89) - 605 - Stock based compensation (15) (166) (4,389) - - - Restructuring and other costs - - (2,409) - - - Valuation allowance on deferred tax assets - - - - - 42,634 Income tax effect of non-GAAP adjustments - - - - - (13,220) Non-GAAP adjusted 22,642 $ 8,988 $ 41,574 $ - $ (15,344) $ (12,496) $ (in thousands) (unaudited) RECONCILATIONS OF GAAP REPORTED TO NON-GAAP ADJUSTED INFORMATION For the three months ended December 31, 2016
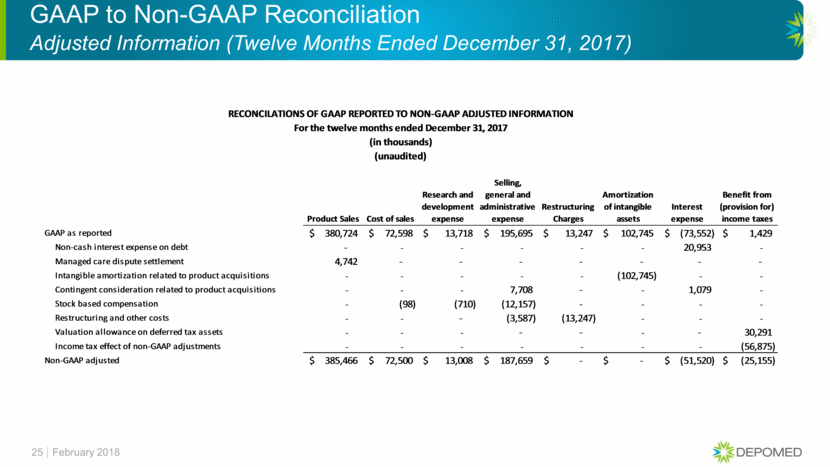
GAAP to Non-GAAP Reconciliation Adjusted Information (Twelve Months Ended December 31, 2017) 25 February 2018 Product Sales Cost of sales Research and development expense Selling, general and administrative expense Restructuring Charges Amortization of intangible assets Interest expense Benefit from (provision for) income taxes GAAP as reported 380,724 $ 72,598 $ 13,718 $ 195,695 $ 13,247 $ 102,745 $ (73,552) $ 1,429 $ Non-cash interest expense on debt - - - - - - 20,953 - Managed care dispute settlement 4,742 - - - - - - - Intangible amortization related to product acquisitions - - - - - (102,745) - - Contingent consideration related to product acquisitions - - - 7,708 - - 1,079 - Stock based compensation - (98) (710) (12,157) - - - - Restructuring and other costs - - - (3,587) (13,247) - - - Valuation allowance on deferred tax assets - - - - - - - 30,291 Income tax effect of non-GAAP adjustments - - - - - - - (56,875) Non-GAAP adjusted 385,466 $ 72,500 $ 13,008 $ 187,659 $ - $ - $ (51,520) $ (25,155) $ RECONCILATIONS OF GAAP REPORTED TO NON-GAAP ADJUSTED INFORMATION For the twelve months ended December 31, 2017 (in thousands) (unaudited)
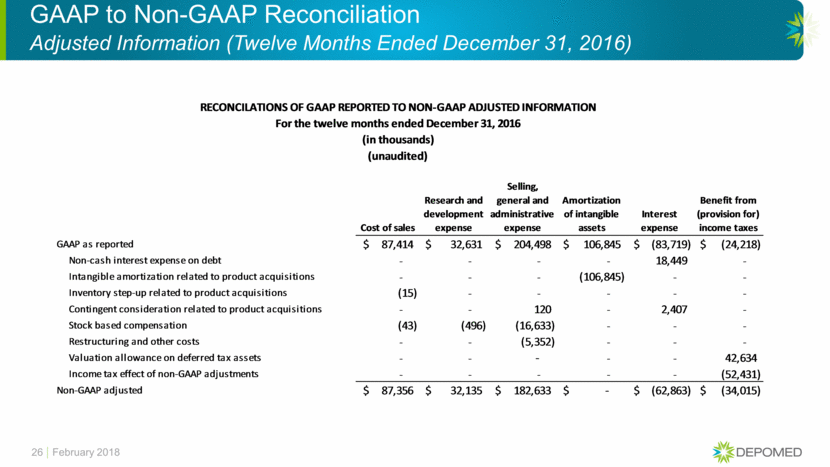
GAAP to Non-GAAP Reconciliation Adjusted Information (Twelve Months Ended December 31, 2016) 26 February 2018 Cost of sales Research and development expense Selling, general and administrative expense Amortization of intangible assets Interest expense Benefit from (provision for) income taxes GAAP as reported 87,414 $ 32,631 $ 204,498 $ 106,845 $ (83,719) $ (24,218) $ Non-cash interest expense on debt - - - - 18,449 - Intangible amortization related to product acquisitions - - - (106,845) - - Inventory step-up related to product acquisitions (15) - - - - - Contingent consideration related to product acquisitions - - 120 - 2,407 - Stock based compensation (43) (496) (16,633) - - - Restructuring and other costs - - (5,352) - - - Valuation allowance on deferred tax assets - - - - - 42,634 Income tax effect of non-GAAP adjustments - - - - - (52,431) Non-GAAP adjusted 87,356 $ 32,135 $ 182,633 $ - $ (62,863) $ (34,015) $ For the twelve months ended December 31, 2016 (in thousands) (unaudited) RECONCILATIONS OF GAAP REPORTED TO NON-GAAP ADJUSTED INFORMATION
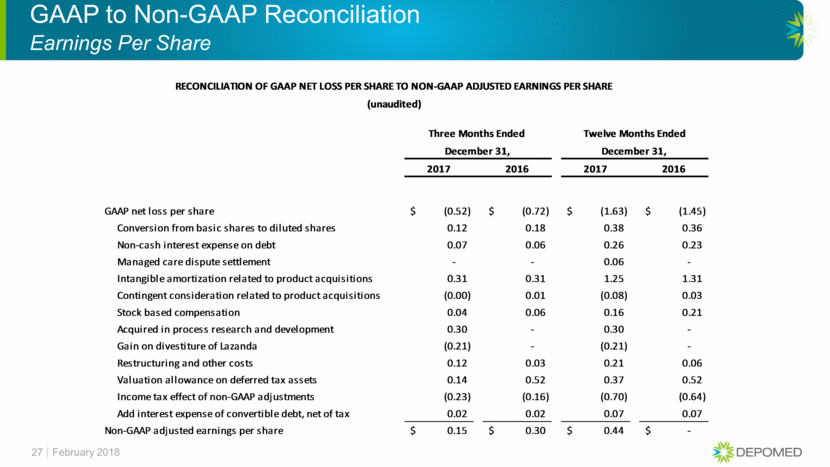
GAAP to Non-GAAP Reconciliation Earnings Per Share 27 February 2018 RECONCILIATION OF GAAP NET LOSS PER SHARE TO NON-GAAP ADJUSTED EARNINGS PER SHARE Three Months Ended Twelve Months Ended December 31, December 31, 2017 2016 2017 2016 GAAP net loss per share (0.52) $ (0.72) $ (1.63) $ (1.45) $ Conversion from basic shares to diluted shares 0.12 0.18 0.38 0.36 Non-cash interest expense on debt 0.07 0.06 0.26 0.23 Managed care dispute settlement - - 0.06 - Intangible amortization related to product acquisitions 0.31 0.31 1.25 1.31 Contingent consideration related to product acquisitions (0.00) 0.01 (0.08) 0.03 Stock based compensation 0.04 0.06 0.16 0.21 Acquired in process research and development 0.30 - 0.30 - Gain on divestiture of Lazanda (0.21) - (0.21) - Restructuring and other costs 0.12 0.03 0.21 0.06 Valuation allowance on deferred tax assets 0.14 0.52 0.37 0.52 Income tax effect of non-GAAP adjustments (0.23) (0.16) (0.70) (0.64) Add interest expense of convertible debt, net of tax 0.02 0.02 0.07 0.07 Non-GAAP adjusted earnings per share 0.15 $ 0.30 $ 0.44 $ - $ (unaudited)
GAAP to Non-GAAP Reconciliation Adjusted EBIDTA Guidance February 2018 28 GAAP net loss ($72) - ($82) Intangible amortization related to product acquisitions $102 Interest Expense $63 - $66 Stock Based Compensation $13 - $15 Taxes $0 - $3 Depreciation $3 Restructuring $20 - $24 Non-GAAP adjusted EBITDA $125 - $135 RECONCILIATION OF FY 2018 GAAP NET LOSS TO NON-GAAP ADJUSTED EBITDA GUIDANCE (in millions)
