Attached files
UNITED STATES
SECURITIES AND EXCHANGE COMMISSION
Washington, D.C. 20549
______________________________
FORM 10-K
(Mark One)
ý | ANNUAL REPORT PURSUANT TO SECTION 13 OR 15(d) OF THE SECURITIES EXCHANGE ACT OF 1934 |
For the fiscal year ended December 31, 2017
Or
¨ | TRANSITION REPORT PURSUANT TO SECTION 13 OR 15(d) OF THE SECURITIES EXCHANGE ACT OF 1934 |
For the transition period from to
Commission file number: 001-35098
______________________________
Cornerstone OnDemand, Inc.
(Exact name of registrant as specified in its charter)
Delaware | 13-4068197 | |
(State or other jurisdiction of incorporation or organization) | (I.R.S. Employer Identification Number) | |
1601 Cloverfield Blvd.
Santa Monica, California 90404
(Address of principal executive offices and zip code)
Registrant’s telephone number, including area code: (310) 752-0200
Securities registered pursuant to Section 12(b) of the Act:
Title of each class | Name of each exchange on which registered | |
Common Stock, par value $0.0001 per share | Nasdaq Stock Market LLC | |
(Nasdaq Global Select Market) | ||
Securities registered pursuant to Section 12(g) of the Act:
None
______________________________
Indicate by check mark if the registrant is a well-known seasoned issuer, as defined in Rule 405 of the Securities Act. Yes ý No ¨
Indicate by check mark if the registrant is not required to file reports pursuant to Section 13 or Section 15(d) of the Securities Exchange Act of 1934 (the “Exchange Act”). Yes ¨ No ý
Indicate by check mark whether the registrant: (1) has filed all reports required to be filed by Section 13 or 15(d) of the Exchange Act during the preceding 12 months (or for such shorter period that the registrant was required to file such reports), and (2) has been subject to such filing requirements for the past 90 days. Yes ý No ¨
Indicate by check mark whether the registrant has submitted electronically and posted on its corporate Web site, if any, every Interactive Data File required to be submitted and posted pursuant to Rule 405 of Regulation S-T (§232.405 of this chapter) during the preceding 12 months (or for such shorter period that the registrant was required to submit and post such files). Yes ý No ¨
Indicate by a check mark if disclosure of delinquent filers pursuant to Item 405 of Regulation S-K (§229.405 of this chapter) is not contained herein, and will not be contained, to the best of registrant’s knowledge, in definitive proxy or information statements incorporated by reference in Part III of this Form 10-K or any amendment to this Form 10-K. ¨
Indicate by check mark whether the registrant is a large accelerated filer, an accelerated filer, a non-accelerated filer, a smaller reporting company, or an emerging growth company. See the definitions of “large accelerated filer,” “accelerated filer,” “smaller reporting company” and “emerging growth company” in Rule 12b-2 of the Exchange Act. (Check one):
Large accelerated filer | x | Accelerated filer | ¨ |
Non-accelerated filer | ¨ (Do not check if a smaller reporting company) | Smaller reporting company | ¨ |
Emerging growth company | ¨ | ||
If an emerging growth company, indicate by check mark if the registrant has elected not to use the extended transition period for complying with any new or revised financial accounting standards provided pursuant to Section 7(a)(2)(B) of the Securities Act. ¨
Indicate by check mark whether the registrant is a shell company (as defined in Rule 12b-2 of the Exchange Act). Yes ¨ No ý
The aggregate market value of voting and non-voting common stock equity held by non-affiliates of the registrant, as of June 30, 2017, the last day of the registrant’s most recently completed second fiscal quarter, was $1,125,050,319 (based on the closing price for shares of the registrant’s common stock as reported by the Nasdaq Global Select Market on June 30, 2017).
On February 21, 2018, 57,319,023 shares of the registrant’s common stock, $0.0001 par value, were outstanding.
DOCUMENTS INCORPORATED BY REFERENCE
Portions of the information called for by Part III of this Form 10-K are hereby incorporated by reference from the Definitive Proxy Statement for the registrant’s annual meeting of stockholders, which will be filed with the Securities and Exchange Commission not later than 120 days after December 31, 2017.
CORNERSTONE ONDEMAND, INC.
2017 ANNUAL REPORT ON FORM 10-K
TABLE OF CONTENTS
Page No. | ||
PART I | ||
Item 1. | ||
Item 1A. | ||
Item 1B. | ||
Item 2. | ||
Item 3. | ||
Item 4. | ||
PART II | ||
Item 5. | ||
Item 6. | ||
Item 7. | ||
Item 7A. | ||
Item 8. | ||
Item 9. | ||
Item 9A. | ||
Item 9B. | ||
PART III | ||
Item 10. | ||
Item 11. | ||
Item 12. | ||
Item 13. | ||
Item 14. | ||
PART IV | ||
Item 15. | ||
Item 16. | ||
TRADEMARKS
© Copyright 2018 Cornerstone OnDemand, Inc. All rights reserved. “Cornerstone,” “Cornerstone OnDemand,” the Cornerstone OnDemand, Inc. logo, “CyberU” and other trademarks or service marks of Cornerstone OnDemand, Inc. appearing in this Annual Report on Form 10-K are the property of Cornerstone OnDemand, Inc. Trade names, trademarks and service marks of other companies appearing in this Annual Report on Form 10-K are the property of their respective holders and should be treated as such.
3
PART I
SPECIAL NOTE REGARDING FORWARD-LOOKING STATEMENTS
This Annual Report on Form 10-K contains forward-looking statements within the meaning of Section 27A of the Securities Act of 1933 and Section 21E of the Securities Exchange Act of 1934. Forward-looking statements are any statements that look to future events and consist of, among other things, statements regarding our business strategies; anticipated future operating results and operating expenses; our ability to attract new clients to enter into subscriptions for our products; our ability to service those clients effectively and induce them to renew and upgrade their deployments of our products; our ability to expand our sales organization to address effectively the new industries, geographies and types of organizations we intend to target; our ability to accurately forecast revenue and appropriately plan our expenses; market acceptance of enhanced products; alternate ways of addressing talent management needs or new technologies generally by us and our competitors; continued acceptance of SaaS as an effective method for delivering human capital management products and other business management products; the attraction and retention of qualified employees and key personnel; our ability to protect and defend our intellectual property; costs associated with defending intellectual property infringement and other claims; our ability to exploit Big Data to drive increased demand for our products; events in the markets for our products and alternatives to our products, as well as in the United States and global markets generally; future regulatory, judicial and legislative changes in our industry; our ability to successfully integrate our operations with those of recently acquired companies; and changes in the competitive environment in our industry and the markets in which we operate. In addition, forward-looking statements also consist of statements involving trend analyses and statements including such words as “may,” “believe,” “could,” “anticipate,” “would,” “might,” “plan,” “expect,” and similar expressions or the negative of such terms or other comparable terminology. These forward-looking statements speak only as of the date of this Annual Report on Form 10-K and are subject to business and economic risks. As such, our actual results could differ materially from those set forth in the forward-looking statements as a result of the factors set forth below in Part I, Item 1A, “Risk Factors,” and in our other reports filed with the Securities and Exchange Commission. We assume no obligation to update the forward-looking statements to reflect events that occur or circumstances that exist after the date on which they were made.
Item 1. | Business |
Overview
Cornerstone OnDemand, Inc. was incorporated on May 24, 1999 in the state of Delaware and began its principal operations in November 1999. Unless the context requires otherwise, the words “Cornerstone,” “we,” “Company,” “us” and “our” refer to Cornerstone OnDemand, Inc. and its wholly owned subsidiaries.
Cornerstone is a leading global provider of learning and human capital management software, delivered as Software-as-a-Service (“SaaS”). We are one of the world’s largest cloud computing companies with approximately 35.3 million users across 3,250 clients in 192 countries and 43 different languages. We help organizations around the globe recruit, train and manage their employees.
Our human capital management platform combines the world’s leading unified talent management solutions with state-of-the-art analytics and HR administration solutions to enable organizations to manage the entire employee lifecycle. Our focus on continuous learning and development helps organizations to empower employees to realize their potential and drive success.
We work with clients across all geographies, verticals and market segments. Our clients include multi-national corporations, large domestic and foreign-based enterprises, mid-market companies, public sector organizations, healthcare providers, higher education institutions, non-profit organizations and small businesses. We sell our platform domestically and internationally through both direct and indirect channels, including direct sales teams throughout North and South America, Europe and Asia-Pacific and distributor relationships with payroll companies, human resource consultancies and global system integrators.
Our enterprise human capital management platform is composed of four product suites:
• | Our Recruiting suite helps organizations to source and attract candidates, assess and select applicants, onboard new hires and manage the entire recruiting process; |
• | Our Learning suite enables clients to manage training and development programs, knowledge sharing and collaboration among employees, track compliance requirements and support career development for employees. Our content offering delivers fresh, modern content, fueling employee curiosity and inspiring growth; |
• | Our Performance suite provides tools to manage goal setting, performance reviews, competency assessments, development plans, continuous feedback, compensation management and succession planning; and |
• | Our HR Administration suite supports employee records administration, organizational management, employee and manager self-service, workforce planning and compliance reporting. |
4
Our clients can supplement the product suites with our state-of-the-art analytics capabilities to make more-informed decisions using data from across the platform for talent mobility, engagement and development so that HR and leadership can focus on strategic initiatives to help their organization succeed.
In addition to our enterprise human capital management platform, we offer PiiQ, formerly known as Cornerstone Growth Edition, which is a cloud-based talent management solution with learning and performance product offerings targeted to organizations with 500 or fewer employees.
Our Client Success team supports our clients’ ongoing optimization of their talent processes and use of our platform. In addition, our Cornerstone Edge solutions allow our clients and partners to more easily integrate with a growing marketplace of service providers. After the initial purchase of our platform, we continue to market and sell to our existing clients, who may renew their subscriptions, add additional products, broaden the deployment of the platform across their organizations and increase usage of the platform over time.
We have grown our business each of the last 16 years. Our revenue has grown to $482.0 million in 2017 from $423.1 million in 2016 and from $339.7 million in 2015. We have averaged an annual dollar retention rate of approximately 95% since 2002 and our annual recurring revenue as of December 31, 2017 was $439.0 million, as described in Item 7, “Management’s Discussion and Analysis of Financial Condition and Results of Operations,” under the heading “Metrics”, which includes a detailed description of these metrics.
The Market
Human capital is both a major asset and expense for all organizations. Based on the U.S. Bureau of Labor Statistics data as of September 2017, total compensation paid to the United States civilian workforce of approximately 161.1 million people was expected to exceed $11.9 trillion in 2017.
Accordingly, organizations have long sought to optimize their investments in human capital. We believe that organizations face seven major challenges in maximizing the productivity of their internal and external human capital:
• | Acquiring Talent. Increasingly seeking to fill open positions by recruiting internally and by leveraging the external networks of their employees, corporate recruiting has evolved from a process that was principally driven by traditional sources such as inbound resume submissions and job board postings to one that is inherently social in nature. |
• | Developing Talent. Effectively orienting new hires and developing employees throughout their careers to achieve their full potential, which has become more difficult with the Millennial generation entering the workforce. Additionally, increasingly distributed workforces and heightened compliance requirements have made training requirements even more important. |
• | Engaging Employees. Connecting with employees at all levels and locations of the organization to keep them motivated, working together and innovating, has become more difficult with the rise of globalization and telecommuting. |
• | Improving Business Execution. Ensuring the effective alignment of employee behavior with the organization’s objectives through goal management and employee assessment and development, as well as by linking compensation to performance. |
• | Building a Leadership Pipeline. Identifying, preparing and retaining individuals for leadership positions at all levels and across all parts of the organization, which has become an acute challenge with the growing mobility and turnover of employees and the impending retirements of the Baby Boomers. |
• | Integrating with the Extended Enterprise of Customers, Vendors and Distributors. Delivering training, certification programs and resources to the organization’s network of customers, vendors, distributors and other third parties that constitute the organization’s extended enterprise, which has become more difficult with the rise of outsourcing and increasing globalization. |
• | Modernizing HR Data Management. Enterprise organizations are forced to either sustain many disparate, outdated HR systems across multiple sites and countries, or choose to replace those systems with a global core HR solution, which can be very costly, risky and take years to implement. Also, many mid-market organizations have outgrown their use of spreadsheets to manage people data, but do not need the complexities of a core HR solution. |
We believe that just as organizations are increasingly choosing SaaS solutions for business applications such as sales force management, they are also increasingly adopting SaaS human capital management solutions. We also believe many of the existing solutions suffer from one or more of the following shortcomings:
• | Narrow Functionality. As they only address specific stages of the employee lifecycle, many solutions lack sufficient breadth of functionality to maximize employee productivity effectively. |
5
• | Limited Configurability. Most solutions are rigid and limit the ability of organizations to match their diverse workflows or to adopt their desired talent management practices. |
• | Difficult to Use. Inputting, updating, analyzing and sharing information is often cumbersome, resulting in low employee adoption and usage. |
• | Costly to Deploy, Maintain and Upgrade. Hosted or on-premise solutions require significant expense and time to deploy as well as require ongoing costs associated with IT support, network infrastructure, maintenance and upgrades. |
• | Inability to Scale. Many solutions are designed to support the needs of smaller organizations and have difficulty meeting the complex functional requirements or the sizeable infrastructure demands of larger enterprises. |
Given the limitations of existing offerings, we believe there is a market opportunity for a comprehensive, unified solution that helps organizations manage all aspects of their internal and external human capital and link human capital management to their business strategy.
The Cornerstone OnDemand Answer
Our human capital management platform is a comprehensive SaaS solution that consists of suites to help organizations manage their recruiting, learning, performance and HR administration processes. These suites are supplemented by state-of-the-art analytics and reporting as well as a number of cross-product tools for employee profile management and e-learning content aggregation and delivery. We also provide professional services for configuration, integration, training and optimization of our platform. We believe that our human capital management platform delivers the following benefits:
• | Comprehensive Functionality. Our platform provides a comprehensive approach to human capital management by offering products to address all stages of the employee lifecycle: recruiting, onboarding, learning, performance, succession, compensation, enterprise social collaboration and HR administration processes. Employees use our platform throughout their careers to engage in performance processes such as goal management, performance reviews, continuous feedback, competency assessments and compensatory reviews; to complete job-specific and compliance-related training; to evaluate potential career changes, development plans or succession processes; and to connect and collaborate with co-workers by leveraging enterprise social networking tools. Employee managers and HR managers use our platform to perform their human capital administrative responsibilities effectively throughout the employees’ careers. |
Our clients can manage processes that span different human capital management functions because our product offerings are unified. For example, our clients can automatically identify skill gaps as part of an employee’s performance review, assign training to address those gaps and monitor the results of that training. Also, clients can identify high potential employees for future leadership positions and place them in executive development programs.
We believe our comprehensive, unified platform allows our clients to align their human capital management processes and practices with their broader strategic goals.
• | Flexible and Highly Configurable. Our platform offers substantial configurability that allows our clients to match the use of our software with most of their specific business processes and workflows. Our clients can configure various features, functions and work flows in our platform by business unit, division, department, region, location, job position, pay grade, cost center, or self-defined organizational unit. Our clients are able to adjust features to configure specific processes, such as performance review workflows or training approvals, to match their existing or desired practices. This high level of configurability means that custom coding projects generally are not required to meet the diverse needs of our clients. |
Our clients can deploy the product offerings individually or in any combination. As a result, our clients have the flexibility to purchase solely those products that solve their immediate human capital management needs and can incrementally deploy additional products in the future as their needs evolve.
• | Easy-to-Use, Personalized User Interface. Our platform employs an intuitive user interface and may be personalized for the end user, typically based on position, division, pay grade, location, manager and particular use of the solution. This ease of use limits the need for end-user training, which we believe increases user adoption rates and usage. While we typically train administrators, most clients do not need training on using our products. |
• | Software-as-a-Service Solution Lowers the Total Cost of Ownership and Speeds Delivery. Our platform is accessible through a standard web browser and does not require the large investments in implementation time, personnel, hardware and consulting that are typical of hosted or on-premise solutions. With a single code base to maintain, we are able to release improved functionality on a quarterly basis. This is a more rapid pace than most hosted or on-premise solution providers can afford to deliver. |
6
• | Scalable to Meet the Needs of Organizations. Our platform has been used by Fortune 100 companies since 2001. While the complex needs of these global corporations required us to build a solution that can scale to support large, geographically-distributed employee bases, our platform is capable of supporting deployments of various sizes. Today we service 36 multi-national corporations with over 150,000 active users each. Our largest deployment is for over 600,000 users. |
• | Continued Innovation through Collaborative Product Development. We work collaboratively with our clients on an ongoing basis to develop almost every part of our platform. The vast majority of our thousands of software features were designed with existing and prospective clients based on their specific functional requests. |
Our Human Capital Management Platform
Our comprehensive human capital management platform combines the world's leading unified talent management solution with state-of-the-art analytics and HR administration. We built this platform using a single code base and a multi-tenant, multi-user architecture that we host in our data centers. The platform consists of a collection of suites to help organizations manage key phases of the employee life cycle. To complement our platform, we offer a number of cross-product tools for analytics and reporting, employee profile management and e-learning content aggregation.
Cornerstone Recruiting
Cornerstone Recruiting. Our applicant tracking product supports the modern ways that organizations source, attract and hire new employees. The recruiting product streamlines the entire hiring process and improves stakeholder collaboration with powerful dashboards and workflows. With mobile-friendly, customizable career sites, organizations can showcase their unique employer brand to attract top talent.
Cornerstone Onboarding. Our onboarding product delivers the resources, connections and tools at critical points across the employee lifecycle. The onboarding product complements the recruiting product by providing a seamless and engaging experience for the employee, while reducing administrative burden and promoting collaboration across departments.
Our Recruiting suite is utilized by approximately 22% of our total base of 3,250 clients.
Cornerstone Learning
Cornerstone Learning. Our learning product helps clients deliver mobile-ready, enterprise-class training and development programs. It links employee development to other parts of the talent management lifecycle, including onboarding, performance management and succession planning. The learning product supports all forms of learning, including online, instructor-led and collaborative and on-the-job learning, as well as robust reporting and embedded predictive analytics. With tens of thousands of online training titles from dozens of global content providers accessible through our new engaging Learning Experience Platform, clients reduce overall training expenses, while quickly transforming their learning programs with modern, curated content. The access to personalized content delivered at scale with Cornerstone’s machine learning technology builds a culture of continuous learning, boosting employee engagement and retention.
Cornerstone Extended Enterprise. Our extended enterprise product helps clients provide training and enablement to their customers, vendors and distributors. The extended enterprise product enables clients to develop new profit centers, increase sales, cut support costs and boost channel productivity.
Cornerstone for Salesforce. Our Cornerstone for Salesforce product is an enablement solution for employees, partners and customers developed natively on the Salesforce.com platform. Cornerstone for Salesforce leverages clients’ Salesforce investments across all products to build high-performance sales and service teams with triggered, just-in-time training, as well as leverage learning to engage and enable customers and partners.
Cornerstone Content. Our Cornerstone Content solutions enable organizations to deliver fresh, modern content to their workforce. Content Anytime is our foundational subscription package that includes a pre-curated library of more than 2,500 courses and a constantly evolving library. We also offer Custom Curated Packages, giving organizations access to pre-curated or custom-curated course collections from our robust library of 30+ content providers and 34,000+ content offerings. Both offerings are complementary to one another.
Our Learning suite is utilized by approximately 86% of our total base of 3,250 clients.
Cornerstone Performance
Cornerstone Performance. Our performance management product allows clients to direct and measure performance at the individual, departmental and organizational levels through ongoing competency management, organizational goal setting, performance appraisal, development planning and feedback. Performance data can also be used by the learning product offering to set training priorities and to make informed workforce planning decisions.
7
Cornerstone Succession. Our succession product allows clients to proactively plan for organizational change and talent mobility. The succession product serves both the employee looking for career advancement and management team members planning for the future. Employees can share career preferences and discover development opportunities. Management team members can utilize tools provided to identify skill gaps, implement development plans and create talent pools for future needs.
Cornerstone Compensation. Our compensation product allows clients to reward their employees for hard work in direct relation to performance. The compensation product enables clients to make more informed decisions about the allocation of base pay, bonus and equity awards.
Our Performance suite is utilized by approximately 52% of our total base of 3,250 clients.
Cornerstone HR
Cornerstone HR. Our HR product offers a modern interface for centralized HR administration across an organization’s disparate systems. Acting as a source of truth for core employee and talent data, the system supports employee self-service, absence management, organization management and records administration.
Cornerstone View. Our view product allows clients to access HR data across our human capital management products. The view product enables organizations to utilize interactive data visualization tools to discover their top performers and future leaders to proactively answer workforce questions and achieve business results.
Cornerstone Benchmark. Our benchmark product enables organizations to compare internal employee data with peers in external companies or across divisions, subdivisions, subsidiaries, or regions within their own organization. Both options allow the organization to visualize how they compare against custom and internal business segments across a variety of metrics.
Our HR suite, our newest offering, is utilized by approximately 8% of our total base of 3,250 clients.
Our Strategy
Our goal is to empower people, organizations and communities to realize their potential with our comprehensive human capital management platform. Key elements of our strategy include:
Retain and Expand Business with Existing Clients. We believe our existing installed base of clients offers a substantial opportunity for growth.
• | Focus on Client Success, Retention and Growth. We believe focusing on our clients’ success will lead to our own success. We have developed a Client Success Framework that governs our operational model. Since 2002, we have had an average annual dollar retention rate of approximately 95%. We strive to maintain our strong retention rates by continuing to provide our clients with high levels of service, support and increasing functionality. |
• | Sell Additional Products to Existing Clients. We believe there is a significant growth opportunity in selling additional functionality to our existing clients. Many clients have added functionality subsequent to their initial deployments as they recognize the benefits of our unified platform, and as a result, approximately 69% of our clients today utilize two or more products and approximately 40% utilize three or more products. With our expanding product portfolio, such as our newest product Cornerstone HR, we believe significant upsell opportunity remains within our existing client base. |
Strengthen Current Sales Channels. We intend to increase our investments in both direct and indirect sales channels to acquire new clients.
• | Invest in Direct Sales in North America. We believe that the market for human capital management is large and remains significantly underpenetrated. |
• | Expand and Strengthen Our Alliances. We intend to grow our distribution channels through key business alliances, including agreements with global vendors. |
• | Significantly Grow Our International Operation. We believe a substantial opportunity exists to continue to grow sales of our platform internationally. We intend to grow our Europe, Middle-East and Africa ("EMEA") and Asia-Pacific and Japan ("APJ") operations, which provide for direct sales, alliances, services and support in the regions. We have grown our EMEA client base from one client at December 31, 2007 to 698 clients at December 31, 2017 and our APJ client base from two clients at December 31, 2009 to 173 clients at December 31, 2017. |
8
Continue to Innovate and Extend Our Technological Leadership. We believe we have developed over the last decade a deep understanding of the human capital management challenges our clients face. We continually collaborate with our clients to build extensive functionality that addresses their specific needs and requests. We plan to continue to leverage our expertise in human capital management and client relationships to develop new products, features and functionality which will enhance our platform and expand our addressable market.
Make Cornerstone Built to Last. Our growth strategy since inception has been deliberate, disciplined and focused on long-term success. This has allowed us to weather periods of economic turmoil and significant changes in the markets we serve without experiencing business contraction. We plan to continue with the same systematic approach in the future.
Acquisitions. In the future, we may seek to acquire or invest in additional businesses, products or technologies that we believe will complement or expand our platform, enhance our technical capabilities or otherwise offer growth opportunities.
Execute Our Renewed Strategic Focus. Following a strategic review process undertaken by our board of directors during 2017, the board determined that the optimal way to maximize shareholder value is to execute a plan to transform our operations and support that plan with a capital infusion and new strategic partnerships. As a result, we entered into an agreement with Silver Lake, one of the world's leading technology private equity investors, and LinkedIn, under which Silver Lake and LinkedIn invested $300.0 million in Cornerstone in the form of convertible senior notes. In November 2017, we announced our strategic plan with the objective of better positioning us for long-term growth and increasing shareholder value. In connection with the plan, we will (i) sharpen our focus on recurring revenue growth; (ii) drive operating margin and free cash flow improvement; (iii) develop new recurring revenue streams, including e-learning content subscriptions; (iv) bolster our leadership team; and (v) strengthen our governance to help us best execute on this strategic transformation.
Strategic Relationships and Professional Services
We have entered into alliance agreements in order to expand our capabilities and geographic presence and provide our clients with access to specific types of content. We have entered into relationships with various third-party consulting firms to assist in the successful implementation of our platform and to optimize our clients’ use of our platform during the terms of their engagements. Our clients utilize these firms to assist in delivery of implementation and integration services amongst other consulting services. As our business grows, we expect to continue to utilize increasing amounts of these services. As part of our renewed strategic focus, we are taking steps to migrate much of our implementation services to our global partners. To effect the migration, we are augmenting our partner operations and delivery assurance functions while reducing overall headcount in our service delivery division, as partners take on the majority of our professional services work. This aligns with our focus on growing recurring revenue.
With our SaaS model, we have eliminated the need for lengthy and complex technology integrations, such as customizing software code, deploying equipment or maintaining unique delivery models or hardware infrastructure for individual clients. As a result, we typically deploy our human capital management platform in significantly less time than required for similar deployments of hosted or on-premise software. Our professional services include implementation services, integration services, content services, business consulting services, training services as well as ongoing support and advice.
Outsourcing and Distribution Relationships
We have developed a network of outsourcing, distribution and referral relationships to expand our reach and provide product and services sales through indirect channels. We expect to continue to add distributors to build our sales presence in certain geographic and vertical markets.
Consulting and Services Relationships
We have entered into alliance relationships with HR consulting firms to deliver consulting services, such as implementation and content development services, to clients.
Content and Product Relationships
We have entered into distributor agreements with a wide range of vendors which provide off-the-shelf e-learning content and custom learning content development services. Through this network, we are able to offer an extensive library of online training content to our clients through our Learning Experience Platform. Our content distributors for e-learning content include industry leaders as well as regional and vertically-focused online training providers. In addition, we have agreements with providers of specific competency models for use by our clients directly in our human capital management platform.
9
Global Client Success
We are dedicated to the success of our clients. We have developed a Client Success Framework which governs our operational model, the structure of our Client Management teams and the types of services necessary at each stage of a client’s lifecycle.
Within this framework, we have developed the following roles with primary responsibility to our clients at various levels of their organizations:
• | Client Executives who interact with executive-level sponsors and human resources executives at a client and are focused on the overall relationship, sales to existing clients and client business concerns; |
• | Client Success Managers who work directly with executive-level sponsors and human resources executives at our clients to maximize the value of their investment in our human capital management platform; and |
• | Product Specialists who interact with client administrators and are focused on features and functions of our human capital management platform. |
We believe this life cycle driven approach to client support and client success has contributed directly to our high client retention rate and high rankings for client satisfaction in independent research studies.
We offer support in multiple languages, at multiple levels and through multiple channels, including global support coverage available 24 hours a day, seven days a week. We use our own enterprise social collaboration product to provide our clients and distributors with a virtual community to collaborate on product design, release management and best practices.
We monitor client satisfaction internally as part of formalized programs and at regular intervals during the client lifecycle, including during the transition from sales to implementation, at the completion of a consulting project and daily based on interactions with our client-facing teams.
Our Customers
As of December 31, 2017, 3,250 clients used our human capital management platform with approximately 35.3 million registered users across 192 countries and 43 languages. Our clients represent a variety of different industries, including automotive, business services, education and publishing, financial services, food and restaurants, healthcare, insurance, media and communications, non-profits, pharmaceuticals, public sector, retail, technology and travel. No single client accounted for 10% or more of our total revenue in 2017, 2016 or 2015.
Technology, Operations and Research and Development
Technology
Our human capital management platform is designed with an on-demand architecture which our clients access via a standard web browser. It uses a single code base, with all of our clients running on the current version of our software and has been specifically built to deliver:
• | a consistent, intuitive end-user experience to limit the need for product training and to encourage high levels of end-user adoption and engagement; |
• | modularity and flexibility, by allowing our clients to activate and implement virtually any combination of the features we offer; |
• | high levels of configurability to enable our clients to mimic their existing business processes, workflows and organizational hierarchies within our platform; |
• | web services to facilitate the importing and exporting of data to and from other client systems, such as enterprise resource planning and human resource information system platforms; |
• | scalability to match the needs of the largest global enterprises and to meet future client growth; and |
• | rigorous security standards and high levels of system performance and availability demanded by our clients. |
Our human capital management platform offers a localized user interface and currency conversion capabilities. It is currently available in the following 43 languages: Arabic, Armenian, Bahasa (Malaysia), Bulgarian, Chinese Simplified, Chinese Traditional (Hong Kong), Croatian, Czech, Danish, Dutch, English (Australia), English (UK), English (US), Estonian, Finnish, French (Canada), French (France), German, Greek, Hebrew, Hungarian, Indonesian, Italian, Japanese, Korean, Latvian, Lithuanian, Norwegian, Polish, Portuguese (Brazil), Portuguese (Portugal), Romanian, Russian, Serbian, Slovakian, Slovenian, Spanish (Latin America), Spanish (Spain), Swedish, Thai, Turkish, Ukrainian and Vietnamese.
10
Our human capital management platform is deployed using a multi-tenant and multi-user architecture. We employ a modularized architecture to balance the load of clients on separate sub-environments, as well as to provide a flexible method for scalability without impacting other parts of the current environment. This architecture allows us to provide the high levels of uptime required by our clients. Our existing infrastructure has been designed with sufficient capacity to meet our current and estimated near term future needs. Global uptime in 2017 was 99.995%.
Security is of paramount importance to us due to the sensitive nature of employee data. We have designed our human capital management platform to meet certain rigorous industry security standards and to help assure clients that their sensitive data is protected across the system. We ensure high levels of security by logically segregating each client’s data from the data of other clients and by enforcing a consistent approach to roles and rights within the system. These restrictions limit system access to only those individuals authorized by our clients. We also employ multiple standard technologies, protocols and processes to monitor, test and certify the security of our infrastructure continuously, including automated scans, periodic security audits and penetration tests conducted by our clients and commissioned by us from third parties.
We utilize a variety of industry standard technologies including Microsoft .NET and Hadoop and write the majority of our software in programming languages, such as C# and Java. We use Web 2.0 technologies, such as Javascript and React, extensively to enhance the usability, performance and overall user experience of our human capital management platform. Microsoft SQL Server is our primary relational database management system, but other database technologies are in use as well, including NoSQL databases. Apart from these and other third-party components, our entire human capital management platform has been specifically built and upgraded by our in-house development team.
Operations
We physically host our human capital management platform for our clients in two secure third-party data center facilities, one located in El Segundo, California and the other located near London, United Kingdom. Both facilities are leased from Equinix, Inc. These facilities provide physical security, including manned security 365 days a year, 24 hours a day, seven days a week, biometric access controls and systems security, redundant power and environmental controls. Additionally, we are in the process of building data centers in Paris, France and Frankfurt, Germany.
We lease space for disaster recovery purposes from Equinix in Virginia, United States and in Manchester, United Kingdom. In addition, we have started building out services and functionality on Amazon Web Services (“AWS”) with a view to migrating more software to AWS over time. We maintain the same or higher standards of security and compliance at AWS as we do in our leased facilities.
Our infrastructure includes firewalls, switches, routers, load balancers and IDS/IPS from Palo Alto Networks, Cisco Systems, A10 Networks and other widely commercially available vendors to provide the networking infrastructure and high levels of security for the environment. We use industry standard blade and rack-mounted servers to run our human capital management platform and Akamai Technologies’ Global Network of Edge Servers for content caching. We use solid state storage and other storage technologies from leading vendors such as SanDisk, Pure Storage and NetApp.
Research and Development
The responsibilities of our research and development organization include product management, product development and quality assurance. Our research and development organization is global, with major centers in our Santa Monica, California headquarters as well as in Sunnyvale, California; Tel Aviv, Israel; Auckland, New Zealand; and Bangalore, India. Our Agile development methodology, in combination with our SaaS delivery model, allows us to release new and enhanced software features on a regular and predictable basis, currently quarterly. We follow a well-defined communications protocol to support our clients with release management. We patch our software on a bi-weekly basis or as needed. Based on feedback from our clients and prospects and pursuant to our own innovation, we continuously develop new functionality while enhancing and maintaining our existing product offerings. We do not need to maintain multiple engineering teams to support different versions of the code because all of our clients are running on the current version of our product offerings.
Our research and development expenses were $62.0 million in 2017, $47.0 million in 2016 and $41.0 million in 2015. Our research and development expenses plus capitalized software were $82.5 million in 2017, $63.4 million in 2016 and $54.3 million in 2015.
11
Sales and Marketing
Sales
We sell our software and services both directly through our sales force and indirectly through our domestic and international network of distributors. We currently service clients in a wide range of industries, including, among others business services, financial services, healthcare, pharmaceuticals, insurance, manufacturing, retail and high technology. We have a number of direct sales teams organized by market segment, industry and geography, which are as follows:
• | Strategic Accounts. We have a strategic accounts sales team focused on sales to some of the top 150 largest multi-national corporations. |
• | U.S. Enterprise. Our enterprise sales team sells to large enterprises with 5,000 or more employees. This team is composed primarily of experienced solution sales executives, with an average tenure of approximately 20 years in sales. |
• | U.S. Mid-Market. Our mid-market sales team sells to organizations with between 501 and 4,999 employees. This team is composed primarily of experienced sales individuals, with an average tenure of approximately 16 years in sales. |
• | Small and Medium-Sized Business. Our small and medium-sized business sales team is targeted to clients with 500 or fewer employees. |
• | U.S. Public Sector. Our public sector sales team targets federal, state and local government, as well as K-12 and higher education institutions. |
• | U.S. Healthcare. Our healthcare sales team targets healthcare providers such as hospitals, healthcare equipment and services, pharmaceuticals, biotechnology and related life science organizations. |
• | EMEA. We have both enterprise and mid-market sales professionals based in core EMEA markets. This team is composed primarily of experienced sales individuals, with an average tenure of over 16 years in sales. |
• | APJ. We have enterprise sales professionals based in core APJ markets including Australia, Hong Kong, India, Japan, New Zealand and Singapore. |
• | LATAM. We have enterprise sales professionals based in core Latin and South America markets including Mexico and Brazil. |
Our direct sales team is supported by product specialists who provide technical and product expertise to facilitate the sales process. Our sales enablement professionals provide on-boarding and ongoing professional development for the sales professionals to increase their effectiveness at selling in the field. We also maintain a separate team of client executives responsible for renewals and up-sales to existing clients, as described above.
Marketing
We manage global demand generation programs, develop sales pipelines and enhance brand awareness through our marketing initiatives. Our marketing programs target HR executives, technology professionals and senior business leaders. Our principal marketing initiatives include:
• | Demand Generation. Our demand generation activities include lead generation through email and direct mail campaigns, participation in industry events, securing event speaking opportunities and online marketing, including both SEM and organic SEO online marketing. |
• | Corporate Marketing. We market to our clients by leveraging product marketing, client success stories, thought leadership content and brand awareness advertising campaigns. Additionally, we host regional client user group meetings and we also co-market with our strategic distributors, including joint press announcements and demand generation activities. |
• | Marketing Communications. We undertake media relations, corporate communications, industry analyst relations activities, client advocacy and social media outreach. |
Competition
The market for human capital management software is highly competitive, rapidly evolving and fragmented. This market is subject to changing technology, shifting client needs and frequent introductions of new products and services.
Most of our sales efforts are competitive, often involving requests for proposals. We compete primarily on the basis of providing a comprehensive, fully unified platform for human capital management as opposed to specific service offerings.
12
In the applicant tracking systems segment, which the recruiting and onboarding product offerings each serve, our principal competitors include companies such as Oracle Corporation, International Business Machines Corporation and Lumesse. In the learning management systems segment, which the learning and extended enterprise product offerings each serve, our principal competitors include companies such as Oracle Corporation, Saba Software, Inc., SAP America, Inc. and SkillSoft Corp. In the performance management systems segment, which the performance, succession and compensation product offerings each serve, our principal competitors include companies such as Saba Software, Inc., Talentsoft, Oracle Corporation, Peoplefluent, Inc. and SAP America, Inc. These vendors are, like us, largely SaaS providers. We compete in these segments primarily on the basis of:
• | the level of integration of our product offerings within our human capital management platform; |
• | the breath and depth of our product functionality; |
• | the flexibility and configurability of our product offerings to meet the changing content and workflow requirements of our clients’ business units; |
• | the quality of our service and focus on client success; |
• | our ability to provide scalability and flexibility for large and complex global deployments; and |
• | the ease of use of our product offerings and overall user experience. |
In addition, we occasionally compete with custom-built software that is designed to support the needs of a single organization, as well as with third-party talent and human resource application providers that focus on specific aspects of human capital management.
Many of our competitors and potential competitors have greater name recognition, longer operating histories and larger marketing budgets than we do. For additional information, see “Risk Factors—Risks Related to Our Business and Industry—The market in which we participate is intensely competitive and if we do not compete effectively, our operating results could be harmed” and “Risk Factors—Mergers of or other strategic transactions by our competitors could weaken our competitive position or reduce our revenue.”
Government Contracts
Many of our contracts with government agencies are subject to termination at the election of the government agency. While our government contracts generally do not provide for renegotiation of fees at the election of the Government, it is possible that the government agency could request, and that we could under certain circumstances agree to, the renegotiation of the payments otherwise payable under such contracts. However, we have not in the past renegotiated significant payment terms under our government contracts. For additional information, see “Risk Factors—We face risks associated with our sales to governmental entities.”
Proprietary Rights
To safeguard our proprietary and intellectual property rights, we rely upon a combination of patent, copyright, trade secret and trademark laws in the United States and in other jurisdictions and on contractual restrictions. Our key assets include our software code and associated proprietary and intellectual property rights, in particular the trade secrets and know-how associated with our human capital management platform which we developed internally over the years. We were issued a patent for our software in 2003 which expires in 2021; we have since filed for additional patent protection, we own registered trademarks and we will continue to evaluate the need for additional patents and trademarks. We have confidentiality and license agreements with employees, contractors, clients, distributors and other third parties, which limit access to and use of our proprietary information and software.
Though we rely in part upon these legal and contractual protections, we believe that factors such as the skills and ingenuity of our employees, creation of new suites, features and functionality, collaboration with our clients and frequent enhancements to our platform are larger contributors to our success in the marketplace.
Despite our efforts to preserve and protect our proprietary and intellectual property rights, unauthorized third parties may attempt to copy, reverse engineer, or otherwise obtain portions of our product. Competitors may attempt to develop similar products that could compete in the same market as our products. Unauthorized disclosure of our confidential information by our employees or third parties could occur. Laws of other jurisdictions may not protect our proprietary and intellectual property rights from unauthorized use or disclosure in the same manner as the United States. The risk of unauthorized uses of our proprietary and intellectual property rights may increase as we continue to expand outside of the United States.
13
Third-party infringement claims are also possible in our industry, especially as software functionality and features expand, evolve and overlap with other industry segments. Current and future competitors, as well as non-practicing patent holders, could claim at any time that some or all of our software infringes on patents they now hold or might obtain or be issued in the future.
Seasonality
Our sales are seasonal in nature. We sign a higher percentage of agreements with new clients, as well as renewal agreements with existing clients, in the fourth quarter of each year. In addition, within a given quarter, we sign a significant portion of these agreements during the last month, and often the last two weeks, of that quarter. We believe this seasonality is driven by several factors, most notably the tendency of our clients’ procurement departments to purchase technology at the end of a quarter or calendar year, possibly in order to use up their available quarterly or annual funding allocations. As the terms of most of our client agreements are measured in full year increments, agreements regardless of when executed, will generally come up for renewal at that same time in subsequent years.
Business Segment and Geographical Information
We operate in a single operating segment. For geographic financial information, see Note 13 to our consolidated financial statements, which is incorporated herein by reference.
Working Capital Practices
Information about our working capital practices is included in Item 7, “Management’s Discussion and Analysis of Financial Condition and Results of Operations,” under the heading “Liquidity and Capital Resources” and is incorporated herein by reference.
Employees
At December 31, 2017, we had 1,891 employees, which is a 4% increase from 1,823 employees at December 31, 2016. None of our employees are covered by a collective bargaining agreement and we have never experienced a strike or similar work stoppage. We consider our relations with our employees to be strong. Internally, we strive to empower our people by using our human capital management platform to on-board, develop, connect, align, assess, retain, promote and manage the HR administration of our own employees.
The Cornerstone OnDemand Foundation
To demonstrate our commitment to empowering people and communities, we helped form the Cornerstone OnDemand Foundation, or the Foundation, in 2010. The Foundation seeks to empower communities in the United States and internationally by increasing the impact of the non-profit sector through the utilization of our human capital management platform and capacity building programs.
The Foundation focuses its efforts on the areas of education, workforce development and disaster relief. We have enlisted the help of our employees, clients and distributors to support the Foundation in its efforts. The Foundation is designed to be self-sustaining over time through a variety of ongoing funding streams, such as donations, sponsorships and distribution fees.
Additional Information
Our Internet address is www.cornerstoneondemand.com and our investor relations website is located at http://investors.cornerstoneondemand.com. We make available free of charge through our investor relations website our Annual Reports on Form 10-K, Quarterly Reports on Form 10-Q, Current Reports on Form 8-K and amendments to those reports filed or furnished pursuant to Section 13(a) of the Securities Exchange Act of 1934, as amended, as soon as reasonably practicable after we electronically file such materials with, or furnish them to, the SEC. Information contained on, or that can be accessed through, our website is not incorporated by reference into this report and you should not consider information on our website to be part of this report.
The SEC maintains an Internet site (www.sec.gov) that contains reports, proxy and information statements and other information regarding issuers that file electronically with the SEC. The public also may read and copy these filings at the SEC’s Public Reference Room at 100 F Street N.E., Washington, DC 20549. Information about this Public Reference Room is available by calling (800) SEC-0330.
14
Item 1A. | Risk Factors |
The following risk factors and other information included in this Annual Report on Form 10-K should be carefully considered. The risks and uncertainties described below are not the only ones we face. Additional risks and uncertainties not presently known to us or that we presently deem less significant may also impair our business operations. Please see Item 1. “Business—Forward Looking Statements” for a discussion of the forward-looking statements that are qualified by these risk factors. If any of the events or circumstances described in the following risk factors actually occurs, our business, operating results and financial condition could be materially adversely affected.
Risks Related to Our Business and Industry
Unfavorable conditions in our industry or the global economy, or reductions in information technology spending, could limit our ability to grow our business and negatively affect our operating results.
Our operating results may vary based on the impact of changes in our industry or the global economy on us or our clients. The revenue growth and potential profitability of our business depends on demand for enterprise application software and services generally and for human capital management platform in particular. We sell our human capital management platform primarily to large, mid-sized and small business organizations whose businesses fluctuate based on general economic and business conditions. In addition, a portion of our revenue is attributable to the number of users of our products at each of our clients, which in turn is influenced by the employment and hiring patterns of our clients and potential clients. To the extent that economic uncertainty or weak economic conditions cause our clients and potential clients to freeze or reduce their headcount, demand for our products may be negatively affected. Historically, economic downturns have resulted in overall reductions in spending on information technology and human capital management platforms as well as pressure from clients and potential clients for extended billing terms. If economic conditions deteriorate, our clients and potential clients may elect to decrease their information technology and human capital management budgets by deferring or reconsidering product purchases, which would limit our ability to grow our business and negatively affect our operating results.
Our financial results may fluctuate due to our long, variable and, therefore, unpredictable sales cycle and our focus on large and mid-market organizations.
We plan our expenses based on certain assumptions about the length and variability of our sales cycle. If our sales cycle becomes longer or more variable, our results may be adversely affected. Our sales cycle generally varies in duration from two to nine months and, in some cases, much longer depending on the size of the potential client. Factors that may influence the length and variability of our sales cycle include among others:
• | the need to educate potential clients about the uses and benefits of our products; |
• | the relatively long duration of the commitment clients make in their agreements with us; |
• | the discretionary nature of potential clients’ purchasing and budget cycles and decisions; |
• | the competitive nature of potential clients’ evaluation and purchasing processes; |
• | the lengthy purchasing approval processes of potential clients; |
• | the evolving functionality demands of potential clients; |
• | fluctuations in the human capital management needs of potential clients; and |
• | announcements or planned introductions of new products by us or our competitors. |
The fluctuations that result from the length and variability of our sales cycle may be magnified by our focus on sales to large and mid-sized organizations. If we are unable to close an expected significant transaction with one or more of these companies in a particular period, or if an expected transaction is delayed until a subsequent period, our operating results, and in particular our billings, for that period, and for any future periods in which revenue from such transaction would otherwise have been recognized, may be adversely affected.
Our financial results may fluctuate due to various business factors, some of which may be beyond our control.
There are a number of other factors that may cause our financial results to fluctuate from period to period, including among others:
• | changes in billing cycles and the size of advance payments relative to overall contract value in client agreements; |
• | the extent to which new clients are attracted to our products to satisfy their human capital management needs; |
• | the timing and rate at which we sign agreements with new clients; |
• | our access to service providers and partners when we outsource client service projects and our ability to manage the quality and completion of the related client implementations; |
• | the timing and duration of our client implementations, which is often outside of our direct control; |
15
• | our ability to provide, or partner with effective partners to provide, resources for client implementations and consulting projects; |
• | the extent to which we retain existing clients and satisfy their requirements; |
• | the extent to which existing clients renew their subscriptions to our products and the timing of those renewals; |
• | the extent to which existing clients purchase or discontinue the use of additional products and add or decrease the number of users; |
• | the extent to which our clients request enhancements to underlying features and functionality of our products and the timing of our delivery of these enhancements to our clients; |
• | the addition or loss of large clients, including through acquisitions or consolidations; |
• | the number and size of new clients, as well as the number and size of renewal clients in a particular period; |
• | the mix of clients among small, mid-sized and large organizations; |
• | changes in our pricing policies or those of our competitors; |
• | seasonal factors affecting demand for our products or potential clients’ purchasing decisions; |
• | the financial condition and creditworthiness of our clients; |
• | the amount and timing of our operating expenses, including those related to the maintenance, expansion and restructuring of our business, operations and infrastructure; |
• | changes in the operational efficiency of our business; |
• | the timing and success of our new product and service introductions; |
• | the timing of expenses of the development of new products and technologies, including enhancements to our products; |
• | our ability to exploit Big Data to drive increased demand for our products; |
• | continued strong demand for human capital management in the U.S. and globally; |
• | our ability to successfully integrate our operations with those of recently acquired privately-held companies; |
• | the success of current and new competitive products and services by our competitors; |
• | other changes in the competitive dynamics of our industry, including consolidation among competitors, clients or strategic partners; |
• | our ability to manage our existing business and future growth, including in terms of additional headcount, additional clients, incremental users and new geographic regions; |
• | expenses related to our network and data centers and the expansion of such networks and data centers; |
• | the effects of, and expenses associated with, acquisitions of third-party technologies or businesses and any potential future charges for impairment of goodwill resulting from those acquisitions; |
• | equity issuances, including as consideration in acquisitions or due to the conversion of our outstanding convertible notes due 2021 and 2018; |
• | business disruptions, costs and future events related to shareholder activism; |
• | legal or political changes in local or foreign jurisdictions that decrease demand for, or restrict our ability to sell or provide, our products; |
• | fluctuations in foreign currency exchange rates, including any fluctuation caused by uncertainties relating to Brexit; |
• | general economic, industry and market conditions; and |
• | various factors related to disruptions in our SaaS hosting network infrastructure, defects in our products, privacy and data security and exchange rate fluctuations, each of which is described elsewhere in these risk factors. |
In light of the foregoing factors, we believe that our financial results, including our revenue and deferred revenue levels, may vary significantly from period-to-period. As a result, period-to-period comparisons of our operating results may not be meaningful and should not be relied on as an indication of future performance.
16
The market in which we participate is intensely competitive, and if we do not compete effectively, our operating results could be harmed.
The market for human capital management software is highly competitive, rapidly evolving and fragmented. Many of our competitors and potential competitors are larger and have greater brand name recognition, much longer operating histories, larger marketing budgets and significantly greater resources than we do. In addition, with the introduction of new technologies and market entrants, we expect competition to intensify in the future. If we fail to compete effectively, our business will be harmed. Some of our principal competitors offer their products or services at a lower price, which has resulted in pricing pressures. Similarly, some competitors offer different billing terms, which has resulted in pressures on our billing terms. If we are unable to maintain our pricing levels and billing terms, our operating results could be negatively impacted. In addition, pricing pressures and increased competition generally could result in reduced sales, reduced margins, losses or the failure of our products to achieve or maintain more widespread market acceptance, any of which could harm our business.
We face competition from paper-based processes and desktop software tools. We also face competition from custom-built software that is designed to support the needs of a single organization, as well as from third-party talent and human resource application providers. These software vendors include, without limitation, Halogen Software, Inc., International Business Machines Corporation, Oracle Corporation, Peoplefluent, Inc., Saba Software, Inc., SAP America, Inc., Skillsoft Corp., Talentsoft and Workday, Inc. In addition, some of the parties with which we maintain business alliances offer or may offer products or services that compete with our products or services.
Many of our competitors are able to devote greater resources to the development, promotion and sale of their products and services. In addition, many of our competitors have established marketing relationships, access to larger client bases and major distribution agreements with consultants, system integrators and distributors. Moreover, many software vendors can bundle human resource products or offer such products at a lower price as part of a larger product sale. In addition, some competitors may offer software that addresses one or a limited number of human capital management functions at a lower price point or with greater depth than our products. As a result, our competitors may be able to respond more quickly and effectively than we can to new or changing opportunities, technologies, standards or client requirements. Further, some potential clients, particularly large enterprises, may elect to develop their own internal products. For all of these reasons, we may not be able to compete successfully against our current and future competitors.
Existing or future laws and regulations relating to privacy or data security could increase the cost of our products and subject us or our clients to litigation, regulatory investigations and other potential liabilities.
Our human capital management platform enables our clients to collect, manage and store a wide range of data related to every phase of the employee performance and management cycle. The United States and various state governments have adopted or proposed limitations on the collection, distribution and use of personal information. Several foreign jurisdictions, including the European Union (“EU”), and the United Kingdom, Korea, Japan, Singapore, Australia and India, have adopted legislation (including directives or regulations) that increase or change the requirements governing data collection and storage in these jurisdictions. These laws and regulations are complex and change frequently, at times due to differing economic conditions and changes in political climate, with new laws and regulations proposed frequently and existing laws and regulations subject to different and conflicting interpretations. Such changes have the potential to increase costs of compliance, risks of noncompliance and penalties for noncompliance. For example, we maintain a major support center in Tel Aviv, Israel. Israel presently is recognized by the EU as providing an “adequate” level of protection for personal data, causing transfers of personal data to be permitted under EU data protection law, but if EU authorities were to determine that Israel no longer provided an “adequate” level of data protection, our business could be harmed. As an additional example, the EU adopted a general data protection regulation, effective in May 2018, that will supersede current EU data protection legislation, impose more stringent EU data protection requirements and provide for greater penalties for noncompliance. Further, following a referendum on June 23, 2016 on the United Kingdom’s membership in the EU, the outcome of which was a vote in favor of leaving the EU, it is expected that the United Kingdom government will shortly commence negotiations in connection with any exit from the EU (often referred to as “Brexit”). The outcome of the referendum has created uncertainty with regard to the regulation of data protection in the United Kingdom. In particular, it is unclear whether the United Kingdom will enact the general data protection regulation and how data transfers to and from the United Kingdom will be regulated. We maintain a data center in the United Kingdom where EU residents’ personal data is stored and processed, causing uncertainty with respect to the regulation of data protection in the United Kingdom to create uncertainty among some of our customers in Europe. We are in the process of building data centers in other EU locations that we anticipate will be functional in 2018, but until such data centers are operational and available to be used by our European customers, we may experience reluctance or refusal by our customers in Europe to use our products. Additionally, any delays in completing the data centers or impediments to beginning operations may harm our customer retention and billings in Europe.
17
We sell our products and operate in many countries. Some of these countries are considering or have passed legislation implementing data protection or privacy requirements that could increase the cost and complexity of selling or delivering our solutions. In addition, changes in the political climate in the United States or other countries may decrease demand for our solutions or make them less competitive to preferred local offerings.
If our privacy or data security measures fail to comply with current or future laws and regulations, we may be subject to litigation, regulatory investigations or other liabilities, as well as negative publicity and a loss of business. Any of these matters could materially adversely affect our business, financial condition or operational results. Moreover, if future laws and regulations limit our clients’ ability to use and share employee data or our ability to store, process and share data with our clients over the Internet, demand for our products could decrease, our costs could increase and our operating results and financial condition could be harmed.
In particular, with regard to transfers of personal data, as such term is used in the EU, we historically relied upon adherence to the U.S. Department of Commerce’s Safe Harbor Privacy Principles and compliance with the U.S.-EU and U.S.-Swiss Safe Harbor Frameworks. The U.S.-EU Safe Harbor Framework, which, together with the U.S.-Swiss Safe Harbor Framework, established the means for legitimizing the transfer of personal data by U.S. companies from the European Economic Area, or EEA, to the U.S., was invalidated in October 2015 by a decision of the European Court of Justice, or the ECJ Ruling. As a result of the ECJ Ruling, the Swiss data protection regulator has questioned the status of the U.S.-Swiss Safe Harbor Framework. In light of these events, we subsequently have self-certified under the EU-U.S. Privacy Shield, a replacement for the U.S.-EU Safe Harbor Framework. The EU-U.S. Privacy Shield has been challenged by private parties and may face additional challenges by national regulators or additional private parties. We may be unsuccessful in maintaining legitimate means for our transfer of personal data from the EEA, or otherwise responding to the ECJ Ruling, and we may experience reluctance or refusal by current or prospective European customers to use our products. Our response to the ECJ Ruling and any other events with respect to the legal landscape surrounding cross-border transfer of EU residents’ personal data may cause us to assume additional liabilities or incur additional expenses for implementing compliance requirements, and any such other events, as well as our response, could adversely affect our billings and lead to regulatory investigations or enforcement actions. The foregoing could have a materially adverse impact upon our business, financial condition and operational results.
Mergers of or other strategic transactions by our competitors could weaken our competitive position or reduce our revenue.
If one or more of our competitors were to merge, acquire or partner with another of our competitors, the change in the competitive landscape could adversely affect our ability to compete effectively. For example, in February 2012, SAP America, Inc. acquired SuccessFactors, Inc.; in April 2012, Oracle Corporation acquired Taleo Corporation; in August 2012, International Business Machines Corporation acquired Kenexa, Inc.; in October 2014, Skillsoft Corp. acquired SumTotal Systems, Inc.; and in May 2017, Saba Software, Inc. acquired Halogen Software, Inc. Our competitors may also establish or strengthen cooperative relationships with our current or future strategic distributors, systems integrators, HR outsourcers, payroll services companies, third-party consulting firms or other parties with whom we have relationships, thereby limiting our ability to promote our products and limiting the number of consultants available to implement our products. Disruptions in our business caused by these events could reduce our revenue.
Our business and operations are experiencing growth and organizational change. If we fail to effectively manage such growth and change in a manner that preserves the key aspects of our corporate culture, our business and operating results could be harmed.
We have experienced, and may continue to experience, rapid growth and organizational change, which has placed, and may continue to place, significant demands on our management, operational and financial resources. For example, our headcount has grown from 1,823 employees on December 31, 2016 to 1,891 employees on December 31, 2017. In addition, we have several international offices, including in Australia, Brazil, France, Germany, Hong Kong, India, Israel, Japan, Netherlands, New Zealand, Spain, Sweden and the United Kingdom. We may continue to expand our international operations into other countries in the future, either organically or through acquisitions. We have also experienced significant growth in the number of users, transactions and data that our SaaS hosting infrastructure supports. Finally, our organizational structure is becoming more complex as we improve our operational, financial and management controls as well as our reporting systems and procedures. We will require significant capital expenditures and the allocation of valuable management resources to grow and change in these areas without undermining our corporate culture of rapid innovation, teamwork and attention to client success that has been central to our growth so far. If we fail to manage our anticipated growth and change in a manner that preserves the key aspects of our corporate culture, the quality of our products may suffer, which could negatively affect our brand and reputation and harm our ability to retain and attract clients.
18
For a detailed discussion of the risks related to our ability to expand our business internationally, manage growth in our SaaS hosting network infrastructure and expand parts of our organization to implement improved operational, financial and management controls and reporting systems, see the risk factors titled “—As a public company, we are obligated to maintain proper and effective internal control over financial reporting. If our internal control over financial reporting is ineffective, our financial reporting may not be accurate, complete and timely and our auditors may be unable to attest to its effectiveness when required, thus adversely affecting investor confidence in our company.” and “—We currently have a number of international offices and are expanding our international operations. Additionally, we do not have substantial experience in all international markets and may not achieve the results that we expect.”
Fluctuations in the exchange rate of foreign currencies could result in foreign currency gains and losses.
We currently have foreign sales denominated in Australian Dollars, Brazilian Reals, Canadian Dollars, Chinese Yuan, Euros, British Pounds, Hong Kong Dollars, Indian Rupees, Japanese Yen, Mexican Pesos, New Zealand Dollars, Singapore Dollars, South African Rand, Swedish Krona and Swiss Franc and may in the future have sales denominated in the currencies of additional countries. In addition, we incur a portion of our operating expenses in British Pounds and Euros and, to a much lesser extent, in Australian Dollars, Brazilian Reals, Canadian Dollars, Chinese Yuan, Hong Kong Dollars, Indian Rupees, Israeli New Shekels, Japanese Yen, Mexican Pesos, New Zealand Dollars, Singapore Dollars and Swedish Krona. Further, our overseas subsidiaries’ results are also impacted by exchange rates affecting the carrying value of U.S. Dollar denominated intercompany loans with us. Fluctuations in the exchange rates of these foreign currencies, including any fluctuations caused by uncertainties relating to Brexit, may negatively impact our business, financial condition and operating results. Due to our legal structure, any fluctuations in the exchange rates of the British Pound may be particularly impactful. We have not previously engaged in foreign currency hedging. If we decide to hedge our foreign currency exposure, we may not be able to completely eliminate the impact of fluctuations in the exchange rates.
We may acquire other companies or technologies, which could divert our management’s attention, result in additional dilution to our stockholders or otherwise disrupt our operations and harm our operating results.
In April 2012, we acquired Sonar Limited, a SaaS talent management solution provider serving small businesses, and in November 2014, we acquired Evolv Inc., a machine learning and data science platform provider. In the future, we may seek to acquire or invest in other businesses, products or technologies that we believe could complement or expand our existing platform, enhance our technical capabilities or otherwise offer growth opportunities. The pursuit of potential acquisitions may divert the attention of management and cause us to incur various expenses in identifying, investigating and pursuing suitable acquisitions, whether or not they are ultimately consummated.
Other than our acquisitions of Sonar Limited and Evolv Inc., we do not have any experience in acquiring other businesses. We may not be able to successfully integrate the personnel, operations and technologies of any businesses that we have acquired or may acquire in the future or effectively manage the combined business following the acquisition. We may also not achieve the anticipated benefits from other acquired businesses due to a number of factors, including:
• | unanticipated costs or liabilities associated with the acquisition; |
• | incurrence of acquisition-related costs; |
• | diversion of management’s attention from other business concerns; |
• | harm to our existing relationships with distributors and clients as a result of the acquisition; |
• | the potential loss of key employees; |
• | exposure to claims and disputes by third parties, including intellectual property claims and disputes; |
• | the use of resources that are needed in other parts of our business; and |
• | the use of substantial portions of our available cash to consummate the acquisition. |
In addition, a significant portion of the purchase price of companies we acquire may be allocated to acquired goodwill, which must be assessed for impairment at least annually, or to intangible assets, which are assessed for impairment upon certain triggering events. In the future, if our acquisitions do not yield expected returns, we may be required to take charges to our operating results based on this impairment assessment process, which could harm our operating results.
Acquisitions could also result in dilutive issuances of equity securities or the incurrence of debt, which could adversely affect our operating results. For example, in our acquisition of Sonar Limited, we issued an aggregate of 46,694 shares of our common stock. In addition, if an acquired business fails to meet our expectations, our operating results, business and financial condition may suffer.
19
As a public company, we are obligated to maintain proper and effective internal control over financial reporting. If our internal control over financial reporting is ineffective, our financial reporting may not be accurate, complete and timely and our auditors may be unable to attest to its effectiveness when required, thus adversely affecting investor confidence in our company.
We are required, pursuant to Section 404 of the Sarbanes-Oxley Act, to furnish a report by management on, among other things, the effectiveness of our internal control over financial reporting. Our auditors also need to audit the effectiveness of our internal control over financial reporting. These assessments need to include disclosure of any material weaknesses in our internal control over financial reporting.
We have incurred and continue to incur significant costs assessing our system of internal control over financial reporting and processing documentation necessary to perform the evaluation needed to comply with Section 404. We may discover, and may not be able to remediate, future significant deficiencies or material weaknesses, or we may be unable to complete our evaluation, testing or any required remediation in a timely fashion. Failure of our internal control over financial reporting to be effective could cause our financial reporting to be inaccurate, incomplete or delayed. Moreover, even if there is no inaccuracy, incompletion or delay of reporting results, if we identify one or more material weaknesses in our internal control over financial reporting, we will be unable to assert, and our auditors will be unable to affirm, that our internal control is effective, in which case investors may lose confidence in the accuracy and completeness of our financial reports, which could have a material adverse effect on the price of our common stock.
Our systems collect, access, use and store personal and other client proprietary information. As a result, we are subject to security risks and are required to invest significant resources to prevent or correct problems caused by security breaches. If a security breach occurs, our reputation could be harmed, our business may suffer and we could incur significant liability.
Our human capital management platform involves the storage and transmission of clients’ sensitive, proprietary and confidential information over the Internet (including public networks), and security breaches, unauthorized access, unauthorized usage, viruses or similar breaches or disruptions could result in loss of this information, damage to our reputation, early termination of our contracts, litigation, regulatory investigations or other liabilities. In addition, errors in the storage or transmission of such information could compromise the security of that information. If our security measures are breached or are otherwise compromised as a result of third-party action, employee error, malfeasance or otherwise and, as a result, someone obtains unauthorized access to client data, our reputation will be damaged, our business may suffer and we could incur significant liability. Advances in computer capabilities, new discoveries in the field of cryptography or other events or developments could result in compromises or breaches of our security systems and the data stored in these systems. Because there is a time lag associated with developing adequate protections against such new developments and techniques, unauthorized access or sabotage of our systems and the information processed in connection with our business may result. If an actual or perceived security breach occurs, the market perception of our security measures could be harmed and we could lose sales and clients. Any violations of privacy or information security could result in the loss of business, litigation and regulatory investigations and penalties that could damage our reputation and adversely impact our operating results and financial condition, including our ability to make required reporting and disclosures as a public company. Moreover, if a high profile security breach occurs with respect to another SaaS provider, our clients and potential clients may lose trust in the security of the SaaS business model generally, which could adversely impact our ability to retain existing clients or attract new ones.
Any significant disruption in our SaaS hosting network infrastructure could harm our reputation, require us to provide credits or refunds, result in early terminations of client agreements or a loss of clients and adversely affect our business.
Our SaaS hosting network infrastructure is a critical part of our business operations. Our clients access our human capital management platform through a standard web browser and depend on us for fast and reliable access to our products. Our software is proprietary, and we currently rely on two third-party data center hosting facilities, which we lease, and the expertise of members of our engineering and software development teams for the continued performance of our platform. Recently, we began the process of migrating our platform from our leased data center hosting facilities to third-party data center hosting facilities operated by Amazon Web Services (“AWS”). After we complete this migration, we will rely extensively on AWS to provide our clients and their users with fast and reliable access to our products. Any disruption of or interference with our SaaS hosting network infrastructure, including the services and operations of AWS, could harm our reputation, business and results of operations. We have experienced, and may in the future experience, disruptions in our computing and communications infrastructure. Factors that may cause such disruptions that may harm our reputation include:
• | human error; |
• | security breaches; |
• | telecommunications outages from third-party providers; |
• | computer viruses; |
• | acts of terrorism, sabotage or other intentional acts of vandalism, including cyber attacks; |
20
• | unforeseen interruption or damages experienced in moving hardware to a new location; |
• | fire, earthquake, flood and other natural disasters; and |
• | power loss. |
Although we generally back-up our client databases hourly, store our data in more than one geographically distinct location at least weekly and perform real-time mirroring of data to disaster recovery locations, we do not currently offer immediate access to disaster recovery locations in the event of a disaster or major outage. Thus, in the event of any of the factors described above, or certain other failures of our computing infrastructure, clients may not be able to access their data for 24 hours or more and there is a remote chance that client data from recent transactions may be permanently lost or otherwise compromised. In addition, we may not have adequate insurance coverage to compensate for losses from a major interruption. Moreover, some of our agreements include performance guarantees and service level standards that obligate us to provide credits, refunds or termination rights in the event of a significant disruption in our SaaS hosting network infrastructure or other technical problems that relate to the functionality or design of our platform.
Certain of our operating results and financial metrics are difficult to predict as a result of seasonality.
We have historically experienced seasonality in terms of when we enter into client agreements for our products. We sign a significantly higher percentage of agreements with new clients, and renewal agreements with existing clients, in the fourth quarter of each year and a significant portion of these agreements are signed during the last month, and with respect to each quarter, often the last two weeks of the quarter. This seasonality is reflected to a much lesser extent, and sometimes is not immediately apparent, in our revenue, due to the fact that we generally recognize subscription revenue over the term of the client agreement, which is generally three years. We expect this seasonality to continue, which may cause fluctuations in certain of our operating results and financial metrics, and thus difficulties in predictability.
We rely on third-party computer hardware and software that may be difficult to replace or could cause errors or failures of our service.
In addition to the software we develop, we rely on computer hardware, purchased or leased, and software licensed from third parties in order to deliver our platform. This hardware and software may not continue to be available on commercially reasonable terms, if at all. Any loss of the right to use any of this hardware or software could result in delays in our ability to provide our platform until equivalent technology is either developed by us or, if available, identified, obtained and integrated. In addition, errors or defects in third-party hardware or software used in our platform could result in errors or a failure of our products, which could harm our business.
Defects in our platform could affect our reputation, result in significant costs to us and impair our ability to sell our products and related services.
Defects in our platform could adversely affect our reputation, result in significant costs to us and impair our ability to sell our products in the future. The costs incurred in correcting any product defects may be substantial and could adversely affect our operating results. Although we continually test our products for defects and work with clients through our client support organization to identify and correct errors, defects in our products are likely to occur in the future. Any defects that cause interruptions to the availability of our products could result in:
• | lost or delayed market acceptance and sales of our products; |
• | early termination of client agreements or loss of clients; |
• | credits or refunds to clients; |
• | product liability suits against us; |
• | diversion of development resources; |
• | injury to our reputation; and |
• | increased maintenance and warranty costs. |
While our client agreements typically contain limitations and disclaimers that purport to limit our liability for damages related to defects in our products, such limitations and disclaimers may not be enforced by a court or other tribunal or otherwise effectively protect us from such claims.
21
If we fail to manage our SaaS hosting network infrastructure capacity, our existing clients may experience service outages and our new clients may experience delays in the deployment of our human capital management platform.
We have experienced significant growth in the number of users, transactions and data that our hosting infrastructure supports. We seek to maintain sufficient excess capacity in our SaaS hosting network infrastructure to meet the needs of all of our clients. We also seek to maintain excess capacity to facilitate the rapid provision of new client deployments and the expansion of existing client deployments. However, the provision of new hosting infrastructure requires significant lead time. If we do not accurately predict our infrastructure capacity requirements, our existing clients may experience service outages that may subject us to financial penalties, financial liabilities and client losses. If our hosting infrastructure capacity fails to keep pace with increased sales, clients may experience delays as we seek to obtain additional capacity, which could harm our reputation and adversely affect our revenue growth.
Our growth depends in part on the success of our strategic relationships with third parties.
We anticipate that we will continue to depend on various third-party relationships in order to grow our business. In addition to growing our indirect sales channels, we intend to pursue additional relationships with other third parties, such as technology and content providers and implementation consultants. Identifying, negotiating and documenting relationships with third parties require significant time and resources, as does integrating third-party content and technology. Our agreements with distributors and providers of technology, content and consulting services are typically non-exclusive and do not prohibit them from working with our competitors or from offering competing services. Our competitors may be effective in providing incentives to third parties to favor their products or services or to prevent or reduce subscriptions to our products. In addition, these distributors and providers may not perform as expected under our agreements, and we have had and may in the future have, disagreements or disputes with such distributors and providers, which could negatively affect our brand and reputation. A global economic slowdown could also adversely affect the businesses of our distributors and it is possible that they may not be able to devote the resources we expect to our relationships with such distributors.
If we are unsuccessful in establishing or maintaining our relationships with these third parties, our ability to compete in the marketplace or to grow our revenue could be impaired and our operating results could suffer. Even if we are successful, we cannot assure you that these relationships will result in improved operating results.
Failure to effectively retain and expand our direct sales teams and develop and expand our indirect sales channel will impede our growth.
We will need to continue to expand our sales and marketing infrastructure in order to grow our client base and our business. We plan to expand our direct sales teams and engage additional third-party distributors, both domestically and internationally. Identifying, recruiting and training these people and entities will require significant time, expense and attention. Our business will be seriously harmed and our financial resources will be wasted if our efforts to expand our direct and indirect sales channels do not generate a corresponding increase in revenue, and we may be required to sacrifice near-term growth and divert management attention in order to restructure our direct sales teams. In particular, if our recent transition to a sales commission model based solely on subscription or recurring revenue and other recent organizational changes hinder our ability to hire, develop and retain talented sales personnel or if our new direct sales personnel are unable to achieve expected productivity levels in a reasonable period of time, we may not be able to significantly increase our revenue and grow our business.
Restructuring activities could adversely affect our ability to execute our business strategy.
In December 2017, we announced that we were implementing a restructuring plan to reduce the headcount of our global service delivery team, as well as the headcount of some of our sales teams, representing a workforce reduction of approximately six percent. In connection with this action, we incurred approximately $1.5 million of expenditures in the quarter ended December 31, 2017 and we estimate we will incur approximately $3.0 million of expenditures, substantially all of which will be severance costs, in the quarter ended March 31, 2018. This restructuring and any future restructurings, should it become necessary for us to continue to restructure our business due to worldwide market conditions or other factors that reduce the demand for our products and services, could adversely affect our ability to execute our business strategy.
22
If we fail to retain key employees and recruit qualified technical and sales personnel, our business could be harmed.
We believe that our success depends on the continued employment of our senior management and other key employees, such as our chief executive officer. In addition, because our future success is dependent on our ability to continue to enhance and introduce new software and services, we are heavily dependent on our ability to attract and retain qualified engineers with the requisite education, background and industry experience. As we expand our business, our continued success will also depend, in part, on our ability to attract and retain qualified sales, marketing and operational personnel capable of supporting a larger and more diverse client base. The loss of the services of a significant number of our engineers or sales people could be disruptive to our development efforts or business relationships. In addition, if any of our key employees joins a competitor or decides to otherwise compete with us, we may experience a material disruption of our operations and development plans, which may cause us to lose clients or increase operating expenses as the attention of our remaining senior managers is diverted to recruit replacements for the departed key employees.
Changes to U.S. immigration and work authorization laws and regulations can be significantly affected by political forces and levels of economic activity. Our international expansion and our business may be materially adversely affected if legislative or administrative changes to immigration or visa laws and regulations impair our hiring processes or projects involving personnel who are not citizens of the country where the work is to be performed.
Failure to effectively manage client deployments by our third-party service providers could adversely impact our business.
In cases where our third-party service providers are engaged either by us or by a client directly to deploy a product for a client, our third-party service providers need to have a substantial understanding of such client’s business so that they can configure the product in a manner that complements its existing business processes and integrates the product into its existing systems. It may be difficult for us to manage the timeliness of these deployments and the allocation of personnel and resources by our clients. Failure to successfully manage client deployments by us or our third-party service providers could harm our reputation and cause us to lose existing clients, face potential client disputes or limit the rate at which new clients purchase our products.
Forecasts of our business growth and profitability may prove to be inaccurate, and even if the markets in which we compete achieve the forecasted growth, we cannot assure you our business will grow at similar rates, or at all.
Our forecasts are subject to significant uncertainty and are based on assumptions and estimates which may not prove to be accurate. These assumptions and estimates include the timing and value of agreements with our customers, variability in the service delivery periods for our customers, impact of foreign currency exchange rate fluctuations and expected growth in our market and related costs to support the growth of our business. Our assumptions and estimates related to our business growth and profitability, including the performance of our core business and emerging businesses and the demand for our products in the United States, Europe, Japan and other regions, may prove to be inaccurate. Even if the markets experience the forecasted growth, we may not grow our business at similar rates, or at all. Our growth is subject to many factors, including our success in implementing our business strategy, which is subject to many risks and uncertainties.
Even if demand for human capital management products and services increases generally, there is no guarantee that demand for SaaS products like ours will increase to a corresponding degree.
The widespread adoption of our products depends not only on strong demand for human capital management products and services generally, but also for products and services delivered via a SaaS business model in particular. There are still a significant number of organizations that have adopted no human capital management functions at all, and it is unclear whether such organizations will ever adopt such functions and, if they do, whether they will desire a SaaS human capital management platform like ours. As a result, we cannot assure you that our SaaS human capital management platform will achieve and sustain the high level of market acceptance that is critical for the success of our business.
23
Our business depends substantially on clients renewing their agreements with us, purchasing additional products from us or adding additional users. Any decline in our clients renewing their agreements, purchasing additional products or adding additional users would harm our future operating results.
In order for us to improve our operating results, it is important that our clients renew their agreements with us when the initial contract term expires and also purchase additional products or add additional users. Our clients have no obligation to renew their subscriptions after the initial subscription period, and we cannot assure you that our clients will renew their subscriptions at the same or a higher level of service, if at all. Every year, some of our clients elect not to renew their agreements with us. Moreover, certain of our clients have the right to cancel their agreements for convenience, subject to certain notice requirements and, in some cases, early termination fees. Our client renewal rates may decline or fluctuate as a result of a number of factors, including their satisfaction or dissatisfaction with our products, our pricing, the prices of competing products or services, mergers and acquisitions affecting our client base, reduced hiring by our clients or reductions in our clients’ spending levels. If our clients do not renew their subscriptions, renew on less favorable terms, fail to purchase additional products or fail to add new users, our revenue may decline and our operating results may be harmed.
Integrated, comprehensive SaaS products such as ours represent a relatively recent approach to addressing organizations’ human capital management challenges, and we may be forced to change the prices we charge for our products, or the pricing model upon which they are based, as the market for these types of products evolves.
Providing organizations with applications to address their human capital management challenges through integrated, comprehensive SaaS products is a developing market. The market for these products is therefore still evolving, and competitive dynamics may cause pricing levels, as well as pricing models generally, to change, as the market matures and as existing and new market participants introduce new types of products and different approaches to enable organizations to address their human capital management needs. As a result, we may be forced to reduce the prices we charge for our products or the pricing model on which they are based, and may be unable to renew existing client agreements or enter into new client agreements at the same prices and upon the same terms that we have historically, which could have a material adverse effect on our revenue, gross margin and other operating results.
Evolving regulation of the Internet, changes in the infrastructure underlying the Internet, or interruptions in Internet access may adversely affect our financial condition by increasing our expenditures and causing client dissatisfaction.
As Internet commerce continues to evolve, regulation by federal, state or foreign agencies may increase. We are particularly sensitive to these risks because the Internet is a critical component of our business model. In addition, taxation of services provided over the Internet or other charges for accessing the Internet may be imposed by government agencies or private organizations. Changes in laws or regulations that adversely affect the growth, popularity or use of the Internet, or impact the way that Internet service providers treat Internet traffic, including laws impacting net neutrality, may negatively increase our operating costs or otherwise impact our business. Any regulation imposing greater fees for Internet use or restricting information exchanged over the Internet could result in a decline in the use of the Internet and the viability of Internet-based services, which could harm our business.
In addition, the rapid and continual growth of traffic on the Internet has resulted at times in slow connection and download speeds among Internet users. Our business expansion may be harmed if the Internet infrastructure cannot handle our clients’ demands or if hosting capacity becomes insufficient. If our clients become frustrated with the speed at which they can utilize our products over the Internet, our clients may discontinue the use of our human capital management platform and choose not to renew their contracts with us. Further, the performance of the Internet has also been adversely affected by viruses, worms, hacking, phishing attacks, denial of service attacks and other similar malicious programs, as well as other forms of damage to portions of its infrastructure, which have resulted in a variety of Internet outages, interruptions and other delays. These service interruptions could diminish the overall attractiveness of our products to existing and potential users and could cause demand for our products to suffer.
We currently have a number of international offices and are expanding our international operations. Additionally, we do not have substantial experience in all international markets and may not achieve the results that we expect.
We currently have international offices in several countries, including in Australia, Brazil, France, Germany, Hong Kong, India, Israel, Japan, Netherlands, New Zealand, Spain, Sweden and the United Kingdom, and we may expand our international operations into other countries in the future. International operations involve a variety of risks that may decrease demand for, or restrict our ability to sell or provide, our products, including:
• | unexpected changes in regulatory requirements, taxes, trade laws, tariffs, export quotas, custom duties or other trade restrictions; |
• | differing labor regulations; |
• | regulations relating to data security and the unauthorized use of, or access to, commercial and personal information; |
24
• | potential penalties or other adverse consequences for violations of anti-corruption, anti-bribery and other similar laws and regulations, including the U.S. Foreign Corrupt Practices Act and the U.K. Bribery Act; |
• | greater difficulty in supporting and localizing our products; |
• | unrest and/or changes in a specific country’s or region’s social, political, legal or economic conditions; |
• | challenges inherent in efficiently managing an increased number of employees over large geographic distances, including the need to implement appropriate systems, controls, policies, benefits and compliance programs; |
• | currency exchange rate fluctuations, including any fluctuations caused by uncertainties relating to Brexit; |
• | limited or unfavorable intellectual property protection; and |
• | restrictions on repatriation of earnings. |
We have less significant experience in marketing, selling and supporting our products and services abroad than domestically. Our less significant experience in operating our business internationally increases the risk that any potential future expansion efforts that we may undertake will not be successful. In addition, it may take us longer to build our presence in international markets. If we invest substantial time and resources to expand our international operations and are unable to do so successfully and in a timely manner, our business and operating results will suffer.
Our operations could be materially affected by changes in domestic and foreign economic, political or legal conditions. For example, we are monitoring developments related to Brexit, which could have significant implications for our business. The political and economic instability created by the United Kingdom’s vote to leave the EU has caused and may continue to cause significant volatility in global financial markets and the value of the British Pound currency or other currencies, including the Euro. Depending on the terms reached regarding any exit from the EU, it is possible that there may be adverse practical and/or operational implications on our business.
Failure to comply with anti-bribery, anti-corruption and anti-money laundering laws could subject us to penalties and other adverse consequences.
We are subject to the Foreign Corrupt Practices Act, or FCPA, the U.K. Bribery Act and other anti-corruption, anti-bribery and anti-money laundering laws in various jurisdictions both domestic and abroad. We leverage third parties, including channel partners, to sell subscriptions to our platform and conduct our business abroad. We and our third-party intermediaries may have direct or indirect interactions with officials and employees of government agencies or state-owned or affiliated entities and may be held liable for the corrupt or other illegal activities of these third-party business partners and intermediaries, our employees, representatives, contractors, channel partners and agents, even if we do not explicitly authorize such activities. While we have policies and procedure to address compliance with such laws, we cannot assure you that all of our employees and agents will not take actions in violation of our policies and applicable law, for which we may be ultimately held responsible. Any violation of the FCPA or other applicable anti-bribery, anti-corruption laws and anti-money laundering laws could result in whistleblower complaints, adverse media coverage, investigations, loss of export privileges, severe criminal or civil sanctions, or suspension or debarment from U.S. government contracts, all of which may have an adverse effect on our reputation, business, operating results and prospects.
If we fail to develop our brand cost-effectively, our business may suffer.
We believe that developing and maintaining awareness of the Cornerstone OnDemand brand in a cost-effective manner is critical to achieving widespread acceptance of our existing and future products and is an important element in attracting new clients. Furthermore, we believe that the importance of brand recognition will increase as competition in our market increases. Successful promotion of our brand will depend largely on the effectiveness of our marketing efforts and on our ability to provide reliable and useful services at competitive prices. In the past, our efforts to build our brand have involved significant expenses. Brand promotion activities may not yield increased revenue, and even if they do, any increased revenue may not offset the expenses we incurred in building our brand. In addition, the Cornerstone OnDemand Foundation shares our company name and any negative perceptions of any kind about the Cornerstone OnDemand Foundation could adversely affect our brand and reputation. If we fail to successfully promote and maintain our brand, or incur substantial expenses in an unsuccessful attempt to promote and maintain our brand, we may fail to attract enough new clients or retain our existing clients to the extent necessary to realize a sufficient return on our brand-building efforts, and our business could suffer.
25
Our sales to government entities are subject to a number of additional challenges and risks.
We sell to U.S. federal and state and foreign governmental agency customers, and we may increase sales to government entities in the future. For example, in June 2017, we entered into an agreement with the U.S. Postal Service that authorizes, but does not guarantee, the purchase by the U.S. Postal Service of our software and services to support their more than 600,000 employees. The additional risks and challenges associated with doing business with governmental entities include, but are not limited to, the following:
• | Selling to governmental entities can be more competitive, expensive and time-consuming than selling to private entities, often requiring significant upfront time and expense without any assurance that these efforts will generate a sale; |
• | Government certification requirements may change, or we may lose one or more government certifications, such as FedRAMP, and in doing so restrict our ability to sell into the government sector until we have attained revised certificates; |
• | Governmental entities may have significant leverage in negotiations, thereby enabling such entities to demand contract terms that differ from what we generally agree to in our standard agreements, including, for example, most favored nation clauses and terms allowing contract termination for convenience; |
• | Government demand and payment for our products may be influenced by public sector budgetary cycles and funding authorizations, with funding reductions or delays having an adverse impact on public sector demand for our products; and |
• | Government contracts are generally subject to audits and investigations, which we have limited experience with, potentially resulting in termination of contracts, refund of a portion of fees received, forfeiture of profits, suspension of payments, fines and suspensions or debarment from future government business. |
To the extent that we become more reliant on contracts with government entities in the future, our exposure to such risks and challenges could increase, which, in turn, could adversely impact our business.
If for any reason we are not able to develop enhancements and new features, keep pace with technological developments or respond to future disruptive technologies, our business will be harmed.
Our future success will depend on our ability to adapt and innovate. To attract new clients and increase revenue from existing clients, we will need to enhance and improve our existing products and introduce new features. The success of any enhancement or new feature depends on several factors, including timely completion, introduction and market acceptance. If we are unable to enhance our existing products to meet client needs or successfully develop or acquire new features or products, or if such new features or products fail to be successful, our business and operating results will be adversely affected.
In addition, because our products are designed to operate on a variety of network, hardware and software platforms using Internet tools and protocols, we will need to continuously modify and enhance our products to keep pace with changes in internet-related hardware, software, communication, browser and database technologies. If we are unable to respond in a timely and cost-effective manner to these rapid technological developments, our products may become less marketable and less competitive or obsolete, and our operating results may be negatively impacted.
Finally, our ability to grow is subject to the risk of future disruptive technologies. If new technologies emerge that are able to deliver a human capital management platform at lower prices, more efficiently or more conveniently, such technologies could adversely impact our ability to compete.
We may require additional capital to support business growth, and this capital may not be available on acceptable terms, if at all.
We intend to continue to make investments to support our business growth and may seek additional funds to respond to business challenges, including the need to develop new features or enhance our existing products, improve our operating infrastructure or acquire complementary businesses and technologies. Accordingly, we may need to engage in additional equity or debt financings to secure additional funds. If we raise additional funds through issuances of equity or debt securities, our existing stockholders could suffer significant dilution, and any new equity securities we issue could have rights, preferences and privileges superior to those of holders of our common stock. Any debt financing secured by us in the future could involve restrictive covenants relating to our capital raising activities and other financial and operational matters, which may make it more difficult for us to obtain additional capital and to pursue business opportunities, including potential acquisitions. In addition, we may not be able to obtain additional financing on terms favorable to us, if at all. If we are unable to obtain adequate financing or financing on terms satisfactory to us, when we require it, our ability to continue to support our business growth and to respond to business challenges could be significantly impaired.
26
Further, the indenture governing the convertible notes due 2021 includes a restrictive covenant that, subject to specified exceptions and parameters, limits our ability to incur additional debt. We may be unable to take advantage of strategic or business development opportunities as they arise, or we may not be able to react to market conditions, if we are restricted in our ability to raise debt financing, or we may be required to seek alternative means to generate cash, including by selling assets, refinancing or obtaining additional equity capital on terms that may be onerous or highly dilutive, if available at all.
In addition, in connection with the sale of our convertible notes due 2012, we entered into an investment agreement with Silver Lake providing Silver Lake with the option to purchase all or a portion of any equity securities, or instruments convertible into or exchangeable for any equity securities, in any proposed offerings by us until the earlier of June 2019 or such time as Silver Lake no longer has a representative and no longer has rights to have a representative on our Board. Although Silver Lake’s option will not apply to equity securities issued in connection with acquisitions, underwritten public offerings, strategic partnerships or commercial arrangements, or equity compensation plans, Silver Lake’s participation rights could impact our ability to raise additional capital.
Servicing our debt will require a significant amount of cash, which could adversely affect our business, financial condition and results of operations.
Our ability to make scheduled payments of the principal of, to pay interest on or to refinance our indebtedness, including our convertible notes due 2021 and 2018, which represent an aggregate principal amount of $553.0 million, depends on our future performance, which is subject to economic, financial, competitive and other factors beyond our control. Our business may not generate cash flow from operations in the future sufficient to satisfy our obligations under the notes and any future indebtedness we may incur and to make necessary capital expenditures. If we are unable to generate such cash flow, we may be required to adopt one or more alternatives, such as reducing or delaying investments or capital expenditures, selling assets, refinancing or obtaining additional equity capital on terms that may be onerous or highly dilutive. Our ability to refinance the notes or future indebtedness will depend on the capital markets and our financial condition at such time. We may not be able to engage in any of these activities or engage in these activities on desirable terms, which could result in a default on the notes or future indebtedness.
Further, with certain exceptions, upon a change of control, the holders of our convertible notes due 2021 may require that we repurchase all or part of such notes at a purchase price equal to the principal amount plus the total sum of all remaining scheduled interest payments through the remainder of the term of the notes. In addition, with certain exceptions, upon a change of control, the holders of our convertible notes due 2018 may require us to purchase all or a portion of such notes for cash at a price equal to the principal amount of such notes plus any accrued and unpaid interest to, but excluding, the effective date of the change of control. In such event, we may not have enough cash available or be able to obtain financing to repurchase the notes, and our ability to repurchase notes may be limited by law, regulatory authority or agreements governing our other indebtedness.
Because of how we recognize revenue, a significant downturn in our business may not be immediately reflected in our operating results.
Generally, we recognize revenue from subscription agreements monthly over the terms of these agreements, which is typically three years for our human capital management platform. As a result, a significant portion of the revenue we report in each quarter is generated from client agreements entered into during previous periods. Consequently, a decline in new subscriptions in any one quarter may not significantly impact our revenue and financial performance in that quarter, but will negatively affect our revenue, or rate of revenue growth and financial performance in future quarters.
In addition, if subscription agreements expire and are not renewed in the same quarter, our revenue and financial performance in that quarter and subsequent quarters will be negatively affected. However, the revenue impact may not be immediately reflected in our operating results to the extent there is an offsetting increase in revenue from services contracts performed in that same quarter.
Finally, we may be unable to adjust our fixed costs in response to reduced revenue. Accordingly, the effect of significant declines in sales and market acceptance of our products may not be reflected in our short-term operating results.
Because we generally recognize subscription revenue from our clients over the terms of their agreements but incur most costs associated with generating such agreements upfront, rapid growth in our client base may put downward pressure on our operating income in the short term.
The expenses associated with generating client agreements are generally incurred up front but the resulting subscription revenue is generally recognized over the life of the agreements; therefore, increased growth in the number of our clients will result in our recognition of more costs than revenue during the early periods covered by such agreements, even in cases where the agreements are expected to be profitable for us over their full terms.
27
We have a history of losses, and we cannot be certain that we will achieve or sustain profitability.
We have incurred losses since our inception. We experienced net losses of $61.3 million, $66.8 million and $85.5 million in 2017, 2016 and 2015, respectively. At December 31, 2017, our accumulated deficit was $515.1 million and total stockholders’ equity was $22.1 million. We expect to continue to incur operating losses as a result of expenses associated with the continued development and expansion of our business. Our expenses include among others, sales and marketing, research and development, consulting and support services and other costs relating to the development, marketing and sale and service of our products that may not generate revenue until later periods, if at all. Any failure to increase revenue or manage our cost structure as we implement initiatives to grow our business could prevent us from achieving or sustaining profitability. In addition, our ability to achieve profitability is subject to a number of the risks and uncertainties discussed below, many of which are beyond our control. We cannot be certain that we will be able to achieve or sustain profitability on a quarterly or annual basis.
The conversion feature of the convertible notes due 2018 could adversely affect our financial condition and operating results.
In the event the conditional conversion feature of the convertible notes due 2018 is triggered, holders of such notes will be entitled to convert the notes at any time during specified periods at their option. In addition, holders of these notes may convert all or a portion of their notes at any time on and after April 1, 2018. If one or more holders elect to convert their notes, we would be required to settle a portion of our conversion obligation through the payment of cash, which could adversely affect our liquidity. In addition, even if holders do not elect to convert their notes, we could be required under applicable accounting rules to reclassify all or a portion of the outstanding principal of the notes as a current rather than long-term liability, which would result in a material reduction of our net working capital.
The accounting methods for our convertible debt securities may have a material effect on our reported financial results.
In May 2008, the Financial Accounting Standards Board, or FASB, issued FASB Staff Position No. APB 14-1, Accounting for Convertible Debt Instruments That May Be Settled in Cash Upon Conversion (Including Partial Cash Settlement), which has subsequently been codified as Accounting Standards Codification 470-20, Debt with Conversion and Other Options, which we refer to as ASC 470-20. Under ASC 470-20, an entity must separately account for the liability and equity components of the convertible debt instruments (such as the convertible notes due 2018) that may be settled entirely or partially in cash upon conversion in a manner that reflects the issuer's economic interest cost. The effect of ASC 470-20 on the accounting for the convertible notes due 2018 is that the equity component is required to be included in the additional paid-in capital section of stockholders' equity on our consolidated balance sheet, and the value of the equity component would be treated as original issue discount for purposes of accounting for the debt component of the notes. As a result, we will be required to record a greater amount of non-cash interest expense in current periods presented as a result of the amortization of the discounted carrying value of the convertible notes due 2018 to their face amount over the term of the notes. We will report lower net income (or greater net loss) in our financial results because ASC 470-20 will require interest to include both the current period's amortization of the debt discount and the instrument's coupon interest, which could adversely affect our reported or future financial results, the market price of our common stock and the trading price of the notes.
In addition, convertible debt instruments (such as the convertible notes due 2018) that may be settled entirely or partly in cash are currently accounted for utilizing the treasury stock method, the effect of which is that the shares issuable upon conversion of the notes are not included in the calculation of diluted earnings per share except to the extent that the conversion value of the notes exceeds their principal amount. Under the treasury stock method, for diluted earnings per share purposes, the transaction is accounted for as if the number of shares of common stock that would be necessary to settle such excess, if we elected to settle such excess in shares, are issued. We cannot be sure that the accounting standards in the future will continue to permit the use of the treasury stock method. In contrast, our convertible notes due 2021 may be settled upon conversion only in shares of our common stock. As a result, the shares issuable upon conversion of these notes will be included in the calculation of diluted earnings per share assuming the conversion of the notes at the beginning of the reporting period if the impact is dilutive. To the extent that we are required to include shares issuable upon conversion of our convertible debt securities in the calculation of diluted earnings per share, our diluted earnings per share will be adversely affected.
28
The nature of our business requires the application of complex revenue and expense recognition rules and the current legislative and regulatory environment affecting GAAP is uncertain. Changes in financial accounting standards or practices may cause adverse, unexpected financial reporting fluctuations and affect our reported operating results.
The accounting rules and regulations that we must comply with are complex and subject to interpretation by the FASB, the SEC and various bodies formed to promulgate and interpret appropriate accounting principles. In addition, many companies’ accounting disclosures are being subjected to heightened scrutiny by regulators and the public. A change in accounting standards or practices can have a significant effect on our reported results and may even affect our reporting of transactions completed before the change is effective. New accounting pronouncements and varying interpretations of accounting pronouncements have occurred and may occur in the future. Changes to existing rules or the questioning of current practices may adversely affect our reported financial results or the way we conduct our business.
For example, in May 2014, the FASB issued Accounting Standards Update No. 2014-09, Revenue from Contracts with Customers (Topic 606), which supersedes nearly all existing revenue recognition guidance under GAAP. We will adopt Topic 606 on the effective date of January 1, 2018, using the modified retrospective transition method, and plan to implement changes to our accounting, internal controls and disclosures to support the new standard. Under this guidance, revenue is recognized when promised goods or services are transferred to customers in an amount that reflects the consideration that is expected to be received for those goods and services. The guidance is expected to impact the timing and recognition of costs to obtain contracts with customers, such as commissions, and may result in variability in our revenue recognition from period to period that may cause unexpected variability in our operating results. Any difficulties in implementing this new standard could cause us to fail to meet our financial reporting obligations, which could result in regulatory discipline, harm investors’ confidence in us, and adversely affect our stock price.
To the extent that our pre-tax income or loss becomes relatively modest, our ability to conclude that a control deficiency is not a material weakness or that an accounting error does not require a restatement could be adversely affected.
Under the Sarbanes-Oxley Act of 2002, our management is required to assess the impact of control deficiencies based upon both quantitative and qualitative factors, and depending upon that analysis, we classify such identified deficiencies as either a control deficiency, significant deficiency or a material weakness. One element of our analysis of the significance of any control deficiency is its actual or potential financial impact. This assessment will vary depending on our level of pre-tax income or loss. For example, a smaller pre-tax income or loss will increase the likelihood of a quantitative assessment of a control deficiency as a significant deficiency or material weakness.
To the extent that our pre-tax income or loss is relatively small, if management or our independent registered public accountants identify an error in our interim or annual financial statements, it is more likely that such an error may be determined to be a material weakness or be considered a material error that could, depending upon the complete quantitative and qualitative analysis, result in our having to restate previously issued financial statements.
If we fail to adequately protect our proprietary rights, our competitive advantage and brand could be impaired and we may lose valuable assets, generate reduced revenue and incur costly litigation to protect our rights.
Our success is dependent, in part, upon protecting our proprietary technology. We rely on a combination of patents, copyrights, trademarks, service marks, trade secret laws and contractual restrictions to establish and protect our proprietary rights in our products and services. However, the steps we take to protect our intellectual property may be inadequate. We will not be able to protect our intellectual property if we are unable to enforce our rights or if we do not detect unauthorized use of our intellectual property. Despite our precautions, it may be possible for unauthorized third parties to copy our products and use information that we regard as proprietary to create products and services that compete with ours. Some license provisions protecting against unauthorized use, copying, transfer and disclosure of our licensed products may be unenforceable under the laws of certain jurisdictions and foreign countries. Further, the laws of some countries do not protect proprietary rights to the same extent as the laws of the United States. To the extent we expand our international activities, our exposure to unauthorized copying and use of our products and proprietary information may increase. We enter into confidentiality and invention assignment agreements with our employees and consultants and enter into confidentiality agreements with the parties with whom we have strategic relationships and business alliances. These agreements may not be effective in controlling access to and distribution of our products and proprietary information. Further, these agreements do not prevent our competitors from independently developing technologies that are substantially equivalent or superior to our products. Litigation brought to protect and enforce our intellectual property rights could be costly, time consuming and distracting to management and could result in the impairment or loss of portions of our intellectual property. If we fail to secure, protect and enforce our intellectual property rights, we may lose valuable assets, generate reduced revenue and incur costly litigation to protect our rights, which could seriously harm our brand and adversely impact our business.
29
We may be sued by third parties for alleged infringement of their proprietary rights or may find it necessary to enter into licensing arrangements with third parties to settle or forestall such claims, either of which could have a material adverse effect on our operating results and financial condition.
There is considerable patent and other intellectual property development activity in our industry. Our success depends in part upon our not infringing the intellectual property rights of others. However, our competitors, as well as a number of other entities and individuals, may own or claim to own intellectual property relating to our industry or, in some cases, our technology or products. From time to time, such third parties may claim that we are infringing their intellectual property rights, and we may actually be found to be infringing such rights. Moreover, we may be subject to claims of infringement with respect to technology that we acquire or license from third parties. The risk that we could be subject to infringement claims is increasing as the number of products and companies competing with our platform grows. Any claims or litigation could require the commitment of substantial time and resources and, if successfully asserted against us, could require that we pay substantial damages or ongoing royalty or licensing payments, indemnify our clients, distributors or other third parties, modify or discontinue the sale of our products, or refund fees, any of which would deplete our resources and adversely impact our business. We have in the past obtained, and may in the future obtain, licenses from third parties to forestall or settle potential claims that our products and technology infringe the intellectual property rights of others. Discussions and negotiations with such third parties, whether successful or unsuccessful, could result in substantial costs and the diversion of management resources, either of which could seriously harm our business.
Indemnity provisions in various agreements potentially expose us to substantial liability for intellectual property infringement and other losses.
Our agreements with clients and other third parties may include indemnification provisions under which we agree to indemnify them for losses suffered or incurred as a result of claims of intellectual property infringement, damages caused by us to property or persons, or other liabilities relating to or arising from our products, services or other contractual obligations. The term of these indemnity provisions generally survives termination or expiration of the applicable agreement. Large indemnity payments could harm our business, operating results and financial condition. From time to time, we are requested by clients to indemnify them for breach of confidentiality with respect to personal data. Although we normally do not agree to, or contractually limit our liability with respect to, such requests, the existence of such a dispute with a client may have adverse effects on our client relationships and reputation.
We use open source software in our products, which could subject us to litigation or other actions.
We use open source software in our products and may use more open source software in the future. From time to time, there have been claims challenging the ownership of open source software against companies that incorporate open source software into their products. As a result, we could be subject to suits by parties claiming ownership of what we believe to be open source software. Litigation could be costly for us to defend, have a negative effect on our operating results and financial condition or require us to devote additional research and development resources to change our products. In addition, if we were to combine our proprietary software products with open source software in a certain manner, we could, under certain of the open source licenses, be required to release the source code of our proprietary software products. If we inappropriately use open source software, we may be required to re-engineer our products, discontinue the sale of our products or take other remedial actions.
We are subject to governmental export and import controls that could impair our ability to compete in international markets due to licensing requirements and subject us to liability if we are not in full compliance with applicable laws.
Our products are subject to export controls, including the Commerce Department’s Export Administration Regulations and various economic and trade sanctions regulations established by the Treasury Department’s Office of Foreign Assets Controls, and exports of our products must be made in compliance with these laws. If we fail to comply with these U.S. export control laws and import laws, including U.S. Customs regulations, we and certain of our employees could be subject to substantial civil or criminal penalties, including the possible loss of export or import privileges; fines, which may be imposed on us and responsible employees or managers; and, in extreme cases, the incarceration of responsible employees or managers. In addition, if our distributors fail to obtain appropriate import, export or re-export licenses or authorizations, we may also be adversely affected through reputational harm and penalties. Obtaining the necessary authorizations, including any required license, for a particular sale may be time-consuming and is not guaranteed, and may result in the delay or loss of sales opportunities. Furthermore, the U.S. export control laws and economic sanctions laws prohibit the shipment of certain products and services to U.S. embargoed or sanctioned countries, governments and persons. Even though we take precautions to prevent our products from being shipped or provided to U.S. sanctions targets, our products and services could be shipped to those targets or provided by our distributors despite such precautions. Any such shipment could have negative consequences, including government investigations, penalties and reputational harm. In addition, various countries regulate the import of certain encryption technology, including through import permitting or licensing requirements, and have enacted laws that could limit our ability to distribute our products or could limit our clients’ ability to implement our products in those countries.
30
Changes to our products or changes in export and import regulations may create delays in the introduction and sale of our products in international markets, prevent our clients with international operations from deploying our products or, in some cases, prevent the export or import of our products to certain countries, governments or persons altogether. Any change in export or import regulations, economic sanctions or related laws, shift in the enforcement or scope of existing regulations, or change in the countries, governments, persons or technologies targeted by such regulations, could result in decreased use of our products, or in our decreased ability to export or sell our products to existing or potential clients with international operations. Any decreased use of our products or limitation on our ability to export or sell our products would likely adversely affect our business, financial condition and operating results.
We rely on implementation partners to deliver professional services to our clients, and if these implementation partners fail to deliver these professional services effectively, or if we are unable to incentivize new partners to service our customers, our operating results will be harmed.
We rely on various partners to assist us in the successful implementation of our products and to optimize our clients’ use of our products during the terms of their engagements. We provide our implementation partners with specific training and programs to assist them in servicing our clients, but there can be no assurance that these steps will be utilized or effective. If these partners fail to deliver these services to our customers in an effective and timely manner, we may suffer reputational harm and our results of operations may be adversely impacted. We also may not be able to incentivize new partners to service our customers. If we are unable to maintain our existing relationships or enter into new ones, we would have to devote substantially more resources to delivering our professional services. If we fail to effectively manage our implementation partners, our ability to sell our products and subscriptions and our operating results will be harmed.
Our investment portfolio is subject to general credit, liquidity, counterparty, market and interest rate risks, any of which could impair the market value of our investments and harm our financial results.
At December 31, 2017, we had $393.6 million in cash and cash equivalents and $263.5 million in short-term and long-term investments in marketable securities, consisting of corporate bonds, money market funds backed by United States Treasury Bills, U.S. treasury securities and agency securities. Although we follow an established investment policy and set of guidelines to manage our investment portfolio, our investments are subject to general credit, liquidity, counterparty, market and interest rate risks, which have been exacerbated by the recent financial and credit crisis, rising bankruptcy filings in the United States and the ongoing debt-ceiling debate.
Because the market value of fixed-rate debt securities may be adversely impacted by a rise in interest rates, our future investment income may fall short of expectations if interest rates rise. In addition, we may suffer losses if we are forced to sell securities that have experienced a decline in market value because of changes in interest rates. Currently, we do not use financial derivatives to hedge our interest rate exposure.
The fair value of our investments may change significantly due to events and conditions in the credit and capital markets. Any investment securities that we hold, or the issuers of such securities, could be subject to review for possible downgrade. Any downgrade in these credit ratings may result in an additional decline in the estimated fair value of our investments. Changes in the various assumptions used to value these securities and any increase in the perceived market risk associated with such investments may also result in a decline in estimated fair value.
In the event of adverse conditions in the credit and capital markets, and to the extent we make future investments, our investment portfolio may be impacted, and we could determine that some or all of our investments experienced an other-than-temporary decline in fair value, requiring impairment, which could adversely impact our financial position and operating results.
We may invest in companies for strategic reasons and may not realize a return on our investments.
In November 2013, we launched a strategic initiative created to invest in, advise and collaborate with promising cloud startups building innovative business applications that support the continued expansion of our market reach. We have made, and from time to time may continue to make, strategic investments in privately-held companies. The privately-held companies in which we may invest are considered inherently risky. The technologies and products these companies have under development are typically in the early stages and may never materialize, which could result in a loss of all or a substantial part of our initial investment in these companies. The evaluation of privately-held companies is based on information that we request from these companies, which is not subject to the same disclosure regulations as U.S. publicly traded companies, and as such, the basis for these evaluations is subject to the timing and accuracy of the data received from these companies.
31
Risks Related to Tax Issues
We are a multinational organization faced with increasingly complex tax issues in many jurisdictions, and we could be obligated to pay additional taxes in various jurisdictions.
As a multinational organization, we are subject to taxation in several jurisdictions around the world with increasingly complex tax laws, the application of which can be uncertain. The amount of taxes we pay in these jurisdictions could increase substantially as a result of changes in the applicable tax principles, including increased tax rates, new tax laws or revised interpretations of existing tax laws and precedents, which could have a material adverse effect on our liquidity and operating results. In addition, the authorities in these jurisdictions could review our tax returns and impose additional tax, interest and penalties, and the authorities could claim that various withholding requirements apply to us or our subsidiaries or assert that benefits of tax treaties are not available to us or our subsidiaries, any of which could have a material impact on us and our operating results. If we are selected for future examinations that uncover incorrect tax positions, we could be subject to additional taxes, interest and penalties.
Taxing authorities could reallocate our taxable income among our subsidiaries, which could increase our consolidated tax liability.
We conduct operations worldwide through subsidiaries in various tax jurisdictions pursuant to transfer pricing arrangements between our subsidiaries. If two or more affiliated companies are located in different countries, the tax laws or regulations of each country generally will require that transfer prices be the same as those between unrelated companies dealing at arms’ length and that contemporaneous documentation is maintained to support the transfer prices. While we believe that we operate in compliance with applicable transfer pricing laws and intend to continue to do so, our transfer pricing procedures are not binding on applicable tax authorities. If tax authorities in any of these countries were to successfully challenge our transfer prices as not reflecting arm’s length transactions, they could require us to adjust our transfer prices and thereby reallocate our income to reflect these revised transfer prices, which could result in a higher tax liability to us. In addition, if the country from which the income is reallocated does not agree with the reallocation, both countries could tax the same income, resulting in double taxation. If tax authorities were to allocate income to a higher tax jurisdiction, subject our income to double taxation or assess interest and penalties, it would increase our consolidated tax liability, which could adversely affect our financial condition, operating results and cash flows.
The recently passed comprehensive tax reform bill could adversely affect our business and financial condition.
On December 22, 2017, new legislation was enacted that significantly revises the Internal Revenue Code of 1986, as amended. The newly enacted federal income tax law, among other things, contains significant changes to corporate taxation, including reduction of the corporate tax rate from a top marginal rate of 35% to a flat rate of 21%, limitation of the tax deduction for interest expense to 30% of adjusted earnings (except for certain small businesses), limitations on the deductibility of executive compensation, limitation of the deduction for net operating losses to 80% of current year taxable income and elimination of net operating loss carrybacks, one time taxation of offshore earnings at reduced rates regardless of whether they are repatriated, elimination of U.S. tax on foreign earnings (subject to certain important exceptions), immediate deductions for certain new investments instead of deductions for depreciation expense over time, and modifying or repealing many business deductions and credits. Notwithstanding the reduction in the corporate income tax rate, the overall impact of the new federal tax law is uncertain and our business and financial condition could be adversely affected. In addition, it is uncertain if and to what extent various states will conform to the newly enacted federal tax law. The Act's new international rules, including the Global Intangible Low-Taxed Income, the Foreign Derived Intangible Income and the Base Erosion Anti-Avoidance Tax, are highly complex and may affect our financial condition as additional interpretive guidance is issued. The impact of this tax reform on holders of our common stock is also uncertain and could be adverse. We urge our stockholders to consult with their legal and tax advisors with respect to this legislation and the potential tax consequences of investing in or holding our common stock.
Our ability to use net operating loss carryforwards to reduce future tax payments may be subject to limitations.
We have federal and state net operating loss carryforwards that will begin to expire, if not utilized. These net operating loss carryforwards could expire unused and be unavailable to offset future income tax liabilities. Under the newly enacted federal income tax law, federal net operating losses incurred in 2018 and in future years may be carried forward indefinitely, but the deductibility of such federal net operating losses may be limited. It is uncertain if and to what extent various states will conform to the newly enacted federal tax law. In addition, under Section 382 of the Internal Revenue Code of 1986, as amended, if a corporation undergoes an “ownership change” (generally defined as a greater than 50% change (by value) in its equity ownership over a three year period), the corporation’s ability to use its pre-change net operating loss carryforwards and other pre-change tax attributes (such as research tax credits) to offset its post-change income may be limited. We may experience ownership changes in the future and subsequent shifts in our stock ownership. As a result, we may be limited in the
32
portion of net operating loss carryforwards that we can use in the future to offset taxable income for U.S. Federal income tax purposes.
Risks Related to Ownership of Our Common Stock
The trading price of our common stock may be volatile.
The trading price of our common stock has at times been volatile and could continue to be subject to significant fluctuations in response to various factors, some of which are beyond our control. In addition, the stock market in general, and the market for technology companies in particular, has experienced extreme price and volume fluctuations that have often been unrelated or disproportionate to the operating performance of the companies operating in such markets. The market price of our common stock may be similarly volatile, and investors in our common stock may experience a decrease in the value of their shares, including as a result of factors unrelated to our operating performance and prospects. The market price of our common stock could be subject to wide fluctuations in response to a number of factors, including:
• | our operating performance and the performance of other similar companies; |
• | the financial or non-financial metric projections we provide to the public, including the failure of the projections to meet the expectations of securities analysts or investors, and any changes in these projections or our failure to meet or exceed these projections; |
• | the overall performance of the equity markets; |
• | developments with respect to intellectual property rights; |
• | publication of unfavorable research reports about us or our industry or withdrawal of research coverage by securities analysts; |
• | speculation in the press or investment community; |
• | the size of our public float; |
• | natural disasters or terrorist acts; |
• | announcements by us or our competitors of significant contracts, new technologies, acquisitions, commercial relationships, joint ventures or capital commitments; and |
• | global economic, legal and regulatory factors unrelated to our performance. |
In addition, in the past, following periods of volatility in the overall market and the market price of a particular company’s securities, securities class action litigation has often been initiated against these companies. This litigation, if initiated against us, could result in substantial costs and a diversion of our management’s attention and resources.
If securities or industry analysts do not publish research or publish misleading or unfavorable research about our business, the market price of our common stock and trading volume could decline.
The trading market for our common stock depends in part on the research and reports that securities or industry analysts publish about us, our business or our market. If one or more of the analysts who cover us downgrade our common stock or publish incorrect or unfavorable research about our business, the market price of our common stock would likely decline. In addition, if one or more of these analysts cease coverage of our company or fail to publish reports on us regularly, demand for our common stock could decrease, which could cause the market price of our stock or trading volume to decline.
The issuance of additional stock in connection with acquisitions, our stock incentive plans or otherwise will dilute all other stockholdings.
Our certificate of incorporation authorizes us to issue up to 1,000,000,000 shares of common stock and up to 50,000,000 shares of preferred stock with such rights and preferences as may be determined by our board of directors. Subject to compliance with applicable rules and regulations, we may issue all of these shares that are not already outstanding without any action or approval by our stockholders. We intend to continue to evaluate strategic acquisitions in the future. We may pay for such acquisitions, partly or in full, through the issuance of additional equity. Any issuance of shares in connection with our acquisitions, the exercise of stock options, the vesting of restricted stock units or otherwise would dilute the percentage ownership held by existing investors.
33
We cannot guarantee that our recently announced share repurchase program will be fully consummated or that it will enhance shareholder value, and share repurchases could affect the trading price of our common stock.
In November 2017, our board of directors authorized a $100.0 million share repurchase program. Although our board of directors has authorized a share repurchase program, the share repurchase program does not obligate us to repurchase any specific dollar amount or to acquire any specific number of shares. The share repurchase program could affect the price of our common stock, increase volatility and diminish our cash reserves. In addition, it may be suspended or terminated at any time, which may result in a decrease in the price of our common stock.
Conversion of our convertible notes may dilute the ownership interest of existing stockholders, including holders who had previously converted their notes, or may otherwise depress the price of our common stock.
The conversion of some or all of our convertible notes due 2021 and the conversion of all or some of our convertible notes due 2018, to the extent we deliver shares upon conversion of the 2018 notes. will dilute the ownership interests of existing stockholders. Any sales in the public market of our common stock issuable upon such conversion could adversely affect prevailing market prices of our common stock. In addition, the existence of the notes may encourage short selling by market participants because the conversion of the notes could be used to satisfy short positions, or anticipated conversion of the notes into shares of our common stock could depress the price of our common stock.
We do not expect to declare any dividends in the foreseeable future.
We do not anticipate declaring any cash dividends to holders of our common stock in the foreseeable future. Consequently, investors may need to sell all or part of their holdings of our common stock after price appreciation, which may never occur, as the only way to realize any future gains on their investment. Investors seeking cash dividends should not purchase our common stock.
Anti-takeover provisions in our charter documents and Delaware law may delay or prevent an acquisition of our company.
Our certificate of incorporation, our bylaws and Delaware law contain provisions that may have the effect of delaying or preventing a change in control of us or changes in our management. Our certificate of incorporation and our bylaws include provisions that:
• | authorize “blank check” preferred stock, which could be issued by the board without stockholder approval and may contain voting, liquidation, dividend and other rights superior to our common stock; |
• | create a classified board of directors whose members serve staggered three-year terms; |
• | specify that special meetings of our stockholders can be called only by our board of directors, the chairperson of the board, the chief executive officer or the president; |
• | establish an advance notice procedure for stockholder approvals to be brought before an annual meeting of our stockholders, including proposed nominations of persons for election to our board of directors; |
• | provide that our directors may be removed only for cause; |
• | provide that vacancies on our board of directors may be filled only by a majority of directors then in office, even though less than a quorum; |
• | specify that no stockholder is permitted to cumulate votes at any election of directors; and |
• | require supermajority votes of the holders of our common stock to amend specified provisions of our charter documents. |
These provisions, alone or together, could delay or prevent hostile takeovers and changes in control or changes in our management.
In addition, because we are incorporated in Delaware, we are governed by the provisions of Section 203 of the Delaware General Corporation Law, which limits the ability of stockholders owning in excess of 15% of our outstanding voting stock to merge or combine with us.
Any provision of our certificate of incorporation, our bylaws or Delaware law that has the effect of delaying or deterring a change in control could limit the opportunity for our stockholders to receive a premium for their shares of our common stock, and could also affect the price that some investors are willing to pay for our common stock.
Item 1B. | Unresolved Staff Comments |
Not applicable.
Item 2. | Properties |
Our principal offices are located in Santa Monica, California, where we occupy approximately 108,000 square feet of office space under operating leases that expire in January 2019. We have additional established offices in Amsterdam, Netherlands; Auckland, New Zealand; Bangalore, India; Düsseldorf, Germany; Hong Kong; London, United Kingdom; Madrid, Spain; Mumbai, India; Munich, Germany; New Delhi, India; Paris, France; São Paulo, Brazil; Stockholm, Sweden; Sunnyvale, United States; Sydney, Australia; Tel Aviv, Israel; and Tokyo, Japan to support our international operations. We believe that our facilities are adequate for our current needs and that suitable additional or substitute space will be available as needed to accommodate planned expansion of our operations.
Item 3. | Legal Proceedings |
From time to time, we are involved in a variety of claims, suits, investigations and proceedings arising from the ordinary course of our business, including actions with respect to intellectual property claims, breach of contract and tort claims, labor and employment claims, tax and other matters. Although claims, suits, investigations and proceedings are inherently uncertain and their results cannot be predicted with certainty, we believe that the resolution of our current pending matters will not have a material adverse effect on our business, consolidated financial position, results of operations or cash flow. Regardless of the outcome, litigation can have an adverse impact on us because of defense costs, diversion of management resources and other factors. In addition, it is possible that an unfavorable resolution of one or more such proceedings could in the future materially and adversely affect our financial position, results of operations or cash flows in a particular period.
Item 4. | Mine Safety Disclosure |
Not applicable.
PART II
34
Item 5. | Market for Registrant's Common Equity, Related Stockholder Matters and Issuer Purchases of Equity Securities |
Market for Our Common Stock and Related Stockholder Matters
Our common stock has been traded on the Nasdaq Global Select Market under the symbol “CSOD” since March 17, 2011. Prior to that time, there was no public market for our common stock. The following table sets forth for the periods indicated the high and low closing sale prices for our common stock as reported on the Nasdaq Global Select Market.
Fiscal 2017 | Fiscal 2016 | ||||||||||||||
High | Low | High | Low | ||||||||||||
First quarter | $ | 43.75 | $ | 38.36 | $ | 34.15 | $ | 24.38 | |||||||
Second quarter | 39.51 | 35.31 | 43.08 | 32.92 | |||||||||||
Third quarter | 41.14 | 33.82 | 47.17 | 37.88 | |||||||||||
Fourth quarter | 40.90 | 34.17 | 45.88 | 31.55 | |||||||||||
Holders of Record
As of January 31, 2018 there were 19 holders of record of our common stock. Because many of our shares of common stock are held of record by brokers and other institutions on behalf of stockholders, we are unable to estimate the total number of stockholders represented by such record holders.
Dividend Policy
We have never declared or paid, and do not anticipate declaring or paying, any cash dividends on our common stock. Any future determination as to the declaration and payment of dividends will be at the discretion of our board of directors and will depend on then-existing conditions, including our financial condition, operating results, contractual restrictions, capital requirements, business prospects and other factors our board of directors may deem relevant.
STOCK PRICE PERFORMANCE GRAPH
This performance graph shall not be deemed “filed” for purposes of Section 18 of the Securities Exchange Act of 1934, as amended (the Exchange Act), or incorporated by reference into any filing of Cornerstone OnDemand, Inc. under the Securities Act of 1933, as amended, or the Exchange Act, except as shall be expressly set forth by specific reference in such filing.
The following graph compares (i) the cumulative total stockholder return on our common stock from December 31, 2012 through December 31, 2017 with (ii) the cumulative total return of the Nasdaq Global Market Index and (iii) the Nasdaq Computer & Data Processing Index over the same period, assuming the investment of $100 in our common stock and in both of the other indices on December 31, 2012 and the reinvestment of all dividends. As discussed above, we have never declared or paid a cash dividend on our common stock and do not anticipate declaring or paying a cash dividend in the foreseeable future.
35
COMPARISON OF CUMULATIVE TOTAL RETURN OF CORNERSTONE ONDEMAND
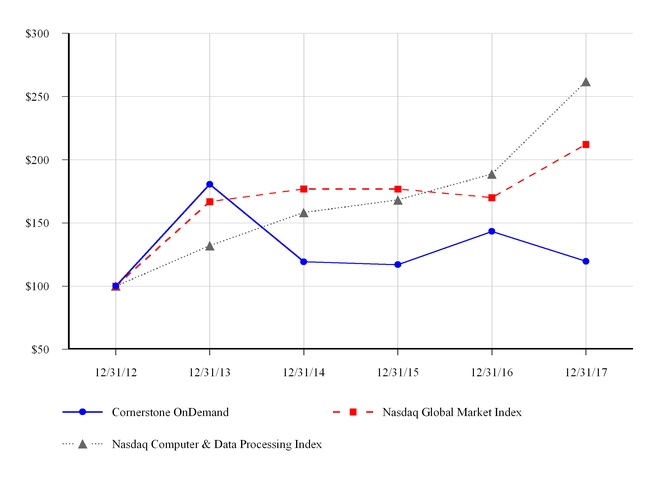
December 31, 2012 | December 31, 2013 | December 31, 2014 | December 31, 2015 | December 31, 2016 | December 31, 2017 | ||||||||||||||||||
Cornerstone OnDemand | $ | 100.00 | $ | 180.53 | $ | 119.20 | $ | 116.93 | $ | 143.28 | $ | 119.64 | |||||||||||
Nasdaq Global Market Index | $ | 100.00 | $ | 166.85 | $ | 176.88 | $ | 176.86 | $ | 170.04 | $ | 212.17 | |||||||||||
Nasdaq Computer & Data Processing Index | $ | 100.00 | $ | 131.95 | $ | 158.17 | $ | 168.05 | $ | 188.67 | $ | 261.81 | |||||||||||
The comparisons shown in the graph and table above are based upon historical data. We caution that the stock price performance shown in the graph above is not necessarily indicative of, nor is it intended to forecast, the potential future performance of our common stock. See the disclosure in Part I, Item 1A. “Risk Factors.”
Equity Compensation Plan Information
The information required by this item will be included in our Proxy Statement for the 2018 Annual Meeting of Stockholders to be filed with the SEC within 120 days of the fiscal year ended December 31, 2017, and is incorporated herein by reference.
Recent Sales of Unregistered Securities
None.
36
Issuer Purchases of Equity Securities
The following table summarizes stock repurchases during the year ended December 31, 2017 (in thousands, expect per share amounts):
Total Number of Shares Purchased | Average Price Paid per Share | Total Number of Shares Purchased as Part of Publicly Announced Plans or Programs (1) | Approximate Dollar Value of Shares that May Yet Be Purchased Under the Plan or Programs (1) | ||||||||||
November 2017 | 100 | $ | 36.46 | 100 | $ | 96,370 | |||||||
December 2017 | 536 | $ | 35.38 | 536 | $ | 77,400 | |||||||
636 | $ | 35.55 | 636 | ||||||||||
(1 | ) | In November 2017, our board of directors authorized a $100.0 million share repurchase program of our common stock. We may repurchase our common stock for cash in the open market in accordance with applicable securities laws. The timing and amount of any stock repurchase will depend on share price, corporate and regulatory requirements, economic and market conditions, and other factors. The stock repurchase authorization will expire in November 2019 and shares repurchased will be immediately retired. |
Item 6. | Selected Financial Data |
The statements of operations data for the three years ended December 31, 2017, 2016 and 2015 and the balance sheet data at December 31, 2017 and 2016, respectively, are derived from, and qualified by reference to, our audited financial statements included elsewhere in this Annual Report on Form 10-K. The statements of operations data for the two years ended December 31, 2014 and 2013 and the balance sheet data at December 31, 2015, 2014 and 2013, respectively, are derived from our audited financial statements not included in this Annual Report on Form 10-K.
The selected consolidated financial data below are not necessarily indicative of future performance and should be read in conjunction with Item 7, “Management’s Discussion and Analysis of Financial Condition and Results of Operations” and the consolidated financial statements and related notes thereto included in Item 8 of this Annual Report on Form 10-K.
37
Years Ended December 31, | |||||||||||||||||||
2017 | 2016 | 2015 | 2014 | 2013 | |||||||||||||||
(in thousands) | |||||||||||||||||||
Consolidated statements of operations data: | |||||||||||||||||||
Revenue | $ | 481,985 | $ | 423,124 | $ | 339,651 | $ | 263,568 | $ | 185,129 | |||||||||
Cost of revenue | 142,867 | 135,752 | 109,864 | 77,684 | 53,548 | ||||||||||||||
Gross profit | 339,118 | 287,372 | 229,787 | 185,884 | 131,581 | ||||||||||||||
Operating expenses: | |||||||||||||||||||
Sales and marketing | 240,271 | 225,631 | 207,026 | 162,552 | 109,737 | ||||||||||||||
Research and development | 61,975 | 46,977 | 40,991 | 30,618 | 21,260 | ||||||||||||||
General and administrative | 84,589 | 70,956 | 49,877 | 41,802 | 33,572 | ||||||||||||||
Restructuring | 1,539 | — | — | — | — | ||||||||||||||
Amortization of certain acquired intangible assets | — | 150 | 600 | 828 | 1,004 | ||||||||||||||
Total operating expenses | 388,374 | 343,714 | 298,494 | 235,800 | 165,573 | ||||||||||||||
Loss from operations | (49,256 | ) | (56,342 | ) | (68,707 | ) | (49,916 | ) | (33,992 | ) | |||||||||
Other income (expense): | |||||||||||||||||||
Interest income (expense) and other income (expense), net | (10,333 | ) | (9,288 | ) | (15,628 | ) | (14,128 | ) | (6,562 | ) | |||||||||
Loss before provision for income taxes | (59,589 | ) | (65,630 | ) | (84,335 | ) | (64,044 | ) | (40,554 | ) | |||||||||
Income tax (provision) benefit | (1,746 | ) | (1,207 | ) | (1,181 | ) | (855 | ) | 128 | ||||||||||
Net loss | $ | (61,335 | ) | $ | (66,837 | ) | $ | (85,516 | ) | $ | (64,899 | ) | $ | (40,426 | ) | ||||
Net loss per share, basic and diluted | $ | (1.07 | ) | $ | (1.20 | ) | $ | (1.58 | ) | $ | (1.22 | ) | $ | (0.79 | ) | ||||
Weighted average common shares outstanding, basic and diluted | 57,262 | 55,595 | 54,171 | 53,267 | 51,427 | ||||||||||||||
At December 31, | |||||||||||||||||||
2017 | 2016 | 2015 | 2014 | 2013 | |||||||||||||||
(in thousands) | |||||||||||||||||||
Consolidated balance sheet data: | |||||||||||||||||||
Cash and cash equivalents | $ | 393,576 | $ | 83,300 | $ | 107,691 | $ | 166,557 | $ | 109,583 | |||||||||
Short-term and long-term investments | 266,500 | 259,837 | 201,088 | 170,044 | 199,925 | ||||||||||||||
Property and equipment, net | 20,817 | 23,962 | 27,021 | 21,424 | 14,436 | ||||||||||||||
Working capital, excluding deferred revenue, current portion1 | 449,874 | 419,408 | 334,664 | 356,553 | 369,499 | ||||||||||||||
Total assets | 967,190 | 623,629 | 561,545 | 505,655 | 451,355 | ||||||||||||||
Deferred revenue, current and non-current portion | 326,163 | 282,332 | 252,139 | 191,336 | 138,822 | ||||||||||||||
Debt, current portion and non-current portion | 533,193 | 238,432 | 232,583 | 225,445 | 218,876 | ||||||||||||||
Capital lease obligations, current portion and non-current portion | — | — | 33 | 236 | 1,123 | ||||||||||||||
Total stockholders’ equity | 22,120 | 26,963 | 7,822 | 35,502 | 52,895 | ||||||||||||||
1 | Working capital is defined as total current assets minus total current liabilities. | |
38
Item 7. | Management's Discussion and Analysis of Financial Condition and Results of Operations |
The following discussion of our financial condition and results of operations should be read together with the financial statements and the related notes set forth in Item 8. “Financial Statements and Supplementary Data.” The following discussion also contains forward-looking statements that involve a number of risks and uncertainties. See Part I, “Special Note Regarding Forward-Looking Statements” for a discussion of the forward-looking statements contained below and Part I, Item 1A. “Risk Factors” for a discussion of certain risks that could cause our actual results to differ materially from the results anticipated in such forward-looking statements.
Overview
Cornerstone is a leading global provider of learning and human capital management software, delivered as Software-as-a-Service (“SaaS”). We are one of the world’s largest cloud computing companies with approximately 35.3 million users across 3,250 clients in 192 countries and 43 different languages. We help organizations around the globe recruit, train and manage their employees.
Following a strategic review process undertaken by our board of directors during 2017, the board determined that the optimal way to maximize shareholder value is to execute a plan to transform our operations and support that plan with a capital infusion and new strategic partnerships. As a result, we entered into an agreement with Silver Lake, one of the world's leading technology private equity investors, and LinkedIn, under which Silver Lake and LinkedIn invested $300.0 million in Cornerstone in the form of convertible senior notes. In November 2017, we announced our strategic plan with the objective of better positioning us for long-term growth and increasing shareholder value. In connection with the plan, we will (i) sharpen our focus on recurring revenue growth; (ii) drive operating margin and free cash flow improvement; (iii) develop new recurring revenue streams, including e-learning content subscriptions; (iv) bolster our leadership team; and (v) strengthen our governance to help us best execute on this strategic transformation.
Our human capital management platform combines the world’s leading unified talent management solutions with state-of-the-art analytics and HR administration solutions to enable organizations to manage the entire employee lifecycle. Our focus on continuous learning and development helps organizations to empower employees to realize their potential and drive success.
We work with clients across all geographies, verticals and market segments. Our clients include multi-national corporations, large domestic and foreign-based enterprises, mid-market companies, public sector organizations, healthcare providers, higher education institutions, non-profit organizations and small businesses. We sell our platform domestically and internationally through both direct and indirect channels, including direct sales teams throughout North and South America, Europe and Asia-Pacific and distributor relationships with payroll companies, human resource consultancies and global system integrators.
Our enterprise human capital management platform is composed of four product suites:
• | Our Recruiting suite helps organizations to source and attract candidates, assess and select applicants, onboard new hires and manage the entire recruiting process; |
• | Our Learning suite enables clients to manage training and development programs, knowledge sharing and collaboration among employees, track compliance requirements and support career development for employees. Our content offering delivers fresh, modern content, fueling employee curiosity and inspiring growth; |
• | Our Performance suite provides tools to manage goal setting, performance reviews, competency assessments, development plans, continuous feedback, compensation management and succession planning; and |
• | Our HR Administration suite supports employee records administration, organizational management, employee and manager self-service, workforce planning and compliance reporting. |
Our clients can supplement the product suites with our state-of-the-art analytics capabilities to make more-informed decisions using data from across the platform for talent mobility, engagement and development so that HR and leadership can focus on strategic initiatives to help their organization succeed.
In addition to our enterprise human capital management platform, we offer Cornerstone PiiQ, formerly known as Cornerstone Growth Edition, which is a cloud-based talent management solution with performance and learning products targeted to organizations with 500 or fewer employees. We currently do not include the number of clients and users of our Cornerstone for Salesforce and Cornerstone PiiQ products in our client and user count metrics as they are not significant and we believe the client and user count metrics for our human capital management platform give a better indication of our overall performance.
39
Our Client Success team supports our clients’ ongoing optimization of their talent processes and use of our platform. In addition, our Cornerstone Edge solutions allow our clients and partners to more easily integrate with a growing marketplace of service providers. After the initial purchase of our platform, we continue to market and sell to our existing clients, who may renew their subscriptions, add additional products, broaden the deployment of the platform across their organizations and increase usage of the platform over time.
We generate most of our revenue from the sale of our products pursuant to multi-year client agreements. Client agreements for our human capital management platform typically have terms of three years. Our sales processes are typically competitive, and sales cycles generally vary in duration from two to nine months depending on the size of the potential client. We generally price our human capital management platform based on the number of products purchased and the permitted number of users with access to each product.
We sell our products through our direct sales teams and, to a lesser extent, indirectly through our distributors. We intend to continue to invest in our direct sales and distribution activities to address our market opportunity.
We generally recognize revenue from subscriptions ratably over the term of the client agreement and revenue from professional services as the services are performed. In certain instances, our clients request enhancements to the underlying features and functionality of our human capital management platform, and in these instances, revenue from subscriptions is recognized over the remaining term of the agreement once the additional features are delivered to the client. We generally invoice our clients upfront for annual subscription fees for multi-year subscriptions and upfront for professional services. We record amounts invoiced for annual subscription periods that have not occurred or services that have not been performed as deferred revenue on our balance sheet. With the growth in the number of clients, our revenue grew to $482.0 million for the year ended December 31, 2017 from $423.1 million for the same period in 2016.
We have historically experienced seasonality in terms of when we enter into client agreements. We usually sign a significantly higher percentage of agreements with new clients, as well as renewal agreements with existing clients, in the fourth quarter of each year. In addition, within a given quarter, we typically sign a large portion of these agreements during the last month, and often the last two weeks, of that quarter. We believe this seasonality is driven by several factors, most notably the tendency of procurement departments at our enterprise clients to purchase technology at the end of a quarter or calendar year, possibly in order to use up their available quarterly or annual funding allocations. As the terms of most of our client agreements are full year increments, agreements initially entered into the fourth quarter or last month of any quarter will generally come up for renewal at that same time in subsequent years. This seasonality is reflected to a much lesser extent, and sometimes is not immediately apparent, in our revenue, due to the fact that we recognize subscription revenue over the term of the client agreement, which is generally three years. In addition, this seasonality is reflected in changes in our deferred revenue balance, which generally is impacted by the timing of when we enter into agreements with new clients, invoice new clients, invoice existing clients for annual subscription periods and recognize revenue. We expect this seasonality to continue, which may cause fluctuations in certain of our operating results and financial metrics, and thus limit our ability to predict future results.
We believe the market for human capital management remains large and underpenetrated, providing us with significant growth opportunities. We expect businesses and other organizations to continue to increase their spending on human capital management platforms in order to maximize the productivity of their employees, manage changing workforce demographics and ensure compliance with global regulatory requirements. Historically, many of these software solutions have been human resource applications running on hardware located on organizations’ premises. We have seen many of these organizations increasingly choose SaaS for their human capital management platform and we anticipate that trend will continue.
We have focused on growing our business to pursue what we believe is a significant market opportunity, and we plan to continue to invest in building for growth. As a result, we expect our cost of revenue and operating expenses to increase in future periods. Over time, we expect our sales and marketing expenses to increase, as we continue to expand our direct sales teams, increase our marketing activities and grow our international operations; however, we are focused on optimizing our investment in sales and marketing and expect to obtain operating leverage into future years similar to what we have achieved over the last couple of years. Research and development expenses are expected to increase as we continue to improve the existing functionality for our products. We also believe that we must invest in maintaining a high degree of client service and support that is critical for our continued success. We plan to continue our policy of implementing best practices across our organization, expanding our technical operations and investing in our network infrastructure and service capabilities in order to support continued future growth. While we expect to increase our level of investment in the business, we also expect that these increased levels of spending will drive improved profitability over time, such that we should obtain incremental leverage in categories like general and administrative expenses.
40
Our operating results have fluctuated in the past and may continue to fluctuate in the future based on a number of factors, many of which are beyond our control, including those described in the “Risk Factors” section of this Annual Report on Form 10-K. One or more of these factors may cause our operating results to vary widely. As such, we believe that our results of operations may vary significantly in the future and that period-to-period comparisons of our operating results may not be meaningful and should not be relied upon as an indication of future performance.
Metrics
We regularly review a number of metrics, including the following key metrics, to evaluate our business, measure our performance, identify trends affecting our business, formulate financial projections and make strategic decisions.
• | Revenue. We generally recognize subscription revenue over the contract period, and as a result of our revenue recognition policy and the seasonality of when we enter into new client agreements, revenue from client agreements signed in the current period may not be fully reflected in the current period. |
• | Subscription revenue. Revenue as defined above on a recurring basis. |
• | Annual recurring revenue. In order to assess our business performance with a metric that reflects a subscription-based business model, we track annual recurring revenue, which is a non-GAAP financial measure we define as the annualized recurring value of all active contracts at the end of a reporting period. |
• | Billings. Under our revenue recognition policy, we generally recognize subscription revenue from our client agreements ratably over the terms of those agreements. For this reason, the major portion of our revenue for a period will be from client agreements signed in prior periods rather than from new business activity during the current period. In order to assess our business performance with a metric that more fully reflects current period business activity, we track billings, which is a non-GAAP financial measure we define as the sum of revenue and the change in the deferred revenue balance for the period. We include changes in the deferred revenue balance to calculate billings so it better reflects new business activity in the period as evidenced by payments under our billing policies arising from the acquisition of new clients, sales of additional products to existing clients, the addition of incremental users by existing clients and client renewals. Beginning in the first quarter of 2018, due to the implementation of our renewed strategic plan and specifically the migration of professional services to our partners, we will no longer consider billings a key metric and will stop reporting on it. Factors that may cause our billings results to vary from period to period include the following: |
◦ | Billings terms. Any changes in those billing terms may shift billings between periods. |
◦ | Seasonality. Due to the seasonality of our sales, billings growth is inconsistent from quarter to quarter throughout a calendar year. |
◦ | Foreign currency exchange rates. While most of our billings have historically been in U.S. Dollars, an increasing percentage of our billings in recent periods has been in foreign currencies, particularly the British Pound. |
For a reconciliation of billings to revenue, please see “Results of Operations – Revenue and Metrics.”
• | Unlevered Free cash flow. We define unlevered free cash flow, a non-GAAP financial measure, as cash provided by operating activities minus capital expenditures and capitalized software costs plus cash paid for interest. We present this metric because it is a liquidity measure that provides useful information to management and investors about the amount of cash generated by our business that can be used for strategic opportunities, including investing in our business and strengthening our balance sheet. |
• | Annual dollar retention rate. We define annual dollar retention rate as the implied monthly recurring revenue under client agreements at the end of a fiscal year, divided by the implied monthly recurring revenue, for that same client base, at the beginning of the fiscal year and includes incremental sales up to but not exceeding the original renewal amount to the existing client base. This ratio does not reflect implied monthly recurring revenue for new clients added between the end of the prior fiscal year and the end of the current fiscal year. We define implied monthly recurring revenue as the total amount of minimum recurring revenue to which we have a contractual right under each of our client agreements over the entire term of the agreement, but excluding non-recurring support, consulting and maintenance fees, divided by the number of months in the term of the agreement. Implied monthly recurring revenue is substantially comprised of subscriptions to our enterprise human capital management platform. This ratio excludes the implied monthly recurring revenue from clients of our Cornerstone for Salesforce and Cornerstone PiiQ products. We believe that our annual dollar retention rate is an important metric to measure the long-term value of client agreements and our ability to retain our clients. |
41
• | Constant currency results. We present constant currency information, a non-GAAP financial measure, to provide a framework for assessing how our underlying business performed excluding the effect of foreign currency fluctuations. Due to our legal and operating structure, our international revenues are favorably impacted as the U.S. Dollar weakens relative to the British pound, and unfavorably impacted as the U.S. Dollar strengthens relative to the British pound. We believe the presentation of results on a constant currency basis in addition to reported results helps improve the ability to understand our performance because they exclude the effects of foreign currency volatility that are not indicative of our core operating results. To present this information, current period results for entities reporting in British pounds are translated into U.S. Dollars at the prior period exchange rates as opposed to the actual exchange rates in effect for the current period. These results should be considered in addition to, not as a substitute for, results reported in accordance with GAAP. Results on a constant currency basis, as we present them, may not be comparable to similarly titled measures used by other companies and are not a measure of performance presented in accordance with GAAP. |
• | Number of clients. We believe that our ability to expand our client base is an indicator of our market penetration and the growth of our business as we continue to invest in our direct sales teams and distributors. Our client count includes contracted clients for our enterprise human capital management platform as of the end of the period and excludes clients of our Cornerstone for Salesforce and Cornerstone PiiQ products. |
• | Number of users. Since our clients generally pay fees based on the number of users of our products within their organizations, we believe the total number of users is an indicator of the growth of our business. Our user count includes active users for our enterprise human capital management platform and excludes users of our Cornerstone for Salesforce and Cornerstone PiiQ products. |
Key Components of Our Results of Operations
Sources of Revenue and Revenue Recognition
Our platform is designed to enable organizations to meet the challenges they face in maximizing the productivity of their human capital. We generate revenue from the following sources:
• | Subscriptions to Our Products and Other Offerings on a Recurring Basis. Clients pay subscription fees for access to our enterprise human capital management platform, other products and support on a recurring basis. Fees are based on a number of factors, including the number of products purchased, which may include e-learning content, and the number of users having access to a product. We generally recognize revenue from subscriptions ratably over the term of the agreements. |
• | Professional Services and Other. We offer our clients assistance in implementing our products and optimizing their use. Professional services include application configuration, system integration, business process re-engineering, change management and training services. Services are generally billed on a fixed-fee basis and to a lesser degree on a time-and-material basis. These services are generally purchased as part of a subscription arrangement and are typically performed within the first several months of the arrangement. Clients may also purchase professional services at any other time. We generally recognize revenue from fixed fee professional services using the proportional performance method over the period the services are performed and as time is incurred for time-and-material arrangements. |
Our client agreements generally include both subscription to access our products and related professional services. Our agreements generally do not contain any cancellation or refund provisions other than in the event of our default.
Cost of Revenue
Cost of revenue consists primarily of costs related to hosting our products; personnel and related expenses, including stock-based compensation, for network infrastructure, IT support, delivery of contracted professional services and on-going client support; payments to external service providers contracted to perform implementation services; depreciation of data centers; amortization of capitalized software costs; amortization of developed technology and software license rights; content and licensing fees; and referral fees. In addition, we allocate a portion of overhead, such as rent, IT costs, depreciation and amortization and employee benefits costs, to cost of revenue based on headcount. The costs associated with providing professional services are significantly higher, as a percentage of revenue, than the costs associated with providing access to our products due to the labor costs to provide the consulting services. We expect gross margin to increase over time as we optimize the efficiency of our operations and continue to scale our business.
42
Operating Expenses
Our operating expenses are as follows:
• | Sales and Marketing. Sales and marketing expenses consist primarily of personnel and related expenses for our sales and marketing staff, including salaries, benefits, bonuses, stock-based compensation and commissions; costs of marketing and promotional events, corporate communications, online marketing, product marketing and other brand-building activities; and allocated overhead. |
We intend to continue to invest in sales and marketing strategically to expand our business both domestically and internationally. We expect over time sales and marketing expenses, as a percentage of revenue, to decrease.
• | Research and Development. Research and development expenses consist primarily of personnel and related expenses for our research and development staff, including salaries, benefits, bonuses and stock-based compensation; the cost of certain third-party service providers; and allocated overhead. Research and development costs, other than software development costs qualifying for capitalization, are expensed as incurred. |
We have focused our research and development efforts on continuously improving our products. We believe that our research and development activities are efficient because we benefit from maintaining a single software code base for each of our products. We expect research and development expenses to increase proportionately with our business.
• | General and Administrative. General and administrative expenses consist primarily of personnel and related expenses for administrative, legal, finance and human resource staff, including salaries, benefits, bonuses and stock-based compensation; professional fees; insurance premiums; other corporate expenses; and allocated overhead. We expect our general and administrative expenses to increase in absolute dollars but decrease as a percentage of revenue. |
• | Restructuring. Restructuring consists of payroll-related costs, such as severance, outplacement costs and continuing healthcare coverage, associated with employee terminations. |
• | Amortization of Certain Acquired Intangible Assets. Amortization of certain acquired intangible assets consists of amortization of acquisition-related intangibles for customer relationships. |
Other Income (Expense)
• | Interest Income. Interest income consists primarily of interest income from investment securities partially offset by amortization of investment premiums. We expect interest income to vary depending on the level of our investments in marketable securities, which include corporate bonds, agency bonds, U.S. treasury securities and commercial paper. |
• | Interest Expense. Interest expense consists primarily of interest expense from our convertible notes, accretion of debt discount and amortization of debt issuance costs. |
• | Other, Net. Other, net consists of income and expense associated with fluctuations in foreign currency exchange rates, fair value adjustments to strategic investments and other non-operating expenses. We expect other income (expense) to vary depending on the movement in foreign currency exchange rates and the related impact on our foreign exchange gain (loss). |
Income Tax (Provision) Benefit
The income tax provision is related to foreign income, state income and withholding taxes. Given our historical losses, we have not recorded a provision, except for state minimum taxes and withholding taxes, for United States, United Kingdom, New Zealand, Hong Kong and Brazil income taxes as we have recorded a full valuation allowance against the net deferred tax assets for each of these countries. Other foreign subsidiaries and branches provide intercompany services and are compensated on a cost-plus basis, and therefore, have incurred liabilities for foreign income taxes in their respective jurisdictions.
Critical Accounting Policies and Estimates
Our consolidated financial statements and the related notes included elsewhere in this Annual Report on Form 10-K are prepared in accordance with accounting principles generally accepted in the United States. The preparation of these consolidated financial statements requires us to make estimates and assumptions that affect the reported amounts of assets, liabilities, revenue, costs and expenses, provision for income taxes and related disclosures. We base our estimates on historical experience and on various other assumptions that we believe to be reasonable under the circumstances. Changes in accounting estimates are reasonably likely to occur from period to period. Accordingly, actual results could differ significantly from the estimates made by our management. We evaluate our estimates and assumptions on an
43
ongoing basis. To the extent that there are material differences between these estimates and actual results, our future financial statement presentation, financial condition, results of operations and cash flows will be affected.
We believe that the following critical accounting policies involve a greater degree of judgment or complexity than our other accounting policies. Accordingly, these are the policies we believe are the most critical to aid in fully understanding and evaluating our consolidated financial condition and results of operations.
Revenue Recognition and Deferred Revenue
We recognize revenue when: (i) persuasive evidence of an arrangement for the sale of our products or professional services exists, (ii) our products have been made available or delivered, or our services have been performed, (iii) the sales price is fixed or determinable and (iv) collectability is reasonably assured. The timing and amount we recognize as revenue is determined based on the facts and circumstances of each client arrangement. Evidence of an arrangement consists of a signed client agreement. We consider that delivery of our software has commenced once we provide the client with log-in information to access and use our products. If non-standard acceptance periods or non-standard performance criteria exist, revenue recognition commences upon the satisfaction of the acceptance or performance criteria, as applicable. Our fees are fixed based on stated rates specified in each client agreement. We assess collectability based in part on an analysis of the creditworthiness of each client, as well as other relevant economic or financial factors. If we do not consider collection reasonably assured, we defer the revenue until the fees are actually collected. We record amounts that have been invoiced to our clients in accounts receivable and as either deferred revenue on our balance sheet or revenue on our statement of operations, depending on whether the revenue recognition criteria have been met.
The majority of our client arrangements include multiple deliverables, such as subscriptions to our products accompanied by professional services. Therefore, we recognize revenue in accordance with the guidance for arrangements with multiple deliverables under Accounting Standards Update 2009-13 “Revenue Recognition (Topic 605)—Multiple-Deliverable Revenue Arrangements—a Consensus of the Emerging Issues Task Force,” or ASU 2009-13. As our clients do not have the right to the underlying software code of our products, our revenue arrangements are outside the scope of software revenue recognition guidance.
For such arrangements, we first assess whether each deliverable has value to the client on a standalone basis. Our products have standalone value because once we give a client access, they are fully functional and do not require any additional development, modification or customization. Our professional services have standalone value because third-party service providers, distributors or our clients themselves can perform these services without our involvement. The professional services we provide are to assist clients with the configuration and integration of our products. The performance of these services does not require highly specialized individuals.
Based on the standalone value of our deliverables, and since clients generally do not have a right of return with respect to the included professional services, we allocate revenue among the separate deliverables under the relative selling price method using the selling price hierarchy established in ASU 2009-13. This hierarchy requires the selling price of each deliverable in a multiple deliverables arrangement to be based on, in descending order of preference, (i) vendor-specific objective evidence of fair value, or VSOE, (ii) third-party evidence of fair value, or TPE, or (iii) management’s best estimate of the selling price, or BESP.
We are not generally able to determine VSOE or TPE for our deliverables because we sell them separately and within a sufficiently narrow price range only infrequently, and because we have determined that there are no third-party offerings reasonably comparable to our products. Accordingly, we determine the selling prices of subscriptions to our products, professional services and e-learning content based on BESP. In determining BESP for subscriptions to our products, we consider the size of client arrangements, as measured by number of users; whether the sales are made by our direct sales team or distributors; and whether the sales are to a domestic or an international client. We group sales of our products into multiple categories based on these criteria. We then compute an average selling price for each group. This average selling price represents our BESP for that type of client arrangement. For professional services, we analyze both bundled arrangements that include subscriptions to our products and professional services, as well as standalone purchases of different types of professional services made subsequent to the original subscription. For these professional services arrangements, we then examine the actual rate per hour we charge or, for fixed fee arrangements, the implied average rate per hour based on the fixed fee divided by the estimated hours to complete the service. The BESP is then the product of this average rate per hour and our estimate of the hours needed to complete the services. The amount we allocate to professional services generally does not exceed its contractual value, as the revenue for subscription to our products is delivered over a longer period of time and represents contingent consideration. This can result in higher allocations of the contractual value to subscriptions to our products over and above the relative fair value allocation based on this limitation. For e-learning content, we estimate BESP by reviewing fees for content in order to establish an average
44
annual fee per user that reflects the cost we incur to acquire the related content from third-party providers. Additionally, we estimate BESP by reviewing fees for content-hosting by reviewing the selling price of gigabytes sold in order to establish a fee on a per user or bandwidth basis.
The determination of BESP for our deliverables as described above requires us to make significant estimates and judgments, including the comparability of different subscription arrangements and professional services and estimates of the hours required to complete various types of services. In addition, we consider other factors including:
• | Nature of the deliverables. For example, in categorizing our subscriptions into meaningful groupings for determining BESP, we consider the number and type of products the client purchased. For professional services, we consider the type of professional service and the estimated hours required to complete the service or average selling price for fixed fee services based on our historical experience. |
• | Location of our clients. Our pricing is different for domestic and international clients, and therefore in determining BESP of subscriptions to our products, we evaluate domestic arrangements separately from international arrangements. |
• | Market conditions and competitive landscape for the sale. Our pricing and discounting varies based on the economic environment and competition. We consider these factors in determining the grouping of comparable services and the periods over which we compare arrangements to compute the BESP. |
• | Internal costs. Our pricing for professional services and e-learning content considers our internal costs to provide the professional services and the third-party purchase costs of e-learning content. |
• | Size of the arrangement. Discounting generally increases as the relative size of an arrangement increases, and we take this into consideration in the grouping of our clients to determine BESP. Our discounting for multiple-deliverable arrangements varies based on the extent and type of the professional services and content included with the subscriptions in the arrangement. |
We update our estimates of BESP on an ongoing basis through internal periodic reviews and as events and circumstances require, and we update our determination to use BESP on a periodic basis, including assessing whether we can determine VSOE or TPE.
After we determine the fair value of revenue allocable to each deliverable based on the relative selling price method, we recognize the revenue for each based on the type of deliverable. For subscriptions to our products, we recognize the revenue on a straight-line basis over the term of the client agreement, which is typically three years. For professional services, we generally recognize revenue using the proportional performance method over the period the services are performed.
In a limited number of cases, the client’s intended use of a product requires enhancements to its underlying features and functionality. In some of these cases, revenue is recognized as one unit of accounting on a straight-line basis from the point at which the enhancements have been made to the product through the remaining term of the agreement. In other cases where the enhancement is not required for the client’s intended use, revenue is recognized separately for the enhancement and the product. The enhancement revenue is recognized based on the allocated value on a straight-line basis once the enhancement has been made to the product.
For arrangements in which we resell third-party e-learning content to our clients or host client or third-party e-learning content provided by the client, we recognize revenue in accordance with accounting guidance as to when to report gross revenue as a principal and when to report net revenue as an agent. We recognize e-learning content revenue in the gross amount that we invoice our client when: (i) we are the primary obligor, (ii) we have latitude to establish the price charged and (iii) we bear the credit risk in the transaction. For arrangements involving our sale of e-learning content, we charge our clients for the content based on pay-per-use or a fixed rate for a specified number of users and recognize the gross amount invoiced as revenue as the content is delivered. For arrangements where clients purchase e-learning content directly from a third-party, or provide it themselves, and we integrate the content into our products, we charge a hosting fee. In such cases, we recognize the amount invoiced for hosting as the content is delivered, excluding any portion we invoice that is attributable to fees the third-party charges for the content.
Commission Expense
We defer commissions paid to our sales force because these amounts are recoverable from future revenue due to the non-cancelable client agreements that give rise to the commissions. We defer expense recognition upon payment and amortize expense to sales and marketing expenses over the term of the client agreement in proportion to the revenue that is recognized. Commissions are direct and incremental costs of our client agreements and we generally commence payment of commissions within 45 to 75 days after the execution of client agreements.
45
Stock-based Compensation
We account for stock-based awards granted to employees and directors by recording compensation expense based on the awards’ estimated fair values. We grant stock options and restricted stock units that vest over time based on the continuing employment of the employee, as well as restricted stock units that vest based on meeting certain performance targets. We expect that our expense related to stock-based compensation will increase over time.
We estimate the fair value of our restricted stock units based on the closing price of our common stock as of the date of grant. We estimate the fair value of our stock options as of the date of grant using the Black-Scholes option-pricing model. Determining the fair value of stock options under this model requires judgment, including estimating (i) the value per share of our common stock, (ii) volatility, (iii) the term of the awards, (iv) the dividend yield and (v) the risk-free interest rate. The assumptions used in calculating the fair value of stock-based awards represent our best estimates, based on management’s judgment and subjective future expectations. These estimates involve inherent uncertainties. If any of the assumptions used in the model change significantly, stock-based compensation recorded for future awards may differ materially from that recorded for awards granted previously.
Beginning in 2017, we began estimating expected volatility based solely on our historical volatility as a public company. In previous years, we estimated this using the average volatility of similar publicly traded companies as sufficient trading history of our stock was not available. For purposes of determining the expected term of the awards in the absence of sufficient historical data relating to stock option exercises for our company, we apply a simplified approach in which the expected term of an award is presumed to be the mid-point between the vesting date and the expiration date of the award. The risk-free interest rate for periods within the expected life of an award, as applicable, is based on the United States Treasury yield curve in effect during the period the award was granted. Our estimated dividend yield is zero, as we have not declared dividends in the past and do not currently intend to declare dividends in the foreseeable future.
The following information represents the weighted average of the assumptions used in the Black-Scholes option-pricing model for stock options granted within each of the last three years:
For the Years Ended December 31, | |||||||
2017 | 2016 | 2015 | |||||
Risk-free interest rate | n/a | 1.4 | % | 1.8 | % | ||
Expected term (in years) | n/a | 5.8 | 6.0 | ||||
Estimated dividend yield | n/a | — | % | — | % | ||
Estimated volatility | n/a | 48.8 | % | 41.8 | % | ||
Once we have determined the estimated fair value of our stock-based awards, we recognize the portion of that value that corresponds to the portion of the award that is ultimately expected to vest, taking estimated forfeitures into account. This amount is recognized as an expense over the vesting period of the award using the straight-line method for awards which contain only service conditions, and using the graded vesting method based upon the probability of the performance condition being met for awards which contain performance conditions. We estimate forfeitures based upon our historical experience and, for each period, we review the estimated forfeiture rate and make changes as factors affecting the forfeiture rate calculations and assumptions change.
In addition, we have issued performance-based restricted stock units that vest based upon continued service through the vesting term and achievement of certain market conditions and performance goals, and others that vest based upon continued service through the vesting term and achievement of certain market conditions or performance goals, established by the board of directors, for a predetermined period. The fair value of the performance-based awards containing a market condition are determined using a Monte-Carlo simulation model that factors in the probability of the award vesting. The fair value of the performance-based awards containing only a service and performance condition are determined based upon the closing price of our common stock on the date of the grant. For performance-based awards, the fair value is not determined until all of the terms and conditions of the award are established.
46
As of December 31, 2017, we had approximately $5.4 million of unrecognized employee related stock-based compensation, net of estimated forfeitures, relating to stock options that we expect to recognize over a weighted-average period of approximately 1.0 year. Unrecognized compensation expense related to nonvested restricted stock units was $105.7 million at December 31, 2017, which is expected to be recognized as expense over the weighted-average period of 2.7 years. Additionally, during 2017, 2016 and 2014, we granted certain performance-based restricted stock units. There was no unrecognized compensation expense related to performance-based restricted stock units at December 31, 2017. The amount of compensation cost relating to performance awards may change in future periods to the extent that another target level becomes probable of achievement.
Stock-based compensation expense is expected to increase in 2018 compared to 2017 as a result of our existing unrecognized stock-based compensation and as we issue additional stock-based awards to continue to attract and retain employees.
Allowance for Doubtful Accounts
On a quarterly basis we evaluate the need to establish an allowance for doubtful accounts, by analyzing our clients’ creditworthiness. Our evaluation and analysis includes specific identification and review of all outstanding accounts receivable balances, review of our historical collection experience with each client and consideration of overall economic conditions, as well as of any specific facts and circumstances that may indicate that a specific client receivable is not collectible. We make judgments as to our ability to collect outstanding receivables and establish an allowance when collection becomes doubtful. At December 31, 2017 and 2016, our allowance for doubtful accounts was $7.5 million and $3.5 million, respectively, based on our evaluation and analysis. If our future actual collections are lower than expected, our cash flows and future results of operations could be negatively impacted.
Capitalized Software Costs
We capitalize the costs associated with software developed or obtained for internal use, including costs incurred in connection with the development of our products, when the preliminary project stage is completed, management has decided to make the project a part of a future offering and the software will be used to perform the function intended. These capitalized costs include external direct costs of materials and services consumed in developing or obtaining internal-use software, personnel and related expenses for employees who are directly associated with, and who devote time to, internal-use software projects and, when material, interest costs incurred during the development. Capitalization of these costs ceases once the project is substantially complete and the software is ready for its intended purpose. Costs incurred for upgrades and enhancements to our products are also capitalized. Post-configuration training and maintenance costs are expensed as incurred. Capitalized software costs are amortized to cost of revenue using the straight-line method over the estimated useful life of the software of typically three years, commencing when the software is ready for its intended use.
Goodwill
Goodwill is not amortized, but instead is required to be tested for impairment annually and under certain circumstances. We perform such testing of goodwill in the fourth quarter of each year, or as events occur or circumstances change that would more likely than not reduce the fair value of a reporting unit below its carrying amount. Events or changes in circumstances which could trigger an impairment review include a significant adverse change in legal factors or in the business climate, an adverse action or assessment by a regulator, unanticipated competition, a loss of key personnel, significant changes in the manner we use the acquired assets or the strategy we have for our overall business, significant negative industry or economic trends, or significant underperformance relative to expected historical or projected future results of operations.
As part of the annual impairment test, we may conduct an assessment of qualitative factors to determine whether it is more likely than not that the fair value of a reporting unit is less than its carrying amount. If we elect not to perform the qualitative assessment or we determine that it is more likely than not that the fair value of a reporting unit is less than its carrying amount, we then conduct the first step of a two-step impairment test. The first step of the test for goodwill impairment compares the fair value of the applicable reporting unit with its carrying value. Fair value was determined using a market approach, which includes consideration of the Company’s own market capitalization.
If the fair value of a reporting unit is less than the reporting unit's carrying value, we perform the second step of the test for impairment of goodwill. During the second step, we compare the implied fair value of the reporting unit's goodwill with the carrying value of that goodwill. The estimate of implied fair value of goodwill may require valuations of certain internally generated and unrecognized intangible assets and other assets and liabilities. If the carrying value of the goodwill exceeds the calculated implied fair value, the excess amount will be recognized as an impairment loss.
47
Consistent with our impairment analysis at December 31, 2016, we had one reporting unit for purposes of the impairment analysis as of December 31, 2017. Based on the results of the annual impairment test, the fair value of the reporting unit exceeded its carrying value by a significant amount, and therefore no impairment of goodwill existed at December 31, 2017.
Intangible Assets
Identifiable intangible assets primarily consist of trade names and intellectual property and acquisition-related intangibles, including developed technology, customer relationships, non-compete agreements, patents, trade names and trademarks. We determine the appropriate useful life of our intangible assets by performing an analysis of expected cash flows of the acquired assets. Intangible assets are amortized over their estimated useful lives ranging from two to ten years, generally using the straight-line method, which approximates the pattern in which the economic benefits are consumed.
We evaluate the recoverability of our long-lived assets with finite useful lives, including intangible assets for impairment, whenever events or changes in circumstances indicate that the carrying amounts may not be recoverable. Such triggering events or changes in circumstances may include: a significant decrease in the market price of a long-lived asset, a significant adverse change in the extent or manner in which a long-lived asset is being used, a significant adverse change in legal factors or in the business climate, the impact of competition or other factors that could affect the value of a long-lived asset, a significant adverse deterioration in the amount of revenue or cash flows expected to be generated from an asset group, an accumulation of costs significantly in excess of the amount originally expected for the acquisition or development of a long-lived asset, current or future operating or cash flow losses that demonstrate continuing losses associated with the use of a long-lived asset, or a current expectation that, more likely than not, a long-lived asset will be sold or otherwise disposed of significantly before the end of its previously estimated useful life. We perform impairment testing at the asset group level that represents the lowest level for which identifiable cash flows are largely independent of the cash flows of other assets and liabilities. If events or changes in circumstances indicate that the carrying amount of an asset group may not be recoverable and the expected undiscounted future cash flows attributable to the asset group are less than the carrying amount of the asset group, an impairment loss equal to the excess of the asset's carrying value over its fair value is recorded. Fair value is determined based upon estimated discounted future cash flows. There were no impairment charges related to the identified intangible assets in the years ended December 31, 2017 and 2016.
Investments in Marketable Securities
Our available-for-sale investments in marketable securities are recorded at fair value, with any unrealized gains and losses, net of taxes, reported as a component of stockholders’ equity until realized or until a determination is made that an other-than-temporary decline in market value has occurred. If we determine that an other-than-temporary decline has occurred for debt securities that we do not then currently intend to sell, we recognize the credit loss component of an other-than-temporary impairment in other income (expense) and the remaining portion in other comprehensive income (loss). The credit loss component is identified as the amount of the present value of cash flows not expected to be received over the remaining term of the security, based on cash flow projections. In determining whether an other-than-temporary impairment exists, we consider: (i) the length of time and the extent to which the fair value has been less than cost; (ii) the financial condition and near-term prospects of the issuer of the securities; and (iii) our intent and ability to retain the security for a period of time sufficient to allow for any anticipated recovery in fair value. The cost of marketable securities sold is determined based on the specific identification method and any realized gains or losses on the sale of investments are reflected as a component of interest income or expense. In addition, we classify marketable securities as current or non-current based upon the maturity dates of the securities. At December 31, 2017, we had $263.5 million of investments in marketable securities.
Convertible Notes
In June 2013, we issued 1.5% convertible notes due July 1, 2018 with a principal amount of $253.0 million (the “2018 Notes”). In December 2017, we issued 5.75% senior convertible notes due July 1, 2021 with a principal amount of $300.0 million (the “2021 Notes”). In accounting for the 2018 Notes at issuance, we separated the 2018 Notes into debt and equity components pursuant to the accounting standards for convertible debt instruments that may be fully or partially settled in cash upon conversion. The fair value of the debt component was estimated using an interest rate, with terms similar to the 2018 Notes, excluding the conversion feature. The carrying amount of the liability component was calculated by measuring the fair value of similar liabilities that do not have an associated convertible feature. The excess of the principal amount of the 2018 Notes over the fair value of the debt component was recorded as a debt discount and a corresponding increase in additional paid-in capital. The debt discount is accreted to interest expense over the term of the 2018 Notes using the interest method. The equity component of the 2018 Notes was recorded to additional paid-in capital
48
is not to be remeasured as long as it continues to meet the conditions for equity classification. The 2021 Notes were recorded based on the fair value of the proceeds, net of discounts and issuance costs, that will be accreted to face value over the term of the 2021 Notes.
Income Taxes
We use the liability method of accounting for income taxes. Under the liability method, deferred taxes are determined based on the temporary differences between the financial statement and tax bases of assets and liabilities, using tax rates expected to be in effect during the years in which the bases differences are expected to reverse. We record a valuation allowance when it is more likely than not that some of our net deferred tax assets will not be realized. In determining the need for valuation allowances, we consider our projected future taxable income and the availability of tax planning strategies. We have recorded a full valuation allowance to reduce our United States, United Kingdom, New Zealand, Hong Kong and Brazil net deferred tax assets to zero, because we have determined that it is not more likely than not that any of our United States, United Kingdom, New Zealand, Hong Kong and Brazil net deferred tax assets will be realized. If in the future we determine that we will be able to realize any of our United States, United Kingdom, New Zealand, Hong Kong and Brazil net deferred tax assets, we will make an adjustment to the allowance, which would increase our income in the period that the determination is made. Certain foreign subsidiaries and branches of the Company provide intercompany services and are compensated on a cost-plus basis, and therefore, have incurred liabilities for foreign income taxes in their respective jurisdictions.
We have assessed our income tax positions and recorded tax benefits for all years subject to examination, based upon our evaluation of the facts, circumstances and information available at each period end. For those tax positions where we have determined there is a greater than 50% likelihood that a tax benefit will be sustained, we have recorded the largest amount of tax benefit that may potentially be realized upon ultimate settlement with a taxing authority that has full knowledge of all relevant information. For those income tax positions where we have determined there is a less than 50% likelihood that a tax benefit will be sustained, no tax benefit has been recognized in our financial statements.
Recent Accounting Pronouncements
In May 2014, the FASB issued a new ASU that provides guidance for recognizing revenue from contracts with customers. Under the new standard, we are required to recognize revenue to depict the transfer of promised goods or services to customers in an amount that reflects consideration that we expect to be entitled to in exchange for those goods or services. The standard permits the use of the full retrospective method, in which case the standard would be applied to each prior reporting period presented and the cumulative effect of applying the standard would be recognized at the earliest period shown, or the modified retrospective method, in which case the cumulative effect of applying the standard would be recognized at the date of initial application. We have evaluated the transition methods and elected to use the modified retrospective method and will adopt this standard beginning January 1, 2018.
During fiscal year 2017, we evaluated the accounting and disclosure requirements of the standard and implemented the appropriate changes to its business processes, systems and internal controls to enable the preparation of its financial information on adoption. We are in the process of finalizing our assessment of the standard as our analysis of costs that represent incremental costs to obtain a contract is ongoing. We believe that we will finalize this analysis in connection with the preparation of our financial statements as of and for the quarter ended March 31, 2018. Costs that represent incremental costs to obtain a contract will be amortized over the expected product life. We have finalized our assessment of how we recognize revenue for subscriptions to our products and other offerings on a recurring basis and revenue for professional services. Upon adoption, revenue for professional services will be based on the relative standalone selling price without limitation to its contractual value. Prior to adoption, such allocation was limited by its contractual value. This change is expected to result in a material increase in the aggregate amount allocated to professional services when allocating total contract values on a relative standalone selling price basis under the new standard. We expect to adjust the following balance sheet line items in fiscal year 2018 to reflect the adoption of the new ASU: deferred commissions; other assets, net; accrued expenses; deferred revenue, current portion; other non-current liabilities; deferred revenue, net of current portion; and accumulated deficit.
For additional information regarding recent accounting pronouncements, refer to Note 2 of the Notes to Consolidated Financial Statements included in this Annual Report on Form 10-K.
49
Results of Operations
The following table sets forth our results of operations for each of the periods indicated (in thousands). The period-to-period comparison of financial results is not necessarily indicative of future results.
Year Ended December 31, | |||||||||||
2017 | 2016 | 2015 | |||||||||
Revenue | $ | 481,985 | $ | 423,124 | $ | 339,651 | |||||
Cost of revenue | 142,867 | 135,752 | 109,864 | ||||||||
Gross profit | 339,118 | 287,372 | 229,787 | ||||||||
Operating expenses: | |||||||||||
Sales and marketing | 240,271 | 225,631 | 207,026 | ||||||||
Research and development | 61,975 | 46,977 | 40,991 | ||||||||
General and administrative | 84,589 | 70,956 | 49,877 | ||||||||
Restructuring | 1,539 | — | — | ||||||||
Amortization of certain acquired intangibles | — | 150 | 600 | ||||||||
Total operating expenses | 388,374 | 343,714 | 298,494 | ||||||||
Loss from operations | (49,256 | ) | (56,342 | ) | (68,707 | ) | |||||
Other income (expense): | |||||||||||
Interest income | 2,951 | 1,702 | 894 | ||||||||
Interest expense | (14,762 | ) | (12,924 | ) | (12,506 | ) | |||||
Other, net | 1,478 | 1,934 | (4,016 | ) | |||||||
Other income (expense), net | (10,333 | ) | (9,288 | ) | (15,628 | ) | |||||
Loss before income tax provision | (59,589 | ) | (65,630 | ) | (84,335 | ) | |||||
Income tax provision | (1,746 | ) | (1,207 | ) | (1,181 | ) | |||||
Net loss | $ | (61,335 | ) | $ | (66,837 | ) | $ | (85,516 | ) | ||
The following table sets forth our results of operations as a percentage of total revenue for each of the periods indicated.
Year Ended December 31, | ||||||||
2017 | 2016 | 2015 | ||||||
Revenue | 100.0 | % | 100.0 | % | 100.0 | % | ||
Cost of revenue | 29.6 | % | 32.1 | % | 32.3 | % | ||
Gross profit | 70.4 | % | 67.9 | % | 67.7 | % | ||
Operating expenses: | ||||||||
Sales and marketing | 49.9 | % | 53.3 | % | 61.0 | % | ||
Research and development | 12.9 | % | 11.1 | % | 12.1 | % | ||
General and administrative | 17.6 | % | 16.8 | % | 14.7 | % | ||
Restructuring | 0.3 | % | — | % | — | % | ||
Amortization of certain acquired intangibles | — | % | — | % | 0.2 | % | ||
Total operating expenses | 80.6 | % | 81.2 | % | 87.9 | % | ||
Loss from operations | (10.2 | )% | (13.3 | )% | (20.2 | )% | ||
Other income (expense): | ||||||||
Interest income | 0.6 | % | 0.4 | % | 0.3 | % | ||
Interest expense | (3.1 | )% | (3.1 | )% | (3.7 | )% | ||
Other, net | 0.3 | % | 0.5 | % | (1.2 | )% | ||
Loss before income tax provision | (12.4 | )% | (15.5 | )% | (24.8 | )% | ||
Income tax provision | (0.4 | )% | (0.3 | )% | (0.3 | )% | ||
Net loss | (12.7 | )% | (15.8 | )% | (25.2 | )% | ||
50
The following table sets forth our revenue and key metrics that we use to evaluate our business, measure our performance, identify trends affecting our business, formulate financial projections and make strategic decisions:
Metrics
At or For Year Ended December 31, | |||||||||||
2017 | 2016 | 2015 | |||||||||
Revenue (in thousands) | $ | 481,985 | $ | 423,124 | $ | 339,651 | |||||
Subscription revenue (in thousands) | $ | 396,764 | $ | 339,756 | $ | 270,093 | |||||
Annual recurring revenue (in thousands) | $ | 439,000 | n/a | n/a | |||||||
Billings (in thousands) | $ | 525,816 | $ | 453,317 | $ | 400,454 | |||||
Unlevered free cash flow (in thousands) | $ | 43,680 | $ | 16,411 | $ | 16,795 | |||||
Annual dollar retention rate | 93.5 | % | 95.1 | % | 95.4 | % | |||||
Number of clients | 3,250 | 2,918 | 2,595 | ||||||||
Number of users (in millions) | 35.3 | 29.9 | 23.8 | ||||||||
Revenue increased $58.9 million, or 14%, in 2017 when compared to 2016. Revenue growth on a constant currency basis increased 15% in 2017 when compared to 2016. Revenue increased $83.5 million, or 25%, in 2016 when compared to 2015. Revenue growth on a constant currency basis increased 29% in 2016 when compared to 2015. The rate of our revenue increase can be impacted by the mix and timing of new client agreements signed, the mix of subscription and professional services revenue, the timing of delivery of our professional services revenue, fluctuations in foreign exchange rates, as well as the growth rate of our emerging markets.
The rate at which revenue increased year over year declined in 2017, from 25% in 2016 to 14% in 2017. Our growth rate can depend on a variety of factors, such as new clients, the size, volume and complexity of our agreements with our customers, foreign currency movements, our ability to work with our customers to implement and deliver our products, our ability to upsell and renew our existing customers, the success of our alliance and partnership arrangements and the expansion of our business through emerging markets.
The following table sets forth our sources of revenue for each of the periods indicated (dollars in thousands):
At or For Year Ended December 31, | |||||||||||
2017 | 2016 | 2015 | |||||||||
Subscription revenue | $ | 396,764 | $ | 339,756 | $ | 270,093 | |||||
Percentage of subscription revenue to total revenue | 82.3 | % | 80.3 | % | 79.5 | % | |||||
Professional services revenue | $ | 85,221 | $ | 83,368 | $ | 69,558 | |||||
Percentage of professional services to total revenue | 17.7 | % | 19.7 | % | 20.5 | % | |||||
$ | 481,985 | $ | 423,124 | $ | 339,651 | ||||||
Subscription revenue increased by $57.0 million in 2017. The increase was attributable to new business, which includes new clients, upsells and renewals from existing clients. Professional services revenue increased by $1.9 million in 2017. The timing of the recognition of professional services revenue can depend on a variety of factors, such as the size, volume and complexity of our agreements with our customers and our ability to work with our customers to implement and deliver our solutions.
Revenue by geography is generally based on the address of the customer as defined in our master subscription agreement with each customer. The following table sets forth our revenue by geographic area for each of the periods indicated (dollars in thousands):
At or For Year Ended December 31, | |||||||||||
2017 | 2016 | 2015 | |||||||||
Revenue for United States | $ | 313,729 | $ | 284,657 | $ | 228,724 | |||||
Percentage of total revenue for United States | 65.1 | % | 67.3 | % | 67.3 | % | |||||
Revenue for all other countries | $ | 168,256 | $ | 138,467 | $ | 110,927 | |||||
Percentage of total revenue for all other countries | 34.9 | % | 32.7 | % | 32.7 | % | |||||
$ | 481,985 | $ | 423,124 | $ | 339,651 | ||||||
51
Annual recurring revenue for the year ended December 31, 2017 was $439.0 million. In order to assess our business performance with a metric that reflects our transition to an even more subscription-based (or recurring revenue) business model, we track annual recurring revenue, which is a non-GAAP financial measure we define as the annualized recurring value of all active contracts at the end of a reporting period. Management believes this metric is useful to investors, in evaluating our ongoing operational performance and trends, and in comparing our financial measures with other companies in the same industry. However, it is important to note that other companies, including companies in our industry, may calculate annual recurring revenue differently or not at all, which may reduce its usefulness as a comparative measure.
Billings increased $72.5 million, or 16% in 2017, reflecting the increase in revenue for the period, plus an increase in deferred revenue compared to the same period in 2016. Billings growth on a constant currency basis increased 12% in 2017. Billings increased $52.9 million, or 13% in 2016, reflecting the increase in revenue for the period, plus an increase in deferred revenue compared to the same period in 2015. Billings growth on a constant currency basis increased 20% in 2016. The growth rates for revenue and billings are not correlated with each other in a given period due to the seasonality of when we enter into client agreements, fluctuations in foreign exchange rates, the varied timing of billings, the recognition of subscription revenue generally on a straight-line basis over the term of each client agreement and the recognition of professional services revenue generally on a proportional performance basis over the period the services are performed.
As discussed above under the section titled “Metrics,” billings is a non-GAAP financial measure, which we define as the sum of revenue and the change in the deferred revenue balance for the period. Management has historically used billings in analyzing its financial results and believes it is useful to investors, as a supplement to the corresponding GAAP measure, in evaluating our ongoing operational performance and trends, and in comparing our financial measures with other companies in the same industry. However, it is important to note that other companies, including companies in our industry, may calculate billings differently or not at all, which may reduce its usefulness as a comparative measure. Due to the implementation of our renewed strategic plan and specifically the migration of professional services to our partners, we will no longer consider billings a key metric and will stop reporting on it beginning in the first quarter of 2018.
52
The following table presents a reconciliation of revenue to billings for each of the periods presented (in thousands):
Deferred Revenue Balance | Year Ended December 31, 2017 | ||||||
Revenue | $ | 481,985 | |||||
Deferred revenue at December 31, 2016 | $ | 282,332 | |||||
Deferred revenue at December 31, 2017 | 326,163 | ||||||
Change in deferred revenue | 43,831 | ||||||
Billings | $ | 525,816 | |||||
Deferred Revenue Balance | Year Ended December 31, 2016 | ||||||
Revenue | $ | 423,124 | |||||
Deferred revenue at December 31, 2015 | $ | 252,139 | |||||
Deferred revenue at December 31, 2016 | 282,332 | ||||||
Change in deferred revenue | 30,193 | ||||||
Billings | $ | 453,317 | |||||
Deferred Revenue Balance | Year Ended December 31, 2015 | ||||||
Revenue | $ | 339,651 | |||||
Deferred revenue at December 31, 2014 | $ | 191,336 | |||||
Deferred revenue at December 31, 2015 | 252,139 | ||||||
Change in deferred revenue | 60,803 | ||||||
Billings | $ | 400,454 | |||||
Unlevered free cash flow for the year ended December 31, 2017 was $43.7 million. We define unlevered free cash flow, a non-GAAP financial measure, as net cash provided by operating activities minus capital expenditures and capitalized software costs plus cash paid for interest. We present this metric because it is a liquidity measure that provides useful information to management and investors about the amount of cash generated by our business that can be used for strategic opportunities, including investing in our business and strengthening our balance sheet.
In 2017, our number of clients grew 11% and our number of users increased 18%.
Cost of Revenue, Gross Profit and Gross Margin
Year Ended December 31, | |||||||||||
2017 | 2016 | 2015 | |||||||||
(dollars in thousands) | |||||||||||
Cost of revenue | $ | 142,867 | $ | 135,752 | $ | 109,864 | |||||
Gross profit | $ | 339,118 | $ | 287,372 | $ | 229,787 | |||||
Gross margin | 70.4 | % | 67.9 | % | 67.7 | % | |||||
Cost of revenue increased $7.1 million, or 5%, in 2017 as compared to 2016. The increase in cost of revenue was primarily due to $4.4 million in increased amortization of capitalized software, $1.9 million in increased employee-related costs due to higher headcount and $1.9 million in increased third-party content costs. These increased costs were offset by $2.2 million in decreased costs related to outsourced consulting services. These costs were incurred to service our existing clients and support our continued growth. The improvement in gross margin was primarily due to a higher mix of subscription revenue, which carry a higher gross margin. Aside from the improvement in gross margin from the higher mix of subscription revenue, we expect gross margin to increase over time as we optimize the efficiency of our operations and continue to scale our business.
53
Cost of revenue increased $25.9 million, or 24%, in 2016. as compared to 2015. The increase in cost of revenue was consistent with the increase in revenue. The increase in cost of revenue was primarily due to $12.1 million in increased costs related to outsourced consulting services, $4.1 million in increased amortization of capitalized software, $3.8 million in increased employee-related costs due to higher headcount, $1.5 million in increased third-party content costs and $1.1 million in increased reseller and referral fees. These costs were incurred to service our existing clients and support our continued growth. The remaining increase relates to various other costs associated with generating revenue from our clients
Sales and Marketing
Year Ended December 31, | |||||||||||
2017 | 2016 | 2015 | |||||||||
(dollars in thousands) | |||||||||||
Sales and marketing | $ | 240,271 | $ | 225,631 | $ | 207,026 | |||||
Percent of revenue | 49.9 | % | 53.3 | % | 61.0 | % | |||||
Sales and marketing expenses increased $14.6 million, or 6%, in 2017 as compared to 2016. As a percentage of revenue, sales and marketing expense decreased by approximately three percentage points, primarily resulting from a combination of increased cost efficiency and leverage realized from changes to our sales commission plans, as we continued our efforts to strategically scale our sales teams and improve their productivity.
Sales and marketing expenses increased $18.6 million, or 9%, in 2016 as compared to 2015. As a percentage of revenue, sales and marketing expense decreased by approximately eight percentage points, primarily resulting from a combination of increased cost efficiency and leverage realized from changes to our sales commission plans, as we continued our efforts to strategically scale our sales teams and improve their productivity.
We assess our investments in new and existing markets strategically and we believe we have gained leverage through our operational excellence initiatives. We expect over time sales and marketing expense, as a percentage of revenue, to continue to decrease as we gain efficiency throughout the various sales teams.
Research and Development
Year Ended December 31, | |||||||||||
2017 | 2016 | 2015 | |||||||||
(dollars in thousands) | |||||||||||
Research and development | $ | 61,975 | $ | 46,977 | $ | 40,991 | |||||
Percent of revenue | 12.9 | % | 11.1 | % | 12.1 | % | |||||
Research and development expenses increased $15.0 million, or 32%, in 2017 as compared to 2016. The increase was principally due to an increase in research and development headcount to maintain and improve the functionality of our products. As a result, we incurred increased employee-related costs of $10.4 million. In addition, we determined that previously capitalized software costs were impaired resulting in the write-off of $1.3 million.
Research and development expenses increased $6.0 million, or 15%, in 2016 as compared to 2015. The increase was principally due to an increase in research and development headcount to maintain and improve the functionality of our products. As a result, we incurred increased employee-related costs of $4.3 million.
We continue to develop and release new products and new features within existing products and as a result, we expect research and development expense to increase proportionately with revenue.
54
We capitalize a portion of our software development costs related to the development and enhancements of our products, which are then amortized to cost of revenue. The timing of our capitalizable development and enhancement projects may affect the amount of development costs expensed in any given period. We capitalized $24.3 million, $20.9 million and $16.5 million of software development costs and amortized $17.6 million, $13.2 million and $9.1 million in 2017, 2016 and 2015, respectively.
General and Administrative
Year Ended December 31, | |||||||||||
2017 | 2016 | 2015 | |||||||||
(dollars in thousands) | |||||||||||
General and administrative | $ | 84,589 | $ | 70,956 | $ | 49,877 | |||||
Percent of revenue | 17.6 | % | 16.8 | % | 14.7 | % | |||||
General and administrative expenses increased $13.6 million, or 19%, in 2017 as compared to 2016. The increase was largely driven by higher costs to support our growing business and incremental spend to support our operational excellence initiatives, which we expect to result in future margin improvements. We incurred increased employee-related costs of $9.8 million as a result of increased headcount and stock-based compensation awards.
General and administrative expenses increased $21.1 million, or 42%, in 2016 as compared to 2015. The increase was largely driven by higher costs to support our growing business, reallocation of resources to this cost category and incremental spend to support our operational excellence initiatives, which we expect to result in future margin improvements. We incurred increased employee-related costs of $16.8 million as a result of increased headcount and stock-based compensation awards.
We expect over time our general and administrative expense to increase in absolute dollars but decrease as a percentage of revenue.
Restructuring
Year Ended December 31, | |||||||||||
2017 | 2016 | 2015 | |||||||||
(dollars in thousands) | |||||||||||
Restructuring | $ | 1,539 | $ | — | $ | — | |||||
Percent of revenue | 0.3 | % | — | % | — | % | |||||
Restructuring expenses of $1.5 million were recorded in 2017, which consisted primarily of payroll-related costs, such as severance, outplacement costs and continuing healthcare coverage, associated with employee terminations.
Amortization of certain acquired intangible assets
Year Ended December 31, | |||||||||||
2017 | 2016 | 2015 | |||||||||
(dollars in thousands) | |||||||||||
Amortization of certain acquired intangible assets | $ | — | $ | 150 | $ | 600 | |||||
Amortization of certain acquired intangible assets decreased $0.2 million in 2017 due to the acquired intangible assets being fully amortized.
55
Other Income (Expense)
Year Ended December 31, | |||||||||||
2017 | 2016 | 2015 | |||||||||
(in thousands) | |||||||||||
Interest income | $ | 2,951 | $ | 1,702 | $ | 894 | |||||
Interest expense | (14,762 | ) | (12,924 | ) | (12,506 | ) | |||||
Other, net | 1,478 | 1,934 | (4,016 | ) | |||||||
Other income (expense), net | $ | (10,333 | ) | $ | (9,288 | ) | $ | (15,628 | ) | ||
Interest income in 2017 increased by $1.2 million due to the increase in interest income earned on the purchase of investment securities, net of purchased premium amortization.
Interest expense in 2017 increased $1.8 million due to an increase in interest expense for our convertible notes. Refer to the section titled “Liquidity and Capital Resources” below for additional information on the convertible notes.
Other, net is primarily comprised of foreign exchange gains and losses related to transactions denominated in foreign currencies and foreign exchange gains and losses related to our intercompany loans and certain cash accounts. Foreign exchange gains and losses for the years ended December 31, 2017, 2016 and 2015, respectively, were primarily driven by fluctuations in the Euro and U.S. Dollar in relation to the British Pound.
Income Tax Provision
Year Ended December 31, | |||||||||||
2017 | 2016 | 2015 | |||||||||
(in thousands) | |||||||||||
Income tax provision | $ | (1,746 | ) | $ | (1,207 | ) | $ | (1,181 | ) | ||
We have recorded a full valuation allowance against our United States, United Kingdom and New Zealand net deferred tax assets and therefore have not recorded a provision or benefit for income taxes for any of the years presented, other than provisions for certain foreign and state current income taxes.
Liquidity and Capital Resources
At December 31, 2017, our principal sources of liquidity were $393.6 million of cash and cash equivalents, investments in marketable securities of $263.5 million and $154.4 million of accounts receivable. In June 2013, we issued $253 million of 1.5% convertible notes due July 1, 2018 (the “2018 Notes”) and concurrently entered into convertible note hedges and separate warrant transactions. The 2018 Notes mature on July 1, 2018, unless earlier converted.
In November 2017, we entered into certain agreements to issue $300.0 million principal amount of 5.75% senior convertible notes due July 1, 2021 (the “2021 Notes”) for a purchase price equal to 98% of the principal amount, to certain entities affiliated with Silver Lake and LinkedIn. Holders of the 2021 Notes may convert their 2021 Notes at any time prior to the close of business on the scheduled trading day immediately preceding the maturity date.
We intend to use our cash for general corporate purposes, including the payment of 2018 Notes when due, potential future acquisitions or other transactions. Depending on certain growth opportunities, we may choose to accelerate investments in sales and marketing, research and development, technology and services, which may require the use of proceeds for such additional expansion and expenditures. Based on our current level of operations and anticipated growth, we believe our future cash flows from operating activities and existing cash and cash equivalents will provide adequate funds for our ongoing operations and general corporate purposes for at least the next twelve months. Our future capital requirements will depend on many factors, including our rate of revenue growth, billings growth and collections, the level of our sales and marketing efforts, the timing and extent of spending to support product development efforts and expansion into new territories, the timing of introductions of new services and enhancements to existing services, the timing of general and administrative expenses as we grow our administrative infrastructure and the continuing market acceptance of our products. To the extent that existing cash and cash from operations are not sufficient to fund our future activities, we may need to raise additional funds. In addition, we may enter into agreements or letters of intent with respect to potential investments in, or acquisitions of, complementary businesses, services or technologies in the future, which could also require us to seek additional financing or utilize our cash resources.
56
The following table sets forth a summary of our cash flows for the periods indicated (in thousands):
Year Ended December 31, | |||||||||||
2017 | 2016 | 2015 | |||||||||
Net cash provided by operating activities | $ | 67,510 | $ | 35,252 | $ | 43,796 | |||||
Net cash used in investing activities | (36,666 | ) | (81,638 | ) | (110,939 | ) | |||||
Net cash provided by financing activities | 276,852 | 23,515 | 11,005 | ||||||||
Our cash flows from operating activities are significantly influenced by our growth, ability to maintain our contractual billing and collection terms and our investments in headcount and infrastructure to support anticipated growth. Given the seasonality and continued growth of our business, our cash flows from operations will vary from period to period.
Cash provided by operating activities was $67.5 million in 2017, compared to $35.3 million in 2016. The increase in operating cash flow was primarily due to working capital changes in 2017 when compared to 2016 and improved profitability.
Our primary investing activities have consisted of investments, capital expenditures to develop our capitalized software as well as to purchase software, computer equipment, leasehold improvements and furniture and fixtures in support of expanding our infrastructure and workforce.
Cash used in investing activities was $36.7 million in 2017, compared to $81.6 million in 2016. The decrease in cash used for investing activities was primarily due to the timing of maturities and purchases of our investments. As we generate cash flow from operations, we look to invest any excess cash that will not be required to fund our operations in the near future.
Cash provided by financing activities was $276.9 million in 2017, compared to $23.5 million in 2016. The increase in financing cash flows was primarily due to proceeds from the issuance of the 2021 Notes.
Share Repurchase Program
In November 2017, our board of directors authorized a $100.0 million share repurchase program of our common stock. We may repurchase our common stock for cash in the open market in accordance with applicable securities laws. The timing and amount of any stock repurchase will depend on share price, corporate and regulatory requirements, economic and market conditions, and other factors. The repurchase authorization will expire in November 2019.
During the year ended December 31, 2017, we repurchased 0.6 million shares of our common stock at an average cost of $35.55 per share for a total expenditure of $22.6 million. At December 31, 2017, $77.4 million remained available under the share repurchase program. Subsequent to December 31, 2017 and as of February 9, 2018, we repurchased 0.3 million shares of our common stock at an average cost of $37.03 per share for a total expenditure of $9.9 million.
Contractual Obligations
Our principal commitments consist of obligations for outstanding debt, leases for our office space, a sponsorship agreement with a professional sports franchise, contractual commitments for professional service projects and third-party consulting firms. The following table summarizes our contractual obligations at December 31, 2017 (in thousands):
Payments Due by Period | |||||||||||||||||||
Total | Less than 1 Year | 1-3 Years | 3-5 Years | More than 5 Years | |||||||||||||||
Long-term debt obligations including interest | $ | 618,272 | $ | 266,522 | $ | 34,500 | $ | 317,250 | $ | — | |||||||||
Operating lease obligations | 9,229 | 8,247 | 909 | 73 | — | ||||||||||||||
Software subscription obligations | 14,254 | 8,448 | 5,806 | — | — | ||||||||||||||
Sponsorship agreements | 1,425 | 700 | 725 | — | — | ||||||||||||||
Other contractual obligations(1) | 19,136 | 12,011 | 7,125 | — | — | ||||||||||||||
$ | 662,316 | $ | 295,928 | $ | 49,065 | $ | 317,323 | $ | — | ||||||||||
57
(1) Other contractual obligations include agreements with various third-party service providers whereby we have committed to assign certain dollar amounts or hours of professional service projects related to implementation and other services for our clients.
At December 31, 2017, liabilities for unrecognized tax benefits of $1.3 million, which are attributable to foreign income taxes and interest and penalties, are not included in the table above because, due to their nature, there is a high degree of uncertainty regarding the timing of future cash outflows and other events that extinguish these liabilities.
Off-Balance Sheet Arrangements
As part of our ongoing business, we do not have any relationships with other entities or financial partnerships, such as entities often referred to as structured finance or special purpose entities, that have been established for the purpose of facilitating off-balance sheet arrangements or other contractually narrow or limited purposes. We are therefore not exposed to any financing, liquidity, market or credit risk that could arise if we had engaged in those types of relationships.
During 2015, we amended a standby letter of credit in association with a building lease. In addition, we maintain standby letters of credit in association with other contractual arrangements. The total amount outstanding under these standby letters of credit is $1.4 million at December 31, 2017.
Item 7A. | Quantitative and Qualitative Disclosures About Market Risk |
We have operations in the United States and internationally, and we are exposed to market risks in the ordinary course of our business. These risks primarily include interest rate, foreign exchange, inflation and counterparty risks, as well as risks relating to changes in the general economic conditions in the countries where we conduct business. To reduce certain of these risks, we monitor the financial condition of our large clients and limit credit exposure by principally collecting in advance and setting credit limits as we deem appropriate. In addition, our investment strategy has been to invest in financial instruments, including corporate bonds, U.S. treasury securities, agency securities, commercial paper and money market funds backed by United States Treasury Bills within the guidelines established under our investment policy. We also make strategic investments in privately-held companies in the development stage. To date, we have not used derivative instruments to mitigate the impact of our market risk exposures. We have also not used, nor do we intend to use, derivatives for trading or speculative purposes.
Interest Rate Risk
At December 31, 2017, we had cash and cash equivalents of $393.6 million and investments of $263.5 million, which primarily consisted of corporate bonds, U.S. treasury securities, agency securities, commercial paper, money market funds backed by United States Treasury Bills and other debt securities. The carrying amount of our cash equivalents reasonably approximates fair value due to the short maturities of these instruments.
The primary objectives of our investment activities are the preservation of capital, the fulfillment of liquidity needs and the fiduciary control of cash and investments. We do not enter into investments for trading or speculative purposes. Our investments are exposed to market risk due to fluctuations in interest rates, which may affect the fair market value of our investments. An increase of 50-basis points in interest rates would have resulted in a $0.7 million reduction on the fair market value of our portfolio as of December 31, 2017. We therefore do not expect our operating results or cash flows to be materially affected by a sudden change in market interest rates.
We do not believe our cash equivalents, corporate bonds, U.S. treasury securities, agency securities and commercial paper have significant risk of default or illiquidity. While we believe these cash investments do not contain excessive risk, we cannot provide assurance that in the future our investments will not be subject to adverse changes in market value. In addition, we maintain significant amounts of cash and cash equivalents at one or more financial institutions that are in excess of federally insured limits. We cannot provide assurance that we will not experience losses on these deposits.
Foreign Currency Risk
We have foreign currency risks related to our revenue and operating expenses denominated in currencies other than the U.S. Dollar, primarily Euros and British Pounds. To a lesser extent, we also have revenue denominated in Australian Dollars, Brazilian Reals, Canadian Dollars, Chinese Yuan, Hong Kong Dollars, Indian Rupees, Japanese Yen, Mexican Pesos, New Zealand Dollars, Singapore Dollars, South African Rand, Swedish Krona, Swiss Franc and other foreign currencies, and operating expenses denominated in Australian Dollars, Brazilian Reals, Canadian Dollars Chinese Yuan, Hong Kong Dollars, Indian Rupees, Israeli Shekels, Japanese Yen, Mexican Pesos, New Zealand Dollars, Singapore Dollars, and Swedish Krona. Increases and decreases in our foreign-denominated revenue from movements in foreign exchange rates are often partially offset by the corresponding decreases or increases in our foreign-denominated operating expenses. Due to our legal structure,
58
revenue and operating expenses denominated in currencies other than the U.S. Dollar primarily flow through subsidiaries with functional currencies of the British Pound and Euro. Our other income (expense) is also impacted by the remeasurement of U.S. Dollar denominated intercompany loans, cash accounts held by our overseas subsidiaries, accounts receivable denominated in foreign currencies and accounts payable denominated in foreign currencies.
As our international operations grow, our risks associated with fluctuation in currency rates will become greater, and we will continue to reassess our approach to managing this risk. In addition, currency fluctuations or a weakening U.S. Dollar can increase the costs of our international expansion. To date, we have not entered into any foreign currency hedging contracts although we may do so in the future. The effect of an immediate 10% adverse change in foreign exchange rates on foreign-denominated accounts at December 31, 2017, including our intercompany loans with our subsidiaries, would result in a foreign currency loss of approximately $6.9 million.
Inflation Risk
We do not believe that inflation has had a material effect on our business, financial condition or results of operations. Nonetheless, if our costs were to become subject to significant inflationary pressures, we may not be able to fully offset such higher costs through price increases. Our inability or failure to do so could harm our business, financial condition and results of operations.
Counterparty Risk
Our financial statements are subject to counterparty credit risk, which we consider as part of the overall fair value measurement. We attempt to mitigate this risk through credit monitoring procedures.
59
Item 8. | Financial Statements and Supplementary Data |
INDEX TO CONSOLIDATED FINANCIAL STATEMENTS
PAGE | |
60
REPORT OF INDEPENDENT REGISTERED PUBLIC ACCOUNTING FIRM
To the Board of Directors and Stockholders of Cornerstone OnDemand, Inc.
Opinions on the Financial Statements and Internal Control over Financial Reporting
We have audited the accompanying consolidated balance sheets of Cornerstone OnDemand, Inc. and its subsidiaries as of December 31, 2017 and 2016 and the related consolidated statements of operations, comprehensive loss, stockholders’ equity and cash flows for each of the three years in the period ended December 31, 2017, including the related notes (collectively referred to as the “consolidated financial statements”). We also have audited the Company's internal control over financial reporting as of December 31, 2017, based on criteria established in Internal Control - Integrated Framework (2013) issued by the Committee of Sponsoring Organizations of the Treadway Commission (COSO).
In our opinion, the consolidated financial statements referred to above present fairly, in all material respects, the financial position of the Company as of December 31, 2017 and 2016, and the results of their operations and their cash flows for each of the three years in the period ended December 31, 2017 in conformity with accounting principles generally accepted in the United States of America. Also in our opinion, the Company maintained, in all material respects, effective internal control over financial reporting as of December 31, 2017, based on criteria established in Internal Control - Integrated Framework (2013) issued by the COSO.
Basis for Opinions
The Company's management is responsible for these consolidated financial statements, for maintaining effective internal control over financial reporting, and for its assessment of the effectiveness of internal control over financial reporting, included in Management's Report on Internal Control over Financial Reporting appearing under Item 9A. Our responsibility is to express opinions on the Company’s consolidated financial statements and on the Company's internal control over financial reporting based on our audits. We are a public accounting firm registered with the Public Company Accounting Oversight Board (United States) ("PCAOB") and are required to be independent with respect to the Company in accordance with the U.S. federal securities laws and the applicable rules and regulations of the Securities and Exchange Commission and the PCAOB.
We conducted our audits in accordance with the standards of the PCAOB. Those standards require that we plan and perform the audits to obtain reasonable assurance about whether the consolidated financial statements are free of material misstatement, whether due to error or fraud, and whether effective internal control over financial reporting was maintained in all material respects.
Our audits of the consolidated financial statements included performing procedures to assess the risks of material misstatement of the consolidated financial statements, whether due to error or fraud, and performing procedures that respond to those risks. Such procedures included examining, on a test basis, evidence regarding the amounts and disclosures in the consolidated financial statements. Our audits also included evaluating the accounting principles used and significant estimates made by management, as well as evaluating the overall presentation of the consolidated financial statements. Our audit of internal control over financial reporting included obtaining an understanding of internal control over financial reporting, assessing the risk that a material weakness exists, and testing and evaluating the design and operating effectiveness of internal control based on the assessed risk. Our audits also included performing such other procedures as we considered necessary in the circumstances. We believe that our audits provide a reasonable basis for our opinions.
Definition and Limitations of Internal Control over Financial Reporting
A company’s internal control over financial reporting is a process designed to provide reasonable assurance regarding the reliability of financial reporting and the preparation of financial statements for external purposes in accordance with generally accepted accounting principles. A company’s internal control over financial reporting includes those policies and procedures that (i) pertain to the maintenance of records that, in reasonable detail, accurately and fairly reflect the transactions and dispositions of the assets of the company; (ii) provide reasonable assurance that transactions are recorded as necessary to permit preparation of financial statements in accordance with generally accepted accounting principles, and that receipts and expenditures of the company are being made only in accordance with authorizations of management and directors of the company; and (iii) provide reasonable assurance regarding prevention or timely detection of unauthorized acquisition, use, or disposition of the company’s assets that could have a material effect on the financial statements.
Because of its inherent limitations, internal control over financial reporting may not prevent or detect misstatements. Also, projections of any evaluation of effectiveness to future periods are subject to the risk that controls may become inadequate because of changes in conditions, or that the degree of compliance with the policies or procedures may deteriorate.
/s/ PricewaterhouseCoopers LLP
Los Angeles, California
February 27, 2018
We have served as the Company’s auditor since 2001.
61
CORNERSTONE ONDEMAND, INC.
CONSOLIDATED BALANCE SHEETS
(In thousands, except par values)
December 31, 2017 | December 31, 2016 | ||||||
Assets | |||||||
Cash and cash equivalents | $ | 393,576 | $ | 83,300 | |||
Short-term investments | 169,551 | 218,791 | |||||
Accounts receivable, net | 154,428 | 136,657 | |||||
Deferred commissions | 42,806 | 36,298 | |||||
Prepaid expenses and other current assets | 21,754 | 18,467 | |||||
Total current assets | 782,115 | 493,513 | |||||
Capitalized software development costs, net | 37,431 | 30,683 | |||||
Property and equipment, net | 20,817 | 23,962 | |||||
Long-term investments | 96,949 | 41,046 | |||||
Intangible assets, net | — | 7,421 | |||||
Goodwill | 25,894 | 25,894 | |||||
Other assets, net | 3,984 | 1,110 | |||||
Total Assets | $ | 967,190 | $ | 623,629 | |||
Liabilities and Stockholders’ Equity | |||||||
Liabilities: | |||||||
Accounts payable | $ | 17,637 | $ | 24,392 | |||
Accrued expenses | 57,528 | 47,619 | |||||
Deferred revenue, current portion | 311,997 | 272,206 | |||||
Convertible notes, net | 248,025 | — | |||||
Other liabilities | 9,051 | 2,094 | |||||
Total current liabilities | 644,238 | 346,311 | |||||
Convertible notes, net | 285,168 | 238,435 | |||||
Other liabilities, non-current | 1,498 | 1,794 | |||||
Deferred revenue, net of current portion | 14,166 | 10,126 | |||||
Total liabilities | 945,070 | 596,666 | |||||
Commitments and contingencies (Note 15) | |||||||
Stockholders’ Equity: | |||||||
Common stock, $0.0001 par value; 1,000,000 shares authorized, 57,512 and 56,516 shares issued and outstanding at December 31, 2017 and 2016, respectively | 6 | 6 | |||||
Additional paid-in capital | 536,951 | 476,230 | |||||
Accumulated deficit | (515,054 | ) | (453,719 | ) | |||
Accumulated other comprehensive income | 217 | 4,446 | |||||
Total stockholders’ equity | 22,120 | 26,963 | |||||
Total Liabilities and Stockholders’ Equity | $ | 967,190 | $ | 623,629 | |||
The accompanying Notes to Consolidated Financial Statements are an integral part of these statements.
62
CORNERSTONE ONDEMAND, INC.
CONSOLIDATED STATEMENTS OF OPERATIONS
(In thousands, except per share data)
Years Ended December 31, | |||||||||||
2017 | 2016 | 2015 | |||||||||
Revenue | $ | 481,985 | $ | 423,124 | $ | 339,651 | |||||
Cost of revenue | 142,867 | 135,752 | 109,864 | ||||||||
Gross profit | 339,118 | 287,372 | 229,787 | ||||||||
Operating expenses: | |||||||||||
Sales and marketing | 240,271 | 225,631 | 207,026 | ||||||||
Research and development | 61,975 | 46,977 | 40,991 | ||||||||
General and administrative | 84,589 | 70,956 | 49,877 | ||||||||
Restructuring | 1,539 | — | — | ||||||||
Amortization of certain acquired intangible assets | — | 150 | 600 | ||||||||
Total operating expenses | 388,374 | 343,714 | 298,494 | ||||||||
Loss from operations | (49,256 | ) | (56,342 | ) | (68,707 | ) | |||||
Other income (expense): | |||||||||||
Interest income | 2,951 | 1,702 | 894 | ||||||||
Interest expense | (14,762 | ) | (12,924 | ) | (12,506 | ) | |||||
Other, net | 1,478 | 1,934 | (4,016 | ) | |||||||
Other income (expense), net | (10,333 | ) | (9,288 | ) | (15,628 | ) | |||||
Loss before income tax provision | (59,589 | ) | (65,630 | ) | (84,335 | ) | |||||
Income tax provision | (1,746 | ) | (1,207 | ) | (1,181 | ) | |||||
Net loss | $ | (61,335 | ) | $ | (66,837 | ) | $ | (85,516 | ) | ||
Net loss per share, basic and diluted | $ | (1.07 | ) | $ | (1.20 | ) | $ | (1.58 | ) | ||
Weighted average common shares outstanding, basic and diluted | 57,262 | 55,595 | 54,171 | ||||||||
The accompanying Notes to Consolidated Financial Statements are an integral part of these statements.
63
CORNERSTONE ONDEMAND, INC.
CONSOLIDATED STATEMENTS OF COMPREHENSIVE LOSS
(In thousands)
Years Ended December 31, | |||||||||||
2017 | 2016 | 2015 | |||||||||
Net loss | $ | (61,335 | ) | $ | (66,837 | ) | $ | (85,516 | ) | ||
Other comprehensive income, net of tax: | |||||||||||
Foreign currency translation adjustment | (3,795 | ) | 3,748 | 686 | |||||||
Net change in unrealized (losses) gains on investments | (434 | ) | 88 | (247 | ) | ||||||
Other comprehensive (loss) income, net of tax | (4,229 | ) | 3,836 | 439 | |||||||
Total comprehensive loss | $ | (65,564 | ) | $ | (63,001 | ) | $ | (85,077 | ) | ||
The accompanying Notes to Consolidated Financial Statements are an integral part of these statements.
64
CORNERSTONE ONDEMAND, INC.
CONSOLIDATED STATEMENTS OF STOCKHOLDERS’ EQUITY
(In thousands)
Common Stock | Additional Paid-In Capital (Deficit) | Accumulated Deficit | Accumulated Other Comprehensive Income (Loss) | Total | ||||||||||||||||||
Shares | Par Value | |||||||||||||||||||||
Balance as of December 31, 2014 | 53,826 | $ | 5 | $ | 336,692 | $ | (301,366 | ) | $ | 171 | $ | 35,502 | ||||||||||
Issuance of common stock upon the exercise of options | 565 | — | 8,448 | — | — | 8,448 | ||||||||||||||||
Vesting of restricted stock units | 200 | — | — | — | — | — | ||||||||||||||||
Shares issued under employee stock purchase plan | 113 | — | 3,035 | — | — | 3,035 | ||||||||||||||||
Stock-based compensation | — | — | 45,914 | — | — | 45,914 | ||||||||||||||||
Net loss | — | — | — | (85,516 | ) | — | (85,516 | ) | ||||||||||||||
Other comprehensive income, net of tax | — | — | — | — | 439 | 439 | ||||||||||||||||
Balance as of December 31, 2015 | 54,704 | $ | 5 | $ | 394,089 | $ | (386,882 | ) | $ | 610 | $ | 7,822 | ||||||||||
Issuance of common stock upon the exercise of options | 978 | 1 | 18,904 | — | — | 18,905 | ||||||||||||||||
Vesting of restricted stock units | 699 | — | — | — | — | — | ||||||||||||||||
Shares issued under employee stock purchase plan | 135 | — | 4,286 | — | — | 4,286 | ||||||||||||||||
Stock-based compensation | — | — | 58,951 | — | — | 58,951 | ||||||||||||||||
Net loss | — | — | — | (66,837 | ) | — | (66,837 | ) | ||||||||||||||
Other comprehensive income, net of tax | — | — | — | — | 3,836 | 3,836 | ||||||||||||||||
Balance as of December 31, 2016 | 56,516 | $ | 6 | $ | 476,230 | $ | (453,719 | ) | $ | 4,446 | $ | 26,963 | ||||||||||
Issuance of common stock upon the exercise of options | 414 | — | 6,777 | — | — | 6,777 | ||||||||||||||||
Vesting of restricted stock units | 1,035 | — | — | — | — | — | ||||||||||||||||
Shares issued under employee stock purchase plan | 182 | — | 5,621 | — | — | 5,621 | ||||||||||||||||
Repurchase of common stock | (635 | ) | — | (22,599 | ) | — | — | (22,599 | ) | |||||||||||||
Stock-based compensation | — | — | 70,922 | — | — | 70,922 | ||||||||||||||||
Net loss | — | — | — | (61,335 | ) | — | (61,335 | ) | ||||||||||||||
Other comprehensive loss, net of tax | — | — | — | — | (4,229 | ) | (4,229 | ) | ||||||||||||||
Balance as of December 31, 2017 | 57,512 | $ | 6 | $ | 536,951 | $ | (515,054 | ) | $ | 217 | $ | 22,120 | ||||||||||
The accompanying Notes to Consolidated Financial Statements are an integral part of these statements.
65
CORNERSTONE ONDEMAND, INC.
CONSOLIDATED STATEMENTS OF CASH FLOWS
(In thousands)
Years Ended December 31, | |||||||||||
2017 | 2016 | 2015 | |||||||||
Cash flows from operating activities: | |||||||||||
Net loss | $ | (61,335 | ) | $ | (66,837 | ) | $ | (85,516 | ) | ||
Adjustments to reconcile net loss to net cash provided by operating activities: | |||||||||||
Depreciation and amortization | 35,377 | 32,392 | 27,512 | ||||||||
Accretion of debt discount and amortization of debt issuance costs | 9,833 | 9,130 | 8,691 | ||||||||
Purchased investment premium, net of amortization | 1,135 | 240 | 262 | ||||||||
Net foreign currency (gain) loss | (2,461 | ) | (7 | ) | 1,584 | ||||||
Stock-based compensation expense | 65,924 | 54,699 | 43,081 | ||||||||
Write-off of capitalized software | 1,339 | — | — | ||||||||
Deferred income taxes | 52 | (736 | ) | (105 | ) | ||||||
Changes in operating assets and liabilities: | |||||||||||
Accounts receivable | (14,317 | ) | (38,092 | ) | (21,837 | ) | |||||
Deferred commissions | (5,249 | ) | (2,543 | ) | (10,296 | ) | |||||
Prepaid expenses and other assets | (2,704 | ) | (3,623 | ) | (2,575 | ) | |||||
Accounts payable | (6,820 | ) | 5,939 | 4,444 | |||||||
Accrued expenses | 8,530 | 3,727 | 14,724 | ||||||||
Deferred revenue | 35,829 | 43,379 | 64,774 | ||||||||
Other liabilities | 2,377 | (2,416 | ) | (947 | ) | ||||||
Net cash provided by operating activities | 67,510 | 35,252 | 43,796 | ||||||||
Cash flows from investing activities: | |||||||||||
Purchases of investments | (323,413 | ) | (210,534 | ) | (220,383 | ) | |||||
Maturities of investments | 314,418 | 151,533 | 138,360 | ||||||||
Capital expenditures | (7,100 | ) | (6,228 | ) | (15,633 | ) | |||||
Capitalized software costs | (20,571 | ) | (16,409 | ) | (13,283 | ) | |||||
Net cash used in provided by investing activities | (36,666 | ) | (81,638 | ) | (110,939 | ) | |||||
Cash flows from financing activities: | |||||||||||
Proceeds from issuance of convertible notes, net | 285,077 | — | — | ||||||||
Repayment of debt | — | — | (352 | ) | |||||||
Principal payments under capital lease obligations | — | (33 | ) | (202 | ) | ||||||
Proceeds from employee stock plans | 12,509 | 23,548 | 11,559 | ||||||||
Repurchases of common stock | (20,734 | ) | — | — | |||||||
Net cash provided by financing activities | 276,852 | 23,515 | 11,005 | ||||||||
Effect of exchange rate changes on cash and cash equivalents | 2,580 | (1,520 | ) | (2,728 | ) | ||||||
Net increase (decrease) in cash and cash equivalents | 310,276 | (24,391 | ) | (58,866 | ) | ||||||
Cash and cash equivalents at beginning of period | 83,300 | 107,691 | 166,557 | ||||||||
Cash and cash equivalents at end of period | $ | 393,576 | $ | 83,300 | $ | 107,691 | |||||
Supplemental cash flow information: | |||||||||||
Cash paid for interest | $ | 3,841 | $ | 3,796 | $ | 1,915 | |||||
Cash paid for income taxes | 2,243 | 2,334 | 1,520 | ||||||||
Proceeds from employee stock plans received in advance of stock issuance | 575 | 489 | 193 | ||||||||
Non-cash investing and financing activities: | |||||||||||
Assets acquired under capital leases and other financing arrangements | $ | 3,467 | $ | — | $ | — | |||||
Capitalized assets financed by accounts payable and accrued expenses | 1,829 | 2,080 | 705 | ||||||||
Capitalized stock-based compensation | 4,998 | 4,252 | 2,833 | ||||||||
Deferred debt issuance costs included in accrued expenses | 152 | — | — | ||||||||
Unsettled share repurchase in other liabilities | 1,866 | — | — | ||||||||
The accompanying Notes to Consolidated Financial Statements are an integral part of these statements.
66
CORNERSTONE ONDEMAND, INC.
NOTES TO CONSOLIDATED FINANCIAL STATEMENTS
1. | ORGANIZATION |
Company Overview
Cornerstone OnDemand, Inc. (“Cornerstone” or the “Company”) was incorporated on May 24, 1999 in the state of Delaware and began its principal operations in November 1999.
The Company is a leading global provider of learning and human capital management software, delivered as Software-as-a-Service (“SaaS”). The Company helps organizations around the globe recruit, train and manage their employees. It is one of the world’s largest cloud computing companies. The Company's human capital management platform combines the world’s leading unified talent management solutions with state-of-the-art analytics and HR administration solutions to enable organizations to manage the entire employee lifecycle. Its focus on continuous learning and development helps organizations to empower employees to realize their potential and drive success.
The Company works with clients across all geographies, verticals and market segments. Its Recruiting, Learning, Performance and HR Administration suites help with sourcing, recruiting and onboarding new hires; managing training and development requirements; nurturing knowledge sharing and collaboration among employees; goal setting reviews, competency management and continuous feedback; linking compensation to performance; identifying development plans based on performance gaps; streamlining employee data management, self-service and compliance reporting; and then utilizing state-of-the-art analytics capabilities to make smarter, more-informed decisions using data from across the platform for talent mobility, engagement and development so that HR and leadership can focus on strategic initiatives to help their organization succeed.
The Company’s management has determined that the Company operates in one segment as it only reports financial information on an aggregate and consolidated basis to the Company’s chief executive officer, who is the Company’s chief operating decision maker.
Office Locations
The Company is headquartered in Santa Monica, California and has offices in Amsterdam, Netherlands; Auckland, New Zealand; Bangalore, India; Düsseldorf, Germany; Hong Kong; London, United Kingdom; Madrid, Spain; Mumbai, India; Munich, Germany; New Delhi, India; Paris, France; São Paulo, Brazil; Stockholm, Sweden; Sunnyvale, United States; Sydney, Australia; Tel Aviv, Israel; and Tokyo, Japan.
2. | SUMMARY OF SIGNIFICANT ACCOUNTING POLICIES |
Basis of Presentation and Principles of Consolidation
The accompanying consolidated financial statements are presented in accordance with accounting standards generally accepted in the United States of America (“GAAP”), and include the accounts of Cornerstone OnDemand, Inc. and its wholly owned subsidiaries. All significant inter-company transactions and balances have been eliminated in consolidation.
Use of Estimates
The preparation of consolidated financial statements in conformity with GAAP requires management to make estimates and assumptions that affect the reported amounts of assets and liabilities and disclosures of contingent assets and liabilities at the date of the financial statements and the reported amounts of revenue and expenses during the reporting period. Actual results could differ from those estimates.
On an on-going basis, management evaluates its estimates, including among others those related to: (i) the realization of tax assets and estimates of tax liabilities and reserves, (ii) the recognition and disclosure of contingent liabilities, (iii) the collectability of accounts receivable, (iv) the evaluation of revenue recognition criteria, including the determination of standalone value and estimates of the selling price of multiple-deliverables in the Company’s revenue arrangements, (v) fair values of investments in marketable securities and strategic investments carried at fair value, (vi) the fair values of acquired assets and assumed liabilities in business combinations, (vii) the useful lives of property and equipment, capitalized software and intangible assets, (viii) impairment of long-lived assets, including goodwill, (ix) the amount and period of amortization of the commission payments to record to expense in proportion to the revenue that is recognized, (x) assumptions used in the Black-Scholes option pricing model to determine the fair value of stock options and (xi) assumptions used in the valuation of various types of performance-based awards. These estimates are based on historical data and experience, as well as various
67
other factors that management believes to be reasonable under the circumstances, the results of which form the basis for making judgments about the carrying value of assets and liabilities that are not readily apparent from other sources. The Company engages third-party valuation specialists to assist with the allocation of the purchase price in business combinations. Such estimates required the selection of appropriate valuation methodologies and models and significant judgment in evaluating ranges of assumptions and financial inputs.
Business Combinations
The results of businesses acquired in a business combination are included in the Company’s consolidated financial statements from the date of the acquisition. Purchase accounting results in assets and liabilities of an acquired business being recorded at their estimated fair values on the acquisition date. Any excess consideration over the fair value of assets acquired and liabilities assumed is recognized as goodwill.
The Company performs valuations of assets acquired and liabilities assumed for an acquisition and allocates the purchase price to its respective net tangible and intangible assets. Determining the fair value of assets acquired and liabilities assumed requires management to use significant judgment and estimates including the selection of valuation methodologies, estimates of future revenue and cash flows, discount rates and selection of comparable companies. The Company engages the assistance of valuation specialists in concluding on fair value measurements in connection with determining fair values of assets acquired and liabilities assumed in a business combination.
Transaction costs associated with business combinations are expensed as incurred, and are included in general and administrative expenses in the consolidated statement of operations. There were no transaction costs for the years ended December 31, 2017, 2016 and 2015.
Revenue Recognition
The Company derives its revenue from the following sources:
• | Subscriptions to the Company’s products and other offerings on a recurring basis—Clients pay subscription fees for access to the Company’s enterprise human capital management platform, other products and support on a recurring basis. Fees are based on a number of factors, including the number of products purchased, which may include e-learning content, and the number of users having access to a product. The Company generally recognizes revenue from subscriptions ratably over the term of the agreements. |
• | Professional services and other—The Company offers its clients assistance in implementing its products and optimizing their use. Professional services include application configuration, system integration, business process re-engineering, change management and training services. Services are generally billed on a fixed fee basis and to a lessor degree on a time-and-material basis. These services are generally purchased as part of a subscription arrangement and are typically performed within the first several months of the arrangement. Clients may also purchase professional services at any other time. The Company generally recognizes revenue from fixed fee professional services using the proportional performance method over the period the services are performed and as time is incurred for time-and-material arrangements. |
The Company recognizes revenue when: (i) persuasive evidence of an arrangement for the sale of the Company’s products or professional services exists, (ii) the products have been made available or delivered, or services have been performed, (iii) the sales price is fixed or determinable and (iv) collectability is reasonably assured. The timing and amount the Company recognizes as revenue is determined based on the facts and circumstances of each client arrangement. Evidence of an arrangement consists of a signed client agreement. The Company considers that delivery of a product has commenced once it provides the client with log-in information to access and use the product. If non-standard acceptance periods or non-standard performance criteria exist, revenue recognition commences upon the satisfaction of the non-standard acceptance or performance criteria, as applicable. Standard acceptance or performance clauses relate to the Company’s products meeting certain perfunctory operating thresholds. Fees are fixed based on stated rates specified in the client agreement. If collectability is not considered reasonably assured, revenue is deferred until the fees are collected. The majority of client arrangements include multiple deliverables, such as subscriptions to the Company’s software products and professional services. The Company therefore recognizes revenue in accordance with the guidance for arrangements with multiple deliverables under Accounting Standards Update (“ASU”) 2009-13 “Revenue Recognition (Topic 605)—Multiple-Deliverable Revenue Arrangements—a Consensus of the Emerging Issues Task Force,” or ASU 2009-13. As clients do not have the right to the underlying software code for the products, the Company’s revenue arrangements are outside the scope of software revenue recognition guidance. The Company’s agreements generally do not contain any cancellation or refund provisions other than in the event of the Company’s default.
68
For multiple-deliverable revenue arrangements, the Company first assesses whether each deliverable has value to the client on a standalone basis. The Company has determined that the products have standalone value, because, once access is given to a client, the products are fully functional and do not require any additional development, modification or customization. Professional services have standalone value because third-party service providers, distributors or clients themselves can perform these services without the Company’s involvement. The professional services assist clients with the configuration and integration of the Company’s products. The performance of these services generally does not require highly specialized or skilled individuals and are not essential to the functionality of the products.
Based on the standalone value of the deliverables, and since clients do not have a general right of return relative to the included professional services, the Company allocates revenue among the separate deliverables in an arrangement under the relative selling price method using the selling price hierarchy established in ASU 2009-13. This hierarchy requires the selling price of each deliverable in a multiple deliverable arrangement to be based on, in descending order: (i) vendor-specific objective evidence of fair value (“VSOE”), (ii) third-party evidence of fair value (“TPE”) or (iii) management’s best estimate of the selling price (“BESP”).
The Company is generally not able to determine VSOE or TPE for its deliverables, because the deliverables are sold separately and within a sufficiently narrow price range only infrequently, and because management has determined that there are no third-party offerings reasonably comparable to the Company’s products. Accordingly, total contract values are allocated to subscriptions to the products and professional services based on BESP. However, the amounts allocated to professional services generally do not exceed the contractually stated values of the professional services, as the revenue for subscriptions to the Company’s products is delivered over a longer period of time and is contingent upon delivery. This can result in higher allocations of the total contract value to subscriptions to the Company’s products over and above the relative selling price allocation based on this contingent revenue limitation. The determination of BESP requires the Company to make significant estimates and judgments. The Company considers numerous factors, including the nature of the deliverables themselves; the geography, market conditions and competitive landscape for the sale; internal costs; and pricing and discounting practices. The Company updates its estimates of BESP on an ongoing basis through internal periodic reviews and as events or circumstances may require.
After the contract value is allocated to each deliverable in a multiple deliverable arrangement based on the relative selling price method, revenue is recognized for each deliverable based on the pattern in which the revenue is earned. For subscriptions to the products, revenue is recognized on a straight-line basis over the subscription term, which is typically three years. For professional services, revenue is recognized using the proportional performance method over the period the services are performed. For e-learning content and hosting, revenue is recognized ratably over the period the content is delivered or hosting service is provided.
In a limited number of cases, the client’s intended use of a product requires enhancements to its underlying features and functionality. In some of these cases, revenue is recognized as one unit of accounting on a straight-line basis from the point at which the enhancements have been made to the product, through the remaining term of the agreement. In other cases where the enhancement is not required for the client’s intended use, revenue is recognized separately for the enhancement and the product. The enhancement revenue is recognized based on the allocated value on a straight-line basis once the enhancement has been made to the product, through the remaining term of the agreement.
For arrangements in which the Company resells third-party e-learning training content to clients or hosts client or third-party e-learning training content provided by the client, revenue is recognized in accordance with accounting guidance as to when to report gross revenue as a principal or report net revenue as an agent. The Company recognizes third-party content revenue at the gross amount invoiced to clients when (i) the Company is the primary obligor, (ii) the Company has latitude to establish the price charged and (iii) the Company bears the credit risk in the transaction. For arrangements involving the sale of third-party content, clients are charged for the content based on pay-per-use or a fixed rate for a specified number of users, and revenue is recognized at the gross amount invoiced as the content is delivered. For arrangements where clients purchase third-party content directly from a third-party vendor, or provide it themselves, and the Company integrates the content into a product, the Company charges a fee per user or fee based on estimated bandwidth. In such cases, the fees are recognized at the net amount charged by the Company for hosting services as the content is delivered.
The Company records amounts that have been invoiced to its clients in accounts receivable and in either deferred revenue or revenue depending on whether the revenue recognition criteria described above have been met. Deferred revenue that will be recognized during the succeeding twelve month period from the respective balance sheet date is recorded as current deferred revenue and the remaining portion is recorded as noncurrent.
69
Cost of Revenue
Cost of revenue consists primarily of costs related to hosting the Company’s products; personnel and related expenses, including stock-based compensation, and related expenses for network infrastructure, IT support, delivery of contracted professional services and on-going client support staff; payments to external service providers contracted to perform implementation services; depreciation of data centers; amortization of capitalized software costs; amortization of developed technology software license rights; content and licensing fees; and referral fees. In addition, the Company allocates a portion of overhead, such as rent, IT costs, depreciation and amortization and employee benefits costs, to cost of revenue based on headcount. Costs associated with providing professional services are recognized as incurred when the services are performed. Out-of-pocket travel costs related to the delivery of professional services are typically reimbursed by the client and are accounted for as both revenue and expense in the period in which the cost is incurred.
Commission Payments
The Company defers commissions paid to its sales force and related payroll taxes because these amounts are recoverable from the future revenue due to the non-cancelable client agreements that gave rise to the commissions. Commissions are deferred on the balance sheet and are recognized as sales and marketing expense over the term of the client agreement in proportion to the revenue that is recognized. Commissions are considered direct and incremental costs to client agreements and the Company generally commences payment of commissions within 45 to 75 days after execution of client agreements.
During the years ended December 31, 2017, 2016 and 2015, the Company deferred $48.2 million, $33.3 million and $42.0 million, respectively, of commissions on the balance sheet. During the years ended December 31, 2017, 2016 and 2015, the Company recognized $41.7 million, $33.0 million and $32.3 million in commissions expense to sales and marketing expense, respectively. As of December 31, 2017 and 2016, deferred commissions on the Company’s consolidated balance sheets totaled $42.8 million and $36.3 million, respectively.
Research and Development
Research and development expenses consist primarily of personnel and related expenses for the Company’s research and development staff, including salaries, benefits, bonuses and stock-based compensation; the cost of certain third-party service providers; and allocated overhead. Research and development expenses, other than software development costs qualifying for capitalization, are expensed as incurred. The Company’s research and development expenses were $62.0 million in 2017, $47.0 million in 2016 and $41.0 million in 2015.
Advertising
Advertising expenses for 2017, 2016 and 2015 were $9.0 million, $6.6 million and $5.4 million, respectively, and are expensed as incurred.
Stock-Based Compensation
The Company accounts for stock-based awards granted to employees and directors by recording compensation expense based on the awards’ estimated fair values. The Company grants stock options and restricted stock units that vest over time based on the continuing employment of the employee, as well as restricted stock units that vest based on meeting certain performance targets.
The Company estimates the fair value of its restricted stock units based on the closing price of its common stock as of the date of grant. The Company estimates the fair value of its stock options as of the date of grant using the Black-Scholes option-pricing model. Determining the fair value of stock options under this model requires judgment, including estimating (i) the value per share of our common stock, (ii) volatility, (iii) the term of the awards, (iv) the dividend yield and (v) the risk-free interest rate. The assumptions used in calculating the fair value of stock based awards represent the Company’s best estimates, based on management’s judgment and subjective future expectations. These estimates involve inherent uncertainties. If any of the assumptions used in the model change significantly, stock-based compensation recorded for future awards may differ materially from that recorded for awards granted previously.
70
Beginning in 2017, the Company began estimating expected volatility based solely on its historical volatility as a public company. In previous years, the Company estimated this using the average volatility of similar publicly traded companies as sufficient trading history of the Company’s stock was not available. For purposes of determining the expected term of the awards in the absence of sufficient historical data relating to stock option exercises for the Company, it applies a simplified approach in which the expected term of an award is presumed to be the mid-point between the vesting date and the expiration date of the award. The risk-free interest rate for periods within the expected life of an award, as applicable, is based on the United States Treasury yield curve in effect during the period the award was granted. The estimated dividend yield is zero, as the Company has not declared dividends in the past and does not currently intend to declare dividends in the foreseeable future.
The following information represents the weighted average of the assumptions used in the Black-Scholes option-pricing model for stock options granted during each of the last three years:
For the Years Ended December 31, | |||||||
2017 | 2016 | 2015 | |||||
Risk-free interest rate | n/a | 1.4 | % | 1.8 | % | ||
Expected term (in years) | n/a | 5.8 | 6.0 | ||||
Estimated dividend yield | n/a | — | % | — | % | ||
Estimated volatility | n/a | 48.8 | % | 41.8 | % | ||
Once the Company has determined the estimated fair value of its stock-based awards, it recognizes the portion of that value that corresponds to the portion of the award that is ultimately expected to vest, taking estimated forfeitures into account. This amount is recognized as an expense over the vesting period of the award using the straight-line method for awards which contain only service conditions, and using the graded vesting method based upon the probability of the performance condition being met for awards which contain performance conditions. The Company estimates forfeitures based upon its historical experience and for each period, the Company reviews the estimated forfeiture rate and makes changes as factors affecting the forfeiture rate calculations and assumptions change.
In addition, the Company has issued performance-based restricted stock units that vest based upon continued service over the vesting term and achievement of certain market conditions and performance goals, and others that vest based upon continued service over the vesting term and achievement of certain market conditions or performance goals, established by the Board of Directors, for a predetermined period. The fair value of the performance-based awards containing a market condition are determined using a Monte-Carlo simulation model that factors in the probability of the award vesting. The Company recognizes the fair value of stock-based compensation for awards which contain market-based conditions using the graded vesting method regardless of whether the market based condition is met. The fair value of the performance-based awards containing only a service and performance condition are determined based upon the closing price of the Company’s common stock on the date of the grant and the Company recognizes the fair value of awards containing a performance condition only if it is probable the performance condition will be met. For all performance-based awards, the fair value is not determined until all of the terms and conditions of the award are established.
Due to the full valuation allowance provided on its net deferred tax assets, the Company has not recorded any significant tax benefit attributable to stock-based compensation expense as of December 31, 2017 and 2016.
Capitalized Software Costs
The Company capitalizes the costs associated with software developed or obtained for internal use, including costs incurred in connection with the development of its products, when the preliminary project stage is completed, management has decided to make the project a part of its future offering and the software will be used to perform the function intended. These capitalized costs include external direct costs of materials and services consumed in developing or obtaining internal-use software, personnel and related expenses for employees who are directly associated with and who devote time to internal-use software projects and, when material, interest costs incurred during the development. Capitalization of these costs ceases once the project is substantially complete and the software is ready for its intended purpose. Costs incurred for upgrades and enhancements to the products are also capitalized. Post-configuration training and maintenance costs are expensed as incurred. Capitalized software costs are amortized to cost of revenue using the straight-line method over an estimated useful life of the software, which is typically three years, commencing when the software is ready for its intended use. The Company does not transfer ownership of or lease its software to its clients.
71
During the years ended December 31, 2017, 2016 and 2015, the Company capitalized $24.3 million, $20.9 million and $16.5 million, respectively, of software development costs to the balance sheet. During the years ended December 31, 2017, 2016 and 2015, the Company amortized $17.6 million, $13.2 million and $9.1 million to cost of revenue, respectively. Based on the Company’s capitalized software costs at December 31, 2017, estimated amortization expense of $19.1 million, $12.5 million, $5.7 million and $0.1 million is expected to be recognized in 2018, 2019, 2020 and 2021, respectively.
Comprehensive Loss
Comprehensive loss encompasses all changes in equity other than those arising from transactions with stockholders, and consists of net loss, currency translation adjustments and unrealized gains or losses on investments. For the years ended December 31, 2017, 2016 and 2015, accumulated other comprehensive income (loss) comprised a cumulative translation adjustment and also included net unrealized gains (losses) on investments.
Income Taxes
The Company uses the liability method of accounting for income taxes. Under the liability method, deferred taxes are determined based on the temporary differences between the financial statement and tax bases of assets and liabilities, using tax rates expected to be in effect during the years in which the bases differences are expected to reverse. A valuation allowance is recorded when it is more likely than not that some of the deferred tax assets will not be realized. In determining the need for valuation allowances, the Company considers projected future taxable income and the availability of tax planning strategies. The Company has recorded a full valuation allowance to reduce its United States, United Kingdom, New Zealand, Hong Kong and Brazil net deferred tax assets to zero, as it has determined that it is not more likely than not that these deferred tax assets will be realized.
The Company has assessed its income tax positions and recorded tax benefits for all years subject to examination, based upon its evaluation of the facts, circumstances and information available at each period end. For those tax positions where the Company has determined there is a greater than 50% likelihood that a tax benefit will be sustained, the Company has recorded the largest amount of tax benefit that may potentially be realized upon ultimate settlement with a taxing authority that has full knowledge of all relevant information. For those income tax positions where it is determined there is less than 50% likelihood that a tax benefit will be sustained, no tax benefit has been recognized.
Cash and Cash Equivalents
The Company considers cash and cash equivalents to include short-term, highly liquid investments that are readily convertible to known amounts of cash and so near their maturity that they present insignificant risk of changes in value, including investments with original or remaining maturities from the date of purchase of three months or less. At December 31, 2017 and 2016, cash and cash equivalents consisted of cash balances of $24.7 million and $35.2 million, respectively, money market funds backed by U.S. treasury securities of $358.9 million and $48.1 million, respectively, and certificates of deposit of $10.0 million and none, respectively.
Investments in Marketable Securities
The Company’s available-for-sale investments in marketable securities are recorded at fair value, with any unrealized gains and losses, net of taxes, reported as a component of stockholders’ equity until realized or until a determination is made that an other-than-temporary decline in market value has occurred. If the Company determines that an other-than-temporary decline has occurred for debt securities that the Company does not then currently intend to sell, the Company recognizes the credit loss component of an other-than-temporary impairment in other income (expense) and the remaining portion in other comprehensive income (loss). The credit loss component is identified as the amount of the present value of cash flows not expected to be received over the remaining term of the security, based on cash flow projections. In determining whether an other-than-temporary impairment exists, the Company considers: (i) the length of time and the extent to which the fair value has been less than cost; (ii) the financial condition and near-term prospects of the issuer of the securities; and (iii) the Company’s intent and ability to retain the security for a period of time sufficient to allow for any anticipated recovery in fair value. The cost of marketable securities sold is determined based on the specific identification method and any realized gains or losses on the sale of investments are reflected as a component of interest income or expense. In addition, the Company classifies marketable securities as current or non-current based upon the maturity dates of the securities. At December 31, 2017 and 2016, the Company had $263.5 million and $257.8 million, respectively, of investments in marketable securities.
72
Strategic Investments
Since 2014, the Company has invested in equity securities of multiple privately-held companies. The Company accounted for each of these investment using the cost method of accounting, as we do not have significant influence or a controlling financial interest over these entities. These investments are subject to periodic impairment reviews and are considered to be impaired when a decline in fair value is judged to be other-than-temporary. These investments are included in long-term investments on the Consolidated Balance Sheets.
Allowance for Doubtful Accounts
The Company bases its allowance for doubtful accounts on its historical collection experience and a review in each period of the status of the then-outstanding accounts receivable.
A reconciliation of the beginning and ending amount of allowance for doubtful accounts for the years ended December 31, 2017, 2016 and 2015, is as follows (in thousands):
2017 | 2016 | 2015 | |||||||||
Beginning balance, January 1 | $ | 3,532 | $ | 2,578 | $ | 2,177 | |||||
Additions and adjustments | 7,680 | 3,165 | 1,368 | ||||||||
Write-offs | (3,734 | ) | (2,211 | ) | (967 | ) | |||||
Ending balance, December 31 | $ | 7,478 | $ | 3,532 | $ | 2,578 | |||||
The Company recognized bad debt expense of $1.4 million, $0.8 million and $0.7 million for the years ended December 31, 2017, 2016 and 2015, respectively.
Property and Equipment, Net
Property and equipment are recorded at historical cost, less accumulated depreciation and amortization. Depreciation is computed using the straight-line method based upon the estimated useful lives of the assets, generally two to seven years (See Note 6).
The Company leases equipment under capital lease arrangements. The assets and liabilities under capital lease are recorded at the lesser of the present value of aggregate future minimum lease payments, including estimated bargain purchase options, or the fair value of the asset under lease. Assets under capital lease are depreciated using the straight-line method over the lesser of the estimated useful life of the asset or the term of the lease.
Leasehold improvements are depreciated on a straight-line basis over the shorter of their estimated useful lives or lease terms. Repair and maintenance costs are charged to expense as incurred, while renewals and improvements are capitalized.
Impairment of Long Lived Assets
The Company evaluates the recoverability of its long-lived assets with finite useful lives, including intangible assets, for impairment whenever events or changes in circumstances indicate that the carrying amounts may not be recoverable. Such triggering events or changes in circumstances may include: a significant decrease in the market price of a long-lived asset, a significant adverse change in the extent or manner in which a long-lived asset is being used, a significant adverse change in legal factors or in the business climate, the impact of competition or other factors that could affect the value of a long-lived asset, a significant adverse deterioration in the amount of revenue or cash flows expected to be generated from an asset group, an accumulation of costs significantly in excess of the amount originally expected for the acquisition or development of a long-lived asset, current or future operating or cash flow losses that demonstrate continuing losses associated with the use of a long-lived asset, or a current expectation that, more likely than not, a long-lived asset will be sold or otherwise disposed of significantly before the end of its previously estimated useful life. The Company performs impairment testing at the asset group level that represents the lowest level for which identifiable cash flows are largely independent of the cash flows of other assets and liabilities. If events or changes in circumstances indicate that the carrying amount of an asset group may not be recoverable and the expected undiscounted future cash flows attributable to the asset group are less than the carrying amount of the asset group, an impairment loss equal to the excess of the asset’s carrying value over its fair value is recorded. Fair value is determined based upon estimated undiscounted future cash flows. During the year ended December 31, 2017, the Company determined that previously capitalized software costs were impaired resulting in the write-off of $1.3 million, which was recorded in research and development expense in the accompanying Consolidated Statement of Operations. There were no impairment charges related to identifiable long lived assets in the year ended December 31, 2016.
73
Intangible Assets
Identifiable intangible assets primarily consist of trade names and intellectual property and acquisition-related intangibles, including developed technology, customer relationships, non-compete agreements, patents, trade names and trademarks. The Company determines the appropriate useful life of its intangible assets by performing an analysis of expected cash flows of the acquired assets. Intangible assets are amortized over their estimated useful lives ranging from two to ten years, generally using the straight line method which approximates the pattern in which the economic benefits are consumed.
Goodwill
Goodwill is not amortized, but instead is required to be tested for impairment annually and under certain circumstances. The Company performs such testing of goodwill in the fourth quarter of each year, or as events occur or circumstances change that would more likely than not reduce the fair value of a reporting unit below its carrying amount. Events or changes in circumstances which could trigger an impairment review include a significant adverse change in legal factors or in the business climate, an adverse action or assessment by a regulator, unanticipated competition, a loss of key personnel, significant changes in the manner of the Company’s use of the acquired assets or the strategy for the Company’s overall business, significant negative industry or economic trends, or significant underperformance relative to expected historical or projected future results of operations.
As part of the annual impairment test, the Company may conduct an assessment of qualitative factors to determine whether it is more likely than not that the fair value of a reporting unit is less than its carrying amount. If the Company elects not to perform the qualitative assessment or it determines that it is more likely than not that the fair value of a reporting unit is less than its carrying amount, it then conducts the first step of a two-step impairment test. The first step of the test for goodwill impairment compares the fair value of the applicable reporting unit with its carrying value. Fair value was determined using a market approach, which includes consideration of the Company’s own market capitalization.
If the fair value of a reporting unit is less than the reporting unit’s carrying value, the Company performs the second step of the test for impairment of goodwill in which the Company compares the implied fair value of the reporting unit’s goodwill with the carrying value of that goodwill. The estimate of implied fair value of goodwill may require valuations of certain internally generated and unrecognized intangible assets and other assets and liabilities. If the carrying value of the goodwill exceeds the calculated implied fair value, the excess amount will be recognized as an impairment loss. Based on the results of the annual impairment test, no impairment of goodwill existed at December 31, 2017 or 2016.
Convertible Notes
In June 2013, the Company issued 1.50% convertible notes due July 1, 2018 with a principal amount of $253.0 million (the “2018 Notes”). In December 2017, the Company issued 5.75% senior convertible notes due July 1, 2021 with a principal amount of $300.0 million (the “2021 Notes”). In accounting for the 2018 Notes at issuance, the Company separated the 2018 Notes into debt and equity components pursuant to the accounting standards for convertible debt instruments that may be fully or partially settled in cash upon conversion. The fair value of the debt component was estimated using an interest rate, with terms similar to the 2018 Notes, excluding the conversion feature. The carrying amount of the liability component was calculated by measuring the fair value of similar liabilities that do not have an associated convertible feature. The excess of the principal amount of the 2018 Notes over the fair value of the debt component was recorded as a debt discount and a corresponding increase in additional paid-in capital. The debt discount is accreted to interest expense over the term of the 2018 Notes using the interest method. The equity component of the 2018 Notes recorded to additional paid-in capital is not to be remeasured as long as it continues to meet the conditions for equity classification. The 2021 Notes were recorded based on the fair value of the proceeds, net of discounts and issuance costs, and will be accreted to face value over the term of the 2021 Notes.
Fair Value of Financial Instruments
Fair value represents the exchange price that would be received for an asset or paid to transfer a liability (an exit price) in the principal or most advantageous market for the asset or liability in an orderly transaction between market participants on the measurement date. Valuation techniques used to measure fair value must maximize the use of observable inputs and minimize the use of unobservable inputs. The fair value hierarchy is based on the following three levels of inputs, of which the first two are considered observable and the last one is considered unobservable:
• | Level 1—Quoted prices (unadjusted) in active markets for identical assets or liabilities that management has the ability to access at the measurement date. |
• | Level 2—Inputs other than quoted prices included within Level 1 that are observable for the asset or liability, either directly or indirectly. |
74
• | Level 3—Unobservable inputs. |
Observable inputs are based on market data obtained from independent sources.
Concentration of Risk
Financial instruments that potentially subject the Company to concentration of credit risk consist principally of cash, cash equivalents, restricted cash and accounts receivable. The Company’s cash and cash equivalents are deposited with several financial institutions and, at times, may exceed federally insured limits, as applicable. The Company performs ongoing credit evaluations of its clients.
For the years ended December 31, 2017, 2016 and 2015, no single client comprised more than 10% of the Company’s revenue. No single client had an accounts receivable balance greater than 10% of total accounts receivable at December 31, 2017 or 2016.
Foreign Currency Transactions and Translation
Transactions in foreign currencies are translated into U.S. Dollars at the rates of exchange in effect at the date of the transaction. Unrealized transaction (losses) gains were approximately $(3.1) million, $20 thousand and $(0.9) million for the years ended December 31, 2017, 2016 and 2015, respectively, and are included in other, net within other income (expense), net, in the accompanying consolidated statements of operations.
The Company has entities in various countries. For entities where the local currency is different than the functional currency, the local currency financial statements have been remeasured from the local currency into the functional currency using the current exchange rate for monetary accounts and historical exchange rates for nonmonetary accounts, with exchange differences on remeasurement included in other income (loss). To the extent that the functional currency of our subsidiaries is different than the U.S Dollar, the financial statements have then been translated into U.S. Dollars using period-end exchanges rates for assets and liabilities and average exchanges rates for the results of operations. Foreign currency translation gains and losses are included as a component of Accumulated other comprehensive income or loss in the Consolidated Balance Sheets.
Recently Adopted Accounting Pronouncements
In January 2017, the Financial Accounting Standards Board (“FASB”) issued a new accounting standards update (“ASU”) which amends the reporting requirement in regard to new accounting pronouncements or existing pronouncements that have not yet been adopted. The guidance requires registrants to disclose the effect that recently issued accounting standards will have on their financial statements when adopted in a future period. The Company implemented this requirement as of the beginning of the first quarter of 2017.
In March 2016, the FASB issued a new ASU to simplify several areas of accounting for share-based compensation arrangements, including the income tax impact, classification on the statement of cash flows and forfeitures. The Company adopted this ASU as of the beginning of the first quarter of 2017 and has elected to continue to estimate expected forfeitures over the course of a vesting period. Further, the ASU eliminates the requirement to delay the recognition of excess tax benefits until they reduce current taxes payable. Upon adoption on January 1, 2017, the Company recorded a $39.4 million U.S. deferred tax asset for the previously unrecognized excess tax benefits, however, this had no impact on our accumulated deficit balance as the deferred tax assets were fully offset by a valuation allowance. The adoption did not have any other material impacts on the Company’s financial statements.
Recent Accounting Pronouncements
In May 2017, the FASB issued a new ASU, which amends the scope of modification accounting for share-based payment arrangements. It provides guidance on the types of changes to the terms or conditions of share-based payment awards to which an entity would be required to apply modification accounting under ASC 718. This guidance is effective for the Company’s interim and annual reporting periods beginning January 1, 2018. The Company does not expect the adoption of this ASU to have a material impact on its financial statements.
In August 2016, the FASB issued a new ASU to clarify how companies present and classify certain cash receipts and cash payments in the statement of cash flows. This guidance is effective for our interim and annual reporting periods beginning January 1, 2018. The Company does not expect the adoption of this ASU to have a material impact on its financial statements.
75
In February 2016, the FASB issued a new ASU, which amends a number of aspects of lease accounting, including requiring lessees to recognize operating leases with a term greater than one year on their balance sheet as a right-of-use asset and corresponding lease liability, measured at the present value of the lease payments. This guidance is effective for the Company’s interim and annual reporting periods beginning January 1, 2019. Upon adoption, the Company expects additional lease liability to be recognized on the consolidated balance sheets.
In January 2016, the FASB issued a new ASU that provides guidance for the recognition, measurement, presentation and disclosure of financial assets and liabilities. This guidance is effective for the Company’s interim and annual reporting periods beginning January 1, 2018. The Company does not expect the adoption of this ASU to have a material impact on its financial statements.
In May 2014, the FASB issued a new ASU that provides guidance for recognizing revenue from contracts with customers. Under the new standard, the Company is required to recognize revenue to depict the transfer of promised goods or services to customers in an amount that reflects consideration that the Company expects to be entitled to in exchange for those goods or services. The standard permits the use of the full retrospective method, in which case the standard would be applied to each prior reporting period presented and the cumulative effect of applying the standard would be recognized at the earliest period shown, or the modified retrospective method, in which case the cumulative effect of applying the standard would be recognized at the date of initial application. The Company has evaluated the transition methods and elected to use the modified retrospective method and will adopt this standard beginning January 1, 2018.
During fiscal year 2017, the Company evaluated the accounting and disclosure requirements of the standard and implemented the appropriate changes to its business processes, systems and internal controls to enable the preparation of its financial information on adoption. The Company is in the process of finalizing its assessment of the standard as the Company’s analysis of costs that represent incremental costs to obtain a contract is ongoing. The Company believes it will finalize this analysis in connection with the preparation of its financial statements as of and for the quarter ended March 31, 2018. Costs that represent incremental costs to obtain a contract will be amortized over the expected product life. The Company has finalized its assessment of how it recognizes revenue for subscriptions to the Company’s products and other offerings on a recurring basis and revenue for professional services. Upon adoption, revenue for professional services will be based on the relative standalone selling price without limitation to its contractual value. Prior to adoption, such allocation was limited by its contractual value. This change is expected to result in a material increase in the aggregate amount allocated to professional services when allocating total contract values on a relative standalone selling price basis under the new standard. The Company expects to adjust the following balance sheet line items in fiscal year 2018 to reflect the adoption of the new ASU: deferred commissions; other assets, net; accrued expenses; deferred revenue, current portion; other non-current liabilities; deferred revenue, net of current portion; and accumulated deficit.
3. | NET LOSS PER SHARE |
The following table presents the Company's basic and diluted net loss per share (in thousands, except per share amounts):
For the Years Ended December 31, | |||||||||||
2017 | 2016 | 2015 | |||||||||
Net loss | $ | (61,335 | ) | $ | (66,837 | ) | $ | (85,516 | ) | ||
Weighted-average shares of common stock outstanding | 57,262 | 55,595 | 54,171 | ||||||||
Net loss per share — basic and diluted | $ | (1.07 | ) | $ | (1.20 | ) | $ | (1.58 | ) | ||
At December 31, 2017, 2016 and 2015, the following potential shares were excluded from the computation of diluted net loss per share because their effect would have been anti-dilutive (in thousands):
December 31, | ||||||||
2017 | 2016 | 2015 | ||||||
Options to purchase common stock, restricted stock units and performance-based restricted stock units | 10,143 | 10,635 | 10,860 | |||||
Shares issuable pursuant to employee stock purchase plan | 114 | 89 | 77 | |||||
Convertible notes | 11,825 | 4,682 | 4,682 | |||||
Common stock warrants | 4,682 | 4,682 | 4,682 | |||||
Total shares excluded from net loss per share | 26,764 | 20,088 | 20,301 | |||||
Under the treasury stock method, the convertible notes and common stock warrants will have a dilutive impact on net earnings per share when the average stock price for the period exceeds the respective conversion prices and the Company has net income. The Company also entered into note hedge transactions (“Note Hedges”) in connection with the convertible notes with respect to its common stock to minimize the impact of potential economic dilution upon conversion of the convertible notes. The Note Hedges were outstanding as of December 31, 2017. Since the beneficial impact of the Note Hedges is anti-dilutive, they are excluded from the calculation of diluted net income (loss) per share. See Note 8 of the Notes to Consolidated Financial Statements.
76
4. INVESTMENTS
Investments in Marketable Securities
The Company’s investments in available-for-sale marketable securities are made pursuant to its investment policy, which has established guidelines relative to the diversification of the Company’s investments and their maturities, with the principal objective of capital preservation and maintaining liquidity that is sufficient to meet cash flow requirements.
The following is a summary of investments in marketable securities, including those that meet the definition of a cash equivalent, as of December 31, 2017 (in thousands):
December 31, 2017 | |||||||||||||||||||||||
Amortized Cost Basis | Unrealized Gains | Unrealized Losses | Fair Value | Cash Equivalent | Investments | ||||||||||||||||||
Money market funds | $ | 358,859 | $ | — | $ | — | $ | 358,859 | $ | 358,859 | $ | — | |||||||||||
Certificate of deposit | 10,000 | — | — | 10,000 | 10,000 | — | |||||||||||||||||
Corporate bonds | 74,868 | — | (220 | ) | 74,648 | — | 74,648 | ||||||||||||||||
U.S. treasury securities | 189,310 | — | (430 | ) | 188,880 | — | 188,880 | ||||||||||||||||
$ | 633,037 | $ | — | $ | (650 | ) | $ | 632,387 | $ | 368,859 | $ | 263,528 | |||||||||||
The following is a summary of investments in marketable securities, including those that meet the definition of a cash equivalent, as of December 31, 2016 (in thousands):
December 31, 2016 | |||||||||||||||||||||||
Amortized Cost Basis | Unrealized Gains | Unrealized Losses | Fair Value | Cash Equivalent | Investments | ||||||||||||||||||
Money market funds | $ | 48,136 | $ | — | $ | — | $ | 48,136 | $ | 48,136 | $ | — | |||||||||||
Corporate bonds | 60,725 | 1 | (50 | ) | 60,676 | — | 60,676 | ||||||||||||||||
Agency bonds | 28,954 | 2 | (26 | ) | 28,930 | — | 28,930 | ||||||||||||||||
U.S. treasury securities | 157,829 | 17 | (160 | ) | 157,686 | — | 157,686 | ||||||||||||||||
Commercial paper | 10,473 | — | — | 10,473 | — | 10,473 | |||||||||||||||||
$ | 306,117 | $ | 20 | $ | (236 | ) | $ | 305,901 | $ | 48,136 | $ | 257,765 | |||||||||||
As of December 31, 2017, the Company’s investment in corporate bonds, agency bonds and U.S. treasury securities had a weighted-average maturity date of approximately nine months. Unrealized gains and losses on investments were not significant, and the Company does not believe the unrealized losses represent other-than-temporary impairments as of December 31, 2017. No marketable securities held have been in a continuous unrealized loss position for more than 12 months as of December 31, 2017.
Strategic Investments
During the year ended December 31, 2017, the Company made $1.5 million in strategic investments. As of December 31, 2017, the Company had aggregate strategic investments of $3.0 million. During the year ended December 31, 2016, the Company made $0.6 million in strategic investments. As of December 31, 2016, the Company had aggregate strategic investments of $2.1 million. The Company accounted for each of these investments using the cost method of accounting, as the Company does not have significant influence or a controlling financial interest over these entities.
These investments are subject to periodic impairment reviews and are considered to be impaired when a decline in fair value is judged to be other-than-temporary. During the year ended December 31, 2017, the Company recognized $0.6 million of impairment losses recorded in Other, net in the accompanying Consolidated Statement of Operations. During the year ended December 31, 2016, the Company did not recognize any impairment losses.
77
5. GOODWILL AND INTANGIBLE ASSETS
Finite-lived Intangibles
The Company has finite-lived intangible assets, which are amortized over their estimated useful lives on a straight-line basis. The following table presents the gross carrying amount and accumulated amortization of finite-lived intangible assets as of December 31, 2017 and 2016 (in thousands):
December 31, 2017 | December 31, 2016 | ||||||||||||||||||||||
Gross Carrying Amount | Accumulated Amortization | Net Carrying Amount | Gross Carrying Amount | Accumulated Amortization | Net Carrying Amount | ||||||||||||||||||
Developed technology | $ | 29,984 | $ | (29,984 | ) | $ | — | $ | 29,984 | $ | (22,711 | ) | $ | 7,273 | |||||||||
Software license rights | 1,654 | (1,654 | ) | — | 1,654 | (1,506 | ) | 148 | |||||||||||||||
Total | $ | 31,638 | $ | (31,638 | ) | $ | — | $ | 31,638 | $ | (24,217 | ) | $ | 7,421 | |||||||||
Total amortization expense from finite-lived intangible assets was $7.4 million, $9.3 million and $10.6 million for the years ended December 31, 2017, 2016 and 2015, respectively. The amortization expense recognized was related to developed technology and software license rights and was recorded in cost of revenue except for $0.2 million and $0.6 million for the years ended December 31, 2016 and 2015, respectively, which was recorded in “Amortization of certain acquired intangible assets” in the accompanying Consolidated Statements of Operations.
The Company evaluates the recoverability of its long-lived assets with finite useful lives, including intangible assets, for impairment whenever events or changes in circumstances indicate that the carrying amounts may not be recoverable. There were no impairment charges related to identifiable intangible assets in the years ended December 31, 2017, 2016 and 2015.
Goodwill
There was no change in the carrying amount of goodwill for the years ended December 31, 2017 and 2016.
6. | OTHER BALANCE SHEET AMOUNTS |
The balance of property and equipment, net is as follows (in thousands):
Useful Life | December 31, | ||||||||
2017 | 2016 | ||||||||
Computer equipment and software | 3 – 5 years | $ | 38,838 | $ | 32,926 | ||||
Furniture and fixtures | 7 years | 3,855 | 3,837 | ||||||
Leasehold improvements | 2 – 6 years | 10,046 | 9,878 | ||||||
Renovation in progress | n/a | 58 | 58 | ||||||
52,797 | 46,699 | ||||||||
Less: accumulated depreciation and amortization | (31,980 | ) | (22,737 | ) | |||||
Total property and equipment, net | $ | 20,817 | $ | 23,962 | |||||
Depreciation expense for the years ended December 31, 2017, 2016 and 2015 was $10.3 million, $9.9 million, $7.6 million, respectively.
The balance of accrued expenses is as follows (in thousands):
December 31, | |||||||
2017 | 2016 | ||||||
Accrued bonuses | $ | 13,557 | $ | 13,371 | |||
Accrued commissions | 12,401 | 10,616 | |||||
Other accrued expenses | 31,570 | 23,632 | |||||
Total accrued expenses | $ | 57,528 | $ | 47,619 | |||
78
7. | FAIR VALUE OF FINANCIAL INSTRUMENTS |
Assets and liabilities measured at fair value on a recurring basis included the following as of December 31, 2017 and 2016 (in thousands):
December 31, 2017 | December 31, 2016 | ||||||||||||||||||||||||||||||
Fair Value | Level 1 | Level 2 | Level 3 | Fair Value | Level 1 | Level 2 | Level 3 | ||||||||||||||||||||||||
Cash equivalents | $ | 368,859 | $ | 358,859 | $ | 10,000 | $ | — | $ | 48,136 | $ | 48,136 | $ | — | $ | — | |||||||||||||||
Corporate bonds | 74,648 | — | 74,648 | — | 60,676 | — | 60,676 | — | |||||||||||||||||||||||
Agency bonds | — | — | — | — | 28,930 | — | 28,930 | — | |||||||||||||||||||||||
U.S. treasury securities | 188,880 | — | 188,880 | — | 157,686 | — | 157,686 | — | |||||||||||||||||||||||
Commercial paper | — | — | — | — | 10,473 | — | 10,473 | — | |||||||||||||||||||||||
$ | 632,387 | $ | 358,859 | $ | 273,528 | $ | — | $ | 305,901 | $ | 48,136 | $ | 257,765 | $ | — | ||||||||||||||||
At December 31, 2017 and 2016, cash equivalents of $358.9 million and $48.1 million, respectively, consisted of money market funds with original maturity dates of three months or less backed by U.S. Treasury bills. At December 31, 2017, cash equivalents of $10.0 million consisted of certificate of deposits with original maturity dates of three months or less.
As of December 31, 2017, corporate bonds, agency bonds, U.S. treasury securities and commercial paper were classified within Level 2 of the fair value hierarchy. The bonds were valued using information obtained from pricing services, which obtained quoted market prices from a variety of industry data providers, security master files from large financial institutions, and other third-party sources. The Company performed supplemental analysis to validate information obtained from its pricing services. As of December 31, 2017, no adjustments were made to such pricing information.
Convertible Notes
The Company’s convertible notes, including the 2018 Notes and the 2021 Notes described below, are shown in the accompanying Consolidated Balance Sheets at their original issuance value, net of unamortized discount and debt issuance costs, and are not remeasured to fair value each period. The approximate fair value of the Company’s convertible notes as of December 31, 2017 was $552.0 million. The fair value of the 2018 Notes was estimated on the basis of quoted market prices, which, due to limited trading activity, are considered Level 2 in the fair value hierarchy. The fair value of the 2021 Notes were estimated as the principal amount of the 2021 Notes, due to the lack of trading activity as of December 31, 2017.
8. | DEBT AND OTHER FINANCING ARRANGEMENTS |
2018 Convertible Notes
In 2013, the Company issued convertible notes (the “2018 Notes”) raising gross proceeds of $253.0 million.
The 2018 Notes are governed by an Indenture, dated June 17, 2013, between the Company and U.S. Bank National Association, as trustee (the “2013 Indenture”). The 2018 Notes mature on July 1, 2018, unless earlier repurchased or converted, and bear interest at a rate of 1.50% per year payable semi-annually in arrears on January 1 and July 1 of each year, commencing January 1, 2014.
The 2018 Notes are convertible at an initial conversion rate of 18.5046 shares of the Company’s common stock per $1,000 principal amount of the 2018 Notes, which represents an initial conversion price of approximately $54.04 per share, subject to adjustment for anti-dilutive issuances, voluntary increases in the conversion rate and make-whole adjustments upon a fundamental change. A fundamental change includes a change in control, delisting of the Company’s common stock and a liquidation of the Company. Upon conversion, the Company will deliver cash for the principal amount, and the Company has the right to settle any amounts in excess of the principal in cash or shares.
Prior to April 1, 2018, the 2018 Notes are only convertible upon satisfaction of certain conditions as follows:
• | during any calendar quarter after September 30, 2013, if the last reported sale price of common stock for at least 20 trading days (whether or not consecutive) during a period of 30 consecutive trading days ending on the last trading day of the immediately preceding calendar quarter is greater than or equal to 130% of the conversion price on each applicable trading day; |
79
• | during the five business day period after any five consecutive trading day period in which the trading price per $1,000 principal amount of the 2018 Notes for each trading day of that five consecutive trading day period was less than 98% of the product of the last reported sale price of common stock and the conversion rate on each such trading day; or |
• | upon the occurrence of specified corporate events as defined in the 2013 Indenture. |
Holders of the 2018 Notes may convert their 2018 Notes at any time on or after April 1, 2018, until the close of business on the second scheduled trading day immediately preceding the maturity date.
The holders of the 2018 Notes may require the Company to repurchase all or a portion of their 2018 Notes at a cash repurchase price equal to 100% of the principal amount of the 2018 Notes being repurchased, plus accrued and unpaid interest, upon a fundamental change and events of default, including non-payment of interest or principal and other obligations under the 2013 Indenture.
In accounting for the 2018 Notes at issuance, the Company separated the 2018 Notes into debt and equity components pursuant to the accounting standards for convertible debt instruments that may be fully or partially settled in cash upon conversion. The fair value of the debt component was estimated using an interest rate for nonconvertible debt, with terms similar to the 2018 Notes, excluding the conversion feature. The excess of the principal amount of the 2018 Notes over the fair value of the debt component was recorded as a debt discount and a corresponding increase in additional paid-in capital. The debt discount is accreted to interest expense over the term of the 2018 Notes using the interest method. The amount recorded to additional paid-in capital is not to be remeasured as long as it continues to meet the conditions for equity classification. Upon issuance of the $253.0 million of 2018 Notes, the Company recorded $214.3 million to debt and $38.7 million to additional paid-in capital for the debt discount.
The Company incurred transaction costs of approximately $7.3 million related to the issuance of the 2018 Notes. In accounting for these costs, the Company allocated the costs to the debt and equity components in proportion to the allocation of proceeds from the issuance of the 2018 Notes to such components. Transaction costs allocated to the debt component of $6.2 million are deferred and amortized to interest expense over the term of the 2018 Notes. The transaction costs allocated to the equity component of $1.1 million were recorded to additional paid-in capital.
2021 Senior Convertible Notes
In December 2017, the Company issued $300.0 million principal amount of 5.75% senior convertible notes (the “2021 Notes”) for a purchase price equal to 98% of the principal amount, raising net proceeds of $294.0 million.
The 2021 Notes are governed by an Indenture, dated December 8, 2017 between the Company and U.S. Bank National Association, as trustee (the “2017 Indenture”). The 2021 Notes mature on July 1, 2021, unless earlier repurchased or converted, and bear interest at a rate of 5.75% per year payable semi-annually in arrears on January 1 and July 1 of each year, commencing January 1, 2018.
The 2021 Notes are convertible at an initial conversion rate of 23.8095 shares of the Company’s common stock per $1,000 principal amount of the 2021 Notes, which represents an initial conversion price of $42.00 per share, subject to adjustment for anti-dilutive issuances, voluntary increases in the conversion rate and make-whole adjustments upon a fundamental change. A fundamental change includes a change in control, delisting of the Company’s common stock and a liquidation of the Company. Upon conversion, the Company will deliver the applicable number of the Company’s common stock and cash in lieu of any fractional shares. Holders of the 2021 Notes may convert their 2021 Notes at any time prior to the close of business on the scheduled trading day immediately preceding the maturity date, subject to a restricted period through December 2018.
The holders of the 2021 Notes may require the Company to repurchase all or a portion of their 2021 Notes at a cash repurchase price equal to 100% of the principal amount of the Notes being repurchased, plus the remaining scheduled interest through and including the maturity date, upon a fundamental change and events of default, including non-payment of interest or principal and other obligations under the 2017 Indenture.
The 2021 Notes were issued at a two percent discount and was accounted for as debt upon issuance. The Company recorded $300.0 million of debt and $6.0 million for the debt discount. The debt discount is accreted to interest expense over the term of the 2021 Notes using the interest method.
The Company incurred debt issuance costs of $9.1 million that were deferred and will be amortized to interest expense over the term of the 2021 Notes.
80
2018 Notes and 2021 Notes
The net carrying amounts of the liability components of the 2018 and 2021 Notes as of December 31, 2017 and 2016 consists of the following (in thousands):
December 31, 2017 | December 31, 2016 | ||||||
Principal amount | $ | 553,000 | $ | 253,000 | |||
Unamortized debt discount | (10,190 | ) | (12,550 | ) | |||
Net carrying amount before unamortized debt issuance costs | 542,810 | 240,450 | |||||
Unamortized debt issuance costs | (9,617 | ) | (2,015 | ) | |||
Net carrying value | $ | 533,193 | $ | 238,435 | |||
The effective interest rate of the liability component is 5.4% and 6.4% for the 2018 Notes and the 2021 Notes, respectively. The interest rate for the 2018 Notes was based on the interest rates of similar liabilities at the time of issuance that did not have associated convertible features.
The following table presents the interest expense recognized related to the 2018 Notes and the 2021 Notes for years ended December 31, 2017, 2016 and 2015 (in thousands):
Years Ended December 31, | |||||||||||
2017 | 2016 | 2015 | |||||||||
Contractual interest expense at 1.50% and 5.75% per annum | $ | 4,897 | $ | 3,795 | $ | 3,795 | |||||
Amortization of debt issuance costs | 1,472 | 1,263 | 1,202 | ||||||||
Accretion of debt discount | 8,360 | 7,867 | 7,489 | ||||||||
Total | $ | 14,729 | $ | 12,925 | $ | 12,486 | |||||
Net proceeds of approximately $246.0 million and $285.1 million from the 2018 Notes and the 2021 Notes, respectively, were received after payment of the initial purchasers’ offering expenses. The Company used approximately $49.5 million of the net proceeds of the 2018 Notes offering to pay the cost of the Note Hedges described below, which was partially offset by $23.2 million of the proceeds from the Company’s sale of the Warrants also described below.
Note Hedges
Concurrent with the 2018 Notes that were issued in 2013, the Company entered into note hedges (the “Note Hedges”) with certain bank counterparties, with respect to its common stock. The Company paid $49.5 million for the Note Hedges. The Note Hedges cover approximately 4.7 million shares of the Company’s common stock at a strike price of $54.04 per share, and are exercisable by the Company upon conversion of the 2018 Notes. The Note Hedges will expire upon the maturity of the 2018 Notes. The Note Hedges are intended to reduce the potential economic dilution upon conversion of the 2018 Notes in the event that the fair value per share of the Company’s common stock at the time of exercise is greater than the conversion price of the 2018 Notes.
Warrants
Separately and concurrently with the entry by the Company into the Note Hedges in 2013, the Company entered into warrant transactions, whereby it sold warrants to the same bank counterparties as the Note Hedges to acquire up to 4.7 million shares of the Company’s common stock at a strike price of $80.06 per share (the “Warrants”), subject to anti-dilution adjustments. The Company received proceeds of $23.2 million from the sale of the Warrants. The Warrants expire at various dates during 2018 and 2019. If the fair value per share of the Company’s common stock exceeds the strike price of the Warrants, the Warrants will reduce diluted earnings per share to the extent that the calculation does not have an anti-dilutive effect.
The amounts paid and received for the Note Hedges and the Warrants have been recorded in additional paid-in capital. The fair value of the Note Hedges and the Warrants are not remeasured through earnings each reporting period.
81
9. | STOCKHOLDERS’ EQUITY |
Capitalization
As of December 31, 2017, the Company’s authorized stock consists of 1,000,000,000 shares of common stock, par value of $0.0001 per share, and 50,000,000 shares of preferred stock, par value of $0.0001 per share. No shares of preferred stock were issued or outstanding at December 31, 2017 and 2016.
Share Repurchase Program
In November 2017, the Company’s board of directors authorized a $100.0 million share repurchase program of its common stock. The Company may repurchase its common stock for cash in the open market in accordance with applicable securities laws. The timing and amount of any stock repurchase will depend on share price, corporate and regulatory requirements, economic and market conditions, and other factors. The stock repurchase authorization will expire in November 2019 and shares repurchased will be immediately retired.
During the year ended December 31, 2017, the Company repurchased 0.6 million shares of its common stock at an average cost of $35.55 per share for a total expenditure of $22.6 million. At December 31, 2017, $77.4 million remained available under the share repurchase program.
10. | STOCK-BASED AWARDS |
1999 and 2009 Plans
In November 1999, the Company adopted the 1999 Stock Plan (“1999 Plan”) as amended. In January 2009, the Company adopted the 2009 Plan (“2009 Plan”) as amended. Stock options granted under the 1999 and 2009 Plans may be incentive stock options or non-statutory stock options. At December 31, 2017, no shares are issuable under the 1999 and 2009 Plans.
2010 Plan
In March 2011, upon the completion of the Company’s IPO, the Company adopted the 2010 Plan and determined that it will no longer grant any additional awards under the 1999 Plan and the 2009 Plan. However, the 1999 Plan and the 2009 Plan continue to govern the terms and conditions of the outstanding awards previously granted under each respective plan. Upon the adoption of the 2010 Plan, the maximum aggregate number of shares issuable thereunder was 3,680,480 shares, plus (i) any shares subject to stock options or similar awards granted under the 1999 Plan or 2009 Plan prior to March 16, 2011 that expire or otherwise terminate without having been exercised in full and (ii) shares issued pursuant to awards granted under the 1999 Plan and 2009 Plan that are forfeited to or repurchased by the Company after March 16, 2011, with the maximum number of shares to be added to the 2010 Plan from the 1999 Plan and 2009 Plan equal to 5,614,369 shares of common stock. In addition, the number of shares available for issuance under the 2010 Plan will be annually increased on the first day of each fiscal year beginning with 2012, by an amount equal to the lesser of 5,500,000 shares, 4.5% of the outstanding shares of the Company’s common stock as of the last day of the immediately preceding fiscal year, or such other amount as the Company’s Board of Directors determines.
Shares issued pursuant to awards under the 2010 Plan that are repurchased by the Company or that expire or are forfeited, as well as shares used to pay the exercise price of an award or to satisfy the minimum tax withholding obligations related to an award, will become available for future grant or sale under the 2010 Plan. In addition, to the extent that an award is paid out in cash rather than shares, such cash payment will not reduce the number of shares available for issuance under the 2010 Plan.
The 2010 Plan permits the grant of incentive stock options to employees and the grant of non-statutory stock options, restricted stock, restricted stock units, stock appreciation rights, performance units and performance shares to the Company’s employees, directors and consultants.
Under the 2010 Plan, 4,128,903 shares remained available for issuance, at December 31, 2017.
Stock Options
The exercise price of stock options granted under the 2010 Plan must equal at least the fair market value of the Company’s common stock on the date of grant. The term of an incentive stock option may not exceed ten years; provided, however, that an incentive stock option held by a participant who owns more than 10% of the total combined voting power of all classes of the Company’s stock, may not have a term in excess of five years and must have an exercise price of at least 110% of the fair market value of the Company’s common stock on the grant date.
82
Restricted Stock Units
The Company may also grant restricted stock units under the 2010 Plan. The fair value of each restricted stock unit granted is equal to the grant date fair market value of the Company’s common stock. The payment of restricted stock units may be in the form of cash, shares, or in a combination thereof, as determined by the Board of Directors. During 2017, the Company granted 1,937,900 restricted stock units under the 2010 Plan, containing service conditions.
Performance Units/Performance Shares
The Company may also grant performance units and performance shares under the 2010 Plan. Performance units and performance shares are awards that will result in a payment to a participant only if performance goals for a predetermined period, established by the Board of Directors, are achieved or the awards otherwise vest. The fair value of each performance unit and performance share awarded is equal to the grant date fair value of the Company’s common stock when the performance goals are defined solely by reference to the Company’s own operations. The fair value of each performance unit and performance award that contain performance goals tied to performance of the Company’s common stock is estimated using a Monte-Carlo simulation. The payment of performance units and performance shares may be in the form of cash, shares, or a combination thereof, as determined by the Board of Directors.
Employee Stock Purchase Plan
Under the Company’s 2010 Employee Stock Purchase Plan (“ESPP”) eligible employees are granted the right to purchase shares at the lower of 85% of the fair value of the stock at the time of grant or 85% of the fair value at the time of exercise. The right to purchase shares is granted twice yearly for six month offering periods in June and December and exercisable on or about the succeeding December and June, respectively, on each year. Under the ESPP, 3,045,181 shares remained available for issuance, at December 31, 2017. The Company recognized compensation expense related to the ESPP of $1.6 million, $1.4 million and $0.9 million for the years ended December 31, 2017, 2016 and 2015, respectively.
Stock Options
The Company has granted stock options, which vest upon meeting service conditions. The following table summarizes the stock option activity which contain only service conditions, under the Company’s 1999, 2009 and 2010 Plans (in thousands, except per share and term information):
Shares | Weighted Average Exercise Price | Weighted Average Remaining Contractual Term | Aggregate Intrinsic Value (1) | |||||||||
Outstanding, December 31, 2016 | 6,041 | $ | 32.01 | 6.2 | $ | 74,989 | ||||||
Granted | — | — | ||||||||||
Exercised | (413 | ) | 16.38 | |||||||||
Forfeited | (334 | ) | 35.71 | |||||||||
Outstanding, December 31, 2017 | 5,294 | 32.99 | 5.3 | 40,122 | ||||||||
83
Shares | Weighted- Average Exercise Price | Weighted- Average Remaining Contractual Term | Aggregate Intrinsic Value (1) | |||||||||
Exercisable at December 31, 2017 | 4,934 | $ | 32.60 | 5.2 | $ | 39,951 | ||||||
Vested and expected to vest at December 31, 2017 | 5,280 | 32.98 | 5.3 | 40,113 | ||||||||
(1) | Based on the Company’s closing stock price of $35.33 on December 31, 2017 and $42.31 on December 31, 2016. |
The following table summarizes information about stock options, which contain only service conditions, under the Company’s equity incentive plans at December 31, 2017 (in thousands except term information):
Options Outstanding at December 31, 2017 | Options Exercisable at December 31, 2017 | ||||||||
Number of Options | Weighted Average Remaining Contractual Term (in years) | Number of Options | Weighted Average Remaining Contractual Term (in years) | ||||||
Range of Exercise Prices | |||||||||
$0.34 to $1.65 | 92 | 1.9 | 92 | 1.9 | |||||
$5.93 to $8.88 | 677 | 2.9 | 677 | 2.9 | |||||
$12.54 to $15.41 | 132 | 3.7 | 132 | 3.7 | |||||
$16.24 to $18.82 | 305 | 4.0 | 305 | 4.0 | |||||
$20.85 to $23.94 | 552 | 4.4 | 552 | 4.4 | |||||
$27.55 to $31.44 | 207 | 5.6 | 193 | 5.5 | |||||
$31.64 to $36.15 | 835 | 6.8 | 633 | 6.6 | |||||
$38.03 to $45.76 | 1,093 | 6.1 | 1,036 | 6.0 | |||||
$46.20 to $56.05 | 1,401 | 6.1 | 1,314 | 6.1 | |||||
5,294 | 5.3 | 4,934 | 5.2 | ||||||
The total intrinsic value of options exercised during the years ended December 31, 2017, 2016 and 2015 was $9.2 million, $18.2 million and $11.4 million, respectively. The total grant date fair value of stock options vested during the years ended December 31, 2017, 2016 and 2015 was $15.4 million, $24.3 million and $32.3 million, respectively. The Company recognized compensation expense related to stock options of $14.0 million, $23.0 million and $28.0 million for the years ended December 31, 2017, 2016 and 2015, respectively.
Unrecognized compensation expense relating to stock options was $5.4 million at December 31, 2017 which is expected to be recognized over a weighted-average period of 1.0 years.
The aggregate grant date fair value of stock options granted for the years ended December 31, 2016 and 2015 was $1.8 million and $8.4 million, respectively.
Restricted Stock Units
Restricted stock unit activity for the year ended December 31, 2017 under the Company’s equity incentive plans is summarized as follows (shares in thousands):
Number of Shares | Weighted Average Grant Date Fair Value | |||||
Outstanding at December 31, 2016 | 3,254 | $ | 36.35 | |||
Granted | 1,938 | 37.99 | ||||
Forfeited | (367 | ) | 36.04 | |||
Vested | (1,035 | ) | 36.34 | |||
Outstanding at December 31, 2017 | 3,790 | $ | 37.22 | |||
84
The Company recognized compensation expense related to restricted stock units of $44.1 million, $31.9 million and $15.0 million for the years ended December 31, 2017, 2016 and 2015, respectively. Unrecognized compensation expense related to unissued shares of the Company’s common stock subject to unvested restricted stock units was $105.7 million at December 31, 2017, which is expected to be recognized as expense over the weighted-average period of 2.7 years.
Performance-Based Restricted Stock Units
In July 2014, the Compensation Committee of the Company’s Board of Directors (the “Compensation Committee”) approved the issuance of performance-based restricted stock units to an executive officer of the Company. The number of shares of the Company’s common stock issuable upon the vesting of this performance-based restricted stock award is based upon (a) the performance of the Company’s stock price relative to a certain independent market index and (b) the recipient continuing to provide service through the end of the three-year term of the award. Achievement of the target performance level would result in the issuance of 40,600 shares and achievement at the maximum performance level would result in the issuance of 60,900 shares. The Company used a Monte Carlo simulation to estimate the fair value of this award which factors in the probability of the award vesting. The grant date fair value of the award was $1.8 million, which was recognized ratably over the three-year term of the award. In July 2017, based on the performance of the Company’s stock price relative to a certain independent market index, the Company determined it had not achieved the required performance level, which resulted in none of the shares being issued.
In December 2014, the Compensation Committee approved the issuance of a special award of performance-based restricted stock units to certain executives of the Company. The number of shares of the Company’s common stock issuable upon the vesting of these performance-based restricted stock unit awards is based upon (a) the performance of the Company’s stock price relative to a certain independent market index, (b) the achievement of the Company’s revenue guidance for each of fiscal year 2015 and 2016 and (c) the recipient continuing to provide services to the Company through the end of the three-year term of the award. The Company finalizes its revenue guidance in February of each year, thus a grant date was established in February 2015 and February 2016 for each of the two tranches of the award related to that year’s revenue guidance. Each tranche is treated as a separate grant and recognized from the date the revenue guidance is determined over the remaining portion of the original three-year term of the award. Achievement of the target performance level would result in the issuance of 535,000 shares and achievement at the maximum performance level would result in the issuance of an aggregate of 1,070,000 shares.
The Company used a Monte Carlo simulation to estimate the fair value of each tranche of the awards for which a grant date has been established. The valuation factors in the probability of achieving the performance of the Company’s stock price relative to the market index. In the first quarter of 2015, the aggregate grant date fair value of the first half of the above awards was $9.9 million. As of December 31, 2017, the aggregate fair value of the first half of the awards was $4.8 million based on the Company’s performance in relation to the revenue guidance for fiscal year 2015. In the first quarter of 2016, the aggregate grant date fair value of the second half of the awards was $3.6 million. In the first quarter of 2017, the Compensation Committee provided clarification on the use of constant currency adjustments to the Company’s performance in relation to the revenue guidance for fiscal year 2016. As a result, during the year ended December 31, 2017, the Company determined that the aggregate fair value of the awards was $9.8 million, which was recognized over the remaining vesting period of the awards. In December 2017, based on the performance of the Company’s stock price relative to a certain independent market index, the Company determined it had not achieved the required performance level, which resulted in none of the shares being issued.
Beginning in 2016, the Compensation Committee designed an annual equity compensation structure to further align the compensation levels of certain executives to the performance of the Company through the issuance of performance-based restricted stock units. The number of shares of the Company’s common stock issuable upon the vesting of these performance-based restricted stock unit awards is based upon the Company meeting composite revenue and cash flow growth targets determined at the time of the grant. The total amount of compensation expense recognized is based on the number of shares that the Company determines are probable of vesting. The estimate will be made each reporting period and determined by the Company’s actual and projected revenue and cash flow performance and the compensation expense will be recognized over the vesting term of the awards.
85
The following table summarizes the Company’s issuances of awards under the new compensation award structure:
Grant Date | Performance Measures | Vesting Term | Performance Period | # of Shares at Target | # of Shares at Maximum | Grant Date Fair Value per share | ||||||||||
July 2016 | (a) the Company meeting certain revenue and cash flow targets through December 31, 2018 and (b) the recipient continuing to provide services to the Company through the end of June 2019 | Three years | Fiscal years 2016, 2017 and 2018 | 166,600 | 499,800 | $ | 38.67 | |||||||||
March 2017 | (a) the Company meeting certain revenue and cash flow targets through December 31, 2019 and (b) the recipient continuing to provide services to the Company through the end of March 2020 | Three years | Fiscal years 2017, 2018 and 2019 | 185,270 | 555,810 | $ | 41.73 | |||||||||
The Company recognized compensation expense related to all performance-based awards in the aggregate amount of $11.2 million, $2.6 million and $1.9 million for the years ended December 31, 2017, 2016 and 2015, respectively. There was no unrecognized compensation expense related to unvested performance-based restricted stock units at December 31, 2017.
Stock-Based Compensation
Stock-based compensation expense related to stock options, restricted stock units, the ESPP and performance-based restricted stock units is included in the following line items in the accompanying Consolidated Statements of Operations for the years ended December 31, 2017, 2016 and 2015 (in thousands):
Years Ended December 31, | |||||||||||
2017 | 2016 | 2015 | |||||||||
Cost of revenue | $ | 4,904 | $ | 4,732 | $ | 3,887 | |||||
Sales and marketing | 28,427 | 25,642 | 23,604 | ||||||||
Research and development | 9,630 | 7,586 | 6,010 | ||||||||
General and administrative | 22,869 | 16,739 | 9,580 | ||||||||
Total | $ | 65,830 | $ | 54,699 | $ | 43,081 | |||||
In certain instances the Company is responsible for payroll taxes related to stock options exercised or the underlying shares sold by its employees. The Company accrues its obligations at the time of the exercise of the stock options or the sale of the underlying shares.
11. | INCOME TAXES |
On December 22, 2017, the Tax Cuts and Jobs Act of 2017 (the “Tax Act”) was signed into law making significant changes to the Internal Revenue Code of 1986, as amended. Changes include, but are not limited to, a corporate tax rate decrease from 34% to 21% effective for tax years beginning after December 31, 2017, further limitation on deductibility of interest expense, the transition of U.S international taxation from a worldwide tax system to a territorial system, and a one-time transition tax on the mandatory deemed repatriation of cumulative foreign earnings as of December 31, 2017. Consistent with the guidance under ASC 740, we will record any impacts from enactment of the Tax Act in the fourth quarter of 2017 subject to Staff Accounting Bulletin (“SAB”) 118 which provides for a measurement period to complete the accounting for certain elements of the tax reform.
We have calculated our best estimate of the impact of the Tax Act in our year end income tax provision in accordance with our understanding of the Tax Act and guidance available as of the date of this filing. The Tax Act did not result in any material tax expense during fourth quarter of 2017, the period in which the legislation was enacted. The Company remeasured the net deferred tax assets and corresponding valuation allowance at the 21% rate. Further, the impact of the one-time transition tax on the mandatory deemed repatriation of foreign earnings was immaterial due to an aggregate foreign earnings deficit.
The changes included in the Tax Act are broad and complex. The final transition impacts of the Tax Act may differ from the above estimate, possibly materially, due to, among other things, changes in interpretations of the Tax Act, any legislative action to address questions that arise because of the Tax Act, any changes in accounting standards for income taxes or related interpretations in response to the Tax Act, or any updates or changes to estimates the company has utilized to calculate the transition impacts, including impacts from changes to current year earnings estimates and foreign exchange rates of foreign subsidiaries. The Securities Exchange Commission has issued rules that would allow for a measurement period of up to one year after the enactment date of the Tax Act to finalize the recording of the related tax impacts.
86
The components of the Company’s loss before provision (benefit) for income taxes are as follows (in thousands):
Years Ended December 31, | |||||||||||
2017 | 2016 | 2015 | |||||||||
United States | $ | (32,853 | ) | $ | (39,107 | ) | $ | (59,797 | ) | ||
Foreign | (26,736 | ) | (26,523 | ) | (24,538 | ) | |||||
Loss before provision for income taxes | $ | (59,589 | ) | $ | (65,630 | ) | $ | (84,335 | ) | ||
The components of the provision (benefit) for income taxes attributable to continuing operations are as follows (in thousands):
Years Ended December 31, | |||||||||||
2017 | 2016 | 2015 | |||||||||
Current income tax provision: | |||||||||||
Federal | $ | — | $ | — | $ | — | |||||
State | 114 | 105 | 147 | ||||||||
Foreign | 1,580 | 1,838 | 1,139 | ||||||||
Total current income tax provision | 1,694 | 1,943 | 1,286 | ||||||||
Deferred income tax benefit: | |||||||||||
Federal | — | — | — | ||||||||
State | — | — | — | ||||||||
Foreign | 52 | (736 | ) | (105 | ) | ||||||
Total deferred income tax benefit | 52 | (736 | ) | (105 | ) | ||||||
Total income tax provision (benefit) | $ | 1,746 | $ | 1,207 | $ | 1,181 | |||||
On a consolidated basis, the Company has incurred operating losses and has recorded a full valuation allowance against its United States, United Kingdom, New Zealand, Hong Kong and Brazil deferred tax assets for all periods to date and, accordingly, has not recorded a provision (benefit) for income taxes for any of the periods presented other than a provision (benefit) for certain foreign and state income taxes. Certain foreign subsidiaries and branches of the Company provide intercompany services and are compensated on a cost-plus basis, and therefore, have incurred liabilities for foreign income taxes in their respective jurisdictions.
The differences in the total provision for income taxes that would result from applying the 34% federal statutory rate to loss before provision for income taxes and the reported provision for income taxes are as follows (in thousands):
Years Ended December 31, | |||||||||||
2017 | 2016 | 2015 | |||||||||
U.S. Federal tax benefit at statutory rates | $ | (20,260 | ) | $ | (22,310 | ) | $ | (28,681 | ) | ||
State income taxes, net of federal tax benefit | (806 | ) | (855 | ) | (1,632 | ) | |||||
Foreign rate differential | 5,220 | 3,711 | 3,964 | ||||||||
Stock based compensation | 3,182 | 4,467 | 4,673 | ||||||||
Other permanent differences | (494 | ) | (750 | ) | (99 | ) | |||||
Deferred adjustments / U.S. rate change | 7,811 | — | — | ||||||||
Other | 262 | 1,494 | 536 | ||||||||
Valuation allowance | 6,831 | 15,450 | 22,420 | ||||||||
Total income tax (benefit) provision | $ | 1,746 | $ | 1,207 | $ | 1,181 | |||||
87
Major components of the Company’s deferred tax assets (liabilities) at December 31, 2017 and 2016 are as follows (in thousands):
December 31, | |||||||
2017 | 2016 | ||||||
Deferred tax assets: | |||||||
Accrued expenses | $ | 2,371 | $ | 3,037 | |||
Long-lived intangible assets and fixed assets — basis difference | 19,884 | 22,146 | |||||
Net operating loss carryforwards | 80,615 | 68,356 | |||||
Stock-based compensation | 16,886 | 19,515 | |||||
Deferred revenue | 2,739 | 4,060 | |||||
Convertible note hedge | 1,467 | 6,387 | |||||
Other | 2,721 | 2,276 | |||||
Total deferred tax assets | 126,683 | 125,777 | |||||
Valuation allowance | (118,606 | ) | (111,775 | ) | |||
Deferred tax assets, net of valuation allowance | 8,077 | 14,002 | |||||
Deferred tax liabilities: | |||||||
Prepaid expenses and deferred commissions | (5,672 | ) | (7,718 | ) | |||
Convertible note discount | (1,074 | ) | (4,721 | ) | |||
Other | (410 | ) | (591 | ) | |||
Total deferred tax liabilities | (7,156 | ) | (13,030 | ) | |||
Net deferred tax assets (liabilities) | $ | 921 | $ | 972 | |||
At December 31, 2017, the Company had federal, state and foreign net operating losses of approximately $250.7 million, $257.9 million and $86.0 million, respectively. The federal net operating loss carryforward will begin expiring in 2022, the state net operating loss carryforward began expiring in 2017, and the foreign net operating loss has an unlimited carryforward period. The Internal Revenue Code of 1986, as amended, imposes substantial restrictions on the utilization of net operating losses in the event of an “ownership change” of a corporation. Accordingly, a company’s ability to use net operating losses may be limited as prescribed under Internal Revenue Code Section 382 (“IRC Section 382”). Events which may cause limitations in the amount of the net operating losses that the Company may use in any one year include, but are not limited to, a cumulative ownership change of more than 50% over a three-year period. Due to the effects of historical equity issuances, the Company has determined that the future utilization of a portion of its net operating losses is limited annually pursuant to IRC Section 382. The Company has determined that none of its net operating losses will expire because of the annual limitation.
The Company has recorded a full valuation allowance against its otherwise recognizable United States, United Kingdom, New Zealand, Hong Kong and Brazil deferred income tax assets as of December 31, 2017. Management has determined, after evaluating all positive and negative historical and prospective evidence, that it is more likely than not that these assets will not be realized. The net increase to the valuation allowance of $6.8 million, $15.5 million and $22.4 million for the years ended December 31, 2017, 2016 and 2015, respectively, was primarily due to additional net operating losses generated by the Company.
We adopted ASU No. 2016-09 effective January 1, 2017. The ASU eliminates the requirement to delay the recognition of excess tax benefits until they reduce current taxes payable. However, as of January 1, 2017, the previously unrecognized excess tax benefits of $39.4 million had no impact on our accumulated deficit balance as the related U.S. deferred tax assets were fully offset by a valuation allowance. The adoption did not have any other material impacts on the Company’s provision for income taxes.
Deferred income taxes have not been provided on the undistributed earnings of the Company’s foreign subsidiaries because the Company’s practice and intent is to permanently reinvest these earnings. The cumulative amount of such undistributed earnings was $3.3 million and $4.0 million at December 31, 2017 and December 31, 2016, respectively. Any future distribution of these non-U.S. earnings may subject the Company to state income taxes, as adjusted for tax credits, and foreign withholding taxes that the Company estimates would be $0.1 million and $0.8 million at December 31, 2017 and 2016, respectively. We are also estimating that the transition tax on any undistributed earnings that existed as of December 31, 2017 will be zero.
88
A reconciliation of the beginning and ending amount of unrecognized tax benefits for the years ended December 31, 2017, 2016 and 2015 is as follows (in thousands):
Years Ended December 31, | |||||||||||
2017 | 2016 | 2015 | |||||||||
Balance at January 1 | $ | 276 | $ | 276 | $ | 276 | |||||
Additions for tax positions related to the current year | 995 | — | — | ||||||||
Balance at December 31 | $ | 1,271 | $ | 276 | $ | 276 | |||||
The provision for uncertain tax positions relates to business in territories outside of the United States.
The Company’s policy is to classify interest and penalties on uncertain tax positions as a component of tax expense. An insignificant amount of interest and penalties on unrecognized tax benefits were accrued during the 2017 tax year. The amount of accrued interest and penalties on unrecognized tax benefits was insignificant, as of December 31, 2017 and 2016. The Company does not expect the change in uncertain tax positions to have a material impact on its financial position, results of operations or liquidity. The recognition of previously unrecognized tax benefits on uncertain tax positions would result in a $1.3 million tax benefit. The Company believes it is reasonably possible that within the next twelve months we may resolve certain matters related to the years under examination, which may result in reductions of our unrecognized tax benefits and income tax expense of up to $1.1 million.
The Company is subject to United States federal income tax as well as to income tax in multiple state and foreign jurisdictions, including the United Kingdom. Federal income tax returns of the Company are subject to IRS examination for the 2014 through 2017 tax years. State income tax returns are subject to examination for the 2013 through 2017 tax years. Foreign income tax returns are subject to examination for the 2007 through 2017 tax years.
12. | RESTRUCTURING COSTS |
In December 2017, as part of the Company’s new strategic plan to accelerate revenue growth and increase operating margins, the Company approved a restructuring plan to reduce the headcount of the Company’s global service delivery team, as well as the headcount of some of its sales teams, representing a total workforce reduction of approximately six percent. In December 2017, the Company completed the sales team headcount reductions. The Company expects the service delivery headcount reductions to be primarily completed by March 2018. The restructuring is part of the Company’s renewed focus on recurring, or subscription-based, revenue growth and driving cost reductions to accelerate the growth of its operating margins and free cash flow.
89
During the year ended December 31, 2017, the Company recognized $1.5 million of restructuring costs, which was recorded in “Restructuring” in the accompanying Consolidated Statements of Operations. The restructuring costs consisted primarily of payroll-related costs, such as severance, outplacement costs and continuing healthcare coverage, associated with employee terminations. The Company expects to incur an additional cost of approximately $3.0 million in connection with the restructuring plan in the first quarter of 2018.
13. | SEGMENT AND GEOGRAPHIC INFORMATION |
The Company’s management has determined that the Company operates in one segment as it only reports financial information on an aggregate and consolidated basis to its chief executive officer, who is the chief operating decision maker. The Company presents its entity-wide information in the tables below.
The following table sets forth the Company’s sources of revenue (dollars in thousands):
At or For Year Ended December 31, | |||||||||||
2017 | 2016 | 2015 | |||||||||
Subscription revenue | $ | 396,764 | $ | 339,756 | $ | 270,093 | |||||
Percentage of subscription revenue to total revenue | 82.3 | % | 80.3 | % | 79.5 | % | |||||
Professional services revenue | $ | 85,221 | $ | 83,368 | $ | 69,558 | |||||
Percentage of professional services revenue to total revenue | 17.7 | % | 19.7 | % | 20.5 | % | |||||
$ | 481,985 | $ | 423,124 | $ | 339,651 | ||||||
Revenue by geographic region, which is generally based on the address of the Company’s clients as defined in their master subscription agreements, is set forth below (in thousands):
Years Ended December 31, | |||||||||||
2017 | 2016 | 2015 | |||||||||
Revenue | |||||||||||
United States | $ | 313,729 | $ | 284,657 | $ | 228,724 | |||||
United Kingdom | 25,701 | 27,571 | 30,104 | ||||||||
All other countries | 142,555 | 110,896 | 80,823 | ||||||||
Total revenue | $ | 481,985 | $ | 423,124 | $ | 339,651 | |||||
Property and equipment by region is set forth below (in thousands):
December 31, | ||||||||
2017 | 2016 | |||||||
Property and equipment, net | ||||||||
United States | $ | 16,468 | $ | 19,843 | ||||
United Kingdom | 3,378 | 2,985 | ||||||
All other countries | 971 | 1,134 | ||||||
Total property and equipment, net | $ | 20,817 | $ | 23,962 | ||||
14. | 401(K) SAVINGS PLAN |
The Company has a defined contribution savings plan (the “Plan”) under Section 401(k) of the Internal Revenue Code. The Plan covers substantially all employees who meet minimum age and service requirements and allows participants to defer a portion of their annual compensation on a pre-tax basis. Company contributions to the Plan may be made at the discretion of the Board of Directors. The Plan provides for a Company matching contribution in an amount equal to 50% of an employee’s contributions up to $2,400 per year, which vests fully after the fourth year of employment.
The Company incurred approximately $2.0 million, $1.9 million and $1.6 million of matching contribution expenses related to the Plan during the years ended December 31, 2017, 2016 and 2015, respectively.
90
15. | COMMITMENTS AND CONTINGENCIES |
Leases
The Company has various non-cancelable operating leases for its offices and its managed hosting facilities and services. These leases expire at various times through 2021. Certain lease agreements contain renewal options, rent abatement and escalation clauses. The Company recognizes rent expense on a straight-line basis over the lease term, commencing when the Company takes possession of the property. Certain of the Company’s office leases entitle the Company to receive a tenant allowance from the landlord. The Company records tenant allowances as a deferred rent credit, which the Company amortizes on a straight-line basis, as a reduction of rent expense, over the term of the underlying lease. Total rent expense under operating leases was approximately $8.0 million, $7.8 million and $6.7 million for the years ended December 31, 2017, 2016 and 2015, respectively.
Future minimum lease payments under non-cancelable operating leases at December 31, 2017 are as follows (in thousands):
Operating Leases | |||
2018 | $ | 8,246 | |
2019 | 826 | ||
2020 | 84 | ||
2021 | 73 | ||
2022 | — | ||
Total minimum lease payments | $ | 9,229 | |
Letters of Credit
During 2015, the Company amended a standby letter of credit in association with its building lease. In addition, the Company maintains standby letters of credit in association with other contractual arrangements. Total letters of credit outstanding at December 31, 2017 was $1.4 million.
Other Commitments
As of December 31, 2017, the Company had agreements with various third-party service providers whereby the Company has committed to assign certain dollar amounts or hours of professional service projects related to implementation and other services for clients of the Company’s human capital management platform. In aggregate, these estimated commitments total approximately $12.0 million in 2018, $6.5 million in 2019 and $0.7 million in 2020.
As of December 31, 2017, the Company had software subscription agreements with various service providers with obligations of approximately $8.4 million in 2018, $5.3 million in 2019 and $0.5 million in 2020.
As of December 31, 2017, the Company had a sponsorship agreement with a professional sports franchise with obligations of approximately $0.7 million in 2018 and $0.7 million in 2019.
Guarantees and Indemnifications
The Company has made guarantees and indemnities under which it may be required to make payments to a guaranteed or indemnified party, in relation to certain transactions, including revenue transactions in the ordinary course of business. The Company is obligated to indemnify its directors and officers to the maximum extent permitted under the laws of the State of Delaware. However, the Company has a directors and officers insurance policy that may reduce its exposure in certain circumstances and may enable it to recover a portion of future amounts that may be payable, if any. The duration of the guarantees and indemnities varies and, in many cases, is indefinite but subject to statutes of limitations. To date, the Company has made no payments related to these guarantees and indemnities. The Company estimates the fair value of its indemnification obligations as insignificant based on this history and the Company’s insurance coverage and therefore has not recorded any liability for these guarantees and indemnities in the accompanying consolidated balance sheets.
91
Litigation
During 2017, a patent infringement claim was filed against the Company. This claim has subsequently been dismissed and did not have a material adverse effect on the Company’s business, operating results, cash flows or financial condition.
The Company is subject to various legal proceedings and claims that arise in the ordinary course of business. If the Company determines that it is probable that a loss has been incurred and the amount is reasonably estimable, the Company will record a liability. The Company has determined that it does not have a potential liability related to any legal proceedings or claims that would individually or in the aggregate materially adversely affect its financial condition or operating results.
Taxes
From time to time, various federal, state and other jurisdictional tax authorities undertake review of the Company and its filings. In evaluating the exposure associated with various tax filing positions, the Company accrues charges for possible exposures. The Company believes any adjustments that may ultimately be required as a result of any of these reviews will not be material to its consolidated financial statements.
16. | RELATED PARTY TRANSACTIONS |
The Cornerstone OnDemand Foundation (the “Foundation”) empowers communities in the United States and internationally by increasing the impact of the non-profit sector through the utilization of human capital management technology including the Company’s products. The Company’s chief executive officer is on the board of directors of the Foundation. The Company does not direct the Foundation’s activities, and accordingly, the Company does not consolidate the Foundation’s statement of activities with its financial results. During the years ended December 31, 2017, 2016 and 2015, the Company provided at no charge certain resources to the Foundation, with approximate values of $3.4 million, $3.3 million and $2.9 million, respectively.
An executive of the Company has an ownership interest in The Corner restaurant (the “Corner”). The Company does not direct the Corner’s activities, and accordingly, the Company does not consolidate the Corner’s statement of activities with its financial results. During the year ended December 31, 2017, the Company recorded $0.3 million in expenses related to the use of the restaurant.
During June 2010, an executive officer of an accounting software company joined the Company’s board of directors and resigned in September 2016. For the years ended December 31, 2016 and 2015, the Company recorded $0.7 million and $0.6 million, respectively, in expenses related to the use of the accounting software from the company whose executive officer served on the Company’s Board of Directors during those years.
During May 2017, an executive officer of a cyber security company joined the Company’s board of directors. For the year ended December 31, 2017, the Company recorded $0.7 million, in expenses related to the products and services provided by the cyber security company. Additionally, for the year ended December 31, 2017, the Company recognized revenue of $0.3 million related to the cyber security company’s subscription to our products.
17. | SUBSEQUENT EVENTS |
During January 2018, shares issuable under the Company’s 2010 Employee Stock Purchase Plan increased by 575,119 shares and shares issuable under the Company’s 2010 Plan increased by 2,588,036 shares in accordance with the automatic annual increase provisions of such plans.
During January and February 2018, the Company entered into software subscription agreements with various service providers with obligations of approximately $3.1 million in 2018, $3.1 million in 2019 and $3.1 million in 2020.
During January and February 2018, the Compensation Committee granted restricted stock units covering an aggregate of 64,635 shares of the Company’s common stock which generally vest annually over four years.
Subsequent to December 31, 2017 and as of February 9, 2018, the Company repurchased 0.3 million shares of its common stock at an average cost of $37.03 per share for a total expenditure of $9.9 million.
92
18. | SELECTED QUARTERLY DATA (UNAUDITED) |
The following unaudited quarterly consolidated statements of operations for each of the quarters in the years ended December 31, 2017 and 2016 have been prepared on a basis consistent with the Company’s audited annual financial statements and include, in the opinion of management, all normal recurring adjustments necessary for the fair statement of the financial information contained in these statements.
Quarter Ended | |||||||||||||||||||||||||||||||
(in thousands, except per share data) | |||||||||||||||||||||||||||||||
Mar. 31, 2016 | June 30, 2016 | Sept. 30, 2016 | Dec. 31, 2016 | Mar. 31, 2017 | June 30, 2017 | Sept. 30, 2017 | Dec. 31, 2017 | ||||||||||||||||||||||||
Revenue | $ | 99,324 | $ | 107,013 | $ | 107,758 | $ | 109,029 | $ | 111,582 | $ | 116,651 | $ | 121,796 | $ | 131,956 | |||||||||||||||
Cost of revenue | 31,650 | 35,955 | 33,369 | 34,778 | 33,949 | 35,321 | 35,708 | 37,889 | |||||||||||||||||||||||
Gross profit | 67,674 | 71,058 | 74,389 | 74,251 | 77,633 | 81,330 | 86,088 | 94,067 | |||||||||||||||||||||||
Operating expenses: | |||||||||||||||||||||||||||||||
Sales and marketing | 56,701 | 57,835 | 53,690 | 57,405 | 56,894 | 62,073 | 60,554 | 60,750 | |||||||||||||||||||||||
Research and development | 11,015 | 11,782 | 12,130 | 12,050 | 13,411 | 14,684 | 16,389 | 17,491 | |||||||||||||||||||||||
General and administrative | 16,465 | 16,538 | 18,608 | 19,345 | 20,476 | 23,141 | 21,249 | 19,723 | |||||||||||||||||||||||
Restructuring | — | — | — | — | — | — | — | 1,539 | |||||||||||||||||||||||
Amortization of certain acquired intangible assets | 150 | — | — | — | — | — | — | — | |||||||||||||||||||||||
Total operating expenses | 84,331 | 86,155 | 84,428 | 88,800 | 90,781 | 99,898 | 98,192 | 99,503 | |||||||||||||||||||||||
Loss from operations | (16,657 | ) | (15,097 | ) | (10,039 | ) | (14,549 | ) | (13,148 | ) | (18,568 | ) | (12,104 | ) | (5,436 | ) | |||||||||||||||
Other income (expense): | |||||||||||||||||||||||||||||||
Interest income (expense) and other income (expense), net | (1,051 | ) | (2,350 | ) | (2,131 | ) | (3,756 | ) | (2,492 | ) | (2,333 | ) | (2,248 | ) | (3,260 | ) | |||||||||||||||
Loss before income tax provision | (17,708 | ) | (17,447 | ) | (12,170 | ) | (18,305 | ) | (15,640 | ) | (20,901 | ) | (14,352 | ) | (8,696 | ) | |||||||||||||||
Income tax provision | (535 | ) | (141 | ) | (218 | ) | (313 | ) | (571 | ) | (364 | ) | (503 | ) | (308 | ) | |||||||||||||||
Net loss | $ | (18,243 | ) | $ | (17,588 | ) | $ | (12,388 | ) | $ | (18,618 | ) | $ | (16,211 | ) | $ | (21,265 | ) | $ | (14,855 | ) | $ | (9,004 | ) | |||||||
Net loss per share, basic and diluted | $ | (0.33 | ) | $ | (0.32 | ) | $ | (0.22 | ) | $ | (0.33 | ) | $ | (0.29 | ) | $ | (0.37 | ) | $ | (0.26 | ) | $ | (0.16 | ) | |||||||
Weighted average common shares outstanding, basic and diluted | 54,827 | 55,278 | 55,964 | 56,300 | 56,642 | 56,935 | 57,627 | 57,826 | |||||||||||||||||||||||
Item 9. | Changes in and Disagreements with Accountants on Accounting and Financial Disclosure |
None.
93
Item 9A. | Controls and Procedures |
(a) Evaluation of Disclosure Controls and Procedures
The term “disclosure controls and procedures,” as defined in Rules 13a-15(e) and 15d-15(e) under the Securities Exchange Act of 1934, as amended (the “Exchange Act”), refers to controls and procedures that are designed to ensure that information required to be disclosed by a company in the reports that it files or submits under the Exchange Act is recorded, processed, summarized and reported, within the time periods specified in the SEC’s rules and forms. Disclosure controls and procedures include, without limitation, controls and procedures designed to ensure that such information is accumulated and communicated to a company’s management, including its principal executive and principal financial officers, as appropriate to allow timely decisions regarding required disclosure.
Our management, with the participation of our chief executive officer and chief financial officer, has evaluated the effectiveness of our disclosure controls and procedures as of December 31, 2017, the end of the period covered by this Annual Report on Form 10-K. Based upon such evaluation, our chief executive officer and chief financial officer have concluded that our disclosure controls and procedures were effective as of such date.
(b) Management’s Report on Internal Control over Financial Reporting
Our management is responsible for establishing and maintaining adequate internal control over financial reporting as defined in Rules 13a-15(f) and 15d-15(f) under the Exchange Act. Our internal control over financial reporting is a process designed to provide reasonable assurance regarding the reliability of financial reporting and the preparation of our consolidated financial statements for external purposes in accordance with generally accepted accounting principles. Our internal control over financial reporting includes those policies and procedures that:
• | pertain to the maintenance of records that, in reasonable detail, accurately and fairly reflect the transactions and dispositions of our assets; |
• | provide reasonable assurance that transactions are recorded as necessary to permit preparation of our consolidated financial statements in accordance with generally accepted accounting principles, and that receipts and expenditures are being made only in accordance with authorizations of our management and board of directors; and |
• | provide reasonable assurance regarding prevention or timely detection of any unauthorized acquisition, use or disposition of our assets that could have a material effect on our consolidated financial statements. |
Because of its inherent limitations, internal control over financial reporting may not prevent or detect financial statement misstatements. Also, projections of any evaluation of internal control effectiveness to future periods are subject to the risk that controls may become inadequate because of changes in conditions, or that the degree of compliance with the policies or procedures may deteriorate.
Our management, with the participation of our chief executive officer and chief financial officer, has assessed the effectiveness of our internal control over financial reporting as of December 31, 2017. In making this assessment, management used the criteria set forth by the Committee of Sponsoring Organizations of the Treadway Commission (“COSO”) in Internal Control-Integrated Framework (2013). Based on this assessment, our management has concluded that our internal control over financial reporting was effective as of December 31, 2017.
The effectiveness of our internal control over financial reporting as of December 31, 2017 has been audited by PricewaterhouseCoopers LLP, an independent registered public accounting firm, as stated in its report, which appears in Item 8 of this Annual Report on Form 10-K.
(c) Changes in Internal Control over Financial Reporting
There was no change in our internal control over financial reporting that occurred during the quarter ended December 31, 2017 that has materially affected, or is reasonably likely to materially affect, our internal control over financial reporting.
94
Item 9B. | Other Information |
Carter Transition Agreement
In connection with Dave Carter’s resignation as the Company’s Chief Sales Officer, effective as of March 31, 2018, Mr. Carter entered into a transition agreement (the “Carter Transition Agreement”) with the Company, dated February 27, 2018, pursuant to which Mr. Carter released all claims he may have against the Company and affirmed his obligations regarding confidential information as stated in his confidentiality agreement with the Company.
The Carter Transition Agreement provides that through Mr. Carter’s actual termination of employment with the Company, which is expected to occur on or around March 31, 2018, he will continue to be employed pursuant to the current terms of his employment, as amended by the Carter Transition Agreement. If Mr. Carter remains employed with the Company through March 31, 2018, or, if prior to that date his employment with the Company is terminated for reasons other than for “cause”, then, subject to Mr. Carter executing and not revoking a supplemental separation agreement, he will receive the following benefits, which include those set forth in his preexisting Change of Control Severance Agreement: (i) a lump-sum payment equal to $335,000, less applicable withholding taxes, (ii) reimbursement for up to twelve months of COBRA premiums, (iii) twelve-months of accelerated vesting of all outstanding time-based equity awards, and (iv) the ability to exercise any vested stock options through the earlier of the maximum expiration date and March 31, 2020.
The foregoing description of the Carter Transition Agreement is qualified in its entirety by reference to the full text of the Carter Transition Agreement, which is filed as an exhibit to this Annual Report on Form 10-K.
Helvey Transition Agreement
In connection with Kirsten Helvey’s resignation as the Company’s Chief Operating Officer, effective as of March 31, 2018, Ms. Helvey entered into a transition agreement (the “Helvey Transition Agreement”) with the Company, dated February 27, 2018, pursuant to which Ms. Helvey released all claims she may have against the Company and affirmed her obligations regarding confidential information as stated in her confidentiality agreement with the Company.
The Helvey Transition Agreement provides that through Ms. Helvey’s actual termination of employment with the Company, which is expected to occur on or around March 31, 2018, she will continue to be employed pursuant to the current terms of her employment, as amended by the Helvey Transition Agreement. If Ms. Helvey remains employed with the Company through March 31, 2018, or, if prior to that date her employment with the Company is terminated for reasons other than for “cause”, then, subject to Ms. Helvey executing and not revoking a supplemental separation agreement, she will receive the following benefits, which include those set forth in her preexisting Change of Control Severance Agreement: (i) a lump-sum payment equal to $350,000, less applicable withholding taxes, (ii) reimbursement for up to twelve months of COBRA premiums, (iii) twelve-months of accelerated vesting of all outstanding time-based equity awards, (iv) the ability to exercise any vested stock options through the earlier of the maximum expiration date and March 31, 2020, and (v) reimbursement of up to $10,000 for expenses relating to executive coaching. In order to ensure a smooth transition, Ms. Helvey may render transitional services as a consultant to the Company after her resignation.
The foregoing description of the Helvey Transition Agreement is qualified in its entirety by reference to the full text of the Helvey Transition Agreement, which is filed as an exhibit to this Annual Report on Form 10-K.
PART III
Item 10. | Directors, Executive Officers and Corporate Governance |
The information required by this item will be included in our Proxy Statement for the 2018 Annual Meeting of Stockholders to be filed with the SEC within 120 days of the fiscal year ended December 31, 2017, and is incorporated herein by reference.
Item 11. | Executive Compensation |
The information required by this item will be included in our Proxy Statement for the 2018 Annual Meeting of Stockholders to be filed with the SEC within 120 days of the fiscal year ended December 31, 2017, and is incorporated herein by reference.
95
Item 12. | Security Ownership of Certain Beneficial Owners and Management and Related Stockholder Matters |
The information required by this item will be included in our Proxy Statement for the 2018 Annual Meeting of Stockholders to be filed with the SEC within 120 days of the fiscal year ended December 31, 2017, and is incorporated herein by reference.
Item 13. | Certain Relationships and Related Transactions, and Director Independence |
The information required by this item will be included in our Proxy Statement for the 2018 Annual Meeting of Stockholders to be filed with the SEC within 120 days of the fiscal year ended December 31, 2017, and is incorporated herein by reference.
Item 14. | Principal Accounting Fees and Services |
The information required by this item will be included in our Proxy Statement for the 2018 Annual Meeting of Stockholders to be filed with the SEC within 120 days of the fiscal year ended December 31, 2017, and is incorporated herein by reference.
With the exception of the information incorporated in Items 10, 11, 12, 13 and 14 of this Annual Report on Form 10-K, our Proxy Statement for the 2018 Annual Meeting of Stockholders to be filed with the SEC within 120 days of the fiscal year ended December 31, 2017 is not deemed “filed” as part of this Annual Report on Form 10-K.
PART IV
96
Item 15. | Exhibits and Financial Statement Schedules |
Documents filed as part of this report are as follows:
1. | Consolidated Financial Statements: |
Our Consolidated Financial Statements are listed in the “Index to Consolidated Financial Statements” under Item 8 of this Annual Report on Form 10-K.
2. | Financial Statement Schedules: |
Financial Statement Schedules have been omitted as information required is inapplicable or the information is presented in the consolidated financial statements and the related notes.
3. | Exhibits: |
The documents listed in the Exhibit Index immediately below are incorporated by reference or are filed with this Annual Report on Form 10-K, in each case as indicted therein (numbered in accordance with Item 601 of Regulation S-K).
Exhibit Index
Exhibit Description | Incorporated by Reference | |||||||
Exhibit Number | Form | File No. | Exhibit | Filing Date | ||||
S-1/A | 333-169621 | 3.2 | November 9, 2010 | |||||
S-1/A | 333-169621 | 3.4 | November 9, 2010 | |||||
8-K | 001-35098 | 4.1 | June 17, 2013 | |||||
8-K | 001-35098 | 4.1 | December 8, 2017 | |||||
S-1/A | 333-169621 | 10.1 | December 17, 2010 | |||||
S-1 | 333-169621 | 10.2 | September 29, 2010 | |||||
S-1 | 333-169621 | 10.3 | September 29, 2010 | |||||
S-1/A | 333-169621 | 10.3A | December 17, 2010 | |||||
S-1/A | 333-169621 | 10.4 | December 17, 2010 | |||||
S-1/A | 333-169621 | 10.5 | December 17, 2010 | |||||
S-1/A | 333-169621 | 10.6 | November 9, 2010 | |||||
S-1 | 333-169621 | 10.11 | September 29, 2010 | |||||
10-Q | 001-35098 | 10.1 | August 5, 2016 | |||||
S-1/A | 333-169621 | 10.9 | November 9, 2010 | |||||
97
Exhibit Description | Incorporated by Reference | |||||||
Exhibit Number | Form | File No. | Exhibit | Filing Date | ||||
10-Q | 001-35098 | 10.1 | August 7, 2014 | |||||
10-Q | 001-35098 | 10.1 | May 8, 2015 | |||||
10-Q | 001-35098 | 10.1 | May 6, 2016 | |||||
10-Q | 001-35098 | 10.1 | May 5, 2017 | |||||
S-1/A | 333-169621 | 10.10 | February 11, 2011 | |||||
10-Q | 001-35098 | 10.2 | August 7, 2014 | |||||
10-Q | 001-35098 | 10.2 | May 8, 2015 | |||||
10-Q | 001-35098 | 10.2 | May 6, 2016 | |||||
10-Q | 001-35098 | 10.2 | May 5, 2017 | |||||
10-Q | 001-35098 | 10.4 | August 7, 2013 | |||||
8-K | 001-35098 | n/a | March 18, 2016 | |||||
8-K | 001-35098 | n/a | March 5, 2017 | |||||
S-1 | 333-169621 | 10.17 | September 29, 2010 | |||||
S-1 | 333-169621 | 10.18 | September 29, 2010 | |||||
10-K | 001-35098 | 10.16 | March 6, 2012 | |||||
10-Q | 001-35098 | 10.1 | May 9, 2013 | |||||
10-Q | 001-35098 | 10.2 | May 9, 2013 | |||||
98
Exhibit Description | Incorporated by Reference | |||||||
Exhibit Number | Form | File No. | Exhibit | Filing Date | ||||
101.SCH | XBRL Taxonomy Extension Schema Document | |||||||
* | Indicates a management contract or compensatory plan or arrangement. |
† | The certifications attached as Exhibit 32.1 and 32.2 that accompany this Annual Report on Form 10-K, are not deemed filed with the Securities and Exchange Commission and are not to be incorporated by reference into any filing of Cornerstone OnDemand, Inc. under the Securities Act of 1933, as amended, or the Securities Exchange Act of 1934, as amended, whether made before or after the date of this Annual Report on Form 10-K, irrespective of any general incorporation language contained in such filing. |
99
Item 16. | Form 10-K Summary |
None.
100
SIGNATURES
Pursuant to the requirements of Section 13 or 15(d) of the Securities Exchange Act of 1934, the Registrant has duly caused this Annual Report on Form 10-K to be signed on its behalf by the undersigned, thereunto duly authorized, on February 27, 2018.
CORNERSTONE ONDEMAND, INC. | ||
By: | /s/ Adam L. Miller | |
Name: | Adam L. Miller | |
Title: | President and Chief Executive Officer | |
POWER OF ATTORNEY
KNOW ALL PERSONS BY THESE PRESENTS, that each person whose signature appears below constitutes and appoints Adam L. Miller and Brian L. Swartz, jointly and severally, his attorney-in-fact, with the power of substitution, for him in any and all capacities, to sign any amendments to this Annual Report on Form 10-K and to file the same, with exhibits thereto and other documents in connection therewith, with the Securities and Exchange Commission, hereby ratifying and confirming all that each of said attorneys-in-fact, or his substitute or substitutes, may do or cause to be done by virtue hereof.
Pursuant to the requirements of the Securities Exchange Act of 1934, this report has been signed below by the following persons on behalf of the Company and in the capacities and on the dates indicated:
Signature | Title | Date | |
/s/ Adam L. Miller | President, Chief Executive Officer and Director (principal executive officer) | February 27, 2018 | |
Adam L. Miller | |||
/s/ Brian L. Swartz | Chief Financial Officer (principal financial and accounting officer) | February 27, 2018 | |
Brian L. Swartz | |||
/s/ R.C. Mark Baker | Director | February 27, 2018 | |
R.C. Mark Baker | |||
/s/ Harold W. Burlingame | Director | February 27, 2018 | |
Harold W. Burlingame | |||
/s/ Dean Carter | Director | February 27, 2018 | |
Dean Carter | |||
/s/ Robert Cavanaugh | Director | February 27, 2018 | |
Robert Cavanaugh | |||
101
Signature | Title | Date | |
/s/ Joseph Osnoss | Director | February 27, 2018 | |
Joseph Osnoss | |||
/s/ Joseph P. Payne | Director | February 27, 2018 | |
Joseph P. Payne | |||
/s/ Kristina Salen | Director | February 27, 2018 | |
Kristina Salen | |||
/s/ Steffan Tomlinson | Director | February 27, 2018 | |
Steffan Tomlinson | |||
102