Attached files
| file | filename |
|---|---|
| EX-99.3 - EX-99.3 - SendGrid, Inc. | a18-7047_1ex99d3.htm |
| EX-99.1 - EX-99.1 - SendGrid, Inc. | a18-7047_1ex99d1.htm |
| 8-K - 8-K - SendGrid, Inc. | a18-7047_18k.htm |

Legal Information This presentation and any discussion relating to it contain “forward-looking” statements that are based on SendGrid management’s beliefs and assumptions and on information currently available to management. Forward-looking statements include, but are not limited to, statements about SendGrid’s outlook for the quarter ending March 31, 2018 and the full year ending December 31, 2018. Forward-looking statements involve known and unknown risks, uncertainties and other factors that may cause our actual results, performance or achievements to be materially different from any future results, performance or achievements expressed or implied by the forward-looking statements. Risks that could cause actual results to differ materially from forecasted results are included in SendGrid’s filings with the SEC. Except as required by law, SendGrid assumes no obligation to update these forward-looking statements, or to update the reasons if actual results differ materially from those anticipated in the forward-looking statements. To supplement its consolidated financial statements, which are prepared and presented in accordance with GAAP, SendGrid uses certain non-GAAP financial measures to understand and evaluate its core operating performance. These non-GAAP financial measures, which may be different than similarly titled measures used by other companies, are presented to enhance investors’ overall understanding of SendGrid’s financial performance and should not be considered a substitute for, or superior to, the financial information prepared and presented in accordance with GAAP. Investors are encouraged to review the reconciliation below of these non-GAAP measures to their most directly comparable GAAP financial measures. SendGrid believes that these non-GAAP financial measures provide useful information about its financial performance, enhance the overall understanding of its past performance and future prospects, and allow for greater transparency with respect to important metrics used by SendGrid management for financial and operational decision-making. 2

Q4 2017 Highlights Revenue of $31.7M, up 38% compared with $23.1M in Q4-16 Gross margin of 74.3%, down 140 BPS compared with Q4-16 GAAP Net Loss of $(1.5)M compared with a loss of $(0.4)M in Q4-16 Non-GAAP Adjusted Net Income (ANI) of $2.2M, a $1.8M year-over-year improvement Net Cash Flows from Operating Activities of $2.5M, and non-GAAP Free Cash Flow of $0.1M, up $1.4M compared with $(1.3)M of Free Cash Flow in Q4-16 Grew email volume to 132 billion transactions in the quarter, including first day ever delivering more than 2 billion transactions (Cyber Monday) Subscription Net Dollar Retention Rate (NDR) of 116%, up 200 BPS compared with Q4-16 3
Full-year 2017 Highlights Full-year revenue of $111.9M, up 40% compared with $79.9M in 2016 Gross margin of 73.6%, up 60 BPS compared with full-year 2016 GAAP Net Loss of $(6.3)M compared with $(3.9)M for 2016 Non-GAAP Adjusted Net Income (ANI) of $3.4M, first positive full year, up $4.8M versus 2016 Net Cash Flows from Operating Activities of $12.7M, and Free Cash Flow of $0.4M, first positive full year, and up $2.8M versus 2016 Grew email volume by 35% to 457 billion, with a daily average of 1.25 billion emails Total customers of 63,600, up 39% compared with 45,900 at 2016 year end Subscription Net Dollar Retention Rate (NDR) of 117%, up 600 BPS compared with 2016 4
Fourth Quarter Revenue Grew 38% YoY 5
Annual Gross Margins Improved 60 bps YoY 6
We Delivered our Sixth Consecutive Quarter of Profitability on an Adjusted Net Income basis 7 NOTE: See appendix for definition of Adjusted Net Income (ANI).
We Added 39% More Customers in 2017 8
Email Volume Increased 38% in 2017 9
Our Subscription NDR Rate Remains Strong 10 NOTE: Subscription Net Dollar Retention Rate is calculated as the increase in subscription revenue contributed in the current period from customers that also contributed subscription revenue in the prior year period, and dividing the difference by the prior period amount.
Q1-18 and FY-2018 Outlook Metric Q1-2018 FY-2018 Revenue ($M) $31.9-$32.1 $139-$141 Midpoint Revenue Growth Rate 29% 25% Adj. Net Income (ANI) ($M) Break-even* $2.0-$4.0 Stock Compensation ($M) $2.2-$2.4 N/A 11 * NOTE: Not included in the Q1-18 outlook is approximately $2.0M-$2.5M of stock compensation expense, approximately $100,000 of amortization of intangible assets, and less than $100,000 of restructuring and M&A-related expense. A reconciliation of non-GAAP adjusted net income to the most directly comparable GAAP measure, or net income (loss), for the full year 2018 is not available on a forward-looking basis without unreasonable efforts and uncertainty due to the unpredictability and complexity of the charges excluded from non-GAAP adjusted net income (loss), including without limitation stock-based compensation. Stock-based compensation expenses are impacted by future hiring and retention needs, as well as the future fair market value of SendGrid’s common stock, all of which are difficult to predict and subject to change. SendGrid expects the above charges, including stock-based compensation, collectively will have a significant, and potentially unpredictable, impact on its GAAP net income (loss) for 2018.
APPENDIX 12

Historic Revenue $ Contributions by Product Revenue Source ($M) Q4-17 Q3-17 Q2-17 Q1-17 Q4-16 Q3-16 Q2-16 Q1-16 Email API $25.2 $22.5 $21.4 $19.9 $18.3 $16.6 $15.1 $13.4 Marketing Campaigns $5.2 $3.9 $3.2 $2.7 $2.4 $1.9 $1.5 $1.2 Predecessor Email Marketing Service $0.2 $0.9 $1.4 $1.5 $1.8 $1.6 $1.9 $2.1 Services & Other $1.1 $1.0 $1.0 $0.7 $0.6 $0.6 $0.5 $0.4 Total Revenue $31.7 $28.3 $27.0 $24.8 $23.1 $20.7 $19.0 $17.1 Total MC + Legacy Tool $5.4 $4.8 $4.6 $4.2 $4.2 $3.5 $3.4 $3.3 13 NOTE: Marketing Campaigns replaced SendGrid’s predecessor email marketing tool, which was sunset as of Dec. 31, 2017. Q4-2017, as highlighted above, will be the last quarter realizing revenue from this predecessor email marketing tool.
Historic Revenue % Contributions by Product Revenue Source Q4-17 Q3-17 Q2-17 Q1-17 Q4-16 Q3-16 Q2-16 Q1-16 Email API 79.5% 79.5% 79.3% 80.3% 79.2% 80.2% 79.5% 78.4% Marketing Campaigns 16.4% 13.8% 11.9% 10.9% 10.4% 9.2% 7.9% 7.0% Predecessor Email Marketing Service 0.6% 3.2% 5.2% 6.0% 7.8% 7.7% 10.0% 12.3% Services & Other 3.5% 3.5% 3.6% 2.8% 2.6% 2.9% 2.6% 2.3% Total Revenue 100% 100% 100% 100% 100% 100% 100% 100% 14 NOTE: Marketing Campaigns replaced SendGrid’s predecessor email marketing tool, which was sunset as of Dec. 31, 2017.
Adjusted Net Income (ANI) Reconciliation 15
Adjusted Net Income (ANI) Reconciliation 16
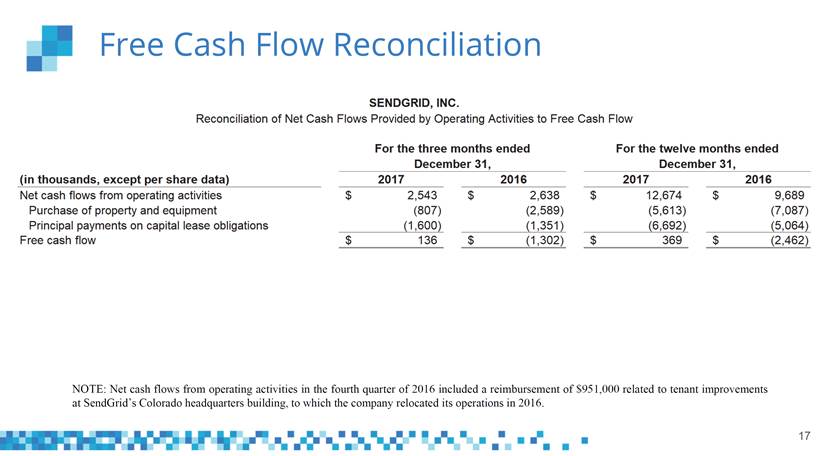
Free Cash Flow Reconciliation 17 NOTE: Net cash flows from operating activities in the fourth quarter of 2016 included a reimbursement of $951,000 related to tenant improvements at SendGrid’s Colorado headquarters building, to which the company relocated its operations in 2016.
Non-GAAP Expense Reconciliation: Cost of Revenue and R&D 18
Non-GAAP Expense Reconciliation: Sales & Marketing and G&A 19