Attached files
| file | filename |
|---|---|
| EX-32.2 - EX-32.2 - SendGrid, Inc. | ex-32d2.htm |
| EX-32.1 - EX-32.1 - SendGrid, Inc. | ex-32d1.htm |
| EX-31.2 - EX-31.2 - SendGrid, Inc. | ex-31d2.htm |
| EX-31.1 - EX-31.1 - SendGrid, Inc. | ex-31d1.htm |
| EX-23.1 - EX-23.1 - SendGrid, Inc. | ex-23d1.htm |
| EX-3.2 - EX-3.2 - SendGrid, Inc. | ex-3d2.htm |
| EX-3.1 - EX-3.1 - SendGrid, Inc. | ex-3d1.htm |
UNITED STATES
SECURITIES AND EXCHANGE COMMISSION
Washington, D.C. 20549
FORM 10-K
|
☒ |
|
ANNUAL REPORT PURSUANT TO SECTION 13 OR 15(d) OF THE SECURITIES EXCHANGE ACT OF 1934 |
|
|
||
|
For the fiscal year ended December 31, 2017 |
||
|
|
||
|
or |
||
|
☐ |
|
TRANSITION REPORT PURSUANT TO SECTION 13 OR 15(d) OF THE SECURITIES EXCHANGE ACT OF 1934 |
|
|
||
|
For the transition period from to |
||
Commission File Number: 001-38275
SendGrid, Inc.
(Exact name of registrant as specified in its charter)
|
Delaware (State or other jurisdiction of incorporation or organization) |
27-0554600 (I.R.S. Employer Identification Number) |
||
1801 California Street, Suite 500
Denver, Colorado 80202
(Address of principal executive offices) (Zip Code)
(888) 985-7363
(Registrant’s telephone number, including area code)
Securities registered pursuant to Section 12(b) of the Act:
|
Title of each class |
|
(Name of each exchange on which registered) |
|
Common Stock, par value $0.001 per share |
|
The New York Stock Exchange |
Securities registered pursuant to Section 12(g) of the Act: None
Indicate by check mark if the registrant is a well-known seasoned issuer, as defined in Rule 405 of the Securities Act: Yes ☐ No ☒
Indicate by check mark if the registrant is not required to file reports pursuant to Section 13 or 15(d) of the Act: Yes ☐ No ☒
Indicate by check mark whether the registrant (1) has filed all reports required to be filed by Section 13 or 15(d) of the Securities Exchange Act of 1934 during the preceding 12 months (or for such shorter period that the registrant was required to file such reports), and (2) has been subject to such filing requirements for the past 90 days. Yes ☒ No ☐
Indicate by check mark whether the registrant has submitted electronically and posted on its corporate Web site, if any, every Interactive Data File required to be submitted and posted pursuant to Rule 405 of Regulation S-T (§232.405 of this chapter) during the preceding 12 months (or for such shorter period that the registrant was required to submit and post such files). Yes ☐ No ☐
Indicate by check mark if disclosure of delinquent filers pursuant to Item 405 of Regulation S-K (§229.405 of this chapter) is not contained herein, and will not be contained, to the best of registrant’s knowledge, in definitive proxy or information statements incorporated by reference in Part III of the Form 10-K or any amendment to the Form 10-K. ☒
Indicate by check mark whether the registrant is a large accelerated filer, an accelerated filer, a non-accelerated filer, smaller reporting company, or an emerging growth company. See the definitions of “large accelerated filer,” “accelerated filer,” “smaller reporting company,” and “emerging growth company” in Rule 12b-2 of the Exchange Act.
|
Large accelerated filer ☐ |
|
Accelerated filer ☐ |
|
Non-accelerated filer ☒ (Do not check if a smaller reporting company) |
|
Smaller reporting company ☐ |
|
Emerging Growth Company ☒ |
If an emerging growth company, indicate by check mark if the registrant has elected not to use the extended transition period for complying with any new or revised financial accounting standards provided pursuant to Section 13(a) of the Exchange Act. ☐
Indicate by check mark whether the registrant is a shell company (as defined in Rule 12b-2 of the Exchange Act). Yes ☐ No ☒
The registrant’s common stock was not publicly traded as of the last business day of the registrant’s most recently completed second fiscal quarter.
On February 15, 2018, the registrant had 42,701,210 shares of common stock outstanding.
DOCUMENTS INCORPORATED BY REFERENCE
Portions of the registrant’s definitive Proxy Statement for its 2018 Annual Meeting of Stockholders are incorporated herein by reference in Part III of this Annual Report on Form 10-K to the extent stated herein. Such Proxy Statement will be filed with the Securities and Exchange Commission within 120 days of the registrant’s fiscal year ended December 31, 2017.
SendGrid, Inc.
Annual Report on Form 10-K
For the Fiscal Year Ended December 31, 2017
2
Unless the content otherwise requires, references in this Annual Report on Form 10-K to “SendGrid,” “company,” “our,” “us,” and “we” refer to SendGrid, Inc. and where appropriate its consolidated subsidiaries.
“SendGrid” and other trademarks or service marks of SendGrid appearing in this Annual Report on Form 10-K are our property. This Annual Report on Form 10-K contains additional trade names, trademarks, and service marks of other companies, which are the property of their respective owners. We do not intend our use or display of other companies’ trade names, trademarks, or service marks to imply a relationship with, or endorsement or sponsorship of us by, these other companies.
NOTE REGARDING FORWARD LOOKING STATEMENTS
This Annual Report on Form 10-K contains forward-looking statements within the meaning of Section 27A of the Securities Act of 1933, as amended, or the Securities Act, and Section 21E of the Securities Exchange Act of 1934, as amended, or the Exchange Act, that involve substantial risks and uncertainties. All statements other than statements of historical facts contained in this Annual Report on Form 10-K, including statements regarding our future financial condition, results of operations, business strategy and plans and objectives of management for future operations, as well as statements regarding industry trends, are forward-looking statements. In some cases, you can identify forward-looking statements by terminology such as “believe,” “will,” “may,” “estimate,” “continue,” “anticipate,” “intend,” “should,” “plan,” “expect,” “predict,” “could,” “potentially” or the negative of these terms or other similar expressions. We have based these forward-looking statements largely on our current expectations and projections about future events and trends that we believe may affect our financial condition, results of operations, business strategy and financial needs. These forward-looking statements are subject to a number of risks, uncertainties and assumptions described under the section titled “Risk Factors” and elsewhere in this Annual Report on Form 10-K, regarding, among other things:
|
· |
our ability to effectively sustain and manage our growth and future expenses, and our ability to achieve and maintain future profitability; |
|
· |
our ability to attract new customers and to maintain and expand our existing customer base; |
|
· |
our dependence on our self-service model; |
|
· |
our ability to scale and update our platform to respond to customers’ needs and rapid technological change; |
|
· |
our reliance on third parties, including for strategic relationships to sell our services and for network connectivity, hosting and other services; |
|
· |
the effects of increased competition on our market and our ability to compete effectively; |
|
· |
our ability to expand our operations and increase adoption of our platform internationally; |
|
· |
our ability to maintain, protect and enhance our brand; |
|
· |
our customers’ and other platform users’ violation of our policies or misuse of our platform; |
|
· |
the sufficiency of our cash and cash equivalents to satisfy our liquidity needs; |
|
· |
our failure or the failure of our platform of services to comply with applicable industry standards, laws, and regulations; |
|
· |
our ability to maintain our corporate culture; |
|
· |
our ability to hire, retain and motivate qualified personnel; |
|
· |
our ability to identify targets for, execute on and realize the benefits of potential acquisitions; |
3
|
· |
our ability to estimate the size and potential growth of our target market; and |
|
· |
our ability to maintain proper and effective internal controls. |
These risks are not exhaustive. Other sections of this Annual Report on Form 10-K may include additional factors that could adversely impact our business and financial performance. New risk factors emerge from time to time and it is not possible for our management to predict all risk factors, nor can we assess the impact of all factors on our business or the extent to which any factor, or combination of factors, may cause actual results to differ materially from those contained in, or implied by, any forward-looking statements.
You should not rely upon forward-looking statements as predictions of future events. Although we believe that the expectations reflected in the forward-looking statements are reasonable, we cannot guarantee future results, levels of activity, performance, or achievements. Except as required by law, we undertake no obligation to update publicly any forward-looking statements for any reason after the date of this Annual Report on Form 10-K.
4
Overview
We are a leading digital communication platform, enabling businesses to engage with their customers via email reliably, effectively and at scale. Our cloud-based platform allows for frictionless adoption and immediate value creation for businesses, providing their developers and marketers with the tools to seamlessly and effectively reach their customers using email. Since our inception we have processed more than one trillion emails.
Increasingly, today’s transactions are digital. They happen online and are often automatic and recurring. Consumers want a seamless experience and have come to expect that their online activity will be recorded in their email inbox. Email serves as the system of record for a consumer’s digital life, delivering purchase receipts, shipping notifications, account information, social media updates, reservations, and website login data. Email is the primary communication channel in the digital world, with 125 billion commercial emails sent every day, according to a 2017 Radicati Group report. Email is also a trusted marketing tool for businesses. Businesses rely on email to send customers notifications, promotions, and personalized content because email is effective, searchable, and permanent. An email-based promotion can reach the right user at the right time, with a high degree of certainty that the user will see it. According to The Inbox Report 2017, in 2016 nearly 80% of Americans checked their email daily. According to a 2015 Direct Marketing Association report, email demonstrated the highest return on investment among all forms of digital communication, generating $38 in revenue for every $1 invested.
While email offers a compelling value proposition for businesses, effective email delivery at scale is complex and difficult. Inbox service providers, including Google Gmail, Microsoft Outlook, and Yahoo! Mail, evaluate incoming email and block the delivery of harmful or unwanted email. However, these filters can also prevent the delivery of wanted email. According to a 2017 Return Path report for the 12-month period ended June 30, 2017, only 80% of wanted email reached its intended recipient. To manage email delivery on their own, businesses must understand the complexities associated with both sending millions or billions of transactional and marketing emails and the unique dynamics of numerous inbox service providers. Dedicated servers and databases, domain expertise, continuous monitoring of email protocols and a team of people are all necessary to maintain a robust internally-developed email communications system. The use of developer resources in this effort can reduce businesses investment in product innovation and other priorities. Without an effective, easy to use system, marketers seeking to reach customers via email can also expend significant time and resources without accomplishing their marketing goals.
SendGrid was founded in 2009 by developers who were frustrated with their own experiences in managing email delivery. They wanted to build a system “that just worked” for developers and allowed them to focus on strategic business activities. They developed a robust technology platform incorporating their domain expertise and created an Application Programming Interface, or API, that allowed for easy integration by businesses. We built our business model around serving the developer, including self-service adoption and a frictionless user experience. We have extended this platform over time to serve the similar email delivery needs of marketers.
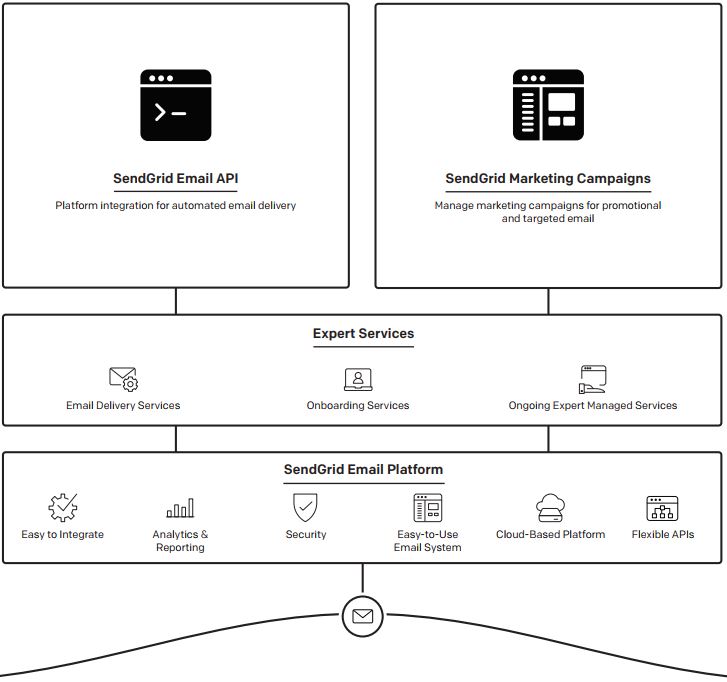
We offer our customers three services: our Email API; Marketing Campaigns; and Expert Services. Our Email API service allows developers to use our API in their preferred development framework to leverage our platform to add email functionality to their applications within minutes. This service enables businesses to send thousands or billions of emails, all with the same high level of service and reliability, and incorporates proprietary technology and domain expertise to significantly improve deliverability rates. Our Marketing Campaigns service allows marketers to upload and manage customer contact lists, create and test email templates, and then execute and analyze multi-faceted email campaigns that engage customers and drive growth. Our Expert Services help businesses further optimize their email delivery. With our platform, businesses can achieve industry leading email deliverability that translates into higher brand engagement with their customers. For 2017, 2016, and 2015, revenue from our Email API service and our Marketing Campaigns service represented 80%, 79%, and 79% and 13%, 9%, and 1% of our total revenue, respectively.
Our category leadership, self-service model, and company culture have enabled us to attract and retain customers and employees and continue to develop innovative solutions for email delivery. Our platform is designed to serve the
5
communication needs of small and midsize businesses, or SMBs, and large enterprises across industries. Our pricing model and extensive document library make our platform accessible to developers and marketers alike, irrespective of their expertise or the scale of their needs. We deliver our services through a self-service cloud-based subscription model, where businesses primarily sign up for our services through our website. We offer transparent and affordable pricing, generally on a per month basis by volume of email and typically paid by credit card. In addition, we have robust documentation for onboarding and ongoing usage. We have developed a broad user and partner community available for help and support. This self-service delivery model has enabled us to rapidly attract customers while operating our business efficiently.
Businesses of all sizes and across industries depend on our digital communication platform. As of December 31, 2017, we had over 63,000 customers globally, an increase of 39% year over year. While we serve large enterprises, we primarily serve SMBs that rely on email to power their businesses and are rapidly adopting cloud services. Our self-service model has allowed us to efficiently acquire SMB customers that historically have not been a focus for companies that depend on large enterprise sales forces. Our robust platform and the increasing breadth of our services allow us to scale with our customers as they grow.
Industry Trends
Email Is the Primary Commercial Communications Channel in the Digital World
Businesses increasingly interact with their customers through digital channels. Many emerging businesses are digital first. They primarily engage with customers through online and mobile channels. Customers of these businesses rarely interact with sales people, collect paper receipts, track orders over the phone or mail in their bills. Customers enjoy and increasingly demand one-click purchases, recurring home deliveries and automated online services and depend on email as their system of record for their transactions.
Businesses send emails to their customers daily because marketers know they can reach a wide audience and personalize interactions, while trusting emails will reach their target recipient. Digital channels allow businesses to engage with their customers in a more personalized way. Consumers leave a digital footprint of their transaction history and preferences, enabling businesses to analyze demographic information and buying behavior in order to deliver highly personalized digital experiences. The emergence of smart phones and other personal devices has enabled convenient online access by consumers, who as a result expect instant access to information and services. These dynamics have created the opportunity for frequent customer engagement and targeted marketing. Businesses must be able to react quickly and effectively in order to take advantage of this opportunity.
Email Is Used for Multiple Business Purposes
Businesses send email in three different forms to connect with customers:
Transactional (Recipient Initiated, One-to-One)
A transactional email is generated whenever an event occurs, such as a purchase, payment, password reset, account creation, shipping notification, and social media update. Nearly all websites and applications require a unique email address to sign up or login, establishing email as the system of record for the transaction.
Marketing (One-to-Many)
One-to-many marketing email is sent as a single message to a large distribution list, and includes promotions, newsletters, buy now, sign up now, and special offers.
Marketing (Personalized, One-to-One)
Personalized marketing email is based on unique data about the recipient and is the most difficult type of marketing email to produce but can be the most valuable to businesses. To generate a personalized marketing email, businesses can apply data analysis techniques to generate an email specific to that user at the right time.
6
Email Is Highly Effective at Driving Customer Engagement and Revenue
Email accounts are widespread, and each is personal to its owner and consistent across time, making email a highly effective method of communication between businesses and consumers. Individuals with email accounts check their email throughout the day, every day. The use of smartphones for always-on access has only increased this effectiveness.
Effective Email Delivery Is Difficult
While email offers a compelling value proposition, businesses struggle to achieve effective email delivery due to a number of factors.
The Email Recipient’s Side
Inbox service providers, including Google Gmail, Microsoft Outlook, and Yahoo! Mail, use sophisticated filters to analyze incoming email and prevent the delivery of harmful or unwanted email, often blocking wanted email as well. Recipient systems analyze factors such as sender reputation, email content, past spam or phishing complaints, invalid addresses, blacklists, and domain name reputation with the goal of verifying legitimate email. If an email does not pass one of these filters, the system will automatically block the email from the recipient’s inbox, with the addressee likely not even knowing it was blocked. The cost of delivery failure includes not only the infrastructure expense associated with processing the email, but more importantly, the lost revenue for a business from a new or existing customer. We estimate businesses lose tens of billions of dollars in revenue every year from failed email delivery.
The Email Sender’s Side
Maintaining an email delivery system is complex. Domain expertise, dedicated resources, and the need to satisfy complex technical requirements are all required to operate an effective email delivery system, particularly at scale.
To be effective, businesses must understand the complexities of building a sender reputation and how to maintain that reputation across inbox service providers, spam houses, blacklist managers and industry watchdogs. This effectiveness requires strong relationships with postmasters at major inbox service providers to understand their protocols and proprietary methods in order to optimize delivery and resolve sender reputation issues quickly. Businesses must also synthesize a vast array of rapidly changing regulations, including privacy laws, that differ significantly by country.
Building and managing an email delivery system is resource-intensive and costly. To deliver billions of emails to thousands of recipients, businesses need dedicated infrastructure, including servers and databases, as well as an understanding of protocols to communicate with the recipient servers, including Simple Mail Transfer Protocol, or SMTP, and APIs. Businesses also need to build, maintain, and manage distribution lists across various applications and integrate relevant information from disparate databases into the email system.
Businesses Are Adopting Cloud Services to Reduce Complexity and Focus on Core Functions
Technological innovation has enabled businesses to improve efficiency, but it has also lowered barriers to entry and raised customer expectations. Businesses of all sizes must adapt quickly to changing market needs in order to grow and compete. As a result, businesses are turning to cloud services to manage complex and costly parts of their IT infrastructure and operations. For example, more than one million companies use Amazon Web Services for computing, network and storage infrastructure, over $20 billion in online payments has been processed by Stripe, over 500,000 businesses are powered by Shopify, and billions of Short Message Service, or SMS, messages have been sent using Twilio. Cloud services can seamlessly provide many of the critical, but non-core, components for a business, allowing it to maximize the value of internal resources by focusing on its core differentiating competencies.
Frictionless, Self-Service Models Are Driving High Adoption of Cloud Services
The ease of cloud service delivery is driving a move from multi-million-dollar capital purchases of on-premises IT infrastructure to recurring lower-cost subscriptions for cloud services. Many cloud services providers are also making it easier for end users to experiment with and adopt their technologies by deploying self-service models. These services
7
enable easy integration with existing IT systems and business workflows. As a result, self-service models enable cloud services providers to broaden their customer reach to include SMBs that have not been well-served by traditional enterprise sales forces. This change has increased the influence of line of business owners, developers and marketers in technology purchasing decisions compared to a traditional Chief Information Officer led purchasing process. Developers at businesses of all sizes can now conduct research to find solutions to meet their needs and adopt cloud services on their own, often using credit cards for purchases instead of purchase orders. This enables developers and marketers to sign up for services on the Internet and be up and running in minutes. With cloud services, developers and marketers exert greater control over how they allocate their resources.
Businesses Need to Effectively and Efficiently Send Wanted Email at Scale
Email is critical to building and growing customer relationships, but it requires significant resources and expertise to manage the complex underlying infrastructure. Businesses are turning to cloud services providers to provide transactional and marketing email services. The developers and marketers who are driving purchasing decisions of cloud services need a transactional and marketing email solution that possesses the following characteristics:
|
· |
Reliability: continuous uptime to send secure emails at any time |
|
· |
Effectiveness: high delivery rates and high consumer engagement |
|
· |
Scalability: ability to send billions of emails across a range of customer use cases, with the same level of effectiveness |
|
· |
Ease of Adoption and Integration: self-service onboarding and integration |
|
· |
Affordability: lower, predictable cost versus an internal system and accessible to businesses of all sizes |
|
· |
Platform Extensibility: integrated transactional and marketing email capabilities |
|
· |
Services and Support: expert help to obtain desired outcomes and enhance email marketing capabilities |
Benefits of Our Solution
Key benefits of our solution include:
Platform Reliability
Businesses rely on our platform to power their customer email communications. We utilize a robust global infrastructure that includes multiple co-located data centers and public cloud resources to host our platform. In 2017, our platform was available for our customers to send email 99.995% of the time. We have invested and continue to invest to improve the reliability of our platform.
Proprietary Technology and Domain Expertise Enables Effective Email Delivery
We significantly improve email deliverability through embedded intellectual property in our platform and industry-leading domain expertise. Our platform is designed to operate at scale across multiple inbox service providers. We have over 180 domain experts in email communication supporting our technology. In 2017 we estimate that we achieved a delivery rate of 94%, as compared to a general delivery rate for wanted email of 80% (as reported by Return Path in 2017 for the 12-month period ended June 30, 2017). Our delivery rates for 2016 and 2015 were consistent with our delivery rate for 2017. We also offer Expert Services to help our customers achieve the best outcomes for their individual needs. We estimate customers who utilize our Expert Services achieve nearly 2% higher deliverability on average, compared to our standard offering.
8
Ability to Scale With Customers As They Grow
Our communication platform provides the same high-quality service to a wide range of businesses, from startups to large enterprises, that send significant email volumes. Our Email API service starts with entry-level pricing of $9.95 that supports up to 40,000 emails per month and scales up from there. Our largest customers send more than one billion emails per month. We recognize that as our customers scale, their needs evolve, and we provide services that help them manage the complexities that emerge.
Frictionless Adoption for Developers and Marketers
We make it easy for developers and marketers to adopt our platform using a self-service model. We provide a flexible API setup to easily add email functionality to their applications which allows developers to begin sending email through our API in minutes. We have comprehensive documentation to help developers write code in their preferred development framework. We also provide 24 x 7 support to help our customers integrate with our platform. We have a community of over 2.9 million active users that serves as a resource for questions about our platform. Marketers seek the same reliable service for marketing email as developers do for transactional email. Therefore, once a business is using our API for transactional email delivery, it is simple for that business to also use our platform for promotional and personalized email marketing.
Affordable and Accessible to Businesses of All Sizes
We offer our Email API service as a monthly subscription, with pricing based on email volume. Our Email API service pricing plans start at $9.95 per month for up to 40,000 emails, providing businesses of all sizes, especially SMBs, with an affordable option for digital customer communication. Businesses can tailor the use of our services for their individual needs, without the need to commit to expensive, multi-year contracts. Our cloud-based services generally provide significant cost savings compared to an internally developed system and free up internal resources for other tasks. Based on our internal estimates and analysis, we believe a typical high-volume customer located in a major metropolitan area could save up to one-third by using our Email API service as compared to the cost of implementing and maintaining an internally-developed email delivery system.
Extensible Communications Platform
Our platform incorporates extensible technology that allows our customers to expand their use cases to improve their customer communications. We introduced our Email API service in 2009, which allowed businesses to send both transactional and marketing emails. We continued to add functionality to our platform and in late 2015, we introduced our Marketing Campaigns service. Businesses that use our Marketing Campaigns service gain more insight about how their customers interact with email, which allows the business to improve deliverability and engagement. Our customers benefit from having a single platform for transactional and marketing email, enabling them to manage their customer contact data in a single place, leverage universal design templates and testing systems, and ensure high email deliverability.
Competitive Strengths
Our competitive strengths include:
Easy to Adopt, Self-Service Model
Our Email API and Marketing Campaigns services are designed to be accessed from our website and immediately useable. During 2017, approximately 99% of our new customers purchased our platform through our website, without engaging with our sales team. By reducing the friction that typically accompanies the purchase of business software and eliminating the need for complicated and costly implementation and training, we believe we attract more customers to try, buy and derive value from our platform. Customers find us through our marketing efforts and word-of-mouth. This self-service model has allowed us to grow our customer base while avoiding the expensive customer acquisition costs typical of high-touch enterprise sales models. We focus on the quality of our services, frictionless adoption, and customer support in lieu of a costly traditional sales infrastructure.
9
Market Leadership in Email Service with Strong Brand Association
We pioneered the market for a cloud-based email API service and continue to invest significant resources to extend our technology leadership and brand awareness in our industry. As a result of these initiatives and our involvement in the early development of commercialized email service, we believe that the SendGrid brand has become synonymous with email delivery and is recognized as the industry standard for scalability, reliability, and deliverability. Our brand recognition is central to the efficiency of our self-service sales model.
Significant Domain Expertise Around Email
We have processed over one trillion emails since inception, including over 450 billion emails in 2017. We sent email to more than 3.9 billion unique email addresses globally during 2017. We believe each of those figures is materially larger than our closest competitor. We have longstanding relationships and integrations with inbox service providers, including Google Gmail, Microsoft Outlook, and Yahoo! Mail. These relationships provide us with real-time intelligence and performance feedback that enables us to optimize the deliverability of the emails that we send. Additionally, our personnel hold leadership roles with numerous email industry organizations including the Messaging Malware Mobile Anti-Abuse Working Group, Data & Marketing Association, and Email Experience Council.
Large, Growing and Happy Global Customer Base
As of December 31, 2017, we had over 63,000 customers globally. Our broad customer base provides us with insight into digital communication trends and activity and results in word-of-mouth recognition that drives traffic to our website. We have minimal customer concentration with no customer accounting for more than 2% of revenue in any of the last three years, and a broad geographic reach with more than 36% of our revenue in the same periods coming from international regions, where we maintain limited infrastructure and no product localization.
Our Growth Strategies
Key components of our growth strategy include:
Continue to Add Customers to Our Platform
The market for our platform is large, underpenetrated, and growing. We believe that there is substantial opportunity to add additional customers both in the United States and internationally as the ubiquity of email and the digital transformation of businesses continue to drive market adoption of our services.
Expand Platform Features and Functionality and Grow Our Marketing Campaigns Service
Our ability to develop new applications and functionalities has been integral to our success and we intend to continue to invest to extend the functionality and range of our platform. An example of innovation includes our Marketing Campaigns service, which we launched in late 2015. Our Marketing Campaigns service has experienced strong customer receptivity, with more than 10,000 customers as of December 31, 2017. We intend to grow our Marketing Campaigns service by cross selling into our existing Email API service customer base, acquiring new customers and adding new capabilities and features. Many of our Email API service customers do not employ separate, dedicated marketing solutions and we believe that our Marketing Campaigns service offers them a highly attractive proposition. Furthermore, while we do not currently provide services in other emerging communications channels, such as messaging/chat platforms, in-app messages, online ads, browser and push notifications, and SMS, we believe that the proliferation of these channels creates further potential growth opportunities over time for us to help our customers optimize their communications across those channels.
Expand our Strategic Partner Channel
We have built and plan to continue investing in channel relationships with our strategic partners in order to broaden the reach of our internal marketing efforts. Our partner ecosystem includes strategic relationships with leading public cloud infrastructure providers and ecommerce platforms, such as Heroku, Amazon Web Services and Microsoft Azure, software vendors that offer complementary products and with which we co-sell our Email API and Marketing Campaigns services,
10
such as GitHub, New Relic and Twilio, and digital marketing agencies, such as Deloitte Digital, which resell our services to their clients.
Continue to Grow Internationally
We generated more than 36% of our revenue in each of the last three years from customers located in international geographies despite having limited international infrastructure and no product localization. We attribute this success to awareness of our services, our frictionless self-service onboarding process, and the ease-of-use of our services. Recently, we opened our first international sales and marketing office in London. In the future, we intend to add more physical infrastructure as well as localized platform content and currency, checkout, and support that will enhance our attractiveness to international customers.
Pursue Select Acquisitions to Augment Our Features and Functionality
We intend to continue pursuing acquisitions that we believe will be complementary. For example, we may pursue acquisitions that we believe will enhance our services, accelerate customer acquisition, introduce different distribution channels, and add talent and expertise to our organization. We have a track record of successfully completing acquisitions. For example, in 2015, we acquired certain assets from Message Bus, a transactional email company, and in 2017, we acquired JCKM, Inc., or Bizzy, a marketing automation company.
11
Our Platform and Services
Our offerings include:
Email API
Our Email API service enables businesses to programmatically send email via our API or an SMTP relay. We manage delivery of those emails and report on account statistics and recipient engagement. We take care of the details of making SMTP connections, bulk emailing, connection handling, and click- and open-tracking to help our customers get the right message to the right person at the right time.
|
· |
Integrations: Businesses can integrate our email API with multiple leading development frameworks and client libraries, including Node.js, Ruby, Python, Go, Hypertext Preprocessor, Java, and C#. |
|
· |
Documentation: Users can get answers and support from robust documentation, video tutorials and the SendGrid community on our website. |
12
|
· |
Internet Protocol, or IP, Management: Domains and links can be customized, whether sending from shared IP address pools or a dedicated IP address, for improved reputation management and delivery. |
|
· |
Deliverability: Our custom Sender Policy Framework and DomainKeys Identified Mail record creation is designed to eliminate domain spoofing and phishing. |
|
· |
Reporting & Analytics: Account statistics and engagement data can be accessed in real-time via our Advanced Statistics API and SendGrid Event Webhook. |
|
· |
Mobile support: Our deep linking functionality enables email engagement for mobile apps. |
|
· |
Security: Our two-factor authentication, API key permissions, and IP Address Access Management enables secure management of our email API by our customers. |
Marketing Campaigns
Our email marketing service, SendGrid Marketing Campaigns, allows marketers to upload and manage customer contact lists, create and test email templates, and then execute and analyze multi-faceted email campaigns that engage customers and drive growth. Our Marketing Campaigns service includes:
|
· |
Segmentation and Contact Management Tools: Enables users to upload and manage target recipient lists, create segments of recipients, and personalize messages to segments. |
|
· |
A/B testing: Campaign optimization tools to test changes to subject lines, images, links, copy and button placement to optimize email campaign performance. Users can run up to six variations simultaneously. |
|
· |
Email Template Editor: Enables marketers to design emails, drag and drop email components or existing Hyper Text Markup Language, or HTML, into the code editors, or write HTML directly, and personalize emails using customer fields to add recipient-specific data. |
|
· |
Analytics and Reporting: Our real time analytics provide instant feedback and customizable performance metrics to optimize engagement. |
Expert Services
Our Expert Services provide customers with a variety of service packages to ensure customers are able to maximize the value of their email programs.
|
· |
Expert Managed Services: Our in-house email experts proactively manage our customers’ sender reputations on an ongoing basis by using sophisticated monitoring tools, building custom delivery plans, and making recommendations to improve deliverability and email program return on investment. |
|
· |
One-time Services: Offerings range from one-time onboarding and email delivery consulting services to custom-designed service packages that include direct access to expert technical support and delivery services team members. |
The SendGrid Way
We create new services and functionality via a process called The SendGrid Way. We engage our customer base to gather extensive feedback on existing services and services in development, as well as to learn about other communications problems our customers need to solve. This iterative process is ideal in providing our development team with listening posts to help guide our development roadmap. Our SendGrid Labs team is focused on future innovation beyond currently offered services.
13
Our Technology
The technology that powers our digital communications platform combines IP and domain knowledge around email delivery, which enables us to deliver email reliably and at scale. Numerous and distinct technologies and processes go into email delivery, and it is our ability to apply these technologies across billions of daily emails and dozens of inbox service providers that truly differentiates our platform. Our technology balances the processes needed to keep bad actors who send harmful or unwanted emails off our platform with enabling reputable senders to deliver wanted mail to recipients. Constantly managing these two objectives, automatically and at scale, ensures a frictionless experience for users.
We describe our technology differentiation across five areas:
Ability to Process Email Efficiently
Using a mechanism in Domain Name Servers, we have designed our mail processors to automatically route mail sent by our customers to our platform to the nearest email processing facility for optimized response times. We lease co-location space from third-party data center providers to maintain email processing facilities in four locations spread across the United States, as well as in Asia, the United Kingdom and Europe.
Improving Deliverability for Reputable Senders
Our platform is designed to capture the continuous signal provided by inbox service providers, allowing us to understand their operational responses to our email delivery techniques. Our proprietary technology relies on this continuous feedback mechanism to adjust the timing, speed and volume of email sending to optimize delivery for our customers across inbox service providers. We employ a variety of techniques to preserve the sender reputation of our customers, including warming up new IP addresses, where we systematically increase the volume of email sent from new IP addresses at a measured pace, and exponential-backoff, where we decelerate email sending quickly if the messages being sent are not well received by the target inbox service provider. We also protect our customers from actions that may inadvertently damage their ability to reach their end users. For example, our platform blocks the sending of email to end users who have unsubscribed from an email distribution list. Our Expert Services team also provides customized advice to help businesses improve their sender reputation for better deliverability.
Keeping Bad Actors Off the System
We strive to ensure that our platform is used only for sending wanted email. We continuously monitor the behaviors of users to detect unwanted email patterns. Once identified, we can reduce, suspend, or eliminate the ability of bad actors to send emails by removing them from our platform. We utilize machine learning to analyze information gathered during the sign-up process and from third parties as well as email content to determine malicious intent. These controls help us to preserve the sender reputations of our customers.
Market Leading Security Architecture
We incorporate sophisticated layers of security into our platform. We offer encrypted email to the receiver’s inbox through a Transport Layer Security connection. Our services are System and Organization Controls 2 Type II compliant. Moreover, we have implemented a broad range of advanced security technologies designed to prevent external cyberattacks and keep our internal and customer-facing systems secure.
Managing Our Services at Scale
Our technology is designed to capture, process, and react to the unique and continuous signals provided by an array of inbox service providers. We helped create the notion of a transactional email service provider. We built a global, proprietary Message Transfer Agent, which is a set of sophisticated software components that manages the distribution and delivery of email to recipients through our co-located email processing facilities. We leverage scalable cloud resources to support continuous sending during high volume periods. We maintain a high level of reliability across our email processing facilities because they operate independently from one another. If we encounter an issue at one email processing facility, we can reroute mail to another to support continuous service for our customers. Our platform also uses fair queuing
14
to optimize the email flow through the system so that an important message such as a password reset email is prioritized over non-critical messages going to millions of recipients.
We intend to continue to invest in our research and development capabilities. Our research and development expense was $29.6 million, $21.2 million, and $19.0 million for 2017, 2016, and 2015, respectively.
Our Customers
Our scalable platform helps businesses solve some of their most important digital communications challenges. As of December 31, 2017, we had more than 63,000 customers globally using our services. We believe a relatively small number of businesses have more than one unique paying account with us, and we count each of these accounts as a separate customer. Our customers are comprised of SMBs and large global enterprises. We have a diverse customer base that spans industries. No customer accounted for more than 2% of revenue in any of the last three years.
Marketing and Sales
Marketing
We believe the SendGrid name is synonymous with email. We rely on our brand strength and self-service, go-to-market model to acquire customers with little direct sales involvement. Because of our self-service model, we depend on businesses finding us. We invest significantly in our marketing efforts to promote our brand, attract customers, and build a community around our platform. We focus our marketing efforts on:
|
· |
Self-Service Channel: We acquire new customers through direct response marketing, such as email marketing, search engine advertising, display advertising, social media advertising and digital sponsorships. These initiatives are designed to attract new customers to our website that will sign up for our service. We run our own demand-side platform, allowing us to directly manage our digital advertising spend and maximize the efficacy of our customer acquisition strategy. We devote significant attention to generating compelling and informative content, including an extensive library of how-to guides, best practices recommendations and comparable benchmarks. Our customer analytics supports all of these efforts, measuring the effectiveness of each component of our self-service strategy. |
|
· |
Strategic Partner Channel: We continue to expand our relationships with leading public cloud infrastructure providers, ecommerce platforms, software vendors and digital marketing agencies to acquire new customers. |
|
· |
Brand Strategy: Our marketing is focused on both creating awareness of SendGrid across the developer and marketer communities through advertising, content marketing, public relations, and events, and driving direct-response conversions via our self-service and partner channels. Our research and insights team continually gathers feedback from our customers to improve our targeting and ultimately the return-on-investment from our marketing activities. We established a customer advisory board to understand the changing needs of customers and to reflect those needs in our development roadmap. |
|
· |
Community Development: Through our Community Development team, we partner with startup accelerators, such as Techstars, incubators, and others in the startup ecosystem to provide mentorship and other support to emerging digital companies. |
15
Sales
Our inside sales team responds to inbound customer inquiries and pursues targeted outbound prospects. We have a strategic focus on cross-selling our Marketing Campaigns service and Expert Services to our existing customer base. We also have a dedicated customer success team that supports larger-volume accounts and helps them grow and expand.
Technical Support
Our platform is designed to be easy to adopt and use with little support. We provide 24 x 7 support for all of our customers through our Customer Support team. Our online support services enable our customers to access documentation and instruction for our services on the Docs section of our website. We offer troubleshooting and how-to tips for all of our services, with links to all our service-specific knowledge bases.
Our Competition
We provide cloud-based services that enable businesses to reach their customers using email for both transactional and marketing purposes. The market for providing these services is fragmented, with some vendors addressing transactional email services, some vendors addressing email marketing services and other vendors providing a broad array of services that include transactional and marketing services as part of a software suite or broader portfolio of software offerings. Notwithstanding the availability of third-party software services, some businesses rely on internally-developed solutions for their email communications needs. The market for digital communications services is also rapidly evolving, creating opportunity for new competitors to enter the market with point product solutions or addressing specific segments of the market. In addition, in some instances, we have strategic or other commercial relationships with companies with which we also compete, such as Amazon Web Services. Our competitors include:
|
· |
Companies that offer transactional email services, including Amazon, Mailgun, Oracle and SparkPost; and |
|
· |
Companies that offer email marketing services, including Adobe, Campaign Monitor, Endurance, IBM, MailChimp, Oracle, and Salesforce. |
We believe the principal competitive factors include: completeness of offering; credibility with developers and marketers; global reach; ease of adoption; features and functionality; platform scalability, reliability, security, and performance; brand awareness and reputation; integration with third-party applications and data sources; customer support; and the total cost of deployment and ownership. We believe that we compete favorably with respect to each of these factors. For additional information, see the section titled “Risk Factors—Risks Related to our Business—The market in which we participate is highly competitive and, if we do not compete effectively, our operating results could be harmed.”
Employees
As of December 31, 2017, we had 415 full-time employees.
Government Regulations
We are subject to a number of U.S. federal and state and foreign laws and regulations that involve matters central to our business. These laws and regulations may involve privacy, data protection, intellectual property, competition, consumer protection, taxation or other subjects. Many of the laws and regulations to which we are subject are still evolving and being tested in courts and could be interpreted in ways that could harm our business. In addition, the application and interpretation of these laws and regulations often are uncertain, particularly in the new and rapidly evolving industry in which we operate. Because global laws and regulations have continued to develop and evolve rapidly, it is possible that we may not be, or may not have been, compliant with each such applicable law or regulation.
Intellectual Property
We rely on a combination of intellectual property rights, including patent, trade secret, copyright, and trademark protections, as well as customary contractual protections to protect our proprietary technology.
16
As of December 31, 2017, in the United States, we had one issued patent, which expires in 2036. We have also registered “SendGrid” as a trademark and our pixel grid design in the United States and various foreign jurisdictions. In addition, we also enter into confidentiality and invention assignment agreements with our employees and contractors and sign confidentiality agreements with third parties. We restrict access to proprietary technology and confidential information through the use of internal controls.
Despite our efforts to protect our technology and proprietary rights through intellectual property rights and contractual protections, unauthorized parties may still copy or otherwise obtain and use our software and other technology. In addition, we intend to continue to expand our international operations, and effective intellectual property and trade secret protection may not be available or may be limited in foreign countries.
Segment and Geographic Information
We view our operations and manage our business as one operating segment. See our consolidated financial statements for a discussion of revenues, operating loss, net loss, and total assets.
For a description of our revenue and long-lived assets by geographic location, see Note 14 of the Notes to our Consolidated Financial Statements included in this Annual Report on Form 10-K.
Corporate Information
We were incorporated in Delaware in July 2009. Our principal executive offices are located at 1801 California Street, Suite 500, Denver, CO 80202, and our telephone number is (888) 985-7363.
Available Information
We maintain a website at https://sendgrid.com, including an investor relations section at https://investors.sendgrid.com in which we routinely post important information, such as webcasts of quarterly earnings calls and other investor events in which we participate or host, and any related materials. You may access our annual reports on Form 10-K, quarterly reports on Form 10-Q, current reports on Form 8-K and amendments to those reports, as well as other reports relating to us that are filed with or furnished to the Securities or Exchange Commission, or SEC, free of charge in the investor relations section of our website as soon as reasonably practicable after such material is electronically filed with or furnished to the SEC. We are not, however, including the information contained on our website, or information that may be accessed through links on our website, as part of, or incorporating such information by reference into, this Annual Report on Form 10-K, and you should not consider any information contained on, or that can be accessed through, our website as part of this Annual Report on Form 10-K. The public may also read and copy materials we file with the SEC at the SEC’s Public Reference Room, which is located at 100 F Street, NE, Washington, DC 20549. You can obtain information on the operation of the Public Reference Room by calling the SEC at 1-800-SEC-0330. The SEC also maintains a website that contains reports, proxy and information statements and other information regarding issuers that file electronically with the SEC at www.sec.gov.
17
Our operations and financial results are subject to various risks and uncertainties including those described below. You should carefully consider the risks and uncertainties described below, together with all of the other information in this Annual Report on Form 10-K, including the section titled “Management’s Discussion and Analysis of Financial Condition and Results of Operations”, as well as our other public filings with the SEC. Our business, operating results, financial condition, or prospects could be materially and adversely affected by any of these risks and uncertainties. In that case, the trading price of our common stock could decline. In addition, the risks and uncertainties discussed below are not the only ones we face. Our business, operating results, financial condition, or prospects could also be harmed by risks and uncertainties not currently known to us or that we currently do not believe are material, and these risks and uncertainties could result in a decrease in the market price of our common stock. In assessing the risks and uncertainties described below, you should also refer to the other information contained in this Annual Report on Form 10-K, including our consolidated financial statements and the related notes thereto.
Risks Related to our Business
Our recent growth may not be indicative of our future growth and, if we continue to grow, we may not be able to manage our growth effectively.
We have recently experienced a period of rapid growth in our headcount and operations. In particular, we grew from 58 employees as of December 31, 2011, to 415 fulltime employees as of December 31, 2017, and we have also significantly increased the number of emails processed by our platform over the last several years. We anticipate that we will continue to expand our operations and headcount in the near term. Our growth has placed, and future growth will place, a significant strain on our management, technical, administrative, operational, and financial infrastructure. Our success will depend in part on our ability to manage this growth effectively. To manage the expected growth of our operations and personnel, we will need to continue to improve our management, technical, administrative, operational, and financial controls and our reporting systems and procedures. Failure to effectively manage our growth could result in difficulty or delays in effectively scaling our platform to handle increased email volumes, declines in quality or customer satisfaction, increases in costs, difficulties in introducing new features or other operational difficulties. Any of these difficulties could adversely impact our business and results of operations.
If we are unable to sustain our revenue growth rate, we may not achieve or maintain profitability in the future.
We have experienced rapid revenue growth over recent years, with revenue of $111.9 million, $79.9 million, and $58.5 million in 2017, 2016, and 2015, respectively. Although we have experienced rapid revenue growth historically, we may not continue to grow as rapidly in the future and our revenue growth rates may decline. Any success that we may experience in the future will depend in large part on our ability to, among other things:
|
· |
maintain and expand our customer base; |
|
· |
increase revenue from existing customers through increased or broader use of our platform within their organizations; |
|
· |
improve the performance and capabilities of our platform through research and development; |
|
· |
continue to successfully expand our business domestically and internationally; |
|
· |
achieve the anticipated benefits from any businesses or technologies that we may acquire; and |
|
· |
successfully compete with other companies. |
If we are unable to maintain consistent revenue or revenue growth, our stock price could be volatile or decline, and we may not achieve or maintain profitability. You should not rely on our revenue for any prior quarterly or annual periods as any indication of our future revenue or revenue growth.
18
If we are unable to attract new customers, retain existing customers or increase sales both to new and existing customers, our business and results of operations will be affected adversely.
To succeed, we must continue to attract and retain customers and increase sales to new and existing customers. We price our services on a tiered subscription model based on the customer’s use of our services (principally, email volumes), and therefore the revenue we generate from our customers depends on their use of our services. We have only a limited salesforce and to date have relied primarily on our self-service model to generate our revenue. The amount that new and existing customers purchase, renew, and use our services depends on a number of factors, including those outside of our control.
We may fail to attract new customers, retain existing customers or increase sales to new or existing customers as a result of a number of factors, including: reductions in our current or potential customers’ spending levels; competitive factors affecting the cloud-based business software market, including the introduction of competing platforms, discount pricing and other strategies that may be implemented by our competitors; our ability to execute on our growth strategy and operating plans; a decline in our customers’ level of satisfaction with our platform and customers’ usage of our platform or an increased perception by our customers’ that they can manage their email distribution and marketing efforts internally or otherwise without use of our platform; reductions in the use of email as a digital communication channel; the difficulty and cost to switch to a competitor may not be significant for many of our customers; changes in our relationships with third parties, including our strategic partners and payment processors; the timeliness and success of new services and functionality we may offer now or in the future, including our Marketing Campaigns service that we introduced in late 2015; concerns relating to actual or perceived security breaches; the frequency and severity of any system outages; and technological changes or problems. In addition, we believe a relatively small number of businesses have more than one unique paying account with us, and we count each of these accounts as a separate customer. We believe our number of customers is an important measure for evaluating our business. Because some businesses have more than one unique paying account with us and we count each of these accounts as a separate customer, the number of our customers set forth in this Annual Report on Form 10-K for any period is not necessarily indicative of the number of unique businesses from which we received revenue during any such period. We rely on our reputation and recommendations from key customers in order to promote our platform. The loss of any of our key customers could have a significant impact on our business reputation and our ability to obtain new customers. In addition, acquisitions of our customers could lead to cancellation of our contracts with those customers or by the acquiring companies.
Failure to attract new customers, retain existing customers or increase sales to customers will harm our business and results of operations.
Our limited operating history in new and developing markets and our rapid growth make it difficult to evaluate our current business and future prospects.
We introduced our Email API service in 2009, our Marketing Campaigns service in late 2015, and our Expert Services in 2016. The majority of our revenue growth has occurred in the last few years and was derived from the sale of subscriptions to our Email API service. This short operating history and our rapid growth make it difficult to evaluate our future prospects. Our ability to forecast our future operating results is subject to a number of uncertainties, including our ability to plan for and model future growth, particularly with respect to our most recently introduced services. If our assumptions regarding these uncertainties are incorrect or change in reaction to changes in our markets, or if we do not address these risks successfully, our operating and financial results could differ materially from our historical and expected operating and financial results, our business could suffer, and the trading price of our stock may decline.
We also operate in new and developing markets that may not continue to develop as we expect. You should consider our future prospects in light of the challenges and uncertainties that we face, including the fact that our business has grown rapidly, and it may not be possible to discern fully the trends that we are subject to, that we operate in new and developing markets and that elements of our business strategy are new and subject to ongoing development. We have encountered and will continue to encounter risks and difficulties frequently experienced by growing companies in rapidly changing industries, including increasing and unforeseen expenses as we continue to grow our business. If we do not manage these risks successfully, our business and results of operations will be harmed.
19
If we are unable to increase adoption of our platform through our self-service model, our business, results of operations, and financial condition may be adversely affected.
Historically, we have relied on the adoption of our platform through our self-service model for a significant majority of our revenue. We have only a limited salesforce. Although we believe our business model can continue to scale without a significantly larger salesforce, our self-service model may not continue to be as effective as we anticipate, and the absence of a large direct sales function may impede our future growth.
As we continue to scale our business, we may choose to invest in a larger direct salesforce to reach additional customers and grow our revenue. Our ability to manage a larger direct salesforce is uncertain. Identifying and recruiting additional qualified sales personnel and managing and training them once hired would require significant time, expense and attention and would significantly impact our business model. In addition, adding additional salesforce would considerably change our cost structure and results of operations, and we may have to reduce other expenses, such as our research and development expense, in order to accommodate a corresponding increase in marketing and sales expense and attain and maintain profitability. If our lack of a large direct salesforce limits us from reaching additional customers and growing our revenue and we are unable to hire, develop and retain talented sales personnel in the future, our revenue growth and results of operations may be harmed.
Our growth depends in part on the success of our strategic relationships with third parties to sell our services.
We have established strategic relationships with a number of other companies, including public cloud infrastructure providers and ecommerce platforms, software vendors that offer complementary products and with which we co-sell our services and digital marketing agencies that resell our services to their clients. In order to grow our business, we anticipate that we will continue to establish and maintain these strategic relationships. Identifying strategic partners, and negotiating and documenting relationships with them, requires significant time and resources. Our competitors may be effective in providing incentives to third parties to favor their products or services over ours or to prevent or reduce subscriptions to our platform. In addition, acquisitions of our strategic partners by our competitors, or acquisition of our competitors by our strategic partners, could result in a decrease in the number of our current and potential customers, as our strategic partners may no longer facilitate the adoption of our platform by potential customers.
If we are unsuccessful in establishing or maintaining our strategic relationships with third parties, our ability to compete or to grow our revenues could be impaired and our operating results could suffer. Even if we are successful in our strategic relationships, we cannot assure you that these relationships will result in increased usage of our services or increased revenues.
Our future success depends in part on our ability to continue to drive adoption of our platform and services by international customers, and our international operations and sales to customers with international operations expose us to risks inherent in international sales.
We generated more than 36% of our revenue in each of the last three years from customers located outside the United States. The future success of our business will depend, in part, on our ability to continue to expand our customer base worldwide and to sell additional services to international customers.
If we are unable to successfully market our platform to or localize our services for international customers, then our business, results of operations, and financial condition may be adversely affected, and our growth may be constrained.
We have limited experience operating in international markets where the challenges of conducting our business can be significantly different from those we have faced in the United States and the existing markets in which we operate and where business practices may create internal control risks. We have only recently established operations outside of the United States, with the opening of an office in London. We may open additional non-U.S. offices in the future. There are a number of risks inherent in conducting international business, including:
|
· |
fluctuations in foreign currency exchange rates; |
20
|
· |
the burden of complying with a wide variety of laws and regulatory regimes, including those relating to labor matters, consumer and data protection, privacy, network security, encryption, and taxes; |
|
· |
tariffs, export and import restrictions, restrictions on foreign investments, sanctions, and other trade barriers or protection measures; |
|
· |
costs and difficulties of localizing our services; |
|
· |
lack of acceptance of our localized services; |
|
· |
difficulties in and costs of staffing, managing, and operating our international operations; |
|
· |
tax issues, including restrictions on repatriating earnings and with respect to our corporate operating structure and intercompany arrangements; |
|
· |
weaker intellectual property protection; |
|
· |
economic weakness or currency related crises; |
|
· |
limitations on the ability of our self-service sales model to attract international customers; |
|
· |
our limited historical sale experience outside the United States; |
|
· |
our ability to adapt to our marketing and selling efforts to different cultures and customer requirements; |
|
· |
common local business behaviors that are in direct conflict with our policies and codes of conduct and ethics; |
|
· |
corporate espionage; and |
|
· |
political instability and security risks in the countries where we are doing business. |
If we are unable to effectively manage these risks, our relationships with our existing and prospective customers, strategic partners and employees and our operations outside of the United States may be adversely affected.
If we are not able to maintain and enhance our brand and maintain and increase market awareness of our company and services, then our business, results of operations, and financial condition may be adversely affected.
We believe that maintaining and enhancing the “SendGrid” brand identity and maintaining and increasing market awareness of our company and services is critical to achieving widespread acceptance of our platform, to strengthen our relationships with our existing customers and to our ability to attract new customers. The successful promotion of our brand will depend largely on our continued marketing efforts, our ability to continue to offer high quality services, our ability to be thought leaders in our industry and our ability to successfully differentiate our platform and services from competing products and services. For example, we rely on both algorithmic and purchased listings displayed by search engines to attract a significant percentage of the customers. Algorithmic listings cannot be purchased, and instead are determined and displayed solely by a set of formulas designed by the search engine. Purchased listings can be purchased by advertisers in order to attract customers to their websites, but the cost of purchased search listing advertising may increase as demand for these channels grows. If search engines on which we rely for algorithmic listings modify their algorithms in an attempt to optimize their search listings, this could result in fewer potential customers clicking through to our website, requiring us to resort to additional purchased listings or other costly advertisements to attempt to replace this traffic. If one or more search engines on which we rely for purchased listings modifies or terminates its relationship with us, or increases the amounts it charges us, our expenses could rise. Any such increases could negatively affect market awareness of our brand and our business, results of operations, and financial condition.
In addition, independent industry analysts often provide reviews of our services and competing products and services, which may significantly influence the perception of our services in the marketplace. If these reviews are negative or not
21
as strong as reviews of our competitors’ products and services, then our brand may be harmed. This may cause us to lose existing customers, decrease the number of new customers that we are able to attract or lower our pricing model, each of which would likely harm our results of operations.
From time to time, our customers and other third parties have complained about our platform, such as complaints about our pricing and customer support or the use of our platform to transmit spam, phishing scams, website links to harmful applications or other harmful or illegal material. If we do not handle customer and other complaints effectively, then our brand and reputation may suffer, our customers may lose confidence in us and our customers may reduce or cease their use of our services. In addition, many of our customers post about and discuss Internet-based products and services, including our platform and services, on social media. Our success depends, in part, on our ability to generate positive customer feedback and minimize negative feedback on social media channels where existing and potential customers seek and share information. If actions we take or changes we make to our platform or services, particularly as our platform continues to scale, upset these customers then their online commentary could negatively affect our brand and reputation. Complaints or negative publicity about us, our platform or our services could materially and adversely impact our ability to attract and retain customers, our business, results of operations, and financial condition.
The promotion of our brand also requires us to make substantial expenditures, and we anticipate that these expenditures will increase as our market becomes more competitive and as we expand into new markets. To the extent that these activities increase revenue, this revenue still may not be enough to offset the increased expenses we incur. If we do not successfully maintain and enhance our brand, then our business may not grow, we may see our pricing power reduced relative to competitors and we may lose customers, all of which would adversely affect our business, results of operations, and financial condition.
The market in which we participate is highly competitive and, if we do not compete effectively, our operating results could be harmed.
We provide cloud-based services that enable businesses to reach their customers using email for both transactional and marketing purposes. The market for providing these services is fragmented, with some vendors addressing transactional email services, some vendors addressing email marketing services and other vendors providing a broad array of services that include transactional and marketing services as part of a software suite or broader portfolio of software offerings. Notwithstanding the availability of third-party software services, some businesses rely on internally-developed solutions for their email communications needs. The market for digital communications services is rapidly evolving, creating opportunity for new competitors to enter the market with point product solutions or addressing specific segments of the market. In addition, in some instances, we have strategic or other commercial relationships with companies with which we also compete, such as Amazon Web Services. Our competitors include:
|
· |
Companies that offer transactional email services, including Amazon, Mailgun, Oracle and SparkPost; and |
|
· |
Companies that offer email marketing services, including Adobe, Campaign Monitor, Endurance, IBM, MailChimp, Oracle and Salesforce. |
We believe the principal factors on which we compete include: completeness of offering; credibility with developers and marketers; global reach; ease of adoption; features and functionality; platform scalability, reliability, security, and performance; brand awareness and reputation; integration with third-party applications and data sources; customer support; and the total cost of deployment and ownership. Our current and potential competitors may develop and market new technologies with similar or superior functionality to our platform or at a cheaper price point that render our existing or future services less competitive or obsolete, and we may need to decrease the prices or accept less favorable terms for subscriptions for our services in order to remain competitive. If we are unable to maintain our pricing due to competitive pressures, our margins will be reduced, and our operating results will be negatively affected.
Our current and potential competitors also may have significantly more financial, technical, marketing, and other resources than we have, may be able to devote greater resources to the development, promotion, sale and support of their products and services, may have more extensive customer bases and broader customer relationships and may have longer operating histories and greater name recognition. As a result, these competitors may respond faster to new technologies and undertake more extensive marketing programs for their products or services. If these companies decide to further invest in
22
and develop, market, or resell competitive products or services, or acquire or form a strategic alliance with one of our other competitors, our ability to compete effectively could be significantly compromised and our operating results could be harmed. In a few cases, these vendors may offer competitive products or services at little or no additional cost by bundling it with their existing suite of applications. To the extent any of our competitors has existing relationships with potential customers for either email software or other applications, those customers may be unwilling to purchase our platform because of their existing relationships with our competitor. If we are unable to compete with such companies, the demand for our platform and services could substantially decline.
If our security measures are breached or unauthorized access to our or our customers’ and their end customers’ private or proprietary data is otherwise obtained, our platform or services may be perceived as not being secure, our reputation may be severely harmed, customers may reduce the use of or stop using our services, we may incur significant liabilities and we may lose the ability to offer our customers a credit card payment option.
Our operations involve the storage and transmission of data of our customers and their end customers, including personally identifiable information. Security breaches or other incidents could result in unauthorized access to, loss of or unauthorized disclosure of this information, litigation, indemnity obligations and other possible liabilities, as well as negative publicity, which could damage our reputation, impair our sales, and harm our customers and our business. Cyberattacks and other malicious Internet-based activity continue to increase generally, and cloud-based service providers like us are regularly targeted. For example, in 2013, we suffered a distributed denial of service attack, whereby a cybercriminal denied our customers access to our webpage and, in 2015, a cybercriminal gained unauthorized access to several of our internal systems, including those containing sensitive and confidential customer data. It is possible that we may face increased risk of cybersecurity attacks as compromising our platform may allow cybercriminals to send a large number of phishing emails that bypasses end users’ spam filters. If our security measures are compromised as a result of third-party action, employee or customer error, malfeasance, stolen or fraudulently obtained log-in credentials or otherwise, our reputation could be damaged, our business may be harmed, and we could incur significant liability. In addition, if the security measures of our customers are compromised, even without any actual compromise of our own systems, we may face negative publicity or reputational harm if our customers or anyone else incorrectly attributes the blame for such security breaches to us or our systems. We may be unable to anticipate or prevent techniques used to obtain unauthorized access or to sabotage our systems because they change frequently and generally are not detected until after an incident has occurred. As we increase our customer base and our brand becomes more widely known and recognized, we may become more of a target for third parties seeking to compromise our security systems or gain unauthorized access to our customers’ data. Further, as we rely more on third-party and public-cloud infrastructure, such as Amazon Web Services, we will become more dependent on third-party security measures to protect against unauthorized access, cyberattacks and the mishandling of customer data. Any security breach, whether actual or perceived, would harm our reputation, and we could lose customers and fail to acquire new customers. In addition, many governments have enacted laws requiring companies to notify individuals of data security incidents involving certain types of personal data and any mandatory disclosures we may make regarding a security breach would likely lead to widespread negative publicity, which may cause our customers to lose confidence in the effectiveness of our data security measures. It is also possible that security breaches sustained by our competitors could result in negative publicity for our entire industry that indirectly harms our reputation and diminishes demand for our services.
Furthermore, failure to maintain compliance with the data protection policy standards adopted by the major credit card issuers and other payment processors may limit our ability to offer our customers a credit card or online payment option. Any loss of our ability to offer our customers a credit card payment or online payment option would harm our reputation and make our platform and services less attractive to many organizations by negatively impacting our customer experience and significantly increasing our administrative costs related to customer payment processing.
Our existing general liability insurance may not cover any, or cover only a portion of any, potential claims related to security breaches to which we are exposed or may not be adequate to indemnify us for all or any portion of liabilities that may be imposed. In addition, there can be no assurance that the limitations on liability in our contracts would be enforceable or adequate or would otherwise protect us from any such liabilities with respect to any particular claim. Any imposition of liability that is not covered by insurance or is in excess of insurance coverage would increase our operating expenses and reduce our net income.
23
Our customers’ and other users’ violation of our policies or other misuse of our platform to transmit offensive or illegal messages, phish, spam, website links to harmful applications or for other fraudulent activity could damage our reputation, and we may face liability for unauthorized, inaccurate, or fraudulent information distributed via our platform.
Despite our ongoing and substantial efforts to limit such use, a portion of our customers use our platform to transmit offensive or illegal messages, spam, phishing scams, and website links to harmful applications, reproduce and distribute copyrighted material or the trademarks of others without permission, and report inaccurate or fraudulent data or information. These issues also arise with respect to a portion of those users who use our platform on a free trial basis. These actions are in violation of our policies. However, our efforts to defeat spamming attacks and other fraudulent activity will not prevent all such attacks and activity, such use of our platform could damage our reputation and we could face claims for damages, copyright or trademark infringement, defamation, negligence, or fraud. Moreover, our customers’ and other users’ promotion of their products and services through our platform might not comply with federal, state, and foreign laws. We rely on contractual representations made to us by our customers that their use of our platform will comply with our policies and applicable law, including, without limitation, our email policy. Although we retain the right to verify that customers and other users are abiding by our email policy and to review their email and email lists, our customers and other users are ultimately responsible for compliance with our policies, and we do not systematically audit our customers or other users to confirm compliance with our policies. We cannot predict whether our role in facilitating our customers’ or other users’ activities would expose us to liability under applicable law. Even if claims asserted against us do not result in liability, we may incur substantial costs in investigating and defending such claims. If we are found liable for our customers’ or other users’ activities, we could be required to pay fines or penalties, redesign business methods or otherwise expend resources to remedy any damages caused by such actions and to avoid future liability.
Real or perceived errors, failures, vulnerabilities, or bugs in our software could adversely affect our business, results of operations, financial condition, and growth prospects.
Our platform is complex, and therefore, undetected errors, failures or bugs may occur, particularly as we continue to scale our platform to accommodate future growth. Our platform may be used in IT environments with different operating systems, system management software, applications, devices, databases and equipment and networking configurations, which may cause errors or failures of our platform or other aspects of the IT environment into which it is deployed. Despite testing by us, errors, failures, or bugs may not be found until our platform is used by our customers. Real or perceived errors, failures or bugs in our platform or services could result in negative publicity, loss of or delay in market acceptance of our platform or services, weakening of our competitive position, claims by customers for losses sustained by them or failure to meet any stated service level commitments in our customer agreements. For example, in November 2017, while making changes to increase stability in our system, a subset of recipient data was relocated within one of our data centers. During the relocation, this subset of recipient data did not fully propagate for some customer accounts, resulting in the decision to suspend Marketing Campaigns email sending for several hours until recipient data was restored. Correcting any of these problems could require significant expenditures of our capital and other resources and could cause interruptions, delays, or cessation in the sale of our services, which could cause us to lose existing or potential customers and adversely affect our business, results of operations, and financial condition.
Our platform and services and our business are subject to a variety of U.S. and international laws and regulations, including those regarding privacy, data protection and information security. Any failure by us or our third-party service providers, as well as the failure of our platform or services to comply with applicable laws and regulations would harm our business, results of operations, and financial condition.
We are subject to a variety of laws and regulations, including regulation by various federal government agencies, including the U.S. Federal Trade Commission, or FTC, and state and local agencies. The United States and various state and foreign governments have adopted or proposed limitations on, or requirements regarding, the collection, distribution, use, security, and storage of personally identifiable information of individuals, and the FTC and many state attorneys general are applying federal and state consumer protection laws to impose standards on the online collection, use and dissemination of data. Self-regulatory obligations, other industry standards, policies and other legal obligations may apply to our collection, distribution, use, security or storage of personally identifiable information or other data relating to individuals. In addition, the federal government and many states and foreign governments have enacted laws requiring companies to
24
notify individuals of data security breaches involving certain types of personal data. These obligations may be interpreted and applied in an inconsistent manner from one jurisdiction to another and may conflict with one another, other regulatory requirements, or our internal practices. Any failure or perceived failure by us to comply with United States, European Union or other foreign privacy or security laws, regulations, policies, industry standards or legal obligations or any security incident that results in the unauthorized access to, or acquisition, release or transfer of, personally identifiable information or other customer data may result in governmental enforcement actions, litigation, fines and penalties or adverse publicity and could cause our customers to lose trust in us, which could have an adverse effect on our reputation and business.
We expect that there will continue to be new proposed laws, regulations and industry standards concerning privacy, data protection and information security in the United States, the European Union, and other jurisdictions, and we cannot yet determine the impact such future laws, regulations and standards may have on our business. For example, in May 2018, the general data protection regulation will come into force, bringing with it a complete overhaul of E.U. data protection laws: the new rules will supersede current E.U. data protection legislation, impose more stringent E.U. data protection requirements, and provide for greater penalties for noncompliance. Changing definitions of personal data and information may also limit or inhibit our ability to operate or expand our business, including limiting strategic partnerships that may involve the sharing of data. Also, some jurisdictions require that certain types of data be retained on servers within these jurisdictions. Our failure to comply with applicable laws, directives and regulations may result in enforcement action against us, including fines and imprisonment, and damage to our reputation, any of which may have an adverse effect on our business and operating results. In 2016, the European Union and the United States political authorities adopted the E.U.-U.S. Privacy Shield, or Privacy Shield, to enable companies in the United States to transfer personal data lawfully from the European Union and Switzerland to the United States. Organizations in the United States may participate in the Privacy Shield program once they have satisfied a series of requirements (as contained in a set of privacy-protective principles), which are designed to ensure they will continue to provide a level of data protection deemed “adequate” by the European Commission. The Privacy Shield is administered by the U.S. Department of Commerce and the European Commission. In December 2017, we obtained our E.U.-U.S. Privacy Shield certification and Swiss-U.S. Privacy Shield certification. By submitting our self-certifications to these Privacy Shield frameworks, we have committed to apply the frameworks’ principles to all personal information received by us from the European Economic Area and Switzerland in reliance on these frameworks. These frameworks enable us to lawfully collect, receive and process personal data from the European Union and Switzerland.
We publicly post our privacy policies and practices concerning our processing, use and disclosure of the personally identifiable information provided to us by our website visitors. Our publication of our privacy policies and other statements we publish that provide promises and assurances about privacy and security can subject us to potential state and federal action if they are found to be deceptive or misrepresentative of our practices.
If our service is perceived to cause, or is otherwise unfavorably associated with, violations of privacy or data security requirements, it may subject us or our customers to public criticism and potential legal liability. Existing and potential privacy laws and regulations concerning privacy and data security and increasing sensitivity of consumers to unauthorized processing of personal information may create negative public reactions to technologies, products, and services such as ours. Public concerns regarding personal information processing, privacy and security may cause some of our customers’ end users to be less likely to visit their websites or otherwise interact with them. If enough end users choose not to visit our customers’ websites or otherwise interact with them, our customers could stop using our platform. This, in turn, may reduce the value of our services and slow or eliminate the growth of our business.
Evolving and changing definitions of what constitutes “Personal Information” and “Personal Data” within the European Union, the United States and elsewhere, especially relating to the classification of internet protocol, or IP, addresses, machine or device identification numbers, location data and other information, may limit or inhibit our ability to operate or expand our business. Future laws, regulations, standards, and other obligations could impair our ability to collect or use information that we utilize to provide email delivery and marketing services to our customers, thereby impairing our ability to maintain and grow our customer base and increase revenue. Future restrictions on the collection, use, sharing or disclosure of our customers’ data or additional requirements for express or implied consent of customers for the use and disclosure of such information limit our ability to develop new services and features.
25
United States federal legislation and the laws of many foreign countries impose certain obligations on the senders of commercial emails, which could minimize the effectiveness of our platform, and establish financial penalties for non-compliance, which could increase the costs of our business.
The Federal Controlling the Assault of Non-Solicited Pornography and Marketing Act of 2003, or the CAN-SPAM Act, establishes certain requirements for commercial email messages and transactional email messages and specifies penalties for the transmission of email messages that are intended to deceive the recipient as to source or content. The CAN-SPAM Act, among other things, obligates the sender of commercial emails to provide recipients with the ability to opt out of receiving future commercial emails from the sender. In addition, some states have passed laws regulating commercial email practices that are significantly more restrictive and difficult to comply with than the CAN-SPAM Act. For example, Utah and Michigan prohibit the sending of email messages that advertise products or services that minors are prohibited by law from purchasing (e.g., alcoholic beverages, tobacco products, illegal drugs) or that contain content harmful to minors (e.g., pornography) to email addresses listed on specified child protection registries. Some portions of these state laws may not be preempted by the CAN-SPAM Act. In addition, certain foreign jurisdictions, such as Australia, Canada, and the European Union, have enacted laws that regulate sending email, and some of these laws are more restrictive than U.S. laws. For example, some foreign laws prohibit sending broad categories of email unless the recipient has provided the sender advance consent to receipt of such email, or in other words has “opted-in” to receiving such email. If we were found to be in violation of the CAN-SPAM Act, applicable state laws governing email not preempted by the CAN-SPAM Act or foreign laws regulating the distribution of email, whether as a result of violations by our customers or our own acts or omissions, we could be required to pay large penalties, which would adversely affect our financial condition, significantly harm our business, and injure our reputation. The terms of injunctions, judgments, consent decrees or settlement agreements entered into connection with enforcement actions or investigations against our company in connection with any of the foregoing laws may also require us to change one or more aspects of the way we operate our business, which could impair our ability to attract and retain customers or could increase our operating costs.
The standards that private entities and inbox service providers use to regulate the use and delivery of email have in the past interfered with, and may in the future interfere with, the effectiveness of our platform and our ability to conduct business.
Our customers rely on email to communicate with their existing or prospective customers. Various private entities attempt to regulate the use of email for commercial solicitation. These entities often advocate standards of conduct or practice that significantly exceed current legal requirements and classify certain email solicitations that comply with current legal requirements as spam. Some of these entities maintain “blacklists” of companies and individuals, and the websites, inbox service providers and IP addresses associated with those entities or individuals that do not adhere to those standards of conduct or practices for commercial email solicitations that the blacklisting entity believes are appropriate. If a company’s IP addresses are listed by a blacklisting entity, emails sent from those addresses may be blocked if they are sent to any internet domain or internet address that subscribes to the blacklisting entity’s service or uses its blacklist.
From time to time, some of our IP addresses have become, and we expect will continue to be, listed with one or more blacklisting entities due to the messaging practices of our customers and other users. We may be at an increased risk of having our IP addresses blacklisted due to our scale and volume of email processed, compared to our smaller competitors. While the overall percentage of such email solicitations that our individual customers send may be at or below reasonable standards, the total aggregate number of all emails that we process on behalf of our customers may trigger increased scrutiny from these blacklisting entities. There can be no guarantee that we will be able to successfully remove ourselves from those lists. Because we fulfill email delivery on behalf of our customers, blacklisting of this type could undermine the effectiveness of our customers’ transactional email, email marketing programs and other email communications, all of which could have a material negative impact on our business and results of operations.
Additionally, inbox service providers can block emails from reaching their users. While we continually improve our own technology and work closely with inbox service providers to maintain our deliverability rates, the implementation of new or more restrictive policies by inbox service providers may make it more difficult to deliver our customers’ emails, particularly if we are not given adequate notice of a change in policy or struggle to update our platform or services to comply with the changed policy in a reasonable amount of time. In addition, some inbox service providers categorize as “promotional” emails that originate from email service providers and, as a result, direct them to an alternate or “tabbed”
26
section of the recipient’s inbox. If inbox service providers materially limit or halt the delivery of our customers’ emails, or if we fail to deliver our customers’ emails in a manner compatible with inbox service providers’ email handling or authentication technologies or other policies, or if the open rates of our customers’ emails are negatively impacted by the actions of inbox service providers to categorize emails, then customers may question the effectiveness of our platform and cancel their accounts. This, in turn, would harm our business and financial condition.
We are subject to governmental export controls and economic sanctions and anti-corruption laws and regulations that could impair our ability to compete in international markets and subject us to liability if we are not in compliance with applicable laws.
Various of our operations and services may be subject to export control and economic sanctions regulations, including the U.S. Export Administration Regulations, U.S. Customs regulations and various economic and trade sanctions regulations administered by the U.S. Treasury Department’s Office of Foreign Assets Controls. The provision of our services must be made in compliance with these laws and regulations. Obtaining the necessary authorizations, including any required license, for a particular deployment may be time-consuming, is not guaranteed and may result in the delay or loss of sales opportunities. In addition, changes in our platform capabilities or services, or changes in applicable export or economic sanctions regulations may create delays in the introduction and deployment of our platform and services in international markets, or, in some cases, prevent the provision of our services to certain countries or end users. Any change in export or economic sanctions regulations, shift in the enforcement or scope of existing regulations, or change in the countries, governments, persons, or technologies targeted by such regulations, could also result in decreased use of our platform and services, or in our decreased ability to provide our services to existing or prospective customers with international operations. Any decreased use of our platform and services or limitation on our ability to provide our services could adversely affect our business, results of operations, and financial condition.
Furthermore, U.S. export control laws and economic sanctions prohibit the exportation of certain products and services to countries, territories, governments, and persons targeted by U.S. sanctions. While we are currently taking precautions to prevent our platform from being accessed by persons targeted by U.S. sanctions, including IP address blocking, such measures may be circumvented. Given the technical limitations in developing measures that will prevent access to internet based services from particular geographies or by particular individuals, we have previously identified and expect we will continue to identify customer accounts for our platform and services that originate or that we suspect originate from countries that are subject to U.S. embargoes.
We are aware that trials of and subscriptions to our platform have been initiated by persons and organizations in countries that are the subject of U.S. embargoes. Our provision of services in these instances was likely in violation of trade sanctions laws. We have terminated the accounts of such persons and organizations as we have become aware of them. We filed an initial voluntary self-disclosure with the U.S. Department of Treasury’s Office of Foreign Assets Control, or OFAC, in February 2016 concerning these potential violations. In December 2017, OFAC informed us it had completed its review of our voluntary self-disclosure and issued a cautionary letter instead of pursuing a civil monetary penalty. The cautionary letter is a final enforcement response but does not constitute a final agency determination and does not preclude OFAC from taking future enforcement action should new or additional information warrant renewed attention.
Our failure to comply with U.S. sanctions or export control laws or regulations could cause us and certain of our employees to be subject to substantial civil or criminal penalties, including the possible loss of export privileges; fines, which may be imposed on us and responsible employees or managers; and, in extreme cases, the incarceration of responsible employees or managers. Each instance in which we allow access to our platform may constitute a separate violation of these laws. We may also suffer reputational harm.
Further, we incorporate encryption technology into certain of our platform functions and services. Various countries regulate the import of certain encryption technology, including through import permitting and licensing requirements, and have enacted laws that could limit our customers’ ability to import our services into those countries. Encryption products and the underlying technology may also be subject to export control restrictions. Governmental regulation of encryption technology and regulation of exports of encryption products, or our failure to obtain required approval for our services, when applicable, could harm our international sales and adversely affect our revenue. Compliance with applicable regulatory requirements regarding the provision of our services, including with respect to new services, may create delays in the introduction of our services in international markets, prevent our customers with international operations from
27
deploying our platform and using our services throughout their globally-distributed systems or, in some cases, prevent the provision of our services to some countries altogether.
Additionally, we are subject to the Foreign Corrupt Practices Act, or FCPA, the U.K. Bribery Act and other anti-corruption, anti-bribery, and anti-money laundering laws in various jurisdictions both domestic and abroad. We and our third-party business partners and intermediaries may have direct or indirect interactions with officials and employees of government agencies or state-owned or affiliated entities and may be held liable for the corrupt or other illegal activities of these third-party business partners and intermediaries, our employees, representatives, contractors, channel partners, and agents, even if we do not explicitly authorize such activities. While we have policies and procedures in place to address compliance with such laws, we cannot assure you that all of our employees and agents will not take actions in violation of our policies and applicable law, for which we may be ultimately held responsible. Any violation of the FCPA or other applicable anti-bribery, anti-corruption laws, and anti-money laundering laws could result in whistleblower complaints, adverse media coverage, investigations, loss of export privileges, severe criminal or civil sanctions, or suspension or debarment from U.S. government contracts, all of which may have an adverse effect on our reputation, business, operating results, and prospects.
If we are unable to develop and release enhancements to our platform and services or new services and functionality to respond to rapid technological change in a timely and cost-effective manner, our business, operating results, and financial condition could be adversely affected.
The market for our platform and services is characterized by rapid technological change, frequent new product and service introductions and enhancements, changing customer demands, and evolving industry standards. The introduction of products and services embodying new technologies can quickly make existing products and services obsolete and unmarketable. For example, new Internet standards and technologies or new standards in the field of operating system support could emerge that are incompatible with customer deployments of our platform. The success of any enhancements or improvements to our platform or any new services or functionality depends on several factors, including timely completion, competitive pricing, adequate quality testing, integration with existing technologies and our platform, and overall market acceptance. We cannot be sure that we will succeed in developing, marketing, and delivering on a timely and cost-effective basis enhancements or improvements to our platform or any services or functionality that respond to technological change or new customer requirements, nor can we be sure that any enhancements or improvements to our platform will achieve market acceptance. For example, we introduced our Marketing Campaigns service in late 2015 and the service may not achieve broad market acceptance or be cost-effective in the long term.
Further, our success depends on meeting customer demands and expectations both with respect to the ability of our API to integrate within their applications and the speed, reliability, and effectiveness of our platform. For example, if we are unable to adapt our platform on a timely basis to new email or operating system protocols or we fail to effectively integrate our API with new technologies and standards, the ability of our platform to integrate with our customers’ systems or satisfy our customers’ needs may be impaired. In addition, because we use both co-located data centers and public cloud resources to host our platform, we need to continually enhance and improve our platform to keep pace with changes in Internet-related hardware, software, communications, and database technologies and standards. As we transition to Amazon Web Services to host a portion of our platform, we will become more dependent on third parties to keep pace with such changes. If we cannot deliver technologically competitive services, we could lose customers and our revenues and stock price may decline.
Any new services or functionality that we develop may not be introduced in a timely or cost-effective manner, may contain errors or defects, or may not achieve the broad market acceptance necessary to generate sufficient revenue. Moreover, even if we introduce new services or functionality, we may experience a decline in revenue of our existing services that is not offset by revenue from the new services or functionality. For example, customers may delay making purchases of new services to permit them to make a more thorough evaluation of these services or until industry and marketplace reviews become widely available. In addition, we may lose existing customers that choose a competitor’s products and services or that choose to rely on an internally-developed solution, rather than migrate to our new services. Similarly, if we offer a bundle of our services that our customers and prospective customers do not find compelling, our business will be harmed. This could result in a temporary or permanent revenue shortfall and adversely affect our business.
28
We may not be able to scale our technology infrastructure and platform quickly enough to meet our customers’ growing needs and if we are not able to grow efficiently, our operating results could be harmed.
As usage of our platform grows, we will need to continue making significant investments to develop and implement new technologies in our infrastructure operations to support our growth. In addition, we will need to appropriately scale our internal business systems and our services organization, including basic customer support and our Expert Services team, to serve our growing customer base. Any failure of, or delay in, these efforts could impair the performance of our platform and reduce customer satisfaction and reduce our growth. Even if we are able to upgrade our systems and expand our staff, any such expansion may be expensive and complex. To the extent that we do not effectively scale our platform and infrastructure to meet the growing needs of our customers or are not able to manage that growth effectively, we may not be able to grow as quickly as we anticipate, our customers may reduce or stop use of our services, we may be unable to compete effectively, and our business and operating results may be harmed.
We are primarily dependent on a single service, our Email API service, and the lack of continued market acceptance of our Email API service could cause our operating results to suffer.
Sales of our Email API service account for a substantial majority of our revenue. We expect that we will be substantially dependent on our Email API service to generate revenue for the foreseeable future. As a result, our operating results could suffer due to:
|
· |
any decline in demand for our Email API service; |
|
· |
the failure of our Email API service to achieve continued market acceptance; |
|
· |
the market for our Email API service not continuing to grow, or growing more slowly than we expect; |
|
· |
the introduction or increase in popularity of products and technologies that serve as a replacement or substitute for, or represent an improvement over, our Email API service; |
|
· |
technological innovations or new standards that our Email API service does not address; |
|
· |
sensitivity to current or future prices offered by us or competing solutions; |
|
· |
our inability to release enhanced versions of our Email API service on a timely basis; and |
|
· |
the continued use and ubiquity of email in commercial transactions and applications. |
If the market for our Email API service grows more slowly than anticipated or if demand for our Email API service does not grow as quickly as anticipated, we may not be able to grow our revenue.
Our services are sold on a short-term basis, such that subscription renewal or usage rates can decrease rapidly, and if we do not accurately predict these rates, our future revenue and operating results may be harmed.
We charge our customers based on their use of our services. We generally enter into monthly subscription agreements with our customers and, therefore, most of our customers may reduce or cease their use of our services on a monthly basis without penalty or termination charges. Our retention of customers and our customers’ use of our services are used to determine our subscription net dollar retention rate. We believe subscription net dollar retention rate is an important measure for evaluating our business. Additionally, our subscription agreements for use of our Email API service include a fixed fee that covers a specified number of email credits in the applicable month. If our customers lower the number of email credits they purchase in any month, then the fixed fees we charge will decrease. We have historically experienced customer turnover as a result of many of our customers being SMBs in the entrepreneurial stage of their development that are more susceptible than larger businesses to general economic conditions and other risks affecting their businesses. We cannot accurately predict customers’ usage levels on a monthly basis and the loss of customers or reductions in their usage levels of our services may each have a negative impact on our business, results of operations, and financial condition,
29
including our subscription net dollar retention rate and our subscription gross dollar churn rate, which is a component of our subscription net dollar retention rate.
Any failure to offer high-quality support may harm our relationships with our customers and have a negative impact on our business and financial condition.
Our customers depend on our customer support team to resolve technical and operational issues relating to our platform. Our ability to provide effective customer support is largely dependent on our ability to attract, train, and retain qualified personnel with experience in supporting customers on platforms such as ours. Our customer base has grown significantly and that has and will put additional pressure on our customer support team. We may be unable to respond quickly enough to accommodate short-term increases in customer demand for support. We also may be unable to modify the scope and delivery of our support to compete with changes in the support provided by our competitors. Increased customer demand for support, without corresponding revenue, could increase costs and negatively affect our operating results. In addition, as we continue to grow our operations and expand internationally, we need to be able to provide efficient customer support that meets our customers’ needs globally at scale and our customer support team will face additional challenges, including those associated with delivering support and documentation in languages other than English. If we are unable to provide efficient customer support globally at scale, our ability to grow our operations may be harmed and we may need to hire additional support personnel, which could negatively impact our operating results. In addition, we provide self-service support resources to our customers, such as our best practice guides and webcasts hosted on our website. We also rely on our user community to serve as a resource for questions on any part of our platform. Members of our user community are not obligated to participate in discussions with other users, and to the extent they do not our customers’ ability to find answers to questions about our platform of services may suffer. If we are unable to develop self-service support resources that are easy to use and that our customers utilize to resolve their technical issues or if our customers choose not to take advantage of these self-service support services, customers may continue to direct support requests to our customer support team instead of relying on our self-service support resources and our customers’ experience with our platform may be negatively impacted. Any failure to maintain high-quality support, or a market perception that we do not maintain high-quality support, could harm our reputation, our ability to sell our services to existing and prospective customers, and our business, operating results, and financial condition.
To deliver our services, we rely on internet service providers for network connectivity and co-location facilities and public cloud infrastructure to host our platform.
We interconnect with internet service providers around the world to enable the use of our platform by our customers and we expect that we will continue to rely heavily on internet service providers for network connectivity going forward. Our reliance on internet service providers reduces our control over quality of service and exposes us to potential service outages and rate fluctuations. If a significant portion of our internet service providers stop providing us with access to their network infrastructure, fail to provide access on a cost-effective basis, cease operations, or otherwise terminate access, the delay caused by qualifying and switching to other internet service providers could be time consuming and costly and could adversely affect our business, results of operations, and financial condition.
In addition, we currently serve the majority of our platform infrastructure from multiple co-located third-party data centers located throughout the United States and in certain international locations. We are in the process of transitioning the hosting of a portion of our platform infrastructure to Amazon Web Services. As a result, our operations depend, in part, on the ability of third parties to protect these facilities and resources against damage or interruption from natural disasters, power or network failures, criminal acts and similar events. In the event that any of our hosting arrangements are terminated, or if there is a lapse of service or damage to a facility or other resource, we could experience interruptions in our platform as well as delays and additional expenses in arranging new facilities and resources. We have experienced and expect that we will in the future experience such interruptions from time to time.
Any damage to, or failure of, the systems of our third-party providers could result in interruptions to and may cause errors or poor quality communications with our platform. Even with current and planned disaster recovery arrangements, our business could be harmed. Also, in the event of damage or interruption, our insurance policies may not adequately compensate us for any losses that we may incur. These factors in turn could further reduce our revenue, subject us to liability, damage our reputation and cause customers to become dissatisfied and fail to renew their subscriptions or demand credits, any of which could materially and adversely affect our business.
30
If we are unable to hire, retain and motivate qualified personnel, our business will suffer.
Our future success depends, in part, on our ability to continue to attract and retain highly skilled personnel. From time to time we have experienced difficulty in hiring and retaining employees who have appropriate qualifications, and we are continuing our efforts to meet our hiring goals. We believe that there is, and will continue to be, intense competition for highly skilled executive, technical, marketing, and other personnel with experience in the locations where we maintain offices. We must provide competitive compensation packages and a high-quality work environment to hire, retain and motivate employees. If we are unable to retain and motivate our existing employees and attract qualified personnel to fill key positions, we may be unable to manage our business effectively, including the development, marketing, and sale of our services, which could adversely affect our business, results of operations, and financial condition. To the extent we hire personnel from competitors, we also may be subject to allegations that they have been improperly solicited or divulged proprietary or other confidential information.
Volatility in, or lack of performance of, our stock price may also affect our ability to attract and retain key personnel. Many of our key personnel are, or will soon be, vested in a substantial amount of shares of common stock or stock awards. Employees may be more likely to terminate their employment with us if the shares they own or the shares underlying their vested options have significantly appreciated in value relative to the original purchase prices of the shares or the exercise prices of the options, or, conversely, if the exercise prices of the options that they hold are significantly above the trading price of our common stock. Additionally, if our stock price underperforms or the outlook for our stock is negative, we may not be able to attract qualified personnel to join our business. Candidates making employment decisions, particularly in high-technology industries, often consider the value and growth potential of any equity they may receive in connection with their employment. As a result, any significant decline in the market price of our common stock may adversely affect our ability to attract or retain highly skilled executive, technical, marketing, and other personnel. If we are unable to retain and attract highly-skilled employees, our business, results of operations, and financial condition could be adversely affected.
We have experienced losses in the past, and we may not achieve or sustain profitability in the future.
We generated net losses of $6.3 million, $3.9 million, and $5.9 million in 2017, 2016, and 2015, respectively. As of December 31, 2017, we had an accumulated deficit of $49.9 million. We will need to generate and sustain increased revenue levels in future periods in order to achieve or sustain profitability. We also expect our costs to increase in future periods, which could negatively affect our future operating results if our revenue does not increase commensurately. For example, we intend to continue to expend significant funds to develop and enhance our technical infrastructure, platform, and services, including possibly through the acquisition of complementary businesses and technologies, expand our research and development efforts and selling and marketing operations, including through increased headcount, meet the increased compliance requirements associated with our transition to and operation as a public company, and expand into new markets. Our efforts to grow our business may be more costly than we expect, and we may not be able to increase our revenue enough to offset our higher operating expenses. We may incur significant losses in the future for a number of reasons, including the other risks described in this Annual Report on Form 10-K, and unforeseen expenses, difficulties, complications and delays and other unknown events. If we are unable to achieve or sustain profitability, our stock price may significantly decrease.
We may require additional financing in the future and may not be able to obtain such financing on favorable terms, if at all, which could slow or stop our ability to grow or otherwise harm our business.
We intend to continue to make investments to support our business growth and may require additional funds to respond to business challenges and opportunities, including the need to develop new features or enhance our platform, improve our operating infrastructure, or acquire complementary businesses and technologies. To date, we have financed our operations primarily through our operations, sales of our equity securities and debt financing provided by financial institutions. We may not be able to obtain additional financing on terms favorable to us, if at all. We may need to engage in equity or debt financings to secure additional funds. If we raise additional equity financing, our stockholders may experience significant dilution of their ownership interests and the per share value of our common stock could decline. If we engage in debt financing, the holders of debt would have priority over the holders of our common stock, and we may be required to accept terms that restrict our ability to incur additional indebtedness and our ability to operate our business. We may also be required to take other actions that would otherwise be in the interests of the debt holders and force us to maintain specified
31
liquidity or other ratios, any of which could harm our business, financial condition, and operating results. If we are unable to obtain adequate financing or financing on terms satisfactory to us when we require it, our ability to continue to support our business growth and to respond to business challenges could be significantly impaired, and our business may be adversely affected.
Our quarterly results may fluctuate significantly, and if we fail to meet the expectations of analysts or investors, our stock price could decline substantially.
Our results of operations, including our revenue, operating expenses, and cash flows, have fluctuated from quarter to quarter in the past and may continue to fluctuate as a result of a variety of factors, many of which are outside of our control, may be difficult to predict and may or may not fully reflect the underlying performance of our business. Additionally, we have a limited operating history with the current scale of our business, which makes it difficult to forecast our future results. Some of the factors that may cause our results of operations to fluctuate from quarter to quarter include:
|
· |
our ability to attract new customers; |
|
· |
our ability to retain customers and expand their usage of our services; |
|
· |
changes in customers’ budgets and in the timing of their purchasing decisions, including as a result of any changes in their usage or expected usage of our services; |
|
· |
potential customers opting for alternative solutions, including internally-developed and maintained solutions, and competitive email or digital communication solutions; |
|
· |
our ability to control costs, including our operating expenses; |
|
· |
the timing and success of new products, features and services by us and our competitors; |
|
· |
changes in the competitive dynamics of our industry, including price competition or consolidation among competitors, customers, or strategic partners; |
|
· |
significant security breaches of, technical difficulties with, or interruptions to, the delivery and use of our platform; |
|
· |
reputational harm or other liabilities resulting from the use of our platform to transmit spam, phishing scams, website links to harmful applications or other harmful or illegal material; |
|
· |
the collectability of receivables from customers, which may be hindered or delayed if these customers experience financial distress; |
|
· |
general economic conditions, both domestically and internationally, as well as economic conditions specifically affecting industries in which our customers participate; |
|
· |
fluctuations in foreign currency exchange rates which could, for example, cause our subscription agreements denominated in U.S. dollars to be more expensive internationally; |
|
· |
sales tax and other tax determinations by authorities in the jurisdictions in which we conduct business; |
|
· |
the impact of new accounting pronouncements; and |
|
· |
fluctuations in stock-based compensation expense. |
The occurrence of one or more of the foregoing and other factors may cause our results of operations to vary significantly. Accordingly, our results of operations in any one quarter may not be meaningful and should not be relied upon as indicative of future performance. Additionally, if our quarterly results of operations fall below the expectations of investors or
32
securities analysts who follow our stock, the price of our common stock could decline substantially, and we could face costly lawsuits, including securities class action suits.
Our revenue is affected by seasonality.
Our revenue is directly correlated with the number of emails sent by our customers. During the fourth-quarter holiday season, our customers process a relatively higher number of transactions, run a greater number of marketing programs, and therefore send more emails. Partially because of this seasonality, a greater percentage of our annual revenue has come from our fourth quarter than from other quarters. In 2017, 2016, and 2015, 28% to 29% of our annual revenue was in our fourth quarter. While we believe that this seasonality has affected and will continue to affect our quarterly results, our rapid growth has largely masked seasonal trends to date. Seasonality may become more pronounced in the future to the extent our revenue mix shifts between our Email API, Marketing Campaigns, and other revenue sources over time. As a result, historical patterns in our business may not be a reliable indicator of our future performance.
Our reliance on cloud-based technologies from third parties may adversely affect our business, results of operations, and financial condition.
We rely heavily on hosted cloud-based technologies from third parties in order to operate critical internal functions of our business, including our accounting, billing, and office management functions. If these services become unavailable due to extended outages or interruptions, or because they are no longer available on commercially reasonable terms or prices, our expenses could increase. As a result, our ability to manage our operations could be interrupted and our processes for managing our sales process and supporting our customers could be impaired until equivalent services, if available, are identified, obtained, and implemented, all of which could adversely affect our business, results of operations, and financial condition.
Our corporate culture has contributed to our success, and if we cannot maintain this culture as we grow, we could lose the innovation, creativity and teamwork fostered by our culture, which could harm our business.
We believe that our culture has been and will continue to be a key contributor to our success. Between December 31, 2011 and December 31, 2017, we have increased the size of our full-time workforce by 357 employees, and we expect to continue to hire as we expand. If we do not continue to maintain our corporate culture as we grow, we may be unable to foster the innovation, creativity, and teamwork we believe we need to support our growth. Moreover, many of our employees may be able to receive significant proceeds from sales of our common stock in the public markets after our recent initial public offering, or IPO, which could lead to disparities of wealth among our employees that adversely affects relations among employees and our culture in general. Our potential headcount growth and our transition from a private company to a public company may result in a change to our corporate culture, which could harm our business.
Acquisition opportunities could be difficult to identify, and any pursued acquisitions could divert the attention of management, pose integration challenges, disrupt our business, dilute stockholder value, and adversely affect our operating results and financial condition.
We have in the past acquired and intend in the future seek to acquire or invest in businesses, products, or technologies that we believe could complement or expand our platform, enhance our technical capabilities, or otherwise offer growth opportunities. For example, in 2017, we acquired Bizzy, a marketing automation company. We do not know if we will be able to fully realize the anticipated benefits of this or other acquisitions and we may not be successful in integrating acquired technologies and businesses into our company. Acquisitions may disrupt our business, divert our resources, and require significant management attention that would otherwise be available for development of our existing business.
We also may not achieve the anticipated benefits from an acquired business due to a number of factors, including:
|
· |
inability to integrate or benefit from acquired technologies or services in a profitable manner; |
|
· |
unanticipated costs, accounting charges or other liabilities associated with the acquisition; |
|
· |
incurrence of acquisition-related costs; |
33
|
· |
difficulty integrating the accounting systems, operations, and personnel of the acquired business, including due to language, geographical or cultural differences; |
|
· |
difficulties and additional expenses associated with supporting legacy products and hosting infrastructure of the acquired business; |
|
· |
difficulty converting the customers of the acquired business onto our platform and contract terms, including disparities in the revenues, licensing, support, or professional services model of the acquired company; |
|
· |
adverse effects to our existing business relationships with business partners and customers as a result of the acquisition; |
|
· |
the potential loss of key employees; |
|
· |
retention of employees from the acquired company; |
|
· |
use of resources that are needed in other parts of our business; |
|
· |
litigation or other claims arising in connection with the acquired company; |
|
· |
additional regulatory and compliance requirements; and |
|
· |
use of substantial portions of our available cash to consummate the acquisition. |
In addition, a significant portion of the purchase price of companies we acquire may be allocated to goodwill and other intangible assets, which must be assessed for impairment at least annually. Acquisitions could also result in dilutive issuances of equity securities or the incurrence of debt, which could adversely affect our operating results. In the future, if our acquisitions do not yield expected returns, we may be required to take charges to our operating results based on this impairment assessment process, which could adversely affect our results of operations.
Our platform or services may infringe the intellectual property rights of third parties and this may create liability for us or otherwise harm our business.
From time to time third parties have claimed, and may in the future claim, that our platform capabilities or services infringe their intellectual property rights, and such claims may also result in claims against our customers. These claims may damage our brand and reputation, harm our customer relationships, and create liability for us. We expect the number of such claims will increase as the number of products and services and the level of competition in our market grows, the functionality of our platform or services overlap with that of other products and services, and the volume of issued software patents and patent applications continues to increase.
Companies in the software and technology industries, including some of our current and potential competitors, own large numbers of patents, copyrights, trademarks, and trade secrets and frequently enter into litigation based on allegations of infringement or other violations of intellectual property rights. In addition, many of these companies have the capability to dedicate substantially greater resources to enforce their intellectual property rights and to defend claims that may be brought against them. Furthermore, patent holding companies, non-practicing entities and other adverse patent owners that are not deterred by our existing intellectual property protections have asserted, and in the future may seek to assert, patent claims against us. From time to time, third parties have contacted us inviting us to license their patents and may, in the future, assert patent, copyright, trademark or other intellectual property rights against us, our strategic partners or our customers. We have received, and may in the future receive, notices that claim we have misappropriated, misused, or infringed other parties’ intellectual property rights, and, to the extent we gain greater market visibility, we face a higher risk of being the subject of intellectual property infringement claims, which is not uncommon with respect to our market.
There may be third-party intellectual property rights, including issued or pending patents, that cover significant aspects of our technologies or business methods. In addition, if we acquire or license technologies from third parties, we may be exposed to increased risk of being the subject of intellectual property infringement due to, among other things, our lower
34
level of visibility into the development process with respect to such technology and the care taken to safeguard against infringement risks. Any intellectual property claims, with or without merit, may be very time-consuming, may be expensive to settle or litigate, and may divert our management’s attention and other resources. These claims may also subject us to significant liability for damages, potentially including treble damages if we are found to have willfully infringed patents or copyrights and may require us to indemnify our customers for liabilities they incur as a result of such claims. These claims may also result in our having to stop using technology found to be in violation of a third party’s rights. We may be required to seek a license for the intellectual property, which may not be available on reasonable terms or at all. Even if a license were available, we may be required to pay significant royalties, which would increase our operating expenses. Alternatively, we may be required to develop alternative non-infringing technology, which may require significant time, effort, and expense, and may affect the performance or features of our platform. If we cannot license or develop alternative non-infringing substitutes for any infringing technology used in any aspect of our business, we would be forced to limit or stop sales of our services and may be unable to compete effectively. Any of these results would adversely affect our business, operating results, and financial condition.
Indemnity provisions in various agreements potentially expose us to substantial liability for intellectual property infringement and other losses.
Our agreements with customers and other third parties typically include indemnification or other provisions under which we agree to indemnify or otherwise be liable to them for losses suffered or incurred as a result of claims of intellectual property infringement or other liabilities relating to or arising from our platform or services or other acts or omissions. Large indemnity payments or damage claims from contractual breach could harm our business, results of operations, and financial condition. Although we normally contractually limit our liability with respect to such obligations, we may still incur substantial liability related to them. Any dispute with a customer with respect to such obligations could have adverse effects on our relationship with that customer and other current and prospective customers, reduce demand for our platform and adversely affect our business, results of operations, and financial condition.
Our platform contains third-party open source software components, and failure to comply with the terms of the underlying open source software licenses could restrict our ability to sell our services.
Our platform incorporates open source software code. An open source license allows the use, modification, and distribution of software in source code form. Certain kinds of open source licenses further require that any person who creates a product or service that contains, links to, or is derived from software that was subject to an open source license must also make their own product or service subject to the same open source license. Using software that is subject to this kind of open source license can lead to a requirement that our services be provided free of charge or be made available or distributed in source code form. Although we do not believe our platform includes any open source software in a manner that would result in the imposition of any such requirement, the interpretation of open source licenses is legally complex, and, despite our efforts, it is possible that our platform could be found to contain this type of open source software. Further, few of the licenses applicable to open source software have been interpreted by courts, and there is a risk that these licenses could be construed in a manner that could impose unanticipated conditions or restrictions on our ability to commercialize our platform or services in the future.
Moreover, we cannot assure you that our processes for controlling our use of open source software in our platform will be effective. If we have not complied with the terms of an applicable open source software license, we could be required to seek licenses from third parties to continue offering our platform on terms that are not economically feasible, to re-engineer our services to remove or replace the open source software, to discontinue the sale of our services if re-engineering could not be accomplished on a timely basis, to pay monetary damages, or to make generally available the source code for our proprietary technology, any of which could adversely affect our business, operating results, and financial condition.
In addition to risks related to license requirements, use of open source software can involve greater risks than those associated with use of third-party commercial software, as open source licensors generally do not provide warranties or assurance of title, performance, non-infringement, or controls on origin of the software. There is typically no support available for open source software, and we cannot assure you that the authors of such open source software will not abandon further development and maintenance. Many of the risks associated with the use of open source software, such as the lack of warranties or assurances of title or performance, cannot be eliminated, and could, if not properly addressed, negatively affect our business. We have established processes to help alleviate these risks, including a review process for
35
screening requests from our development organizations for the use of open source software, but we cannot be sure that all open source software is identified or submitted for approval prior to use in our platform.
Responding to any infringement claim, regardless of its validity, or discovering open source software code in our platform could harm our business, operating results, and financial condition, by, among other things:
|
· |
resulting in time-consuming and costly litigation; |
|
· |
diverting management’s time and attention from developing our business; |
|
· |
requiring us to pay monetary damages or enter into royalty and licensing agreements on terms that may not be favorable to us; |
|
· |
causing delays in the deployment of our platform; |
|
· |
requiring us to stop selling some aspects of our platform; |
|
· |
requiring us to redesign certain components of our platform using alternative non-infringing or non-open source technology or practices, which could require significant effort and expense; |
|
· |
requiring us to disclose our software source code, the detailed program commands for our software; and |
|
· |
requiring us to satisfy indemnification obligations to our customers. |
Any failure to protect our proprietary technology and intellectual property rights could substantially harm our business and operating results.
Our success and ability to compete depend in part on our ability to protect our proprietary technology and intellectual property. To safeguard these rights, we rely on a combination of patent, trademark, copyright and trade secret laws and contractual protections in the United States and other jurisdictions, all of which provide only limited protection and may not now or in the future provide us with a competitive advantage.
In order to protect our unpatented proprietary technologies and processes, we rely on trade secret laws and confidentiality and invention assignment agreements with our employees, consultants, strategic partners, vendors, and others. Also, despite our efforts to protect our proprietary technology and trade secrets, unauthorized parties may attempt to misappropriate, copy, reverse engineer or otherwise obtain and use them. In addition, others may independently discover our trade secrets, in which case we would not be able to assert trade secret rights or develop similar technologies and processes. Further, the contractual provisions that we enter into may not prevent unauthorized use or disclosure of our proprietary technology or intellectual property rights and may not provide an adequate remedy in the event of unauthorized use or disclosure of our proprietary technology or intellectual property rights. Moreover, policing unauthorized use of our technologies, trade secrets and intellectual property is difficult, expensive, and time-consuming, particularly in foreign countries where the laws may not be as protective of intellectual property rights as those in the United States and where mechanisms for enforcement of intellectual property rights may be weak. To the extent that we expand our activities outside of the United States, our exposure to unauthorized copying and use of our platform and proprietary information may increase. We may be unable to determine the extent of any unauthorized use or infringement of our platform, technologies, or intellectual property rights.
We cannot assure you that any patents we have obtained or that may be issued to us in the future will give us the protection that we seek or that such patents will not be challenged, invalidated, or circumvented. As of December 31, 2017, we had one issued patent. Any patents that may be issued to us in the future may not provide sufficiently broad protection and may not be enforceable in actions against alleged infringers. Obtaining and enforcing software patents in the United States is becoming increasingly challenging. Any patents we have obtained or may obtain in the future may be found to be invalid or unenforceable in light of recent and future changes in the law. Similarly, we cannot assure you that any future trademark registrations will be issued from current or future applications or that any registered trademarks we have obtained or may obtain in the future will be enforceable or provide adequate protection of our proprietary rights. We also license software
36
from third parties for integration into our software, including open source software and other software available on commercially reasonable terms. We cannot assure you that such third parties will maintain such software or continue to make it available.
There can be no assurance that the steps that we take will be adequate to protect our proprietary technology and intellectual property, that others will not develop or patent similar or superior technologies, products, or services, or that our trademark, patent, and other intellectual property rights will not be challenged, invalidated, or circumvented by others. Furthermore, effective trademark, patent, copyright, and trade secret protection may not be available in every country in which our software is available or where we have employees or independent contractors. In addition, the legal standards relating to the validity, enforceability, and scope of protection of intellectual property rights in internet and software-related industries are uncertain and still evolving.
In order to protect our proprietary technology and intellectual property rights, we may be required to spend significant resources to monitor and protect these rights. Litigation brought to protect and enforce our intellectual property rights could be costly, time-consuming, and distracting to management and could result in the impairment or loss of portions of our intellectual property. Furthermore, our efforts to enforce our proprietary technology and intellectual property rights may be met with defenses, counterclaims and countersuits attacking the validity and enforceability of our intellectual property rights. Our failure to secure, protect and enforce our intellectual property rights could materially and adversely affect our business.
We face exposure to foreign currency exchange rate fluctuations, and such fluctuations could adversely affect our business, results of operations, and financial condition.
As our international operations expand beyond our current London location, our exposure to the effects of fluctuations in currency exchange rates grows. While we have primarily transacted with customers and business partners in U.S. dollars, we expect to expand the number of transactions with customers and business partners that are denominated in foreign currencies in the future as we expand our business internationally. We incur expenses for some of our internet service provider costs outside of the United States in local currencies and for employee compensation and other operating expenses at our U.K. location in British pounds. Fluctuations in the exchange rates between the U.S. dollar and other currencies could result in an increase to the U.S. dollar equivalent of such expenses.
Accordingly, changes in the value of foreign currencies relative to the U.S. dollar may, particularly in the future as we expand our business internationally, affect our results of operations due to transactional and translational remeasurement. As a result of such foreign currency exchange rate fluctuations, it could be more difficult to detect underlying trends in our business and results of operations. In addition, to the extent that fluctuations in currency exchange rates cause our results of operations to differ from our expectations or the expectations of our investors and securities analysts who follow our stock, the trading price of our common stock could be adversely affected.
Our subscription agreements are denominated in U.S. dollars, and therefore our revenue currently is not subject to foreign currency risk. However, a strengthening of the U.S. dollar could increase the real cost of our platform to current and prospective customers outside of the United States, adversely affecting our business, results of operations, and financial condition.
We do not currently maintain a program to hedge transactional exposures in foreign currencies. However, in the future, we may use derivative instruments, such as foreign currency forward and option contracts, to hedge certain exposures to fluctuations in foreign currency exchange rates. The use of such hedging activities may not offset any or more than a portion of the adverse financial effects of unfavorable movements in foreign exchange rates over the limited time the hedges are in place. Moreover, the use of hedging instruments may introduce additional risks if we are unable to structure effective hedges with such instruments.
Comprehensive tax reform bills could adversely affect our business and financial condition.
On December 22, 2017, and effective January 1, 2018, the U.S. government enacted H.R. 1, “An Act to provide for reconciliation pursuant to titles II and V of the concurrent resolution on the budget for fiscal year 2018” (informally titled the “Tax Cuts and Jobs Act,”) which includes significant changes to the taxation of business entities. The Tax Cuts and
37
Jobs Act, among other things, contains significant changes to corporate taxation, including reduction of the corporate tax rate from a top marginal rate of 35% to a flat rate of 21%, limitation of the tax deduction for interest expense to 30% of adjusted earnings (except for certain small businesses), limitation of the deduction for net operating losses to 80% of current year taxable income and elimination of net operating loss carrybacks, one time taxation of offshore earnings at reduced rates regardless of whether they are repatriated, elimination of U.S. tax on foreign earnings (subject to certain important exceptions), immediate deductions for certain new investments instead of deductions for depreciation expense over time, and modifying or repealing many business deductions and credits. Notwithstanding the reduction in the corporate income tax rate, the Tax Cuts and Jobs Act remains subject to interpretation and further guidance from US taxing authorities and as a result the overall impact of this tax reform is uncertain and may change due to interpretation changes, and our business and financial condition could be adversely affected. The impact of the Tax Cuts and Jobs Act on holders of our common stock is also uncertain and could be adverse. We are unable to predict what tax reform may be proposed or enacted in the future or what effect such changes would have on our business, but such changes, to the extent they are brought into tax legislation, regulations, policies or practices, could affect our effective tax rates in the future in countries where we have operations and have an adverse effect on our overall tax rate in the future, along with increasing the complexity, burden and cost of tax compliance. We urge our stockholders to consult with their legal and tax advisors with respect to the Tax Cuts and Jobs Act and the potential tax consequences of investing in or holding our common stock.
Taxing authorities may successfully assert that we should have collected or paid, or in the future should collect or pay, sales, use, value added or similar taxes, and we could be subject to liability with respect to past or future sales, which could adversely affect our financial results.
We do not collect sales, use, value added and similar taxes in all jurisdictions in which we have sales, based on our belief that such taxes are not applicable. Sales, use, value added, and similar tax laws and rates vary greatly by jurisdiction. Certain jurisdictions in which we do not collect such taxes may assert that such taxes are applicable, which could result in tax assessments, penalties, and interest, and we may be required to collect and/or remit such taxes in the future. While we reserve estimated amounts with respect to such taxes on our financial statements, we cannot be certain that we have made sufficient reserves to cover such tax liabilities or such taxes. If our reserve amounts are inadequate, such tax assessments, penalties and interest or future requirements may adversely affect our results of operations and financial condition. Additionally, the application of federal, state, local and international tax laws to cloud services are continuously evolving. Income, sales, use or other tax laws, statutes, rules, regulations, or ordinances could be enacted or amended at any time, possibly with retroactive effect, which could increase our taxes and ultimately have a negative impact on our results of operations and cash flows.
Our ability to use our net operating losses to offset future taxable income may be subject to certain limitations.
As of December 31, 2017, we had net operating loss, or NOL, carryforwards for U.S. federal income tax purposes of approximately $37.1 million, which expire in various years beginning in 2029 if not utilized.
In general, under Section 382 of the United States Internal Revenue Code of 1986, as amended, or the Code, a corporation that undergoes an “ownership change” is subject to limitations on its ability to utilize its pre-ownership change NOLs to offset future taxable income. As of December 31, 2017, we had not completed a Section 382 limitation study, and postponed completion of our prior study, due to a significant level of legacy ownership both before and after our IPO. We will continue to monitor and assess our significant ownership interests. Future changes in our stock ownership, some of which are outside of our control, could also result in an ownership change under Section 382 of the Code.
Our ability to utilize our NOLs is dependent on attaining profitability sufficient to offset such available NOLs prior to their expiration. In addition, we may not be able to utilize a portion of the NOLs reflected on our balance sheet, even if we attain profitability.
Under the Tax Cuts and Jobs Act, NOLs generated in 2018 and future years may be carried forward indefinitely but may not be carried back and are only eligible to offset up to a maximum of 80% of taxable income generated in a given year. It is uncertain if and to what extent various U.S. states will conform to the newly enacted U.S. federal tax law.
38
The enactment of legislation implementing changes in U.S. taxation of international business activities or the adoption of other tax reform policies could materially impact our financial condition and results of operations.
U.S. tax laws, including limitations on the ability of taxpayers to claim and utilize foreign tax credits and the deferral of certain tax deductions until earnings outside of the United States are repatriated to the United States, as well as changes to U.S. tax laws that may be enacted in the future, could impact the tax treatment of our foreign earnings. Due to the anticipated expansion of our international business activities, any changes in the U.S. taxation of such activities may increase our worldwide effective tax rate and adversely affect our financial condition and results of operations.
We could be subject to additional tax liabilities.
We are subject to federal, state, and local taxes in the United States and the United Kingdom. Significant judgment is required in evaluating our tax positions and our worldwide provision for taxes. During the ordinary course of business, there are many activities and transactions for which the ultimate tax determination is uncertain. In addition, our tax obligations and effective tax rates could be adversely affected by changes in the relevant tax, accounting and other laws, regulations, principles and interpretations, including those relating to income tax nexus, by our earnings being lower than anticipated in jurisdictions where we have lower statutory rates and higher than anticipated in jurisdictions where we have higher statutory rates, by changes in foreign currency exchange rates, or by changes in the valuation of our deferred tax assets and liabilities. We may be audited in various jurisdictions, and such jurisdictions may assess additional taxes against us. Although we believe our tax estimates are reasonable, the final determination of any tax audits or litigation could be materially different from our historical tax provisions and accruals, which could have a material adverse effect on our operating results or cash flows in the period or periods for which a determination is made.
Unfavorable conditions in our industry or the global economy or reductions in marketing information technology spending could limit our ability to grow our business and negatively affect our results of operations.
Our results of operations may vary based on the impact of changes in our industry or the global economy on us or our customers. The revenue growth and potential profitability of our business depend on demand for email services and email marketing generally and for our services in particular. Current or future economic uncertainties or downturns could adversely affect our business and results of operations. Negative conditions in the general economy both in the United States and abroad, including conditions resulting from changes in gross domestic product growth, financial and credit market fluctuations, political turmoil, natural catastrophes, warfare and terrorist attacks on the United States, Europe, the Asia Pacific region or elsewhere, could cause a decrease in business investments, including spending on information technology, and negatively affect the growth of our business. To the extent our platform or services are perceived by customers and potential customers as discretionary, there may be delays or reductions in spending on our services, we may need to reduce our prices in order to remain competitive and our revenue may decline. In addition, the increased pace of consolidation in certain industries may result in reduced overall spending on our platform and services. We cannot predict the timing, magnitude or duration of any economic slowdown, instability, or recovery, generally or within any particular industry. If the economic conditions of the general economy or markets in which we operate worsen, our business, results of operations, and financial condition could be adversely affected.
Furthermore, many of our customers are SMBs. These organizations frequently have limited budgets and are often resource- and time-constrained and, as a result, may be significantly more affected by economic downturns than their larger, more established counterparts. As a result, SMBs may choose to spend the limited funds that they have on items other than our services. Moreover, if SMBs experience economic distress, they may be unwilling or unable to expend time and financial resources on email, which could negatively affect the overall demand for our platform, increase customer attrition and cause our revenue growth or operating results to decline.
The success of our business depends on the continued growth and acceptance of email as a communications tool and the related accessibility, expansion, and reliability of the Internet infrastructure.
The future success of our business depends on the continued widespread use of email as a primary means of communication and as the document of record for many digital business transactions. Security problems such as viruses, worms and other malicious programs, reliability issues arising from outages and damage to the Internet infrastructure or an overabundance of spam could create the perception that email is not a safe, reliable, or efficient means of communication, which would
39
discourage businesses and consumers from using email. In addition, alternative communications tools such as social media or text messaging have gained significant widespread acceptance and may gain additional acceptance for both email marketing and transactional record purposes. To the extent use of these alternative communications tools continues to grow, these tools could be used by our customers as a substitute for our services, and demand for our services and our revenues could decline.
Furthermore, federal, state, or foreign government bodies or agencies have in the past adopted, and may in the future adopt, laws or regulations affecting the use of the Internet as a commercial medium. In addition, government agencies or private organizations have imposed and may impose additional taxes, fees, or other charges for accessing the Internet or commerce conducted via the Internet. We provide our platform through the Internet and many of our customers use our services in connection with their own online transactions. Changes in these laws or regulations could require us to modify our platform in order to comply with these changes and could impact our customers’ businesses, reducing demand for our services. These laws or charges could limit the growth of Internet-related commerce or the use of Internet communications such as email or result in reductions in the demand for Internet-based services such as our platform. In addition, the use of the Internet and email as business tools could be adversely affected due to delays in the development or adoption of new standards and protocols to handle increased demands in Internet activity, security, reliability, cost, ease-of-use, accessibility, and quality of service. Any decrease in the use of the Internet or email would reduce demand for our platform and harm our business.
If we experience excessive credit card or other fraudulent activity, we could incur substantial costs.
Most of our customers authorize us to bill their credit card or other online accounts directly for subscription fees that we charge. If people pay for our services with stolen credit cards or other wrongly obtained online account information, we could incur substantial third-party vendor costs for which we may not be reimbursed. Further, our customers provide us with credit card billing information online, and we do not review the physical credit cards used in these transactions, which increases our risk of exposure to fraudulent activity. We also incur charges, which we refer to as chargebacks, from the credit card and other online payment processing companies from claims that the customer did not authorize the credit card or other online transaction to purchase our subscription. If the number of unauthorized credit card or other online transactions becomes excessive, we could be assessed substantial fines for excess chargebacks and we could lose the right to accept credit cards or other online accounts for payment, which could have a material adverse effect on our business and operating results.
Our reported financial results may be adversely affected by changes in accounting principles generally accepted in the United States.
Generally accepted accounting principles, or GAAP, in the United States are subject to interpretation by the Financial Accounting Standards Board, or FASB, the SEC, and various bodies formed to promulgate and interpret appropriate accounting principles. A change in these principles or interpretations could have a significant effect on our reported financial results for periods prior to and subsequent to such change and could affect the reporting of transactions completed before the announcement of a change.
In particular, in May 2014, the FASB issued Accounting Standards Update, or ASU, No. 2014-09, Revenue from Contracts with Customers (Topic 606), which supersedes the revenue recognition requirements in Accounting Standards Codification, or ASC, 605, Revenue Recognition. The core principle of ASU 2014-09 is that an entity should recognize revenue to depict the transfer of promised goods or services to customers in an amount that reflects the consideration to which the entity expects to be entitled in exchange for those goods or services; this new accounting standard also impacts the recognition of sales commissions. As an “emerging growth company” the Jumpstart Our Business Startups Act, or JOBS Act, allows us to delay adoption of new or revised accounting pronouncements applicable to public companies until such pronouncements are made applicable to private companies. We have elected to use this extended transition period under the JOBS Act with respect to ASU 2014-09, and as a result ASU 2014-09 will become applicable to us on January 1, 2019.
ASU 2014-09 permits the use of either a retrospective or cumulative effect transition method. We continue to evaluate the impact of the new standard and available adoption methods on our consolidated financial statements. We are in the process of evaluating arrangements with customers and identifying differences in accounting between new and existing standards.
40
Regardless of the transition method, the application of this new guidance could have an adverse effect on our operating results in one or more periods as compared to what they would have been under current standards.
If our estimates or judgments relating to our critical accounting policies prove to be incorrect, our results of operations could be adversely affected.
The preparation of financial statements in conformity with GAAP requires management to make estimates and assumptions that affect the amounts reported in the consolidated financial statements and accompanying notes. We base our estimates on historical experience and on various other assumptions that we believe to be reasonable under the circumstances, as provided in the section titled “Management’s Discussion and Analysis of Financial Condition and Results of Operations.” The results of these estimates form the basis for making judgments about the carrying values of assets, liabilities and equity, and the amount of revenue and expenses that are not readily apparent from other sources. Significant assumptions and estimates used in preparing our consolidated financial statements include those related to revenue recognition, valuation of goodwill and intangible assets, and stock-based compensation. Our results of operations may be adversely affected if our assumptions change or if actual circumstances differ from those in our assumptions, which could cause our results of operations to fall below the expectations of securities analysts and investors, resulting in a decline in the trading price of our common stock.
The requirements of being a public company may strain our resources, divert management’s attention, and affect our ability to attract and retain executive management and qualified board members.
As a public company, we are subject to the reporting requirements of the Exchange Act, the Sarbanes-Oxley Act of 2002, or the Sarbanes-Oxley Act, the Dodd-Frank Wall Street Reform and Consumer Protection Act, the listing requirements of the New York Stock Exchange, or NYSE, and other applicable securities rules and regulations. Compliance with these rules and regulations will increase our legal and financial compliance costs, make some activities more difficult, time-consuming, or costly, and increase demand on our systems and resources, particularly after we are no longer an “emerging growth company” as defined in the JOBS Act.
In addition, changing laws, regulations and standards relating to corporate governance and public disclosure are creating uncertainty for public companies, further increasing legal and financial compliance costs, and making some activities more time consuming. These laws, regulations and standards are subject to varying interpretations, in many cases due to their lack of specificity, and, as a result, their application in practice may evolve over time as new guidance is provided by regulatory and governing bodies. This could result in continuing uncertainty regarding compliance matters and higher costs necessitated by ongoing revisions to disclosure and governance practices. We intend to invest substantial resources to comply with evolving laws, regulations and standards, and this investment may result in increased general and administrative expense and a diversion of management’s time and attention from revenue-generating activities to compliance activities. If our efforts to comply with new laws, regulations and standards differ from the activities intended by regulatory or governing bodies due to ambiguities related to their application and practice, regulatory authorities may initiate legal proceedings against us and our business may be adversely affected.
Moreover, the demands on management in operating a publicly-traded company, interacting with public company investors, and complying with the increasingly complex laws pertaining to public companies, are significant. Our management team may not successfully or efficiently manage us as a public company subject to significant regulatory oversight and reporting obligations under the federal securities laws and the continuous scrutiny of securities analysts and investors. These new obligations and constituents require significant attention from our senior management and could divert their attention away from the day-to-day management of our business, which could adversely affect our business, results of operations, and financial condition.
We also expect that being a public company will make it more expensive for us to obtain director and officer liability insurance, and we may be required to accept reduced coverage or incur substantially higher costs to obtain coverage. These factors could also make it more difficult for us to attract and retain qualified members of our board of directors and qualified executive officers.
41
If we are unable to implement and maintain effective internal controls over financial reporting in the future, investors may lose confidence in the accuracy and completeness of our financial reports and the market price of our common stock may be negatively affected.
As a public company, we are required to maintain internal controls over financial reporting and to report any material weaknesses in such internal controls. Section 404 of the Sarbanes-Oxley Act requires that we furnish a report by management on, among other things, the effectiveness of our internal control over financial reporting for the year ending December 31, 2018. This assessment will need to include disclosure of any material weaknesses identified by our management in our internal control over financial reporting, as well as a statement that our independent registered public accounting firm has issued an opinion on our internal control over financial reporting, provided that our independent registered public accounting firm will not be required to attest to the effectiveness of our internal control over financial reporting until our first annual report required to be filed with the SEC following the date we are no longer an “emerging growth company,” as defined in the JOBS Act.
If we have a material weakness in our internal controls over financial reporting, we may not detect errors on a timely basis and our financial statements may be materially misstated. We are in the process of designing and implementing the internal controls over financial reporting required to comply with this obligation, which process will be time-consuming, costly, and complicated. If we identify material weaknesses in our internal controls over financial reporting, if we are unable to comply with the requirements of Section 404 in a timely manner, if we are unable to assert that our internal controls over financial reporting are effective, or if our independent registered public accounting firm is unable to express an opinion as to the effectiveness of our internal controls over financial reporting, when required, investors may lose confidence in the accuracy and completeness of our financial reports, and the market price of our common stock could be negatively affected. In addition, we could become subject to investigations by the NYSE, the SEC or other regulatory authorities, which could require additional financial and management resources and adversely affect our business, financial condition, and operating results.
Risks Related to Ownership of Our Common Stock
The trading price of our stock may be volatile.
The market price of our common stock may be highly volatile and may fluctuate substantially as a result of a variety of factors, some of which are related in complex ways. Since shares of our common stock were sold in our IPO in November 2017 at a price of $16.00 per share, our stock price has ranged from an intraday low of $17.50 to an intraday high of $24.45 through December 31, 2017. In addition to the factors discussed in this “Risk Factors” section and elsewhere in this Annual Report on Form 10-K, the factors that may affect the market price of our common stock include:
|
· |
our operating performance and the operating performance of similar companies; |
|
· |
failure to meet revenue, earnings, key metrics or other financial or operational expectations that we establish or are established by securities analysts or investors; |
|
· |
the overall performance and volatility of the equity markets in general or of our industry in particular; |
|
· |
actual or anticipated developments in our business, our competitors’ businesses, or the competitive landscape generally; |
|
· |
the number of shares of our common stock publicly owned and available for trading; |
|
· |
threatened or actual litigation; |
|
· |
changes in laws or regulations affecting our business; |
|
· |
changes in our board of directors or management; |
42
|
· |
publication of research reports about us or our industry or changes in recommendations or withdrawal of research coverage by securities analysts; |
|
· |
public reaction to our press releases, other public announcements, and filings with the SEC, including related to new services or functionalities or announced or completed acquisitions; |
|
· |
changes in accounting standards, policies, guidelines, interpretations, or principles; |
|
· |
large volumes of sales of shares of our common stock by us or our existing stockholders; and |
|
· |
general political and economic conditions. |
In addition, the stock market in general, and the market for technology companies in particular, has experienced extreme price and volume fluctuations that have often been unrelated or disproportionate to the operating performance of those companies. Broad market and industry factors may seriously affect the market price of our stock regardless of actual operating performance. Securities class action litigation has often been instituted against companies following periods of volatility in the market price of their securities. This form of litigation, if instituted against us, could result in very substantial costs, divert our management’s attention and resources, and harm our business, operating results, and financial condition.
An active public trading market for our common stock may not be sustained.
Prior to the completion of our IPO in November 2017, no public market for our common stock existed. Although our common stock is listed on the NYSE, we cannot assure you that an active public trading market for our common stock will continue to develop or be sustained. If an active market for our common stock does not continue to develop or is not sustained, it may be difficult for investors in our common stock to sell shares without depressing the market price for the shares or to sell the shares at all. An inactive market may also impair our ability to raise capital to continue to fund operations by selling shares and may impair our ability to acquire other companies or technologies by using our shares as consideration.
Substantial future sales of shares of our common stock could cause the market price of our common stock to decline.
The market price of our common stock could decline as a result of substantial sales of our common stock, particularly sales by our directors, executive officers and significant stockholders, a large number of shares of our common stock becoming available for sale or the perception in the market that holders of a large number of shares intend to sell their shares.
As of December 31, 2017, there were 42,175,647 shares of our common stock outstanding. All shares of common stock sold in our IPO are freely tradable without restriction or further registration under the Securities Act, unless held by our “affiliates,” as that term is defined in Rule 144 under the Securities Act. The resale of 33,370,647 shares of our common stock, or approximately 79% of our outstanding shares as of December 31, 2017, is currently prohibited or otherwise restricted as a result of securities law provisions, market standoff agreements entered into by our stockholders with us or lock-up agreements entered into by our stockholders with the underwriters for our IPO; however, subject to applicable securities law restrictions, these shares will be able to be sold in the public market beginning May 14, 2017. Further, Morgan Stanley & Co. LLC on behalf of the underwriters may, in its sole discretion, permit our officers, directors, employees and current security holders who are subject to lock-up agreements to sell shares prior to the expiration of the lock-up agreements. In addition, the shares subject to outstanding options and restricted stock units, or RSUs, of which options and RSUs to purchase 12,217,721 shares and 656,854 shares, respectively, were outstanding as of December 31, 2017, and the shares reserved for future issuance under our equity incentive plans will become available for sale immediately upon the exercise of such options and the expiration of any applicable market stand-off or lock-up agreements, subject to applicable securities law restrictions. On November 15, 2017, we registered the offer and sale of all shares of common stock that we may issue under our equity incentive plans. As a consequence, the sale of shares to be issued under our equity incentive plans can be freely sold in the public market upon issuance, subject to the lockup agreements and the restrictions of Rule 144 under the Securities Act, in the case of our affiliates.
43
The holders of 24,471,780 shares, or approximately 58% of our outstanding common stock as of December 31, 2017, have rights, subject to some conditions, to require us to file registration statements covering the sale of their shares or to include their shares in registration statements that we may file for ourselves or other stockholders. Once we register the offer and sale of shares for the holders of registration rights, they can be freely sold in the public market upon issuance, subject to the lock-up agreements and the restrictions of Rule 144 under the Securities Act, in the case of our affiliates.
We may issue shares of our common stock or securities convertible into our common stock from time to time in connection with a financing, acquisition, investment or otherwise. Any such issuance could result in substantial dilution to our existing stockholders and cause the trading price of our common stock to decline.
We may invest or spend the proceeds of our initial public offering in ways with which you may not agree or in ways which may not yield a return.
We intend to use the remaining net proceeds to us from our IPO for working capital and other general corporate purposes, including developing and enhancing our technical infrastructure, platform, and services, expanding our research and development efforts and selling and marketing operations, meeting the increased compliance requirements associated with our transition to and operation as a public company, and expanding into new markets. We may also use a portion to make acquisitions or investments. However, we do not have any agreements or commitments for any acquisitions or strategic investments at this time. Our management generally will have broad discretion to use the net proceeds, and you will be relying on the judgment of our management regarding the application of these proceeds. Our management might not apply the net proceeds in ways that increase the value of your investment. Until we use the net proceeds, we plan to invest them, and these investments may not yield a favorable rate of return. If we do not invest or apply the net proceeds in ways that enhance stockholder value, we may fail to achieve expected financial results, which could cause our stock price to decline.
Concentration of ownership among our officers, directors, significant stockholders, and their affiliates may prevent minority investors from influencing corporate decisions.
Our officers, directors, and their affiliated funds and each of our stockholders who own greater than 5% of our outstanding common stock and their affiliates, in the aggregate, beneficially owned an aggregate of approximately 65.8% of the outstanding shares of our common stock as of December 31, 2017. If some of these persons or entities act together, they will have significant influence over the outcome of matters submitted to our stockholders for approval, including the election of directors and approval of significant corporate transactions, such as a merger or other sale of our company or our assets. This concentration of ownership could limit the ability of other stockholders to influence corporate matters and may have the effect of delaying or preventing a change of control of our company. Some of these persons or entities may have interests different from yours.
We do not intend to pay dividends for the foreseeable future.
We never have declared or paid any cash dividends on our capital stock and do not intend to pay any cash dividends in the foreseeable future. In addition, our credit facility restricts, and any future debt or preferred security arrangements may restrict, our ability to make distributions to our stockholders. We anticipate that we will retain any future earnings for use in the development of our business and for general corporate purposes. Any determination to pay dividends in the future will be at the discretion of our board of directors. Accordingly, investors must rely on sales of their shares of our common stock after price appreciation, which may never occur, as the only way to realize any future gains on their investments.
We are an “emerging growth company,” and we cannot be certain if the reduced disclosure requirements applicable to emerging growth companies will make our common stock less attractive to investors.
For so long as we remain an “emerging growth company,” as defined in the JOBS Act, we may take advantage of certain exemptions from various requirements that are applicable to public companies that are not “emerging growth companies,” including not being required to comply with the independent auditor attestation requirements of Section 404 of the Sarbanes-Oxley Act, reduced disclosure obligations regarding executive compensation in our periodic reports and proxy statements, and exemptions from the requirements of holding a nonbinding advisory vote on executive compensation and stockholder approval of any golden parachute payments not previously approved. Further, we have elected to take advantage of the extended transition period to comply with new or revised accounting standards. As a result of the
44
accounting standards election, we will not be subject to the same implementation timing for new or revised accounting standards as other public companies that are not emerging growth companies, which may make comparison of our financials to those of other public companies more difficult. We will remain an “emerging growth company” until the earliest of (i) the last day of the year following the fifth anniversary of the completion of our IPO, (ii) the last day of the first year in which our annual gross revenue is $1.07 billion or more, (iii) the date on which we have, during the previous rolling three-year period, issued more than $1.00 billion in non-convertible debt securities or (iv) the date on which we are deemed to be a “large accelerated filer” as defined in the Exchange Act. We cannot predict if investors will find our common stock less attractive because we may rely on these exemptions. If some investors find our common stock less attractive as a result, there may be a less active trading market for our common stock, and our stock price may be more volatile and may decline.
Anti-takeover provisions in our charter documents and under Delaware law could make an acquisition of our company more difficult, limit attempts by our stockholders to replace or remove our current management and limit the market price of our common stock.
Provisions in our amended and restated certificate of incorporation and amended and restated bylaws may have the effect of delaying or preventing a change of control or changes in our management. Our amended and restated certificate of incorporation and amended and restated bylaws include provisions that:
|
· |
authorize our board of directors to issue, without further action by the stockholders, shares of undesignated preferred stock with terms, rights, and preferences determined by our board of directors that may be senior to our common stock; |
|
· |
require that any action to be taken by our stockholders be effected at a duly called annual or special meeting and not by written consent; |
|
· |
specify that special meetings of our stockholders can be called only by our board of directors, the chairperson of our board of directors, or our chief executive officer; |
|
· |
establish an advance notice procedure for stockholder proposals to be brought before an annual meeting, including proposed nominations of persons for election to our board of directors; |
|
· |
establish that our board of directors is divided into three classes, with each class serving three-year staggered terms; |
|
· |
prohibit cumulative voting in the election of directors; |
|
· |
provide that our directors may be removed for cause only upon the vote of sixty-six and two-thirds percent (66%) of our outstanding shares of common stock; |
|
· |
provide that vacancies on our board of directors may be filled only by a majority of directors then in office, even though less than a quorum; and |
|
· |
require the approval of our board of directors or the holders of at least sixty-six and two-thirds percent (66%) of our outstanding shares of common stock to amend our bylaws and certain provisions of our certificate of incorporation. |
These provisions may frustrate or prevent any attempts by our stockholders to replace or remove our current management by making it more difficult for stockholders to replace members of our board of directors, which is responsible for appointing the members of our management. In addition, because we are incorporated in Delaware, we are governed by the provisions of Section 203 of the Delaware General Corporation Law, which generally prohibits a Delaware corporation from engaging in any of a broad range of business combinations with any “interested” stockholder for a period of three years following the date on which the stockholder became an “interested” stockholder. Any delay or prevention of a change of control transaction or changes in our management could cause the market price of our common stock to decline.
45
Our amended and restated certificate of incorporation provides that the Court of Chancery of the State of Delaware or the U.S. federal district courts are the exclusive forums for substantially all disputes between us and our stockholders, which could limit our stockholders’ ability to obtain a favorable judicial forum for disputes with us or our directors, officers, or other employees.
Our amended and restated certificate of incorporation provides that the Court of Chancery of the State of Delaware is the sole and exclusive forum for any derivative action or proceeding brought on our behalf, any action asserting a breach of fiduciary duty owed by any of our directors, officers or other employees to us or our stockholders, any action asserting a claim against us arising pursuant to any provisions of the Delaware General Corporation Law, our amended and restated certificate of incorporation or our amended and restated bylaws, or any action asserting a claim against us that is governed by the internal affairs doctrine. Our amended and restated certificate of incorporation further provides that the U.S. federal district courts are the exclusive forum for resolving any complaint asserting a cause of action arising under the Securities Act. These choice of forum provisions may limit a stockholder’s ability to bring a claim in a judicial forum that it finds favorable for disputes with us or our directors, officers, or other employees, which may discourage such lawsuits. If a court were to find either choice of forum provision contained in our amended and restated certificate of incorporation to be inapplicable or unenforceable in an action, we may incur additional costs associated with resolving such action in other jurisdictions, which could adversely affect our results of operations and financial condition.
If securities or industry analysts do not publish research or publish inaccurate or unfavorable research about our business, our stock price and trading volume could decline.
The trading market for our common stock depends in part on the research and reports that securities or industry analysts publish about us or our business. If one or more of the analysts who cover us downgrade our common stock or publish inaccurate or unfavorable research about our business, our common stock price would likely decline. If one or more of these analysts cease coverage of us or fail to publish reports on us regularly, demand for our common stock could decrease, which might cause our common stock price and trading volume to decline.
Item 1B.Unresolved Staff Comments
None.
Our principal corporate office is in Denver, Colorado, where we occupy 72,000 square feet under a lease that expires in 2024. We also have offices in Redwood City, California, Orange, California, and London, United Kingdom. We host our platform infrastructure through a combination of leased co-location space at third-party data centers and mail processing facilities in locations spread across the United States, as well as in Asia, the United Kingdom, and Europe. We also utilize public-cloud resources. We believe our facilities are adequate and suitable for our current needs, and suitable additional space will be available, if needed.
From time to time we are involved in legal proceedings and subject to claims arising in the ordinary course of our business. We are not presently a party to any legal proceedings that, if determined adversely to us, would individually or taken together have a material adverse effect on our business, operating results, financial condition, or cash flows. Regardless of the outcome, litigation can have an adverse impact on us because of defense and settlement costs, diversion of management time and resources and other factors.
Item 4.Mine Safety Disclosures
Not applicable.
46
Item 5.Market for Registrant’s Common Equity, Related Stockholder Matters, and Issuer Purchases of Equity Securities
Market Information
Our common stock commenced trading on the NYSE, under the symbol SEND on November 15, 2017. Prior to that date, there was no public market for our common stock. The following table summarizes the high and low sale prices of our common stock as reported by NYSE:
|
|
Low |
High |
|
November 15, 2017 to December 31, 2017 |
$17.50 |
$24.45 |
As of February 15, 2018, we had 187 holders of record of our common stock. The actual number of stockholders is greater than this number of record holders and includes stockholders who are beneficial owners but whose shares are held in street name by brokers and other nominees.
Dividends
We have never declared or paid cash dividends and do not intend to pay any cash dividends in the foreseeable future. In addition, our credit facility restricts, and any future debt or preferred security arrangements may restrict, our ability to make distributions to our stockholders. We anticipate that we will retain any future earnings for use in the development of our business and for general corporate purposes. Any determination to pay dividends in the future will be at the discretion of our board of directors.
Stock Performance Graph
This performance graph shall not be deemed “soliciting material” or to be “filed” with the SEC for purposes of Section 18 of the Exchange Act, or otherwise subject to the liabilities under that Section, and shall not be deemed to be incorporated by reference into any SendGrid filing under the Securities Act or the Exchange Act.
47
The chart below presents the cumulative total return to our stockholders between November 15, 2017 (the date our common stock commenced trading on the NYSE) through December 31, 2017 in comparison to the Standard and Poor’s 500 Index, or S&P 500, and the Standard and Poor’s North American Technology Software Index, or S&P Technology. All values assume a $100 initial investment. Data for the S&P 500 and S&P Technology assume reinvestment of dividends. The comparisons are based on historical data and are not indicative of, nor intended to forecast, the future performance of our common stock.
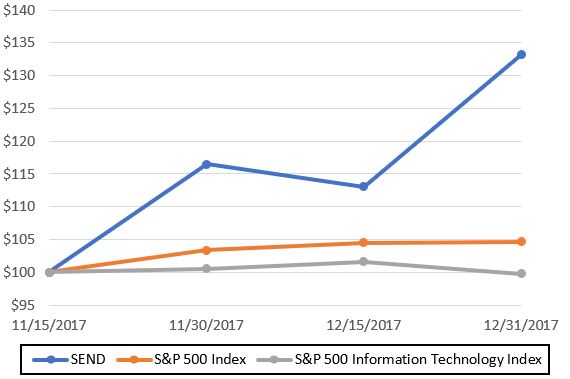
Securities Authorized for Issuance Under Equity Compensation Plans
See “Item 12. Security Ownership of Certain Beneficial Owners and Management and Related Stockholder Matters” in this Annual Report on Form 10-K.
Sales of Unregistered Securities
From January 1, 2017, to November 15, 2017 (the date of the filing of our registration statement on Form S-8), we issued and sold the following securities:
|
(1) |
We granted stock options under our 2012 Equity Incentive Plan to purchase an aggregate of 3,471,073 shares of our common stock at exercise prices ranging between $4.52 and $12.72 per share to a total of 421 employees, directors, and consultants. |
|
(2) |
We issued and sold to our employees, directors, and consultants an aggregate of 443,205 shares of our common stock upon the exercise of options for aggregate proceeds of approximately $0.5 million. |
|
(3) |
We issued RSUs under our 2012 Equity Incentive Plan for an aggregate of 34,717 shares of our common stock to one employee. |
The sales of the above securities were exempt from registration under the Securities Act in reliance upon Section 4(a)(2) of the Securities Act, or Rule 701 promulgated under Section 3(b) of the Securities Act as transactions by an issuer not involving any public offering or pursuant to benefit plans and contracts relating to compensation as provided under Rule 701. The recipients of the securities in each of these transactions represented their intentions to acquire for investment
48
only and not with a view to or for sale in connection with any distribution thereof, and appropriate legends were placed upon stock certificates issued in these transactions.
Additionally, on November 17, 2017, we issued 44,894 shares of our common stock to PacWest Bancorp. The shares were issued upon the closing of our IPO pursuant to the “net exercise” of a warrant to purchase shares of our common stock held by PacWest Bancorp. We did not receive any cash or other consideration as the warrant was “net exercised” in full. The issuance of the shares of common stock upon exercise of the warrant as exempt from registration pursuant to Section 3(a)(9) of the Securities Act.
Use of Proceeds from Initial Public Offering of Common Stock
In November 2017, we closed our IPO in which we sold 9,430,000 shares of common stock at a public offering price of $16.00 per share. This includes share sold in connection with the exercise of the underwriters’ option to purchase additional shares. The offer and sale of all of the shares in the IPO were registered under the Securities Act pursuant to a registration statement on Form S-1 (File No. 333-221003), which was declared effective by the SEC on November 14, 2017.
Morgan Stanley & Co. LLC and J.P. Morgan Securities LLC acted as representatives for the underwriters. The offering commenced on November 14, 2017 and did not terminate before all securities registered in the registration statement were sold.
We raised $136.3 million in net proceeds after deducting underwriting discounts and commissions of $10.6 million and offering expenses of $4.0 million. Other than payments in the ordinary course of business to officers for salaries, we made no payments to directors, officers, or persons owning 10 percent or more of our capital stock (or their associates or affiliates). As of December 31, 2017, substantially all expenses incurred in connection with our IPO have been paid.
There has been no material change in the planned use of the IPO proceeds as described in our final prospectus filed with the SEC on November 15, 2017 pursuant to Rule 424(b) of the Securities Act. As of December 31, 2017, all proceeds were held as cash and cash equivalents.
Issuer Purchases of Equity Securities
None.
49
Item 6.Selected Consolidated Financial Data
We derived the selected consolidated statements of operations data for 2017, 2016, and 2015, and the selected consolidated balance sheet data as of December 31, 2017 and 2016 from our audited consolidated financial statements included elsewhere in this Annual Report on Form 10-K. The consolidated statements of operations data for 2014 and the consolidated balance sheet data as of December 31, 2015 are derived from audited consolidated financial statements that are not included in this Annual Report on Form 10-K. Our historical results are not necessarily indicative of the results that may be expected in the future. You should read this data together with our “Management’s Discussion and Analysis of Financial Condition and Results of Operations” and the consolidated financial statements and related notes included elsewhere in this Annual Report on Form 10-K.
|
|
|
For the Year Ended December 31, |
||||||||||
|
|
|
2017 |
|
2016 |
|
2015 |
|
2014 |
||||
|
|
|
(In thousands, except per share amounts) |
||||||||||
|
Consolidated Statements of Operations Data: |
|
|
|
|
|
|
|
|
|
|
|
|
|
Revenue |
|
$ |
111,888 |
|
$ |
79,929 |
|
$ |
58,476 |
|
$ |
42,776 |
|
Cost of revenue (1) (2) |
|
|
29,507 |
|
|
21,605 |
|
|
18,961 |
|
|
15,187 |
|
Gross profit |
|
|
82,381 |
|
|
58,324 |
|
|
39,515 |
|
|
27,589 |
|
Operating expenses: (1) (2) |
|
|
|
|
|
|
|
|
|
|
|
|
|
Research and development |
|
|
29,643 |
|
|
21,178 |
|
|
18,959 |
|
|
15,290 |
|
Selling and marketing (3) |
|
|
28,185 |
|
|
21,800 |
|
|
13,737 |
|
|
15,260 |
|
General and administrative (4) (5) |
|
|
30,101 |
|
|
18,920 |
|
|
12,477 |
|
|
9,550 |
|
Loss on disposal of assets |
|
|
22 |
|
|
27 |
|
|
1 |
|
|
63 |
|
Total operating expenses |
|
|
87,951 |
|
|
61,925 |
|
|
45,174 |
|
|
40,163 |
|
Loss from operations |
|
|
(5,570) |
|
|
(3,601) |
|
|
(5,659) |
|
|
(12,574) |
|
Other income (expense), net: (6) |
|
|
(683) |
|
|
(307) |
|
|
(195) |
|
|
(386) |
|
Net loss before provision for income taxes |
|
|
(6,253) |
|
|
(3,908) |
|
|
(5,854) |
|
|
(12,960) |
|
Provision for income taxes |
|
|
- |
|
|
- |
|
|
- |
|
|
- |
|
Net loss |
|
$ |
(6,253) |
|
$ |
(3,908) |
|
$ |
(5,854) |
|
$ |
(12,960) |
|
|
|
|
|
|
|
|
|
|
|
|
|
|
|
Weighted average shares used in computing net loss per share, basic and diluted (7) |
|
|
8,499 |
|
|
7,521 |
|
|
7,091 |
|
|
5,194 |
|
Net loss per share, basic and diluted |
|
$ |
(0.74) |
|
$ |
(0.52) |
|
$ |
(0.83) |
|
$ |
(2.50) |
|
(1) |
Includes stock-based compensation expense as follows: |
|
|
|
For the Year Ended December 31, |
||||||||||
|
|
|
2017 |
|
2016 |
|
2015 |
|
2014 |
||||
|
|
|
(In thousands) |
||||||||||
|
Cost of revenue |
|
$ |
474 |
|
$ |
131 |
|
$ |
97 |
|
$ |
103 |
|
Research and development |
|
|
1,294 |
|
|
552 |
|
|
379 |
|
|
157 |
|
Selling and marketing |
|
|
899 |
|
|
402 |
|
|
193 |
|
|
125 |
|
General and administrative |
|
|
2,313 |
|
|
814 |
|
|
706 |
|
|
309 |
|
Total |
|
$ |
4,980 |
|
$ |
1,899 |
|
$ |
1,375 |
|
$ |
694 |
50
|
(2) |
Includes merger and acquisition expense as follows: |
|
|
|
For the Year Ended December 31, |
||||||||||
|
|
|
2017 |
|
2016 |
|
2015 |
|
2014 |
||||
|
|
|
(In thousands) |
||||||||||
|
Cost of revenue |
|
$ |
67 |
|
$ |
- |
|
$ |
- |
|
$ |
- |
|
Research and development |
|
|
545 |
|
|
- |
|
|
- |
|
|
- |
|
Selling and marketing |
|
|
16 |
|
|
- |
|
|
- |
|
|
- |
|
General and administrative |
|
|
266 |
|
|
- |
|
|
- |
|
|
- |
|
Total |
|
$ |
894 |
|
$ |
- |
|
$ |
- |
|
$ |
- |
|
(3) |
Includes non-capitalizable costs related to preparation to become and operate as a public company of $0.2 million, $0, $0, and $0 for the years ended December 31, 2017, 2016, 2015, and 2014, respectively. |
|
(4) |
Includes non-capitalizable costs related to preparation to become and operate as a public company of $1.7 million, $0.1 million, $0, and $0 for the years ended December 31, 2017, 2016, 2015, and 2014, respectively. |
|
(5) |
Includes restructuring expense of $1.2 million, $0.4 million, $0, and $0 for the years ended December 31, 2017, 2016, 2015, and 2014, respectively. |
|
(6) |
Includes warrant fair value adjustment of $0.7 million, $0.1 million, $0, and $0.1 million for the years ended December 31, 2017, 2016, 2015, and 2014, respectively. |
|
(7) |
See Note 13 to our consolidated financial statements for an explanation of the method used to calculate basic and diluted net loss per common share attributable to common stockholders. |
|
|
|
As of December 31, |
|||||||
|
|
|
2017 |
|
2016 |
|
2015 |
|||
|
|
|
(In thousands) |
|||||||
|
Consolidated Balance Sheet Data: |
|
|
|
|
|
|
|
|
|
|
Cash and cash equivalents |
|
$ |
175,496 |
|
$ |
40,400 |
|
$ |
9,269 |
|
Working capital |
|
$ |
168,498 |
|
$ |
33,775 |
|
$ |
5,665 |
|
Property and equipment, net |
|
$ |
29,192 |
|
$ |
19,190 |
|
$ |
10,413 |
|
Total assets |
|
$ |
223,283 |
|
$ |
66,635 |
|
$ |
24,676 |
|
Total stockholders' equity (deficit) |
|
$ |
179,774 |
|
$ |
(37,780) |
|
$ |
(35,947) |
Non-GAAP Financial Measures
To supplement our consolidated financial statements, which are prepared and presented in accordance with GAAP, we use certain non-GAAP financial measures, as described below, to understand and evaluate our core operating performance. These non-GAAP financial measures, which may be different than similarly titled measures used by other companies, are presented to enhance investors’ overall understanding of our financial performance and should not be considered a substitute for, or superior to, the financial information prepared and presented in accordance with GAAP.
We believe that these non-GAAP financial measures provide useful information about our financial performance, enhance the overall understanding of our past performance and future prospects, and allow for greater transparency with respect to important metrics used by our management for financial and operational decision-making. We are presenting these non-GAAP financial metrics to assist investors in seeing our financial performance through the eyes of management, and
51
because we believe that these measures provide an additional tool for investors to use in comparing our core financial performance over multiple periods with other companies in our industry.
|
|
|
For the Year Ended December 31, |
||||||||||
|
|
|
2017 |
|
2016 |
|
2015 |
|
2014 |
||||
|
|
|
(In thousands) |
||||||||||
|
Adjusted net income (loss) |
|
$ |
3,377 |
|
$ |
(1,440) |
|
$ |
(4,460) |
|
$ |
(12,190) |
|
Free cash flow |
|
$ |
369 |
|
$ |
(2,462) |
|
$ |
(3,965) |
|
$ |
(13,584) |
Adjusted net income (loss)
We use the non-GAAP financial measure of adjusted net income (loss), which is defined as GAAP net income (loss), excluding stock-based compensation expense, restructuring expense, costs associated with mergers and acquisitions, warrant fair value adjustment and non-capitalizable costs associated with our recent IPO. Due to our significant federal and state net operating loss carryforwards, as well as a full valuation against our net deferred tax assets, there is no income tax effect on adjusted net income (loss) in the presented periods. We believe that adjusted net income (loss) helps identify underlying trends in our business that could otherwise be masked by the effect of the expenses that we exclude in adjusted net income (loss). Additionally, our executive compensation structure uses an adjusted net income (loss) target as one of the components when calculating payments that have been earned.
The following table presents a reconciliation of net loss, the most directly comparable financial measure calculated in accordance with GAAP, to adjusted net income (loss), for each of the periods presented:
|
|
|
For the Year Ended December 31, |
||||||||||
|
|
|
2017 |
|
2016 |
|
2015 |
|
2014 |
||||
|
|
|
(In thousands) |
||||||||||
|
Net loss |
|
$ |
(6,253) |
|
$ |
(3,908) |
|
$ |
(5,854) |
|
$ |
(12,960) |
|
Stock-based compensation expense |
|
|
4,980 |
|
|
1,899 |
|
|
1,375 |
|
|
694 |
|
Restructuring expense |
|
|
1,158 |
|
|
385 |
|
|
- |
|
|
- |
|
Merger and acquisition expense |
|
|
894 |
|
|
- |
|
|
- |
|
|
- |
|
Adjustment to convertible preferred stock warrant liability |
|
|
667 |
|
|
86 |
|
|
19 |
|
|
76 |
|
Certain IPO costs |
|
|
1,931 |
|
|
98 |
|
|
- |
|
|
- |
|
Adjusted net income (loss) |
|
$ |
3,377 |
|
$ |
(1,440) |
|
$ |
(4,460) |
|
$ |
(12,190) |
There are a number of limitations related to the use of adjusted net income (loss) as compared to net loss, including that adjusted net income (loss) excludes stock-based compensation expense, which has been, and will continue to be for the foreseeable future, a significant recurring expense in our business and an important part of our compensation strategy.
Free cash flow
We use the non-GAAP financial measure of free cash flow, which is defined as GAAP net cash flows from operating activities, reduced by purchase of property and equipment, and principal payments on capital lease obligations. We believe free cash flow is an important liquidity measure of the cash that is available, after capital expenditures, for operational expenses, investment in our business and to make acquisitions. Free cash flow is useful to investors as a liquidity measure because it measures our ability to generate or use cash. Once our business needs and obligations are met, cash can be used to maintain a strong balance sheet and invest in future growth.
52
The following table presents a reconciliation of net cash from operating activities, the most directly comparable financial measure calculated in accordance with GAAP, to free cash flow for each of the periods presented:
|
|
|
For the Year Ended December 31, |
||||||||||
|
|
|
2017 |
|
2016 |
|
2015 |
|
2014 |
||||
|
|
|
(In thousands) |
||||||||||
|
Net cash flows from operating activities |
|
$ |
12,674 |
|
$ |
9,689 |
|
$ |
1,230 |
|
$ |
(9,640) |
|
Purchase of property and equipment |
|
|
(5,613) |
|
|
(7,087) |
|
|
(1,256) |
|
|
(2,446) |
|
Principal payments on capital lease obligations |
|
|
(6,692) |
|
|
(5,064) |
|
|
(3,939) |
|
|
(1,498) |
|
Free cash flow |
|
$ |
369 |
|
$ |
(2,462) |
|
$ |
(3,965) |
|
$ |
(13,584) |
There are a number of limitations related to the use of free cash flow as compared to net cash from operating activities, including that free cash flow does not reflect future contractual commitments.
53
Item 7.MANAGEMENT’S DISCUSSION AND ANALYSIS OF FINANCIAL CONDITION AND RESULTS OF OPERATIONS
You should read the following discussion and analysis of our financial condition and results of operations together with our consolidated financial statements and the related notes and other financial information included elsewhere in this Annual Report on Form 10-K. Some of the information contained in this discussion and analysis or set forth elsewhere in this Annual Report on Form 10-K, including information with respect to our plans and strategy for our business, includes forward looking statements that involve risks and uncertainties. You should review the sections titled “Note Regarding Forward Looking Statements” and “Risk Factors” for a discussion of important factors that could cause actual results to differ materially from the results described in or implied by the forward looking statements contained in the following discussion and analysis.
Overview
We are a leading digital communication platform, enabling businesses to engage with their customers via email reliably, effectively and at scale. Our cloud-based platform allows for frictionless adoption and immediate value creation for businesses, providing their developers and marketers with the tools to seamlessly and effectively reach their customers using email. Since our inception we have processed more than one trillion emails.
SendGrid was started by three developers who found themselves spending an increasing amount of time resolving email issues rather than working on the core products of their emerging technology companies. Frustrated with the time and effort required to send email at scale, they started our company with the goal of building an effective and easy to adopt platform for scalable email delivery. Since our founding, we have focused on extending the scale and reliability of our platform while expanding the scope of our offerings. We introduced our Email API service in 2009, which allowed businesses to send both transactional and marketing emails. We continued to add functionality to our platform and in late 2015 introduced our Marketing Campaigns service, which allows marketers to upload and manage customer contact lists, create and test email templates, and then execute and analyze multi-faceted email campaigns that engage customers and drive growth. Our Marketing Campaigns service replaced our predecessor email marketing service, which we sunset at the end of 2017. In 2016, we introduced Expert Services to help businesses further optimize the deliverability of their emails and the effectiveness of their email marketing programs.
Our services are designed to be easy to adopt and affordable for businesses of all sizes. Our services are easily accessible from our website, with transparent pricing and a monthly contract term. Our customers pay for what they need and can begin using our services in minutes. We generate revenue primarily through sales of subscriptions to our services. We offer our Email API service on a subscription basis, priced based on email volume. Our Email API service pricing plans start at $9.95 per month for up to 40,000 emails. Our Marketing Campaigns service is priced based on the number of email contacts stored on our platform and the number of monthly emails sent to those contacts through our Email API service. Our Marketing Campaigns service is fully integrated, such that businesses using the service to store email contacts on our system must also use our Email API to send email to those contacts. Therefore, revenue from our Marketing Campaigns service includes revenue generated from subscriptions by our Marketing Campaigns customers both to store email contacts on our system and to send emails through our Email API service to those contacts. Expert Services are charged either on a monthly basis or as a one-time consultation fee and to date has accounted for a de minimis percentage of our total revenue.
We primarily sell to developers and marketers who want easy to use, self-service tools. Businesses learn about us through our marketing efforts or through our user community and sign up through our website. We offer documentation to enable self-service onboarding and 24 x 7 support to answer questions. We also sell our services to and through leading public cloud infrastructure providers and ecommerce platforms, such as Heroku, Amazon Web Services and Microsoft Azure, software vendors that offer complementary products and with which we co sell our Email API and Marketing Campaigns services, such as GitHub, New Relic and Twilio, and digital marketing agencies, such as Deloitte Digital, which resell our services to their clients. Additionally, we have a limited inside sales team to manage inbound interest from businesses.
We target any business that needs to deliver transactional or marketing email. As a result, our customers include SMBs and large enterprises across a wide range of industries. As of December 31, 2017, we had more than 63,000 customers
54
globally. We believe a relatively small number of these businesses have more than one unique paying account with us, and we count each of these accounts as a separate customer. No single customer represented more than 2% of annual total revenue in 2017, 2016, or 2015, and our ten largest customers comprised 10% or less of our total revenue in each of 2017, 2016, and 2015.
Key Factors Affecting Our Performance
The following are the key factors affecting our performance:
Attracting New Customers and Expanding with Existing Customers
We had over 63,000 customers globally as of December 31, 2017. Our revenue grows as our customers scale and send more email. Our typical adoption pattern begins with a developer who signs up for our Email API service. Once a customer begins using our Email API service, the customer often increases the number of emails sent through our service over time, principally as a result of the customer’s organic growth and also through the adoption of additional use cases and services, in each case typically without significant incremental marketing expenditures from us.
Since launching our Marketing Campaigns service in late 2015, we have seen strong receptivity from marketers, with over 10,000 customers using the service as of December 31, 2017. We intend to grow our Marketing Campaigns business by adding new Marketing Campaigns customers and by cross selling into our existing Email API service customer base. Many of our customers using our Email API service for transactional email do not use a separate, dedicated marketing product, and we believe that our Marketing Campaigns service offers them a highly attractive proposition. The growth of our business is dependent on our ability to attract and retain new customers and to expand services with existing customers.
Increasing International Revenue
Customers outside the United States are increasingly using our services. We define U.S. revenue as revenue derived from customers with U.S. billing addresses and international revenue as all other revenue. In each of 2017, 2016, and 2015, more than 36% of our total revenue was from outside the United States, and from 2015 to 2017 our international revenue increased by $20.2 million, or approximately 93%. Recently, we opened our first international sales and marketing office, located in London. We plan to grow our international revenue by expanding our sales and marketing efforts in select countries and regions, through increased leverage with international strategic partners, and through localization of our services and support.
We have relied primarily on our self-service sales model and relationships with strategic partners to attract international customers. We have limited international infrastructure, limited experience operating directly in international markets and no localization of our services or support. To the extent that our self-service sales model or strategic partner relationships do not continue to allow us to attract international customers, our international revenue may not grow or may decline, or we may incur significant additional selling and marketing and other expenses in order to grow our international revenue, including as a result of any expansion of our direct sales force outside the United States. Furthermore, our ability to successfully localize our services and support without making additional material investments in international infrastructure and personnel is uncertain. To the extent that increased costs from our international expansion are not offset by sufficient revenue growth, our profitability will be harmed. See “Risk Factors—Our future success depends in part on our ability to continue to drive adoption of our platform and services by international customers, and our international operations and sales to customers with international operations expose us to risks inherent in international sales” for additional information.
Increasing Reliance on Strategic Partners
We have established strategic relationships with a number of other companies and we intend to continue to invest in, and expand, such relationships. Our partner ecosystem includes strategic relationships with leading public cloud infrastructure providers and ecommerce platforms, software vendors that offer complementary products and with which we co sell our Email API and Marketing Campaigns services, and digital marketing agencies, which resell our services to their clients. Sales to or through these strategic partners accounted for 5%, 4% and 3% of our total revenue in 2017, 2016, and 2015,
55
respectively. Increased sales through our strategic partners will have an impact on our revenue growth and operating margin.
Seasonality
Given our volume pricing model, our revenue is directly correlated with the number of emails sent by our customers. During the fourth quarter holiday season, our customers process a relatively higher number of transactions, run a greater number of marketing programs, and therefore send more emails. Partially because of this seasonality, a greater percentage of our annual revenue has come from our fourth quarter than from other quarters. In each of 2017, 2016, and 2015, 28% to 29% of our annual revenue was in our fourth quarter. While we believe that this seasonality has affected and will continue to affect our quarterly results, our rapid growth has largely masked seasonal trends to date. Seasonality may become more pronounced in the future to the extent our revenue mix shifts between our Email API, Marketing Campaigns, and other revenue sources over time.
Key Business Metrics
We regularly review the following key metrics to measure performance, identify trends, formulate financial projections, and make strategic decisions. We are not aware of any uniform standards for calculating these key metrics. In addition, other companies may not calculate similarly titled metrics in a consistent manner, which may hinder comparability.
Customers
We believe that the size of our customer base is an important indicator of the growth of our business, the market acceptance of our platform and future revenue trends. We define a customer as any user account from which we derive revenue during the last month of the period. We believe a relatively small number of businesses have more than one unique paying account with us, and we count each of these accounts as a separate customer. More specifically, for each of the periods presented, we estimate that approximately 4% of our customers may have been part of the same business as one or more of our other customers. Any such affiliations among our customers do not impact how we manage our business or our customer relationships or how our operating results are reported. We view our total number of customers, irrespective of any affiliations among them, as reflective of the number of sources of revenue to us and our growth and potential for future growth because each customer reported is making a separate purchasing decision with respect to our services. Furthermore, in general, we count each of our strategic partners as a single customer regardless of how many end customers the strategic partner may have that are using our services.
Email volume
We believe email volume is an important measure of our business because it is a key indicator of volume growth and our ability to generate revenue, since a substantial majority of our revenue is based on the number of emails processed. Email volume consists of the total number of emails we processed in a given period.
Subscription Net Dollar Retention Rate
We believe subscription net dollar retention rate is an important measure for evaluating our business because it quantifies the impact on revenue growth of both retention and expansion of our existing customers.
Our ability to drive growth and generate incremental revenue depends, in part, on our ability to retain our customers and increase their use of our platform. An important way in which we track our performance in this area is by measuring subscription net dollar retention rate.
Our subscription net dollar retention rate increases when our customers increase their volume usage of our Email API service or extend usage of our other services. Our subscription net dollar retention rate decreases when customers temporarily or permanently cease or reduce volume usage of our Email API service or otherwise cease or reduce usage of our other services. Changes in our pricing may materially impact our subscription net dollar retention rate in the future but did not have a material impact for any of the periods presented.
56
Our subscription net dollar retention rate compares the subscription revenue from a set of customers in a period to the same period in the prior year. To calculate the subscription net dollar retention rate for a period, we first identify the cohort of customers that were customers in the equivalent prior year period. Subscription net dollar retention rate for a period is the quotient obtained by dividing the subscription revenue generated from that cohort in a period, by the subscription revenue generated from that same cohort in the corresponding prior year period.
Alternatively, our subscription net dollar retention rate can be calculated as the difference between our subscription dollar expansion rate and our subscription gross dollar churn rate. Our subscription dollar expansion rate is indicative of net revenue growth period over period from customers that contribute revenue in both the measured period and the equivalent prior year period. We calculate subscription dollar expansion rate for a period in two steps: first, we take the increase or decrease in the subscription revenue in a period from customers that contributed revenue in both that period and the same period in the prior year and add the total subscription revenue in the prior year period; and second, we divide the result of the first step by the total subscription revenue in the prior year period. Our subscription gross dollar churn rate is indicative of lost revenue from customers that contribute no revenue in the measured period but did contribute revenue in the equivalent prior year period. We also calculate subscription gross dollar churn rate in a period in two steps: first, we measure the amount of subscription revenue in the same period in the prior year from customers that contributed revenue in the prior year period but did not contribute revenue in the given period; and second, we divide the result of the first step by the total subscription revenue in the equivalent prior year period.
For 2017, 2016, and 2015, our subscription dollar expansion rate was 126%, 122%, and 124%, respectively, and our subscription gross dollar churn rate was 9%, 11%, and 12%, respectively. Our subscription net dollar retention rate for those periods is set forth in the table below.
The following are our key metrics as of and for each of 2017, 2016, and 2015.
|
|
|
December 31, |
|
|||||||
|
|
|
2017 |
|
2016 |
|
2015 |
|
|||
|
Customers (in thousands) (at period end) |
|
|
63.6 |
|
|
45.9 |
|
|
33.4 |
|
|
Email volume (in billions) (for the period ended) |
|
|
457 |
|
|
338 |
|
|
233 |
|
|
Subscription net dollar retention rate (for the period ended) |
|
|
117 |
% |
|
111 |
% |
|
112 |
% |
Components of Results of Operations
Revenue
We generate revenue primarily through the sale of our Email API and Marketing Campaigns services, which we sell on a monthly subscription basis. Sales of our Email API service accounted for 80%, 79%, and 79% our total revenue in 2017, 2016, and 2015, respectively. Other sources of revenue for these periods consisted of sales of our email marketing services, including sales of our Marketing Campaigns service and its predecessor, and other sources, including professional services. Sales of our Marketing Campaigns service accounted for 13%, 9%, and 1% of our total revenue in each of 2017, 2016, and 2015, respectively. Revenue attributed to sales of our Email API service does not include the portion of revenue generated by subscriptions from our email marketing services customers to send emails through our Email API to contacts stored on our system for use with our email marketing services.
Our customers subscribe to our Email API service through a plan that provides for a predetermined allowance of renewable email credits to be used each month. Usage above the plan’s credit allowance is billed as an overage charge. All plans include basic customer support.
Certain customers also subscribe to our Marketing Campaigns service. Our customers store email contacts and segmentation information on our platform in order to customize communications.
Our revenue is generally recognized ratably over the applicable service period.
57
Cost of Revenue
Cost of revenue consists principally of depreciation and amortization expense related to hosting equipment and outsourced managed hosting costs. Other components include employee related costs, including compensation, other related costs, and an allocation of our general overhead. We expect our cost of revenue to continue to increase in absolute dollar amounts as we invest in our business.
Gross Profit and Gross Margin
Gross profit is total revenue less total cost of revenue. Gross margin is gross profit expressed as a percentage of total revenue. We expect that gross profit and gross margin will continue to be affected by various factors including our pricing, our mix of services sold and our ability to increase total revenue at a sufficient rate to cover fixed costs.
Operating Expenses
Our operating expenses consist of research and development, selling and marketing, and general and administrative expenses.
Research and Development Expense
Research and development expense consists primarily of employee related costs, including compensation, other related costs, and an allocation of our general overhead. Also included are non-personnel costs, such as consulting and professional fees for third party development resources and depreciation costs. Our research and development efforts focus on maintaining and enhancing functionality of existing services and adding new features and services. We expect research and development expense to increase in absolute dollars as we invest in the enhancement of our services.
Selling and Marketing Expense
Selling and marketing expense consists primarily of employee related costs, including compensation, other related costs, and an allocation of our general overhead. These expenses also include expenditures related to advertising, marketing, promotional events, and brand awareness activities. We expect selling and marketing expense to continue to increase in absolute dollars as we enhance our services and implement new marketing strategies.
General and Administrative Expense
General and administrative expense consists primarily of employee related costs, including compensation, other related costs, and an allocation of our general overhead for those employees associated with administrative services such as legal, human resources, information technology, accounting, and finance. These expenses also include certain third-party consulting services, certain facilities costs, credit card processing fees, and any corporate overhead costs not allocated to other expense categories.
We expect our general and administrative expense to increase in absolute dollars as we continue to grow our business. We also anticipate that we will incur additional costs for employees and third-party consulting services related to operating as a public company.
58
Results of Operations
The following table sets forth our consolidated statements of operations data for the periods indicated:
|
|
|
For the Year Ended December 31, |
|||||||
|
|
|
2017 |
|
2016 |
|
2015 |
|||
|
|
|
(In thousands) |
|||||||
|
Consolidated Statements of Operations Data: |
|
|
|
|
|
|
|
|
|
|
Revenue |
|
$ |
111,888 |
|
$ |
79,929 |
|
$ |
58,476 |
|
Cost of revenue (1)(2) |
|
|
29,507 |
|
|
21,605 |
|
|
18,961 |
|
Gross profit |
|
|
82,381 |
|
|
58,324 |
|
|
39,515 |
|
Operating expenses: (1)(2) |
|
|
|
|
|
|
|
|
|
|
Research and development |
|
|
29,643 |
|
|
21,178 |
|
|
18,959 |
|
Selling and marketing (3) |
|
|
28,185 |
|
|
21,800 |
|
|
13,737 |
|
General and administrative (4)(5) |
|
|
30,101 |
|
|
18,920 |
|
|
12,477 |
|
Loss on disposal of assets |
|
|
22 |
|
|
27 |
|
|
1 |
|
Total operating expenses |
|
|
87,951 |
|
|
61,925 |
|
|
45,174 |
|
Loss from operations |
|
|
(5,570) |
|
|
(3,601) |
|
|
(5,659) |
|
Other income (expense), net: (6) |
|
|
(683) |
|
|
(307) |
|
|
(195) |
|
Net loss before provision for income taxes |
|
|
(6,253) |
|
|
(3,908) |
|
|
(5,854) |
|
Provision for income taxes |
|
|
- |
|
|
- |
|
|
- |
|
Net loss |
|
$ |
(6,253) |
|
$ |
(3,908) |
|
$ |
(5,854) |
|
(1) |
Includes stock-based compensation expense as follows: |
|
|
|
For the Year Ended December 31, |
|||||||
|
|
|
2017 |
|
2016 |
|
2015 |
|||
|
|
|
(In thousands) |
|||||||
|
Cost of revenue |
|
$ |
474 |
|
$ |
131 |
|
$ |
97 |
|
Research and development |
|
|
1,294 |
|
|
552 |
|
|
379 |
|
Selling and marketing |
|
|
899 |
|
|
402 |
|
|
193 |
|
General and administrative |
|
|
2,313 |
|
|
814 |
|
|
706 |
|
Total |
|
$ |
4,980 |
|
$ |
1,899 |
|
$ |
1,375 |
|
(2) |
Includes merger and acquisition expense as follows: |
|
|
|
For the Year Ended December 31, |
|||||||
|
|
|
2017 |
|
2016 |
|
2015 |
|||
|
|
|
(In thousands) |
|||||||
|
Cost of revenue |
|
$ |
67 |
|
$ |
- |
|
$ |
- |
|
Research and development |
|
|
545 |
|
|
- |
|
|
- |
|
Selling and marketing |
|
|
16 |
|
|
- |
|
|
- |
|
General and administrative |
|
|
266 |
|
|
- |
|
|
- |
|
Total |
|
$ |
894 |
|
$ |
- |
|
$ |
- |
|
(3) |
Includes non-capitalizable costs related to preparation to become and operate as a public company of $0.2 million, $0, and $0 for the years ended December 31, 2017, 2016, and 2015, respectively. |
|
(4) |
Includes non-capitalizable costs related to preparation to become and operate as a public company of $1.7 million, $0.1 million, and $0 for the years ended December 31, 2017, 2016, and 2015, respectively. |
|
(5) |
Includes restructuring expense of $1.2 million, $0.4 million, and $0 for the years ended December 31, 2017, 2016, and 2015, respectively. |
59
|
(6) |
Includes warrant fair value adjustment of $0.7 million, $0.1 million, and $0 for the years ended December 31, 2017, 2016, and 2015, respectively. |
The following table sets forth our consolidated statements of operations data expressed as a percentage of total revenue:
|
|
|
For the Year Ended December 31, |
|
|||||||
|
|
|
2017 |
|
2016 |
|
2015 |
|
|||
|
Consolidated Statements of Operations Data: |
|
|
|
|
|
|
|
|
|
|
|
Revenue |
|
|
100 |
% |
|
100 |
% |
|
100 |
% |
|
Cost of revenue |
|
|
26 |
|
|
27 |
|
|
32 |
|
|
Gross margin |
|
|
74 |
|
|
73 |
|
|
68 |
|
|
Operating expenses: |
|
|
|
|
|
|
|
|
|
|
|
Research and development |
|
|
26 |
|
|
26 |
|
|
32 |
|
|
Selling and marketing |
|
|
25 |
|
|
27 |
|
|
23 |
|
|
General and administrative |
|
|
27 |
|
|
24 |
|
|
21 |
|
|
Loss on disposal of assets |
|
|
— |
|
|
— |
|
|
— |
|
|
Total operating expenses |
|
|
79 |
|
|
77 |
|
|
77 |
|
|
Loss from operations |
|
|
(5) |
|
|
(5) |
|
|
(10) |
|
|
Other income (expense), net: |
|
|
(1) |
|
|
— |
|
|
— |
|
|
Net loss before provision for income taxes |
|
|
(6) |
|
|
(5) |
|
|
(10) |
|
|
Provision for income taxes |
|
|
— |
|
|
— |
|
|
— |
|
|
Net loss |
|
|
(6) |
% |
|
(5) |
% |
|
(10) |
% |
Revenue
|
|
|
For the Year Ended December 31, |
|
2017 vs. 2016 |
|
2016 vs.2015 |
|
|||||||||||||||
|
|
|
2017 |
|
2016 |
|
2015 |
|
$ Change |
|
% Change |
|
$ Change |
|
% Change |
|
|||||||
|
|
|
(Dollars in thousands) |
|
|||||||||||||||||||
|
Email API |
|
$ |
88,986 |
|
$ |
63,435 |
|
$ |
46,065 |
|
$ |
25,551 |
|
|
40 |
% |
$ |
17,370 |
|
|
38 |
% |
|
Marketing Campaigns |
|
|
14,970 |
|
|
7,061 |
|
|
749 |
|
|
7,909 |
|
|
112 |
% |
|
6,312 |
|
|
843 |
% |
|
Predecessor email marketing service |
|
|
4,144 |
|
|
7,407 |
|
|
10,768 |
|
|
(3,263) |
|
|
(44) |
% |
|
(3,361) |
|
|
(31) |
% |
|
Other |
|
|
3,788 |
|
|
2,026 |
|
|
894 |
|
|
1,762 |
|
|
87 |
% |
|
1,132 |
|
|
127 |
% |
|
Total |
|
$ |
111,888 |
|
$ |
79,929 |
|
$ |
58,476 |
|
$ |
31,959 |
|
|
40 |
% |
$ |
21,453 |
|
|
37 |
% |
Total revenue increased $32.0 million, or 40%, in 2017, compared to 2016. The increase was attributable to an increase in email volume from, and sales of additional services to, existing customers and sales of our Email API service and other services to new customers. Revenue from existing customers comprised $22.5 million, or 70%, of the $32.0 million increase, with the remaining increase attributed to revenue from new customers. Our overall email volume increased to 457 billion in 2017 from 338 billion in 2016, and our number of customers increased by 39% from December 31, 2016 to December 31, 2017. Revenue from our Email API service increased by $25.6 million, or 40%, in 2017, compared to 2016. Revenue from our email marketing services, including our Marketing Campaigns service and its predecessor, increased by $4.6 million, or 32%, in 2017, compared to 2016, as a result of a $7.9 million increase in revenue from our Marketing Campaigns service in 2017, offset by a $3.3 million decrease in revenue from our predecessor email marketing service.
Total revenue increased $21.5 million, or 37%, in 2016, compared to 2015. The increase was attributable to an increase in email volume from, and sales of additional services to, existing customers and sales of our Email API service and other services to new customers. Revenue from existing customers comprised $12.3 million, or 57%, of the $21.5 million increase, with the remaining increase attributed to revenue from new customers. Our overall email volume increased to 338 billion in 2016 from 233 billion in 2015, and our number of customers increased by 37% from December 31, 2015 to December 31, 2016. Revenue from our Email API service increased by $17.4 million, or 38%, in 2016, compared to 2015. Revenue from our email marketing services, including our Marketing Campaigns service and its predecessor, increased by $3.0 million, or 26%, in 2016, compared to 2015, as a result of a $6.3 million increase in revenue from our Marketing Campaigns service in 2016, offset by a $3.4 million decrease in revenue from our predecessor email marketing service. The increase in revenue from our Marketing Campaigns service resulted from our offering the service for the full year in 2016 following its introduction in late 2015 and sales to new and existing customers, a portion of which were users of our predecessor email marketing service.
60
Cost of Revenue and Gross Margin
|
|
|
For the Year Ended December 31, |
|
2017 vs. 2016 |
|
2016 vs. 2015 |
|
|||||||||||||||
|
|
|
2017 |
|
2016 |
|
2015 |
|
$ Change |
|
% Change |
|
$ Change |
|
% Change |
|
|||||||
|
|
|
(Dollars in thousands) |
|
|||||||||||||||||||
|
Cost of revenue |
|
$ |
29,507 |
|
$ |
21,605 |
|
$ |
18,961 |
|
$ |
7,902 |
|
|
37 |
% |
$ |
2,644 |
|
|
14 |
% |
|
Gross margin |
|
|
74 |
% |
|
73 |
% |
|
68 |
% |
|
|
|
|
|
|
|
|
|
|
|
|
Cost of revenue increased $7.9 million, or 37%, in 2017, compared to 2016. The increase was primarily attributable to a $3.9 million increase in data center and hosting costs due to the investment and use of additional property and equipment to support growth, as well as a $3.8 million increase in employee related costs due to an increase in headcount related to delivering our services and supporting our customers. There was also an increase of $0.8 million in other expenses, including allocated overhead. These increases were partially offset by a decrease in costs related to third-party consulting services of $0.6 million.
Cost of revenue increased $2.6 million, or 14%, in 2016, compared to 2015. The increase was primarily attributable to a $1.4 million increase in data center and hosting costs due to the investment and use of additional property and equipment to support growth, as well as a $1.2 million increase in employee related costs due to an increase in headcount related to delivering our services and supporting our customers.
Operating Expenses
Research and Development
|
|
|
For the Year Ended December 31, |
|
2017 vs. 2016 |
|
2016 vs. 2015 |
|
|||||||||||||||
|
|
|
2017 |
|
2016 |
|
2015 |
|
$ Change |
|
% Change |
|
$ Change |
|
% Change |
|
|||||||
|
|
|
(Dollars in thousands) |
|
|||||||||||||||||||
|
Research and development |
|
$ |
29,643 |
|
$ |
21,178 |
|
$ |
18,959 |
|
$ |
8,465 |
|
|
40 |
% |
$ |
2,219 |
|
|
12 |
% |
|
As a percentage of revenue |
|
|
26 |
% |
|
26 |
% |
|
32 |
% |
|
|
|
|
|
|
|
|
|
|
|
|
Research and development expense increased $8.5 million, or 40%, in 2017 compared to 2016. This increase was primarily a result of a $7.0 million increase in product and engineering employee related costs related to additional research and development initiatives and a $1.0 million increase in other expenses, including allocated overhead. The remaining increase of $0.5 million was related to merger and acquisition costs.
Research and development expense increased $2.2 million, or 12%, in 2016 compared to 2015. This increase was primarily a result of a $2.9 million increase in product and engineering employee related costs related to additional research and development initiatives, partially offset by a $0.4 million decrease in other expenses, including allocated overhead, and a decrease in costs related to third-party consulting services of $0.3 million.
Selling and Marketing
|
|
|
For the Year Ended December 31, |
|
2017 vs. 2016 |
|
2016 vs. 2015 |
|
|||||||||||||||
|
|
|
2017 |
|
2016 |
|
2015 |
|
$ Change |
|
% Change |
|
$ Change |
|
% Change |
|
|||||||
|
|
|
(Dollars in thousands) |
|
|||||||||||||||||||
|
Selling and marketing |
|
$ |
28,185 |
|
$ |
21,800 |
|
$ |
13,737 |
|
$ |
6,385 |
|
|
29 |
% |
$ |
8,063 |
|
|
59 |
% |
|
As a percentage of revenue |
|
|
25 |
% |
|
27 |
% |
|
23 |
% |
|
|
|
|
|
|
|
|
|
|
|
|
Selling and marketing expense increased $6.4 million, or 29%, in 2017 compared to 2016. This increase was a result of a $2.8 million increase in advertising and promotion expense due to execution of our advertising strategy, a $2.4 million increase in employee related costs due to an increase in headcount, and a $1.3 million increase in other expenses, including allocated overhead. These increases were partially offset by a decrease in costs related to third-party consulting services of $0.1 million.
Selling and marketing expense increased $8.1 million, or 59%, in 2016 compared to 2015. This increase was a result of a $3.9 million increase in employee related costs due to an increase in headcount, a $3.0 million increase in advertising and promotion expense due to implementation of a new advertising strategy, a $0.6 million increase in costs related to third-party consulting services, and a $0.6 million increase in other expenses, including allocated overhead.
61
General and Administrative
|
|
|
For the Year Ended December 31, |
|
2017 vs. 2016 |
|
2016 vs. 2015 |
|
|||||||||||||||
|
|
|
2017 |
|
2016 |
|
2015 |
|
$ Change |
|
% Change |
|
$ Change |
|
% Change |
|
|||||||
|
|
|
(Dollars in thousands) |
|
|||||||||||||||||||
|
General and administrative |
|
$ |
30,101 |
|
$ |
18,920 |
|
$ |
12,477 |
|
$ |
11,181 |
|
|
59 |
% |
$ |
6,443 |
|
|
52 |
% |
|
As a percentage of revenue |
|
|
27 |
% |
|
24 |
% |
|
21 |
% |
|
|
|
|
|
|
|
|
|
|
|
|
General and administrative expense increased $11.2 million, or 59%, in 2017 compared to 2016. This increase was a result of a $5.7 million increase in employee related costs, largely due to an increase in headcount to support the growth of our business, a $1.6 million increase in costs related to our recent IPO, a $0.8 million increase in restructuring expense related to the relocation of our headquarters, a $0.7 million increase in credit card fees, a $0.6 million increase in office expense, a $0.4 million increase in third-party consulting services, a $0.4 million increase in sales tax expense, and a $1.0 million increase in other expenses, including allocated overhead.
General and administrative expense increased $6.4 million, or 52%, in 2016 compared to 2015. This increase was a result of a $2.7 million increase in employee related costs, largely due to an increase in headcount to support the growth of our business, a $0.9 million increase in office expense, a $0.7 million increase in third-party consulting services, a $0.5 million increase in credit card fees, a $0.4 million increase in software expense, a $0.4 million increase in costs related to business operations, and a $0.8 million increase in restructuring expense related to the relocation of our headquarters and other expenses, including allocated overhead.
Quarterly Results of Operations
The following tables set forth unaudited quarterly statements of operations data for each of the eight most recent quarters ended December 31, 2017. The information for each of these quarters has been prepared on the same basis as the audited annual consolidated financial statements included elsewhere in this Annual Report on Form 10-K and, in the opinion of management, includes all adjustments, which consist only of normal recurring adjustments, necessary for the fair presentation of the results of operations for these periods. This data should be read in conjunction with our consolidated financial statements, related notes and other financial information included elsewhere in this Annual Report on Form 10‑K. Our quarterly results of operations will vary in the future. These quarterly results are not necessarily indicative of our operating results to be expected for 2018 or any other future period.
62
|
|
|
|
|
|
|
|
|
|
|
|
|
|
|
|
|
|
|
|
|
|
|
|
|
|
|
|
|
Mar. 31, |
|
Jun. 30, |
|
Sep. 30, |
|
Dec. 31, |
|
Mar. 31, |
|
Jun. 30, |
|
Sep. 30, |
|
Dec. 31, |
||||||||
|
|
|
2016 |
|
2016 |
|
2016 |
|
2016 |
|
2017 |
|
2017 |
|
2017 |
|
2017 |
||||||||
|
|
|
(In thousands) |
||||||||||||||||||||||
|
Consolidated Statements of Operations Data: |
|
|
|
|
|
|
|
|
|
|
|
|
|
|
|
|
|
|
|
|
|
|
|
|
|
Revenue: |
|
|
|
|
|
|
|
|
|
|
|
|
|
|
|
|
|
|
|
|
|
|
|
|
|
Email API |
|
$ |
13,418 |
|
$ |
15,097 |
|
$ |
16,582 |
|
$ |
18,339 |
|
$ |
19,946 |
|
$ |
21,411 |
|
$ |
22,474 |
|
$ |
25,155 |
|
Marketing Campaigns |
|
|
1,165 |
|
|
1,570 |
|
|
1,918 |
|
|
2,408 |
|
|
2,700 |
|
|
3,196 |
|
|
3,906 |
|
|
5,168 |
|
Predecessor email marketing service |
|
|
2,145 |
|
|
1,868 |
|
|
1,626 |
|
|
1,767 |
|
|
1,520 |
|
|
1,447 |
|
|
964 |
|
|
213 |
|
Other |
|
|
397 |
|
|
497 |
|
|
575 |
|
|
557 |
|
|
665 |
|
|
958 |
|
|
972 |
|
|
1,193 |
|
Total revenue |
|
|
17,125 |
|
|
19,032 |
|
|
20,701 |
|
|
23,071 |
|
|
24,831 |
|
|
27,012 |
|
|
28,316 |
|
|
31,729 |
|
Cost of revenue |
|
|
5,237 |
|
|
5,366 |
|
|
5,392 |
|
|
5,610 |
|
|
6,471 |
|
|
7,274 |
|
|
7,612 |
|
|
8,150 |
|
Gross profit |
|
|
11,888 |
|
|
13,666 |
|
|
15,309 |
|
|
17,461 |
|
|
18,360 |
|
|
19,738 |
|
|
20,704 |
|
|
23,579 |
|
Operating expenses: |
|
|
|
|
|
|
|
|
|
|
|
|
|
|
|
|
|
|
|
|
|
|
|
|
|
Research and development |
|
|
5,238 |
|
|
5,105 |
|
|
5,289 |
|
|
5,546 |
|
|
6,524 |
|
|
7,139 |
|
|
7,545 |
|
|
8,435 |
|
Selling and marketing |
|
|
4,507 |
|
|
5,447 |
|
|
5,357 |
|
|
6,489 |
|
|
6,588 |
|
|
6,870 |
|
|
7,124 |
|
|
7,603 |
|
General and administrative |
|
|
3,942 |
|
|
4,557 |
|
|
4,592 |
|
|
5,829 |
|
|
7,044 |
|
|
6,494 |
|
|
7,684 |
|
|
8,879 |
|
Loss (gain) on disposal of assets |
|
|
27 |
|
|
- |
|
|
- |
|
|
- |
|
|
- |
|
|
2 |
|
|
- |
|
|
20 |
|
Total operating expenses |
|
|
13,714 |
|
|
15,109 |
|
|
15,238 |
|
|
17,864 |
|
|
20,156 |
|
|
20,505 |
|
|
22,353 |
|
|
24,937 |
|
Income (loss) from operations |
|
|
(1,826) |
|
|
(1,443) |
|
|
71 |
|
|
(403) |
|
|
(1,796) |
|
|
(767) |
|
|
(1,649) |
|
|
(1,358) |
|
Other income (expense), net |
|
|
(53) |
|
|
(159) |
|
|
(73) |
|
|
(22) |
|
|
(5) |
|
|
(566) |
|
|
56 |
|
|
(168) |
|
Net loss before provision for income taxes |
|
|
(1,879) |
|
|
(1,602) |
|
|
(2) |
|
|
(425) |
|
|
(1,801) |
|
|
(1,333) |
|
|
(1,593) |
|
|
(1,526) |
|
Provision for income taxes |
|
|
- |
|
|
- |
|
|
- |
|
|
- |
|
|
- |
|
|
- |
|
|
- |
|
|
- |
|
Net loss |
|
$ |
(1,879) |
|
$ |
(1,602) |
|
$ |
(2) |
|
$ |
(425) |
|
$ |
(1,801) |
|
$ |
(1,333) |
|
$ |
(1,593) |
|
$ |
(1,526) |
|
|
|
|
|
|
|
|
|
|
|
|
|
|
|
|
|
|
|
|
|
|
|
|
|
|
|
Other Data: |
|
|
|
|
|
|
|
|
|
|
|
|
|
|
|
|
|
|
|
|
|
|
|
|
|
|
|
|
|
|
|
|
|
|
|
|
|
|
|
|
|
|
|
|
|
|
|
|
|
|
|
Adjusted net income (loss) |
|
$ |
(1,448) |
|
$ |
(917) |
|
$ |
533 |
|
$ |
392 |
|
$ |
25 |
|
$ |
551 |
|
$ |
641 |
|
$ |
2,160 |
|
Free cash flow |
|
$ |
(1,079) |
|
$ |
74 |
|
$ |
(155) |
|
$ |
(1,302) |
|
$ |
(1,581) |
|
$ |
692 |
|
$ |
1,122 |
|
$ |
136 |
|
|
|
|
|
|
|
|
|
|
|
|
|
|
|
|
|
|
|
|
|
|
|
|
|
|
|
|
|
Mar. 31, |
|
Jun. 30, |
|
Sep. 30, |
|
Dec. 31, |
|
Mar. 31, |
|
Jun. 30, |
|
Sep. 30, |
|
Dec. 31, |
||||||||
|
|
|
2016 |
|
2016 |
|
2016 |
|
2016 |
|
2017 |
|
2017 |
|
2017 |
|
2017 |
||||||||
|
|
|
(As a percentage of total revenue) |
||||||||||||||||||||||
|
Consolidated Statements of Operations Data: |
|
|
|
|
|
|
|
|
|
|
|
|
|
|
|
|
|
|
|
|
|
|
|
|
|
Revenue: |
|
|
|
|
|
|
|
|
|
|
|
|
|
|
|
|
|
|
|
|
|
|
|
|
|
Email API |
|
|
78% |
|
|
79% |
|
|
80% |
|
|
79% |
|
|
80% |
|
|
79% |
|
|
79% |
|
|
79% |
|
Marketing Campaigns |
|
|
7% |
|
|
8% |
|
|
9% |
|
|
10% |
|
|
11% |
|
|
12% |
|
|
14% |
|
|
16% |
|
Predecessor email marketing service |
|
|
13% |
|
|
10% |
|
|
8% |
|
|
8% |
|
|
6% |
|
|
5% |
|
|
3% |
|
|
1% |
|
Other |
|
|
2% |
|
|
3% |
|
|
3% |
|
|
2% |
|
|
3% |
|
|
4% |
|
|
3% |
|
|
4% |
|
Total revenue |
|
|
100% |
|
|
100% |
|
|
100% |
|
|
100% |
|
|
100% |
|
|
100% |
|
|
100% |
|
|
100% |
|
Cost of revenue |
|
|
31% |
|
|
28% |
|
|
26% |
|
|
24% |
|
|
26% |
|
|
27% |
|
|
27% |
|
|
26% |
|
Gross margin |
|
|
69% |
|
|
72% |
|
|
74% |
|
|
76% |
|
|
74% |
|
|
73% |
|
|
73% |
|
|
74% |
|
Operating expenses: |
|
|
|
|
|
|
|
|
|
|
|
|
|
|
|
|
|
|
|
|
|
|
|
|
|
Research and development |
|
|
31% |
|
|
27% |
|
|
26% |
|
|
24% |
|
|
26% |
|
|
26% |
|
|
27% |
|
|
27% |
|
Selling and marketing |
|
|
26% |
|
|
29% |
|
|
26% |
|
|
28% |
|
|
27% |
|
|
25% |
|
|
25% |
|
|
24% |
|
General and administrative |
|
|
23% |
|
|
24% |
|
|
22% |
|
|
25% |
|
|
28% |
|
|
24% |
|
|
27% |
|
|
28% |
|
Loss (gain) on disposal of assets |
|
|
0% |
|
|
0% |
|
|
0% |
|
|
0% |
|
|
0% |
|
|
0% |
|
|
0% |
|
|
0% |
|
Total operating expenses |
|
|
80% |
|
|
79% |
|
|
74% |
|
|
77% |
|
|
81% |
|
|
76% |
|
|
79% |
|
|
79% |
|
Income (loss) from operations |
|
|
-11% |
|
|
-8% |
|
|
0% |
|
|
-2% |
|
|
-7% |
|
|
-3% |
|
|
-6% |
|
|
-4% |
|
Other income (expense), net |
|
|
0% |
|
|
-1% |
|
|
0% |
|
|
0% |
|
|
0% |
|
|
-2% |
|
|
0% |
|
|
-1% |
|
Net loss before provision for income taxes |
|
|
-11% |
|
|
-8% |
|
|
0% |
|
|
-2% |
|
|
-7% |
|
|
-5% |
|
|
-6% |
|
|
-5% |
|
Provision for income taxes |
|
|
0% |
|
|
0% |
|
|
0% |
|
|
0% |
|
|
0% |
|
|
0% |
|
|
0% |
|
|
0% |
|
Net loss |
|
|
-11% |
|
|
-8% |
|
|
0% |
|
|
-2% |
|
|
-7% |
|
|
-5% |
|
|
-6% |
|
|
-5% |
|
|
|
|
|
|
|
|
|
|
|
|
|
|
|
|
|
|
|
|
|
|
|
|
|
|
|
Other Data: |
|
|
|
|
|
|
|
|
|
|
|
|
|
|
|
|
|
|
|
|
|
|
|
|
|
|
|
|
|
|
|
|
|
|
|
|
|
|
|
|
|
|
|
|
|
|
|
|
|
|
|
Adjusted net income (loss) |
|
|
-8% |
|
|
-5% |
|
|
3% |
|
|
2% |
|
|
0% |
|
|
2% |
|
|
2% |
|
|
7% |
|
Free cash flow |
|
|
-6% |
|
|
0% |
|
|
-1% |
|
|
-6% |
|
|
-6% |
|
|
3% |
|
|
4% |
|
|
0% |
Adjusted net income (loss) is not a measure determined in accordance with GAAP and should not be considered in isolation or as a substitute for operating income (loss), net income (loss), or any other measure determined in accordance with GAAP.
63
The following table shows a reconciliation of net income (loss), the most directly comparable financial measure calculated and presented in accordance with GAAP, to adjusted net income (loss) for the periods indicated:
|
|
|
|
|
|
|
|
|
|
|
|
|
|
|
|
|
|
|
|
|
|
|
|
|
|
|
|
|
Mar. 31, |
|
Jun. 30, |
|
Sep. 30, |
|
Dec. 31, |
|
Mar. 31, |
|
Jun. 30, |
|
Sep. 30, |
|
Dec. 31, |
||||||||
|
|
|
2016 |
|
2016 |
|
2016 |
|
2016 |
|
2017 |
|
2017 |
|
2017 |
|
2017 |
||||||||
|
|
|
(In thousands) |
||||||||||||||||||||||
|
Net loss |
|
$ |
(1,879) |
|
$ |
(1,602) |
|
$ |
(2) |
|
$ |
(425) |
|
$ |
(1,801) |
|
$ |
(1,333) |
|
$ |
(1,593) |
|
$ |
(1,526) |
|
Stock-based compensation expense |
|
|
431 |
|
|
448 |
|
|
494 |
|
|
526 |
|
|
588 |
|
|
793 |
|
|
1,296 |
|
|
2,303 |
|
Restructuring expense |
- |
135 |
17 |
233 |
847 |
167 |
112 |
32 |
||||||||||||||||
|
Merger and acquisition expense |
|
|
- |
|
|
- |
|
|
- |
|
|
- |
|
|
257 |
|
|
214 |
|
|
190 |
|
|
233 |
|
Adjustment to convertible preferred stock |
|
|
- |
|
|
102 |
|
|
24 |
|
|
(40) |
|
|
(26) |
|
|
544 |
|
|
(84) |
|
|
233 |
|
Certain IPO costs |
|
|
- |
|
|
- |
|
|
- |
|
|
98 |
|
|
160 |
|
|
166 |
|
|
720 |
|
|
885 |
|
Adjusted net income (loss) |
|
$ |
(1,448) |
|
$ |
(917) |
|
$ |
533 |
|
$ |
392 |
|
$ |
25 |
|
$ |
551 |
|
$ |
641 |
|
$ |
2,160 |
Free cash flow is not a measure determined in accordance with GAAP and should not be considered in isolation or as a substitute for cash flows from operations, operating income (loss), net income (loss), or any other measure determined in accordance with GAAP.
The following table shows a reconciliation of net cash flows from operating activities, the most directly comparable financial measure calculated and presented in accordance with GAAP, to free cash flow for the periods indicated:
|
|
|
|
|
|
|
|
|
|
|
|
|
|
|
|
|
|
|
|
|
|
|
|
|
|
|
|
|
Mar. 31, |
|
Jun. 30, |
|
Sep. 30, |
|
Dec. 31, |
|
Mar. 31, |
|
Jun. 30, |
|
Sep. 30, |
|
Dec. 31, |
||||||||
|
|
|
2016 |
|
2016 |
|
2016 |
|
2016 |
|
2017 |
|
2017 |
|
2017 |
|
2017 |
||||||||
|
|
|
(In thousands) |
||||||||||||||||||||||
|
Net cash flows from operating activities |
|
$ |
217 |
|
$ |
2,187 |
|
$ |
4,647 |
|
$ |
2,638 |
|
$ |
1,730 |
|
$ |
3,392 |
|
$ |
5,009 |
|
$ |
2,543 |
|
Purchase of property and equipment |
|
|
(212) |
|
|
(789) |
|
|
(3,497) |
|
|
(2,589) |
|
|
(1,794) |
|
|
(1,220) |
|
|
(1,792) |
|
|
(807) |
|
Principal payments on capital lease obligations |
|
|
(1,084) |
|
|
(1,324) |
|
|
(1,305) |
|
|
(1,351) |
|
|
(1,517) |
|
|
(1,480) |
|
|
(2,095) |
|
|
(1,600) |
|
Free cash flow |
|
$ |
(1,079) |
|
$ |
74 |
|
$ |
(155) |
|
$ |
(1,302) |
|
$ |
(1,581) |
|
$ |
692 |
|
$ |
1,122 |
|
$ |
136 |
For more information about adjusted net income (loss) and free cash flow, see “Selected Consolidated Financial Data” in Item 6 of this Annual Report on Form 10-K.
Quarterly Trends
Our quarterly total revenue increased sequentially quarter over quarter for each period presented above reflecting expansion within our existing customer base and an increase in customers. In future periods, our growth rate may decline, and our Marketing Campaigns service may become a greater component of our total revenue, making seasonality more pronounced in our total revenue. For more information regarding the effect of seasonality on our total revenue, see the section titled “—Key Factors Affecting Our Performance—Seasonality.”
Our quarterly cost of revenue has increased sequentially quarter over quarter for each period presented above primarily as a result of the increased cost of providing support and delivering our services to our expanding customer base. On a percentage of revenue basis, our quarterly cost of revenue has generally decreased quarter over quarter for each period presented above.
Our quarterly gross margins improved sequentially quarter over quarter for each period presented in 2016 above due to total revenue increasing at a higher rate than the associated costs. Our quarterly gross margins generally decreased in 2017 compared to the fourth quarter of 2016 as a result of increased data center and hosting costs, and employee related costs, both to support growth.
Our quarterly operating expenses have increased sequentially quarter over quarter for each period presented above primarily as a result of our continued addition of headcount to support growth and expansion of the business. We have increased headcount in our research and development, selling and marketing, and general and administrative functions.
64
Liquidity and Capital Resources
As of December 31, 2017, we had $175.5 million of cash and cash equivalents. We believe that existing cash and cash equivalents and positive cash flows from operations will be sufficient to support working capital and capital expenditure requirements for at least the next 12 months. Since inception, we have financed our operations primarily through the sale of equity securities, debt financings, and the sale of software subscriptions and support.
We have a loan and security agreement, or LSA, with a bank that provides a revolving line of credit with $40.0 million maximum borrowing availability. The LSA matures in May 2018.
We had $40.0 million available to draw and were in compliance with all financial covenants under the LSA as of December 31, 2017. No amounts were outstanding as of December 31, 2017 or 2016, and we had no borrowing activity during the years ended December 31, 2017, 2016, or 2015.
For further information on our LSA, refer to Note 9 in consolidated financial statements contained elsewhere in this Annual Report on Form 10-K.
Historical Cash Flows
The following table shows a summary of our cash flows for the periods indicated:
|
|
|
For the Year Ended December 31, |
|||||||
|
|
|
2017 |
|
2016 |
|
2015 |
|||
|
|
|
(In thousands) |
|||||||
|
Net cash flows from operating activities |
|
$ |
12,674 |
|
$ |
9,689 |
|
$ |
1,230 |
|
Net cash flows from investing activities |
|
|
(7,725) |
|
|
(6,538) |
|
|
(1,032) |
|
Net cash flows from financing activities |
|
|
130,143 |
|
|
27,984 |
|
|
(3,191) |
|
Effect from foreign currency exchange rates |
|
|
4 |
|
|
(4) |
|
|
(2) |
|
Net increase (decrease) in cash |
|
|
135,096 |
|
|
31,131 |
|
|
(2,995) |
|
Cash at beginning of period |
|
|
40,400 |
|
|
9,269 |
|
|
12,264 |
|
Cash at end of period |
|
$ |
175,496 |
|
$ |
40,400 |
|
$ |
9,269 |
Operating Activities
Net cash provided by operating activities was $12.7 million in 2017, primarily due to our net loss of $6.3 million adjusted for non-cash items, including $9.4 million of depreciation and amortization expense primarily as a result of additional acquisitions of computer and data center equipment used to support growth of the business, $5.0 million of stock-based compensation expense driven primarily by an increase in employees to support growth of the business, $0.7 million of landlord reimbursements for leasehold improvements associated with our new headquarters, $0.7 million of warrant fair value adjustment as a result of an increase in the fair value, $0.4 million in restructuring expense, and $2.8 million of cumulative changes in operating assets and liabilities. With respect to changes in operating assets and liabilities, accounts payable and accrued liabilities increased $3.7 million and other liabilities increased $2.6 million due to timing of cash payments and growth in the business partially offset by increases in accounts receivable of $1.9 million and prepaid expenses and other assets of $1.6 million related to timing of cash receipts and growth in the business.
Net cash provided by operating activities was $9.7 million in 2016, primarily due to our net loss of $3.9 million adjusted for non-cash items, including $6.9 million of depreciation and amortization expense primarily as a result of additional acquisitions of computer and data center equipment used to support growth of the business, $3.6 million of landlord reimbursements for leasehold improvements associated with our new headquarters, $1.9 million of stock-based compensation expense driven primarily by an increase in employees to support growth of the business, $0.9 million of cumulative changes in operating assets and liabilities and $0.2 million in restructuring expense. With respect to changes in operating assets and liabilities, accounts payable and accrued liabilities increased $2.8 million and other liabilities increased $0.2 million due to timing of cash payments and growth in the business partially offset by increases in accounts receivable of $1.3 million and prepaid expenses and other assets of $0.9 million related to timing of cash receipts and growth in the business.
65
Net cash provided by operating activities was $1.2 million in 2015, primarily due to our net loss of $5.9 million adjusted for non-cash items, including $5.5 million of depreciation and amortization expenses primarily as a result of additional acquisitions of computer and data center equipment used to support growth of the business, $1.4 million of stock-based compensation expense driven primarily by an increase in employees to support growth of the business, and $0.2 million of cumulative changes in operating assets and liabilities. With respect to changes in operating assets and liabilities, accounts payable and accrued liabilities increased $1.1 million and other liabilities increased $0.2 million due to timing of payments and growth in the business partially offset by increases in accounts receivable of $1.0 million related to timing of cash receipts.
Investing Activities
Net cash used in investing activities was $7.7 million in 2017, primarily due to $5.6 million related to purchases of property and equipment used to support the growth of the business and $2.2 million related to a business acquisition, partially offset by a $0.1 million decrease in restricted cash due to a lease termination.
Net cash used in investing activities was $6.5 million in 2016, primarily due to $7.1 million related to purchases of property and equipment used to support the growth of the business, partially offset by a $0.3 million decrease in restricted cash related to an office lease and $0.2 million in proceeds from the sale of assets.
Net cash used in investing activities was $1.0 million in 2015, primarily due to $1.3 million related to purchases of property and equipment used to support the growth of the business, partially offset by a $0.2 million decrease in restricted cash related to an office lease.
Financing Activities
Net cash provided by financing activities was $130.1 million in 2017, primarily due to $140.3 million in net proceeds from the issuance of common stock in our IPO and $0.5 million in proceeds from stock option exercises, partially offset by $6.7 million in principal payments on capital lease obligations and $4.0 million in payments for offering costs.
Net cash provided by financing activities was $28.0 million in 2016, primarily due to $32.9 million in proceeds from the issuance of preferred stock partially offset by $5.1 million in principal payments on capital lease obligations.
Net cash used in financing activities was $3.2 million in 2015, primarily due to $3.9 million in principal payments on capital lease obligations partially offset by $0.8 million in proceeds from the issuance of common stock.
66
Contractual Obligations, Commitments, and Future Capital Requirements
The following table summarizes commitments on contracts at December 31, 2017 that meet the following criteria:
|
· |
enforceable; |
|
· |
legally binding; and |
|
· |
specify all significant terms, including fixed or minimum services to be used, fixed, minimum, or variable price provisions, and the approximate timing of the actions under the contracts. |
The table excludes obligations under agreements that we can cancel without a significant penalty.
|
|
|
Payments due by Period |
|||||||||||||||||||
|
|
|
2018 |
|
2019 |
|
2020 |
|
2021 |
|
2022 |
|
Thereafter |
|
Total |
|||||||
|
|
|
(In thousands) |
|||||||||||||||||||
|
Operating lease obligations |
|
$ |
3,921 |
|
$ |
4,882 |
|
$ |
4,939 |
|
$ |
5,068 |
|
$ |
5,201 |
|
$ |
16,467 |
|
$ |
40,478 |
|
Capital lease obligations |
|
|
6,110 |
|
|
5,194 |
|
|
4,390 |
|
|
1,511 |
|
|
- |
|
|
- |
|
|
17,205 |
|
Purchase obligations and interest on capital lease obligations |
|
|
6,576 |
|
|
5,751 |
|
|
5,723 |
|
|
9,017 |
|
|
4,625 |
|
|
- |
|
|
31,692 |
|
Total |
|
$ |
16,607 |
|
$ |
15,827 |
|
$ |
15,052 |
|
$ |
15,596 |
|
$ |
9,826 |
|
$ |
16,467 |
|
$ |
89,375 |
For additional information on our contractual obligations and commitments, refer to Note 16 in our consolidated financial statements contained elsewhere in this Annual Report on Form 10-K.
Backlog
As substantially all of our revenue is derived from monthly subscription agreements, we do not have material amounts of future revenue contracted in backlog.
Off Balance Sheet Arrangements
We did not have during the periods presented, and we do not currently have, any off balance sheet financing arrangements or any relationships with unconsolidated entities or financial partnerships, including entities sometimes referred to as structured finance or special purpose entities, that were established for the purpose of facilitating off balance sheet arrangements or other contractually narrow or limited purposes.
Critical Accounting Policies
The preparation of consolidated financial statements, in conformity with GAAP, requires estimates and assumptions that affect the reported amounts of assets and liabilities and disclosure of contingent assets and liabilities at the date of the consolidated financial statements, the reported amounts of revenue and expenses during the reporting period, and certain information disclosed in the notes to the consolidated financial statements. Actual results could materially differ from these estimates. While our significant accounting policies are more fully described in Note 2 in the notes to our consolidated financial statements included elsewhere in this Annual Report on Form 10-K, the following accounting policies involve a greater degree of judgment and complexity. Accordingly, these are the accounting policies we believe are the most critical to aid in fully understanding and evaluating our financial condition and results of operations.
|
· |
revenue recognition; |
|
· |
determination of the fair value of assets acquired and liabilities assumed in business combinations; |
|
· |
stock-based compensation. |
67
Revenue Recognition
We derive revenue primarily from fees charged to customers accessing our Email API and Marketing Campaigns services. Prior to delivering services, we require customers to select a service level package and enter into a monthly service agreement. The arrangement generally includes a fixed subscription fee that covers a predetermined email volume limit for the month. Any usage above the email volume limit is invoiced as overage charges based on a stated price per email. Fees associated with our Marketing Campaigns service are based on a tiered pricing model dependent on the number of contacts stored on the platform. All customers are entitled to unlimited basic support.
Fixed subscription fees are invoiced at the beginning of each monthly service cycle based on the agreed upon fee. At the end of each monthly service cycle, we invoice customers for usage based on the contracted rate as well as fees associated with contact storage. Revenue from usage incurred and contact storage, if applicable, that has not been invoiced as of the end of a reporting period are recorded as unbilled accounts receivable. Fees are recognized as revenue in the month services are provided.
We provide a service; therefore, service revenue is recognized ratably over the applicable service period, generally one month, when all of the following conditions have been met.
|
Condition |
Considerations and Evidence |
|
Persuasive evidence of an arrangement exists |
A signed service agreement |
|
The services have been delivered to the customer |
The customer has access to our platform. Our services are available for use at this point. |
|
The price is fixed or determinable |
We consider the price fixed or determinable when the customer selects a package and payment terms are established. This occurs at the onset of the agreement. Our fees are typically based on predetermined email volume. Any usage above such predetermined volume is invoiced as overage charges based on set fees stated in the agreement. Usage fees related to our Marketing Campaigns service are invoiced according to the tiered fee structure per the agreement. |
|
Collection of the fees is reasonably assured |
We assess collectability based on a number of factors, including collection history and credit worthiness. Our customers generally pay the base fee in advance by credit card. The cardholder may subsequently contest charges, and we occasionally receive chargebacks. We estimate chargebacks and sales credits using historical experience adjusted to take into account current market conditions. We record revenue net of estimated chargebacks and sales credits. |
We have arrangements with strategic partners that generally act as resellers. In most reseller arrangements, we provision the service, provide technical support, establish pricing, and assume credit risk. We consider ourselves the principal in these arrangements and record revenue on a gross basis. On the consolidated statements of operations, expenses directly related to providing the service are recorded as cost of revenue, and commissions paid to strategic partners are recorded as selling and marketing expense.
In other reseller arrangements, the reseller provides support, training, and other services requested or required by end users at the reseller’s sole cost and expense. We provide support services only to the reseller and have no obligation to provide
68
technical support or respond to requests directly from end users. In addition, the reseller establishes the price for the service and assumes credit risk. We consider ourselves the agent in these arrangements and record the net amount received from the reseller.
Valuation of Goodwill and Intangible Assets
When we acquire a business, we allocate the purchase price to the tangible assets and liabilities and identifiable intangible assets acquired. We record any residual purchase price as goodwill. The allocation of the purchase price requires significant estimates in determining the fair values of assets acquired and liabilities assumed, especially with respect to intangible assets. These estimates are based on information obtained from management of the acquired companies, market information and historical experience. These estimates can include, but are not limited to:
|
· |
the time and expenses that would be necessary to recreate the asset; |
|
· |
the profit margin a market participant would receive; |
|
· |
cash flows that an asset is expected to generate in the future; and |
|
· |
discount rates. |
These estimates are inherently uncertain and unpredictable, and if different estimates were used, the purchase price for the acquisition could be allocated to the acquired assets and liabilities differently from the allocation that we have made. In addition, unanticipated events and circumstances may occur that may affect the accuracy or validity of such estimates, and if such events occur, we may be required to record a charge against the value ascribed to an acquired asset or an increase in the amounts recorded for assumed liabilities.
Stock-Based Compensation
We recognize stock-based compensation expense in accordance with the provisions of Accounting Standards Codification 718, Compensation—Stock Compensation, or ASC 718. ASC 718 requires the measurement and recognition of compensation expense for all stock-based payment awards made to employees and directors based on the grant date fair values of the awards. We use the Black Scholes option pricing method for valuing stock options. The fair value of an award, net of estimated forfeitures, is recognized as an expense over the requisite service period on a straight-line basis. We include stock-based compensation expense in cost of revenue and operating expenses within our consolidated statements of operations based on the classification of the individual earning the award.
69
The determination of the grant date fair value of stock-based awards is affected by the estimated fair value per share of our common stock as well as other highly subjective assumptions, including, the following:
|
Estimate or Assumption |
Criteria |
|
The fair value of our common stock |
Subsequent to our IPO in November 2017, we obtain the fair value of our Common Stock from the public market. Prior to our IPO, there was no public trading market for our Common or Preferred Stock. As a result, our Board considered an independent third-party valuation of our Common Stock and whether any new material information after the date of such valuation had materially affected the fair value of our Common Stock. |
|
Risk-free interest rates |
The risk-free interest rate is based on the U.S. Treasury yield for treasury securities with maturities that align closely with the timing of the average remaining expected life of the option. |
|
Volatility |
We estimate a volatility factor utilizing an average of the stock volatility of peer companies. |
|
Expected dividend yield |
Because we have never declared or paid a dividend and do not expect to do so in the foreseeable future, we assume a dividend yield of zero. |
|
Expected option life |
Given our limited history, we applied the simplified method (the average of the period from vesting to expiration) to determine the expected option life. |
The use of different estimates and assumptions could cause significant adjustments to the valuation.
In addition, we are required to estimate at the time of grant the expected forfeiture rate and only recognize expense for those stock-based awards expected to vest. We base our expected forfeiture rate on our estimate of pre-vesting award forfeitures.
Valuation of Our Common Stock Prior to Our Initial Public Offering
Prior to our IPO, given the absence of an active market for our common stock, our board of directors was required to determine the fair value of our common stock at the time of each stock-based award based upon several factors, including consideration of input from management and contemporaneous third-party valuations.
The exercise price for all stock options granted was at or above the estimated fair value of the underlying common stock, as estimated on the date of grant by our board of directors in accordance with the guidelines outlined in the practice aid issued by the American Institute of Certified Public Accountants, titled Valuation of Privately Held Company Equity Securities Issued as Compensation. Each fair value estimate was based on a variety of factors, which included the following:
|
· |
contemporaneous valuations performed by an unrelated third-party valuation firm; |
|
· |
the prices, rights, preferences, and privileges of our then outstanding preferred stock relative to our common stock; |
|
· |
pricing and timing of transactions in our equity; |
70
|
· |
the lack of marketability of our common stock; |
|
· |
our actual operating and financial performance; |
|
· |
current business conditions and projections; |
|
· |
the market performance of comparable publicly traded companies; |
|
· |
the likelihood of achieving a liquidity event, such as an initial public offering, merger or acquisition of our business given prevailing market conditions; and |
|
· |
U.S. and global capital market conditions. |
We determined the fair value of our common stock for financial reporting purposes, taking into account the factors described above, using a combination of valuation methodologies with varying weighting applied to each methodology. One valuation methodology used was the Probability Weighted Expected Return Method under which the value of our common stock was estimated based upon an analysis of values for the company assuming an initial public offering as a possible future event. We applied a discount for lack of marketability to account for a lack of access to an active public market.
JOBS Act Accounting Election
In April 2012, the JOBS Act was enacted. Section 107 of the JOBS Act provides that an “emerging growth company” may take advantage of the extended transition period provided in Section 7(a)(2)(B) of the Securities Act for complying with new or revised accounting standards. Therefore, an emerging growth company can delay the adoption of certain accounting standards until those standards would otherwise apply to private companies. We have elected to use this extended transition period for complying with new or revised accounting standards that have different effective dates for public and private companies until the earlier of the date we (i) are no longer an emerging growth company or (ii) affirmatively and irrevocably opt out of the extended transition period provided in the JOBS Act. As a result, our financial statements may not be comparable to companies that comply with new or revised accounting pronouncements as of public company effective dates.
Recent Accounting Pronouncements
Recently Adopted Accounting Standards
In September 2015, the FASB issued ASU 2015-16, Business Combinations (Topic 805): Simplifying the Accounting for Measurement-Period Adjustments, which eliminates the requirement for an acquirer to retrospectively adjust the financial statements for measurement-period adjustments that occur in periods after a business combination is consummated. ASU 2015-16 was effective for us on January 1, 2017. The adoption of this standard did not have a significant impact on our consolidated financial statements and related disclosures.
In January 2017, the FASB issued ASU 2017-04, Intangibles—Goodwill and Other (Topic 350): Simplifying the Test for Goodwill Impairment. This standard simplifies the accounting for goodwill impairment by removing step two of the goodwill impairment test, which requires a hypothetical purchase price allocation. A goodwill impairment will be the amount by which a reporting unit’s carrying amount, including goodwill, exceeds its fair value. The impairment charge will be limited to the amount of goodwill allocated to that reporting unit. The standard requires prospective application. We adopted ASU 2017-04 on October 1, 2017, and it did not have a significant impact on our consolidated financial statements and related disclosures.
In May 2017, the FASB issued ASU 2017-09, Compensation—Stock Compensation (Topic 718): Scope of Modification Accounting, which provides guidance regarding stock-based payment award changes that require modification accounting. The standard requires prospective application for awards modified on or after the effective date. We adopted ASU 2017-09 on October 1, 2017, and it did not have a significant impact on our consolidated financial statements and related disclosures.
71
New Accounting Pronouncements Not Yet Adopted
In January 2017, the FASB issued ASU 2017-01, Business Combinations (Topic 805): Clarifying the Definition of a Business, which clarifies when transactions should be accounted for as acquisitions (or disposals) of assets or business. ASU 2017-01 is effective for us beginning January 1, 2019. Early adoption is permitted for transactions not previously reported in issued financial statements. The effect that the ASU will have on our consolidated financial statements will be dependent upon the nature and amount of asset acquisitions (or disposals) and business combinations we execute in future periods, if any.
In November 2016, the FASB issued ASU 2016-18, Statements of Cash Flow (Topic 230): Restricted Cash, which requires that a statement of cash flows explain the change during the period in the total cash, cash equivalents, and amounts generally described as restricted cash or restricted cash equivalents. Therefore, amounts generally described as restricted cash and restricted cash equivalents should be included with cash and cash equivalents when reconciling the beginning-of-period and end-of-period total amount shown on the statement of cash flows. ASU 2016-18 is effective for us beginning January 1, 2019. The effect that the ASU will have on our consolidated financial statements will be dependent upon the amount of restricted cash in future periods.
In August 2016, the FASB issued ASU 2016-15, Statements of Cash Flows (Topic 230): Classification of Certain Cash Receipts and Cash Payments, which clarifies classification for certain cash receipts and cash payments on the consolidated statement of cash flows. ASU 2016-15 is effective for us beginning January 1, 2019. The standard requires a retrospective transition method for each period presented. We do not expect the adoption of this standard will have a significant impact on our consolidated financial statements and related disclosures.
In March 2016, the FASB issued ASU 2016-09, Compensation—Stock Compensation (Topic 718): Improvements for Employee Share-Based Payment Accounting, which simplifies certain aspects of accounting for share-based payment transactions, including income tax consequences, statutory tax withholdings requirements, forfeitures, and classification in the statement of cash flows. ASU 2016-09 is effective for us beginning January 1, 2018. The standard requires the guidance related to forfeitures to be applied using a modified retrospective transition method and the guidance related to the accounting for income taxes to be applied prospectively. We do not expect the adoption of this standard will have a significant impact on our consolidated financial statements and related disclosures.
In February 2016, the FASB issued ASU 2016-02, Leases (Topic 842), which requires lessees to recognize the assets and liabilities that arise from all leases on the consolidated balance sheet. ASU 2016-02 is effective for us beginning January 1, 2020 (or January 1, 2019 should we cease to be classified as an EGC). Early adoption is permitted. The standard requires a modified retrospective approach for leases that exist or are entered into after the beginning of the earliest comparative period in the financial statements. We have not yet determined the effect of the standard on our consolidated financial statements and related disclosures.
In May 2014, the FASB issued ASU 2014-09, Revenue from Contracts with Customers (Topic 606), and modified the standard thereafter. The standard requires an entity to recognize the amount of revenue to which it expects to be entitled for the transfer of promised goods or services to customers. This new accounting standard also impacts the recognition of sales commissions. The ASU will replace most existing revenue recognition guidance in U.S. GAAP when it becomes effective. ASU 2014-09 is effective for us beginning January 1, 2019. Early adoption is permitted. The standard permits the use of either the retrospective or cumulative effect transition method. We continue to evaluate the impact of the new standard and available adoption methods on our consolidated financial statements. We are in the process of evaluating arrangements with customers and identifying differences in accounting between new and existing standards.
Item 7A.Quantitative and Qualitative Disclosure About Market Risk
Market Risks Associated with Financial Instruments
Cash and Cash Equivalents
As of December 31, 2017, our cash and cash equivalents had a fair value of $175.5 million and was comprised of $25.6 million in demand deposit accounts and $149.9 million in money market mutual funds.
72
Marketable Investment Securities and Derivative Financial Instruments
We did not hold marketable investment securities or derivative financial instruments at any time during the year ended December 31, 2017.
Interest Rate Risk
A hypothetical 10% change in average interest rates would not have a significant impact on the fair value of our cash and cash equivalents due to the nature and limited maturity of our holdings.
Our cash equivalents represent money market funds with an average annual rate of return of approximately 1%. Assuming the balance in these money market funds remains constant, a hypothetical 10% decrease in average interest rates would not have a significant impact on our interest income.
Foreign Currency Related Risks
Although we only accept payment for our services in U.S. dollars, a substantial portion of our business is conducted with non-U.S. based customers. We are exposed to market risks in the ordinary course of our business. Our market risk exposure is primarily the result of fluctuations in the U.S. dollar with respect to other currencies.
Based on the size of our foreign operations we do not have material foreign currency exchange risk.
I
73
Item 8.Financial Statements and Supplementary Data
INDEX TO CONSOLIDATED FINANCIAL STATEMENTS
|
|
Page |
|
|
|
| 75 | |
|
Consolidated Statements of Operations and Comprehensive Loss |
76 |
| 77 | |
| 78 | |
| 79 | |
| 80 |
74
Report of Independent Registered Public Accounting Firm
To the Stockholders and Board of Directors
SendGrid, Inc.:
Opinion on the Consolidated Financial Statements
We have audited the accompanying consolidated balance sheets of SendGrid, Inc. and subsidiaries (the “Company”) as of December 31, 2017 and 2016, the related consolidated statements of operations and comprehensive loss, stockholders’ equity (deficit), and cash flows for each of the years in the three year period ended December 31, 2017, and the related notes (collectively, the consolidated financial statements). In our opinion, the consolidated financial statements present fairly, in all material respects, the financial position of the Company as of December 31, 2017 and 2016, and the results of its operations and its cash flows for each of the years in the three year period ended December 31, 2017, in conformity with U.S. generally accepted accounting principles.
Basis for Opinion
These consolidated financial statements are the responsibility of the Company’s management. Our responsibility is to express an opinion on these consolidated financial statements based on our audits. We are a public accounting firm registered with the Public Company Accounting Oversight Board (United States) (“PCAOB”) and are required to be independent with respect to the Company in accordance with the U.S. federal securities laws and the applicable rules and regulations of the Securities and Exchange Commission and the PCAOB.
We conducted our audits in accordance with the standards of the PCAOB. Those standards require that we plan and perform the audit to obtain reasonable assurance about whether the consolidated financial statements are free of material misstatement, whether due to error or fraud. The Company is not required to have, nor were we engaged to perform, an audit of its internal control over financial reporting. As part of our audits, we are required to obtain an understanding of internal control over financial reporting but not for the purpose of expressing an opinion on the effectiveness of the Company’s internal control over financial reporting. Accordingly, we express no such opinion.
Our audits included performing procedures to assess the risks of material misstatement of the consolidated financial statements, whether due to error or fraud, and performing procedures that respond to those risks. Such procedures included examining, on a test basis, evidence regarding the amounts and disclosures in the consolidated financial statements. Our audits also included evaluating the accounting principles used and significant estimates made by management, as well as evaluating the overall presentation of the consolidated financial statements. We believe that our audits provide a reasonable basis for our opinion.
We have served as the Company’s auditor since 2011.
/s/ KPMG LLP
Denver, Colorado
February 26, 2018
75
SENDGRID, INC.
CONSOLIDATED STATEMENTS OF OPERATIONS AND COMPREHENSIVE LOSS
(In thousands, except per share amounts)
|
|
|
For the Year Ended December 31, |
|||||||
|
|
|
2017 |
|
2016 |
|
2015 |
|||
|
Revenue |
|
$ |
111,888 |
|
$ |
79,929 |
|
$ |
58,476 |
|
Cost of revenue |
|
|
29,507 |
|
|
21,605 |
|
|
18,961 |
|
Gross profit |
|
|
82,381 |
|
|
58,324 |
|
|
39,515 |
|
|
|
|
|
|
|
|
|
|
|
|
Operating expenses: |
|
|
|
|
|
|
|
|
|
|
Research and development |
|
|
29,643 |
|
|
21,178 |
|
|
18,959 |
|
Selling and marketing |
|
|
28,185 |
|
|
21,800 |
|
|
13,737 |
|
General and administrative |
|
|
30,101 |
|
|
18,920 |
|
|
12,477 |
|
Loss on disposal of assets |
|
|
22 |
|
|
27 |
|
|
1 |
|
Total operating expenses |
|
|
87,951 |
|
|
61,925 |
|
|
45,174 |
|
Loss from operations |
|
|
(5,570) |
|
|
(3,601) |
|
|
(5,659) |
|
|
|
|
|
|
|
|
|
|
|
|
Other income (expense): |
|
|
|
|
|
|
|
|
|
|
Interest expense |
|
|
(182) |
|
|
(195) |
|
|
(165) |
|
Adjustment to redeemable preferred stock warrant liability |
|
|
(667) |
|
|
(86) |
|
|
(19) |
|
Other |
|
|
166 |
|
|
(26) |
|
|
(11) |
|
Other income (expense) |
|
|
(683) |
|
|
(307) |
|
|
(195) |
|
Net loss before provision for income taxes |
|
|
(6,253) |
|
|
(3,908) |
|
|
(5,854) |
|
Provision for income taxes |
|
|
- |
|
|
- |
|
|
- |
|
Net loss |
|
$ |
(6,253) |
|
$ |
(3,908) |
|
$ |
(5,854) |
|
|
|
|
|
|
|
|
|
|
|
|
Weighted average common shares outstanding |
|
|
8,499 |
|
|
7,521 |
|
|
7,091 |
|
Net loss per share attributable to common stockholders |
|
$ |
(0.74) |
|
$ |
(0.52) |
|
$ |
(0.83) |
|
|
|
|
|
|
|
|
|
|
|
|
Comprehensive loss: |
|
|
|
|
|
|
|
|
|
|
Net loss |
|
$ |
(6,253) |
|
$ |
(3,908) |
|
$ |
(5,854) |
|
Change in cumulative foreign currency translation adjustment |
|
|
4 |
|
|
(4) |
|
|
(2) |
|
Comprehensive loss |
|
$ |
(6,249) |
|
$ |
(3,912) |
|
$ |
(5,856) |
See accompanying notes to consolidated financial statements.
76
SENDGRID, INC.
(In thousands, except share amounts)
|
|
|
As of December 31, |
||||
|
|
|
2017 |
|
2016 |
||
|
Assets |
|
|
|
|
|
|
|
Current Assets: |
|
|
|
|
|
|
|
Cash and cash equivalents |
|
$ |
175,496 |
|
$ |
40,400 |
|
Restricted cash equivalents |
|
|
- |
|
|
78 |
|
Accounts receivable - trade, net of allowance |
|
|
5,765 |
|
|
3,873 |
|
Prepaid expenses and other current assets |
|
|
9,087 |
|
|
2,849 |
|
Total current assets |
|
|
190,348 |
|
|
47,200 |
|
|
|
|
|
|
|
|
|
Noncurrent Assets: |
|
|
|
|
|
|
|
Property and equipment, net |
|
|
29,192 |
|
|
19,190 |
|
Intangible assets, net |
|
|
1,795 |
|
|
11 |
|
Other assets |
|
|
300 |
|
|
234 |
|
Goodwill |
|
|
1,648 |
|
|
- |
|
Total noncurrent assets |
|
|
32,935 |
|
|
19,435 |
|
Total assets |
|
$ |
223,283 |
|
$ |
66,635 |
|
|
|
|
|
|
|
|
|
Liabilities, Redeemable Convertible Preferred Stock, and Stockholders’ Equity (Deficit) |
|
|
|
|
|
|
|
Current liabilities: |
|
|
|
|
|
|
|
Accounts payable and accrued liabilities |
|
|
13,837 |
|
|
7,771 |
|
Current portion of capital lease obligations |
|
|
6,110 |
|
|
5,022 |
|
Current portion of deferred rent |
|
|
328 |
|
|
153 |
|
Other current liabilities |
|
|
1,575 |
|
|
479 |
|
Total current liabilities |
|
|
21,850 |
|
|
13,425 |
|
|
|
|
|
|
|
|
|
Long-Term Obligations, Net of Current Portion: |
|
|
|
|
|
|
|
Capital lease obligations, net of current portion |
|
|
11,095 |
|
|
5,628 |
|
Deferred rent, net of current portion |
|
|
10,054 |
|
|
3,983 |
|
Other long-term liabilities |
|
|
510 |
|
|
490 |
|
Redeemable preferred stock warrant liability |
|
|
- |
|
|
201 |
|
Total long-term obligations, net of current portion: |
|
|
21,659 |
|
|
10,302 |
|
Total liabilities |
|
|
43,509 |
|
|
23,727 |
|
|
|
|
|
|
|
|
|
Commitment and contingencies (notes 8 - 20) |
|
|
|
|
|
|
|
|
|
|
|
|
|
|
|
Redeemable Convertible Preferred Stock |
|
|
|
|
|
|
|
Series A, A-1, B, C, and D, $0.001 par value |
|
|
|
|
|
|
|
None authorized, issued, or outstanding as of December 31, 2017 |
|
|
|
|
|
|
|
24,697,410 authorized, 24,535,227 issued and outstanding as of December 31, 2016 |
|
|
- |
|
|
80,688 |
|
Total redeemable convertible preferred stock |
|
|
- |
|
|
80,688 |
|
|
|
|
|
|
|
|
|
Stockholders’ equity (deficit): |
|
|
|
|
|
|
|
Common stock, $0.001 par value, |
|
|
|
|
|
|
|
250,000,000 and 50,000,000 shares authorized as of Dec. 31, 2017 and 2016, respectively |
|
|
|
|
|
|
|
42,175,647 and 7,611,930 shares issued and outstanding as of Dec. 31, 2017 and 2016, respectively |
|
|
39 |
|
|
5 |
|
Preferred stock, $0.001 par value, |
|
|
|
|
|
|
|
10,000,000 and no shares authorized as of Dec. 31, 2017 and 2016, respectively |
|
|
|
|
|
|
|
None issued or outstanding as of Dec. 31, 2017 or 2016 |
|
|
- |
|
|
- |
|
Additional paid-in capital |
|
|
229,594 |
|
|
5,825 |
|
Accumulated deficit |
|
|
(49,857) |
|
|
(43,604) |
|
Accumulated other comprehensive loss |
|
|
(2) |
|
|
(6) |
|
Total stockholders’ equity (deficit) |
|
|
179,774 |
|
|
(37,780) |
|
Total liabilities, redeemable convertible preferred stock, and stockholders’ equity (deficit) |
|
$ |
223,283 |
|
$ |
66,635 |
See accompanying notes to consolidated financial statements
77
SENDGRID, INC.
CONSOLIDATED STATEMENTS OF CASH FLOWS
(In thousands)
|
|
|
For the Year Ended December 31, |
|||||||
|
|
|
2017 |
|
2016 |
|
2015 |
|||
|
Cash flows from operating activities: |
|
|
|
|
|
|
|
|
|
|
Net loss |
|
$ |
(6,253) |
|
$ |
(3,908) |
|
$ |
(5,854) |
|
Adjustments to reconcile net loss to net cash used in operating activities: |
|
|
|
|
|
|
|
|
|
|
Depreciation and amortization |
|
|
9,418 |
|
|
6,913 |
|
|
5,521 |
|
Stock-based compensation |
|
|
4,980 |
|
|
1,899 |
|
|
1,375 |
|
Adjustment to redeemable preferred stock warrant liability |
|
|
667 |
|
|
86 |
|
|
19 |
|
Non-cash interest expense and other |
|
|
40 |
|
|
14 |
|
|
(7) |
|
Restructuring and loss on disposal of assets |
|
|
372 |
|
|
248 |
|
|
1 |
|
Reimbursement of tenant improvements |
|
|
718 |
|
|
3,578 |
|
|
- |
|
Changes in operating assets and liabilities: |
|
|
|
|
|
|
|
|
|
|
Accounts receivable |
|
|
(1,919) |
|
|
(1,252) |
|
|
(963) |
|
Prepaid expenses and other assets |
|
|
(1,621) |
|
|
(925) |
|
|
(88) |
|
Accounts payable and accrued liabilities |
|
|
3,704 |
|
|
2,795 |
|
|
1,063 |
|
Other liabilities |
|
|
2,568 |
|
|
241 |
|
|
163 |
|
Net cash flows from operating activities |
|
|
12,674 |
|
|
9,689 |
|
|
1,230 |
|
|
|
|
|
|
|
|
|
|
|
|
Cash flows from investing activities: |
|
|
|
|
|
|
|
|
|
|
Purchase of property and equipment |
|
|
(5,613) |
|
|
(7,087) |
|
|
(1,256) |
|
Cash paid for business combination |
|
|
(2,726) |
|
|
- |
|
|
- |
|
Cash acquired in business combination |
|
|
527 |
|
|
- |
|
|
- |
|
Proceeds from sale of assets |
|
|
9 |
|
|
216 |
|
|
7 |
|
Decrease (increase) in restricted cash |
|
|
78 |
|
|
333 |
|
|
217 |
|
Net cash flows from investing activities |
|
|
(7,725) |
|
|
(6,538) |
|
|
(1,032) |
|
|
|
|
|
|
|
|
|
|
|
|
Cash flows from financing activities: |
|
|
|
|
|
|
|
|
|
|
Proceeds from initial public offering, net of $10.6 million underwriters' discount |
|
|
140,318 |
|
|
- |
|
|
- |
|
Payments of costs related to initial public offering |
|
|
(4,029) |
|
|
- |
|
|
- |
|
Proceeds from stock option exercises |
|
|
546 |
|
|
180 |
|
|
784 |
|
Proceeds from issuance of preferred stock |
|
|
- |
|
|
32,934 |
|
|
- |
|
Payments for preferred stock issuance costs |
|
|
- |
|
|
(66) |
|
|
(36) |
|
Principal payments on capital lease obligations |
|
|
(6,692) |
|
|
(5,064) |
|
|
(3,939) |
|
Net cash flows from financing activities |
|
|
130,143 |
|
|
27,984 |
|
|
(3,191) |
|
|
|
|
|
|
|
|
|
|
|
|
Effect of foreign currency exchange rates on cash |
|
|
4 |
|
|
(4) |
|
|
(2) |
|
Net increase (decrease) in cash and cash equivalents |
|
|
135,096 |
|
|
31,131 |
|
|
(2,995) |
|
Cash and cash equivalents, beginning of year |
|
|
40,400 |
|
|
9,269 |
|
|
12,264 |
|
Cash and cash equivalents, end of year |
|
$ |
175,496 |
|
$ |
40,400 |
|
$ |
9,269 |
|
|
|
|
|
|
|
|
|
|
|
|
Supplemental disclosure of cash flow information: |
|
|
|
|
|
|
|
|
|
|
Assets acquired under capitalized leases |
|
$ |
13,351 |
|
$ |
8,527 |
|
$ |
3,094 |
|
Property and equipment purchases included in accounts payable |
|
$ |
2,252 |
|
$ |
832 |
|
$ |
73 |
|
Issuance of common stock for business combination |
|
$ |
432 |
|
$ |
- |
|
$ |
- |
|
Cash paid for interest |
|
$ |
192 |
|
$ |
182 |
|
$ |
172 |
See accompanying notes to consolidated financial statements
78
SENDGRID, INC.
CONSOLIDATED STATEMENTS STOCKHOLDERS’ EQUITY (DEFICIT)
(In thousands, except share amounts)
|
|
|
|
|
|
|
|
|
|
|
|
|
|
Accumulated |
|
Total |
||
|
|
|
|
|
|
|
|
Additional |
|
|
|
|
Other |
|
Stockholders’ |
|||
|
|
|
Common Stock |
|
Paid-in |
|
Accumulated |
|
Comprehensive |
|
Equity |
|||||||
|
|
|
Shares |
|
Amount |
|
Capital |
|
Deficit |
|
Loss |
|
(Deficit) |
|||||
|
Balance at December 31, 2014 |
|
5,293,094 |
|
$ |
2 |
|
$ |
1,590 |
|
$ |
(33,842) |
|
$ |
- |
|
$ |
(32,250) |
|
Exercise of common stock options |
|
2,161,599 |
|
|
2 |
|
|
782 |
|
|
|
|
|
|
|
|
784 |
|
Stock-based compensation |
|
|
|
|
|
|
|
1,375 |
|
|
|
|
|
|
|
|
1,375 |
|
Net loss |
|
|
|
|
|
|
|
|
|
|
(5,854) |
|
|
|
|
|
(5,854) |
|
Foreign currency translation adjustment |
|
|
|
|
|
|
|
|
|
|
|
|
|
(2) |
|
|
(2) |
|
Balance at December 31, 2015 |
|
7,454,693 |
|
$ |
4 |
|
$ |
3,747 |
|
$ |
(39,696) |
|
$ |
(2) |
|
$ |
(35,947) |
|
Exercise of common stock options |
|
157,237 |
|
|
1 |
|
|
179 |
|
|
|
|
|
|
|
|
180 |
|
Stock-based compensation |
|
|
|
|
|
|
|
1,899 |
|
|
|
|
|
|
|
|
1,899 |
|
Net loss |
|
|
|
|
|
|
|
|
|
|
(3,908) |
|
|
|
|
|
(3,908) |
|
Foreign currency translation adjustment |
|
|
|
|
|
|
|
|
|
|
|
|
|
(4) |
|
|
(4) |
|
Balance at December 31, 2016 |
|
7,611,930 |
|
$ |
5 |
|
$ |
5,825 |
|
$ |
(43,604) |
|
$ |
(6) |
|
$ |
(37,780) |
|
Issuance of common stock in connection with initial public offering, net of underwriters' discount of $10.6 million and other issuance costs of $4.0 million |
|
9,430,000 |
|
|
9 |
|
|
136,280 |
|
|
|
|
|
|
|
|
136,289 |
|
Conversion of preferred stock into common stock in connection with the initial public offering |
|
24,535,227 |
|
|
25 |
|
|
80,663 |
|
|
|
|
|
|
|
|
80,688 |
|
Redemption of preferred stock warrant liability and conversion of the associated preferred shares into common stock |
|
44,894 |
|
|
- |
|
|
868 |
|
|
|
|
|
|
|
|
868 |
|
Exercise of common stock options |
|
474,049 |
|
|
- |
|
|
546 |
|
|
|
|
|
|
|
|
546 |
|
Issuance of common stock for business combination |
|
79,547 |
|
|
- |
|
|
432 |
|
|
|
|
|
|
|
|
432 |
|
Stock-based compensation |
|
|
|
|
|
|
|
4,980 |
|
|
|
|
|
|
|
|
4,980 |
|
Net loss |
|
|
|
|
|
|
|
|
|
|
(6,253) |
|
|
|
|
|
(6,253) |
|
Foreign currency translation adjustment |
|
|
|
|
|
|
|
|
|
|
|
|
|
4 |
|
|
4 |
|
Balance at December 31, 2017 |
|
42,175,647 |
|
$ |
39 |
|
$ |
229,594 |
|
$ |
(49,857) |
|
$ |
(2) |
|
$ |
179,774 |
See accompanying notes to consolidated financial statements.
79
SENDGRID, INC.
NOTES TO CONSOLIDATED FINANCIAL STATEMENTS
(1) Organization and Description of Business
SendGrid, Inc. and our wholly owned subsidiaries, SendGrid UK Limited and JCKM, Inc. (“Bizzy”) (collectively, “we,” “us,” “our,” “SendGrid”, or “the Company”), operate a leading digital communication platform that enables businesses to engage with their customers via email reliably, effectively, and at scale. SendGrid’s cloud-based platform allows for frictionless adoption and immediate value creation for businesses, providing their developers and marketers with the tools to seamlessly and effectively reach their customers using email. We maintain business operations in the United States and United Kingdom, with sales to customers in the United States and internationally.
In November 2017, we completed our initial public offering (“IPO”). We sold 9.4 million shares of our common stock (“Common Stock”) at the public offering price of $16.00 per share. We received net proceeds of $136.3 million after deducting underwriting discounts and offering expenses. Our Common Stock began trading on the New York Stock Exchange on November 15, 2017. In connection with the closing of our IPO, all 24.5 million outstanding shares of our redeemable convertible preferred stock converted into Common Stock at the ratio of one to one.
(2) Summary of Significant Accounting Policies
Basis of Presentation and Consolidation
The accompanying consolidated financial statements were prepared in accordance with accounting principles generally accepted in the United States of America (“GAAP”). Consolidated financial statements include the accounts of the Company and its subsidiaries. Bizzy became a wholly owned subsidiary effective March 3, 2017. All intercompany transactions and accounts balances have been eliminated in consolidation.
Use of Estimates
The preparation of consolidated financial statements, in conformity with GAAP, requires estimates and assumptions that affect the reported amounts of assets and liabilities and disclosure of contingent assets and liabilities at the date of the consolidated financial statements, the reported amounts of revenue and expenses during the reporting period, and certain information disclosed in the notes to the consolidated financial statements. Actual results could materially differ from these estimates. Significant estimates and assumptions that affect our consolidated financial condition and results of operations include:
|
· |
revenue recognition; |
|
· |
allowance for doubtful accounts and sales returns; |
|
· |
determination of the fair value of assets acquired and liabilities assumed in business combinations; |
|
· |
income tax uncertainties; |
|
· |
deferred taxes and related valuation allowances; |
|
· |
sales and use tax; |
|
· |
stock-based compensation; and |
|
· |
other contingencies |
We review estimates and assumptions periodically, and the effects of revisions are reflected prospectively in the period they occur.
80
Foreign Currency Translation
Our reporting currency is the U.S. dollar. We operate a subsidiary in the United Kingdom and use the British pound as its functional currency. All of the subsidiary’s assets and liabilities denominated in a foreign currency are translated into U.S. dollars based on the exchange rate on the balance sheet date. Revenue, expenses, and cash flows are translated at the average exchange rates during the period. The effects of foreign exchange gains and losses arising from translation are included as a component of other comprehensive income (loss).
Liquidity
We are subject to various risks and uncertainties frequently encountered by companies in the early stages of development, particularly companies in the evolving market for software and services. Such risks and uncertainties include, but are not limited to:
|
· |
operating losses; |
|
· |
the ability to raise capital; |
|
· |
significant competition; |
|
· |
changing marketplace demands; |
|
· |
the ability to retain and attract personnel; and |
|
· |
management of growth. |
To address these risks, we must, among other things:
|
· |
further develop our customer base; |
|
· |
implement and successfully execute our business and marketing strategy; |
|
· |
continue to develop and upgrade our platform; |
|
· |
provide excellent customer service; |
|
· |
provide for sufficient funding to support our operations and anticipated growth; and |
|
· |
attract, retain, and motivate qualified personnel. |
There can be no guarantee that we will be successful in addressing these or other such risks.
Historically, we funded our operations through a combination of equity and debt financings, and cash flows from operations. We believe that the cash on hand, cash available to draw on our line of credit, cash expected to be generated from customers, and managing operating costs at a level commensurate with cash generated from customers will provide sufficient cash flow to fund operations and provide our working capital needs through at least the next 12 months.
The continued execution of our long-term business plan may require us to raise additional capital through the issuance of equity or debt instruments. While we have historically been successful in obtaining equity financing, there can be no assurance that such additional financing, if necessary, will be available or, if available, that such financings can be obtained on satisfactory terms.
Cash and Cash Equivalents
We consider all liquid investments purchased with a remaining maturity of 90 days or less at the date of acquisition to be cash equivalents. Cash consists of checking and other demand deposit accounts, and cash equivalents consist of money market funds. Our restricted cash represents funds restricted for use or withdrawal related to contractual agreements for facility leases. We maintained balances in various operating accounts in excess of federally insured limits.
81
Trade Accounts Receivable
Accounts receivable are recorded at the invoiced amount and do not bear interest. Customer usage charges in excess of package limits are billed in arrears. Charges incurred but not yet billed at the end of the reporting period are recorded as unbilled accounts receivable until they are billed in the following month.
Accounts receivable on the consolidated balance sheets is reflected net of the allowance for doubtful accounts. The allowance for doubtful accounts is our best estimate of the amount of probable credit losses. In establishing the required allowance amount, we consider historical losses adjusted to take into account current market conditions, customer payment patterns, and the current receivables aging. Account balances are charged off against the allowance after all means of collection have been exhausted and the potential for recovery is considered remote. We record bad debt expense in general and administrative expense on the consolidated statements of operations.
Property and Equipment
Property and equipment are stated at cost and depreciated using the straight-line method over the estimated useful lives of the assets from the date placed in service. We periodically evaluate the estimates of the useful lives by reviewing historical usage and consider technological changes, trends in the industry, and other economic factors that could impact utilization.
We record equipment acquired under capital leases at the lower of the fair value of the asset or the net present value of the minimum lease payments at the inception of the lease.
Upon retirement or disposition of assets, the cost and related accumulated depreciation are removed from the accounts, and the related gains or losses are recognized in our results of operations. Maintenance and repair costs are expensed as incurred.
Intangible Assets and Goodwill
Identified intangible assets arising from business combinations are initially recorded at fair value. We amortize intangible assets using the straight-line method, as this method approximates the timing in which we expect to receive the associated benefit.
Our goodwill is associated with the Bizzy acquisition and represents the excess of the purchase price over the estimated acquisition date fair value assigned to the identifiable assets acquired and liabilities assumed. We evaluate goodwill for impairment annually each October 1st, or more frequently if a triggering event occurs between testing dates, using a fair value approach.
Our impairment assessment begins with a qualitative assessment to determine if it is more likely than not that a reporting unit’s fair value is less than the net book value. The initial qualitative assessment includes comparing the overall financial performance of the reporting unit against the planned results as well as other factors which might indicate that the reporting unit’s value has declined since the last assessment date.
If the net book value exceeds the fair value, we then perform an additional step to determine the amount of the impairment loss. The impairment loss represents the excess of the reporting unit’s net book value over its fair value. The impairment loss is limited to the amount of goodwill allocated to the reporting unit. There were no goodwill impairment losses during any period presented.
Long-Lived Assets
We review long-lived assets for possible impairment whenever events or circumstances indicate that the carrying amount of such assets may not be recoverable. If circumstances require a long-lived asset to be tested for possible impairment, we first compare undiscounted cash flows expected to be generated by an asset group to the carrying value of the asset group.
If the carrying value of the long-lived asset group is not recoverable on an undiscounted basis, an impairment is recognized to the extent that the carrying value exceeds its fair value. Fair value is determined through various valuation techniques, including discounted cash flow models, quoted market values, and third-party independent appraisals, as considered necessary. There were no impairment losses recognized during any periods presented.
Redeemable Preferred Stock Warrant Liability
82
Prior to our IPO in November 2017, a third party held a warrant to purchase shares of our redeemable convertible preferred stock. We reported the warrant on the consolidated balance sheet as a liability at its estimated fair value. We estimated fair value using the Black-Scholes option-pricing method and revalued at each balance sheet date. We reflected adjustments to the fair value in “adjustments to redeemable preferred stock warrant liability” on the consolidated statements of operations.
Upon the closing of the IPO, the warrant became exercisable for shares of Common Stock, and the holder exercised the warrant. As a result, we issued the requisite Common Stock and reclassified the liability to additional paid in capital.
Fair Value Measurements
Fair value is defined as the price that would be received to sell an asset or paid to transfer a liability in an orderly transaction between participants at the measurement date.
GAAP establishes a three-level valuation hierarchy for disclosure of fair value measurements. The determination of the applicable level within the hierarchy of a particular asset or liability depends on the inputs used in valuation as of the measurement date, notably the extent to which the inputs are market-based (observable) or internally derived (unobservable). The three levels are defined as follows.
Level 1—inputs based on quoted prices (unadjusted) for identical assets or liabilities in active markets.
Level 2—inputs based on quoted prices for similar assets and liabilities in active markets for substantially the full term of the financial instrument; quoted prices for identical or similar instruments in markets that are not active for substantially the full term of the financial instrument; and model-derived valuations whose inputs or significant value drivers are observable.
Level 3—inputs based on unobservable prices or valuation techniques that are significant to the fair value measurement.
A financial instrument’s categorization within the valuation hierarchy is based upon the lowest level of input that is significant to the fair value measurement.
As of all periods presented, the carrying amount for cash, restricted cash, accounts receivable (net of allowance for doubtful accounts), and current liabilities (excluding the current portion of capital lease obligations) is equal to or approximates fair value due to their short-term nature and proximity to current market rates.
We view our capital lease obligations as Level 2 measurements. The fair value of our capital lease obligations approximates their carrying amounts based on the proximity of their interest rates to current market rates.
In periods prior to our IPO, we used level 3 assumptions in valuing our redeemable preferred stock warrant liability. Our redeemable preferred stock warrant liability is the only asset or liability on our consolidated balance sheets subject to fair value measurement on a recurring basis.
Our accounting policy is to recognize transfers between levels of the fair value hierarchy on the date of the event or change in circumstances that caused the transfer. For all periods presented, there were no significant transfers into or out of Level 1, Level 2, or Level 3.
Revenue Recognition
We derive revenue primarily from fees charged to customers accessing our Email application program interface (or API) and Marketing Campaigns services. Prior to delivering services, we require customers to select a service level package and enter into a monthly service agreement. The arrangement generally includes a fixed subscription fee that covers a predetermined email volume limit for the month. Any usage above the email volume limit is invoiced as overage charges based on a stated price per email. Fees associated with our Marketing Campaigns service are based on a tiered pricing model dependent on the number of contacts stored on the platform. All customers are entitled to unlimited basic support.
83
Fixed subscription fees are invoiced at the beginning of each monthly service cycle based on the agreed upon fee. At the end of each monthly service cycle, we invoice customers for usage based on the contracted rate as well as fees associated with contact storage. Revenue from usage incurred and contact storage, if applicable, that has not been invoiced as of the end of a reporting period are recorded as unbilled accounts receivable. Fees are recognized as revenue in the month services are provided.
We provide a service; therefore, service revenue is recognized ratably over the applicable service period, generally one month, when all of the following conditions have been met.
|
Condition |
Considerations and Evidence |
|
Persuasive evidence of an arrangement exists |
A signed service agreement |
|
The services have been delivered to the customer |
The customer has access to our platform. Our services are available for use at this point. |
|
The price is fixed or determinable |
We consider the price fixed or determinable when the customer selects a package and payment terms are established. This occurs at the onset of the agreement. Our fees are typically based on predetermined email volume. Any usage above such predetermined volume is invoiced as overage charges based on set fees stated in the agreement. Usage fees related to our Marketing Campaigns service are invoiced according to the tiered fee structure per the agreement. |
|
Collection of the fees is reasonably assured |
We assess collectability based on a number of factors, including collection history and credit worthiness. Our customers generally pay the base fee in advance by credit card. The cardholder may subsequently contest charges, and we occasionally receive chargebacks. We estimate chargebacks and sales credits using historical experience adjusted to take into account current market conditions. We record revenue net of estimated chargebacks and sales credits. |
We have arrangements with strategic partners that generally act as resellers. In most reseller arrangements, we provision the service, provide technical support, establish pricing, and assume credit risk. We consider ourselves the principal in these arrangements and record revenue on a gross basis. On the consolidated statements of operations, expenses directly related to providing the service are recorded as cost of revenue, and commissions paid to strategic partners are recorded as selling and marketing expense.
In other reseller arrangements, the reseller provides support, training, and other services requested or required by end users at the reseller’s sole cost and expense. We provide support services only to the reseller and have no obligation to provide technical support or respond to requests directly from end users. In addition, the reseller establishes the price for the service and assumes credit risk. We consider ourselves the agent in these arrangements and record the net amount received from the reseller.
Cost of Revenue
Cost of revenue consists principally of depreciation and amortization expense related to hosting equipment and outsourced managed hosting costs. Other components include employee related costs, including salaries, bonuses, benefits, stock-based compensation, other related costs, and an allocation of our general overhead.
84
Research and Development
Research and development expense consists primarily of employee related costs, including salaries, bonuses, benefits, stock-based compensation, other related costs, and an allocation of our general overhead. Also included are non-personnel costs such as consulting and professional fees for third party development resources, and depreciation costs.
Our research and development efforts focus on enhancing functionality of existing services and adding new features and services. To date, expenditures incurred between when the application has reached the development stage and when it is substantially complete and ready for its intended use have been inconsequential and, as a result, we have not capitalized any qualifying software development costs.
Income Taxes
We account for income taxes using the asset and liability method of accounting for deferred income taxes. Deferred tax assets and liabilities are recognized for the future tax consequences attributable to differences between the consolidated financial statement carrying amounts of existing assets and liabilities and their respective tax bases that will result in taxable or deductible amounts in the future. Deferred tax assets and liabilities are measured using enacted tax rates expected to apply to taxable income in the years in which those temporary differences are expected to be recovered or settled. The effect on deferred tax assets and liabilities of a change in tax rates is recognized in operations in the period that includes the enactment date. We record valuation allowance to the extent it is more likely than not that a deferred tax asset will not be realized.
In assessing the realizability of deferred tax assets, we consider whether it is more likely than not that some portion or all of the deferred tax assets will not be realized. The ultimate realization of deferred tax assets is dependent upon the generation of future taxable income during the periods in which those temporary differences become deductible. We consider the scheduled reversal of deferred tax liabilities, projected future taxable income, and tax planning strategies in making this assessment.
We recognize the effect of income tax positions only if those positions are more likely than not to be sustained. Recognized income tax positions are measured at the largest amount that is greater than 50% likely of being realized. Changes in recognition or measurement are reflected in the period in which the change in judgment occurs. We record interest related to unrecognized tax benefits in interest expense and penalties in general, and administrative expenses. Our net deferred tax asset has been completely reduced by a valuation allowance because we cannot conclude that realization of the deferred tax assets is assured, on a more likely than not basis, due primarily to our history of operating losses.
Stock-Based Compensation
We account for employee stock-based compensation based on the fair value of the award at the grant date. Expense is recognized, net of estimated forfeitures, on a straight-line basis over the period during which the holder is required to provide services, which is usually the vesting period. We determine the fair value of all stock options at time of grant using the Black-Scholes option pricing model.
We record excess tax benefits and deficiencies in the period they arise in the provision for income taxes. To date, there has been no impact on the provision for income taxes due to the full valuation allowance.
Concentration of Credit Risk and Significant Customers
Concentrations of credit risk consist primarily of cash and accounts receivable. All cash is in demand deposit accounts at financial institutions we believe to be creditworthy. We perform ongoing evaluations of our customers’ financial condition and do not require any collateral to support receivables.
85
Recently Adopted Accounting Standards
In September 2015, the FASB issued ASU 2015-16, Business Combinations (Topic 805): Simplifying the Accounting for Measurement-Period Adjustments, which eliminates the requirement for an acquirer to retrospectively adjust the financial statements for measurement-period adjustments that occur in periods after a business combination is consummated. ASU 2015-16 was effective for us on January 1, 2017. The adoption of this standard did not have a significant impact on our consolidated financial statements and related disclosures.
In January 2017, the FASB issued ASU 2017-04, Intangibles—Goodwill and Other (Topic 350): Simplifying the Test for Goodwill Impairment. This standard simplifies the accounting for goodwill impairment by removing step two of the goodwill impairment test, which requires a hypothetical purchase price allocation. A goodwill impairment will be the amount by which a reporting unit’s carrying amount, including goodwill, exceeds its fair value. The impairment charge will be limited to the amount of goodwill allocated to that reporting unit. The standard requires prospective application. We adopted ASU 2017-04 on October 1, 2017, and it did not have a significant impact on our consolidated financial statements and related disclosures.
In May 2017, the FASB issued ASU 2017-09, Compensation—Stock Compensation (Topic 718): Scope of Modification Accounting, which provides guidance regarding stock-based payment award changes that require modification accounting. The standard requires prospective application for awards modified on or after the effective date. We adopted ASU 2017-09 on October 1, 2017, and it did not have a significant impact on our consolidated financial statements and related disclosures.
New Accounting Pronouncements Not Yet Adopted
We are an emerging growth company (“EGC”) as defined by the Jumpstart Our Business Startups Act (“JOBS Act”). The JOBS Act provides that an EGC can take advantage of an extended transition period for complying with new or revised accounting standards. This allows an EGC to delay adoption of certain accounting standards until those standards would otherwise apply to private companies. We elected to take advantage of the extended transition period. However, this election will not apply should we cease to be classified as an EGC.
In January 2017, the FASB issued ASU 2017-01, Business Combinations (Topic 805): Clarifying the Definition of a Business, which clarifies when transactions should be accounted for as acquisitions (or disposals) of assets or business. ASU 2017-01 is effective for us beginning January 1, 2019. Early adoption is permitted for transactions not previously reported in issued financial statements. The effect that the ASU will have on our consolidated financial statements will be dependent upon the nature and amount of asset acquisitions (or disposals) and business combinations we execute in future periods, if any.
In November 2016, the FASB issued ASU 2016-18, Statements of Cash Flow (Topic 230): Restricted Cash, which requires that a statement of cash flows explain the change during the period in the total cash, cash equivalents, and amounts generally described as restricted cash or restricted cash equivalents. Therefore, amounts generally described as restricted cash and restricted cash equivalents should be included with cash and cash equivalents when reconciling the beginning-of-period and end-of-period total amount shown on the statement of cash flows. ASU 2016-18 is effective for us beginning January 1, 2019. The effect that the ASU will have on our consolidated financial statements will be dependent upon the amount of restricted cash in future periods.
In August 2016, the FASB issued ASU 2016-15, Statements of Cash Flows (Topic 230): Classification of Certain Cash Receipts and Cash Payments, which clarifies classification for certain cash receipts and cash payments on the consolidated statement of cash flows. ASU 2016-15 is effective for us beginning January 1, 2019. The standard requires a retrospective transition method for each period presented. We do not expect the adoption of this standard will have a significant impact on our consolidated financial statements and related disclosures.
86
In March 2016, the FASB issued ASU 2016-09, Compensation—Stock Compensation (Topic 718): Improvements for Employee Share-Based Payment Accounting, which simplifies certain aspects of accounting for share-based payment transactions, including income tax consequences, statutory tax withholdings requirements, forfeitures, and classification in the statement of cash flows. ASU 2016-09 is effective for us beginning January 1, 2018. The standard requires the guidance related to forfeitures to be applied using a modified retrospective transition method and the guidance related to the accounting for income taxes to be applied prospectively. We do not expect the adoption of this standard will have a significant impact on our consolidated financial statements and related disclosures.
In February 2016, the FASB issued ASU 2016-02, Leases (Topic 842), which requires lessees to recognize the assets and liabilities that arise from all leases on the consolidated balance sheet. ASU 2016-02 is effective for us beginning January 1, 2020 (or January 1, 2019 should we cease to be classified as an EGC). Early adoption is permitted. The standard requires a modified retrospective approach for leases that exist or are entered into after the beginning of the earliest comparative period in the financial statements. We have not yet determined the effect of the standard on our consolidated financial statements and related disclosures.
In May 2014, the FASB issued ASU 2014-09, Revenue from Contracts with Customers (Topic 606), and modified the standard thereafter. The standard requires an entity to recognize the amount of revenue to which it expects to be entitled for the transfer of promised goods or services to customers. This new accounting standard also impacts the recognition of sales commissions. The ASU will replace most existing revenue recognition guidance in U.S. GAAP when it becomes effective. ASU 2014-09 is effective for us beginning January 1, 2019. Early adoption is permitted. The standard permits the use of either the retrospective or cumulative effect transition method. We continue to evaluate the impact of the new standard and available adoption methods on our consolidated financial statements. We are in the process of evaluating arrangements with customers and identifying differences in accounting between new and existing standards.
(3) Accounts Receivable and Credit Card Chargebacks
We reflect accounts receivable on the consolidated balance sheets net of the allowance for doubtful accounts. The following table summarizes the activity in the allowance for doubtful accounts:
|
|
|
For the Year Ended December 31, |
|||||||
|
|
|
2017 |
|
2016 |
|
2015 |
|||
|
|
|
(In thousands) |
|||||||
|
Balance, beginning of period |
|
$ |
34 |
|
$ |
15 |
|
$ |
23 |
|
Additions |
|
|
240 |
|
|
313 |
|
|
105 |
|
Write-offs |
|
|
(241) |
|
|
(294) |
|
|
(113) |
|
Balance, end of period |
|
$ |
33 |
|
$ |
34 |
|
$ |
15 |
Our customers generally pay by credit card. The cardholder may subsequently contest charges, and we occasionally receive chargebacks. We estimate chargebacks and sales credits using historical experience adjusted to take into account current market conditions. We record revenue net of estimated chargebacks and sales credits. The following table summarizes chargebacks and sales credits:
|
|
|
For the Year Ended December 31, |
|||||||
|
|
|
2017 |
|
2016 |
|
2015 |
|||
|
|
|
(In thousands) |
|||||||
|
Chargebacks and sales credits |
|
$ |
1,023 |
|
$ |
323 |
|
$ |
369 |
87
(4) Prepaid Expenses and Other Assets
Prepaid expenses and other assets consist of the following:
|
|
|
As of December 31, |
||||
|
|
|
2017 |
|
2016 |
||
|
|
|
(In thousands) |
||||
|
Tenant improvement allowances |
|
$ |
4,935 |
|
$ |
- |
|
Subscriptions |
|
|
1,351 |
|
|
939 |
|
Marketing |
|
|
579 |
|
|
235 |
|
Security deposits |
|
|
341 |
|
|
321 |
|
Salary and bonus |
|
|
76 |
|
|
126 |
|
Travel and other |
|
|
2,105 |
|
|
1,462 |
|
|
|
|
9,387 |
|
|
3,083 |
|
Less long-term |
|
|
(300) |
|
|
(234) |
|
Prepaid expenses and other current assets |
|
$ |
9,087 |
|
$ |
2,849 |
Tenant improvement allowances represent receivables from landlords and deferred credits related to leasehold improvements in facility lease agreements.
(5) Property and Equipment
Property and equipment consist of the following:
|
|
|
Estimated Useful |
|
As of December 31, |
||||
|
|
|
Life (in months) |
|
2017 |
|
2016 |
||
|
|
|
|
|
(In thousands) |
||||
|
Data center equipment |
|
36 - 48 |
|
$ |
28,474 |
|
$ |
22,307 |
|
Leasehold improvements |
|
41 - 91 * |
|
|
8,067 |
|
|
6,056 |
|
Office furniture and equipment |
|
36 - 60 |
|
|
4,560 |
|
|
2,780 |
|
Computer equipment and peripherals |
|
36 |
|
|
3,276 |
|
|
2,595 |
|
|
|
|
|
|
44,377 |
|
|
33,738 |
|
Less accumulated depreciation |
|
|
|
|
(15,185) |
|
|
(14,548) |
|
Property and equipment, net |
|
|
|
$ |
29,192 |
|
$ |
19,190 |
* We depreciate leasehold improvements using the straight-line method over the shorter of the asset’s useful life or the life of the lease.
We hold certain equipment under capital lease arrangements. This equipment is classified as data center and office equipment. We depreciate this equipment using the straight-line method over the shorter of the useful life or the term of the lease agreement. The following table summarizes our capital lease arrangements:
|
|
|
As of December 31, |
||||
|
|
|
2017 |
|
2016 |
||
|
|
|
(In thousands) |
||||
|
Equipment held under capital lease agreements |
|
$ |
24,866 |
|
$ |
21,956 |
|
Less accumulated depreciation |
|
|
(7,860) |
|
|
(11,256) |
|
Carrying value |
|
$ |
17,006 |
|
$ |
10,700 |
88
The following table summarizes depreciation expense, including depreciation of assets held under capital lease arrangements:
|
|
|
For the Year Ended December 31, |
|||||||
|
|
|
2017 |
|
2016 |
|
2015 |
|||
|
|
|
(In thousands) |
|||||||
|
Depreciation Expense |
|
$ |
9,172 |
|
$ |
6,896 |
|
$ |
5,521 |
(6) Business Combination
On March 3, 2017, we acquired 100% of the outstanding common stock of Bizzy. Bizzy was based in San Francisco, California and operated a subscription-based email automation tool that focused on customer segmentation and customization. The acquisition enhances our Marketing Campaigns service.
We allocated the purchase price to the assets acquired and liabilities assumed based on their estimated fair values as of the acquisition date, with the excess purchase price allocated to goodwill. We retained a third-party valuation specialist to assist with estimating these values. The valuation of the identifiable assets acquired was based upon our estimates and assumptions.
The following tables summarize the consideration paid at the acquisition date and the purchase price allocation:
|
|
|
|
|
Consideration |
|
|
|
|
|
|
Paid |
|
|
|
|
|
|
(In millions) |
|
|
Cash |
|
|
|
$ |
2.7 |
|
79,547 shares of SendGrid common stock |
|
|
|
|
0.4 |
|
Total consideration |
|
|
|
$ |
3.1 |
|
|
|
|
|
|
|
|
|
|
Estimated |
|
Purchase |
|
|
|
|
Useful Life |
|
Price |
|
|
|
|
(in months) |
|
Allocation |
|
|
|
|
|
|
(In millions) |
|
|
Cash |
|
NA |
|
$ |
0.5 |
|
Core technology |
|
120 |
|
|
0.8 |
|
Customer relationships, non-compete, and other |
|
36 - 60 |
|
|
0.2 |
|
Goodwill |
|
NA |
|
|
1.6 |
|
Total fair value of assets acquired |
|
|
|
$ |
3.1 |
We allocated the excess of purchase price over the fair value of the underlying assets acquired to goodwill. The goodwill principally represents the acquired assembled workforce and the value of synergies expected to be realized between SendGrid and Bizzy, neither of which qualify as a separate amortizable intangible asset. Goodwill is not amortized. The goodwill is not deductible for tax purposes.
We entered into consent agreements with certain former Bizzy stockholders whereby $1.2 million will be paid at various dates through March 2019 as long as the employees remain continuously employed. The fair value of the payment obligation is recorded as post-acquisition expense in research and development expense over the 24-month period beginning March 2017.
During the year ended December 31, 2017, we incurred outside legal fees of $0.2 million related to the Bizzy acquisition. These costs are included in general and administrative expense on the consolidated statements of operations. Bizzy’s results of operations are included in our financial statements for the period subsequent to March 3, 2017.
89
(7) Intangible Assets and Goodwill
Our intangible assets consist of the following:
|
|
|
Estimated |
|
As of December 31, |
||||||||||||||||
|
|
|
Useful |
|
2017 |
|
2016 |
||||||||||||||
|
|
|
Life |
|
|
|
|
Accumulated |
|
Net Book |
|
|
|
|
Accumulated |
|
Net Book |
||||
|
|
|
(in months) |
|
Cost |
|
Amortization |
|
Value |
|
Cost |
|
Amortization |
|
Value |
||||||
|
|
|
|
|
(In thousands) |
||||||||||||||||
|
Core technology |
|
120 |
|
$ |
800 |
|
$ |
(67) |
|
$ |
733 |
|
$ |
- |
|
$ |
- |
|
$ |
- |
|
Customer relationships, non-compete agreements, and other |
|
36 - 60 |
|
|
163 |
|
|
(35) |
|
|
128 |
|
|
- |
|
|
- |
|
|
- |
|
Software |
|
36 |
|
|
1,150 |
|
|
(216) |
|
|
934 |
|
|
99 |
|
|
(88) |
|
|
11 |
|
|
|
|
|
$ |
2,113 |
|
$ |
(318) |
|
$ |
1,795 |
|
$ |
99 |
|
$ |
(88) |
|
$ |
11 |
The following table summarizes amortization expense on intangible assets:
|
|
|
For the Year Ended December 31, |
|||||||
|
|
|
2017 |
|
2016 |
|
2015 |
|||
|
|
|
(In thousands) |
|||||||
|
Amortization Expense |
|
$ |
246 |
|
$ |
17 |
|
$ |
- |
As of December 31, 2017, the weighted average remaining amortization period on our intangible assets was 71 months. The following table summarizes future amortization expense as of December 31, 2017:
|
|
|
2018 |
|
2019 |
|
2020 |
|
2021 |
|
2022 |
|
Thereafter |
|
Total |
|||||||
|
|
|
(In thousands) |
|||||||||||||||||||
|
Future amortization expense |
|
$ |
482 |
|
$ |
477 |
|
$ |
322 |
|
$ |
99 |
|
$ |
83 |
|
$ |
332 |
|
$ |
1,795 |
We had no goodwill on our consolidated balance sheets as of December 31, 2016. Our goodwill as of December 31, 2017 is associated with the Bizzy acquisition.
(8) Accounts Payable and Accrued Liabilities
Accounts payable and accrued liabilities consists of the following:
|
|
|
As of December 31, |
||||
|
|
|
2017 |
|
2016 |
||
|
|
|
(In thousands) |
||||
|
Bonus and commission |
|
$ |
4,031 |
|
$ |
2,086 |
|
Accounts payable |
|
|
3,553 |
|
|
1,549 |
|
Sales tax |
|
|
2,057 |
|
|
1,114 |
|
Vacation |
|
|
1,832 |
|
|
1,304 |
|
Employee benefits |
|
|
557 |
|
|
366 |
|
Marketing expense |
|
|
203 |
|
|
228 |
|
Other accrued liabilities |
|
|
1,604 |
|
|
1,124 |
|
Accounts payable and accrued liabilities |
|
$ |
13,837 |
|
$ |
7,771 |
(9) Revolving Line of Credit
We have a loan and security agreement (“LSA”) with a bank that provides a revolving line of credit with $40.0 million maximum borrowing availability. The LSA matures in May 2018.
We had $40.0 million available to draw and were in compliance with all financial covenants under the LSA as of December 31, 2017. No amounts were outstanding as of December 31, 2017 or 2016, and we had no borrowing activity during the years ended December 31, 2017, 2016, or 2015.
90
Amounts available to draw under the LSA are calculated from a trailing three-month revenue base, which can differ from the maximum loan amount. Advances are subject to the following interest rates:
|
· |
prime rate then in effect plus 0.50%, with a floor of 4.00% while our cash balance is greater than $8.0 million. |
|
· |
prime rate then in effect plus 1.25%, with a floor of 4.75% while our cash balance is not greater than $8.0 million |
Principal is due at maturity. Borrowings are secured by substantially all of our assets. The LSA contains certain restrictions, affirmative and negative covenants, and limitations, including, among other things:
|
· |
restriction on our ability to pledge our intellectual property; |
|
· |
requirement to maintain at least 40% of our aggregate cash and cash equivalents in depository, operating, and investment accounts with the bank |
|
· |
requirement to maintain certain business performance levels; |
|
· |
limitations on disposal of assets; |
|
· |
limitations on certain fundamental business changes; |
|
· |
limitations on incurrences of debt; |
|
· |
limitations on incurrences of liens; |
|
· |
limitations on payments of dividends; |
|
· |
limitations on repurchases of stock; and |
|
· |
limitations on engaging in affiliate transactions. |
Each case is subject to certain exceptions. The LSA also contains certain events of default including, among other things, that during the existence of an event of default, interest on the obligations could be increased.
(10) Common and Preferred Shares
Common Shares
During 2017, our Board of Directors reserved the following common shares:
|
· |
466,571 shares to fund SendGrid.org |
|
· |
791,833 shares for our employee stock purchase plan |
|
· |
2,973,675 shares for our 2017 Equity Incentive Plan |
SendGrid.org is a division of SendGrid and not a separate legal entity. Its mission is to support nonprofit organizations.
New Preferred Shares
In November 2017, we amended and restated our certificate of incorporation to authorize 10,000,000 shares of new preferred stock. None were issued our outstanding as of December 31, 2017.
Redeemable Convertible Preferred Shares
In November 2016, our Board of Directors (the “Board”) and stockholders amended and restated our certificate of incorporation to authorize 2,400,000 shares of Series D Preferred Stock (“Series D Preferred”). We sold 2.3 million shares of Series D Preferred at a per share price of $14.14029 with total proceeds of $32.8 million, net of stock issuance costs of $0.1 million.
91
In connection with the closing of our IPO in November 2017, each share of our Series A Preferred Stock (“Series A Preferred”), Series A-1 Preferred Stock (“Series A-1 Preferred”), Series B Preferred Stock (“Series B Preferred”), Series C Preferred Stock (“Series C Preferred”), and Series D Preferred (collectively, “Preferred Stock”) converted into Common Stock at the ratio of one to one.
Characteristics of the Redeemable Convertible Preferred Shares Prior to the Initial Public Offering
Prior to our IPO in November 2017, our Preferred Stock had the following characteristics in accordance with our certificate of incorporation:
(a) Conversion
Optional Conversion
Each share of Preferred Stock could, at the option of the holder, be converted at any time into the number of fully paid, nonassessable shares of our Common Stock determined by the applicable conversion rate (as described in detail below).
Mandatory Conversion
Each share of Preferred Stock was convertible into a certain number of fully paid and nonassessable shares of Common Stock at a conversion rate determined by dividing the applicable original issue price per share by the applicable conversion price per share at the time of conversion. The per share conversion price for each series of Preferred Stock was initially equal to that series’ original issue price, but each series’ conversion price was subject to certain anti-dilution and adjustment provisions. As of November 17, 2017 (the closing date of the IPO) and December 31, 2016, the original issue price for each series of Preferred Stock remained equal to that series’ conversion price; therefore, the rate at which each share of Preferred Stock did convert and could convert into Common Stock was one for one for all series of Preferred Stock. The following table details aggregate liquidation value and events that trigger mandatory conversion of each series of Preferred Stock into Common Stock, which conversion would occur at the then-applicable conversion rate for such series of Preferred Stock:
|
|
|
|
|
|
|
|
Series |
|
Original |
|
Mandatory Conversion Trigger Events |
|
|
|
|
|
|
|
|
|
Series A Preferred |
|
$ |
0.220.667282.7645.74 |
|
(1) At any time upon the affirmative election of the holders of a majority of the then outstanding shares of that specific series of preferred shares voting as a separate class or (2) upon the closing of a firmly underwritten public offering of Common Stock shares at a per share price not less than two times the original issue price of the Series C Preferred (as adjusted for stock splits, dividends and the like) and for a total offering of not less than $50 million (before deduction of underwriters commissions and expenses) |
|
|
|
|
|
|
|
|
Series D Preferred |
|
$ |
14.14029 |
|
(1) At any time upon the affirmative election of the holders of a majority of the then outstanding shares of Series D Preferred voting as a separate class or (2) upon the closing of a firmly underwritten public offering of Common Stock shares |
|
|
|
|
|
|
|
92
(b) Voting Rights
On any matter presented to the stockholders, each holder of outstanding shares of Preferred Stock was entitled to cast the number of votes equal to the number of whole shares of Common Stock into which the shares of Preferred Stock were convertible as of the record date. Except as provided by law or the certificate of incorporation, holders of shares of Preferred Stock voted together with the holders of Common Stock as a single class.
The affirmative vote or written consent of the holders of at least 60% of the outstanding shares of Preferred Stock, voting together on an as-converted to Common Stock basis, was required: (i) to amend, alter, or repeal any provision of our certificate of incorporation or bylaws; (ii) to increase or decrease the authorized number of shares of Common Stock or Preferred Stock; (iii) to authorize or designate any new class or series of stock or other securities convertible into equity securities ranking on a parity with or senior to the Preferred Stock in certain rights or any increase in the authorized or designated number of any such new class or series; (iv) to redeem, repurchase, pay, or declare dividends or other distributions with respect to Common Stock or Preferred Stock, other than in connection with equity incentive agreements with service providers and certain dividends that result in Preferred Stock conversion-price adjustments; (v) to enter into any agreement by the Company or its stockholders effecting a Deemed Liquidation Event (as defined in our certificate of incorporation); (vi) to voluntarily dissolve, liquidate, or wind up the affairs of the Company or voluntarily petition for bankruptcy or assignment for the benefit of creditors; (vii) to exclusively license, lease, sell, distribute, or otherwise dispose of intellectual property outside the ordinary course of business; (viii) to create, or acquire capital stock in, any subsidiary that is not wholly owned (either directly or through one or more other subsidiaries) by the Company, or to sell, transfer or otherwise dispose of any capital stock of any direct or indirect subsidiary of the Company, or to permit any direct or indirect subsidiary to sell, lease, transfer, exclusively license or otherwise dispose of all or substantially all of the assets of such subsidiary; (ix) to create or authorize the creation of any debt security if the Company’s aggregate indebtedness for borrowed money (excluding accrued interest) would exceed $100,000 (excluding ordinary course vendor and supplier financing and non-debt obligations under customer contracts and strategic relationships); or (x) to increase or decrease the authorized number of members of the Board. The affirmative vote or written consent of a majority of the outstanding shares of Series D Preferred was required to amend, alter, or repeal any provision of our certificate of incorporation or bylaws in a manner that adversely affected the rights, preferences, or privileges of the Series D Preferred.
The following table summarizes voting rights associated with election of Board members prior to our IPO. Holders of each series of Preferred Stock and the Common Stock voted exclusively and as a separate class. Board members elected by each class or series of capital stock designated in the table below could be removed without cause only by the holders of that class or series.
|
|
|
|
|
Class or Series |
|
Number of |
|
Series A-1 Preferred |
|
1 |
|
Series B Preferred |
|
1 |
|
Series D Preferred |
|
1 |
|
Common |
|
2 |
The holders of Common Stock and Preferred Stock, voting together as a single class on an as-converted to Common Stock basis, were entitled to elect all remaining members of the Board.
93
(c) Dividends
Had the Board declared a dividend, the holders of Preferred Stock were entitled to receive noncumulative dividends in preference to any dividends on Common Stock. Dividends were paid out of any assets legally available at the following rates, each as adjusted for any stock dividends, combinations, splits, recapitalizations, or the like:
|
Series |
|
Noncumulative |
|
|
Series A Preferred |
|
$ |
0.0176 |
|
Series A-1 Preferred |
|
$ |
0.0534 |
|
Series B Preferred |
|
$ |
0.22112 |
|
Series C Preferred |
|
$ |
0.4592 |
|
Series D Preferred |
|
$ |
1.312232 |
Had dividends been paid on Common Stock, the Company was required to pay an additional dividend equal to that paid on Common Stock on all outstanding shares of Preferred Stock on an as-converted to Common Stock basis. Through November 17, 2017 (the closing date of our IPO), no dividends were declared or paid on the Preferred Stock.
(d) Redemption Feature
The holders of Preferred Stock did not have any right to demand redemption. However, in the event of a Deemed Liquidation Event, under certain circumstances and subject to certain requirements, the holders of Preferred Stock could have demanded redemption of shares of Preferred Stock out of assets legally available for distribution in an amount per share equal to the original issue price applicable to such Preferred Stock.
(e) Liquidation Preferences
In the event of any liquidation, dissolution, winding up of the Company, or Deemed Liquidation Event either voluntary or involuntary, the holders of outstanding shares of Preferred Stock were entitled to receive, prior to and in preference to any payment made to holders of Common Stock, the greater of (1) an amount equal to the original issue price applicable to such share of Preferred Stock, plus any declared and unpaid dividends thereon or (2) an amount per share as would have been payable had all shares of Preferred Stock been converted into Common Stock immediately prior to such liquidation, dissolution, winding up, or Deemed Liquidation Event.
If upon any such liquidation, dissolution, or winding up of the Company, or Deemed Liquidation Event, the Company’s assets available for distribution were insufficient to pay the Preferred stockholders the full amount to which they are entitled, they would have shared ratably in any distribution of assets in proportion to the respective amounts that would otherwise be payable in full.
(11) Stock Awards
In 2012, we created the 2012 Equity Incentive Plan (the “2012 Plan”), and in 2017, we created the 2017 Equity Incentive Plan (the “2017 Plan”). The 2012 Plan terminated upon the effectiveness of the 2017 Plan. However, any outstanding stock awards will continue to be governed by their existing terms.
94
The following table summarizes remaining shares available for grant under the 2012 Plan and the 2017 Plan as of December 31, 2016 and December 31, 2017:
|
|
|
As of December 31, |
||||
|
|
|
2017 |
|
2016 |
||
|
Stock awards available for grant under the 2012 Plan |
|
|
- |
|
|
2.6 million |
|
Stock awards available for grant under the 2017 Plan |
|
|
3.5 million |
|
|
- |
The 2012 Plan allowed and the 2017 Plan allows granting of stock options at an exercise price not less than 100% of the fair value of Common Stock on the date of grant.
Options expire no more than ten years from the grant date and generally vest over four years under one of the following vesting schedules:
|
· |
25% vesting on the first-year anniversary and the remaining 75% vesting in equal monthly installments thereafter |
|
· |
1/24th vesting monthly beginning on the two-year anniversary |
|
· |
1/12th vesting monthly beginning on the three-year anniversary |
The following table summarizes our stock option activity:
|
|
|
|
|
|
|
|
|
Weighted |
|
|
|||
|
|
|
|
|
|
|
|
|
Average |
|
|
|||
|
|
|
|
|
Weighted |
|
Weighted |
|
Remaining |
|
Aggregated |
|||
|
|
|
|
|
Average |
|
Average |
|
Contractual |
|
Intrinsic |
|||
|
|
|
Stock |
|
Exercise |
|
Grant Date |
|
Life |
|
Value |
|||
|
|
|
Options |
|
Price |
|
Fair Value |
|
(In Years) |
|
(In Thousands) |
|||
|
Outstanding January 1, 2016 |
|
8,158,243 |
|
$ |
1.73 |
|
$ |
0.81 |
|
|
|
|
|
|
Granted |
|
1,873,222 |
|
$ |
3.89 |
|
$ |
1.72 |
|
|
|
|
|
|
Exercised |
|
(157,237) |
|
$ |
1.14 |
|
$ |
0.58 |
|
|
|
$ |
441 |
|
Forfeited |
|
(538,830) |
|
$ |
2.07 |
|
$ |
0.96 |
|
|
|
|
|
|
Outstanding December 31, 2016 |
|
9,335,398 |
|
$ |
2.15 |
|
$ |
0.99 |
|
8.0 |
|
$ |
21,663 |
|
Vested and exercisable December 31, 2016 |
|
4,399,724 |
|
$ |
1.48 |
|
$ |
0.71 |
|
7.1 |
|
$ |
13,158 |
|
|
|
|
|
|
|
|
|
|
|
|
|
|
|
|
Outstanding January 1, 2017 |
|
9,335,398 |
|
$ |
2.15 |
|
$ |
0.99 |
|
|
|
|
|
|
Granted |
|
3,751,939 |
|
$ |
10.86 |
|
$ |
5.70 |
|
|
|
|
|
|
Exercised |
|
(474,049) |
|
$ |
1.15 |
|
$ |
0.58 |
|
|
|
$ |
3,591 |
|
Forfeited |
|
(395,567) |
|
$ |
4.33 |
|
$ |
2.20 |
|
|
|
|
|
|
Outstanding December 31, 2017 |
|
12,217,721 |
|
$ |
4.79 |
|
$ |
2.41 |
|
7.8 |
|
$ |
234,284 |
|
Vested and exercisable December 31, 2017 |
|
5,937,234 |
|
$ |
1.88 |
|
$ |
0.88 |
|
6.6 |
|
$ |
131,182 |
During the year ended December 31, 2015, the aggregate intrinsic value of options exercised was $3.8 million.
The following table summarizes the total fair value of options that vested during each period:
|
|
|
For the Year Ended December 31, |
|||||||
|
|
|
2017 |
|
2016 |
|
2015 |
|||
|
|
|
(In thousands) |
|||||||
|
Fair value of shares vested |
|
$ |
2,436 |
|
$ |
1,787 |
|
$ |
1,231 |
95
The following table summarizes information about stock options outstanding and exercisable as of December 31, 2017:
|
|
|
Options Outstanding |
|
Options Exercisable |
||||||||||
|
|
|
|
|
Weighted |
|
|
|
|
|
Weighted |
|
|
||
|
|
|
|
|
Average |
|
Weighted |
|
|
|
Average |
|
Weighted |
||
|
Grant |
|
Number of |
|
Remaining |
|
Average |
|
Number of |
|
Remaining |
|
Average |
||
|
(Strike) |
|
Options |
|
Contractual Life |
|
Exercise |
|
Options |
|
Contractual Life |
|
Exercise |
||
|
Price |
|
Outstanding |
|
(In Years) |
|
Price |
|
Exercisable |
|
(In Years) |
|
Price |
||
|
$0.01 - $1.50 |
|
2,196,864 |
|
5.2 |
|
$ |
0.99 |
|
2,141,436 |
|
|
|
|
|
|
$1.51 - $2.00 |
|
1,797,816 |
|
6.8 |
|
$ |
1.83 |
|
1,489,853 |
|
|
|
|
|
|
$2.01 - $2.50 |
|
2,912,435 |
|
7.6 |
|
$ |
2.31 |
|
1,700,149 |
|
|
|
|
|
|
$2.51 - $5.00 |
|
1,998,636 |
|
8.7 |
|
$ |
4.00 |
|
587,613 |
|
|
|
|
|
|
$5.01 - $6.00 |
|
488,139 |
|
9.3 |
|
$ |
5.48 |
|
5,863 |
|
|
|
|
|
|
$6.01 - $8.00 |
|
275,147 |
|
9.4 |
|
$ |
7.58 |
|
12,320 |
|
|
|
|
|
|
$8.01 - $10.00 |
|
- |
|
- |
|
$ |
- |
|
- |
|
|
|
|
|
|
$10.01 - $13.00 |
|
2,267,818 |
|
9.6 |
|
$ |
12.18 |
|
- |
|
|
|
|
|
|
$13.01 - $21.36 |
|
280,866 |
|
9.9 |
|
$ |
21.36 |
|
- |
|
|
|
|
|
|
|
|
12,217,721 |
|
7.8 |
|
$ |
4.79 |
|
5,937,234 |
|
6.6 |
|
$ |
1.88 |
The Plan also allows for the issuance of restricted stock units. The following table summarizes our restricted stock unit activity:
|
|
|
|
|
Weighted |
|
|
|
|
Restricted |
|
Average |
|
|
|
|
Stock |
|
Grant Date |
|
|
|
|
Units |
|
Fair Value |
|
|
Outstanding at January 1, 2016 |
|
617,455 |
|
$ |
1.83 |
|
Granted |
|
- |
|
$ |
- |
|
Vested |
|
- |
|
$ |
- |
|
Forfeited |
|
- |
|
$ |
- |
|
Outstanding at December 31, 2016 |
|
617,455 |
|
$ |
1.83 |
|
|
|
|
|
|
|
|
Outstanding at January 1, 2017 |
|
617,455 |
|
$ |
1.83 |
|
Granted |
|
39,399 |
|
$ |
13.75 |
|
Vested |
|
- |
|
$ |
- |
|
Forfeited |
|
- |
|
$ |
- |
|
Outstanding at December 31, 2017 |
|
656,854 |
|
$ |
2.54 |
96
For all periods presented, we computed the fair value of options granted using the Black-Scholes option pricing model. The model requires estimates and assumptions, including:
|
Estimate or Assumption |
Criteria |
|
The fair value of our Common Stock |
Subsequent to our IPO in November 2017, we obtain the fair value of our Common Stock from the public market. Prior to our IPO, there was no public trading market for our Common or Preferred Stock. As a result, our Board considered an independent third-party valuation of our Common Stock and whether any new material information after the date of such valuation had materially affected the fair value of our Common Stock. |
|
Risk-free interest rates |
The risk-free interest rate is based on the U.S. Treasury yield for treasury securities with maturities that align closely with the timing of the average remaining expected life of the option. |
|
Volatility |
We estimate a volatility factor utilizing an average of the stock volatility of peer companies. |
|
Expected dividend yield |
Because we have never declared or paid a dividend and do not expect to do so in the foreseeable future, we assume a dividend yield of zero. |
|
Expected option life |
Given our limited history, we applied the simplified method (the average of the period from vesting to expiration) to determine the expected option life. |
The use of different estimates and assumptions could cause significant adjustments to the valuation.
The following table summarizes the estimates and assumptions used and the resulting weighted average grant date fair value of the options granted:
|
|
|
For the Year Ended December 31, |
|||||||
|
|
|
2017 |
|
2016 |
|
2015 |
|||
|
Fair value of Common Stock |
|
|
$4.47 - $21.36 |
|
|
$2.74 - $4.19 |
|
|
$2.07 - $2.41 |
|
Risk-free interest rate |
|
|
1.8% - 2.2% |
|
|
1.2% - 1.6% |
|
|
1.5% - 2.0% |
|
Expected life |
|
|
6.2 years |
|
|
6.1 years |
|
|
6.0 years |
|
Expected dividend yield |
|
|
- |
|
|
- |
|
|
- |
|
Expected volatility |
|
|
46.5% - 54.0% |
|
|
45.2% - 46.6% |
|
|
44.8% - 48.2% |
|
Weighted average grant date fair value of the options granted |
|
|
$5.70 |
|
|
$1.72 |
|
|
$1.02 |
97
We recognize stock-based compensation cost net of estimated forfeitures on a straight‑line basis over the requisite service period for the entire award. Estimated forfeitures are based on historical experience and future expectations. We allocate stock-based compensation to the same expense categories as the base compensation for such employees. We recognized the following stock-based compensation expense for options and RSUs:
|
|
|
For the Year Ended December 31, |
|||||||
|
|
|
2017 |
|
2016 |
|
2015 |
|||
|
|
|
(In thousands) |
|||||||
|
Cost of revenue |
|
$ |
474 |
|
$ |
131 |
|
$ |
97 |
|
Research and development |
|
|
1,294 |
|
|
552 |
|
|
379 |
|
Selling and marketing |
|
|
899 |
|
|
402 |
|
|
193 |
|
General and administrative |
|
|
2,313 |
|
|
814 |
|
|
706 |
|
Stock-based compensation |
|
$ |
4,980 |
|
$ |
1,899 |
|
$ |
1,375 |
The following table summarizes our unrecognized compensation cost (net of expected forfeitures):
|
|
|
As of December 31, |
|
|
|
|
2017 |
|
|
Unrecognized compensation cost (in thousands) |
|
$ |
17,466 |
|
Expected annual forfeiture rate |
|
|
12.3% |
|
Weighted average remaining vesting period |
|
|
3.2 years |
(12) Redeemable Preferred Stock Warrant Liability
Prior to our IPO in November 2017, a third party held a warrant to purchase 54,269 shares of our redeemable convertible preferred stock at $2.76 per share. Upon the closing of our IPO, the warrant became exercisable for 54,269 shares of our Common Stock at an exercise price of $2.76 per share. Immediately following the closing of our IPO, the holder elected a cashless exercise, which resulted in the issuance of 44,894 shares of Common Stock.
Prior to the holder’s exercise, we reported the warrant on the consolidated balance sheet as a liability at its estimated fair value. We reflected adjustments to the fair value in “adjustments to redeemable preferred stock warrant liability” on the consolidated statements of operations. The following table summarizes our redeemable preferred stock warrant liability:
|
|
|
Redeemable Preferred |
|
|
|
|
Stock Warrant Liability |
|
|
|
|
(Level 3 Measurement) |
|
|
|
|
(In thousands) |
|
|
Balance as of January 1, 2015 |
|
$ |
96 |
|
Fair value adjustment |
|
|
19 |
|
Balance as of December 31, 2015 |
|
|
115 |
|
Fair value adjustment |
|
|
86 |
|
Balance as of December 31, 2016 |
|
|
201 |
|
Fair value adjustment |
|
|
667 |
|
Redemption and exercise of the warrant |
|
|
(868) |
|
Balance as of December 31, 2017 |
|
$ |
- |
98
Prior to our IPO, there was no public trading market for our Common Stock, Preferred Stock, or warrant. We computed the fair value of the warrant using the Black-Scholes option pricing model, which requires certain estimates and assumptions. The use of different estimates and assumptions could cause significant changes to fair value. We estimated volatility utilizing an average of the stock volatility of peer companies. The risk-free interest rates were based on U.S. Treasury yields for treasury securities of similar maturity. The following table summarizes the estimates and assumptions:
|
|
|
For the Year Ended December 31, |
||
|
|
|
2016 |
|
2015 |
|
Risk-free interest rate |
|
0.7% |
|
1.1% |
|
Expected life |
|
Remaining contractual term |
|
Remaining contractual term |
|
Expected dividend yield |
|
- |
|
- |
|
Expected volatility |
|
63.2% |
|
63.1% |
(13) Net Loss Per Share Attributed to Common Stockholders
We calculate our basic and diluted net loss per share attributable to common stockholders in conformity with the two-class method, which is required for companies with participating securities. We exclude all potentially dilutive securities, which include the following “common stock equivalents”:
|
· |
Redeemable convertible preferred stock (considered a participating security) |
|
· |
Redeemable convertible preferred stock warrant |
|
· |
Options to purchase common stock |
|
· |
Restricted stock units |
The two-class method requires the following:
|
Periods when we have net loss |
|
We calculate both basic and diluted net loss per common share by dividing net loss by the weighted average number of common shares outstanding during the period. |
|
|
|
Common stock equivalents are not considered because their effect is antidilutive. |
|
Periods when we have net income |
|
Basic net income per share |
|
|
|
We calculate basic net income per share by dividing the net income attributable to the common stockholder by the weighted average number of common shares outstanding during the period. |
|
|
|
Diluted net income per share |
|
We calculate diluted net income per share by dividing net income attributable to the common stockholder by the weighted average number of common shares and common stock equivalents outstanding during the period. The potential dilution from stock awards is accounted for using the treasury stock method. |
99
The following table summarizes our net loss per share:
|
|
|
For the Year Ended December 31, |
|||||||
|
|
|
2017 |
|
2016 |
|
2015 |
|||
|
|
|
(In thousands, except per share amounts) |
|||||||
|
Net loss |
|
$ |
(6,253) |
|
$ |
(3,908) |
|
$ |
(5,854) |
|
Weighted average common shares outstanding |
|
|
8,499 |
|
|
7,521 |
|
|
7,091 |
|
Net loss attributable to common stockholders |
|
$ |
(0.74) |
|
$ |
(0.52) |
|
$ |
(0.83) |
In connection with the closing of our IPO in November 2017, all outstanding shares of Preferred Stock converted into Common Stock at a one to one ratio and the redeemable preferred stock warrant became exercisable for shares of Common Stock. The following common stock equivalents were excluded from the computation of diluted net loss per share for the periods presented because their effect would have been anti-dilutive.
|
|
|
For the Year Ended December 31, |
|||||||
|
|
|
2017 |
|
2016 |
|
2015 |
|||
|
|
|
(In thousands) |
|||||||
|
Stock options |
|
|
12,218 |
|
|
9,335 |
|
|
8,158 |
|
Restricted stock units |
|
|
657 |
|
|
617 |
|
|
617 |
|
Redeemable convertible preferred stock, Series A |
|
|
- |
|
|
3,227 |
|
|
3,227 |
|
Redeemable convertible preferred stock, Series A-1 |
|
|
- |
|
|
7,531 |
|
|
7,531 |
|
Redeemable convertible preferred stock, Series B |
|
|
- |
|
|
7,838 |
|
|
7,838 |
|
Redeemable convertible preferred stock, Series C |
|
|
- |
|
|
3,610 |
|
|
3,610 |
|
Redeemable convertible preferred stock, Series D |
|
|
- |
|
|
2,329 |
|
|
- |
|
Redeemable preferred stock warrant |
|
|
- |
|
|
54 |
|
|
54 |
|
|
|
|
12,875 |
|
|
34,541 |
|
|
31,035 |
(14) Segment and Geographic Information
Our Chief Executive Officer and Chief Financial Officer / Chief Operating Officer are the chief operating decision makers. They regularly review financial information presented on a consolidated basis for the purposes of allocating resources and evaluating performance. Accordingly, we determined that we currently operate in one reportable business segment.
Substantially all of our assets are located in the United States. We consider all revenue derived from customers with a U.S. billing address as U.S. revenue. All other revenue is considered international revenue.
The following table summarizes revenue by geographic area:
|
|
|
For the Year Ended December 31, |
|||||||
|
|
|
2017 |
|
2016 |
|
2015 |
|||
|
|
|
(In thousands) |
|||||||
|
United States |
|
$ |
69,955 |
|
$ |
50,361 |
|
$ |
36,754 |
|
International |
|
|
41,933 |
|
|
29,568 |
|
|
21,722 |
|
Total revenue |
|
$ |
111,888 |
|
$ |
79,929 |
|
$ |
58,476 |
100
(15) Income Taxes
The following table presents domestic and foreign components of loss before income taxes:
|
|
|
|
For the Year Ended December 31, |
||||||
|
|
|
2017 |
|
2016 |
|
2015 |
|||
|
|
|
(In thousands) |
|||||||
|
United States |
|
$ |
(6,292) |
|
$ |
(3,918) |
|
$ |
(5,868) |
|
International |
|
|
39 |
|
|
10 |
|
|
14 |
|
Total net loss before provision for income taxes |
|
$ |
(6,253) |
|
$ |
(3,908) |
|
$ |
(5,854) |
For all periods presented, we recorded no expense for either current or deferred taxes in any jurisdiction. The following table presents a reconciliation of the statutory federal tax rate and our effective tax rate
|
|
|
|
For the Year Ended December 31, |
||||||
|
|
|
2017 |
|
2016 |
|
2015 |
|||
|
|
|
(In thousands) |
|||||||
|
Tax benefit at federal statutory rate |
|
|
34% |
|
|
34% |
|
|
34% |
|
State tax, net of federal benefit |
|
|
4% |
|
|
4% |
|
|
4% |
|
Stock-based compensation |
|
|
(18%) |
|
|
(6%) |
|
|
(6%) |
|
Rate change and rate differences |
|
|
1% |
|
|
(1%) |
|
|
(4%) |
|
Change in valuation allowance |
|
|
68% |
|
|
(25%) |
|
|
(24%) |
|
Change in rate * |
|
|
(74%) |
|
|
- |
|
|
- |
|
Deferred financing costs |
|
|
(6%) |
|
|
- |
|
|
- |
|
Meals and entertainment expenses |
|
|
(4%) |
|
|
(7%) |
|
|
(4%) |
|
Merger and acquisition expenses |
|
|
(5%) |
|
|
- |
|
|
- |
|
Other |
|
|
- |
|
|
1% |
|
|
- |
|
Effective tax rate |
|
|
- |
|
|
- |
|
|
- |
* On December 22, 2017, and effective January 1, 2018, the U.S. government enacted H.R. 1, “An Act to provide for reconciliation pursuant to titles II and V of the concurrent resolution on the budget for fiscal year 2018” (informally titled the “Tax Cuts and Jobs Act”). The Tax Cuts and Jobs Act reduces the corporate tax rate from a top marginal rate of 35% to a flat rate of 21% beginning in 2018. The corresponding impact to our deferred corporate tax rate for 2017 is the lowering of the deferred corporate tax rate from 38% to 26%.
The following table presents the significant components of our deferred tax assets and liabilities:
|
|
|
As of December 31, |
||||
|
|
|
2017 |
|
2016 |
||
|
|
|
(In thousands) |
||||
|
Deferred tax assets: |
|
|
|
|
|
|
|
Net operating loss carry forwards |
|
$ |
9,643 |
|
$ |
12,863 |
|
Deferred rent |
|
|
2,698 |
|
|
1,570 |
|
Stock-based compensation |
|
|
1,005 |
|
|
690 |
|
Accrued and prepaid expenses |
|
|
572 |
|
|
862 |
|
Miscellaneous |
|
|
39 |
|
|
42 |
|
Gross deferred tax assets |
|
|
13,957 |
|
|
16,027 |
|
Valuation allowance |
|
|
(9,936) |
|
|
(13,951) |
|
Net deferred tax assets |
|
|
4,021 |
|
|
2,076 |
|
Deferred tax liabilities: |
|
|
|
|
|
|
|
Property and equipment |
|
|
(4,021) |
|
|
(2,076) |
|
Net deferred tax assets |
|
$ |
- |
|
$ |
- |
101
For federal income tax purposes, we had the following net operating loss (“NOL”) carryforwards, which will begin to expire in 2029:
|
|
|
As of December 31, |
||||
|
|
|
2017 |
|
2016 |
||
|
|
|
(In thousands) |
||||
|
NOL carryforwards |
|
$ |
37,105 |
|
$ |
33,890 |
A limitation may apply to the use of the NOL and credit carryforwards, under section 382 of the Internal Revenue Code of 1986, as amended (“Section 382”), and similar state tax provisions that are applicable if we experience an “ownership change.” An ownership change may occur, for example, as a result of issuance of new equity. Should these limitations apply, the carryforwards would be subject to an annual limitation, resulting in a potential reduction in the gross deferred tax assets before considering the valuation allowance.
As of December 31, 2017, we had not completed a Section 382 limitation study, and postponed the completion of our prior study, due to a significant level of legacy ownership both before and after our IPO. We will continue to monitor and assess our significant ownership interests. Future changes in our stock ownership, some of which are outside of our control, could also result in an ownership change under Section 382 of the Code. A limitation in the carryforwards would decrease the carrying amount of the gross amount of the NOL carryforwards, with a corresponding decrease in the valuation allowance recorded against these gross deferred tax assets.
Accounting for deferred taxes involves the evaluation of a number of factors concerning the realizability of our net deferred tax assets. We primarily considered such factors as our history of operating losses, the nature of our deferred tax assets, and the timing, likelihood, and amount, if any, of future taxable income during the periods in which those temporary differences and carryforwards become deductible. At present, we do not believe that it is more likely than not that the net deferred tax assets will be realized, accordingly, we established a full valuation allowance.
The following table summarizes changes in our valuation allowance:
|
|
|
For the Year Ended December 31, |
|||||||
|
|
|
2017 |
|
2016 |
|
2015 |
|||
|
|
|
(In thousands) |
|||||||
|
Increases (decreases) in the valuation allowance |
|
$ |
(4,015) |
|
$ |
975 |
|
$ |
1,421 |
We attribute net revenue, costs, and expenses to domestic and foreign components based on the terms of agreements with our subsidiaries. Prior to 2017, we did not provide for federal income taxes on the undistributed earnings of our foreign subsidiaries, as such earnings are to be reinvested offshore indefinitely. The Tax Cuts and Jobs Act (“the Act”) requires recognition of certain previously undistributed earnings of foreign subsidiaries for the year ended December 31, 2017. Based upon the Act, the Company recognized foreign earnings of $0.08 million and corresponding U.S. tax liability is insignificant. The accounting for the income tax effects of the Act are complete.
Currently, we do not have any uncertain tax positions. We do not anticipate any significant changes within twelve months of December 31, 2017 in uncertain tax positions that would be material to the consolidated financial statements taken as a whole.
We file U.S. federal income tax returns as well as income tax returns in many U.S. states and the United Kingdom. The following tax years remain open to examination by the major jurisdictions in which we are subject to tax:
|
|
|
As of December 31, |
||||
|
|
|
2017 |
|
2016 |
||
|
Tax years that remain open |
|
|
2013 through 2016 |
|
|
2012 through 2015 |
102
(16) Commitments and Contingencies
Commitments
The following table summarizes commitments on contracts at December 31, 2017 that meet the following criteria:
|
· |
enforceable; |
|
· |
legally binding; and |
|
· |
specify all significant terms, including fixed or minimum services to be used, fixed, minimum, or variable price provisions, and the approximate timing of the actions under the contracts. |
The table excludes obligations under agreements that we can cancel without a significant penalty.
|
|
|
Payments due by Period |
|||||||||||||||||||
|
|
|
2018 |
|
2019 |
|
2020 |
|
2021 |
|
2022 |
|
Thereafter |
|
Total |
|||||||
|
|
|
(In thousands) |
|||||||||||||||||||
|
Operating lease obligations |
|
$ |
3,921 |
|
$ |
4,882 |
|
$ |
4,939 |
|
$ |
5,068 |
|
$ |
5,201 |
|
$ |
16,467 |
|
$ |
40,478 |
|
Capital lease obligations |
|
|
6,110 |
|
|
5,194 |
|
|
4,390 |
|
|
1,511 |
|
|
- |
|
|
- |
|
|
17,205 |
|
Purchase obligations and interest on capital lease obligations |
|
|
6,576 |
|
|
5,751 |
|
|
5,723 |
|
|
9,017 |
|
|
4,625 |
|
|
- |
|
|
31,692 |
|
Total |
|
$ |
16,607 |
|
$ |
15,827 |
|
$ |
15,052 |
|
$ |
15,596 |
|
$ |
9,826 |
|
$ |
16,467 |
|
$ |
89,375 |
Leasing Arrangements
When lease agreements contain escalating rent clauses, free rent periods, or incentives such as tenant improvement allowances, we record rent expense on a straight-line basis over the life of the lease. We base rent expense on the total cash payable to the lessor over the lease term less any incentives.
We record tenant improvements in property and equipment, and the allowance is recorded as deferred rent on the consolidated balance sheets. We record the difference between the rent paid and the straight-line rent expense as deferred rent.
The following table summarizes recently executed facility lease agreements. The Redwood City, California and Irvine, California lease agreements will replace our existing office space in those general locations.
|
Location |
|
Lease |
|
Possession |
|
Expiration |
|
Tenant |
|
|
|
|
|
|
|
|
|
|
(In thousands) |
|
|
Denver, Colorado |
|
March and July 2016 |
|
June 2016 to May 2017 |
|
April 2024 |
|
$ |
6,373 |
|
Redwood City, California |
|
March 2017 |
|
October 2017 |
|
February 2029 |
|
$ |
910 |
|
Irvine, California |
|
May 2017 |
|
November 2017 |
|
January 2025 |
|
$ |
1,621 |
We allocate rent expense to departments based on space occupied. The following table summarizes our rent expense:
|
|
|
For the Year Ended December 31, |
|||||||
|
2017 |
2016 |
2015 |
|||||||
|
|
|
(In thousands) |
|||||||
|
Rent expense |
|
$ |
2,994 |
|
$ |
2,388 |
|
$ |
1,726 |
103
General and administrative expense includes the following costs related to facility closures and relocation:
|
For the Year Ended December 31, |
|||||||||
|
|
|
2017 |
|
2016 |
|
2015 |
|||
|
|
|
(In thousands) |
|||||||
|
Facility closure costs |
|
$ |
1,158 |
|
$ |
384 |
|
$ |
- |
As of December 31, 2017, we had unused letters of credit totaling $2.6 million, which relate to our Denver and Redwood City leases.
Sales and Use Tax
We conduct operations in many tax jurisdictions throughout the United States. In many of these jurisdictions, non-income-based taxes, such as sales and use taxes are assessed on our operations. Historically, we have not billed or collected these taxes. We record a provision for such tax exposure when it is both probable that a liability has been incurred and the amount of the exposure can be reasonably estimated. The liability is recorded in “accounts payable and accrued liabilities” and “other long-term liabilities” on the consolidated balance sheets. These estimates include several key assumptions including, but not limited to, the taxability of our services, the jurisdictions in which we believe we have nexus, and the sourcing of revenues to those jurisdictions. In the event these jurisdictions challenge our assumptions and analysis, the actual exposure could differ materially from the current estimates.
The following table summarizes the sales tax, interest, and penalty recorded:
|
|
|
For the Year Ended December 31, |
|||||||
|
|
|
2017 |
|
2016 |
|
2015 |
|||
|
|
|
(In thousands) |
|||||||
|
Sales tax |
|
$ |
758 |
|
$ |
437 |
|
$ |
299 |
|
Interest |
|
|
86 |
|
|
24 |
|
|
15 |
|
Penalties |
|
|
122 |
|
|
59 |
|
|
36 |
|
|
|
$ |
966 |
|
$ |
520 |
|
$ |
350 |
Indemnification
Our arrangements with customers generally include an indemnification provision that we will indemnify and defend a customer in actions that claim our services infringe upon a valid patent, copyright, or trademark. Historically, we have not incurred any costs related to indemnification claims and do not expect to incur such costs. Accordingly, we do not maintain a reserve for such exposure.
Other
From time to time, we are subject to various legal proceedings and claims that arise in the ordinary course of business, including, among other things, regulatory matters and disputes with customers and vendors. In our opinion, the amount of ultimate liability with respect to any of these actions is unlikely to materially affect our financial condition, results of operations or liquidity.
(17) Advertising Cost
We expense advertising costs as incurred and include in selling and marketing expenses on the consolidated statements of operations. The following table summarizes our advertising costs:
|
|
|
For the Year Ended December 31, |
|
|||||||
|
|
|
2017 |
|
2016 |
|
2015 |
|
|||
|
|
|
(In thousands) |
|
|||||||
|
Advertising costs |
|
$ |
6,884 |
|
$ |
4,485 |
|
$ |
1,845 |
|
104
(18) Expense Associated with Defined Contribution Benefit Plans
We sponsor a defined contribution plan (“the 401(k) Plan), which permits participants to make contributions through salary deductions pursuant to section 401(k) of the Internal Revenue Code. All employees who are at least 18 years of age are generally eligible to participate.
Participating employees can contribute up to the lesser of (i) 90% of annual compensation or (ii) the maximum annual amount allowed under the Internal Revenue Code. Participating employees can elect that a portion or all of the deferral contributions are Roth contributions that are includable in the participants’ gross income at the time deferred. The combined elective deferrals between traditional pre-tax and designated Roth contributions cannot exceed the maximum annual amount allowed under the Internal Revenue Code.
Unless an eligible employee affirmatively elects otherwise, we reduce compensation by 4%, and make pre-tax deferral contributions in such amount on the employee’s behalf. The 401(k) Plan provides for us, at our discretion, to make pretax matching contributions based on a percentage of each participant’s eligible compensation, as determined annually by management. The following table summarizes expense associated with matching contributions:
|
|
|
For the Year Ended December 31, |
|||||||
|
|
|
2017 |
|
2016 |
|
2015 |
|||
|
|
|
(In thousands) |
|||||||
|
Expense associated with matching contributions |
|
$ |
1,723 |
|
$ |
1,286 |
|
$ |
1,019 |
(19) Quarterly Information
Our quarterly results of operations are summarized as follows (unaudited):
|
|
|
For the Three Months Ended |
||||||||||
|
|
|
Mar. 31 |
|
Jun. 30 |
|
Sep. 30 |
|
Dec. 31 |
||||
|
|
|
(Unaudited - In thousands) |
||||||||||
|
Year ended December 31, 2017 |
|
|
|
|
|
|
|
|
|
|
|
|
|
Revenue |
|
$ |
24,831 |
|
$ |
27,012 |
|
$ |
28,316 |
|
$ |
31,729 |
|
Loss from operations |
|
$ |
(1,796) |
|
$ |
(767) |
|
$ |
(1,649) |
|
$ |
(1,358) |
|
Net loss |
|
$ |
(1,801) |
|
$ |
(1,333) |
|
$ |
(1,593) |
|
$ |
(1,526) |
|
|
|
|
|
|
|
|
|
|
|
|
|
|
|
|
|
|
|
|
|
|
|
|
|
|
|
|
|
Year ended December 31, 2016 |
|
|
|
|
|
|
|
|
|
|
|
|
|
Revenue |
|
$ |
17,125 |
|
$ |
19,032 |
|
$ |
20,701 |
|
$ |
23,071 |
|
Income (loss) from operations |
|
$ |
(1,826) |
|
$ |
(1,443) |
|
$ |
71 |
|
$ |
(403) |
|
Net loss |
|
$ |
(1,879) |
|
$ |
(1,602) |
|
$ |
(2) |
|
$ |
(425) |
|
|
|
|
|
|
|
|
|
|
|
|
|
|
|
|
|
|
|
|
|
|
|
|
|
|
|
|
|
Year ended December 31, 2015 |
|
|
|
|
|
|
|
|
|
|
|
|
|
Revenue |
|
$ |
12,885 |
|
$ |
14,146 |
|
$ |
14,985 |
|
$ |
16,460 |
|
Loss from operations |
|
$ |
(1,800) |
|
$ |
(1,323) |
|
$ |
(1,180) |
|
$ |
(1,356) |
|
Net loss |
|
$ |
(1,840) |
|
$ |
(1,357) |
|
$ |
(1,232) |
|
$ |
(1,425) |
105
Item 9. Changes in and Disagreements with Accountants on Accounting and Financial Disclosure
None
Item 9A.Controls and Procedures
Evaluation of Disclosure Controls and Procedures
Our management, with the participation of our principal executive officer and principal financial officer, has evaluated the effectiveness of our disclosure controls and procedures (as defined in Rules 13a-15(e) and 15d-15(e) under the Exchange Act as of the end of the period covered by this Annual Report on Form 10-K. Based on such evaluation, our principal executive officer and principal financial officer have concluded that as of such date, our disclosure controls and procedures were effective.
Management’s Annual Report on Internal Control Over Financial Reporting
This Annual Report on Form 10-K does not include a report of management’s assessment regarding internal control over financial reporting or an attestation report of our registered public accounting firm as permitted in this transition period under the rules of the SEC for newly public companies.
Changes in Internal Control
There were no changes in our internal control over financial reporting in connection with the evaluation required by Rules 13a-15(d) and 15d-15(d) of the Exchange Act that occurred during the Company’s fourth fiscal quarter for the fiscal year ended December 31, 2017 that materially affected, or are reasonably likely to materially affect, our internal control over financial reporting.
Inherent Limitations on Effectiveness of Controls
Our management, including our principal executive officer and principal financial officer, does not expect that our disclosure controls and procedures or our internal control over financial reporting will prevent or detect all errors and all fraud. A control system, no matter how well conceived and operated, can provide only reasonable, not absolute, assurance that the objectives of the control system are met. Because of the inherent limitations in all control systems, no evaluation of controls can provide absolute assurance that all control issues and instances of fraud, if any, have been detected. The design of any system of controls also is based in part upon certain assumptions about the likelihood of future events, and there can be no assurance that any design will succeed in achieving its stated goals under all potential future conditions. Over time, controls may become inadequate because of changes in conditions, or the degree of compliance with the policies or procedures may deteriorate. Because of the inherent limitations in a cost-effective control system, misstatements due to error or fraud may occur and not be detected.
We will hold our first annual meeting of stockholders as a public company on May 31, 2018 at 10:00 a.m. Mountain Time. The record date for the meeting is April 2, 2018.
106
Item 10.Directors, Executive Officers, and Corporate Governance
The information required by this Item is incorporated by reference from our proxy statement relating to our 2018 Annual Meeting of Stockholders. The proxy statement will be filed with the SEC within 120 days of the fiscal year ended December 31, 2017.
Code of Conduct
We have adopted a Code of Conduct that applies to all of our employees, officers (including our principal executive officer, principal financial officer and principal accounting officer or controller, or persons performing similar functions), agents and representatives, including directors and consultants. The full text of our Code of Conduct is available on our website at https://investors.sendgrid.com/governance/governance-documents. We intend to disclose future amendments to certain provisions of our Code of Conduct, or waivers of such provisions, applicable to any principal executive officer, principal financial officer, principal accounting officer or controller, or persons performing similar functions, and our directors, on our website identified above.
Item 11.Executive Compensation
The information required by this Item is incorporated by reference from our proxy statement relating to our 2018 Annual Meeting of Stockholders. The proxy statement will be filed with the SEC within 120 days of the fiscal year ended December 31, 2017.
Item 12.Security Ownership of Certain Beneficial Owners and Management and Related Stockholder Matters
The information required by this Item is incorporated by reference from our proxy statement relating to our 2018 Annual Meeting of Stockholders. The proxy statement will be filed with the SEC within 120 days of the fiscal year ended December 31, 2017.
Item 13.Certain Relationships and Related Transactions and Director Independence
The information required by this Item is incorporated by reference from our proxy statement relating to our 2018 Annual Meeting of Stockholders. The proxy statement will be filed with the SEC within 120 days of the fiscal year ended December 31, 2017.
Item 14.Principal Accountant Fees and Services
The information required by this Item is incorporated by reference from our proxy statement relating to our 2018 Annual Meeting of Stockholders. The proxy statement will be filed with the SEC within 120 days of the fiscal year ended December 31, 2017.
Item 15.Exhibits, Financial Statement Schedules
The following documents are filed as part of this report:
Financial Statements
See Index to Financial Statements at Item 8 herein.
Financial Statement Schedules
Schedules have been omitted because they are not required, not applicable, or the required information is otherwise included.
107
EXHIBIT INDEX
|
Incorporated by Reference |
||||||||||||
|
Exhibit |
Exhibit Description |
Form |
File No. |
Exhibit |
Filing |
Filed |
||||||
|
3.1 |
X |
|||||||||||
|
3.2 |
X |
|||||||||||
|
4.1 |
Reference is made to exhibits 3.1 and 3.2. |
|||||||||||
|
4.2 |
Specimen stock certificate evidencing shares of Common Stock. |
S‑1/A |
333‑221003 |
4.2 |
10/30/2017 |
|||||||
|
4.3 |
S‑1 |
333‑221003 |
4.3 |
10/18/2017 |
||||||||
|
10.1+ |
2009 Equity Incentive Plan of SendGrid, Inc., as amended to date. |
S‑1 |
333‑221003 |
10.1 |
10/18/2017 |
|||||||
|
10.1.1+ |
Form of Stock Option Agreement under 2009 Equity Incentive Plan of SendGrid, Inc. |
S‑1 |
333‑221003 |
10.1.1 |
10/18/2017 |
|||||||
|
10.2+ |
2012 Equity Incentive Plan of SendGrid, Inc., as amended to date. |
S‑1 |
333‑221003 |
10.2 |
10/18/2017 |
|||||||
|
10.2.1+ |
S‑1 |
333‑221003 |
10.2.1 |
10/18/2017 |
||||||||
|
10.2.2+ |
S-1 |
333‑221003 |
10.2.2 |
10/18/2017 |
||||||||
|
10.3+ |
S‑1/A |
333‑221003 |
10.3 |
10/30/2017 |
||||||||
|
10.3.1+ |
S‑1/A |
333‑221003 |
10.3.1 |
10/30/2017 |
||||||||
|
10.3.2+ |
S‑1/A |
333‑221003 |
10.3.2 |
10/30/2017 |
||||||||
|
10.4+ |
S‑1/A |
333‑221003 |
10.4 |
10/30/2017 |
||||||||
|
10.5+ |
Form of Indemnity Agreement between the Registrant and each of its directors and executive officers. |
S‑1 |
333‑221003 |
10.5 |
10/18/2017 |
|||||||
108
|
Incorporated by Reference |
||||||||||||
|
Exhibit |
Exhibit Description |
Form |
File No. |
Exhibit |
Filing |
Filed |
||||||
|
10.6+ |
S‑1 |
333‑221003 |
10.6 |
10/18/2017 |
||||||||
|
10.7+ |
S‑1 |
333‑221003 |
10.7 |
10/18/2017 |
||||||||
|
10.8+ |
S‑1 |
333‑221003 |
10.8 |
10/18/2017 |
||||||||
|
10.9+ |
8‑K |
001‑38275 |
10.1 |
2/5/2018 |
||||||||
|
10.10 |
S‑1 |
333‑221003 |
10.9 |
10/18/2017 |
||||||||
|
10.10.1 |
S‑1 |
333‑221003 |
10.9.1 |
10/18/2017 |
||||||||
|
10.10.2 |
Letter Agreement between BOP 1801 California Street LLC and Registrant dated April 4, 2017. |
S‑1 |
333‑221003 |
10.9.2 |
10/18/2017 |
|||||||
|
10.11 |
S‑1 |
333‑221003 |
10.10 |
10/18/2017 |
||||||||
|
10.11.1 |
S‑1 |
333‑221003 |
10.10.1 |
10/18/2017 |
||||||||
|
10.11.2 |
S‑1 |
333‑221003 |
10.10.2 |
10/18/2017 |
||||||||
|
10.11.3 |
S‑1 |
333‑221003 |
10.10.3 |
10/18/2017 |
||||||||
|
10.11.4 |
S‑1 |
333‑221003 |
10.10.4 |
10/18/2017 |
||||||||
|
10.11.5 |
S‑1 |
333‑221003 |
10.10.5 |
10/18/2017 |
||||||||
|
10.11.6 |
S‑1 |
333‑221003 |
10.10.6 |
10/18/2017 |
||||||||
109
110
|
Incorporated by Reference |
||||||||||||
|
Exhibit |
Exhibit Description |
Form |
File No. |
Exhibit |
Filing |
Filed |
||||||
|
32.1* |
X |
|||||||||||
|
32.2* |
X |
|||||||||||
+Indicates management contract or compensatory plan.
*This certification accompanies the Annual Report on Form 10-K to which it relates, is not deemed filed with the SEC and is not incorporated by reference into any filing of the Registrant under the Securities Act or the Exchange Act (whether made before or after the date of the Annual Report on Form 10-K), irrespective of any general incorporation language contained in such filing.
111
Pursuant to the requirements of Section 13 or 15(d) of the Securities Exchange Act of 1934, as amended, the registrant has duly caused this report to be signed on its behalf by the undersigned thereunto duly authorized.
|
|
SENDGRID, INC. |
||
|
|
|
||
|
|
By: |
/s/ Sameer Dholakia |
|
|
|
|
Sameer Dholakia |
|
|
|
|
President, Chief Executive Officer and Director |
|
POWER OF ATTORNEY
KNOW ALL PERSONS BY THESE PRESENTS that each individual whose signature appears below constitutes and appoints Sameer Dholakia, Yancey Spruill and Michael Tognetti, and each of them, his true and lawful attorneys-in-fact and agents with full power of substitution, for him and in his name, place, and stead, in any and all capacities, to sign any and all amendments to this Annual Report on Form 10-K, and to file the same, with all exhibits thereto and other documents in connection therewith, with the Securities and Exchange Commission, granting unto said attorneys-in-fact and agents, and each of them, full power and authority to do and perform each and every act and thing requisite and necessary to be done in and about the premises, as fully to all intents and purposes as he might or could do in person, hereby ratifying and confirming all that said attorneys-in-fact and agents or any of them, or his or their substitute or substitutes, may lawfully do or cause to be done or by virtue hereof.
Pursuant to the requirements of the Securities Exchange Act of 1934, as amended, this report has been signed below by the following persons on behalf of the registrant and in the capacities and on the dates indicated
|
Signature |
Title |
Date |
||
|
/s/ Sameer Dholakia |
President, Chief Executive Officer and Director |
February 26, 2018 |
||
|
Sameer Dholakia |
||||
|
/s/ Yancey Spruill |
Chief Financial Officer |
February 26, 2018 |
||
|
Yancey Spruill |
||||
|
/s/ Byron B. Deeter |
Director |
February 26, 2018 |
||
|
Byron B. Deeter |
||||
|
/s/ Warren Adelman |
Director |
February 26, 2018 |
||
|
Warren Adelman |
||||
|
/s/ Ajay Agarwal |
Director |
February 26, 2018 |
||
|
Ajay Agarwal |
||||
|
/s/ Fred Ball |
Director |
February 26, 2018 |
||
|
Fred Ball |
||||
|
/s/ Hilary Schneider |
Director |
February 26, 2018 |
||
|
Hilary Schneider |
||||
|
/s/ Sri Viswanath |
Director |
February 26, 2018 |
||
|
Sri Viswanath |
112