Attached files
| file | filename |
|---|---|
| EX-32.2 - EX-32.2 - SKYWEST INC | skyw-20171231ex322c20e35.htm |
| EX-32.1 - EX-32.1 - SKYWEST INC | skyw-20171231ex321ae81aa.htm |
| EX-31.2 - EX-31.2 - SKYWEST INC | skyw-20171231ex312585bdb.htm |
| EX-31.1 - EX-31.1 - SKYWEST INC | skyw-20171231ex311a352c4.htm |
| EX-23.1 - EX-23.1 - SKYWEST INC | skyw-20171231ex231d6c1e3.htm |
UNITED STATES
SECURITIES AND EXCHANGE COMMISSION
Washington, D.C. 20549
FORM 10‑K
|
☒ |
ANNUAL REPORT PURSUANT TO SECTION 13 OR 15(d) OF THE |
|
For the fiscal year ended December 31, 2017 |
|
|
OR |
|
|
☐ |
TRANSITION REPORT PURSUANT TO SECTION 13 OR 15(d) OF THE |
|
For the transition period from to |
|
Commission File No. 0‑14719
SKYWEST, INC.
|
Incorporated under the Laws of Utah |
87‑0292166 |
444 South River Road
St. George, Utah 84790
(435) 634‑3000
Securities Registered Pursuant to Section 12(b) of the Act:
(Title of Each Class) (Name of Exchange on which Registered)
Common Stock, No Par Value The Nasdaq Global Select Market
Securities Registered Pursuant to Section 12(g) of the Act: None
Indicate by check mark if the registrant is a well‑known seasoned issuer, as defined in Rule 405 of the Securities Act. Yes ☒ No ☐
Indicate by check mark if the registrant is not required to file reports pursuant to Section 13 or Section 15(d) of the Act. Yes ☐ No ☒
Indicate by check mark whether the registrant (1) has filed all reports required to be filed by Section 13 or 15(d) of the Securities Exchange Act of 1934 during the preceding 12 months (or such shorter period that the registrant was required to file such reports), and (2) has been subject to such filing requirements for the past 90 days. Yes ☒ No ☐
Indicate by check mark whether the registrant has submitted electronically and posted on its corporate Web site, if any, every Interactive Data File required to be submitted and posted pursuant to Rule 405 of Regulation S‑T (§ 232.405 of this chapter) during the preceding 12 months (or for such shorter period that the registrant was required to submit and post such files). Yes ☒ No ☐
Indicate by check mark if disclosure of delinquent filers pursuant to Item 405 of Regulation S‑K (§ 229.405)is not contained herein, and will not be contained, to the best of registrant’s knowledge, in the definitive proxy or information statements incorporated by reference in Part III of this Form 10‑K or any amendment to this Form 10‑K. ☐
Indicate by check mark whether the registrant is a large accelerated filer, an accelerated filer, a non‑accelerated filer, a smaller reporting company, or an emerging growth company. See the definitions of “large accelerated filer,” “accelerated filer,” “smaller reporting company,” and “emerging growth company” in Rule 12b‑2 of the Exchange Act.
|
Large accelerated filer ☒ |
Accelerated filer ☐ |
Non‑accelerated filer ☐ |
Smaller reporting company ☐ |
Emerging growth company ☐ |
If an emerging growth company, indicate by check mark if the registrant has elected not to use the extended transition period for complying with any new or revised financial accounting standards provided pursuant to Section 13(a) of the Exchange Act. ☐
Indicate by check mark whether the registrant is a shell company (as defined in Rule 12b‑2 of the Act). Yes ☐ No ☒
The aggregate market value of the registrant’s common stock held by non‑affiliates (based upon the closing sale price of the registrant’s common stock on The Nasdaq Global Select Market) on June 30, 2017 was approximately $1,816,989,866.
As of February 16, 2018, there were 51,784,012 shares of the registrant’s common stock outstanding.
Documents Incorporated by Reference
Portions of the registrant’s proxy statement to be used in connection with the registrant’s 2018 Annual Meeting of Shareholders are incorporated by reference into Part III of this Report as specified. Such proxy statement will be filed with the Securities and Exchange Commission not later than 120 days after the registrant’s fiscal year ended December 31, 2017.
SKYWEST, INC.
ANNUAL REPORT ON FORM 10‑K
|
|
|
Page No. |
|
PART I |
||
| 3 | ||
| 3 | ||
| 15 | ||
| 25 | ||
| 25 | ||
| 27 | ||
| 28 | ||
|
PART II |
||
| 28 | ||
| 29 | ||
|
Management’s Discussion and Analysis of Financial Condition and Results of Operations |
31 | |
| 52 | ||
| 52 | ||
|
Changes in and Disagreements with Accountants on Accounting and Financial Disclosure |
82 | |
| 82 | ||
| 84 | ||
|
PART III |
||
| 84 | ||
| 84 | ||
|
Security Ownership of Certain Beneficial Owners and Management and Related Stockholder Matters |
84 | |
| 84 | ||
| 84 | ||
|
PART IV |
||
| 84 | ||
| 89 | ||
2
PART I
Unless otherwise indicated in this Report, “SkyWest,” “we,” “us,” “our” and similar terms refer to SkyWest, Inc., “SkyWest Airlines” refers to our wholly‑owned subsidiary, SkyWest Airlines, Inc., and "ExpressJet" refers to our wholly-owned subsidiary, ExpressJet Airlines, Inc.
Cautionary Statement Concerning Forward‑Looking Statements
Certain of the statements contained in this Report should be considered “forward‑looking statements” within the meaning of the Private Securities Litigation Reform Act of 1995. These forward‑looking statements may be identified by words such as “may,” “will,” “expect,” “intend,” “anticipate,” “believe,” “estimate,” “plan,” “project,” “could,” “should,” “hope,” “likely,” and “continue” and similar terms used in connection with statements regarding our outlook, anticipated operations, the revenue environment, our contractual relationships, and our anticipated financial performance. These statements include, but are not limited to, statements about our future growth and development plans, including our future financial and operating results, our plans for SkyWest Airlines and ExpressJet, our objectives, expectations and intentions and other statements that are not historical facts. Readers should keep in mind that all forward‑looking statements are based on our existing beliefs about present and future events outside of our control and on assumptions that may prove to be incorrect. If one or more risks identified in this Report materializes, or any other underlying assumption proves incorrect, our actual results will vary, and may vary materially, from those anticipated, estimated, projected, or intended for a number of reasons, including but not limited to: the challenges of competing successfully in a highly competitive and rapidly changing industry; developments associated with fluctuations in the economy and the demand for air travel; the financial stability of United Airlines, Inc. (“United”), Delta Air Lines, Inc. (“Delta”), American Airlines, Inc. (“American”) and Alaska Airlines, Inc. (“Alaska”) (each, a “major airline partner”) and any potential impact of their financial condition on the operations of SkyWest, SkyWest Airlines or ExpressJet; fluctuations in flight schedules, which are determined by the major airline partners for whom SkyWest’s operating airlines conduct flight operations; variations in market and economic conditions; significant aircraft lease and debt commitments; realization of manufacturer residual value guarantees on applicable SkyWest aircraft; residual aircraft values and related impairment charges; the impact of global instability; labor relations and costs; potential fluctuations in fuel costs, and potential fuel shortages; the impact of weather-related or other natural disasters on air travel and airline costs; new aircraft deliveries; and the ability to attract and retain qualified pilots, as well as the other factors described below in Item 1A. Risk Factors.
There may be other factors that may affect matters discussed in forward‑looking statements set forth in this Report, which factors may also cause actual results to differ materially from those discussed. We assume no obligation to publicly update any forward‑looking statement to reflect actual results, changes in assumptions or changes in other factors affecting these statements other than as required by applicable law.
General
Through SkyWest Airlines and ExpressJet, we offer scheduled passenger service with approximately 2,980 daily departures to destinations in the United States, Canada, Mexico and the Caribbean. Substantially all of our flights are operated as Delta Connection, United Express, American Eagle or Alaska Airlines flights under code‑share arrangements (commercial agreements between airlines that, among other things, allow one airline to use another airline’s flight designator codes on its flights) with Delta, United, American or Alaska, respectively. SkyWest Airlines and ExpressJet generally provide regional flying to our major airline partners under long‑term, fixed‑fee, code‑share agreements. Under these fixed‑fee agreements, our major airline partners generally pay us fixed rates for operating the aircraft primarily based on the number of completed flights, flight time and the number of aircraft under contract. The major airline partners also reimburse us for specified direct operating expenses (including fuel expense).
3
SkyWest Airlines and ExpressJet have developed industry‑leading reputations for providing quality regional airline service during their long operating histories. SkyWest Airlines has been flying since 1972 and ExpressJet (and its predecessors) since 1979. As of December 31, 2017, we had 595 aircraft in scheduled service consisting of the following:
|
|
|
CRJ200 |
|
CRJ700 |
|
CRJ900 |
|
ERJ135 |
|
ERJ145 |
|
E175 |
|
Total |
|
|
United |
|
81 |
|
20 |
|
— |
|
3 |
|
109 |
|
65 |
|
278 |
|
|
Delta |
|
94 |
|
60 |
|
52 |
|
— |
|
— |
|
19 |
|
225 |
|
|
American |
|
16 |
|
49 |
|
— |
|
— |
|
— |
|
— |
|
65 |
|
|
Alaska |
|
4 |
|
— |
|
— |
|
— |
|
— |
|
23 |
|
27 |
|
|
Aircraft in scheduled service |
|
195 |
|
129 |
|
52 |
|
3 |
|
109 |
|
107 |
|
595 |
|
|
Subleased to an un-affiliated entity |
|
4 |
|
— |
|
— |
|
— |
|
— |
|
— |
|
4 |
|
|
Other* |
|
9 |
|
7 |
|
— |
|
— |
|
8 |
|
— |
|
24 |
|
|
Total Fleet |
|
208 |
|
136 |
|
52 |
|
3 |
|
117 |
|
107 |
|
623 |
|
*As of December 31, 2017, these aircraft have been removed from service and are in the process of being returned under the applicable leasing arrangement or are aircraft transitioning between code-share agreements with our major airline partners. During the year ended December 31, 2017, we sold eleven owned Embraer Brasilia EMB120 (“EMB120”) 30-seat turboprop aircraft at net book value.
As of December 31, 2017, our fleet scheduled for service consisted of aircraft manufactured by Bombardier Aerospace (“Bombardier”) and Embraer S.A. (“Embraer”) summarized as follows:
|
Manufacturer |
|
Aircraft Type |
|
Seat Configuration |
|
Bombardier |
|
CRJ900s |
|
76 |
|
Bombardier |
|
CRJ700s |
|
65-70 |
|
Bombardier |
|
CRJ200s |
|
50 |
|
Embraer |
|
E175s |
|
76 |
|
Embraer |
|
ERJ145s |
|
50 |
|
Embraer |
|
ERJ135s |
|
37 |
Bombardier and Embraer are the primary manufacturers of regional jets operated in the United States and offer many of the amenities of larger commercial jet aircraft, including flight attendant service, a stand‑up cabin, overhead and under seat storage, lavatories and in‑flight snack and beverage service. The speed of Bombardier and Embraer regional jets is comparable to larger aircraft operated by major airlines, and they have a range of approximately 1,600 miles and 2,100 miles, respectively.
We were incorporated in Utah in 1972. Our principal executive offices are located at 444 South River Road, St. George, Utah 84790, and our primary telephone number is (435) 634‑3000. We maintain an internet website at inc.skywest.com, which provides links to our annual, quarterly and current reports filed with the Securities and Exchange Commission (“SEC”). The information on our website does not constitute part of this Report. In addition, we provide electronic or paper copies of our SEC filings free of charge upon request.
Our Operating Platforms
SkyWest Airlines
SkyWest Airlines provides regional jet service to airports primarily located in the Midwestern and Western United States, as well as Mexico and Canada. As of December 31, 2017, SkyWest Airlines offered approximately 2,000 daily departures, of which approximately 770 were United Express flights, 810 were Delta Connection flights, 300 were American Eagle flights and 120 were Alaska Airlines flights. SkyWest Airlines’ operations are conducted principally from airports located in Chicago (O’Hare), Denver, Houston, Los Angeles, Minneapolis, Phoenix, Salt Lake City, San Francisco and Seattle. As of December 31, 2017, SkyWest Airlines operated a fleet of 422 aircraft consisting of the following:
4
|
|
|
CRJ200 |
|
CRJ700 |
|
CRJ900 |
|
E175 |
|
Total |
|
|
United |
|
81 |
|
20 |
|
— |
|
65 |
|
166 |
|
|
Delta |
|
94 |
|
27 |
|
36 |
|
19 |
|
176 |
|
|
American |
|
16 |
|
37 |
|
— |
|
— |
|
53 |
|
|
Alaska |
|
4 |
|
— |
|
— |
|
23 |
|
27 |
|
|
Total |
|
195 |
|
84 |
|
36 |
|
107 |
|
422 |
|
SkyWest Airlines conducts its code‑share operations with its major airline partners pursuant to the following agreements:
|
Major airline partner |
|
Agreement |
|
United |
|
“SkyWest Airlines United Express Agreements” and “SkyWest Airlines United Express Prorate Agreement” |
|
Delta |
|
“SkyWest Airlines Delta Connection Agreement” and “SkyWest Airlines Delta Prorate Agreement” |
|
American |
|
“SkyWest Airlines American Agreement” and “SkyWest Airlines American Prorate Agreement” |
|
Alaska |
|
“SkyWest Airlines Alaska Agreement” |
A summary of the terms for each SkyWest Airlines code‑share agreement with the respective major airline partner is provided under the heading “Code-Share Agreements” below on page 7.
ExpressJet
ExpressJet provides regional jet service to airports primarily located in the Eastern and Midwestern United States, as well as Mexico, Canada and the Caribbean. ExpressJet’s operations are conducted principally from airports located in Atlanta, Chicago (O’Hare), Houston, Newark and New York. ExpressJet offered approximately 980 daily departures, of which approximately 350 were Delta Connection flights, 550 were United Express flights and 80 were American Eagle flights. As of December 31, 2017, ExpressJet operated a fleet of 173 aircraft consisting of the following:
|
|
|
CRJ200 |
|
ERJ145 |
|
ERJ135 |
|
CRJ700 |
|
CRJ900 |
|
Total |
|
|
United |
|
— |
|
109 |
|
3 |
|
— |
|
— |
|
112 |
|
|
Delta |
|
— |
|
— |
|
— |
|
33 |
|
16 |
|
49 |
|
|
American |
|
— |
|
— |
|
— |
|
12 |
|
— |
|
12 |
|
|
Total |
|
— |
|
109 |
|
3 |
|
45 |
|
16 |
|
173 |
|
ExpressJet conducts its code‑share operations with its major airline partners pursuant to the following agreements:
|
Major airline partner |
|
Agreement |
|
United |
|
“ExpressJet United Express ERJ Agreement” |
|
Delta |
|
“ExpressJet Delta Connection Agreement” |
|
American |
|
“ExpressJet American Agreement” |
A summary of the terms for each ExpressJet code‑share agreement with the respective major airline partner is provided under the heading “Code-Share Agreements” below on page 7.
SkyWest Leasing
The SkyWest Leasing segment includes revenue attributed to our Embraer E175 dual-class regional jet aircraft (“E175”) ownership cost earned under the applicable fixed-fee contracts, and the depreciation and interest expense of our E175 aircraft. The SkyWest Leasing segment’s total assets and capital expenditures include the acquired E175 aircraft. The SkyWest Leasing segment additionally includes the income from Bombardier CRJ200 regional jet (“CRJ200”) aircraft leased to a third-party.
5
Competition and Economic Conditions
The airline industry is highly competitive. SkyWest Airlines and ExpressJet compete principally with other regional airlines. The combined operations of SkyWest Airlines and ExpressJet extend throughout most major geographic markets in the United States. Our competition includes, therefore, nearly every other domestic regional airline. The primary competitors of SkyWest Airlines and ExpressJet include Air Wisconsin Airlines Corporation (“Air Wisconsin”); Endeavor Air, Inc. (“Endeavor”) (owned by Delta); Envoy Air Inc. (“Envoy”), PSA Airlines, Inc. (“PSA”) and Piedmont Airlines (“Piedmont”) (Envoy, PSA and Piedmont are owned by American); Horizon Air Industries, Inc. (“Horizon”) (owned by Alaska Air Group, Inc.); Mesa Air Group, Inc. (“Mesa”); Republic Airways Holdings Inc. (“Republic”); and Trans States Airlines, Inc. (“Trans States”). Major airlines typically award code-share flying arrangements to regional airlines based primarily upon the following criteria: ability to fly contracted schedules, availability of labor resources, including pilots, low operating cost, financial resources, geographical infrastructure, overall customer service levels relating to on‑time arrival and flight completion percentages and the overall image of the regional airline.
The principal competitive factors for regional airline code‑share arrangements include labor resources, code‑share agreement terms, reliable flight operations, operating cost structure, ability to finance new aircraft, certification to operate certain aircraft types and geographical infrastructure and markets and routes served.
The combined operations of SkyWest Airlines and ExpressJet represent the largest regional airline operations in the United States. However, regional carriers owned by major airlines may have access to greater resources through their parent companies than SkyWest Airlines and ExpressJet.
Generally, the airline industry is sensitive to changes in general economic conditions. Economic downturns, combined with competitive pressures, have contributed to a number of reorganizations, bankruptcies, liquidations and business combinations among major and regional carriers. The effect of economic downturns may be somewhat mitigated by the predominantly contract-based flying arrangements of SkyWest Airlines and ExpressJet. If, however, any of our major airline partners experience a prolonged decline in the number of passengers or are negatively affected by low ticket prices or high fuel prices, they may seek rate reductions in future code-share agreements with SkyWest Airlines or ExpressJet, or materially reduce scheduled flights in order to reduce their costs. In addition, adverse weather conditions can impact our ability to complete scheduled flights and can have a negative impact on our operations and financial condition.
Industry Overview
Major and Regional Airlines
The airline industry in the United States has traditionally been comprised of several major airlines, including Alaska, American, Delta and United. The major airlines offer scheduled flights to most major U.S. cities, numerous smaller U.S. cities, and cities throughout the world through a hub and spoke network.
Regional airlines, including ExpressJet and SkyWest Airlines, typically operate smaller aircraft on shorter distance routes than major and low‑cost carriers. Several regional airlines, including Endeavor, Envoy, Horizon, Piedmont and PSA, are wholly‑owned subsidiaries of major airlines.
Regional airlines generally do not try to establish an independent route system to compete with the major airlines. Rather, regional airlines typically enter into relationships with one or more major airlines, pursuant to which the regional airline agrees to use its smaller, lower‑cost aircraft to carry passengers booked and ticketed by the major airline between a hub of the major airline and a smaller outlying city. In exchange for such services, the major airline pays the regional airline either a fixed flight fee, termed “contract” or “fixed‑fee” flights, or the regional airline receives a percentage of applicable passenger ticket revenues, termed “prorate” or “revenue‑sharing” flights, as described in more detail below.
Code‑Share Agreements
Regional airlines generally enter into code‑share agreements with major airlines, pursuant to which the regional airline is authorized to use the major airline’s two‑letter flight designator codes to identify the regional airline’s flights and fares in the central reservation systems, to paint its aircraft with the colors and/or logos of the major airline and to
6
market and advertise its status as a carrier for the major airline. Code‑share agreements also generally obligate the major airline to provide services such as reservations, ticketing, ground support and gate access to the regional airline, and the major airline often coordinates marketing, advertising and other promotional efforts. In exchange, the regional airline provides a designated number of low‑capacity (usually between 50 and 76 seats) flights between larger airports served by the major airline and surrounding cities, usually in lower‑volume markets. The financial arrangements between the regional airlines and their code‑share partners usually involve either fixed‑fee arrangements or revenue‑sharing arrangements as explained below:
|
· |
Fixed‑Fee Arrangements. Under a fixed‑fee arrangement (referred to as a “fixed‑fee arrangement,” “fixed-fee contract,” “contract flying” or a “capacity purchase agreement”), the major airline generally pays the regional airline a fixed‑fee for each departure, flight hour (measured from takeoff to landing, excluding taxi time) and block hour (measured from takeoff to landing, including taxi time) incurred, and an amount per aircraft in service each month with additional incentives based on completion of flights, on‑time performance and other operating metrics. In addition, under a fixed fee arrangement, the major airline bears the risk of fuel price fluctuations and certain other costs. Regional airlines benefit from fixed‑fee arrangements because they are protected from some of the elements that cause volatility in airline financial performance, including variations in ticket prices, number of passengers and fuel prices. However, regional airlines in fixed‑fee arrangements generally do not benefit from positive trends in ticket prices, ancillary revenue, such as baggage and food and beverage fees, the number of passengers enplaned or fuel prices, because the major airlines retain passenger fare volatility risk and fuel costs associated with the regional airline flight. |
|
· |
Revenue‑Sharing Arrangements. Under a revenue‑sharing arrangement (referred to as a “revenue‑sharing” arrangement or “prorate” arrangement), the major airline and regional airline negotiate a passenger fare proration formula for specifically identified routes, pursuant to which the regional airline receives a percentage of the ticket revenues for those passengers traveling for one portion of their trip on the regional airline and the other portion of their trip on the major airline. On the other hand, the regional airline receives all of the passenger fare when a passenger purchases a ticket on a route solely operated by the regional airline. Substantially all costs associated with the regional airline flight are borne by the regional airline. In a revenue‑sharing arrangement, the regional airline may realize increased profits as ticket prices and passenger loads increase or fuel prices decrease and, correspondingly, the regional airline may realize decreased profits as ticket prices and passenger loads decrease or fuel prices increase. |
SkyWest Airlines has code‑share agreements with United, Delta, American and Alaska. ExpressJet has code‑share agreements with United, Delta and American.
During the year ended December 31, 2017, approximately 87.8% of our passenger revenues related to fixed‑fee contract flights, where Delta, United, American and Alaska controlled scheduling, ticketing, pricing and seat inventories. The remainder of our passenger revenues during the year ended December 31, 2017 related to prorate flights for Delta, United or American, where we controlled scheduling, pricing and seat inventories, and shared passenger fares with Delta, United or American according to prorate formulas.
Under our fixed-fee arrangements, our major airline partners compensate us for our costs of owning or leasing the aircraft on a monthly basis. The aircraft compensation structure varies by agreement, but is intended to cover either our aircraft principal and interest debt service costs, our aircraft depreciation and interest expense or our aircraft lease expense costs while the aircraft is under contract. Under our ExpressJet United Express ERJ Agreement, a portion of the aircraft operating under our SkyWest Airlines Delta Connection Agreement and a portion of our aircraft operating under our ExpressJet Delta Connection Agreement, the major airline partner provides the aircraft to us for a nominal amount. The number of aircraft under our fixed‑fee arrangements and our prorate arrangements as of December 31, 2017 is reflected in the summary below. The following summaries of our code-share agreements do not purport to be complete and are qualified in their entirety by reference to the applicable agreement.
7
Delta Connection Agreements
|
Agreement |
Aircraft type |
Number of Aircraft |
Term / Termination |
||||||
|
SkyWest Airlines Delta Connection Agreement (fixed-fee arrangement) |
|
CRJ 200 CRJ 700 CRJ 900 E175 |
|
70 27 36 19 |
|
Individual aircraft have scheduled removal dates under the agreement between 2018 and 2027 The average remaining term of the aircraft under contract is 2.9 years |
|
||
|
ExpressJet Delta Connection Agreement (fixed-fee arrangement) |
|
CRJ 700 CRJ 900 |
|
33 16 |
|
Individual aircraft have scheduled removal dates under the agreement during 2018 |
|
||
|
SkyWest Airlines Delta Connection Prorate Agreement (revenue-sharing arrangement) |
|
CRJ 200
|
|
24 |
|
Terminable with 30-day notice |
|
||
United Express Agreements
|
Agreement |
|
Aircraft type |
|
Number of Aircraft |
|
Term / Termination |
|
|
SkyWest Airlines United Express Agreements (fixed-fee arrangement) |
|
CRJ 200 CRJ 700 E175 |
|
57 20 65
|
|
Individual aircraft have scheduled removal dates under the agreement between 2018 and 2029 The average remaining term of the aircraft under contract is 5.1 years |
|
|
ExpressJet United Express ERJ Agreement (fixed-fee arrangement) |
|
ERJ145 ERJ135
|
|
109 3 |
|
Agreement expires in 2022 The average remaining term of the aircraft under contract is 4.8 years |
|
|
SkyWest Airlines United Express Prorate Agreement (revenue-sharing arrangement) |
|
CRJ 200
|
|
24 |
|
Terminable with 120-day notice |
|
American Agreements
|
Agreement |
|
Aircraft type |
|
Number of Aircraft |
|
Term / Termination Dates |
|
|
SkyWest Airlines American Agreement (fixed-fee arrangement) |
|
CRJ 200 CRJ 700
|
|
10 37 |
|
CRJ200 aircraft are scheduled to expire in 2018 and the CRJ700 aircraft are scheduled to expire in 2019 |
|
|
SkyWest Airlines American Prorate Agreement (revenue-sharing arrangement) |
|
CRJ 200 |
|
6 |
|
Terminable with 120-day notice |
|
|
ExpressJet American Agreement (fixed-fee arrangement) |
|
CRJ 700 |
|
12
|
|
CRJ700 aircraft are scheduled to expire in 2019 |
|
Alaska Capacity Purchase Agreement
|
Agreement |
|
Aircraft type |
|
Number of Aircraft |
|
Term / Termination |
|
|
SkyWest Airlines Alaska Agreement (fixed-fee arrangement) |
CRJ 200 E175 |
4 23 |
CRJ200 aircraft are scheduled to expire in 2018 E175 aircraft have scheduled removal dates under the agreement between 2027 and 2029 |
8
In addition to the contractual arrangements described above, SkyWest Airlines has entered into agreements with Alaska and Delta to place additional E175 aircraft (which are typically configured with 76 seats) or E175 SC dual-class regional jet aircraft (which are typically configured with 70 seats) (“E175 SC”) into service for those major airline partners. As of December 31, 2017, we anticipate placing an additional 12 E175 aircraft with Alaska and 30 E175 SC aircraft with Delta. The delivery dates for the new E175/E175 SC aircraft are expected to take place by the end of 2018 or early 2019.
SkyWest Airlines and ExpressJet Delta Connection Agreements
ExpressJet and Delta are parties to a Delta Connection Agreement (the “ExpressJet Delta Connection Agreement”). During 2017, ExpressJet and Delta mutually agreed to initiate the wind down of the ExpressJet Delta Connection Agreement by the end of 2018. As of December 31, 2017, ExpressJet operated 33 Canadair CRJ700 regional jet aircraft (“CRJ700”) and 16 Canadair CRJ900 regional jet aircraft (“CRJ900”) under the ExpressJet Delta Connection Agreement. Of the 49 aircraft, ExpressJet anticipates returning the 19 leased aircraft financed by Delta to Delta, including all CRJ900s, and removing 30 CRJ700 aircraft from service with Delta during 2018. ExpressJet is pursuing placement of the 30 CRJ700 aircraft with other major airline partners, of which eight aircraft are scheduled to be placed under an agreement with American following the removal from service with Delta. ExpressJet expects to transition all 30 CRJ700 aircraft to other major airline partners throughout 2018.
SkyWest Airlines and Delta are parties to a Delta Connection Agreement (the "SkyWest Airlines Delta Connection Agreement"), pursuant to which SkyWest Airlines provides contract flight services for Delta. The SkyWest Airlines Delta Connection Agreement contains multi‑year rate reset provisions applicable to the CRJ aircraft that became operative in 2010. The SkyWest Airlines Delta Connection Agreement multi-year rate reset provision does not include the E175/E175 SC aircraft. SkyWest Airlines agreed with Delta on contractual rates that are effective through December 31, 2018.
The SkyWest Airlines Delta Connection Agreement is subject to early termination in various circumstances, including:
|
· |
if SkyWest Airlines or Delta commits a material breach of the SkyWest Airlines Delta Connection Agreement, subject to 30‑day notice and cure rights; |
|
· |
if SkyWest Airlines fails to conduct all flight operations and maintain all aircraft under the SkyWest Airlines Delta Connection Agreement in compliance in all material respects with applicable government regulations; |
|
· |
if SkyWest Airlines fails to satisfy certain performance and safety requirements; |
|
· |
if either party files for bankruptcy, reorganization or similar action (subject to limitations imposed by the U.S. Bankruptcy Code) or makes an assignment for the benefit of creditors; or |
|
· |
if SkyWest Airlines fails to maintain competitive base rate costs (provided, however, that SkyWest Airlines has the right to adjust its rates prior to any such termination). |
SkyWest Airlines United Express Agreements
SkyWest Airlines and United are parties to two United Express agreements: a United Express agreement to operate certain CRJ200s and CRJ700s, and a United Express agreement to operate E175 aircraft (collectively, the “SkyWest Airlines United Express Agreements”).
9
The SkyWest Airlines United Express Agreements have a latest scheduled termination date in 2027. The SkyWest Airlines United Express Agreements are subject to early termination in various circumstances including:
|
· |
if SkyWest Airlines or United fails to fulfill an obligation under the SkyWest Airlines United Express Agreements for a period of 60 days after written notice to cure; |
|
· |
if SkyWest Airlines’ operations fall below certain performance levels for a period of three consecutive months; |
|
· |
subject to limitations imposed by the U.S. Bankruptcy Code, if either party becomes insolvent, fails to pay its debts when due, takes action leading to its cessation as a going concern, makes an assignment of substantially all of its assets, or ceases or suspends operations; or |
|
· |
subject to limitations imposed by the U.S. Bankruptcy Code, if bankruptcy proceedings are commenced against either party and certain specified conditions are not satisfied. |
ExpressJet United Express ERJ Agreement
ExpressJet and United are parties to an Amended and Restated Capacity Purchase Agreement (the "ExpressJet United Express ERJ Agreement") to operate Embraer ERJ145 regional jets (“ERJ145s”) and Embraer ERJ135 regional jets (“ERJ135s”). During 2017, ExpressJet secured a five-year extension of the ExpressJet United Express ERJ Agreement, effective January 1, 2018.
The ExpressJet United Express ERJ Agreement is scheduled to terminate in December 2022 and is subject to early termination in various circumstances including:
|
· |
if ExpressJet’s performance falls below identified standards and such failure is not cured within 60 days following receipt of notice; |
|
· |
upon the occurrence of a labor strike lasting 15 days or longer; |
|
· |
upon the occurrence of a material default by ExpressJet under certain lease agreements relating to aircraft operated by ExpressJet under the ExpressJet United Express ERJ Agreement, provided that such material default is not cured within 60 days following receipt of notice; and |
|
· |
if United fails to make payment of $500,000 or more due to ExpressJet under the ExpressJet United Express ERJ Agreement and such failure is not cured within five business days following receipt of notice. |
Under the terms of the ExpressJet United Express ERJ Agreement, ExpressJet operates 109 ERJ145s and three ERJ135s in the United flight system. All of such ERJ145s and ERJ135s are leased to ExpressJet by United pursuant to sublease or lease agreements. Upon the expiration of the ExpressJet United Express ERJ Agreement, ExpressJet is obligated to return the subleased or leased aircraft to United.
SkyWest Airlines American Agreement
SkyWest Airlines and American are parties to an agreement (the "SkyWest Airlines American Agreement") for the operation of CRJ200 and CRJ700 aircraft. The SkyWest Airlines American Agreement for CRJ200 aircraft and CRJ700 aircraft is scheduled to terminate in 2018 and 2020, respectively, and is subject to early termination in various circumstances including:
|
· |
if SkyWest Airlines or American fail to fulfill any obligation under the SkyWest Airlines American Agreement for a period of 30 days after written notice to cure; |
10
|
· |
if SkyWest Airlines’ operations fall below certain performance levels; |
|
· |
subject to limitations imposed by the U.S. Bankruptcy Code, if either party makes a general assignment for the benefit of creditors or becomes insolvent; or |
|
· |
subject to limitations imposed by the U.S. Bankruptcy Code, if bankruptcy proceedings are commenced against either party and certain specified conditions are not satisfied |
ExpressJet American Agreement
ExpressJet and American are parties to an agreement (the "ExpressJet American Agreement") for the operation of CRJ700 aircraft. The ExpressJet American Agreement for CRJ700 is scheduled to terminate in 2019 and is subject to early termination in various circumstances including:
|
· |
if ExpressJet or American fail to fulfill any obligation under the ExpressJet American Agreement for a period of 30 days after written notice to cure; |
|
· |
if ExpressJet’s operations fall below certain performance levels; |
|
· |
subject to limitations imposed by the U.S. Bankruptcy Code, if either party makes a general assignment for the benefit of creditors or becomes insolvent; or |
|
· |
subject to limitations imposed by the U.S. Bankruptcy Code, if bankruptcy proceedings are commenced against either party and certain specified conditions are not satisfied. |
SkyWest Airlines Alaska Agreement
SkyWest Airlines and Alaska are parties to a Capacity Purchase Agreement (the "SkyWest Airlines Alaska Agreement") for the operation of E175 aircraft. The agreement has a 12‑year term for each of the aircraft subject to the agreement. The SkyWest Airlines Alaska Agreement is subject to early termination in various circumstances including:
|
· |
if SkyWest Airlines or Alaska fail to fulfill an obligation under the SkyWest Airlines Alaska Capacity Purchase Agreement for a period of 30 days after written notice to cure; |
|
· |
if SkyWest Airlines’ operational performance falls below certain performance levels; |
|
· |
subject to limitations imposed by the U.S. Bankruptcy Code, if either party makes a general assignment for the benefit of creditors or becomes insolvent; or |
|
· |
subject to limitations imposed by the U.S. Bankruptcy Code, if bankruptcy proceedings are commenced against either party and certain specified conditions are not satisfied. |
Segment Financial Information
See Management’s Discussion and Analysis of Financial Condition and Results of Operations, set forth in Item 7 of this Report, and Note 2 to our Consolidated Financial Statements included in Item 8 of this Report, for financial information regarding our business segments.
Training and Aircraft Maintenance
SkyWest Airlines and ExpressJet provide substantially all training to their crew members and maintenance personnel at their respective training facilities. SkyWest Airlines and ExpressJet employees perform routine airframe and
11
engine maintenance along with periodic inspections of equipment at their respective maintenance facilities. SkyWest Airlines and ExpressJet also use third‑party vendors for certain airframe and engine maintenance work.
Fuel
Our fixed‑fee agreements with Delta, United, American and Alaska require the respective major airline partner to reimburse us for the fuel costs we incur under those agreements, thereby reducing our exposure to fuel price fluctuations. Under our prorate agreements with Delta, United and American, we are responsible for the costs to operate the flight, including fuel costs, and therefore we are exposed to fuel price fluctuations for flights operated under our prorate agreements. During the year ended December 31, 2017, United and Delta purchased the majority of the fuel for our aircraft flying under their respective fixed-fee agreements directly from their fuel vendors. Historically, we have not experienced problems with the availability of fuel, and believe we will be able to obtain fuel in quantities sufficient to meet our existing and anticipated future requirements at competitive prices. Standard industry fuel purchase contracts generally do not provide protection against fuel price increases, nor do they ensure availability of supply. We typically purchase fuel from third-party suppliers for our prorate agreements. A substantial increase in the price of jet fuel for flights we operate under our prorate agreements, or the lack of adequate fuel supplies in the future, could have a material adverse effect on our business, financial condition, results of operations or liquidity.
Employee Matters
Railway Labor Act
Our relations with labor unions in the United States are governed by the Railway Labor Act (the “RLA”). Under the RLA, a labor union seeking to represent an unrepresented craft or class of employees is required to file with the National Mediation Board (the “NMB”) an application alleging a representation dispute, along with authorization cards signed by at least 35% of the employees in that craft or class. The NMB then investigates the dispute and, if it finds the labor union has obtained a sufficient number of authorization cards, conducts an election to determine whether to certify the labor union as the collective bargaining representative of that craft or class. Under the NMB’s usual rules, a labor union will be certified as the representative of the employees in a craft or class only if more than 50% of those employees vote for union representation. A certified labor union then enters into negotiations toward a collective bargaining agreement with the employer.
Under the RLA, a collective bargaining agreement between an airline and a labor union does not expire, but instead becomes amendable as of a stated date. Either party may request that the NMB appoint a federal mediator to participate in the negotiations for a new or amended agreement. If no agreement is reached in mediation, the NMB may determine, at any time, that an impasse exists and offer binding arbitration. If either party rejects binding arbitration, a 30‑day “cooling off” period begins. At the end of this 30‑day period, the parties may engage in “self help,” unless the U.S. President appoints a Presidential Emergency Board (“PEB”) to investigate and report on the dispute. The appointment of a PEB maintains the “status quo” for an additional 60 days. If the parties do not reach agreement during this period, the parties may then engage in “self help.” “Self help” includes, among other things, a strike by the union or the imposition of proposed changes to the collective bargaining agreement by the airline. The U.S. Congress and the President have the authority to prevent “self help” by enacting legislation that, among other things, imposes a settlement on the parties.
Collective Bargaining
As of December 31, 2017, we had approximately 16,300 full‑time equivalent employees. Approximately 22.0% of these employees were represented by unions, as set forth in the table below. Effective December 31, 2011, our subsidiary ExpressJet Airlines, Inc. was merged into our subsidiary Atlantic Southeast Airlines, Inc., with the surviving corporation named ExpressJet Airlines, Inc. (the “ExpressJet Combination”). Notwithstanding the completion of the ExpressJet Combination, ExpressJet’s employee groups primarily continue to be represented by those unions who provided representation prior to the ExpressJet Combination. Accordingly, the following table refers to ExpressJet’s employee groups based upon their union affiliations prior to the ExpressJet Combination.
12
|
|
|
Approximate |
|
|
|
|
|
|
|
|
Number of |
|
|
|
|
|
|
|
|
Active Employees |
|
|
|
Status of |
|
|
Employee Group |
|
Represented |
|
Representatives |
|
Agreement |
|
|
Atlantic Southeast Pilots |
|
669 |
|
Air Line Pilots Association International |
|
Amendable February 2018 |
|
|
Atlantic Southeast Flight Attendants |
|
552 |
|
International Association of Machinists and Aerospace Workers |
|
Currently Amendable |
|
|
Atlantic Southeast Flight Controllers |
|
25 |
|
Transport Workers Union of America |
|
Currently Amendable |
|
|
Atlantic Southeast Mechanics |
|
102 |
|
International Brotherhood of Teamsters |
|
Currently Amendable |
|
|
Atlantic Southeast Stock Clerks |
|
29 |
|
International Brotherhood of Teamsters |
|
Currently Amendable |
|
|
ExpressJet Delaware Pilots |
|
1111 |
|
Air Line Pilots Association International |
|
Amendable February 2018 |
|
|
ExpressJet Delaware Flight Attendants |
|
618 |
|
International Association of Machinists and Aerospace Workers |
|
Currently Amendable |
|
|
ExpressJet Delaware Mechanics |
|
418 |
|
International Brotherhood of Teamsters |
|
Amendable January 2019 |
|
|
ExpressJet Delaware Dispatchers |
|
22 |
|
Transport Workers Union of America |
|
Currently Amendable |
|
|
ExpressJet Delaware Stock Clerks |
|
42 |
|
International Brotherhood of Teamsters |
|
Currently Amendable |
|
In January 2018, the ExpressJet Delaware Mechanics ratified a one-year contract extension to their labor agreement. Delays or expenses or other challenges associated with executing an acceptable agreement with each labor workgroup with a currently amendable contract could impact our financial performance.
As of December 31, 2017, SkyWest and SkyWest Airlines collectively employed 11,965 full‑time equivalent employees, consisting of 4,495 pilots, 3,380 flight attendants, 1,541 customer service personnel, 1,099 mechanics, 825 other maintenance personnel, 166 dispatchers and 459 operational support and administrative personnel. None of these employees are currently represented by a union. Collective bargaining group organization efforts among SkyWest Airlines’ employees do occur from time to time and may continue in the future. If unionization efforts are successful, we may be subjected to risks of work interruption or stoppage and/or incur additional expenses associated with increased union representation of our employees. Neither SkyWest nor SkyWest Airlines has ever experienced a work stoppage due to a strike or other labor dispute, and we consider SkyWest Airlines’ relationships with its employees to be good.
Government Regulation
All interstate air carriers, including SkyWest Airlines and ExpressJet, are subject to regulation by the U.S. Department of Transportation (the “DOT”), the U.S. Federal Aviation Administration (the “FAA”) and other governmental agencies. Regulations promulgated by the DOT primarily relate to economic aspects of air service. The FAA requires operating, air worthiness and other certificates; approval of personnel who may engage in flight, maintenance or operating activities; record‑keeping procedures in accordance with FAA requirements; and FAA approval of flight training and retraining programs. Generally, governmental agencies enforce their regulations through, among other methods, certifications, which are necessary for the continued operations of SkyWest Airlines and ExpressJet, and proceedings, which can result in civil or criminal penalties or revocation of operating authority. The FAA can also issue maintenance directives and other mandatory orders relating to, among other things, grounding of
13
aircraft, inspection of aircraft, installation of new safety‑related items and the mandatory removal and replacement of aircraft parts.
We believe SkyWest Airlines and ExpressJet are in compliance in all material respects with FAA regulations and hold all operating and airworthiness certificates and licenses which are necessary to conduct their respective operations. We incur substantial costs in maintaining current certifications and otherwise complying with the laws, rules and regulations to which SkyWest Airlines and ExpressJet are subject. SkyWest Airlines’ and ExpressJet’s flight operations, maintenance programs, record keeping and training programs are conducted under FAA approved procedures. All air carriers operating in the United States are required to comply with federal laws and regulations pertaining to noise abatement and engine emissions. All such air carriers are also subject to certain provisions of the Federal Communications Act of 1934, as amended, because of their extensive use of radio and other communication facilities. SkyWest Airlines and ExpressJet are also subject to certain federal and state laws relating to protection of the environment, labor relations and equal employment opportunity. We believe SkyWest Airlines and ExpressJet are in compliance in all material respects with these laws and regulations.
Environmental Matters
SkyWest, SkyWest Airlines and ExpressJet are subject to various federal, state, local and foreign laws and regulations relating to environmental protection matters. These laws and regulations govern such matters as environmental reporting, storage and disposal of materials and chemicals and aircraft noise. We are, and expect in the future to be, involved in various environmental matters and conditions at, or related to, our properties. We are not currently subject to any environmental cleanup orders or actions imposed by regulatory authorities. We are not aware of any active material environmental investigations related to our assets or properties.
Safety and Security
We are committed to the safety and security of our passengers and employees. SkyWest Airlines and ExpressJet have taken many steps, both voluntarily and as mandated by governmental authorities, to increase the safety and security of their operations. Some of the safety and security measures we have taken with our major airline partners include: aircraft security and surveillance, positive bag matching procedures, enhanced passenger and baggage screening and search procedures, and securing of cockpit doors. We are committed to complying with future safety and security requirements.
Insurance
SkyWest, SkyWest Airlines and ExpressJet maintain insurance policies we believe are of types customary in the industry and in amounts we believe are adequate to protect against material loss. These policies principally provide coverage for public liability, passenger liability, baggage and cargo liability, property damage, including coverage for loss or damage to our flight equipment, and workers’ compensation insurance.
Seasonality
Our results of operations for any interim period are not necessarily indicative of those for the entire year, in part because the airline industry is subject to seasonal fluctuations and changes in general economic conditions. Our operations are somewhat favorably affected by pleasure travel on our prorate routes, historically contributing to increased travel in the summer months, and are unfavorably affected by decreased business travel during the months from November through January and by inclement weather which can result in cancelled flights, principally during the winter months. Additionally, a significant portion of our fixed‑fee arrangements is based on completing flights and we typically have more scheduled flights during the summer months. We generally experience a significantly higher number of weather cancellations during the winter months, which negatively impacts our revenue during such months.
14
In addition to factors discussed elsewhere in this Report, the following are important risks which could adversely affect our future results. Additional risks and uncertainties not presently known to us or that we currently do not deem material may also impair our business operations. If any of the risks we describe below occur, or if any unforeseen risk develops, our operating results may suffer, our financial condition may deteriorate, the trading price of our common stock may decline and investors could lose all or part of their investment in us.
Risks Related to Our Operations
We may experience a shortage of pilots which may negatively affect our operations and financial condition.
On July 8, 2013, as directed by the U.S. Congress, the FAA issued more stringent pilot qualification and crew member flight training standards, which increase the required training time for new commercial pilots. With these changes, the supply of qualified pilot candidates eligible for hiring by the airline industry has been dramatically reduced. Additionally, major airlines may significantly increase the number of pilots hired from regional carriers due to the number of pilots at the major airlines reaching the statutory mandatory retirement age of 65 years. These factors may cause our pilot attrition rates to be higher than our ability to hire and retain replacement pilots. If we are unable to maintain a sufficient number of eligible pilots to operate our scheduled flights, we may need to request a reduced flight schedule with our major airline partners, which may result in operational performance penalties under the code-share agreements with those partners and our operations and financial results could be materially and adversely affected.
Additionally, our projected number of available pilots and attrition rates may impact our fleet planning decisions. If actual pilot availability or our actual pilot attrition rates are materially different than our projections, our operations and financial results could be materially and adversely affected. A shortage of qualified pilots to conduct our operations may cause us to underutilize our aircraft and would negatively impact our operations and financial condition.
Our labor costs, including pilot compensation, may continue to increase.
Labor costs are a significant component of our total expenses. Currently, we believe our labor costs are competitive relative to other regional airlines. However, we cannot provide assurance that our labor costs going forward will remain competitive because of changes in supply and demand for labor in the regional industry. We compete against other airlines and businesses for labor in many highly skilled positions. If we are unable to hire, train and retain qualified employees at a reasonable cost, sustain employee engagement in our strategic vision, or if we are unsuccessful at implementing succession plans for our key staff, we may be unable to grow or sustain our business. Attrition beyond normal levels could negatively impact our operating results, increase our training and labor costs and our business prospects could be harmed.
The Airline Safety and Pilot Training Improvement Act of 2009 may continue to negatively affect our operations and financial condition.
The Airline Safety and Pilot Training Improvement Act of 2009 (the “Improvement Act”) became effective in August 2013. The Improvement Act added new certification requirements for entry‑level commercial pilots, requires additional emergency training for airline personnel, improves availability of pilot records and mandates stricter rules to minimize pilot fatigue.
The Improvement Act also:
|
· |
Requires that all airline pilots obtain an Airline Transport Pilot license, which was previously only required for captains. |
|
· |
Obligates the FAA to maintain a database of pilot records, including records to be provided by airlines and other sources, so that airlines will have access to more information before they hire pilots. |
15
|
· |
Requires the FAA to issue new regulations governing the airlines’ obligations to submit pilot records and the requirements for airlines to obtain access for information in the database before the database portion of the Improvement Act becomes effective. |
|
· |
Directs the FAA to rewrite the rules for how long pilots are allowed to work and how much rest they must have before working. |
The Improvement Act (and associated regulations) has increased our compliance and FAA reporting obligations, has had a negative effect on pilot scheduling, work hours and the number of pilots required to be employed for our operations or other aspects of our operations, and may continue to negatively impact our operations and financial condition.
We have aircraft lease and debt commitments that extend beyond our existing fixed‑fee contractual term on certain aircraft.
Under our fixed‑fee arrangements with multiple major airline partners we have a total of 36 CRJ700/CRJ900s with flying contract expirations in 2018 and 2019. Our underlying lease or debt financing obligations associated with each of these aircraft are scheduled to terminate in 2023 and 2024 on an aircraft‑by‑aircraft basis. We may not be successful in extending the flying contract term on these aircraft with our major airline partner at acceptable economic terms. In the event we are unsuccessful in extending the flying contract terms on these aircraft, we intend to pursue alternative uses for the aircraft over the remaining aircraft financing term including, but not limited to, operating the aircraft with another major carrier under a negotiated code‑share agreement, subleasing the aircraft to another operator, and/or marketing the debt financed aircraft for sale. Additionally, we may negotiate an early lease return agreement with the aircraft lessor. In the event we are unable to extend the flying contract terms for these aircraft at each respective contract’s expiration, we may incur cash and non-cash early lease termination costs that would negatively impact our operations and financial condition. Additionally, in the event we are unable to extend a flying contract with an existing major airline partner, but reach an agreement to place the aircraft into service with a different major airline partner, we likely will incur inefficiencies and incremental costs, such as changing the aircraft livery, which would negatively impact our financial results.
Our business model is dependent on code-share agreements with four major airline partners.
Our business model depends on major airlines electing to contract with us instead of operating their own regional jets. Some regional airlines are owned by a major airline. We have no guarantee that in the future our major airline partners will choose to enter into contracts with us instead of operating their own regional jets. Our major airline partners are not prohibited from doing so under our code‑share agreements. A decision by any of our major airline partners to phase out code‑share relationships and instead acquire and operate their own regional jets could have a material adverse effect on our financial results.
As of December 31, 2017, 541 out of our total 595 aircraft available for scheduled service were operating under a fixed‑fee arrangement or a revenue‑sharing agreement with either Delta or United. If our code‑share relationship with Delta or United were terminated, we would be significantly impacted and likely would not have an immediate source of revenue or earnings to offset such loss. A termination of either of these relationships would likely have a material adverse effect on our financial condition, operating revenues and net income unless we are able to enter into satisfactory substitute arrangements for the utilization of the affected aircraft by other code‑share partners, or, alternatively, obtain the airport facilities and gates and make the other arrangements necessary to fly as an independent airline. We may not be able to enter into substitute code‑share arrangements, and any such arrangements we might secure may not be as favorable to us as our current agreements. Operating an airline independent from major airline partners would be a significant departure from our business plan and would likely require significant time and resources, which may not be a viable alternative.
Additionally, each of our agreements with our major airline partners is subject to certain early termination provisions. For example, Delta’s termination rights include the right to terminate the agreements upon the occurrence of certain force majeure events (including certain labor‑related events) that prevent SkyWest Airlines from performance
16
for certain periods and the right to terminate the agreements if SkyWest Airlines fails to maintain competitive base rate costs, subject to certain rights of SkyWest Airlines to take corrective action to reimburse Delta for lost revenues. United may terminate the SkyWest Airlines and ExpressJet United Express Agreements due to an uncured breach by SkyWest Airlines or ExpressJet of certain operational or performance provisions, including measures and standards related to flight completions, baggage handling and on‑time arrivals. We currently use the systems, facilities and services of Delta and United to support a significant portion of our operations, including airport and terminal facilities and operations, information technology support, ticketing and reservations, scheduling, dispatching, fuel purchasing and ground handling services. If Delta or United were to cease to maintain any of these systems, close any of these facilities or no longer provide these services to us, due to termination of one of our code‑share agreements, a strike or other labor interruption by Delta or United personnel or for any other reason, we may not be able to obtain alternative systems, facilities or services on terms and conditions as favorable as those we currently receive, or at all. Since our revenues and operating profits are dependent on our level of flight operations, we could then be forced to significantly reduce our operations. Furthermore, upon certain terminations of our code‑share agreements, Delta and United could require us to sell or assign to them facilities and assets, including maintenance facilities, we use in connection with the code‑share services we provide. As a result, in order to offer airline service after termination of any of our code‑share agreements, we may have to replace these facilities, assets and services. We may be unable to arrange such replacements on satisfactory terms, or at all.
There are long‑term risks related to supply and demand of regional aircraft associated with our regional airline services strategy.
Our major airline partners have indicated that their committed supply of regional airline capacity is larger than they desire given current market conditions. Specifically, they have identified a general oversupply of 50‑seat regional jets under contractual commitments with regional airlines. Delta in particular has reduced both the number of 50‑seat regional jets within its network and the number of regional airlines with which it contracts. In addition to reducing the number of 50‑seat jets under contract, major airlines have reduced the utilization of regional aircraft, thereby reducing the revenue paid to regional airlines under capacity purchase agreements. This decrease has had, and may continue to have, a negative impact on our regional airline services revenue and financial results.
Our growth may be limited with our major airline partners' flight systems.
Additional growth opportunities within our major airline partners’ flight systems are limited by various factors, including a limited number of regional aircraft each such major airline partner can operate in its regional network due to its own labor agreements. Except as contemplated by our existing code‑share agreements, we cannot be sure that our major airline partners will contract with us to fly any additional aircraft. We may not receive additional growth opportunities, or may agree to modifications to our code‑share agreements that reduce certain benefits to us in order to obtain additional aircraft, or for other reasons. Given the competitive nature of the airline industry, we believe limited growth opportunities may result in competitors accepting reduced margins and less favorable contract terms in order to secure new or additional code‑share operations. Even if we are offered growth opportunities by our major airline partners, those opportunities may involve economic terms or financing commitments that are unacceptable to us. Additionally, our major airline partners may reduce the number of regional jets in their system by not renewing or extending existing flying arrangements with regional operators. Any one or more of these factors may reduce or eliminate our ability to expand our flight operations with our existing major airline partners.
Increases in labor costs, maintenance costs and overhead costs may result in lower operating margins under our fixed-fee contracts.
Under our fixed-fee contracts with Delta, United, American and Alaska, a portion of our compensation is based upon pre‑determined rates typically applied to production statistics (such as departures, block hours, flight hours and number of aircraft in service each month). The primary operating costs intended to be compensated by the pre-determined rates include labor costs, including crew training costs, certain aircraft maintenance expenses, and overhead costs. During the year ended December 31, 2017, approximately 85.9% of our code‑share operating costs were reimbursable at pre‑determined rates and 14.1% of our code‑share operating costs were pass‑through costs. Additionally, our aircraft maintenance costs may increase annually as our fleet ages at a higher rate than our pre-
17
determined rates allow. If our operating costs for labor, aircraft maintenance and overhead costs exceed the compensation earned from our pre‑determined rates under our fixed‑fee arrangements, our financial position and operating results will be negatively affected.
Anticipated fleet reductions with Delta at ExpressJet may result in operating inefficiencies in 2018.
As of December 31, 2017, ExpressJet operated 49 aircraft under the ExpressJet Delta Connection Agreement out of a total of 173 aircraft operated under all of ExpressJet’s code-share agreements. During 2017, ExpressJet and Delta mutually agreed to initiate the wind down of the ExpressJet Delta Connection Agreement by the end of 2018. Of the 49 aircraft, ExpressJet anticipates returning 19 leased aircraft to Delta and removing 30 CRJ700 aircraft from service with Delta during 2018. ExpressJet is pursuing placement of the 30 CRJ700 aircraft with other major airline partners, of which eight aircraft are scheduled to be placed under an agreement with American following the removal from service with Delta. We may not be successful in placing the remaining 22 aircraft with other major airline partners on acceptable economic terms, or at all. In the event we are unsuccessful in negotiating flying contracts for these aircraft, we intend to pursue alternative uses for the aircraft over their remaining financing terms including, but not limited to, subleasing the aircraft to another operator, and/or marketing the debt financed aircraft for sale. Although ExpressJet’s anticipated fleet reduction in 2018 is consistent with our long-term fleet plans to improve our long-term profitability and reduce fleet risk, we may experience operating inefficiencies and cash and/or non-cash expenses in 2018 in connection with the aircraft reductions. These inefficiencies and expenses may include, but are not limited to, under-utilized facilities and other assets, infrastructure reductions, employee relocation costs or other operational disruptions. We may also experience inefficiencies while aircraft are temporarily removed from service during a transition period. Fleet transition expenses and potential operating inefficiencies may negatively impact our financial results.
We are reliant on two aircraft manufacturers and two engine manufacturers.
We operate aircraft manufactured by Bombardier and Embraer. The issuance of FAA or manufacturer directives restricting or prohibiting the use of any Bombardier or Embraer aircraft types we operate could negatively impact our business and financial results. We are also dependent upon General Electric and Rolls Royce as the sole manufacturers of engines used on the aircraft we operate. Our operations could be materially and adversely affected by the failure or inability of Bombardier, Embraer, General Electric or Rolls Royce to provide sufficient parts or related maintenance and support services to us on a timely manner. Additionally, timing of aircraft deliveries could be delayed.
We may experience disruption in service with key third-party service providers.
We rely on outside vendors for a variety of services and functions critical to our business, including airframe and engine maintenance, ground handling, fueling, computer reservation system hosting, telecommunication systems and information technology infrastructure and services.
Even though we strive to formalize agreements with these vendors that define expected service levels, our use of outside vendors increases our exposure to several risks. In the event that one or more vendors goes into bankruptcy, ceases operation or fails to perform as promised, replacement services may not be readily available at competitive rates, or at all. If one of our vendors fails to perform adequately, we may experience increased costs, delays, maintenance issues, safety issues or negative public perception of our airline. Vendor bankruptcies, unionization, regulatory compliance issues or significant changes in the competitive marketplace among suppliers could adversely affect vendor services or force us to renegotiate existing agreements on less favorable terms. These events could result in disruptions in our operations or increases in our cost structure.
Information technology security breaches, hardware or software failures, or other information technology disruptions may negatively impact our operations or reputation.
The performance and reliability of our technology are critical to our ability to compete effectively. Any internal technological error or failure or large‑scale external interruption in the technological infrastructure we depend on, such as power, telecommunications or the internet, may disrupt our internal network. Any individual, sustained or repeated failure of technology could impact our ability to conduct our business and result in increased costs. Our technological systems and related data may be vulnerable to a variety of sources of interruption due to events beyond our control,
18
including natural disasters, terrorist attacks, telecommunications failures, computer viruses, hackers and other security issues.
In addition, as a part of our ordinary business operations, we collect and store sensitive data, including personal information of our passengers and employees and information of our business partners. Our information systems are subject to an increasing threat of continually evolving cybersecurity risks. Unauthorized parties may attempt to gain access to our systems or information through fraud or other means of deception. The methods used to obtain unauthorized access, disable or degrade service or sabotage systems are constantly evolving, and may be difficult to anticipate or to detect for long periods of time. We may not be able to prevent all data security breaches or misuse of data. The compromise of our technology systems resulting in the loss, disclosure, misappropriation of, or access to, customers’, employees’ or business partners’ information could result in legal claims or proceedings, liability or regulatory penalties under laws protecting the privacy of personal information, disruption to our operations and damage to our reputation, any or all of which could adversely affect our business and financial condition.
The residual value of our owned aircraft may be less than estimated in our depreciation policies.
As of December 31, 2017, we had approximately $4.2 billion of property and equipment and related assets, net of accumulated depreciation. In accounting for these long‑lived assets, we make estimates about the expected useful lives of the assets, the expected residual values of certain of these assets, and the potential for impairment based on the fair value of the assets and the cash flows they generate. Factors indicating potential impairment include, but are not limited to, significant decreases in the market value of the long‑lived assets, a significant change in the condition of the long‑lived assets and operating cash flow losses associated with the use of the long‑lived assets. In the event the estimated residual value of any of our aircraft types is determined to be lower than the residual value assumptions used in our depreciation policies, the applicable aircraft type in our fleet may be impaired and may result in a material reduction in the book value of applicable aircraft types we operate or we may need to prospectively modify our depreciation policies. For example, during 2016 we recorded an impairment of $465.6 million attributable to certain long-lived assets associated with our 50-seat aircraft primarily resulting from changes to our short-term and long-term fleet plans with our 50-seat aircraft. An impairment on any of our aircraft types we operate or an increased level of depreciation expense resulting from a change to our depreciation policies could result in a material negative impact to our financial results.
Interruptions or disruptions in service at one of our hub airports, due to weather, system malfunctions or for any other reason, could have a material adverse impact on our operations.
We currently operate primarily through hubs across the United States. Nearly all of our flights either originate from or fly into one of these hubs. Our revenues depend primarily on our completion of flights and secondarily on service factors such as timeliness of departure and arrival. Any interruptions or disruptions could, therefore, severely and adversely affect us. Extreme weather such as hurricanes or tornados can cause flight disruptions, and, during periods of storms or adverse weather, our flights may be canceled or significantly delayed. We operate a significant number of flights to and from airports with particular weather difficulties, including Atlanta, Salt Lake City, Chicago, San Francisco, Newark and Denver. A significant interruption or disruption in service at one of our hubs, due to adverse weather, system malfunctions, security closures or otherwise, could result in the cancellation or delay of a significant portion of our flights and, as a result, could have a severe adverse impact on our operations and financial performance.
Negative economic or industry conditions may result in reductions to our flight schedules, which could materially and adversely affect our operations and financial condition.
Our operations and financial condition are affected by many changing economic and other conditions beyond our control, including, among others:
|
· |
disruptions in the credit markets, which may impact availability of financing; |
|
· |
actual or potential changes in international, national, regional and local economic, business and financial conditions, including recession, inflation, higher interest rates, wars, terrorist attacks or political instability; |
19
|
· |
changes in consumer preferences, perceptions, spending patterns or demographic trends; |
|
· |
changes in the competitive environment due to industry consolidation and other factors; |
|
· |
actual or potential disruptions to U.S. air traffic control systems; |
|
· |
price of jet fuel and oil; |
|
· |
outbreaks of diseases that affect travel behavior; and |
|
· |
weather and natural disasters. |
The effect of any, or some combination, of the foregoing economic and industry conditions on our operations or financial condition is virtually impossible to forecast; however, the occurrence of any or all of such conditions in a significant manner could materially and adversely affect our operations and financial condition and could cause our major airline partners to reduce the utilization levels of our aircraft under our code-share agreements.
The majority of our code‑share agreements set forth minimum levels of flight operations which our major airline partners are required to schedule for our operations and we are required to provide. These minimum flight operating levels are intended to provide a baseline level of expected utilization of aircraft, labor, maintenance facilities and related flight operations support. Historically, our major airline partners have utilized our flight operations at levels which exceed the minimum levels set forth in our code‑share agreements, however, the occurrence of any or all of the foregoing economic and industry conditions may cause our major airline partners to reduce our utilization levels. If our major airline partners schedule the utilization of our aircraft below historical levels (including taking into account the route distances and frequency of our scheduled flights), we may not be able to maintain operating efficiencies previously obtained, which would negatively impact our operating results and financial condition. Additionally, our major airline partners may change routes and frequencies of flights, which can negatively impact our operating efficiencies. Changes in schedules may increase our flight costs, which could exceed the reimbursed rates paid by our major airline partners. Continued reduced utilization levels of our aircraft or other changes to our schedules under our code‑share agreements would adversely impact our financial results.
We may experience an increase in fuel prices in our prorate operations.
Dependence on foreign imports of crude oil, limited refining capacity and the possibility of changes in government policy on jet fuel production, transportation and marketing make it impossible to predict the future availability of jet fuel. If there are additional outbreaks of hostilities or other conflicts in oil‑producing areas or elsewhere, or a reduction in refining capacity (due to weather events, for example), or governmental limits on the production or sale of jet fuel, there could be a reduction in the supply of jet fuel and significant increases in the cost of jet fuel. Additionally, our operations may experience disruptions from temporary fuel shortages by our fuel vendors resulting from fuel quality issues, refueling disruption, or other challenges. Major reductions in the availability of jet fuel or significant increases in its cost, or a continuation of high fuel prices for a significant period of time, would have a material adverse impact on us.
Pursuant to our fixed‑fee arrangements, our major airline partners have agreed to bear the economic risk of fuel price fluctuations on our contracted flights. However, we bear the economic risk of fuel price fluctuations on our prorate operations. As of December 31, 2017, we operated 24 CRJ200s under a prorate agreement with United, 24 CRJ200s under a prorate agreement with Delta, and six CRJ200s under a prorate agreement with American. Our operating and financial results with respect to these prorate arrangements can be negatively affected by the price of jet fuel in the event we are unable to increase our passenger fares. Additionally in the event of prolonged low fuel prices, our competitors may lower their passenger ticket prices on routes that compete with our prorate markets, which could negatively impact our passenger load factors.
Certain flying arrangements with our major airline partners are terminable upon notice of 120 days or less.
Certain of our flying agreements with our major airline partners permit the major airline partner to terminate the agreement in its discretion by giving us notice of 120 days or less. If one of our major airline partners elects to terminate
20
a flying agreement with notice of 120 days or less, our ability to use the aircraft under an alternative agreement with similar economics may be limited, which could negatively impact our financial results. Additionally, even if we can subsequently place the aircraft into service with a different major airline partner, of which there can be no assurance, we likely would incur inefficiencies and incremental costs, such as changing the aircraft livery, during the transition period, which would negatively impact our financial results.
We have a significant amount of contractual obligations.
As of December 31, 2017, we had a total of approximately $2.7 billion in total long‑term debt obligations. Substantially all of this long‑term debt was incurred in connection with the acquisition of aircraft and engines. We also have significant long‑term lease obligations primarily relating to our aircraft fleet. These leases are classified as operating leases and therefore are not reflected as liabilities in our consolidated balance sheets. At December 31, 2017, we had 319 aircraft under lease, with remaining terms ranging up to nine years. Future minimum lease payments due under all long‑term operating leases were approximately $716.8 million at December 31, 2017. At a 5.0% discount factor, which is the average rate used to approximate the implicit rates within the applicable aircraft leases, the present value of these lease obligations was equal to approximately $594.3 million at December 31, 2017. Our high level of fixed obligations could impact our ability to obtain additional financing to support additional expansion plans or divert cash flows from operations and expansion plans to service the fixed obligations.
Our anticipated fleet replacement would require a significant increase in our leverage and the related cash requirements.
We currently have 195 CRJ200s with an average life of 15.2 years and 109 ERJ145s with an average life of 15.3 years. Over the next several years, we may continue to replace the CRJ200s and ERJ145s with larger regional jets. If we continue to add new aircraft to our fleet, we anticipate using significant amounts of capital to acquire these larger regional jets.
There can be no assurance that our operations will generate sufficient cash flow or liquidity to enable us to obtain the necessary aircraft acquisition financing to replace our current fleet, or to make required debt service payments related to our existing or anticipated future obligations. Even if we meet all required debt, lease and purchase obligations, the size of these long‑term obligations could negatively affect our financial condition, results of operations and the price of our common stock in many ways, including:
|
· |
increasing the cost, or limiting the availability of, additional financing for working capital, acquisitions or other purposes; |
|
· |
limiting the ways in which we can use our cash flow, much of which may have to be used to satisfy debt and lease obligations; and |
|
· |
adversely affecting our ability to respond to changing business or economic conditions or continue our growth strategy. |
If we need additional capital and cannot obtain such capital on acceptable terms, or at all, we may be unable to realize our fleet replacement plans or take advantage of unanticipated opportunities.
Our business could be harmed if we lose the services of our key personnel.
Our business depends upon the efforts of our chief executive officer, Russell A. Childs, and our other key management and operating personnel. We may have difficulty replacing management or other key personnel who cease to be employed by us and, therefore, the loss of the services of any of these individuals could harm our business. We do not maintain key‑person insurance on any of our executive officers.
We may decrease our dividends and/or reduce the amount of stock repurchases in the future.
Historically, we have paid dividends and repurchased shares of our common stock in varying amounts. The future payment and amount of cash dividends and our future repurchases of shares of common stock, if any, and the number of shares of common stock we may repurchase will depend upon our financial condition and results of
21
operations and other factors deemed relevant by our board of directors. There can be no assurance that we will continue our practice of paying dividends on our common stock or that we will have the financial resources to pay such dividends. There also can be no assurance that we will continue our practice of repurchasing shares of common stock or that we will have the financial resources to repurchase shares of common stock in the future.
In addition, repurchases of our common stock pursuant to our share repurchase program and any future dividends could affect our stock price and increase its volatility. The existence of a share repurchase program and any future dividends could cause our stock price to be higher than it would otherwise be and could potentially reduce the market liquidity for our stock. Additionally, our share repurchase program and any future dividends may reduce our cash reserves, which may impact our ability to finance future growth and to pursue possible future strategic opportunities and acquisitions. Further, our share repurchase program may fluctuate such that our cash flow may be insufficient to fully cover our share repurchases. Although our share repurchase program is intended to enhance long-term shareholder value, there is no assurance that it will do so because the market price of our common stock may decline below the levels at which we repurchased shares of stock and short-term stock price fluctuations could reduce the program’s effectiveness.
Disagreements regarding the interpretation of our code‑share agreements with our major airline partners could have an adverse effect on our operating results and financial condition.
Long‑term contractual agreements, such as our code‑share agreements, are subject to interpretation and disputes may arise under such agreements if the parties to an agreement apply different interpretations to that agreement. Those disputes may divert management time and resources from the core operation of the business, and may result in litigation, arbitration or other forms of dispute resolution.
In recent years we have experienced disagreements with our major airline partners regarding the interpretation of various provisions of our code‑share agreements. Some of those disagreements have resulted in litigation, and we may be subject to additional disputes and litigation in the future. Those disagreements have also required a significant amount of management time, financial resources and settlement negotiations of disputed matters.
To the extent that we experience disagreements regarding the interpretation of our code‑share or other agreements, we will likely expend valuable management time and financial resources in our efforts to resolve those disagreements. Those disagreements may result in litigation, arbitration, settlement negotiations or other proceedings. Furthermore, there can be no assurance that any or all of those proceedings, if commenced, would be resolved in our favor. An unfavorable result in any such proceeding could have adverse financial consequences or require us to modify our operations. Such disagreements and their consequences could have an adverse effect on our operating results and financial condition.
Provisions of our charter documents and code‑share agreements may limit the ability or desire of others to gain control of our company.
Our ability to issue shares of preferred and common stock without shareholder approval may have the effect of delaying or preventing a change in control and may adversely affect the voting and other rights of the holders of our common stock, even in circumstances where such a change in control would be viewed as desirable by most investors. The provisions of the Utah Control Shares Acquisitions Act may also discourage the acquisition of a significant interest in or control of our company. Additionally, our code‑share agreements contain termination and extension trigger provisions related to change in control type transactions that may have the effect of deterring a change in control of our company.
Recent U.S. tax legislation may materially adversely affect our financial condition, results of operations and cash flows.
Recently enacted U.S. tax legislation has significantly changed the U.S. federal income taxation of U.S. corporations, including by reducing the U.S. corporate income tax rate, and revising the rules governing net operating losses and foreign tax credits. Many of these changes are effective immediately, without any transition periods or grandfathering for existing transactions. The legislation is unclear in many respects and could be subject to potential amendments and technical corrections, as well as interpretations and implementing regulations by the Treasury and Internal Revenue
22
Service (“IRS”), any of which could lessen or increase certain adverse impacts of the legislation. In addition, it is unclear how these U.S. federal income tax changes will affect state and local taxation, which often uses federal taxable income as a starting point for computing state and local tax liabilities. While our analysis and interpretation of this legislation is ongoing, based on reasonable estimates of our current evaluation, we have included a $246.8 million benefit related to the revaluation of our net deferred tax liability and other tax liabilities in accordance with this legislation. This amount may be subject to further adjustment in subsequent periods throughout 2018 in accordance with subsequent interpretive guidance issued by the SEC or the IRS. Further, there may be other material adverse effects resulting from the legislation that we have not yet identified. While some of the changes made by the tax legislation may adversely affect the Company in one or more reporting periods and prospectively, other changes may be beneficial on a going forward basis. We continue to work with our tax advisors and auditors to determine the full impact on us of the recent tax legislation. We urge our investors to consult with their legal and tax advisors with respect to such legislation.
Risks Related to the Airline Industry
The occurrence of an aviation accident involving our aircraft would negatively impact our operations and financial condition.
An accident or incident involving one of our aircraft could result in significant potential claims of injured passengers and others, as well as repair or replacement of a damaged aircraft and its consequential temporary or permanent loss from service. In the event of an accident, our liability insurance may not be adequate to offset our exposure to potential claims and we may be forced to bear substantial losses from the accident. Substantial claims resulting from an accident in excess of our related insurance coverage would harm our operational and financial results. Moreover, any aircraft accident or incident, even if fully insured, could cause a public perception that our operations are less safe or reliable than other airlines.
Various factors may negatively impact demand for air travel in the United States.
As is the case for other airlines, our operations often are affected by delays, cancellations and other conditions caused by factors largely beyond our control. Factors that might negatively impact our operations include:
|
· |
congestion and/or space constraints at airports or air traffic control problems; |
|
· |
facility disruptions including power supplies; |
|
· |
lack of operational approval (e.g. new routes, aircraft deliveries, etc.); |
|
· |
adverse weather conditions; |
|
· |
increased security measures or breaches in security; |
|
· |
contagious illness and fear of contagion; |
|
· |
changes in international treaties concerning air rights; |
|
· |
international or domestic conflicts or terrorist activity; and |
|
|
|
· |
other changes in business conditions. |
Increased labor costs, strikes, labor disputes and increased unionization of our workforces may adversely affect our ability to conduct our business and reduce our profitability.
Our business is labor intensive, requiring large numbers of pilots, flight attendants, mechanics and other personnel. Labor costs constitute a significant percentage of our total operating costs. For example, during the year ended December 31, 2017, our salary, wage and benefit costs constituted approximately 42.5% of our total operating costs.
23
Increases in our labor costs could result in a material reduction in our earnings. Any new collective bargaining agreements entered into by other regional carriers with their work forces may also result in higher industry wages and increased pressure on us to increase the wages and benefits of our employees. Future agreements with unionized and non‑unionized employees may be on terms that are not as attractive as our current agreements or comparable to agreements entered into by our competitors.
Approximately 22.0% of our workforce is unionized. Strikes or labor disputes with our unionized employees may adversely affect our ability to conduct business. Relations between air carriers and labor unions in the United States are governed by the RLA, which provides that a collective bargaining agreement between an airline and a labor union does not expire, but instead becomes amendable as of a stated date. The RLA generally prohibits strikes or other types of self‑help action both before and after a collective bargaining agreement becomes amendable, unless and until the collective bargaining processes required by the RLA have been exhausted.
SkyWest Airlines’ employees are not currently represented by any union; however, unionization efforts among those employees occur from time to time. Such efforts will likely continue in the future and may ultimately result in some or all of SkyWest Airlines’ employees being represented by one or more unions. Moreover, one or more unions representing ExpressJet employees may seek a single carrier determination by the National Mediation Board, which could require SkyWest Airlines to recognize such union or unions as the certified bargaining representative of SkyWest Airlines’ employees. One or more unions representing ExpressJet employees may also assert that SkyWest Airlines’ employees should be subject to ExpressJet’s collective bargaining agreements. If SkyWest Airlines’ employees were to unionize or be deemed to be represented by one or more unions, negotiations with unions representing SkyWest Airlines’ employees could divert management attention and disrupt operations, which may result in increased operating expenses and may negatively impact our financial results. Moreover, we cannot predict the outcome of any future negotiations relating to union representation or collective bargaining agreements. Agreements reached in collective bargaining may increase our operating expenses and negatively impact our financial results.
We are subject to significant governmental regulation and potential regulatory changes.
All interstate air carriers, including SkyWest Airlines and ExpressJet, are subject to regulation by the DOT, the FAA and other governmental agencies. Regulations promulgated by the DOT primarily relate to economic aspects of air service. The FAA requires operating, air worthiness and other certificates; approval of personnel who may engage in flight, maintenance or operation activities; record keeping procedures in accordance with FAA requirements; and FAA approval of flight training and retraining programs. We cannot predict whether we will be able to comply with all present and future laws, rules, regulations and certification requirements or that the cost of continued compliance will not have a material adverse effect on our operations. We incur substantial costs in maintaining our current certifications and otherwise complying with the laws, rules and regulations to which we are subject. A decision by the FAA to ground, or require time‑consuming inspections of or maintenance on, all or any of our aircraft for any reason may have a material adverse effect on our operations. In addition to state and federal regulation, airports and municipalities enact rules and regulations that affect our operations. From time to time, various airports throughout the country have considered limiting the use of smaller aircraft, such as our aircraft, at such airports. The imposition of any limits on the use of our aircraft at any airport at which we operate could have a material adverse effect on our operations.
We cannot predict the impact, of potential regulatory changes that may affect our business or the airline industry as whole including the potential impact of tariffs on aircraft deliveries. However, it is possible that these changes could adversely affect our business. Our business may be subject to additional costs or loss of government subsidies as a result of potential regulatory changes, which could have an adverse effect on our operations and financial results.
The airline industry is highly competitive and has undergone a period of consolidation and transition leaving fewer potential code‑share partners.
The airline industry is highly competitive. We not only compete with other regional airlines, some of which are owned by or operated as code‑share partners of major airlines, but we also face competition from low‑cost carriers and major airlines on many of our routes. Low‑cost carriers such as Southwest, Allegiant, Spirit and JetBlue among others, operate at many of our hubs, resulting in significant price competition. Additionally, a large number of other carriers operate at our hubs, creating intense competition. Certain of our competitors are larger and have significantly greater
24
financial and other resources than we do. Moreover, federal deregulation of the industry allows competitors to rapidly enter our markets and to quickly discount and restructure fares. The airline industry is particularly susceptible to price discounting because airlines incur only nominal costs to provide service to passengers occupying otherwise unsold seats. Increased fare competition could adversely affect our operations and the price of our common stock. The airline industry has undergone substantial consolidation, including the mergers between Alaska and Virgin America Inc. in 2016, American and US Airways Group Inc. in 2013, Southwest Airlines Co. and AirTran Holdings, Inc. in 2011, United and Continental Airlines, Inc. in 2010 and Delta and Northwest Airlines, Inc. in 2008. Any additional consolidation or significant alliance activity within the airline industry could limit the number of potential partners with whom we could enter into code‑share relationships and could have a material adverse effect on our relationships with our major airline partners.
Due, in part, to the dynamic nature of the airline industry, major airlines may also make other strategic changes such as changing or consolidating hub locations. If our major airline partners were to make changes such as these in their strategy and operations, our operations and financial results could be adversely impacted.
Terrorist activities or warnings have dramatically impacted the airline industry, and will likely continue to do so.
The terrorist attacks of September 11, 2001 and their aftermath have negatively impacted the airline industry in general, including our operations. The primary effects experienced by the airline industry include a substantial loss of passenger traffic and revenue. If additional terrorist attacks are launched against the airline industry, there will be lasting consequences of the attacks, which may include loss of life, property damage, increased security and insurance costs, increased concerns about future terrorist attacks, increased government regulation and airport delays due to heightened security. Additional terrorist attacks and the fear of such attacks could negatively impact the airline industry, and result in further decreased passenger traffic and yields, increased flight delays or cancellations associated with new government mandates, as well as increased security, fuel and other costs. We cannot provide any assurance that these events will not harm the airline industry generally or our operations or financial condition in particular.
ITEM 1B. UNRESOLVED STAFF COMMENTS
None
Flight Equipment
As of December 31, 2017, our fleet available for scheduled service consisted of the following types of owned and leased aircraft:
|
|
|
Number of |
|
Number of |
|
|
|
Scheduled |
|
Average |
|
|
|
|
|
|
Owned |
|
Leased |
|
Passenger |
|
Flight |
|
Cruising |
|
Average |
|
|
Aircraft Type |
|
Aircraft |
|
Aircraft |
|
Capacity |
|
Range (miles) |
|
Speed (mph) |
|
Age (years) |
|
|
CRJ900s |
|
11 |
|
41 |
|
76 |
|
1,500 |
|
530 |
|
10.4 |
|
|
CRJ700s |
|
69 |
|
60 |
|
65-70 |
|
1,600 |
|
530 |
|
12.4 |
|
|
CRJ200s |
|
105 |
|
90 |
|
50 |
|
1,500 |
|
530 |
|
15.2 |
|
|
E175s |
|
107 |
|
— |
|
70-76 |
|
2,100 |
|
530 |
|
1.9 |
|
|
ERJ145s |
|
— |
|
109 |
|
50 |
|
1,500 |
|
530 |
|
15.3 |
|
|
ERJ135s |
|
— |
|
3 |
|
37 |
|
1,500 |
|
530 |
|
16.0 |
|
Several factors may impact our fleet size throughout 2018 and thereafter, including contract expirations, lease expirations, growth opportunities and opportunities to transition to an alternative major airline partner. Below is our 2018 outlook on our fleet by aircraft type. Our actual future fleet size and/or mix of aircraft types will likely vary, and may vary materially, from our current fleet size.
|
· |
CRJ900s/CRJ700s – As of December 31, 2017, ExpressJet operated 16 CRJ900 aircraft and 33 CRJ 700 aircraft under the ExpressJet Delta Connection Agreement. ExpressJet anticipates returning all 16 leased CRJ900 |
25
aircraft and three leased CRJ700 aircraft to Delta and removing the remaining 30 CRJ700 aircraft from service with Delta during 2018. We are pursuing placement of the 30 CRJ700 aircraft with other major airline partners, of which eight aircraft are scheduled to be placed under an agreement with American following the removal from service with Delta. |
|
· |
E175s/E175 SCs – We anticipate the E175/E175 SC fleet count will increase to approximately 149 aircraft by the end of 2018 or early 2019. Growth in this aircraft type in excess of 149 aircraft is expected to be contingent upon additional flying contract awards with one of our major airline partners. |
|
· |
ERJ145s/135s – Our ERJ145/135 fleet is scheduled to be ratably reduced through lease expirations and related flying contract expirations to approximately 100 aircraft by the end of 2018. These aircraft are leased from the major airline partner with which we have our flying contract. |
|
· |
CRJ200s – We currently have 26 CRJ200 aircraft with contract expirations scheduled for 2018 with multiple major airline partners. We are pursuing contract extension discussions and alternative placement with other major airline partners. |
Ground Facilities
SkyWest, SkyWest Airlines and ExpressJet own or lease the following principal properties:
SkyWest Facilities
|
· |
We own the corporate headquarters facilities of SkyWest and SkyWest Airlines, located in St. George, Utah, which consist of two adjacent buildings of 63,000 and 55,000 square-feet, respectively. |
SkyWest Airlines Facilities
|
· |
SkyWest Airlines leases a 221,000 square-foot facility at the Salt Lake International Airport. This facility consists of a 98,000 square‑foot aircraft maintenance hangar and a 123,000 square‑foot training and office facility. SkyWest Airlines is leasing the facility from the Salt Lake City Department of Airports under a lease that is scheduled to expire on January 1, 2028. |
|
· |
SkyWest Airlines owns a 180,000 square‑foot aircraft maintenance hangar and office facility in Milwaukee, Wisconsin with a land lease that is scheduled to expire on November 1, 2032. |
|
· |
SkyWest Airlines leases a 126,000 square‑foot aircraft maintenance hangar and office facility in Boise, Idaho. The lease agreement is scheduled to expire on September 1, 2040. |
|
· |
SkyWest Airlines leases a 105,000 square‑foot aircraft maintenance hangar and office facility in Fresno, California. The lease agreement is scheduled to expire on August 31, 2019. |
|
· |
SkyWest Airlines owns a 101,000 square‑foot aircraft maintenance hangar and office facility in Colorado Springs, Colorado with a land lease that is scheduled to expire on July 31, 2056. |
|
· |
SkyWest Airlines leases an 88,000 square‑foot aircraft maintenance hangar and office facility in Detroit, Michigan. The lease agreement is scheduled to expire on September 1, 2019. |
|
· |
SkyWest Airlines leases an 80,000 square‑foot aircraft maintenance hangar and office facility in Nashville, Tennessee. The lease agreement is scheduled to expire on September 1, 2022. |
|
· |
SkyWest Airlines owns a 75,000 square‑foot aircraft maintenance hangar and office facility in Chicago, Illinois. The City of Chicago possesses the right to acquire ownership rights of the facility in 2018. |
|
· |
SkyWest Airlines leases a 70,000 square‑foot aircraft maintenance hangar in Tucson, Arizona. The lease agreement is scheduled to expire on January 1, 2025. |
|
· |
SkyWest Airlines owns a 57,000 square-foot aircraft maintenance facility in Palm Springs, California with a land lease that is scheduled to expire on January 14, 2027. |
26
|
· |
SkyWest Airlines owns a 55,000 square‑foot maintenance accessory shop and leases a 5,000 square‑foot training facility in Salt Lake City, Utah. The lease agreement is scheduled to expire on May 31, 2019. |
|
· |
SkyWest Airlines leases a 42,000 square‑foot aircraft maintenance facility in South Bend, Indiana. The lease agreement is scheduled to expire on September 1, 2018. |
ExpressJet Facilities
|
· |
ExpressJet leases an aircraft hangar complex consisting of 203,000 square-feet of building space at the Hartsfield‑Jackson Atlanta International Airport. The complex also contains a 15,000 square‑foot ground service equipment facility. The 203,000 square‑foot building space consists of a 114,000 square-foot aircraft maintenance hangar, an 18,000 square‑foot training facility, and 71,000 square-feet of renovated office space which is utilized to support various operating divisions and ExpressJet’s Operational Control Center. The lease agreement for the aircraft hangar complex has a 25‑year term and is scheduled to expire on April 30, 2033. A portion of the hangar complex has been subleased to another airline. |
|
· |
ExpressJet leases an aircraft hangar complex located at the Middle Georgia Regional Airport. The complex includes a 77,000 square‑foot aircraft hangar facility and 41,000 square-feet of training and office space. The lease agreement has a sixteen‑year term and is scheduled to expire on April 1, 2018. ExpressJet has subleased the hangar complex to another party, but ExpressJet remains obligated for payment and other obligations of the lease under the lease agreement. |
|
· |
ExpressJet leases an 83,000 square‑foot aircraft maintenance hangar, and a 15,000 square‑foot shop facility in Knoxville, Tennessee. The lease agreement for the aircraft maintenance hangar is scheduled to expire on November 30, 2020, and the lease for the shop facility is scheduled to expire on December 31, 2019. |
|
· |
ExpressJet subleases a 91,000 square‑foot aircraft maintenance facility in Cleveland, Ohio. The lease agreement is scheduled to expire on January 30, 2020. |
|
· |
ExpressJet leases a 69,000 square‑foot aircraft maintenance hangar and office support facility in Houston, Texas. The lease agreement is scheduled to expire on December 31, 2020. |
|
· |
ExpressJet leases a 57,000 square‑foot training center and support space in Houston, Texas. The lease agreement is scheduled to expire on December 31, 2027. |
|
· |
ExpressJet leases an aircraft hangar complex located at the Baton Rouge Metropolitan Airport District. The complex includes a 39,000 square‑foot aircraft maintenance hangar and office facility. ExpressJet has the right to occupy the Baton Rouge facility rent‑free until 2023. |
|
· |
ExpressJet leases a 32,000 square‑foot aircraft maintenance facility in Richmond, Virginia. The lease agreement is scheduled to expire on October 31, 2018. |
|
· |
ExpressJet leases a 29,000 square-foot warehouse for the purpose of parts storage in Atlanta, Georgia. The lease agreement is scheduled to expire on May 31, 2018. |
|
· |
ExpressJet leases a 20,000 square‑foot facility at the Hartsfield‑Jackson Atlanta International Airport which serves as ExpressJet’s corporate headquarters. The lease agreement for this facility has a seven‑year term and is scheduled to expire on July 31, 2018. |
Our management deems the current facilities of SkyWest, SkyWest Airlines and ExpressJet as being suitable to support existing operations and believes these facilities will be adequate for the foreseeable future.
We are subject to certain legal actions which we consider routine to our business activities. As of December 31, 2017, our management believed, after consultation with legal counsel, that the ultimate outcome of such legal matters was not likely to have a material adverse effect on our financial position, liquidity or results of operations.
27
ITEM 4. MINE SAFETY DISCLOSURES
The disclosure required by this item is not applicable.
PART II
ITEM 5. MARKET FOR REGISTRANT’S COMMON EQUITY, RELATED STOCKHOLDER MATTERS AND ISSUER PURCHASES OF EQUITY SECURITIES
Market Price for Our Common Stock
Our common stock is traded on The Nasdaq Global Select Market under the symbol “SKYW.” As of February 16, 2018, there were approximately 768 stockholders of record of our common stock. Securities held of record do not include shares held in securities position listings. The following table sets forth the range of high and low closing sales prices for our common stock, during the periods indicated.
|
|
|
2017 |
|
2016 |
|
||||||||
|
Quarter |
|
High |
|
Low |
|
High |
|
Low |
|
||||
|
First |
|
$ |
37.45 |
|
$ |
32.75 |
|
$ |
20.08 |
|
$ |
14.19 |
|
|
Second |
|
|
37.50 |
|
|
30.40 |
|
|
26.46 |
|
|
18.77 |
|
|
Third |
|
|
44.40 |
|
|
32.05 |
|
|
29.78 |
|
|
25.36 |
|
|
Fourth |
|
|
54.55 |
|
|
43.20 |
|
|
39.30 |
|
|
27.70 |
|
The transfer agent for our common stock is Zions First National Bank, Salt Lake City, Utah.
Dividends
During 2017, our Board of Directors declared regular quarterly dividends of $0.08 per share. Our Board of Directors declared regular quarterly dividends of $0.04 per share for the first quarter of 2016 and $0.05 per share for the second, third and fourth quarters of 2016. We intend to continue to pay quarterly dividends subject to liquidity, capital availability and quarterly determinations that cash dividends are in the best interests of our shareholders.
Issuer Purchases of Equity Securities
Our Board of Directors has adopted a stock repurchase program which authorizes us to repurchase shares of our common stock in the public market or in private transactions, from time to time, at prevailing prices. Our stock repurchase program currently authorizes the repurchase of up to $100.0 million of our common stock. The following table summarizes our purchases under our stock repurchase program during the three months ended December 31, 2017:
|
|
|
Total Number of |
|
Average Price |
|
Total Number of Shares |
|
Maximum Dollar Value of |
||
|
November 1, 2017 - November 31, 2017 |
|
110,497 |
|
$ |
46.90 |
|
110,497 |
|
$ |
84,807 |
|
December 1, 2017 - December 31, 2017 |
|
92,258 |
|
|
52.18 |
|
92,258 |
|
|
79,992 |
|
Total |
|
202,755 |
|
$ |
49.30 |
|
202,755 |
|
$ |
79,992 |
|
(1) |
On February 9, 2017, we announced that our Board of Directors authorized the repurchase of up to $100.0 million of our common stock over the next three years. Purchases are made at management’s discretion based on market conditions and financial resources. As of December 31, 2017, we had repurchased approximately 484,000 shares of our common stock for $20.0 million under this authorization. |
28
Stock Performance Graph
The following Performance Graph and related information shall not be deemed “soliciting material” or “filed” with the SEC, nor shall such information be incorporated by reference into any future filing under the Securities Act of 1933, as amended, or the Securities Exchange Act of 1934, as amended (the “Exchange Act”), except to the extent we specifically incorporate it by reference into such filing.
The following graph compares the cumulative total shareholder return on our common stock over the five‑year period ended December 31, 2017, with the cumulative total return during such period of the Nasdaq Stock Market (U.S. Companies) and the Nasdaq Stock Market Transportation Index. The following graph assumes an initial investment of $100.00 with dividends reinvested. The stock performance shown on the graph below represents historical stock performance and is not necessarily indicative of future stock price performance.
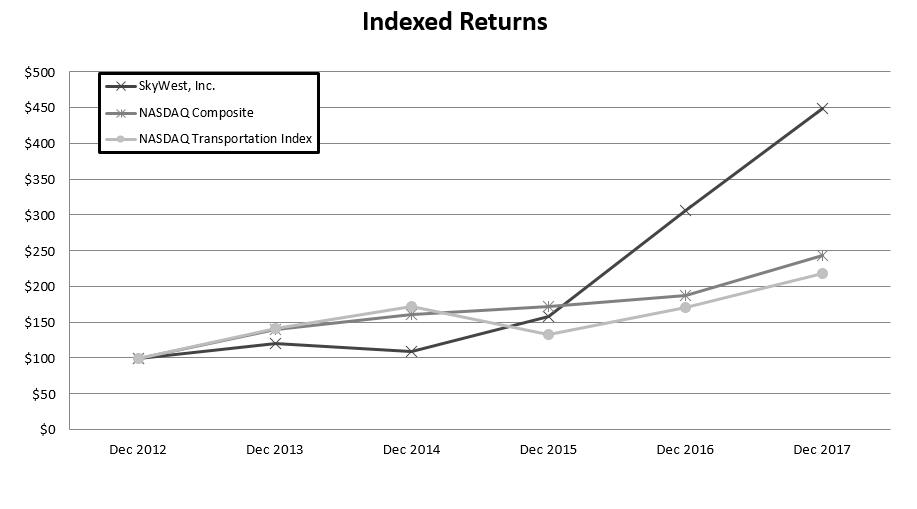
|
|
|
INDEXED RETURNS |
|
||||||||||
|
|
|
Base |
|
|
|
|
|
|
|
|
|
|
|
|
|
|
Period |
|
Years Ending |
|
||||||||
|
Company Name / Index |
|
2012 |
|
2013 |
|
2014 |
|
2015 |
|
2016 |
|
2017 |
|
|
SkyWest, Inc. |
|
100 |
|
120.38 |
|
109.71 |
|
158.69 |
|
306.30 |
|
448.91 |
|
|
NASDAQ Composite |
|
100 |
|
140.12 |
|
160.78 |
|
171.97 |
|
187.22 |
|
242.71 |
|
|
NASDAQ Transportation Index |
|
100 |
|
141.60 |
|
171.91 |
|
132.47 |
|
171.17 |
|
218.34 |
|
ITEM 6. SELECTED FINANCIAL DATA
The following selected financial and operating data should be read in conjunction with “Management’s Discussion and Analysis of Financial Condition and Results of Operations,” and our consolidated financial statements and related notes included elsewhere in this Report.
29
Selected Consolidated Financial Data (amounts in thousands, except per share data):
|
|
|
Year ended December 31, |
|
|||||||||||||
|
|
|
2017 |
|
2016 |
|
2015 |
|
2014 |
|
2013 |
|
|||||
|
Operating revenues |
|
$ |
3,204,268 |
|
$ |
3,121,206 |
|
$ |
3,095,563 |
|
$ |
3,237,447 |
|
$ |
3,297,725 |
|
|
Operating income (loss)(1) |
|
|
388,199 |
|
|
(172,684) |
|
|
234,515 |
|
|
24,848 |
|
|
153,111 |
|
|
Net income (loss)(2) |
|
|
428,907 |
|
|
(161,586) |
|
|
117,817 |
|
|
(24,154) |
|
|
58,956 |
|
|
Net income (loss) per common share: |
|
|
|
|
|
|
|
|
|
|
|
|
|
|
|
|
|
Basic |
|
$ |
8.28 |
|
$ |
(3.14) |
|
$ |
2.31 |
|
$ |
(0.47) |
|
$ |
1.14 |
|
|
Diluted |
|
$ |
8.08 |
|
$ |
(3.14) |
|
$ |
2.27 |
|
$ |
(0.47) |
|
$ |
1.12 |
|
|
Weighted average shares: |
|
|
|
|
|
|
|
|
|
|
|
|
|
|
|
|
|
Basic |
|
|
51,804 |
|
|
51,505 |
|
|
51,077 |
|
|
51,237 |
|
|
51,688 |
|
|
Diluted |
|
|
53,100 |
|
|
51,505 |
|
|
51,825 |
|
|
51,237 |
|
|
52,422 |
|
|
Total assets(3) |
|
$ |
5,458,279 |
|
$ |
5,007,966 |
|
$ |
4,781,984 |
|
$ |
4,388,818 |
|
$ |
4,214,582 |
|
|
Current assets(3) |
|
|
995,133 |
|
|
917,792 |
|
|
1,017,570 |
|
|
1,089,501 |
|
|
1,287,568 |
|
|
Current liabilities |
|
|
820,825 |
|
|
747,265 |
|
|
748,026 |
|
|
691,065 |
|
|
625,910 |
|
|
Long-term debt, net of current maturities |
|
|
2,377,346 |
|
|
2,240,051 |
|
|
1,659,234 |
|
|
1,548,390 |
|
|
1,306,370 |
|
|
Stockholders’ equity |
|
|
1,754,322 |
|
|
1,350,943 |
|
|
1,506,435 |
|
|
1,400,346 |
|
|
1,434,939 |
|
|
Return (loss) on average equity(4) |
|
|
27.6 |
% |
|
(12.0) |
% |
|
7.8 |
% |
|
(1.7) |
% |
|
4.2 |
% |
|
Cash dividends declared per common share |
|
$ |
0.32 |
|
$ |
0.19 |
|
$ |
0.16 |
|
$ |
0.16 |
|
$ |
0.16 |
|
|
(1) |
Our operating loss for 2016 included a special charge of $465.6 million related to an impairment on our 50-seat aircraft and related assets. Our 2014 operating income included a special charge of $74.8 million primarily related to an impairment on our EMB120 aircraft and ERJ145 long-lived assets. |
|
(2) |
Our net income for 2017 included a $246.8 million benefit related to the revaluation of our net deferred tax liability and other tax liabilities in accordance with the Tax Cuts and Jobs Act of 2017 that was enacted into law in December 2017. |
|
(3) |
Certain reclassifications were made to 2016 balances to conform to the current period presentation. See Note 1 to our Consolidated Financial Statements included in Item 8 of this Report. |
|
(4) |
Calculated by dividing net income (loss) by the average of beginning and ending stockholders’ equity for the year. |
Selected Operating Data
|
|
|
Year ended December 31, |
|
||||||||
|
|
|
2017 |
|
2016 |
|
2015 |
|
2014 |
|
2013 |
|
|
Block hours |
|
1,839,779 |
|
1,938,492 |
|
2,074,804 |
|
2,275,562 |
|
2,380,118 |
|
|
Departures |
|
1,087,052 |
|
1,153,480 |
|
1,226,897 |
|
1,357,454 |
|
1,453,601 |
|
|
Passengers carried |
|
51,483,552 |
|
53,539,438 |
|
56,228,593 |
|
58,962,010 |
|
60,581,948 |
|
|
Average passenger trip length |
|
512 |
|
523 |
|
528 |
|
534 |
|
525 |
|
|
Number of operating aircraft at end of year(1) |
|
595 |
|
652 |
|
660 |
|
717 |
|
755 |
|
|
(1) |
Excludes aircraft leased to un‑affiliated and affiliated entities. |
30
ITEM 7. MANAGEMENT’S DISCUSSION AND ANALYSIS OF FINANCIAL CONDITION AND RESULTS OF OPERATIONS
The following discussion and analysis presents factors that had a material effect on our results of operations during the years ended December 31, 2017, 2016 and 2015. Also discussed is our financial position as of December 31, 2017 and 2016. You should read this discussion in conjunction with our consolidated financial statements, including the notes thereto, appearing elsewhere in this Report or incorporated herein by reference. This discussion and analysis contains forward‑looking statements. Please refer to the sections of this Report entitled “Cautionary Statement Concerning Forward‑looking Statements” and “Item 1A. Risk Factors” for discussion of some of the uncertainties, risks and assumptions associated with these statements.
Overview
Through SkyWest Airlines and ExpressJet, we have the largest regional airline operations in the United States. As of December 31, 2017, SkyWest Airlines and ExpressJet offered scheduled passenger and air freight service with approximately 2,980 total daily departures to destinations in the United States, Canada, Mexico and the Caribbean. As of December 31, 2017, we had 595 aircraft available for scheduled service consisting of the following:
|
|
|
CRJ200 |
|
CRJ700 |
|
CRJ900 |
|
ERJ135 |
|
ERJ145 |
|
E175 |
|
Total |
|
|
United |
|
81 |
|
20 |
|
— |
|
3 |
|
109 |
|
65 |
|
278 |
|
|
Delta |
|
94 |
|
60 |
|
52 |
|
— |
|
— |
|
19 |
|
225 |
|
|
American |
|
16 |
|
49 |
|
— |
|
— |
|
— |
|
— |
|
65 |
|
|
Alaska |
|
4 |
|
— |
|
— |
|
— |
|
— |
|
23 |
|
27 |
|
|
Aircraft in scheduled service |
|
195 |
|
129 |
|
52 |
|
3 |
|
109 |
|
107 |
|
595 |
|
|
Subleased to an un-affiliated entity |
|
4 |
|
— |
|
— |
|
— |
|
— |
|
— |
|
4 |
|
|
Other* |
|
9 |
|
7 |
|
— |
|
— |
|
8 |
|
— |
|
24 |
|
|
Total Fleet |
|
208 |
|
136 |
|
52 |
|
3 |
|
117 |
|
107 |
|
623 |
|
*As of December 31, 2017, these aircraft have been removed from service and are in the process of being returned under the applicable leasing arrangement or are aircraft transitioning between code-share agreements with our major airline partners. During the year ended December 31, 2017, we sold eleven owned EMB120 30-seat turboprop aircraft at net book value.
Our business model is based on providing scheduled regional airline service under code-share agreements (commercial agreements between airlines that, among other things, allow one airline to use another airline’s flight designator codes on its flights) with our major airline partners. Our success is principally centered on our ability to meet the needs of our major airline partners through providing a reliable and safe operation at attractive economics. Over the last several years, our business has evolved as we have added 21 new E175 aircraft to our fleet since December 31, 2016, removed 47 50-seat ERJ145 aircraft and 18 50 seat CRJ200 aircraft that were operating under less profitable or unprofitable flying agreements.
We anticipate our fleet will continue to evolve in 2018 as we are scheduled to add 42 new E175 to existing fixed-fee agreements by the end of 2018 or early 2019. We also anticipate certain fleet reductions, primarily due to the wind down of the ExpressJet Delta Connection Agreement. Our primary objective in the fleet changes is to improve our profitability by adding new aircraft to fixed-fee agreements at improved economics, including the E175 aircraft, while removing aircraft that were operating under less profitable or unprofitable arrangements.
For the year ended December 31, 2017, approximately 46.7% of our aircraft in scheduled service were operated for United, approximately 37.8% were operated for Delta, approximately 10.9% were operated for American and approximately 4.6% were operated for Alaska.
Historically, multiple contractual relationships with major airlines have enabled us to reduce our reliance on any single major airline code and to enhance and stabilize operating results through a mix of fixed‑fee arrangements and our prorate flying arrangements. For the year ended December 31, 2017, contract flying revenue and prorate revenue represented approximately 88% and 12%, respectively, of our total passenger revenues. On contract routes, the major
31
airline partner controls scheduling, ticketing, pricing and seat inventories and we are compensated by the major airline partner at contracted rates based on completed block hours (measured from takeoff to landing, including taxi time), flight departures and other operating measures.
Financial Highlights
We had total operating revenues of $3.2 billion for the year ended December 31, 2017, a 2.5% increase, compared to total operating revenues of $3.1 billion for the year ended December 31, 2016. We had a net income of $428.9 million, or $8.08 per diluted share, for the year ended December 31, 2017, compared to a net loss of $161.6 million, or $(3.14) per diluted share, for the year ended December 31, 2016. Our results for 2017 included a $246.8 million benefit related to the revaluation of our net deferred tax liability and other tax liabilities in accordance with the Tax Cuts and Jobs Act that was enacted into law in December 2017. Our results for 2016 included a non-cash impairment charge of $465.6 million (pre-tax) primarily attributable to assets associated with our 50-seat aircraft.
The significant items affecting our financial performance during the year ended December 31, 2017 are outlined below:
Revenue
The number of aircraft we have in scheduled service and the number of block hours we generate on our flights are primary drivers to our passenger revenues under our fixed-fee arrangements. During 2017, we had a net reduction in the number of aircraft operating under fixed-fee agreements. As summarized under the Fleet Activity section below, from December 31, 2016 to December 31, 2017, we removed 78 aircraft from service that were operating under less profitable flying contracts and added 21 aircraft to new or existing fixed-fee arrangements at improved economics. The number of aircraft available for scheduled service decreased from 652 aircraft at December 31, 2016 to 595 at December 31, 2017, or by 8.7%. Our completed block hours decreased 5.1% primarily due to the reduced fleet size during 2017.
Despite the net reduction in our fleet size and block hour production since 2016, our total passenger revenue increased 2.5% from 2016 to 2017 primarily due to higher compensation we earned on aircraft, including new aircraft added in 2017, partially offset by a decrease in revenue associated with the aircraft removed from our fleet. Additionally, SkyWest Airlines took delivery of 19 E175 aircraft during the fourth quarter of 2016, which had only a partial quarter impact on 2016 revenue for comparability purposes to the 2017 year.
Operating Expenses
The decrease in our operating expense from 2016 to 2017 of $477.8 million, or 14.5%, was related primarily to a non-cash impairment of $465.6 million recorded in 2016 primarily attributable to the write-down of certain long-lived assets associated with our 50-seat aircraft. We did not have an impairment in 2017. The remaining decrease in our direct operating costs was primarily associated with the reduction to our fleet size of 8.7% from 2016 to 2017.
Fleet Activity
The following table summarizes our fleet activity for 2017:
|
Aircraft in Service |
|
December 31, 2016 |
|
Additions |
|
Removals |
|
December 31, 2017 |
|
|
CRJ200s |
|
213 |
|
— |
|
(18) |
|
195 |
|
|
CRJ700s |
|
130 |
|
— |
|
(1) |
|
129 |
|
|
CRJ900s |
|
64 |
|
— |
|
(12) |
|
52 |
|
|
ERJ145/135s |
|
159 |
|
— |
|
(47) |
|
112 |
|
|
E175s |
|
86 |
|
21 |
|
— |
|
107 |
|
|
Total |
|
652 |
|
21 |
|
(78) |
|
595 |
|
32
The additional 21 E175 aircraft were new aircraft we acquired and placed into fixed-fee contracts during 2017. The 18 CRJ200s, 47 ERJ145s, twelve CRJ900s and one CRJ700 were aircraft removed from scheduled service during 2017 and were either leased aircraft that were returned to lessors (or in the process of being returned to lessors) or owned aircraft that were sold to third parties.
Fleet Developments
As of December 31, 2017, we had 107 E175 aircraft in service. We have agreements with multiple major airline partners to place 42 new E175/E175 SC aircraft into fixed-fee contracts by the end of 2018 or early 2019.
During 2017, ExpressJet and Delta mutually agreed to initiate the wind down of the ExpressJet Delta Connection Agreement by the end of 2018. As of December 31, 2017, ExpressJet operated 49 CRJ700s/900s under the ExpressJet Delta Connection Agreement. Of the 49 aircraft, ExpressJet anticipates returning 19 leased aircraft to Delta and removing 30 CRJ700 aircraft from service with Delta during 2018. ExpressJet is pursuing placement of the 30 CRJ700 aircraft with other major airline partners, of which eight aircraft are scheduled to be placed under an agreement with American following the removal from service with Delta.
Critical Accounting Policies
Our significant accounting policies are summarized in Note 1 to our Consolidated Financial Statements included in Item 8 of this Report. Critical accounting policies are those policies that are most important to the preparation of our consolidated financial statements and require management’s subjective and complex judgments due to the need to make estimates about the effect of matters that are inherently uncertain. Our critical accounting policies relate to revenue recognition, aircraft maintenance, aircraft leases, impairment of long‑lived assets, stock‑based compensation expense and fair value as discussed below. The application of these accounting policies involves the exercise of judgment and the use of assumptions as to future uncertainties and, as a result, actual results will likely differ, and could differ materially, from such estimates.
Revenue Recognition
Passenger and ground handling revenues are recognized when service is provided. Under our fixed-fee and prorate flying agreements with our major airline partners, revenue is considered earned when each flight is completed. Our agreements with our major airline partners contain certain provisions pursuant to which the parties could terminate the respective agreement, subject to certain rights of the other party, if certain performance criteria are not maintained. Our revenues could be impacted by a number of factors, including changes to the applicable code‑share agreements, contract modifications resulting from contract renegotiations and our ability to earn incentive payments contemplated under applicable agreements. In the event contracted rates are not finalized at a quarterly or annual financial statement date, we record that period’s revenues based on the lower of the prior period’s approved rates or our estimate of rates that will be implemented upon completion of negotiations. Also, in the event we have a reimbursement dispute with a major airline partner at a quarterly or annual financial statement date, we evaluate the dispute under established revenue recognition criteria and, provided the revenue recognition criteria have been met, we recognize revenue for that period based on our estimate of the resolution of the dispute. Accordingly, we are required to exercise judgment and use assumptions in the application of our revenue recognition policy. See “Recent Accounting Pronouncements” set forth below for a discussion of a new accounting standard that we anticipate is likely to have an impact on our revenue accounting beginning in 2018.
Maintenance
We use the direct‑expense method of accounting for our regional jet aircraft engine overhaul costs. Under this method, the maintenance liability is not recorded until the maintenance services are performed. With respect to engines on a portion of our fleet, a third‑party vendor provides our long‑term engine services covering the scheduled and unscheduled repairs for engines under our Fixed‑Rate Engine Contracts. Under the terms of the vendor agreement, we pay a set dollar amount per engine hour flown on a monthly basis and the third‑party vendor assumes the obligation to repair the engines at no additional cost to us, subject to certain specified exclusions. Thus, under the third‑party vendor agreement, we expense the engine maintenance costs as flight hours are incurred on the engines and using the contractual rate set forth in the agreement.
33
Aircraft Leases
Our fleet of aircraft in scheduled service includes 319 aircraft under lease. All of ExpressJet’s ERJ145 aircraft flying for United are leased from United for nominal amounts. In order to determine the proper classification of our leased aircraft as either operating leases or capital leases, we must make certain estimates at the inception of the lease relating to the economic useful life and the fair value of an asset as well as select an appropriate discount rate to be used in discounting future lease payments. These estimates are utilized by management in making computations as required by existing accounting standards that determine whether the lease is classified as an operating lease or a capital lease. All of our aircraft leases have been classified as operating leases, which results in rental payments being charged to expense over the terms of the related leases. Under the majority of our operating leases, we are required to meet half-time lease return conditions with the aircraft, which presumes at least 50 percent of the eligible flight time for certain components since the last overhaul remains when the aircraft is returned to the lessor. A liability for probable lease return costs is recorded after the aircraft has completed its last maintenance cycle prior to being returned. Additionally, operating leases are not reflected in our consolidated balance sheet and accordingly, neither a lease asset nor an obligation for future lease payments is reflected in our consolidated balance sheets. See “Recent Accounting Pronouncements” set forth below for a discussion of a new accounting standard that is likely to have an impact on our aircraft lease accounting beginning in 2019.
Impairment of Long‑Lived Assets
As of December 31, 2017, we had approximately $4.2 billion of property and equipment and related assets net of accumulated depreciation. Additionally, as of December 31, 2017, we had approximately $4.9 million in intangible assets. In accounting for these long‑lived and intangible assets, we make estimates about the expected useful lives of the assets, the expected residual values of certain of these assets, and the potential for impairment based on the fair value of the assets and the cash flows they generate. Factors indicating potential impairment include, but are not limited to, significant decreases in the market value of the long‑lived assets, a significant change in the condition of the long‑lived assets and operating cash flow losses associated with the use of the long‑lived assets. When considering whether or not impairment of long‑lived assets exists, we group similar assets together at the lowest level for which identifiable cash flows are largely independent of the cash flows of other assets and liabilities and compare the undiscounted cash flows for each asset group to the net carrying amount of the assets supporting the asset group. Asset groupings are done at the fleet type or contract level. We did not have any impairment charges during the year ended December 31, 2017.
Stock‑Based Compensation Expense
Restricted stock units (“RSUs”) are awarded to eligible employees and entitle the grantee to receive shares of common stock at the end of the vest period. Performance Share Units (“PSUs”) are awarded to certain employees to receive shares of common stock if specific performance targets are achieved. At the end of each performance period, the number of shares awarded can range from 0% to 200% of the original 2017 grant amount for performance share units and can range from 0% to 150% of the original 2015 and 2016 grant amounts for performance shares, depending on the performance against the pre-established targets. The fair value of the RSUs and PSUs are based on the trailing 20-day average stock price as of the date of grant and “cliff vest” after three years. Expense is recognized over the three year vesting period.
Fair value
We hold certain assets that are required to be measured at fair value in accordance with U.S. Generally Accepted Accounting Principles. We determined fair value of these assets based on the following three levels of inputs:
|
Level 1—Quoted prices in active markets for identical assets or liabilities. |
|
Level 2—Observable inputs other than Level 1 prices such as quoted prices for similar assets or liabilities; quoted prices in markets that are not active; or other inputs that are observable or can be corroborated by observable market data for substantially the full term of the assets or liabilities. Some of our marketable securities primarily utilize broker quotes in a non‑active market for valuation of these securities. |
34
|
Level 3—Unobservable inputs that are supported by little or no market activity and that are significant to the fair value of the assets or liabilities, therefore requiring an entity to develop its own assumptions. |
We utilize several valuation techniques in order to assess the fair value of our financial assets and liabilities. Our cash and cash equivalents primarily utilize quoted prices in active markets for identical assets or liabilities.
Recent Accounting Pronouncements
See Note 1 to the Consolidated Financial Statements included in Item 8 of this Report for a description of recent accounting pronouncements.
Other Accounting Items
Under our fixed‑fee arrangements, three components may have a significant impact on comparability of revenue and operating expense for the periods presented in this Report. The first item is the reimbursement of fuel expense, which is a directly‑reimbursed expense under all of our fixed‑fee arrangements. If we purchase fuel directly from vendors, our major airline partners reimburse us for fuel expense incurred under each respective fixed‑fee contract, and we record such reimbursement as passenger revenue. Thus, the price volatility of fuel and the volume of fuel expensed under our fixed‑fee arrangements during a particular period will impact our fuel expense and our passenger revenue during the period equally, with no impact on our operating income. Over the past few years, some of our major airline partners have purchased an increased volume of fuel directly from vendors on flights we operated under our fixed‑fee contracts, which has decreased both revenue and operating expenses compared to previous periods presented in this Report.
The second item is the reimbursement of landing fees and station rents, which is a directly‑reimbursed expense under all of our fixed‑fee arrangements. Our major airline partners reimburse us for landing fees and station rent expense incurred under each respective fixed‑fee contract, and we record such reimbursement as passenger revenue. Over the past few years, some of our major airline partners have paid an increased volume of landing fees and station rents directly to our vendors on flights we operated under our flying contracts, which has also decreased both revenue and operating expenses compared to previous periods presented in this Report.
The third item is the compensation we receive for engine maintenance under our fixed‑fee arrangements. Under certain of our fixed-fee contracts, a portion of our compensation is based upon fixed hourly rates the aircraft is in operation, which is intended to cover our engine maintenance costs (“Fixed‑Rate Engine Contracts”). Under the remainder of our fixed-fee contracts, our major airline partner directly reimburses us for engine maintenance expense when the expense is incurred as a pass‑through cost (“Directly‑Reimbursed Engine Contracts”).
Because we recognize revenue using the applicable fixed hourly rates under our Fixed‑Rate Engine Contracts, the number of engine maintenance events and related expense we incur may vary between reporting periods under such contracts, which may impact the comparability of our operating income for the presented reporting periods.
Because we recognize revenue and engine overhaul expense in the same amount and in the same period when we incur engine maintenance expense on engines operating under our Directly‑Reimbursed Engine Contracts, the number of engine events and related expense we incur each reporting period does not have a direct impact on our operating income for the presented reporting periods.
We use the direct‑expense method of accounting for our regional jet aircraft engine overhaul costs and, accordingly, we recognize engine maintenance expense on our engines on an as‑incurred basis. Under the direct‑expense method, the maintenance liability is recorded when the maintenance services are performed (“Engine Overhaul Expense”).
We have an agreement with a third‑party vendor to provide long‑term engine maintenance covering scheduled and unscheduled repairs for engines on certain of our CRJs and E175s operating under our Fixed‑Rate Engine Contracts (a “Power-by-the-Hour Agreement”). Under the terms of the Power-by-the-Hour Agreement, we are obligated to pay a set dollar amount per engine hour flown on a monthly basis and the vendor assumes the obligation to repair the engines at no additional cost to us, subject to certain specified exclusions. Thus, under the Power-by-the-Hour Agreement, we
35
expense the engine maintenance costs as flight hours are incurred on the engines and using the contractual rate set forth in the agreement. The table below summarizes how we are compensated by our major airline partners under our flying contracts for engine expense and the method we use to recognize the corresponding expense.
|
Flying Contract |
|
Compensation of Engine Expense |
|
Expense Recognition |
|
SkyWest Delta Connection (CRJs) |
|
Directly-Reimbursed Engine Contracts |
|
Direct Expense |
|
SkyWest Delta Connection (E175) |
|
Fixed-Rate Engine Contracts |
|
Power-by-the-Hour Agreement |
|
ExpressJet Delta Connection (CRJs) |
|
Directly-Reimbursed Engine Contracts |
|
Direct Expense |
|
SkyWest United Express (CRJ200, CRJ700, E175) |
|
Fixed-Rate Engine Contracts |
|
Power-by-the-Hour Agreement |
|
ExpressJet United (ERJ145) |
|
Directly-Reimbursed Engine Contracts |
|
Power-by-the-Hour Agreement |
|
Alaska Agreement (CRJ200, CRJ700) |
|
Fixed-Rate Engine Contracts |
|
Power-by-the-Hour Agreement |
|
Alaska Agreement (E175) |
|
Fixed-Rate Engine Contracts |
|
Power-by-the-Hour Agreement |
|
SkyWest American Agreement (CRJ200, CRJ700) |
|
Fixed-Rate Engine Contracts |
|
Power-by-the-Hour Agreement |
|
ExpressJet American Agreement (CRJ700) |
|
Fixed-Rate Engine Contracts |
|
Power-by-the-Hour Agreement |
Results of Operations
2017 Compared to 2016
Operational Statistics. The following table sets forth our major operational statistics and the associated percentages of change for the periods identified below. The decrease in block hours, departures and passengers carried during the year ended December 31, 2017, compared to the year ended December 31, 2016, was primarily due to a net reduction in our operating fleet from 652 aircraft to 595 aircraft.
|
|
|
For the year ended December 31, |
|
||||
|
|
|
2017 |
|
2016 |
|
% Change |
|
|
Block hours |
|
1,839,779 |
|
1,938,492 |
|
(5.1) |
% |
|
Departures |
|
1,087,052 |
|
1,153,480 |
|
(5.8) |
% |
|
Passengers carried |
|
51,483,552 |
|
53,539,438 |
|
(3.8) |
% |
|
Passenger load factor |
|
80.4 |
% |
82.1 |
% |
(1.7) |
pts |
|
Average passenger trip length (miles) |
|
512 |
|
523 |
|
(2.1) |
% |
Revenues. Total operating revenues increased $83.1 million, or 2.7%, during the year ended December 31, 2017, compared to the year ended December 31, 2016, primarily due to higher compensation earned on aircraft added to our fleet and improved economics on flying contract renewals, partially offset by a reduction in revenue from aircraft removed from unprofitable or less profitable flying contracts since 2016, as further explained in the “Passenger revenues” section below. Under certain of our fixed-fee contracts, certain expenses are subject to direct reimbursement from our major airline partners and we record such reimbursements as passenger revenue. These reimbursed expenses include fuel, landing fees, station rents and certain engine maintenance expenses. The following table summarizes our passenger revenues and the amount of fuel, landing fees, station rents, and engine maintenance incurred under our fixed-fee agreements. The direct reimbursement was included in our passenger revenues for the periods indicated (dollar amounts in thousands).
|
|
|
For the year ended December 31, |
|
|||||||||
|
|
|
2017 |
|
2016 |
|
$ Change |
|
% Change |
|
|||
|
Passenger revenues |
|
$ |
3,126,708 |
|
$ |
3,051,414 |
|
$ |
75,294 |
|
2.5 |
% |
|
Less: directly-reimbursed fuel from airline partners |
|
|
77,517 |
|
|
51,583 |
|
|
25,934 |
|
50.3 |
% |
|
Less: directly-reimbursed landing fee and station rent from airline partners |
|
|
13,002 |
|
|
18,739 |
|
|
(5,737) |
|
(30.6) |
% |
|
Less: directly-reimbursed engine maintenance from airline partners |
|
|
68,531 |
|
|
62,782 |
|
|
5,749 |
|
9.2 |
% |
|
Passenger revenue excluding directly-reimbursed fuel, landing fee, station rent and engine maintenance |
|
$ |
2,967,658 |
|
$ |
2,918,310 |
|
$ |
49,348 |
|
1.7 |
% |
36
Passenger revenues. The $75.3 million, or 2.5%, increase in passenger revenues during the year ended December 31, 2017, compared to the year ended December 31, 2016, was partially attributed to an increase in the amount of directly-reimbursed fuel expenses incurred under our fixed-fee contracts of $25.9 million in the year ended December 31, 2017, compared to the year ended December 31, 2016. The increase in directly-reimbursed fuel expense was primarily due to higher average fuel cost per gallon in 2017 compared to 2016 and an increase in the volume of gallons that we purchased. Our fuel expense, landing fees, station rents and directly‑reimbursed engine expense increased by $25.9 million during the year ended December 31, 2017, compared to the year ended December 31, 2016.
Passenger revenue excluding directly-reimbursed fuel, landing fees, station rents and engine maintenance increased $49.3 million, or 1.7%, in the year ended December 31, 2017, compared to the year ended December 31, 2016, due to higher compensation we earned on aircraft, including new aircraft added in 2017, partially offset by a decrease in revenue associated with the aircraft removed from our fleet. Additionally, SkyWest Airlines took delivery of 19 E175 aircraft during the fourth quarter of 2016, which had only a partial quarter impact on 2016 revenue for comparability purposes to the 2017 year.
Ground handling and other. Total ground handling and other revenues increased $7.8 million, or 11.1%, during the year ended December 31, 2017, compared to the year ended December 31, 2016. Ground handling and other revenue primarily consists of ground handling services we provide to third‑party airlines and government subsidies we receive for operating certain routes under our prorate agreements. Revenues associated with ground handling services we provide for our aircraft are recorded as passenger revenues. The increase was primarily related to an increase in ground handling operations provided to third-party airlines on a short-term contract basis.
Individual expense components attributable to our operations are set forth in the following table (dollar amounts in thousands).
|
|
|
For the year ended December 31, |
|
||||||||||
|
|
|
2017 |
|
2016 |
|
$ Change |
|
% Change |
|
|
|||
|
|
|
Amount |
|
Amount |
|
Amount |
|
Percent |
|
|
|||
|
Salaries, wages and benefits |
|
$ |
1,196,227 |
|
$ |
1,211,380 |
|
$ |
(15,153) |
|
(1.3) |
% |
|
|
Aircraft maintenance, materials and repairs |
|
|
579,463 |
|
|
569,306 |
|
|
10,157 |
|
1.8 |
% |
|
|
Depreciation and amortization |
|
|
292,768 |
|
|
284,969 |
|
|
7,799 |
|
2.7 |
% |
|
|
Aircraft rentals |
|
|
215,807 |
|
|
262,602 |
|
|
(46,795) |
|
(17.8) |
% |
|
|
Aircraft fuel |
|
|
162,653 |
|
|
122,284 |
|
|
40,369 |
|
33.0 |
% |
|
|
Ground handling services |
|
|
69,848 |
|
|
72,659 |
|
|
(2,811) |
|
(3.9) |
% |
|
|
Special items |
|
|
— |
|
|
465,649 |
|
|
(465,649) |
|
NM |
|
|
|
Other operating expenses |
|
|
299,303 |
|
|
305,041 |
|
|
(5,738) |
|
(1.9) |
% |
|
|
Total operating expenses |
|
$ |
2,816,069 |
|
$ |
3,293,890 |
|
$ |
(477,821) |
|
(14.5) |
% |
|
|
Interest expense |
|
|
104,925 |
|
|
78,177 |
|
|
26,748 |
|
34.2 |
% |
|
|
Total airline expenses |
|
$ |
2,920,994 |
|
$ |
3,372,067 |
|
$ |
(451,073) |
|
(13.4) |
% |
|
Salaries, Wages and Employee Benefits. The $15.2 million, or 1.3%, decrease in salaries, wages and employee benefits during the year ended December 31, 2017, compared to the year ended December 31, 2016, was primarily due to a decrease in direct labor costs resulting from a net reduction in our fleet size and related level of departures and block hours, which was partially offset by higher crew compensation costs resulting from labor agreements executed since 2016.
Aircraft maintenance, materials and repairs. The following table summarizes the effect of directly-reimbursed engine maintenance costs under our fixed-fee arrangements included in our aircraft maintenance expense for the periods indicated (dollar amounts in thousands).
37
|
|
|
For the year ended December 31, |
|
|||||||||
|
|
|
2017 |
|
2016 |
|
$ Change |
|
% Change |
|
|||
|
Aircraft maintenance, materials and repairs |
|
$ |
579,463 |
|
$ |
569,306 |
|
$ |
10,157 |
|
1.8 |
% |
|
Less: directly-reimbursed engine maintenance from airline partners |
|
|
68,531 |
|
|
62,782 |
|
|
5,749 |
|
9.2 |
% |
|
Other aircraft maintenance, materials and repairs |
|
$ |
510,932 |
|
$ |
506,524 |
|
$ |
4,408 |
|
0.9 |
% |
The $4.4 million, or 0.9%, increase in aircraft maintenance expense (excluding directly-reimbursed engine overhaul costs) during the year ended December 31, 2017, compared to the year ended December 31, 2016, was primarily due to an increase in the percentage of our fleet that is under long-term Power-by-the-Hour maintenance agreements, including the additional 21 E175 aircraft added since December 31, 2016, which was partially offset by a decrease in direct maintenance costs that corresponds with our net decrease in fleet size and block hour reduction of 5.1%. The increase in directly-reimbursed engine overhaul costs was primarily due to an increase in the number of overhaul events on aircraft operating under the applicable fixed-fee flying contracts.
Depreciation and amortization. The $7.8 million, or 2.7%, increase in depreciation and amortization expense during the year ended December 31, 2017, compared to the year ended December 31, 2016, was primarily due to the purchase of 21 additional E175 aircraft and related long-lived aircraft parts in 2017. Additionally, we acquired 19 E175 aircraft in the fourth quarter of 2016 that only had a partial year of depreciation in 2016.
Aircraft rentals. The $46.8 million, or 17.8%, decrease in aircraft rentals during the year ended December 31, 2017, compared to the year ended December 31, 2016, was primarily due to a decrease in leased aircraft from 415 leased aircraft for the year ended to December 31, 2016, to 319 leased aircraft for the year ended December 31, 2017.
Aircraft fuel. The $40.4 million, or 33.0%, increase in fuel cost during the year ended December 31, 2017, compared to the year ended December 31, 2016, was primarily due to an increase in the average fuel cost per gallon in 2017 compared to 2016 and an increase in the volume of gallons that we purchased. The following table summarizes our aircraft fuel expenses and directly-reimbursed fuel expense under our fixed-fee arrangements, for the periods indicated (dollar amounts in thousands).
|
|
|
For the year ended December 31, |
|
|||||||||
|
|
|
2017 |
|
2016 |
|
$ Change |
|
% Change |
|
|||
|
Aircraft fuel expenses |
|
$ |
162,653 |
|
$ |
122,284 |
|
$ |
40,369 |
|
33.0 |
% |
|
Less: directly-reimbursed fuel from airline partners |
|
|
77,517 |
|
|
51,583 |
|
|
25,934 |
|
50.3 |
% |
|
Aircraft fuel less directly-reimbursed fuel from airline partners |
|
$ |
85,136 |
|
$ |
70,701 |
|
$ |
14,435 |
|
20.4 |
% |
The average fuel cost per gallon was $2.01 and $1.70 for the years ended December 31, 2017 and 2016, respectively. Under the majority of our fixed-fee agreements, our major airline partner will purchase the fuel directly from a third-party provider for flights operated under the fixed-fee agreement. We do not record the fuel expense when the major partner purchases the fuel directly from third parties. The following table summarizes the gallons of fuel we purchased directly and our fuel expense, for the periods indicated:
|
|
|
For the year ended December 31, |
|||||||
|
(in thousands) |
|
2017 |
|
2016 |
|
% Change |
|
||
|
Fuel gallons purchased |
|
|
80,767 |
|
|
72,011 |
|
12.2 |
% |
|
Fuel expense |
|
$ |
162,653 |
|
$ |
122,284 |
|
33.0 |
% |
Ground handling service. Ground handling service expense includes airport-related customer service costs (our employee customer service labor costs are reflected in salaries, wages and benefits) such as outsourced airport gate and ramp agent services, airport security fees and passenger interruption costs. The $2.8 million, or 3.9%, decrease in ground handling service expense during the year ended December 31, 2017, compared to the year ended December 31, 2016, was primarily due to a reduction in passenger interruption related costs during the year ended December 31, 2017.
Special items. Special items for the year ended December 31, 2016 included impairment charges and inventory valuation charges related to our 50-seat aircraft and related assets. We did not have any similar special items in 2017.
38
Other operating expenses. Other operating expenses, primarily consist of property taxes, hull and liability insurance, landing fees, station rents, simulator costs, crew per diem, and crew hotel costs. Under our fixed-fee arrangements, landing fee and station rental expense are directly-reimbursed expenses. The following table summarizes our other operating expenses (less directly-reimbursed landing fees and station rents under our fixed-fee arrangements) for the periods indicated (dollar amounts in thousands):
|
|
|
For the year ended December 31, |
|
||||||||||||||
|
|
|
2017 |
|
2016 |
|
$ Change |
|
% Change |
|
||||||||
|
Other operating expenses |
|
$ |
299,303 |
|
$ |
305,041 |
|
$ |
(5,738) |
|
(1.9) |
% |
|||||
|
Less: directly-reimbursed landing fee and station rent from airline partners |
|
|
13,002 |
|
|
18,739 |
|
|
(5,737) |
|
(30.6) |
% |
|||||
|
Other operating expenses less landing fee and station rent reimbursements from airline partners |
|
$ |
286,301 |
|
$ |
286,302 |
|
$ |
(1) |
|
(0.0) |
% |
|||||
Other operating expenses (less directly-reimbursed landing fees and station rents) was impacted by the decrease in our fleet size and in other operating costs that resulted from the reduction in block hour production of 5.1%, partially offset by additional training costs associated with E175 aircraft deliveries, including the use of simulators and hotels.
Interest Expense. The $26.7 million, or 34.2%, increase in interest expense during the year ended December 31, 2017, compared to the year ended December 31, 2016, was primarily due to the purchase of 21 additional E175 aircraft in 2017 financed through debt and an annualized impact of 41 E175 aircraft added throughout 2016 financed through debt.
Total airline expenses. Total airline expenses (consisting of total operating and interest expenses) decreased $451.1 million, or 13.4%, during the year ended December 31, 2017, compared to the year ended December 31, 2016. Under our contract flying arrangements, we are reimbursed by our major airline partners for our actual fuel costs, contract related station rents, landing fees and engine overhaul costs under our Directly‑Reimbursed Engine Contracts. We record such reimbursements as revenue. The following table summarizes the amount of fuel and engine overhaul expenses which are included in our total airline expenses for the periods indicated (dollar amounts in thousands).
|
|
|
For the year ended December 31, |
|
||||||||
|
|
|
2017 |
|
2016 |
|
$ Change |
|
% Change |
|
||
|
Total airline expense |
|
$ |
2,920,994 |
|
$ |
3,372,067 |
|
(451,073) |
|
(13.4) |
% |
|
Less: directly-reimbursed fuel from airline partners |
|
|
77,517 |
|
|
51,583 |
|
25,934 |
|
50.3 |
% |
|
Less: directly-reimbursed landing fee and station rent from airline partners |
|
|
13,002 |
|
|
18,739 |
|
(5,737) |
|
(30.6) |
% |
|
Less: directly-reimbursed engine maintenance from airline partners |
|
|
68,531 |
|
|
62,782 |
|
5,749 |
|
9.2 |
% |
|
Total airline expense excluding directly-reimbursed fuel, landing fee, station rent and engine maintenance |
|
$ |
2,761,944 |
|
$ |
3,238,963 |
|
(477,019) |
|
(14.7) |
% |
The $477.2 million, or 14.7%, decrease in total airline expenses, excluding directly-reimbursed fuel, station rents, landing fees and engine overhauls, during the year ended December 31, 2017, compared to the year ended December 31, 2016, was primarily due to the special items of $465.6 million relating to the 50-seat aircraft for the year ended December 31, 2016, and the reduction in fleet size and related block hour production of 5.1% during the year ended December 31, 2017, compared to the year ended December 31, 2016.
Summary of provision for income taxes:
Provision for income taxes. On December 22, 2017, the Tax Cuts and Jobs Act of 2017 (“Tax Act”) was signed into law, which reduced the statutory federal income tax rate from 35% to 21% effective January 1, 2018. We recorded a $246.8 million benefit during 2017 related to the revaluation of our net federal, state and other deferred tax liabilities based on our reasonable estimate of the effects of the Tax Act. We also recorded a $5.4 million benefit in 2017 relating to ASU 2016-09 which requires, beginning in 2017, excess tax benefits and deficiencies to be recognized in the income
39
tax provision during the period stock options are vested/exercised. We currently estimate our 2018 effective tax rate will generally range between 24% and 25% before discrete tax items.
Net Income (loss). Primarily due to the factors described above, we generated net income of $428.9 million, or $8.08 per diluted share, for the year ended December 31, 2017, compared to a net loss of $(161.6) million, or $(3.14) per diluted share, for the year ended December 31, 2016.
2016 Compared to 2015
Operational Statistics. The following table sets forth our major operational statistics and the associated percentages of change for the periods identified below.
|
|
|
For the year ended December 31, |
|
||||
|
|
|
2016 |
|
2015 |
|
% Change |
|
|
Block hours |
|
1,938,492 |
|
2,074,804 |
|
(6.6) |
% |
|
Departures |
|
1,153,480 |
|
1,226,897 |
|
(6.0) |
% |
|
Passengers carried |
|
53,539,438 |
|
56,228,593 |
|
(4.8) |
% |
|
Passenger load factor |
|
82.1 |
% |
82.6 |
% |
(0.5) |
pt |
|
Average passenger trip length (miles) |
|
523 |
|
528 |
|
(0.9) |
% |
Revenues. Total operating revenues increased $25.6 million, or 0.8%, during the year ended December 31, 2016, compared to the year ended December 31, 2015, primarily due to higher compensation earned on aircraft and the addition of 41 aircraft to our fleet, as further explained in the “Passenger revenues” section below. Under certain of our fixed-fee contracts, certain expenses are subject to direct reimbursement from our major airline partners and we record such reimbursements as passenger revenue. These reimbursed expenses include fuel, landing fees, station rents and certain engine maintenance expenses. The following table summarizes our passenger revenues and the amount of fuel, landing fees, station rents, and engine maintenance incurred under our fixed-fee agreements. The direct reimbursement was included in our passenger revenues for the periods indicated (dollar amounts in thousands).
|
|
|
For the year ended December 31, |
|
|||||||||
|
|
|
2016 |
|
2015 |
|
$ Change |
|
% Change |
|
|||
|
Passenger revenues |
|
$ |
3,051,414 |
|
$ |
3,030,023 |
|
$ |
21,391 |
|
0.7 |
% |
|
Less: directly-reimbursed fuel from airline partners |
|
|
51,583 |
|
|
41,567 |
|
|
10,016 |
|
24.1 |
% |
|
Less: directly-reimbursed landing fee and station rent from airline partners |
|
|
18,739 |
|
|
22,171 |
|
|
(3,432) |
|
(15.5) |
% |
|
Less: directly-reimbursed engine maintenance from airline partners |
|
|
62,782 |
|
|
94,142 |
|
|
(31,360) |
|
(33.3) |
% |
|
Passenger revenue excluding directly-reimbursed fuel, landing fee, station rent and engine maintenance |
|
$ |
2,918,310 |
|
$ |
2,872,143 |
|
$ |
46,167 |
|
1.6 |
% |
Passenger revenues. Passenger revenues increased $21.4 million, or 0.7%, during the year ended December 31, 2016, compared to the year ended December 31, 2015. Our passenger revenues, excluding fuel, landing fees, station rents and engine overhaul reimbursements from major airline partners, increased $46.2 million, or 1.6%, during the year ended December 31, 2016, compared to the year ended December 31, 2015. The increase in passenger revenues, excluding fuel, landing fees, station rents and engine overhaul reimbursements, was primarily due to higher compensation we earned on aircraft placed into service during 2016, improvements in the terms of certain of our flying contracts since 2015 and an $11.5 million favorable resolution of a flying agreement matter with one of our major airline partners in contrast to a reduction to revenue of $7.9 million in 2015 from a resolution of a contract matter with a major airline partner. This increase was partially offset by the 1.2% net reduction to our aircraft in scheduled service from 660 aircraft at December 31, 2015 to 652 aircraft at December 31, 2016. Our fuel expense, landing fees, station rents and directly‑reimbursed engine expense decreased by $24.7 million during the year ended December 31, 2016, as compared to the year ended December 31, 2015, due primarily to our major airline partners paying for landing fees and station rents directly to vendors on flights we operated under our fixed-fee arrangements and a reduction in the number of engine maintenance events.
40
Ground handling and other. Total ground handling and other revenues increased $4.3 million, or 6.5%, during the year ended December 31, 2016, compared to the year ended December 31, 2015. Ground handling and other revenue primarily consists of ground handling services we provide to third‑party airlines and government subsidies we receive for operating certain routes under our prorate agreements. Revenues associated with ground handling services we provide for our aircraft are recorded as passenger revenues. The increase in ground handling and other revenue was primarily due to an increased volume of departures during 2016 on routes subject to government subsidies, which was partially offset by a reduction in the number of locations for which SkyWest Airlines provided ground handling services to third-party airlines during 2016.
Individual expense components attributable to our operations are set forth in the following table (dollar amounts in thousands).
|
|
|
For the year ended December 31, |
|
||||||||||
|
|
|
|
|
|
|
|
|
|
|
|
|
|
|
|
|
|
2016 |
|
2015 |
|
$ Change |
|
% Change |
|
|
|||
|
|
|
Amount |
|
Amount |
|
Amount |
|
Percent |
|
|
|||
|
Salaries, wages and benefits |
|
$ |
1,211,380 |
|
$ |
1,203,312 |
|
$ |
8,068 |
|
0.7 |
% |
|
|
Aircraft maintenance, materials and repairs |
|
|
569,306 |
|
|
604,863 |
|
|
(35,557) |
|
(5.9) |
% |
|
|
Depreciation and amortization |
|
|
284,969 |
|
|
264,507 |
|
|
20,462 |
|
7.7 |
% |
|
|
Aircraft rentals |
|
|
262,602 |
|
|
273,696 |
|
|
(11,094) |
|
(4.1) |
% |
|
|
Aircraft fuel |
|
|
122,284 |
|
|
118,124 |
|
|
4,160 |
|
3.5 |
% |
|
|
Ground handling services |
|
|
72,659 |
|
|
82,694 |
|
|
(10,035) |
|
(12.1) |
% |
|
|
Special items |
|
|
465,649 |
|
|
— |
|
|
465,649 |
|
NM |
|
|
|
Other operating expenses |
|
|
305,041 |
|
|
313,852 |
|
|
(8,811) |
|
(2.8) |
% |
|
|
Total operating expenses |
|
|
3,293,890 |
|
|
2,861,048 |
|
|
432,842 |
|
15.1 |
% |
|
|
Interest expense |
|
|
78,177 |
|
|
75,850 |
|
|
2,327 |
|
3.1 |
% |
|
|
Total airline expenses |
|
$ |
3,372,067 |
|
$ |
2,936,898 |
|
$ |
435,169 |
|
14.8 |
% |
|
Salaries, Wages and Employee Benefits. Salaries, wages and employee benefits increased $8.1 million, or 0.7%, during the year ended December 31, 2016, compared to the year ended December 31, 2015. The increase in salaries, wages and employee benefits was primarily due to new pilot training costs associated with the 41 new E175 aircraft delivered in 2016 and an increase in employee healthcare costs, partially offset by the decrease in our fleet size and related decrease in the number of departures and block hours compared to the year ended December 31, 2015.
Aircraft maintenance, materials and repairs. Aircraft maintenance expense decreased $35.6 million, or 5.9%, during the year ended December 31, 2016, compared to the year ended December 31 2015. The following table summarizes the effect of directly-reimbursed engine maintenance costs under our fixed-fee arrangements included in our aircraft maintenance expense for the periods indicated (dollar amounts in thousands).
|
|
|
For the year ended December 31, |
|
|||||||||
|
|
|
2016 |
|
2015 |
|
$ Change |
|
% Change |
|
|||
|
Aircraft maintenance, materials and repairs |
|
$ |
569,306 |
|
$ |
604,863 |
|
$ |
(35,557) |
|
(5.9) |
% |
|
Less: directly-reimbursed engine maintenance from airline partners |
|
|
62,782 |
|
|
94,142 |
|
|
(31,360) |
|
(33.3) |
% |
|
Other aircraft maintenance, materials and repairs |
|
$ |
506,524 |
|
$ |
510,721 |
|
$ |
(4,197) |
|
(0.8) |
% |
Other aircraft maintenance, materials and repairs, excluding our directly-reimbursed engine overhaul costs, decreased $4.2 million, or 0.8%, during the year ended December 31, 2016, compared to the year ended December 31, 2015. The decrease in aircraft maintenance expense (excluding directly-reimbursed engine overhaul costs) was primarily due to a reduction in direct maintenance costs resulting from a reduced fleet size, partially offset by an increase in Power-by-the-Hour maintenance costs associated with the additional E175 aircraft added to our fleet since 2015 along with maintenance costs of $19.0 million associated with EMB120, CRJ200 and CRJ700 aircraft lease returns.
The decrease in our engine overhaul costs incurred under our Directly‑Reimbursed Engine Contracts was primarily due to a reduced number of engine overhaul events in 2016 compared to 2015.
41
Depreciation and amortization. Depreciation and amortization expense increased $20.5 million, or 7.7%, during the year ended December 31, 2016, compared to the year ended December 31, 2015. The increase in depreciation and amortization expense was primarily due to the purchase of 41 additional E175 aircraft and related long-lived aircraft parts in 2016.
Aircraft rentals. Aircraft rentals decreased $11.1 million, or 4.1%, during the year ended December 31, 2016, compared to the year ended December 31, 2015. The decrease was primarily related to eight CRJ700 aircraft removed from service and 15 CRJ200s leases that expired in 2016.
Fuel. Fuel costs increased $4.2 million, or 3.5%, during the year ended December 31, 2016, compared to the year ended December 31, 2015. The increase in fuel cost was primarily due to an increase in the volume in gallons that we purchased under our fixed-fee contracts, partially offset by the decrease in the average fuel cost per gallon in 2016 compared to 2015. The following table summarizes our aircraft fuel expenses and directly-reimbursed fuel expense under our fixed-fee arrangements, for the periods indicated (dollar amounts in thousands).
|
|
|
For the year ended December 31, |
|
|||||||||
|
|
|
2016 |
|
2015 |
|
$ Change |
|
% Change |
|
|||
|
Aircraft fuel expenses |
|
$ |
122,284 |
|
$ |
118,124 |
|
$ |
4,160 |
|
3.5 |
% |
|
Less: directly-reimbursed fuel from airline partners |
|
|
51,583 |
|
|
41,567 |
|
|
10,016 |
|
24.1 |
% |
|
Aircraft fuel less directly-reimbursed fuel from airline partners |
|
$ |
70,701 |
|
$ |
76,557 |
|
$ |
(5,856) |
|
(7.6) |
% |
The average fuel cost per gallon was $1.70 and $2.09 for the years ended December 31, 2016 and 2015, respectively. Under the majority of our fixed-fee agreements, our major airline partner will purchase the fuel directly from a third-party provider for flights operated under the fixed-fee agreement. We do not record the fuel expense when the major partner purchases the fuel directly from third parties. The following table summarizes the gallons of fuel we purchased directly and our fuel expense, for the periods indicated:
|
|
|
For the year ended December 31, |
|||||||
|
(in thousands) |
|
2016 |
|
2015 |
|
% Change |
|
||
|
Fuel gallons purchased |
|
|
72,011 |
|
|
56,389 |
|
27.7 |
% |
|
Fuel expense |
|
$ |
122,284 |
|
$ |
118,124 |
|
3.5 |
% |
Ground handling service. Ground handling service expense decreased $10.0 million, or 12.1%, during the year ended December 31, 2016, compared to the year ended December 31, 2015. The decrease in ground handling service expense was primarily due to a reduction in passenger liability insurance costs along with a decrease in the number of locations for which SkyWest Airlines provides ground handling services subsequent to December 31, 2015.
Special items. Special items for the year ended December 31, 2016 included impairment charges and inventory valuation charges comprised of the following: $374.1 million impairment for CRJ200 aircraft, $61.5 million impairment for CRJ and ERJ fixed asset spare aircraft parts and engines, a net $6.2 million impairment for CRJ long-term prepaid aircraft rents and other considerations and $23.8 million inventory write-down for excess CRJ and ERJ inventory parts. These charges are net of $90 million in cash proceeds and other considerations from the Bombardier termination agreement.
42
Other operating expenses. Other operating expenses, primarily consist of property taxes, hull and liability insurance, landing fees, station rents, simulator costs, crew per diem, and crew hotel costs. Under our fixed-fee arrangements, landing fee and station rental expense are directly-reimbursed expenses. The following table summarizes our other operating expenses (less directly-reimbursed landing fees and station rents under our fixed-fee arrangements) for the periods indicated (dollar amounts in thousands):
|
|
|
For the year ended December 31, |
|
|||||||||
|
|
|
2016 |
|
2015 |
|
$ Change |
|
% Change |
|
|||
|
Other operating expenses |
|
$ |
305,041 |
|
$ |
313,852 |
|
$ |
(8,811) |
|
(2.8) |
% |
|
Less: directly-reimbursed landing fee and station rent from airline partners |
|
|
18,739 |
|
|
22,171 |
|
|
(3,432) |
|
(15.5) |
% |
|
Other operating expenses less landing fee and station rent reimbursements from airline partners |
|
$ |
286,302 |
|
$ |
291,681 |
|
$ |
(5,379) |
|
(1.8) |
% |
The $5.4 million, or 1.8%, decrease in other operating expense (less directly-reimbursed landing fees and station rents) for the year ended December 31, 2016, compared to the year ended December 31, 2015, was primarily related to a reduction in fleet size and a change in locations served in 2016 with lower landing fee and airport rent charges in our prorate agreements, partially offset by additional training costs associated with E175 deliveries, including the use of simulators and hotels.
Total airline expenses. Total airline expenses (consisting of total operating and interest expenses) increased $435.2 million, or 14.8%, during the year ended December 31, 2016, compared to the year ended December 31, 2015. Under our contract flying arrangements, we are reimbursed by our major airline partners for our actual fuel costs, contract related station rents, landing fees and engine overhaul costs under our Directly‑Reimbursed Engine Contracts. We record such reimbursements as revenue. The following table summarizes the amount of fuel and engine overhaul expenses which are included in our total airline expenses for the periods indicated (dollar amounts in thousands).
|
|
|
For the year ended December 31, |
|
||||||||
|
|
|
2016 |
|
2015 |
|
$ Change |
|
% Change |
|
||
|
Total airline expense |
|
$ |
3,372,067 |
|
$ |
2,936,898 |
|
435,169 |
|
14.8 |
% |
|
Less: directly-reimbursed fuel from airline partners |
|
|
51,583 |
|
|
41,567 |
|
10,016 |
|
24.1 |
% |
|
Less: directly-reimbursed landing fee and station rent from airline partners |
|
|
18,739 |
|
|
22,171 |
|
(3,432) |
|
(15.5) |
% |
|
Less: directly-reimbursed engine maintenance from airline partners |
|
|
62,782 |
|
|
94,142 |
|
(31,360) |
|
(33.3) |
% |
|
Total airline expense excluding directly-reimbursed fuel, landing fee, station rent and engine maintenance |
|
$ |
3,238,963 |
|
$ |
2,779,018 |
|
459,945 |
|
16.6 |
% |
Excluding directly-reimbursed costs by our major airline partners for fuel, station rents, landing fees and engine overhaul costs, our total airline expenses increased $459.9 million, or 16.6%, during the year ended December 31, 2016, compared to the year ended December 31, 2015. The increase in total airline expenses, excluding directly-reimbursed fuel, station rents, landing fees and engine overhauls, was primarily due to the special items of $465.6 million relating to the 50-seat aircraft for the year ended December 31, 2016, partially offset by the reduction in fleet size and related block hour production of 6.6% during the year ended December 31, 2016, compared to the year ended December 31, 2015.
Summary of other income (expense) items and provision for income taxes:
Other Income (expense), net. Other income (expense) for 2016 of $(0.1) million was primarily due to a write-off of a non-refundable maintenance deposit and other assets associated with the four CRJ900 aircraft that were subleased to Air Mekong, partially offset by a gain resulting from the early payoff of debt. Other income (expense) for 2015 of $33.7 million was primarily due to a gain resulting from the early payoff of debt.
Provision for income taxes. The income tax provision for 2016 included an increase of valuation allowance of $0.8 million for previously generated state net operating loss benefits specific to ExpressJet that we expect to expire. The
43
increase of the valuation allowance was based on changes in state tax laws and our income tax projections, which increased the amount of deferred tax assets that are expected to expire before the deferred tax assets may be utilized.
The income tax provision for 2015 included a release of valuation allowance of $0.9 million for previously generated state net operating loss benefits primarily for ExpressJet that we previously anticipated would expire. The release of the valuation allowance was based on the gain related to early retirement of certain long-term debt which reduced the amount of deferred tax assets that we anticipate will expire before the deferred tax assets may be utilized.
Net Income (loss). Primarily due to the $465.6 million in special items described above, we generated a net loss of $(161.6) million, or $(3.14) per diluted share, for the year ended December 31, 2016, compared to net income of $117.8 million, or $2.27 per diluted share, for the year ended December 31, 2015.
Our Business Segments 2017 compared to 2016:
For the year ended December 31, 2017, we had three reportable segments which are the basis of our internal financial reporting. Our segment disclosure relates to components of our business for which separate financial information is available to, and regularly evaluated by our chief operating decision maker. Our operating segments are SkyWest Airlines, ExpressJet and SkyWest Leasing. Corporate overhead expense is allocated to the operating expenses of SkyWest Airlines and ExpressJet.
The following table sets forth our segment data for the years ended December 31, 2017 and 2016 (in thousands):
|
|
|
For the year ended December 31, |
|
|||||||||
|
|
|
(dollar amounts in thousands) |
|
|||||||||
|
|
|
2017 |
|
2016 |
|
$ Change |
|
% Change |
|
|||
|
|
|
Amount |
|
Amount |
|
Amount |
|
Percent |
|
|||
|
Operating Revenues: |
|
|
|
|
|
|
|
|
|
|
|
|
|
SkyWest Airlines operating revenue |
|
$ |
2,173,384 |
|
$ |
1,935,378 |
|
$ |
238,006 |
|
12.3 |
% |
|
ExpressJet operating revenues |
|
|
790,942 |
|
|
1,044,828 |
|
|
(253,886) |
|
(24.3) |
% |
|
SkyWest Leasing operating revenues |
|
|
239,942 |
|
|
141,000 |
|
|
98,942 |
|
70.2 |
% |
|
Total Operating Revenues |
|
$ |
3,204,268 |
|
$ |
3,121,206 |
|
$ |
83,062 |
|
2.7 |
% |
|
Airline Expenses: |
|
|
|
|
|
|
|
|
|
|
|
|
|
SkyWest Airlines airline expense |
|
$ |
1,910,100 |
|
$ |
1,912,384 |
|
$ |
(2,284) |
|
(0.1) |
% |
|
ExpressJet airline expense |
|
|
823,470 |
|
|
1,346,342 |
|
|
(522,872) |
|
(38.8) |
% |
|
SkyWest Leasing segment expense |
|
|
187,424 |
|
|
113,341 |
|
|
74,083 |
|
65.4 |
% |
|
Total Airline Expense(1) |
|
$ |
2,920,994 |
|
$ |
3,372,067 |
|
$ |
(451,073) |
|
(13.4) |
% |
|
Segment profit (loss): |
|
|
|
|
|
|
|
|
|
|
|
|
|
SkyWest Airlines segment profit |
|
$ |
263,284 |
|
$ |
22,994 |
|
$ |
240,290 |
|
1,045.0 |
% |
|
ExpressJet segment loss |
|
|
(32,528) |
|
|
(301,514) |
|
|
268,986 |
|
(89.2) |
% |
|
SkyWest Leasing segment profit |
|
|
52,518 |
|
|
27,659 |
|
|
24,859 |
|
89.9 |
% |
|
Total Segment Profit (loss) |
|
$ |
283,274 |
|
$ |
(250,861) |
|
$ |
534,135 |
|
(212.9) |
% |
|
Interest Income |
|
|
4,509 |
|
|
2,143 |
|
|
2,366 |
|
110.4 |
% |
|
Other Income (Expense), net |
|
|
400 |
|
|
(94) |
|
|
494 |
|
(525.5) |
% |
|
Consolidated Income (loss) Before Taxes |
|
$ |
288,183 |
|
$ |
(248,812) |
|
$ |
536,995 |
|
(215.8) |
% |
|
(1) |
Total Airline Expense includes operating expense and interest expense |
SkyWest Airlines Segment Profit. SkyWest Airlines segment profit increased $240.3 million, or 1,045.0%, during the year ended December 31, 2017, compared to the year ended December 31, 2016. The SkyWest Airlines 2016 segment included $184.3 million of special item expenses associated with the impairment charge of CRJ200 aircraft and related assets. SkyWest Airlines segment profit was also partially impacted by additional profitability from adding 21 E175 aircraft during 2017 and 19 E175 aircraft during the fourth quarter of 2016, which only contributed for a partial year to the 2016 results. SkyWest Airlines also had various flying contract extensions at favorable economics in 2017 compared to 2016.
44
SkyWest Airlines block hour production increased to 1,237,547, or 12.0%, for 2017 from 1,105,031 for 2016 primarily due to the additional block hour production from the new E175 aircraft added subsequent to December 31, 2016. Significant items contributing to the SkyWest Airlines segment profit are set forth below.
The $238.0 million, or 12.3%, increase to SkyWest Airlines operating revenue during 2017, compared to 2016, was primarily due to 21 E175 aircraft placed into service in 2017 and 19 E175 aircraft added during the fourth quarter of 2016, which only had a partial year impact in 2016 results.
The $2.3 million, or 0.1%, decrease in the SkyWest Airlines airline expense during 2017, compared to 2016, was primarily due to the following factors:
|
· |
SkyWest Airlines’ salaries, wages and benefits expense increased by $78.8 million, or 11.5%, primarily due to the additional block hour production along with higher crew compensation costs resulting from labor agreements executed since 2016. |
|
· |
SkyWest Airlines’ aircraft maintenance, materials and repairs expense increased by $67.8 million, or 21.7%, primarily attributable to the additional aircraft engines being placed under Power-by-the-Hour engine maintenance contracts, an increase in the number of engine events and direct maintenance costs related to the increased volume of block hours. |
|
· |
SkyWest Airlines aircraft rentals expense decreased $19.2 million, or 9.6%, primarily due to an expiration of 15 aircraft leases subsequent to 2016. |
|
· |
SkyWest Airlines fuel expense increased $41.3 million, or 34.5%. The increase in fuel cost was primarily due to an increase in the volume of gallons purchased, and an increase in the average fuel cost per gallon in 2017 of $2.01, compared to 2016 of $1.70. |
|
· |
SkyWest Airlines other operating expense increased $21.4 million, or 11.5%. The increase in other operating expense was primarily related to the increased volume of block hours. |
|
· |
SkyWest Airlines airline expense in 2016 included special items of $184.3 million for impairment charges on its CRJ200 aircraft and write down of certain related assets. SkyWest Airlines did not have any similar special item charges in 2017. |
ExpressJet Segment Loss. ExpressJet segment loss decreased $269.0 million, or 89.2%, during the year ended December 31, 2017, compared to the year ended December 31, 2016. The ExpressJet 2016 segment included $281.4 million of special item expenses associated with the CRJ200 and ERJ145 aircraft and write‑down of certain assets.
ExpressJet’s block hour production decreased to 602,232, or 27.7%, for the year ended December 31, 2016 from 833,461 for the year ended December 31, 2016, primarily due to the removal of CRJ200, CRJ900 and ERJ145 aircraft from operations. Significant items contributing to the ExpressJet segment loss are set forth below:
The $253.9 million decrease in ExpressJet Operating Revenues during 2017, compared to 2016, was primarily due to a 27.7% reduction in block hour production due to a reduced fleet size since 2016.
The $522.9 million decrease in ExpressJet Airline Expense during 2017, compared to 2016, was primarily due to the following factors:
|
· |
ExpressJet’s salaries, wages and benefits decreased $94.5 million, or 18.0%. The decrease was primarily due to a decrease in scheduled production subsequent to 2016 that resulted from the decreased number of ERJ145, CRJ200 and CRJ900 aircraft in operation. |
|
· |
ExpressJet’s aircraft maintenance, materials and repairs expense decreased $52.8 million, or 21.0%. The decrease was primarily due to the reduced fleet size and related production subsequent to 2016. |
45
|
· |
ExpressJet’s aircraft rental expenses decreased $27.6 million, or 44.5%, primarily due to the termination of aircraft leases on CRJ200 and CRJ900 aircraft since 2016. |
|
· |
ExpressJet’s depreciation expense decreased $32.0 million, or 38.1%, primarily due to a reduction in owned 50-seat aircraft and related long-lived assets since December 31, 2016. |
|
· |
ExpressJet’s other airline expenses decreased $27.1 million, or 22.9%, primarily due to a decrease in scheduled production subsequent to 2016. |
|
· |
ExpressJet’s airline expense in 2016 included special items of $281.4 million for impairment charges on certain CRJ200 and ERJ145 long‑lived assets and write down of certain related assets. ExpressJet did not have any similar special item charges in 2017. |
SkyWest Leasing Segment Profit. SkyWest Leasing profit increased $52.5 million during the year ended December 31, 2017, compared to the year ended December 31, 2016, primarily due to the additional E175 aircraft revenue attributed to the ownership costs of the E175 aircraft earned under the applicable fixed-fee contract and profitability offset by the E175 aircraft depreciation and interest expense.
Our Business Segments 2016 compared to 2015:
For the year ended December 31, 2016, we had three reportable segments which are the basis of our internal financial reporting. Our segment disclosure relates to components of our business for which separate financial information is available to, and regularly evaluated by our chief operating decision maker. Our operating segments are SkyWest Airlines, ExpressJet and SkyWest Leasing. Corporate overhead expense is allocated to the operating expenses of SkyWest Airlines and ExpressJet.
The following table sets forth our segment data for the years ended December 31, 2016 and 2015 (in thousands):
|
|
|
For the year ended December 31, |
|
|||||||||
|
|
|
(dollar amounts in thousands) |
|
|||||||||
|
|
|
2016 |
|
2015 |
|
$ Change |
|
% Change |
|
|||
|
|
|
Amount |
|
Amount |
|
Amount |
|
Percent |
|
|||
|
Operating Revenues: |
|
|
|
|
|
|
|
|
|
|
|
|
|
SkyWest Airlines operating revenue |
|
$ |
1,935,378 |
|
$ |
1,848,363 |
|
$ |
87,015 |
|
4.7 |
% |
|
ExpressJet operating revenues |
|
|
1,044,828 |
|
|
1,169,923 |
|
|
(125,095) |
|
(10.7) |
% |
|
SkyWest Leasing operating revenues |
|
|
141,000 |
|
|
77,277 |
|
|
63,723 |
|
82.5 |
% |
|
Total Operating Revenues |
|
$ |
3,121,206 |
|
$ |
3,095,563 |
|
$ |
25,643 |
|
0.8 |
% |
|
Airline Expenses: |
|
|
|
|
|
|
|
|
|
|
|
|
|
SkyWest Airlines airline expense |
|
$ |
1,912,384 |
|
$ |
1,666,341 |
|
$ |
246,043 |
|
14.8 |
% |
|
ExpressJet airline expense |
|
|
1,346,342 |
|
|
1,204,161 |
|
|
142,181 |
|
11.8 |
% |
|
SkyWest Leasing segment expense |
|
|
113,341 |
|
|
66,396 |
|
|
46,945 |
|
70.7 |
% |
|
Total Airline Expense(1) |
|
$ |
3,372,067 |
|
$ |
2,936,898 |
|
$ |
435,169 |
|
14.8 |
% |
|
Segment profit (loss): |
|
|
|
|
|
|
|
|
|
|
|
|
|
SkyWest Airlines segment profit |
|
$ |
22,994 |
|
$ |
182,022 |
|
$ |
(159,028) |
|
(87.4) |
% |
|
ExpressJet segment loss |
|
|
(301,514) |
|
|
(34,238) |
|
|
(267,276) |
|
780.6 |
% |
|
SkyWest Leasing segment profit |
|
|
27,659 |
|
|
10,881 |
|
|
16,778 |
|
154.2 |
% |
|
Total Segment Profit (loss) |
|
$ |
(250,861) |
|
$ |
158,665 |
|
$ |
(409,526) |
|
(258.1) |
% |
|
Interest Income |
|
|
2,143 |
|
|
1,997 |
|
|
146 |
|
7.3 |
% |
|
Other Income (Expense), net |
|
|
(94) |
|
|
33,660 |
|
|
(33,754) |
|
(100.3) |
% |
|
Consolidated Income (loss) Before Taxes |
|
$ |
(248,812) |
|
$ |
194,322 |
|
$ |
(443,134) |
|
(228.0) |
% |
|
(1) |
Total Airline Expense includes operating expense and interest expense |
46
SkyWest Airlines Segment Profit. SkyWest Airlines segment profit decreased $159.0 million, or 87.4%, during the year ended December 31, 2016, compared to the year ended December 31, 2015. The SkyWest Airlines 2016 segment included $184.3 million of special item expenses associated with the impairment charge of CRJ200 aircraft and related assets and $9.3 million in early lease return costs associated with certain CRJ700 aircraft. Excluding the impact of these items, SkyWest Airlines segment profitability improved by $34.6 million. SkyWest Airlines segment profit was also partially impacted by additional profitability from adding 41 E175 aircraft.
SkyWest Airlines block hour production increased to 1,105,031, or 2.8%, for 2016 from 1,074,809 for 2015 primarily due to the additional block hour production from the new E175 aircraft added subsequent to December 31, 2015. Significant items contributing to the SkyWest Airlines segment profit are set forth below.
SkyWest Airlines operating revenue increased by $87.0 million, or 4.7%, for 2016 compared to 2015. The increase was primarily due to additional E175 operations along with improved contract rates with certain major airline partners.
SkyWest Airlines airline expense increased by $246.0 million, or 14.8%, during the year ended December 31, 2016, compared to the year ended December 31, 2015. The increase in the SkyWest Airlines airline expense was primarily due to the following factors:
|
· |
SkyWest Airlines airline expense included an increase in salaries, wages and employee benefits of $47.1 million, or 7.4%, for 2016 compared to 2015. The increase was primarily due to additional wages incurred in connection with the additional block hour production and incremental pilot costs, including crew training associated with the new E175 aircraft deliveries. |
|
· |
SkyWest Airlines aircraft maintenance, materials and repairs expense increased by $27.5 million, or 9.7%, during 2016, compared to 2015. The increase was primarily attributable to an increase in direct maintenance costs associated with the increased volume of departures and the replacement and repair of aircraft parts and components and $15.9 million of lease return maintenance costs primarily associated with EMB120, CRJ200 and CRJ700 aircraft lease returns. |
|
· |
SkyWest Airlines aircraft rentals expense decreased $3.8 million, or 1.9%, during 2016, compared to 2015, primarily due to an expiration of 12 aircraft leases subsequent to 2015. |
|
· |
SkyWest Airlines ground handling service expense decreased $4.6 million, or 7.1%, during 2016, compared to 2015. The decrease in ground handling service expense was primarily due to a reduction in passenger liability insurance costs and a reduction in the locations at which SkyWest Airlines provided ground handling services subsequent to December 31, 2015. |
|
· |
SkyWest Airlines fuel expense increased $4.9 million, or 4.2%, during 2016, compared to 2015. The increase in fuel cost was primarily due to an increase in the volume of gallons purchased, which was partially offset by the decrease in the average fuel cost per gallon in 2016 compared to 2015. The average fuel cost per gallon was $1.70 and $2.09 for the years 2016 and 2015, respectively. |
|
· |
SkyWest Airlines airline expense in 2016 included special items of $184.3 million for impairment charges on its CRJ200 aircraft and related long‑lived assets, including aircraft, capitalized aircraft improvements and additional inventory reserves for excess spare part inventory. |
|
· |
SkyWest Airlines interest expense decreased $9.2 million, or 26.0%, during 2016, compared to 2015, primarily due to a decrease in outstanding long-term debt over 2016, compared to 2015. |
47
ExpressJet Segment Loss. ExpressJet segment loss increased $267.3 million, or 780.6%, during the year ended December 31, 2016, compared to the year ended December 31, 2015. The ExpressJet 2016 segment included $281.4 million of special item expenses associated with the CRJ200 and ERJ145 aircraft and write‑down of certain assets and $6.8 million associated with certain leased CRJ700 aircraft that were removed from service. Excluding the impact of the special item expenses, ExpressJet’s segment profitability improved by $20.9 million. This special charge was partially offset by the removal of aircraft operating under unprofitable fixed-fee contracts and rate improvements in certain fixed-fee contracts compared to 2015.
ExpressJet’s block hour production decreased to 833,461, or 16.7%, for the year ended December 31, 2016 from 999,995 for the year ended December 31, 2015, primarily due to the removal of ERJ145 aircraft previously operated under its United fixed-fee agreement. Significant items contributing to the ExpressJet segment loss are set forth below:
ExpressJet’s operating revenue decreased by $125.1 million, or 10.7%, for 2016 compared to 2015. The decrease was primarily due to a 16.7% reduction in block hours resulting from fewer ERJ145s operating under its United fixed-fee arrangement, which was partially offset by rate improvements in certain fixed-fee contracts compared to 2015.
ExpressJet’s airline expense increased $142.2 million, or 11.8%, during the year ended December 31, 2016, compared to the year ended December 31, 2015. The increase in the ExpressJet airline expense was primarily due to the following factors:
|
· |
ExpressJet’s salaries, wages and benefits decreased $39.0 million, or 6.9%, during 2016, compared to 2015. The decrease was primarily due to a decrease in scheduled production subsequent to 2015 that resulted from the decreased number of ERJ145 and CRJ200 aircraft in operation. |
|
· |
ExpressJet’s aircraft maintenance, materials and repairs expense decreased $67.6 million, or 21.1%, during 2016, compared to 2015. The decrease was primarily due to the reduced fleet size and related production subsequent to 2015 and maintenance costs savings initiatives in 2016. |
|
· |
ExpressJet’s aircraft rental expenses decreased $7.3 million, or 10.6%, during 2016, compared to 2015, primarily due to the termination of aircraft leases on CRJ200 aircraft since 2015. |
|
· |
ExpressJet’s ground handling services expenses decreased $5.5 million, or 29.3%, during 2016, compared to 2015, primarily due to a decrease in scheduled production and reduced fleet size. |
|
· |
ExpressJet’s other airline expenses decreased $7.1 million, or 6.2%, during 2016, compared to 2015, primarily due to a decrease in scheduled production subsequent to 2015, partially offset by increases in lodging and simulator expenses used for crew training. |
|
· |
ExpressJet’s airline expense in 2016 included special items of $281.4 million for impairment charges on certain CRJ200 and ERJ145 long‑lived assets, including aircraft, spare engines and capitalized aircraft improvements and additional inventory reserves for excess spare part inventory. |
|
· |
ExpressJet’s interest expense decreased $6.0 million, or 47.2%, during 2016, compared to 2015, primarily due to a decrease in outstanding long-term debt since 2015. |
SkyWest Leasing Segment Profit. SkyWest Leasing profit increased $16.8 million during the year ended December 31, 2016, compared to the year ended December 31, 2015, primarily due to the additional E175 aircraft revenue attributed to the ownership costs of the E175 aircraft earned under the applicable fixed-fee contract and profitability offset by the E175 aircraft depreciation and interest expense.
48
Liquidity and Capital Resources
Sources and Uses of Cash—2017 Compared to 2016
Cash Position and Liquidity. The following table provides a summary of the net cash provided by (used in) our operating, investing and financing activities for the years ended December 31, 2017 and 2016, and our total cash and marketable securities position as of December 31, 2017 and December 31, 2016 (in thousands).
|
|
|
For the year ended December 31, |
|
|||||||||
|
|
|
2017 |
|
2016 |
|
$ Change |
|
% Change |
|
|||
|
Net cash provided by operating activities |
|
$ |
684,124 |
|
$ |
506,665 |
|
$ |
177,459 |
|
35.0 |
% |
|
Net cash used in investing activities |
|
|
(751,337) |
|
|
(1,177,078) |
|
|
425,741 |
|
(36.2) |
% |
|
Net cash provided by financing activities |
|
|
102,239 |
|
|
614,144 |
|
|
(511,905) |
|
(83.4) |
% |
|
|
|
December 31, |
|
December 31, |
|
|
|
|
|
|
||
|
|
|
2017 |
|
2016 |
|
$ Change |
|
% Change |
|
|||
|
Cash and cash equivalents |
|
$ |
181,792 |
|
$ |
146,766 |
|
$ |
35,026 |
|
23.9 |
% |
|
Restricted cash |
|
|
— |
|
|
8,243 |
|
|
(8,243) |
|
(100.0) |
% |
|
Marketable securities |
|
|
503,503 |
|
|
409,898 |
|
|
93,605 |
|
22.8 |
% |
|
Total |
|
$ |
685,295 |
|
$ |
564,907 |
|
$ |
120,388 |
|
21.3 |
% |
Cash Flows from Operating Activities. Net cash provided by operating activities increased $177.5 million, or 35.0%, during 2017, compared to 2016, primarily due to an increase in pre-tax income from 2017 to 2016 and changes in our working capital accounts. Our pre-tax income was $288.2 million in 2017. Our pre-tax loss was $248.8 million in 2016, however our 2016 pre-tax loss included $465.6 million of special charges.
Cash Flows from Investing Activities. Net cash used in investing activities decreased $425.7 million, or 36.2%, during 2017, compared to 2016, primarily due to the acquisition of 21 E175 aircraft and the related spare aircraft assets during 2017, compared to 41 E175 aircraft and the related spare aircraft assets purchased during 2016, partially offset by the proceeds from the sale of 15 CRJ200 aircraft, eleven EMB120 aircraft, one CRJ700 aircraft and related spare aircraft assets during 2017.
Cash Flows from Financing Activities. Net cash provided by financing activities decreased $511.9 million, or 83.4%, during 2017, compared to 2016, primarily related to proceeds from the issuance of long-term debt associated with 21 E175 aircraft acquired during 2017, compared to proceeds from the issuance of debt associated with 41 E175 aircraft acquired during 2016. This decrease in cash provided by financing activities was partially offset by $20.0 million and $5.1 million used in 2017 to purchase treasury shares and towards the net settlement of income taxes on employee equity awards, respectively.
Sources and Uses of Cash—2016 Compared to 2015
Cash Position and Liquidity. The following table provides a summary of the net cash provided by (used in) our operating, investing and financing activities for the years ended December 31, 2016 and 2015, and our total cash and marketable securities position as of December 31, 2016 and December 31, 2015 (in thousands).
|
|
|
For the year ended December 31, |
|
|||||||||
|
|
|
2016 |
|
2015 |
|
$ Change |
|
% Change |
|
|||
|
Net cash provided by operating activities |
|
$ |
506,665 |
|
$ |
417,325 |
|
$ |
89,340 |
|
21.4 |
% |
|
Net cash used in investing activities |
|
|
(1,177,078) |
|
|
(569,716) |
|
|
(607,362) |
|
106.6 |
% |
|
Net cash provided by financing activities |
|
|
614,144 |
|
|
223,151 |
|
|
390,993 |
|
175.2 |
% |
49
|
|
|
December 31, |
|
December 31, |
|
|
|
|
|
|
||
|
|
|
2016 |
|
2015 |
|
$ Change |
|
% Change |
|
|||
|
Cash and cash equivalents |
|
$ |
146,766 |
|
$ |
203,035 |
|
$ |
(56,269) |
|
(27.7) |
% |
|
Restricted cash |
|
|
8,243 |
|
|
8,216 |
|
|
27 |
|
0.3 |
% |
|
Marketable securities |
|
|
409,898 |
|
|
286,668 |
|
|
123,230 |
|
43.0 |
% |
|
Total |
|
$ |
564,907 |
|
$ |
497,919 |
|
$ |
66,988 |
|
13.5 |
% |
Cash Flows from Operating Activities. Net cash provided from operating activities increased $89.3 million, or 21.4%, during 2016, compared to 2015. Our pre-tax income was $194.3 million in 2015. Our pre-tax loss in 2016 was $148.8 million, which included a non-cash special charge of $465.6 million. Excluding the impact of the 2016 non-cash special charge, our pre-tax income increased by $22.5 million. The remaining increase in our cash from operations included positive cash changes in our working capital accounts and 2015 cash flows included a $33.7 million non-cash gain from an early extinguishment of debt.
Cash Flows from Investing Activities. Net cash used in investing activities increased $607.4 million, or 106.6%, during 2016, compared to 2015. The increase in cash used in investing activities was primarily due to the net purchases of marketable securities which increased $251.9 million from 2015 to 2016, and the acquisition of 41 E175 aircraft and the related spare aircraft assets in 2016, compared to 25 E175 aircraft and the related spare aircraft assets purchased in 2015, which in total represented an increase of $428.1 million. These uses of cash were partially offset by proceeds received from the Bombardier termination agreement of $90.0 million.
Cash Flows from Financing Activities. Net cash provided by financing activities increased $391.0 million, or 175.2%, during 2016, compared to 2015. The increase was primarily due to the proceeds from the issuance of long‑term debt of $926.1 million associated with 41 E175 aircraft acquired during 2016, compared to the issuance of long‑term debt of $591.9 million associated with 25 E175 aircraft acquired during 2015. Additionally, the principal payments of long-term debt decreased $52.1 million during 2016, compared to 2015, as a result of the early pay off of $145.4 million in debt during 2015.
Liquidity and Capital Resources as of December 31, 2017 and 2016
We believe that in the absence of unusual circumstances, the working capital currently available to us, together with our projected cash flows from operations, will be sufficient to meet our present financial requirements, including anticipated expansion, planned capital expenditures, and scheduled lease payments and debt service obligations for at least the next 12 months.
At December 31, 2017, our total capital mix was 42.5% equity and 57.5% long‑term debt, compared to 37.6% equity and 62.4% long‑term debt at December 31, 2016.
At December 31, 2017, we had $14.8 million in letters of credit issued under our line of credit facility, which reduced the amount available under the facility to $60.2 million. The facility expires on June 1, 2018 and has a variable interest rate of LIBOR plus 2.5% (4.1% at December 31, 2017).
As of December 31, 2017 and 2016, we had $87.4 million and $87.7 million, respectively, in letters of credit and surety bonds outstanding with various banks and surety institutions.
As of December 31, 2017, we had no restricted cash related to our workers' compensation policies. As of December 31, 2016, we classified $8.2 million as restricted cash related to our workers' compensation policies.
50
Significant Commitments and Obligations
General
The following table summarizes our commitments and obligations as noted for each of the next five years and thereafter (in thousands):
|
|
|
Total |
|
2018 |
|
2019 |
|
2020 |
|
2021 |
|
2022 |
|
Thereafter |
|
|||||||
|
Operating lease payments for aircraft and facility obligations |
|
$ |
716,832 |
|
$ |
142,157 |
|
$ |
104,297 |
|
$ |
121,119 |
|
$ |
112,657 |
|
$ |
75,981 |
|
$ |
160,621 |
|
|
Firm aircraft and spare engine commitments |
|
|
1,097,926 |
|
|
1,066,126 |
|
|
21,200 |
|
|
10,600 |
|
|
— |
|
|
— |
|
|
— |
|
|
Interest commitments(A) |
|
|
530,938 |
|
|
103,522 |
|
|
90,705 |
|
|
78,171 |
|
|
66,757 |
|
|
56,038 |
|
|
135,745 |
|
|
Principal maturities on long-term debt |
|
|
2,712,350 |
|
|
313,243 |
|
|
315,753 |
|
|
284,998 |
|
|
272,470 |
|
|
280,360 |
|
|
1,245,526 |
|
|
Total commitments and obligations |
|
$ |
5,058,046 |
|
$ |
1,625,048 |
|
$ |
531,955 |
|
$ |
494,888 |
|
$ |
451,884 |
|
$ |
412,379 |
|
$ |
1,541,892 |
|
|
(A) |
At December 31, 2017, we had variable rate notes representing 2.5% of our total long‑term debt. Actual interest commitments will change based on the actual variable interest. |
Purchase Commitments and Options
As of December 31, 2017, we had a firm purchase commitment for 42 E175/E175 SC aircraft from Embraer, S.A. with scheduled delivery dates through the end of 2018 or early 2019.
We have not historically funded a substantial portion of our aircraft acquisitions with working capital. Rather, we have generally funded our aircraft acquisitions through a combination of operating leases and long-term debt financing. At the time of each aircraft acquisition, we evaluate the financing alternatives available to us, and select one or more of these methods to fund the acquisition. At present, we intend to fund our acquisition of any additional aircraft through cash on hand and debt financing. Based on current market conditions and discussions with prospective leasing organizations and financial institutions, we currently believe that we will be able to obtain financing for our committed acquisitions, as well as additional aircraft. We intend to finance the firm purchase commitment for 42 E175/E175 SC aircraft with approximately 85% debt and the remaining balance with cash.
Aircraft Lease and Facility Obligations
We also have significant long‑term lease obligations, primarily relating to our aircraft fleet. At December 31, 2017, we had 319 aircraft under lease with remaining terms ranging from less than one to nine years. Future minimum lease payments due under all long‑term operating leases were approximately $716.8 million at December 31, 2017. Assuming a 5.0% discount rate, which is the average rate used to approximate the implicit rates within the applicable aircraft leases, the present value of these lease obligations would have been equal to approximately $594.3 million at December 31, 2017.
Long‑term Debt Obligations
As of December 31, 2017, we had $2.7 billion of long‑term debt obligations related to the acquisition of aircraft and certain spare engines. The average effective interest rate on those long‑term debt obligations was approximately 3.9% at December 31, 2017.
Under our fixed-fee arrangements, the major airline partners compensate us for our costs of owning or leasing the aircraft on a monthly basis. The aircraft compensation structure varies by agreement, but is intended to cover either our aircraft principal and interest debt service costs, our aircraft depreciation and interest expense or our aircraft lease expense costs while the aircraft is under contract.
Guarantees
We have guaranteed the obligations of SkyWest Airlines under the SkyWest Airlines Delta Connection Agreement and the SkyWest Airlines United Express Agreement for the E175 aircraft. We have also guaranteed the
51
obligations of ExpressJet under the ExpressJet Delta Connection Agreement and the ExpressJet United Express ERJ Agreement.
ITEM 7A. QUANTITATIVE AND QUALITATIVE DISCLOSURES ABOUT MARKET RISK
Aircraft Fuel
In the past, we have not experienced difficulties with fuel availability and we currently expect to be able to obtain fuel at prevailing prices in quantities sufficient to meet our future needs. Pursuant to our contract flying arrangements, United, Delta, American and Alaska have agreed to bear the economic risk of fuel price fluctuations on our contracted flights. We bear the economic risk of fuel price fluctuations on our prorate operations. For each of the years ended December 31, 2017, 2016 and 2015, approximately 12%, 13% and 12% of our total passenger revenue was derived from prorate arrangements. For the years ended December 31, 2017, 2016 and 2015, the average price per gallon of aircraft fuel was $2.01, $1.70 and $2.09, respectively. For illustrative purposes only, we have estimated the impact of the market risk of fuel on our prorate operations using a hypothetical increase of 25% in the price per gallon we purchase. Based on this hypothetical assumption, we would have incurred an additional $21.3 million, $17.6 million and $19.1 million in fuel expense for the years ended December 31, 2017, 2016 and 2015, respectively.
Interest Rates
Our earnings are affected by changes in interest rates due to the amount of variable rate long-term debt held. The interest rates applicable to variable rate notes may rise and increase the amount of interest expense. At December 31, 2017, 2016 and 2015, we had variable rate notes representing 2.5%, 5.1% and 12.1% of our total long‑term debt, respectively. For illustrative purposes only, we have estimated the impact of market risk using a hypothetical increase in interest rates of one percentage point for variable rate long-term debt. Based on this hypothetical assumption, we would have incurred an additional $0.9 million in interest expense for the year ended December 31, 2017; we would have incurred an additional $2.0 million in interest expense for the year ended December 31, 2016; and we would have incurred an additional $3.5 million in interest expense for the year ended December 31, 2015. However, under our contractual arrangements with our major airline partners, the majority of the increase in interest expense would be passed through and recorded as passenger revenue in our consolidated statements of operations and comprehensive income (loss). If interest rates were to decline, our major airline partners would receive the principal benefit of the decline, since interest expense is generally passed through to our major airline partners, resulting in a reduction to passenger revenue in our consolidated statement of operations and comprehensive income (loss).
We currently intend to finance the acquisition of aircraft through manufacturer financing, third-party leases or long-term borrowings. Changes in interest rates may impact the actual cost to us to acquire these aircraft. To the extent we place these aircraft in service under our code-share agreements with Delta, United, Alaska or other carriers, our code-share agreements currently provide that reimbursement rates will be adjusted higher or lower to reflect changes in our aircraft financing interest rates.
ITEM 8. FINANCIAL STATEMENTS AND SUPPLEMENTARY DATA
The information set forth below should be read together with the “Management’s Discussion and Analysis of Financial Condition and Results of Operations,” appearing elsewhere herein.
52
Report of Independent Registered Public Accounting Firm
To the Stockholders and the Board of Directors of SkyWest, Inc.
Opinion on the Financial Statements
We have audited the accompanying consolidated balance sheets of SkyWest, Inc. and subsidiaries (the Company) as of December 31, 2017 and 2016, the related consolidated statements of comprehensive income (loss), stockholders’ equity and cash flows for each of the three years in the period ended December 31, 2017, and the related notes and financial statement schedule listed in the Index at Item 15(a)2 (collectively referred to as the “financial statements”). In our opinion, the consolidated financial statements present fairly, in all material respects, the financial position of the Company at December 31, 2017 and 2016, and the results of its operations and its cash flows for each of the three years in the period ended December 31, 2017, in conformity with U.S. generally accepted accounting principles.
We also have audited, in accordance with the standards of the Public Company Accounting Oversight Board (United States) (PCAOB), the Company’s internal control over financial reporting as of December 31, 2017, based on criteria established in Internal Control—Integrated Framework issued by the Committee of Sponsoring Organizations of the Treadway Commission (2013 framework) and our report dated February 26, 2018 expressed an unqualified opinion thereon.
Basis for Opinion
These financial statements are the responsibility of the Company’s management. Our responsibility is to express an opinion on the Company’s financial statements based on our audits. We are a public accounting firm registered with the PCAOB and are required to be independent with respect to the Company in accordance with the U.S. federal securities laws and the applicable rules and regulations of the Securities and Exchange Commission and the PCAOB.
We conducted our audits in accordance with the standards of the PCAOB. Those standards require that we plan and perform the audit to obtain reasonable assurance about whether the financial statements are free of material misstatement, whether due to error or fraud. Our audits included performing procedures to assess the risks of material misstatement of the financial statements, whether due to error or fraud, and performing procedures that respond to those risks. Such procedures include examining, on a test basis, evidence regarding the amounts and disclosures in the financial statements. Our audits also included evaluating the accounting principles used and significant estimates made by management, as well as evaluating the overall presentation of the financial statements. We believe that our audits provide a reasonable basis for our opinion.
/s/ Ernst & Young LLP
We have served as the Company’s auditor since 2003.
Salt Lake City, Utah
February 26, 2018
53
SKYWEST, INC. AND SUBSIDIARIES
CONSOLIDATED BALANCE SHEETS
(Dollars in thousands)
ASSETS
|
|
|
|
December 31, |
|
December 31, |
|
||
|
|
|
|
2017 |
|
2016 |
|
||
|
CURRENT ASSETS: |
|
|
|
|
|
|
|
|
|
Cash and cash equivalents |
|
|
$ |
181,792 |
|
$ |
146,766 |
|
|
Marketable securities |
|
|
|
503,503 |
|
|
409,898 |
|
|
Restricted cash |
|
|
|
— |
|
|
8,243 |
|
|
Income tax receivable |
|
|
|
5,316 |
|
|
6,989 |
|
|
Receivables, net |
|
|
|
42,731 |
|
|
46,916 |
|
|
Inventories, net |
|
|
|
119,755 |
|
|
118,509 |
|
|
Prepaid aircraft rents |
|
|
|
115,098 |
|
|
162,360 |
|
|
Other current assets |
|
|
|
26,938 |
|
|
18,111 |
|
|
Total current assets |
|
|
|
995,133 |
|
|
917,792 |
|
|
|
|
|
|
|
|
|
|
|
|
PROPERTY AND EQUIPMENT: |
|
|
|
|
|
|
|
|
|
Aircraft and rotable spares |
|
|
|
5,335,870 |
|
|
4,839,501 |
|
|
Deposits on aircraft |
|
|
|
49,000 |
|
|
38,800 |
|
|
Buildings and ground equipment |
|
|
|
265,608 |
|
|
261,704 |
|
|
|
|
|
|
5,650,478 |
|
|
5,140,005 |
|
|
Less-accumulated depreciation and amortization |
|
|
|
(1,467,475) |
|
|
(1,318,308) |
|
|
Total property and equipment, net |
|
|
|
4,183,003 |
|
|
3,821,697 |
|
|
|
|
|
|
|
|
|
|
|
|
OTHER ASSETS |
|
|
|
|
|
|
|
|
|
Long-term prepaid assets |
|
|
|
230,923 |
|
|
218,505 |
|
|
Other long-term assets |
|
|
|
49,220 |
|
|
49,972 |
|
|
Total other assets |
|
|
|
280,143 |
|
|
268,477 |
|
|
Total assets |
|
|
$ |
5,458,279 |
|
$ |
5,007,966 |
|
See accompanying notes to consolidated financial statements.
54
SKYWEST, INC. AND SUBSIDIARIES
CONSOLIDATED BALANCE SHEETS (Continued)
(Dollars in thousands)
LIABILITIES AND STOCKHOLDERS’ EQUITY
|
|
|
December 31, |
|
December 31, |
||
|
|
|
2017 |
|
2016 |
||
|
CURRENT LIABILITIES: |
|
|
|
|
|
|
|
Current maturities of long-term debt |
|
$ |
309,678 |
|
$ |
305,460 |
|
Accounts payable |
|
|
288,904 |
|
|
241,215 |
|
Accrued salaries, wages and benefits |
|
|
154,367 |
|
|
139,885 |
|
Taxes other than income taxes |
|
|
19,228 |
|
|
15,618 |
|
Other current liabilities |
|
|
48,648 |
|
|
45,087 |
|
Total current liabilities |
|
|
820,825 |
|
|
747,265 |
|
|
|
|
|
|
|
|
|
OTHER LONG-TERM LIABILITIES |
|
|
42,541 |
|
|
50,844 |
|
|
|
|
|
|
|
|
|
LONG-TERM DEBT, net of current maturities |
|
|
2,377,346 |
|
|
2,240,051 |
|
|
|
|
|
|
|
|
|
DEFERRED INCOME TAXES PAYABLE |
|
|
419,020 |
|
|
565,404 |
|
|
|
|
|
|
|
|
|
DEFERRED AIRCRAFT CREDITS |
|
|
44,225 |
|
|
53,459 |
|
|
|
|
|
|
|
|
|
COMMITMENTS AND CONTINGENCIES (Note 5) |
|
|
|
|
|
|
|
STOCKHOLDERS’ EQUITY: |
|
|
|
|
|
|
|
Preferred stock, 5,000,000 shares authorized; none issued |
|
|
— |
|
|
— |
|
Common stock, no par value, 120,000,000 shares authorized; 80,398,104 and 79,781,305 shares issued, respectively |
|
|
672,593 |
|
|
657,353 |
|
Retained earnings |
|
|
1,516,957 |
|
|
1,103,751 |
|
Treasury stock, at cost, 28,643,535 and 28,015,386 shares, respectively |
|
|
(435,178) |
|
|
(410,090) |
|
Accumulated other comprehensive loss |
|
|
(50) |
|
|
(71) |
|
Total stockholders’ equity |
|
|
1,754,322 |
|
|
1,350,943 |
|
Total liabilities and stockholders’ equity |
|
$ |
5,458,279 |
|
$ |
5,007,966 |
See accompanying notes to consolidated financial statements.
55
SKYWEST, INC. AND SUBSIDIARIES
CONSOLIDATED STATEMENTS OF COMPREHENSIVE INCOME (LOSS)
(In thousands, except per share amounts)
|
|
|
|
Year Ended December 31, |
||||||||
|
|
|
|
2017 |
|
2016 |
|
2015 |
|
|||
|
OPERATING REVENUES: |
|
|
|
|
|
|
|
|
|
|
|
|
Passenger |
|
|
$ |
3,126,708 |
|
$ |
3,051,414 |
|
$ |
3,030,023 |
|
|
Ground handling and other |
|
|
|
77,560 |
|
|
69,792 |
|
|
65,540 |
|
|
Total operating revenues |
|
|
|
3,204,268 |
|
|
3,121,206 |
|
|
3,095,563 |
|
|
OPERATING EXPENSES: |
|
|
|
|
|
|
|
|
|
|
|
|
Salaries, wages and benefits |
|
|
|
1,196,227 |
|
|
1,211,380 |
|
|
1,203,312 |
|
|
Aircraft maintenance, materials and repairs |
|
|
|
579,463 |
|
|
569,306 |
|
|
604,863 |
|
|
Depreciation and amortization |
|
|
|
292,768 |
|
|
284,969 |
|
|
264,507 |
|
|
Aircraft rentals |
|
|
|
215,807 |
|
|
262,602 |
|
|
273,696 |
|
|
Aircraft fuel |
|
|
|
162,653 |
|
|
122,284 |
|
|
118,124 |
|
|
Ground handling services |
|
|
|
69,848 |
|
|
72,659 |
|
|
82,694 |
|
|
Special items |
|
|
|
— |
|
|
465,649 |
|
|
— |
|
|
Other operating expenses |
|
|
|
299,303 |
|
|
305,041 |
|
|
313,852 |
|
|
Total operating expenses |
|
|
|
2,816,069 |
|
|
3,293,890 |
|
|
2,861,048 |
|
|
OPERATING INCOME (LOSS) |
|
|
|
388,199 |
|
|
(172,684) |
|
|
234,515 |
|
|
OTHER INCOME (EXPENSE): |
|
|
|
|
|
|
|
|
|
|
|
|
Interest income |
|
|
|
4,509 |
|
|
2,143 |
|
|
1,997 |
|
|
Interest expense |
|
|
|
(104,925) |
|
|
(78,177) |
|
|
(75,850) |
|
|
Other, net |
|
|
|
400 |
|
|
(94) |
|
|
33,660 |
|
|
Total other expense, net |
|
|
|
(100,016) |
|
|
(76,128) |
|
|
(40,193) |
|
|
INCOME (LOSS) BEFORE INCOME TAXES |
|
|
|
288,183 |
|
|
(248,812) |
|
|
194,322 |
|
|
PROVISION (BENEFIT) FOR INCOME TAXES |
|
|
|
(140,724) |
|
|
(87,226) |
|
|
76,505 |
|
|
NET INCOME (LOSS) |
|
|
$ |
428,907 |
|
$ |
(161,586) |
|
$ |
117,817 |
|
|
|
|
|
|
|
|
|
|
|
|
|
|
|
BASIC EARNINGS (LOSS) PER SHARE |
|
|
$ |
8.28 |
|
$ |
(3.14) |
|
$ |
2.31 |
|
|
DILUTED EARNINGS (LOSS) PER SHARE |
|
|
$ |
8.08 |
|
$ |
(3.14) |
|
$ |
2.27 |
|
|
Weighted average common shares: |
|
|
|
|
|
|
|
|
|
|
|
|
Basic |
|
|
|
51,804 |
|
|
51,505 |
|
|
51,077 |
|
|
Diluted |
|
|
|
53,100 |
|
|
51,505 |
|
|
51,825 |
|
|
|
|
|
|
|
|
|
|
|
|
|
|
|
COMPREHENSIVE INCOME (LOSS): |
|
|
|
|
|
|
|
|
|
|
|
|
Net income (loss) |
|
|
$ |
428,907 |
|
$ |
(161,586) |
|
$ |
117,817 |
|
|
Net unrealized appreciation on marketable securities, net of taxes |
|
|
|
21 |
|
|
189 |
|
|
29 |
|
|
TOTAL COMPREHENSIVE INCOME (LOSS) |
|
|
$ |
428,928 |
|
$ |
(161,397) |
|
$ |
117,846 |
|
See accompanying notes to consolidated financial statements.
56
SKYWEST, INC. AND SUBSIDIARIES
CONSOLIDATED STATEMENTS OF STOCKHOLDERS’ EQUITY
(In thousands)
|
|
|
|
|
|
|
|
|
|
|
|
Accumulated |
|
|
|
|||||
|
|
|
|
|
|
|
|
|
|
|
|
Other |
|
|
|
|||||
|
|
|
Common Stock |
|
Retained |
|
Treasury Stock |
|
Comprehensive |
|
|
|
||||||||
|
|
|
Shares |
|
Amount |
|
Earnings |
|
Shares |
|
Amount |
|
Income (Loss) |
|
Total |
|||||
|
Balance at December 31, 2014 |
|
77,951 |
|
$ |
626,521 |
|
$ |
1,165,478 |
|
(26,765) |
|
$ |
(391,364) |
|
$ |
(289) |
|
$ |
1,400,346 |
|
Net income |
|
— |
|
|
— |
|
|
117,817 |
|
— |
|
|
— |
|
|
— |
|
|
117,817 |
|
Net unrealized appreciation on marketable securities, net of tax of $18 |
|
— |
|
|
— |
|
|
— |
|
— |
|
|
— |
|
|
29 |
|
|
29 |
|
Exercise of common stock options and vested restricted stock units |
|
815 |
|
|
8,490 |
|
|
— |
|
— |
|
|
— |
|
|
— |
|
|
8,490 |
|
Sale of common stock under employee stock purchase plan |
|
254 |
|
|
3,430 |
|
|
— |
|
— |
|
|
— |
|
|
— |
|
|
3,430 |
|
Stock based compensation expense related to the issuance of stock options and restricted stock units |
|
— |
|
|
5,368 |
|
|
— |
|
— |
|
|
— |
|
|
— |
|
|
5,368 |
|
Tax deficiency from exercise of common stock options |
|
— |
|
|
(2,166) |
|
|
— |
|
— |
|
|
— |
|
|
— |
|
|
(2,166) |
|
Treasury stock purchases |
|
— |
|
|
— |
|
|
— |
|
(1,250) |
|
|
(18,726) |
|
|
— |
|
|
(18,726) |
|
Cash dividends declared ($0.16 per share) |
|
— |
|
|
— |
|
|
(8,153) |
|
— |
|
|
— |
|
|
— |
|
|
(8,153) |
|
Balance at December 31, 2015 |
|
79,020 |
|
|
641,643 |
|
|
1,275,142 |
|
(28,015) |
|
|
(410,090) |
|
|
(260) |
|
|
1,506,435 |
|
Net loss |
|
— |
|
|
— |
|
|
(161,586) |
|
— |
|
|
— |
|
|
— |
|
|
(161,586) |
|
Net unrealized appreciation on marketable securities, net of tax of $98 |
|
— |
|
|
— |
|
|
— |
|
— |
|
|
— |
|
|
189 |
|
|
189 |
|
Exercise of common stock options and vested restricted stock units |
|
609 |
|
|
4,979 |
|
|
— |
|
— |
|
|
— |
|
|
— |
|
|
4,979 |
|
Sale of common stock under employee stock purchase plan |
|
152 |
|
|
3,163 |
|
|
— |
|
— |
|
|
— |
|
|
— |
|
|
3,163 |
|
Stock based compensation expense related to the issuance of stock options and restricted stock units |
|
— |
|
|
7,568 |
|
|
— |
|
— |
|
|
— |
|
|
— |
|
|
7,568 |
|
Cash dividends declared ($0.19 per share) |
|
— |
|
|
— |
|
|
(9,805) |
|
— |
|
|
— |
|
|
— |
|
|
(9,805) |
|
Balance at December 31, 2016 |
|
79,781 |
|
|
657,353 |
|
|
1,103,751 |
|
(28,015) |
|
|
(410,090) |
|
|
(71) |
|
|
1,350,943 |
|
Net income |
|
— |
|
|
— |
|
|
428,907 |
|
— |
|
|
— |
|
|
— |
|
|
428,907 |
|
Net unrealized appreciation on marketable securities, net of tax of $7 |
|
— |
|
|
— |
|
|
— |
|
— |
|
|
— |
|
|
21 |
|
|
21 |
|
Exercise of common stock options and vested restricted stock units |
|
529 |
|
|
1,658 |
|
|
— |
|
— |
|
|
— |
|
|
— |
|
|
1,658 |
|
Treasury shares withheld for the payment of taxes |
|
— |
|
|
— |
|
|
— |
|
(145) |
|
|
(5,080) |
|
|
— |
|
|
(5,080) |
|
Sale of common stock under employee stock purchase plan |
|
88 |
|
|
3,002 |
|
|
— |
|
— |
|
|
— |
|
|
— |
|
|
3,002 |
|
Stock based compensation expense related to the issuance of stock options and restricted stock units |
|
— |
|
|
10,580 |
|
|
— |
|
— |
|
|
— |
|
|
— |
|
|
10,580 |
|
Impact of adoption of Accounting Standards Update (ASU) 2016-09 (See Note 1) |
|
— |
|
|
— |
|
|
867 |
|
— |
|
|
— |
|
|
— |
|
|
867 |
|
Treasury stock purchases |
|
— |
|
|
— |
|
|
— |
|
(484) |
|
|
(20,008) |
|
|
— |
|
|
(20,008) |
|
Cash dividends declared ($0.32 per share) |
|
— |
|
|
— |
|
|
(16,568) |
|
— |
|
|
— |
|
|
— |
|
|
(16,568) |
|
Balance at December 31, 2017 |
|
80,398 |
|
$ |
672,593 |
|
$ |
1,516,957 |
|
(28,644) |
|
$ |
(435,178) |
|
$ |
(50) |
|
$ |
1,754,322 |
See accompanying notes to consolidated financial statements.
57
SKYWEST, INC. AND SUBSIDIARIES
CONSOLIDATED STATEMENTS OF CASH FLOWS
(In thousands)
|
|
|
|
Year Ended December 31, |
||||||||
|
|
|
|
2017 |
|
2016 |
|
2015 |
|
|||
|
CASH FLOWS FROM OPERATING ACTIVITIES: |
|
|
|
|
|
|
|
|
|
|
|
|
Net income (loss) |
|
|
$ |
428,907 |
|
$ |
(161,586) |
|
$ |
117,817 |
|
|
Adjustments to reconcile net income (loss) to net cash provided by operating activities: |
|
|
|
|
|
|
|
|
|
|
|
|
Depreciation and amortization |
|
|
|
292,768 |
|
|
284,969 |
|
|
264,507 |
|
|
Stock based compensation expense |
|
|
|
10,580 |
|
|
7,568 |
|
|
5,368 |
|
|
Gain from early extinguishment of debt |
|
|
|
— |
|
|
(1,279) |
|
|
(33,660) |
|
|
Special items |
|
|
|
— |
|
|
465,649 |
|
|
— |
|
|
Net increase (decrease) in deferred income taxes |
|
|
|
(145,517) |
|
|
(83,441) |
|
|
73,844 |
|
|
Changes in operating assets and liabilities: |
|
|
|
|
|
|
|
|
|
|
|
|
Decrease (increase) in restricted cash |
|
|
|
8,243 |
|
|
(27) |
|
|
3,366 |
|
|
Decrease in receivables |
|
|
|
4,201 |
|
|
15,260 |
|
|
21,076 |
|
|
Decrease (increase) in income tax receivable |
|
|
|
1,673 |
|
|
(4,118) |
|
|
(92) |
|
|
Increase in inventories |
|
|
|
(1,246) |
|
|
(1,986) |
|
|
(2,860) |
|
|
Decrease (increase) in other current assets |
|
|
|
26,017 |
|
|
37,569 |
|
|
(28,598) |
|
|
Decrease in deferred aircraft credits |
|
|
|
(8,520) |
|
|
(8,108) |
|
|
(8,635) |
|
|
Increase (decrease) in accounts payable and accrued aircraft rents |
|
|
|
46,934 |
|
|
(47,563) |
|
|
9,690 |
|
|
Increase (decrease) in other current liabilities |
|
|
|
20,084 |
|
|
3,758 |
|
|
(4,498) |
|
|
NET CASH PROVIDED BY OPERATING ACTIVITIES |
|
|
|
684,124 |
|
|
506,665 |
|
|
417,325 |
|
|
|
|
|
|
|
|
|
|
|
|
|
|
|
CASH FLOWS FROM INVESTING ACTIVITIES: |
|
|
|
|
|
|
|
|
|
|
|
|
Purchases of marketable securities |
|
|
|
(1,533,867) |
|
|
(2,511,388) |
|
|
(1,170,439) |
|
|
Sales of marketable securities |
|
|
|
1,440,283 |
|
|
2,388,168 |
|
|
1,299,069 |
|
|
Proceeds from the sale of aircraft, property and equipment |
|
|
|
51,994 |
|
|
3,008 |
|
|
10,308 |
|
|
Proceeds from settlement of residual value guarantee aircraft agreements |
|
|
|
— |
|
|
90,000 |
|
|
— |
|
|
Acquisition of property and equipment: |
|
|
|
|
|
|
|
|
|
|
|
|
Aircraft and rotable spare parts |
|
|
|
(661,176) |
|
|
(1,138,963) |
|
|
(710,871) |
|
|
Deposits on aircraft |
|
|
|
(46,733) |
|
|
(650) |
|
|
— |
|
|
Buildings and ground equipment |
|
|
|
(27,467) |
|
|
(14,350) |
|
|
(10,405) |
|
|
Return of deposits applied towards acquired aircraft |
|
|
|
36,533 |
|
|
— |
|
|
1,850 |
|
|
Decrease (increase) in other assets |
|
|
|
(10,904) |
|
|
7,097 |
|
|
10,772 |
|
|
NET CASH USED IN INVESTING ACTIVITIES |
|
|
|
(751,337) |
|
|
(1,177,078) |
|
|
(569,716) |
|
|
|
|
|
|
|
|
|
|
|
|
|
|
|
CASH FLOWS FROM FINANCING ACTIVITIES: |
|
|
|
|
|
|
|
|
|
|
|
|
Proceeds from issuance of long-term debt |
|
|
|
471,677 |
|
|
926,069 |
|
|
591,881 |
|
|
Principal payments on long-term debt |
|
|
|
(330,258) |
|
|
(302,158) |
|
|
(354,277) |
|
|
Proceeds from issuance of common stock |
|
|
|
4,660 |
|
|
8,142 |
|
|
9,754 |
|
|
Purchase of treasury stock |
|
|
|
(20,008) |
|
|
— |
|
|
(18,726) |
|
|
Employee income tax paid on equity awards |
|
|
|
(5,080) |
|
|
— |
|
|
— |
|
|
Decrease (increase) in debt issuance cost |
|
|
|
(3,737) |
|
|
(8,653) |
|
|
2,779 |
|
|
Payment of cash dividends |
|
|
|
(15,015) |
|
|
(9,256) |
|
|
(8,260) |
|
|
NET CASH PROVIDED BY FINANCING ACTIVITIES |
|
|
|
102,239 |
|
|
614,144 |
|
|
223,151 |
|
|
|
|
|
|
|
|
|
|
|
|
|
|
|
Increase (decrease) in cash and cash equivalents |
|
|
|
35,026 |
|
|
(56,269) |
|
|
70,760 |
|
|
Cash and cash equivalents at beginning of period |
|
|
|
146,766 |
|
|
203,035 |
|
|
132,275 |
|
|
CASH AND CASH EQUIVALENTS AT END OF PERIOD |
|
|
$ |
181,792 |
|
$ |
146,766 |
|
$ |
203,035 |
|
|
|
|
|
|
|
|
|
|
|
|
|
|
|
SUPPLEMENTAL DISCLOSURE OF CASH FLOW INFORMATION: |
|
|
|
|
|
|
|
|
|
|
|
|
Non-cash investing activities: |
|
|
|
|
|
|
|
|
|
|
|
|
Acquisition of rotable spare parts |
|
|
$ |
755 |
|
$ |
5,688 |
|
$ |
— |
|
|
Cash paid during the period for: |
|
|
|
|
|
|
|
|
|
|
|
|
Interest, net of capitalized amounts |
|
|
$ |
105,639 |
|
$ |
76,589 |
|
$ |
80,657 |
|
|
Income taxes |
|
|
$ |
5,010 |
|
$ |
1,212 |
|
$ |
5,104 |
|
See accompanying notes to consolidated financial statements.
58
SKYWEST, INC. AND SUBSIDIARIES
NOTES TO CONSOLIDATED FINANCIAL STATEMENTS
DECEMBER 31, 2017
(1) Nature of Operations and Summary of Significant Accounting Policies
SkyWest, Inc. (the “Company”), through its subsidiaries, SkyWest Airlines, Inc. (“SkyWest Airlines”) and ExpressJet Airlines, Inc. (“ExpressJet”), operates the largest regional airlines in the United States. As of December 31, 2017, SkyWest Airlines and ExpressJet offered scheduled passenger service under code-share agreements with United, Delta, American and Alaska with approximately 2,980 total daily departures to different destinations in the United States, Canada, Mexico and the Caribbean. Additionally, the Company provides airport customer service and ground handling services for other airlines throughout its system. As of December 31, 2017, the Company had 595 aircraft in scheduled service out of a combined fleet of 623 aircraft consisting of the following:
|
|
|
CRJ200 |
|
CRJ700 |
|
CRJ900 |
|
ERJ135 |
|
ERJ145 |
|
E175 |
|
Total |
|
|
United |
|
81 |
|
20 |
|
— |
|
3 |
|
109 |
|
65 |
|
278 |
|
|
Delta |
|
94 |
|
60 |
|
52 |
|
— |
|
— |
|
19 |
|
225 |
|
|
American |
|
16 |
|
49 |
|
— |
|
— |
|
— |
|
— |
|
65 |
|
|
Alaska |
|
4 |
|
— |
|
— |
|
— |
|
— |
|
23 |
|
27 |
|
|
Aircraft in scheduled service |
|
195 |
|
129 |
|
52 |
|
3 |
|
109 |
|
107 |
|
595 |
|
|
Subleased to an un-affiliated entity |
|
4 |
|
— |
|
— |
|
— |
|
— |
|
— |
|
4 |
|
|
Other* |
|
9 |
|
7 |
|
— |
|
— |
|
8 |
|
— |
|
24 |
|
|
Total Fleet |
|
208 |
|
136 |
|
52 |
|
3 |
|
117 |
|
107 |
|
623 |
|
* As of December 31, 2017, these aircraft have been removed from service and are in the process of being returned under the applicable leasing arrangement or are aircraft transitioning between code-share agreements with the Company’s major airline partners. During the year ended December 31, 2017, the Company sold eleven owned Embraer Brasilia EMB120 (“EMB120”) 30-seat turboprop aircraft at net book value.
For the year ended December 31, 2017, approximately 46.7% of the Company’s aircraft in scheduled service operated for United, approximately 37.8% was operated for Delta, approximately 10.9% was operated for American and approximately 4.6% was operated for Alaska.
SkyWest Airlines has been a code-share partner with Delta since 1987, United since 1997, Alaska since 2011 and American since 2012. As of December 31, 2017, SkyWest Airlines operated as a Delta Connection carrier primarily in Salt Lake City and Minneapolis, a United Express carrier primarily in Los Angeles, San Francisco, Denver, Houston, Chicago and the Pacific Northwest, an American carrier primarily in Chicago, Los Angeles and Phoenix and an Alaska carrier primarily in the Pacific Northwest.
As of December 31, 2017, ExpressJet operated as a Delta Connection carrier primarily in Atlanta and Detroit, a United Express carrier primarily in Chicago (O’Hare), Cleveland, Newark and Houston and an American carrier primarily in Dallas.
The Company’s subsidiaries operate the following aircraft manufactured by Bombardier Aerospace (“Bombardier”) and Embraer S.A. (“Embraer”): Bombardier CRJ200 regional jets (“CRJ200s”), Bombardier CRJ700 regional jets (“CRJ700s”), Bombardier CRJ900 regional jets (“CRJ900s”), Embraer ERJ145 Regional Jets (“ERJ145s”) and Embraer E175 dual-class regional jet aircraft (which are typically configured with 76 seats) (“E175s”). Additionally, the Company has ordered 30 E175 aircraft from Embraer configured with 70 seats (“E175 SC”).
59
Basis of Presentation
The Company’s consolidated financial statements include the accounts of the Company and the SkyWest Airlines, ExpressJet and SkyWest Leasing segments, with all inter‑company transactions and balances having been eliminated.
In preparing the accompanying consolidated financial statements, the Company has reviewed, as determined necessary by the Company’s management, events that have occurred after December 31, 2017, through the filing date of the Company’s annual report with the U.S. Securities and Exchange Commission. The Company reclassified certain prior period amounts to conform to the current period presentation (see Recent Accounting Pronouncements).
Use of Estimates
The preparation of financial statements in conformity with accounting principles generally accepted in the United States requires management to make estimates and assumptions that affect the reported amounts of assets and liabilities and disclosure of contingent assets and liabilities at the date of the financial statements and the reported amounts of revenues and expenses during the reporting period. Actual results could differ from those estimates.
Cash and Cash Equivalents
The Company considers all highly liquid investments with an original maturity of three months or less to be cash equivalents. The Company classified $8.2 million of cash as restricted cash collateralizing letters of credit under the Company’s workers’ compensation insurance policy and classified it accordingly in the consolidated balance sheets as of December 31, 2016. The Company had no restricted cash as of December 31, 2017, as the Company satisfied the workers’ compensation insurance policy requirement with a letter of credit.
Marketable Securities
The Company’s investments in marketable debt and equity securities are deemed by management to be available-for-sale and are reported at fair market value with the net unrealized appreciation reported as a component of accumulated other comprehensive income (loss) in stockholders’ equity. At the time of sale, any realized appreciation or depreciation, calculated by the specific identification method, is recognized in other income and expense. The Company’s position in marketable securities as of December 31, 2017 and 2016 was as follows (in thousands):
|
|
|
|
|
|
Gross unrealized |
|
Gross unrealized |
|
|
|
|
||
|
At December 31, 2017 |
|
Amortized Cost |
|
holding gains |
|
holding losses |
|
Fair market value |
|
||||
|
Total cash and cash equivalents |
|
$ |
181,792 |
|
$ |
— |
|
$ |
— |
|
$ |
181,792 |
|
|
Marketable securities: |
|
|
|
|
|
|
|
|
|
|
|
|
|
|
Bond and bond funds |
|
$ |
344,479 |
|
$ |
— |
|
$ |
(228) |
|
$ |
344,251 |
|
|
Commercial Paper |
|
|
159,252 |
|
|
— |
|
|
— |
|
|
159,252 |
|
|
Total marketable securities |
|
$ |
503,731 |
|
$ |
— |
|
$ |
(228) |
|
$ |
503,503 |
|
|
Total assets measured at fair value |
|
$ |
685,523 |
|
$ |
— |
|
$ |
(228) |
|
$ |
685,295 |
|
|
|
|
|
|
|
Gross unrealized |
|
|
Gross unrealized |
|
|
|
|
|
|
At December 31, 2016 |
|
Amortized Cost |
|
holding gains |
|
holding losses |
|
Fair market value |
|
||||
|
Total cash and cash equivalents |
|
$ |
146,766 |
|
$ |
— |
|
$ |
— |
|
$ |
146,766 |
|
|
Marketable securities: |
|
|
|
|
|
|
|
|
|
|
|
|
|
|
Bond and bond funds |
|
$ |
410,001 |
|
$ |
— |
|
$ |
(116) |
|
$ |
409,885 |
|
|
Commercial Paper |
|
|
13 |
|
|
— |
|
|
— |
|
|
13 |
|
|
Total marketable securities |
|
$ |
410,014 |
|
$ |
— |
|
$ |
(116) |
|
$ |
409,898 |
|
|
Total assets measured at fair value |
|
$ |
556,780 |
|
$ |
— |
|
$ |
(116) |
|
$ |
556,664 |
|
60
As of December 31, 2017 and 2016, the Company had classified $503.5 million and $409.9 million of marketable securities, respectively, as short‑term since it had the ability to redeem the securities within one year.
Inventories
Inventories include expendable parts, fuel and supplies and are valued at cost (FIFO basis) less an allowance for obsolescence based on historical results, excess parts and management’s expectations of future operations. Expendable inventory parts are charged to expense as used. An obsolescence allowance for flight equipment expendable parts is accrued based on estimated lives of the corresponding fleet types and salvage values. The inventory allowance as of December 31, 2017 and 2016 was $17.1 million and $40.5 million, respectively. The inventory allowance decreased in 2017 due to the disposal of excess inventory that had a valuation allowance as of December 31, 2016. These allowances are based on management estimates.
Property and Equipment
Property and equipment are stated at cost and depreciated over their useful lives to their estimated residual values using the straight‑line method. The Company changed the estimated useful lives and residual values for certain long-lived assets as of January 1, 2017 as follows:
|
Assets |
|
Current Depreciable Life |
|
Prior Policy Depreciable Life |
|
Current Residual Value |
|
Prior Policy Residual Value |
||
|
New Aircraft |
|
20 - 22 years |
|
18 years |
|
17.5 - 20 |
% |
|
30 |
% |
|
Used Aircraft, rotable spares, and spare engines |
|
up to 18 years |
|
up to 18 years |
|
0 - 20 |
% |
|
0 - 30 |
% |
|
Ground equipment |
|
up to 10 years |
|
No Change |
|
0 |
% |
|
No Change |
|
|
Office equipment |
|
up to 7 years |
|
No Change |
|
0 |
% |
|
No Change |
|
|
Leasehold improvements |
|
Shorter of 15 years or lease term |
|
No Change |
|
0 |
% |
|
No Change |
|
|
Buildings |
|
20 - 39.5 years |
|
No Change |
|
0 |
% |
|
No Change |
|
The impact of this change increased depreciation expense by an additional $1.4 million for 2017.
Impairment of Long-Lived Assets
As of December 31, 2017, the Company had approximately $4.2 billion of property and equipment and related assets. Additionally, as of December 31, 2017, the Company had approximately $4.9 million in intangible assets. In accounting for these long‑lived and intangible assets, the Company makes estimates about the expected useful lives of the assets, the expected residual values of certain of these assets, and the potential for impairment based on the fair value of the assets and the cash flows they generate. On September 7, 2005, the Company acquired all of the issued and outstanding capital stock of Atlantic Southeast and recorded an intangible asset for specifically identifiable contracts of approximately $33.7 million relating to the acquisition. The Company anticipates the intangible asset will be fully amortized by the end of 2018. As of December 31, 2017 and 2016, the Company had $28.9 million and $25.5 million in accumulated amortization expense, attributable to the acquisition, respectively. Factors indicating potential impairment include, but are not limited to, significant decreases in the market value of the long‑lived assets, a significant change in the condition of the long‑lived assets and operating cash flow losses associated with the use of the long‑lived assets. On a periodic basis, the Company evaluates whether impairment indicators are present. When considering whether or not impairment of long‑lived assets exists, the Company groups similar assets together at the lowest level for which identifiable cash flows are largely independent of the cash flows of other assets and liabilities and compare the undiscounted cash flows for each asset group to the net carrying amount of the assets supporting the asset group. Asset groupings are done at the fleet or contract level.
The Company did not recognize any impairment charges of long-lived assets during the year ended December 31, 2017.
61
In 2016, the Company impaired certain long-lived assets relating to the CRJ200 aircraft and ERJ145 aircraft type specific assets. See Note 8, Special Items, for the impairment charges recorded during the year ended December 31, 2016.
Capitalized Interest
Interest is capitalized on aircraft purchase deposits as a portion of the cost of the asset and is depreciated over the estimated useful life of the asset. During the years ended December 31, 2017, 2016 and 2015, the Company capitalized interest costs of approximately $1.4 million, $1.5 million, and $2.2 million, respectively.
Maintenance
The Company operates under a U.S. Federal Aviation Administration approved continuous inspection and maintenance program. The Company uses the direct expense method of accounting for its regional jet engine overhauls wherein the expense is recorded when the overhaul event occurs. The Company has engine services agreements with third-party vendors to provide long-term engine services covering the scheduled and unscheduled repairs for certain of its CRJ200 aircraft, CRJ700 aircraft, ERJ145 aircraft and E175 aircraft. Under the terms of the agreements, the Company pays a fixed dollar amount per engine hour flown on a monthly basis and the third-party vendors will assume the responsibility to repair the engines at no additional cost to the Company, subject to certain specified exclusions. Maintenance costs under these contracts are recognized when the engine hour is flown pursuant to the terms of each contract.
The costs of maintenance for airframe and avionics components, landing gear and other recurring maintenance are expensed as incurred.
Passenger and Ground Handling Revenues
The Company recognizes passenger and ground handling revenues when the service is provided under its code-share agreements. Under the Company’s fixed-fee arrangements (referred to as “fixed-fee arrangements, “fixed-fee contracts” or “capacity purchase agreements”) with Delta, United, American and Alaska (each, a “major airline partner”), the major airline partner generally pays the Company a fixed-fee for each departure, flight or block time incurred, and an amount per aircraft in service each month with additional incentives based on flight completion and on time performance. The major airline partner also directly reimburses the Company for certain direct expenses incurred under the fixed-fee arrangement such as fuel expense and certain airport related expenses. Under the fixed-fee arrangements, revenue is earned when each flight is completed.
Under the Company’s fixed-fee agreements with Delta, United, American and Alaska, the compensation structure generally consists of a combination of agreed‑upon rates for operating flights and direct reimbursement for other certain costs associated with operating the aircraft. A portion of the Company’s contract flying compensation is designed to reimburse the Company for certain aircraft ownership costs. The aircraft compensation structure varies by agreement, but is intended to cover either the Company’s aircraft principal and interest debt service costs, its aircraft depreciation and interest expense or its aircraft lease expense costs while the aircraft is under contract. Under the Company’s ExpressJet United Express ERJ Agreement and certain aircraft operating under fixed-fee contracts with Delta, the major airline partner provides the aircraft to the Company for a nominal amount. The Company has concluded that a component of its revenue under these agreements is rental income, inasmuch as the agreements identify the “right of use” of a specific type and number of aircraft over a stated period of time. The amounts deemed to be rental income under the agreements for the years ended December 31, 2017, 2016 and 2015 were $572.7 million, $516.0 million and $504.9 million, respectively. These amounts are reflected as passenger revenues on the Company’s consolidated statements of comprehensive income (loss). The Company has not separately stated aircraft rental income and aircraft rental expense in the consolidated statement of comprehensive income (loss) since the use of the aircraft is not a separate activity of the total service provided.
In the event that the contractual rates under the agreements have not been finalized at quarterly or annual financial statement dates, the Company records revenues based on the lower of prior period’s approved rates, as adjusted
62
to reflect any contract negotiations and the Company’s estimate of rates that will be implemented in accordance with revenue recognition guidelines. In the event the Company has a reimbursement dispute with a major airline partner, the Company evaluates the dispute under its established revenue recognition criteria and, provided the revenue recognition criteria have been met, the Company recognizes revenue based on management’s estimate of the resolution of the dispute.
In several of the Company’s agreements, the Company is eligible for incentive compensation upon the achievement of certain performance criteria. The incentives are defined in the agreements and are being measured and determined on a monthly, quarterly or semi-annual basis. At the end of each period, the Company calculates the incentives achieved during that period and recognizes revenue accordingly.
The Company’s passenger revenues from fixed-fee agreements could be impacted by a number of factors, including changes to the Company’s code‑share agreements with Delta, United, Alaska or American, contract modifications resulting from contract re‑negotiations, the Company’s ability to earn incentive payments contemplated under the Company’s code‑share agreements and settlement of reimbursement disputes with the Company’s major airline partners.
Under a Revenue Sharing Arrangement (referred to as a “revenue-sharing” or “prorate” arrangement), the major airline and regional airline negotiate a passenger fare proration formula, pursuant to which the regional airline receives a percentage of the ticket revenues for those passengers traveling for one portion of their trip on the regional airline and the other portion of their trip on the major airline. Revenue is recognized under the Company’s prorate flying agreements when each flight is completed based upon the portion of the prorate passenger fare the Company anticipates that it will receive for each completed flight.
Other ancillary revenues commonly associated with airlines such as baggage fee revenue, ticket change fee revenue and the marketing component of the sale of mileage credits are retained by the Company’s major airline partners on flights that the Company operates under its code-share agreements.
The following summarizes the significant provisions of each code-share agreement the Company has with each major airline partner:
Delta Connection Agreements
|
Agreement |
Aircraft type |
Number of Aircraft |
Term / Termination |
||||||
|
SkyWest Airlines Delta Connection Agreement (fixed-fee arrangement) |
|
CRJ 200 CRJ 700 CRJ 900 E175 |
|
70 27 36 19 |
|
Individual aircraft have scheduled removal dates under the agreement between 2018 and 2027 The average remaining term of the aircraft under contract is 2.9 years |
|
||
|
ExpressJet Delta Connection Agreement (fixed-fee arrangement) |
|
CRJ 700 CRJ 900 |
|
33 16 |
|
Individual aircraft have scheduled removal dates under the agreement during 2018 |
|
||
|
SkyWest Airlines Delta Connection Prorate Agreement (revenue-sharing arrangement) |
|
CRJ 200
|
|
24 |
|
Terminable with 30-day notice |
|
||
63
United Express Agreements
|
Agreement |
|
Aircraft type |
|
Number of Aircraft |
|
Term / Termination |
|
|
SkyWest Airlines United Express Agreements (fixed-fee arrangement) |
|
CRJ 200 CRJ 700 E175 |
|
57 20 65
|
|
Individual aircraft have scheduled removal dates under the agreement between 2018 and 2029 The average remaining term of the aircraft under contract is 5.1 years |
|
|
ExpressJet United ERJ Agreement (fixed-fee arrangement) |
|
ERJ145 ERJ135
|
|
109 3 |
|
Agreement expires in 2022 The average remaining term of the aircraft under contract is 4.8 years |
|
|
SkyWest Airlines United Express Prorate Agreement (revenue-sharing arrangement) |
|
CRJ 200
|
|
24 |
|
Terminable with 120-day notice |
|
American Agreements
|
Agreement |
|
Aircraft type |
|
Number of Aircraft |
|
Term / Termination Dates |
|
|
SkyWest Airlines American Agreement (fixed-fee arrangement) |
|
CRJ 200 CRJ 700
|
|
10 37 |
|
CRJ200 aircraft are scheduled to expire in 2018 and the CRJ700 aircraft are scheduled to expire in 2019 |
|
|
SkyWest Airlines American Prorate Agreement (revenue-sharing arrangement) |
|
CRJ 200 |
|
6 |
|
Terminable with 120-day notice |
|
|
ExpressJet American Agreement (fixed-fee arrangement) |
|
CRJ 700 |
|
12
|
|
CRJ700 aircraft are scheduled to expire in 2019 |
|
Alaska Capacity Purchase Agreement
|
Agreement |
|
Aircraft type |
|
Number of Aircraft |
|
Term / Termination |
|
|
SkyWest Airlines Alaska Agreement (fixed-fee arrangement) |
CRJ 200 E175 |
4 23 |
CRJ200 aircraft are scheduled to expire in 2018 E175 aircraft have scheduled removal dates under the agreement between 2027 and 2029 |
In addition to the contractual arrangements described above, SkyWest Airlines has entered into agreements with Alaska and Delta to place additional E175/E175 SC aircraft into service for those major airline partners. As of December 31, 2017, the Company anticipated placing an additional 12 E175 aircraft with Alaska and 30 E175 SC aircraft with Delta. The delivery dates for the new E175/E175 SC aircraft are currently scheduled to take place by the end of 2018 or early 2019. Final delivery dates may adjust based on various factors.
64
ExpressJet initiated the wind down of its flying agreement with Delta during 2017 and expected to be complete by the end of 2018. As of December 31, 2017, ExpressJet operated 49 CRJ700s/900s under its Delta flying agreement. Of the 49 aircraft, ExpressJet anticipates returning 19 leased aircraft to Delta and removing 30 CRJ700 aircraft from service with Delta during 2018. ExpressJet is pursuing placement of the 30 CRJ700 aircraft with other partners, of which eight aircraft are scheduled to be placed under an agreement with American following the removal from service with Delta.
Deferred Aircraft Credits
The Company accounts for incentives provided by aircraft manufacturers as deferred credits. The deferred credits related to leased aircraft are amortized on a straight‑line basis as a reduction to rent expense over the lease term. Credits related to owned aircraft reduce the purchase price of the aircraft, which has the effect of amortizing the credits on a straight‑line basis as a reduction in depreciation expense over the life of the related aircraft. The incentives are credits that may be used to purchase spare parts and pay for training and other expenses.
Income Taxes
The Company recognizes a net liability or asset for the deferred tax consequences of all temporary differences between the tax basis of assets and liabilities and their reported amounts in the consolidated financial statements that are expected to result in taxable or deductible amounts in future years when the reported amounts of the assets and liabilities are recovered or settled.
Net Income (Loss) Per Common Share
Basic net income (loss) per common share (“Basic EPS”) excludes dilution and is computed by dividing net income (loss) by the weighted average number of common shares outstanding during the period. Diluted net income (loss) per common share (“Diluted EPS”) reflects the potential dilution that could occur if stock options or other contracts to issue common stock were exercised or converted into common stock. The computation of Diluted EPS does not assume exercise or conversion of securities that would have an anti‑dilutive effect on net income (loss) per common share. During the year ended December 31, 2017, 284,000 performance shares (at target performance) were excluded in the computation of Diluted EPS since the Company had not achieved the minimum target thresholds as of December 31, 2017. During the year ended December 31, 2016, 2,077,000 shares reserved for the issuance upon the exercise of outstanding options, performance shares and restricted stock units were excluded from the computation of Diluted EPS due to the net loss in 2016 and 505,000 shares reserved for outstanding options were excluded from the Diluted EPS calculation for the year ended December 31, 2015 as the respective exercise price exceeded the weighted average fair market value of the Company’s stock for 2015. The calculation of the weighted average number of common shares outstanding for Basic EPS and Diluted EPS are as follows for the years ended December 31, 2017, 2016 and 2015 (in thousands):
|
|
|
Year Ended December 31, |
||||||||
|
|
|
2017 |
|
2016 |
|
2015 |
|
|||
|
Numerator: |
|
|
|
|
|
|
|
|
|
|
|
Net Income (Loss) |
|
$ |
428,907 |
|
$ |
(161,586) |
|
$ |
117,817 |
|
|
Denominator: |
|
|
|
|
|
|
|
|
|
|
|
Denominator for basic earnings per-share weighted average shares |
|
|
51,804 |
|
|
51,505 |
|
|
51,077 |
|
|
Dilution due to stock options and restricted stock units |
|
|
1,296 |
|
|
— |
|
|
748 |
|
|
Denominator for diluted earnings per-share weighted average shares |
|
|
53,100 |
|
|
51,505 |
|
|
51,825 |
|
|
Basic earnings (loss) per-share |
|
$ |
8.28 |
|
$ |
(3.14) |
|
$ |
2.31 |
|
|
Diluted earnings (loss) per-share |
|
$ |
8.08 |
|
$ |
(3.14) |
|
$ |
2.27 |
|
65
Comprehensive Income (Loss)
Comprehensive income (loss) includes charges and credits to stockholders’ equity that are not the result of transactions with the Company’s shareholders, including changes in unrealized appreciation on marketable securities.
Fair Value of Financial Instruments
The carrying amounts reported in the consolidated balance sheets for receivables and accounts payable approximate fair values because of the immediate or short‑term maturity of these financial instruments. Marketable securities are reported at fair value based on market quoted prices in the consolidated balance sheets. If quoted prices in active markets are no longer available, the Company has estimated the fair values of these securities utilizing a discounted cash flow analysis as of December 31, 2017. These analyses consider, among other items, the collateralization underlying the security investments, the creditworthiness of the counterparty, the timing of expected future cash flows, and the expectation of the next time the security is expected to have a successful auction. The fair value of the Company’s long‑term debt is estimated based on current rates offered to the Company for similar debt and was approximately $2,698.4 million as of December 31, 2017, as compared to the carrying amount of $2,712.4 million as of December 31, 2017. The Company’s fair value of long‑term debt as of December 31, 2016 was $2,566.5 million as compared to the carrying amount of $2,570.9 million as of December 31, 2016.
Segment Reporting
Generally accepted accounting principles require disclosures related to components of a company for which separate financial information is available to, and regularly evaluated by, the Company’s chief operating decision maker when deciding how to allocate resources and in assessing performance. The Company’s three operating segments consist of the operations conducted by SkyWest Airlines, ExpressJet and SkyWest Leasing. Information pertaining to the Company’s reportable segments is presented in Note 2, Segment Reporting.
Recent Accounting Pronouncements
Standards Effective in Future Years and Not Yet Adopted
In May 2014, the Financial Accounting Standards Board (the “FASB”) issued Accounting Standards Update No. 2014‑09, “Revenue from Contracts with Customers” (“ASU No. 2014‑09”). Under ASU No. 2014‑09, revenue is recognized at the time a good or service is transferred to a customer for the amount of consideration received for that specific good or service. In 2016, the FASB issued several amendments to the standard, including principal versus agent considerations when another party is involved in providing goods or services to a customer and the application of identifying performance obligations. The Company’s adoption of the standard as of January 1, 2018, will be first presented in the first quarter of 2018, utilizing the full retrospective method of adoption allowed by the standard, in order to provide for comparative results in all periods presented. Under the new standard, the Company concluded that individual flights are distinct services and these flight services promised in a CPA agreement represent a series of services that should be accounted for as a single performance obligation, recognized over time as the flights are completed. The adoption of ASU No. 2014‑09 did not have a material impact on recorded amounts when applied to the opening balance sheet as of January 1, 2018 and is not expected to impact the amount or timing of the future amounts of net income, however the principal versus agent considerations under ASU No. 2014-09 will result in the Company recording directly reimbursed fuel expense under its fixed-fee contracts as a reduction to the applicable operating expense (net) rather than revenue (gross). The Company’s analysis of information necessary to recast prior period results is still preliminary and additional impacts could still result when the standard is first applied to revenue transactions during the first quarter of 2018.
In February 2016, the FASB issued Accounting Standards Update 2016‑02, “Leases (Topic 842)” (“ASU No. 2016-02”). ASU No. 2016‑02 amends the existing accounting standards for lease accounting, including requiring lessees to recognize most leases on their balance sheets and making targeted changes to lessor accounting. ASU No. 2016‑02 will be effective beginning in the first quarter of 2019. Early adoption of ASU No. 2016‑02 is permitted. ASU No. 2016‑02 requires a modified retrospective transition approach for all leases existing at, or entered into after, the date of initial application, with an option to use certain transition relief. The Company’s management is currently
66
evaluating the impact the adoption of ASU 2016‑02 is anticipated to have on the Company’s consolidated financial statements.
In 2016, the FASB issued Accounting Standards Update 2016‑15, “Statement of Cash Flows (Topic 230): Classification of Certain Cash Receipts and Cash Payments” and Accounting Standard Update 2016‑18, “Statement of Cash Flows (Topic 230): Restricted Cash” related to the classification of certain cash receipts and cash payments and the presentation of restricted cash within an entity’s statement of cash flows, respectively. These standards are effective for interim and annual reporting periods beginning after December 15, 2017, but early adoption is permitted. The Company anticipates adopting this standard in the first quarter of 2018 that will modify the presentation of changes in restricted cash in the Company’s Consolidated Statement of Cash Flows.
Recently Adopted Standards
Pursuant to the guidelines of the recently issued Accounting Standards Update 2015-17, “Income Taxes (Topic 740): Balance Sheet Classification of Deferred Taxes” (“ASU 2015‑17”), all net deferred tax assets and liabilities are to be classified as non-current. As permitted under ASU 2015‑17, the Company adopted this guidance for the quarter ended March 31, 2017. The Company adopted ASU 2015‑17 retrospectively. Upon adoption, approximately $129.3 million of formerly recorded current deferred tax assets as of December 31, 2016 were reclassified to non-current and netted against non-current deferred income taxes payable as of December 31, 2016 in the accompanying financial statements.
In March 2016, the FASB issued Accounting Standards Update No. 2016‑09, “Compensation—Stock Compensation (Topic 718)” (“ASU No. 2016‑09”). ASU No. 2016‑09 makes several amendments to Topic 718, which simplified the accounting for share-based payment transactions, including the income tax consequences, the calculation of diluted earnings per share, the treatment of forfeitures and the classification on the statement of cash flows. Amendments related to the timing of when excess tax benefits are recognized, minimum statutory withholding requirements and forfeitures should be applied using a modified retrospective transition method by means of a cumulative-effect adjustment to equity as of the beginning of the period in which the guidance is adopted. Amendments requiring the recognition of excess tax benefits and tax deficiencies in the income statement should be applied prospectively. Prior to the adoption of ASU No. 2016‑09, accounting principles generally accepted in the United States of America (“GAAP”) required tax effects of deductions for share-based payments in excess of compensation cost and tax deficiencies to be recorded in equity. Under ASU No. 2016‑09, the tax effects of awards are treated as discrete income tax expense items in the reporting period in which they occur.
The Company adopted ASU No. 2016‑09 as of January 1, 2017. The adoption of this standard resulted in the recognition in of $0.9 million of previously unrecognized excess tax benefits in net deferred tax liabilities and an increase to retained earnings on the consolidated balance sheet as of the beginning of the current year, and the recognition of $5.4 million of excess tax benefits in the income tax provision for the year ended December 31, 2017. The adoption of ASU No. 2016‑09 did not have a material impact on the statement of cash flows presentation.
(2) Segment Reporting
Generally accepted accounting principles require disclosures related to components of a company for which separate financial information is available to, and regularly evaluated by, the Company’s chief operating decision maker when deciding how to allocate resources and in assessing performance.
The Company’s three reporting segments consist of the operations of SkyWest Airlines, ExpressJet and SkyWest Leasing activities. Corporate overhead expenses incurred by the Company are allocated to the operating expenses of SkyWest Airlines and ExpressJet.
The Company’s chief operating decision maker analyzes the profitability of operating the E175 aircraft (including operating costs and associated revenue) separately from the profitability of the Company’s ownership, financing costs and associated revenue of the Company’s E175 aircraft (including depreciation expense, interest expense and associated revenue). The SkyWest Leasing segment includes revenue attributed to the Company’s E175 aircraft ownership cost earned under the applicable fixed-fee contracts and the depreciation and interest expense of the Company’s E175 aircraft. The SkyWest Leasing segment’s total assets and capital expenditures include the acquired E175 aircraft. The SkyWest Leasing segment additionally includes the activity of four CRJ200 aircraft leased to a third-party.
67
The following represents the Company’s segment data for the years ended December 31, 2017, 2016 and 2015 (in thousands).
|
|
|
|
Year Ended December 31, 2017 |
||||||||||
|
|
|
|
SkyWest |
|
|
|
|
|
|
|
|
|
|
|
|
|
|
Airlines |
|
|
ExpressJet |
|
|
SkyWest Leasing |
|
|
Consolidated |
|
|
Operating revenues |
|
$ |
2,173,384 |
|
$ |
790,942 |
|
$ |
239,942 |
|
$ |
3,204,268 |
|
|
Operating expense |
|
|
1,888,556 |
|
|
819,343 |
|
|
108,170 |
|
|
2,816,069 |
|
|
Depreciation and amortization expense |
|
|
134,563 |
|
|
51,982 |
|
|
106,223 |
|
|
292,768 |
|
|
Interest expense |
|
|
21,544 |
|
|
4,127 |
|
|
79,254 |
|
|
104,925 |
|
|
Segment profit (loss) (1) |
|
|
263,284 |
|
|
(32,528) |
|
|
52,518 |
|
|
283,274 |
|
|
Identifiable intangible assets, other than goodwill |
|
|
— |
|
|
4,896 |
|
|
— |
|
|
4,896 |
|
|
Total assets |
|
|
2,228,930 |
|
|
599,122 |
|
|
2,630,227 |
|
|
5,458,279 |
|
|
Capital expenditures (including non-cash) |
|
|
124,955 |
|
|
14,278 |
|
|
550,165 |
|
|
689,398 |
|
|
|
|
|
Year Ended December 31, 2016 |
|
|||||||||
|
|
|
|
SkyWest |
|
|
|
|
|
|
|
|
|
|
|
|
|
|
Airlines |
|
|
ExpressJet |
|
|
SkyWest Leasing |
|
|
Consolidated |
|
|
Operating revenues |
|
$ |
1,935,378 |
|
$ |
1,044,828 |
|
$ |
141,000 |
|
$ |
3,121,206 |
|
|
Operating expense |
|
|
1,886,173 |
|
|
1,339,569 |
|
|
68,148 |
|
|
3,293,890 |
|
|
Depreciation and amortization expense |
|
|
139,159 |
|
|
83,935 |
|
|
61,875 |
|
|
284,969 |
|
|
Special items |
|
|
184,295 |
|
|
281,354 |
|
|
— |
|
|
465,649 |
|
|
Interest expense |
|
|
26,211 |
|
|
6,773 |
|
|
45,193 |
|
|
78,177 |
|
|
Segment profit (loss) (1) |
|
|
22,994 |
|
|
(301,514) |
|
|
27,659 |
|
|
(250,861) |
|
|
Identifiable intangible assets, other than goodwill |
|
|
— |
|
|
8,249 |
|
|
— |
|
|
8,249 |
|
|
Total assets |
|
|
2,250,276 |
|
|
582,890 |
|
|
2,174,800 |
|
|
5,007,966 |
|
|
Capital expenditures (including non-cash) |
|
|
57,761 |
|
|
15,396 |
|
|
1,085,844 |
|
|
1,159,001 |
|
|
|
|
|
Year Ended December 31, 2015 |
|
|||||||||
|
|
|
|
SkyWest |
|
|
|
|
|
|
|
|
|
|
|
|
|
|
Airlines |
|
|
ExpressJet |
|
|
SkyWest Leasing |
|
|
Consolidated |
|
|
Operating revenues |
|
$ |
1,848,363 |
|
$ |
1,169,923 |
|
$ |
77,277 |
|
$ |
3,095,563 |
|
|
Operating expense |
|
|
1,630,200 |
|
|
1,192,070 |
|
|
38,778 |
|
|
2,861,048 |
|
|
Depreciation and amortization expense |
|
|
141,189 |
|
|
86,382 |
|
|
36,936 |
|
|
264,507 |
|
|
Interest expense |
|
|
36,141 |
|
|
12,091 |
|
|
27,618 |
|
|
75,850 |
|
|
Segment profit (loss) (1) |
|
|
182,022 |
|
|
(34,238) |
|
|
10,881 |
|
|
158,665 |
|
|
Identifiable intangible assets, other than goodwill |
|
|
— |
|
|
10,499 |
|
|
— |
|
|
10,499 |
|
|
Total assets |
|
|
2,300,388 |
|
|
1,331,000 |
|
|
1,150,596 |
|
|
4,781,984 |
|
|
Capital expenditures (including non-cash) |
|
|
30,897 |
|
|
24,679 |
|
|
659,513 |
|
|
715,089 |
|
|
(1) |
Segment profit is operating income less interest expense |
68
(3) Long‑term Debt
Long‑term debt consisted of the following as of December 31, 2017 and 2016 (in thousands):
|
|
|
December 31, |
|
December 31, |
|
||
|
|
|
2017 |
|
2016 |
|
||
|
Notes payable to banks, due in semi-annual installments, variable interest based on LIBOR, or with interest rates ranging from 2.91% to 3.43% through 2020, secured by aircraft |
|
$ |
34,905 |
|
$ |
63,408 |
|
|
Notes payable to a financing company, due in semi-annual installments, variable interest based on LIBOR, or with interest rates ranging from 2.85% to 3.25% through 2021, secured by aircraft |
|
|
97,612 |
|
|
146,266 |
|
|
Notes payable to banks, due in semi-annual installments plus interest at 6.06% to 6.51% through 2021, secured by aircraft |
|
|
63,090 |
|
|
86,052 |
|
|
Notes payable to a financing company, due in semi-annual installments plus interest at 5.78% to 6.23% through 2017, secured by aircraft |
|
|
— |
|
|
8,854 |
|
|
Notes payable to banks, due in monthly installments plus interest of 2.68% to 6.86% through 2025, secured by aircraft |
|
|
372,157 |
|
|
426,389 |
|
|
Notes payable to banks, due in monthly installments, plus interest at 4.16% to 6.05% through 2029, secured by aircraft |
|
|
49,001 |
|
|
8,998 |
|
|
Notes payable to banks, due in monthly installments, plus interest at 3.44% through 2019, secured by aircraft |
|
|
— |
|
|
3,280 |
|
|
Notes payable to banks, due in quarterly installments, plus interest at 3.39% to 4.73% through 2029, secured by aircraft |
|
|
2,085,822 |
|
|
1,806,981 |
|
|
Notes payable to banks, due in monthly installments, plus interest based on LIBOR at 3.54% through 2017, secured by aircraft |
|
|
— |
|
|
4,666 |
|
|
Notes payable to banks due in monthly installments, interest at 3.30% through 2019, secured by spare engines |
|
|
9,763 |
|
|
16,010 |
|
|
Long-term debt |
|
$ |
2,712,350 |
|
$ |
2,570,904 |
|
|
Current portion of long-term debt |
|
|
(313,243) |
|
|
(308,945) |
|
|
Less long-term portion of unamortized debt issue cost, net |
|
|
(21,761) |
|
|
(21,908) |
|
|
Long-term debt, net of current maturities and debt issue costs |
|
$ |
2,377,346 |
|
$ |
2,240,051 |
|
|
|
|
|
|
|
|
|
|
|
Current portion of long-term debt |
|
|
313,243 |
|
|
308,945 |
|
|
Less current portion of unamortized debt issue cost, net |
|
|
(3,565) |
|
|
(3,485) |
|
|
Current portion of long-term debt, net of debt issue costs |
|
$ |
309,678 |
|
$ |
305,460 |
|
During the year ended December 31, 2017, the Company acquired 21 new E175 aircraft. Approximately 85% of the aircraft purchase price was financed through the issuance of debt and 15% of the aircraft purchase price was paid with cash.
As of December 31, 2017 and 2016, the Company had $2.7 billion and $2.6 billion, respectively, of long‑term debt obligations primarily related to the acquisition of aircraft and certain spare engines. The average effective interest rate on the debt related to those long-term debt obligations at December 31, 2017 and 2016, was approximately 3.9% and 3.8%, respectively.
During the year ended December 31, 2016, the Company used $16.5 million in cash to extinguish $18.4 million in debt early. The payment resulted in a pre-tax gain of $1.3 million, reflected as other income in the consolidated statements of comprehensive income (loss). During the year ended December 31, 2015, the Company used $110.8 million in cash to pay off $145.4 million in debt. The payment resulted in a pre-tax gain of $33.7 million, reflected as other income in the consolidated statements of comprehensive income (loss). The Company did not extinguish any debt early during 2017.
69
The aggregate amounts of principal maturities of long‑term debt as of December 31, 2017 were as follows (in thousands):
|
2018 |
|
$ |
313,243 |
|
|
2019 |
|
|
315,753 |
|
|
2020 |
|
|
284,998 |
|
|
2021 |
|
|
272,470 |
|
|
2022 |
|
|
280,360 |
|
|
Thereafter |
|
|
1,245,526 |
|
|
|
|
$ |
2,712,350 |
|
As of December 31, 2017 and 2016, SkyWest Airlines had a $75 million line of credit. The line of credit includes minimum liquidity and profitability covenants and is secured by certain assets. As of December 31, 2017 and 2016, SkyWest Airlines had no amount outstanding under the facility. However, at December 31, 2017 and 2016 the Company had $14.8 million and $6.5 million, respectively, in letters of credit issued under the facility which reduced the amount available under the facility to $60.2 million and $68.5 million, respectively. The facility expires on June 1, 2018 and has a variable interest rate of LIBOR plus 2.5% (4.1% at December 31, 2017).
As of December 31, 2017 and 2016, the Company had $87.4 million and $87.7 million, respectively, in letters of credit and surety bonds outstanding with various banks and surety institutions.
(4) Income Taxes
The provision (benefit) for income taxes includes the following components (in thousands):
|
|
|
Year ended December 31, |
|
|||||||
|
|
|
2017 |
|
2016 |
|
2015 |
|
|||
|
Current tax provision (benefit): |
|
|
|
|
|
|
|
|
|
|
|
Federal |
|
$ |
5,853 |
|
$ |
(3,801) |
|
$ |
3,801 |
|
|
State |
|
|
180 |
|
|
111 |
|
|
1,035 |
|
|
|
|
|
6,033 |
|
|
(3,690) |
|
|
4,836 |
|
|
Deferred tax provision (benefit): |
|
|
|
|
|
|
|
|
|
|
|
Federal |
|
|
(166,890) |
|
|
(77,430) |
|
|
66,430 |
|
|
State |
|
|
20,133 |
|
|
(6,106) |
|
|
5,239 |
|
|
|
|
|
(146,757) |
|
|
(83,536) |
|
|
71,669 |
|
|
Provision (benefit) for income taxes |
|
$ |
(140,724) |
|
$ |
(87,226) |
|
$ |
76,505 |
|
70
The following is a reconciliation between a federal income tax rate of 35% of income (loss) before income taxes and the effective tax rate which is derived by dividing the provision (benefit) for income taxes by income (loss) before for income taxes (in thousands):
|
|
|
Year ended December 31, |
|
|||||||
|
|
|
2017 |
|
2016 |
|
2015 |
|
|||
|
Computed provision (benefit) for income taxes at the statutory rate |
|
$ |
100,864 |
|
$ |
(87,084) |
|
$ |
68,013 |
|
|
Increase (decrease) in income taxes resulting from: |
|
|
|
|
|
|
|
|
|
|
|
State income tax provision (benefit), net of federal income tax benefit |
|
|
7,778 |
|
|
(5,768) |
|
|
5,416 |
|
|
Non-deductible expenses |
|
|
3,230 |
|
|
3,552 |
|
|
3,641 |
|
|
Valuation allowance changes affecting the provision for income taxes |
|
|
505 |
|
|
751 |
|
|
(899) |
|
|
Excess tax benefits from share-based compensation |
|
|
(5,377) |
|
|
— |
|
|
— |
|
|
Revaluation of net deferred taxes for the Tax Act |
|
|
(246,845) |
|
|
— |
|
|
— |
|
|
Other, net |
|
|
(879) |
|
|
1,323 |
|
|
334 |
|
|
Provision (benefit) for income taxes |
|
$ |
(140,724) |
|
$ |
(87,226) |
|
$ |
76,505 |
|
On December 22, 2017, the Tax Cuts and Jobs Act of 2017 (the “Tax Act”) was enacted. The Tax Act makes broad and complex changes to the U.S. tax code that may affect our income tax accounting at December 31, 2017 and future periods, including, but not limited to reducing the U.S. federal corporate tax rate from the previous rate of 35% to 21%, requiring companies to pay a one-time transition tax on earnings of certain foreign subsidiaries that were previously tax deferred, and creates new taxes on certain foreign sourced earnings.
The SEC staff issued Staff Accounting Bulletin 118 (“SAB 118”), which provides guidance on accounting for the tax effects of the Tax Act. SAB 118 provides a measurement period that should not extend beyond one year from the Tax Act enactment date for companies to complete the accounting under Accounting Standards Codification 740 (“ASC 740”). In accordance with SAB 118, a company must reflect the income tax effects of those aspects of the Tax Act for which the accounting under ASC 740 is complete. To the extent that a company’s accounting for certain income tax effects of the Tax Act is incomplete but it is able to determine a reasonable estimate, it must record a provisional estimate in the financial statements. If a company cannot determine a provisional estimate to be included in the financial statements, it should continue to apply ASC 740 on the basis of the provisions of the tax laws that were in effect immediately before the enactment of the Tax Act.
In connection with our initial analysis of the impact of the Tax Act and consistent with the requirement to record a provisional estimate when applicable, the Company made a reasonable estimate of the effects of the Tax Act and recorded a discrete net income tax benefit at December 31, 2017 of approximately $246.8 million. This provisional estimate primarily consists of a net benefit for the corporate rate reduction due to the revaluing of the Company’s net deferred tax liabilities, including certain state related effects, as a result of the reduction in the federal corporate tax rates. The Company made certain estimates in evaluating the Tax Act impact on state income taxes and other deferred tax items. The Company is continuing to gather information and analyze aspects of the Tax Act, which could potentially affect the estimated impact on the deferred tax balances. These estimates may be affected as the Company gains a more thorough understanding of the Tax Act, including the deductibility of purchased assets, state tax treatment, and amounts related to employee compensation.
The impact of the Tax Act may differ from our estimates, possibly materially, due to, among other things, changes in interpretations and assumptions the Company has made, guidance that may be issued and actions the Company may take as a result of the Tax Act. The Company will continue to update the provisional estimates as information is obtained, such as state impacts regarding decoupling from the Tax Act provisions, realization of deferred amounts, and accounting method elections that may be made by the Company.
71
For the years ended December 31, 2017, 2016 and 2015 the Company recorded a $0.5 million, $0.8 million and $0.9 million valuation allowance, respectively against certain deferred tax assets primarily associated with ExpressJet state net operating losses with a limited carry forward period. The increase of the valuation allowance was based on changes in state tax laws and the Company's income tax projections which increased the amount of deferred tax assets that are anticipated to expire before the deferred tax assets may be utilized.
The Company recorded a $5.4 million benefit from share-based compensation in 2017 relating to ASU 2016-09 which, beginning in 2017, requires excess tax benefits and deficiencies to be recognized in the income tax provision during the period stock options are exercised and when stock awards vest.
The significant components of the Company’s net deferred tax assets and liabilities as of December 31, 2017 and 2016 are as follows (in thousands):
|
|
|
As of December 31, |
|
||||
|
|
|
2017 |
|
2016 |
|
||
|
Deferred tax assets: |
|
|
|
|
|
|
|
|
Intangible asset |
|
$ |
(206) |
|
$ |
4,983 |
|
|
Accrued benefits |
|
|
31,651 |
|
|
48,482 |
|
|
Net operating loss carryforward |
|
|
122,648 |
|
|
286,389 |
|
|
AMT credit carryforward |
|
|
23,443 |
|
|
17,589 |
|
|
Deferred aircraft credits |
|
|
53,870 |
|
|
60,415 |
|
|
Accrued reserves and other |
|
|
26,853 |
|
|
47,906 |
|
|
Total deferred tax assets |
|
|
258,259 |
|
|
465,764 |
|
|
Valuation allowance |
|
|
(10,642) |
|
|
(8,877) |
|
|
Deferred tax liabilities: |
|
|
|
|
|
|
|
|
Accelerated depreciation |
|
|
(666,637) |
|
|
(1,022,291) |
|
|
Total deferred tax liabilities |
|
|
(666,637) |
|
|
(1,022,291) |
|
|
Net deferred tax liability |
|
$ |
(419,020) |
|
$ |
(565,404) |
|
The Company’s deferred tax liabilities were primarily generated through accelerated depreciation, combined with shorter depreciable tax lives, allowed under the IRS tax code for purchased aircraft and support equipment compared to the Company’s depreciation policy under GAAP for such assets using the straight-line method (see note 1 Nature of Operations and Summary of Significant Accounting Policies).
The Company's valuation allowance is related to certain deferred tax assets with a limited carry forward period where the Company does not anticipate utilizing these deferred tax assets prior to the lapse of the carry forward period.
At December 31, 2017 and 2016, the Company had federal net operating losses of approximately $491.4 million and $763.9 million and state net operating losses of approximately $302.5 million and $469.2 million, respectively. The estimated effective tax rate applicable to the federal and state net operating losses at December 31, 2017 was 21.0% and 3.36%, respectively. The Company anticipated that the federal and state net operating losses will start to expire in 2034 and 2018, respectively. The Company has recorded a valuation allowance for state net operating losses the Company anticipates will expire before the benefit will be realized due to the limited carry forward periods. As of December 31, 2017 and 2016, the Company also had an alternative minimum tax credit of approximately $23.4 million and $17.6 million, respectively, which does not expire. Under the new the Tax Act, the alternative minimum tax credit is anticipated to be realized by the Company either by offsetting regular tax due or as a refundable credit over the next four years.
72
(5) Commitments and Contingencies
Lease Obligations
The Company leases 319 aircraft, as well as airport facilities, office space, and various other property and equipment under non‑cancelable operating leases which are generally on a long‑term net rent basis where the Company pays taxes, maintenance, insurance and certain other operating expenses applicable to the leased property. The following table summarizes future minimum rental payments required under operating leases that have non‑cancelable lease terms as of December 31, 2017 (in thousands):
|
2018 |
|
$ |
142,157 |
|
|
2019 |
|
|
104,297 |
|
|
2020 |
|
|
121,119 |
|
|
2021 |
|
|
112,657 |
|
|
2022 |
|
|
75,981 |
|
|
Thereafter |
|
|
160,621 |
|
|
|
|
$ |
716,832 |
|
The majority of the Company’s leased aircraft are owned and leased through trusts whose sole purpose is to purchase, finance and lease these aircraft to the Company (“Leveraged Lease Agreements”); therefore, they meet the criteria of a variable interest entity. However, since these are single owner trusts in which the Company does not participate, the Company is not considered at risk for losses and is not considered the primary beneficiary. As a result, the Company has not consolidated any of these trusts or any other entities in applying the accounting guidance. The Company’s management believes that the Company’s maximum exposure under these leases is the remaining lease payments.
Total rental expense for non-cancelable aircraft operating leases was approximately $215.8 million, $262.6 million and $273.7 million for the years ended December 31, 2017, 2016 and 2015, respectively. The minimum rental expense for airport station rents was approximately $30.3 million, $31.4 million and $35.1 million for the years ended December 31, 2017, 2016 and 2015, respectively.
Self‑insurance
The Company self‑insures a portion of its potential losses from claims related to workers’ compensation, environmental issues, property damage, medical insurance for employees and general liability. Losses are accrued based on an estimate of the ultimate aggregate liability for claims incurred, using standard industry practices and the Company’s actual experience. Actual results could differ from these estimates.
Legal Matters
The Company is subject to certain legal actions which it considers routine to its business activities. As of December 31, 2017, management believed, after consultation with legal counsel, that the ultimate outcome of such legal matters was not likely to have a material adverse effect on the Company’s financial position, liquidity or results of operations.
Concentration Risk and Significant Customers
The Company requires no collateral from its major airline partners or customers, but monitors the financial condition of its major airline partners. Under the majority of the Company’s code-share agreements, the Company receives weekly payments from its major code-share partners that approximate a significant percentage of the compensation earned for such period. Additionally, the Company provides certain customer service functions at multiple airports for various airlines and the Company maintains an allowance for doubtful accounts receivable based upon expected collectability of all accounts receivable. The Company’s allowance for doubtful accounts totaled $157,000 and $173,000 as of December 31, 2017 and 2016, respectively. For the years ended December 31, 2017, 2016
73
and 2015, the Company’s contractual relationships with Delta and United combined accounted for approximately 78.8%, 85.4% and 86.9%, respectively of the Company’s total revenues.
Employees Under Collective Bargaining Agreements
As of December 31, 2017, the Company had approximately 16,300 full‑time equivalent employees. Approximately 22.0% of these employees were represented by unions, including the following employee groups. Notwithstanding the completion of the ExpressJet Combination, ExpressJet’s employee groups continue to be represented by those unions who provided representation prior to the ExpressJet Combination.
Accordingly, the following table refers to ExpressJet’s employee groups based upon their union affiliations prior to the ExpressJet Combination.
|
|
|
Approximate |
|
|
|
|
|
|
|
|
Number of |
|
|
|
|
|
|
|
|
Active Employees |
|
|
|
Status of |
|
|
Employee Group |
|
Represented |
|
Representatives |
|
Agreement |
|
|
Atlantic Southeast Pilots |
|
669 |
|
Air Line Pilots Association International |
|
Amendable February 2018 |
|
|
Atlantic Southeast Flight Attendants |
|
552 |
|
International Association of Machinists and Aerospace Workers |
|
Currently Amendable |
|
|
Atlantic Southeast Flight Controllers |
|
25 |
|
Transport Workers Union of America |
|
Currently Amendable |
|
|
Atlantic Southeast Mechanics |
|
102 |
|
International Brotherhood of Teamsters |
|
Currently Amendable |
|
|
Atlantic Southeast Stock Clerks |
|
29 |
|
International Brotherhood of Teamsters |
|
Currently Amendable |
|
|
ExpressJet Delaware Pilots |
|
1111 |
|
Air Line Pilots Association International |
|
Amendable February 2018 |
|
|
ExpressJet Delaware Flight Attendants |
|
618 |
|
International Association of Machinists and Aerospace Workers |
|
Currently Amendable |
|
|
ExpressJet Delaware Mechanics |
|
418 |
|
International Brotherhood of Teamsters |
|
Amendable January 2019 |
|
|
ExpressJet Delaware Dispatchers |
|
22 |
|
Transport Workers Union of America |
|
Currently Amendable |
|
|
ExpressJet Delaware Stock Clerks |
|
42 |
|
International Brotherhood of Teamsters |
|
Currently Amendable |
|
In January 2018, the ExpressJet Delaware Mechanics ratified a one-year contract extension to their labor agreement.
(6) Fair Value Measurements
The Company holds certain assets that are required to be measured at fair value in accordance with GAAP. The Company determined fair value of these assets based on the following three levels of inputs:
|
Level 1—Quoted prices in active markets for identical assets or liabilities. |
|
Level 2—Observable inputs other than Level 1 prices such as quoted prices for similar assets or liabilities; quoted prices in markets that are not active; or other inputs that are observable or can be corroborated by observable market data for substantially the full term of the assets or liabilities. Some of the Company’s marketable securities primarily utilize broker quotes in a non‑active market for valuation of these securities. |
74
|
Level 3—Unobservable inputs that are supported by little or no market activity and that are significant to the fair value of the assets or liabilities, therefore requiring an entity to develop its own assumptions. |
As of December 31, 2017, the Company held certain assets that are required to be measured at fair value on a recurring basis. Assets measured at fair value on a recurring basis are summarized below (in thousands):
|
|
|
Fair Value Measurements as of December 31, 2017 |
|
||||||||||
|
|
|
Total |
|
Level 1 |
|
Level 2 |
|
Level 3 |
|
||||
|
Marketable Securities |
|
|
|
|
|
|
|
|
|
|
|
|
|
|
Bonds and bond funds |
|
$ |
344,251 |
|
$ |
— |
|
$ |
344,251 |
|
$ |
— |
|
|
Commercial paper |
|
|
159,252 |
|
|
— |
|
|
159,252 |
|
|
— |
|
|
|
|
$ |
503,503 |
|
$ |
— |
|
$ |
503,503 |
|
$ |
— |
|
|
Cash, Cash Equivalents and Restricted Cash |
|
|
181,792 |
|
|
181,792 |
|
|
— |
|
|
— |
|
|
Total Assets Measured at Fair Value |
|
$ |
685,295 |
|
$ |
181,792 |
|
$ |
503,503 |
|
$ |
— |
|
|
|
|
Fair Value Measurements as of December 31, 2016 |
|
||||||||||
|
|
|
Total |
|
Level 1 |
|
Level 2 |
|
Level 3 |
|
||||
|
Marketable Securities |
|
|
|
|
|
|
|
|
|
|
|
|
|
|
Bonds and bond funds |
|
$ |
409,885 |
|
$ |
— |
|
$ |
409,885 |
|
$ |
— |
|
|
Commercial paper |
|
|
13 |
|
|
— |
|
|
13 |
|
|
— |
|
|
|
|
$ |
409,898 |
|
$ |
— |
|
$ |
409,898 |
|
$ |
— |
|
|
Cash, Cash Equivalents and Restricted Cash |
|
|
155,009 |
|
|
155,009 |
|
|
— |
|
|
— |
|
|
Total Assets Measured at Fair Value |
|
$ |
564,907 |
|
$ |
155,009 |
|
$ |
409,898 |
|
$ |
— |
|
The Company’s “Marketable Securities” classified as Level 2 primarily utilize broker quotes in a non‑active market for valuation of these securities.
No significant transfers between Level 1, Level 2 and Level 3 occurred during the year ended December 31, 2017. The Company’s policy regarding the recording of transfers between levels is to record any such transfers at the end of the reporting period.
(7) Investment in Other Companies
In 2014, the Company completed the sale of its 20% interest in Brazilian airline, TRIP Linhas Aéreas (“TRIP”), to TRIP Investments Ltd. (“TRIP Investimentos”). As part of the sale transaction, the Company also received options to acquire a minority interest in TRIP Investimentos. The options have an initial exercise price per share equal to the price paid by TRIP Investimentos to acquire TRIP shares from the Company subject to annual escalations. The options are scheduled to expire in 2018. The options were recorded as an asset at a nominal amount in 2014.
(8) Special Items
The following table summarizes the components of the Company's special items, for the year ended December 31, 2017, 2016 and 2015 (in thousands):
75
|
|
|
Year ended December 31, |
|
|||||||
|
|
|
2017 |
|
2016 |
|
2015 |
|
|||
|
Special items: |
|
|
|
|
|
|
|
|
|
|
|
CRJ200 aircraft related items 1 |
|
$ |
— |
|
$ |
424,466 |
|
$ |
— |
|
|
ERJ145 aircraft related items 2 |
|
|
— |
|
|
41,183 |
|
|
— |
|
|
Total special items |
|
$ |
— |
|
$ |
465,649 |
|
$ |
— |
|
|
(1) |
Consists primarily of inventory valuation charges and impairment charges to write-down CRJ200 aircraft including related long-lived assets to their estimated fair value. The estimated fair value of the long-lived assets, including the aircraft and fixed asset spare parts inventory, was based on third-party appraisals on the assets. These values were estimated based on listed market values or recent third-party market transactions for similar assets. Additionally, the Company estimated the fair value of certain long-lived prepaid lease assets using the net present value of estimated current CRJ200 lease rates. All fair values are considered to be Level 3 within the fair value hierarchy. Of the special items $184.3 million related to SkyWest Airlines and $240.2 million related to ExpressJet. These charges are net of $90 million in cash proceeds and other considerations from the Bombardier termination agreement. These special items are reflected in the SkyWest Airlines and ExpressJet operating expenses under Note 2 Segment Reporting. |
|
(2) |
The ERJ145 aircraft related items recorded in the 2016 special charge consist primarily of inventory valuation charges and impairment charges to write-down certain ERJ145 long-lived assets, which primarily consisted of spare engines and ERJ145 spare aircraft parts, to their estimated fair value of $41.2 million. The estimated fair value of the long-lived assets was based on third-party appraisals and valuations for similar assets which is considered an unobservable input (Level 3) under the fair value hierarchy. These special items are reflected in the ExpressJet operating expenses under Note 2 Segment Reporting. |
(9) Capital Transactions
Preferred Stock
The Company is authorized to issue 5,000,000 shares of preferred stock in one or more series without shareholder approval. No shares of preferred stock are presently outstanding. The Company’s Board of Directors is authorized, without any further action by the shareholders of the Company, to (i) divide the preferred stock into series; (ii) designate each such series; (iii) fix and determine dividend rights; (iv) determine the price, terms and conditions on which shares of preferred stock may be redeemed; (v) determine the amount payable to holders of preferred stock in the event of voluntary or involuntary liquidation; (vi) determine any sinking fund provisions; and (vii) establish any conversion privileges.
Stock Compensation
On May 4, 2010, the Company’s shareholders approved the adoption of the SkyWest, Inc. 2010 Long‑Term Incentive Plan, which provides for the issuance of up to 5,150,000 shares of common stock to the Company’s directors, employees, consultants and advisors (the “2010 Incentive Plan”). The 2010 Incentive Plan provides for awards in the form of options to acquire shares of common stock, stock appreciation rights, restricted stock grants, restricted stock units and performance awards. The 2010 Incentive Plan is administered by the Compensation Committee of the Company’s Board of Directors (the “Compensation Committee”), which is authorized to designate option grants as either incentive stock options for income tax purposes (“ISO”) or non-statutory stock options ISOs are granted at not less than 100% of the market value of the underlying common stock on the date of grant. Non‑statutory stock options are granted at a price as determined by the Compensation Committee.
Stock Options
The fair value of stock options awarded under the Company’s stock option plans has been estimated as of the grant date using the Black‑Scholes option pricing model. The Company uses historical data to estimate option exercises and employee termination in the option pricing model. The expected term of options granted is derived from the output
76
of the option pricing model and represents the period of time that options granted are expected to be outstanding. The expected volatilities are based on the historical volatility of the Company’s traded stock and other factors. During the year ended December 31, 2017, the Company did not grant any options to purchase shares of common stock. The Company granted 206,021 and 267,433 stock options to employees under the 2010 Incentive Plan during the years ended December 31, 2016 and 2015, respectively. Stock options granted in 2015 and 2016 vest in three equal installments over a three-year period. The following table shows the assumptions used and weighted average fair value for grants in the years ended December 31, 2016 and 2015.
|
|
|
2016 |
|
2015 |
|
||
|
Expected annual dividend rate |
|
|
1.08 |
% |
|
1.18 |
% |
|
Risk-free interest rate |
|
|
1.15 |
% |
|
1.62 |
% |
|
Average expected life (years) |
|
|
5.7 |
|
|
5.7 |
|
|
Expected volatility of common stock |
|
|
0.412 |
|
|
0.401 |
|
|
Forfeiture rate |
|
|
0.0 |
% |
|
0.0 |
% |
|
Weighted average fair value of option grants |
|
$ |
5.27 |
|
$ |
4.75 |
|
The Company recorded share‑based compensation expense only for those options that are expected to vest. The estimated fair value of the stock options is amortized over the vesting period of the respective stock option grants.
Options are exercisable for a period as defined by the Compensation Committee on the date granted; however, no stock option will be exercisable before six months have elapsed from the date of grant and no stock option shall be exercisable after seven years from the date of grant. The following table summarizes the stock option activity for all of the Company’s plans for the years ended December 31, 2017, 2016 and 2015:
|
|
|
2017 |
|
2016 |
|
2015 |
|
|||||||||||||||||||||||||||||
|
|
|
|
|
|
|
|
Weighted |
|
|
|
|
|
|
|
|
|
|
|
|
|
||||||||||||||||
|
|
|
|
|
Weighted |
|
Average |
|
Aggregate |
|
|
|
Weighted |
|
|
|
Weighted |
|
|||||||||||||||||||
|
|
|
|
|
Average |
|
Remaining |
|
Intrinsic |
|
|
|
Average |
|
|
|
Average |
|
|||||||||||||||||||
|
|
|
Number of |
|
Exercise |
|
Contractual |
|
Value |
|
Number of |
|
Exercise |
|
Number of |
|
Exercise |
|
|||||||||||||||||||
|
|
|
Options |
|
Price |
|
Term |
|
($000) |
|
Options |
|
Price |
|
Options |
|
Price |
|
|||||||||||||||||||
|
Outstanding at beginning of year |
|
819,981 |
|
$ |
13.58 |
|
4.4 |
years |
$ |
18,756.9 |
|
1,064,429 |
|
$ |
13.64 |
|
2,888,074 |
|
$ |
16.46 |
|
|||||||||||||||
|
Granted |
|
— |
|
|
— |
|
|
|
|
|
|
206,021 |
|
|
14.90 |
|
267,433 |
|
|
13.63 |
|
|||||||||||||||
|
Exercised |
|
(356,209) |
|
|
13.36 |
|
|
|
|
|
|
(351,296) |
|
|
14.17 |
|
(544,917) |
|
|
14.68 |
|
|||||||||||||||
|
Cancelled |
|
(5,669) |
|
|
14.33 |
|
|
|
|
|
|
(99,173) |
|
|
14.90 |
|
(1,546,161) |
|
|
18.53 |
|
|||||||||||||||
|
Outstanding at end of year |
|
458,103 |
|
|
13.73 |
|
4.0 |
years |
$ |
18,034.1 |
|
819,981 |
|
|
13.58 |
|
1,064,429 |
|
|
13.64 |
|
|||||||||||||||
|
Exercisable at December 31, 2017 |
|
254,192 |
|
|
13.17 |
|
3.4 |
years |
$ |
10,150.8 |
|
|
|
|
|
|
|
|
|
|
|
|||||||||||||||
|
Exercisable at December 31, 2016 |
|
263,851 |
|
|
13.76 |
|
2.8 |
years |
$ |
5,985.5 |
|
|
|
|
|
|
|
|
|
|
|
|||||||||||||||
The total intrinsic value of options to acquire shares of the Company’s common stock that were exercised during the years ended December 31, 2017, 2016 and 2015 was $9,940,000, $4,250,000 and $1,800,000, respectively.
77
The following table summarizes the status of the Company’s non‑vested stock options as of December 31, 2017:
|
|
|
|
|
Weighted-Average |
|
|
|
|
|
Number of |
|
Grant-Date |
|
|
|
|
|
Shares |
|
Fair Value |
|
|
|
Non-vested shares at beginning of year |
|
556,130 |
|
$ |
4.86 |
|
|
Granted |
|
— |
|
|
— |
|
|
Vested |
|
(346,550) |
|
|
4.67 |
|
|
Cancelled |
|
(5,669) |
|
|
5.14 |
|
|
Non-vested shares at end of year |
|
203,911 |
|
$ |
5.17 |
|
The following table summarizes information about the Company’s stock options outstanding at December 31, 2017:
|
|
|
|
|
Options Outstanding |
|
Options Exercisable |
|
|||||||||
|
|
|
|
|
|
|
Weighted Average |
|
|
|
|
|
|
|
|
|
|
|
|
|
|
|
Number |
|
Remaining |
|
Weighted Average |
|
Number |
|
Weighted Average |
|
|||
|
Range of Exercise Prices |
|
Outstanding |
|
Contractual Life |
|
Exercise Price |
|
Exercisable |
|
Exercise Price |
|
|||||
|
$8.00 |
to |
$12.99 |
|
79,990 |
|
3.1 |
years |
|
$ |
12.06 |
|
79,990 |
|
$ |
12.06 |
|
|
$13.00 |
to |
$14.99 |
|
371,480 |
|
4.2 |
years |
|
|
14.02 |
|
173,481 |
|
|
13.67 |
|
|
$15.00 |
to |
$19.00 |
|
6,633 |
|
4.8 |
years |
|
|
17.77 |
|
721 |
|
|
15.03 |
|
|
$8.00 |
to |
$19.00 |
|
458,103 |
|
4.0 |
years |
|
$ |
13.73 |
|
254,192 |
|
$ |
13.17 |
|
Restricted Stock Units
During the year ended December 31, 2017, the Company granted 160,137 restricted stock units to certain of the Company’s employees under the 2010 Incentive Plan. The restricted stock units granted during the year ended December 31, 2017 have a three‑year cliff-vesting period, during which the recipient must remain employed with the Company or its subsidiaries. The weighted average fair value of the restricted stock units at the date of grants made during the year ended December 31, 2017 was $35.81 per share.
The following table summarizes the activity of restricted stock units granted to certain Company employees for the years ended December 31, 2017, 2016 and 2015:
|
|
|
|
|
|
Weighted-Average |
|
|
|
|
|
|
|
Grant-Date Fair |
|
|
|
|
Number of Shares |
|
|
Value |
|
|
Non-vested shares outstanding at December 31, 2014 |
|
723,176 |
|
$ |
12.70 |
|
|
Granted |
|
408,163 |
|
|
13.57 |
|
|
Vested |
|
(215,856) |
|
|
13.06 |
|
|
Cancelled |
|
(106,184) |
|
|
13.52 |
|
|
Non-vested shares outstanding at December 31, 2015 |
|
809,299 |
|
$ |
13.13 |
|
|
Granted |
|
384,148 |
|
|
14.81 |
|
|
Vested |
|
(215,146) |
|
|
13.29 |
|
|
Cancelled |
|
(51,370) |
|
|
13.72 |
|
|
Non-vested shares outstanding at December 31, 2016 |
|
926,931 |
|
$ |
13.65 |
|
|
Granted |
|
160,137 |
|
|
35.81 |
|
|
Vested |
|
(230,903) |
|
|
12.01 |
|
|
Cancelled |
|
(40,575) |
|
|
15.78 |
|
|
Non-vested shares outstanding at December 31, 2017 |
|
815,590 |
|
$ |
18.35 |
|
Performance Stock Units
78
During the year ended December 31, 2017, the Compensation Committee granted performance share units, which are performance based restricted stock units, to certain Company employees with three-year performance-based financial metrics that the Company must meet before those awards may be earned and the performance period is measured for the three years ending December 31, 2019. The Compensation Committee will determine the achievement of performance results and corresponding vesting of performance shares for each year’s grant in 2015, 2016 and 2017. At the end of each performance period, the number of shares awarded can range from 0% to 200% of the original granted amount for performance share units granted in 2017 and can range from 0% to 150% of the original granted amount for performance shares granted in 2015 and 2016, depending on the performance against the pre-established targets.
The following table summarizes the activity of performance share units granted at target as of December 31, 2017.
|
|
|
|
|
|
Weighted-Average |
|
|
|
|
|
|
Grant-Date Fair |
|
|
|
Number of Shares |
|
|
Value |
|
Non-vested shares outstanding at December 31, 2014 |
|
— |
|
$ |
— |
|
Granted |
|
222,583 |
|
|
13.61 |
|
Vested |
|
— |
|
|
— |
|
Cancelled |
|
(19,754) |
|
|
13.51 |
|
Non-vested shares outstanding at December 31, 2015 |
|
202,829 |
|
$ |
13.62 |
|
Granted |
|
183,577 |
|
|
14.89 |
|
Vested |
|
— |
|
|
— |
|
Cancelled |
|
(22,413) |
|
|
14.16 |
|
Non-vested shares outstanding at December 31, 2016 |
|
363,993 |
|
$ |
14.23 |
|
Granted |
|
119,315 |
|
|
35.81 |
|
Vested |
|
— |
|
|
— |
|
Cancelled |
|
(14,732) |
|
|
15.00 |
|
Non-vested shares outstanding at December 31, 2017 |
|
468,576 |
|
$ |
19.70 |
During the years ended December 31, 2017, 2016 and 2015 the Company granted fully‑vested shares of common stock to the Company’s directors in the amounts of 22,617, 42,624 and 36,950 shares, respectively, with a weighted average grant‑date fair value of $35.81, $14.78, and $14.05, respectively.
During the year ended December 31, 2017, 2016 and 2015, the Company recorded equity‑based compensation expense of $10.6 million, $7.6 million and $5.4 million, respectively.
As of December 31, 2017, the Company had $10.6 million of total unrecognized compensation cost related to non‑vested stock options, non‑vested restricted stock grants and non-vested performance stock units. Total unrecognized compensation cost will be adjusted for future changes in estimated forfeitures. The Company expects to recognize this cost over a weighted average period of 1.7 years.
Taxes
The Company’s treatment of stock option grants of non‑qualified options, restricted stock units and performance shares results in the creation of a deferred tax asset, which is a temporary difference, until the time that the option is exercised or the restrictions lapse.
(10) Retirement Plans and Employee Stock Purchase Plans
SkyWest Retirement Plan
The Company sponsors the SkyWest, Inc. Employees’ Retirement Plan (the “SkyWest Plan”). Employees who have completed 90 days of service and are at least 18 years of age are eligible for participation in the SkyWest Plan. Employees may elect to make contributions to the SkyWest Plan. Generally, the Company matches 100% of such
79
contributions up to levels ranging from 2% to 7% of compensation, based on position and years of service. Additionally, a discretionary contribution may be made by the Company. The Company’s combined contributions to the SkyWest Plan were $26.1 million, $23.2 million and $20.4 million for the years ended December 31, 2017, 2016 and 2015, respectively.
ExpressJet and Atlantic Southeast Retirement Plans
ExpressJet (formerly Atlantic Southeast) sponsors the Atlantic Southeast Airlines, Inc. Investment Savings Plan (the “Atlantic Southeast Plan”). Employees who have completed 90 days of service and are 18 years of age are eligible for participation in the Atlantic Southeast Plan. Employees may elect to make contributions to the Atlantic Southeast Plan, ExpressJet will match up to 8% of each participant’s total compensation, based on years of service and other provisions included in the Atlantic Southeast Plan. Additionally, participants are 100% vested in their elective deferrals and rollover amounts and from 10% to 100% vested in company matching contributions based on length of service.
ExpressJet additionally sponsors the ExpressJet Airlines, Inc. 401(k) Savings Plan (the “ExpressJet Retirement Plan”). Substantially all of ExpressJet’s domestic employees were covered by this plan at the time the Company acquired ExpressJet in 2010. Effective January 1, 2009, the ExpressJet Retirement Plan was amended such that certain matching payment amounts have been reduced or eliminated depending on the terms of the collective bargaining unit or work group, as applicable.
ExpressJet’s contribution to the Atlantic Southeast and the ExpressJet Retirement Plans was $17.8 million, $21.0 million and $24.0 million for the years ended December 31, 2017, 2016 and 2015, respectively.
Employee Stock Purchase Plans
In May 2009, the Company’s Board of Directors approved the SkyWest, Inc. 2009 Employee Stock Purchase Plan (the “2009 Stock Purchase Plan”). All employees who have completed 90 days of employment with the Company or one of its subsidiaries are eligible to participate in the 2009 Stock Purchase Plan, except employees who own five percent or more of the Company’s common stock. The 2009 Stock Purchase Plan enables employees to purchase shares of the Company’s common stock at a five percent discount, through payroll deductions. Employees can contribute up to 15% of their base pay, not to exceed $25,000 each calendar year, for the purchase of shares. Shares are purchased semi-annually at a five percent discount based on the end of the period price. Employees can terminate their participation in the 2009 Stock Purchase Plan at any time upon written notice.
The following table summarizes purchases made under the 2009 Employee Stock Purchase Plans during the years ended December 31, 2017, 2016 and 2015:
|
|
|
Year ended December 31, |
|
|||||||
|
|
|
2017 |
|
2016 |
|
2015 |
|
|||
|
Number of shares purchased |
|
|
88,362 |
|
|
151,531 |
|
|
254,098 |
|
|
Average price of shares purchased |
|
$ |
33.96 |
|
$ |
20.87 |
|
$ |
13.50 |
|
The 2009 Stock Purchase Plan is a non‑compensatory plan under the accounting guidance. Therefore, no compensation expense was recorded for the years ended December 31, 2017, 2016 and 2015.
(11) Stock Repurchase
The Company’s Board of Directors has adopted a stock repurchase program which authorizes the Company to repurchase shares of the Company’s common stock in the public market or in private transactions, from time to time, at prevailing prices. The Company’s stock repurchase program authorizes the repurchase of up to $100.0 million of the Company’s common stock, over a three year period commencing on February 9, 2017, of which $80.0 million remained available at December 31, 2017.
80
During the years ended December 31, 2017 and 2015, the Company repurchased 0.5 million and 1.3 million shares of common stock for approximately $20.0 million and $18.7 million, respectively at a weighted average price per share of $41.36 and $14.98, respectively. The Company did not repurchase any shares of its common stock during the year ended December 31, 2016. Additionally, during the year ended December 31, 2017, the Company paid $5.1 million for a net settlement of the income tax obligation on employee equity awards.
(12) Related‑Party Transactions
During the year ended December 31, 2017, the Company purchased $198,000 of spare aircraft parts from an entity affiliated with a director of the Company.
(13) Quarterly Financial Data (Unaudited)
Unaudited summarized financial data by quarter for 2017 and 2016 is as follows (in thousands, except per share data):
|
|
|
Year ended December 31, 2017 |
|
|||||||||||||||
|
|
|
First |
|
Second |
|
Third |
|
Fourth |
|
|
|
|
||||||
|
|
|
Quarter |
|
Quarter |
|
Quarter |
|
Quarter |
|
Year |
|
|||||||
|
Operating revenues |
|
$ |
765,415 |
|
$ |
809,759 |
|
$ |
831,936 |
|
$ |
797,158 |
|
$ |
3,204,268 |
|
||
|
Operating income |
|
|
76,295 |
|
|
106,596 |
|
|
112,369 |
|
|
92,939 |
|
|
388,199 |
|
||
|
Net income(1) |
|
|
34,786 |
|
|
50,477 |
|
|
53,716 |
|
|
289,928 |
|
|
428,907 |
|
||
|
Net income per common share: |
|
|
|
|
|
|
|
|
|
|
|
|
|
|
|
|
||
|
Basic |
|
|
0.67 |
|
|
0.98 |
|
|
1.04 |
|
|
5.60 |
|
|
8.28 |
|
||
|
Diluted |
|
|
0.65 |
|
|
0.95 |
|
|
1.01 |
|
|
5.46 |
|
|
8.08 |
|
||
|
Weighted average common shares: |
|
|
|
|
|
|
|
|
|
|
|
|
|
|
|
|
||
|
Basic: |
|
|
51,820 |
|
|
51,751 |
|
|
51,833 |
|
|
51,811 |
|
|
51,804 |
|
||
|
Diluted: |
|
|
53,202 |
|
|
52,977 |
|
|
53,080 |
|
|
53,140 |
|
|
53,100 |
|
||
|
|
|
Year ended December 31, 2016 |
|
|||||||||||||
|
|
|
First |
|
Second |
|
Third |
|
Fourth |
|
|
|
|
||||
|
|
|
Quarter |
|
Quarter |
|
Quarter |
|
Quarter |
|
Year |
|
|||||
|
Operating revenues |
|
$ |
762,075 |
|
$ |
801,338 |
|
$ |
799,776 |
|
$ |
758,017 |
|
$ |
3,121,206 |
|
|
Operating income (loss) |
|
|
61,809 |
|
|
84,137 |
|
|
85,834 |
|
|
(404,464) |
|
|
(172,684) |
|
|
Net income (loss)(2) |
|
|
27,092 |
|
|
40,244 |
|
|
41,322 |
|
|
(270,244) |
|
|
(161,586) |
|
|
Net income (loss) per common share: |
|
|
|
|
|
|
|
|
|
|
|
|
|
|
|
|
|
Basic |
|
|
0.53 |
|
|
0.78 |
|
|
0.80 |
|
|
(5.22) |
|
|
(3.14) |
|
|
Diluted |
|
|
0.52 |
|
|
0.77 |
|
|
0.79 |
|
|
(5.22) |
|
|
(3.14) |
|
|
Weighted average common shares: |
|
|
|
|
|
|
|
|
|
|
|
|
|
|
|
|
|
Basic: |
|
|
51,218 |
|
|
51,418 |
|
|
51,627 |
|
|
51,757 |
|
|
51,505 |
|
|
Diluted: |
|
|
52,014 |
|
|
52,194 |
|
|
52,471 |
|
|
51,757 |
|
|
51,505 |
|
|
(1) |
Net income for 2017 included a $246.8 million benefit related to the revaluation of the Company’s deferred tax liability and other tax liabilities in accordance with the Tax Act. |
|
(2) |
Operating loss for the fourth quarter of 2016 included a special charge of $465.6 million related to an impairment on the Company’s 50-seat aircraft. |
81
ITEM 9. CHANGES IN AND DISAGREEMENTS WITH ACCOUNTANTS ON ACCOUNTING AND FINANCIAL DISCLOSURE
None.
ITEM 9A. CONTROLS AND PROCEDURES
Disclosure Controls and Procedures
Our management, including our Chief Executive Officer and Chief Financial Officer, performed an evaluation of our disclosure controls and procedures, which have been designed to ensure that information we are required to disclose in the reports we file or submit under the Exchange Act is recorded, processed, summarized and reported accurately and within the time periods specified in the SEC rules and forms. Our management, including our Chief Executive Officer and Chief Financial Officer, concluded that, as of December 31, 2017, those controls and procedures were effective to ensure that information we are required to disclose in the reports we file or submit under the Exchange Act is accumulated and communicated to our management, including our Chief Executive Officer and Chief Financial Officer, as appropriate to allow timely decisions regarding required disclosure.
Changes in Internal Control
During the most recently completed fiscal quarter, we did not make any changes in our internal control over financial reporting that have materially affected, or are reasonably likely to materially affect, our internal control over financial reporting.
Management’s Annual Report on Internal Control Over Financial Reporting
Management is responsible for establishing and maintaining adequate internal control over financial reporting, as such term is defined in Rules 13a‑15(f) and 15d‑15(f) under the Exchange Act. Our internal control over financial reporting is designed to provide reasonable assurance regarding the reliability of financial reporting and the preparation of financial statements for external purposes in accordance with accounting principles generally accepted in the United States.
Because of its inherent limitations, internal control over financial reporting may not prevent or detect misstatements. Projections of any evaluation of effectiveness to future periods are subject to the risk that controls may become inadequate because of changes in conditions, or that the degree of compliance with the policies may deteriorate.
Management conducted an evaluation of the effectiveness of our internal control over financial reporting as of December 31, 2017 using the criteria issued by the Committee of Sponsoring Organizations of the Treadway Commission (COSO) in Internal Control—Integrated Framework (2013). Based on that evaluation, management believes that our internal control over financial reporting was effective as of December 31, 2017.
The effectiveness of our internal control over financial reporting as of December 31, 2017, has been audited by Ernst & Young LLP (“Ernst & Young”), the independent registered public accounting firm who also has audited our Consolidated Financial Statements included in this Report. Ernst & Young’s report on our internal control over financial reporting appears on the following page.
82
Report of Independent Registered Public Accounting Firm
To the Stockholders and the Board of Directors of SkyWest, Inc.
Opinion on Internal Control over Financial Reporting
We have audited SkyWest, Inc. and subsidiaries’ internal control over financial reporting as of December 31, 2017, based on criteria established in Internal Control—Integrated Framework issued by the Committee of Sponsoring Organizations of the Treadway Commission (2013 framework) (the COSO criteria). In our opinion, SkyWest, Inc. and subsidiaries (the Company) maintained, in all material respects, effective internal control over financial reporting as of December 31, 2017, based on the COSO criteria.
We also have audited, in accordance with the standards of the Public Company Accounting Oversight Board (United States) (PCAOB), the consolidated balance sheets of SkyWest, Inc. and subsidiaries as of December 31, 2017 and 2016, and the related consolidated statements of comprehensive income (loss), stockholders’ equity and cash flows for each of the three years in the period ended December 31, 2017, and the related notes and financial statement schedule listed in the Index at Item 15(a)2 and our report dated February 26, 2018 expressed an unqualified opinion thereon.
Basis for Opinion
The Company’s management is responsible for maintaining effective internal control over financial reporting and for its assessment of the effectiveness of internal control over financial reporting included in the accompanying Management’s Annual Report on Internal Control Over Financial Reporting. Our responsibility is to express an opinion on the Company’s internal control over financial reporting based on our audit. We are a public accounting firm registered with the PCAOB and are required to be independent with respect to the Company in accordance with the U.S. federal securities laws and the applicable rules and regulations of the Securities and Exchange Commission and the PCAOB.
We conducted our audit in accordance with the standards of the PCAOB. Those standards require that we plan and perform the audit to obtain reasonable assurance about whether effective internal control over financial reporting was maintained in all material respects.
Our audit included obtaining an understanding of internal control over financial reporting, assessing the risk that a material weakness exists, testing and evaluating the design and operating effectiveness of internal control based on the assessed risk, and performing such other procedures as we considered necessary in the circumstances. We believe that our audit provides a reasonable basis for our opinion.
Definition and Limitations of Internal Control over Financial Reporting
A company’s internal control over financial reporting is a process designed to provide reasonable assurance regarding the reliability of financial reporting and the preparation of financial statements for external purposes in accordance with generally accepted accounting principles. A company’s internal control over financial reporting includes those policies and procedures that (1) pertain to the maintenance of records that, in reasonable detail, accurately and fairly reflect the transactions and dispositions of the assets of the company; (2) provide reasonable assurance that transactions are recorded as necessary to permit preparation of financial statements in accordance with generally accepted accounting principles, and that receipts and expenditures of the company are being made only in accordance with authorizations of management and directors of the company; and (3) provide reasonable assurance regarding prevention or timely detection of unauthorized acquisition, use, or disposition of the company’s assets that could have a material effect on the financial statements.
Because of its inherent limitations, internal control over financial reporting may not prevent or detect misstatements. Also, projections of any evaluation of effectiveness to future periods are subject to the risk that controls may become inadequate because of changes in conditions, or that the degree of compliance with the policies or procedures may deteriorate.
/s/ Ernst & Young LLP
Salt Lake City, Utah
February 26, 2018
83
None.
PART III
Items 10, 11, 12, 13 and 14 in Part III of this Report are incorporated herein by reference to our definitive proxy statement for our 2018 Annual Meeting of Shareholders scheduled for May 8, 2018. We intend to file our definitive proxy statement with the SEC not later than 120 days after December 31, 2017, pursuant to Regulation 14A of the Exchange Act.
|
|
|
Headings in Proxy Statement |
|
DIRECTORS, EXECUTIVE OFFICERS AND CORPORATE GOVERNANCE |
“Election of Directors,” “Executive Officers,” “Corporate Governance,” “Meetings and Committees of the Board” and “Section 16(a) Beneficial Ownership Reporting Compliance” |
|
|
EXECUTIVE COMPENSATION |
“Corporate Governance,” “Meetings and Committees of the Board,” “Compensation Discussion and Analysis,” “Compensation Committee Report,” “Executive Compensation,” “Director Compensation” and “Director Summary Compensation Table” |
|
|
SECURITY OWNERSHIP OF CERTAIN BENEFICIAL OWNERS AND MANAGEMENT AND RELATED STOCKHOLDER MATTERS |
“Security Ownership of Certain Beneficial Owners” “Securities Authorized for Issuance Under Equity Compensation Plans” |
|
|
CERTAIN RELATIONSHIPS AND RELATED TRANSACTIONS |
“Certain Relationships and Related Transactions” |
|
|
PRINCIPAL ACCOUNTANT FEES AND SERVICES |
“Audit and Finance Committee Disclosure” and “Fees Paid to Independent Registered Public Accounting Firm” |
PART IV
ITEM 15. EXHIBITS AND FINANCIAL STATEMENT SCHEDULES
(a)Documents Filed:
1.Financial Statements: Reports of Independent Auditors, Consolidated Balance Sheets as of December 31, 2017 and 2016, Consolidated Statements of Comprehensive Income (Loss) for the years ended December 31, 2017, 2016 and 2015, Consolidated Statements of Cash Flows for the years ended December 31, 2017, 2016 and 2015, Consolidated Statements of Stockholders’ Equity for the years ended December 31, 2017, 2016, 2015 and 2014 and Notes to Consolidated Financial Statements.
2.Financial Statement Schedule. The following consolidated financial statement schedule of our company is included in this Item 15.
•Schedule II—Valuation and qualifying accounts
All other schedules for which provision is made in the applicable accounting regulations of the Securities and Exchange Commission are not required under the related instructions or are not applicable, and therefore have been omitted.
84
(b)Exhibits
85
|
Number |
Exhibit |
Incorporated |
| 31.1 |
Filed herewith |
|
| 31.2 |
Filed herewith |
|
| 32.1 |
Filed herewith |
|
| 32.2 |
Filed herewith |
|
|
101.INS** |
XBRL Instance Document |
|
|
101.SCH** |
XBRL Taxonomy Extension Schema Document |
|
|
101.CAL** |
XBRL Taxonomy Extension Calculation Linkbase Document |
|
|
101.LAB** |
XBRL Taxonomy Extension Label Linkbase Document |
|
|
101.PRE** |
XBRL Taxonomy Extension Presentation Linkbase Document |
|
|
101.DEF** |
XBRL Taxonomy Extension Definition Linkbase Document |
|
*Certain portions of this exhibit have been omitted pursuant to Rule 24b‑2 and are subject to a confidential treatment request.
**Attached as Exhibit 101 to this report are the following documents formatted in XBRL (Extensible Business Reporting Language): (i) the Consolidated Statement of Comprehensive Income (Loss) for the years ended December 31, 2017, December 31, 2016 and December 31, 2015, (ii) the Consolidated Balance Sheet at December 31, 2017 and December 31, 2016, and (iii) the Consolidated Statement of Cash Flows for the years ended December 31, 2017, December 31, 2016 and December 31, 2015
(1)Incorporated by reference to the exhibits to a Registration Statement on Form S ‑3 (File No. 333‑129831) filed on November 18, 2005
(2)Incorporated by reference to a Registration Statement on Form S‑ 3 (File No. 333‑42508) filed on July 28, 2000
(3)Incorporated by reference to Registrant’s Current Report on Form 8‑K filed on September 13, 2005, as amended by Amendment No. 2 on Form 8‑K/A filed on February 21, 2006
(4)Incorporated by reference to exhibits to Registrant’s Quarterly Report on Form 10‑Q filed on November 14, 2003
(5)Incorporated by reference to the exhibits to Registrant’s Quarterly Report on Form 10‑Q filed for the quarter ended December 31, 1986
(6)Incorporated by reference to the exhibits to Registrant’s Quarterly Report on Form 10‑Q filed on February 13, 2001
(7)Incorporated by reference to the exhibits to Registrant’s Annual Report on Form 10‑K filed on February 23, 2009
(8)Incorporated by reference to Appendix A to Registrant's Definitive Proxy Statement on Schedule 14A (File No. 000-14719) filed on March 12, 2010
(9)Incorporated by reference to the exhibits to Registrant’s Current Report on Form 8‑K filed on November 18, 2010
(10)Incorporated by reference to the exhibits to Registrant’s Current Report on Form 8‑K filed on December 13, 2012, as amended by Amendment No. 1 to Current Report on Form 8‑K/A filed on June 25, 2013
(11)Incorporated by reference to the exhibits to Registrant’s Annual Report on Form 10‑K filed on February 24, 2012
86
(12)Incorporated by reference to the exhibits to Registrant’s Quarterly Report on Form 10-Q filed on August 7, 2013, as amended by Amendment No. 1 to Quarterly Report on Form 10-Q/A filed on November 4, 2013
(13)Incorporated by reference to the exhibits to Registrant’s Annual Report on Form 10‑K filed on February 14, 2014
(14)Incorporated by reference to the exhibits to Registrant’s Annual Report on Form 10‑K filed on February 18, 2015
(15)Incorporated by reference to the exhibits to Registrant’s Annual Report on Form 10‑K filed on February 26, 2016
(16)Incorporated by reference to the exhibits to Registrant’s Annual Report on Form 10‑K filed on February 27, 2017
87
SKYWEST, INC. AND SUBSIDIARIES
SCHEDULE II—VALUATION AND QUALIFYING ACCOUNTS
For the Years Ended December 31, 2017, 2016 and 2015
(Dollars in thousands)
|
|
|
|
|
|
Additions |
|
|
|
|
|
|
|
|
|
|
Balance at |
|
Charged to |
|
|
|
|
|
|
||
|
|
|
Beginning |
|
Costs and |
|
|
|
Balance at |
|
|||
|
Description |
|
of Year |
|
Expenses |
|
Deductions |
|
End of Year |
|
|||
|
Year ended December 31, 2017: |
|
|
|
|
|
|
|
|
|
|
|
|
|
Allowance for inventory obsolescence(1) |
|
$ |
40,497 |
|
|
— |
|
(23,399) |
|
$ |
17,098 |
|
|
Allowance for doubtful accounts receivable |
|
|
173 |
|
|
— |
|
(16) |
|
|
157 |
|
|
|
|
$ |
40,670 |
|
|
— |
|
(23,415) |
|
$ |
17,255 |
|
|
Year ended December 31, 2016: |
|
|
|
|
|
|
|
|
|
|
|
|
|
Allowance for inventory obsolescence(2) |
|
$ |
13,933 |
|
|
26,564 |
|
— |
|
$ |
40,497 |
|
|
Allowance for doubtful accounts receivable |
|
|
187 |
|
|
— |
|
(14) |
|
|
173 |
|
|
|
|
$ |
14,120 |
|
|
26,564 |
|
(14) |
|
$ |
40,670 |
|
|
Year ended December 31, 2015: |
|
|
|
|
|
|
|
|
|
|
|
|
|
Allowance for inventory obsolescence |
|
$ |
11,588 |
|
|
2,345 |
|
— |
|
$ |
13,933 |
|
|
Allowance for doubtful accounts receivable |
|
|
326 |
|
|
— |
|
(139) |
|
|
187 |
|
|
|
|
$ |
11,914 |
|
|
2,345 |
|
(139) |
|
$ |
14,120 |
|
|
(1) |
The deductions in 2017 related to the disposal of excess and obsolete inventory in 2017. |
|
(2) |
The increase in the inventory obsolescence related to additional excess inventory identified as part of the impairment analysis of the 50-seat aircraft. See note 8, Special items, for additional detail on the impairment. |
88
Pursuant to the requirements of Section 13 or 15 (d) of the Securities Act of 1934, as amended, the Registrant has duly caused this Annual Report on Form 10‑K for the year ended December 31, 2017, to be signed on its behalf by the undersigned, thereunto duly authorized, on February 26, 2018.
|
|
SkyWest, Inc. |
|
|
|
|
|
|
|
By: |
/s/ ROBERT J. SIMMONS
Robert J. Simmons |
89
ADDITIONAL SIGNATURES
Pursuant to the requirement of the Securities Act of 1934, as amended, this Annual Report on Form 10‑K has been signed below by the following persons in the capacities and on the dates indicated.
|
|
Name |
|
|
|
Capacities |
|
|
|
Date |
|
|
|
|
|
||||||||
|
/s/ Jerry C. Atkin Jerry C. Atkin
|
Chairman of the Board
|
February 26, 2018 |
||||||||
|
/s/ Russell A. Childs Russell A. Childs
|
Chief Executive Officer and President (Principal Executive Officer) and Director |
February 26, 2018 |
||||||||
|
/s/ Robert J. Simmons Robert J. Simmons |
Chief Financial Officer (Principal Financial Officer) |
February 26, 2018 |
||||||||
|
|
|
|
||||||||
|
/s/ Eric J. Woodward Eric J. Woodward |
Chief Accounting Officer (Principal Accounting Officer) |
February 26, 2018 |
||||||||
|
|
|
|
||||||||
|
/s/ Steven F. Udvar‑Hazy Steven F. Udvar‑Hazy |
Lead Director |
February 26, 2018 |
||||||||
|
|
|
|
||||||||
|
/s/ W. Steve Albrecht Steve Albrecht |
Director |
February 26, 2018 |
||||||||
|
|
|
|
||||||||
|
/s/ Henry J. Eyring Henry J. Eyring |
Director |
February 26, 2018 |
||||||||
|
|
|
|
||||||||
|
/s/ Meredith S. Madden Meredith S. Madden |
Director |
February 26, 2018 |
||||||||
|
|
|
|
||||||||
|
/s/ Ronald J. Mittelstaedt Ronald J. Mittelstaedt |
Director |
February 26, 2018 |
||||||||
|
|
|
|
||||||||
|
/s/ Andrew C. Roberts Andrew C. Roberts |
Director |
February 26, 2018 |
||||||||
|
|
|
|
||||||||
|
/s/ Keith E. Smith Keith E. Smith |
Director |
February 26, 2018 |
||||||||
|
|
|
|
||||||||
|
/s/ James L. Welch James L. Welch |
Director |
February 26, 2018 |
||||||||
90