Attached files
| file | filename |
|---|---|
| EX-99.1 - EX-99.1 - NUVASIVE INC | nuva-ex991_6.htm |
| 8-K - 8-K - NUVASIVE INC | nuva-8k_20180226.htm |

Q4/Full-Year 2017 Results Supplemental Presentation to Earnings Press Release February 26, 2018 Exhibit 99.2
Forward-Looking Statements NuVasive, Inc. (“NuVasive,” “NUVA” or the “Company”) cautions you that statements included in this presentation that are not a description of historical facts are forward-looking statements that involve risks, uncertainties, assumptions and other factors which, if they do not materialize or prove correct, could cause the Company's results to differ materially from historical results or those expressed or implied by such forward-looking statements. In addition, this presentation contains selected financial results from the fourth quarter and year-end 2017, as well as projections for 2018 finance guidance and longer-term financial and business goals. The Company’s projections for 2018 financial guidance and longer-term financial performance goals represent current estimates, including initial estimates of the potential benefits, synergies and cost savings associated with acquisitions, which are subject to the risk of being inaccurate because of the preliminary nature of the forecasts, the risk of further adjustment, or unanticipated difficulty in selling products or generating expected profitability. The potential risks and uncertainties that could cause actual growth and results to differ materially include, but are not limited to: the risk that NuVasive’s financial guidance and expectations may turn out to be inaccurate because of the preliminary nature of the Company’s forecasts and projections; the risk of further adjustment to financial results or future financial expectations; unanticipated difficulty in selling products, generating revenue or producing expected growth and profitability; the risk that acquisitions will not be integrated successfully or that the benefits and synergies from the acquisition may not be fully realized or may take longer to realize than expected; the loss of key employees; unexpected variations in market growth and demand for the company’s products and technologies; and those other risks and uncertainties more fully described in the Company’s news releases and periodic filings with the Securities and Exchange Commission. NuVasive’s public filings with the Securities and Exchange Commission are available at www.sec.gov. The forward-looking statements contained herein are based on the current expectations and assumptions of NuVasive and not on historical facts. NuVasive assumes no obligation to update any forward-looking statement to reflect events or circumstances arising after the date on which it was made.
Non-GAAP Financial Measures Management uses certain non-GAAP financial measures such as non-GAAP earnings per share, non-GAAP net income, non-GAAP operating expenses and non-GAAP operating profit margin, which exclude amortization of intangible assets, leasehold related charges, integration related expenses associated with acquired businesses, one-time restructuring and acquisition related items, CEO transition related costs, certain litigation charges and non-cash interest expense (excluding debt issuance cost) and or losses on convertible notes. Management also uses certain non-GAAP measures which are intended to exclude the impact of foreign exchange currency fluctuations. The measure constant currency is the use of an exchange rate that eliminates fluctuations when calculating financial performance numbers. The Company also uses measures such as free cash flow, which represents cash flow from operations less cash used in the acquisition and disposition of capital. Additionally, the Company uses an adjusted EBITDA measure which represents earnings before interest, taxes, depreciation and amortization and excludes the impact of stock-based compensation, leasehold related charges, integration related expenses associated with acquired businesses, CEO transition related costs, certain litigation liabilities, acquisition related items and other significant one-time items. Management calculates the non-GAAP financial measures provided in this earnings release excluding these costs and uses these non-GAAP financial measures to enable it to further and more consistently analyze the period-to-period financial performance of its core business operations. Management believes that providing investors with these non-GAAP measures gives them additional information to enable them to assess, in the same way management assesses, the Company’s current and future continuing operations. These non-GAAP measures are not in accordance with, or an alternative for, GAAP, and may be different from non-GAAP measures used by other companies. Set forth below are reconciliations of the non-GAAP financial measures to the comparable GAAP financial measure. For reconciliations of non-GAAP financial measures to the comparable GAAP financial measure, please refer to the supplemental financial information posted on the Investor Relations section of the Company’s corporate website at www.nuvasive.com.
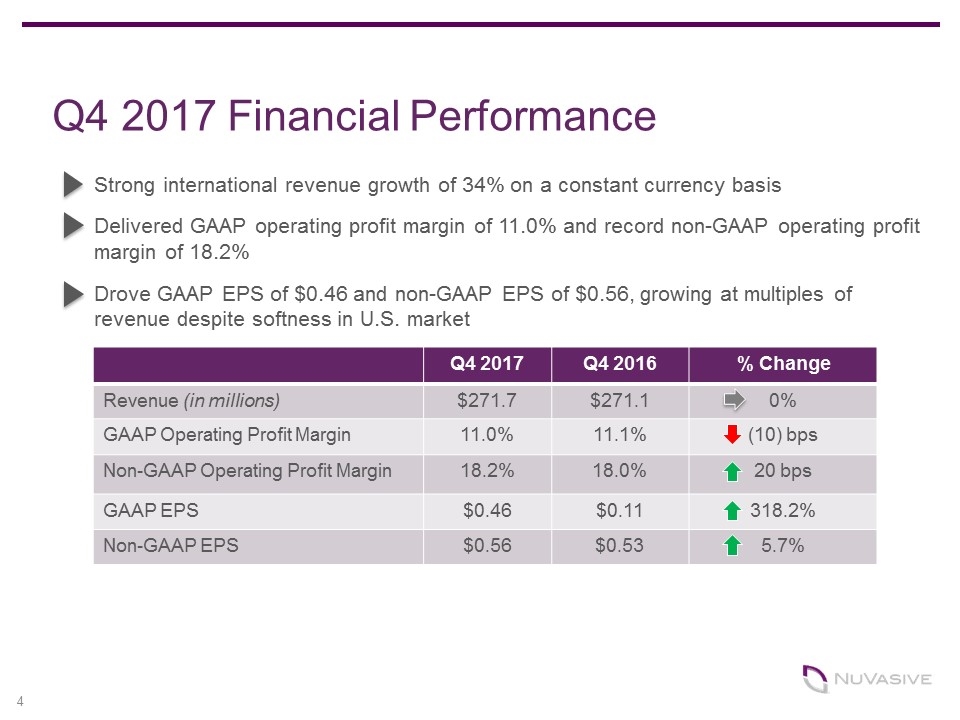
Q4 2017 Financial Performance Strong international revenue growth of 34% on a constant currency basis Delivered GAAP operating profit margin of 11.0% and record non-GAAP operating profit margin of 18.2% Drove GAAP EPS of $0.46 and non-GAAP EPS of $0.56, growing at multiples of revenue despite softness in U.S. market Q4 2017 Q4 2016 % Change Revenue (in millions) $271.7 $271.1 0% GAAP Operating Profit Margin 11.0% 11.1% (10) bps Non-GAAP Operating Profit Margin 18.2% 18.0% 20 bps GAAP EPS $0.46 $0.11 318.2% Non-GAAP EPS $0.56 $0.53 5.7%
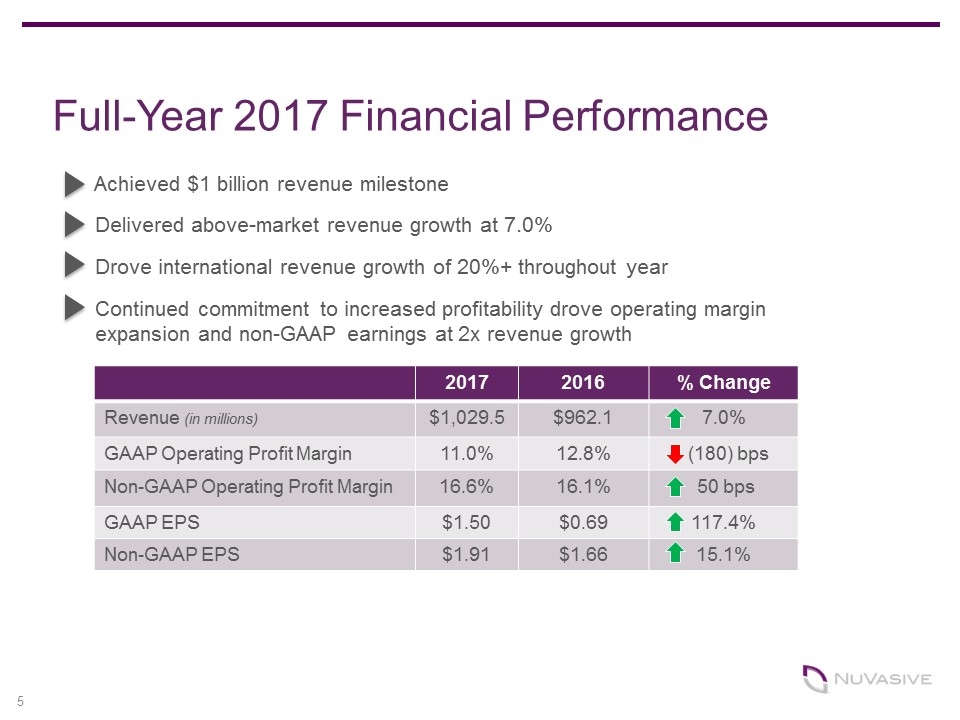
Full-Year 2017 Financial Performance Achieved $1 billion revenue milestone Delivered above-market revenue growth at 7.0% Drove international revenue growth of 20%+ throughout year Continued commitment to increased profitability drove operating margin expansion and non-GAAP earnings at 2x revenue growth 2017 2016 % Change Revenue (in millions) $1,029.5 $962.1 7.0% GAAP Operating Profit Margin 11.0% 12.8% (180) bps Non-GAAP Operating Profit Margin 16.6% 16.1% 50 bps GAAP EPS $1.50 $0.69 117.4% Non-GAAP EPS $1.91 $1.66 15.1%
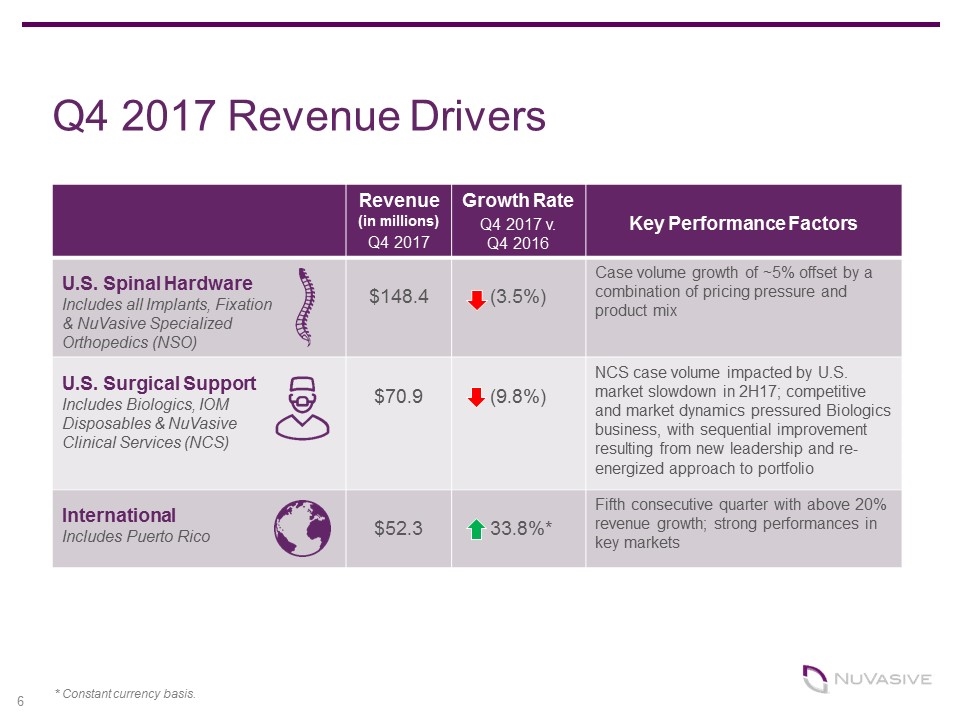
Q4 2017 Revenue Drivers Revenue (in millions) Q4 2017 Growth Rate Q4 2017 v. Q4 2016 Key Performance Factors U.S. Spinal Hardware Includes all Implants, Fixation & NuVasive Specialized Orthopedics (NSO) $148.4 (3.5%) Case volume growth of ~5% offset by a combination of pricing pressure and product mix U.S. Surgical Support Includes Biologics, IOM Disposables & NuVasive Clinical Services (NCS) $70.9 (9.8%) NCS case volume impacted by U.S. market slowdown in 2H17; competitive and market dynamics pressured Biologics business, with sequential improvement resulting from new leadership and re-energized approach to portfolio International Includes Puerto Rico $52.3 33.8%* Fifth consecutive quarter with above 20% revenue growth; strong performances in key markets * Constant currency basis.
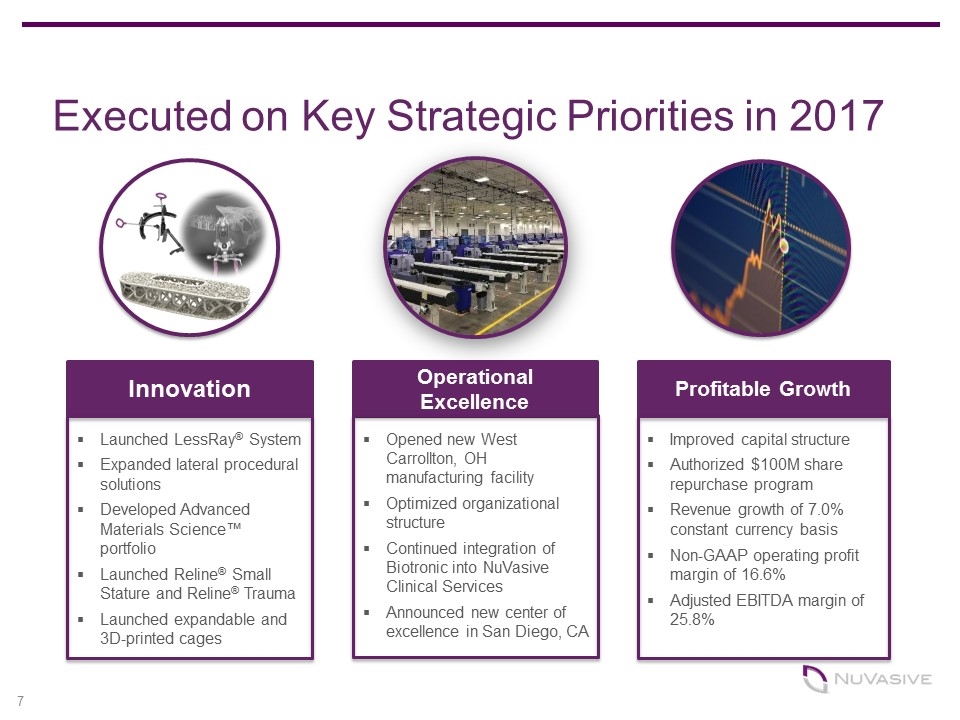
Executed on Key Strategic Priorities in 2017 Launched LessRay® System Expanded lateral procedural solutions Developed Advanced Materials Science™ portfolio Launched Reline® Small Stature and Reline® Trauma Launched expandable and 3D-printed cages Improved capital structure Authorized $100M share repurchase program Revenue growth of 7.0% constant currency basis Non-GAAP operating profit margin of 16.6% Adjusted EBITDA margin of 25.8% Opened new West Carrollton, OH manufacturing facility Optimized organizational structure Continued integration of Biotronic into NuVasive Clinical Services Announced new center of excellence in San Diego, CA Innovation Operational Excellence Profitable Growth
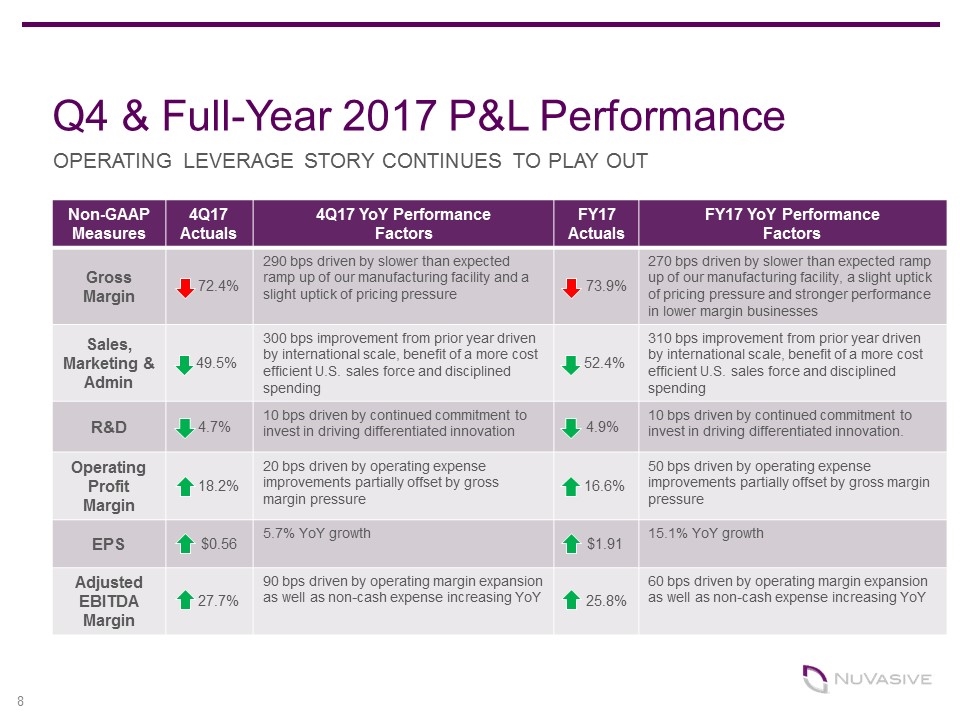
Q4 & Full-Year 2017 P&L Performance Non-GAAP Measures 4Q17 Actuals 4Q17 YoY Performance Factors FY17 Actuals FY17 YoY Performance Factors Gross Margin 72.4% 290 bps driven by slower than expected ramp up of our manufacturing facility and a slight uptick of pricing pressure 73.9% 270 bps driven by slower than expected ramp up of our manufacturing facility, a slight uptick of pricing pressure and stronger performance in lower margin businesses Sales, Marketing & Admin 49.5% 300 bps improvement from prior year driven by international scale, benefit of a more cost efficient U.S. sales force and disciplined spending 52.4% 310 bps improvement from prior year driven by international scale, benefit of a more cost efficient U.S. sales force and disciplined spending R&D 4.7% 10 bps driven by continued commitment to invest in driving differentiated innovation 4.9% 10 bps driven by continued commitment to invest in driving differentiated innovation. Operating Profit Margin 18.2% 20 bps driven by operating expense improvements partially offset by gross margin pressure 16.6% 50 bps driven by operating expense improvements partially offset by gross margin pressure EPS $0.56 5.7% YoY growth $1.91 15.1% YoY growth Adjusted EBITDA Margin 27.7% 90 bps driven by operating margin expansion as well as non-cash expense increasing YoY 25.8% 60 bps driven by operating margin expansion as well as non-cash expense increasing YoY Non-GAAP Measures OPERATING LEVERAGE STORY CONTINUES TO PLAY OUT
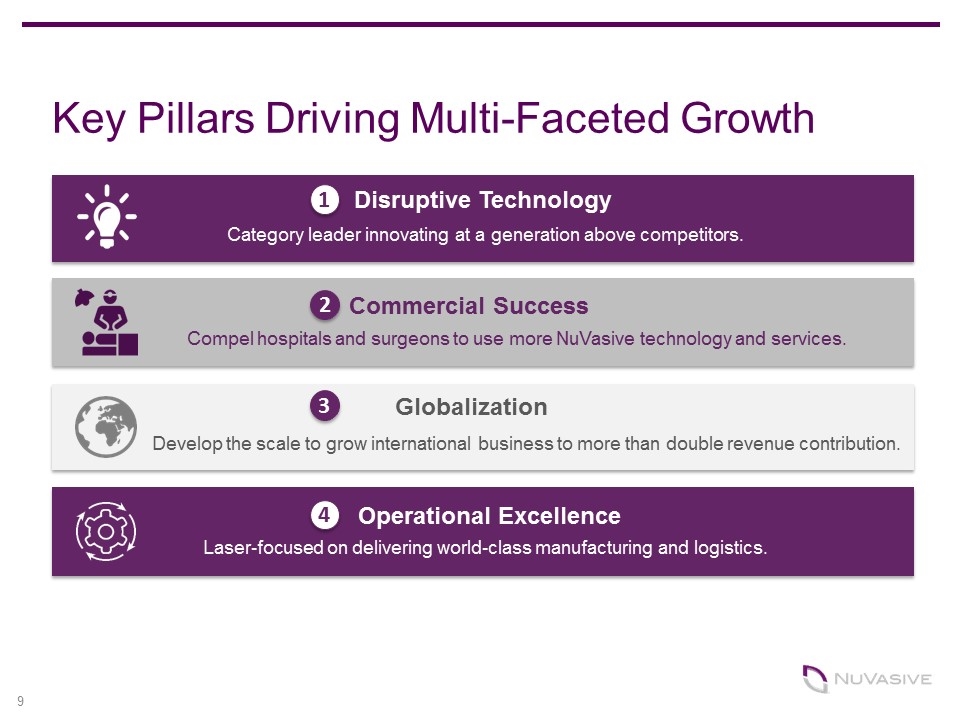
Key Pillars Driving Multi-Faceted Growth Disruptive Technology Commercial Success Globalization Develop the scale to grow international business to more than double revenue contribution. Compel hospitals and surgeons to use more NuVasive technology and services. Category leader innovating at a generation above competitors. Operational Excellence Laser-focused on delivering world-class manufacturing and logistics. 1 2 4 3 9
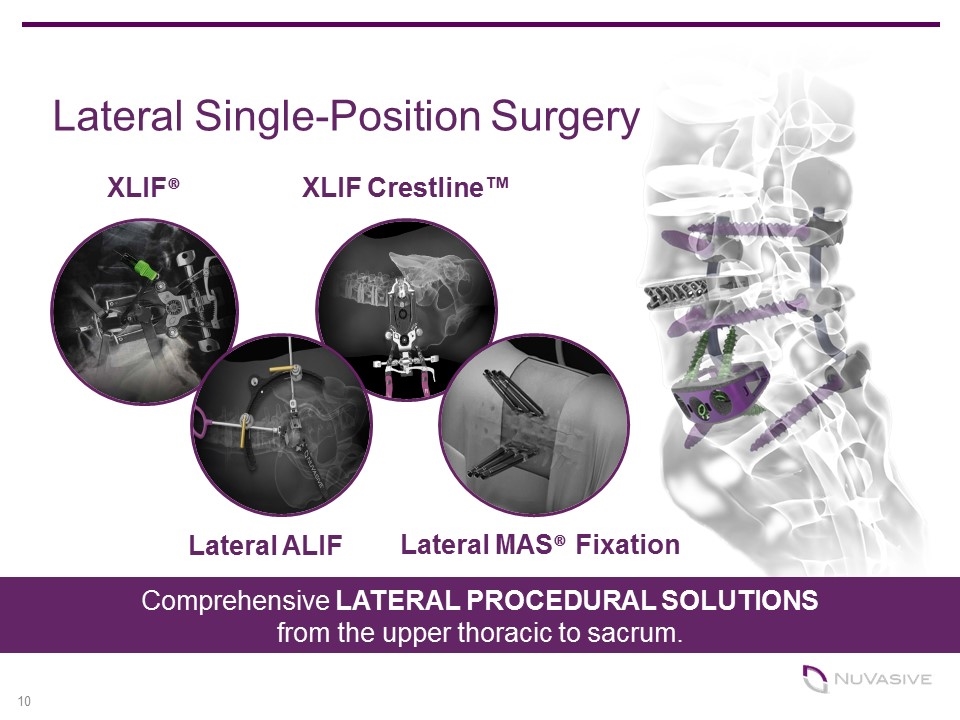
Lateral Single-Position Surgery Lateral ALIF XLIF Crestline™ Lateral MAS® Fixation Comprehensive LATERAL PROCEDURAL SOLUTIONS from the upper thoracic to sacrum. XLIF®
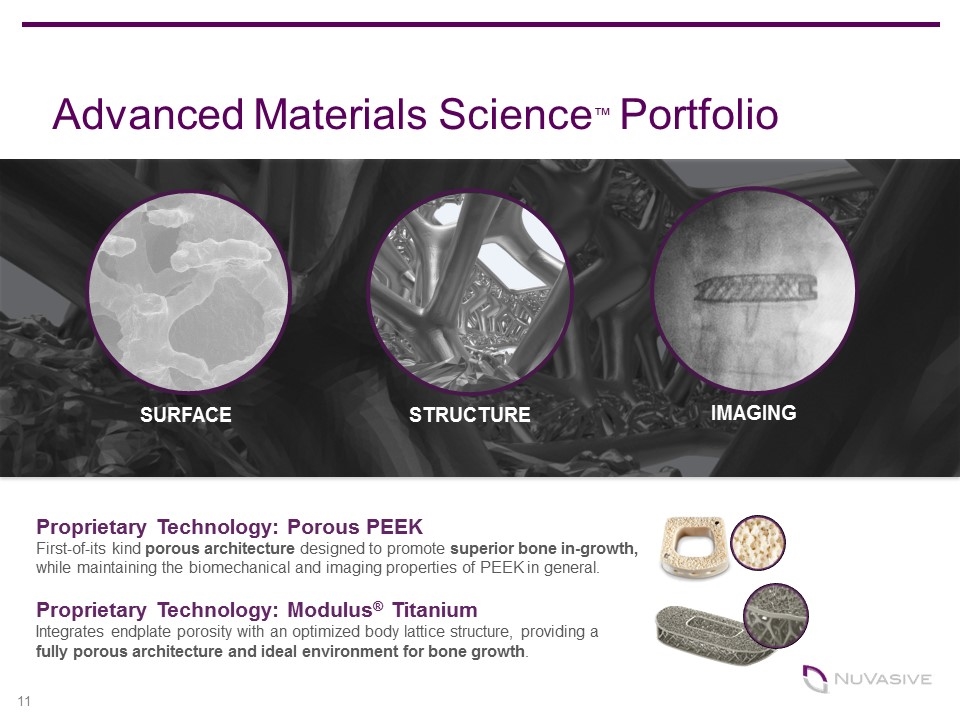
Proprietary Technology: Porous PEEK First-of-its kind porous architecture designed to promote superior bone in-growth, while maintaining the biomechanical and imaging properties of PEEK in general. Proprietary Technology: Modulus® Titanium Integrates endplate porosity with an optimized body lattice structure, providing a fully porous architecture and ideal environment for bone growth. Advanced Materials Science™ Portfolio SURFACE IMAGING STRUCTURE 11
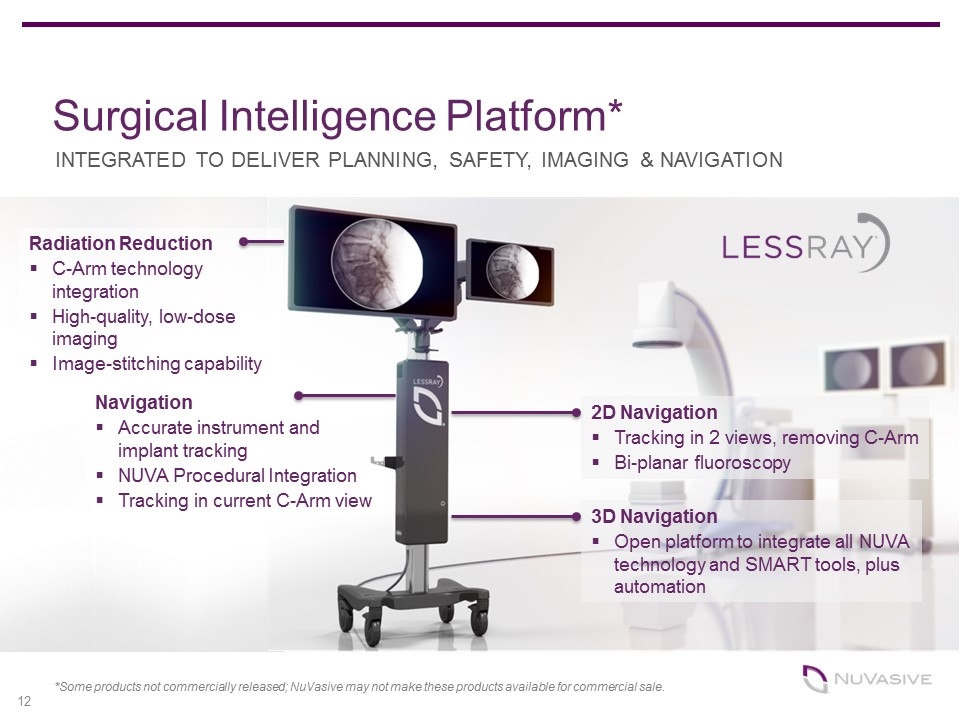
Surgical Intelligence Platform* INTEGRATED TO DELIVER PLANNING, SAFETY, IMAGING & NAVIGATION Radiation Reduction C-Arm technology integration High-quality, low-dose imaging Image-stitching capability Navigation Accurate instrument and implant tracking NUVA Procedural Integration Tracking in current C-Arm view 2D Navigation Tracking in 2 views, removing C-Arm Bi-planar fluoroscopy 3D Navigation Open platform to integrate all NUVA technology and SMART tools, plus automation *Some products not commercially released; NuVasive may not make these products available for commercial sale.
Serving ~100,000 U.S. cases annually – a national footprint 435+ Neurophysiologists and 35+ Physicians on staff Enhanced Surgical Monitoring & Remote Services A comprehensive spine solution Committed to Achieving Leadership in IONM Quality, Service and Technology #1 Service Leader for Intraoperative Monitoring NuVasive Clinical Services + 13
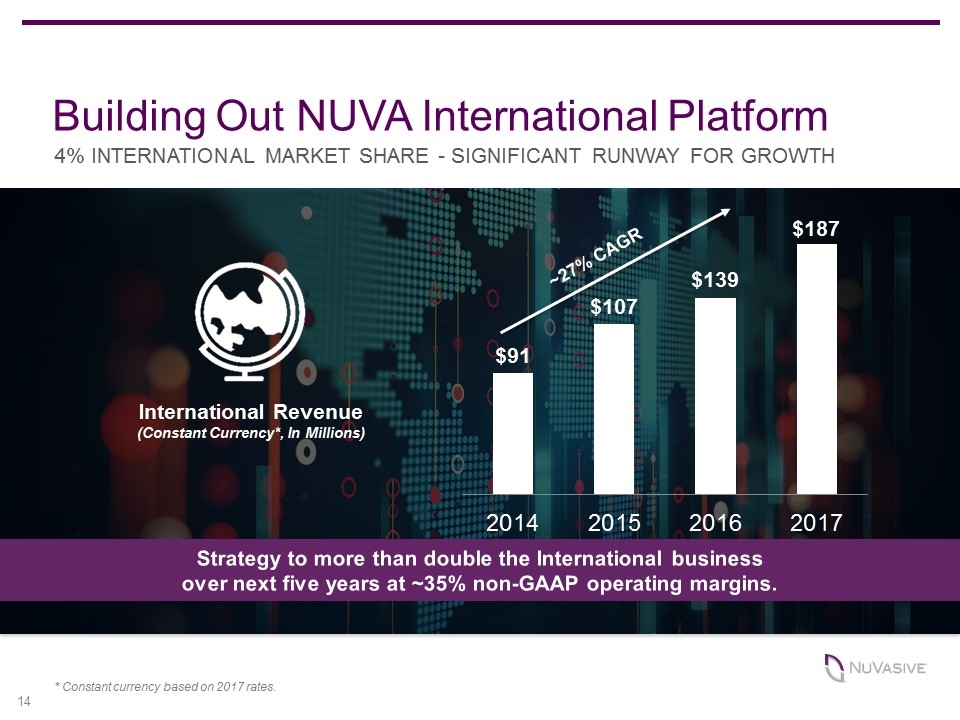
Strategy to more than double the International business over next five years at ~35% non-GAAP operating margins. International Revenue (Constant Currency*, In Millions) ~27% CAGR 14 * Constant currency based on 2017 rates. Building Out NUVA International Platform 4% INTERNATIONAL MARKET SHARE - SIGNIFICANT RUNWAY FOR GROWTH
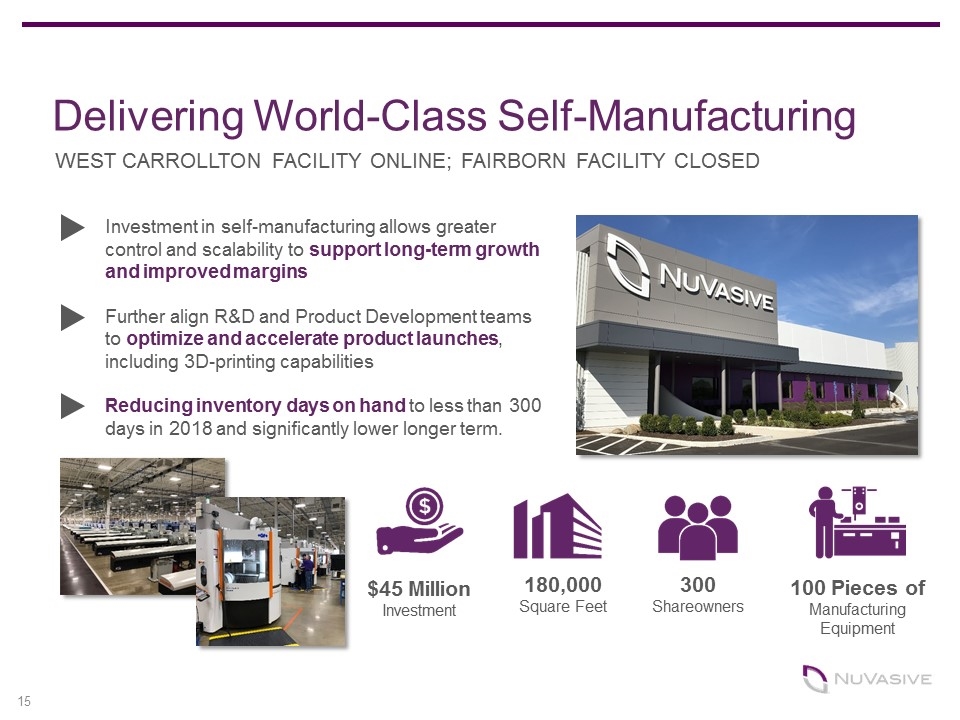
Delivering World-Class Self-Manufacturing $45 Million Investment 100 Pieces of Manufacturing Equipment 180,000 Square Feet Investment in self-manufacturing allows greater control and scalability to support long-term growth and improved margins Further align R&D and Product Development teams to optimize and accelerate product launches, including 3D-printing capabilities Reducing inventory days on hand to less than 300 days in 2018 and significantly lower longer term. 300 Shareowners WEST CARROLLTON FACILITY ONLINE; FAIRBORN FACILITY CLOSED
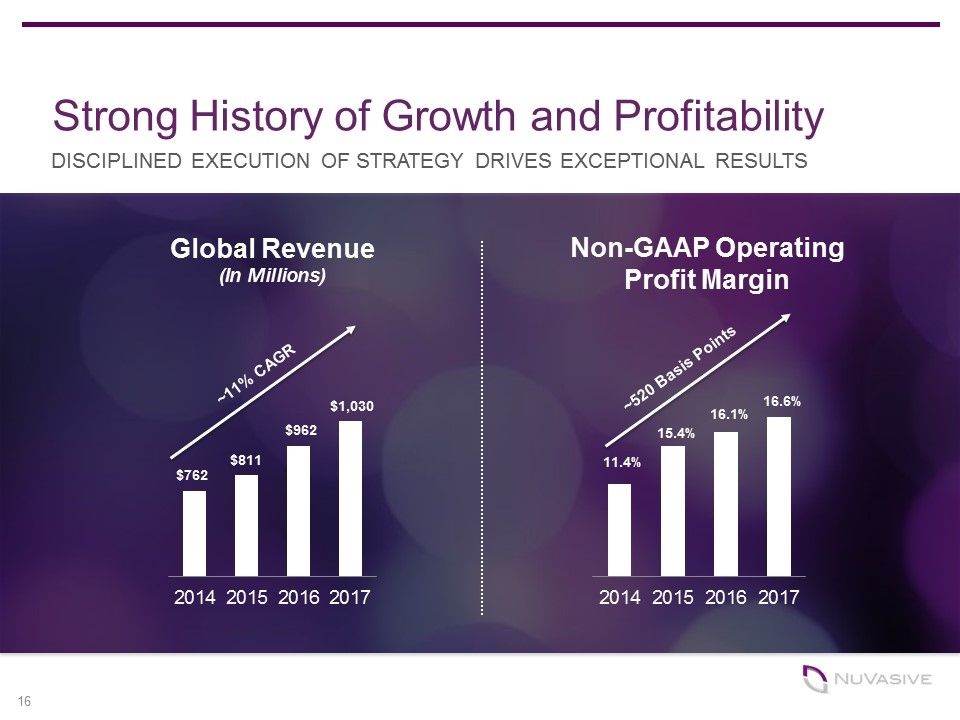
Strong History of Growth and Profitability Global Revenue (In Millions) Non-GAAP Operating Profit Margin $1,030 11.4% 15.4% 16.1% 16.6% ~520 Basis Points ~11% CAGR DISCIPLINED EXECUTION OF STRATEGY DRIVES EXCEPTIONAL RESULTS $762 $811 $962
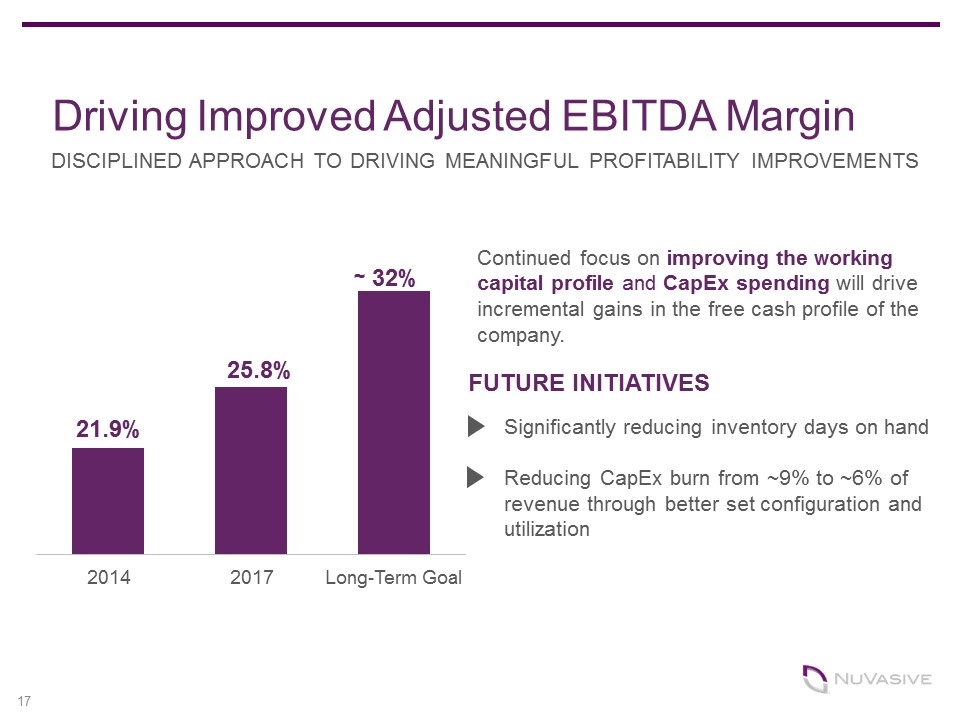
Driving Improved Adjusted EBITDA Margin DISCIPLINED APPROACH TO DRIVING MEANINGFUL PROFITABILITY IMPROVEMENTS Continued focus on improving the working capital profile and CapEx spending will drive incremental gains in the free cash profile of the company. FUTURE INITIATIVES Significantly reducing inventory days on hand Reducing CapEx burn from ~9% to ~6% of revenue through better set configuration and utilization ~
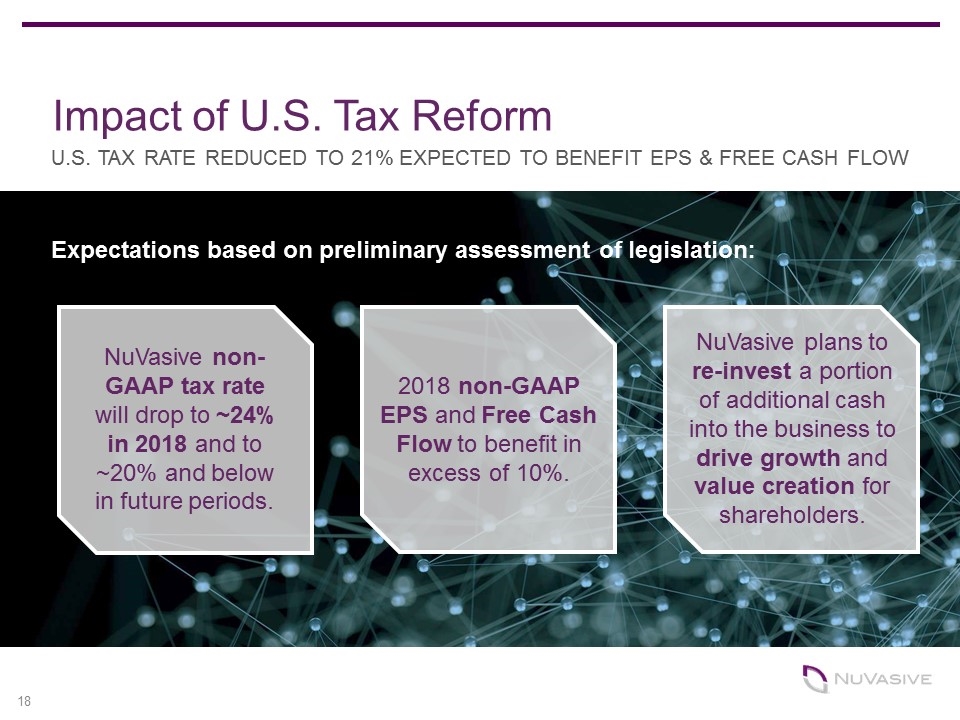
Impact of U.S. Tax Reform U.S. TAX RATE REDUCED TO 21% EXPECTED TO BENEFIT EPS & FREE CASH FLOW NuVasive non-GAAP tax rate will drop to ~24% in 2018 and to ~20% and below in future periods. 2018 non-GAAP EPS and Free Cash Flow to benefit in excess of 10%. NuVasive plans to re-invest a portion of additional cash into the business to drive growth and value creation for shareholders. Expectations based on preliminary assessment of legislation:
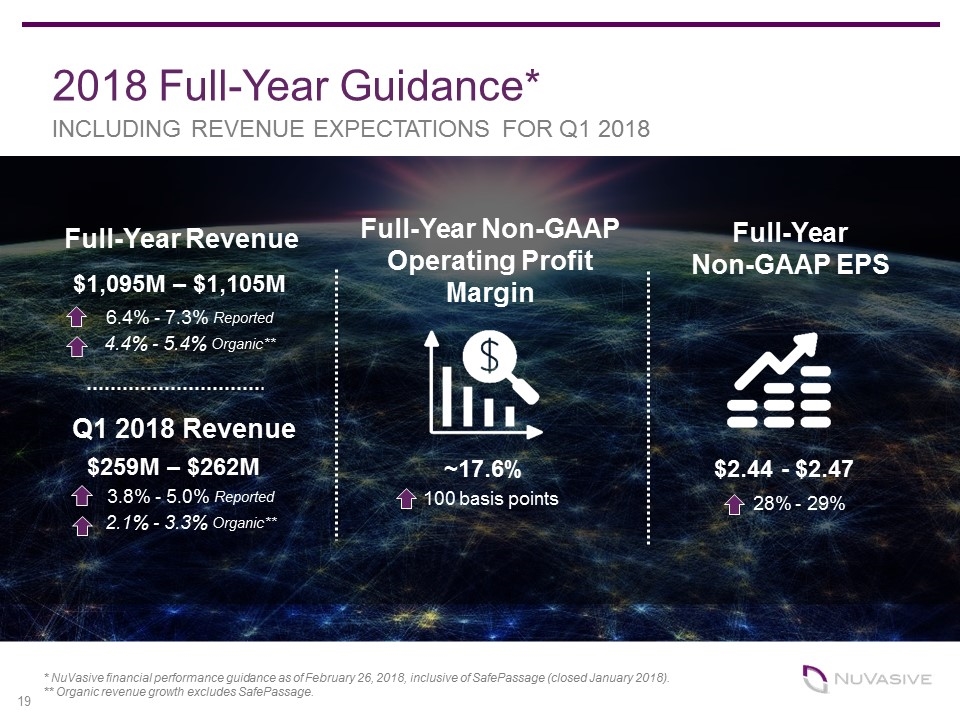
2018 Full-Year Guidance* $1,095M – $1,105M Full-Year Non-GAAP Operating Profit Margin Full-Year Revenue ~17.6% Full-Year Non-GAAP EPS $2.44 - $2.47 * NuVasive financial performance guidance as of February 26, 2018, inclusive of SafePassage (closed January 2018). ** Organic revenue growth excludes SafePassage. 6.4% - 7.3% Reported 4.4% - 5.4% Organic** INCLUDING REVENUE EXPECTATIONS FOR Q1 2018 Q1 2018 Revenue $259M – $262M 3.8% - 5.0% Reported 2.1% - 3.3% Organic** 28% - 29% 100 basis points
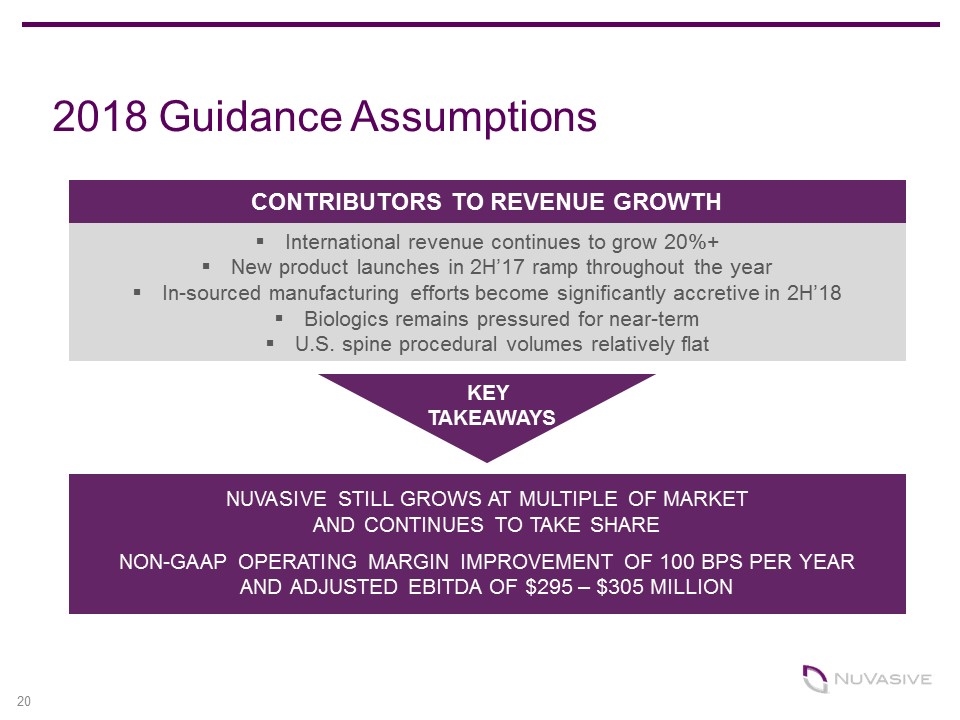
CONTRIBUTORS TO REVENUE GROWTH International revenue continues to grow 20%+ New product launches in 2H’17 ramp throughout the year In-sourced manufacturing efforts become significantly accretive in 2H’18 Biologics remains pressured for near-term U.S. spine procedural volumes relatively flat NUVASIVE STILL GROWS AT MULTIPLE OF MARKET AND CONTINUES TO TAKE SHARE NON-GAAP OPERATING MARGIN IMPROVEMENT OF 100 BPS PER YEAR AND ADJUSTED EBITDA OF $295 – $305 MILLION KEY TAKEAWAYS 2018 Guidance Assumptions 20
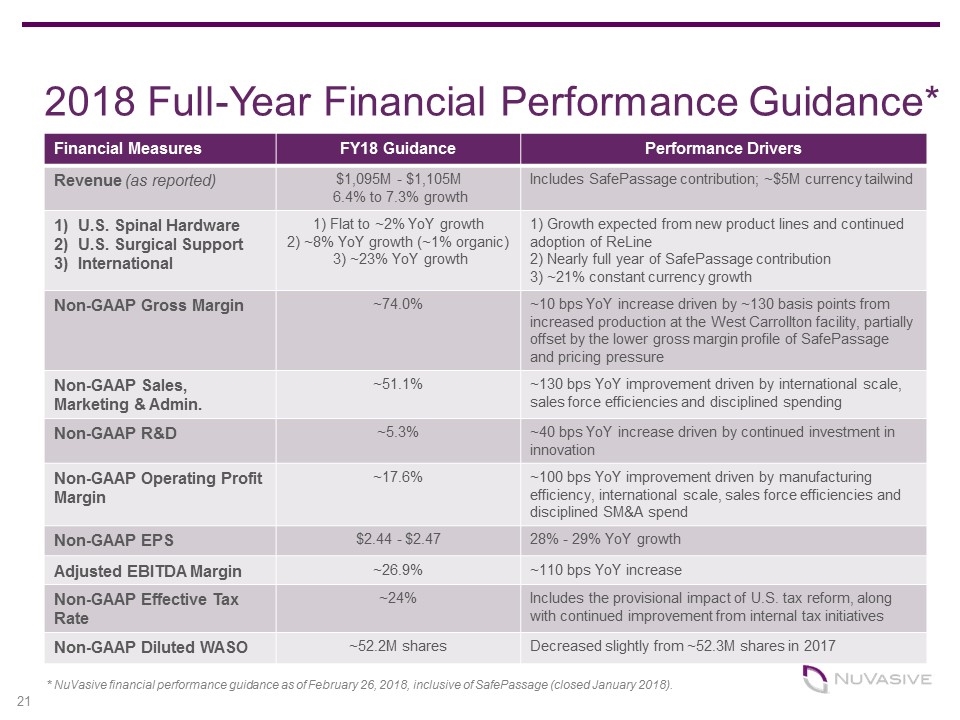
* NuVasive financial performance guidance as of February 26, 2018, inclusive of SafePassage (closed January 2018). 2018 Full-Year Financial Performance Guidance* Financial Measures FY18 Guidance Performance Drivers Revenue (as reported) $1,095M - $1,105M 6.4% to 7.3% growth Includes SafePassage contribution; ~$5M currency tailwind U.S. Spinal Hardware U.S. Surgical Support International 1) Flat to ~2% YoY growth 2) ~8% YoY growth (~1% organic) 3) ~23% YoY growth 1) Growth expected from new product lines and continued adoption of ReLine 2) Nearly full year of SafePassage contribution 3) ~21% constant currency growth Non-GAAP Gross Margin ~74.0% ~10 bps YoY increase driven by ~130 basis points from increased production at the West Carrollton facility, partially offset by the lower gross margin profile of SafePassage and pricing pressure Non-GAAP Sales, Marketing & Admin. ~51.1% ~130 bps YoY improvement driven by international scale, sales force efficiencies and disciplined spending Non-GAAP R&D ~5.3% ~40 bps YoY increase driven by continued investment in innovation Non-GAAP Operating Profit Margin ~17.6% ~100 bps YoY improvement driven by manufacturing efficiency, international scale, sales force efficiencies and disciplined SM&A spend Non-GAAP EPS $2.44 - $2.47 28% - 29% YoY growth Adjusted EBITDA Margin ~26.9% ~110 bps YoY increase Non-GAAP Effective Tax Rate ~24% Includes the provisional impact of U.S. tax reform, along with continued improvement from internal tax initiatives Non-GAAP Diluted WASO ~52.2M shares Decreased slightly from ~52.3M shares in 2017
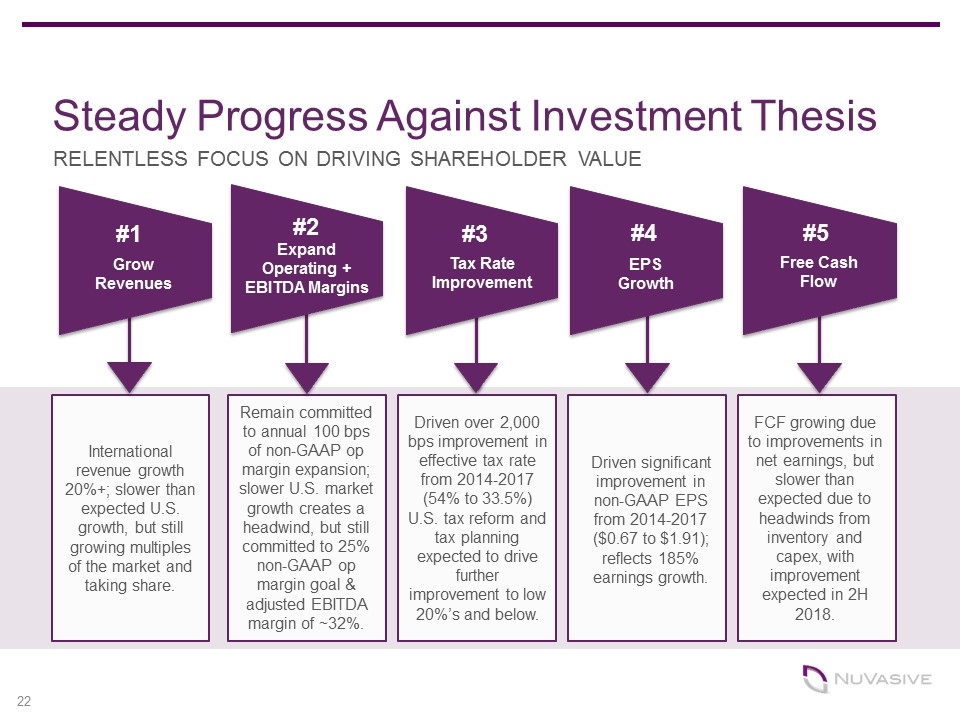
Steady Progress Against Investment Thesis RELENTLESS FOCUS ON DRIVING SHAREHOLDER VALUE International revenue growth 20%+; slower than expected U.S. growth, but still growing multiples of the market and taking share. Remain committed to annual 100 bps of non-GAAP op margin expansion; slower U.S. market growth creates a headwind, but still committed to 25% non-GAAP op margin goal & adjusted EBITDA margin of ~32%. Driven over 2,000 bps improvement in effective tax rate from 2014-2017 (54% to 33.5%) U.S. tax reform and tax planning expected to drive further improvement to low 20%’s and below. Driven significant improvement in non-GAAP EPS from 2014-2017 ($0.67 to $1.91); reflects 185% earnings growth. FCF growing due to improvements in net earnings, but slower than expected due to headwinds from inventory and capex, with improvement expected in 2H 2018. #1 #2 #3 #4 #5 Grow Revenues Expand Operating + EBITDA Margins Tax Rate Improvement Free Cash Flow EPS Growth
