Attached files
| file | filename |
|---|---|
| 8-K - FORM 8-K FEB 26 2018 - CREE, INC. | form8k022618.htm |

© 2018 Cree, Inc. All rights reserved

© 2018 Cree, Inc. All rights reserved
RAIFORD GARRABRANT, DIRECTOR
FEBRUARY 26TH, 2018
Investor Relations
© 2018 Cree, Inc. All rights reserved 3
Welcome
Raiford Garrabrant Investor Relations
Corporate Strategy
Gregg Lowe Chief Executive Officer
Wolfspeed
Cengiz Balkas SVP / GM Wolfspeed
Break
LED Products
Dave Emerson EVP / GM LED Products
Agenda
Lighting Products
Craig Atwater SVP / GM Lighting Products
Financial Overview
Mike McDevitt Chief Financial Officer
Group Q&A
Presentation Adjourns

© 2018 Cree, Inc. All rights reserved 4
Note on Forward-Looking Statements
This presentation includes forward-looking statements about Cree’s business outlook, future financial results and targets, product markets, plans and objectives for future
operations, and product development programs and goals. These statements are subject to risks and uncertainties, both known and unknown, that may cause actual results to
differ materially, as discussed in our most recent annual report and other reports filed with the U.S. Securities and Exchange Commission.
Important factors that could cause actual results to differ materially include the risk that we may not obtain sufficient orders to achieve our targeted revenues; price competition in
key markets; our ability to lower costs; the risk that our results will suffer if we are unable to balance fluctuations in customer demand and capacity; product mix; risks associated
with our ability to complete development and commercialization of products under development; risks associated with the ramp-up of production of our new products and our
entry into new business channels; the rapid development of new technology and competing products that may impair demand or render our products obsolete; the potential lack
of customer acceptance for our products; risks associated with acquisitions, divestitures, joint ventures or investments generally; and the risk that we or our channel partners are
not able to develop and expand customer bases and accurately anticipate demand from end customers, which can result in increased inventory and reduced orders as we
experience wide fluctuations in supply and demand.
The forward-looking statements in this presentation were based on management’s analysis of information available at the time the presentation was prepared and on
assumptions deemed reasonable by management. Our industry and business are constantly evolving, and Cree undertakes no obligation to update such forward-looking
statements to reflect new information, subsequent developments or otherwise, except as may be required by applicable U.S. federal securities laws and regulations.
Note Regarding Non-GAAP Financial Measures
This presentation includes certain non-GAAP financial measures and targets. Cree's management evaluates results and makes operating decisions using both GAAP and non-
GAAP measures included in this presentation. Non-GAAP results exclude certain costs, charges and expenses which are included in GAAP results. By including these non-
GAAP measures, management intends to provide investors with additional information to further analyze the Company's performance, core results and underlying trends. Non-
GAAP results are not prepared in accordance with GAAP and non-GAAP information should be considered a supplement to, and not a substitute for, financial statements
prepared in accordance with GAAP. Investors and potential investors are encouraged to review the reconciliation of non-GAAP financial measures to their most directly
comparable GAAP measures attached to this presentation. Please see the Appendix at the end of this presentation.
Forward-Looking Statements & Non-GAAP Measures

© 2018 Cree, Inc. All rights reserved
GREGG LOWE, CEO
FEBRUARY 26TH, 2018

© 2018 Cree, Inc. All rights reserved 6
WOLFSPEED
A Powerhouse Semiconductor company focused on Silicon Carbide (SiC)
and Gallium Nitride (GaN)
• Large multi-decade growth opportunities with SiC and GaN in Electric Vehicles, Solar energy,
Telecommunications, Industrial, and Mil/Aero
• Invest to expand scale and to accelerate growth of SiC Materials, Power Devices and GaN
RF Devices where SiC and GaN have distinct advantage
• Objectives: High growth, strong gross margins with good fall through to the bottom line
Cree’s Transformation Path

© 2018 Cree, Inc. All rights reserved 7
LED
Focus where our best-in-class technology and application-optimized solutions are differentiated
and valued
• High-power technology provides the only solution
• High-power general lighting
• Automotive lighting
• Application-optimized solutions solve the most difficult system-level problems
• Next-generation video
• Specialty lighting
• Cree Venture JV accesses additional SAM
• Broader mid-power markets
• Objectives: Modest growth and gross margin expansion
OPEX lean, CAPEX light
Cree’s Transformation Path
© 2018 Cree, Inc. All rights reserved 8
LIGHTING
Fix the Business
• Fix quality through improved processes and new product developments
• Improve channel position and relationships
• New product innovations to better position the portfolio--focused on higher specification and
smart intelligent features improving customer satisfaction
• Objectives: Modest growth, gross margin in line with the industry and operating margin
expansion
Cree’s Transformation Path
© 2018 Cree, Inc. All rights reserved 9
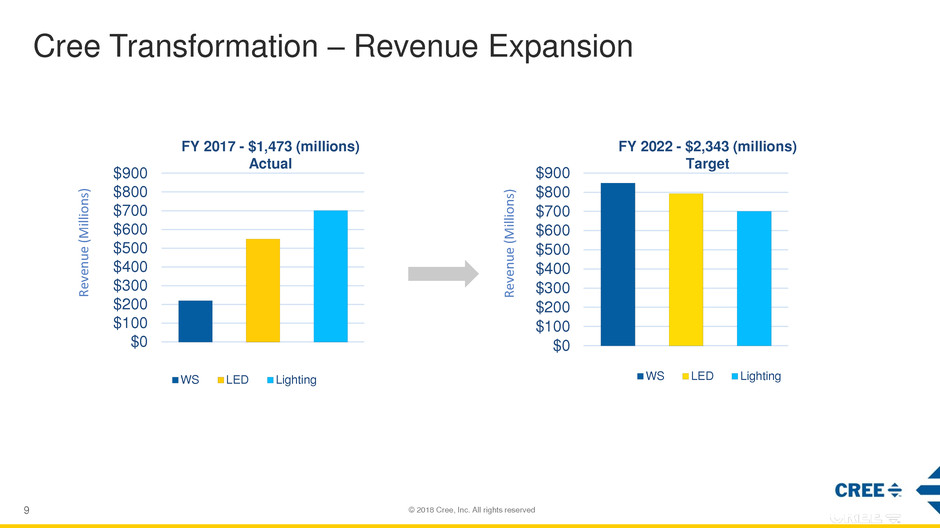
Cree Transformation – Revenue Expansion
$0
$100
$200
$300
$400
$500
$600
$700
$800
$900
WS LED Lighting
$0
$100
$200
$300
$400
$500
$600
$700
$800
$900
WS LED Lighting
FY 2017 - $1,473 (millions)
Actual
FY 2022 - $2,343 (millions)
Target
Re
ven
u
e
(M
ill
io
n
s)
Re
ven
u
e
(M
ill
io
n
s)

© 2018 Cree, Inc. All rights reserved 10
Gross Margin and Earnings Power Expansion 25.7%
40.0%
-0.7%
20.0%
-5%
0%
5%
10%
15%
20%
25%
30%
35%
40%
F18Q2 FY22
%
to
Re
ven
ue
Gross and Operating Margin (non-GAAP)
GM% OM%
Long Range Model (non-GAAP)
• GM 40+%
• OM 20+%
Target
Actual

© 2018 Cree, Inc. All rights reserved 11
WOLFSPEED
A Powerhouse Semiconductor company focused on Silicon Carbide (SiC) and Gallium
Nitride (GaN)
LED
Focus where our best-in-class technology and application-optimized solutions are
differentiated and valued
LIGHTING
Fix the Business
Cree’s Transformation Path

© 2018 Cree, Inc. All rights reserved

© 2018 Cree, Inc. All rights reserved
CREE CONFIDENTIAL & PROPRIETARY © 2017 Cree, Inc. All rights
reserved
Wolfspeed
Cengiz Balkas, SVP and GM
February 26, 2018

© 2018 Cree, Inc. All rights reserved 14
WOLFSPEED
A Powerhouse Semiconductor company focused on Silicon Carbide (SiC)
and Gallium Nitride (GaN)
• Large multi-decade growth opportunities with SiC and GaN in Electric Vehicles, Solar energy,
Telecommunications, Industrial, and Mil/Aero
• Invest to expand scale and to accelerate growth of SiC Materials, Power Devices and GaN
RF Devices where SiC and GaN have distinct advantage
• Objectives: High growth, strong gross margins with good fall through to the bottom line
Cree’s Transformation Path

© 2018 Cree, Inc. All rights reserved 15
Silicon Carbide and GaN: Fundamental Advantages
Silicon Carbide Solar Inverters
and On-Board Chargers are:
• 5X lighter
• 3X smaller
• 25% lower semiconductor losses
GaN-Based Antennas:
• Increased capacity and
coverage
• 2X the users/tower
• 10X the data rate/user
4G LTE antenna 5G active antenna
0
5
10
15
Switching Efficiency Power Density
Silicon Carbide vs Silicon
SiC Si
0
20
40
60
Max Frequency Power Density
GaN vs Silicon LDMOS
GaN Si
© 2018 Cree, Inc. All rights reserved 16
Wolfspeed Business Overview
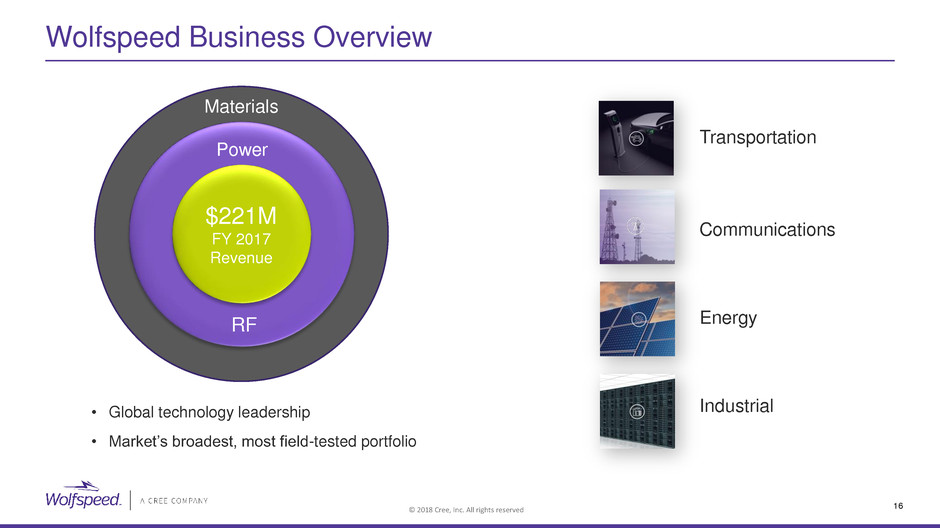
$xxB
$221M
FY 2017
Revenue
RF
Power
Materials
• Global technology leadership
• Market’s broadest, most field-tested portfolio
Transportation
Communications
Energy
Industrial

© 2018 Cree, Inc. All rights reserved 17
30 Years of Global Silicon Carbide and GaN Leadership
1991
Released world’s
first commercial SiC
wafers
1998
Created industry’s
first GaN HEMT on
SiC
2000
Demonstrated first
ever GaN MMIC
with record power
density
2002
Released first 600V
commercial SiC JBS
Schottky diode
2011
Released industry’s
first SiC MOSFET
2016
Leading 150mm SiC
wafer market;
introduced 200mm
© 2018 Cree, Inc. All rights reserved 18
Wolfspeed’s Leadership in Power and RF Devices
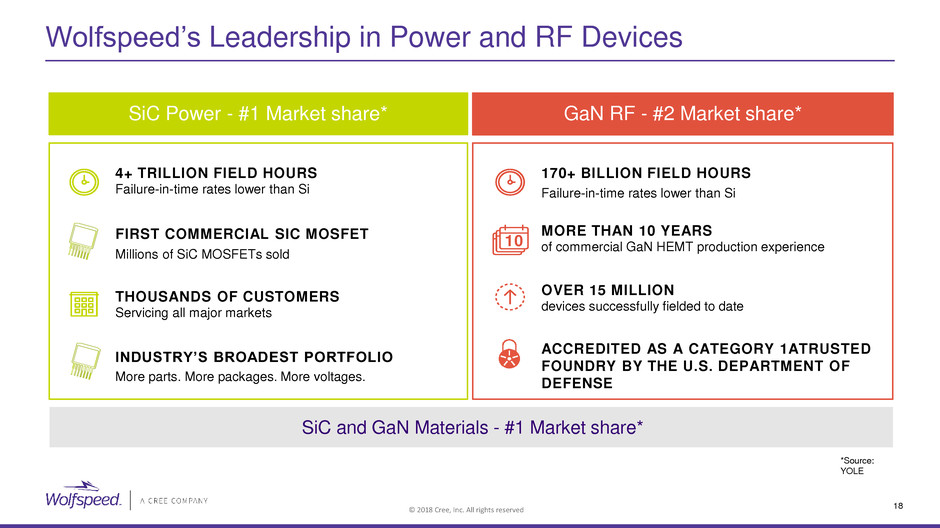
SiC Power - #1 Market share*
GaN RF - #2 Market share*
4+ TRILLION FIELD HOURS
Failure-in-time rates lower than Si
FIRST COMMERCIAL SIC MOSFET
THOUSANDS OF CUSTOMERS
Servicing all major markets
170+ BILLION FIELD HOURS
MORE THAN 10 YEARS
of commercial GaN HEMT production experience
OVER 15 MILLION
devices successfully fielded to date
ACCREDITED AS A CATEGORY 1ATRUSTED
FOUNDRY BY THE U.S. DEPARTMENT OF
DEFENSE
10
INDUSTRY’S BROADEST PORTFOLIO
Millions of SiC MOSFETs sold
More parts. More packages. More voltages.
Failure-in-time rates lower than Si
*Source:
YOLE
SiC and GaN Materials - #1 Market share*
© 2018 Cree, Inc. All rights reserved 19
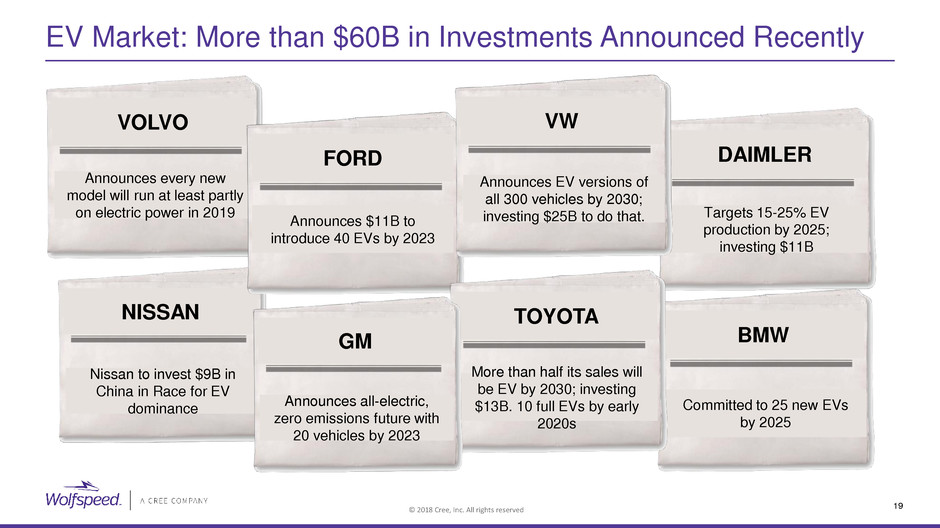
EV Market: More than $60B in Investments Announced Recently
BMW
Committed to 25 new EVs
by 2025
NISSAN
Nissan to invest $9B in
China in Race for EV
dominance
VOLVO
Announces every new
model will run at least partly
on electric power in 2019
FORD
Announces $11B to
introduce 40 EVs by 2023
DAIMLER
Targets 15-25% EV
production by 2025;
investing $11B
TOYOTA
More than half its sales will
be EV by 2030; investing
$13B. 10 full EVs by early
2020s
VW
Announces EV versions of
all 300 vehicles by 2030;
investing $25B to do that.
GM
Announces all-electric,
zero emissions future with
20 vehicles by 2023

© 2018 Cree, Inc. All rights reserved 20
Even Modest EV Adoption Drives Significant Opportunity
• SiC at the heart of EV
and EV infrastructure
• Multi-decade
opportunity
$15B
$-
$2,000
$4,000
$6,000
$8,000
$10,000
$12,000
$14,000
$16,000
0
20
40
60
80
100
120
140
2017 2022 2027 2032
S
iC
O
p
p
ortun
it
y
in
M
ill
io
n
s
V
e
h
ic
le
s
P
ro
d
u
c
e
d
i
n
M
ill
io
n
s
Total Vehicles Electric SiC Opportunity
*Source: Bloomberg New Energy Finance and Cree Estimates
$6B
$2.4B

© 2018 Cree, Inc. All rights reserved 21
Power

© 2018 Cree, Inc. All rights reserved 22
Key Markets Driving SiC Power Market Expansion
Drivers
≈30% of all vehicles made will be electric
by 2032
Faster charging and long-term reliability
High efficiency and power density for commercial
and industrial equipment
Legislation and social awareness for renewables
Worldwide SiC
Revenue 2017
(Source: YOLE estimates )
$5.0B
SAM 2022
Solar
Electric
Vehicles
$280M
Fast Charging
SiC Power Market
(Source: YOLE and company estimates)

© 2018 Cree, Inc. All rights reserved 23
On-Vehicle SiC has Unprecedented Potential for Growth
Drivers
Within ten years half of all model types
manufactured will be EVs
Policy tailwinds – emission standards
are tightening
Increasing Range
Decreasing cost
Worldwide SiC
Revenue 2017
$2.4B
SAM 2022
Solar
$7M
SiC EV Market
(Source: YOLE and company estimates)
(Source:
YOLE )

© 2018 Cree, Inc. All rights reserved 24
Fast Chargers Could Drive a $500 Million SAM by 2022
Drivers
Asia leading the field for charger installations
On-the-go demand for fast charging
Efficiency and size key to installation
Worldwide SiC
Revenue 2017
$522M
SAM 2022
Solar
Electric
Vehicles
$2M
Fast Charging
SiC Fast
Charging Market
(Source: YOLE and company estimates)
(Source: YOLE estimates)

© 2018 Cree, Inc. All rights reserved 25
Solar Silicon Carbide Adoption Accelerating
Drivers
Energy efficiency and cost
Legislation and global incentives
Social awareness for renewables
Worldwide SiC Solar
Revenue 2017
$2.1B
SAM 2022
Solar
Electric
Vehicles
$85M
Solar SiC Market
(Source: YOLE and company estimates)
(Source: YOLE estimates)

© 2018 Cree, Inc. All rights reserved 26
10 MW
saved
per year
• SiC enables lighter, smaller, quieter and more efficient solar inverters
• SiC saves 10 megawatts for each gigawatt installed per year vs silicon; saves 500 watts for every
second in operation

© 2018 Cree, Inc. All rights reserved 27
RF
© 2018 Cree, Inc. All rights reserved 28
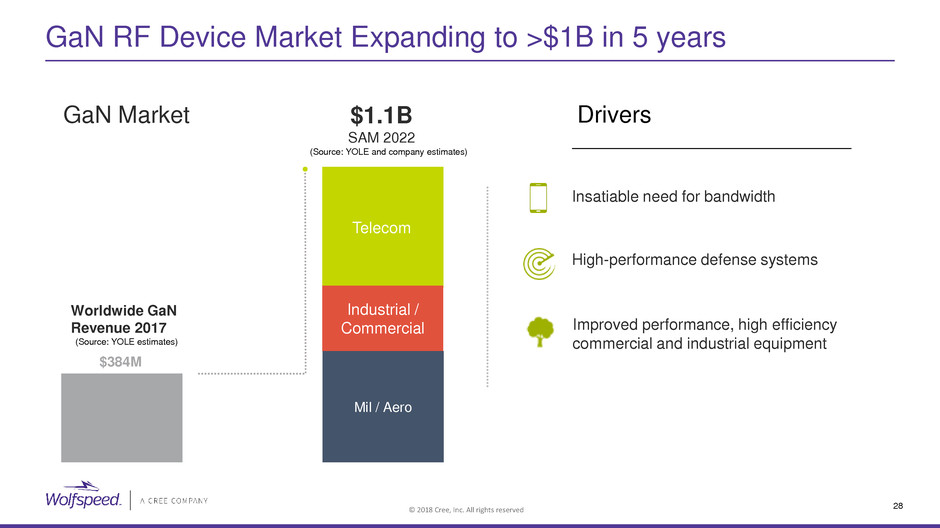
GaN RF Device Market Expanding to >$1B in 5 years
Drivers
Insatiable need for bandwidth
High-performance defense systems
Improved performance, high efficiency
commercial and industrial equipment
Worldwide GaN
Revenue 2017
$1.1B
SAM 2022
Telecom
Industrial /
Commercial
$384M
Mil / Aero
GaN Market
(Source: YOLE and company estimates)
(Source: YOLE estimates)
© 2018 Cree, Inc. All rights reserved 29
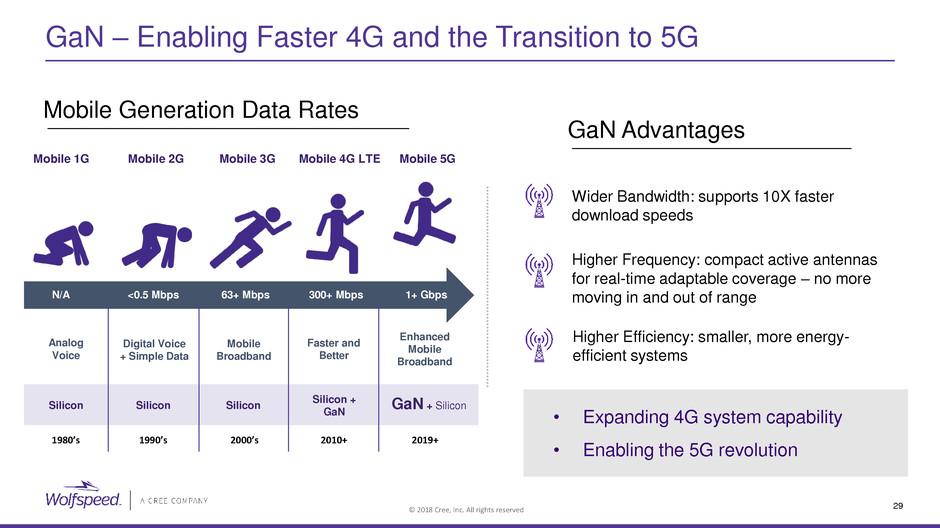
GaN – Enabling Faster 4G and the Transition to 5G
GaN Advantages
Wider Bandwidth: supports 10X faster
download speeds
Higher Frequency: compact active antennas
for real-time adaptable coverage – no more
moving in and out of range
Higher Efficiency: smaller, more energy-
efficient systems
Mobile Generation Data Rates
Mobile 1G Mobile 2G Mobile 3G Mobile 4G LTE Mobile 5G
N/A <0.5 Mbps 63+ Mbps 300+ Mbps 1+ Gbps
Silicon Silicon Silicon
Silicon +
GaN
1980’s 1990’s 2000’s 2010+ 2019+
GaN + Silicon
Enhanced
Mobile
Broadband
• Expanding 4G system capability
• Enabling the 5G revolution
Faster and
Better
Mobile
Broadband
Digital Voice
+ Simple Data
Analog
Voice
© 2018 Cree, Inc. All rights reserved 30
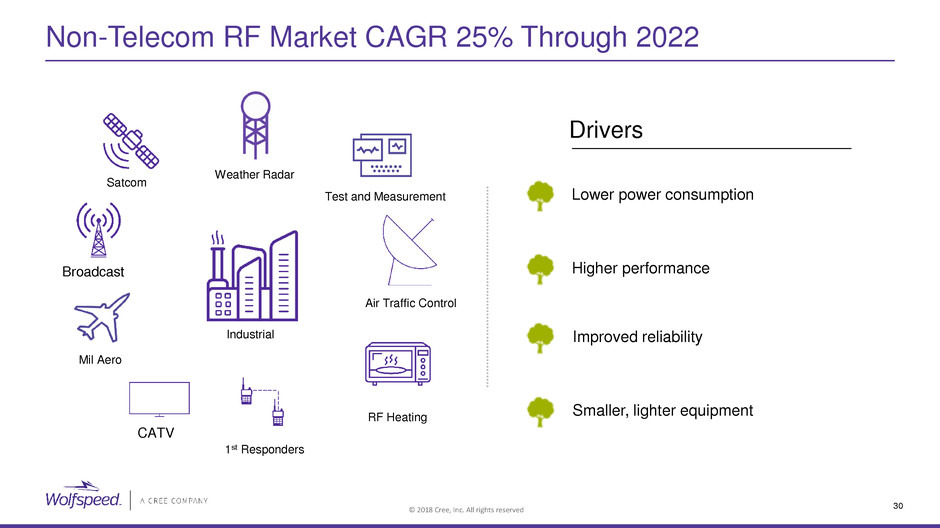
Non-Telecom RF Market CAGR 25% Through 2022
Drivers
Lower power consumption
Higher performance
Improved reliability
Smaller, lighter equipment
Weather Radar
Air Traffic Control
1st Responders
CATV
RF Heating
Industrial
Test and Measurement
Mil Aero
Broadcast
Satcom

© 2018 Cree, Inc. All rights reserved 31
Materials

© 2018 Cree, Inc. All rights reserved 32
A More Powerful, Efficient World Enabled by SiC and GaN
• #1 supply position at major power and RF
semi companies globally
• Over three decades of global technology
leadership
• Continued innovation through device
performance feedback
• Unrivaled scale; significantly ramping capacity
to meet demand
30
YEA
RS

© 2018 Cree, Inc. All rights reserved 33
SiC Materials Innovation Leadership
• Released the world’s first commercial SiC wafers in 1991
• Led every subsequent wafer diameter increase
1991
Unrivaled scale and market share leader
Initiated Commercial SiC Wafer Market
Led commercial scale SiC production

© 2018 Cree, Inc. All rights reserved 34
SiC Materials Market Expanding To >$1B by 2022
Drivers
EV applications driving significant volume
steps in power wafer market
Significant adoption in broad
industrial market applications
Telecom/5G commercial growth with
major RF players
Worldwide SiC Materials
Revenue 2017
$1.2B
SAM 2022
Solar
Electric
Vehicles
$56M
Value proposition for SiC validated in
applications that are driving significant growth
SiC Materials
Market
(Source: YOLE and company estimates)
(Source: YOLE estimates)
© 2018 Cree, Inc. All rights reserved 35
A More Powerful, Efficient World Enabled by SiC and GaN
Wolfspeed SiC and GaN deliver superior performance and value addressing the growing
demands of semiconductor applications
Revenue for FY2017 was $221M; SAM for our target markets is $7.3B for 2022
If only 25% of this converts for SiC and GaN, that’s still a $2B market, which is 8X where we
are today

© 2018 Cree, Inc. All rights reserved 36
WOLFSPEED
A Powerhouse Semiconductor company focused on Silicon Carbide (SiC)
and Gallium Nitride (GaN)
• Large multi-decade growth opportunities with SiC and GaN in Electric Vehicles, Solar energy,
Telecommunications, Industrial, and Mil/Aero
• Invest to expand scale and to accelerate growth of SiC Materials, Power Devices and GaN
RF Devices where SiC and GaN have distinct advantage
• Objectives: High growth, strong gross margins with good fall through to the bottom line
Cree’s Transformation Path

© 2018 Cree, Inc. All rights reserved

© 2018 Cree, Inc. All rights reserved
DAVE EMERSON, EVP AND GM
FEBRUARY 26TH, 2018
LED BUSINESS
© 2018 Cree, Inc. All rights reserved 39
LED
Focus where our best-in-class technology and application-optimized solutions are differentiated
and valued
• High-power technology provides the only solution
• High-power general lighting
• Automotive lighting
• Application-optimized solutions solve the most difficult system-level problems
• Next-generation video
• Specialty lighting
• Cree Venture JV accesses additional SAM
• Broader mid-power markets
• Objectives: Modest growth and gross margin expansion
OPEX lean, CAPEX light
Cree’s Transformation Path

© 2018 Cree, Inc. All rights reserved 40
LEDs
$550M
GM – 27%
(2017)
$793M
GM – 31%
(2022)
Stickier applications
High-power Lighting, Automotive Lighting,
Next-generation Video Screen, Specialty Lighting
Broader SAM
Cree Venture JV
Modest revenue growth with good gross margin expansion
OpEx Lean, CapEx Light
© 2018 Cree, Inc. All rights reserved 41
LEDs
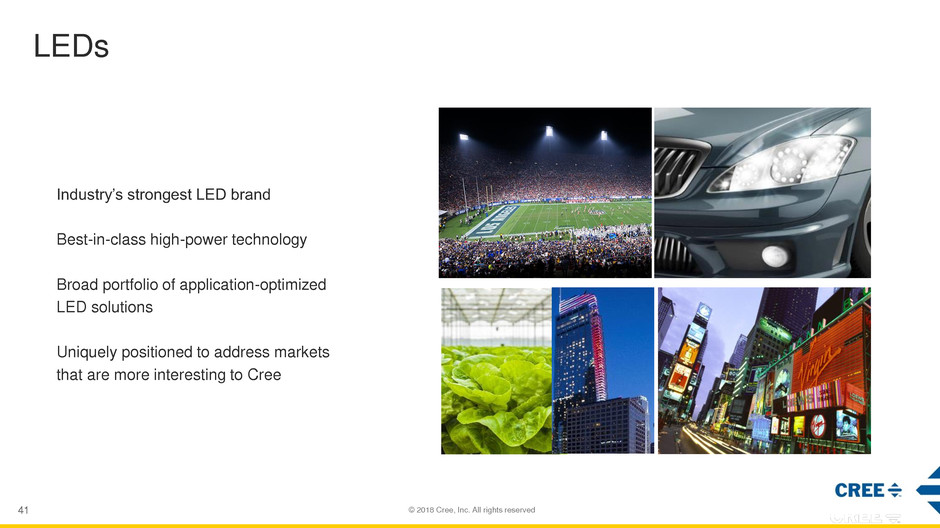
Industry’s strongest LED brand
Best-in-class high-power technology
Broad portfolio of application-optimized
LED solutions
Uniquely positioned to address markets
that are more interesting to Cree

© 2018 Cree, Inc. All rights reserved 42
Focus in Differentiated Market Segments
HIGH
P
O
W
E
R
A
P
P
LIC
A
TIO
N
O
P
TIMIZE
D
Automotive Lighting
$1.6B
Next-Generation
Video
$1.1B
Specialty Lighting
$0.7B
New focus provides access to $4.6B SAM by 2022 in differentiated applications
* Sources: IHS Packaged LEDs 2017, Strategies Unlimited 2017, LEDInside 2017 & Cree internal analysis
General Lighting
$1.2B

© 2018 Cree, Inc. All rights reserved 43
Cree Venture: Synergy for Growth
Expanded portfolio to address larger mid-power opportunity
IP, Brand & Channel
High Volume / Cost Optimized
Low cost, Large Scale Manufacturing
Increase General Lighting SAM 5X - Low OpEx, No CapEx
+

© 2018 Cree, Inc. All rights reserved 44
New Strategic Focus Drives Profits
G
ros
s
Ma
rgi
n
Time
New focus combined with OpEx Lean/CapEx Light approach increases cash flow
New focus
Differentiate
• High-power General Lighting
• Automotive
• Next-Generation Video
Screen
• Specialty Lighting
Broader MP Market
• Cree Venture JV

© 2018 Cree, Inc. All rights reserved 45
LED
Focus where our best-in-class technology and application-optimized solutions are differentiated
and valued
• High-power technology provides the only solution
• High-power general lighting
• Automotive lighting
• Application-optimized solutions solve the most difficult system-level problems
• Next-generation video
• Specialty lighting
• Cree Venture JV accesses additional SAM
• Broader mid-power markets
• Objectives: Modest growth and gross margin expansion
OPEX lean, CAPEX light
Cree’s Transformation Path

© 2018 Cree, Inc. All rights reserved

© 2018 Cree, Inc. All rights reserved
CRAIG ATWATER, SVP AND GM
FEBRUARY 26TH, 2018
LIGHTING BUSINESS

© 2018 Cree, Inc. All rights reserved 48
LIGHTING
Fix the Business
• Fix quality through improved processes and new product developments
• Improve channel position and relationships
• New product innovations to better position the portfolio--focused on higher specification and
smart intelligent features improving customer satisfaction
• Objectives: Modest growth, gross margin in line with the industry and operating margin
expansion
Cree’s Transformation Path
© 2018 Cree, Inc. All rights reserved 49
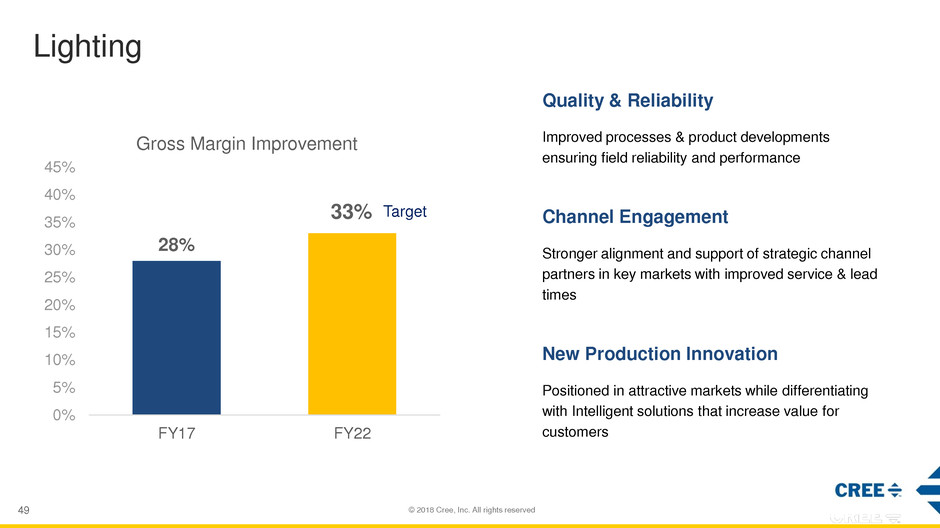
Lighting
0%
5%
10%
15%
20%
25%
30%
35%
40%
45%
FY17 FY22
Gross Margin Improvement
28%
Quality & Reliability
Improved processes & product developments
ensuring field reliability and performance
Channel Engagement
Stronger alignment and support of strategic channel
partners in key markets with improved service & lead
times
New Production Innovation
Positioned in attractive markets while differentiating
with Intelligent solutions that increase value for
customers
33% Target

© 2018 Cree, Inc. All rights reserved 50
$701M
FY2017
Intelligent
Indoor Outdoor
Lighting
Office / Education / Retail
Healthcare
Industrial
Area/Site

© 2018 Cree, Inc. All rights reserved 51
Quality & Reliability
Key Drivers:
• Improved process controls resulting in quality product
developments
• State-of-the art reliability lab
• Resolution & reduction of field claims
Early Indications:
• Design & process improvements preventing new issues
from being sent into the market
• Recent product launches performing well

© 2018 Cree, Inc. All rights reserved 52
Channel Engagement
Key Drivers:
• Stronger agent alignment & support
• Distributor partnerships & growth programs
• Stock & Flow penetration
• Service enhancements & Lead Time Optimization
Early Indications:
• Increased field selling resources by >75%
• Aligning w/ partners to drive mutual growth

© 2018 Cree, Inc. All rights reserved 53
New Product Innovation
Key Drivers:
• Engineering teams refocused on product development
• Complete portfolio optionality to increase specification
strength & margin opportunity
• Intelligent product solutions that delight customers and
solve new problems
Early Indications:
• Reprioritized NPI pipeline to position portfolio in more
attractive markets
• Recent NPI GM low 30’s

© 2018 Cree, Inc. All rights reserved 54
Lighting
Recognized leader in indoor and outdoor LED
lighting—delivering better light experiences without
compromise
Lighting technologies delivering brilliantly efficient,
radically simple and exceptional high quality
products
Built on a foundation of relentless innovation, we
are committed to delivering value beyond light
Outdoor
Indoor

© 2018 Cree, Inc. All rights reserved 55
LIGHTING
Fix the Business
• Fix quality through improved processes and new product developments
• Improve channel position and relationships
• New product innovations to better position the portfolio--focused on higher specification and
smart intelligent features improving customer satisfaction
• Objectives: Modest growth, gross margin in line with the industry and operating margin
expansion
Cree’s Transformation Path

© 2018 Cree, Inc. All rights reserved

© 2018 Cree, Inc. All rights reserved
MIKE McDEVITT, CFO
FEBRUARY 26TH, 2018
BUSINESS MODEL
© 2018 Cree, Inc. All rights reserved 58
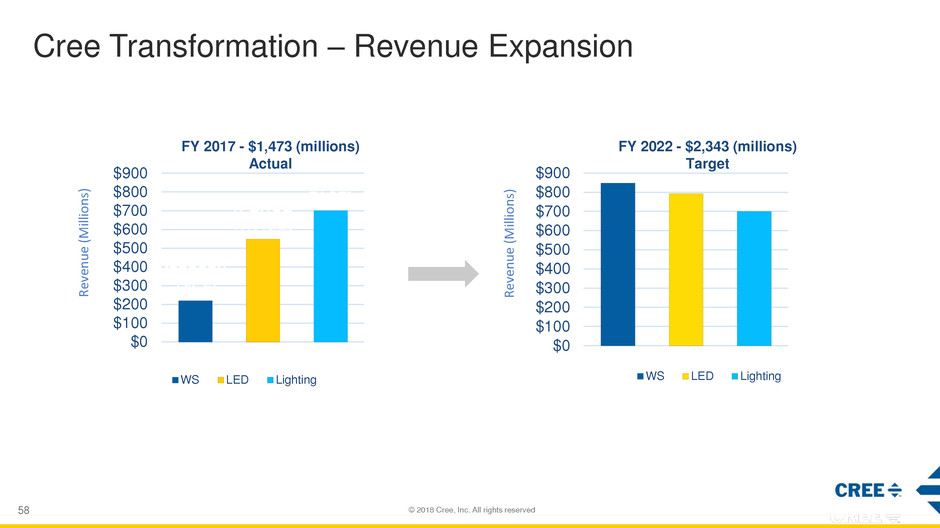
Cree Transformation – Revenue Expansion
[PERCEN
TAGE]
[PERCE
NTAGE]
[PERCEN
TAGE]
$0
$100
$200
$300
$400
$500
$600
$700
$800
$900
WS LED Lighting
$0
$100
$200
$300
$400
$500
$600
$700
$800
$900
WS LED Lighting
FY 2017 - $1,473 (millions)
Actual
FY 2022 - $2,343 (millions)
Target
Re
ven
u
e
(M
ill
io
n
s)
Re
ven
u
e
(M
ill
io
n
s)

© 2018 Cree, Inc. All rights reserved 59
Gross Margin and Earnings Power Expansion
Long Range Model (non-GAAP)
• GM 40+%
• OM 20+%
• Wolfspeed targets high revenue growth, strong gross margins with good fall through to bottom line
• LED targets modest revenue growth and gross margin expansion, OPEX lean and CAPEX light
• Lighting targets modest growth, gross margin in line with the industry, operating margin expansion
25.7%
40.0%
-0.7%
20.0%
-5%
0%
5%
10%
15%
20%
25%
30%
35%
40%
F18Q2 FY22
%
to
Re
ven
ue
Gross and Operating Margin (non-GAAP)
GM% OM%
Actual
Target
© 2018 Cree, Inc. All rights reserved 60
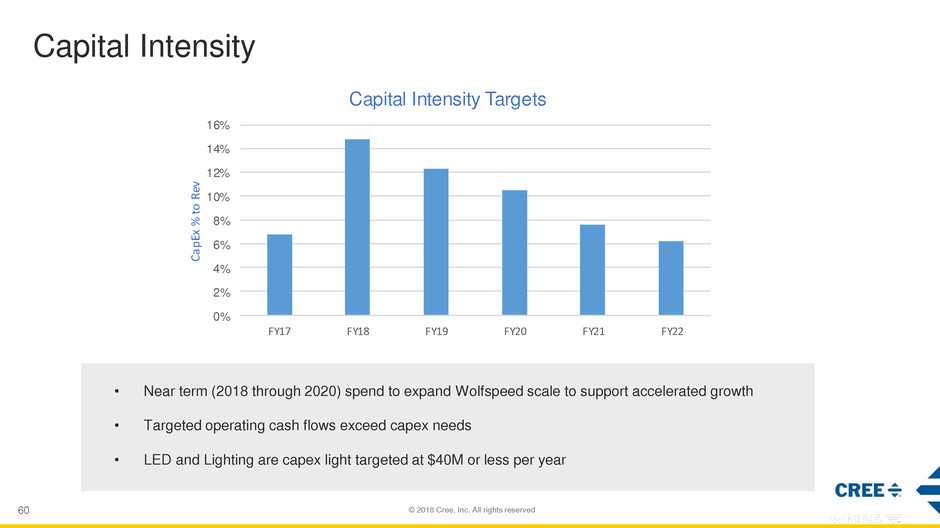
Capital Intensity
0%
2%
4%
6%
8%
10%
12%
14%
16%
FY17 FY18 FY19 FY20 FY21 FY22
Ca
pEx
%
to
Rev
Capital Intensity Targets
• Near term (2018 through 2020) spend to expand Wolfspeed scale to support accelerated growth
• Targeted operating cash flows exceed capex needs
• LED and Lighting are capex light targeted at $40M or less per year

© 2018 Cree, Inc. All rights reserved 61
Powering Earnings Growth
8%
26%
0%
5%
10%
15%
20%
25%
30%
F18Q2 FY22
EB
ITD
A
%
to
Re
ven
ue
EBITDA
$-
$250
$500
$750
$1,000
$1,250
$1,500
F18Q2 FY22
C&
I ($
's i
n M
's)
Cash & Investments
Organic growth in segments that reward value
• Provides profit expansion
• Increases cash position
• Enables access to other forms of capital to pursue other strategic opportunities
Actual
Target
Actual
Target

© 2018 Cree, Inc. All rights reserved
GREGG LOWE, CEO
FEBRUARY 26TH, 2018
© 2018 Cree, Inc. All rights reserved 63
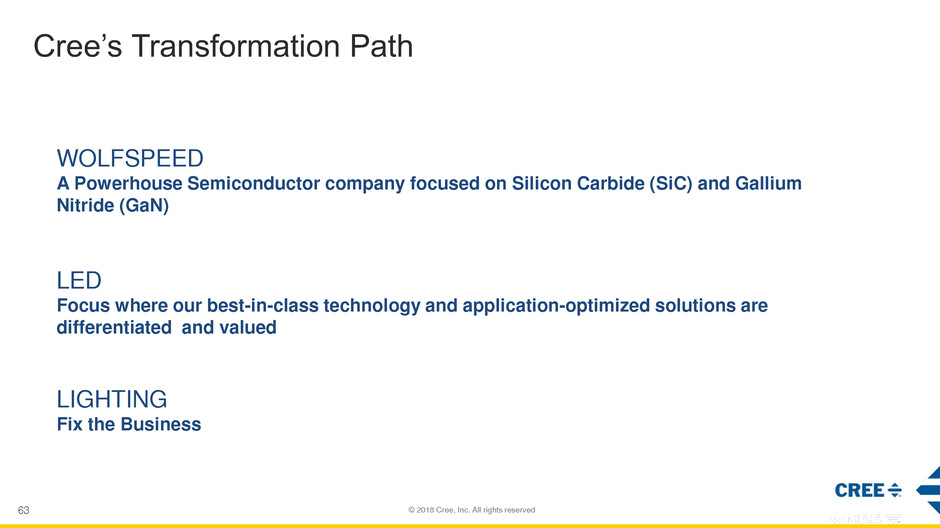
WOLFSPEED
A Powerhouse Semiconductor company focused on Silicon Carbide (SiC) and Gallium
Nitride (GaN)
LED
Focus where our best-in-class technology and application-optimized solutions are
differentiated and valued
LIGHTING
Fix the Business
Cree’s Transformation Path

© 2018 Cree, Inc. All rights reserved

© 2018 Cree, Inc. All rights reserved
Appendix 1
© 2018 Cree, Inc. All rights reserved 66
Non-GAAP Financial Measures
This presentation includes certain non-GAAP financial measures and targets. Cree's management evaluates results and makes operating decisions using both GAAP and non-
GAAP measures included in this presentation. Non-GAAP results exclude certain costs, charges and expenses which are included in GAAP results. By including these non-
GAAP measures, management intends to provide investors with additional information to further analyze the Company's performance, core results and underlying trends. Non-
GAAP results are not prepared in accordance with GAAP and non-GAAP information should be considered a supplement to, and not a substitute for, financial statements
prepared in accordance with GAAP. Investors and potential investors are encouraged to review the reconciliation of non-GAAP financial measures to their most directly
comparable GAAP measures included in this Appendix.
We present three non-GAAP financial measures in this presentation – Non-GAAP Gross Margin, Non-GAAP Operating Margin and EBITDA. For the presentation of historical
non-GAAP financial measures and results, the reconciliation to their most directly comparable GAAP measures are on the next page.
For forward-looking non-GAAP financial measures, we are unable to provide a reconciliation to the most directly comparable GAAP financial measure because certain information
needed to project these future measures is difficult to estimate and is dependent on future events which are uncertain or outside of our control. Nonetheless, we note that the
items that we expect to exclude from our non-GAAP measures (when applicable) include stock-based compensation expense; amortization or impairment of acquisition-related
intangibles; business restructuring charges or gains; net changes with equity investments; and income tax effects of the foregoing non-GAAP items. Cree management currently
believes that the Company’s long term non-GAAP tax rate should approximate the GAAP tax rate, subject to the composition on a jurisdiction by jurisdiction basis of revenue,
expense and income.
Appendix -- Non-GAAP Measures Reconciliation

© 2018 Cree, Inc. All rights reserved 67
Appendix -- Non-GAAP Measures Reconciliation
Non-GAAP Gross Margin Reconciliation FY18Q2 Non-GAAP Operating Margin Reconciliation FY18Q2 EBITDA Reconciliation FY18Q2
Revenue $ 367.9 Revenue $ 367.9 Revenue $ 367.9
GAAP Gross Profit $ 92.6 GAAP Operating (loss) income $ (26.3) GAAP Income before income taxes $ 0.4
GAAP Gross Margin % 25.2% GAAP Operating (loss) income % -7.2% Adjustments:
Adjustment: Adjustments: Depreciation and amortization 37.2
Stock-based compensation expense 1.9 Stock-based compensation expense 12.0 Stock-based compensation 12.0
Non-GAAP Gross Profit $ 94.5
Amortization or impairment of
acquisition related intangibles 6.8
Loss on Disposal or impairment
of long lived assets 4.3
Non-GAAP Gross Margin % 25.7% Executive Severance 4.9 (Gain) loss on equity investment (25.2)
Adjustment Total 23.7 Interest Expense 1.1
Non-GAAP Operating (loss) income $ (2.6) Adjustment Total 29.4
Non-GAAP Operating (loss) income % -0.7% EBITDA $ 29.8
EBITDA % 8%
