Attached files
| file | filename |
|---|---|
| EX-99.1 - EX-99.1 - GENERAL MILLS INC | d448662dex991.htm |
| 8-K - 8-K - GENERAL MILLS INC | d448662d8k.htm |
Acquisition of blue buffalo February 23, 2018 Exhibit 99.2
Certain information contained in this presentation that are not statements of historical or current fact constitute "forward-looking statements" within the meaning of Section 21E of the Securities Exchange Act of 1934. These statements may be identified by the use of words such as "may," "will," "expect," "should," "anticipate," "intend," "believe" and "plan." The forward-looking statements contained in this presentation include, without limitation, statements related to: the planned acquisition of Blue Buffalo and the timing and financing thereof; the ability to obtain regulatory approvals and meet other closing conditions for the planned acquisition; the expected impact of the planned acquisition, including among others, on the Company's net sales, expected trends in net sales, earnings performance, profitability and other financial measures; expectations regarding growth potential in various products, geographies and market categories, including the impact from a more diversified portfolio of brands and business mix; expectations regarding growth in the pet food category; the realization of anticipated cost synergies, margin expansion and adjusted earnings per share accretion from the acquisition; the ability to retain key personnel; and the anticipated sufficiency of future cash flows to enable the payment of interest and repayment of short- and long-term debt as well as quarterly dividends. These and other forward-looking statements are based on each party’s respective management's current views and assumptions and involve risks and uncertainties that could significantly affect expected results. Results may be materially affected by factors such as: risks associated with transactions generally, such as the inability to obtain, or delays in obtaining, required approvals under applicable anti-trust legislation and other regulatory and third party consents and approvals; the occurrence of any event, change or other circumstances that could give rise to the termination of the merger agreement; the outcome of any legal proceedings that may be instituted following announcement of the transaction; potential volatility in the capital markets and the impact on the ability to complete the proposed debt and equity financing necessary to consummate the acquisition of Blue Buffalo; failure to retain key management and employees of Blue Buffalo; General Mills’ level of indebtedness as a result of the transactions and its ability to achieve its objective of reducing indebtedness; issues or delays in the successful integration of Blue Buffalo's operations with those of General Mills, including incurring or experiencing unanticipated costs and/or delays or difficulties; difficulties or delays in the successful transition from the information technology systems of Blue Buffalo to those of General Mills as well as risks associated with other integration or transition of the operations, systems and personnel of Blue Buffalo; failure or inability to implement growth strategies in a timely manner; unfavorable reaction to the transaction by customers, competitors, suppliers and employees; future levels of revenues being lower than expected and costs being higher than expected; conditions affecting the industry generally; local and global political and economic conditions; conditions in the securities market that are less favorable than expected; and changes in the level of capital investment, and other risks described in General Mills’ filings with the Securities and Exchange Commission, including General Mills’ Annual Report on Form 10-K for the fiscal year ended May 28, 2017 and in Blue Buffalo’s filings with the Securities and Exchange Commission, including Blue Buffalo’s Annual Report on Form 10-K for the fiscal year ended December 31, 2016. Actual results could differ materially from those projected in the forward-looking statements. The Company undertakes no obligation to update or revise publicly any forward-looking statements, whether as a result of new information, future events or otherwise, except as may be required by law. Forward Looking Statements
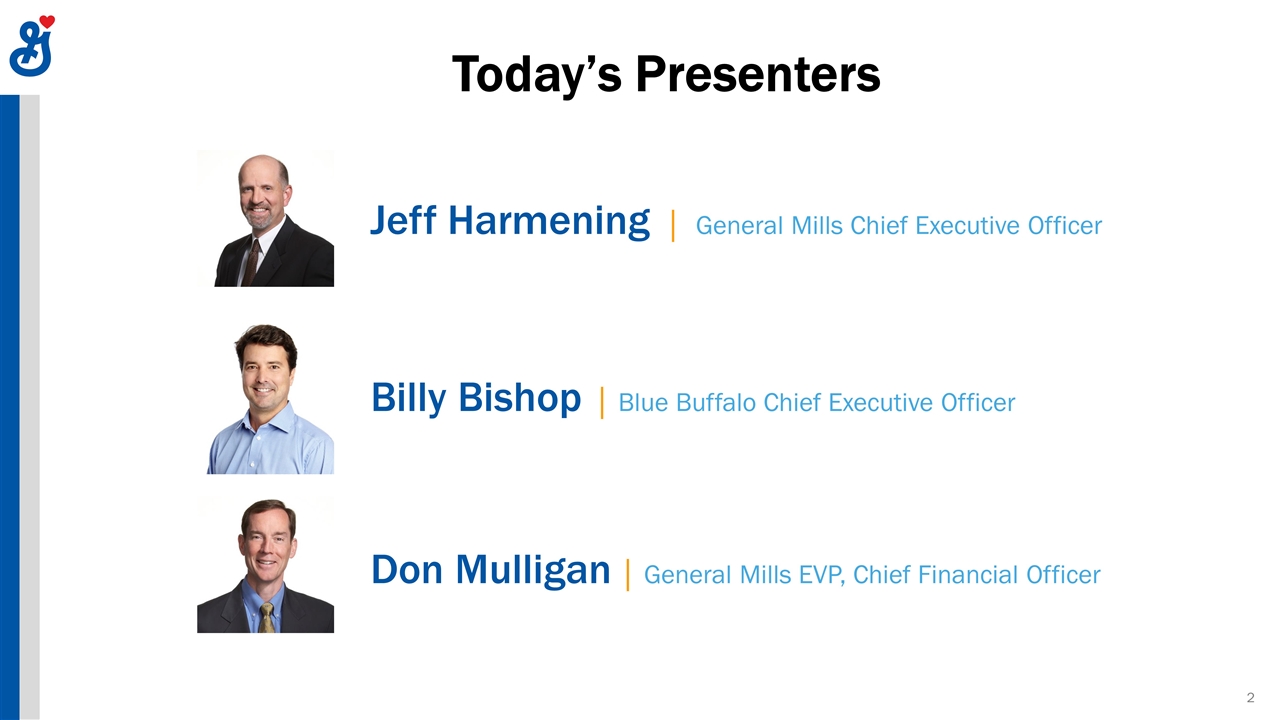
Today’s Presenters Jeff Harmening │ General Mills Chief Executive Officer Don Mulligan │ General Mills EVP, Chief Financial Officer Billy Bishop │ Blue Buffalo Chief Executive Officer
General Mills to Acquire Blue Buffalo All-cash Acquisition at $40.00 per Share (23% premium)(1) Enterprise Value of $8.0 Billion Blue Buffalo is the Leader in the Fast-growing Wholesome Natural Pet Food Category Scale & Profitability: $1,275 Million in Net Sales | 25% Adjusted EBITDA Margin(2) Strong Track Record: Three-year Net Sales CAGR of 12% and Adjusted EBITDA CAGR of 18%(3) Blue Buffalo Will Become a New Pet Operating Segment for General Mills Billy Bishop Will Lead the Pet Segment for General Mills General Mills Expects to Maintain Blue Buffalo HQ, Manufacturing and R&D Facilities Transaction Has Been Approved by Both Boards of Directors Invus and Bishop Family Shareholders, Representing More than 50% of Blue Buffalo’s Outstanding Shares, Have Approved the Transaction (1) Based on 60 day VWAP as of 2/22/2018 (2) Non-GAAP measure. See appendix for reconciliation. Reflects 2017 full year results (3) Non-GAAP measure. See appendix for reconciliation. Represents CAGR for the period from 2014 – 2017
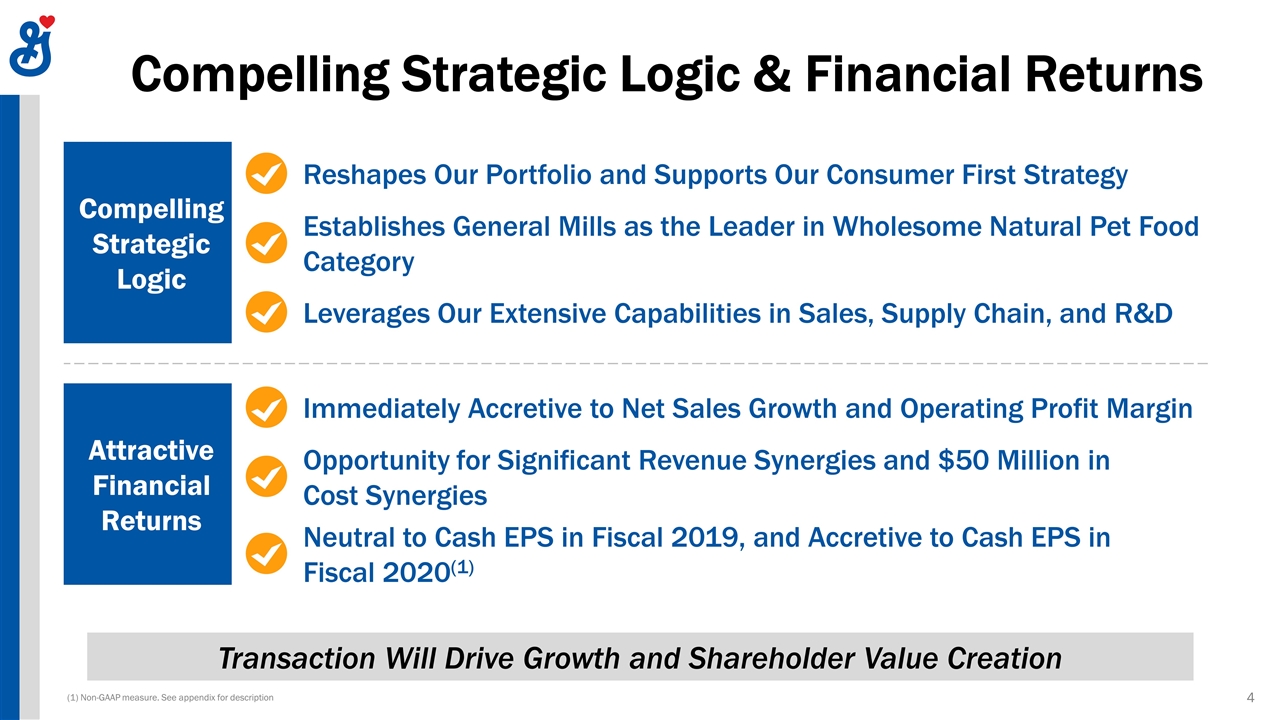
Compelling Strategic Logic & Financial Returns Transaction Will Drive Growth and Shareholder Value Creation Neutral to Cash EPS in Fiscal 2019, and Accretive to Cash EPS in Fiscal 2020(1) Immediately Accretive to Net Sales Growth and Operating Profit Margin Opportunity for Significant Revenue Synergies and $50 Million in Cost Synergies Reshapes Our Portfolio and Supports Our Consumer First Strategy Leverages Our Extensive Capabilities in Sales, Supply Chain, and R&D Establishes General Mills as the Leader in Wholesome Natural Pet Food Category Compelling Strategic Logic Attractive Financial Returns (1) Non-GAAP measure. See appendix for description
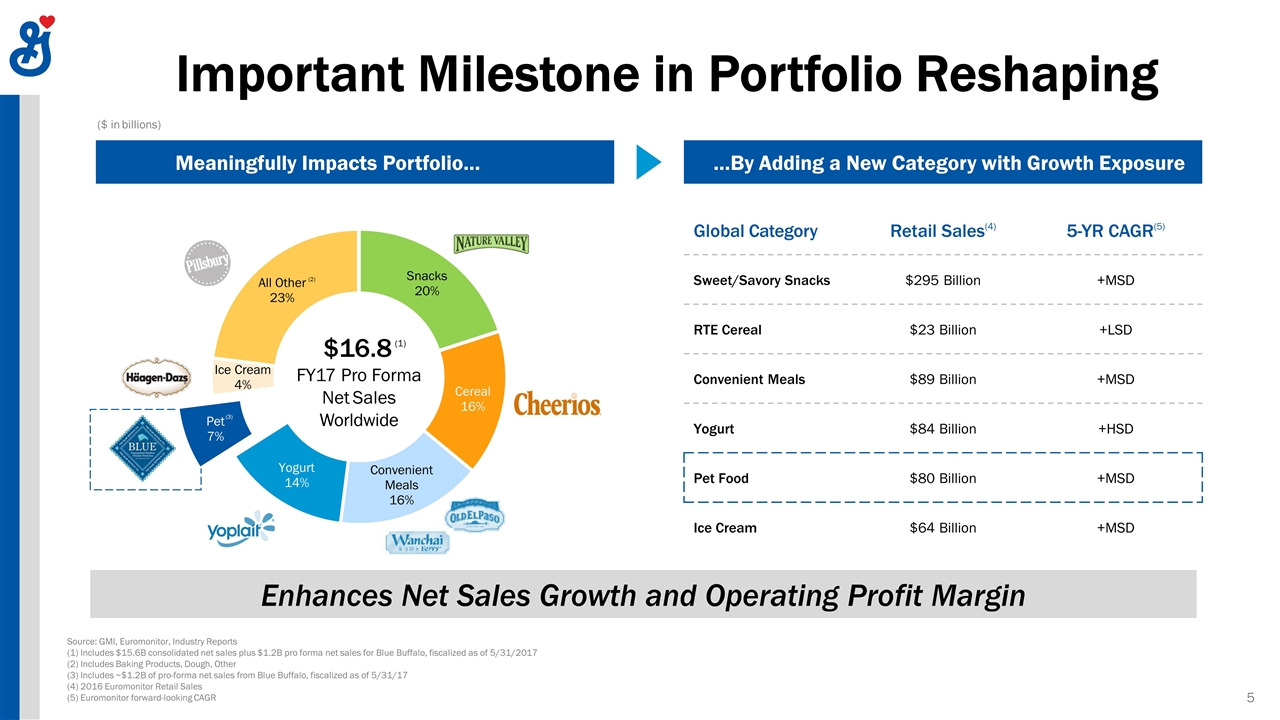
Important Milestone in Portfolio Reshaping Meaningfully Impacts Portfolio… …By Adding a New Category with Growth Exposure Source: GMI, Euromonitor, Industry Reports (1) Includes $15.6B consolidated net sales plus $1.2B pro forma net sales for Blue Buffalo, fiscalized as of 5/31/2017 (2) Includes Baking Products, Dough, Other (3) Includes ~$1.2B of pro-forma net sales from Blue Buffalo, fiscalized as of 5/31/17 (4) 2016 Euromonitor Retail Sales (5) Euromonitor forward-looking CAGR $16.8 (1) FY17 Pro Forma Net Sales Worldwide Global Category Retail Sales(4) 5-YR CAGR(5) Sweet/Savory Snacks $295 Billion +MSD RTE Cereal $23 Billion +LSD Convenient Meals $89 Billion +MSD Yogurt $84 Billion +HSD Pet Food $80 Billion +MSD Ice Cream $64 Billion +MSD ($ in billions) (3) (2) Enhances Net Sales Growth and Operating Profit Margin
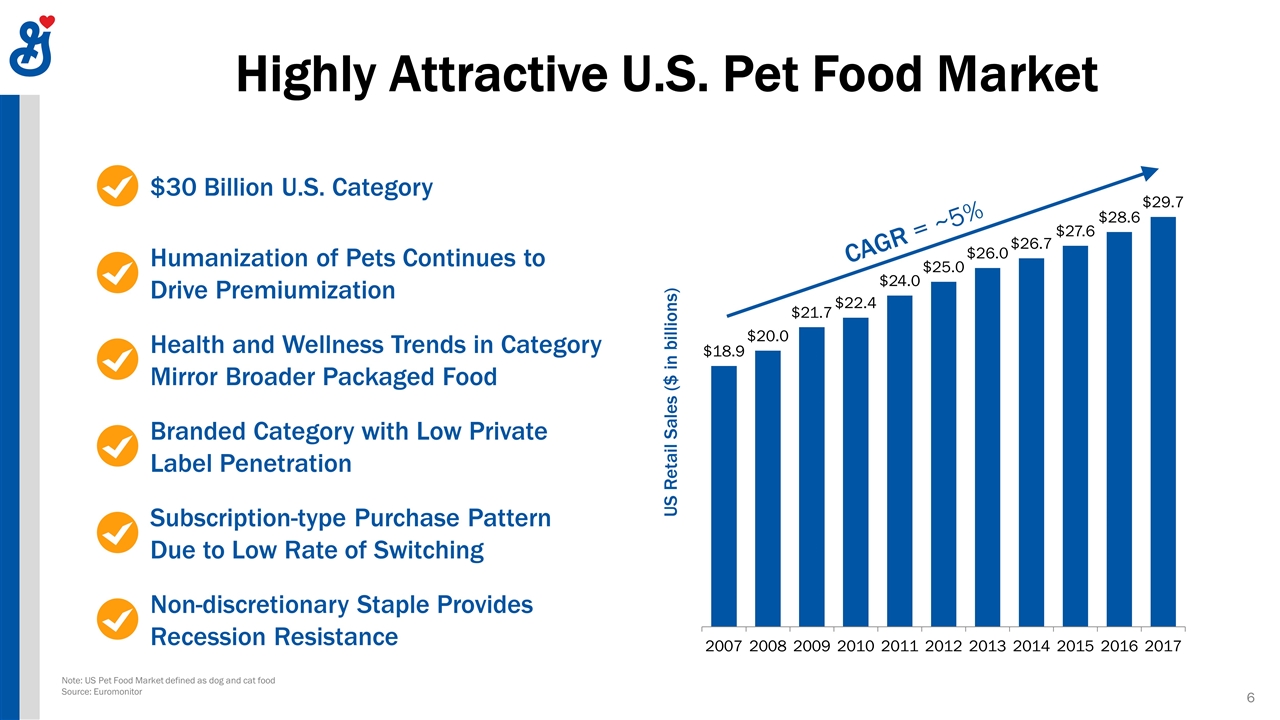
Highly Attractive U.S. Pet Food Market CAGR = ~5% $30 Billion U.S. Category US Retail Sales ($ in billions) Humanization of Pets Continues to Drive Premiumization Health and Wellness Trends in Category Mirror Broader Packaged Food Branded Category with Low Private Label Penetration Subscription-type Purchase Pattern Due to Low Rate of Switching Non-discretionary Staple Provides Recession Resistance Note: US Pet Food Market defined as dog and cat food Source: Euromonitor
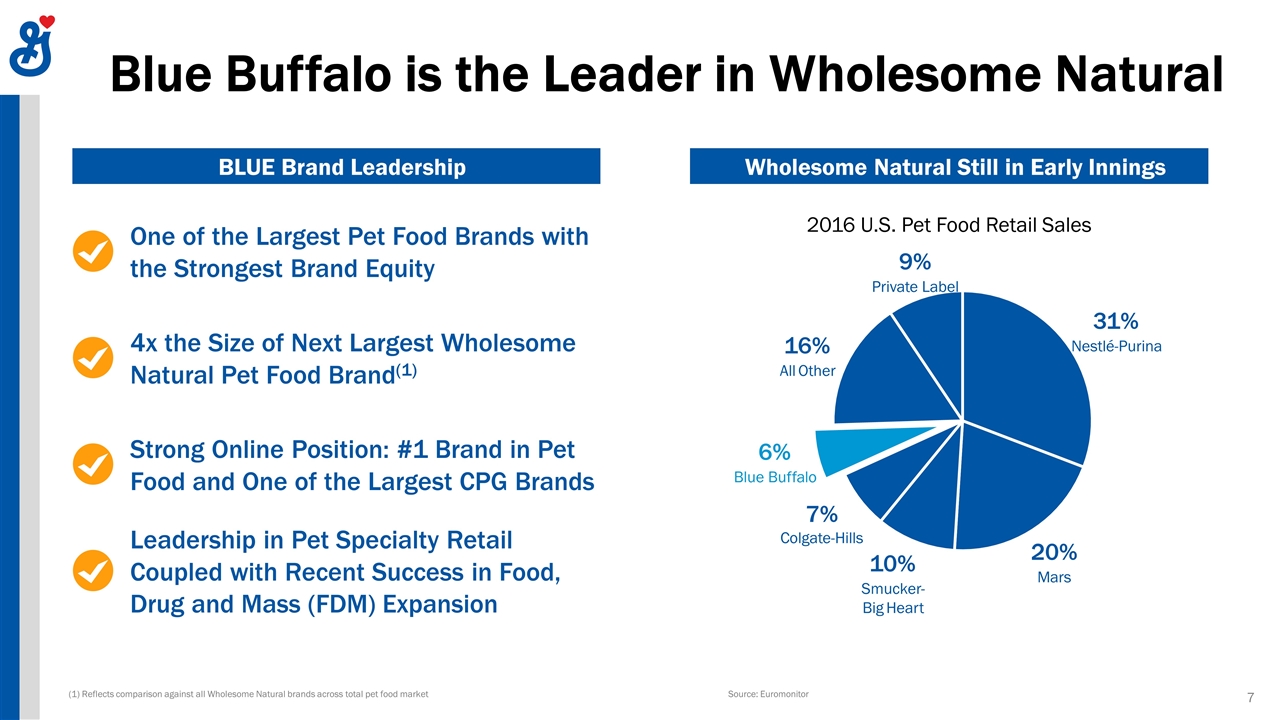
Blue Buffalo is the Leader in Wholesome Natural BLUE Brand Leadership Wholesome Natural Still in Early Innings 31% Nestlé-Purina 20% Mars 10% Smucker- Big Heart 7% Colgate-Hills 6% Blue Buffalo 16% All Other 9% Private Label 2016 U.S. Pet Food Retail Sales One of the Largest Pet Food Brands with the Strongest Brand Equity 4x the Size of Next Largest Wholesome Natural Pet Food Brand(1) Strong Online Position: #1 Brand in Pet Food and One of the Largest CPG Brands Leadership in Pet Specialty Retail Coupled with Recent Success in Food, Drug and Mass (FDM) Expansion Source: Euromonitor (1) Reflects comparison against all Wholesome Natural brands across total pet food market
The Authentic Brand Committed to Making Life Better for Pets Developed by Pet Parents for Pet Parents Dedicated to Consumer Education and Dialogue High Quality, Natural Ingredients Commitment to Pet Cancer Research and Awareness Love them like family. Feed them like family.®
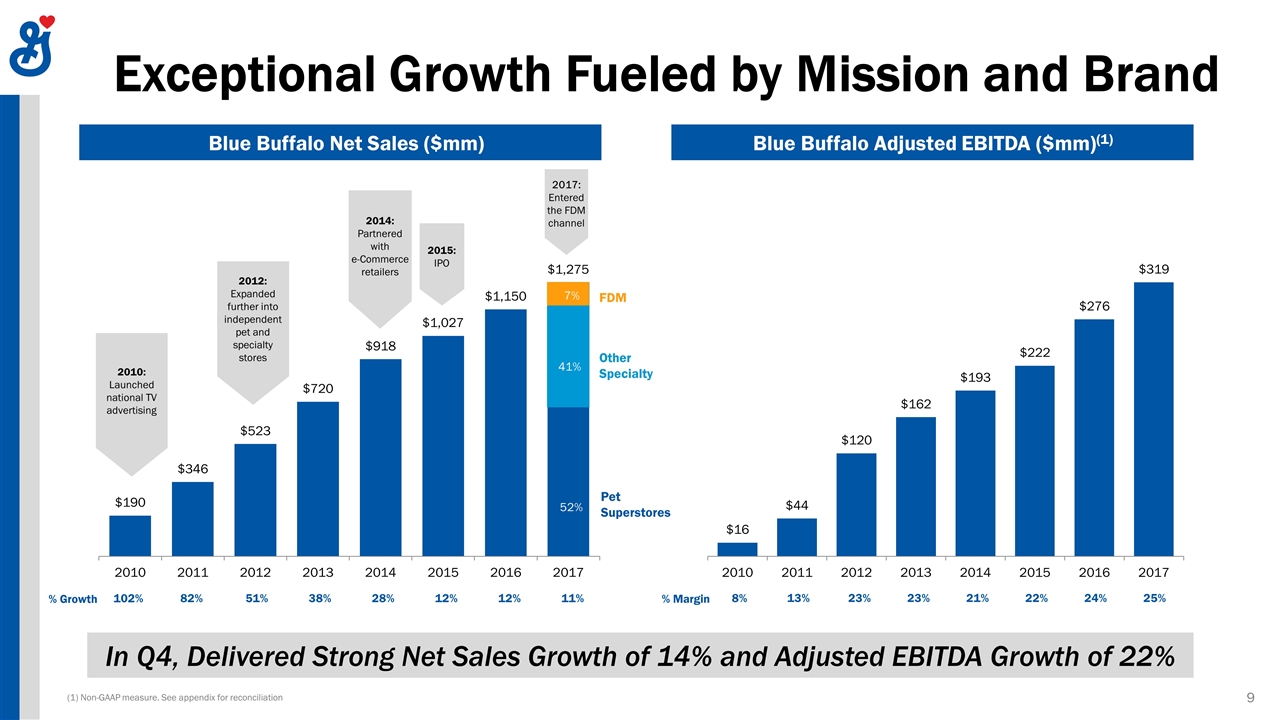
Exceptional Growth Fueled by Mission and Brand Blue Buffalo Net Sales ($mm) Blue Buffalo Adjusted EBITDA ($mm)(1) In Q4, Delivered Strong Net Sales Growth of 14% and Adjusted EBITDA Growth of 22% Pet Superstores 52% FDM Other Specialty 41% 7% 2017: Entered the FDM channel 2014: Partnered with e-Commerce retailers 2010: Launched national TV advertising 2012: Expanded further into independent pet and specialty stores 2015: IPO (1) Non-GAAP measure. See appendix for reconciliation 102% 82% 51% 38% 28% 12% 12% 11% % Growth 8% 13% 23% 23% 21% 22% 24% 25% % Margin
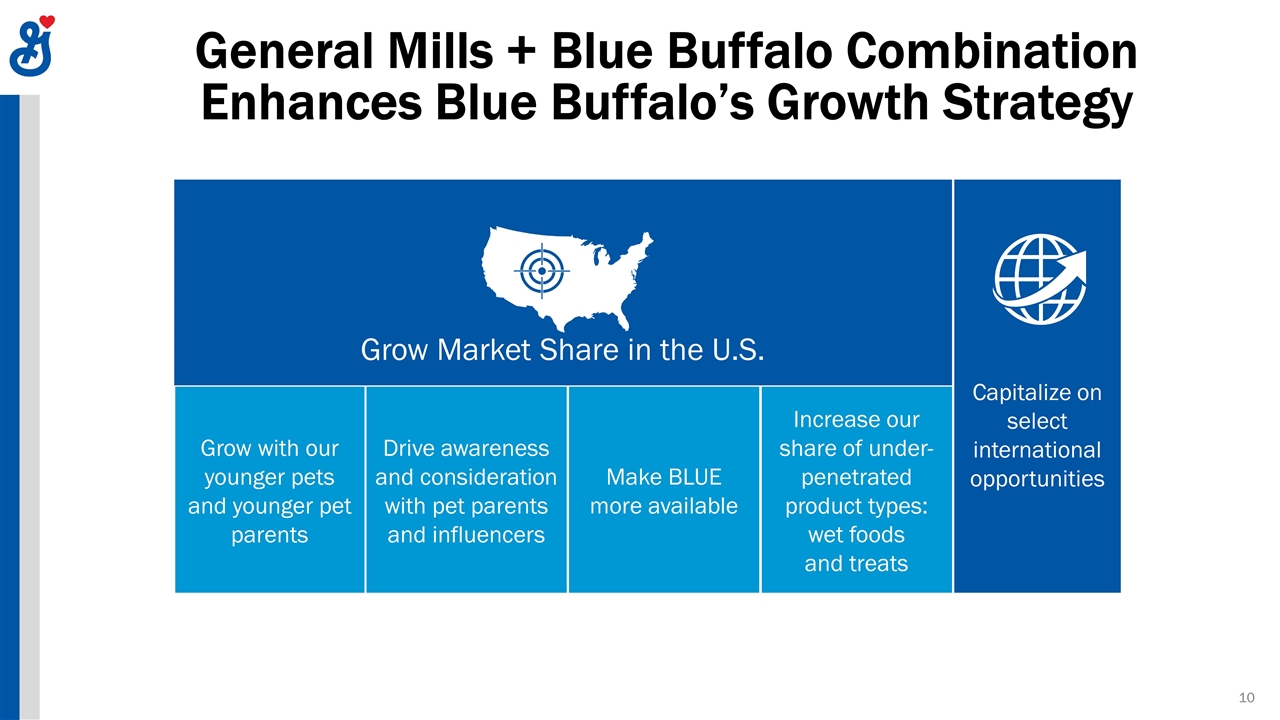
General Mills + Blue Buffalo Combination Enhances Blue Buffalo’s Growth Strategy Capitalize on select international opportunities Grow Market Share in the U.S. Grow with our younger pets and younger pet parents Drive awareness and consideration with pet parents and influencers Make BLUE more available Increase our share of under-penetrated product types: wet foods and treats
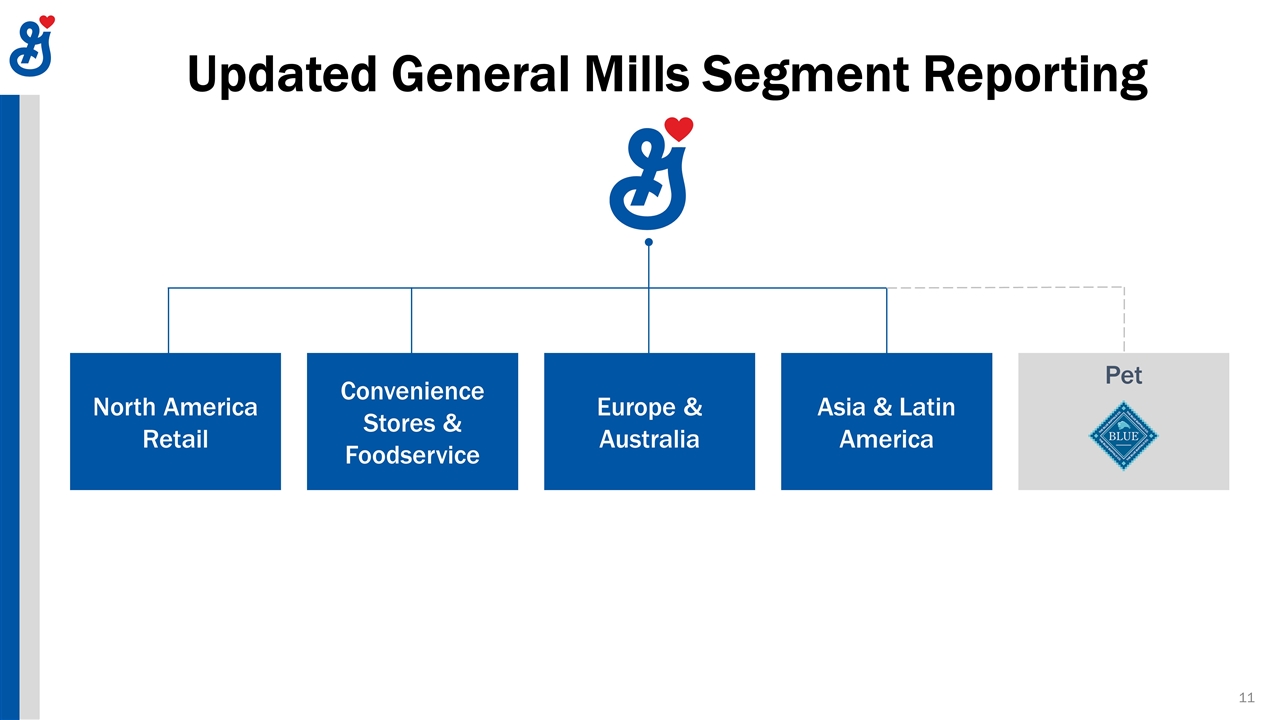
Updated General Mills Segment Reporting North America Retail Convenience Stores & Foodservice Europe & Australia Asia & Latin America Pet
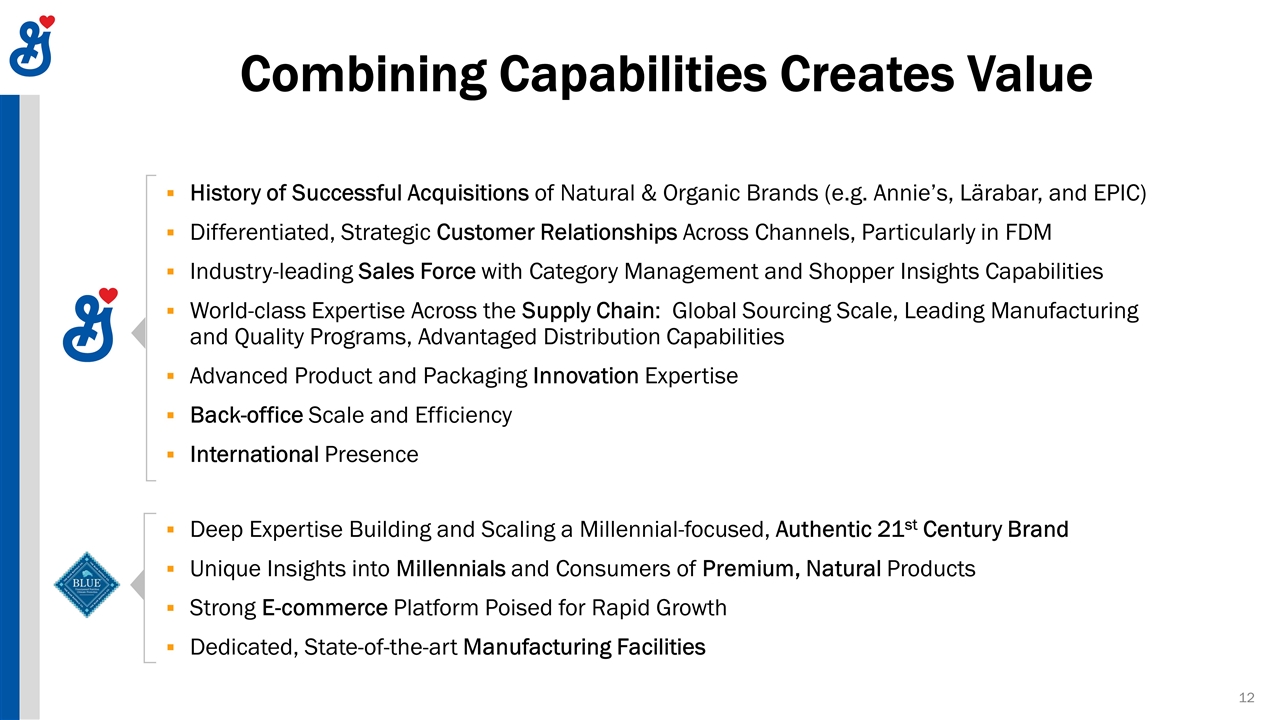
Combining Capabilities Creates Value Deep Expertise Building and Scaling a Millennial-focused, Authentic 21st Century Brand Unique Insights into Millennials and Consumers of Premium, Natural Products Strong E-commerce Platform Poised for Rapid Growth Dedicated, State-of-the-art Manufacturing Facilities History of Successful Acquisitions of Natural & Organic Brands (e.g. Annie’s, Lärabar, and EPIC) Differentiated, Strategic Customer Relationships Across Channels, Particularly in FDM Industry-leading Sales Force with Category Management and Shopper Insights Capabilities World-class Expertise Across the Supply Chain: Global Sourcing Scale, Leading Manufacturing and Quality Programs, Advantaged Distribution Capabilities Advanced Product and Packaging Innovation Expertise Back-office Scale and Efficiency International Presence
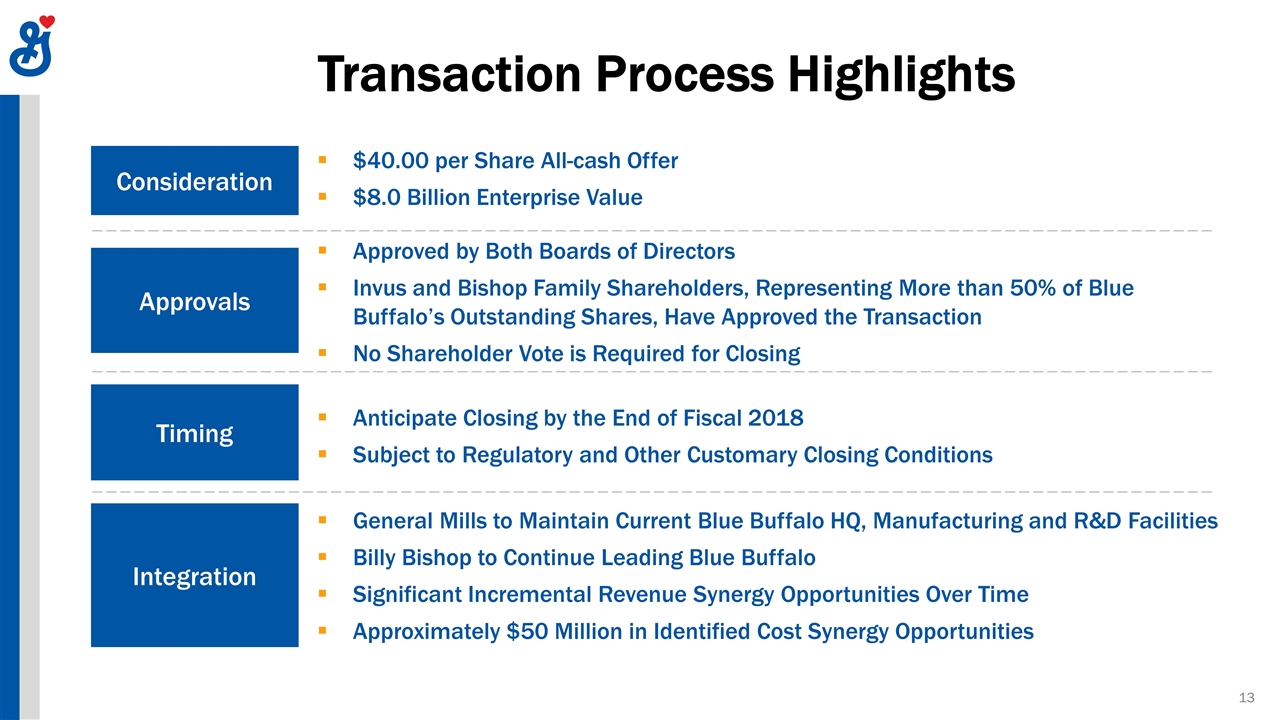
Transaction Process Highlights Approvals Consideration Timing $40.00 per Share All-cash Offer $8.0 Billion Enterprise Value Integration General Mills to Maintain Current Blue Buffalo HQ, Manufacturing and R&D Facilities Billy Bishop to Continue Leading Blue Buffalo Significant Incremental Revenue Synergy Opportunities Over Time Approximately $50 Million in Identified Cost Synergy Opportunities Approved by Both Boards of Directors Invus and Bishop Family Shareholders, Representing More than 50% of Blue Buffalo’s Outstanding Shares, Have Approved the Transaction No Shareholder Vote is Required for Closing Anticipate Closing by the End of Fiscal 2018 Subject to Regulatory and Other Customary Closing Conditions
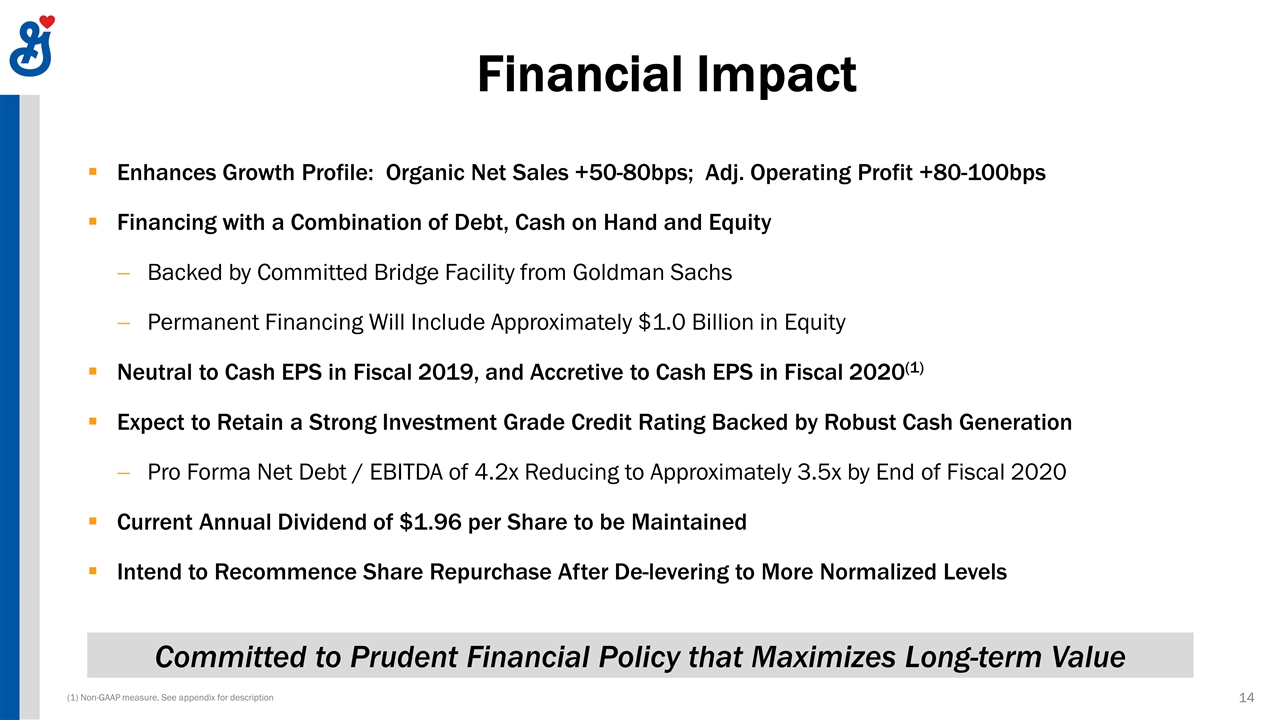
Financial Impact Enhances Growth Profile: Organic Net Sales +50-80bps; Adj. Operating Profit +80-100bps Financing with a Combination of Debt, Cash on Hand and Equity Backed by Committed Bridge Facility from Goldman Sachs Permanent Financing Will Include Approximately $1.0 Billion in Equity Neutral to Cash EPS in Fiscal 2019, and Accretive to Cash EPS in Fiscal 2020(1) Expect to Retain a Strong Investment Grade Credit Rating Backed by Robust Cash Generation Pro Forma Net Debt / EBITDA of 4.2x Reducing to Approximately 3.5x by End of Fiscal 2020 Current Annual Dividend of $1.96 per Share to be Maintained Intend to Recommence Share Repurchase After De-levering to More Normalized Levels Committed to Prudent Financial Policy that Maximizes Long-term Value (1) Non-GAAP measure. See appendix for description
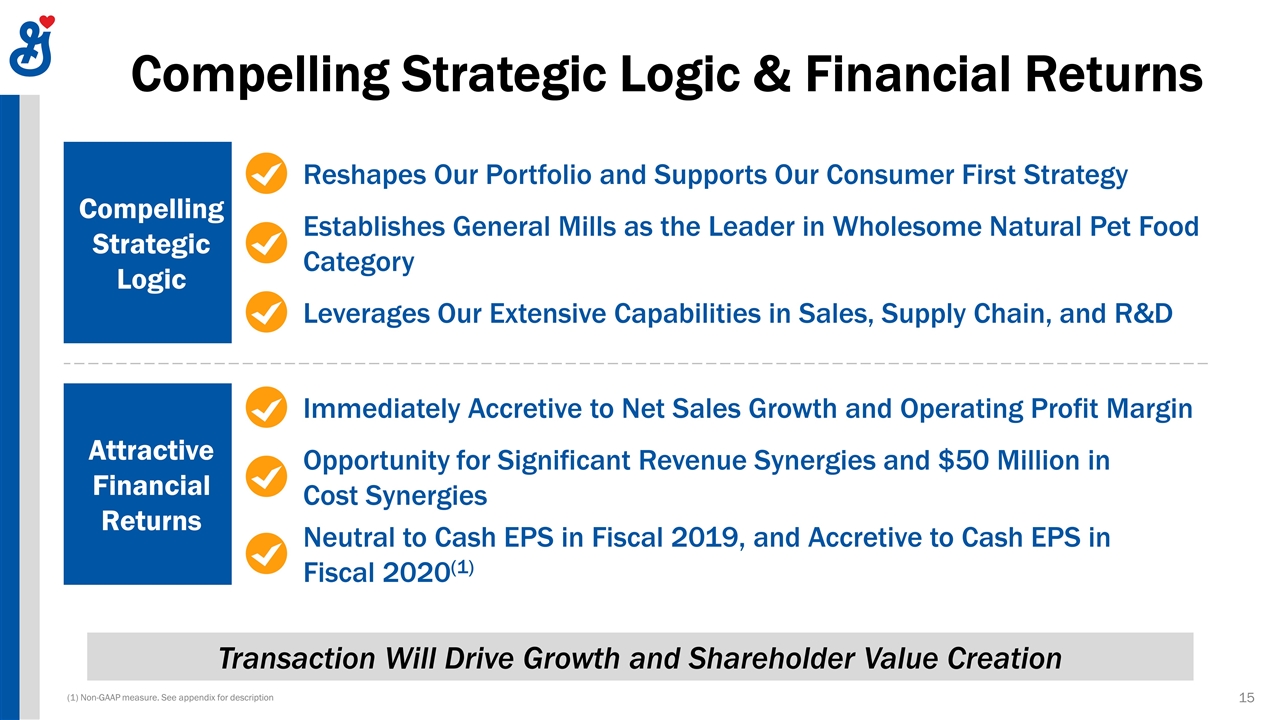
Compelling Strategic Logic & Financial Returns Transaction Will Drive Growth and Shareholder Value Creation Neutral to Cash EPS in Fiscal 2019, and Accretive to Cash EPS in Fiscal 2020(1) Immediately Accretive to Net Sales Growth and Operating Profit Margin Opportunity for Significant Revenue Synergies and $50 Million in Cost Synergies Reshapes Our Portfolio and Supports Our Consumer First Strategy Leverages Our Extensive Capabilities in Sales, Supply Chain, and R&D Establishes General Mills as the Leader in Wholesome Natural Pet Food Category Compelling Strategic Logic Attractive Financial Returns (1) Non-GAAP measure. See appendix for description
This presentation includes measures that are not defined by GAAP. For each of these non-GAAP financial measures, we have included on the following slides a reconciliation of the differences between the non-GAAP measure and the most directly comparable GAAP measure. These non-GAAP measures should be viewed in addition to, and not in lieu of, the comparable GAAP measure. This presentation also includes an outlook concerning future growth on a cash EPS basis. Cash EPS is a non-GAAP measure defined as pro-forma adjusted EPS which excludes the impacts of purchase accounting, transaction and integration costs, and other items affecting comparability. Non-GAAP Measures
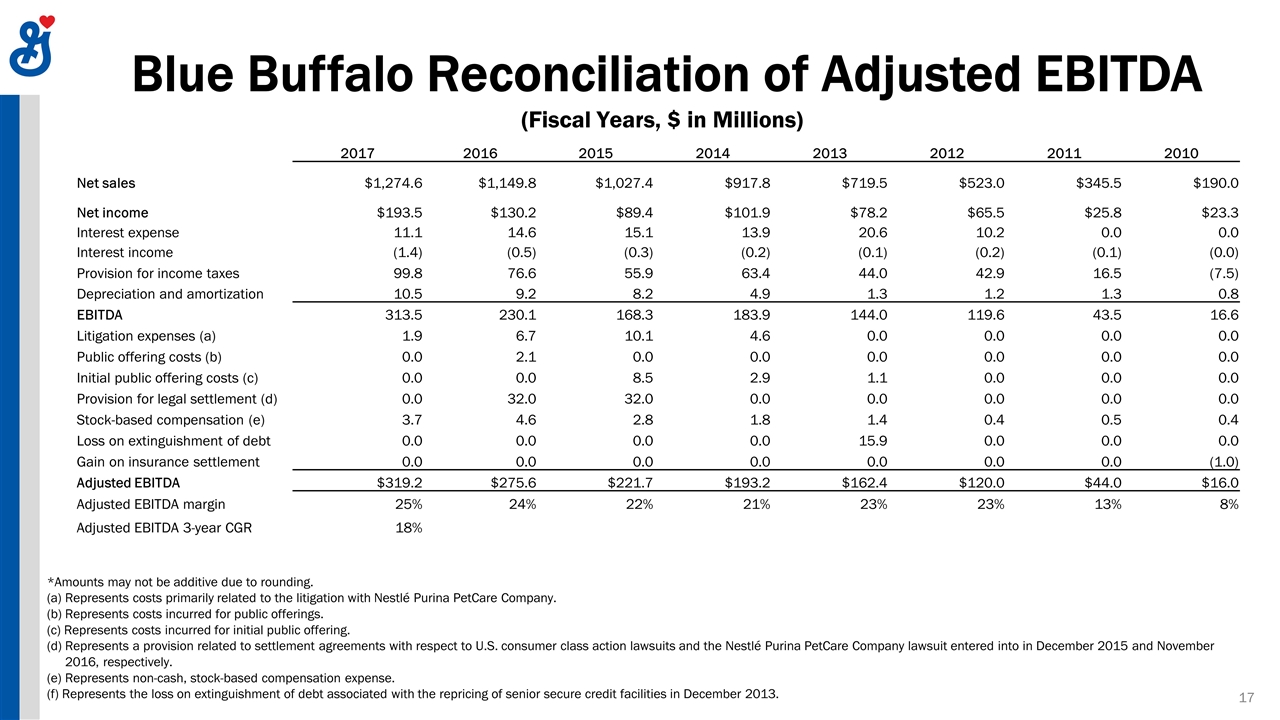
Blue Buffalo Reconciliation of Adjusted EBITDA 2017 2016 2015 2014 2013 2012 2011 2010 Net sales $1,274.6 $1,149.8 $1,027.4 $917.8 $719.5 $523.0 $345.5 $190.0 Net income $193.5 $130.2 $89.4 $101.9 $78.2 $65.5 $25.8 $23.3 Interest expense 11.1 14.6 15.1 13.9 20.6 10.2 0.0 0.0 Interest income (1.4) (0.5) (0.3) (0.2) (0.1) (0.2) (0.1) (0.0) Provision for income taxes 99.8 76.6 55.9 63.4 44.0 42.9 16.5 (7.5) Depreciation and amortization 10.5 9.2 8.2 4.9 1.3 1.2 1.3 0.8 EBITDA 313.5 230.1 168.3 183.9 144.0 119.6 43.5 16.6 Litigation expenses (a) 1.9 6.7 10.1 4.6 0.0 0.0 0.0 0.0 Public offering costs (b) 0.0 2.1 0.0 0.0 0.0 0.0 0.0 0.0 Initial public offering costs (c) 0.0 0.0 8.5 2.9 1.1 0.0 0.0 0.0 Provision for legal settlement (d) 0.0 32.0 32.0 0.0 0.0 0.0 0.0 0.0 Stock-based compensation (e) 3.7 4.6 2.8 1.8 1.4 0.4 0.5 0.4 Loss on extinguishment of debt 0.0 0.0 0.0 0.0 15.9 0.0 0.0 0.0 Gain on insurance settlement 0.0 0.0 0.0 0.0 0.0 0.0 0.0 (1.0) Adjusted EBITDA $319.2 $275.6 $221.7 $193.2 $162.4 $120.0 $44.0 $16.0 Adjusted EBITDA margin 25% 24% 22% 21% 23% 23% 13% 8% Adjusted EBITDA 3-year CGR 18% (Fiscal Years, $ in Millions) *Amounts may not be additive due to rounding. (a) Represents costs primarily related to the litigation with Nestlé Purina PetCare Company. (b) Represents costs incurred for public offerings. (c) Represents costs incurred for initial public offering. (d) Represents a provision related to settlement agreements with respect to U.S. consumer class action lawsuits and the Nestlé Purina PetCare Company lawsuit entered into in December 2015 and November 2016, respectively. (e) Represents non-cash, stock-based compensation expense. (f) Represents the loss on extinguishment of debt associated with the repricing of senior secure credit facilities in December 2013.
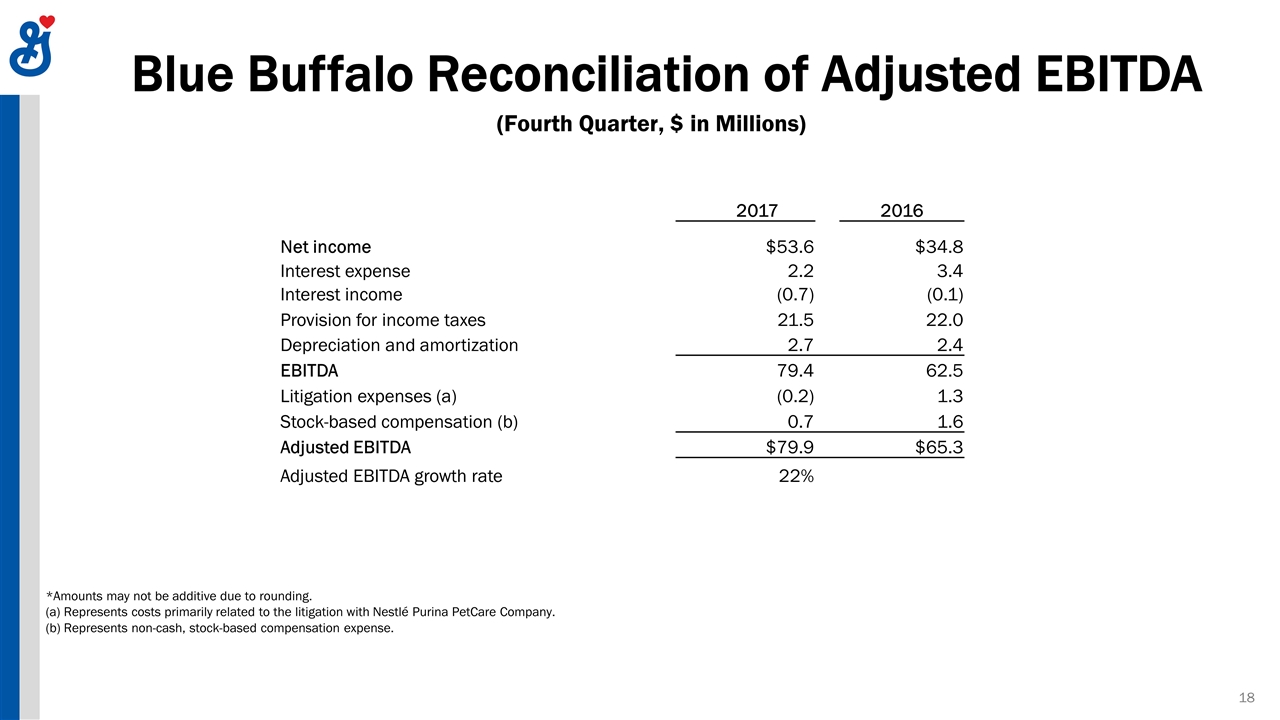
Blue Buffalo Reconciliation of Adjusted EBITDA 2017 2016 Net income $53.6 $34.8 Interest expense 2.2 3.4 Interest income (0.7) (0.1) Provision for income taxes 21.5 22.0 Depreciation and amortization 2.7 2.4 EBITDA 79.4 62.5 Litigation expenses (a) (0.2) 1.3 Stock-based compensation (b) 0.7 1.6 Adjusted EBITDA $79.9 $65.3 Adjusted EBITDA growth rate 22% (Fourth Quarter, $ in Millions) *Amounts may not be additive due to rounding. (a) Represents costs primarily related to the litigation with Nestlé Purina PetCare Company. (b) Represents non-cash, stock-based compensation expense.
