Attached files
| file | filename |
|---|---|
| EX-32.2 - EXHIBIT 32.2 - FLIR SYSTEMS INC | flir-12312017x10kxex322.htm |
| EX-32.1 - EXHIBIT 32.1 - FLIR SYSTEMS INC | flir-12312017x10kxex321.htm |
| EX-31.2 - EXHIBIT 31.2 - FLIR SYSTEMS INC | flir-12312017x10kxex312.htm |
| EX-31.1 - EXHIBIT 31.1 - FLIR SYSTEMS INC | flir-12312017x10kxex311.htm |
| EX-23.0 - EXHIBIT 23.0 KPMG CONSENT - FLIR SYSTEMS INC | flir-12312017x10kxex230.htm |
| EX-21.0 - EXHIBIT 21.0 SUBSIDIARIES - FLIR SYSTEMS INC | flir-12312017x10kex210.htm |
UNITED STATES
SECURITIES AND EXCHANGE COMMISSION
Washington, D.C. 20549
___________________________________________________
FORM 10-K
(Mark one)
ý | ANNUAL REPORT PURSUANT TO SECTION 13 OR 15(d) OF THE SECURITIES EXCHANGE ACT OF 1934 |
For the fiscal year ended December 31, 2017. | |
OR
¨ | TRANSITION REPORT PURSUANT TO SECTION 13 OR 15(d) OF THE SECURITIES EXCHANGE ACT OF 1934 |
For the transition period from to | |
Commission file number: 0-21918
_________________________________________________________________
FLIR Systems, Inc.
(Exact name of registrant as specified in its charter)
Oregon | 93-0708501 | |
(State or other jurisdiction of incorporation or organization) | (I.R.S. Employer Identification No.) | |
27700 SW Parkway Avenue, Wilsonville, Oregon | 97070 | |
(Address of principal executive offices) | (Zip code) | |
Registrant’s telephone number, including area code: (503) 498-3547
Securities registered pursuant to Section 12(b) of the Act:
Title of Each Class | Name of Each Exchange on Which Registered | |
Common Stock, $0.01 par value | NASDAQ Global Select Market | |
Securities registered pursuant to Section 12(g) of the Act: None
________________________________________________________________
Indicate by check mark if the registrant is a well-known seasoned issuer, as defined in Rule 405 of the Securities Act. Yes x No ¨
Indicate by check mark if the registrant is not required to file reports pursuant to Section 13 or Section 15(d) of the Act. Yes ¨ No x
Indicate by check mark whether the registrant (1) has filed all reports required to be filed by Section 13 or 15(d) of the Securities Exchange Act of 1934 during the preceding 12 months (or for such shorter period that the registrant was required to file such reports), and (2) has been subject to such filing requirements for the past 90 days. Yes x No ¨
Indicate by check mark whether the registrant has submitted electronically and posted on its corporate Web site, if any, every Interactive Data File required to be submitted and posted pursuant to Rule 405 of Regulation S-T (§229.405 of this chapter) during the preceding 12 months (or for such shorter period that the registrant was required to submit and post such files). Yes x No ¨
Indicate by check mark if disclosure of delinquent filers pursuant to Item 405 of Regulation S-K is not contained herein, and will not be contained, to the best of registrant’s knowledge, in definitive proxy or information statements incorporated by reference in Part III of this Form 10-K or amendment to this Form 10-K. ¨
Indicate by checkmark whether the registrant is a large accelerated filer, an accelerated filer, a non-accelerated filer or a smaller reporting company. See the definitions of “large accelerated filer,” “accelerated filer” and “smaller reporting company” in Rule 12b-2 of the Exchange Act. (Check one)
Large accelerated filer x | Accelerated filer ¨ |
Non-accelerated filer ¨ | Smaller reporting company ¨ |
Indicate by check mark whether the registrant is a shell company (as defined in Rule 12b-2 of the Act). Yes ¨ No x
As of June 30, 2017, the aggregate market value of the shares of voting and non-voting stock of the registrant held by non-affiliates was $4,711,497,291.
As of February 16, 2018, there were 138,919,705 shares of the registrant’s common stock, $0.01 par value, outstanding.
DOCUMENTS INCORPORATED BY REFERENCE:
The registrant has incorporated by reference into Part III of this Form 10-K, portions of its Proxy Statement for its 2018 Annual Meeting of Shareholders.
FLIR Systems, Inc.
FORM 10-K
ANNUAL REPORT
TABLE OF CONTENTS
PART I | ||
Item 1 | ||
Item 1A | ||
Item 1B | ||
Item 2 | ||
Item 3 | ||
Item 4 | ||
PART II | ||
Item 5 | ||
Item 6 | ||
Item 7 | ||
Item 7A | ||
Item 8 | ||
Item 9 | ||
Item 9A | ||
Item 9B | ||
PART III | ||
Item 10 | ||
Item 11 | ||
Item 12 | ||
Item 13 | ||
Item 14 | ||
PART IV | ||
Item 15 | ||
Item 16 | ||
Forward-Looking Statements
This Annual Report on Form 10-K (the “Report”), including “Management’s Discussion and Analysis of Financial Condition and Results of Operations” in Item 7 contains forward-looking statements within the meaning of the Private Securities Litigation Reform Act of 1995 regarding future events and the future results of FLIR Systems, Inc. and its consolidated subsidiaries (“FLIR” or the “Company”) that are based on management’s current expectations, estimates, projections and assumptions about the Company’s business. Words such as “expects,” “anticipates,” “intends,” “plans,” “believes,” “sees,” “estimates” and variations of such words and similar expressions are intended to identify such forward-looking statements. These statements are not guarantees of future performance and involve risks, uncertainties and assumptions that are difficult to predict. Therefore, actual outcomes and results may differ materially from what is expressed or forecasted in such forward-looking statements due to numerous factors including, but not limited to, those discussed in “Risk Factors” in Item 1A, “Management’s Discussion and Analysis of Financial Condition and Results of Operations” in Item 7, and elsewhere in this Report as well as those discussed from time to time in the Company’s other Securities and Exchange Commission filings and reports. In addition, such statements could be affected by general industry, economic and market conditions. Such forward-looking statements speak only as of the date of this Report or, in the case of any document incorporated by reference, the date of that document, and the Company does not undertake any obligation to update any forward-looking statement to reflect events or circumstances after the date of this Report, or for changes made to this document by wire services or Internet service providers. If the Company updates or corrects one or more forward-looking statements, investors and others should not conclude that the Company will make additional updates or corrections with respect to other forward-looking statements.
PART I
ITEM 1. | BUSINESS |
GENERAL
FLIR Systems, Inc. (“FLIR,” the “Company,” “we,” “us,” or “our”) is a world leader in developing technologies that enhance perception and awareness. We design, develop, market, and distribute solutions that detect people, objects and substances that may not be perceived by human senses and improve the way people interact with the world around them. We bring these innovative technologies - which include thermal imaging systems, visible-light imaging systems, locater systems, measurement and diagnostic systems, and advanced threat-detection solutions - into daily life.
Founded in 1978, FLIR is a pioneer in advanced sensors and integrated sensor systems that enable the gathering, measurement, and analysis of critical information through a wide variety of applications in commercial, industrial, government, and consumer markets worldwide. We offer the broadest range of infrared, also known as thermal, imaging solutions in the world, with products that range from consumer-use thermal camera smartphone accessories to highly advanced aircraft-mounted imaging systems for military and search and rescue applications, with products in between serving a multitude of markets, customers, and applications. As the cost of thermal imaging technology has declined, our opportunities to increase the adoption of thermal technology and create new markets for the technology have expanded. In order to better serve the customers in these markets, we have augmented our thermal product offerings with complementary sensing technologies, such as visible imaging, radar, laser, sonar, chemical sensing, and environmental sensing technologies.
Our goal is to both enable our customers to benefit from the valuable information produced by advanced sensing technologies and to deliver sustained superior financial performance for our shareholders. We create value for our customers by improving personal and public safety and security, providing advanced intelligence, surveillance, reconnaissance, and tactical defense capabilities, facilitating air, ground, and maritime-based situational awareness, enhancing enjoyment of the outdoors, detecting electrical, mechanical and building envelope problems, displaying process irregularities, detecting volatile organic gas emissions, and a variety of other uses of thermal and other sensing technologies.
Our business model and range of solutions allow FLIR to sell products to various end markets, including industrial, original equipment manufacturing ("OEM"), military, homeland security, enterprise, infrastructure, environmental, and consumer. We sell off-the-shelf products in configurations to suit specific customer requirements in an efficient, timely, and affordable manner, and support those customers with training and ongoing support and services. Centered on the design of products for low-cost manufacturing and high-volume distribution, our commercial operating model has been developed over time and provides us with
1
a unique ability to adapt to market changes and meet our customers’ needs. Because we aggregate product demand and production across these markets, we are able to generate significant volume - this volume drives down cost, which then increases demand, enabling a virtuous cycle of lower prices and higher unit volumes. Our manufacturing and supply processes are vertically integrated, minimizing lead times, facilitating prompt delivery, controlling costs and ensuring that components satisfy our high quality standards.
We have evolved our product suite over time, expanding our reach into markets that are adjacent to thermal imaging, with the intent of expanding the adoption and channel development for thermal imaging technology. Examples of this evolution include our entrance into the visible-image security and surveillance market, the maritime electronics market, the industrial machine vision market, and the traffic monitoring and signal control market. We intend to continue this evolution as we continue to lower the cost of advanced sensing products. As the cost to own thermal technology continues to decline, the application of these sensors is expanding beyond imaging to areas such as data acquisition where thermal sensors can provide important data that can be used for a wide variety of applications.
We believe that FLIR's brand is known for quality, innovation and trust and that customers are drawn to us for products and solutions that are effective, innovative, easy to use, and sold at competitive market prices. We intend to: continue to reduce the cost of thermal technology through higher volumes and new product and process improvements; innovate new applications and form-factors for our technology based on customer feedback; improve the customer experience through improved user-interface, ease-of-use, and software; increase customer loyalty and trust by providing world-class product warranties and support; and improve operational processes to realign resources to be nimble in response to customers’ needs and market trends.
Through December 31, 2017, our business was organized into six operating segments: Surveillance, Instruments, Security, OEM & Emerging Markets, Maritime and Detection. In August 2017, we announced a realignment of our business into three principle business units: Government and Defense, Industrial, and Commercial. For the purposes of this report, all business descriptions and financial results are based upon our reporting structure as of December 31, 2017.
As of December 31, 2017, we were organized into the following six operating segments:
Surveillance: The Surveillance segment provides enhanced imaging and recognition solutions under our commercially developed, military qualified ("CDMQ") model to a wide variety of military, law enforcement, public safety, and other government customers around the world for the protection of borders, troops, and public welfare. Surveillance also develops hand-held and weapon-mounted thermal imaging systems for use by consumers. These products are sold off-the-shelf or can be customized for specific applications and range in price from under $1,000 for certain hand-held and weapon-mounted systems to over $1 million for our most advanced stabilized multi-spectral targeting systems. Revenue from Surveillance was $545.8 million in 2017, which represented approximately 30 percent of consolidated revenue.
Instruments: The Instruments segment provides devices that image, measure, and assess thermal energy, gases, electricity, and other environmental elements for industrial, commercial, and scientific applications under the FLIR and Extech brands. These tools are used by professionals in electrical and mechanical, building envelope, manufacturing plant facility maintenance, petrochemical, utilities, HVAC/R, firefighting, safety and health, and a variety of other sectors. Revenue from Instruments was $357.8 million in 2017, which represented approximately 20 percent of consolidated revenue.
Security: The Security segment develops and manufactures a wide spectrum of cameras and video recording systems for use in commercial, critical infrastructure, and home monitoring applications. The segment sells products under the FLIR and Lorex brands. Revenue from Security was $231.5 million in 2017, which represented approximately 13 percent of consolidated revenue. On February 6, 2018, we completed the sale of Lorex and our consumer and small and medium-sized visible-spectrum security products business. This sale is expected to enable us to focus the Security segment on critical infrastructure and enterprise segments of the broader security market. See Note 21, "Subsequent Events," to the Consolidated Financial Statements in Item 8 for additional information.
OEM & Emerging Markets: The OEM & Emerging Markets segment provides thermal and visible-spectrum imaging camera cores and components that are utilized by third parties to create thermal, industrial, and other types of imaging systems. This segment also houses our emerging businesses, including intelligent traffic systems, imaging solutions for the smartphone and mobile devices market, and thermal imaging solutions for commercial-use unmanned aerial systems ("UAS"). Revenue from OEM & Emerging Markets was $347.2 million in 2017, which represented approximately 19 percent of consolidated revenue.
2
Maritime: The Maritime segment develops and manufactures electronics and imaging instruments for the recreational and commercial maritime market under the FLIR and Raymarine brands. The segment provides boats of all sizes, a full suite of electronic instruments, control systems, and communications equipment. Revenue from Maritime was $189.7 million in 2017, which represented approximately 11 percent of consolidated revenue.
Detection: The Detection segment offers sensors, instruments, and integrated platform solutions for the detection, identification, and suppression of chemical, biological, radiological, nuclear, and explosives ("CBRNE") threats for military force protection, homeland security, first responders, and commercial applications. Detection has strengths in understanding the nature of sophisticated security threats, the technological potential of advanced detection instruments and systems, and the complex procurement processes of United States and many international government customers. Revenue from Detection was $128.5 million in 2017, which represented 7 percent of consolidated revenue.
For additional information concerning the Company’s segments, including revenues from external customers, earnings from operations, and total assets by segment presented in accordance with our segment structure, see Note 17 to the Consolidated Financial Statements in Item 8.
Our headquarters are located at 27700 SW Parkway Avenue, Wilsonville, Oregon, 97070, and the telephone number at this location is (503) 498-3547. Information about the Company is available on our website at www.flir.com.
TECHNOLOGY AND CAPABILITIES
Infrared is a portion of the electromagnetic spectrum that is adjacent to the visible spectrum but is invisible to the human eye due to its longer wavelengths. Unlike visible light, infrared radiation (or heat) is emitted directly by all objects above absolute zero in temperature. Thermal imaging systems detect this infrared radiation and convert it into an electronic signal, which is then processed into a video signal and displayed on a video screen. Thermal sensors provide several benefits over ubiquitous visible light-based sensing technologies, including the ability to see in complete darkness, measure temperature remotely and without touching the surface of the object, image through obscurants such as smoke and fog, detect and discriminate living beings in an efficient and reliable way, see over long distances with minimal atmospheric interference, and image many types of otherwise invisible gases. For these reasons we feel the potential of our core technology to grow in prevalence and importance is significant, particularly as the cost to produce the technology continues to decline.
Thermal imaging systems are different than other types of “low light” night vision systems, such as visible light intensification systems used in green or gray sighted night vision goggles, because thermal imaging systems are not adversely affected by the presence of visible light, so they can be used day or night and are not susceptible to rapid changes in visible light levels. Thermal imaging systems are particularly well-suited for security applications involving the early detection of human activity due to the typically large temperature difference found between a human and the surrounding background. Since infrared systems are detecting emitted infrared radiation, they are passive - and thus more covert than certain “active” or “illuminated” infrared systems. Additionally, thermal imaging systems have the ability to measure absolute temperatures remotely, a critical feature for a variety of commercial, industrial, and scientific applications.
An infrared detector, which collects or absorbs infrared radiation and converts it into an electronic signal, is the primary component of thermal imaging systems. The two types of infrared detectors we manufacture and use in our systems are often referred to as “cooled” and “uncooled” detectors. Cooled detectors utilize a mechanical sterling cycle micro-cooler to reduce the operating temperature of the infrared sensor to approximately -200°C. These detectors offer very high sensitivity and spatial resolution for long-range applications or those applications requiring high measurement precision. Cooled detectors, while more sensitive and thus able to see farther, result in a product that is more expensive, heavier, more complex, and uses more power than those using uncooled detectors. Uncooled detectors operate at room temperature and do not require a micro-cooler, resulting in products that are lighter, use less power and are less expensive to produce than those using cooled detectors. The cost of both types of detectors is declining, and we expect to continue reducing costs as volumes rise and the technology advances.
We have expertise in the calibration and repair of our products, and maintain service facilities at many locations worldwide. Each of our service facilities have the capability to perform the complex calibrations required to service thermal imaging systems. We also maintain field service capabilities under the direction of our independent representatives or distributors in certain locations outside the United States.
3
As our customers have sought, and will continue to seek, new ways to address their needs and requirements in the most cost-effective and efficient manner, we have integrated thermal imaging with complementary technologies such as visible imaging, lasers, radar, and more. The following capabilities and disciplines are integrated into our business and processes:
System Design and Integration
We have developed extensive competencies in the design and integration of numerous capabilities and payloads into integrated systems or sub-systems. Competencies such as stabilization, packaging and systems integration allow us to effectively combine a wide variety of technologies and payloads to suit our customers’ needs. We strive to minimize the size, weight, power consumption, and cost in each of our product designs.
Radiometry
Our ability to produce thermal imaging systems that can accurately measure temperature remotely is critical in many of our Instruments segment markets. We have demonstrated know-how in designing and producing systems that can measure temperature to within very precise tolerances while maintaining accuracy and stability over time and over a wide range of ambient temperatures. We believe our skills in this area, known as thermal radiometry, offer an important competitive advantage over many of our competitors.
Mechanical Engineering
The design and production of thermal imaging systems involves highly sophisticated mechanical engineering techniques, particularly in the design and assembly of the supporting structures for system components such as detector arrays, micro-coolers, and optics. We also have expertise in designing stabilized assemblies used in our gimbal-mounted products utilizing precise electro-mechanical control, gyroscopes, electronic stabilization, and specialized optical control mechanisms. Also, through our 2016 acquisition of Prox Dynamics, we develop and manufacture nano-class UAS that are specifically designed to be man-portable and highly covert surveillance and reconnaissance sensors.
Infrared Detector Design Manufacturing
We design and manufacture both cooled and uncooled infrared detector arrays, in high volumes and at low costs. We believe our uncooled vanadium oxide microbolometers and cooled detectors using indium antimonide and indium gallium arsenide are among the highest performing infrared detectors of their type available in the world. Internal design and manufacturing of these detectors provides significant cost and engineering advantages compared with the use of external sources.
Integrated Circuits and Electronic Design
We have significant electronic design capabilities across several specialized areas, including readout-integrated circuit design, signal processing, image processing, and electronics integration. Our design expertise lies in the areas of reliability, low power consumption, and extreme environmental survivability.
Software Development
Software is an increasingly important aspect of our overall engineering and design activity. We offer networking capabilities, video analytics, command and control, and advanced firmware in our camera and other sensing systems. Many of our products are supported by a software eco-system that includes dedicated desktop and mobile platform applications. Our products are typically developed with broad compatibility with common industry standards and protocols.
Optical Design, Fabrication and Coating
We design and manufacture sophisticated infrared optics using materials such as silicon, germanium, and zinc selenide that are required to produce a thermal imaging system. This capability allows us to rapidly develop optics optimized for use with our cameras and avoid costs and delays associated with reliance on third-party optics suppliers. We also have the capability to produce silicon wafer-level micro-optics at high volumes and the ability to apply custom multi-layer, vapor-deposited coatings to improve the transmission of the lens materials that are used in infrared systems.
4
Micro-Coolers
We manufacture some of the industry’s smallest, lightest, and lowest power micro-coolers for use in cooling infrared detectors. Our coolers are especially effective in hand-held applications, where light weight and long battery life are essential.
Lasers and Laser Components
Many of our more sophisticated systems are increasingly being offered with various types of laser payloads, including pointers, illuminators, rangefinders, and designators. We design and manufacture purpose-built laser rangefinders and designators for inclusion in some of our gimbaled multi-sensor systems. We also manufacture certain laser-related materials and components for external customers.
Tactical Platforms
We develop and manufacture comprehensive and integrated solutions for surveillance, assessment, and response. These platform solutions draw from our Surveillance and Detection products, as well as products sourced outside of the Company. These unmanned and manned networkable mobile and vehicle mounted systems can be deployed in nearly any environment and have provided security at borders, at theme parks, for police and military forces, at national monuments, and at high-profile events, both in the United States and internationally.
RESEARCH & DEVELOPMENT
Our success has been, and will continue to be, substantially affected by our ability to innovate new products and technologies that both augment our existing offerings and create new avenues for growth. We strive to differentiate ourselves from our competition with our research and development ("R&D") capabilities. Our internally funded R&D expenses were $170.7 million, $147.5 million, and $132.9 million in 2017, 2016 and 2015, respectively. We intend to continue to have significant internal R&D expenses in the future to provide a continuing flow of innovative and high-quality products to maintain and enhance our competitive position in each of our business segments. In addition to these internally funded activities, we engage in R&D projects that were reimbursed by government agencies or prime contractors pursuant to development contracts we undertook. We believe our R&D capabilities are most efficiently deployed in a commercial environment, where we are free to innovate to meet market and customer needs, as such, the amount of externally funded R&D work that we undertake has been declining.
COMPETITIVE STRENGTHS
With our decades of experience in developing and marketing infrared sensor products, we have built several unique competitive advantages that are core to our success. We look to leverage these strengths to continue to increase the availability of and uses for advanced sensing technologies and to grow our revenue and profitability:
Commercial Operating Model
A key differentiator of our business model is our commercial approach to technology investment and product strategy. This is characterized by our commercial approach to R&D as described above, as well as our focus on global deployment, innovative marketing communications, superior customer service, rapid product development cycles, innovation of new technologies and unique products, ability to design for large-volume and low-cost production, and control of multiple production inputs through our vertically integrated operations.
Vertically Integrated Manufacturing and Supply
We have built a vertically integrated manufacturing operation that provides control over several key component technologies. Through acquisitions and internal development, we have created this internal supply network that allows for optimized manufacturing throughput, rapid response to changes in customer demand, increased product design flexibility, enhanced product reliability, and independence in designing key components. Further, this integrated approach enables us to lower costs and improve the functionality of critical components so that they work together most efficiently within our products. In comparison to competitors that do not possess a similar level of vertical integration, our model helps us deliver products in a more timely and cost-effective manner as we rely less on third-party suppliers for critical components.
5
Industry-Leading Market Position
We are a leading developer of advanced, proprietary sensor systems that are highly reliable, accurate, and effective. We strive to develop products that lead in the areas of Size, Weight, Power and Cost ("SWAP-c"). We believe we have achieved significant penetration into many markets, including the government, industrial, commercial, and consumer markets by pioneering new applications and being a "first-mover" in these markets. Having a leading position in the markets we serve allows us to secure new and continuing business while also achieving manufacturing economies of scale. Increased unit volumes work to reduce costs throughout our business, which allows us to create new products that feature lower price points. This creates a virtuous cycle whereby we are able to make advanced sensor technologies more affordable to a wide array of end-users while reducing costs. This established presence across multiple markets enhances our competitive position.
Broad Product Lines
We offer a wide array of sensor products, including infrared imaging cameras and systems, detector cores, visible-light cameras, CBRNE threat detectors, test and measurement instruments, radars, maritime electronics, and related products and solutions. Our customers can buy these products off the shelf or request a customized sensor solution. This ability to serve a variety of customers with disparate needs and specifications allows us to be successful in facilitating the use of advanced sensors in a broad range of applications. We have the ability to rapidly conceive, design, prototype, and manufacture new products to meet the evolving landscapes of the markets we serve. Our development process incorporates significant customer satisfaction and field-use data and results in the rapid creation of new features that are able to address the changing needs of the end-user. This continual evolution of our products has proven successful through our high level of customer retention and revenue and income growth.
Internally Funded Innovation
We have expertise in developing sensing instruments that are both highly advanced from a technical standpoint and commercially viable and salable across multiple types of customers. Since the beginning of 2013, we have invested $741.6 million in internally funded research and development of new technologies and products. Utilizing our own funds for R&D provides us with full ownership of the development process and the end product, and also focuses our R&D teams on projects that will result in products that are commercially viable, yield the highest expected financial return and can be marketed to multiple markets for multiple applications.
Diverse Customer Base
We sell our products to thousands of commercial and government customers for use in a variety of applications and markets worldwide. The buyers and users of our products include United States and foreign governments and government agencies, aerospace and defense contractors, electricians and tradesmen, commercial seaports, first responders, critical infrastructure operators, electrical generation and gas processing plants, heating and air conditioning technicians, building inspectors, food processors, automobile parts manufacturers, commercial and residential security providers, research and lab technicians, manufacturing companies, recreational boaters, and general commercial consumers. We believe that the diversity of our customers, end-user markets, and applications helps to mitigate fluctuations in demand from any particular customer or market. The diversity of our customers and of the end-users of sensor technologies provides us with multiple long-term growth opportunities.
Global Distribution Capabilities
Our core infrared imaging products have expanded from high-end products sold primarily to military customers and niche research firms to everyday tools providing valuable information-gathering and assessment capabilities for a multitude of industrial, government, and commercial entities and consumers. With the widening adoption of these technologies, distribution has become a key advantage to our business globally. We believe our sales and distribution organization is among the largest in the industry and effectively covers the world with a combination of direct sales, third-party representatives and distributors, independent dealers, retail outlets, application engineers, and service and training centers. Internationally, we have invested heavily to build a strong presence to sell and service our products, a key advantage in penetrating certain markets, such as foreign governments. Our sales representatives, including third-party distributors, undergo a comprehensive training program on each product’s technical specifications, functions, and applications. We also continuously update our training programs to incorporate technological and competitive shifts and changes. We sell in many distinct markets and have established specific sales channels for each market. We intend to continue to expand this distribution platform through internal growth and external acquisitions.
6
Investment in Research and Development and Intellectual Property Platform
We have invested heavily in R&D, resulting in industry-leading innovations and a robust and growing patent portfolio that is focused on our core technologies as well as many of our emerging technologies and businesses. To complement our patent portfolio, we continue to strengthen our key brands by unifying critical design features across product lines, enhancing our worldwide trademark coverage, refining our domain portfolio, and growing brand awareness through social media outlets.
Consistent Generation and Distribution of Cash Flows
Our earnings, combined with our modest capital expenditure requirements, result in the generation of significant free cash flows. In the years ended December 31, 2017 and 2016, our net cash provided by operating activities was $308.3 million and $319.8 million, respectively. Our operating cash flows have exceeded our net earnings in each of the last five years. This ability to consistently convert revenues into net operating cash provides us significant flexibility in making growth and capital deployment decisions, such as consummating strategic acquisitions, undertaking new product and technology development initiatives, expanding our distribution and marketing presence, making capital investments, paying dividends, and repurchasing shares of our common stock in the open market. Since 2013, we have utilized approximately $531.5 million of cash for acquisitions, $490.6 million for share repurchases, $317.8 million for dividends, and $259.4 million for capital expenditures. Since we began paying dividends in 2011, we have annually increased our dividend at a compound annual growth rate of approximately 16 percent.
STRATEGY
Our clear and consistent strategy has enabled strong and steady business performance while allowing expansion into areas of growth. We look to build on our leading position in advanced sensor systems by leveraging our key competitive strengths through a focused corporate strategy that will yield growth in both revenue and profitability. Key elements of the FLIR growth strategy include:
Control the corners
We seek to have strong positions in both the entry-level and high-performance price points in each market we serve. We believe this will provide us with the ability to innovate solutions throughout the full solution spectrum of each market and sell products for the broadest customer base in the market. We believe this approach has created a significant competitive advantage for many of our businesses. Our focus will remain on continuous cost reduction of sensor technology, innovative next-generation solutions for evolving customer needs, and creating virtuous cycles of demand across all of our markets.
Lower costs, increase awareness
We strive to aggressively lower the cost and increase awareness of thermal sensor technology to enable our approach to high-volume markets. The price and awareness of thermal technology have been and continue to be the barriers to broad adoption. By increasing the awareness of thermal imaging, through thoughtful and impactful marketing and solution design, we believe our customers will recognize the benefits of thermal sensing and, as prices decline, recognize the value proposition of infrared technology.
Identify needs
We consistently look to identify customers' needs that can be solved by our capabilities. When we identify such a market need, we invest in research, distribution, product development, and staffing to create the best product solution and most efficient go-to-market strategy. This has allowed us to pioneer several new markets for thermal imaging. Our experience in finding and building these new markets has allowed us to create a repeatable system for continuing to expand the uses and demand for advanced sensor-based technologies.
Brand, distribution, and innovation
We intend to grow the size and our share of the markets we participate in as well as develop markets for our technology that do not currently exist through a strong brand, broad distribution, and highly innovative products and solutions. We invest in brand development to support our goal of being the top brand in thermal sensing, and intend to expand our brand power into new arenas. We have developed and utilize both our own distribution infrastructure and that of hundreds of partners, resulting in a diverse,
7
efficient, and effective platform for selling and delivering our products. We also leverage a strong innovation engine, built from a talented and driven employee base and a willingness to invest in high-return opportunities, to create valuable intellectual property and cutting-edge products.
Build trust
We believe trust is our most valuable asset. We focus on building trust with stakeholders - including current and future customers, shareholders, employees, and our communities. We build that trust by operating on an uncompromising foundation of ethical behavior and producing products that deliver a differentiated value proposition to our customers. We also build trust by maintaining an effective and open line of communication with our employees, stakeholders, and community members.
Financial discipline
We intend to continue to operate with financial discipline in order to create value for our stakeholders. We believe that the cornerstones to financial discipline are revenue and profit growth. We are focused on growing our top-line revenues and converting that to profits for bottom-line growth. We also intend to focus on continuous improvement through creating process efficiencies, building operational scale, and utilizing robust financial controls. We believe that these factors will ultimately generate superior long-term returns on investment for our shareholders.
BUSINESS SEGMENTS
Surveillance Segment
The Surveillance segment develops and manufactures enhanced imaging and situational awareness solutions for a wide variety of military, law enforcement, public safety, and other government entities around the world. The segment also develops and sells hand-held and mounted scopes for consumers in the hunting and outdoors markets. Our solutions are used to protect borders, surveil a scene, conduct search and rescue missions, gather intelligence, and protect critical infrastructure by providing the capability to see over long distances, day or night, through adverse weather conditions, through many obscurants, and from a wide variety of vehicle, man-portable, and fixed-installation platforms.
Surveillance infrared imaging systems typically employ cooled infrared detector and numerous other imaging technologies to identify and track objects from long distances and at high resolution. The Surveillance segment also utilizes uncooled thermal technology to enable markets where size, weight, power consumption, and cost are important considerations. Uncooled Surveillance segment products include hand-held and tripod-mount monoculars and binoculars, weapon sights, man-portable UAS, and military-vehicle vision systems. We also design and manufacture lasers and laser components, such as rangefinders, illuminators, and target markers.
Our customers require systems that operate in demanding environments such as extreme climatic conditions, battlefield and military environments, or maritime conditions. Systems are often installed onto larger platforms and must be able to integrate with other systems such as aircraft avionics, radars, remote weapon systems, laser systems, command and control centers, and large, broad-based security networks.
We address our core markets through either a commercial, off-the-shelf ("COTS") model or CDMQ model. The products we develop under the COTS model are applicable to a range of commercial and government customers and markets, including military applications. CDMQ products are specifically designed to meet military specifications. In both the COTS and CDMQ product development models, we use internally generated funds for research and development, and we generally own all rights to the products and their design.
Markets
Search and rescue
Thermal imaging systems are used in airborne, shipborne, and land-based missions to rescue individuals in danger, distress, or who are wounded or lost in adverse conditions. These systems are in use today by organizations such as the United States Army, United States Air Force, United States Coast Guard, United States Marine Corps, United States Air National Guard, and many international customers.
8
Force protection
In instances where military or other personnel are deployed in hostile areas, thermal imaging systems and radars mounted on towers or other platforms are deployed to detect, identify, and defeat potential threats at an early stage. Our systems are deployed for this purpose by the United States Army, United States Marine Corps, and other organizations worldwide.
Border and maritime patrol
Our systems are used in airborne, shipborne, hand-held and fixed-installation applications for border and maritime surveillance, particularly at night, to enforce borders and monitor coastal waters, to support national fishing boundaries and to prevent smuggling. Our cameras are currently deployed along numerous borders worldwide, including in the United States, Europe, and the Middle East.
Surveillance and reconnaissance
High-definition thermal imaging systems are used in surveillance and reconnaissance applications for the precise positioning of objects or people from substantial distances and for enhanced situational awareness, particularly at night or in conditions of reduced or obscured visibility. We also offer high-resolution, frequency-modulated, continuous-wave radars that enable wide-area surveillance capable of detecting potential threats before they cross a perimeter. These systems can be installed on fixed platforms, manned-mobile platforms, and UAS. With our acquisition of Prox Dynamics in 2016, we develop and sell nano-class UAS solutions that are highly portable and rapidly deployable real-time imaging solutions.
Airborne law enforcement
We are a leader in the supply of stabilized airborne thermal imaging systems for federal, state, and local law enforcement agencies. This type of equipment gives those agencies the ability to track suspects, locate lost persons, and provide situational awareness to officers on the ground.
Targeting
We offer several products that provide precise target location and designation capabilities in applications ranging from man-portable devices to high-definition, multi-spectral, stabilized airborne laser designator systems.
Drug interdiction
Thermal imaging systems enable government agencies to expand their drug interdiction and support activities by allowing 24/7 wide-area surveillance and detection capabilities. Our systems are in use by the United States Customs Service, United States Drug Enforcement Agency and United States Federal Bureau of Investigation, as well as by similar foreign government agencies.
Personal vision
We develop easy to use, affordable, and lightweight personal vision thermal and image-intensified cameras, such as monoculars and hunting scopes, that provide people the ability to see at night and stay safe in various settings. They enhance people’s enjoyment of the outdoors by enabling them to keep track of their camping party, see and track animals, and navigate during deteriorated weather conditions. We believe the personal vision systems market is very large and is becoming increasingly accessible as we reduce the price of advanced thermal imaging products.
Sales and Distribution
Our Surveillance business has a direct sales staff and a network of independent representatives and distributors covering major government markets worldwide. Included in this organization are technical and customer support staff in the United States, Europe, the Middle East, and Asia Pacific regions who provide application development, technical training, and operational assistance to direct and indirect sales personnel as well as to customers.
The Surveillance segment typically has the highest backlog of our segments relative to revenue and in absolute terms. At December 31, 2017, the Surveillance segment had a total backlog of $354 million. Backlog represents orders that have been received for products, contract research and development, or other services for which a contractual agreement is in place and delivery or performance is expected to occur within 12 months.
Customers
Surveillance segment customers generally consist of United States and foreign government agencies, including civilian, military, paramilitary, and police forces, as well as defense contractors and aircraft manufacturers. A substantial portion of Surveillance segment consolidated revenue is derived from sales to United States and foreign government agencies, and our business will
9
continue to be substantially dependent upon such sales. We expect revenue outside the United States to continue to account for a significant portion of our Surveillance segment's revenue. The Surveillance segment is susceptible to some seasonality in its orders primarily based on the United States government budget year end. The result is that the third quarter tends to exhibit the largest amount of orders for our Surveillance segment. However, fiscal policy trends, increased revenue from outside the United States, budget delays, and general economic trends can overshadow this seasonality in any given year.
Competition
The Surveillance segment operates in a highly competitive market. Many of our competitors in the government sector are well-established contractors for various governments and have more financial and other resources than we possess. The principal competitive factors in the government markets include technical innovation, agency relationships, product quality and reliability, price, and ability to deliver. We believe we compete successfully in these markets with our best-in-class technologies, our products’ abilities to outperform customer requirements and competitors’ products, our lower-priced solutions that result from our CDMQ operating model, and our service and support functions that exist in the field and near the customer. Our current principal competitors in the Surveillance markets include divisions of BAE Systems, DRS (a Finmeccanica company), Elbit Systems, General Dynamics, L-3 Communications, Lockheed Martin, Raytheon, Sagem, Sofradir, and Thales.
Instruments Segment
The Instruments segment develops hand-held, fixed mount, and desktop imaging and measurement products. Thermal imaging camera products detect and measure heat and surface temperature differences, offering high accuracy, sophisticated diagnostic functionality, and a product range that spans a wide price spectrum. The Instruments segment's thermal cameras and related products are utilized by a growing number of industrial plant professionals, residential construction and contracting firms, energy production workers, manufacturing equipment and production line technicians, tradesmen, and homeowners.
The Instruments segment offers a broad range of cooled and uncooled thermal products, with thermal cameras for laboratory and research and development applications; optical gas imagers for oil, power, and chemical production applications; highly ruggedized cameras for firefighters that are used for fire attack, overhaul, and search-and-rescue operations; fixed and pan-tilt thermal cameras for factory line automation and plant safety monitoring; and multiple lines of professional and mid-level thermal cameras for building analysis, predictive maintenance, and electrical systems analysis.
Under our FLIR and Extech brands, the Instruments segment provides a comprehensive line of rugged and reliable test and measurement instruments, such as moisture meters, electrical test clamp meters, power analyzers, and multi-functional meters. These measurement instruments are used to evaluate electrical and environmental factors, including voltage, sound, light, heat index, and water quality. Leveraging our low-cost thermal sensors, we augment and enhance these familiar tools used in many industrial and commercial trades with Infrared Guided Measurement ("IGM"). IGM allows users to more efficiently address issues by first discovering via a thermal image the precise area of over-heating, moisture damage, or air ingress, allowing them to then apply the relevant sensor, such as voltage, current, spot temperature, or moisture probe, at the point of concern.
Markets
Building and HVAC/R
Thermal imaging cameras are increasingly used by building and home inspectors, roofing specialists, plumbers, general contractors, and real estate firms to evaluate and measure the integrity of buildings by quickly revealing structural problems, such as air leaks and missing insulation, to help ensure efficient use of energy and other resources. Heating, ventilation, air conditioning, and refrigeration ("HVAC/R") and mechanical contractors use thermal cameras and test and measurement equipment to ensure comfort in residences and workplaces by discovering, monitoring, and documenting airflow, leaks, and temperatures in ductwork and other forms of heating/cooling distribution systems. Hand-held test and measurement tools are used to measure airflow, humidity, carbon monoxide levels, light, sound, and other environmental factors.
Electrical
Electricians and mechanical technicians utilize thermal cameras and test and measurement equipment to quickly conduct electrical diagnostics, such as identifying circuit overloads, finding loose wire connections, and measuring currents, all without having to touch dangerous components. From overheating electrical circuits to corroded connections, thermal cameras and test meters provide the diagnostic functions needed to verify correct installations, quickly trace the source of problems, and enable efficient electrical
10
systems. Hand-held test and measurement tools are used to measure currents, voltage, resistance, continuity, and other electrical parameters.
Predictive maintenance
Thermal imaging systems are used for monitoring the condition of mechanical and electrical equipment. Such monitoring enables factory and plant maintenance technicians to quickly reveal equipment faults, manifested as hot or cold spots, so they can be repaired before they fail. This increases equipment productivity and avoids catastrophic failures or major damage, which reduces operating expenses by lowering repair costs and reducing downtime. Improved functionality of image analysis software, smaller size and weight, and simplicity of system operation are critical factors for this well-established market segment. Hand-held test and measurement tools are used to measure airflow, humidity, carbon monoxide levels, sound, vibration and other environmental factors.
Firefighting
Thermal imaging is a well-known technology in the firefighting market, with firefighters and first responders worldwide utilizing thermal imaging cameras for protecting their own life and saving the lives of others. Thermal imaging technology allows first responders to assess conditions of a space prior to and after entry by providing them the ability to see through most forms of smoke. This also allows them to search for people and animals and identify fire hot spots in burning buildings or smoke filled environments. Providing the ability to measure temperatures in a non-contact mode from a safe distance helps firefighters to protect themselves against dangerous phenomena like roll-overs and flash-overs.
Research and science
High-end thermal imaging systems provide the unique ability to detect very small differences in temperature. This capability is useful in industrial R&D, where developers study, see, and quantify the heat dissipation, stress tolerance, and thermal characteristics of their materials, components, and products. At colleges and universities, instructors use thermal imagery to help students visualize the theories of heat transfer and thermodynamics, improving student comprehension of key concepts, and for both fundamental and applied research. In the defense sector, cooled thermal imaging cameras are used in the development of firearms, ammunition, guided missiles, and aircraft.
Oil and gas production
Thermal imaging cameras can visualize and pinpoint certain gas leaks. In industrial, utility, and oil and gas refinery settings, optical gas imagers visually reveal plumes of gases such as SF6 (Sulfur Hexafluoride), hydrocarbons, carbon monoxide and carbon dioxide from a safe distance. Optical gas imaging cameras can continuously scan installations in remote areas or in zones that are difficult to access. Continuous monitoring allows the user to be informed when a dangerous or costly gas leak appears. Typical examples are monitoring pipelines, petrochemical industry and offshore operations.
Manufacturing process control
Temperature consistency is critical to the quality of many manufactured components, materials, and products, including metals, plastics, paper, and glass. Thermal cameras, both fixed and mobile, help factories ensure product quality and identify other defects in both products and in the manufacturing process itself through the continuous monitoring of the production line, resulting in higher output and nearly perfect quality control. Other users of thermal cameras in the manufacturing sectors include worker safety and fire prevention, analysis of welding and fastening effectiveness, food inspection, packaging quality, and electronic and mechanical component manufacturing, ranging in size from small hybrid integrated circuits to jet engines.
Sales and Distribution
Our Instruments business has a direct sales staff and a network of distributors and retailers covering major markets worldwide, including technical and customer support staff in the United States and internationally who provide application development, technical training, and operational assistance to direct and indirect sales personnel as well as to customers. Dedicated staffs of business development managers for the firefighting, science, optical gas imaging and automation markets assist the distribution channel with application development, technical training, and operational assistance. With a focused sales organization and specialized sales teams that serve the specific R&D market, we have been successful at building and leveraging strong relationships with various research institutes and universities worldwide.
At December 31, 2017, the Instruments segment had a total backlog of $30 million. Backlog represents orders that have been received for products or services for which a contractual agreement is in place and delivery or performance is expected to occur within 12 months.
11
Customers
Instruments segment customers are found around the world in commercial, government, trades, educational, research, agricultural, and non-professional/consumer segments. They include utility companies, electrical contractors, building inspectors, damage restoration contractors, first responders, universities, and numerous commercial enterprises. Given the high-value nature of many of our thermography-related instruments, our thermography products’ revenues tend to be correlated with seasonal trends, in particular capital spending trends. In general, customers in markets like predictive maintenance and R&D are sensitive to the broad economy because our cameras are viewed as capital expenditure items. We expect revenue outside the United States to continue to account for more than half of our Instrument segment revenue.
Competition
The Instruments segment operates in highly competitive markets. The primary competitive factors include brand reputation, technical innovation, product breadth, functionality, quality, reliability, and price. We believe we compete successfully in these markets with our innovative products, multi-function capabilities, our high value-to-price ratio, and our service and support functions. Our current principal competitors in the Instruments segment's markets include Fortive, Testo, Seek Thermal, SATIR, OPGAL, Infratec, Guide Infrared, and Nippon Avionics for thermal imaging cameras. The test and measurement products compete with products from Fortive, Testo, Gossen Metrawatt, Textron, General Tools, Ideal Industries, and others. The firefighting camera products compete primarily with Bullard, ISG/Scott, Argus, Dräger, and MSA.
Security Segment
The Security segment provides security solutions for a multitude of applications, from home and small business monitoring to enterprise and infrastructure security. The segment develops video security solutions for use in commercial, critical infrastructure, perimeter surveillance, and home security applications. These solutions include thermal and visible-spectrum cameras, digital and networked video recorders, and related video management systems ("VMS") software and video analytics software accessories that enable the efficient and effective safeguarding of assets at all hours of the day and night and during adverse weather conditions.
Our video security cameras are marketed under the FLIR brand name, for thermal and professional-grade visible spectrum cameras, and the Lorex brand name, for the consumer do-it-yourself ("DIY") and small business user. Security segment cameras come in indoor/outdoor, fixed, pan/tilt, and dome configurations, are network-ready, available with a variety of lens options, and provide analog and digital video outputs. Our Megapixel over Coax ("MPX") products allow customers to upgrade security systems to high-definition resolution using an existing coax cable that may already be present, saving the time and money of rewiring their building. We also offer a full spectrum of end to end security systems complete with video analytics and advanced VMS capability. In addition, our security products comply with several industry standards, can be integrated with dozens of video management systems and video analytics providers, and are accessible remotely on Apple iOS, Android, PC, or Mac devices through our FLIR Cloud service.
Markets
Utilities
Power plants, electrical substations, and water facilities utilize visible spectrum and thermal imaging cameras to provide continuous surveillance day or night. Our cameras are integrated with video analytics to provide automated alarm notification. At electrical substations, our thermal products provide protection against materials theft and acts of sabotage, and provide notifications when connections switchgear and transformers reach dangerous operating temperatures.
Nuclear power
Recent rules from the United States Nuclear Regulatory Commission require nuclear facilities to provide continuous 24-hour surveillance, observation, and monitoring of their perimeter and control areas. Our thermal security cameras are well suited for this requirement, providing true 24/7 monitoring capability even during most adverse weather conditions.
Petrochemical
Our thermal security cameras help petrochemical facilities meet the United States Department of Homeland Security's Chemical Facility Anti-Terrorism Standards. Thermal security cameras are highly effective in meeting the standards' requirements for monitoring a facility's perimeter, securing applicable assets, and solidifying a deter, detect, and delay strategy.
12
Ports and borders
Our long range thermal and visible security cameras provide "beyond the fence" situational awareness and advanced warning capabilities. Airport and border authorities around the world utilize our thermal security cameras to help keep people and equipment safe, operating day and night, in nearly all weather or lighting conditions.
Commercial and residential
FLIR’s full-spectrum security solutions offer a comprehensive line of thermal and visible cameras to protect commercial facilities. Our products are also used in a wide range of home applications that may include the use of thermal, visible or image-intensified cameras as well as network video recorders and other peripheral equipment.
Sales and Distribution
Our Security segment sales organization specializes in delivering complete solutions for thermal and visible security. Our Lorex products are sold through both brick and mortar and online retail outlets. Commercial and professional-grade security products utilize direct sales, a network of independent reps, and distributors covering major markets worldwide.
At December 31, 2017, the Security segment had a total backlog of $23 million. Backlog represents orders that have been received for products or services for which a contractual agreement is in place and delivery or performance is expected to occur within 12 months.
Customers
Our Security segment serves a broad customer base that is expanding every year. Our visible-spectrum solutions are purchased by high-end critical infrastructure users, security hardware distributors, systems integrators, contractors, and homeowners. Thermal security cameras are currently sold in all global regions, with most customers falling into the high-end critical infrastructure category. However, recent volume production of our thermal camera cores has allowed us to drop the cost of thermal security cameras to a point where it is an affordable option for many commercial security networks.
Competition
The Security segment operates in highly competitive markets. Many of our competitors are well-established brands. Key competitive factors include technical innovation, analytics, video monitoring, system integration and compatibility, price, and ability to deliver. Our competitive advantages include our broad line of thermal camera offerings, which combined with our DIY consumer product line offers both high- and low-end solutions to our customers. Our current principal competitors include Axis Communications, Bosch, Hikvision, Dahua, Infinova, Avigilon, Sony, Samsung, Q-see, and Panasonic.
OEM & Emerging Markets Segment
The OEM & Emerging Markets segment develops and manufactures thermal and visible spectrum imaging camera cores and related components. A thermal camera core is an integrated, plug-and-play camera system that includes the infrared or visible spectrum sensor as well as the related image processing electronics and an optical lens. We offer cooled and uncooled thermal cores that are based on long wave infrared ("LWIR"), mid-wave infrared ("MWIR"), and short wave infrared ("SWIR") sensors. Our visible spectrum camera cores are utilized primarily for machine vision and people counting applications and are based on complementary metal-oxide semiconductors ("CMOS") and charged-coupled device ("CCD") sensors that are produced by third parties. We also sell to third parties thermal sensors and readout integrated circuit ("ROIC") products, which are used to convert pixel-level information into digital information, essential in the design of infrared, visible, ultra violet, and X-Ray sensors.
Our vertically integrated manufacturing capability, built over many years, enables us to provide thermal camera core and component products to other FLIR segments at low cost, as well as sell cores and components to third party customers. Our cores and components are designed for easy and efficient integration into higher levels of product assembly. Third party OEMs integrate these cores and components into their own branded products. We operate under this model so to aggregate the largest amount of volume possible, which lowers our total cost to produce camera cores and components.
The OEM & Emerging Markets segment also houses our Emerging Markets businesses, which are businesses that are identified as high-potential but do not yet have the scale to represent their own segment. Included in Emerging Markets is our Intelligent
13
Traffic Systems business, which develops and manufactures software-enabled automotive and pedestrian monitoring and control systems, our Mobile products business, makers of thermal imaging accessories for the smartphone market, and our commercial UAS business, which provides thermal cameras and cores for use on, or integration into, UAS systems, which are often referred to as “drones.”
Markets
OEM
We supply cooled and uncooled thermal and visible spectrum camera cores, sensors, and ROICs on an OEM basis to an array of manufacturers of finished products in both the military and commercial spaces. These customers require a product at a lower level of integration than a fully developed thermal imaging system. Examples of major applications in this segment are automotive, industrial automation systems, firefighting, smartphones, UAS, medical devices, military, digital X-ray, and security.
Mobile
Leveraging our ability to produce thermal sensors at a low cost and with low size, weight, and power consumption, we created a line of personal thermal imaging cameras that attach to smartphones. The mass adoption of smartphones has driven significant growth in the development of tools that extend the utility of these devices, and our FLIR ONE® products do this by empowering consumers with thermal imaging on their smartphones. We believe that the potential of thermal imaging as a tool for consumers provides this segment with an emerging opportunity for growth.
Intelligent Transportation
Visible and thermal imaging helps transportation departments all over the world monitor vehicles and pedestrians in urban environments, detect incidents on highways and in tunnels, collect traffic data, control traffic signals, and ensure the safety on public roads and railways. These systems are able to detect vehicles and use the information to control traffic lights in order to improve traffic flow. While road-embedded magnetic loops have historically been the primary technology for analyzing intersections and roadways, visible and thermal imaging are increasingly being used for this application. Thermal imaging technology has shown to be highly effective at detecting the presence of vehicles as it is not impeded by darkness, colors, shadows, direct sunlight, light from oncoming traffic, or weather effects. We believe that the value of these solutions in terms of improved traffic flow, fuel conservation, and public safety is significant.
Sales and Distribution
We employ primarily a direct sales force for selling and distributing our thermal cores and components, and both direct sales and distributors for our visible-spectrum camera cores. The majority of our Mobile market sales are generated through wholesale channels, which include national and regional consumer electronics chains, large online retailers, and specialty retailers. We also sell our Mobile products directly to consumers through our own network of e-commerce websites. In addition, we sell our products to independent distributors in various countries where we generally do not have direct sales operations, and through licensees. A dedicated staff of business development managers for the Intelligent Traffic products assist the distribution channel, made up of traffic control systems integrators and engineering consultants, with application development, technical training, and operational assistance.
At December 31, 2017, the OEM & Emerging Markets segment had a total backlog of $169 million. Backlog represents orders that have been received for products, contract research and development, or other services for which a contractual agreement is in place and delivery or performance is expected to occur within 12 months.
Customers
Typical OEM customers include makers of military aircraft and vehicles, automotive safety equipment, firefighting equipment, manufacturing automation systems, security cameras, hunting equipment, smartphones, UAS, and maritime equipment. Our OEM sales personnel maintain direct relationships with most of these customers. We sell our Mobile products to a diverse group of consumers, including homeowners, outdoors people, and technology enthusiasts. Customers for our Intelligent Traffic products are traffic and public transportation authorities in cities and municipalities all over the world who deploy thermal imaging cameras and other equipment in urban areas, on highways, in tunnels, and on bridges.
14
Competition
While our market share in OEM cores and components is estimated to be nearly 50 percent based on independent industry research, we view the thermal OEM market as highly competitive. We believe the key drivers of success in these markets are: technological proficiency in imaging sensors, product quality, product cost, and scalability of operations. We believe we are well positioned to operate in this competitive environment given our demonstrated ability to innovate high-quality sensors at low cost due to our vertically-integrated operating model, our advanced R&D capabilities, and our broad product offering. Our primary competitors in the OEM space are ULIS, DRS, L-3, BAE Systems, Basler, and Allied Vision. In Mobile products, our competitors include Seek Thermal and Opgal. In the Intelligent Traffic product space, our major competitors include Image Sensing Systems, Iteris, and Citilog.
Maritime Segment
The Maritime segment develops and manufactures a broad range of thermal imaging and marine electronic products for recreational and commercial customers globally. The segment provides boats of all sizes a full suite of electronic systems including multi-function helm displays, navigational instruments, autopilots, radars, sonar systems, thermal and visible imaging systems, and communications equipment. These products are utilized for general navigation, sport fishing, cruising, and sailing.
Our primary product offering is multifunction navigation displays ("MFDs"). Our MFDs are designed to provide boaters visual navigation data from multiple sensors, including GPS, autopilot, sonar, and radar. We have several lines of MFD products, serving leisure and fishing boats of all sizes, in saltwater or freshwater environments. Our Dragonfly® product line addresses the MFD needs of the small-boat recreational fishermen, including kayakers and freshwater bass anglers, while our larger MFDs serve large saltwater boat end-users. We also integrate our MFDs to use and control thermal and visual cameras, onboard entertainment products, engine instruments, and data services like satellite weather. Recognizing the importance of mobile devices to boaters, we offer Wi-Fi enabled MFDs along with mobile apps that give boaters access to the MFD and sensors from anywhere on board the vessel.
Our marine instrument products are dedicated displays and sensors for monitoring depth, boat speed, and wind information. Our sonar solutions are engineered to serve the needs of both the inland and saltwater fishing customers. These sonars serve as fishermen’s eyes below the water so they can detect fish, locate underwater structure, and identify the habitat of the fish they are trying to catch. We also offer autopilot solutions that provide precision steering control for open water passages. To keep boaters connected, we offer several communication products, such as VHF marine radios for ship-to-ship and ship-to-shore communications, and our automatic identification system ("AIS") solutions enable the wireless exchange of navigation status between vessels and vessel-monitoring centers. The Maritime segment’s thermal camera solutions are designed to enhance a boater’s overall situational awareness in limited visibility and are used primarily to identify other vessels, navigation aids, and hazards. Thermal maritime cameras are also utilized for search and rescue and local law enforcement surveillance operations.
We market our Maritime segment products under both the FLIR and Raymarine brands. FLIR-branded maritime products consist of thermal cameras designed for recreational, commercial, and first-responder vessels. The Raymarine line of marine electronics is designed and marketed primarily to recreational boaters and light-commercial customers.
Markets
Recreational Boating
The recreational boating market, which represents the majority of our sales, is comprised of fresh and saltwater fishing, sport/cruising, and sailing. Our core MFD products are engineered to address the needs of all three markets. We also develop products specifically for strategic markets and customers, such as Dragonfly® sonars for freshwater fishermen, wind instruments for sailors, and vessel automation for boat builders.
Commercial Maritime
The commercial maritime market is comprised of light commercial, heavy commercial, and light-defense segments. We address these commercial markets with both our thermal maritime cameras and our marine electronics systems.
15
Sales and Distribution
Our Maritime segment sells products worldwide through a network of aftermarket distributors, technical dealers, boat builders/OEMs, and retailers. We have a dedicated business development team to address the unique requirements of our OEM boat-builder channel. With our OEM boat builders, we differentiate ourselves by providing full system solutions. We also add value to our boat-building partners through technical installation training of the OEM factory staff. In the United States, we devote special teams to the retail channel so we can address this channel’s dynamic and unique merchandising and promotional needs. Our sales team is supported by technical support teams and applications engineers. The technical teams provide customer support and conduct regular training sessions with our technical dealer and OEM customers.
At December 31, 2017, the Maritime segment had a total backlog of $17 million. Backlog represents orders that have been received for products or services for which a contractual agreement is in place and delivery or performance is expected to occur within 12 months.
Customers
Our FLIR maritime thermal cameras are supplied to an array of commercial customers including tugboats, work boats, and passenger vessels. Both FLIR and Raymarine maritime-branded thermal cameras are supplied to recreational sport fishing and cruising powerboat customers. Raymarine’s primary end consumers include freshwater and saltwater fishing boat owners, cruising power boats, and sailboat owners. In the fishing segment, Raymarine customers include kayakers, bass boat owners, bay boats, center consoles, and offshore sport fish boat owners. The cruising segment includes owners of sport boats, cruisers, and trawlers. Sailing customers include owners of day sailors, racers, cruising yachts and multi-hull sailboats.
Our Maritime segment also supplies thermal cameras to maritime first responders and maritime law enforcement organizations around the globe, including the United States Coast Guard. Our cameras are used by marine divisions of city fire and police departments along with local fish and wildlife enforcement organizations.
Competition
Our Maritime segment operates in a highly competitive market for marine electronics. Like consumer electronics, delivering innovative features and lower price points are critical to the success of our marine electronics products. Consumers typically purchase marine electronics as a system of products from one brand, so it is critical that we deliver a competitive offering in each of our product lines. Our primary marine electronic competitors include Garmin, Navico, Furuno, and Humminbird.
Detection Segment
Our Detection segment develops and manufactures field-ready sensor instruments and integrated platform solutions for the accurate detection, identification, classification, and suppression of chemical, biological, radiological, nuclear, and explosives ("CBRNE") threats for military force protection, homeland security, and commercial applications.
Detection segment solutions combine multi-threat detection and identification technologies into single hand-held or desktop instruments. Product lines include hand-held and fixed radiation detectors, hand-held and desktop explosives trace detectors, desktop and portable mass spectrometers, and continuous air monitoring devices for aerosolized biological threats and disclosure sprays. The segment also manufactures integrated systems of multiple pieces of equipment to create turn-key solutions used by first responders for the detection, identification, sample collection, decontamination, marking, and hazard reporting of CBRNE threats.
Our products utilize mission-based user interfaces to expedite decision-making for field operators and advanced technicians. Our advanced CBRNE detection instruments provide lab-quality confidence in a field-proven, highly reliable, and ruggedized package. Customers around the world use our products for forensic analysis, military reconnaissance, force protection, public security, law enforcement, emergency response, environmental monitoring, building and event security, teaching, and research.
The Detection segment leverages an established technical R&D organization that enables the business to offer smart, simple, and reliable products that meet the evolving needs of government and commercial security providers. With many years of experience working in collaboration with multiple government agencies, the Detection segment has developed relationships with various government decision-makers and has substantial knowledge of the governmental procurement process.
16
Markets
Government and private sector entities continue to seek new ways to address increasingly sophisticated terrorist threats and to respond to other security risks, natural disasters, and unintentional incidents that threaten public safety. Our multi-purpose products meet the requirements for a broad range of end-users and end uses.
We offer biological air monitors that are used by various governmental agencies for security at facilities and events. Our explosives detection products are used to identify military-grade explosives and homemade explosive devices in a wide array of military and public safety applications, such as screening high-risk individuals at checkpoints and identifying improvised explosive device ("IED") makers, and our radiation products protect the public by warning of radionuclide exposure.
Sales and Distribution
The Detection segment sells products worldwide primarily through a combination of a direct sales force and a distributor network, but also utilizes third-party sales representatives, value-added resellers, and systems integrators. With a centralized sales organization and specialized sales teams that serve specific markets, we have been successful at building and leveraging strong relationships with key decision-makers at various government agencies and commercial entities. Some Detection segment products are designed as components or sub-systems that are incorporated into third-party products or systems.
The Detection segment derives a portion of its revenue, approximately 9 percent in 2017, from funding received from agencies of the United States government pursuant to research projects. The revenue recognized under these contracts represents reimbursement by the customer for time periods ranging from several months to several years. Our participation in these and other development programs has culminated in the development of a number of commercial products. In general, our contracts with the United States government permit us to retain all rights to patents emerging from the funded R&D efforts.
At December 31, 2017, the Detection segment had a total backlog of $59 million. Backlog represents orders that have been received for products, contract research and development, or other services for which a contractual agreement is in place and delivery or performance is expected to occur within 12 months.
Customers
The Detection segment sells its products, systems, and services to a broad base of federal, state, and local government customers, to all branches of the United States military, foreign militaries, private sector businesses and commercial ports both in the United States and internationally. Using a regionally deployed sales force, the business sells to agencies of the United States government, such as the Departments of Homeland Security, Defense, and Energy, as well as the Transportation Security Administration, the Federal Bureau of Investigation, NASA, the Secret Service, the Coast Guard, and agencies of multiple state and local governments in the United States. Similar to our Surveillance segment, the Detection segment experiences some seasonality in its orders due to the United States government budget year end.
Competition
The markets in which the Detection segment competes are dynamic and highly competitive. Success in these markets depends on our ability to develop new technologies to meet rapidly evolving customer needs, reduce production and development costs, integrate with third-party devices and systems, establish and foster relationships with key government and commercial customers, and recruit highly technical personnel. The Detection segment competes in various markets with companies such as Agilent Technologies, Canberra Industries, Safran, SAIC, Smiths Detection, Thermo Fisher Scientific, and United Technologies.
SALES, MARKETING, CUSTOMER SUPPORT, AND TRAINING
Our sales and distribution organization covers the world with a combination of direct sales, third-party representatives and distributors, system integrators, independent dealers, retail outlets, application engineers, and service and training centers. Internationally, we have invested heavily to build a strong presence to sell and service our products, a key advantage in penetrating certain markets, such as foreign governments. Our sales representatives, including third-party distributors, undergo a comprehensive training program on each product’s technical specifications, functions, and applications. We also continuously update our training programs to incorporate technological and competitive shifts and changes. We sell in many distinct markets and have established specific sales channels for each market.
17
Our primary marketing activities include online advertising, participating in trade shows, partner sponsorships, optimizing our website for search keywords so that prospects searching for imaging and sensing solutions online find FLIR quickly, press releases about new products and company developments, social media outreach, and cooperative advertising.
We offer a strong product warranty coupled with responsive support accessible via phone, web, and e-mail, and our localized support locations for high-end systems helps us stand out in our markets.
Our Infrared Training Center ("ITC") offers training, certification, and re-certification in all aspects of thermography, including specialized instruction in building diagnostics, roofing, electrical, mechanical, research and science, and optical gas imaging. Online courses cover the basics of thermal camera operation and reporting software. The ITC is also the premier sponsor of InfraMation, thermal imaging’s leading users conference which is typically held annually.
MANUFACTURING
We manufacture many of the critical components for our products, including but not limited to infrared detectors, gimbals, pan-tilts, optics and coatings, laser sub-systems, and micro-coolers, and develop much of the software and middleware for our systems. This vertical integration minimizes lead times, facilitates prompt delivery of our products, controls costs, and ensures that these components satisfy our quality standards. We purchase other parts pre-assembled, including certain detectors, coolers and optics, circuit boards, cables, and wire harnesses. These purchased and manufactured components are then assembled into finished systems and tested at one of our primary production facilities located in the United States, Sweden, Estonia, and Canada. Certain components and finished goods, including some of our visible-spectrum cameras, test and measurement products and maritime electronics, are produced by contract manufacturers.
Our manufacturing operations are, from time to time, audited by certain customers, which include several major aircraft manufacturers, and have been certified as meeting their quality standards. Substantially all of our manufacturing locations are either ISO 9001:2000 or :2008 certified with certain locations having higher certifications.
INTELLECTUAL PROPERTY
To support our focus on being an innovation leader in our key markets and protect our proprietary information, we rely on a combination of patent, trademark, copyright, and trade secret rights, a strong internet domain presence, confidentiality agreements, joint development agreements, and contractual provisions. Over the past several years we have intensified our efforts to protect our innovations through increased United States and international patent filings, and to strengthen our core brands through thoughtful trademark procurement and domain portfolio refinement. We will continue to actively develop our intellectual property and intend to emphasize initiatives that will further promote innovation and leadership in marketable technologies. We cannot, however, be certain or give any assurance that we can secure patent or trademark protection on all our innovations, maintain our competitive advantage or that competitors will not develop similar or superior capabilities.
GOVERNMENT REGULATION
Thermal technology is controlled for export, re-export and retransfer by the United States government. Depending on the technology, the export of infrared products may be controlled by the United States Department of State or the Bureau of Industry and Security. In general, the more sophisticated the technology and the higher the performance of the product, the more restrictive are the licensing requirements. Licensing requirements differ from country to country, end user to end user and differ with product performance and field of intended use. The export of some of our products are controlled by the International Traffic and Arms Regulation ("ITAR") or are identified on the Commerce Control List (“CCL”) requiring an export license from the United States Department of Commerce. Thermal and infrared products identified in Category XII of the United States Munitions List like those manufactured by the Company have recently been the subject of export control reform moving classification and control of some products from the ITAR to the CCL and adding additional license restrictions under regulations administered by the United States Department of Commerce.
18
As a United States government supplier, we must comply with specific procurement regulations and other requirements and are subject to routine audits and investigations by United States government agencies. If we fail to comply with these rules and regulations, the results could include: reductions in the value of contracts; contract modifications or termination; the assessment of penalties and fines; and/or suspension or debarment from United States government contracting or subcontracting for a period of time or permanently.
EMPLOYEES
As of December 31, 2017, we had 3,542 employees of which 1,840 were located in the United States and 1,702 located outside of the United States. We have generally been successful in attracting highly skilled technical, marketing, and management personnel. None of our employees in the United States are represented by a union or other bargaining group. Certain employees in Europe are represented by unions and workers councils whose contracts are subject to periodic renegotiations. We believe our relationships with our employees, unions and workers councils are generally good.
ENVIRONMENTAL MATTERS
Our operations are subject to a variety of federal, state, local and foreign environmental laws and regulations relating to the discharge, treatment, storage, disposal and remediation of certain materials, substances, and wastes used in our operations. We continually assess our obligations and compliance with respect to these requirements. We have also assessed the risk for environmental contamination for our various manufacturing facilities, including our acquired businesses and facilities and, where appropriate, have obtained indemnification from the sellers of those businesses and facilities.
We believe that our current operations are in substantial compliance with all existing applicable environmental laws and permits. Operating and maintenance costs associated with environmental compliance are a normal, recurring part of our operations. Historically, these costs have not been material.
AVAILABLE INFORMATION
Our internet website address is www.flir.com. This Report, Quarterly Reports on Form 10-Q, Current Reports on Form 8-K and amendments to those reports filed or furnished pursuant to Section 13 or 15(d) of the Securities Exchange Act of 1934 and other required filings are available through our internet website as soon as reasonably practicable after we electronically file such material with, or furnish it to, the Securities and Exchange Commission. Our internet website and the information contained therein or connected thereto are not intended to be incorporated into this Report.
19
ITEM 1A. | RISK FACTORS |
The following are important factors that could cause actual results or events to differ materially from those contained in any forward-looking statements made by or on behalf of the Company. If we are unable to adequately respond to these risks and uncertainties, our business, financial condition and results of operations could be materially adversely affected. Additionally, we cannot be certain or give any assurance that any actions taken to reduce known risks and uncertainties will be effective.
Risks, Uncertainties and Other Factors Related to Our Business
We depend on the United States government for a material portion of our business and changes in government spending could adversely affect our business
We derive significant revenue from contracts or subcontracts funded by United States government agencies. A significant reduction in the purchase of our products by these agencies or contractors for these agencies would have a material adverse effect on our business. For the fiscal years ended December 31, 2017, 2016 and 2015, approximately 26 percent, 25 percent and 21 percent, respectively, of our revenues were derived directly or indirectly from sales to the United States government and its agencies. The funding of contracts awarded to us depends on the overall United States government budget and appropriations process, which is beyond our control. In addition, at its discretion, the United States government may change its spending priorities and/or terminate, reduce or modify contracts.
Substantial uncertainty exists in the spending levels and priorities of the United States government, particularly with respect to military expenditures. Continued and further reductions in military spending could have a material adverse effect on our results from operations.
As a United States government supplier, we are subject to a number of procurement rules and regulations
Government contractors must comply with specific procurement regulations and other requirements and are subject to routine and non-routine audits and investigations by United States government agencies. In addition, violations of these regulations or other unrelated laws and statutes can lead to debarment and other penalties. If we fail to comply with procurement rules and regulations and other laws and statutes, the results could include: reductions in the value of contracts; contract modifications or termination; the assessment of penalties and fines; and/or suspension or debarment from United States government contracting or subcontracting for a period of time or permanently. An adverse action by the United States government could also result in lost sales to non-governmental customers who might disqualify us as a result of such adverse action. The impairment or loss of our government contracts could have a material adverse effect on our business.
Operating margins may be negatively impacted by reduction in sales or by a change in the mix of products sold
Our expense levels are based, in part, on our expectations regarding future sales and these expenses are largely fixed in the short term. Some expenses, such as those related to research and development activities, would likely be maintained in the event of a sales downturn in order to maintain and enhance the long-term competitiveness of the Company. We maintain inventories of finished goods, components and raw materials at levels we believe are necessary to meet anticipated sales. Accordingly, we may not be able to reduce our costs in a timely manner to compensate for any unexpected shortfall between forecasted and actual sales. Any significant shortfall of sales may result in us carrying higher levels of inventories of finished goods, components and raw materials thereby increasing our risk of inventory obsolescence and corresponding inventory write-downs and write-offs. Our fixed costs, including facilities and information technology costs, compliance and public company costs, and depreciation and amortization related to previous acquisitions and capital expenditures, are significant and are difficult to reduce in the short term. Our operating margins vary by product and substantial changes in the mix of products sold could also have a negative impact on our operating margins.
We may experience impairment in the value of our tangible and intangible assets
Our industry is subject to rapid changes in technology, which may result in unexpected obsolescence or impairment of our assets. Our intangible assets, including goodwill, represent a significant portion of our total assets. Most of these intangibles are the result of acquisitions in which the purchase price exceeded the value of the tangible assets acquired. We amortize certain of these
20
intangibles over their anticipated useful life and review goodwill and indefinite-lived intangible assets for impairment annually or more frequently if warranted by events. To date we have not experienced any impairment of our intangible assets, but there can be no assurance that we will not experience such impairment in the future. In addition, certain of our tangible assets such as inventory and machinery and equipment may experience impairment in their value as a result of such events as the introduction of new products, changes in technology or changes in customer demand patterns. We depreciate our machinery and equipment at levels we believe are adequate; however, there can be no assurance that there will not be a future impairment that may have a material impact on our business, financial condition and results of operations.
Unfavorable results of legal proceedings could materially adversely affect us
We are subject to various legal proceedings and claims that have arisen out of the ordinary conduct of our business and are not yet resolved, and additional claims may arise in the future. Results of legal proceedings cannot be predicted with certainty. Regardless of merit, litigation may be both time-consuming and disruptive to our operations and could cause significant expense and diversion of management attention. From time to time, we are involved in lawsuits concerning intellectual property, torts, contracts, shareholder litigation, administrative and regulatory proceedings and other matters, as well as governmental inquiries and investigations, the outcomes of which may be significant to our results of operations and may limit our ability to engage in our business activities. In recognition of these considerations, we have and may in the future enter into material settlements to avoid ongoing costs and efforts in defending or pursuing a matter. Should we fail to prevail in certain matters, or should several of these matters be resolved against us in the same reporting period, we may be faced with significant monetary damages or injunctive relief against us that could adversely affect our business, financial condition, operating results and cash flows. While we have insurance related to our business operations, it may not apply to or fully cover liabilities we incur as a result of these lawsuits. We record accruals for liabilities where we believe a loss to be probable and reasonably estimable. However, our actual costs may differ materially from these estimates.
We face risks from international sales and business activities
We market and sell our products worldwide and international sales have accounted for, and are expected to continue to account for, a significant portion of our revenue. For the years ended December 31, 2017, 2016 and 2015, international sales accounted for 47 percent, 46 percent and 47 percent, respectively, of our total revenue. We also manufacture certain products and subassemblies in Europe and we have several contract manufacturing agreements with third parties in Europe and in Asia. Certain of these products, particularly our thermal and infrared products, are subject to substantial government regulation and licensing and end use restrictions throughout the world. Our international business activities are subject to a number of risks, including:
• | the imposition of and changes to governmental licensing restrictions and controls impacting our technology and products; |
• | restrictions and prohibitions on the export of technology and products, including recent changes in regulation prohibiting the sale of certain of our products to certain end users without a license; |
• | international trade restrictions; |
• | difficulty in collecting receivables and governmental restrictions with respect to currency; |
• | inadequate protection of intellectual property; |
• | labor union activities; |
• | changes in tariffs and taxes; |
• | restrictions on repatriation of earnings; |
• | restriction on the importation and exportation of goods and services; |
• | risks, costs, impacts and obligations associated with the United States Foreign Corrupt Practices Act ("FCPA"), and other anti-bribery and anti-corruption laws applicable to us, and laws applicable to global trade and United States exports and costs and penalties from violations of such laws and related regulations, including the costs associated with required remedial and other increased compliance activity; |
• | difficulties in staffing and managing international operations; and |
• | political and economic instability. |
Some of these factors recently have had an adverse impact on our sales and operations and increased the Company’s cost of doing business and subjected the business to additional rules, policies and procedures that impacted the operation of the Company. No assurance can be given that these factors will not have a material adverse effect on our future international sales and operations and, consequently, on our business, financial condition and results of operations. Furthermore, compliance with complex foreign
21
and U.S. laws and regulations that apply to our international operations increases our cost of doing business both in the United States and in international jurisdictions. These regulations include import and export laws, anti-competition laws, anti-corruption laws, such as the FCPA and the U.K. Bribery Act, and other local laws prohibiting corrupt payments to governmental officials, data privacy requirements, tax laws, and accounting, internal control and disclosure requirements. For example, on April 8, 2015, the Company and the Securities and Exchange Commission (“SEC”) entered into an agreement through entry of an Order Instituting Cease-and-Desist Proceedings Pursuant to Section 21C of the Securities and Exchange Act of 1934, Making Findings, and Imposing a Cease-and-Desist Order (the “SEC Order”). The SEC Order settled charges under the FCPA with respect to incidents of improper travel and gifts involving FLIR’s Middle East operation. Pursuant to the SEC Order, the Company is obligated to “cease and desist” from committing any future violations of the Securities Exchange Act of 1934, as amended. Violations of these laws and regulations could result in civil and criminal fines, penalties and sanctions against us, our officers or our employees, prohibitions on the conduct of our business and on our ability to offer our products and services in one or more countries, and could also materially affect our reputation, business and results of operations. In certain foreign jurisdictions, there is a higher risk of fraud or corruption and greater difficulty in maintaining effective internal controls and compliance programs. Further, although we have implemented and continue to implement policies and procedures designed to promote compliance with applicable laws and regulations, there can be no assurance that our employees, contractors or agents will not violate our policies or applicable laws and regulations. In addition, our international contracts may include industrial cooperation agreements requiring specific in-country purchases, investments, manufacturing agreements or other financial obligations, known as offset obligations, and may provide for penalties if we fail to meet such requirements. The impact of these factors is difficult to predict, but one or more of them could have a material adverse effect on our financial position, results of operations, or cash flows.
We face risks from currency fluctuations
Historically, currency fluctuations have affected our operating results. Changes in the value of foreign currencies in which our sales or costs incurred are denominated have in the past caused, and could in the future cause, fluctuations in our operating results. We seek to reduce our exposure to currency fluctuations by denominating, where possible, our international sales in United States dollars, by balancing expenses and revenues in various currencies and by undertaking limited hedging of forecasted currency exposures. With respect to international sales denominated in United States dollars, a decrease in the value of foreign currencies relative to the United States dollar could make our products less price competitive.
We may not be successful in obtaining the necessary export licenses to conduct operations abroad and the United States government may prevent proposed sales to foreign governments and customers
Export licenses and other authorizations are required from United States government agencies under the ITAR, the Export Administration Regulation (“EAR”), the Office of Foreign Assets Control (“OFAC”) Regulations, the Trading with the Enemy Act of 1917, the International Emergency Economic Powers Act (“IEEPA”), the Arms Export Control Act of 1976 (“AECA”), and other similar laws and regulations for the sale, use and export of many of our products and related data and services. Thermal and infrared products and technical data have been subject to the ITAR and EAR, historically under United States Munitions List (“USML”) Category XII and Commerce Control List (“CCL”) Category 6. Recently, the United States Government’s export reform effort resulted in the transition of various Company products from the USML to the CCL, shifting the licensing requirements and restrictions for products regulated by the Department of Commerce under the EAR. This transition has increased the licensing requirements and restrictions on some products and reduced the requirements and restrictions on others. We can give no assurance that we will be successful in obtaining the necessary licenses from the United States Department of State or Department of Commerce required to conduct our business as presently or historically conducted.
The United States export licensing environment has been affected by a number of factors, including but not limited to, the aftermath of 9/11, the rise of terrorism and the changing geopolitical environment, heightened tensions with other countries (which shift and evolve over time), and the United States reliance on the tactical advantage of the night-time war fighter. Some of these factors have affected the thermal imaging and infrared technology industry overall while others have impacted the Company directly. In addition, the Company’s 2014 submission to the United States Department of State Office of Defense Trade Controls Compliance (“DDTC”) pursuant to ITAR § 127.12(c), regarding the unauthorized export of technical data and defense services to dual and third country nationals in at least four facilities of the Company, have led to heightened scrutiny of export licenses for products in our markets and in some cases, has resulted in lengthened drafting and review periods for our license applications, including in countries where we have historically made significant sales. Subsequent engagement with the DDTC as part of the Company’s 2014 and related submissions and other communications concerning the Company’s licensing posture overall, highlight
22
DDTC’s focus on the manner in which the Company handles exports of its products, technical data and services subject to the ITAR. In addition, concerns with respect to potential diversion of certain of the Company's products to prohibited end users and countries subject to economic and other sanctions implemented by the United States government has caused the United States Department of Commerce Bureau of Industry and Security to restrict recently the Company’s ability to sell 9hz thermal products without a license to customers in China not identified on a list maintained by the United States Department of Commerce.
Although we have taken actions and continue to take additional actions necessary to implement policies and procedures to promote an improved compliance culture and programs, there is no guarantee that our actions will be effective or that government agencies will not view our actions and programs with heightened scrutiny, including as a result of events outside the Company’s control. As a result, we may receive more restrictive provisos or limitations on new license requests, wholesale denials of our license requests, suspensions or terminations of our existing licenses, or delays in receiving new licenses resulting from requests for follow-up information, due diligence requests or additional limitations on our sale to third parties. We can give no assurance that we will be successful in obtaining necessary licenses required to facilitate our international business. Failures to obtain or delays in obtaining licenses may prevent or limit our ability to market, sell, export, or transfer our products outside the United States and has had and could continue to have a material adverse effect on our business and our operating results.
General economic conditions may adversely affect our business, operating results and financial condition
Our operations and performance depend significantly on worldwide economic conditions and their impact on levels of capital investment and consumer spending. Economic factors that could adversely influence demand for the Company’s products include uncertainty about global economic conditions leading to reduced levels of investment, changes in government spending levels and/or priorities, the size and availability of government budgets, customers’ and suppliers’ access to credit, consumer confidence and other macroeconomic factors affecting government, industrial or consumer spending behavior.
In recent years, our performance has been negatively impacted by reduced spending by United States government agencies, global economic weakness, and the Eurozone crisis. Continuation of the conditions that led to reduced spending and potential further reductions in spending globally by either consumers or government agencies could have a material adverse effect on our business, financial condition and results of operations.
Our primary markets are volatile and unpredictable
Our business depends on the demand for our products and solutions in a variety of commercial, industrial and government markets. In the past, the demand for our products in these markets has fluctuated due to a variety of factors, some of which are beyond our control, including:
• | the timing, number and size of orders from, and shipments to, our customers, as well as the relative mix of those orders; |
• | variations in the volume of orders for a particular product or product line in a particular fiscal quarter; |
• | the size and timing of new contract awards; |
• | the timing of the release of government funds for procurement of our products; and |
• | the timing of orders and shipments within a given fiscal quarter. |
Seasonal fluctuations in our operating results are an outcome of:
• | the seasonal pattern of contracting by the United States government and certain foreign governments; |
• | the desire of customers to take delivery of equipment prior to fiscal year ends due to funding considerations; and |
• | the tendency of commercial enterprises to utilize fully annual capital budgets prior to expiration. |
Competition in our markets is intense and our failure to compete effectively could adversely affect our business
Competition in the markets for our products is intense. The speed with which companies can identify new applications for thermal imaging, develop products to meet those needs and supply commercial quantities at low prices to the market are important competitive factors. We believe the principal competitive factors in our markets are product performance, price, customer service and training, product reputation, and effective marketing and sales efforts. Many of our competitors have greater financial, technical, research and development, and marketing resources than we do. All of these factors, as well as the potential for increased competition
23
from new market entrants, require us to continue to invest in, and focus on, research and development and new product innovation. No assurance can be given that we will be able to compete effectively in the future and a failure to do so could have a material adverse effect on our business, financial condition and results of operations.
Our products may suffer from defects or errors leading to substantial product liability, damage or warranty claims
We include complex system designs and components in our products that may contain errors or defects, particularly when we incorporate new technology into our products or release new versions. If any of our products are defective, we might be required to redesign or recall those products or pay substantial damages or warranty claims. Such an event could result in significant expenses including expenses arising from product liability and warranty claims. It also could disrupt sales and affect our reputation and that of our products, which could have a material adverse effect on our business, financial condition and results of operations. As we expand our presence into new markets, we may face increased exposure to product liability claims. We maintain product liability insurance but cannot be certain that it will be sufficient or will continue to be available on acceptable terms.
Amounts included in our backlog may not result in actual revenues or translate into profits
Many contracts are subject to cancellation or suspension on short notice at the discretion of the customer, and the contracts in our backlog are subject to changes in the scope of services to be provided as well as adjustments to the costs relating to the contract. We have historically experienced variances in the components of backlog related to delivery delays or cancellations resulting from customer-specific circumstances, external market factors and economic factors beyond our control, and we may experience more delays or cancellations in the future. Accordingly, there is no assurance that backlog will actually be realized. If our backlog fails to materialize, we could experience a reduction in revenues and a decline in profitability, which could result in a deterioration of our financial position and liquidity.
Risks, Uncertainties and Other Factors Related to Our Technology and Intellectual Property
Our inability to protect our intellectual property and proprietary rights and avoid infringing the rights of others could harm our competitive position and our business
Our ability to compete successfully and achieve future revenue growth depends, in part, on our ability to protect our proprietary technology and operate without infringing the rights of others. To accomplish this, we rely on a combination of patent, trademark, copyright and trade secret laws, confidentiality agreements and contractual provisions to protect our proprietary rights. Many of our proprietary rights are held in confidence as trade secrets and are not covered by patents, making them more difficult to protect. Although we currently hold worldwide patents covering certain aspects of our technologies and products, and we are actively pursuing additional patents, we cannot be certain that we will obtain additional patents or trademarks on our technology, products and trade names. Furthermore, we cannot be certain that our patents or trademarks will not be challenged or circumvented by our competitors or that measures taken by us to protect our proprietary rights will adequately deter their misappropriation or disclosure. Any failure by us to protect our intellectual property could have a material adverse effect on our business, financial condition and results of operations. Moreover, because intellectual property does not necessarily prevent our competitors from entering the markets we serve, there can be no assurance that we will be able to maintain our competitive advantage or that our competitors will not develop capabilities equal or superior to ours.
Litigation over patents and other intellectual property is common in our industry. We have been the subject of patent and other intellectual property litigation in the past and cannot be sure that we will not be subject to such litigation in the future. Similarly, there exists the possibility we will assert claims in litigation to protect our intellectual property. Lawsuits defending or prosecuting intellectual property claims and related legal and administrative proceedings could result in substantial expense to us and significant diversion of effort of our personnel. An adverse determination in a patent suit or in any other proceeding in which we are a party could subject us to significant liabilities, result in the loss of intellectual property rights we claim or impact our competitive position. Additionally, an adverse determination could require us to seek licenses from third parties. If such licenses are not available on commercially reasonable terms or at all, our business, financial condition and results of operations could be adversely affected.
24
Our future success will depend on our ability to respond to the rapid technological change in the markets in which we compete, our ability to introduce new or enhanced products and enter into new markets
The markets in which we compete are characterized by rapid technological developments and frequent new product introductions, enhancements and modifications. Our ability to develop new products and technologies that anticipate changing customer requirements, reduce costs and otherwise retain or enhance our competitive position in existing and new markets will be an important factor in our future results from operations. We will continue to make substantial capital expenditures and incur significant research and development costs to improve our manufacturing capability, reduce costs, and develop and introduce new products and enhancements. If we fail to develop and introduce new products and technologies in a timely manner, our business, financial condition and results of operations would be adversely affected. In addition, we cannot be certain that our new products and technologies will be successful or that customers will accept any of our new products.
Our business could be negatively impacted by cybersecurity threats and other security threats and technology disruptions
We face certain security threats and technology disruptions, including threats to our information technology infrastructure, attempts to gain access to our or our customers’ proprietary or classified information, threats to the physical security of our facilities and employees, threats of terrorism events, and failures of our technology tools and systems. We are subject to laws and rules issued by various agencies concerning safeguarding and maintaining infrastructure and physical security and information confidentiality. Our information technology networks and related systems are critical to the operation of our business and essential to our ability to successfully perform day-to-day operations. We are also involved with information technology systems for certain customers and other third parties, for which we face similar security threats as for our own. In particular, cybersecurity threats-which include, but are not limited to, computer viruses, spyware and malware, attempts to access information, denial of service attacks and other electronic security breaches-are persistent and evolve quickly. Such threats have increased in frequency, scope and potential impact in recent years. Further, a variety of technological tools and systems, including both company-owned information technology and technological services provided by outside parties, support our critical functions. These technologies, as well as our products, are subject to failure and the user’s inability to have such technologies properly supported, updated, expanded or integrated into other technologies and may contain open source and third party software which may unbeknownst to us contain defects or viruses that pose unintended risks to our customers. These risks if not effectively mitigated or controlled could materially harm our business or reputation. While we believe that we have implemented appropriate measures and controls, there can be no assurance that such actions will be sufficient to prevent disruptions to critical systems, unauthorized release of confidential information or corruption of data.
We require user names and passwords in order to access our information technology systems. We use encryption and authentication technologies designed to secure the transmission and storage of data and prevent access to our data or accounts. These security measures are subject to third-party security breaches, employee error, malfeasance, faulty password management or other irregularities. For example, third parties may attempt to induce by fraud employees or customers into disclosing user names, passwords or other sensitive information, which may in turn be used to access our information technology systems. These security systems cannot provide absolute security. To the extent we were to experience a breach of our systems and were unable to protect sensitive data, such a breach could materially damage business partner and customer relationships, and curtail or otherwise impact the use of our information technology systems. Moreover, if a security breach of our information technology system affects our computer systems or results in the release of personally identifiable or other sensitive information of customers, business partners, employees and other third parties, our reputation and brand could be materially damaged, use of our products and services could decrease, and we could be exposed to a risk of loss, litigation and potential liability.
Although we have in the past and continue to be subject to cybersecurity threats and other security threats and technology disruptions, to date none has had a material impact on our business, financial condition or results of operations. Nonetheless, in the future, these types of events could disrupt our operations and customer and other third party information technology systems. They also could require significant management attention and resources, negatively impact our reputation among our customers and the public and challenge our eligibility for future work on sensitive or classified systems, which could have a material adverse effect on our business, financial condition and results of operations.
25
Risks, Uncertainties and Other Factors Related to Our Corporate Structure and Organization
Our future success depends in part on attracting and retaining key senior management and qualified technical, sales and other personnel
Our future success depends in part on the efforts and continued services of our key executives and our ability to attract and retain qualified technical, sales and other personnel. Significant competition exists for such personnel and we cannot assure the retention of our key executives, technical and sales personnel or our ability to attract, integrate and retain other such personnel that may be required in the future. We cannot assure that employees will not leave and subsequently compete against us. If we are unable to attract and retain key personnel, our business, financial condition and results of operations could be adversely affected.
We must successfully manage a complex global organization
As we have grown, the size and scope of our worldwide operations have also increased substantially. We currently design, manufacture and market numerous product lines in locations worldwide. Significant management time and effort is required to manage effectively the increased complexity of the business and our failure to successfully do so could have a material adverse effect on our business, financial condition and results of operations. Our inability to continue to manufacture our products at one or more of our facilities as a result of, for example, a prolonged power outage, earthquake, fire or other natural disaster, or labor or political unrest, could prevent us from supplying products to our customers and could have a material adverse effect on our business, financial condition and results of operations.
We may be unable to integrate successfully recent or future acquisitions into our operations, thereby disrupting our business and harming our financial condition and results of operations
We have made twelve acquisitions of various sizes in the past five years. The integration of businesses, personnel, product lines and technologies can be difficult, time consuming and subject to significant risks. For example, we could lose key personnel from companies that we acquire, incur unanticipated costs, lose major sources of revenue, fail to integrate critical technologies, suffer business disruptions, fail to capture anticipated synergies, fail to establish satisfactory internal controls, or incur unanticipated liabilities. Any of these difficulties could disrupt our ongoing business, distract our management and employees, increase our expenses and decrease our revenue.
We frequently evaluate strategic opportunities available to us and it is likely that we will make additional acquisitions in the future. Such acquisitions may vary in size and complexity. Any future acquisitions are subject to the risks described above. Furthermore, we might assume or incur additional debt or issue additional equity securities to pay for future acquisitions. Additional debt may negatively impact our results and increase our financial risk, and the issuance of any additional equity securities could dilute our then existing shareholders’ ownership. No assurance can be given that we will realize anticipated benefits of any future acquisitions, or that any such acquisition or investment will not have a material adverse effect on our business, financial condition and results of operations.
We have indebtedness as a result of the issuance of our 3.125 percent senior unsecured notes (the “Notes”) and borrowings against our unsecured credit facility, and we are subject to certain restrictive covenants under our unsecured credit facility and the indenture governing the Notes which may limit our operational and financial flexibility
Our ability to meet our debt service obligations and comply with the financial covenants under our credit facility will be dependent upon our future performance, which will be subject to financial, business and other factors affecting our operations, many of which are beyond our control. Our inability to meet our debt service obligations or comply with the required covenants could result in a default under the credit facility or indenture. In the event of any such default, under the credit facility, the lenders thereunder could elect to declare all outstanding debt, accrued interest and fees under the facility to be due and immediately payable. In the event of any such default under our indenture, either the trustee or the holders of at least 25 percent of the outstanding principal amount of the Notes could declare the principal amount of all of the Notes to be due and payable immediately.
26
We may not be able to refinance our indebtedness on favorable terms, if at all, which could materially and adversely affect our liquidity and our ongoing results of operations.
Our ability to refinance indebtedness, including the Notes, will depend in part on our operating and financial performance, which, in turn, is subject to prevailing economic conditions and to financial, business, legislative, regulatory and other factors beyond our control. In addition, prevailing interest rates or other factors at the time of refinancing could increase our interest expense. A refinancing of our indebtedness, including the Notes, could also require us to comply with more onerous covenants and further restrict our business operations. Our inability to refinance our indebtedness or to do so upon favorable terms could materially and adversely affect our business, results of operations, financial condition and cash flows, and make us vulnerable to adverse industry and general economic conditions.
We are effectively self-insured against many potential liabilities
Although we maintain insurance policies with respect to a broad range of risks, including automobile liability, general liability, workers’ compensation and employee group health, these policies do not cover all possible claims and certain of the policies are subject to large deductibles. Accordingly, we are effectively self-insured for a substantial number of actual and potential claims. In addition, if any of our insurance carriers defaulted on its obligations to provide insurance coverage by reason of its insolvency or for other reasons, our exposure to claims would increase and our profits would be adversely affected. Our estimates for unpaid claims and expenses are based on known facts, historical trends and industry averages, utilizing the assistance of actuarial services. The determination of such estimated liabilities and their appropriateness are reviewed and updated at least quarterly. However, these liabilities are difficult to assess and estimate due to many relevant factors, the effects of which are often unknown, including the severity of an injury or damage, the determination of liability in proportion to other parties, the timeliness of reported claims, the effectiveness of our risk management and safety programs and the terms and conditions of our insurance policies. Our accruals are based upon known facts, historical trends and our reasonable estimate of future expenses, and we believe such accruals are adequate. However, unknown or changing trends, risks or circumstances, such as increases in claims, a weakening economy, increases in medical costs, changes in case law or legislation or changes in the nature of the work we perform, could render our current estimates and accruals inadequate. In such case, adjustments to our balance sheet may be required and these increased liabilities would be recorded in the period that the experience becomes known. Insurance carriers may be unwilling, in the future, to provide our current levels of coverage without a significant increase in insurance premiums and/or collateral requirements to cover our obligations to them. Increased collateral requirements may be in the form of additional letters of credit and/or cash, and an increase in collateral requirements could significantly reduce our liquidity. If insurance premiums increase, and/or if insurance claims are higher than our estimates, our profitability could be adversely affected.
Changes in our effective income tax rate may have an adverse effect on our results of operations
We are subject to taxes in the United States and numerous foreign jurisdictions, including Belgium, where a number of our subsidiaries are organized. Due to economic and political conditions, tax rates in various jurisdictions may be subject to significant change. Our future effective tax rate could be affected by changes in the mix of earnings in countries with different statutory tax rates, changes in the valuation of deferred tax assets and liabilities, changes in the enforcement environment, and changes in tax laws or their interpretations, in the United States and in foreign jurisdictions. For example, in January 2016, the European Commission announced a decision concluding that certain rules under Belgian tax legislation are deemed to be incompatible with European Union regulations on state aid. As a result of this decision, the European Commission has directed the Belgian Government to recover past taxes from certain entities, reflective of disallowed state aid, which impacts one of the Company’s international subsidiaries. The Belgian Government announced they have appealed this decision and filed action for an annulment in the General Count of the European Union, and in July 2016 the Company filed a separate appeal with the General Court of the European Union. The Company recorded discrete tax expense of $39.6 million during 2016 related to this matter and on January 10, 2017, received tax assessments from the Belgium government for a similar amount. The Company has filed a complaint against the Belgian tax assessments, and the result of this complaint, the appeal with the General Court of the European Union, new information received from the Belgian Government, or other future events may cause the income tax provision associated with the decision to be entirely or partially reversed.
Our future effective tax rate may be adversely affected by a number of additional factors including:
• | the jurisdictions in which profits are determined to be earned and taxed; |
• | the resolution of issues arising from tax audits with various tax authorities; |
27
• | changes in the valuation of our deferred tax assets and liabilities; |
• | adjustments to estimated taxes upon finalization of various tax returns; |
• | increases in expenses not deductible for tax purposes; |
• | changes in available tax credits; |
• | changes in share-based compensation expense; |
• | changes in tax laws or the interpretation of such tax laws and changes in generally accepted accounting principles; |
• | changes in foreign tax rates or agreed upon foreign taxable base; and/or |
• | the repatriation of earnings from outside the United States for which we have not previously provided for United States taxes. |
Any significant increase in our future effective tax rates could adversely impact net income for future periods. In addition, the United States Internal Revenue Service (“IRS”) and other tax authorities regularly examine our income tax returns. Our financial condition and results of operations could be adversely impacted if any assessments resulting from the examination of our income tax returns by the IRS or other taxing authorities are not resolved in our favor.
New tax legislation, commonly referred to as the Tax Cuts and Jobs Act (the “Tax Act”), was enacted on December 22, 2017. The Tax Act, among other things, (i) permanently reduces the US corporate income tax rate to 21% beginning in 2018, (ii) provides for a five year period of 100% bonus depreciation followed by a phase-down of the bonus depreciation percentage, and (iii) provides for more general changes to the taxation of corporations, including changes to the deductibility of interest expense, the adoption of a modified territorial tax system, assessing a repatriation tax or “toll-charge” on undistributed earnings and profits of US-owned foreign corporations, and introducing certain anti-base erosion provisions. The long-term impact of the Tax Act on the general economy cannot be reliably predicted at this time and will require rule-making and interpretation in a number of areas.
The Tax Act requires complex computations not previously required by U.S. tax law. As such, the application of certain accounting guidance is currently evolving. Further, compliance with the Tax Act and the accounting for certain provisions require accumulation of information not previously required or regularly produced. As a result, we have provided a provisional estimate on the effect of the Tax Act in our financial statements. As additional interpretative guidance is issued by the applicable authorities, we will continue our analysis on the application of the Tax Act and will revise our current estimates in future periods. The revisions to our current estimates could materially affect our results of operations, cash flow and financial position.
State of Oregon law and our charter documents contain provisions that could discourage or prevent a potential takeover, even if the transaction would benefit our shareholders
Other companies may seek to acquire or merge with us. An acquisition or merger of our Company could result in benefits to our shareholders, including an increase in the value of our common stock. Some provisions of our Articles of Incorporation and Bylaws, including our ability to issue preferred stock without further action by our shareholders, as well as provisions of the State of Oregon law, may discourage, delay or prevent a merger or acquisition that a shareholder may consider favorable.
ITEM 1B. UNRESOLVED STAFF COMMENTS
None.
28
ITEM 2. PROPERTIES
At December 31, 2017, we conducted manufacturing, research and development, and sales and administration in 98 facilities worldwide. Of these, we owned 7 facilities with approximately 712 thousand square feet and leased 28 facilities with approximately 398 thousand square feet in the United States, and we owned 7 facilities with approximately 328 thousand square feet and leased 56 facilities with approximately 320 thousand square feet outside the United States, primarily in Europe. Our headquarters is located in Wilsonville, Oregon.
Our major facilities include the following locations:
Location | Owned | Leased | |||
(Square feet in Thousands) | |||||
Wilsonville (Portland), Oregon | 154 | — | |||
North Billerica (Boston), Massachusetts | 133 | — | |||
Täby (Stockholm), Sweden | 205 | — | |||
Elkridge (Baltimore), Maryland | — | 109 | |||
Nashua, New Hampshire | 140 | — | |||
Tallinn, Estonia | 46 | — | |||
Markham (Toronto), Ontario, Canada | — | 27 | |||
Goleta (Santa Barbara), California | 169 | — | |||
Fareham (Portsmouth), United Kingdom | 63 | — | |||
Stillwater, Oklahoma | — | 28 | |||
Meer (Antwerp), Belgium | — | 12 | |||
Richmond (Vancouver) British Columbia, Canada | — | 52 | |||
Other | 130 | 490 | |||
Total | 1,040 | 718 | |||
Our reportable segments operate out of facilities as follows:
Surveillance: Wilsonville, Oregon; North Billerica, Massachusetts; Täby, Sweden; Elkridge, Maryland; and 14 facilities in the United States and 15 facilities located outside the United States.
Instruments: Täby, Sweden; Nashua, New Hampshire; Tallinn, Estonia; and 2 facilities in the United States and 24 facilities located outside the United States.
Security: Markham, Ontario, Canada and 1 facility in the United States and 19 facilities outside the United States.
OEM & Emerging Markets: Goleta, California, Vancouver BC, Canada and 4 facilities in the United States and 19 facilities located outside the United States.
Maritime: Fareham, United Kingdom and 1 facility in the United States and 14 facilities located outside the United States.
Detection: Stillwater, Oklahoma; Elkridge, Maryland; and 5 facilities in the United States and 4 facilities located outside the United States.
We believe all of our properties are suitable for their intended use, adequate to meet our current and near-term business needs, and in good condition. We do not anticipate difficulty in renewing existing leases as they expire or in finding alternative facilities.
29
ITEM 3. | LEGAL PROCEEDINGS |
Raytheon Litigation
FLIR Systems, Inc. and its subsidiary, FLIR Commercial Systems, Inc. (formerly known as Indigo Systems Corporation) (together, the “FLIR Parties”), were named in a lawsuit filed by Raytheon Company (“Raytheon”) on March 2, 2007, in the United States District Court for the Eastern District of Texas. Raytheon's complaint, as amended, asserted claims for tortious interference, patent infringement, trade secret misappropriation, unfair competition, breach of contract, and fraudulent concealment. The FLIR Parties filed an answer to the complaint on September 2, 2008, in which they denied all material allegations. On October 27, 2010, the FLIR Parties and Raytheon entered into a settlement agreement that resolved the patent infringement claims (the "Patent Claims") pursuant to which the FLIR Parties paid $3 million to Raytheon and entitles the FLIR Parties to certain license rights in the patents that were the subject of the Patent Claims. On October 28, 2014, a four-week trial began with respect to Raytheon's remaining claims of misappropriations of trade secrets and claims related to 31 alleged trade secrets. On November 24, 2014, a jury in the United States District Court for the Eastern District of Texas rejected Raytheon’s claims and determined that 27 of the alleged trade secrets were not in fact trade secrets and that neither of the FLIR Parties infringed any of the trade secrets claimed and awarded Raytheon no damages. On March 31, 2016, the United States District Court for the Eastern District of Texas issued a Final Judgment denying Raytheon’s claims and awarding FLIR court costs and denying each of Raytheon’s and FLIR’s Renewed Motions for Judgment as a Matter of Law and denying FLIR’s Amended Rule 54(d) Motion for Attorneys’ Fees and Costs Under the Texas Theft Liability Act.
On April 29, 2016, Raytheon filed a Notice of Appeal to the United States Court of Appeals for the Federal Circuit of the denial by the United States District Court for the Eastern District of Texas of Raytheon’s Renewed Motion for Judgment as a Matter of Law, or in the Alternative, Motion for New Trial. On May 11, 2016, the FLIR Parties filed a Notice of Appeal to the United States Court of Appeals for the Federal Circuit of the Order of the United States District Court for the Eastern District of Texas Denying the FLIR Parties’ Amended Rule 54(d) Motion for Attorneys’ Fees and Costs under the Texas Theft Liability Act, the Order Denying the FLIR Parties’ Renewed Motion For Judgment as a Matter Of Law, and the Final Judgment to the extent it denied the FLIR Parties Attorneys’ Fees and Costs under the Texas Theft Liability Act. The United States Court of Appeals for the Federal Circuit heard the matter on January 12, 2018 and a decision is expected later this year. The matter remains ongoing and is subject to appeal. The Company is unable to estimate the amount or range of potential loss or recovery, if any, which might result if the final determination of this matter is favorable or unfavorable, but an adverse ruling on the merits of the original claims against the FLIR Parties, while remote, could be material.
Matters Involving the United States Department of State and Department of Commerce
On October 22, 2014, the Company initially contacted the United States Department of State Office of Defense Trade Controls Compliance (“DDTC”), pursuant to International Traffic in Arms Regulation (“ITAR”) § 127.12(c), regarding the unauthorized export of technical data and defense services to dual and third country nationals in at least four facilities of the Company. On April 27, 2015, the Company submitted its initial report to DDTC regarding the details of the issues raised in the October 22, 2014, submission. DDTC subsequently notified the Company that it was considering administrative proceedings under Part 128 of ITAR and requested a tolling agreement, which the Company executed on June 16, 2015 and referenced certain Company disclosures in addition to the submissions made in conjunction with the October 24, 2014 initial notification. On June 6, 2016, the Company executed a subsequent tolling agreement extending the tolling period for matters to be potentially included in an administrative proceeding for an additional 18 months and at the request of DDTC on December 1, 2017, further extended the tolling agreement for an additional six months through May 9, 2018. DDTC continues its review of the Company’s activities and the Company continues to engage actively with the United States government on these matters.
In May 2017, the Company submitted an initial notification to DDTC regarding potential violations related to certain export classifications obtained through the commodity jurisdiction process and a final voluntary disclosure in August 2017. DDTC acknowledged the notification and at the request of DDTC, the Company executed a tolling agreement for this matter, suspending the statute of limitations through July 2018.
In June 2017, the United States Department of Commerce Bureau of Industry and Security informed the Company of additional export licensing requirements that restrict the Company’s ability to sell 9hz thermal products without a license to customers in China not identified on a list maintained by the United States Department of Commerce. This action was precipitated by concerns of potential diversion of some of the Company's products to prohibited end users and to countries subject to economic and other
30
sanctions implemented by the United States. The United States Department of Commerce Bureau of Industry and Security subsequently favorably modified these restrictions to reduce the applicability of the restrictions to sales of FLIR's Tau camera cores (as opposed to finished products containing Tau camera cores) to customers in China not identified on a list maintained by the United States Department of Commerce and persons in a country other than those in EAR Country Group A:5 (Supplement No. 1 to Part 740 of the EAR). If the Company is found to have violated applicable rules and regulations with respect to customers and limitations on the end use of the Company’s products, the Company could be subject to substantial fines and penalties, suspension of existing licenses or other authorizations and/or loss or suspension of export privileges.
The Company is unable to reasonably estimate the time it may take to resolve these matters or the amount or range of potential loss, penalty or other government action, if any, that may be incurred in connection with these matters. However, an unfavorable outcome could result in substantial fines and penalties or loss or suspension of export privileges or of particular authorizations that could be material to the Company’s financial position, results of operations or cash flows in and following the period in which such an outcome becomes estimable or known.
SkyWatch Product Quality Matters
In March 2016, the Company learned of potential quality concerns with respect to as many as 313 Level III and Level IV SkyWatch Surveillance Towers sold by FLIR and companies acquired by FLIR from 2002 through 2014. The Company notified customers who purchased the affected SkyWatch Towers of the potential concerns and, as a precautionary measure, also temporarily suspended production of all Level III and Level IV SkyWatch Towers pending the completion of its review and the implementation of any necessary remedial measures. During the quarter ended June 30, 2017, the Company identified the cause of these quality issues and began testing certain remedial solutions to repair the affected SkyWatch Towers. Testing of the remedial solution for certain of the product variations affected was also completed during the quarter ended June 30, 2017. Subsequent to the aforementioned identification and testing, customers who purchased the product configurations for which a remedial solution has been identified and tested were notified of their options to request modifications to their fielded units. While there still remains uncertainty related to estimating the costs associated with a potential remedy and number of units which may require such remedy, the Company currently estimates the range of potential loss to be between $6.9 million and $14.6 million. As no single amount within the range is a better estimate than any other amount within the range, the Company has recorded a liability of $6.9 million as of December 31, 2017. Factors underlying this estimated range of loss may change from time to time, and actual results may vary significantly from this estimate.
Other Matters
The Company is also subject to other legal and administrative proceedings, investigations, claims and litigation arising in the ordinary course of business not specifically identified above. In these identified matters and others not specifically identified, the Company records a liability with respect to a matter when management believes it is both probable that a liability has been incurred and the Company can reasonably estimate the amount of the loss. The Company believes it has recorded adequate provisions for any probable and estimable losses for matters in existence on the date hereof. The Company reviews these provisions to reflect the impact of negotiations, settlements, rulings, advice of legal counsel and other information and events pertaining to a particular matter. While the outcome of each of these matters is currently not determinable, the Company does not expect that the ultimate resolution of any such matter will individually have a material adverse effect on the Company’s financial position, results of operations or cash flows. The costs to resolve all such matters may in the aggregate have a material adverse effect on the Company’s financial position, results of operations or cash flows.
ITEM 4. MINE SAFETY DISCLOSURES
Not Applicable.
31
PART II
ITEM 5. | MARKET FOR REGISTRANT’S COMMON EQUITY, RELATED STOCKHOLDER MATTERS AND ISSUER PURCHASES OF EQUITY SECURITIES |
The common stock of the Company has been traded on the NASDAQ Global Market since June 22, 1993, under the symbol “FLIR.” The following table sets forth, for the quarters indicated, the high and low closing sales price for our common stock as reported on the NASDAQ Global Select Market, a segment of the NASDAQ Global Market.
2017 | 2016 | ||||||||||||||
High | Low | High | Low | ||||||||||||
First Quarter | $ | 37.05 | $ | 34.15 | $ | 33.78 | $ | 27.60 | |||||||
Second Quarter | 38.94 | 34.66 | 33.92 | 29.08 | |||||||||||
Third Quarter | 40.66 | 34.10 | 33.23 | 30.41 | |||||||||||
Fourth Quarter | 47.81 | 41.00 | 36.77 | 28.97 | |||||||||||
At December 31, 2017, there were approximately 84 holders of record of our common stock and 138,868,926 shares outstanding. During the year ended December 31, 2016, we paid dividends quarterly at the rate of $0.12 per share for a total of $65.9 million. During the year ended December 31, 2017, we paid dividends quarterly at the rate of $0.15 per share for a total of $82.6 million. On February 8, 2018, the Company’s Board of Directors declared a quarterly dividend of $0.16 per share on its common stock, payable on March 9, 2018, to shareholders of record as of the close of business on February 23, 2018. We currently intend to continue to pay cash dividends to holders of our common stock for the foreseeable future, but such payment remains at the discretion of our Board of Directors and will depend upon many factors, including our financial condition, earnings, and other factors our Board of Directors deems relevant.
The graph below shows a comparison of the five-year cumulative total shareholder return for the Company’s common stock with the cumulative total returns on the Standard & Poor’s (“S&P”) 500 Index and the S&P 500 Electronic Equipment & Instruments Index for the same five-year period. The data used for this graph assumes that $100 was invested in the Company and in each index on December 31, 2012, and that all dividends were reinvested.
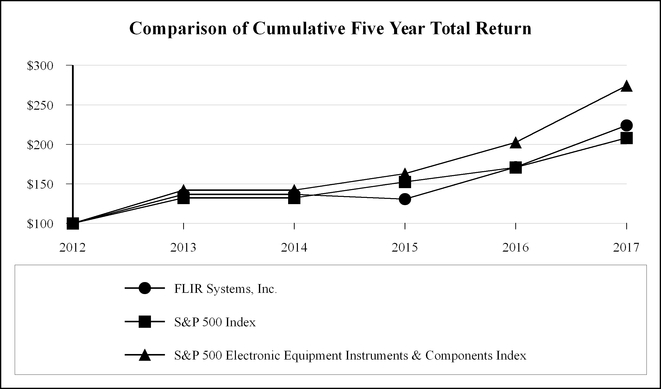
32
The stock performance graph was plotted using the following data:
2012 | 2013 | 2014 | 2015 | 2016 | 2017 | |||||||||||||||||||
FLIR Systems, Inc. | $ | 100.00 | $ | 136.62 | $ | 148.47 | $ | 130.84 | $ | 171.27 | $ | 224.04 | ||||||||||||
S&P 500 Index | 100.00 | 132.39 | 150.51 | 152.59 | 170.84 | 208.14 | ||||||||||||||||||
S&P 500 Electronic Equipment Instruments & Components Index | 100.00 | 142.00 | 174.74 | 162.86 | 202.55 | 274.24 | ||||||||||||||||||
On February 8, 2017, our Board of Directors authorized the repurchase of up to 15.0 million shares of our outstanding common stock. This authorization will expire on February 8, 2019. During 2017, we did not repurchase any common stock.
33
ITEM 6. SELECTED FINANCIAL DATA
The following selected financial data should be read in conjunction with Item 7 “Management’s Discussion and Analysis of Financial Condition and Results of Operations” and Item 8 “Financial Statements and Supplementary Data.”
Year Ended December 31, | ||||||||||||||||||||||
2017 | 2016 | 2015 | 2014 | 2013 | ||||||||||||||||||
(in thousands, except per share amounts) | ||||||||||||||||||||||
Statement of Income Data: | ||||||||||||||||||||||
Revenue | $ | 1,800,434 | $ | 1,662,167 | $ | 1,557,067 | $ | 1,530,654 | $ | 1,496,372 | ||||||||||||
Cost of goods sold | 941,658 | 895,046 | 803,506 | 780,281 | 759,362 | |||||||||||||||||
Gross profit | 858,776 | 767,121 | 753,561 | 750,373 | 737,010 | |||||||||||||||||
Operating expenses: | ||||||||||||||||||||||
Research and development | 170,735 | 147,537 | 132,892 | 142,751 | 147,696 | |||||||||||||||||
Selling, general and administrative | 373,867 | 322,435 | 313,544 | 331,995 | 322,739 | |||||||||||||||||
Restructuring expenses | 625 | 1,431 | 1,361 | 16,383 | 25,832 | |||||||||||||||||
Loss on net assets held for sale | 23,588 | — | — | — | — | |||||||||||||||||
Total operating expenses | 568,815 | 471,403 | 447,797 | 491,129 | 496,267 | |||||||||||||||||
Earnings from operations | 289,961 | 295,718 | 305,764 | 259,244 | 240,743 | |||||||||||||||||
Interest expense | 16,804 | 18,071 | 14,086 | 14,593 | 14,091 | |||||||||||||||||
Interest income | (1,764 | ) | (1,402 | ) | (1,167 | ) | (1,405 | ) | (1,058 | ) | ||||||||||||
Other (income) expense, net | (4,144 | ) | 3,092 | (12,601 | ) | (3) | (3,473 | ) | (1,276 | ) | ||||||||||||
Earnings before income taxes | 279,065 | 275,957 | 305,446 | 249,529 | 228,986 | |||||||||||||||||
Income tax provision | 171,842 | (1) | 109,331 | (2) | 63,760 | 49,268 | 51,971 | |||||||||||||||
Net earnings | $ | 107,223 | $ | 166,626 | $ | 241,686 | $ | 200,261 | $ | 177,015 | ||||||||||||
Net earnings per share: | ||||||||||||||||||||||
Basic earnings per share | $ | 0.78 | $ | 1.22 | $ | 1.73 | $ | 1.42 | $ | 1.24 | ||||||||||||
Diluted earnings per share | $ | 0.77 | $ | 1.20 | $ | 1.72 | $ | 1.39 | $ | 1.22 | ||||||||||||
(1) The 2017 tax provision includes tax expense of $94.4 million resulting from the effects of new US tax legislation commonly referred to as the Tax Cuts and Jobs Act (the "Tax Act") signed into law on December 22, 2017 and our subsequent decision to end permanent reinvestment of all previously unremitted foreign earnings. See Note 14, "Income Taxes," of the Notes to the Consolidated Financial Statements for additional information. | ||||||||||||||||||||||
(2) The 2016 tax provision includes a discrete tax charge for certain tax legislation in Belgium of $39.6 million. See Note 14, "Income Taxes," of the Notes to the Consolidated Financial Statements for additional information. | ||||||||||||||||||||||
(3) Other income in 2015 includes the gain of $20.2 million on the sale of a cost-basis investment in a private technology company. | ||||||||||||||||||||||
December 31, | ||||||||||||||||||||||
2017 | 2016 | 2015 | 2014 | 2013 | ||||||||||||||||||
(in thousands, except per share amounts) | ||||||||||||||||||||||
Balance Sheet Data: | ||||||||||||||||||||||
Working capital | $ | 992,286 | $ | 802,945 | $ | 702,169 | $ | 990,771 | $ | 1,033,216 | ||||||||||||
Total assets | 2,810,026 | 2,619,706 | 2,406,400 | 2,349,311 | 2,343,359 | |||||||||||||||||
Short-term debt | 11 | 15,025 | 264,707 | 15,041 | 15,064 | |||||||||||||||||
Long-term debt, excluding current portion | 420,684 | 501,921 | 93,750 | 357,986 | 372,528 | |||||||||||||||||
Total shareholders’ equity | 1,834,558 | 1,678,326 | 1,649,515 | 1,609,773 | 1,613,380 | |||||||||||||||||
Other Financial Data: | ||||||||||||||||||||||
Cash dividends declared per common share | $ | 0.60 | $ | 0.48 | $ | 0.44 | $ | 0.40 | $ | 0.36 | ||||||||||||
34
ITEM 7. | MANAGEMENT’S DISCUSSION AND ANALYSIS OF FINANCIAL CONDITION AND RESULTS OF OPERATIONS |
Overview
We are a world leader in sensor systems that enhance perception and awareness. We were founded in 1978 and have since become a premier designer, manufacturer, and marketer of thermal imaging and other sensing products and systems. Our advanced sensors and integrated sensor systems enable the gathering and analysis of critical information through a wide variety of applications in commercial, industrial, and government markets worldwide.
Our goal is to both enable our customers to benefit from the valuable information produced by advanced sensing technologies and to deliver sustained superior financial performance for our shareholders. We create value for our customers by providing advanced surveillance and tactical defense capabilities, improving personal and public safety and security, facilitating air, ground, and maritime navigation, enhancing enjoyment of the outdoors, providing infrastructure inefficiency information, conveying pre-emptive structural deficiency data, displaying process irregularities, and enabling commercial business opportunities through our continual support and development of new thermal imaging data and analytics applications. Our business model meets the needs of a wide range of customers – we sell off-the-shelf products to many markets and also offer a variety of system configurations to suit specific customer requirements. Centered on the design of products for low cost manufacturing and high volume distribution, our commercial operating model has been developed over time and provides us with a unique ability to adapt to market changes and meet our customers’ needs.
This Management's Discussion and Analysis of Financial Condition and Results of Operations is prepared and reported based on our reporting structure of six operating segments. For a more detailed description of our segments, see "Business Segments" within Item 1.
International revenue accounted for approximately 47 percent, 46 percent and 47 percent of our revenue in 2017, 2016 and 2015, respectively. We anticipate that international sales will continue to account for a significant percentage of revenue in the future. We have exposure to foreign exchange fluctuations and changing dynamics of foreign competitiveness based on variations in the value of the United States dollar relative to other currencies. Factors contributing to this variability include significant manufacturing activity in Europe, significant sales denominated in currencies other than the United States dollar, and cross currency fluctuations between such currencies as the United States dollar, euro, Swedish kronor and British pound sterling. The impact of those fluctuations is reflected throughout our consolidated financial statements, but in the aggregate, did not have a material impact on our results of operations in 2017.
We experience fluctuations in orders and sales due to seasonal variations and customer sales cycles, such as the seasonal pattern of contracting by the United States and certain foreign governments, the desire of customers to take delivery of equipment prior to fiscal year ends due to funding considerations, and the tendency of commercial enterprises to fully utilize annual capital budgets prior to expiration. Such events have resulted and could continue to result in fluctuations in quarterly results in the future. As a result of such quarterly fluctuations in operating results, we believe that quarter-to-quarter comparisons of our results of operations are not necessarily meaningful and should not be relied upon as indicators of future performance.
We expect that macroeconomic factors, including fluctuations in spending by United States government agencies, rate of GDP growth in certain geographic markets, and fluctuations in foreign currency exchange rates, will continue to impact our financial results and may render predictions regarding future performance difficult to make.
Critical Accounting Policies and Estimates
This discussion and analysis of our financial condition and results of operations is based upon our consolidated financial statements, which have been prepared in accordance with United States generally accepted accounting principles. The preparation of these financial statements requires us to make estimates and judgments that affect the reported amounts of assets, liabilities, revenues and expenses, and related disclosure of contingent assets and liabilities. We evaluate our estimates, including those related to revenue recognition, allowance for doubtful accounts, inventory, goodwill, product warranties, contingencies and income taxes on an on-going basis. We base our estimates on historical experience and on various other assumptions that are believed to be reasonable under the circumstances, the results of which form the basis for making judgments about the carrying value of assets and liabilities that are not readily apparent from other sources. Actual results may differ from these estimates under different assumptions or conditions. Senior management has discussed the development, selection and disclosure of these estimates with the Audit Committee of our Board of Directors. We believe the following critical accounting policies and the related judgments and estimates affect the preparation of our consolidated financial statements.
Revenue recognition. Revenue is recognized when persuasive evidence of an arrangement exists, upon delivery of the product to the customer at a fixed or determinable price with a reasonable assurance of collection, passage of title and risk of loss to the customer as indicated by the contractual terms and fulfillment of all significant obligations.
35
We design, market and sell our products primarily as commercial, off-the-shelf products. Certain customers request different system configurations, generally based on standard options or accessories that we offer. In general, our revenue arrangements do not involve acceptance provisions based upon customer specified acceptance criteria. In those circumstances when customer specified acceptance criteria exist, revenue is deferred until customer acceptance if we cannot demonstrate that the system meets those specifications prior to shipment. For any contracts with multiple elements (i.e., training, installation, additional parts, etc.) we allocate revenue among the deliverables primarily based upon objective and reliable evidence of fair value of each element in the arrangement. If objective and reliable evidence of fair value of any element is not available, we use an estimated selling price for purposes of allocating the total arrangement consideration among the elements. In addition, judgments are required in evaluating the credit worthiness of our customers. Credit is not extended to customers and revenue is not recognized until we have determined that collectability is reasonably assured.
Allowance for doubtful accounts. Our policy is to maintain allowances for estimated losses resulting from the inability of our customers to make required payments. Credit limits are established through a process of reviewing the financial history and stability of each customer. Where appropriate, we obtain credit rating reports and financial statements of the customer when determining or modifying their credit limits. We regularly evaluate the collectability of our trade receivable balances based on a combination of factors. When a customer’s account balance becomes past due, we initiate dialogue with the customer to determine the cause. If it is determined that the customer will be unable to meet its financial obligation to us, such as in the case of a bankruptcy filing, deterioration in the customer’s operating results or financial position or other material events impacting their business, we record a specific allowance to reduce the related receivable to the amount we expect to recover given all information presently available. Actual write-offs during the past three years have not been material to our results of operations.
We also record an allowance for all other customers based on certain other factors including the length of time the receivables are past due and historical collection experience with individual customers. As of December 31, 2017, our accounts receivable balance of $346.7 million is reported net of allowances for doubtful accounts of $7.6 million. We believe our reported allowances at December 31, 2017 are adequate. If the financial conditions of those customers were to deteriorate, however, resulting in their inability to make payments, we may need to record additional allowances that would result in additional selling, general and administrative expenses being recorded for the period in which such determination is made.
Inventory. Our policy is to record inventory write-downs when conditions exist that indicate that our inventories are likely to be in excess of anticipated demand or are obsolete based upon our assumptions about future demand for our products and market conditions. We regularly evaluate the ability to realize the value of our inventories based on a combination of factors including the following: historical usage rates, forecasted sales or usage, product end of life dates, estimated current and future market values and new product introductions. Purchasing requirements and alternative usages are evaluated within these processes to mitigate inventory exposure. When recorded, our write-downs are intended to reduce the carrying value of our inventories to their net realizable value and establishes a new cost basis. As of December 31, 2017, our inventories of $372.2 million are stated net of inventory write-downs. If actual demand for our products deteriorates or market conditions are less favorable than those that we project, additional inventory write-downs may be required in the future.
Goodwill. Goodwill represents the excess purchase price of an acquired enterprise over the estimated fair value of identifiable net assets acquired. We assess goodwill for potential impairment at the reporting unit level during the third quarter of each year, or whenever events or circumstances indicate that the carrying value of these assets may exceed their fair value. We may assess qualitative factors to make this determination, or bypass such a qualitative assessment and proceed directly to testing goodwill for impairment using a two-step process. Qualitative factors we may consider include, but are not limited to, macroeconomic conditions, industry conditions, the competitive environment, changes in the market for our products and services, regulatory and political developments and entity specific factors such as strategies and financial performance. If there are indicators that goodwill has been impaired we proceed to a two-step impairment test, whereby the first step is comparing the fair value of a reporting unit with its carrying amount, including goodwill. If the fair value of the reporting unit exceeds the carrying value, goodwill is not impaired and no further testing is performed. The second step is performed if the carrying value of a reporting unit exceeds its fair value. If the carrying value of a reporting unit’s goodwill exceeds its implied fair value, an impairment loss equal to the difference is recorded. Our impairment test in the current year did not indicate an impairment of goodwill in any of our reporting units.
Product warranties. Our products are sold with warranty provisions that require us to remedy deficiencies in quality or performance of our products over a specified period of time, generally twelve to twenty-four months, at no cost to our customers. Our policy is to record warranty liabilities at levels that represent our estimate of the costs that will be incurred to fulfill those warranty requirements at the time that revenue is recognized. We believe that our recorded liability of $18.1 million at December 31,
36
2017 is adequate to cover our future cost of materials, labor and overhead for the servicing of our products sold through that date. If actual product failures or material or service delivery costs differ from our estimates, our warranty liability would need to be revised accordingly.
Contingencies. We are subject to the possibility of loss contingencies arising in the normal course of business. We consider the likelihood of loss or impairment of an asset or the incurrence of a liability, as well as our ability to reasonably estimate the amount of loss in determining loss contingencies. An estimated loss is accrued when it is probable that an asset has been impaired or a liability has been incurred and the amount can be reasonably estimated. We regularly evaluate current information available to us to determine whether such accruals and disclosures should be adjusted.
Income taxes. We account for income taxes using the asset and liability method, which requires the recognition of deferred tax assets and liabilities for the expected future tax consequences of temporary differences between the carrying amounts and the tax basis of the assets and liabilities measured using the enacted tax rates in effect in the years in which the differences are expected to reverse. Valuation allowances against deferred tax assets are recorded when a determination is made that the deferred tax assets are not more likely than not to be realized in the future. In making that determination, on a jurisdiction by jurisdiction basis, we estimate our future taxable income based upon historical operating results and external market data. Future levels of taxable income are dependent upon, but not limited to, general economic conditions, competitive pressures and other factors beyond our control. As of December 31, 2017, we have determined that a valuation allowance against our deferred tax assets of $3.4 million is required. If we should determine that we may be unable to realize our deferred tax assets to the extent reported, an adjustment to the deferred tax assets would be recorded in the period such determination is made.
We are subject to income taxes in the United States and in numerous foreign jurisdictions, and in the ordinary course of business, there are many transactions and calculations where the ultimate tax determination is uncertain. We record a benefit on a tax position when we determine that it is more likely than not that the position is sustainable upon examination, including resolution of any related appeals or litigation processes, based on the technical merits of the position. For tax positions that are more likely than not to be sustained, we measure the tax position at the largest amount of benefit that has a greater than 50 percent likelihood of being realized when it is effectively settled, using information that is available at the reporting date. We review our tax positions as circumstances warrant, and update our liability for additional taxes as changes in available facts arise.
37
Consolidated Operating Results
The following table sets forth for the indicated periods certain items as a percentage of revenue:
Year Ended December 31,(1) | ||||||||
2017 | 2016 | 2015 | ||||||
Revenue | 100.0 | % | 100.0 | % | 100.0 | % | ||
Cost of goods sold | 52.3 | 53.8 | 51.6 | |||||
Gross margin | 47.7 | 46.2 | 48.4 | |||||
Operating expenses: | ||||||||
Research and development | 9.5 | 8.9 | 8.5 | |||||
Selling, general and administrative | 20.8 | 19.4 | 20.1 | |||||
Restructuring expenses | — | 0.1 | 0.1 | |||||
Loss on net assets held for sale | 1.3 | — | — | |||||
Total operating expenses | 31.6 | 28.4 | 28.8 | |||||
Earnings from operations | 16.1 | 17.8 | 19.6 | |||||
Interest expense | 0.9 | 1.1 | 0.9 | |||||
Interest income | (0.1 | ) | (0.1 | ) | (0.1 | ) | ||
Other (income) expense, net | (0.2 | ) | 0.2 | (0.8 | ) | |||
Earnings before income taxes | 15.5 | 16.6 | 19.6 | |||||
Income tax provision | 9.5 | 6.6 | 4.1 | |||||
Net earnings | 6.0 | % | 10.0 | % | 15.5 | % | ||
_______________
(1) | Totals may not recompute due to rounding. |
The following discussion of operating results provides an overview of our operations by addressing key elements in our Consolidated Statements of Income. The “Segment Operating Results” section that follows describes the contributions of each of our business segments to our consolidated revenue and earnings from operations for 2017, 2016 and 2015. Given the nature of our business, we believe revenue and earnings from operations (including operating margin percentage) are most relevant to an understanding of our performance at a segment level. Additionally, at the segment level we disclose backlog, which represents orders received for products or services for which a sales agreement is in place and delivery is expected within twelve months. Backlog is not an absolute indicator of future revenue because a portion of the orders in backlog could be canceled at the customer's discretion. While the backlog is subject to order cancellations, we have not historically experienced a significant number of order cancellations.
Revenue. Revenue for 2017 totaled $1,800.4 million, an increase of 8.3 percent from 2016 revenue of $1,662.2 million. Year over year revenue increased for all segments except in our Security segment. The acquisitions of Armasight, Prox Dynamics, and Point Grey were the primary drivers in revenue growth for the year ended December 31, 2017.
Revenue for 2016 totaled $1,662.2 million, an increase of 6.7 percent over 2015 revenue of $1,557.1 million. Year over year revenue growth was primarily due to increases in our OEM & Emerging, Surveillance, and Security segments, partially offset by a decline in our Instruments segment. Acquisitions made during the year ended December 31, 2016 constitute approximately 2.1% of consolidated revenue in 2016.
International revenue in 2017 totaled $844.0 million, representing 46.9 percent of revenue. This compares with international revenue in 2016 which totaled $758.6 million, representing 45.6 percent of revenue, and $726.6 million in 2015, representing 46.7 percent of revenue. While the sales mix between United States and international sales may fluctuate from year to year, we expect revenue from customers outside the United States to continue to comprise a significant portion of our total revenue on a long-term basis.
Cost of goods sold. Cost of goods sold for the years ended December 31, 2017 and 2016 was $941.7 million and $895.0 million, respectively. The increase is primarily due to the increase in revenues year over year as discussed above and changes in product mix.
38
Cost of goods sold in 2016 was $895.0 million, compared to cost of goods sold of $803.5 million in 2015. The increase is primarily due to the increase in revenues year over year as discussed above and changes in product mix and increased manufacturing variances and period costs.
Cost of goods sold includes materials, labor and overhead costs incurred in the manufacturing of products and services sold in the period as well as warranty costs. Material costs include raw materials, purchased components and sub-assemblies, outside processing and inbound freight costs. Labor and overhead costs consist of direct and indirect manufacturing costs, including wages and fringe benefits, operating supplies, depreciation and amortization, occupancy costs, and purchasing, receiving and inspection costs.
Gross profit. Gross profit for the year ended December 31, 2017 was $858.8 million compared to $767.1 million in 2016. Gross margin, defined as gross profit divided by revenue, increased from 46.2 percent in 2016 to 47.7 percent in 2017 primarily due to favorable product mix.
Gross profit for the year ended December 31, 2016 was $767.1 million compared to $753.6 million in 2015. Gross margin decreased from 48.4 percent in 2015 to 46.2 percent in 2016 primarily due to changes in product mix and increased manufacturing variances and period costs.
Research and development. Research and development expenses were $170.7 million, or 9.5 percent of revenue, in 2017, compared to $147.5 million, or 8.9 percent of revenue, in 2016, and $132.9 million, or 8.5 percent of revenue, in 2015. The increase in research and development expenses year over year in 2017 was primarily related to the inclusion of companies acquired in 2015 and 2016.
We intend to continue to have significant research and development expenses in the future to provide a continuing flow of innovative and high-quality products that maintain and enhance our competitive position in each of our business segments. We believe that future cash flow generation will be sufficient to support the development of new products that fuel the growth of the business.
Selling, general and administrative expenses. Selling, general and administrative expenses were $373.9 million, or 20.8 percent of revenue, in 2017 compared to $322.4 million, or 19.4 percent of revenue, in 2016 and $313.5 million, or 20.1 percent of revenue, in 2015. The increase in selling, general and administrative expenses year over year in 2017 and 2016 was primarily due to an increase in selling expenses to support the increase in revenue mentioned above as well as increased operating expenses associated with the acquisitions in November 2016. The decrease in selling, general, and administrative expenses as a percentage of revenue in 2016 compared to 2015 is due to the successful implementation of cost cutting measures in 2016. While selling, general and administrative expenses may be affected in the future by acquisitions with different cost structures, we anticipate selling, general and administrative expenses to increase at a slower rate than revenue in our existing businesses.
Restructuring expenses. During the years ended December 31, 2017, 2016 and 2015, we recorded net pre-tax restructuring expenses totaling $0.6 million, $1.4 million and $1.4 million, respectively. Restructuring expenses recorded in 2017, 2016 and 2015 were recorded in operating expenses. In the fourth quarter of 2013, we initiated a realignment plan that included closing six not-to-scale sites in the United States and Europe and a transfer of those operations to larger facilities. We also consolidated our optics and laser manufacturing businesses to better realize the benefits of vertical integration in these areas. The benefits from these actions are reflected in our operating results. The majority of the actions in our realignment plan were completed in 2016.
Loss on net assets held for sale. During the fourth quarter of 2017, we recorded a pre-tax loss on net assets held for sale of $23.6 million. The loss on net assets held for sale was related to the planned divestiture of our consumer and small and medium-sized visible-spectrum security business. See Note 18, "Business Acquisitions and Divestitures," to the Consolidated Financial Statements in Item 8 for additional information.
Interest expense. Interest expense totaled $16.8 million, $18.1 million and $14.1 million for the years ended December 31, 2017, 2016 and 2015, respectively. Interest expense for the year was primarily associated with the $425 million aggregate principal amount of 3.125 percent senior unsecured notes that were issued in June 2016, and amounts drawn under our credit facility, which was repaid in August 2017. The decrease in interest expense in 2017 compared to 2016 was primarily due to the $1.3 million loss incurred in 2016 on extinguishment of our debt. The increase in interest expense in 2016 compared to 2015 is primarily due to the
39
increased amount of interest bearing debt as well as a $1.3 million loss on the extinguishment of the $250 million aggregate principal amount of our 3.75 percent senior unsecured notes that were repaid in July 2016.
Other (income) expense, net. Other income totaled $4.1 million for the year ended December 31, 2017. Other expense totaled $3.1 million for the year ended December 31, 2016 and other income totaled $12.6 million for the year ended December 31, 2015. The change in other (income) expense, net in 2017 over 2016 is primarily attributed to decreased losses on currency exchange rate fluctuations. The change in other (income) expenses, net in 2016 compared to 2015 is primarily attributed to the $20.2 million gain on the sale of our cost-basis investment in a private technology company during the year ended December 31, 2015.
Income taxes. Our income tax provision was $171.8 million, $109.3 million and $63.8 million in 2017, 2016 and 2015, respectively. The effective tax rates for 2017, 2016 and 2015 were 61.6 percent, 39.6 percent and 20.9 percent, respectively. Our effective tax rate in 2017 is higher than the United States federal tax rate of 35 percent mainly due to our estimate of the impact of the Tax Cuts and Jobs Act (the "Tax Act") , including $66.5 million for deemed distributions of previously unremitted foreign earnings, $12.8 million for revaluation of deferred tax items and $15.1 million for estimated state and foreign taxes due on distribution of previously unremitted foreign earnings. Unrecognized tax benefits for intercompany pricing increased in various jurisdictions in 2017, but this was partially offset by excess tax benefits for stock compensation and the mix of lower foreign tax rates applied to foreign earnings. In 2016, our effective tax was higher than the United States federal tax rate of 35 percent due mainly to an accrual of $39.6 million by one of our international subsidiaries in response to the European Commission’s decision regarding certain tax legislation in Belgium. In 2015, our effective tax was lower than the United States federal tax rate of 35 percent due primarily to the release of valuation allowance previously recorded against foreign deferred tax assets, and the mix of lower tax rates applied to foreign earnings. We expect the effective tax rate for 2018 to be approximately 21.5 percent excluding discrete items.
At December 31, 2017, we had United States tax net operating loss carry-forwards totaling approximately $3.9 million which expire between 2019 and 2031 and are subject to annual limitation under Section 382 of the US Internal Revenue Code. In addition, we have various state net operating loss carry-forwards totaling approximately $0.9 million which expire between 2023 and 2036. Finally, we have various foreign net operating loss carry-forwards totaling approximately $111.1 million, a portion of which expire between 2018 and 2036 and a portion of which have an indefinite carry-forward period.
Tax benefits as described above are recorded as assets when the benefits are more likely than not to be recognized. To the extent that we assess the realization of such assets to not be more likely than not, a valuation allowance is required to be recorded. As of December 31, 2017, we have determined that a valuation allowance against our deferred tax assets of $3.4 million is required, primarily related to certain foreign deductions carried forward and acquired net operating losses. A review of all available positive and negative evidence is considered, including past and future performance, the market environment in which we operate, utilization of tax attributes in the past, length of carry-back and carry-forward periods, and evaluation of potential tax planning strategies, when evaluating whether the deferred tax assets will be realized.
On January 11, 2016, the European Commission announced a decision concluding that certain rules under Belgian tax legislation are deemed to be incompatible with European Union regulations on state aid. As a result of this decision, the European Commission has directed the Belgian Government to recover past taxes from certain entities, reflective of disallowed state aid, which impacts one of our international subsidiaries. The Belgian Government announced they have appealed this decision and filed action for an annulment in the General Court of the European Union, and in July 2016 we filed a separate appeal with the General Court of the European Union. In accordance with the Financial Accounting Standards Board Accounting Standards Codification Topic 740, “Income Taxes,” we recorded discrete tax expense of $39.6 million during 2016 related to this matter and on January 10, 2017, received tax assessments from the Belgium government for a similar amount, which we have classified as current taxes payable on the Consolidated Balance Sheet as of December 31, 2017. We have filed a complaint against the Belgian tax assessments, and the result of this complaint, the appeal with the General Court of the European Union, new information received from the Belgian Government, or other future events may cause the income tax provision associated with the decision to be entirely or partially reversed.
Segment Operating Results
As of December 31, 2017 and for the three year period ending, we have six reportable operating segments. The following discusses the operating results of each of our segments for that three year period.
40
Surveillance
Surveillance operating results are as follows (in millions, except percentages):
Year Ended December 31, | |||||||||||
2017 | 2016 | 2015 | |||||||||
Revenue | $ | 545.8 | $ | 532.5 | $ | 503.0 | |||||
Earnings from operations | 152.0 | 151.5 | 149.6 | ||||||||
Operating margin | 27.8 | % | 28.5 | % | 29.7 | % | |||||
Backlog | 354 | 328 | 309 | ||||||||
Surveillance revenue increased by 2.5 percent in 2017 compared to 2016. The increase in revenue in 2017 compared to 2016 was predominately due to the addition of Armasight and Prox Dynamics, which were acquired in 2016. Earnings from operations increased by 0.3 percent in 2017 compared to 2016. The slight increase in earnings from operations was primarily due to higher revenues and favorable product mix, partially offset by increased operating expenses from the acquired businesses. The increased backlog in the Surveillance segment is largely attributed to the $74.7 million contract for land surveillance systems from the United States Army received in September 2017.
Surveillance revenue increased by 5.9 percent in 2016 compared to 2015. The increase in revenue was primarily due to the acquisition of Armasight in June 2016. Earnings from operations increased by 1.3 percent in 2016 compared to 2015. The increase in earnings from operations was primarily due to the Armasight acquisition.
Instruments
Instruments operating results are as follows (in millions, except percentages):
Year Ended December 31, | |||||||||||
2017 | 2016 | 2015 | |||||||||
Revenue | $ | 357.8 | $ | 336.1 | $ | 347.5 | |||||
Earnings from operations | 106.9 | 98.8 | 115.1 | ||||||||
Operating margin | 29.9 | % | 29.4 | % | 33.1 | % | |||||
Backlog | 30 | 27 | 27 | ||||||||
Instruments segment revenue increased by 6.5 percent in 2017 compared to 2016. The increase in revenue for 2017 was predominately attributable to strength in the premium and volume handheld product lines driven by new product launches, supplemented by growth in optical gas and fire products. The revenue growth was partially offset by declines in the test and measurement product lines. Earnings from operations increased 8.2 percent in 2017 compared to 2016. The increase was primarily due to the higher revenue base.
Instruments revenue decreased by 3.3 percent in 2016 compared to 2015. The decrease in revenue was primarily due to a revenue decline in Europe and APAC regions. On a product line basis, declines in our building and predictive maintenance and science products lines were partially offset by increases in our firefighting and automation products lines. Earnings from operations decreased 14.2 percent in 2016 compared to 2015. The decrease in earnings from operations was due to a change in product mix, as we sold more products with lower gross margins in 2016 compared to 2015, and increased manufacturing cost under-absorption.
41
Security
Security operating results are as follows (in millions, except percentages):
Year Ended December 31, | |||||||||||
2017 | 2016 | 2015 | |||||||||
Revenue | $ | 231.5 | $ | 240.0 | $ | 226.6 | |||||
Earnings from operations | 13.8 | 15.9 | 29.4 | ||||||||
Operating margin | 5.9 | % | 6.6 | % | 13.0 | % | |||||
Backlog | 23 | 21 | 16 | ||||||||
Security segment revenue decreased by 3.6 percent in 2017 compared to 2016. The decrease in revenue was primarily due to a reduction in sales for consumer-grade security products. Earnings from operations decreased 13.4 percent in 2017 compared to 2016. The decrease in earnings from operations was due to lower revenues and lower operating margins in the consumer-grade business.
Security segment revenue for the year ended December 31, 2016 increased by 5.9 percent. The increase in revenue was primarily due to the acquisition of DVTEL in November 2015 and the inclusion of the associated revenues in the current year, partially offset by a decrease in consumer-grade security products. The decrease in earnings from operations in 2016 of 45.9 percent over 2015 was primarily due higher operating expenses associated with the DVTEL acquisition.
OEM & Emerging Markets
OEM & Emerging Markets operating results are as follows (in millions, except percentages):
Year Ended December 31, | |||||||||||
2017 | 2016 | 2015 | |||||||||
Revenue | $ | 347.2 | $ | 243.7 | $ | 186.7 | |||||
Earnings from operations | 103.3 | 66.1 | 43.7 | ||||||||
Operating margin | 29.8 | % | 27.1 | % | 23.4 | % | |||||
Backlog | 169 | 143 | 140 | ||||||||
OEM & Emerging Markets segment revenue increased by 42.5 percent in 2017 compared to 2016. The increase in revenue in 2017 was primarily due to the Point Grey acquisition in 2016 and growth in our cores and traffic product lines. Earnings from operations increased 56.2 percent in 2017 compared to 2016. The increase in earnings from operations is primarily due to the increase in revenue. The increase in backlog for the OEM & Emerging Markets segment was primarily attributed to orders growth in our Integrated Imaging Solutions group which includes the Point Grey acquisition.
OEM & Emerging Markets segment revenue increased by 30.5 percent in 2016 compared to 2015, primarily due to higher deliveries in most of the segment product lines, particularly in cores and components and mobile accessories, and the acquisition of Point Grey in November 2016. Earnings from operations increased in 2016 compared to 2015, primarily due to the increase in revenue.
Maritime
Maritime operating results are as follows (in millions, except percentages):
Year Ended December 31, | |||||||||||
2017 | 2016 | 2015 | |||||||||
Revenue | $ | 189.7 | $ | 185.7 | $ | 177.9 | |||||
Earnings from operations | 23.0 | 18.6 | 17.4 | ||||||||
Operating margin | 12.1 | % | 10.0 | % | 9.8 | % | |||||
Backlog | 17 | 16 | 28 | ||||||||
42
Maritime segment revenue increased by 2.1 percent in 2017 compared to 2016. The increase in revenue in 2017 was driven by sales on the new Axiom line of multi-function displays which began shipping during the second quarter of 2017, partially offset by a decline in thermal camera sales. Earnings from operations increased 24.0 percent in 2017 compared to 2016. The increase in operating income in 2017 was driven by stronger margins on shipments of new products introduced in 2017.
Maritime segment revenue for 2016 increased by 4.4 percent compared to 2015 primarily due to an increase in revenue from the Americas and Europe regions. On a product basis, increased shipments of multifunction displays, radar, and thermal cameras more than offset declines in autopilot and instrument shipments. Earnings from operations increased 6.8 percent in 2016 compared to 2015. The increase in earnings from operations is due to an increase in revenue and a decrease in operating expenses, partially offset by an increase in warranty costs.
Detection
Detection operating results are as follows (in millions, except percentages):
Year Ended December 31, | |||||||||||
2017 | 2016 | 2015 | |||||||||
Revenue | $ | 128.5 | $ | 124.1 | $ | 115.3 | |||||
Earnings from operations | 36.1 | 35.3 | 30.3 | ||||||||
Operating margin | 28.1 | % | 28.4 | % | 26.2 | % | |||||
Backlog | 59 | 57 | 82 | ||||||||
Detection segment revenue increased by 3.5 percent in 2017 compared to 2016, due to higher shipments of our CBRNE threat response systems to the United States government customers and higher sales of our ChemBio and Radiation products. Earnings from operations increased 2.5 percent in 2017 compared to 2016, primarily due to higher revenues in 2017.
Detection segment revenue for 2016 increased by 7.7 percent compared to 2015. The increase in revenue was primarily due to increased shipments from our CBRNE threat response systems to United States government customers. Earnings from operations increased 16.6 percent in 2016 compared to 2015. The increase in earnings from operations and operating margin were primarily due to increases in revenue and reduced operating expenses. The decrease in backlog was primarily due to significant orders for our CBRNE threat response systems that were received in the first quarter and fourth quarter of 2015 and delivered in 2016.
43
Liquidity and Capital Resources
At December 31, 2017, we had a total of $519.1 million in cash and cash equivalents, $228.9 million of which was in the United States and $290.2 million at our foreign subsidiaries, compared to cash and cash equivalents at December 31, 2016 of $361.3 million, of which $98.3 million was in the United States and $263.0 million at our foreign subsidiaries. The increase in cash and cash equivalents in 2017 was primarily due to cash provided from operations of $308.3 million and proceeds of $58.2 million from share issuances pursuant to our stock plans, partially offset by the pay down on our revolving credit facility of $97.5 million, dividend payments of $82.6 million, and capital expenditures of $42.1 million.
Cash provided by operating activities in 2017 totaled $308.3 million compared to $319.8 million in 2016 and $293.4 million in 2015. The decrease in cash provided from operations in 2017 compared to 2016 was primarily due to changes in current balances. The increase in cash provided from operations in 2016 compared to 2015 was primarily due to changes in current balances and accrued income taxes.
Cash used for investing activities for the year ended December 31, 2017 totaled $38.4 million, primarily consists of capital expenditures of $42.1 million. Cash used for investing activities for the year ended December 31, 2016 totaled $447.8 million, consisting of $419.2 million spent primarily on the acquisitions of Innovative Security Designs, LLC, Armasight, Inc, Point Grey Research Inc. and Prox Dynamics AS, and capital expenditures of $35.9 million. Cash used for investing activities for the year ended December 31, 2015 totaled $134.8 million, consisting of $92.3 million for the acquisition of DVTEL, Inc. and capital expenditures of $68.2 million, partially offset by $25.6 million of proceeds from the sale of an investment in a third party. Capital expenditures in 2015 included $33.0 million for building improvements for our new facility in Goleta, California.
Cash used by financing activities for the year ended December 31, 2017 totaled $132.6 million, which primarily consisted of repayment of borrowings under our revolving credit facility and the payment of quarterly dividends, partially offset by proceeds from share issuances pursuant to our stock plans. Cash provided by financing activities for the year ended December 31, 2016 totaled $31.1 million, primarily consisting of the net proceeds from long-term debt and the new credit agreement, partially offset by the repayment of long-term debt, repurchases of common stock and the payment of dividends. Cash used by financing activities for the years ended December 31, 2015 totaled $184.1 million, primarily consisting of the repurchase of shares of our common stock and the payment of dividends, partially offset by proceeds from shares issued pursuant to stock-based compensation plans.
On February 8, 2011, we entered into a Credit Agreement (“Credit Agreement”) with Bank of America, N.A., U.S. Bank National Association, JPMorgan Chase Bank N.A. and other Lenders. The Credit Agreement provided for a $200 million, five-year revolving line of credit. On April 5, 2013, the Credit Agreement was amended to extend the maturity of the revolving credit facility from April 8, 2016 to April 5, 2018, in addition to incorporating a $150 million term loan facility maturing April 5, 2019. On May 31, 2016, the Credit Agreement was further amended to increase the borrowing capacity to $500 million and to extend the maturity of the revolving credit facility from April 5, 2018 to May 31, 2021. The amendment also incorporated a revised schedule of fees and interest rates. We have the right, subject to certain conditions, including approval of additional commitments by qualified lenders, to increase the revolving line of credit under the Credit Agreement by an additional $200 million until May 31, 2021. The Credit Agreement allows us and certain designated subsidiaries to borrow in United States dollars, European euros, Swedish kronor, British pound sterling, Japanese yen, Canadian dollars, Australian dollars, and other agreed upon currencies. Interest rates under the Credit Agreement are determined based on the type of borrowing. Interest associated with borrowings can be based on either the prime lending rate of Bank of America, N.A. or the published Eurocurrency rate (i.e. LIBOR). The borrowings have an applicable margin that ranges from 0.125 percent to 2.125 percent depending on the applicable base rate and our consolidated total leverage ratio. Including the respective spreads, the one-month Eurocurrency-based borrowing rate was 2.944 percent per annum and the prime lending-based borrowing rate was 4.875 percent per annum at December 31, 2017. The Credit Agreement requires us to pay a commitment fee on the amount of unused revolving commitments at a rate, based on our total leverage ratio, which ranges from 0.150 percent to 0.300 percent of unused revolving commitments. At December 31, 2017, the commitment fee on the amount of unused revolving credit was 0.175 percent per annum. The Credit Agreement contains two financial covenants that require the maintenance of a total leverage ratio and an interest coverage ratio, with which the Company was in compliance at December 31, 2017. The credit facilities available under the Credit Agreement are unsecured.
On May 31, 2016, the Company drew down $105 million under the revolving credit facility and repaid the term loan originally issued under the credit agreement dated April 5, 2013. Interest was accrued and paid monthly based on the one-month LIBOR rate. To manage the interest rate risk arising from the variability in monthly interest expense attributable to amounts drawn under the revolver, the Company entered into two amortizing interest rate swaps with an aggregate of $105 million. The interest rate swaps were designated, and effective, as cash flow hedges.
44
During the year ended December 31, 2017, the Company repaid all amounts outstanding under the revolving credit facility. Concurrently, the Company exited both interest rate swaps which had a combined notional value at the time of $86.3 million. We had $18.4 million of letters of credit outstanding under the Credit Agreement at December 31, 2017, which reduced the total available revolving credit under the Credit Agreement.
In June 2016, we issued $425 million aggregate principal amount of our 3.125 percent senior unsecured notes due June 15, 2021 (the “Notes”). The net proceeds from the issuance of the Notes were approximately $421.0 million, after deducting underwriting discounts and offering expenses, which are being amortized over a period of five years. Interest on the Notes is payable semiannually in arrears on December 15 and June 15. The proceeds from the Notes were used to repay our 3.75 percent senior unsecured notes that were due September 1, 2016, and are being used for general corporate purposes, which include working capital and capital expenditure needs, business acquisitions, and repurchases of our common stock.
On February 5, 2015, our Board of Directors authorized the repurchase of up to 15.0 million shares of our outstanding common stock. An aggregate of 6.3 million shares were repurchased under this authorization, which expired on February 5, 2017. On February 8, 2017, our Board of Directors authorized the repurchase of up to 15.0 million shares of our outstanding common stock. This authorization will expire on February 8, 2019. As of December 31, 2017, no shares have been repurchased under the February 8, 2017 authorization.
In accordance with the Tax Act, the Company has accrued $66.5 million of United States taxes payable on all previously undistributed earnings of the Company's foreign subsidiaries, estimated to be approximately $1.0 billion as of December 31, 2017. The Company has also recorded deferred tax liabilities of $15.1 million for state and foreign taxes estimated to be due upon distribution of all accumulated earnings by the Company's foreign subsidiaries.
We believe that our existing cash combined with the cash we anticipate generating from operating activities, and our available credit facilities and financing available from other sources will be sufficient to meet our cash requirements for the next twelve months. We do not have any significant commitments nor are we aware of any significant events or conditions that are likely to have a material impact on our liquidity or capital resources.
Off-Balance Sheet Arrangements
As of December 31, 2017, we leased our non-owned facilities under operating lease agreements. We also leased certain operating machinery and equipment and office equipment under operating lease agreements. Except for these operating lease agreements, we do not have any off-balance sheet arrangements that have or are likely to have a material current or future effect on our financial condition, revenues or expenses, results of operations, liquidity, capital expenditures or capital resources.
45
Contractual Obligations
As of December 31, 2017, our contractual obligations were as follows (in thousands):
Payments Due by Period | |||||||||||||||||||
Total | Less than 1 Year | 1 – 3 Years | 3 – 5 Years | More than 5 Years | |||||||||||||||
Long-term debt, including interest | $ | 471,485 | $ | 13,281 | $ | 26,563 | $ | 431,641 | $ | — | |||||||||
Operating leases | 30,898 | 9,877 | 11,743 | 7,181 | 2,097 | ||||||||||||||
Licensing rights | 550 | 550 | — | — | — | ||||||||||||||
Post-retirement obligations | 9,615 | 6,387 | 868 | 826 | 1,534 | ||||||||||||||
Belgium tax assessment | 44,740 | 44,740 | — | — | — | ||||||||||||||
Other obligations | 216 | 216 | — | — | — | ||||||||||||||
$ | 557,504 | $ | 75,051 | $ | 39,174 | $ | 439,648 | $ | 3,631 | ||||||||||
Principal and interest on long-term debt, operating leases and licensing rights obligations are based upon contractual terms. Actual payments may differ in terms of both timing and amounts. We did not include approximately $18.4 million of standby letters of credit and performance bonds due to the unlikely event of payment, if any, of amounts under those arrangements.
Aside from $44.7 million related to the Belgian tax assessment, the Company cannot make a reasonably reliable estimate of the period of potential cash settlement of its remaining unrecognized tax benefits of $32.6 million and, therefore, has not included the related unrecognized tax benefits in the table of contractual obligations as of December 31, 2017. For further detail on unrecognized tax benefits, see Note 14, "Income Taxes," to the Consolidated Financial Statements in Item 8.
Recent Accounting Pronouncements
See Note 1, "Nature of Business and Significant Accounting Policies," to the Consolidated Financial Statements in Item 8 for a discussion of recent accounting pronouncements.
46
ITEM 7A. | QUANTITATIVE AND QUALITATIVE DISCLOSURES ABOUT MARKET RISK |
Foreign Currency Exchange Rate Risk
We have assets and liabilities outside the United States that are subject to fluctuations in foreign currency exchange rates. Similarly, certain revenues from products sold in countries outside the United States and costs associated with non-United States operations are denominated in foreign currencies. For more information on our foreign currency translation, see Note 1, "Nature of Business and Significant Accounting Policies," to the Consolidated Financial Statements in Item 8. Assets and liabilities located outside the United States are primarily located in Europe. Our investments in subsidiaries outside the United States with functional currencies other than the United States dollar are considered long-term. We currently engage in forward currency exchange contracts and other similar hedging activities to reduce our economic exposure to changes in exchange rates. At December 31, 2017, exchange contracts with a notional amount of approximately $153.0 million were outstanding. Because we market, sell and license our products throughout the world, we could be adversely affected by weak economic conditions in international markets that could reduce demand for our products.
Our net investment in subsidiaries outside the United States, translated into United States dollars using the period-end exchange rates, was approximately $984.2 million at December 31, 2017. The potential loss in fair value resulting from a hypothetical 10 percent adverse change in foreign exchange rates would be approximately $98.4 million at December 31, 2017. The potential loss in fair value is primarily due to the increase in the net investment of subsidiaries outside the United States. We have no plans to liquidate any of our subsidiaries outside the United States, and therefore, foreign exchange rate gains or losses on our international investments are reflected as a cumulative translation adjustment and do not increase or reduce our reported net earnings.
Interest Rate Risk
Our exposure to changes in market interest rates relate primarily to interest paid on future hypothetical drawings against the Credit Agreement. Amounts borrowed under our revolving loan facility bears interest at the one-month LIBOR rate plus a scheduled spread. Fluctuations in market interest rates will cause interest expense increases or decreases on such long-term debt.
To mitigate the risk of changes in cash flows attributable to changes in the one-month LIBOR rate for hypothetical drawings against the revolving loan facility, the Company could consider interest rate swaps as effective cash flow hedges.
See Liquidity and Capital Resources in Item 7 and Note 3, "Derivative Financial Instruments," Note 9, "Credit Agreement," and Note 11, "Long-Term Debt," to the Consolidated Financial Statements in Item 8, for additional information on the Company's interest rate risk.
47
ITEM 8. | FINANCIAL STATEMENTS AND SUPPLEMENTARY DATA |
This item includes the following financial information:
Statement | Page |
48
Report of Independent Registered Public Accounting Firm
To the shareholders and board of directors
FLIR Systems, Inc.:
Opinion on the Consolidated Financial Statements
We have audited the accompanying consolidated balance sheets of FLIR Systems, Inc. and subsidiaries (the Company) as of December 31, 2017 and 2016, the related consolidated statements of income, comprehensive income, shareholders’ equity, and cash flows for each of the years in the three‑year period ended December 31, 2017, and the related notes (collectively, the consolidated financial statements). In our opinion, the consolidated financial statements present fairly, in all material respects, the financial position of the Company as of December 31, 2017 and 2016, and the results of its operations and its cash flows for each of the years in the three‑year period ended December 31, 2017, in conformity with U.S. generally accepted accounting principles.
We also have audited, in accordance with the standards of the Public Company Accounting Oversight Board (United States) (PCAOB), the Company’s internal control over financial reporting as of December 31, 2017, based on criteria established in Internal Control - Integrated Framework (2013) issued by the Committee of Sponsoring Organizations of the Treadway Commission, and our report dated February 23, 2018 expressed an unqualified opinion on the effectiveness of the Company’s internal control over financial reporting.
Basis for Opinion
These consolidated financial statements are the responsibility of the Company’s management. Our responsibility is to express an opinion on these consolidated financial statements based on our audits. We are a public accounting firm registered with the PCAOB and are required to be independent with respect to the Company in accordance with the U.S. federal securities laws and the applicable rules and regulations of the Securities and Exchange Commission and the PCAOB.
We conducted our audits in accordance with the standards of the PCAOB. Those standards require that we plan and perform the audit to obtain reasonable assurance about whether the consolidated financial statements are free of material misstatement, whether due to error or fraud. Our audits included performing procedures to assess the risks of material misstatement of the consolidated financial statements, whether due to error or fraud, and performing procedures that respond to those risks. Such procedures included examining, on a test basis, evidence regarding the amounts and disclosures in the consolidated financial statements. Our audits also included evaluating the accounting principles used and significant estimates made by management, as well as evaluating the overall presentation of the consolidated financial statements. We believe that our audits provide a reasonable basis for our opinion.
/s/ KPMG LLP
We have served as the Company’s auditor since 2002.
Portland, Oregon
February 23, 2018
49
FLIR SYSTEMS, INC. CONSOLIDATED STATEMENTS OF INCOME (in thousands, except per share amounts) | |||||||||||
Year Ended December 31, | |||||||||||
2017 | 2016 | 2015 | |||||||||
Revenue | $ | 1,800,434 | $ | 1,662,167 | $ | 1,557,067 | |||||
Cost of goods sold | 941,658 | 895,046 | 803,506 | ||||||||
Gross profit | 858,776 | 767,121 | 753,561 | ||||||||
Operating expenses: | |||||||||||
Research and development | 170,735 | 147,537 | 132,892 | ||||||||
Selling, general and administrative | 373,867 | 322,435 | 313,544 | ||||||||
Restructuring expenses | 625 | 1,431 | 1,361 | ||||||||
Loss on net assets held for sale | 23,588 | — | — | ||||||||
Total operating expenses | 568,815 | 471,403 | 447,797 | ||||||||
Earnings from operations | 289,961 | 295,718 | 305,764 | ||||||||
Interest expense | 16,804 | 18,071 | 14,086 | ||||||||
Interest income | (1,764 | ) | (1,402 | ) | (1,167 | ) | |||||
Other (income) expense, net | (4,144 | ) | 3,092 | (12,601 | ) | ||||||
Earnings before income taxes | 279,065 | 275,957 | 305,446 | ||||||||
Income tax provision | 171,842 | 109,331 | 63,760 | ||||||||
Net earnings | $ | 107,223 | $ | 166,626 | $ | 241,686 | |||||
Net earnings per share: | |||||||||||
Basic earnings per share | $ | 0.78 | $ | 1.22 | $ | 1.73 | |||||
Diluted earnings per share | $ | 0.77 | $ | 1.20 | $ | 1.72 | |||||
The accompanying notes are an integral part of these consolidated financial statements.
50
FLIR SYSTEMS, INC. CONSOLIDATED STATEMENTS OF COMPREHENSIVE INCOME (In thousands) | |||||||||||
Year Ended December 31, | |||||||||||
2017 | 2016 | 2015 | |||||||||
Net earnings | $ | 107,223 | $ | 166,626 | $ | 241,686 | |||||
Other comprehensive income (loss), net of tax: | |||||||||||
Change in minimum liability for pension plans, net of tax effects of $238, $48 and $477, respectively | 1,271 | 102 | 661 | ||||||||
Fair value adjustment on interest rate swap contracts | 187 | (16 | ) | (602 | ) | ||||||
Realized gain on interest rate swap contracts reclassified to earnings | (494 | ) | — | — | |||||||
Unrealized gain on available-for-sale investments | (4 | ) | — | — | |||||||
Foreign currency translation adjustments | 51,631 | (40,911 | ) | (61,776 | ) | ||||||
Total other comprehensive income (loss) | 52,591 | (40,825 | ) | (61,717 | ) | ||||||
Comprehensive income | $ | 159,814 | $ | 125,801 | $ | 179,969 | |||||
The accompanying notes are an integral part of these consolidated financial statements.
51
FLIR SYSTEMS, INC. CONSOLIDATED BALANCE SHEETS (in thousands, except for par value) | |||||||
December 31, | |||||||
2017 | 2016 | ||||||
ASSETS | |||||||
Current assets: | |||||||
Cash and cash equivalents | $ | 519,090 | $ | 361,349 | |||
Accounts receivable, net | 346,687 | 352,020 | |||||
Inventories | 372,183 | 371,371 | |||||
Assets held for sale, net | 67,344 | — | |||||
Prepaid expenses and other current assets | 81,915 | 79,917 | |||||
Total current assets | 1,387,219 | 1,164,657 | |||||
Property and equipment, net | 263,996 | 271,785 | |||||
Deferred income taxes, net | 21,001 | 45,243 | |||||
Goodwill | 909,811 | 801,406 | |||||
Intangible assets, net | 168,130 | 168,460 | |||||
Other assets | 59,869 | 168,155 | |||||
Total assets | $ | 2,810,026 | $ | 2,619,706 | |||
LIABILITIES AND SHAREHOLDERS’ EQUITY | |||||||
Current liabilities: | |||||||
Accounts payable | $ | 106,389 | $ | 114,225 | |||
Deferred revenue | 25,614 | 34,420 | |||||
Accrued payroll and related liabilities | 71,310 | 52,874 | |||||
Accrued product warranties | 15,024 | 17,476 | |||||
Advance payments from customers | 20,672 | 26,019 | |||||
Accrued expenses | 37,089 | 34,022 | |||||
Accrued income taxes | 64,136 | 51,017 | |||||
Liabilities held for sale | 39,544 | — | |||||
Other current liabilities | 15,155 | 16,659 | |||||
Current portion, long-term debt | — | 15,000 | |||||
Total current liabilities | 394,933 | 361,712 | |||||
Long-term debt | 420,684 | 501,921 | |||||
Deferred income taxes | 12,496 | 2,331 | |||||
Accrued income taxes | 87,483 | 9,643 | |||||
Pension and other long-term liabilities | 59,872 | 65,773 | |||||
Commitments and contingencies (Notes 12 and 13) | |||||||
Shareholders’ equity: | |||||||
Preferred stock, $0.01 par value, 10,000 shares authorized; no shares issued at December 31, 2017 or 2016 | — | — | |||||
Common stock, $0.01 par value, 500,000 shares authorized, 138,869 and 136,334 shares issued at December 31, 2017 and 2016, respectively, and additional paid-in capital | 91,162 | 12,139 | |||||
Retained earnings | 1,856,756 | 1,832,138 | |||||
Accumulated other comprehensive loss | (113,360 | ) | (165,951 | ) | |||
Total shareholders’ equity | 1,834,558 | 1,678,326 | |||||
Total liabilities and shareholders' equity | $ | 2,810,026 | $ | 2,619,706 | |||
The accompanying notes are an integral part of these consolidated financial statements.
52
FLIR SYSTEMS, INC. CONSOLIDATED STATEMENTS OF SHAREHOLDERS’ EQUITY (in thousands) | |||||||||||||||||||
Common Stock and Additional Paid-in Capital | Retained Earnings | Accumulated Other Comprehensive Earnings (Loss) | Total Shareholders' Equity | ||||||||||||||||
Shares | Amount | ||||||||||||||||||
Balance, December 31, 2014 | 139,579 | $ | 1,396 | $ | 1,671,786 | $ | (63,409 | ) | $ | 1,609,773 | |||||||||
Net earnings for the year | — | — | 241,686 | — | 241,686 | ||||||||||||||
Income tax benefit of common stock options exercised | — | 1,611 | — | — | 1,611 | ||||||||||||||
Repurchase of common stock | (4,169 | ) | (44,387 | ) | (78,806 | ) | — | (123,193 | ) | ||||||||||
Common stock issued pursuant to stock-based compensation plans, net | 1,940 | 17,071 | — | — | 17,071 | ||||||||||||||
Stock-based compensation | — | 25,683 | — | — | 25,683 | ||||||||||||||
Dividends paid | — | — | (61,399 | ) | — | (61,399 | ) | ||||||||||||
Other comprehensive loss | — | — | — | (61,717 | ) | (61,717 | ) | ||||||||||||
Balance, December 31, 2015 | 137,350 | 1,374 | 1,773,267 | (125,126 | ) | 1,649,515 | |||||||||||||
Net earnings for the year | — | — | 166,626 | — | 166,626 | ||||||||||||||
Income tax benefit of common stock options exercised | — | 1,329 | — | — | 1,329 | ||||||||||||||
Repurchase of common stock | (2,132 | ) | (24,222 | ) | (41,835 | ) | — | (66,057 | ) | ||||||||||
Common stock issued pursuant to stock-based compensation plans, net | 1,116 | 5,985 | — | — | 5,985 | ||||||||||||||
Stock-based compensation | — | 27,673 | — | — | 27,673 | ||||||||||||||
Dividends paid | — | — | (65,920 | ) | — | (65,920 | ) | ||||||||||||
Other comprehensive loss | — | — | — | (40,825 | ) | (40,825 | ) | ||||||||||||
Balance, December 31, 2016 | 136,334 | 12,139 | 1,832,138 | (165,951 | ) | 1,678,326 | |||||||||||||
Net earnings for the year | — | — | 107,223 | — | 107,223 | ||||||||||||||
Common stock issued pursuant to stock-based compensation plans, net | 2,535 | 47,510 | — | — | 47,510 | ||||||||||||||
Stock-based compensation | — | 31,513 | — | — | 31,513 | ||||||||||||||
Dividends paid | — | — | (82,605 | ) | — | (82,605 | ) | ||||||||||||
Other comprehensive income | — | — | — | 52,591 | 52,591 | ||||||||||||||
Balance, December 31, 2017 | 138,869 | $ | 91,162 | $ | 1,856,756 | $ | (113,360 | ) | $ | 1,834,558 | |||||||||
The accompanying notes are an integral part of these consolidated financial statements.
53
FLIR SYSTEMS, INC. CONSOLIDATED STATEMENTS OF CASH FLOWS (in thousands) | |||||||||||
Year Ended December 31, | |||||||||||
2017 | 2016 | 2015 | |||||||||
CASH PROVIDED BY OPERATING ACTIVITIES: | |||||||||||
Net earnings | $ | 107,223 | $ | 166,626 | $ | 241,686 | |||||
Adjustments to reconcile net earnings to net cash provided by operating activities: | |||||||||||
Depreciation and amortization | 71,010 | 57,513 | 49,534 | ||||||||
Stock-based compensation arrangements | 31,018 | 27,797 | 25,748 | ||||||||
Gain on sale of assets, net | — | — | (19,166 | ) | |||||||
Loss on net assets held for sale | 23,588 | — | — | ||||||||
Deferred income taxes | 25,968 | 5,613 | 2,863 | ||||||||
Other, net | (31,256 | ) | 11,992 | 7,722 | |||||||
Increase (decrease) in cash, net of acquisitions, resulting from changes in: | |||||||||||
Accounts receivable | (7,758 | ) | (10,704 | ) | 28,258 | ||||||
Inventories | (32,961 | ) | 51,170 | (74,816 | ) | ||||||
Prepaid expenses | 1,217 | (7,706 | ) | 1,858 | |||||||
Other assets | 12,027 | (10,750 | ) | (4,333 | ) | ||||||
Accounts payable | 21,558 | (33,465 | ) | 38,660 | |||||||
Deferred revenue | (9,220 | ) | 2,928 | 3,503 | |||||||
Accrued payroll and other liabilities | 17,076 | (10,147 | ) | (10,704 | ) | ||||||
Accrued income taxes | 84,352 | 66,302 | (1,076 | ) | |||||||
Pension and other long-term liabilities | (5,590 | ) | 2,582 | 3,688 | |||||||
Net cash provided by operating activities | 308,252 | 319,751 | 293,425 | ||||||||
CASH FLOWS FROM INVESTING ACTIVITIES: | |||||||||||
Additions to property and equipment | (42,109 | ) | (35,940 | ) | (68,234 | ) | |||||
Business acquisitions, net of cash acquired | — | (419,203 | ) | (92,260 | ) | ||||||
Proceeds from sale of assets | 3,686 | 7,331 | 25,649 | ||||||||
Net cash used by investing activities | (38,423 | ) | (447,812 | ) | (134,845 | ) | |||||
CASH FLOWS FROM FINANCING ACTIVITIES: | |||||||||||
Net proceeds of long-term debt, including current portion | — | 524,560 | — | ||||||||
Repayment of long-term debt | (97,500 | ) | (367,435 | ) | (15,000 | ) | |||||
Repurchase of common stock | — | (66,057 | ) | (123,193 | ) | ||||||
Dividends paid | (82,605 | ) | (65,920 | ) | (61,399 | ) | |||||
Proceeds from shares issued pursuant to stock-based compensation plans | 58,241 | 11,966 | 22,499 | ||||||||
Tax paid for net share exercises and issuance of vested restricted stock units | (10,731 | ) | (5,991 | ) | (7,032 | ) | |||||
Other financing activities | (17 | ) | 13 | (24 | ) | ||||||
Net cash (used) provided by financing activities | (132,612 | ) | 31,136 | (184,149 | ) | ||||||
Effect of exchange rate changes on cash | 20,524 | (14,511 | ) | (33,020 | ) | ||||||
Net increase (decrease) in cash and cash equivalents | 157,741 | (111,436 | ) | (58,589 | ) | ||||||
Cash and cash equivalents, beginning of year | 361,349 | 472,785 | 531,374 | ||||||||
Cash and cash equivalents, end of year | $ | 519,090 | $ | 361,349 | $ | 472,785 | |||||
The accompanying notes are an integral part of these consolidated financial statements.
54
FLIR SYSTEMS, INC.
NOTES TO THE CONSOLIDATED FINANCIAL STATEMENTS
Note 1. | Nature of Business and Significant Accounting Policies |
FLIR Systems, Inc. (the "Company") is a world leader in sensor systems that enhance perception and awareness. The Company was founded in 1978 and has since become a premier designer, manufacturer, and marketer of thermal imaging and other sensing products and systems. The Company’s advanced sensors and integrated sensor systems enable the gathering and analysis of critical information through a wide variety of applications in commercial, industrial, and government markets worldwide.
The Company’s goal is to both enable its customers to benefit from the valuable information produced by advanced sensing technologies and to deliver sustained superior financial performance for its shareholders. The Company creates value for its customers by providing advanced surveillance and tactical defense capabilities, improving personal and public safety and security, facilitating air, ground, and maritime navigation, enhancing enjoyment of the outdoors, providing infrastructure inefficiency information, conveying pre-emptive structural deficiency data, displaying process irregularities, and enabling commercial business opportunities through its continual support and development of new thermal imaging data and analytics applications. The Company’s business model meets the needs of a multitude of customers—it sells off-the-shelf products to a wide variety of markets in an efficient, timely, and affordable manner as well as offers a variety of system configurations to suit specific customer requirements. Centered on the design of products for low cost manufacturing and high volume distribution, the Company’s commercial operating model has been developed over time and provides it with a unique ability to adapt to market changes and meet its customers’ needs.
Principles of consolidation
The accompanying consolidated financial statements include the accounts of the Company and its wholly owned subsidiaries. All intercompany accounts and transactions were eliminated.
Reclassification
The Company made certain reclassifications to the prior years' financial statements to conform them to the presentation as of and for the year ended December 31, 2017. These reclassifications had no effect on consolidated financial position, net earnings, shareholders' equity, or net cash flows for any of the periods presented.
Foreign currency translation
The assets and liabilities of the Company’s subsidiaries outside the United States are translated into United States dollars at current exchange rates in effect at the balance sheet date. Revenues and expenses are translated at monthly average exchange rates. Resulting translation adjustments are reflected in accumulated other comprehensive earnings (loss) within shareholders’ equity. Transaction gains and losses that arise from exchange rate fluctuations on transactions denominated in currencies other than the functional currency are reflected as other (income) expense, net, in the Consolidated Statements of Income as incurred.
The cumulative translation adjustment included in accumulated other comprehensive earnings (loss) is a loss of $113.0 million and $164.6 million at December 31, 2017 and 2016, respectively. Transaction gains and losses included in other (income) expense, net, are net losses of $0.2 million, $2.2 million, and $2.5 million for the years ended December 31, 2017, 2016 and 2015, respectively.
Revenue recognition
Revenue is recognized when persuasive evidence of an arrangement exists, upon delivery of the product to the customer at a fixed or determinable price with a reasonable assurance of collection, passage of title and risk of loss to the customer as indicated by the contractual terms and fulfillment of all significant obligations.
55
FLIR SYSTEMS, INC.
NOTES TO THE CONSOLIDATED FINANCIAL STATEMENTS—(Continued)
Note 1. | Nature of Business and Significant Accounting Policies - (Continued) |
Revenue recognition - (Continued)
The Company designs, markets and sells products primarily as commercial, off-the-shelf products. Certain customers request different system configurations, based on standard options or accessories that the Company offers. In general, revenue arrangements do not involve acceptance provisions based upon customer specified acceptance criteria. In those limited circumstances when customer specified acceptance criteria exist, revenue is deferred until customer acceptance if the Company cannot demonstrate the system meets those specifications prior to shipment. For any contracts with multiple elements (i.e., training, installation, additional parts, etc.) the Company allocates revenue among the deliverables primarily based upon objective and reliable evidence of fair value of each element in the arrangement. If objective and reliable evidence of fair value of any element is not available, the Company uses an estimated selling price for purposes of allocating the total arrangement consideration among the elements. Credit is not extended to customers and revenue is not recognized until the Company has determined that collectability is reasonably assured.
The Company’s products are sold with warranty provisions that require it to remedy deficiencies in quality or performance of the Company’s products over a specified period of time, generally twelve to twenty-four months, at no cost to its customers. Warranty liabilities are established at the time that revenue is recognized at levels that represent the Company’s estimate of the costs that will be incurred to fulfill those warranty requirements.
Provisions for estimated losses on sales or related receivables are recorded when identified. Revenue includes certain shipping and handling costs and is stated net of representative commissions and sales taxes. Service revenue is deferred and recognized over the contract period, as is the case for extended warranty contracts, or recognized as services are provided.
Cost of goods sold
Cost of goods sold includes materials, labor and overhead costs incurred in the manufacturing of products and services sold in the period as well as warranty costs. Material costs include raw materials, purchased components and sub-assemblies, outside processing and inbound freight costs. Labor and overhead costs consist of direct and indirect manufacturing costs, including wages and fringe benefits, operating supplies, depreciation, occupancy costs, and purchasing, receiving and inspection costs.
Research and development
Expenditures for research and development activities are expensed as incurred.
Cash equivalents and restricted cash
The Company considers short-term investments that are highly liquid, readily convertible into cash and have maturities of less than three months when purchased to be cash equivalents. Cash equivalents at December 31, 2017 and 2016 were $140.7 million and $8.3 million, respectively, which were primarily investments in money market funds and overnight deposits. Restricted cash includes cash that is subject to a legal or contractual restriction by a third party and restricted as to withdrawal or use, including restrictions that require the funds to be used for a specified purpose and restrictions that limit the purpose for which the funds can be used. The Company did not have any restricted cash balances at December 31, 2017 and 2016, respectively.
Accounts receivable and allowance for doubtful accounts
Accounts receivable are stated at the amounts the Company expects to collect. Credit limits are established through a process of reviewing the financial history and stability of each customer. The Company regularly evaluates the collectability of its trade receivables balances based on a combination of factors. If it is determined that a customer will be unable to fully meet its financial obligation, the Company records a specific allowance to reduce the related receivable to the amount expected to be recovered. In addition, the Company also records an allowance for all other customers based on certain other factors including the length of time the receivables are past due and historical collection experience with individual customers.
Inventories
Inventories are stated at the lower of cost or market and include materials, labor, and manufacturing overhead. Cost is determined based on a currently adjusted standard cost basis that approximates actual manufacturing cost on a first-in, first-out basis.
56
FLIR SYSTEMS, INC.
NOTES TO THE CONSOLIDATED FINANCIAL STATEMENTS—(Continued)
Note 1. | Nature of Business and Significant Accounting Policies - (Continued) |
Inventories - (Continued)
Inventory write-downs are recorded when conditions exist to indicate that inventories are likely to be in excess of anticipated demand or are obsolete based upon the Company’s assumptions about future demand for its products and market conditions. The Company regularly evaluates its ability to realize the value of inventories based on a combination of factors including the following: historical usage rates, forecasted sales or usage, product end of life dates, estimated current and future market values and new product introductions. When recorded, write-downs reduce the carrying value of the Company’s inventories to their net realizable value and create a new cost-basis in the inventories. Write-downs are reflected in cost of goods sold in the Consolidated Statements of Income.
Demonstration units
The Company’s products which are being used as demonstration units are stated at the lower of cost or market and are included in prepaid expenses and other current assets in the Consolidated Balance Sheets. Demonstration units are available for sale and the Company periodically evaluates them as to marketability and realizable values. The carrying value of demonstration units was $37.6 million and $36.9 million at December 31, 2017 and 2016, respectively.
Property and equipment
Property and equipment are stated at cost and are depreciated using a straight-line methodology over their estimated useful lives. Repairs and maintenance are charged to expense as incurred.
Goodwill
Goodwill is reviewed during the third quarter of each year, or more frequently if warranted, for impairment to determine if events or changes in business conditions indicate that the carrying value may not be recoverable. The Company did not recognize any impairment charges on goodwill during the years ended December 31, 2017, 2016 and 2015. See Note 7, "Goodwill," for additional information.
Intangible assets
Intangible assets are amortized using a straight-line methodology over their estimated useful lives. Intangible assets with indefinite useful lives are evaluated annually for impairment, or more frequently if required. The Company did not recognize any impairment charges on intangible assets with indefinite lives during the years ended December 31, 2017, 2016 and 2015.
Impairment of long-lived assets
Long-lived asset groups are reviewed for impairment when circumstances indicate that the carrying amounts may not be recoverable. Impairment exists when the carrying value is greater than the expected undiscounted future cash flows expected to be provided by the asset group. If impairment exists, the asset group is written down to its fair value. The Company did not recognize any impairment charges on long-lived assets during the years ended December 31, 2017, 2016 and 2015.
Advertising costs
Advertising costs, which are included in selling, general and administrative expenses, are expensed as incurred. Advertising costs for the years ended December 31, 2017, 2016 and 2015 were $19.2 million, $19.3 million and $18.7 million, respectively.
Cost-basis investments
The Company has private company investments, which consist of investments for which the Company does not have the ability to exercise significant influence, and are accounted for under the cost method. The investments are carried at cost and adjusted only when the Company believes that events have occurred that are likely to have a significant other-than-temporary adverse effect on the estimated fair value of the investments. If no such events have occurred, the fair value of the investments is not calculated as it is not required. The carrying value of those investments were $3.1 million and $3.2 million at December 31, 2017 and 2016, respectively. The investments are included in other assets in the Consolidated Balance Sheets.
57
FLIR SYSTEMS, INC.
NOTES TO THE CONSOLIDATED FINANCIAL STATEMENTS—(Continued)
Note 1. | Nature of Business and Significant Accounting Policies - (Continued) |
Contingencies
The Company is subject to the possibility of loss contingencies arising in the normal course of business. An estimated loss is accrued when the Company determines that it is probable that an asset has been impaired or a liability has been incurred and the amount can be reasonably estimated. The Company regularly evaluates current available information to determine whether such accruals and disclosures should be adjusted.
Earnings per share
Basic earnings per share is based on the weighted average number of shares of common stock outstanding during the period. Diluted earnings per share is computed similar to basic earnings per share except that the weighted shares outstanding are increased to include additional shares from the assumed exercise of stock options, if dilutive, and the assumed issuance of shares upon vesting of restricted stock awards.
The following table sets forth the reconciliation of the numerator and denominator utilized in the computation of basic and diluted earnings per share (in thousands):
Year Ended December 31, | |||||||||||
2017 | 2016 | 2015 | |||||||||
Numerator for earnings per share: | |||||||||||
Net earnings for basic and diluted earnings per share | $ | 107,223 | $ | 166,626 | $ | 241,686 | |||||
Denominator for earnings per share: | |||||||||||
Weighted average number of common shares outstanding | 137,456 | 137,138 | 139,353 | ||||||||
Assumed exercise of stock options and vesting of restricted stock awards, net of shares assumed reacquired under the treasury stock method | 2,190 | 1,359 | 1,421 | ||||||||
Diluted shares outstanding | 139,646 | 138,497 | 140,774 | ||||||||
The effect of stock-based compensation awards for the years ended December 31, 2017, 2016 and 2015 that aggregated 39,000, 233,000 and 354,000 shares, respectively, have been excluded for purposes of diluted earnings per share since the effect of their inclusion would have been anti-dilutive.
Supplemental cash flow disclosure (in thousands)
Year Ended December 31, | |||||||||||
2017 | 2016 | 2015 | |||||||||
Cash paid for: | |||||||||||
Interest | $ | 15,394 | $ | 15,815 | $ | 13,039 | |||||
Taxes | $ | 72,340 | $ | 32,465 | $ | 68,534 | |||||
Stock-based compensation
The Company uses the Black-Scholes option pricing model to estimate the fair value of stock option awards and shares expected to be issued under the Company's employee stock purchase plan. Nonvested stock awards (referred to as restricted stock unit awards) are valued based on the fair market value of the Company's stock, discounted for expected dividends, on the date of grant. Restricted stock units containing performance-based vesting criteria are valued on the date of grant based on the fair value of the Company's stock, discounted for expected dividends and an estimate for illiquidity. The fair value of market-based restricted stock units is determined on the date of grant using a lattice-based option-pricing valuation model that incorporates a Monte-Carlo simulation and a discount for illiquidity. The estimated discount for illiquidity is relevant for share based awards that require the plan participant to hold the shares for a specified period of time after the award vests and is estimated using the protective put method. The Company recognizes the compensation expense for all stock-based compensation awards on a straight-line basis over the requisite service period of each award.
58
FLIR SYSTEMS, INC.
NOTES TO THE CONSOLIDATED FINANCIAL STATEMENTS—(Continued)
Note 1. | Nature of Business and Significant Accounting Policies - (Continued) |
Stock-based compensation - (Continued)
The following table sets forth the stock-based compensation expense recognized in the Consolidated Statements of Income for the years ended December 31, 2017, 2016 and 2015 (in thousands):
Year Ended December 31, | |||||||||||
2017 | 2016 | 2015 | |||||||||
Cost of goods sold | $ | 2,665 | $ | 3,103 | $ | 3,001 | |||||
Research and development | 5,068 | 4,815 | 4,694 | ||||||||
Selling, general and administrative | 23,285 | 19,879 | 18,053 | ||||||||
Stock-based compensation expense before income taxes | $ | 31,018 | $ | 27,797 | $ | 25,748 | |||||
Stock-based compensation expense capitalized in the Consolidated Balance Sheets as of December 31, 2017, 2016 and 2015 is as follows (in thousands):
December 31, | |||||||||||
2017 | 2016 | 2015 | |||||||||
Capitalized in inventory | $ | 1,062 | $ | 567 | $ | 691 | |||||
As of December 31, 2017, the Company had approximately $42.0 million of total unrecognized stock-based compensation costs, net of estimated forfeitures, to be recognized over a weighted average period of 2.09 years.
The fair value of the stock-based awards granted in the years ended December 31, 2017, 2016 and 2015 was estimated with the following weighted-average assumptions:
2017 | 2016 | 2015 | ||||||
Stock option awards: | ||||||||
Risk-free interest rate | 1.8 | % | 0.9 | % | 0.2 | % | ||
Expected dividend yield | 1.6 | % | 1.6 | % | 1.4 | % | ||
Expected term | 6.0 years | 4.3 years | 4.1 years | |||||
Expected volatility | 26.6 | % | 25.6 | % | 26.6 | % | ||
Performance-based restricted stock awards: | ||||||||
Expected dividend yield | 1.6 | % | 1.6 | % | — | |||
Discount for illiquidity | — | 9.9 | % | — | ||||
Market-based restricted stock awards: | ||||||||
Risk-free interest rate | — | 0.9 | % | 0.9 | % | |||
Expected dividend yield | — | 1.6 | % | 1.4 | % | |||
Expected term | — | 4.0 years | 4.0 years | |||||
Expected volatility | — | 25.8 | % | 27.5 | % | |||
Expected volatility of S&P 500 | — | 25.0 | % | 23.4 | % | |||
Discount for illiquidity | — | 9.9 | % | 10.9 | % | |||
Employee stock purchase plan: | ||||||||
Risk-free interest rate | 1.0 | % | 0.5 | % | 0.4 | % | ||
Expected dividend yield | 1.6 | % | 1.5 | % | 1.5 | % | ||
Expected term | 6 months | 6 months | 6 months | |||||
Expected volatility | 20.9 | % | 27.0 | % | 21.5 | % | ||
Discount for illiquidity | 10.5 | % | 10.5 | % | — | |||
59
FLIR SYSTEMS, INC.
NOTES TO THE CONSOLIDATED FINANCIAL STATEMENTS—(Continued)
Note 1. | Nature of Business and Significant Accounting Policies - (Continued) |
Stock-based compensation - (Continued)
The Company uses the United States Treasury (constant maturity) interest rate on the date of grant as the risk-free interest rate and uses historical volatility as the expected volatility. The Company’s determination of expected term is based on an analysis of historical and expected exercise patterns. In 2017, 2016 and 2015, all stock options granted were time-based options. The Company uses an estimated forfeiture rate of 5 percent of the stock-compensation expense of non-executive employees based on an analysis of historical and expected forfeitures.
During the years ended December 31, 2017, 2016 and 2015, the Company granted approximately 773,000, 865,000 and 804,000 time-vested restricted stock units, respectively. The fair value of time-vested restricted stock units is fixed and determined on the date of grant based upon the Company's stock price on the date of grant. The weighted average fair values of the time-vested restricted stock units granted during the years ended December 31, 2017, 2016 and 2015 were $36.20, $29.48 and $26.30 per share, respectively.
During the year ended December 31, 2016 and 2015, the Company granted approximately 64,000 and 128,000 market-based restricted stock units, respectively. These units may be earned based upon the Company's total shareholder return compared to the total shareholder return over a three year period of the component company at the 60th percentile level in the S&P 500 Index. Shares vested under the market-based restricted stock unit awards must be held by the participant for a period of one year from the vest date. The fair value of the market-based restricted stock units granted during the year ended December 31, 2016 and 2015 was $22.89 and $25.55 per share, respectively.
During the years ended December 31, 2017 and 2016, the Company granted approximately 283,000 and 62,000 performance-based restricted stock units, respectively. These units are earned based upon the Company's return on invested capital over a three year period. The fair value of the performance-based restricted units granted during the years ended December 31, 2017 and 2016 was $35.08 and $26.41 per share, respectively.
The total fair value of the restricted stock unit awards granted during the year ended December 31, 2017 in the table below of $37.9 million includes $9.9 million of grant date fair value associated with the performance-based restricted stock units. The total fair value of the restricted stock unit awards granted during the year ended December 31, 2016 in the table below of $28.6 million includes $1.5 million of grant date fair value associated with the market-based restricted stock units and $1.6 million of grant date fair value associated with the performance-based restricted stock units.
The weighted-average fair value of stock-based compensation awards granted and vested, and the intrinsic value of options exercised during the period were (in thousands, except per share amounts):
Years Ended December 31, | |||||||||||
2017 | 2016 | 2015 | |||||||||
Stock option awards: | |||||||||||
Weighted average grant date fair value per share | $ | 8.55 | $ | 5.68 | $ | 5.60 | |||||
Total fair value of awards granted | $ | 2,824 | $ | 4,716 | $ | 4,170 | |||||
Total fair value of awards vested | $ | 4,203 | $ | 4,407 | $ | 4,290 | |||||
Total intrinsic value of options exercised | $ | 20,631 | $ | 6,170 | $ | 15,585 | |||||
Restricted stock unit awards: | |||||||||||
Weighted average grant date fair value per share | $ | 35.90 | $ | 28.86 | $ | 29.12 | |||||
Total fair value of awards granted | $ | 37,906 | $ | 28,603 | $ | 27,150 | |||||
Total fair value of awards vested | $ | 27,489 | $ | 21,130 | $ | 24,458 | |||||
Employee stock purchase plan: | |||||||||||
Weighted average grant date fair value per share | $ | 7.66 | $ | 6.33 | $ | 5.83 | |||||
Total fair value of shares estimated to be issued | $ | 1,087 | $ | 923 | $ | 951 | |||||
The total amount of cash received from the exercise of stock options in the years ended December 31, 2017, 2016 and 2015 was $53.5 million, $7.7 million and $20.8 million, respectively, and the related tax benefits realized from the exercise of the stock options in the years ended December 31, 2017, 2016 and 2015 was $3.0 million, $1.3 million and $3.9 million, respectively.
60
FLIR SYSTEMS, INC.
NOTES TO THE CONSOLIDATED FINANCIAL STATEMENTS—(Continued)
Note 1. | Nature of Business and Significant Accounting Policies - (Continued) |
Concentration of risk
Financial instruments that potentially subject the Company to concentration of credit risk consist primarily of accounts receivable. Concentration of credit risk with respect to accounts receivable is limited because a relatively large number of geographically diverse customers make up the Company’s customer base, thus diversifying the trade credit risk. The Company controls credit risk through credit approvals, credit limits and monitoring procedures. The Company performs credit evaluations for all new customers and requires letters of credit, bank guarantees and advanced payments, if deemed necessary.
A substantial portion of the Company’s revenue is derived from sales to United States and foreign government agencies (see Note 17, "Operating Segments and Related Information"). The Company also purchases certain key components from sole or limited source suppliers.
The Company maintains cash deposits with major banks that from time to time may exceed federally insured limits. The Company periodically assesses the financial condition of the institutions and instruments in which it invests and adjusts its investment balances to mitigate the risk of principal loss.
Use of estimates
The preparation of financial statements in conformity with United States generally accepted accounting principles requires management to make estimates and judgments that affect the reported amounts of assets and liabilities and disclosure of contingent assets and liabilities at the date of the financial statements, and the reported amounts of revenue and expenses during the reporting period. Significant estimates and judgments made by management of the Company include matters such as collectability of accounts receivable, realizability of inventories, recoverability of deferred tax assets, impairment tests of goodwill, intangible assets and other long-lived assets, recognition and measurement of loss contingencies and adequacy of warranty accruals. Actual results could differ from those estimates. The Company believes that the estimates used are reasonable.
Accumulated other comprehensive earnings (loss)
Accumulated other comprehensive earnings (loss) includes cumulative translation adjustments, fair value adjustments on interest rate swap contracts, unrealized gains and losses on available-for-sale securities and changes in minimum liability for pension plans. Foreign currency translation adjustments included in comprehensive income were not tax affected as investments in international affiliates are deemed to be indefinite in duration.
The following table sets forth the changes in the balances of each component of accumulated other comprehensive earnings (loss) for the year ended December 31, 2017:
Pension Plans Items | Interest Rate Swap Contracts | Available-For-Sale Items | Foreign Currency Items | Total | ||||||||||||||||
Balance, December 31, 2016 | $ | (1,615 | ) | $ | 307 | $ | — | $ | (164,643 | ) | $ | (165,951 | ) | |||||||
Other comprehensive income (loss) before reclassifications, net of tax | 1,286 | 187 | (4 | ) | 51,631 | 53,100 | ||||||||||||||
Amounts reclassified from accumulated other comprehensive earnings (loss), net of tax | (15 | ) | (494 | ) | — | — | (509 | ) | ||||||||||||
Net current period other comprehensive income (loss), net of tax | 1,271 | (307 | ) | (4 | ) | 51,631 | 52,591 | |||||||||||||
Balance, December 31, 2017 | $ | (344 | ) | $ | — | $ | (4 | ) | $ | (113,012 | ) | $ | (113,360 | ) | ||||||
The amounts reclassified from accumulated other comprehensive earnings (loss) for interest rate swap contracts have been recorded to interest expense in the Company's Consolidated Statement of Income for the year ended December 31, 2017.
61
FLIR SYSTEMS, INC.
NOTES TO THE CONSOLIDATED FINANCIAL STATEMENTS—(Continued)
Note 1. | Nature of Business and Significant Accounting Policies - (Continued) |
Recent accounting pronouncements
Effective January 1, 2017, the Company adopted the Financial Accounting Standards Board ("FASB") Accounting Standards Update 2016-09, "Improvements to Employee Share-Based Payment Accounting" ("ASU 2016-09"). The standard update simplifies several aspects of the accounting for employee share-based payment transactions, including accounting for income taxes, forfeitures, and statutory withholding requirements, as well as classification in the Consolidated Statements of Cash Flows. As a result of the adoption, on a prospective basis, the Company recognized $4.5 million of excess tax benefits from stock-based compensation as a discrete item in income tax provision for the year ended December 31, 2017. Historically, this amount was recorded as additional paid-in capital. Upon adoption, the Company elected to apply the change retrospectively to the Consolidated Statement of Cash Flows which resulted in a reclassification of excess tax benefits from stock-based compensation of $1.5 million and $8.2 million from cash flows from financing activities to cash flows from operating activities for the year ended December 31, 2016 and 2015, respectively. Additionally, $6.0 million and $9.4 million paid in cash to satisfy withholding requirements for net settlement of restricted stock unit shares vested and stock options exercised has been reclassified from cash flows from operating activities to cash flows from financing activities to conform to the presentation required by the new standard in the Consolidated Statement of Cash Flows for the year ended December 31, 2016 and 2015, respectively. ASU 2016-09 also requires excess tax benefits and deficiencies to be excluded from the assumed future proceeds in the calculation of diluted shares. This change resulted in an increase in diluted weighted average shares outstanding of 492,000 shares for the year ended December 31, 2017. The Company elected not to change its policy on accounting for forfeitures and will continue to estimate a requisite forfeiture rate. Additional amendments to the accounting for income taxes and minimum statutory withholding requirements had no impact on the Company's results of operations.
In May 2014, the FASB issued Accounting Standards Update No. 2014-09, "Revenue from Contracts with Customers" ("ASU 2014-09" or "Topic 606"), which establishes new guidance under which companies will recognize revenue to depict the transfer of promised goods or services to customers in an amount that reflects the consideration to which the company expects to be entitled in exchange for those goods or services. ASU 2014-09 also provides for additional disclosure requirements. Subsequently, the FASB has issued several amendments to the new standard to clarify the implementation. ASU 2014-09 is effective for interim and annual reporting periods beginning after December 15, 2017 and may be applied retrospectively or on a modified retrospective transition basis. The Company currently intends to adopt ASU 2016-09 on January 1, 2018 using the modified retrospective approach.
The Company has substantially completed its review of the accounting systems and processes required from adopting the new standard, including the application of the modified retrospective method for adoption. Additionally, the Company has completed the assessment phase and documentation of new policies and evaluation of it internal controls framework and is currently in the process of gathering data for the new disclosure requirements. The Company does not expect a significant change in its control environment due to the adoption of the new standard.
Upon adoption, the Company does not expect a material impact to the opening balance sheet as of January 1, 2018 related to the modified retrospective effect. Although the impact of the new standard will greatly increase the amount of required disclosures the Company expects revenue recognition for the broad portfolio of its products and services offerings to remain largely unchanged. However, the guidance is expected to change the timing of revenue recognition in certain area, including accounting for complex and highly customized systems integrations when there is no alternative use for assets produced and termination for convenience clauses entitle the Company to receive cost plus a reasonable margin in the event of early termination. Such contracts represent a minor subset of the Company's total portfolio, however, such arrangements may represent a significant amount of revenue in a given period. Such contracts and other aspects of the new standard expected to impact the Company are described in further detail below:
•Integration, engineering services and highly customized products: Topic 606 requires revenue recognition when (or as) the Company satisfies a performance obligation by transferring control of a promised good or service to a customer. If the Company's performance does not create an asset with an alternative use and termination for convenience clauses provide an enforceable right to payment for performance completed to date (including fees representing a reasonable profit), revenue would be recognized over time as the performance obligation is satisfied, rather than the point in time when final delivery or acceptance occurs. Though not expected to impact the vast majority of the Company's contracts with customers, over-time revenue recognition may be required on certain contracts which would have been recognized at a point in time under current standards.
62
FLIR SYSTEMS, INC.
NOTES TO THE CONSOLIDATED FINANCIAL STATEMENTS—(Continued)
Note 1. | Nature of Business and Significant Accounting Policies - (Continued) |
Recent accounting pronouncements - (Continued)
•Contract acquisition costs: Topic 606 requires the deferral and amortization of "incremental" costs incurred to obtain a contract. The primary contract acquisition cost for the Company are sales commissions. While the majority of the Company's sales commissions are not earned upon contract acquisition, all commissions are currently expensed when earned. The change required by Topic 606 may result in the creation of an asset on the opening balance sheet at January 1, 2018. The impact is not expected to be material as the Company has limited agreements providing for commissions earned upon contract acquisition and also because it intends to elect the practical expedient to omit recognition of contract acquisition assets if the amortization period of the asset that otherwise would be recognized is one year or less.
•Variable consideration: Some of the Company's contracts with customers include notification or acceptance provisions that preclude revenue recognition because of the requirement for amounts to be fixed or determinable under the current standards. Topic 606 requires the Company to estimate and account for variable consideration using either the probability-weighted expected amount or the most likely amount and estimate the transaction price to recognize when or as control is transferred to the customer. Though not applicable to the vast majority of the Company's contracts, revenue for certain customer contracts may be recognized earlier than it would be under current standards as transaction prices are estimated upon transfer of control rather than at the point when the price is considered fixed or determinable.
•Allocation of transaction price: Similar to current standards, Topic 606 requires an allocation of arrangement consideration between deliverables within a transaction. Current GAAP restricts the allocation of revenue that is contingent on future deliverables to current deliverables, however Topic 606 removes this restriction. Though expected to be rare, this change could result in the Company recognizing a portion of a contract earlier during the performance period, even if payment is contingent upon future deliverables.
The Company will continue to assess the impact of the adoption as it completes its processes and internal controls necessary to gather information required for the new disclosures beginning in the first quarter ending March 31, 2018. As discussed above, the adoption of the new standard is not expected to have a material impact on the opening balance sheet as of January 1, 2018. However, this expectation is based on many variables, which are subject to change.
In February 2016, the FASB issued Accounting Standards Update No. 2016-02, “Leases (Topic 842)” (“ASU 2016-02”). The amendments in this update require the identification of arrangements that should be accounted for as leases by lessees. In general, for lease arrangements exceeding a twelve month term, these arrangements must now be recognized as assets and liabilities on the balance sheet of the lessee. ASU 2016-02 requires the use of the modified retrospective method, which will require adjustment to all comparative periods presented in the consolidated financial statements. ASU 2016-09 is effective for interim and annual reporting periods beginning after December 15, 2018, with early adoption permitted, and the Company currently intends to adopt ASU 2016-02 on January 1, 2019. The Company is assessing the impact ASU 2016-02 will have on its consolidated financial statements and expects that the primary impact upon adoption will be the recognition, on a discounted basis, of its minimum commitments under noncancelable operating leases on its consolidated balance sheets resulting in the recording of right of use assets and lease obligations. The Company's current minimum commitments under noncancelable operating leases are disclosed in Note 12.
In October 2016, the FASB issued Accounting Standards Update No. 2016-16, “Intra-Entity Transfers of Assets Other Than Inventory” ("ASU 2016-16"). The amendments in this update eliminate the exception of recognizing, at the time of transfer, current and deferred income taxes for intra-entity asset transfers other than inventory. ASU 2016-16 is effective for interim and annual reporting periods beginning after December 15, 2017 and should be applied on a modified retrospective transition basis. The Company is currently planning to adopt ASU 2016-16 on January 1, 2018. As of December 31, 2017, the Company has a remaining deferred tax benefit of $7.0 million recorded in prepaid expenses and other current assets, which represents the tax benefit that was deferred in accordance with the current GAAP. Upon adoption, the Company will recognize this amount through a cumulative-effect adjustment to retained earnings.
63
FLIR SYSTEMS, INC.
NOTES TO THE CONSOLIDATED FINANCIAL STATEMENTS—(Continued)
Note 1. | Nature of Business and Significant Accounting Policies - (Continued) |
Recent accounting pronouncements - (Continued)
In November 2016, the FASB issued Accounting Standards Update No. 2016-18, "Statement of Cash Flows (Topic 230): Restricted Cash" ("ASU 2016-18"). This update clarifies guidance on the classification and presentation of restricted cash in the statement of cash flows. The amendment requires restricted cash be included in an entity's cash and cash-equivalent balances in the statement of cash flows and also requires an entity to disclose information about the nature of the restrictions. Further, a reconciliation between the statement of financial position and the statement of cash flows must be disclosed when the statement of financial position includes more than one line item for cash, cash equivalents, restricted cash, and restricted cash equivalents. ASU 2016-18 should be applied on a retrospective basis and is effective for interim and annual reporting periods beginning after December 15, 2017. The Company currently intends to adopt ASU 2016-18 on January 1, 2018, and does not expect the adoption to have a material impact on its consolidated financial statements.
In January 2017, the FASB issued Accounting Standards Update No. 2017-01, "Business Combinations (Topic 805): Clarifying the Definition of a Business" ("ASU 2017-01"). The amendments in this update clarify the definition of a business with the objective of adding guidance to assist entities with evaluating whether transactions should be accounted for as acquisitions (or disposals) of assets or businesses. ASU 2017-01 is effective for interim and annual reporting periods beginning after December 15, 2017. The Company currently intends to adopt ASU 2017-01 on January 1, 2018, and does not expect the adoption to have a material impact on its consolidated financial statements.
In January 2017, the FASB issued Accounting Standards Updated No. 2017-04, “Intangibles - Goodwill and Other (Topic 350): Simplifying the Test for Goodwill Impairment” (“ASU 2017-04”). The amendments in this update simplify the subsequent measurement of goodwill by removing the second step of the two-step impairment test. The amendment requires an entity to perform its annual, or interim goodwill impairment test by comparing the fair value of a reporting unit with its carrying amount. An impairment charge should be recognized for the amount by which the carrying amount exceeds the reporting unit's fair value; however, the loss recognized should not exceed the total amount of goodwill allocated to that reporting unit. An entity still has the option to perform the qualitative assessment for a reporting unit to determine if the quantitative impairment test is necessary. The amendment should be applied on a prospective basis. ASU 2017-04 is effective for annual or any interim goodwill impairment tests in fiscal years beginning after December 15, 2019. Early adoption is permitted for interim or annual goodwill impairment tests performed on testing dates after January 1, 2017. The amendments in ASU 2017-04 are to be applied on a prospective basis and are not expected to have a material impact on the Company's consolidated financial statements.
Note 2. | Fair Value of Financial Instruments |
Factors used in determining the fair value of financial assets and liabilities are summarized into three broad categories in accordance with FASB ASC Topic 820, “Fair Value Measurements”:
Level 1 – quoted prices in active markets for identical securities as of the reporting date; |
Level 2 – other significant directly or indirectly observable inputs, including quoted prices for similar securities, interest rates, prepayment speeds, credit risk and observable market prices for identical instruments that are traded in less active markets; and |
Level 3 – significant inputs that are generally less observable than objective sources, including our own assumptions in determining fair value. |
The factors or methodology used for valuing securities are not necessarily an indication of the risk associated with investing in those securities.
The Company had $140.7 million and $8.3 million of cash equivalents at December 31, 2017 and 2016, respectively, which were primarily investments in money market funds and overnight deposits. The Company has categorized its cash equivalents as a Level 1 financial asset, measured at fair value based on quoted prices in active markets of identical assets. All cash equivalents are in instruments that are convertible to cash daily. The fair value of the Company’s foreign currency contracts as of December 31, 2017 and 2016 are disclosed in Note 3, "Derivative Financial Instruments," and based on Level 2 inputs. The fair value of the Company’s senior unsecured notes as described in Note 11, "Long-Term Debt," is approximately $427.5 million based upon Level 2 inputs at December 31, 2017. The Company does not have any other significant financial assets or liabilities that are measured at fair value.
64
FLIR SYSTEMS, INC.
NOTES TO THE CONSOLIDATED FINANCIAL STATEMENTS—(Continued)
Note 3. Derivative Financial Instruments
Foreign Currency Exchange Rate Risk
The Company enters into foreign currency forward contracts not formally designated as hedges to manage the consolidated exchange rate risk associated with the remeasurement of non-functional currency denominated monetary assets and liabilities. Non-functional currency denominated monetary assets and liabilities consist primarily of cash, receivables, payables and intercompany loans. The Company manages exposure to counterparty non-performance credit risk by entering into foreign currency forward contracts only with major financial institutions that are expected to fully perform under the terms of such contracts. Changes in fair value of foreign currency forward contracts are recognized in income at the end of each reporting period based on the difference between the contract rate and the spot rate. In general, these gains and losses are offset in the Consolidated Statements of Income by the reciprocal gains and losses from the underlying assets or liabilities which originally gave rise to the exposure. The net amount of the gains and losses related to derivative instruments recorded in other (income) expense, net for the year ended December 31, 2017, 2016 and 2015 were a loss of $9.4 million, $7.9 million and a gain of $1.2 million, respectively.
Notional amounts are used to measure the volume of foreign currency forward contracts and do not represent the Company's total exposure to foreign currency gains or losses. The table below presents the net notional amounts of the Company’s outstanding foreign currency forward contracts by currency at December 31, 2017 and 2016 (in thousands):
Year Ended December 31, | |||||||
2017 | 2016 | ||||||
Swedish kroner | $ | 59,373 | $ | 48,555 | |||
European euro | 34,800 | 156,352 | |||||
British pound sterling | 34,317 | 33,862 | |||||
Brazilian real | 7,794 | 2,747 | |||||
Canadian dollar | 7,426 | 15,645 | |||||
Japanese yen | 3,362 | 3,251 | |||||
Australian dollar | 2,817 | 1,653 | |||||
Other | 3,095 | — | |||||
$ | 152,984 | $ | 262,065 | ||||
At December 31, 2017, the Company’s foreign currency forward contracts, in general, had maturities of three months or less.
The carrying amount of the foreign exchange contracts included in the Consolidated Balance Sheets are as follows (in thousands):
December 31, 2017 | December 31, 2016 | ||||||||||||||
Prepaid Expenses and Other Current Assets | Other Current Liabilities | Prepaid Expenses and Other Current Assets | Other Current Liabilities | ||||||||||||
Foreign exchange contracts | $ | 1,760 | $ | 579 | $ | 2,369 | $ | 75 | |||||||
Interest Rate Swap Contracts
On May 31, 2016, the Company drew down $105 million under the revolving credit facility as described in Note 9, "Credit Agreement," and repaid the term loan originally issued under the credit agreement dated April 5, 2013. Interest was accrued and paid monthly based on the one-month LIBOR rate. To manage the interest rate risk arising from the variability in monthly interest expense attributable to the original term loan and amounts drawn under the revolver, the Company entered into two amortizing interest rate swaps with an aggregate notional amount of $105 million. The interest rate swaps were designated, and effective, as cash flow hedges.
65
FLIR SYSTEMS, INC.
NOTES TO THE CONSOLIDATED FINANCIAL STATEMENTS—(Continued)
Note 3. Derivative Financial Instruments - (Continued)
Interest Rate Swap Contracts - (Continued)
During the year ended December 31, 2017, the Company repaid all amounts outstanding under the revolving credit facility. Concurrently, the Company exited both interest rate swaps which had a combined notional amount at the time of $86.3 million and discontinued the cash flow hedge. The Company reclassified a gain of $0.5 million from accumulated other comprehensive income to interest expense because it was probable that the forecasted variable monthly LIBOR-based interest rate payments would no longer occur.
Note 4. | Accounts Receivable |
Accounts receivable are net of an allowance for doubtful accounts. The following table summarizes the Company’s allowance for doubtful accounts and the activity for 2017, 2016 and 2015 (in thousands):
Year Ended December 31, | |||||||||||
2017 | 2016 | 2015 | |||||||||
Allowance for doubtful accounts, beginning of year | $ | 6,457 | $ | 6,853 | $ | 8,014 | |||||
Charges to costs and expenses | 2,303 | 1,460 | 807 | ||||||||
Write-offs of uncollectible accounts, net of recoveries | (1,505 | ) | (1,661 | ) | (1,568 | ) | |||||
Currency translation adjustments | 375 | (195 | ) | (400 | ) | ||||||
Allowance for doubtful accounts, end of year | $ | 7,630 | $ | 6,457 | $ | 6,853 | |||||
Note 5. | Inventories |
Inventories consist of the following (in thousands):
December 31, | |||||||
2017 | 2016 | ||||||
Raw material and subassemblies | $ | 210,615 | $ | 200,640 | |||
Work-in-progress | 47,400 | 43,430 | |||||
Finished goods | 114,168 | 127,301 | |||||
$ | 372,183 | $ | 371,371 | ||||
Note 6. Property and Equipment
Property and equipment are summarized as follows (in thousands):
Estimated Useful Life | December 31, | ||||||||
2017 | 2016 | ||||||||
Land | — | $ | 22,765 | $ | 22,326 | ||||
Buildings | 30 years | 167,645 | 162,701 | ||||||
Machinery and equipment | 3 to 7 years | 275,688 | 258,023 | ||||||
Office equipment and other | 3 to 10 years | 104,064 | 103,798 | ||||||
570,162 | 546,848 | ||||||||
Less accumulated depreciation | (306,166 | ) | (275,063 | ) | |||||
$ | 263,996 | $ | 271,785 | ||||||
Depreciation expense for the years ended December 31, 2017, 2016 and 2015 was $42.3 million, $37.8 million and $32.5 million, respectively.
66
FLIR SYSTEMS, INC.
NOTES TO THE CONSOLIDATED FINANCIAL STATEMENTS—(Continued)
Note 7. | Goodwill |
The carrying value of goodwill and the activity for the two year period ending December 31, 2017 are as follows (in thousands):
Balance, December 31, 2015 | $ | 596,316 | ||
Goodwill from acquisitions | 220,795 | |||
Currency translation adjustments | (15,705 | ) | ||
Balance, December 31, 2016 | 801,406 | |||
Goodwill from acquisitions | 96,431 | |||
Classification as asset held for sale | (13,090 | ) | ||
Currency translation adjustments | 25,064 | |||
Balance, December 31, 2017 | $ | 909,811 | ||
During the year ended December 31, 2017, the Company recorded $96.4 million of goodwill primarily in connection with the purchase price allocation associated with Prox Dynamics, AS ("Prox Dynamics").
The Company reviews its goodwill for impairment annually during the third quarter, or more frequently, if events or circumstances indicate that the carrying value of a reporting unit exceeds its fair value. During the third quarter of 2017, the Company completed its annual review of goodwill and determined that no impairment of its recorded goodwill was necessary. During the fourth quarter of 2017, the Company allocated goodwill totaling approximately $13.1 million to assets held for sale related to the planned divestiture of the Consumer and Small and Medium-Sized (SMB) portion of the Security business. See Note 18, "Business Acquisitions and Divestitures," for further discussion. As a result of the reallocation of goodwill to the disposal group, the Company assessed whether there were any potential triggers or indicators of impairment on the retained portion of the Security segment. The Company concluded there had been no significant changes in the reporting unit assessment that would result in a significant change to the future expected cash flows generated from the retained asset groups. As such, as of December 31, 2017, the Company concluded that goodwill was not impaired.
Note 8. Intangible Assets
Intangible assets are summarized as follows (in thousands):
Weighted Average Estimated Useful Life | December 31, | ||||||||
2017 | 2016 | ||||||||
Product technology | 10 years | $ | 123,474 | $ | 98,895 | ||||
Customer relationships | 11 years | 73,382 | 87,013 | ||||||
Trademarks and trade name portfolios | 13 years | 9,606 | 8,160 | ||||||
Trade name portfolio not subject to amortization | indefinite | 32,076 | 37,494 | ||||||
In-process research and development | 7 years | 5,602 | 4,700 | ||||||
Other | 3 years | 1,929 | 1,827 | ||||||
Acquired identifiable intangibles | 246,069 | 238,089 | |||||||
Less accumulated amortization | (80,841 | ) | (73,535 | ) | |||||
Net acquired identifiable intangibles | 165,228 | 164,554 | |||||||
Patents | 7 years | 6,112 | 6,083 | ||||||
Less accumulated amortization | (3,399 | ) | (2,531 | ) | |||||
Net patents | 2,713 | 3,552 | |||||||
Acquired in-place leases and other | 7 years | 456 | 2,074 | ||||||
Less accumulated amortization | (267 | ) | (1,720 | ) | |||||
Net acquired in-place leases and other | 189 | 354 | |||||||
$ | 168,130 | $ | 168,460 | ||||||
67
FLIR SYSTEMS, INC.
NOTES TO THE CONSOLIDATED FINANCIAL STATEMENTS—(Continued)
Note 8. Intangible Assets - (Continued)
During the year ended December 31, 2017, the Company recorded $31.4 million of identified intangibles assets in connection with the purchase price allocation associated with Prox Dynamics and reclassed $8.4 million to Assets Held for Sale, net on the Consolidated Balance Sheets related to the Company's planned divestiture of the Consumer and SMB portion of the Security business. During the year ended December 31, 2016, the Company acquired $47.4 million of identifiable intangible assets as part of the acquisitions of Armasight and Point Grey and during the year ended December 31, 2015, the Company acquired $27.4 million of identifiable intangible assets as part of the acquisition of DVTEL. Refer to Note 18, "Business Acquisitions and Divestitures" for further discussion.
The aggregate amortization expense recorded in 2017, 2016 and 2015 was $27.5 million, $18.4 million and $16.4 million, respectively. For intangible assets recorded at December 31, 2017, the estimated future aggregate amortization expense for the years ending December 31, 2018 through 2022 is approximately (in thousands):
2018 | $ | 23,949 | |
2019 | 23,028 | ||
2020 | 20,132 | ||
2021 | 18,456 | ||
2022 | 18,119 | ||
Note 9. | Credit Agreement |
On February 8, 2011, the Company entered into a Credit Agreement (“Credit Agreement”) with Bank of America, N.A., U.S. Bank National Association, JPMorgan Chase Bank N.A. and other Lenders. The Credit Agreement provided for a $200 million, five-year revolving line of credit. On April 5, 2013, the Credit Agreement was amended to extend the maturity of the revolving credit facility from April 8, 2016 to April 5, 2018 in addition to incorporating a $150 million term loan facility maturing April 5, 2019. On May 31, 2016, the Credit Agreement was further amended to increase the borrowing capacity to $500 million and to extend the maturity of the revolving credit facility from April 5, 2018 to May 31, 2021. The amendment also incorporated a revised schedule of fees and interest rate spreads. The Company has the right, subject to certain conditions, including approval of additional commitments by qualified lenders, to increase the revolving line of credit under the Credit Agreement by an additional $200 million until May 31, 2021. The Credit Agreement allows the Company and certain designated subsidiaries to borrow in United States dollars, European euros, Swedish kronor, British pound sterling, Japanese yen, Canadian dollars, Australian dollars and other agreed upon currencies. Interest rates under the Credit Agreement are determined based on the type of borrowing. Interest associated with borrowings can be based on the prime lending rate of Bank of America, N.A. or the published Eurocurrency rate (i.e. LIBOR). The borrowings have an applicable margin of 0.125 percent to 2.125 percent depending on the applicable base rate and our consolidated total leverage ratio. Including the respective spreads, the one-month LIBOR interest rate was 2.944 percent per annum and the prime lending rate was 4.875 percent per annum at December 31, 2017. The Credit Agreement requires the Company to pay a commitment fee on the amount of unused revolving commitments at a rate, based on the Company’s total leverage ratio, which ranges from 0.150 percent to 0.300 percent of unused revolving commitments. At December 31, 2017, the commitment fee rate was 0.175 percent per annum. The Credit Agreement contains two financial covenants that require the maintenance of a total leverage ratio and an interest coverage ratio, with which the Company was in compliance at December 31, 2017. The credit facilities available under the Credit Agreement are unsecured.
On May 31, 2016, the Company drew down $105 million under the revolving credit facility and repaid the term loan originally issued under the credit agreement dated April 5, 2013. During the year ended December 31, 2017, the Company repaid all amounts outstanding under the revolving credit facility. At December 31, 2017, the Company had $18.4 million of letters of credit outstanding, which reduces the total available revolving credit under the Credit Agreement.
68
FLIR SYSTEMS, INC.
NOTES TO THE CONSOLIDATED FINANCIAL STATEMENTS—(Continued)
Note 10. | Accrued Product Warranties |
The Company generally provides a twelve to twenty-four month warranty on its products. A provision for the estimated future costs of warranty, based upon historical cost and product performance experience, is recorded when revenue is recognized. The following table summarizes the Company’s warranty liability and activity for 2017, 2016 and 2015 (in thousands):
Year Ended December 31, | |||||||||||
2017 | 2016 | 2015 | |||||||||
Accrued product warranties, beginning of year | $ | 20,845 | $ | 16,514 | $ | 16,175 | |||||
Amounts paid for warranty services | (16,764 | ) | (19,592 | ) | (12,821 | ) | |||||
Warranty provisions for products sold | 14,422 | 22,928 | 13,074 | ||||||||
Business acquisition | — | 1,215 | 395 | ||||||||
Currency translation adjustments and other | (451 | ) | (220 | ) | (309 | ) | |||||
Accrued product warranties, end of year | $ | 18,052 | $ | 20,845 | $ | 16,514 | |||||
Current accrued product warranties, end of year | $ | 15,024 | $ | 17,476 | $ | 13,406 | |||||
Long-term accrued product warranties, end of year | $ | 3,028 | $ | 3,369 | $ | 3,108 | |||||
Note 11. Long-Term Debt
Long-term debt consists of the following (in thousands):
December 31, | |||||||
2017 | 2016 | ||||||
Unsecured notes | $ | 425,000 | $ | 425,000 | |||
Credit Agreement | — | 97,500 | |||||
Unamortized discounts and issuance costs of unsecured notes | (4,316 | ) | (5,579 | ) | |||
$ | 420,684 | $ | 516,921 | ||||
Current portion, long-term debt | $ | — | $ | 15,000 | |||
Long-term debt | $ | 420,684 | $ | 501,921 | |||
In August 2011, the Company issued $250 million aggregate principal amount of its 3.75 percent senior unsecured notes due September 1, 2016 (the “Notes”). The 2011 Notes were repaid on July 5, 2016 and the Company recorded a $1.3 million loss on the extinguishment of the 2011 Notes in Interest Expense.
In June 2016, the Company issued $425 million aggregate principal amount of its 3.125 percent senior unsecured notes due June 15, 2021 (the “2016 Notes”). The net proceeds from the issuance of the 2016 Notes were approximately $421.0 million, after deducting underwriting discounts and offering expenses, which are being amortized over a period of five years. Interest on the 2016 Notes is payable semiannually in arrears on December 15 and June 15. The proceeds from the 2016 Notes were used to repay the principal amount of the 2011 Notes outstanding in July 2016 and are being used for other general corporate purposes, including working capital and capital expenditure needs, business acquisitions and repurchases of the Company’s common stock.
On April 5, 2013, the Company borrowed $150 million under the term loan facility incorporated in the Credit Agreement. As discussed in Note 9, "Credit Agreement," of the Notes to the Consolidated Financial Statements above, on May 31, 2016, the Company repaid its term loan and drew down $105.0 million under the revolving credit facility. Interest on amounts outstanding under the revolving credit facility accrued at the one-month LIBOR rate plus the applicable margin for the amount outstanding and is paid monthly in arrears. During the year ended December 31, 2017, the Company repaid all amounts outstanding under the revolving credit facility.
69
FLIR SYSTEMS, INC.
NOTES TO THE CONSOLIDATED FINANCIAL STATEMENTS—(Continued)
Note 12. | Commitments |
The Company leases some of its primary facilities under various operating leases that expire in 2018 through 2027. The Company also leases certain operating machinery and equipment and office equipment under operating lease agreements. Total net rent expense for the years ended December 31, 2017, 2016 and 2015 amounted to $13.9 million, $9.0 million and $12.2 million, respectively.
The future minimum obligations under all non-cancelable leases and other contractual obligations are as follows (in thousands):
Net Operating Leases | Other Contractual Obligations | ||||||
2018 | $ | 9,862 | $ | 766 | |||
2019 | 6,660 | — | |||||
2020 | 5,082 | — | |||||
2021 | 4,275 | — | |||||
2022 | 2,906 | — | |||||
Thereafter | 2,097 | — | |||||
Total minimum payments | $ | 30,882 | $ | 766 | |||
Note 13. | Contingencies |
Raytheon Litigation
FLIR Systems, Inc. and its subsidiary, FLIR Commercial Systems, Inc. (formerly known as Indigo Systems Corporation) (together, the “FLIR Parties”), were named in a lawsuit filed by Raytheon Company (“Raytheon”) on March 2, 2007, in the United States District Court for the Eastern District of Texas. Raytheon's complaint, as amended, asserted claims for tortious interference, patent infringement, trade secret misappropriation, unfair competition, breach of contract, and fraudulent concealment. The FLIR Parties filed an answer to the complaint on September 2, 2008, in which they denied all material allegations. On October 27, 2010, the FLIR Parties and Raytheon entered into a settlement agreement that resolved the patent infringement claims (the "Patent Claims") pursuant to which the FLIR Parties paid $3 million to Raytheon and entitles the FLIR Parties to certain license rights in the patents that were the subject of the Patent Claims. On October 28, 2014, a four-week trial began with respect to Raytheon's remaining claims of misappropriations of trade secrets and claims related to 31 alleged trade secrets. On November 24, 2014, a jury in the United States District Court for the Eastern District of Texas rejected Raytheon’s claims and determined that 27 of the alleged trade secrets were not in fact trade secrets and that neither of the FLIR Parties infringed any of the trade secrets claimed and awarded Raytheon no damages. On March 31, 2016, the United States District Court for the Eastern District of Texas issued a Final Judgment denying Raytheon’s claims and awarding FLIR court costs and denying each of Raytheon’s and FLIR’s Renewed Motions for Judgment as a Matter of Law and denying FLIR’s Amended Rule 54(d) Motion for Attorneys’ Fees and Costs Under the Texas Theft Liability Act.
On April 29, 2016, Raytheon filed a Notice of Appeal to the United States Court of Appeals for the Federal Circuit of the denial by the United States District Court for the Eastern District of Texas of Raytheon’s Renewed Motion for Judgment as a Matter of Law, or in the Alternative, Motion for New Trial. On May 11, 2016, the FLIR Parties filed a Notice of Appeal to the United States Court of Appeals for the Federal Circuit of the Order of the United States District Court for the Eastern District of Texas Denying the FLIR Parties’ Amended Rule 54(d) Motion for Attorneys’ Fees and Costs under the Texas Theft Liability Act, the Order Denying the FLIR Parties’ Renewed Motion For Judgment as a Matter Of Law, and the Final Judgment to the extent it denied the FLIR Parties Attorneys’ Fees and Costs under the Texas Theft Liability Act. The United States Court of Appeals for the Federal Circuit heard the matter on January 12, 2018 and a decision is expected later this year. The matter remains ongoing and is subject to appeal. The Company is unable to estimate the amount or range of potential loss or recovery, if any, which might result if the final determination of this matter is favorable or unfavorable, but an adverse ruling on the merits of the original claims against the FLIR Parties, while remote, could be material.
70
FLIR SYSTEMS, INC.
NOTES TO THE CONSOLIDATED FINANCIAL STATEMENTS—(Continued)
Note 13. | Contingencies - (Continued) |
Matters Involving the United States Department of State and Department of Commerce
On October 22, 2014, the Company initially contacted the United States Department of State Office of Defense Trade Controls Compliance (“DDTC”), pursuant to International Traffic in Arms Regulation (“ITAR”) § 127.12(c), regarding the unauthorized export of technical data and defense services to dual and third country nationals in at least four facilities of the Company. On April 27, 2015, the Company submitted its initial report to DDTC regarding the details of the issues raised in the October 22, 2014, submission. DDTC subsequently notified the Company that it was considering administrative proceedings under Part 128 of ITAR and requested a tolling agreement, which the Company executed on June 16, 2015 and referenced certain Company disclosures in addition to the submissions made in conjunction with the October 24, 2014 initial notification. On June 6, 2016, the Company executed a subsequent tolling agreement extending the tolling period for matters to be potentially included in an administrative proceeding for an additional 18 months and at the request of DDTC on December 1, 2017, further extended the tolling agreement for an additional six months through May 9, 2018. DDTC continues its review of the Company’s activities and the Company continues to engage actively with the United States government on these matters.
In May 2017, the Company submitted an initial notification to DDTC regarding potential violations related to certain export classifications obtained through the commodity jurisdiction process and a final voluntary disclosure in August 2017. DDTC acknowledged the notification and at the request of DDTC, the Company executed a tolling agreement for this matter, suspending the statute of limitations through July 2018.
In June 2017, the United States Department of Commerce Bureau of Industry and Security informed the Company of additional export licensing requirements that restrict the Company’s ability to sell 9hz thermal products without a license to customers in China not identified on a list maintained by the United States Department of Commerce. This action was precipitated by concerns of potential diversion of some of the Company's products to prohibited end users and to countries subject to economic and other sanctions implemented by the United States. The United States Department of Commerce Bureau of Industry and Security subsequently favorably modified these restrictions to reduce the applicability of the restrictions to sales of FLIR's Tau camera cores (as opposed to finished products containing Tau camera cores) to customers in China not identified on a list maintained by the United States Department of Commerce and persons in a country other than those in EAR Country Group A:5 (Supplement No. 1 to Part 740 of the EAR). If the Company is found to have violated applicable rules and regulations with respect to customers and limitations on the end use of the Company’s products, the Company could be subject to substantial fines and penalties, suspension of existing licenses or other authorizations and/or loss or suspension of export privileges.
The Company is unable to reasonably estimate the time it may take to resolve these matters or the amount or range of potential loss, penalty or other government action, if any, that may be incurred in connection with these matters. However, an unfavorable outcome could result in substantial fines and penalties or loss or suspension of export privileges or of particular authorizations that could be material to the Company’s financial position, results of operations or cash flows in and following the period in which such an outcome becomes estimable or known.
SkyWatch Product Quality Matters
In March 2016, the Company learned of potential quality concerns with respect to as many as 313 Level III and Level IV SkyWatch Surveillance Towers sold by FLIR and companies acquired by FLIR from 2002 through 2014. The Company notified customers who purchased the affected SkyWatch Towers of the potential concerns and, as a precautionary measure, also temporarily suspended production of all Level III and Level IV SkyWatch Towers pending the completion of its review and the implementation of any necessary remedial measures. During the quarter ended June 30, 2017, the Company identified the cause of these quality issues and began testing certain remedial solutions to repair the affected SkyWatch Towers. Testing of the remedial solution for certain of the product variations affected was also completed during the quarter ended June 30, 2017. Subsequent to the aforementioned identification and testing, customers who purchased the product configurations for which a remedial solution has been identified and tested were notified of their options to request modifications to their fielded units. While there still remains uncertainty related to estimating the costs associated with a potential remedy and number of units which may require such remedy, the Company currently estimates the range of potential loss to be between $6.9 million and $14.6 million. As no single amount within the range is a better estimate than any other amount within the range, the Company has recorded a liability of $6.9 million as of December 31, 2017. Factors underlying this estimated range of loss may change from time to time, and actual results may vary significantly from this estimate.
71
FLIR SYSTEMS, INC.
NOTES TO THE CONSOLIDATED FINANCIAL STATEMENTS—(Continued)
Note 13. | Contingencies - (Continued) |
Other Matters
The Company is also subject to other legal and administrative proceedings, investigations, claims and litigation arising in the ordinary course of business not specifically identified above. In these identified matters and others not specifically identified, the Company records a liability with respect to a matter when management believes it is both probable that a liability has been incurred and the Company can reasonably estimate the amount of the loss. The Company believes it has recorded adequate provisions for any probable and estimable losses for matters in existence on the date hereof. The Company reviews these provisions to reflect the impact of negotiations, settlements, rulings, advice of legal counsel and other information and events pertaining to a particular matter. While the outcome of each of these matters is currently not determinable, the Company does not expect that the ultimate resolution of any such matter will individually have a material adverse effect on the Company’s financial position, results of operations or cash flows. The costs to resolve all such matters may in the aggregate have a material adverse effect on the Company’s financial position, results of operations or cash flows.
Note 14. | Income Taxes |
New tax legislation, commonly referred to as the Tax Cuts and Jobs Act (the “Tax Act”), was enacted on December 22, 2017. The Tax Act made broad and complex changes to the United States tax code including, but not limited to, reducing the United States federal corporate tax rate and requiring a one-time transition tax on undistributed earnings of foreign subsidiaries. FASB Accounting Standards Codification 740, "Accounting for Income Taxes," requires companies to recognize the effect of tax law changes in the period of enactment even though the effective date for most provisions is for tax years beginning after December 31, 2017, or in the case of certain other provisions, January 1, 2018.
Given the significance of the legislation, the SEC staff issued Staff Accounting Bulletin No. 118, which allows registrants to record provisional amounts during a one year “measurement period” similar to that used when accounting for business combinations. However, the measurement period is deemed to have ended earlier when the registrant has obtained, prepared and analyzed the information necessary to finalize its accounting. During the measurement period, impacts of the law are expected to be recorded at the time a reasonable estimate for all or a portion of the effects can be made, and provisional amounts can be recognized and adjusted as information becomes available, prepared or analyzed.
In connection with the Company's initial analysis of the impact of the Tax Act, the Company recorded a discrete net tax expense of $94.4 million for the period ended December 31, 2017. This amount consists of a net expense of $66.5 million for the transition tax and a net expense of $12.8 million for the remeasurement of the Company's net deferred tax assets using the reduced United States tax rate. In addition, we also recorded a discrete net tax expense of $15.1 million for state income and foreign taxes estimated to be due upon distribution of approximately $1.0 billion of previously undistributed foreign earnings no longer permanently reinvested as of December 31, 2017.
For the items above, the Company was able to make reasonable estimates of the impact of the Tax Act and has recorded provisional amounts. These estimates may be impacted by the need for further analysis and future clarification and guidance regarding available tax accounting methods and elections, earnings and profits computations, foreign tax credit calculations, and state tax conformity to federal tax changes.
Other significant provisions that are not yet effective but may impact income taxes in future years include: an exemption from U.S. tax on dividends of future foreign earnings, limitation on the current deductibility of net interest expense in excess of 30 percent of adjusted taxable income, a limitation of net operating losses generated after fiscal year 2018 to 80 percent of taxable income, an incremental tax (base erosion anti-abuse tax or "BEAT") on excessive amounts paid to foreign related parties, and a minimum tax on certain foreign earnings in excess of 10 percent of the foreign subsidiaries tangible assets (i.e., global intangible low-taxed income or "GILTI"). The Company is still evaluating whether to make a policy election to treat the GILTI tax as a period expense or to provide U.S. deferred taxes on foreign temporary differences that are expected to generate GILTI income when they reverse in future years.
72
FLIR SYSTEMS, INC.
NOTES TO THE CONSOLIDATED FINANCIAL STATEMENTS—(Continued)
Note 14. | Income Taxes - (Continued) |
Pre-tax earnings by significant geographical locations are as follows (in thousands):
Year Ended December 31, | |||||||||||
2017 | 2016 | 2015 | |||||||||
United States | $ | 143,924 | $ | 124,500 | $ | 146,940 | |||||
Foreign | 135,141 | 151,457 | 158,506 | ||||||||
$ | 279,065 | $ | 275,957 | $ | 305,446 | ||||||
The provisions for income taxes are as follows (in thousands):
Year Ended December 31, | |||||||||||
2017 | 2016 | 2015 | |||||||||
Current tax expense: | |||||||||||
Federal | $ | 112,673 | $ | 36,771 | $ | 35,029 | |||||
State | 5,035 | 5,785 | 6,074 | ||||||||
Foreign | 19,689 | 64,109 | 19,884 | ||||||||
137,397 | 106,665 | 60,987 | |||||||||
Deferred tax expense (benefit): | |||||||||||
Federal | 34,857 | 1,404 | 10,752 | ||||||||
State | 473 | 267 | 1,052 | ||||||||
Foreign | (885 | ) | 995 | (9,031 | ) | ||||||
34,445 | 2,666 | 2,773 | |||||||||
Total income tax provision | $ | 171,842 | $ | 109,331 | $ | 63,760 | |||||
The Company recognizes deferred tax assets and liabilities for the expected future tax consequences of events and basis differences that have been recognized in the Company’s financial statements and tax returns. Under this method, deferred tax assets and liabilities are determined based on the difference between the financial statement carrying amount and the tax basis of assets and liabilities using the enacted tax rates in effect in the years in which the differences are expected to reverse.
Net deferred tax assets (liabilities) were classified on the balance sheet as follows (in thousands):
December 31, | |||||||
2017 | 2016 | ||||||
Deferred tax assets, non-current | 21,001 | 45,243 | |||||
Deferred tax liabilities, non-current | (12,496 | ) | (2,331 | ) | |||
Net deferred tax assets | $ | 8,505 | $ | 42,912 | |||
73
FLIR SYSTEMS, INC.
NOTES TO THE CONSOLIDATED FINANCIAL STATEMENTS—(Continued)
Note 14. | Income Taxes - (Continued) |
The tax effects of temporary differences that gave rise to significant portions of deferred tax assets and deferred tax liabilities were as follows (in thousands):
December 31, | |||||||
2017 | 2016 | ||||||
Deferred tax assets: | |||||||
Accrued liabilities and allowances | $ | 20,425 | $ | 28,909 | |||
Tax credit and loss carry-forwards | 30,979 | 25,522 | |||||
Stock-based compensation | 11,715 | 17,204 | |||||
Inventory basis differences | 8,555 | 11,337 | |||||
Deferred revenue | 2,732 | 4,758 | |||||
Other assets | 2,527 | 917 | |||||
Gross deferred tax assets | 76,933 | 88,647 | |||||
Valuation allowance | (3,392 | ) | (2,924 | ) | |||
Total deferred tax assets, net | 73,541 | 85,723 | |||||
Deferred tax liabilities: | |||||||
Intangible assets | (29,117 | ) | (33,564 | ) | |||
Property and equipment | (16,499 | ) | (7,212 | ) | |||
Unremitted earnings of foreign subsidiaries | (15,100 | ) | — | ||||
Other liabilities | (4,320 | ) | (2,035 | ) | |||
Total deferred tax liabilities | (65,036 | ) | (42,811 | ) | |||
Net deferred tax assets | $ | 8,505 | $ | 42,912 | |||
The provision for income taxes differs from the amount of tax determined by applying the applicable United States statutory federal income tax rate to pretax income as a result of the following differences:
Year Ended December 31, | ||||||||
2017 | 2016 | 2015 | ||||||
Statutory federal tax rate | 35.0 | % | 35.0 | % | 35.0 | % | ||
(Decrease) increase in rates resulting from: | ||||||||
Foreign rate differential | (10.7 | ) | (11.3 | ) | (7.8 | ) | ||
Foreign, federal and state income tax credits | (2.0 | ) | (1.2 | ) | (2.1 | ) | ||
State taxes | 1.8 | 2.3 | 2.4 | |||||
European Union state aid recovery | 0.1 | 14.4 | — | |||||
Valuation allowance release | — | — | (6.4 | ) | ||||
Tax rate change on deferred items | 5.1 | — | — | |||||
United States transition tax | 23.8 | — | — | |||||
Unremitted earnings of foreign subsidiaries | 5.4 | — | — | |||||
Other | 3.1 | 0.4 | (0.2 | ) | ||||
Effective tax rate | 61.6 | % | 39.6 | % | 20.9 | % | ||
The Company's effective tax rate in 2017 is higher than the United States federal tax rate of 35 percent mainly due to the Company's estimate of the impact of the Tax Act. Unrecognized tax benefits for intercompany pricing increased in various jurisdictions in 2017, but this was partially offset by excess tax benefits for stock compensation and the mix of lower foreign tax rates. The foreign tax rate differential in 2016 is mainly due to the impact of amortization and lower statutory rates. The European Union state aid recovery in 2016 relates to the European Commission’s decision regarding the three-year agreement in Belgium, discussed below. The Company's foreign tax rate differential in 2015 is primarily the result of a three-year agreement in Belgium, which expired on July 31, 2015, as well as the impact of lower statutory rates.
74
FLIR SYSTEMS, INC.
NOTES TO THE CONSOLIDATED FINANCIAL STATEMENTS—(Continued)
Note 14. | Income Taxes - (Continued) |
At December 31, 2017, the Company had United States tax net operating loss carry-forwards totaling approximately $3.9 million which expire between 2019 and 2031 and are subject to annual limitation under Section 382 of the Internal Revenue Code. In addition, the Company has various state net operating loss carry-forwards totaling approximately $0.9 million which expire between 2023 and 2036. Finally, the Company has various foreign net operating loss carry-forwards totaling approximately $111.1 million, a portion of which expire between 2018 and 2036, and a portion of which have an indefinite carry-forward period.
The tax benefits described above are accounted for using the asset and liability method, which requires the recognition of deferred tax assets and liabilities for the expected future tax consequences of temporary differences between the carrying amounts and the tax basis of the assets and liabilities. To the extent that management assesses the realization of such assets to not be more likely than not, a valuation allowance is required to be recorded. As of December 31, 2017, the Company has determined that a valuation allowance against its deferred tax assets of $3.4 million is required, primarily related to certain foreign deductions carried forward and acquired net operating losses. A review of all available positive and negative evidence is considered, including past and future performance, the market environment in which the Company operates, utilization of tax attributes in the past, length of carry-back and carry-forward periods, and evaluation of potential tax planning strategies, when evaluating the realizability of deferred tax assets. The Company believes that it is more likely than not that the results of future operations will generate sufficient taxable income to realize the net deferred tax assets.
The following table summarizes the activity related to unrecognized tax benefits, including amounts accrued for potential interest and penalties (in thousands):
Year Ended December 31, | |||||||||||
2017 | 2016 | 2015 | |||||||||
Balance, beginning of year | $ | 51,851 | $ | 14,967 | $ | 15,401 | |||||
Increases related to current year tax positions | 17,264 | 40,840 | 1,446 | ||||||||
Increases related to prior year tax positions | 5,781 | 1,066 | 299 | ||||||||
Increases (decreases) related to prior year tax positions | (759 | ) | (610 | ) | (724 | ) | |||||
Lapse of statute of limitations | (1,260 | ) | (4,070 | ) | (1,455 | ) | |||||
Settlements | (986 | ) | (342 | ) | — | ||||||
Change due to currency translation | 5,384 | — | — | ||||||||
Balance, end of year | $ | 77,275 | $ | 51,851 | $ | 14,967 | |||||
The unrecognized tax benefits at December 31, 2017 relate to the United States, Belgium, United Kingdom and various other foreign jurisdictions, all of which would affect the Company’s effective tax rate if recognized.
On January 11, 2016, the European Commission announced a decision concluding that certain rules under Belgian tax legislation are deemed to be incompatible with European Union regulations on state aid. As a result of this decision, the European Commission has directed the Belgian Government to recover past taxes from certain entities, reflective of disallowed state aid, which impacts one of the Company’s international subsidiaries. The Belgian Government announced they have appealed this decision and filed action for an annulment in the General Court of the European Union, and in July 2016 the Company filed a separate appeal with the General Court of the European Union. In accordance with FASB ASC Topic 740, “Income Taxes,” the Company recorded discrete tax expense of $39.6 million during 2016 related to this matter and on January 10, 2017, received tax assessments from the Belgium government for a similar amount, which the Company has classified as current taxes payable on the Consolidated Balance Sheet as of December 31, 2017. The Company has filed a complaint against the Belgian tax assessments, and the result of this complaint, the appeal with the General Court of the European Union, new information received from the Belgian Government, or other future events may cause the income tax provision associated with the decision to be entirely or partially reversed.
The Company classifies interest and penalties related to unrecognized tax benefits in the income tax provision. As of December 31, 2017, the Company had $7.0 million of accrued interest and penalties related to unrecognized tax benefits that are recorded as current and non-current accrued income taxes on the Consolidated Balance Sheet.
75
FLIR SYSTEMS, INC.
NOTES TO THE CONSOLIDATED FINANCIAL STATEMENTS—(Continued)
Note 14. | Income Taxes - (Continued) |
The Company files United States federal, state and foreign income tax returns in jurisdictions with varying statutes of limitations. The Company currently has the following tax years open to examination by major taxing jurisdictions:
Tax Years: | |
United States Federal | 2014 - 2016 |
State of California | 2013 - 2016 |
State of Massachusetts | 2014 - 2016 |
State of Oregon | 2014 - 2016 |
Sweden | 2012 - 2016 |
United Kingdom | 2013 - 2016 |
Belgium | 2011 - 2016 |
Note 15. | Stock-based Compensation |
Stock Incentive Plans
The Company has a stock-based compensation program that provides equity incentives for employees, consultants and directors. This program includes non-statutory stock options and nonvested stock awards (referred to as restricted stock unit awards) granted under two plans: the FLIR Systems, Inc. 2002 Stock Incentive Plan (the “2002 Plan”) and the FLIR Systems, Inc. 2011 Stock Incentive Plan (the “2011 Plan”). The Company has discontinued issuing awards out of the 2002 Plan but previously granted awards under the 2002 Plan remain outstanding.
The Company has granted time-based options, time-based restricted stock unit awards, market-based restricted stock unit awards and performance-based restricted stock unit awards. Options generally expire ten years from the grant date. Time-based options and restricted stock unit awards generally vest over a three year period. Market-based restricted stock unit awards may be earned based upon the Company's total shareholder return compared to the total shareholder return of the component company at the 60th percentile level in the S&P 500 Index over a three year period. Performance-based restricted stock unit awards granted during the year ended December 31, 2016 may be earned based upon the Company's return on invested capital over a three year period. Performance-based restricted stock unit awards granted during the year ended December 31, 2017 may be earned based upon the Company's operating margin performance over a three year period. Certain shares vested under the performance-based restricted stock unit awards and the market-based restricted stock unit awards must be held by the participant for a period of one year from the vest date.
Shares issued as a result of stock option exercises and the distribution of vested restricted stock units are new shares.
The Company also has stock options issued as replacement awards in connection with the acquisition of ICx Technologies in 2010.
Information with respect to stock option activity for 2017 is as follows:
Shares (in thousands) | Weighted Average Exercise Price | Weighted Average Remaining Contractual Term | Aggregate Intrinsic Value (in thousands) | |||||||||
Outstanding at December 31, 2016 | 5,109 | $ | 28.88 | 5.6 | ||||||||
Granted | 330 | 36.72 | ||||||||||
Exercised | (2,101 | ) | 28.76 | |||||||||
Forfeited | (126 | ) | 31.09 | |||||||||
Outstanding at December 31, 2017 | 3,212 | $ | 29.66 | 5.4 | $ | 54,493 | ||||||
Exercisable at December 31, 2017 | 2,527 | $ | 28.95 | 4.6 | $ | 44,663 | ||||||
Vested and expected to vest at December 31, 2017 | 3,178 | $ | 29.63 | 5.4 | $ | 54,001 | ||||||
76
FLIR SYSTEMS, INC.
NOTES TO THE CONSOLIDATED FINANCIAL STATEMENTS—(Continued)
Note 15. | Stock-based Compensation - (Continued) |
Information with respect to restricted stock unit activity for 2017 is as follows:
Shares (in thousands) | Weighted Average Grant Date Fair Value | |||||
Outstanding at December 31, 2016 | 1,930 | $ | 30.92 | |||
Granted | 1,057 | 35.89 | ||||
Vested and distributed | (748 | ) | 36.62 | |||
Forfeited | (226 | ) | 30.41 | |||
Outstanding at December 31, 2017 | 2,013 | $ | 31.86 | |||
As of December 31, 2017, there were 9,222,000 shares of common stock reserved for future issuance under the stock incentive plans.
Employee Stock Purchase Plan
The Company has an Employee Stock Purchase Plan (the “ESPP”) which allows employees to purchase shares of the Company’s common stock at 85 percent of the fair market value at the lower of either the date of enrollment or the purchase date. The ESPP provides for six-month offerings commencing on May 1 and November 1 of each year with purchases on April 30 and October 31 of each year. Shares purchased under the ESPP must be held by employees for a period of at least 18 months after the date of purchase. The Company reserved 5,000,000 shares of common stock for issuance under the ESPP.
There were 158,000 shares issued at the average purchase price of $27.49 during 2017 and 2,978,000 shares remained available under the ESPP at December 31, 2017 for future issuance. Shares issued for ESPP purchases are new shares.
Note 16. | Other Employee Benefit Plans |
Employee 401(k) Plans
The Company has a 401(k) Savings and Retirement Plan (the “Plan”) to provide for voluntary salary deferral contributions on a pre-tax basis for employees within the United States in accordance with Section 401(k) of the Internal Revenue Code of 1986, as amended. The Plan allows for contributions by the Company. The Company made and expensed matching contributions of $8.9 million, $8.1 million and $7.5 million during the years ended December 31, 2017, 2016 and 2015, respectively.
Pension Plans
The Company previously offered most of the employees outside the United States participation in a defined benefit pension plan that has been curtailed. In addition, the Company previously provided a Supplemental Executive Retirement Plan (the “SERP”) for certain officers of the Company based in the United States. As of December 31, 2017, the last remaining SERP participant retired. Consequently, during the year ended December 31, 2017, the Company recorded an actuarial gain of approximately $1.7 million, primarily associated with the change in projected benefit obligation associated with the adjusted date of expected retirement and related actuarial compensation estimates for the final SERP participant.
The Company has recorded changes to the minimum pension liability to accumulated other comprehensive earnings (loss) and the estimated benefit to be paid in 2018 has been reported in other current liabilities. The remaining obligations are recorded in pension and other long-term liabilities. The measurement date used for the pension plans is December 31.
77
FLIR SYSTEMS, INC.
NOTES TO THE CONSOLIDATED FINANCIAL STATEMENTS—(Continued)
Note 16. | Other Employee Benefit Plans - (Continued) |
Pension Plans - (Continued)
Amounts recognized in other comprehensive income (loss) during the years ended December 31, 2017, 2016 and 2015, net of tax, are as follows (in thousands):
Year Ended December 31, | |||||||||||
2017 | 2016 | 2015 | |||||||||
Net earnings (loss) | $ | 1,286 | $ | 78 | $ | 500 | |||||
Prior service cost | (15 | ) | 24 | 161 | |||||||
$ | 1,271 | $ | 102 | $ | 661 | ||||||
Components of accumulated other comprehensive loss related to the Company’s pension plans as of December 31, 2017 and 2016 are as follows (in thousands):
December 31, | |||||||
2017 | 2016 | ||||||
Net loss | $ | (344 | ) | $ | (1,630 | ) | |
Prior service cost | — | 15 | |||||
$ | (344 | ) | $ | (1,615 | ) | ||
A summary of the components of the net periodic pension expense for the benefit obligation and fund assets of the plans is as follows (in thousands):
Year Ended December 31, | |||||||
2017 | 2016 | ||||||
Change in benefit obligation: | |||||||
Benefit obligation at January 1 | $ | 11,419 | $ | 11,426 | |||
Interest costs | 386 | 397 | |||||
Actuarial (gain) loss | (1,720 | ) | 177 | ||||
Benefits paid | (310 | ) | (312 | ) | |||
Foreign currency changes | 374 | (269 | ) | ||||
Benefit obligation at December 31 | $ | 10,149 | $ | 11,419 | |||
Fair value of plan assets at December 31 | $ | — | $ | — | |||
Unfunded status at December 31 | $ | 10,149 | $ | 11,419 | |||
Amounts recognized in the Consolidated Balance Sheets: | |||||||
Current liabilities | $ | 6,262 | $ | 292 | |||
Non-current liabilities | $ | 3,887 | $ | 11,127 | |||
78
FLIR SYSTEMS, INC.
NOTES TO THE CONSOLIDATED FINANCIAL STATEMENTS—(Continued)
Note 16. | Other Employee Benefit Plans - (Continued) |
Pension Plans - (Continued)
The weighted average assumptions used are as follows:
Year Ended December 31, | |||||
2017 | 2016 | ||||
Net periodic benefit cost: | |||||
SERP: | |||||
Discount rate | 4.00 | % | 4.00 | % | |
Rate of increase in compensation levels | 3.00 | % | 3.00 | % | |
Defined benefit pension plan for employees outside the United States: | |||||
Discount rate | 2.00 | % | 2.00 | % | |
Funded status and projected benefit obligation: | |||||
SERP: | |||||
Discount rate | 2.75 | % | 4.00 | % | |
Rate of increase in compensation levels | — | % | 3.00 | % | |
Defined benefit pension plan for employees outside the United States: | |||||
Discount rate | 1.75 | % | 2.00 | % | |
As a result of the change in the SERP's projected benefit payouts and estimated duration, the Company changed the discount rate determined. As of December 31, 2017, the discount rate is determined using a yield curve and applying the individual spot rates from appropriate maturities to each of the future expected benefit payouts by year to better match the plan's duration. We then discounted back to the measurement date to determine the appropriate single level equivalent discount rate. In prior years, the discount rates used were based upon publicly listed bond indices with durations estimated to be consistent with the respective projected benefit obligations. This change did not have a material impact on the financial statements. Further, as there were no active participants left in the plan as of December 31, 2017, there was no rate of increase for compensation levels included in the December 31, 2017 projected benefit obligation.
For the defined benefit pension plan outside the United States, the discount rate is determined by reference to market yields at the end of the reporting period on high quality corporate bonds with similar maturities matching the duration of the projected benefit obligation.
A pension liability of $0.8 million and $2.6 million as of December 31, 2017 and 2016, respectively, has been recognized for the pension plans representing the excess of the unfunded accumulated benefit obligation over the accrued pension costs.
Benefits expected to be paid under the plans are approximately (in thousands):
2018 | $ | 6,262 | |
2019 | 312 | ||
2020 | 306 | ||
2021 | 296 | ||
2022 | 280 | ||
Five years thereafter | 1,316 | ||
$ | 8,772 | ||
Components of net periodic benefit cost are as follows (in thousands):
Year Ended December 31, | |||||||||||
2017 | 2016 | 2015 | |||||||||
Service costs | $ | — | $ | — | $ | 156 | |||||
Interest costs | 386 | 397 | 353 | ||||||||
Net amortization and deferral | 235 | 260 | 513 | ||||||||
Net periodic pension costs | $ | 621 | $ | 657 | $ | 1,022 | |||||
79
FLIR SYSTEMS, INC.
NOTES TO THE CONSOLIDATED FINANCIAL STATEMENTS—(Continued)
Note 16. | Other Employee Benefit Plans - (Continued) |
Pension Plans - (Continued)
Components of net periodic benefit cost expected to be recognized from amounts in accumulated other comprehensive earnings (loss) during the year ending December 31, 2018 are as follows (in thousands):
Year Ending December 31, 2018 | |||
Net loss | $ | 52 | |
Note 17. Operating Segments and Related Information
Operating Segments
The Company has six reportable operating segments as follows:
Surveillance
The Surveillance segment develops and manufactures enhanced imaging and recognition solutions for a wide variety of military, law enforcement, public safety, and other government customers around the world for the protection of borders, troops, and public welfare. Offerings include airborne, land, maritime, and man-portable multi-spectrum imaging systems, radars, lasers, imaging components, integrated multi-sensor system platforms, and services related to these systems.
Instruments
The Instruments segment develops and manufactures devices that image, measure, and assess thermal energy, gases, and other environmental elements for industrial, commercial, and scientific applications. Products include thermal imaging cameras, gas detection cameras, firefighting cameras, process automation cameras, and environmental test and measurement devices.
Security
The Security segment develops and manufactures cameras and video recording systems for use in commercial, critical infrastructure, and home security applications. Products include thermal and visible-spectrum cameras, digital and networked video recorders, and related software and accessories that enable the efficient and effective safeguarding of assets at all hours of the day and through adverse weather conditions.
OEM & Emerging Markets
The OEM & Emerging Markets segment develops and manufactures thermal and visible-spectrum imaging camera cores and components that are utilized by third parties to create thermal, industrial, and other types of imaging systems. The segment also develops and manufactures intelligent traffic monitoring and signal control systems as well as thermal imaging solutions for use by consumers in the smartphone and mobile devices markets.
Maritime
The Maritime segment develops and manufactures electronics and imaging instruments for the recreational and commercial maritime market. The segment provides a full suite of networked electronic systems including multi-function helm displays, navigational instruments, autopilots, radars, sonar systems, thermal and visible imaging systems, and communications equipment for boats of all sizes.
Detection
The Detection segment develops and manufactures sensor instruments and integrated platform solutions for the detection, identification, and suppression of chemical, biological, radiological, nuclear, and explosives threats for military force protection, homeland security, and commercial applications.
80
FLIR SYSTEMS, INC.
NOTES TO THE CONSOLIDATED FINANCIAL STATEMENTS—(Continued)
Note 17. | Operating Segments and Related Information - (Continued) |
Operating Segments - (Continued)
The Company’s chief operating decision maker ("CODM"), its Chief Executive Officer, evaluates each of its segment’s performance and allocates resources based on revenue and segment operating income. Intersegment revenues are recorded at cost and are eliminated in consolidation. The Company and each of its segments employ consistent accounting policies.
The following tables present revenue, operating income, and assets for the six segments. Operating income as reviewed by the CODM is revenue less cost of goods sold and operating expense, excluding general corporate expenses, acquisition related costs, executive transition costs, amortization of purchased intangible assets, amortization of acquisition-related inventory step-up, costs associated with the SkyWatch product remediation, restructuring charges, and the loss on net assets held for sale. Accounts receivable and inventories for operating segments are regularly reviewed by management and are reported below as segment assets. As of and for the years ended December 31, 2017 and 2016, all remaining assets, liabilities, capital expenditures and depreciation were managed on a Company-wide basis.
Operating segment information is as follows (in thousands):
Year Ended December 31, | |||||||||||
2017 | 2016 | 2015 | |||||||||
Revenue—External Customers: | |||||||||||
Surveillance | $ | 545,755 | $ | 532,476 | $ | 503,045 | |||||
Instruments | 357,834 | 336,141 | 347,476 | ||||||||
Security | 231,456 | 240,010 | 226,575 | ||||||||
OEM & Emerging Markets | 347,160 | 243,678 | 186,722 | ||||||||
Maritime | 189,694 | 185,726 | 177,948 | ||||||||
Detection | 128,535 | 124,136 | 115,301 | ||||||||
$ | 1,800,434 | $ | 1,662,167 | $ | 1,557,067 | ||||||
Revenue—Intersegments: | |||||||||||
Surveillance | $ | 14,074 | $ | 18,835 | $ | 10,761 | |||||
Instruments | 4,686 | 4,343 | 9,951 | ||||||||
Security | 15,845 | 13,838 | 12,033 | ||||||||
OEM & Emerging Markets | 42,985 | 33,442 | 33,059 | ||||||||
Maritime | 2,440 | 3,450 | 2,108 | ||||||||
Detection | 145 | 31 | — | ||||||||
Eliminations | (80,175 | ) | (73,939 | ) | (67,912 | ) | |||||
$ | — | $ | — | $ | — | ||||||
Segment operating income: | |||||||||||
Surveillance | $ | 151,983 | $ | 151,516 | $ | 149,560 | |||||
Instruments | 106,887 | 98,775 | 115,115 | ||||||||
Security | 13,760 | 15,885 | 29,366 | ||||||||
OEM & Emerging Markets | 103,334 | 66,141 | 43,660 | ||||||||
Maritime | 23,019 | 18,564 | 17,383 | ||||||||
Detection | 36,146 | 35,276 | 30,262 | ||||||||
$ | 435,129 | $ | 386,157 | $ | 385,346 | ||||||
81
FLIR SYSTEMS, INC.
NOTES TO THE CONSOLIDATED FINANCIAL STATEMENTS—(Continued)
Note 17. | Operating Segments and Related Information - (Continued) |
Operating Segments - (Continued)
A reconciliation of the Company's consolidated segment operating income to consolidated earnings before income taxes is as follows (in thousands):
Year Ended December 31, | |||||||||||
2017 | 2016 | 2015 | |||||||||
Consolidated segment operating income | $ | 435,129 | $ | 386,157 | $ | 385,346 | |||||
Unallocated corporate expenses | (87,184 | ) | (65,012 | ) | (61,946 | ) | |||||
Amortization of purchased intangible assets | (27,391 | ) | (18,266 | ) | (16,275 | ) | |||||
Amortization of acquisition-related inventory step-up | (1,992 | ) | (3,230 | ) | — | ||||||
Restructuring charges | (625 | ) | (1,431 | ) | (1,361 | ) | |||||
Loss on net assets held for sale | (23,588 | ) | — | — | |||||||
SkyWatch product quality accrual | (4,388 | ) | (2,500 | ) | — | ||||||
Consolidated earnings from operations | 289,961 | 295,718 | 305,764 | ||||||||
Interest and non-operating expense, net | (10,896 | ) | (19,761 | ) | (318 | ) | |||||
Consolidated earnings before income taxes | $ | 279,065 | $ | 275,957 | $ | 305,446 | |||||
Unallocated corporate expenses include general corporate expenses, acquisition related costs and executive transition costs.
December 31, | |||||||
2017 | 2016 | ||||||
Segment assets (accounts receivable, net and inventories): | |||||||
Surveillance | $ | 296,891 | $ | 283,324 | |||
Instruments | 139,367 | 114,681 | |||||
Security | 34,735 | 93,174 | |||||
OEM & Emerging Markets | 149,346 | 144,862 | |||||
Maritime | 66,689 | 61,494 | |||||
Detection | 31,842 | 25,856 | |||||
$ | 718,870 | $ | 723,391 | ||||
December 31, | |||||||
2017 | 2016 | ||||||
Segment goodwill: | |||||||
Surveillance | $ | 253,341 | $ | 152,383 | |||
Instruments | 155,937 | 147,595 | |||||
Security | 92,719 | 102,983 | |||||
OEM & Emerging Markets | 256,745 | 252,647 | |||||
Maritime | 103,048 | 97,860 | |||||
Detection | 48,021 | 47,938 | |||||
$ | 909,811 | $ | 801,406 | ||||
82
FLIR SYSTEMS, INC.
NOTES TO THE CONSOLIDATED FINANCIAL STATEMENTS—(Continued)
Note 17. | Operating Segments and Related Information - (Continued) |
Revenue and Long-Lived Assets by Geographic Area
Information related to revenue by significant geographical location, determined by the end customer, is as follows (in thousands):
Year Ended December 31, | |||||||||||
2017 | 2016 | 2015 | |||||||||
United States | $ | 956,438 | $ | 903,582 | $ | 830,485 | |||||
Europe | 375,474 | 338,805 | 338,886 | ||||||||
Asia | 227,047 | 195,913 | 175,616 | ||||||||
Middle East/Africa | 127,796 | 130,890 | 125,848 | ||||||||
Canada/Latin America | 113,679 | 92,977 | 86,232 | ||||||||
$ | 1,800,434 | $ | 1,662,167 | $ | 1,557,067 | ||||||
Long-lived assets are comprised of net property and equipment, net identifiable intangible assets, goodwill and other long-term assets. Long-lived assets by significant geographic locations are as follows (in thousands):
December 31, | |||||||
2017 | 2016 | ||||||
United States | $ | 797,816 | $ | 676,007 | |||
Europe | 343,208 | 673,767 | |||||
Other foreign | 260,782 | 60,032 | |||||
$ | 1,401,806 | $ | 1,409,806 | ||||
Major Customers
Revenue derived from major customers is as follows (in thousands):
Year Ended December 31, | |||||||||||
2017 | 2016 | 2015 | |||||||||
United States government | $ | 466,304 | $ | 416,341 | $ | 321,420 | |||||
Note 18. | Business Acquisitions and Divestitures |
DVTEL Inc.
During 2015, the Company acquired 100% of the outstanding stock of DVTEL Inc. ("DVTEL"), a provider of software and hardware technologies for advanced video surveillance, for approximately $97.5 million in cash. During 2016, the Company finalized the purchase price allocation which had no change to the previously recorded allocation of $27.4 million to identified intangible assets. These amounts have been recorded within the Company's Security segment.
The allocation of the purchase price for DVETEL is as follows (in thousands):
Cash acquired | $ | 5,015 | |
Other tangible assets and liabilities, net | 4,025 | ||
Net deferred taxes | 582 | ||
Identifiable intangible assets | 27,380 | ||
Goodwill | 60,494 | ||
Total purchase price | $ | 97,496 | |
83
FLIR SYSTEMS, INC.
NOTES TO THE CONSOLIDATED FINANCIAL STATEMENTS—(Continued)
Note 18. | Business Acquisitions and Divestitures - (Continued) |
The Company made an election under Section 338 of the Internal Revenue Code of 1986, as amended, which resulted in tax-deductible goodwill related to the acquisition of DVTEL. The Company estimates that the tax-deductible goodwill and intangibles resulting from the election will be approximately $24.8 million, to be amortized for United States tax purposes over a 15-year period. The value of tax-deductible goodwill and intangibles differs from the amounts listed in the purchase price allocation above as the impact of the elections made under Section 338 only affects United States income taxes for the goodwill and intangibles that are owned by the Company's United States subsidiaries.
In connection with the allocation of purchase price to the assets acquired and liabilities assumed, the Company identified certain intangible assets. The following table presents the acquired intangible assets, their estimated fair values, and estimated useful lives (in thousands, except years):
Estimated Useful Life | Amount | ||||
Developed technology | 7.5 years | $ | 21,500 | ||
Customer relationships | 10.0 years | 3,800 | |||
In-process research and development | n/a | 1,700 | |||
Other | 1.0 year | 380 | |||
$ | 27,380 | ||||
Acquisition-date identifiable intangible assets primarily consist of intangibles derived from developed technology, customer relationships, and in-process research and development. Developed technology represents completed software related to internal and external software platforms. In-process research and development represents the value assigned to acquired research and development projects that, as of the acquisition date, had not established technological feasibility and had no alternative future use. The in-process research and development intangible assets are capitalized and accounted for as indefinite-lived intangible assets and are subject to impairment testing until completion or abandonment of the projects. Upon successful completion of each project and launch of the product, we will make a separate determination of useful life of the in-process research and development intangible assets and the related amortization will be recorded as an expense over the estimated useful life of the specific projects.
An average 10-year useful life for customer relationships has been estimated based on the projected economic benefits associated with this asset. The average 10-year estimated useful life represents the approximate point in the projection period in which a majority of the asset’s cash flows are expected to be realized based on assumed attrition rates.
The developed technology, customer relationships, and in-process research and development were valued using the multi-period excess earnings method.
Innovative Security Designs, LLC
During 2016, the Company acquired the assets of Innovative Security Designs, LLC ("ISD"), a developer of embedded firmware and advanced camera surveillance platforms, for approximately $1.8 million in cash, which resulted in an allocation of $1.6 million to goodwill. These amounts have been recorded in the Company’s Security segment.
Armasight, Inc.
During 2016, the Company acquired 100% of the outstanding stock of Armasight, Inc. ("Armasight"), a developer of sporting and military optics products, for approximately $43.5 million in cash.
The allocation of the purchase price for Armasight is as follows (in thousands):
Cash acquired | $ | 2,804 | |
Other tangible assets and liabilities, net | 1,925 | ||
Net deferred taxes | (1,855 | ) | |
Identifiable intangible assets | 7,600 | ||
Goodwill | 32,994 | ||
Total purchase price | $ | 43,468 | |
84
FLIR SYSTEMS, INC.
NOTES TO THE CONSOLIDATED FINANCIAL STATEMENTS—(Continued)
Note 18. | Business Acquisitions and Divestitures - (Continued) |
The $33.0 million of goodwill represents future economic benefits expected to arise from synergies from combining operations and the ability of Armasight to provide the Company domain knowledge and distribution channels in adjacent markets.
In connection with the allocation of purchase price to the assets acquired and liabilities assumed, the Company identified certain intangible assets. The following table presents the acquired intangible assets, their estimated fair values, and estimated useful lives (in thousands, except years):
Estimated Useful Life | Amount | ||||
Customer relationships | 4.0 years | 5,200 | |||
Trade name | 3.0 years | 1,000 | |||
Trade Secrets | 6.0 years | 1,400 | |||
$ | 7,600 | ||||
Acquisition-date identifiable intangible assets primarily consist of intangibles derived from customer relationships, trade names and trademarks, and trade secrets. Customer relationships represents Armasight's ability to consistently offer compelling products that appeal to consumer preferences which is the critical factor impacting the decisions of retailers to carry Armasight products. The trade name represents the value of the Armasight name within the outdoor and tactical weapons sight industry. The trade secrets represent the knowledge that is institutionalized within the employees and former shareholders of Armasight and their relationships with key suppliers.
Customer relationships were valued using the income approach and the lost income and multi-period excess earnings method. The trade name and trade secrets were valued using the income approach and the relief from royalty method.
Point Grey Research, Inc.
During 2016, the Company completed a transaction to acquire the assets of Point Grey Research Inc. (“Point Grey”), a global leader in the development of advanced visible imaging cameras and solutions that are used in industrial automation systems, medical diagnostic equipment, people counting systems, intelligent traffic systems, military and defense products, and advanced mapping systems, for approximately $259.2 million in cash. During 2017, the Company finalized the purchase price allocation which had no change to the previously recorded allocation of $39.8 million to identifiable intangible assets and $183.7 million to goodwill. These amounts have been recorded in the Company’s OEM & Emerging Markets segment.
The allocation of the purchase price for Point Grey is as follows (in thousands):
Cash acquired | $ | 2,994 | |
Other tangible assets and liabilities, net | 35,127 | ||
Net deferred taxes | (2,438 | ) | |
Identifiable intangible assets | 39,800 | ||
Goodwill | 183,678 | ||
Total purchase price | $ | 259,161 | |
The allocation of the purchase price related to this acquisition is based on management’s judgments after evaluating several factors, including valuation assessments of tangible and intangible assets, and estimates of the fair value of liabilities assumed. The goodwill of $183.7 million represents future economic benefits expected to arise from synergies from combining operations and the ability of Point Grey to provide the Company domain knowledge and distribution channels in adjacent markets.
85
FLIR SYSTEMS, INC.
NOTES TO THE CONSOLIDATED FINANCIAL STATEMENTS—(Continued)
Note 18. | Business Acquisitions and Divestitures - (Continued) |
In connection with the allocation of purchase price to the assets acquired and liabilities assumed, the Company identified certain intangible assets. The following table presents the acquired intangible assets, their estimated fair values, and estimated useful lives (in thousands, except years):
Estimated Useful Life | Amount | ||||
Developed technology | 10.0 years | $ | 23,100 | ||
Customer relationships | 7.0 years | 13,200 | |||
Backlog | 1.0 year | 2,300 | |||
Non-Competition Agreements | 5.0 years | 1,000 | |||
Other | n/a | 200 | |||
$ | 39,800 | ||||
Acquisition-date identifiable intangible assets primarily consist of intangibles derived from developed technology, customer relationships, backlog, and non-competition agreements. Developed technology represents the economic advantage of having certain technologies in place that lowers manufacturing and operating costs and drives higher margins. Customer relationships represents the relationships Point Grey has established in the OEM and people counting markets as of the date of the acquisition. Backlog represents “pre-sold” business at the date of acquisition, which provides positive earning streams post acquisition that exceed what is required to provide a return on the other assets employed. Non-competition agreements represent the economic benefit of having agreements with certain current and former employees and shareholders of Point Grey that restrict their ability to compete directly with the Company.
The developed technology was valued using the income approach and relief from royalty method. Customer relationships and backlog were valued using the income approach and multi-period excess earnings method. Non-competition agreements were valued using the income approach and the with-and-without method.
Prox Dynamics, AS
During 2016, the Company acquired 100% of the outstanding stock of Prox Dynamics AS. (“Prox Dynamics”), a leading developer and manufacturer of nano-class UAS for military and para-military intelligence, surveillance, and reconnaissance applications, for approximately $134.4 million in cash, which resulted in the allocation of $11.3 million to net tangible asset and the excess purchase price of approximately $123.1 million to other long-term assets. During 2017, the Company finalized the purchase price allocation, which has been recorded in the Company’s Surveillance business segment.
The allocation of the purchase price for Prox Dynamics is as follows (in thousands):
Cash acquired | $ | 11,706 | |
Other tangible assets and liabilities, net | (900 | ) | |
Net deferred taxes | (4,250 | ) | |
Identifiable intangible assets | 31,400 | ||
Goodwill | 96,431 | ||
Total purchase price | $ | 134,387 | |
The goodwill of $96.4 million million represents future economic benefits expected to arise from synergies from combining operations the ability of Prox Dynamics to provide the Company domain knowledge and distribution channels in adjacent markets.
86
FLIR SYSTEMS, INC.
NOTES TO THE CONSOLIDATED FINANCIAL STATEMENTS—(Continued)
Note 18. | Business Acquisitions and Divestitures - (Continued) |
In connection with the allocation of purchase price to the assets acquired and liabilities assumed, the Company identified certain intangible assets. The following table presents the acquired intangible assets, their estimated fair values, and estimated useful lives (in thousands, except years):
Estimated Useful Life | Amount | ||||
Developed technology | 8 years | $ | 23,400 | ||
Customer relationships | 7 years | 3,500 | |||
Patents | 8 years | 3,100 | |||
Trade name | 8 years | 1,400 | |||
$ | 31,400 | ||||
Acquisition-date identifiable intangible assets primarily consist of intangibles derived from developed technology, customer relationships, patents, and trade name. Developed technology and patents represent the economic advantage of having certain technologies in place that lower manufacturing and operating costs and drive higher margins. Customer relationships represents the relationships Prox Dynamics has established in the military and defense ministries of countries throughout the world. Trade name represents the "Black Hornet" name, which is well recognized within the industry and is known as a leading product within the nano-class UAS segment.
The developed technology and customer relationships were valued using the income approach and multi-period excess earnings method. Patents and trade name were valued using the income approach and relief from royalty method.
The acquisitions of DVTEL, ISD, Armasight, Point Grey, and Prox Dynamics are not significant as defined in Regulation S-X under the Securities Exchange Act of 1934, nor are they significant compared to the Company's overall results of operations. Consequently, no pro forma financial information is provided.
Planned Divestiture of the Consumer and Small and Medium-Sized Security Business
During the fourth quarter of 2017, the Company committed to a plan to sell the Consumer and Small and Medium-sized ("SMB") Security business that has a carrying amount of $51.3 million as of December 31, 2017. In the fourth quarter of 2017, all the held for sale criteria were met and all the assets and liabilities of the disposal group were classified as held for sale on the Consolidated Balance Sheets accordingly. The Company estimates the fair value of the disposal group to be $28.8 million. The costs to sell the disposal group, including legal fees, brokers commissions and other closing costs are estimated to be approximately $1.1 million. Consequently, the Company recorded a pre-tax loss on net assets held for sale of $23.6 million as of December 31, 2017 representing the excess of the $51.3 million carrying value over the $27.7 million estimated fair value less costs to sell. The estimated loss on sale has been recorded as loss on net assets held for sale on the Consolidated Statements of Income. This anticipated disposal does not qualify as discontinued operations and therefore, is included in the Company’s continuing operations for all periods presented. The carrying amounts of the major classes of assets and liabilities held for sale included the following (in thousands):
Accounts receivable, net | $ | 20,414 | |
Inventories | 43,050 | ||
Other current assets | 1,031 | ||
Property and equipment, net | 4,888 | ||
Intangible assets, net | 8,359 | ||
Goodwill | 13,090 | ||
Loss on assets | (23,488 | ) | |
Assets held for sale, net | $ | 67,344 | |
Accounts payable and accrued expenses | $ | 39,544 | |
Liabilities held for sale | $ | 39,544 | |
87
FLIR SYSTEMS, INC.
NOTES TO THE CONSOLIDATED FINANCIAL STATEMENTS—(Continued)
Note 18. | Business Acquisitions and Divestitures - (Continued) |
We ceased recording depreciation and amortization on property, plant and equipment and identified intangibles assets, respectively, as of the date the assets triggered held for sale accounting. There were no assets or liabilities classified as held for sale as of December 31, 2016. On February 6, 2018, the Company completed the sale of this business. See Note 21, "Subsequent Events", for further discussion.
Note 19. | Shareholders’ Equity |
On February 5, 2015, the Company's Board of Directors authorized the repurchase of up to 15.0 million shares of common stock in the open market or through privately negotiated transactions. This authorization expired on February 5, 2017. On February 8, 2017, the Company’s Board of Directors authorized the repurchase of up to 15.0 million shares of common stock in the open market or through privately negotiated transactions. This authorization expires on February 8, 2019. During the year ended December 31, 2017, the company did not repurchase any shares.
During the year ended December 31, 2017, the Company paid dividends quarterly at the rate of $0.15 per share for a total of $82.6 million. During the year ended December 31, 2016, the Company paid dividends quarterly at the rate of $0.12 per share for a total of $65.9 million. During the year ended December 31, 2015, the Company paid dividends quarterly at the rate of $0.11 per share for a total of $61.4 million.
Note 20. | Restructuring Costs |
During the years ended December 31, 2017, 2016 and 2015, the Company recorded net pre-tax restructuring expenses totaling $0.6 million, $1.4 million and $1.4 million, respectively. In 2013, the Company initiated a realignment plan that included closing six not-to-scale sites in the United States and Europe and a transfer of those operations to the Company's larger facilities ("the 2013 Realignment Program"). The Company also consolidated its optics and laser manufacturing businesses to better realize the benefits of vertical integration in these areas.
The Company recorded the restructuring expenses associated with the 2013 Realignment Program in the segments as follows (in thousands):
Year Ended December 31, | |||||||||||
2017 | 2016 | 2015 | |||||||||
Surveillance | $ | — | $ | 107 | $ | 226 | |||||
Instruments | 23 | 492 | 1,170 | ||||||||
Security | — | — | — | ||||||||
OEM & Emerging | — | 65 | (22 | ) | |||||||
Detection | — | — | (13 | ) | |||||||
$ | 23 | $ | 664 | $ | 1,361 | ||||||
During the year ended December 31, 2017 and 2016, the Company also incurred other immaterial restructuring charges representing severance costs associated with cost reduction initiatives executed within the Security segment that were not related to the 2013 Realignment Program.
Restructuring expenses associated with the 2013 Realignment Program were recorded in the Consolidated Statements of Income as follows (in thousands):
Year Ended December 31, | |||||||||||
2017 | 2016 | 2015 | |||||||||
Restructuring expenses | $ | 23 | $ | 664 | $ | 1,361 | |||||
$ | 23 | $ | 664 | $ | 1,361 | ||||||
88
FLIR SYSTEMS, INC.
NOTES TO THE CONSOLIDATED FINANCIAL STATEMENTS—(Continued)
Note 20. | Restructuring Costs - (Continued) |
The following table summarizes the restructuring activity associated with the 2013 Realignment Program by cost type (in thousands):
Severance | Facilities Exit, Lease Terminations & Other | Total | |||||||||
Balance, December 31, 2014 | $ | 10,941 | $ | 1,485 | $ | 12,426 | |||||
2015 restructuring costs | 924 | 437 | 1,361 | ||||||||
Utilization | (8,409 | ) | (1,601 | ) | (10,010 | ) | |||||
Balance, December 31, 2015 | $ | 3,456 | $ | 321 | $ | 3,777 | |||||
2016 restructuring expenses | 642 | 22 | 664 | ||||||||
Utilization | (2,257 | ) | (343 | ) | (2,600 | ) | |||||
Balance, December 31, 2016 | $ | 1,841 | $ | — | $ | 1,841 | |||||
2017 restructuring expenses | 23 | — | 23 | ||||||||
Utilization | (133 | ) | — | (133 | ) | ||||||
Balance, December 31, 2017 | $ | 1,731 | $ | — | $ | 1,731 | |||||
Note 21. | Subsequent Events |
On January 5, 2018, the Company entered into a definitive agreement to sell the Security segment's Consumer and SMB business. The transaction closed on February 6, 2018 for total cash consideration of approximately $29.0 million. See Note 18, "Business Acquisitions and Divestitures," for additional information.
On February 8, 2018, the Company’s Board of Directors declared a quarterly dividend of $0.16 per share on its common stock, payable on March 9, 2018, to shareholders of record as of the close of business on February 23, 2018. The total cash payment of this dividend will be approximately $22.2 million.
89
QUARTERLY FINANCIAL DATA (UNAUDITED) FLIR SYSTEMS, INC. (In thousands, except per share data) | |||||||||||||||
Q1 | Q2 | Q3 | Q4 | ||||||||||||
2017 | |||||||||||||||
Revenue | $ | 406,814 | $ | 434,124 | $ | 464,712 | $ | 494,784 | |||||||
Gross profit | 191,321 | 206,732 | 222,891 | 237,832 | |||||||||||
Net earnings (loss)(1) | 42,571 | 51,413 | 63,529 | (50,290 | ) | ||||||||||
Earnings per share: | |||||||||||||||
Basic earnings (loss) per share | $ | 0.31 | $ | 0.38 | $ | 0.46 | $ | (0.36 | ) | ||||||
Diluted earnings (loss) per share | $ | 0.31 | $ | 0.37 | $ | 0.46 | $ | (0.36 | ) | ||||||
2016 | |||||||||||||||
Revenue | $ | 379,472 | $ | 402,729 | $ | 405,228 | $ | 474,738 | |||||||
Gross profit | 177,690 | 183,322 | 191,376 | 214,733 | |||||||||||
Net earnings(2) | 1,125 | 45,368 | 58,633 | 61,500 | |||||||||||
Earnings per share: | |||||||||||||||
Basic earnings per share | $ | 0.01 | $ | 0.33 | $ | 0.43 | $ | 0.45 | |||||||
Diluted earnings per share | $ | 0.01 | $ | 0.33 | $ | 0.43 | $ | 0.45 | |||||||
_______________
(1) | Net earnings for the fourth quarter of 2017 includes a discrete tax charge of $94.4 million associated with U.S. Tax Cuts and Jobs Act enacted in December 2017 and a loss on net assets held for sale of $23.6 million. |
(2) | Net earnings for the first quarter of 2016 includes a discrete tax charge for certain tax legislation in Belgium of $39.6 million. |
The sum of the quarterly earnings per share does not always equal the annual earnings per share as a result of the computation of quarterly versus annual average shares outstanding.
90
ITEM 9. | CHANGES IN AND DISAGREEMENTS WITH ACCOUNTANTS ON ACCOUNTING AND FINANCIAL DISCLOSURE |
None.
ITEM 9A. | CONTROLS AND PROCEDURES |
Evaluation of Disclosure Controls and Procedures
As of December 31, 2017, the Company completed its annual evaluation, under the supervision and with the participation of the Company’s management, including the Company’s Chief Executive Officer and the Company’s Chief Financial Officer, of the effectiveness of the design and operation of the Company’s disclosure controls and procedures. Based on the evaluation, the Company’s Chief Executive Officer and Chief Financial Officer have concluded that the Company’s disclosure controls and procedures are effective to ensure that information required to be disclosed by the Company in the reports it files or submits under the Securities Exchange Act of 1934, as amended, is recorded, processed, summarized and reported within the time periods specified in Securities and Exchange Commission rules and forms. There were no changes in the Company’s internal control over financial reporting that occurred during the Company's fourth fiscal quarter that have materially affected, or are reasonably likely to materially affect, the Company’s internal control over financial reporting.
Management’s Report on Internal Control over Financial Reporting
Our management is responsible for establishing and maintaining adequate internal control over financial reporting, as such term is defined in Exchange Act Rule 13a-15(f). Our internal control over financial reporting is designed to provide reasonable assurance to our management and Board of Directors regarding the preparation and fair presentation of published financial statements.
Because of its inherent limitations, internal control over financial reporting may not prevent or detect misstatements. Therefore, even those systems determined to be effective can provide only reasonable assurance with respect to financial statement preparation and presentation.
Under the supervision and with the participation of our management, including our Chief Executive Officer and Chief Financial Officer, we conducted an evaluation of the effectiveness of our internal control over financial reporting based on the framework in the Internal Control—Integrated Framework (2013) issued by the Committee of Sponsoring Organizations of the Treadway Commission (“COSO”).
Based on our evaluation using the Internal Control—Integrated Framework (2013), our management concluded that our internal control over financial reporting was effective as of December 31, 2017.
KPMG LLP, an independent registered public accounting firm, has issued an attestation report on the Company’s internal control over financial reporting as of December 31, 2017, which is included elsewhere in this Form 10-K.
91
REPORT OF INDEPENDENT REGISTERED PUBLIC ACCOUNTING FIRM
To the shareholders and board of directors
FLIR Systems, Inc.:
Opinion on Internal Control Over Financial Reporting
We have audited FLIR Systems, Inc.’s and subsidiaries' (the Company) internal control over financial reporting as of December 31, 2017, based on criteria established in Internal Control - Integrated Framework (2013) issued by the Committee of Sponsoring Organizations of the Treadway Commission. In our opinion, the Company maintained, in all material respects, effective internal control over financial reporting as of December 31, 2017, based on criteria established in Internal Control - Integrated Framework (2013) issued by the Committee of Sponsoring Organizations of the Treadway Commission.
We also have audited, in accordance with the standards of the Public Company Accounting Oversight Board (United States) (PCAOB), the consolidated balance sheets of the Company as of December 31, 2017 and 2016, the related consolidated statements of income, comprehensive income, shareholders’ equity, and cash flows for each of the years in the three-year period ended December 31, 2017, and the related notes (collectively, the consolidated financial statements), and our report dated February 23, 2018 expressed an unqualified opinion on those consolidated financial statements.
Basis for Opinion
The Company’s management is responsible for maintaining effective internal control over financial reporting and for its assessment of the effectiveness of internal control over financial reporting, included in the accompanying Management’s Report on Internal Control over Financial Reporting. Our responsibility is to express an opinion on the Company’s internal control over financial reporting based on our audit. We are a public accounting firm registered with the PCAOB and are required to be independent with respect to the Company in accordance with the U.S. federal securities laws and the applicable rules and regulations of the Securities and Exchange Commission and the PCAOB.
We conducted our audit in accordance with the standards of the PCAOB. Those standards require that we plan and perform the audit to obtain reasonable assurance about whether effective internal control over financial reporting was maintained in all material respects. Our audit of internal control over financial reporting included obtaining an understanding of internal control over financial reporting, assessing the risk that a material weakness exists, and testing and evaluating the design and operating effectiveness of internal control based on the assessed risk. Our audit also included performing such other procedures as we considered necessary in the circumstances. We believe that our audit provides a reasonable basis for our opinion.
Definition and Limitations of Internal Control Over Financial Reporting
A company’s internal control over financial reporting is a process designed to provide reasonable assurance regarding the reliability of financial reporting and the preparation of financial statements for external purposes in accordance with generally accepted accounting principles. A company’s internal control over financial reporting includes those policies and procedures that (1) pertain to the maintenance of records that, in reasonable detail, accurately and fairly reflect the transactions and dispositions of the assets of the company; (2) provide reasonable assurance that transactions are recorded as necessary to permit preparation of financial statements in accordance with generally accepted accounting principles, and that receipts and expenditures of the company are being made only in accordance with authorizations of management and directors of the company; and (3) provide reasonable assurance regarding prevention or timely detection of unauthorized acquisition, use, or disposition of the company’s assets that could have a material effect on the financial statements.
Because of its inherent limitations, internal control over financial reporting may not prevent or detect misstatements. Also, projections of any evaluation of effectiveness to future periods are subject to the risk that controls may become inadequate because of changes in conditions, or that the degree of compliance with the policies or procedures may deteriorate.
/s/ KPMG LLP
Portland, Oregon
February 23, 2018
92
ITEM 9B. | OTHER INFORMATION |
None.
PART III
ITEM 10. | DIRECTORS, EXECUTIVE OFFICERS AND CORPORATE GOVERNANCE |
Information with respect to directors and executive officers of the Company is included under “Election of Directors,” “Management,” “Section 16(a) Beneficial Ownership Reporting Compliance,” “Corporate Governance and Related Matters” and “Audit Committee Report” in the Company’s definitive proxy statement for its 2018 Annual Meeting of Shareholders and is incorporated herein by reference.
The Company has adopted a Code of Ethics for Senior Financial Officers (the “Code of Ethics”) that applies to the Company’s Chief Executive Officer, Chief Financial Officer, Controller and persons performing similar duties. The Code of Ethics is publicly available on the Company’s website (www.flir.com) in the Governance area of the Investor Relations segment of the website. None of the material on the Company’s website is part of this Annual Report. If there is any waiver from or amendment to any provision of the Code of Ethics for the Company’s Chief Executive Officer, Chief Financial Officer, Controller and persons performing similar duties, the Company will disclose the nature of such waiver or amendment on its website.
ITEM 11. | EXECUTIVE COMPENSATION |
Information with respect to executive compensation is included under “Compensation Discussion and Analysis,” “Compensation Committee Report,” “Compensation of Named Executive Officers,” and “Director Compensation” in the Company’s definitive proxy statement for its 2018 Annual Meeting of Shareholders and is incorporated herein by reference.
ITEM 12. | SECURITY OWNERSHIP OF CERTAIN BENEFICIAL OWNERS AND MANAGEMENT AND RELATED STOCKHOLDER MATTERS |
Information with respect to security ownership of certain beneficial owners and management is included under “Stock Owned by Management” and “Stock Owned by Principal Shareholders” in the Company’s definitive proxy statement for its 2018 Annual Meeting of Shareholders and is incorporated herein by reference. Information with respect to equity compensation plans is included under “Equity Compensation Plan Information” in the Company’s definitive proxy statement for its 2018 Annual Meeting of Shareholders and is incorporated herein by reference.
ITEM 13. | CERTAIN RELATIONSHIPS AND RELATED TRANSACTIONS, AND DIRECTOR INDEPENDENCE |
Information with respect to certain relationships and related transactions is included under “Certain Relationships and Related Transactions” in the Company’s definitive proxy statement for its 2018 Annual Meeting of Shareholders and is incorporated herein by reference. Information with respect to Director independence is included under “Corporate Governance and Related Matters—Board of Directors Committees” in the Company’s definitive proxy statement for its 2018 Annual Meeting of Shareholders and is incorporated herein by reference.
ITEM 14. | PRINCIPAL ACCOUNTANT FEES AND SERVICES |
Information with respect to principal accountant fees and services is included under “Ratification of Appointment of the Independent Registered Public Accounting Firm and Related Information—Fees Paid to KPMG LLP” in the Company’s definitive proxy statement for its 2018 Annual Meeting of Shareholders and is incorporated herein by reference.
93
PART IV
ITEM 15. | EXHIBITS AND FINANCIAL STATEMENT SCHEDULES |
(a)(1) Financial Statements
The financial statements are included in Item 8 above.
(a)(2) Financial Statement Schedules
No schedules are included because the required information is inapplicable, not required or are presented in the financial statements or the related notes thereto.
(a)(3) Exhibits
Number | Description |
2.1 | |
3.1 | |
3.2 | |
3.3 | |
4.1 | |
4.2 | |
4.3 | |
4.4 | |
4.5 | |
4.6 | |
10.1 | |
10.2 | |
10.3 | |
10.4 | |
10.5 | |
10.6 | |
10.7 | |
94
10.8 | |
10.9 | |
10.10 | |
10.11 | |
10.12 | |
10.13 | |
10.14 | |
10.15 | |
10.16 | |
10.17 | |
10.18 | |
10.19 | |
10.20 | |
10.21 | |
10.22 | |
10.23 | |
21.0 | |
23.0 | |
31.1 | |
31.2 | |
32.1 | |
32.2 | |
101.INS | XBRL Instance Document |
101.SCH | XBRL Taxonomy Extension Schema Document |
95
101.CAL | XBRL Taxonomy Extension Calculation Linkbase Document |
101.DEF | XBRL Taxonomy Extension Definition Linkbase Document |
101.LAB | XBRL Taxonomy Extension Label Linkbase Document |
101.PRE | XBRL Taxonomy Extension Presentation Linkbase Document |
(1) | This exhibit constitutes a management contract or compensatory plan or arrangement. |
ITEM 16. FORM 10-K SUMMARY
None.
96
SIGNATURES
Pursuant to the requirements of Section 13 or 15(d) of the Securities Exchange Act of 1934, the Registrant has duly caused this report to be signed on its behalf by the undersigned, thereunto duly authorized on the 23rd day of February 2018.
FLIR SYSTEMS, INC. | |||
(Registrant) | |||
By: | /s/ CAROL P. LOWE | ||
Carol P. Lowe Executive Vice President and Chief Financial Officer | |||
Pursuant to the requirements of the Securities Exchange Act of 1934, this report has been signed below by the following persons on behalf of the Registrant and in the capacities indicated on February 23, 2018.
Signature | Title | |
/S/ JAMES J. CANNON | President, Chief Executive Officer and Director | |
James J. Cannon | ||
/S/ CAROL P. LOWE | Executive Vice President and Chief Financial Officer | |
Carol P. Lowe | (Principal Financial Officer) | |
/S/ BRIAN E. HARDING | Vice President and Corporate Controller | |
Brian E. Harding | (Principal Accounting Officer) | |
/S/ EARL R. LEWIS | Chairman of the Board of Directors | |
Earl R. Lewis | ||
/S/ JOHN D. CARTER | Director | |
John D. Carter | ||
/S/ WILLIAM W. CROUCH | Director | |
William W. Crouch | ||
/S/ CATHERINE A. HALLIGAN | Director | |
Catherine A. Halligan | ||
/S/ ANGUS L. MACDONALD | Director | |
Angus L. Macdonald | ||
/S/ MICHAEL T. SMITH | Director | |
Michael T. Smith | ||
/S/ CATHY A. STAUFFER | Director | |
Cathy A. Stauffer | ||
/s/ ROBERT S. TYRER | Director | |
Robert S. Tyrer | ||
/S/ JOHN W. WOOD, JR. | Director | |
John W. Wood, Jr. | ||
/S/ STEVEN E. WYNNE | Director | |
Steven E. Wynne | ||
97