Attached files
| file | filename |
|---|---|
| EX-32.2 - EXHIBIT 32.2 - BUNGELTD | ex-322x123117.htm |
| EX-32.1 - EXHIBIT 32.1 - BUNGELTD | ex-321x123117.htm |
| EX-31.2 - EXHIBIT 31.2 - BUNGELTD | ex-312x123117.htm |
| EX-31.1 - EXHIBIT 31.1 - BUNGELTD | ex-311x123117.htm |
| EX-23.1 - EXHIBIT 23.1 - BUNGELTD | consentofindependentregist.htm |
| EX-21.1 - EXHIBIT 21.1 - BUNGELTD | listofbungesubsidiaries-ex.htm |
| EX-12.1 - EXHIBIT 12.1 - BUNGELTD | ratiosofearningstofixedcha.htm |
| EX-10.41 - EXHIBIT 10.41 - BUNGELTD | a2017non-employeedirectors.htm |
| EX-10.16 - EXHIBIT 10.16 - BUNGELTD | twelfthamendmenttortaoctob.htm |
| EX-10.15 - EXHIBIT 10.15 - BUNGELTD | eleventhamendmenttotherta2.htm |
UNITED STATES
SECURITIES AND EXCHANGE COMMISSION
Washington, DC 20549
____________________________________________________________________________
FORM 10-K
ý | ANNUAL REPORT PURSUANT TO SECTION 13 OR 15(d) OF THE SECURITIES EXCHANGE ACT OF 1934 | |
For the fiscal year ended December 31, 2017 | ||
Or | ||
o | TRANSITION REPORT PURSUANT TO SECTION 13 OR 15(d) OF THE SECURITIES EXCHANGE ACT OF 1934 | |
For the transition period from to | ||
Commission File Number 001-16625
BUNGE LIMITED

(Exact name of registrant as specified in its charter)
Bermuda (State or other jurisdiction of incorporation or organization) | 98-0231912 (IRS Employer Identification No.) | |
50 Main Street White Plains, New York USA (Address of principal executive offices) | 10606 (Zip Code) | |
(914) 684-2800
(Registrant's telephone number, including area code)
Securities registered pursuant to Section 12(b) of the Act:
Title of each class | Name of each exchange on which registered | |
Common Shares, par value $.01 per share | New York Stock Exchange | |
Securities registered pursuant to Section 12(g) of the Act: None
Indicate by check mark if the registrant is a well-known seasoned issuer, as defined in Rule 405 of the Securities Act. Yes ý No o
Indicate by check mark if the registrant is not required to file reports pursuant to Section 13 or Section 15(d) of the Securities Act. Yes o No ý
Indicate by check mark whether the registrant (1) has filed all reports required to be filed by Section 13 or 15(d) of the Securities Exchange Act of 1934 during the preceding 12 months (or for such shorter period that the registrant was required to file such reports), and (2) has been subject to such filing requirements for the past 90 days. Yes ý No o
Indicate by check mark whether the registrant has submitted electronically and posted on its corporate web site, if any, every Interactive Data File required to be submitted and posted pursuant to Rule 405 of Regulation S-T (§232.405 of this chapter) during the preceding 12 months (or for such shorter period that the registrant was required to submit and post such files). Yes ý No o
Indicate by check mark if disclosure of delinquent filers pursuant to Item 405 of Regulation S-K is not contained herein, and will not be contained, to the best of registrant's knowledge, in definitive proxy or information statements incorporated by reference in Part III of this Form 10-K or any amendment to this Form 10-K. o
Indicate by check mark whether the registrant is a large accelerated filer, an accelerated filer, a non-accelerated filer, or a smaller reporting company. See the definitions of "large accelerated filer," "accelerated filer," and "smaller reporting company" in Rule 12b-2 of the Exchange Act:
Large Accelerated filer ý | Accelerated filer o | Non-accelerated filer o (do not check if a smaller reporting company) | Smaller reporting company o | Emerging growth company o |
Indicate by check mark whether the registrant is a shell company (as defined in Rule 12b-2 of the Act). Yes o No ý
The aggregate market value of registrant's common shares held by non-affiliates, based upon the closing price of our common shares on the last business day of the registrant's most recently completed second fiscal quarter, June 30, 2017, as reported by the New York Stock Exchange, was approximately $10,448 million. Common shares held by executive officers and directors and persons who own 10% or more of the issued and outstanding common shares have been excluded since such persons may be deemed affiliates. This determination of affiliate status is not a determination for any other purpose.
As of February 16, 2018, 140,699,827 Common Shares, par value $.01 per share, were issued and outstanding.
DOCUMENTS INCORPORATED BY REFERENCE
Portions of the proxy statement for the 2018 Annual General Meeting of Shareholders to be held on May 24, 2018 are incorporated by reference into Part III.
1
Table of Contents
Page | ||
1
Cautionary Statement Regarding Forward Looking Statements
The Private Securities Litigation Reform Act of 1995 provides a "safe harbor" for forward looking statements to encourage companies to provide prospective information to investors. This Annual Report on Form 10-K includes forward looking statements that reflect our current expectations and projections about our future results, performance, prospects and opportunities. Forward looking statements include all statements that are not historical in nature. We have tried to identify these forward looking statements by using words including "may," "will," "should," "could," "expect," "anticipate," "believe," "plan," "intend," "estimate," "continue" and similar expressions. These forward looking statements are subject to a number of risks, uncertainties, assumptions and other factors that could cause our actual results, performance, prospects or opportunities to differ materially from those expressed in, or implied by, these forward looking statements. These factors include the risks, uncertainties, trends and other factors discussed under the headings "Item 1A. Risk Factors," as well as "Item 1. Business," "Item 7. Management's Discussion and Analysis of Financial Condition and Results of Operations," and elsewhere in this Annual Report on Form 10-K, including:
• | changes in governmental policies and laws affecting our business, including agricultural and trade policies and environmental, tax and biofuels regulation; |
• | our funding needs and financing sources; |
• | changes in foreign exchange policy or rates; |
• | the outcome of pending regulatory and legal proceedings; |
• | our ability to complete, integrate and benefit from acquisitions, divestitures, joint ventures and strategic alliances; |
• | our ability to achieve the efficiencies, savings and other benefits anticipated from our cost reduction, margin improvement, operational excellence and other business optimization initiatives; |
• | industry conditions, including fluctuations in supply, demand and prices for agricultural commodities and other raw materials and products that we sell and use in our business, fluctuations in energy and freight costs and competitive developments in our industries; |
• | weather conditions and the impact of crop and animal disease on our business; |
• | global and regional economic, agricultural, financial and commodities market, political, social and health conditions; |
• | operational risks, including industrial accidents and natural disasters; and |
• | other factors affecting our business generally. |
In light of these risks, uncertainties and assumptions, you should not place undue reliance on any forward looking statements contained in this Annual Report on Form 10-K. Additional risks that we may currently deem immaterial or that are not presently known to us could also cause the forward looking events discussed in this Annual Report on Form 10-K not to occur. Except as otherwise required by federal securities law, we undertake no obligation to publicly update or revise any forward looking statements, whether as a result of new information, future events, changed circumstances or any other reason after the date of this Annual Report on Form 10-K.
2
PART I
Item 1. Business
References in this Annual Report on Form 10-K to "Bunge Limited," "Bunge," "the Company," "we," "us" and "our" refer to Bunge Limited and its consolidated subsidiaries, unless the context otherwise indicates.
Business Overview
We are a leading global agribusiness and food company with integrated operations that stretch from the farm field to consumer foods. We believe we are a leading:
• | global oilseed processor and producer of vegetable oils and protein meals, based on processing capacity; |
• | global grain processor, based on volume; |
• | seller of packaged vegetable oils worldwide, based on sales; |
• | producer and seller of wheat flours and bakery mixes and dry milled corn products in North and South America, based on volume; and |
• | producer of sugar and ethanol in Brazil and global trader and merchandiser of sugar, based on volume. |
We conduct our operations in five segments: Agribusiness, Edible Oil Products, Milling Products, Sugar and Bioenergy, and Fertilizer. We refer to the Edible Oil and Milling Products segments collectively as our Food and Ingredients businesses. Our strategy is to profitably grow our position in our core grain and oilseed value chains, capitalizing on our integrated global footprint and key origination, logistics, processing and risk management competencies while pursuing operational excellence. We also are focused on growing our value added Food and Ingredients businesses so that over time they represent a more significant percentage of our earnings. Our strategy is aligned with long-term global macroeconomic and consumer growth trends, including a commitment to sustainability.
Our Agribusiness segment is an integrated, global business principally involved in the purchase, storage, transportation, processing and sale of agricultural commodities and commodity products. Our Agribusiness operations and assets are located in North and South America, Europe and Asia-Pacific, and we have merchandising and distribution offices throughout the world.
Our Food and Ingredients businesses, which consist of two reportable business segments: Edible Oil Products and Milling Products, include businesses that produce and sell edible oil based products, including vegetable oils, shortenings, margarines and mayonnaise and milled grain products such as wheat flours, bakery mixes, corn-based products and rice. The operations and assets of our Edible Oil Products segment are located in North and South America, Europe and Asia-Pacific and the operations and assets of our Milling Products segment are located in North and South America.
Our Sugar and Bioenergy segment produces and sells sugar and ethanol derived from sugarcane, as well as energy derived from the sugar and ethanol production process, through our operations in Brazil. Our operations in this segment also include global trading and merchandising of sugar and ethanol.
Our Fertilizer segment is involved in producing, blending and distributing fertilizer products for the agricultural industry in South America, with operations and retail distribution activities in Argentina, Uruguay and Paraguay, and port facilities in Argentina and Brazil.
2017 Summary Operating Highlights - In our Agribusiness segment in 2017, we continued to expand our global network of integrated assets. We acquired oilseed processing plants in the Netherlands and France, and we substantially completed the upgrade of an existing port terminal in the United States. Additionally, we completed construction and began operations at a new rapeseed processing plant in Asia-Pacific. These investments are intended to increase efficiency and position us for long-term growth in our Agribusiness operations. In our Food and Ingredients businesses, we acquired a leading olive oil and seed producer in Turkey and a leading supplier of oils and fats in the German bakery market, executing on our strategy to expand our value-added business. In addition, we announced an agreement to acquire a 70% ownership interest in IOI Loders Croklaan, which will create a leading solutions provider in business to business (“B2B”) oils while also accelerating the growth of our value-added oils business. We continued to improve the efficiency and performance of our milling operations in the Sugar and Bioenergy segment. Additionally, we launched a Global Competitiveness Program to improve our cost position and deliver increased value to shareholders.
3
History and Corporate Information
Bunge Limited is a limited liability company formed under the laws of Bermuda. We are registered with the Registrar of Companies in Bermuda under registration number EC20791. We trace our history back to 1818 when we were founded as a trading company in Amsterdam, The Netherlands. We are a holding company and substantially all of our operations are conducted through our subsidiaries. Our principal executive offices and corporate headquarters are located at 50 Main Street, White Plains, New York, 10606, United States of America and our telephone number is (914) 684-2800. Our registered office is located at 2 Church Street, Hamilton, HM 11, Bermuda.
Agribusiness
Overview—Our Agribusiness segment is an integrated, global business involved in the purchase, storage, transport, processing and sale of agricultural commodities and commodity products while managing risk across various product lines. The principal agricultural commodities that we handle in this segment are oilseeds, primarily soybeans, rapeseed, canola and sunflower seed, and grains, primarily wheat and corn. We process oilseeds into vegetable oils and protein meals, principally for the food, animal feed and biodiesel industries, through a global network of facilities. Our footprint is well balanced, with approximately 33% of our processing capacity located in South America, 27% in North America, 25% in Europe and 15% in Asia-Pacific.
Customers—We sell agricultural commodities and processed commodity products to customers throughout the world. The principal purchasers of our oilseeds, grains and oilseed meal are animal feed manufacturers, livestock producers, wheat and corn millers and other oilseed processors. As a result, our agribusiness operations generally benefit from global demand for protein, primarily poultry and pork products. The principal purchasers of the unrefined vegetable oils produced in this segment are our own Food and Ingredients businesses and third-party edible oil processing companies, which use these oils as raw materials in the production of edible oil products for the food service, food processor and retail markets. In addition, we sell oil products for various non-food uses, including industrial applications and the production of biodiesel.
Distribution and Logistics—We have developed an extensive global logistics network to transport our products, including trucks, railcars, river barges and ocean freight vessels. Typically, we either lease the transportation assets or contract with third parties for these services. To better serve our customer base and develop our global distribution and logistics capabilities, we own or operate either directly or through joint venture arrangements, various port terminal facilities globally, including in Brazil, Argentina, the United States, Canada, Russia, Ukraine, Poland, Vietnam and Australia.
Financial Services and Activities—We also offer various financial services, principally trade structured finance and financial risk management services for customers and other third parties. Our trade structured finance operations leverage our international trade flows to generate trade finance derived liquidity in emerging markets for customers and other third parties. Our financial risk management services include structuring and marketing risk management products to enable agricultural producers and end users of commodities to manage their commodity price risk exposures. Through our Financial Services Group we also engage in proprietary trading of foreign exchange and other financial instruments. Additionally, in Brazil, we provide financing services to farmers from whom we purchase soybeans and other agricultural commodities. Our farmer financing activities are an integral part of our grain and oilseed origination activities as they help assure the annual supply of raw materials for our Brazilian agribusiness operations.
Biodiesel—We own and operate biodiesel facilities in Europe and Brazil and have equity method investments in biodiesel producers in Europe and Argentina. This business is complementary to our core Agribusiness operations as in each case we supply some of the raw materials (crude vegetable oil) used in their production processes.
Raw Materials—We purchase oilseeds and grains either directly from farmers or indirectly through intermediaries. Although the availability and price of agricultural commodities may, in any given year, be affected by unpredictable factors such as weather, government programs and policies and farmer planting and selling decisions, our operations in major crop growing regions globally have enabled us to source adequate raw materials for our operational needs.
Competition—Due to their commodity nature, markets for our products are highly competitive and subject to product substitution. Competition is principally based on price, quality, product and service offerings and geographic location. Major competitors include but are not limited to: The Archer Daniels Midland Co. ("ADM"), Cargill Incorporated ("Cargill"), Louis Dreyfus Group ("Louis Dreyfus"), Glencore International PLC, Wilmar International Limited and COFCO Agri Limited ("COFCO").
Food and Ingredients
Overview—Our Food and Ingredients businesses include two reportable business segments: Edible Oil Products and Milling Products. We primarily sell our products to three customer types or market channels: food processors, food service
4
companies and retail outlets. The principal raw materials used in our Food and Ingredients businesses are various crude and further processed vegetable oils in our Edible Oil Products segment, and wheat, corn and rice in our Milling Products segment. These raw materials are agricultural commodities that we either produce or purchase from third parties. We believe that our global integrated business model enables us to realize synergies between our Agribusiness and Food and Ingredients operations through raw material procurement, logistics, risk management and co-location of industrial facilities, enabling us to supply customers with reliable, high quality products on a global basis. Additionally, our Food and Ingredients businesses are focused on capitalizing on growing global consumer food trends, including a desire for less processed, healthier foods, interest in new flavors and increases in snacking and eating outside the home.
Edible Oil Products
Products—Our edible oil products include packaged and bulk oils, shortenings, margarines, mayonnaise and other products derived from the vegetable oil refining process. We primarily use soybean, sunflower, rapeseed and canola oil that we produce in our Agribusiness segment oilseed processing operations as raw materials in this business. We are a leading seller of packaged vegetable oils worldwide, based on sales. We have edible oil refining and packaging facilities in North America, South America, Europe and Asia-Pacific. Our edible oil products business is largely B2B focused in North America, while in Brazil, Europe and Asia-Pacific it is a mix of B2B and business to consumer ("B2C").
In September 2017, we announced the acquisition of a 70% ownership interest in IOI Loders Croklaan. This transaction will create a leading solutions provider in B2B oils, building on clear commitments to sustainability, significantly accelerating the growth of our value-added oils business by combining leading innovation and application capabilities worldwide to create a comprehensive product offering with enhanced solutions for customers. The transaction is expected to close in the first quarter of 2018, subject to regulatory approvals and other closing conditions.
In Brazil, our retail edible oil brands include Soya, the leading packaged vegetable oil brand, as well as Primor and Salada. We are also a leading producer in the Brazilian margarine market with our brands Delicia and Primor, as well as in mayonnaise with our Soya, Primor and Salada brands. In shortenings, we are a leading supplier to the food processor market. We also produce processed tomato and other staple food products, including sauces, condiments and seasonings in Brazil under several brand names.
In the United States and Canada, we offer our customers high quality solutions to fit their goals, such as reducing trans-fats or lowering saturated fats. Our products include Nutra-Clear NT Ultra, a high oleic canola oil that is trans-fat free and low in saturated fats and Pro-Formance NT, a high oleic soybean oil that is highly stable and trans-fat free. We have also developed proprietary fiber addition processes that allow bakery and food processor customers to achieve significant reductions in saturated fats in shortenings. We also offer expeller pressed and physically refined oils to food service customers under the brand Whole Harvest and also produce margarines and buttery spreads, including our leading brand Country Premium, for food service, food processor and retail private label customers.
In Europe, we are a leader in consumer packaged vegetable oils, which are sold in various geographies under brand names including Venusz, Floriol, Kujawski, Olek, Unisol, Ideal, Oleina, Maslenitsa, Oliwier, Salat and Rozumnitsa, and a leader in margarines, including our brand names Smakowita, Maslo Rosline, Masmix, Optima, Deli Reform, Keiju, Evesol, Linco, Gottgott, Suvela and Finuu. Most recently, we have introduced Optima margarine with DHA for consumers interested in adding omega-3 fatty acids to their diets. Additionally, we have introduced first cold pressed oils and spice and herb enhanced products under our Deli Reform brand.
Additionally, with the acquisitions of Ana Gyda Yhtiyaç Maddeleri ve Sanayi Ticaret A.Ş (“Ana Gyda”), a leading Turkish olive oil and seed oil producer in 2017, and a majority share in Walter Rau Neusser Öl und Fett Aktiengesellschaft ("Walter Rau Neusser"), a leading oils and fats producer in Germany in 2016, we have strengthened our product portfolio to include olive oil and we are now a significant B2B oils supplier in the Western European foodservice channel. Ana Gyda is the owner of Komili, the market leading olive oil brand in Turkey. We also supply a range of refined seed oils (sunflower and rapeseed) in bulk formats to industrial food processors who are leading brand owners in the global food industry.
In India, our brands include Dalda, Ginni and Chambal in edible oils; Dalda and Gagan in vanaspati; and Masterline in professional bakery fats. In China, our edible oil brand is Dou Wei Jia. In Asia-Pacific, we have distribution arrangements to sell and distribute packaged softseed oils and coconut oil.
Customers—Our customers include baked goods companies, snack food producers, restaurant chains, foodservice distributors and other food manufacturers who use vegetable oils and shortenings as ingredients in their operations, as well as grocery chains, wholesalers, distributors and other retailers who sell to consumers under our brand names or under private labels. These customers include global and national food processors and manufacturers, many of which are leading brand owners in their product categories.
5
Competition—Competition is based on a number of factors, including price, raw material procurement, distribution capabilities and cost structure, brand recognition, product quality, innovation, technical support, new product introductions, composition and nutritional value and advertising and promotion. Our products may compete with widely advertised, well-known, branded products, as well as private label and customized products. In the United States and Canada, our principal competitors in the Edible Oil Products segment include ADM, Cargill, Stratas Foods LLC, Unilever NV/PLC ("Unilever") and Ventura Foods LLC. In Brazil, our principal competitors currently include ADM, Cargill, Imcopa, BRF S.A. and JBS S.A. In Europe, our principal competitors include ADM, Cargill, Unilever and various local companies in each country.
Milling Products
Products—Our Milling Products segment activities include the production and sale of a variety of wheat flours and bakery mixes in Brazil and Mexico, corn-based products in the United States and Mexico derived from the corn dry milling process and milled rice products in the United States and Brazil.
Our brands in Brazil include Suprema, Soberana, Primor and Predileta wheat flours and Gradina, and Pre-Mescla bakery premixes. Our wheat flour and bakery mix brands in Mexico include Espiga, Esponja, Francesera, Chulita, Galletera and Pastelera. Our corn milling products consist primarily of dry-milled corn meals, flours and flaking and brewer's grits, as well as soy-fortified corn meal, corn-soy blend and other similar products. As part of our corn portfolio, we also sell whole grain and fiber ingredients. In the United States, we have added ancient grains, such as quinoa and millet to our portfolio. We have also introduced a range of extruded products that include die cut pellets for the snack food industry. Additionally, we offer non-GMO products in the United States, including corn varieties. We mill and sell bulk and packaged rice in the United States and also sell branded rice in Brazil under the Primor brand.
In August 2016, we announced that we had entered into an agreement to acquire a controlling interest in Grupo Minsa, S.A.B. de C.V. ("Minsa"), a leading corn flour producer in North America, which included mills in Mexico and the United States. In November 2017, we mutually agreed with the Minsa controlling shareholders to terminate the agreement. In January 2018, we reached a new agreement to acquire two corn mills owned by Minsa in the United States.
Customers—The primary customers for our wheat milling products are food processing, bakery and food service companies. The primary customers for our corn milling products are companies in the food-processing sector, such as cereal, snack, bakery and brewing companies, as well as the U.S. Government for humanitarian assistance programs. Our rice milling business sells to customers in the food service and food processing channels, as well as for export markets.
Competition—Competition is based on a variety of factors, including price, raw material procurement, brand recognition, product quality, nutritional profile, dietary trends and distribution capabilities. In Brazil, our major competitors are M. Dias Branco, J.Macedo and Moinho Anaconda, as well as many small regional producers. Our major competitors in North American corn milling include Cargill, Didion Milling Company, SEMO Milling, LLC and Life Line Foods, LLC. Our major competitors in our U.S. rice milling business include ADM and Farmers' Rice Cooperative. Our major competitors in Mexico include Grupo Elizondo, Molinera de México and Grupo Trimex.
Sugar and Bioenergy
Overview—We are a leading, integrated producer of sugar and ethanol in Brazil, and a leading global trader and merchandiser of sugar. We own and operate eight sugarcane mills in Brazil, the world's largest producer and exporter of sugar. As of December 31, 2017, our mills had a total crushing capacity of approximately 22 million metric tons per year. Sugarcane, which is the raw material that we use to produce sugar and ethanol, is supplied by a combination of our own plantations and third-party farmers. Additionally, through cogeneration facilities at our sugarcane mills, we produce electricity from the burning of sugarcane bagasse (the fibrous portion of the sugarcane that remains after the extraction of sugarcane juice) in boilers, which enables our mills to meet their energy requirements. Any surplus electricity is sold to the local grid or other large third-party users of electricity. Our trading and merchandising operations engage in marketing and selling sugar through regional marketing offices in various locations and managing the sugar price risk for our business.
As previously announced, we are in the process of separating our sugar and bioenergy business in Brazil as we continue to explore alternatives to reduce our exposure to the Brazilian sugarcane milling business. While the nature and timing of any potential outcome or transaction is uncertain and cannot be predicted, over the past three years, we have also focused on improving the efficiency and lowering the operating costs of this business, which has resulted in significantly improved results. Additionally, we have recently announced that we intend to exit from our sugar trading operations and are in discussions to sell our interest in our joint venture in Brazil to our partner.
Raw Materials—Sugarcane is our principal raw material in this segment, and we both produce it and procure it through third-party supply contracts. The annual harvesting cycle in Brazil typically begins in late March/early April and ends in late November/early December. Once planted, sugarcane is harvested for five to seven years on average, but the yield decreases
6
with each harvest over the life cycle of the cane. As a result, after this period, old sugarcane plants are typically removed and the area is replanted. The quality and yield of the harvested cane are also affected by factors such as soil quality, topography, weather and agricultural practices.
Our mills are supplied with sugarcane grown on approximately 329,000 hectares of land. This land represents approximately 19,000 hectares of land that we own, 225,000 hectares of land that we manage under agricultural partnership arrangements and 85,000 hectares of land farmed by third-party farmers. In 2017, approximately 68% of our total milled sugarcane came from our owned or managed plantations and 32% was purchased from third-party suppliers. Payments under the agricultural partnership agreements and third-party supply contracts are based on a formula, which factors in the volume of sugarcane per hectare, sucrose content of the sugarcane and market prices for sugarcane, which are set by Consecana, the São Paulo state sugarcane, sugar and ethanol council.
Our sugarcane planting and harvesting processes are substantially mechanized. Mechanized harvesting does not require burning of the cane prior to harvesting, significantly reducing the environmental impact when compared to manual harvesting, and resulting in improved soil conditions.
Logistics—Harvested sugarcane is loaded onto trucks and trailers and transported to our mills. Since the sucrose content of the sugarcane begins to degrade rapidly after harvesting, we seek to minimize the time and distance between the cutting of the cane and its delivery to our mills for processing.
Products—Our mills allow us to produce ethanol, sugar and electricity, as further described below. At mills that produce both sugar and ethanol, we are able to adjust our production mix within certain capacity limits between ethanol and sugar, as well as, for certain mills, between different types of sugar (raw and crystal) and ethanol (hydrous and anhydrous). The ability to adjust our production mix allows us to respond to changes in customer demand and market prices.
Sugar—Our current maximum sugar production capacity is 5,900 metric tons per day, which in a season of 5,000 hours of milling, results in an annual maximum production capacity of approximately 1.2 million metric tons of sugar. We produce two types of sugar: very high polarity ("VHP") raw sugar and white crystal sugar. VHP sugar is similar to the raw sugar traded on major commodities exchanges, including the standard NY11 contract, and is sold almost exclusively for export. Crystal sugar is a non-refined white sugar and is principally sold domestically in Brazil.
Ethanol—Our current maximum ethanol production capacity is 6,200 cubic meters per day, which in a season of 5,000 hours of milling, results in an annual maximum production capacity of over 1.3 million cubic meters of ethanol. We produce and sell two types of ethanol: hydrous and anhydrous. Hydrous ethanol is consumed directly as a transport fuel, while anhydrous ethanol is blended with gasoline in transport fuels.
Electricity—We generate electricity from burning sugarcane bagasse in our mills. As of December 31, 2017, our total installed cogeneration capacity was approximately 322 megawatts, with approximately 131 megawatts available for resale to third parties after supplying our mills' energy requirements, representing approximately 596,000 megawatt hours of electricity available for resale.
Customers—The sugar we produce at our mills is sold in both the Brazilian domestic and export markets. Our domestic customers are primarily in the confectionary and food processing industries. The ethanol we produce is primarily sold to customers for use in the Brazilian domestic market to meet the demand for fuel. We also export ethanol in the international market. Our sugar trading and merchandising operations purchase and sell sugar and ethanol from our own operations as well as third parties to meet international demand.
Other—We have a minority investment in a U.S. corn based ethanol production facility and a 50% interest in a joint venture that produces corn based ethanol in Argentina. We have a 49.9% interest in a joint venture with Corbion NV for the development and production of renewable oils and feed ingredients in Brazil.
Competition—We compete with other sugar and ethanol producers in Brazil and internationally, and in the global market with beet sugar processors, producers of other sweeteners and other biofuels producers. The industry is highly competitive, with raw material procurement, cost structure, selling price and distribution capabilities being important competitive factors. Our major competitors in Brazil include Cosan Limited/Raizen, São Martinho S.A., Biosev (Louis Dreyfus) and ED&F Man. Our major international competitors include British Sugar PLC, Südzucker AG, Cargill, Tereos Group, Sucden Group and COFCO.
Fertilizer
Overview—Through our operations in Argentina, Uruguay and Paraguay, we produce, blend and distribute a range of liquid and dry NPK fertilizers, including nitrogen-based liquid and solid phosphate fertilizers. NPK refers to nitrogen (N), phosphate (P) and potassium (K), the main components of chemical fertilizers, used for crop production primarily of soybeans,
7
corn and wheat. Our operations in Argentina, Uruguay and Paraguay are closely linked to our grain origination activities as we supply fertilizer to producers who supply us with grain. In Brazil, our port operations are comprised by Termag, which operates as a port terminal in the Port of Santos that discharges and handles imported fertilizers for third parties and Fertimport, which provides logistics and support services. Our Brazilian grain operations also provide fertilizer to farmers through barter agreements for which they receive a commission from third parties to supply.
Products and Services—We offer a complete fertilizer portfolio, including SSP, ammonia, urea, urea-ammonium nitrate ("UAN") and ammonium thiosulfate that we produce, as well as monoammonium phosphate ("MAP"), diammonium phosphate, triple supersphosphate, UAN, ammonium sulfate and potassium chloride that we purchase from third parties and resell. In Argentina, Uruguay, and Paraguay, we market our products under the Bunge brand, as well as the Solmix brand for liquid fertilizers.
Raw Materials—Our main raw materials in this segment are concentrated phosphate rock, sulfuric acid, natural gas, ammonium nitrate and sulphur. The prices of fertilizer raw materials are typically based on international prices that reflect global supply and demand factors and global transportation and other logistics costs. Each of these fertilizer raw materials is readily available in the international market from multiple sources.
Competition—Competition is based on a number of factors, including delivered price, product offering and quality, location, access to raw materials, production efficiency and customer service, including, in some cases, customer financing terms. Our main competitors in our fertilizer operations in Argentina are ASP (Agrium), YPF, Profertil, Nidera, Yara International and Louis Dreyfus.
Global Competitiveness Program
In July 2017, Bunge announced a global competitiveness program (“GCP”) to improve its cost position and deliver increased value to shareholders. The GCP is intended to, among other things, rationalize Bunge’s cost structure and reengineer the way the company operates in order to reduce overhead costs. One of the GCP’s key objectives will be to streamline processes and consolidate back office functions to improve efficiency and scalability. See Note 2 to our consolidated financial statements.
Risk Management
Risk management is a fundamental aspect of our business. Engaging in the hedging of risk exposures and anticipating market developments are critical to protect and enhance our return on assets. As such, we are active in derivative markets for agricultural commodities, energy, ocean freight, foreign currency and interest rates. We seek to leverage the market insights that we gain through our global operations across our businesses by actively managing our physical and financial positions on a daily basis. See "Item 7A. Quantitative and Qualitative Disclosures About Market Risk."
Insurance
In each country where we conduct business, our operations and assets are subject to varying degrees of risk and uncertainty. We insure our businesses and assets in each country in a manner that it deems appropriate for a company of our size and activities, based on an analysis of the relative risks and costs. We believe that our geographic dispersion of assets helps mitigate risk to our business from an adverse event affecting a specific facility; however, if we were to incur a significant loss or liability for which we were not fully insured, it could have a materially adverse effect on our business, financial condition and results of operations.
Operating Segments and Geographic Areas
We have included financial information about our reportable segments and our operations by geographic area in Note 27 of the notes to our consolidated financial statements.
Research and Development, Innovation, Patents and Licenses
Our research and development activities are focused on developing products and improving processes that will drive growth or otherwise add value to our core business operations. In our Food and Ingredients business, we have nine research and development centers globally dedicated to supporting product development and enhancement. Additionally, we have created a corporate venture capital unit to invest in new technologies relevant to our industries.
Our total research and development expenses were $20 million, $17 million, and $16 million for the years ended December 31, 2017, 2016 and 2015, respectively. As of December 31, 2017, our research and development organization consisted of 122 employees worldwide.
8
We own trademarks on the majority of the brands we produce in our Food and Ingredients and Fertilizer businesses. We typically obtain long-term licenses for the remainder. We have patents covering some of our products and manufacturing processes. However, we do not consider any of these patents to be material to our business. We believe we have taken appropriate steps to either own or license all intellectual property rights that are material to carrying out our business.
Seasonality
In our Agribusiness segment, while there is a degree of seasonality in the growing season and procurement of our principal raw materials, such as oilseeds and grains, we typically do not experience material fluctuations in volume between the first and second half of the year since we are geographically diversified between the northern and southern hemispheres, and we sell and distribute products throughout the year. However, the first fiscal quarter of the year has generally been our weakest in terms of financial results due to the timing of the North and South American oilseed harvests as the North American harvest peaks in the third and fourth fiscal quarters and the South American harvest peaks in the second fiscal quarter, and thus our North and South American grain merchandising and oilseed processing activities are generally at lower levels during the first quarter.
In our Food and Ingredients businesses, demand for certain of our food items may be influenced by holidays and other annual events.
We experience seasonality in our Sugar and Bioenergy segment as a result of the Brazilian sugarcane growing cycle. In the Center-South of Brazil, where most of our mills are located, the sugarcane harvesting period typically begins in late March/early April and ends in late November/early December. This creates fluctuations in our sugar and ethanol inventories, which usually peak in December to cover sales between crop harvests. These factors result in earnings being weighted towards the second half of the year. This segment is also impacted by the yield development of the sugarcane crops over the course of the crop year with sugar content reaching its highest level in the middle of the crop. As a result of the above factors, there may be significant variations in our results of operations from one quarter to another.
In our Fertilizer segment, we are subject to seasonal trends based on the South American agricultural growing cycle as farmers typically purchase the bulk of their fertilizer needs in the second half of the year.
Government Regulation
We are subject to a variety of laws in each of the countries in which we operate which govern various aspects of our business, including the processing, handling, storage, transport and sale of our products; risk management activities; land-use and ownership of land, including laws regulating the acquisition or leasing of rural properties by certain entities and individuals; and environmental, health and safety matters. To operate our facilities, we must obtain and maintain numerous permits, licenses and approvals from governmental agencies and our facilities are subject to periodic inspection by governmental agencies. In addition, we are subject to other laws and government policies affecting the food and agriculture industries, including food and feed safety, nutritional and labeling requirements and food security policies. From time-to-time, agricultural production shortfalls in certain regions and growing demand for agricultural commodities for feed, food and fuel use have caused prices for relevant agricultural commodities to rise. High commodity prices and regional crop shortfalls have led, and in the future may lead, governments to impose price controls, tariffs, export restrictions and other measures designed to assure adequate domestic supplies and/or mitigate price increases in their domestic markets, as well as increase the scrutiny of competitive conditions in their markets.
Many countries globally are using and producing biofuels as alternatives to traditional fossil fuels. Biofuels convert crops, such as sugarcane, corn, soybeans, palm, rapeseed or canola and other oilseeds, into ethanol or biodiesel to extend, enhance or substitute for fossil fuels. Production of biofuels has increased significantly in the last decade in response to both periods of high fossil fuel prices and to government incentives for the production of biofuels offered in many countries, including the United States, Brazil, Argentina and several South East Asian and European countries. Furthermore, in several countries, governmental authorities are mandating biofuels use in transport fuel at specified levels. As such, the markets for agricultural commodities used in the production of biofuels have become increasingly affected by the growth of the biofuels industry and related legislation.
Environmental Matters and Sustainability
We incorporate a commitment to sustainability into many of the areas of our business; from how we plan and develop our strategic goals and operate our facilities, to how we do business with our suppliers and customers and engage with our communities. Our philosophy is to "Act, Conserve and Engage" and our efforts include policies and initiatives to reduce deforestation, conserve resources in our operations and engage across our sector to address the sustainability challenges in the agribusiness and food value chain.
9
We are subject to various environmental protection and occupational health and safety laws and regulations in the countries in which we operate. Our operations may emit or release certain substances, which may be regulated or limited by applicable laws and regulations. In addition, we handle and dispose of materials and wastes classified as hazardous or toxic by one or more regulatory agencies. Our operations are also subject to laws relating to environmental licensing of facilities, restrictions on land use in certain protected areas, forestry reserve requirements, limitations on the burning of sugarcane and water use. We incur costs to comply with health, safety and environmental regulations applicable to our activities and have made and expect to make substantial capital expenditures on an ongoing basis to continue to ensure our compliance with environmental laws and regulations. However, due to our extensive operations across multiple industries and jurisdictions globally, we are exposed to the risk of claims and liabilities under environmental regulations. Violation of these laws and regulations can result in substantial fines, administrative sanctions, criminal penalties, revocations of operating permits and/or shutdowns of our facilities.
Additionally, our business could be affected in the future by regulation or taxation of greenhouse gas emissions or policies related to national emission reduction plans. It is difficult to assess the potential impact of any resulting regulation of greenhouse gas emissions. Potential consequences could include increased energy, transportation and raw material costs, and we may be required to make additional investments to modify our facilities, equipment and processes. As a result, the effects of additional climate change regulatory initiatives could have adverse impacts on our business and results of operations. Compliance with environmental laws and regulations did not materially affect our earnings or competitive position in 2017.
Employees
As of December 31, 2017, we had approximately 31,000 employees. Many of our employees are represented by labor unions, and their employment is governed by collective bargaining agreements. In general, we consider our employee relations to be good.
Available Information
Our website address is www.bunge.com. Through the "Investors: SEC Filings" section of our website, it is possible to access our periodic report filings with the Securities and Exchange Commission ("SEC") pursuant to Section 13(a) or 15(d) of the Securities Exchange Act of 1934, as amended (the "Exchange Act"), including our Annual Report on Form 10-K, quarterly reports on Form 10-Q and current reports on Form 8-K, and any amendments to those reports. These reports are made available free of charge. Also, filings made pursuant to Section 16 of the Exchange Act with the SEC by our executive officers, directors and other reporting persons with respect to our common shares are made available, free of charge, through our website. Our periodic reports and amendments and the Section 16 filings are available through our website as soon as reasonably practicable after such report, amendment or filing is electronically filed with or furnished to the SEC.
Through the "Investors: Governance" section of our website, it is possible to access copies of the charters for our Audit Committee, Compensation Committee, Finance and Risk Policy Committee, Corporate Governance and Nominations Committee and Sustainability and Corporate Responsibility Committee. Our Corporate Governance Guidelines and our Code of Conduct are also available in this section of our website. Each of these documents is made available, free of charge, through our website.
The foregoing information regarding our website and its content is for your convenience only. The information contained in or connected to our website is not deemed to be incorporated by reference in this report or filed with the SEC.
In addition, you may read and copy any materials we file with the SEC at the SEC's Public Reference Room at 100 F Street, N.E., Washington, D.C. 20549 and may obtain information on the operation of the Public Reference Room by calling the SEC at 1-800-SEC-0330. The SEC maintains a website that contains reports, proxy and information statements, and other information regarding issuers that file electronically. The SEC website address is www.sec.gov.
10
Executive Officers and Key Employees of the Company
Set forth below is certain information concerning the executive officers and key employees of the company.
Name | Position | |
Soren Schroder | Chief Executive Officer | |
Todd Bastean | President, North America | |
Thomas Boehlert | Executive Vice President—Chief Financial Officer | |
Deborah Borg | Executive Vice President—Chief Human Resources Officer | |
Gordon Hardie | President, Food & Ingredients | |
David Kabbes | Executive Vice President, Corporate Affairs and Chief Legal Officer | |
Pierre Mauger | President, Europe and Asia | |
Raul Padilla | President, South America and Sugar & Bioenergy | |
Brian Thomsen | President, Agribusiness | |
Soren Schroder, 56—Mr. Schroder has been our Chief Executive Officer since June 1, 2013. Prior to his current position, he was the Chief Executive Officer of Bunge North America since April 2010. Previously, he served as Vice President of Agribusiness for Bunge Europe since June 2006 and in a variety of agribusiness leadership roles at the company in the United States and Europe since joining Bunge in 2000. Prior to joining Bunge, he worked for over 15 years at Continental Grain and Cargill. Mr. Schroder is a member of Rabobank International's North American Agribusiness Advisory Board. He holds a bachelor's degree in Economics from Connecticut College.
Todd Bastean, 51—Mr. Bastean has served as President, North America since January 2018. Prior to that, he served as Chief Executive Officer, Bunge North America since June 2013. He started his career at Bunge in 1994 and became Chief Financial Officer of Bunge North America in 2010. Before assuming that role, he served as Vice President and General Manager of Bunge North America's Milling and Biofuels business units, and as Vice President and Chief Administrative Officer of its Grain and Milling business units. He also held positions in strategic planning and auditing. Prior to joining Bunge, he worked for KPMG Peat Marwick. Mr. Bastean holds a B.S. in Accounting from Western Illinois University.
Thomas Boehlert, 58—Mr. Boehlert joined Bunge in January 2017. Previously, he was Chief Executive Officer, President and a Director of First Nickel Inc. from 2011 to 2015. First Nickel entered Canadian receivership in August 2015. Prior to that, he was Chief Financial Officer for Kinross Gold Corporation from 2006 to 2011 and served as Chief Financial Officer for several energy companies, including Texas Genco, Direct Energy and Sithe Energies, Inc. Previously, Mr. Boehlert spent 14 years in banking with Credit Suisse, where his focus was on the electric power, natural resources and infrastructure sectors, and where he built and headed the firm's London-based project finance business covering Europe, Africa and the Middle East. He started his career as an auditor at a KPMG predecessor firm in 1983. Mr. Boehlert is a Certified Public Accountant and holds a B.A. in Accounting from Indiana University and an M.B.A. in Finance from New York University.
Deborah Borg, 41—Ms. Borg joined Bunge in January 2016. She joined Bunge from Dow Chemical, where she served as President Dow USA, a role in which she was responsible for regional business strategy and external relationships with customers, government organizations and joint venture partners. She started her career at Dow in 2000 as Human Resources Manager for Australia / New Zealand, and went on to hold regional and business HR roles in Asia, Europe and North America. She also served as Global HR Director, Marketing and Sales, and led the Human Capital Planning and Development function for Dow focusing on talent acquisition, retention, diversity and development. Previously, Ms. Borg served in HR and talent development roles with General Motors Australia. She holds a Bachelor of Business Management in Human Resources and a Master in Training and Change Management from Victoria University, Australia.
Gordon Hardie, 54—Mr. Hardie has served as President, Food & Ingredients since January 2018. Prior to that, he served as Managing Director, Food & Ingredients since July 2011. Prior to joining Bunge, Mr. Hardie founded Morningside Partners, a corporate strategy and M&A advisory firm focused on the food and beverage industries in 2009. Prior to that, from 2003 to 2009, he led the Fresh Baking Division of Goodman Fielder Ltd, the leading producer of bakery brands in Australia and New Zealand, and held leadership roles at companies in a variety of international markets, including as Group General Manager, Marketing at Southcorp Wines; Vice President, Asia-Pacific, Middle East and Africa at Fosters Group International; and Regional Director, Americas & Asia-Pacific at Pernod Ricard. He holds a Bachelor's degree in European Language and Psychology from the National University of Ireland, University College Cork and an M.B.A. from the University College Dublin, Michael Smurfit Graduate School of Business.
11
David Kabbes, 55—Mr. Kabbes has served as Executive Vice President— Corporate Affairs and Chief Legal Officer since January 2018. He became General Counsel and Managing Director, Corporate Affairs in February 2015 after serving as Senior Vice President, Corporate and Legal Affairs for Bunge North America since 2000, where he oversaw the legal, government and industry affairs, communications, foreign trade support and environmental functions. Prior to joining Bunge in 2000, he was Executive Vice President, Secretary and General Counsel at Purina Mills, a corporate attorney at Koch Industries, Inc., a partner at Schiff Hardin & Waite and an associate at Thompson Coburn. He received a bachelor's degree in business from Quincy University and a law degree from the University of Illinois.
Pierre Mauger, 45—Mr. Mauger has served as President, Europe and Asia since January 2018. Prior to that he served as Chief Development Officer since September 2013, when he joined Bunge. Prior to joining Bunge, Mr. Mauger was a partner at McKinsey & Company, where he led the firm's agriculture service line in Europe, the Middle East and Africa from 2009 to 2013, overseeing client relationships with leading global companies in the commodity processing and trading, agrochemicals and fertilizer sectors, as well as with governments. Prior to that, he served as a partner in the firm's consumer goods practice. He joined McKinsey as an associate in 2000. Mr. Mauger previously worked as an auditor at Nestlé and KPMG. He holds a B.Sc. in Economics and Business Finance from Brunel University in the United Kingdom and an M.B.A. from INSEAD.
Raul Padilla, 62—Mr. Padilla has served as President, South America and President, Sugar and Bioenergy since January 2018. Prior to that he served as Chief Executive Officer of Bunge Brazil and Managing Director, Sugar and Bioenergy since 2014. Prior to that, he served as Managing Director, Bunge Global Agribusiness and Chief Executive Officer, Bunge Product Lines since July 2010. Prior to that, he was Chief Executive Officer of Bunge Argentina since 1999, having joined the company in 1997 as Commercial Director. Mr. Padilla has over 30 years of experience in the oilseed processing and grain handling industries in Argentina, beginning his career with La Plata Cereal in 1977. He has served as President of the Argentine National Oilseed Crushers Association, Vice President of the International Association of Seed Crushers and Director of the Buenos Aires Cereal Exchange and the Rosario Futures Exchange. Mr. Padilla is a graduate of the University of Buenos Aires.
Brian Thomsen, 51—Mr. Thomsen has served as President, Agribusiness since January 2018. Prior to that, he served as Managing Director, Bunge Global Agribusiness and Chief Executive Officer, Bunge Product Lines since May 2014. Previously, he served as Managing Director, Global Grains and Oilseeds Product Lines. He joined the company in 2004 as Director, Grains Product Line. Prior to Bunge, Mr. Thomsen was Managing Director, Dry Commodity Trading at Nidera, and previously served in global trading and management roles at Cargill. He started his career in 1988 at Aarhus Oil, a Danish crush and refining company, and is a graduate of the International Academy of Business in Aarhus, Denmark.
Item 1A. Risk Factors
Risk Factors
Our business, financial condition or results of operations could be materially adversely affected by any of the risks and uncertainties described below. Additional risks not presently known to us, or that we currently deem immaterial, may also impair our financial condition and business operations. See "Cautionary Statement Regarding Forward Looking Statements."
Risks Relating to Our Business and Industries
Adverse weather conditions, including as a result of future climate change, may adversely affect the availability, quality and price of agricultural commodities and agricultural commodity products, as well as our operations and operating results.
Adverse weather conditions have historically caused volatility in the agricultural commodity industry and consequently in our operating results by causing crop failures or significantly reduced harvests, which may affect the supply and pricing of the agricultural commodities that we sell and use in our business, reduce demand for our fertilizer products and negatively affect the creditworthiness of agricultural producers who do business with us.
Additionally, our sugar production depends on the volume and sucrose content of the sugarcane that we cultivate or that is supplied to us by third-party growers. Both sugarcane crop yields and sucrose content depend significantly on weather conditions, such as rainfall and prevailing temperatures, which can vary substantially. Adverse weather conditions can also impair our ability to harvest and transport sugarcane to our mills, leading to decreased productivity and higher production costs. As a result, unfavorable weather conditions have had and could in the future have a material adverse effect on our sugar operations.
Severe adverse weather conditions, such as hurricanes or severe storms, may also result in extensive property damage, extended business interruption, personal injuries and other loss and damage to us. Our operations also rely on dependable and efficient transportation services. A disruption in transportation services, as a result of weather conditions or otherwise, may also significantly adversely impact our operations.
12
Additionally, the potential physical impacts of climate change are uncertain and may vary by region. These potential effects could include changes in rainfall patterns, water shortages, changing sea levels, changing storm patterns and intensities, and changing temperature levels that could adversely impact our costs and business operations, the location and costs of global agricultural commodity production and the supply and demand for agricultural commodities. These effects could be material to our results of operations, liquidity or capital resources.
We face intense competition in each of our businesses.
We face significant competition in each of our businesses and we have numerous competitors, some of which are larger and have greater financial resources than we have. Additionally, in recent years we have experienced regional Agribusiness competitors entering new geographies where previously they did not compete with us and certain customers seeking to procure certain commodities directly rather than through historical suppliers such as us. As many of the products we sell are global commodities, the markets for our products are highly price competitive and in many cases also sensitive to product substitution. To compete effectively, we must continuously focus on improving efficiency in our production and distribution operations, developing and offering products that meet customer needs, as well as developing and maintaining appropriate market share and customer relationships. We also compete for talent in our industries, particularly commercial personnel. Additionally, we face competition from changing technologies and shifting industry practices, such as increased on farm storage of crops in several regions which allow producers to retain commodities for extended periods and increase price pressure on purchasers such as us. Competition could cause us to lose market share and talented employees, exit certain lines of business, increase marketing or other expenditures, increase our raw material costs or reduce pricing, each of which could have an adverse effect on our business and profitability.
We are subject to fluctuations in agricultural commodity and other raw material prices caused by other factors outside of our control that could adversely affect our operating results.
Prices for agricultural commodities and their by-products, including, among others, soybeans, corn, wheat, sugar and ethanol, like those of other commodities, are often volatile and sensitive to local and international changes in supply and demand caused by factors outside of our control, including farmer planting and selling decisions, government agriculture programs and policies, global inventory levels, demand for biofuels, weather and crop conditions and demand for and supply of, competing commodities and substitutes. These factors may cause volatility in our operating results.
Our fertilizer business may also be adversely affected by fluctuations in the prices of agricultural commodities and fertilizer raw materials that are caused by market factors beyond our control. Increases in fertilizer prices due to higher raw material costs have in the past and could in the future adversely affect demand for our fertilizer products. Additionally, as a result of competitive conditions in our Food and Ingredients and Fertilizer segments, we may not be able to recoup increases in raw material costs through increases in sales prices for our products, which may adversely affect our profitability.
We are vulnerable to the effects of supply and demand imbalances in our industries.
Historically, the market for some of our agricultural commodities and fertilizer products has been cyclical, with periods of high demand and capacity utilization stimulating new plant investment and the addition of incremental processing or production capacity by industry participants to meet the demand. The timing and extent of this expansion may then produce excess supply conditions in the market, which, until the supply/demand balance is again restored, negatively impacts product prices and operating results. During times of reduced market demand, we may suspend or reduce production at some of our facilities. The extent to which we efficiently manage available capacity at our facilities will affect our profitability.
Fluctuations in energy prices could adversely affect our operating results.
Our operating costs and selling prices of certain of our products are sensitive to changes in energy prices. Our industrial operations utilize significant amounts of electricity, natural gas and coal, and our transportation operations are dependent upon diesel fuel and other petroleum-based products. Significant increases in the cost of these items could adversely affect our operating costs and results.
We also sell certain biofuel products, such as ethanol and biodiesel, which are closely related to, or may be substituted for, petroleum products. As a result, the selling prices of ethanol and biodiesel can be impacted by the selling prices of oil, gasoline and diesel fuel. In turn, the selling prices of the agricultural commodities and commodity products that we sell, such as corn and vegetable oils that are used as feedstocks for biofuels, are also sensitive to changes in the market price for biofuels, and consequently world petroleum prices as well. Prices for petroleum products and biofuels are affected by market factors and government fuel policies, over which we have no control. Lower prices for oil, gasoline or diesel fuel could result in decreased selling prices for ethanol, biodiesel and their raw materials, which could adversely affect our revenues and operating results. Additionally, the prices of sugar and sugarcane-based ethanol are also correlated, and, therefore, a decline in world sugar prices may also adversely affect the selling price of the ethanol we produce in Brazil.
13
We are subject to global and regional economic downturns and related risks.
The level of demand for our products is affected by global and regional demographic and macroeconomic conditions, including population growth rates and changes in standards of living. A significant downturn in global economic growth, or recessionary conditions in major geographic regions, may lead to reduced demand for agricultural commodities, which could adversely affect our business and results of operations.
Additionally, weak global economic conditions and adverse conditions in global financial and capital markets, including constraints on the availability of credit, have in the past adversely affected, and may in the future adversely affect, the financial condition and creditworthiness of some of our customers, suppliers and other counterparties, which in turn may negatively impact our financial condition and results of operations. See "Item 7. Management's Discussion and Analysis of Financial Condition and Results of Operations" and "Item 7A. Quantitative and Qualitative Disclosures About Market Risk" for more information.
For example, Brazil is currently recovering from a significant multi-year recession, and has experienced significant political uncertainty in recent years due to high profile political corruption scandals, the impeachment of the former president and upcoming general elections in 2018. The depressed and uncertain economic and political environment in Brazil has adversely affected consumer confidence levels and spending, which has led to significantly reduced demand for products in our Food and Ingredients businesses in the country. The pace of economic improvement is uncertain, and there can be no assurance that economic and political conditions will not continue to affect market and consumer confidence or deteriorate further in the near term. Additionally, a slowdown in China's economy over a prolonged period could lead to reduced demand for agricultural commodities. To the extent that such economic and political conditions negatively impact consumer and business confidence and consumption patterns or volumes, our business and results of operations could be significantly and adversely affected.
We are subject to economic, political and other risks of doing business globally and in emerging markets.
We are a global business with a substantial majority of our assets and operations located outside the United States. In addition, part of our strategy involves expanding our business in several emerging market regions, including Eastern Europe, Asia-Pacific, the Middle East and Africa. Volatile international economic, political and market conditions may have a negative impact on our operating results and our ability to achieve our business strategies.
Due to the international nature of our business, we are exposed to currency exchange rate fluctuations. Changes in exchange rates between the U.S. dollar and other currencies, particularly the Brazilian real, the Argentine peso, the euro and certain Eastern European currencies affect our revenues and expenses that are denominated in local currencies, affect farm economics in those regions and may also have a negative impact on the value of our assets located outside of the United States.
We are also exposed to other risks of international operations, including:
• | adverse trade policies or trade barriers on agricultural commodities and commodity products; |
• | inflation and hyperinflationary economic conditions and adverse economic effects resulting from governmental attempts to control inflation, such as imposition of wage and price controls and higher interest rates; |
• | changes in laws and regulations or their interpretation or enforcement in the countries where we operate, such as tax laws, including the risk of future adverse tax regulation in the United States relating to our status as a Bermuda company; |
• | difficulties in enforcing agreements or judgments and collecting receivables in foreign jurisdictions; |
• | sovereign risk; |
• | exchange controls or other currency restrictions and limitations on the movement of funds, such as on the remittance of dividends by subsidiaries; |
• | inadequate infrastructure; |
• | government intervention, including through expropriation, or regulation of the economy or natural resources, including restrictions on foreign ownership of land or other assets; |
• | the requirement to comply with a wide variety of foreign and United States laws and regulations that apply to international operations, including, without limitation, economic sanctions regulations, labor laws, import and export regulations, anti-corruption and anti-bribery laws, as well as other laws or regulations discussed in this "Item 1A. Risk Factors" section; |
• | challenges in maintaining an effective internal control environment with operations in multiple international locations, including language differences, varying levels of U.S. Generally Accepted Accounting Principles ("U.S. GAAP") expertise in international locations and multiple financial information systems; and |
• | labor disruptions, civil unrest, significant political instability, wars or other armed conflict or acts of terrorism. |
14
These risks could adversely affect our operations, business strategies and operating results. Additionally, there continues to be a great deal of uncertainty regarding potential future changes in U.S. and global trade policies for companies with multinational operations like ours. As we continue to operate and expand our business globally, our success will depend, in part, on the nature and extent of any such changes and our how well we are able our ability to anticipate, respond to and effectively manage any such changes.
Government policies and regulations, particularly those affecting the agricultural sector and related industries, could adversely affect our operations and profitability.
Agricultural commodity production and trade flows are significantly affected by government policies and regulations. Governmental policies affecting the agricultural industry, such as taxes, tariffs, duties, subsidies, import and export restrictions on agricultural commodities and commodity products and energy policies (including biofuels mandates), can influence industry profitability, the planting of certain crops versus other uses of agricultural resources, the location and size of crop production, whether unprocessed or processed commodity products are traded and the volume and types of imports and exports. In addition, international trade disputes can adversely affect agricultural commodity trade flows by limiting or disrupting trade between countries or regions.
From time to time depending on market conditions, increases in prices for, among other things, food, fuel and crop inputs, such as fertilizers, may become the subject of significant discussion by governmental bodies and the public throughout the world. In some countries, this has led to the imposition of policies such as price controls, tariffs and export restrictions on agricultural commodities. Additionally, continuing efforts to change the regulation of financial markets, including the U.S. Dodd-Frank Act and European regulations, may subject large users of derivatives, such as Bunge, to extensive new oversight and regulation. Such initiatives could impose significant additional costs on us, including operating and compliance costs, and could materially affect the availability, as well as the cost and terms, of certain transactions. Future governmental policies, regulations or actions affecting our industries may adversely affect the supply of, demand for and prices of our products, restrict our ability to do business and cause our financial results to suffer.
Increases in commodity prices can increase the scrutiny to which we are subject under antitrust laws.
We are subject to antitrust and competition laws in various countries throughout the world. We cannot predict how these laws or their interpretation, administration and enforcement will change over time, particularly in periods of significant price increases in our industries. Changes or developments in antitrust laws globally, or in their interpretation, administration or enforcement, may limit our existing or future operations and growth. Increases in food and fertilizer prices have in the past resulted in increased scrutiny of our industries under antitrust and competition laws in Europe, Brazil and other jurisdictions and increase the risk that these laws could be interpreted, administered or enforced in a manner that could affect our operations or impose liability on us in a manner that could have a material adverse effect on our operating results and financial condition.
We may be adversely affected by a shortage of sugarcane or by high sugarcane costs.
Sugarcane is our principal raw material used in the production of ethanol and sugar. Our ability to secure an adequate supply of sugarcane depends on our ability to negotiate and maintain satisfactory land rights and supply contracts with third parties. Currently, approximately 94% of the land we use for sugarcane supply is not owned by us, with such land typically managed through agricultural partnership agreements having an average remaining term of four years. We cannot guarantee that these agreements will be renewed after their respective terms or that any such renewals will be on terms and conditions satisfactory to us. A significant shortage of sugarcane supply or increase in the cost of available sugarcane, including as a result of the termination of our partnership or supply contracts or the inability to enter into alternative arrangements on economic terms, would likely have an adverse effect on our business and financial performance, and such effect could be material.
We may not realize the anticipated benefits of acquisitions, divestitures or joint ventures.
We have been an active acquirer of other companies, and we have joint ventures with several partners. Part of our strategy involves acquisitions, alliances and joint ventures designed to expand and enhance our business. Our ability to benefit from acquisitions, joint ventures and alliances depends on many factors, including our ability to identify suitable prospects, access funding sources on acceptable terms, negotiate favorable transaction terms and successfully consummate and integrate any businesses we acquire. In addition, we may decide, from time to time, to divest certain of our assets or businesses. Our ability to successfully complete a divestiture will depend on, among other things, our ability to identify buyers that are prepared to acquire such assets or businesses on acceptable terms and to adjust and optimize our retained businesses following the divestiture.
Our acquisition or divestiture activities may involve unanticipated delays, costs and other problems. If we encounter unexpected problems with one of our acquisitions, alliances or divestitures, our senior management may be required to divert attention away from other aspects of our businesses to address these problems. Additionally, we may fail to consummate
15
proposed acquisitions or divestitures, after incurring expenses and devoting substantial resources, including management time, to such transactions.
Acquisitions also pose the risk that we may be exposed to successor liability relating to actions by an acquired company and its management before the acquisition. The due diligence we conduct in connection with an acquisition, and any contractual guarantees or indemnities that we receive from the sellers of acquired companies, may not be sufficient to protect us from, or compensate us for, actual liabilities. A material liability associated with an acquisition could adversely affect our reputation and results of operations and reduce the benefits of the acquisition. Additionally, acquisitions involve other risks, such as differing levels of management and internal control effectiveness at the acquired entities, systems integration risks, the risk of impairment charges relating to goodwill and intangible assets recorded in connection with acquisitions, the risk of significant accounting charges resulting from the completion and integration of a sizeable acquisition, the need to fund increased capital expenditures and working capital requirements, our ability to retain and motivate employees of acquired entities and other unanticipated problems and liabilities.
Divestitures may also expose us to potential liabilities or claims for indemnification, as we may be required to retain certain liabilities or indemnify buyers for certain matters, including environmental or litigation matters, associated with the assets or businesses that we sell. The magnitude of any such retained liability or indemnification obligation may be difficult to quantify at the time of the transaction, and its cost to us could ultimately exceed the proceeds we receive for the divested assets or businesses. Divestitures also have other inherent risks, including possible delays in closing transactions (including potential difficulties in obtaining regulatory approvals), the risk of lower-than-expected sales proceeds for the divested businesses and unexpected costs or other difficulties associated with the separation of the businesses to be sold from our information technology and other systems and management processes, including the loss of key personnel. Additionally, expected cost savings or other anticipated efficiencies or benefits from divestitures may also be difficult to achieve or maximize.
Additionally, we have several joint ventures and investments where we may have limited control over governance, financial reporting and operations. As a result, we face certain operating, financial and other risks relating to these investments, including risks related to the financial strength of our joint venture partners or their willingness to provide adequate funding for the joint venture, having differing objectives from our partners, the inability to implement some actions with respect to the joint venture's activities that we may believe are favorable if the joint venture partner does not agree, compliance risks relating to actions of the joint venture or our partners and the risk that we will be unable to resolve disputes with the joint venture partner. As a result, these investments may contribute significantly less than anticipated to our earnings and cash flows.
We are subject to industry and other risks that could adversely affect our reputation and financial results.
We are subject to food and feed industry risks which include, but are not limited to, spoilage, contamination, tampering or other adulteration of products, product liability claims and recalls; as well as government regulation, regarding matters such as food and feed safety, nutritional standards and genetically modified organisms. We are also subject to shifts in customer and consumer preferences and concerns regarding the outbreak of disease associated with livestock and poultry, including avian or swine influenza. These risks could not only adversely affect our business and operating results but also our corporate reputation.
As a company whose products comprise staple food and feed products sold globally, maintaining a good corporate reputation is critical to our continued success. Reputational value is based in large part on perceptions, which can shift rapidly in response to negative incidents. The failure or alleged failure to maintain high standards for quality, safety, integrity, environmental sustainability and social responsibility, including with respect to raw materials and services obtained from suppliers, even if untrue, may result in tangible effects, such as reduced demand for our products, disruptions to our operations, increased costs and loss of market share to competitors. Our reputation and results of operations could also be adversely impacted by changing consumer preferences and perceptions relating to some of the products we sell, such as with regard to the quantity and type of fats, sugars and grains consumed as well as concerns regarding genetically modified crops. Failure to anticipate, adapt or respond effectively to these trends or issues may result in material adverse effects on our business, financial condition, and results of operations.
We are subject to environmental, health and safety regulation in numerous jurisdictions. We may be subject to substantial costs, liabilities and other adverse effects on our business relating to these matters.
Our operations are regulated by environmental, health and safety laws and regulations in the countries where we operate, including those governing the labeling, use, storage, discharge and disposal of hazardous materials. These laws and regulations require us to implement procedures for the handling of hazardous materials and for operating in potentially hazardous conditions and they impose liability on us for the cleanup of environmental contamination. In addition to liabilities arising out of our current and future operations for which we have ongoing processes to manage compliance with regulatory obligations, we may be subject to liabilities for past operations at current facilities and in some cases to liabilities for past operations at
16
facilities that we no longer own or operate. We may also be subject to liabilities for operations of acquired companies. We may incur material costs or liabilities to comply with environmental, health and safety requirements. In addition, our industrial activities can result in serious accidents that could result in personal injuries, facility shutdowns, reputational harm to our business and/or the expenditure of significant amounts to remediate safety issues or repair damaged facilities.
In addition, continued government and public emphasis in countries where we operate on environmental issues, including climate change, conservation and natural resource management, have resulted in and could result in new or more stringent forms of regulatory oversight of our industries, including increased environmental controls, land-use restrictions affecting us or our suppliers and other conditions that could have a material adverse effect on our business, financial condition and results of operations. For example, certain aspects of our business and the larger food production chain generate carbon emissions. The imposition of regulatory restrictions on greenhouse gas emissions, which may include limitations on greenhouse gas emissions, other restrictions on industrial operations, taxes or fees on greenhouse gas emissions and other measures, could affect land-use decisions, the cost of agricultural production and the cost and means of processing and transporting of our products, which could adversely affect our business, cash flows and results of operations.
We are exposed to credit and counterparty risk relating to our customers in the ordinary course of business. In particular, we advance capital and provide other financing arrangements to farmers in Brazil and, as a result, our business and financial results may be adversely affected if these farmers are unable to repay the capital advanced to them.
We have various credit terms with customers, and our customers have varying degrees of creditworthiness, which exposes us to the risk of non-payment or other default under our contracts and other arrangements with them. In the event that we experience significant defaults on their payment obligations to us, our financial condition, results of operations or cash flows could be materially and adversely affected.
In Brazil, where there have been limited third-party financing sources available to farmers, we provide financing to farmers from whom we purchase soybeans and other agricultural commodities through prepaid commodity purchase contracts and advances, which are generally intended to be short-term in nature and are typically secured by the farmer's crop and a mortgage on the farmer's land and other assets to provide a means of repayment in the potential event of crop failure or shortfall. At December 31, 2017 and 2016, respectively, we had approximately $817 million and $966 million in outstanding prepaid commodity purchase contracts and advances to farmers. We are exposed to the risk that the underlying crop will be insufficient to satisfy a farmer's obligation under the financing arrangements as a result of weather and crop growing conditions, and other factors that influence the price, supply and demand for agricultural commodities. In addition, any collateral held by us as part of these financing transactions may not be sufficient to fully protect us from loss.
We are a capital intensive business and depend on cash provided by our operations as well as access to external financing to operate and expand our business.
We require significant amounts of capital to operate our business and fund capital expenditures. In addition, our working capital needs are directly affected by the prices of agricultural commodities, with increases in commodity prices generally causing increases in our borrowing levels. We are also required to make substantial capital expenditures to maintain, upgrade and expand our extensive network of storage facilities, processing plants, refineries, mills, logistics assets and other facilities to keep pace with competitive developments, technological advances and safety and environmental standards. Furthermore, the expansion of our business and pursuit of acquisitions or other business opportunities may require us to have access to significant amounts of capital. If we are unable to generate sufficient cash flows or raise sufficient external financing on attractive terms to fund these activities, including as a result of a tightening in the global credit markets, we may be forced to limit our operations and growth plans, which may adversely impact our competitiveness and, therefore, our results of operations.
As of December 31, 2017, we had $5,015 million unused and available borrowing capacity under various committed long-term credit facilities and $4,479 million in total debt. Our debt could limit our ability to obtain additional financing, limit our flexibility in planning for, or reacting to, changes in the markets in which we compete, place us at a competitive disadvantage compared to our competitors that are less leveraged than we are and require us to dedicate more cash on a relative basis to servicing our debt and less to developing our business. This may limit our ability to run our business and use our resources in the manner in which we would like. Furthermore, difficult conditions in global credit or financial markets generally could adversely impact our ability to refinance maturing debt or the cost or other terms of such refinancing, as well as adversely affect the financial position of the lenders with whom we do business, which may reduce our ability to obtain financing for our operations. See "Item 7. Management's Discussion and Analysis of Financial Condition and Results of Operations—Liquidity and Capital Resources."
In connection with the IOI Loders Croklaan acquisition, we have incurred a significant amount of additional debt to fund the acquisition. This increase in our indebtedness, coupled with the possibility of continued weak financial results as a result of
17
adverse industry conditions generally, could result in a lowering of our credit ratings. Our credit ratings are important to our liquidity. While our debt agreements do not have any credit rating downgrade triggers that would accelerate the maturity of our debt, a reduction in our credit ratings would increase our borrowing costs and, depending on their severity, could impede our ability to obtain credit facilities or access the capital markets in the future on favorable terms and impair our ability to compete effectively relative to competitors with higher credit ratings.
Our risk management strategies may not be effective.
Our business is affected by fluctuations in agricultural commodity prices, transportation costs, energy prices, interest rates and foreign currency exchange rates. We engage in hedging transactions to manage these risks. However, our exposures may not always be fully hedged and our hedging strategies may not be successful in minimizing our exposure to these fluctuations. In addition, our risk management strategies may seek to position our overall portfolio relative to expected market movements. While we have implemented a broad range of control procedures and policies to mitigate potential losses, they may not in all cases successfully protect us from losses that have the potential to impair our financial position. See "Item 7A. Quantitative and Qualitative Disclosures About Market Risk."
We may not be able to achieve the efficiencies, savings and other benefits anticipated from our cost reduction, margin improvement and other business optimization initiatives.
We are continually implementing programs throughout the company to reduce costs, increase efficiencies and enhance our business. Initiatives currently in process or implemented in the past several years include the rationalization of manufacturing operations globally, including the closing of facilities, the implementation of an operational improvement program in our Food and Ingredients businesses and the launch of the Global Competitiveness Program (“GCP”) announced in July 2017. The goal of the GCP is to improve our cost position and deliver increased value to shareholders by achieving $250 million of cost savings by the end of 2020. It is anticipated that aggregate total pre-tax cash charges attributable to the GCP will be in the range of approximately $200 million to $300 million, which primarily relate to severance and other employee benefit costs, and costs related to professional services. The successful design and implementation of the GCP presents significant organizational design and other challenges. We may not achieve or sustain the targeted benefits under the GCP, or we may not achieve them within our expected timetable. Unexpected delays, increased costs, adverse effects on our internal control environment, inability to retain and motivate employees or other challenges arising from these initiatives could adversely affect our ability to realize the anticipated savings or other intended benefits of these activities. Additionally, the scope of the GCP will require a substantial amount of management and operational resources to implement it effectively. These and related demands on our resources may divert the company’s attention from our ongoing business operations, which could also impact our competitive position.
The loss of or a disruption in our manufacturing and distribution operations or other operations and systems could adversely affect our business.
We are engaged in manufacturing and distribution activities on a global scale, and our business depends on our ability to execute and monitor, on a daily basis, a significant number of transactions across numerous markets or geographies. As a result, we are subject to the risks inherent in such activities, including industrial accidents, environmental events, fires, explosions, strikes and other labor or industrial disputes and disruptions in logistics or information systems, as well as natural disasters, pandemics, acts of terrorism and other external factors over which we have no control. While we insure ourselves against many of these types of risks in accordance with industry standards, our level of insurance may not cover all losses. The loss of, or damage to, any of our facilities could have a material adverse effect on our business, results of operations and financial condition.
Our information technology systems and processes may suffer a significant breach or disruption that may adversely affect our ability to conduct our business.
Our information technology systems, some of which are dependent on services provided by third parties, provide critical data and services for internal and external users, including procurement and inventory management, transaction processing, financial, commercial and operational data, human resources management, legal and tax compliance information and other information and processes necessary to operate and manage our business. Our information technology and infrastructure may experience attacks by hackers, breaches or other failures or disruptions that could compromise our systems and the information stored there. While we have implemented security measures and disaster recovery plans designed to protect the security and continuity of our networks and critical systems, these measures may not adequately prevent adverse events such as breaches or failures from occurring or mitigate their severity if they do occur. If our information technology systems are breached, damaged or fail to function properly due to any number of causes, such as security breaches or cyber based attacks, systems implementation difficulties, catastrophic events or power outages, and our security, contingency disaster recovery or other risk mitigation plans do not effectively mitigate these occurrences on a timely basis, we may experience a material disruption in our
18
ability to manage our business operations and produce financial reports, as well as significant costs and lost business opportunities until they are remediated. We may also be subject to legal claims or proceedings, liability under laws that protect the privacy of personal information, potential regulatory penalties and damage to our reputation. These impacts may adversely impact our business, results of operations and financial condition, as well as our competitive position.
Changes in tax laws or exposure to additional tax liabilities could have a material impact on our financial condition and results of operations
We are subject to income taxes as well as non-income taxes in various jurisdictions throughout the world. Tax authorities may disagree with certain positions we have taken and assess additional taxes, along with interest and penalties. We regularly assess the likely outcomes of these audits in order to assess the appropriateness of our tax assets and liabilities. However, the calculation of such liabilities involves significant judgment in the interpretation of complex tax regulations in many jurisdictions. Therefore, any dispute with a taxing authority may result in a payment or outcome that is significantly different from current estimates. There can be no assurance that we will accurately predict the outcomes of these audits and the actual outcomes of these audits could have a material impact on our consolidated earnings and financial condition in the periods in which they are recognized.
Additionally, changes in tax laws could materially impact our tax rate and the monetization of recoverable tax assets (indirect tax credits). Furthermore, the recent efforts in corporate tax transparency by the Organization of Economic Cooperation and Development ("OECD") resulting in additional mandated disclosures will likely cause additional scrutiny on the Company's tax positions and potentially increased tax liabilities.
Changes in tax laws and policies could also impact supplier and customer behaviors, resulting in impacts to our financial results. For example, the recent tax reform legislation in the United States contains a provision favoring sales of commodities to agricultural cooperatives. If not amended, this new provision could result in competitive disadvantages to grain companies such as us and lead to reduced gross margins. We are currently evaluating commercial and other measures to respond to the new law.
Risks Relating to Our Common Shares
We are a Bermuda company, and it may be difficult to enforce judgments against us and our directors and executive officers.
We are a Bermuda exempted company. As a result, the rights of holders of our common shares will be governed by Bermuda law and our memorandum of association and bye-laws. The rights of shareholders under Bermuda law may differ from the rights of shareholders of companies or corporations incorporated in other jurisdictions, including the United States. Several of our directors and some of our officers are non-residents of the United States, and a substantial portion of our assets and the assets of those directors and officers are located outside the United States. As a result, it may be difficult to effect service of process on those persons in the United States or to enforce in the U.S. judgments obtained in U.S. courts against us or those persons based on civil liability provisions of the U.S. securities laws. It is doubtful whether courts in Bermuda will enforce judgments obtained in other jurisdictions, including the United States, against us or our directors or officers under the securities laws of those jurisdictions or entertain actions in Bermuda against us or our directors or officers under the securities laws of other jurisdictions.
Our bye-laws restrict shareholders from bringing legal action against our officers and directors.
Our bye-laws contain a broad waiver by our shareholders of any claim or right of action, both individually and on our behalf, against any of our officers or directors. The waiver applies to any action taken by an officer or director, or the failure of an officer or director to take any action, in the performance of his or her duties, except with respect to any matter involving any fraud or dishonesty on the part of the officer or director. This waiver limits the right of shareholders to assert claims against our officers and directors unless the act, or failure to act, involves fraud or dishonesty.
We have anti-takeover provisions in our bye-laws that may discourage a change of control.
Our bye-laws contain provisions that could make it more difficult for a third party to acquire us without the consent of our Board of Directors. These provisions provide for:
• | directors to be removed without cause at any special general meeting only upon the affirmative vote of at least 66% of all votes attaching to all shares then in issue entitling the holder to attend and vote on the resolution; |
• | restrictions on the time period in which directors may be nominated; |
• | our Board of Directors to determine the powers, preferences and rights of our preference shares and to issue the preference shares without shareholder approval; and |
19
• | an affirmative vote of at least 66% of all votes attaching to all shares then in issue entitling the holder to attend and vote on the resolution for some business combination transactions, which have not been approved by our Board of Directors. |
These provisions, as well as any additional anti-takeover measures our Board of Directors could adopt in the future, could make it more difficult for a third party to acquire us, even if the third party's offer may be considered beneficial by many shareholders. As a result, shareholders may be limited in their ability to obtain a premium for their shares.
Item 1B. Unresolved Staff Comments
Not applicable.
Item 2. Properties
The following tables provide information on our principal operating facilities as of December 31, 2017.
Facilities by Business Area
(metric tons) | Aggregate Daily Production Capacity | Aggregate Storage Capacity | ||||
Business Area | ||||||
Agribusiness | 145,697 | 15,474,260 | ||||
Food and Ingredients | 81,744 | 1,878,322 | ||||
Sugar and Bioenergy | 121,353 | 734,458 | ||||
Fertilizer | 6,408 | 878,283 | ||||
Facilities by Geographic Region
(metric tons) | Aggregate Daily Production Capacity | Aggregate Storage Capacity | ||||
Region | ||||||
North America | 80,665 | 6,185,966 | ||||
South America | 191,564 | 9,438,694 | ||||
Europe | 54,456 | 2,360,397 | ||||
Asia-Pacific | 28,517 | 980,267 | ||||
Agribusiness
In our Agribusiness segment, we have 182 commodity storage facilities globally that are located close to agricultural production areas or export locations. We also have 52 oilseed processing plants globally. We have 39 merchandising and distribution offices throughout the world.
Food and Ingredients
In our Food and Ingredients businesses, we have 112 refining, packaging and milling facilities throughout the world. We also have 105 commodity storage facilities globally that are located close to food and ingredient locations. In addition, to facilitate distribution in Brazil, we operate eight distribution centers.
Sugar and Bioenergy
In our Sugar and Bioenergy segment, we have eight sugarcane mills, all of which are located in Brazil within close proximity to sugarcane production areas. We also manage land through agricultural partnership agreements for the cultivation of sugarcane as described under "Item 1. Business—Sugar and Bioenergy."
Fertilizer
In our Fertilizer segment, we operate three fertilizer processing and blending plants in Argentina and fertilizer ports in Brazil and Argentina.
20
Other
Our corporate headquarters in White Plains, New York, occupies approximately 66,300 square feet of space under a lease that expires in June 2025. We also own or lease other office space for our operations worldwide.
We believe that our facilities are adequate to address our operational requirements.
Item 3. Legal Proceedings
We are subject to various legal proceedings and risks globally in the course of our business, including claims, suits, and government investigations involving competition, tax, labor and employment, commercial disputes and other matters. Although we cannot accurately predict the amount of any liability that may ultimately arise with respect to any of these matters, we make provisions for potential liabilities when we deem them probable and reasonably estimable. These provisions are based on current information and legal advice and are adjusted from time to time according to developments. We do not expect the outcome of these proceedings, net of established reserves, to have a material adverse effect on our financial condition or results of operations. Due to their inherent uncertainty, however, there can be no assurance as to the ultimate outcome of current or future litigation, proceedings, investigations or claims and it is possible that a resolution of one or more such proceedings could result in judgments, awards, fines and penalties that could adversely affect our business, consolidated financial position, results of operations, or cash flows in a particular period.
For a discussion of certain legal and tax matters relating to Argentina and Brazil, see Notes 14 and 21 to our consolidated financial statements included as part of this Annual Report on Form 10-K. Additionally, we are a party to a large number of labor and civil claims relating to our Brazilian operations. We have reserved an aggregate of $85 million and $75 million for labor and civil claims, respectively, as of December 31, 2017. The labor claims primarily relate to dismissals, severance, health and safety, salary adjustments and supplementary retirement benefits. The civil claims relate to various legal proceedings and disputes, including disputes with suppliers and customers and include approximately 112 million Brazilian reais (approximately $34 million as of December 31, 2017) related to a legacy environmental claim in Brazil.
Item 4. Mine Safety Disclosures
Not applicable.
PART II
Item 5. Market for Registrant's Common Equity, Related Stockholder Matters and Issuer Purchases of Equity Securities
(a) | Market Information |
Our common shares trade on the New York Stock Exchange under the ticker symbol "BG". The following table sets forth, for the periods indicated, the high and low closing prices of our common shares, as reported on the New York Stock Exchange.
(US$) | High | Low | ||||||
2018 | ||||||||
First quarter (to February 16, 2018) | $ | 82.55 | $ | 67.99 | ||||
2017 | ||||||||
Fourth quarter | $ | 72.49 | $ | 65.15 | ||||
Third quarter | 80.59 | 69.46 | ||||||
Second quarter | 83.22 | 67.04 | ||||||
First quarter | 82.07 | 67.81 | ||||||
2016 | ||||||||
Fourth quarter | $ | 73.61 | $ | 58.64 | ||||
Third quarter | 66.21 | 57.76 | ||||||
Second quarter | 67.77 | 55.62 | ||||||
First quarter | 66.82 | 47.79 | ||||||
(b) | Approximate Number of Holders of Common Stock |
21
To our knowledge, based on information provided by Computershare Investor Services LLC, our transfer agent, as of December 31, 2017, we had 140,646,829 common shares outstanding, which were held by approximately 75 registered holders.
(c) | Dividends |
We intend to pay cash dividends to holders of our common shares on a quarterly basis. In addition, holders of our 4.875% cumulative convertible perpetual preference shares are entitled to annual dividends per share in the amount of $4.875 per year payable quarterly, when, as and if declared by the Board of Directors in accordance with the terms of these shares. Any future determination to pay dividends will, subject to the provisions of Bermuda law, be at the discretion of our Board of Directors and will depend upon then existing conditions, including our financial condition, results of operations, contractual and other relevant legal or regulatory restrictions, capital requirements, business prospects and other factors our Board of Directors deems relevant.
Under Bermuda law, a company's board of directors may not declare or pay dividends from time to time if there are reasonable grounds for believing that the company is, or would after the payment be, unable to pay its liabilities as they become due or that the realizable value of its assets would thereby be less than of its liabilities. Under our bye-laws, each common share is entitled to dividends if, as and when dividends are declared by our Board of Directors, subject to any preferred dividend right of the holders of any preference shares. There are no restrictions on our ability to transfer funds (other than funds denominated in Bermuda dollars) in or out of Bermuda or to pay dividends to U.S. residents who are holders of our common shares.
We paid quarterly dividends on our common shares of $0.42 per share in the first two quarters of 2017 and $0.46 per share in the last two quarters of 2017. We paid quarterly dividends on our common shares of $0.38 per share in the first two quarters of 2016 and $0.42 per share in the last two quarters of 2016. On December 7, 2017, we declared a regular quarterly cash dividend of $0.46 per share payable on March 2, 2018 to shareholders of record on February 16, 2018.
(d) | Securities Authorized for Issuance Under Equity Compensation Plans |
The following table sets forth certain information, as of December 31, 2017, with respect to our equity compensation plans.
(a) | (b) | (c) | |||||||||||
Plan category | Number of Securities to be Issued Upon Exercise of Outstanding Options, Warrants and Rights | Weighted-Average Exercise Price Per Share of Outstanding Options, Warrants and Rights | Number of Securities Remaining Available for Future Issuance Under Equity Compensation Plans (Excluding Securities Reflected in Column (a)) | ||||||||||
Equity compensation plans approved by shareholders(1) | 7,923,264 | (2) | $ | 71.88 | (3) | 3,946,961 | (4) | ||||||
(1) | Includes our 2016 Equity Incentive Plan, 2009 Equity Incentive Plan, Equity Incentive Plan, Non-Employee Directors' Equity Incentive Plan and 2017 Non-Employee Directors' Equity Incentive Plan. |
(2) | Includes non-statutory stock options outstanding as to 4,896,000 common shares, performance-based restricted stock unit awards outstanding as to 1,029,616 common shares and 2,690 vested and deferred restricted stock units outstanding (including, for all restricted and deferred restricted stock unit awards outstanding, dividend equivalents payable in common shares) under our 2009 Equity Incentive Plan. This number also includes non-statutory stock options outstanding as to 1,320,570 common shares under our 2016 Equity Incentive Plan and 18,511 and 655,877 unvested restricted stock units under our 2017 Non-Employee Directors' Equity Incentive Plan and 2016 Equity Incentive Plan, respectively. Dividend equivalent payments that are credited to each participant's account are paid in our common shares at the time an award is settled. Vested deferred restricted stock units are paid at the time the applicable deferral period lapses. |
(3) | Calculated based on non-statutory stock options outstanding under our 2016 Equity Incentive Plan, 2009 Equity Incentive Plan, Equity Incentive Plan and our Non-Employee Directors' Equity Incentive Plan. This number excludes outstanding time-based restricted stock unit and performance-based restricted stock unit awards under the 2016 Equity Incentive Plan, 2009 Equity Incentive Plan and restricted and deferred restricted stock unit awards under the 2007 Non-Employee Directors' Equity Incentive Plan. |
(4) | Includes dividend equivalents payable in common shares. Shares available under our 2016 Equity Incentive Plan may be used for any type of award authorized under the plan. Awards under the plan may be in the form of statutory or non-statutory stock options, restricted stock units (including performance-based) or other awards that are based on the value of our common shares. Our 2016 Equity Incentive Plan provides that the maximum number of common shares |
22
issuable under the plan is 5,800,000, subject to adjustment in accordance with the terms of the plan. This number also includes shares available for future issuance under our 2017 Non-Employee Directors' Equity Incentive Plan. Our 2017 Non-Employee Directors' Equity Incentive Plan provides that the maximum number of common shares issuable under the plan may not exceed 120,000, subject to adjustment in accordance with the terms of the plan. No additional awards may be granted under the Equity Incentive Plan and the Non-Employee Directors' Equity Incentive Plan.
(e) Performance Graph
The performance graph shown below compares the quarterly change in cumulative total shareholder return on our common shares with the Standard & Poor's (S&P) 500 Stock Index and the S&P Food Products Index from December 31, 2012 through the quarter ended December 31, 2017. The graph sets the beginning value of our common shares and the Indices at $100, and assumes that all dividends are reinvested. All Index values are weighted by the capitalization of the companies included in the Index.
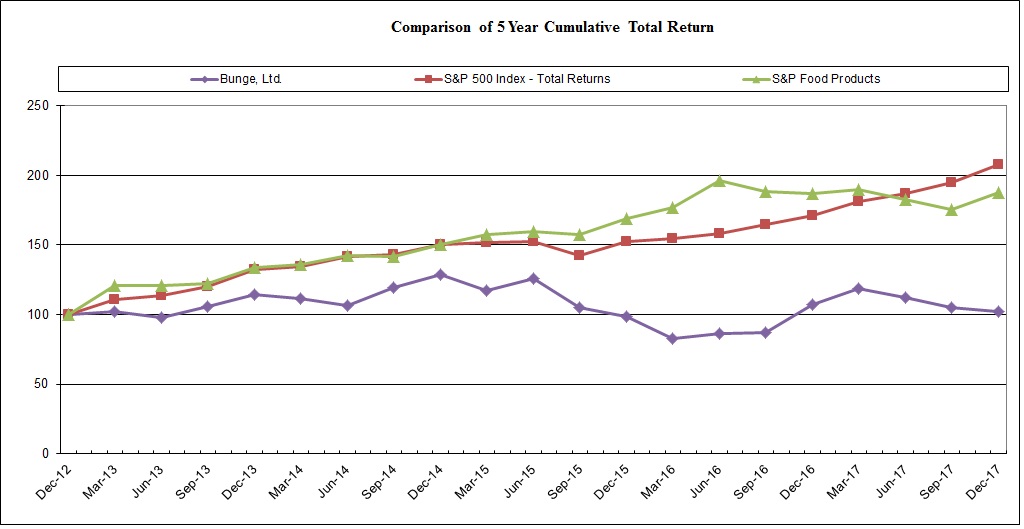
(f) | Purchases of Equity Securities by Registrant and Affiliated Purchasers |
In May 2015, we established a new program for the repurchase of up to $500 million of our issued and outstanding common shares. The program has no expiration date. Bunge did not repurchase any common shares during the year ended December 31, 2017. Total repurchases under the program from its inception in May 2015 through December 31, 2017 were 4,707,440 shares for $300 million. Bunge completed the previous program of $975 million during the first quarter of 2015 with the repurchase of 2,460,600 common shares for $200 million.
Any repurchases may be made from time to time through a variety of means, including in the open market, in privately negotiated transactions or through other means as determined by us, and in compliance with applicable legal requirements. The timing and number of any shares repurchased will depend on a variety of factors, including share price and market conditions, and the program may be suspended or discontinued at any time at our discretion.
Item 6. Selected Financial Data
The following table sets forth our selected historical consolidated financial information for each of the five periods indicated. You should read this information together with "Item 7. Management's Discussion and Analysis of Financial Condition and Results of Operations" and with the consolidated financial statements and notes to the consolidated financial statements included elsewhere in this Annual Report on Form 10-K.
Our consolidated financial statements are prepared in U.S. dollars and in accordance with U.S. GAAP. The selected historical financial information as of and for the years ended December 31, 2017, 2016, 2015, 2014 and 2013 are derived from our audited consolidated financial statements and related notes. Activities of the Fertilizer segment reported in continuing
23
operations include our port operations in Brazil, our fertilizer production operations in Argentina and our 50% equity interest in the Morocco joint venture through the date of its sale in December 2013.
Year Ended December 31, | ||||||||||||||||||||
(US$ in millions) | 2017 | 2016 | 2015 | 2014 | 2013 | |||||||||||||||
Consolidated Statements of Income Data: | ||||||||||||||||||||
Net sales | $ | 45,794 | $ | 42,679 | $ | 43,455 | $ | 57,161 | $ | 61,347 | ||||||||||
Cost of goods sold | (44,030 | ) | (40,269 | ) | (40,762 | ) | (54,540 | ) | (58,587 | ) | ||||||||||
Gross profit | 1,764 | 2,410 | 2,693 | 2,621 | 2,760 | |||||||||||||||
Selling, general and administrative expenses | (1,445 | ) | (1,286 | ) | (1,435 | ) | (1,691 | ) | (1,559 | ) | ||||||||||
Interest income | 38 | 51 | 43 | 87 | 76 | |||||||||||||||
Interest expense | (263 | ) | (234 | ) | (258 | ) | (347 | ) | (363 | ) | ||||||||||
Foreign currency gains (losses) | 95 | (8 | ) | (8 | ) | 47 | 53 | |||||||||||||
Other income (expense)—net | 49 | 12 | (18 | ) | 17 | 44 | ||||||||||||||
Gain on disposition of equity interests and sale of assets | 9 | 122 | 47 | — | 3 | |||||||||||||||
Equity investment impairments | (17 | ) | (59 | ) | — | — | — | |||||||||||||
Goodwill and intangible impairments | — | (12 | ) | (13 | ) | — | — | |||||||||||||
Income from continuing operations before income tax | 230 | 996 | 1,051 | 734 | 1,014 | |||||||||||||||
Income tax (expense) benefit | (56 | ) | (220 | ) | (296 | ) | (249 | ) | (904 | ) | ||||||||||
Income from continuing operations | 174 | 776 | 755 | 485 | 110 | |||||||||||||||
Income (loss) from discontinued operations, net of tax | — | (9 | ) | 35 | 32 | 97 | ||||||||||||||
Net income | 174 | 767 | 790 | 517 | 207 | |||||||||||||||
Net loss (income) attributable to noncontrolling interests | (14 | ) | (22 | ) | 1 | (2 | ) | 99 | ||||||||||||
Net income attributable to Bunge | 160 | 745 | 791 | 515 | 306 | |||||||||||||||
Convertible preference share dividends and other obligations | (34 | ) | (36 | ) | (53 | ) | (48 | ) | (76 | ) | ||||||||||
Net income available to Bunge common shareholders | $ | 126 | $ | 709 | $ | 738 | $ | 467 | $ | 230 | ||||||||||
24
Year ended December 31, | ||||||||||||||||||||
(US$, except outstanding share data) | 2017 | 2016 | 2015 | 2014 | 2013 | |||||||||||||||
Per Share Data: | ||||||||||||||||||||
Earnings per common share—basic | ||||||||||||||||||||
Net income (loss) from continuing operations | $ | 0.90 | $ | 5.13 | $ | 4.90 | $ | 2.98 | $ | 0.91 | ||||||||||
Net income (loss) from discontinued operations | — | (0.06 | ) | 0.24 | 0.22 | 0.66 | ||||||||||||||
Net income (loss) to Bunge common shareholders | $ | 0.90 | $ | 5.07 | $ | 5.14 | $ | 3.20 | $ | 1.57 | ||||||||||
Earnings per common share—diluted | ||||||||||||||||||||
Net income (loss) from continuing operations | $ | 0.89 | $ | 5.07 | $ | 4.84 | $ | 2.96 | $ | 0.90 | ||||||||||
Net income (loss) from discontinued operations | — | (0.06 | ) | 0.23 | 0.21 | 0.65 | ||||||||||||||
Net income (loss) to Bunge common shareholders | $ | 0.89 | $ | 5.01 | $ | 5.07 | $ | 3.17 | $ | 1.55 | ||||||||||
Cash dividends declared per common share | $ | 1.80 | $ | 1.64 | $ | 1.48 | $ | 1.32 | $ | 1.17 | ||||||||||
Weighted-average common shares outstanding—basic | 140,365,549 | 139,845,124 | 143,671,546 | 146,209,508 | 147,204,082 | |||||||||||||||
Weighted-average common shares outstanding—diluted | 141,265,077 | 148,226,475 | 152,238,967 | 147,230,778 | 148,257,309 | |||||||||||||||
Year Ended December 31, | ||||||||||||||||||||
(US$ in millions) | 2017 | 2016 | 2015 | 2014 | 2013 | |||||||||||||||
Consolidated Cash Flow Data: | ||||||||||||||||||||
Cash provided by (used for) operating activities | $ | 1,006 | $ | 1,904 | $ | 610 | $ | 1,399 | $ | 2,225 | ||||||||||
Cash provided by (used for) investing activities | (1,162 | ) | (926 | ) | (802 | ) | (685 | ) | (429 | ) | ||||||||||
Cash provided by (used for) financing activities | (180 | ) | (488 | ) | 360 | (1,058 | ) | (1,565 | ) | |||||||||||
December 31, | ||||||||||||||||||||
(US$ in millions) | 2017 | 2016 | 2015 | 2014 | 2013 | |||||||||||||||
Consolidated Balance Sheet Data: | ||||||||||||||||||||
Cash and cash equivalents | $ | 601 | $ | 934 | $ | 411 | $ | 362 | $ | 742 | ||||||||||
Inventories(1) | 5,074 | 4,773 | 4,466 | 5,554 | 5,796 | |||||||||||||||
Working capital(2) | 4,188 | 3,408 | 3,576 | 4,377 | 5,237 | |||||||||||||||
Total assets | 18,871 | 19,188 | 17,914 | 21,425 | 26,771 | |||||||||||||||
Short-term debt, including current portion of long-term debt | 319 | 1,195 | 1,517 | 1,002 | 1,465 | |||||||||||||||
Long-term debt | 4,160 | 3,069 | 2,926 | 2,848 | 3,169 | |||||||||||||||
Convertible perpetual preference shares(3) | 690 | 690 | 690 | 690 | 690 | |||||||||||||||
Common shares and additional paid-in-capital | 5,227 | 5,144 | 5,106 | 5,054 | 4,968 | |||||||||||||||
Total equity | $ | 7,357 | 7,343 | 6,652 | 8,690 | 10,088 | ||||||||||||||
25
Year ended December 31, | |||||||||||||||
(in millions of metric tons) | 2017 | 2016 | 2015 | 2014 | 2013 | ||||||||||
Other Data: | |||||||||||||||
Volumes: | |||||||||||||||
Agribusiness | 142.9 | 134.6 | 134.1 | 138.7 | 137.4 | ||||||||||
Edible Oil Products | 7.7 | 7.0 | 6.8 | 6.9 | 7.0 | ||||||||||
Milling Products | 4.5 | 4.5 | 4.2 | 4.5 | 4.0 | ||||||||||
Total Food and Ingredients | 12.2 | 11.5 | 11.0 | 11.4 | 11.0 | ||||||||||
Sugar and Bioenergy | 9.4 | 8.8 | 10.4 | 9.7 | 10.3 | ||||||||||
Fertilizer | 1.3 | 1.3 | 1.0 | 1.1 | 1.0 | ||||||||||
_______________________________________________________________________________
(1) | Included in inventories were readily marketable inventories of $4,056 million, $3,855 million, $3,666 million, $4,409 million and $4,600 million at December 31, 2017, 2016, 2015, 2014 and 2013, respectively. Readily marketable inventories are agricultural commodity inventories, such as soybeans, soybean meal, soybean oil, corn and wheat that are readily convertible to cash because of their commodity characteristics, widely available markets and international pricing mechanisms. |
(2) | Working capital is calculated as current assets less current liabilities. |
(3) | Bunge has 6,899,700 4.875% cumulative convertible perpetual preference shares outstanding. Each cumulative convertible preference share has an initial liquidation preference of $100 per share plus accumulated and unpaid dividends up to a maximum of an additional $25 per share. As a result of adjustments made to the initial conversion price because cash dividends paid on Bunge Limited's common shares exceeded certain specified thresholds, each cumulative convertible preference share is convertible, at the holder's option, at any time, into approximately 1.1693 Bunge Limited common shares (8,067,819 Bunge Limited common shares), subject to certain additional anti-dilution adjustments. |
26
Item 7. Management's Discussion and Analysis of Financial Condition and Results of Operations
The following should be read in conjunction with "Cautionary Statement Regarding Forward Looking Statements" and our combined consolidated financial statements and notes thereto included in Item 15 of this Annual Report on Form 10-K.
Non-U.S. GAAP Financial Measures
Total segment earnings before interest and taxes ("EBIT") is an operating performance measure used by Bunge's management to evaluate segment operating activities. Bunge's management believes total segment EBIT is a useful measure of operating profitability, since the measure allows for an evaluation of the performance of its segments without regard to its financing methods or capital structure. In addition, EBIT is a financial measure that is widely used by analysts and investors in Bunge's industries. Total Segment EBIT is a non-U.S. GAAP financial measure and is not intended to replace net income attributable to Bunge, the most directly comparable U.S. GAAP financial measure.
Operating Results
Factors Affecting Operating Results
Bunge Limited, a Bermuda company, together with its subsidiaries, is a leading global agribusiness and food company operating in the farm-to-consumer food chain. The commodity nature of the Company's principal products, as well as regional and global supply and demand variations that occur as an inherent part of the business, make volumes an important operating measure. Accordingly, information is included in "Segment Results" that summarizes certain items in our consolidated statements of income and volumes by reportable segment. The common unit of measure for all reported volumes is metric tons. A description of reported volumes for each reportable segment has also been included in the discussion of key factors affecting results of operations in each of our business segments as discussed below.
Agribusiness
In the Agribusiness segment, we purchase, store, transport, process and sell agricultural commodities and commodity products. Profitability in this segment is affected by the availability and market prices of agricultural commodities and processed commodity products and the availability and costs of energy, transportation and logistics services. Profitability in our oilseed processing operations is also impacted by volumes procured, processed and sold and by capacity utilization rates. Availability of agricultural commodities is affected by many factors, including weather, farmer planting and selling decisions, plant diseases, governmental policies, and agricultural sector economic conditions. Reported volumes in this segment primarily reflect (i) grains and oilseeds originated from farmers, cooperatives or other aggregators and from which "origination margins" are earned; (ii) oilseeds processed in our oilseed processing facilities and from which "crushing margins" are earned- representing the margin from the industrial separation of the oilseed into its protein meal and vegetable oil components, both of which are separate commodity products; and (iii) third party sales of grains, oilseeds and related commodity products merchandised through our distribution businesses and from which "distribution margins" are earned. The foregoing subsegment volumes may overlap as they produce separate margin capture opportunities. For example, oilseeds procured in our
South American grain origination activities may be processed in our oilseed processing facilities in Asia-Pacific and will be reflected at both points within the segment. As such, these reported volumes do not represent solely volumes of net sales to third-parties, but rather where margin is earned, appropriately reflecting their contribution to our global network's capacity utilization and profitability.
Demand for our purchased and processed agribusiness products is affected by many factors, including global and regional economic conditions, changes in per capita incomes, the financial condition of customers and customer access to credit, worldwide consumption of food products, particularly pork and poultry, population growth rates, relative prices of substitute agricultural products, outbreaks of disease associated with livestock and poultry, and demand for renewable fuels produced from agricultural commodities and commodity products.
We expect that the factors described above will continue to affect global supply and demand for our agribusiness products for the foreseeable future. We also expect that, from time to time, imbalances will likely exist between oilseed processing capacity and demand for oilseed products in certain regions, which impacts our decisions regarding whether, when and where to purchase, store, transport, process or sell these commodities, including whether to change the location of or adjust our own oilseed processing capacity.
Additionally, price fluctuations and availability of commodities may cause fluctuations in our working capital, such as inventories, accounts receivable and borrowings over the course of a given year. For example, increased availability of commodities at harvest times often causes fluctuations in our inventories and borrowings. Increases in agricultural commodity prices will also generally cause our cash flow requirements to increase as our operations require increased use of cash to
27
acquire inventories and fund daily settlement requirements on exchange traded futures that we use to hedge our physical inventories.
Food and Ingredients
In the Food and Ingredients businesses, which consist of our Edible Oil Products and Milling Products segments, our operating results are affected by changes in the prices of raw materials, such as crude vegetable oils and grains, the mix of products that we sell, changes in consumer eating habits, changes in per capita incomes, consumer purchasing power levels, availability of credit to customers, governmental dietary guidelines and policies, changes in regional economic conditions and the general competitive environment in our markets. Raw material inputs to our production processes in the Edible Oil Products and Milling Products segments are largely sourced at market prices from our Agribusiness segment. Reported volumes in these segments reflect third-party sales of our finished products and, as such, include the sales of products derived from raw materials sourced from the Agribusiness segment as well as from third-parties. The unit of measure for these volumes is metric tons as these businesses are linked to the commodity raw materials, which are their primary inputs.
Sugar and Bioenergy
The Sugar and Bioenergy segment is an integrated business which primarily includes the procurement and growing of sugarcane and the production of sugar, ethanol and electricity in our eight mills in Brazil, global sugar trading and merchandising activities, and investment interests in affiliates.
Profitability in this segment is affected by the availability and quality of sugarcane, which impacts our capacity utilization rates and the amount of sugar that can be extracted from the sugarcane, and by market prices of sugarcane, sugar and ethanol. Availability and quality of sugarcane is affected by many factors, including weather, geographical factors such as soil quality and topography, and agricultural practices. Once planted, sugarcane may be harvested for several continuous years, but the yield decreases with each subsequent harvest. As a result, the current optimum economic cycle is generally five to seven consecutive harvests, depending on location. We own and/or have partnership agreements to manage farmland on which we grow and harvest sugarcane. We also purchase sugarcane from third parties. Prices of sugarcane in Brazil are established by Consecana, the São Paulo state sugarcane, sugar and ethanol council, and are based on the sucrose content of the cane and the market prices of sugar and ethanol. Demand for our products is affected by such factors as changes in global or regional economic conditions, the financial condition of customers and customer access to credit, worldwide consumption of food products, population growth rates, changes in per capita incomes and demand for and governmental support of renewable fuels produced from agricultural commodities, including sugarcane. We expect that these factors will continue to affect supply and demand for our sugar and bioenergy products in the foreseeable future. Reported volumes in this segment reflect third-party sales of sugar and ethanol.
Fertilizer
In the Fertilizer segment, demand for our products is affected by the profitability of the agricultural sectors we serve, the availability of credit to farmers, agricultural commodity prices, the types of crops planted, the number of acres planted, the quality of the land under cultivation and weather-related issues affecting the success of the harvests. Our profitability is impacted by international selling prices for fertilizers and fertilizer raw materials, such as phosphate, sulfur, ammonia and urea, ocean freight rates and other import costs, as well as import volumes at the port facilities we manage. As our operations are in
South America, primarily Argentina, our results in this segment are typically seasonal, with fertilizer sales normally concentrated in the third and fourth quarters of the year due to the timing of the South American agricultural cycle. Reported volumes in this segment reflect third-party sales of our finished products.
In addition to these industry related factors which impact our business areas, our results of operations in all business areas and segments are affected by the following factors:
Foreign Currency Exchange Rates
Due to the global nature of our operations, our operating results can be materially impacted by foreign currency exchange rates. Both translation of our foreign subsidiaries' financial statements and foreign currency transactions can affect our results. On a monthly basis, for subsidiaries whose functional currency is a currency other than the U.S. dollar, subsidiary statements of income and cash flows must be translated into U.S. dollars for consolidation purposes based on weighted-average exchange rates in each monthly period. As a result, fluctuations of local currencies compared to the U.S. dollar during each monthly period impact our consolidated statements of income and cash flows for each reported period (quarter and year-to-date) and also affect comparisons between those reported periods. Subsidiary balance sheets are translated using exchange rates as of the balance sheet date with the resulting translation adjustments reported in our consolidated balance sheets as a component of other comprehensive income (loss). Included in accumulated other comprehensive income for the years ended
28
December 31, 2017, 2016, and 2015 were foreign currency net translation gains (losses) of $187 million, $709 million and $(2,546) million, respectively, resulting from the translation of our foreign subsidiaries' assets and liabilities.
Additionally, we record transaction gains or losses on monetary assets and liabilities that are not denominated in the functional currency of the entity. These amounts are remeasured into their respective functional currencies at exchange rates as of the balance sheet date, with the resulting gains or losses included in the entity's statement of income and, therefore, in our consolidated statements of income as foreign currency gains (losses).
We primarily use a combination of equity and intercompany loans to finance our subsidiaries. Intercompany loans that are of a long-term investment nature with no intention of repayment in the foreseeable future are considered permanently invested and as such are treated as analogous to equity for accounting purposes. As a result, any foreign currency translation gains or losses on such permanently invested intercompany loans are reported in accumulated other comprehensive income (loss) in our consolidated balance sheets. In contrast, foreign currency translation gains or losses on intercompany loans that are not of a permanent nature are recorded in our consolidated statements of income as foreign currency gains (losses).
Income Taxes
As a Bermuda exempted company, we are not subject to income taxes on income in our jurisdiction of incorporation. However, our subsidiaries, which operate in multiple tax jurisdictions, are subject to income taxes at various statutory rates ranging from 0% to 39%. The jurisdictions that significantly impact our effective tax rate are Brazil, the United States, Argentina and Bermuda. Determination of taxable income requires the interpretation of related and often complex tax laws and regulations in each jurisdiction where we operate and the use of estimates and assumptions regarding future events.
Results of Operations
2017 Overview
For the year ended December 31, 2017, net income attributable to Bunge decreased by $585 million to $160 million from $745 million in 2016. This decrease resulted primarily from a decrease in total segment EBIT of $707 million, particularly in Agribusiness, as described below, and was partially offset by decreases in income tax expense and losses from discontinued operations. Interest income decreased by $13 million to $38 million in 2017 compared to $51 million in 2016, primarily related to lower average cash and cash equivalents balances. Interest expense increased $29 million to $263 million in 2017 from $234 million in 2016, primarily due to higher average debt balances, higher variable interest rates, and an increase in the duration of our debt portfolio.
Income tax expense was $56 million in 2017, compared to income tax expense of $220 million in 2016. The effective tax rate for 2017 was 24% compared to 22% 2016. The higher tax rate in 2017 was primarily due to certain discrete items.
Total segment EBIT of $436 million in 2017 decreased from $1,143 million in 2016. EBIT for 2017 included $55 million of severance, employee benefit and other program costs related to our Global Competitiveness Program (“GCP”), $35 million of severance and other employee benefit costs related to other industrial initiatives, $22 million of restructuring charges in our industrial sugar operations in Brazil, and $16 million of indirect tax credits in our industrial sugar operations in Brazil. In addition, EBIT included $20 million of asset impairment charges in Asia-Pacific and Europe relating to feedmill and port assets, $17 million of impairment charges related to our palm oil affiliate in Indonesia and our renewable oils affiliate in Brazil, and impairment charges of $7 million of intangible assets. EBIT also included $9 million of gains on the disposition of equity interests in Brazil and $9 million of acquisition fees. EBIT for 2016 included $120 million of gains on the disposition of equity interests in port and transshipment operations in Brazil and an oilseed crush facility in Vietnam and a $14 million gain related to a wheat export tax contingency settlement. In addition, 2016 total segment EBIT included impairment charges of $44 million and $15 million relating to equity investments in Brazil and Asia-Pacific, respectively, impairment charges of $12 million of intangible assets, $9 million of asset impairment charges in our fertilizer operations in Argentina, a provision of $8 million for long-term receivables in Brazil and $3 million of restructuring charges in our industrial sugar operations in Brazil.
Agribusiness Segment EBIT decreased by $619 million primarily driven by our grain origination business which was impacted by weaker margins, slow farmer selling, strong competition and take-or-pay logistics commitments in South America and weaker results in our soybean processing facilities in most regions. Contributing to lower EBIT were severance, employee benefit and other program costs related to our GCP and impairment charges.
Edible Oil Products Segment EBIT increased $14 million to $126 million in 2017 from $112 million in 2016. Increases to gross profit from acquisitions in Europe and Argentina and increased volumes in Asia-Pacific were partially offset by program costs related to our GCP and acquisition costs.
29
Milling Products Segment EBIT decreased by $68 million to $63 million in 2017 driven primarily by continued weak economic conditions and lower demand for higher value wheat products in Brazil and Mexico. Additionally, 2016 EBIT benefitted from the recovery of $14 million in Brazilian wheat import taxes.
Sugar and Bioenergy Segment EBIT decreased by $8 million. Our sugarcane milling, trading and merchandising operations were impacted by lower sugar and ethanol prices. Included in EBIT were employee severance costs and restructuring charges of $22 million related to our sugar milling operations, offset by $16 million of indirect tax credits. Included in EBIT in 2016 was $44 million of impairment charges related to our renewable oils affiliate in Brazil.
Fertilizer Segment EBIT decreased $26 million primarily due to lower margins in Argentina and the reversal of a natural gas tariff reserve of $11 million that benefitted 2016. Also, included in 2017 EBIT were $13 million of severance and employee benefit costs related to the closure of three fertilizer production lines in one of our plants in Argentina.
Segment Results
Bunge has five reportable segments-Agribusiness, Edible Oil Products, Milling Products, Sugar and Bioenergy, and Fertilizer-which are organized based upon similar economic characteristics and are similar in nature of products and services offered, the nature of production processes, the type and class of customer, and distribution methods. The Agribusiness segment is characterized by both inputs and outputs being agricultural commodities and thus high volume and low margin. The Edible Oil Products segment involves the manufacturing and marketing of products derived from vegetable oils. The Milling Products segment involves the manufacturing and marketing of products derived primarily from wheat and corn. The Sugar and Bioenergy segment involves sugarcane growing and milling in Brazil, sugar and ethanol trading and merchandising in various countries, as well as sugarcane-based ethanol production and corn-based ethanol investments and related activities. The Fertilizer segment includes the activities of our port operations in Brazil and Argentina and blending and distribution operations in Argentina.
30
A summary of certain items in our consolidated statements of income and volumes by reportable segment for the periods indicated is set forth below.
Year Ended December 31, | ||||||||||||
(US$ in millions) | 2017 | 2016 | 2015 | |||||||||
Volume (in thousands of metric tons): | ||||||||||||
Agribusiness | 142,855 | 134,605 | 134,136 | |||||||||
Edible Oil Products | 7,731 | 6,989 | 6,831 | |||||||||
Milling Products | 4,460 | 4,498 | 4,199 | |||||||||
Sugar and Bioenergy | 9,389 | 8,847 | 10,440 | |||||||||
Fertilizer | 1,329 | 1,272 | 979 | |||||||||
Net sales: | ||||||||||||
Agribusiness | $ | 31,741 | $ | 30,061 | $ | 31,267 | ||||||
Edible Oil Products | 8,018 | 6,859 | 6,698 | |||||||||
Milling Products | 1,575 | 1,647 | 1,609 | |||||||||
Sugar and Bioenergy | 4,054 | 3,709 | 3,495 | |||||||||
Fertilizer | 406 | 403 | 386 | |||||||||
Total | $ | 45,794 | $ | 42,679 | $ | 43,455 | ||||||
Cost of goods sold: | ||||||||||||
Agribusiness | $ | (30,809 | ) | $ | (28,571 | ) | $ | (29,409 | ) | |||
Edible Oil Products | (7,519 | ) | (6,420 | ) | (6,294 | ) | ||||||
Milling Products | (1,366 | ) | (1,378 | ) | (1,372 | ) | ||||||
Sugar and Bioenergy | (3,955 | ) | (3,550 | ) | (3,331 | ) | ||||||
Fertilizer | (381 | ) | (350 | ) | (356 | ) | ||||||
Total | $ | (44,030 | ) | $ | (40,269 | ) | $ | (40,762 | ) | |||
Gross profit (loss): | ||||||||||||
Agribusiness | $ | 932 | $ | 1,490 | $ | 1,858 | ||||||
Edible Oil Products | 499 | 439 | 404 | |||||||||
Milling Products | 209 | 269 | 237 | |||||||||
Sugar and Bioenergy | 99 | 159 | 164 | |||||||||
Fertilizer | 25 | 53 | 30 | |||||||||
Total | $ | 1,764 | $ | 2,410 | $ | 2,693 | ||||||
Selling, general & administrative expenses: | ||||||||||||
Agribusiness | $ | (810 | ) | $ | (706 | ) | $ | (851 | ) | |||
Edible Oil Products | (362 | ) | (320 | ) | (328 | ) | ||||||
Milling Products | (139 | ) | (127 | ) | (123 | ) | ||||||
Sugar and Bioenergy | (115 | ) | (112 | ) | (109 | ) | ||||||
Fertilizer | (19 | ) | (21 | ) | (24 | ) | ||||||
Total | $ | (1,445 | ) | $ | (1,286 | ) | $ | (1,435 | ) | |||
Foreign currency gain (loss): | ||||||||||||
Agribusiness | $ | 85 | $ | (7 | ) | $ | 67 | |||||
Edible Oil Products | 3 | (1 | ) | — | ||||||||
Milling Products | (3 | ) | (7 | ) | (8 | ) | ||||||
Sugar and Bioenergy | 11 | 9 | (68 | ) | ||||||||
Fertilizer | (1 | ) | (2 | ) | 1 | |||||||
Total | $ | 95 | $ | (8 | ) | $ | (8 | ) | ||||
31
Year Ended December 31, | ||||||||||||
(US$ in millions) | 2017 | 2016 | 2015 | |||||||||
EBIT attributable to noncontrolling interests:(1) | ||||||||||||
Agribusiness | $ | (9 | ) | $ | (21 | ) | $ | (9 | ) | |||
Edible Oil Products | (8 | ) | (13 | ) | (8 | ) | ||||||
Milling Products | — | — | — | |||||||||
Sugar and Bioenergy | — | — | — | |||||||||
Fertilizer | (2 | ) | (2 | ) | (1 | ) | ||||||
Total | $ | (19 | ) | $ | (36 | ) | $ | (18 | ) | |||
Other income (expense): | ||||||||||||
Agribusiness | $ | 62 | $ | 24 | $ | (3 | ) | |||||
Edible Oil Products | (6 | ) | 7 | 4 | ||||||||
Milling Products | (4 | ) | (4 | ) | (3 | ) | ||||||
Sugar and Bioenergy | (3 | ) | (16 | ) | (15 | ) | ||||||
Fertilizer | — | 1 | (1 | ) | ||||||||
Total | $ | 49 | $ | 12 | $ | (18 | ) | |||||
Gain on disposition of equity interests and sale of assets—Agribusiness | $ | 9 | $ | 122 | $ | 47 | ||||||
Equity investment impairment—Agribusiness | $ | (13 | ) | $ | (15 | ) | $ | — | ||||
Intangible asset impairment—Agribusiness | $ | — | $ | (12 | ) | $ | — | |||||
Goodwill impairment—Edible Oil Products | $ | — | $ | — | $ | (13 | ) | |||||
Equity investment impairment—Sugar and Bioenergy | $ | (4 | ) | $ | (44 | ) | $ | — | ||||
Segment EBIT:(1) | ||||||||||||
Agribusiness | $ | 256 | $ | 875 | $ | 1,108 | ||||||
Edible Oil Products | 126 | 112 | 59 | |||||||||
Milling Products | 63 | 131 | 103 | |||||||||
Sugar and Bioenergy | (12 | ) | (4 | ) | (27 | ) | ||||||
Fertilizer | 3 | 29 | 5 | |||||||||
Total | $ | 436 | $ | 1,143 | $ | 1,248 | ||||||
Depreciation, depletion and amortization: | ||||||||||||
Agribusiness | $ | (267 | ) | $ | (236 | ) | $ | (234 | ) | |||
Edible Oil Products | (105 | ) | (94 | ) | (90 | ) | ||||||
Milling Products | (61 | ) | (62 | ) | (46 | ) | ||||||
Sugar and Bioenergy | (164 | ) | (143 | ) | (160 | ) | ||||||
Fertilizer | (12 | ) | (12 | ) | (15 | ) | ||||||
Total | $ | (609 | ) | $ | (547 | ) | $ | (545 | ) | |||
Net income attributable to Bunge | $ | 160 | $ | 745 | $ | 791 | ||||||
(1) | We refer to our earnings before interest and taxes in each of our segments as "Segment EBIT". Total Segment EBIT is an operating performance measure used by Bunge's management to evaluate its segments' operating activities. Total segment EBIT is a non-U.S. GAAP financial measure and is not intended to replace net income attributable to Bunge, the most directly comparable U.S. GAAP financial measure. Bunge's management believes segment EBIT is a useful measure of its segments' operating profitability, since the measure allows for an evaluation of the performance of its segments without regard to its financing methods or capital structure. In addition, EBIT is a financial measure that is widely used by analysts and investors in Bunge's industries. Total segment EBIT excludes EBIT attributable to noncontrolling interests and is not a measure of consolidated operating results under U.S. GAAP and should not be considered as an alternative to net income attributable to Bunge or any other measure of consolidated operating results under U.S. GAAP. |
32
A reconciliation of net income attributable to Bunge to Total Segment EBIT follows:
Year Ended December 31, | ||||||||||||
(US$ in millions) | 2017 | 2016 | 2015 | |||||||||
Net income attributable to Bunge | $ | 160 | $ | 745 | $ | 791 | ||||||
Interest income | (38 | ) | (51 | ) | (43 | ) | ||||||
Interest expense | 263 | 234 | 258 | |||||||||
Income tax expense | 56 | 220 | 296 | |||||||||
(Income) loss from discontinued operations | — | 9 | (35 | ) | ||||||||
Noncontrolling interests' share of interest and tax | (5 | ) | (14 | ) | (19 | ) | ||||||
Total segment EBIT | $ | 436 | $ | 1,143 | $ | 1,248 | ||||||
2017 Compared to 2016
Net Income Attributable to Bunge— For the year ended December 31, 2017, net income attributable to Bunge decreased by $585 million to $160 million from $745 million in 2016. This decrease resulted primarily from a decrease in total segment EBIT of $707 million, particularly in Agribusiness, partially offset by decreases in losses from discontinued operations and income tax expense.
Income Tax Expense— In the year ended December 31, 2017, income tax expense was $56 million compared to income tax expense of $220 million in 2016. The effective tax rate for 2017 was 24% compared to 22% for 2016. The higher tax rate in 2017 was primarily due to an income tax charge recognized in the U.S. from newly enacted tax reform of $60 million, an income tax charge due to a tax rate change in Argentina for $6 million and a valuation allowance recognized in Europe for $26 million. This was partly offset by an income tax benefit of $32 million for a favorable resolution of income tax matters in Asia-Pacific, an income tax benefit of $17 million related to a prior year tax election in South America, and the release of a valuation allowance in Asia-Pacific for $6 million. The 2016 effective tax rate of 22% was driven primarily by certain discrete items including an income tax benefit of $60 million recorded for a change in estimate resulting from a tax election for North America, a release of valuation allowance for Sugar entities of $19 million, and an income tax benefit of $11 million recorded for income tax refund claims in Europe, partially offset by an income tax charge of $56 million recorded for an uncertain tax position related to Asia-Pacific. Excluding the effect of these discrete items noted above, our effective tax rate for 2017, and 2016 was 8% and 26%, respectively. The reduction in the effective tax rate from 2016 to 2017, after taking into account the discrete tax items noted above, is primarily attributable to favorable earnings mix on a lower base of pretax income and due to other net favorable discrete items, recognized primarily in the fourth quarter of 2017.
On December 22, 2017, H.R. 1, commonly known as the “Tax Cuts and Jobs Act” (the “Tax Act”) was signed into U.S. law. We recognized the income tax effects of the Tax Act in accordance with Staff Accounting Bulletin No. 118, which provides SEC staff guidance for the application of ASC 740, Income Taxes, in the reporting period in which the Tax Act was signed into law. As such, our financial results reflect the income tax effects of the Tax Act for which the accounting under ASC Topic 740 is complete, and our financial results reflect provisional amounts for those specific income tax effects of the Tax Act for which the accounting under ASC Topic 740 is incomplete but a reasonable estimate could be determined. Pursuant to SAB 118, adjustments to the provisional amounts recorded by us as of December 31, 2017, that are identified within a subsequent measurement period of up to one year from the enactment date will be included as an adjustment to the tax expense from continuing operations in the period the amounts are determined.
Agribusiness Segment— Agribusiness segment net sales increased by 6% to $31.7 billion in 2017, compared to $30.1 billion in 2016, aligned with the overall volumes increase of 6% compared to 2016. Higher volumes in Brazil due to larger soybean and corn crops, increased crush volumes in Europe due to our new crush plant in Ukraine which started operations in the second quarter of 2016, and the acquisition of two oilseed crushing facilities in Western Europe in the first quarter of 2017 led to the increase in net sales compared to 2016.
Cost of goods sold increased by 8%, aligned with the increases in volumes noted above. In addition, cost of goods sold for 2017, was impacted by $16 million of impairment charges of long-lived assets in Asia-Pacific and Europe, $12 million of severance and other employee benefit costs related to our industrial productivity initiatives, higher industrial costs and depreciation from the recent acquisitions in Europe and a 9% appreciation of the Brazilian real against the U.S. dollar in 2017 compared to 2016.
33
Gross profit decreased to $932 million in 2017, from $1.5 billion in 2016, primarily driven by lower margins in our grain origination, oilseed processing and trading and distribution businesses from slow farmer selling, reduced demand for soybean meal, strong competition, fewer risk management opportunities and severance and employee benefit costs related to industrial productivity initiatives.
SG&A expenses increased $104 million to $810 million in 2017, which represented a 15% increase from $706 million in the same period last year. This increase included $37 million of GCP costs, related primarily to severance and other employee benefit costs, added general and administrative expenses in Europe related to new acquisitions and a 9% appreciation of the Brazilian real against the U.S. dollar in 2016. Additionally, there was a $17 million credit adjustment in Brazil, $7 million of impairment charges, primarily of intangible assets related to patents, and $7 million of transaction related costs associated with the acquisition of two oilseed processing facilities in Europe.
Foreign currency results in 2017 were gains of $85 million, compared to losses of $7 million in 2016. These results were primarily driven by gains on U.S. dollar-denominated loans to fund operations and foreign currency gains realized due to the appreciation of the Chinese renminbi in our oilseed processing business in Asia.
Other income (expenses) - net was income of $62 million in 2017, compared to income of $24 million in 2016. Results for the year ended 2017 included income earned in our Financial Services Group, offset by a $13 million impairment of our palm oil affiliate in Indonesia. Results for the year ended 2016 included impairment and restructuring charges of $27 million on our palm oil affiliate in Indonesia and intangible assets related to aquaculture and other patents.
Segment EBIT decreased by $619 million primarily driven by our grain origination business, which was impacted by weaker margins, primarily due to slow farmer selling, strong competition and logistics commitments in South America and weaker results in our soybean processing facilities in most regions. Also, contributing to lower EBIT were severance, employee benefit and other program costs related to our Global Competitiveness Program (“GCP”), impairment charges, transaction costs related to the acquisition of two oilseed crushing facilities in Western Europe and the increase of general and administrative expenses for recent acquisitions.
Edible Oil Products Segment— Edible oil products segment net sales increased by 17% in 2017 to $8.0 billion, compared to $6.9 billion in 2016, resulting primarily from an 11% increase in volumes, driven by our acquisitions of two edible oil production facilities in Europe, the recent acquisition of an edible oil production facility in Argentina and increased volumes in Asia-Pacific and Brazil.
Cost of goods sold in 2017 increased 17% compared to 2016, which is in line with the increase in net sales noted above, and primarily driven by the impact of the recent acquisitions in Europe and Argentina and increased volumes in Asia-Pacific and Brazil compared to 2016. Additionally, 2017 included $6 million of severance and employee benefit costs related to industrial productivity initiatives.
Gross profit in 2017 increased to $499 million compared to $439 million in 2016. The increase was primarily driven by stronger margins in Brazil and increases in volumes in Europe from our recent acquisitions, offset in part by severance and other employee benefit costs and lower refining and packaging margins in the U.S.
SG&A expenses increased by 13% to $362 million in 2017 compared with $320 million in the same period a year ago. The increase includes severance and other employee benefit costs of $10 million related to our GCP and acquisition related costs of $9 million. Additionally, there were increased general and administrative expenses associated with our recent acquisitions.
Foreign currency results in 2017 were income of $3 million, compared to loss of $1 million in 2016 related to foreign currency gains on debt and derivative instruments and hedges.
Other income (expenses) - net was expense of $6 million in 2017, compared to income of $7 million in 2016. Included in Other income (expenses) - net in 2016 is an $11 million gain recorded on the disposition of assets in Europe.
Segment EBIT increased to $126 million in 2017, up from $112 million in 2016, primarily from higher margins and volumes in our Brazil business and increased volumes due to acquisitions in Argentina and Europe, partially offset by severance and other employee benefit costs related to our GCP and industrial productivity initiatives and acquisition related costs of $9 million.
34
Milling Products Segment— Milling products segment net sales decreased 4% to $1.6 billion in 2017. Higher volumes in the U.S. were primarily offset by weak macro-economic conditions and pressure from the record wheat crop in Brazil compared to 2016.
Cost of goods sold were $1.4 billion in 2017, aligned with 2016. Cost of goods sold in 2017 was impacted by $4 million of severance and other employee benefit costs related to industrial productivity initiatives and 2016 included a recovery of $14 million in Brazilian import taxes paid in prior years.
Gross profit decreased by 22% to $209 million in 2017, down from $269 million in 2016, primarily due to increased competition and competitive pricing in Brazil that reduced margins as well as an unfavorable product mix in Mexico.
SG&A expenses increased to $139 million in 2017 from $127 million, primarily due to the 9% appreciation of the Brazilian real against the U.S. dollar compared to 2016 and employee severance and other employee benefit costs related to our GCP.
Segment EBIT decreased to $63 million in 2017 from $131 million in 2016 as a result of lower gross profit driven by continued weak economic conditions and lower demand for higher value wheat products in Brazil and Mexico and severance and other employee benefit costs related to our GCP and other industrial productivity initiatives. In addition, 2016 included a recovery of $14 million in Brazilian import taxes paid in prior years.
Sugar and Bioenergy Segment— Sugar and Bioenergy segment net sales increased to $4.1 billion in 2017 compared to $3.7 billion in the same period last year. The 9% increase in sales was primarily driven by higher sugar sales volumes in our trading and distribution business and a 9% appreciation of the Brazilian real against the U.S. dollar which positively impacted domestic sales of sugar and ethanol in Brazil when converted into U.S. dollar.
Cost of goods sold increased 11% in 2017 compared to the same period 2016, primarily due to higher sales volumes and the appreciation of the Brazilian real compared to the U.S. dollar. Results for 2017 also included $21 million of severance and restructuring charges related to our industrial operations and $16 million of indirect tax credits.
Gross profit decreased to $99 million in 2017 from the $159 million reported in 2016. Higher sales volumes and $16 million related to indirect tax credits were more than offset by lower sugar and ethanol sales prices and $21 million in severance and restructuring charges.
SG&A expenses increased by 3% to $115 million in 2017 from $112 million in the comparable period 2016, primarily due to $4 million of severance and other employee benefit costs related to our GCP and the appreciation of the Brazilian real compared to the U.S. dollar
Foreign currency results in 2017 were $11 million compared to $9 million in the same period 2016. These results relate primarily to gains on foreign currency hedges.
Other income (expenses) - net was expense of $3 million in 2017, compared to expense of $16 million in 2016 related to results in our joint venture for the production of renewable oils in Brazil.
Segment EBIT decreased to a loss $12 million in 2017 from a loss of $4 million in 2016, as higher sugar sales volumes along with foreign currency gains and indirect tax credits were more than offset by lower sugar and ethanol sales prices, $22 million in severance and restructuring charges related to our industrial operations, and $4 million of severance and other employee benefit costs related to our GCP.
Fertilizer Segment— Fertilizer segment net sales increased to $406 million in 2017, compared to $403 million in 2016, primarily due to higher volumes in our Brazil port operations compared to 2016.
Cost of goods sold in 2017 were $381 million compared to $350 million in 2016. Cost of goods sold in 2017 included $13 million of severance and other employee benefit costs related to a production facility in Argentina. In addition, 2016 included a reversal of a natural gas tariff reserve of $11 million due to an Argentine Supreme court decision.
Gross profit decreased by $28 million to $25 million in 2017, from $53 million in the comparable period 2016. The decrease was primarily driven by lower margins in Argentina from higher raw material costs and severance and other employee benefit costs.
Segment EBIT decreased by $26 million to $3 million in 2017 from $29 million in the same period a year ago, higher volumes in our Brazil port operations were more than offset by lower margins in 2017 and $13 million of severance and other
35
employee benefit costs related to a production facility in Argentina. In addition, 2016 included a reversal of a natural gas tariff reserve of $11 million due to an Argentine Supreme court decision.
Interest—A summary of consolidated interest income and expense for the periods indicated follows:
Year Ended December 31, | ||||||||
(US$ in millions) | 2017 | 2016 | ||||||
Interest income | $ | 38 | $ | 51 | ||||
Interest expense | (263 | ) | (234 | ) | ||||
Interest income decreased by $13 million to $38 million in 2017 compared to $51 million in 2016, primarily related to lower average cash and cash equivalents balances. Interest expense increased $29 million to $263 million in 2017 from $234 million in 2016, primarily due to higher average debt balances, higher variable interest rates, and an increase in the duration of our debt portfolio.
Discontinued Operations— Income (loss) from discontinued operations (retail fertilizer business in Brazil) in 2017 was nil compared to a loss of $9 million in 2016. Recovery of bad debt provisions and interest received from customers in litigation offset ongoing administrative expenses and foreign currency losses.
2016 Compared to 2015
Net Income Attributable to Bunge—For the year ended December 31, 2016, net income attributable to Bunge of $745 million represents a decrease of $46 million from $791 million in 2015. This decline resulted primarily from a decrease in Total Segment EBIT of $105 million and reduced income from discontinued operations of $44 million, partially offset by lower income tax expenses of $76 million, lower net interest expense of $24 million and higher interest income of $8 million. Agribusiness Segment EBIT decreased by $233 million primarily due to lower gross profit driven by weaker results in our oilseed processing and grain origination businesses, trading and distribution activities and risk management contributions that were lower than the same period last year, partially offset by lower industrial and SG&A expenses. Results in 2016 benefitted from $120 million of gains on the disposition of equity interests of port and transshipment operations in Brazil and an oilseed crush facility in Vietnam and 2015 results included a $47 million gain on the sale of grain assets in Canada. The Agribusiness Segment EBIT decline was partially offset by an increase in EBIT across all other segments. Edible Oil Products Segment EBIT improved $53 million primarily due to improved results in Brazil and lower SG&A expense. Milling Products Segment EBIT improved $28 million primarily driven by increased gross profit in Brazil from stronger demand for flour in the food service industry, the contribution to results from a wheat mill acquired in the fourth quarter of 2015 and a recovery of $14 million in Brazilian wheat import taxes paid in prior years. Sugar and Bioenergy Segment EBIT improved $23 million primarily due to foreign currency gains, partly offset by restructuring and impairment charges. Fertilizer Segment EBIT improved $24 million primarily due to increased gross profit because of higher fertilizer sales in Argentina driven by higher fertilizer usage by farmers and the reversal of a gas tariff contingency from prior years totaling $11 million. Income tax expense decreased $76 million due to the effect of reduced taxable income and a lower effective tax rate in 2016 primarily due to geographical earnings mix and the net positive impact of certain income tax benefits and charges. Interest expense included the $26 million reversal of interest recorded in previous years in Brazil and Argentina. Discontinued operations results declined $44 million primarily driven by the translation impact of a stronger Brazilian real relative to the U.S. dollar in 2016.
Income Tax Expense—In the year ended December 31, 2016, income tax expense was $220 million compared to $296 million in 2015. The effective tax rate in 2016 was 22% compared to 28% in 2015. The lower effective tax rate in 2016 was primarily due to the favorable impact of refund claims in North America and Europe, along with favorable geographical earnings mix.
Agribusiness Segment—Agribusiness segment net sales decreased 4% to $30.1 billion in 2016 compared to $31.3 billion in 2015, with volumes being essentially flat. Volumes were lower in Brazil driven by reduced farmer selling and a reduced corn crop due to drought. In Asia-Pacific, volumes were lower in our oilseed processing businesses driven by weaker margins and in our trading and distribution businesses. These decreases were partially offset by higher volumes in grain origination in North America and Europe, which benefitted from larger crops and in Argentina as a result of normalized commercialization following the elimination on grain export taxes and the devaluation of the Argentine peso in December 2015.
Cost of goods sold decreased by 3% to $28.6 billion in 2016, compared with $29.4 billion last year in line with the reductions in net sales noted above. In addition, lower industrial costs due to the relative weakening of most currencies to the
36
U.S. dollar and certain insurance recovery benefits contributed to lower cost of goods sold in the year ended December 31, 2016 when compared to the same period last year.
Gross profit decreased 20% to $1,490 million, from $1,858 million in 2015, primarily driven by lower results in oilseed processing and grain origination and to a lesser extent in our trading and distribution businesses. In oilseeds, soy processing results in the United States, Brazil and Europe declined from a strong performance in 2015 due to lower crush margins. In grain origination, gross profit in Brazil significantly declined from strong performances in the same period last year, primarily due to slower farmer selling and lower margins. In trading and distribution, results declined primarily due to lower contribution from our risk management activities.
SG&A expenses were $706 million in 2016 compared to $851 million in 2015. This reduction was primarily driven by a reduction in headcount, cost-cutting initiatives, lower bad debt expenses and the result of the conversion of local currency costs into U.S. dollars as a result of the weakening of most global currencies relative to the U.S. dollar, with exception of the Brazilian real, which appreciated in 2016.
Foreign currency results in 2016 were a loss of $7 million, compared to gains of $67 million in 2015. These results were related primarily to results on certain currency hedges and the movements in the Brazilian real and Argentine peso.
Gains on the disposition of grain and oilseed assets were $120 million in 2016. The disposition of a 50% ownership interest in our Terfron port and transshipment terminal in Brazil to Amaggi Exportaçao E Importaçao Ltda. ("Amaggi") resulted in a $92 million gain and $2 million related losses recorded in foreign currency results. Additionally, the disposition of a 45% interest in our Vietnam crush operations to Wilmar International Limited ("Wilmar") resulted in a gain of $30 million. In 2015, a gain of $47 million was recorded on the sale of Canadian grain assets to G3 Canada Limited (formerly the Canadian Wheat Board).
Other income (expense)-net was income of $24 million and expense of $3 million for 2016 and 2015, respectively. The improvement in other income (expense)-net was primarily due to improvements in the results of certain non-consolidated equity investments, mostly in our logistics joint venture in Brazil.
Impairment and restructuring charges of $27 million in 2016 included an impairment charge of $15 million for BRI and $12 million for intangible assets related to aquaculture and other related patents.
Noncontrolling interests represent (income) loss attributed to the noncontrolling interest holders in joint venture operations that are consolidated in our financial statements. Noncontrolling interests generated income of $21 million in 2016 compared to income of $9 million in 2015. The increased 2016 income was primarily driven by our oilseed processing activities in Asia-Pacific and Europe partially offset by the deconsolidation of a Brazilian grain terminal, which reported income in 2015.
Segment EBIT decreased to $875 million in 2016 from $1,108 million in 2015, primarily driven by lower gross profit due to weaker crush margins that drove reduced soy processing results in the United States, Brazil and Spain, weaker softseed processing results in Europe, lower grain origination results in Brazil due to weaker farmer selling compared to a strong performance in 2015, and lower contributions from risk management. Foreign currency results reduced Segment EBIT by $74 million. The decrease was partially offset by $120 million pre-tax gains on the disposition of equity interests in Brazil and Vietnam and lower SG&A expenses. In 2015, we recorded a pre-tax gain of $47 million on the sale of certain grain assets in Canada.
Edible Oil Products Segment—Edible oil products segment net sales were $6.9 billion in 2016 compared to $6.7 billion in 2015. These higher sales are primarily due to a volume increase of 2% resulting from a higher market share of packaged oil products in Brazil, refined oils in Canada and the additional net sales derived from our acquisition of a 62.8% equity stake in Walter Rau Neusser in Germany.
Cost of goods sold increased 2% to $6.4 billion in 2016 from $6.3 billion in 2015. The higher costs were in line with the increase in net sales, as noted above. In 2015, cost of goods sold was negatively impacted by a $15 million impairment charge related to the closure of an edible oils packaging facility in the United States.
Gross profit increased 9% to $439 million in 2016 from $404 million in 2015. The increase was primarily driven by higher market share for packaged oils products in Brazil, stronger demand for refined oil in Canada and improved volumes and margins in India, partially offset by weaker margins in our margarines business in Europe. In addition, gross profit for 2015 was reduced by the $15 million impairment charge noted above.
SG&A expenses decreased to $320 million in 2016 from $328 million in 2015, primarily as a result of lower marketing expenses, savings from cost-cutting initiatives and the weakening of most currencies relative to the U.S. dollar, partly offset by the appreciation of the Brazilian real in 2016.
37
Goodwill and intangible impairments of $13 million in 2015 represent the full impairment of goodwill in our Brazilian tomato products business.
Segment EBIT increased by $53 million to $112 million in 2016, compared to $59 million in 2015. Gross profit improved due to increased market share in Brazil packaged oils, improved results in refined oil in Canada and India, and lower SG&A expenses. Additionally, 2015 included impairment charges related to the goodwill of the Brazil tomato products business and the closure of an edible oils packaging facility in the United States.
Milling Products Segment—Milling products segment net sales increased by 2% to $1,647 million in 2016 from $1,609 million in 2015, primarily from an 8% increase in volumes primarily as a result of our acquisition of the Moinho Pacifico wheat mill in Brazil, which occurred in the fourth quarter of 2015. In addition, sales increased in our rice and corn milling businesses in the United States, partially offset by volume decreases in Mexico. The net volume increase was mostly offset by the weakening of the Mexican peso by 18% against the U.S. dollar and lower selling prices of flour due to lower commodity prices in wheat, our primary raw material.
Cost of goods sold increased slightly to $1,378 million in 2016 from $1,372 million in 2015, primarily driven by volume increase, partially offset by lower commodity prices in wheat, and net foreign currency effects on local currency industrial costs, lower energy prices in the United States and a recovery of $14 million in Brazilian wheat import taxes paid in prior years.
Gross profit improved by $32 million to $269 million in 2016 from $237 million in 2015, primarily from higher volumes and improved unit margins in wheat milling products in Brazil, the incremental gross profit from the acquisition of the Moinho Pacifico wheat mill in Brazil, which occurred in the fourth quarter of 2015 and the recovery of $14 million in Brazilian import taxes paid in prior years. These increases were partially offset by lower gross profit in Mexico as volumes were lower in 2016 compared to 2015.
SG&A expenses increased to $127 million in 2016 from $123 million in 2015, mainly due to SG&A expenses related to the Moinho Pacifico wheat mill in Brazil, which we acquired in the fourth quarter of 2015. This increase was partially offset by the net translation benefit of the stronger Brazilian real and weaker Mexican peso on the translation of local currency expenses to U.S. dollars as well as benefits from our performance improvement initiatives to contain costs.
Segment EBIT increased to $131 million in 2016 from $103 million in 2015, primarily as a result of higher gross profit in Brazil due to higher volumes and improved margins, results from the Moinho Pacifico wheat mill, acquired in the fourth quarter of 2015 and a recovery of $14 million in Brazilian wheat import taxes paid in prior years.
Sugar and Bioenergy Segment—Sugar and Bioenergy segment net sales increased 6% to $3.7 billion in 2016 compared to $3.5 billion in 2015, as a result of higher average market prices of raw sugar and ethanol of 39% and 24%, respectively. The impact on sales of these price increases was partially offset by a decrease in volumes in our industrial operations due to the adverse weather in Brazil that reduced crushing volume and in our global trading and merchandising activities, where higher global sugar prices reduced demand. In addition, sales in our industrial operations in Brazil were lower driven by our commercial decision to carry less inventories into 2016 than we did in the previous year.
Cost of goods sold increased 7% to $3.6 billion in 2016 compared to $3.3 billion in 2015, in line with the sales increase noted above, primarily due to the increase in sugar and ethanol prices, partially offset by a decline in volumes.
Gross profit was $159 million in 2016 compared to $164 million in 2015. In 2016, higher sugar and ethanol prices in Brazil were partly offset by lower volumes, which drove per unit increases in sugar and ethanol industrial cost. Gross profit in 2015 benefitted from the classification of currency hedge losses reported separately in foreign currency gains and losses.
SG&A expenses were $112 million in 2016, 3% higher compared to $109 million in 2015, driven by increases in local currency costs in Brazil due to higher inflation, partially offset by lower personnel costs from cost-cutting initiative. In addition the appreciation of the Brazilian real, relative to the U.S. dollar resulted in higher expense when converted into U.S. dollar.
Foreign currency results in 2016 were gains of $9 million, compared to losses of $68 million in 2015. These results were related primarily to results on certain currency hedges.
Equity investment impairment charges of $44 million in 2016 included an impairment charge of our equity investment in Solazyme Bunge Renewable Oils ("SB Oils"), our joint venture that operates a commercial-scale algae oils facility adjacent to our Moema sugarcane mill in Brazil.
Segment EBIT improved by $23 million to a loss of $4 million in 2016, compared to a loss of $27 million in 2015 primarily due to improved results in our industrial operations and foreign currency gains on certain currency hedges partially offset by impairment of $44 million in SB Oils.
38
Fertilizer Segment—Fertilizer segment net sales increased 4% to $403 million in 2016 compared to $386 million in 2015, primarily due to an increase of 30% in volumes from higher nitrogen and phosphate fertilizer usage in Argentina as a result of expanded corn and wheat planting areas. The impact of higher sales was substantially offset by a decrease in global nitrogen, phosphate and single superphosphate prices. In 2015 volumes were impacted by a strike in one of our plants.
Cost of goods sold was $350 million in 2016, compared to $356 million in 2015 driven by lower industrial costs and lower costs from nitrogen, as we were required to import higher cost nitrogen last year due to the 2015 strike. This was partially offset by an increase in volumes in 2016. In addition, in 2016 we recorded a reversal of a natural gas tariff reserve of $11 million due to a recent Argentine Supreme Court decision finding the tariff invalid. We also recorded a $9 million impairment charge in 2016 on long lived assets related to a fertilizer production line in one of our plants in Argentina.
Gross profit increased to $53 million in 2016 from $30 million in 2015. The increase was primarily driven by improved gross profit in Argentina resulting from the increased usage of fertilizers by the Argentine farmer from planting a larger crop area, improved fertilizer unit margins and lower product costs. Gross profit in 2015 was impacted by a strike in one of our plants.
Segment EBIT improved by $24 million to $29 million in 2016 compared to $5 million in 2015, primarily due to improved gross profit driven by higher volumes and margins in Argentina.
Interest—A summary of consolidated interest income and expense for the periods indicated follows:
Year Ended December 31, | ||||||||
(US$ in millions) | 2016 | 2015 | ||||||
Interest income | $ | 51 | $ | 43 | ||||
Interest expense | (234 | ) | (258 | ) | ||||
Interest income increased by $8 million to $51 million in 2016 compared to $43 million in 2015, primarily due to higher average cash and cash equivalent balances held in certain Brazilian operating entities. Interest expense decreased $24 million to $234 million in 2016 from $258 million in 2015, primarily due to the reversal of previously recorded interest expense of $16 million for certain ICMS tax credits in Brazil that were recorded in 2014 and $10 million related to unpaid tariffs for natural gas in Argentina, which were found invalid by an Argentine Supreme Court ruling in 2016.
Discontinued Operations—Discontinued operations results in 2016 were a loss of $9 million, net of tax, compared to income of $35 million, net of tax, in 2015. Results declined in 2016 primarily due to cumulative translation adjustments, driven by the appreciation of the Brazilian real relative to the U.S. dollar.
Liquidity and Capital Resources
Liquidity
Our main financial objectives are to prudently manage financial risks, ensure consistent access to liquidity and minimize cost of capital in order to efficiently finance our business and maintain balance sheet strength. We generally finance our ongoing operations with cash flows generated from operations, issuance of commercial paper, borrowings under various bilateral and syndicated revolving credit facilities, term loans and proceeds from the issuance of senior notes. Acquisitions and long-lived assets are generally financed with a combination of equity and long-term debt.
Our current ratio, which is a widely used measure of liquidity and is defined as current assets divided by current liabilities, was 1.67 and 1.44 at December 31, 2017 and 2016, respectively.
Cash and Cash Equivalents—Cash and cash equivalents were $601 million at December 31, 2017 and $934 million at December 31, 2016. Cash balances are managed in accordance with our investment policy, the objectives of which are to preserve the principal value of our cash assets, maintain a high degree of liquidity and deliver competitive returns subject to prevailing market conditions. Cash balances are invested in short-term deposits with highly rated financial institutions and in U.S. government securities.
Readily Marketable Inventories ("RMI")—RMI are agricultural commodity inventories, such as soybeans, soybean meal, soybean oil, corn, wheat, and sugar that are readily convertible to cash because of their commodity characteristics, widely available markets and international pricing mechanisms. RMI in our Agribusiness segment are reported at fair value and were $3,865 million at December 31, 2017 and $3,593 million at December 31, 2016. Of these amounts $2,694 million and $2,523 million were attributable to merchandising activities at December 31, 2017 and December 31, 2016, respectively. RMI at fair value in the aggregate amount of $115 million and $123 million at December 31, 2017 and December 31, 2016, respectively,
39
were included in our Edible Oil Products segment inventories. The Sugar and Bioenergy segment included RMI of $76 million and $139 million at December 31, 2017 and December 31, 2016, respectively. Of these amounts, $73 million and $134 million were attributable to merchandising activities at December 31, 2017 and December 31, 2016, respectively.
Financing Arrangements and Outstanding Indebtedness—We conduct most of our financing activities through a centralized financing structure that provides the company efficient access to debt and capital markets. This structure includes a master trust, the primary assets of which consist of intercompany loans made to Bunge Limited and its subsidiaries. Certain of Bunge Limited's 100% owned finance subsidiaries, Bunge Limited Finance Corp., Bunge Finance Europe B.V. and Bunge Asset Funding Corp., fund the master trust with short and long-term debt obtained from third parties, including through our commercial paper program and certain credit facilities, as well as the issuance of senior notes. Borrowings by these finance subsidiaries carry full, unconditional guarantees by Bunge Limited.
Revolving Credit Facilities—At December 31, 2017, we had $5,015 million of aggregate committed borrowing capacity under our commercial paper program and various revolving bilateral and syndicated credit facilities, of which all was unused and available. The following table summarizes these facilities as of the periods presented:
Total Committed Capacity | Borrowings Outstanding | |||||||||||||
Commercial Paper Program and Revolving Credit Facilities | Maturities | December 31, 2017 | December 31, 2017 | December 31, 2016 | ||||||||||
Commercial Paper | 2019 | $ | 600 | $ | — | $ | — | |||||||
Long-Term Revolving Credit Facilities (1) | 2019 - 2022 | 4,415 | — | — | ||||||||||
Total | $ | 5,015 | $ | — | $ | — | ||||||||
(1) | Borrowings under the revolving credit facilities that have maturities greater than one year from the date of the consolidated balance sheets are classified as long-term debt, consistent with the long-term maturity of the underlying facilities. However, individual borrowings under the revolving credit facilities are generally short-term in nature, bear interest at variable rates and can be repaid or renewed as each such individual borrowing matures. |
On December 12, 2017, Bunge entered into an amendment agreement to its unsecured $1,750 million Amended and Restated Revolving Credit Facility, dated as of March 17, 2014 and amended as of August 10, 2015 (the “Revolving Credit Facility”). The amendment agreement extends the maturity date of the Revolving Credit Facility to December 12, 2020. The amendment agreement also lowers the range of margin applicable to Bunge’s borrowings under the Revolving Credit Facility. Borrowings under the Revolving Credit Facility will bear interest at LIBOR plus a margin, which will vary from 0.30% to 1.30% per annum, based on the credit ratings of Bunge's senior long-term unsecured debt. Amounts under the Revolving Credit Facility that remain undrawn are subject to a commitment fee payable quarterly based on the average undrawn portion of the Revolving Credit Facility at a rate of 35% of the margin specified above, based on the credit ratings of Bunge’s senior long-term unsecured debt. Bunge also will pay a fee that will vary from 0.10% to 0.40% based on the utilization of the Revolving Credit Facility. Bunge may from time to time, with the consent of the facility agent, request one or more of the existing lenders or new lenders to increase the total commitments in an amount not to exceed $250 million pursuant to an accordion provision. Bunge has the option to request an extension of the maturity date of the Facility for two additional one-year periods. Each lender in its sole discretion may agree to any such extension request. Bunge had no borrowings outstanding at December 31, 2017 under the Revolving Credit Facility.
On September 6, 2017, Bunge entered into an amendment agreement to its unsecured $865 million Amended and Restated Credit Agreement, dated as of June 17, 2014 (the “Credit Agreement”). The amendment agreement extends the maturity date of the Credit Agreement to September 6, 2022. The amendment agreement also lowers the range of margin applicable to Bunge’s borrowings under the Credit Agreement. Borrowings under the Credit Agreement will bear interest at LIBOR plus a margin, which will vary from 1.00% to 1.75% per annum, based on the credit ratings of Bunge's senior long-term unsecured debt. Amounts under the Credit Agreement that remain undrawn are subject to a commitment fee payable quarterly based on the average undrawn portion of the Credit Agreement at rates ranging from 0.125% to 0.275%, based on the credit ratings of Bunge’s senior long-term unsecured debt. Bunge had no borrowings outstanding at December 31, 2017 under the Credit Agreement.
We had no borrowings outstanding at December 31, 2017 under our three-year unsecured bilateral revolving credit facilities (the “Facilities”) totaling $700 million, which are maturing at various dates in June and September, 2019. Borrowings under these Facilities bear interest at LIBOR plus a margin, which will vary from 0.65% to 1.40% per annum based on the
40
credit ratings of our senior long-term unsecured debt. Amounts under the Facilities that remain undrawn are subject to a commitment fee payable at a rate ranging from 0.20% to 0.25%.
We had no borrowings outstanding at December 31, 2017 under our $1,100 million five-year unsecured syndicated revolving credit agreement (the ‘‘Revolving Credit Agreement’’) with certain lenders party thereto, maturing November 20, 2019. Borrowings under the Revolving Credit Agreement bear interest at LIBOR plus a margin, which will vary from 1.00% to 1.75% per annum based on the credit ratings of our senior long-term unsecured debt (‘‘Rating Level’’). Amounts under the Revolving Credit Agreement that remain undrawn are subject to a commitment fee ranging from 0.10% to 0.25%, varying based on the Rating Level.
Our commercial paper program is supported by committed back-up bank credit lines (the ‘‘Liquidity Facility’’) equal to the amount of the commercial paper program provided by lending institutions that are required to be rated at least A-1 by Standard & Poor’s and P-1 by Moody’s Investor Services. The cost of borrowing under the Liquidity Facility would typically be higher than the cost of issuance under our commercial paper program. At December 31, 2017, no borrowings were outstanding under the commercial paper program and no borrowings outstanding under the Liquidity Facility. The Liquidity Facility is our only revolving credit facility that requires lenders to maintain minimum credit ratings.
In addition to committed credit facilities, from time to time, we, through our financing subsidiaries, enter into bilateral short-term credit lines as necessary based on our financing requirements. At December 31, 2017 there were no borrowings outstanding under these bilateral short-term credit lines.
Short and long-term debt—Our short and long-term debt increased by $215 million at December 31, 2017 from December 31, 2016, primarily due to an increase in working capital requirements in the latter part of the year. For the year ended December 31, 2017, our average short and long-term debt outstanding was approximately $5,455 million compared to approximately $5,201 million for the year ended December 31, 2016, primarily due to higher average working capital financing requirements, driven by higher average global commodity prices. Our long-term debt outstanding balance was $4,175 million at December 31, 2017 compared to $4,007 million at December 31, 2016. The following table summarizes our short-term debt activity at December 31, 2017.
(US$ in millions) | Outstanding Balance at December 31, 2017 | Weighted Average Interest Rate at December 31, 2017 (1) | Highest Balance Outstanding During 2017 (1) | Average Balance During 2017 (1) | Weighted Average Interest Rate During 2017 (1) | |||||||||||||
Bank Borrowings | $ | 304 | 9.84 | % | $ | 1,450 | $ | 880 | 4.09 | % | ||||||||
Commercial Paper | — | — | 595 | 252 | 1.28 | % | ||||||||||||
Total | $ | 304 | 9.84 | % | $ | 2,045 | $ | 1,132 | 3.47 | % | ||||||||
(1) | Includes $179 million of local currency borrowings in certain Central and Eastern European, South American, South African and Asia-Pacific countries at a weighted average interest rate of 15.03% as of December 31, 2017. |
In connection with Bunge entering into a definitive agreement to acquire a 70% ownership interest in IOI Loders Croklaan from IOI Corporation Berhad (the “Loders Acquisition”), on September 12, 2017, we entered into an unsecured $900 million term loan agreement. Following the completion of the offering of senior notes described below, effective as of September 25, 2017, we terminated the loan agreement. No funds had been drawn under the loan agreement as of the date of termination.
On September 25, 2017, we completed the sale and issuance of $400 million aggregate principal amount of 3.00% unsecured senior notes due September 25, 2022 and $600 million aggregate principal amount of 3.75% unsecured senior notes due September 25, 2027. The senior notes are fully and unconditionally guaranteed by Bunge Limited. The offering was made pursuant to a registration statement filed with the U.S. Securities and Exchange Commission. Interest on the senior notes is payable semi-annually in arrears in March and September of each year, commencing on March 25, 2018. The net proceeds of the offering were approximately $989 million after deducting underwriting commissions and offering expenses. We intend to use the net proceeds from this offering to fund the purchase price for the Loders Acquisition. Pending the closing of the Loders Acquisition, the net proceeds from the offering were used to repay outstanding indebtedness of Bunge.
41
The following table summarizes our short and long-term debt:
December 31, | ||||||||
(US$ in millions) | 2017 | 2016 | ||||||
Short-term debt: (1) | ||||||||
Short-term debt (2) | $ | 304 | $ | 257 | ||||
Current portion of long-term debt | 15 | 938 | ||||||
Total short-term debt | 319 | 1,195 | ||||||
Long-term debt: | ||||||||
Term loan due 2019—three-month Yen LIBOR plus 0.75% (Tranche A) | 253 | 243 | ||||||
Term loan due 2019—fixed Yen interest rate of 0.96% (Tranche B) | 53 | 51 | ||||||
Term loan due 2019—three-month LIBOR plus 1.30% (Tranche C) | 85 | 85 | ||||||
5.90% Senior Notes due 2017 | — | 250 | ||||||
3.20% Senior Notes due 2017 | — | 600 | ||||||
8.50% Senior Notes due 2019 | 599 | 600 | ||||||
3.50% Senior Notes due 2020 | 497 | 497 | ||||||
3.00% Senior Notes due 2022 | 396 | — | ||||||
1.85% Senior Notes due 2023—Euro | 960 | 843 | ||||||
3.25% Senior Notes due 2026 | 694 | 694 | ||||||
3.75% Senior Notes due 2027 | 593 | — | ||||||
Other | 45 | 144 | ||||||
Subtotal | 4,175 | 4,007 | ||||||
Less: Current portion of long-term debt | (15 | ) | (938 | ) | ||||
Total long-term debt (3) | 4,160 | 3,069 | ||||||
Total debt | $ | 4,479 | $ | 4,264 | ||||
(1) | Includes secured debt of $5 million and $7 million at December 31, 2017 and December 31, 2016, respectively. |
(2) | Includes $179 million and $148 million of local currency borrowings in certain Central and Eastern European, South American, African and Asia-Pacific countries at a weighted average interest rate of 15.03% and 13.63% as of December 31, 2017 and December 31, 2016, respectively. |
(3) | Includes secured debt of $24 million and $34 million at December 31, 2017 and December 31, 2016, respectively. |
Credit Ratings—Bunge's debt ratings and outlook by major credit rating agencies at December 31, 2017 were as follows:
Short-term Debt(1) | Long-term Debt | Outlook | |||
Standard & Poor's | A-1 | BBB | Stable | ||
Moody's | P-1 | Baa2 | Negative | ||
Fitch | F1 | BBB | Negative | ||
(1) | Short-term rating applies only to Bunge Asset Funding Corp., the issuer under our commercial paper program. |
Our debt agreements do not have any credit rating downgrade triggers that would accelerate maturity of our debt. However, credit rating downgrades would increase our borrowing costs under our syndicated credit facilities and, depending on their severity, could impede our ability to obtain credit facilities or access the capital markets in the future on competitive terms. A significant increase in our borrowing costs could impair our ability to compete effectively in our business relative to competitors with higher credit ratings.
Our credit facilities and certain senior notes require us to comply with specified financial covenants, including minimum net worth, minimum current ratio, a maximum debt to capitalization ratio, and limitations on secured indebtedness. We were in compliance with these covenants as of December 31, 2017.
42
Trade Receivable Securitization Program—We initially entered into our trade receivable securitization program (the "Program") in June 2011, which provides us with an additional source of liquidity. On May 26, 2016, Bunge and certain of its subsidiaries renewed and amended its $700 million trade receivables securitization program, which terminates on May 26, 2021. However, each committed purchaser's commitment to fund trade receivables sold under the Program will terminate on May 26, 2019 unless extended in accordance with the terms of the receivables transfer agreement.
At December 31, 2017 and 2016, $810 million and $628 million, respectively, of receivables sold under the Program were derecognized from our consolidated balance sheets. Proceeds received in cash related to transfers of receivables under the Program totaled $9,734 million and $9,197 million for the years ended December 31, 2017 and 2016, respectively. In addition, cash collections from customers on receivables previously sold were $9,659 million and $9,176 million for the years ended December 31, 2017 and 2016, respectively. As this is a revolving facility, cash collections from customers are reinvested to fund new receivable sales. Gross receivables sold under the Program for the years ended December 31, 2017 and 2016 were $10,022 million and $9,405 million, respectively. These sales resulted in discounts of $9 million for the year ended December 31, 2017, $6 million for the year ended December 31, 2016 and $5 million for the year ended December 31, 2015, which were included in SG&A in the consolidated statements of income. Servicing fees under the Program were not significant in any period.
Our risk of loss following the sale of the trade receivables is limited to the deferred purchase price receivable ("DPP"), which at December 31, 2017 and 2016 had a fair value of $107 million and $87 million, respectively, and is included in other current assets in our consolidated balance sheets (see Note 18 to our consolidated financial statements). The DPP will be repaid in cash as receivables are collected, generally within 30 days. Delinquencies and credit losses on trade receivables sold under the Program during the years ended December 31, 2017, 2016 and 2015 were insignificant. We have reflected all cash flows under the Program as operating cash flows in the consolidated statements of cash flows for the years ended December 31, 2017 and 2016.
Interest Rate Swap Agreements—We may use interest rate swaps as hedging instruments and record the swaps at fair value in the consolidated balance sheets with changes in fair value recorded contemporaneously in earnings. Additionally, the carrying amount of the associated debt is adjusted through earnings for changes in the fair value due to changes in benchmark interest rates.
Equity—Total equity is set forth in the following table:
December 31, | ||||||||
(US$ in millions) | 2017 | 2016 | ||||||
Convertible perpetual preference shares | $ | 690 | $ | 690 | ||||
Common shares | 1 | 1 | ||||||
Additional paid-in capital | 5,226 | 5,143 | ||||||
Retained earnings | 8,081 | 8,208 | ||||||
Accumulated other comprehensive income | (5,930 | ) | (5,978 | ) | ||||
Treasury shares, at cost (2017 and 2016—12,882,313) | (920 | ) | (920 | ) | ||||
Total Bunge shareholders' equity | 7,148 | 7,144 | ||||||
Noncontrolling interests | 209 | 199 | ||||||
Total equity | $ | 7,357 | $ | 7,343 | ||||
Total Bunge shareholders' equity increased to $7,148 million at December 31, 2017 from $7,144 million at December 31, 2016. Net income attributable to Bunge for the year ended December 31, 2017 of $160 million and cumulative translation gains of $187 million were offset mainly by dividends paid to common and preferred shareholders of $247 million and $34 million, respectively.
Noncontrolling interest increased to $209 million at December 31, 2017 from $199 million at December 31, 2016 primarily due to income attributable to our noncontrolling interest entities and the effects of currency translation, partially offset by dividends paid to non-controlling interest holders.
At December 31, 2017, we had 6,899,700 4.875% cumulative convertible perpetual preference shares outstanding with an aggregate liquidation preference of $690 million. Each convertible perpetual preference share has an initial liquidation preference of $100, which will be adjusted for any accumulated and unpaid dividends. The convertible perpetual preference shares carry an annual dividend of $4.875 per share payable quarterly. As a result of adjustments made to the initial conversion price because cash dividends paid on Bunge Limited's common shares exceeded certain specified thresholds, each convertible perpetual preference share is convertible, at the holder's option, at any time into 1.1693 Bunge Limited common shares, based
43
on the conversion price of $85.5238 per share, subject to certain additional anti-dilution adjustments (which represents 8,067,819 Bunge Limited common shares at December 31, 2017). At any time, if the closing price of our common shares equals or exceeds 130% of the conversion price for 20 trading days during any consecutive 30 trading days (including the last trading day of such period), we may elect to cause the convertible perpetual preference shares to be automatically converted into Bunge Limited common shares at the then-prevailing conversion price. The convertible perpetual preference shares are not redeemable by us at any time.
Cash Flows
Our cash flow from operations varies depending on, among other items, the market prices and timing of the purchase and sale of our inventories. Generally, during periods when commodity prices are rising, our Agribusiness operations require increased use of cash to support working capital to acquire inventories and fund daily settlement requirements on exchange traded futures that we use to minimize price risk related to our inventories.
2017 Compared to 2016—In 2017, our cash and cash equivalents decreased by $333 million, compared to an increase of $523 million in 2016.
Cash provided by our operating activities was $1,006 million for the year ended December 31, 2017 compared to $1,904 million for the year ended December 31, 2016. Net cash inflows from operating activities was lower for the year ended December 31, 2017, primarily due to lower net income, including adjustments for non-cash items, and increased working capital needs compared to the year ended December 31, 2016.
Certain of our non-U.S. operating subsidiaries are primarily funded with U.S. dollar-denominated debt, while currency risk is hedged with U.S. dollar denominated assets. The functional currency of our operating subsidiaries is generally the local currency. In addition, certain of our U.S. dollar functional operating subsidiaries outside the United States are partially funded with local currency borrowings, while the currency risk is hedged with local currency denominated assets. The financial statements of our subsidiaries are calculated in the functional currency, and when the local currency is the functional currency, translated into U.S. dollars. U.S. dollar-denominated loans are remeasured into their respective functional currencies at exchange rates at the applicable balance sheet date. Local currency loans are remeasured into U.S. dollars at the exchange rate at the applicable balance sheet date. The resulting gain or loss is included in our consolidated statements of income as foreign currency gains or losses. For the years ended December 31, 2017 and December 31, 2016, we recorded foreign currency losses of $21 million and losses of $80 million, respectively, which were included as adjustments to reconcile net income to cash used for operating activities in the line item "Foreign currency loss (gain) on debt" in our consolidated statements of cash flows. This adjustment is required because the cash flow impacts of these gains or losses are non-cash items and will represent financing activities when the subsidiary repays the underlying debt and therefore, have no impact on cash flows from operations.
Cash used for investing activities was $1,162 million for the year ended December 31, 2017 compared to $926 million for the year ended December 31, 2016. During 2017, payments made for capital expenditures of $662 million were primarily related to the upgrade and expansion of an export terminal in the U.S., replanting of sugarcane for our industrial sugar business, the expansion of a crushing facility in Brazil and the upgrade of our crush facility in Italy. In addition, we acquired two oilseed processing plants in the Netherlands and France for $318 million, an edible oils business in Argentina for $26 million and an olive oil and seed oil producer in Turkey for $23 million, net of cash acquired. We had cash outflows related to settlements of net investment hedges of $20 million in the year ended December 31, 2017, primarily driven by the appreciation of the Brazilian real relative to the US dollar in 2017. Proceeds from and payments for investments included primarily purchases and sales of short-term investments. During 2017, investments in affiliates included additional investments primarily in our G3, SB Oils and Tapajos joint ventures, as well as the acquisition of a non-controlling stake in Agricola Alvorada, a Brazilian agribusiness company. During 2016, $784 million of capital expenditures were primarily related to replanting of sugarcane and maintenance and improvements for our industrial sugar business in Brazil, upgrade and expansion of an export terminal in the United States, construction of a wheat milling facility in Brazil, the expansion of a port facility in Ukraine and the construction of oilseed processing plants in Ukraine and Asia-Pacific. In addition, we acquired a controlling interest in Walter Rau Neusser, a vegetable oil blends producer for large-scale commercial customers, based in Germany, for $34 million. In the year ended December 31, 2016, we had cash outflows related to settlements of net investment hedges of $375 million. Proceeds from and payments for investments included primarily purchases and sales of certain marketable securities and other short term investments. Investments in affiliates in 2016 included additional investments in SB Oils and G3.
Cash used for financing activities was $180 million in the year ended December 31, 2017, compared to $488 million for the year ended December 31, 2016. Dividends paid to our common shareholders, holders of our convertible preference shares and non-controlling interests were $297 million and $282 million for the years ended December 31, 2017 and 2016, respectively. In connection with our common share repurchase program, in 2017, we did not repurchase common shares and in 2016, we purchased 3,296,230 of our common shares at a cost of $200 million.
44
2016 Compared to 2015—In 2016, our cash and cash equivalents increased by $523 million. For the year ended December 31, 2015, our cash and cash equivalents increased by $49 million.
Cash provided by our operating activities was $1,904 million for the year ended December 31, 2016 compared to $610 million for the year ended December 31, 2015. Net cash inflows from operating activities for the years ended December 31, 2016 and 2015, were principally due to net income, including adjustments for non-cash items, and a decrease in the use of cash for net operating assets and liabilities. In 2016, higher prices for sugar and the soybean complex, together with essentially flat volumes resulted in higher working capital needs, however this was more than offset by initiatives to reduce working capital and an appreciation of the Brazilian real relative to the U.S. dollar, which mostly impacted trade accounts payable in our Brazilian operations. In 2015, the increase in net operating assets and liabilities was primarily due to increases in secured advances to farmers in South America, who were motivated to sell their record level crops as the Brazilian real and Argentine peso depreciated relative to the U.S. dollar. For the years ended December 31, 2016 and December 31, 2015, we recorded foreign currency losses of $80 million and gains of $213 million, respectively, which were included as adjustments to reconcile net income to cash used for operating activities in the line item "foreign currency loss (gain) on debt" in our consolidated statements of cash flows.
Cash used for investing activities was $926 million for the year ended December 31, 2016 compared to $802 million for the year ended December 31, 2015. During 2016, payments made for capital expenditures of $784 million, compared to $649 million during 2015, were primarily related to replanting of sugarcane and maintenance and improvements for our industrial sugar business in Brazil, upgrade and expansion of an export terminal in the United States, construction of a wheat milling facility in Brazil, the expansion of a port facility in Ukraine and the construction of oilseed processing plants in Ukraine and Asia-Pacific. In addition, we acquired, for $34 million, Walter Rau Neusser, a vegetable oil blends producer for large-scale commercial customers, based in Germany. In the year ended December 31, 2015, we paid $347 million for the acquisitions of businesses, net of cash acquired. In the year ended December 31, 2016, we had cash outflows related to settlements of net investment hedges of $375 million, primarily driven by the appreciation of the Brazilian real relative to the US dollar in 2016, compared to cash inflows of $203 million in the year ended December 31, 2015. Proceeds from disposition of investment in affiliates included $145 million and $33 million for the disposition of equity interests of operations in Brazil and Vietnam, respectively. In addition, we sold 10% of our minority share in G3 Global Holdings GP Inc. ("G3") for net proceeds of $37 million to our joint venture partner, Saudi Agricultural and Livestock Investment Company (or SALIC). Proceeds from and payments for investments for both years 2016 and 2015 included primarily purchases and sales of certain marketable securities and other short term investments. Investments in affiliates in 2016 included additional investments in SB Oils, our joint venture with TerraVia Holdings Inc. to produce renewable oils in Brazil and G3.
Cash used for financing activities was $488 million in the year ended December 31, 2016, compared to cash provided by financing activities of $360 million for the year ended December 31, 2015. The cash used for financing activities is primarily reflecting lower working capital needs, partially offset by an increase of cash used for investing activities. Dividends paid to our common shareholders and holders of our convertible preference shares were $257 million and $241 million, for the years ended December 31, 2016 and 2015, respectively. In connection with our common share repurchase program, in 2016, we purchased 3,296,230 of our common shares at a cost of $200 million and in 2015, we purchased 3,871,810 of our common shares at a cost of $300 million. In the year ended December 31, 2016, we paid $25 million of dividends to non-controlling interest holders and $39 million for the acquisition of the non-controlling interest of a joint venture in Europe.
Brazilian Farmer Credit
Background—We advance collateralized funds to counter parties (farmers and crop resellers), primarily in Brazil, to secure mostly soybean origination for our soybean processing facilities. These activities are generally intended to be short-term in nature. The ability of our counter parties (farmers and crop resellers) to repay these amounts is affected by agricultural economic conditions in the relevant geography, which are, in turn, affected by commodity prices, currency exchange rates, crop input costs and crop quality and yields. As a result, these arrangements are typically secured, including by a farmer's crop and, in many cases, land and other assets. In the event of counter party default, we generally initiate legal proceedings to recover the defaulted amounts. However, the legal recovery process through the judicial system is a long-term process, generally spanning a number of years. Additionally, we may seek to renegotiate certain terms of our contract with the defaulting supplier in order to accelerate recovery of amounts owed.
Because Brazilian farmer credit exposures are denominated in local currency, reported values are impacted by movements in the value of the Brazilian real when translated into U.S. dollars. From December 31, 2016 to December 31, 2017, the Brazilian real depreciated by approximately 1.5%, decreasing the reported farmer credit exposure balances when translated into U.S. dollars.
We periodically evaluate the collectability of our farmer receivables and record allowances if we determine that collection is doubtful. We base our determination of the allowance on analyses of credit quality of individual accounts,
45
considering also the economic and financial condition of the farming industry and other market conditions as well as the value of any collateral related to amounts owed. We continuously review defaulted farmer receivables for impairment on an individual account basis. We consider all accounts in legal collections processes to be defaulted and past due. For such accounts, we determine the allowance for uncollectible amounts based on the fair value of the associated collateral, net of estimated costs to sell. For all renegotiated accounts (current and past due), we consider changes in farm economic conditions and other market conditions, our historical experience related to renegotiated accounts and the fair value of collateral in determining the allowance for doubtful accounts.
Secured Advances to Suppliers and Prepaid Commodity Contracts—We purchase soybeans through prepaid commodity purchase contracts (advance cash payments to suppliers against contractual obligations to deliver specified quantities of soybeans in the future) and secured advances to suppliers (advances to suppliers against commitments to deliver soybeans in the future), primarily in Brazil. These financing arrangements are typically secured by the farmer's future crop and mortgages on the farmer's land, buildings and equipment, and are generally settled after the farmer's crop is harvested and sold.
Interest earned on secured advances to suppliers of $44 million, $38 million and $38 million for the years ended December 31, 2017, 2016 and 2015, respectively, is included in net sales in the consolidated statements of income.
The table below shows details of prepaid commodity contracts and secured advances to suppliers outstanding at our Brazilian operations as of the dates indicated. See Notes 6 and 12 of the notes to our consolidated financial statements for more information.
December 31, | ||||||||
(US$ in millions) | 2017 | 2016 | ||||||
Prepaid commodity contracts | $ | 216 | $ | 189 | ||||
Secured advances to suppliers (current) | 406 | 593 | ||||||
Total (current) | 622 | 782 | ||||||
Commodities not yet priced(1) | (46 | ) | (26 | ) | ||||
Net | 576 | 756 | ||||||
Secured advances to suppliers (non-current) | 195 | 184 | ||||||
Total (current and non-current) | 771 | 940 | ||||||
Allowance for uncollectible amounts (current and non-current) | $ | (65 | ) | $ | (53 | ) | ||
(1) | Commodities delivered by suppliers that are yet to be priced are reflected at prevailing market prices at December 31, 2017 and December 31, 2016, respectively. |
Capital Expenditures
Our cash payments made for capital expenditures were $662 million, $784 million and $649 million for the years ended December 31, 2017, 2016 and 2015, respectively. We intend to make capital expenditures of approximately $650 million in 2018. Our priorities for 2018 capital expenditures are growth, maintenance, compliance and productivity projects first (where we expect to use approximately 80% of our funds allocated to capital expenditures), followed by projects related to sugar planting and associated maintenance. We intend to fund these capital expenditures primarily with cash flows from operations.
Off-Balance Sheet Arrangements
Guarantees
We have issued or were party to the following guarantees at December 31, 2017:
(US$ in millions) | Maximum Potential Future Payments | |||
Unconsolidated affiliates guarantee (1)(2) | $ | 215 | ||
Residual value guarantee (3) | 269 | |||
Total | $ | 484 | ||
46
(1) | We issued guarantees to certain financial institutions related to debt of certain of our unconsolidated affiliates. The terms of the guarantees are equal to the terms of the related financings which have maturity dates in 2017 through 2034. There are no recourse provisions or collateral that would enable us to recover any amounts paid under these guarantees. At December 31, 2017, we recorded no obligation related to these guarantees. |
(2) | We issued guarantees to certain third parties related to performance of our unconsolidated affiliates. The terms of the guarantees are equal to the completion date of a port terminal which is expected to be completed in 2020. There are no recourse provisions or collateral that would enable us to recover any amounts paid under these guarantees. At December 31, 2017, we recorded no obligation related to these guarantees. |
(3) | We issued guarantees to certain financial institutions which are party to certain operating lease arrangements for railcars and barges. These guarantees provide for a minimum residual value to be received by the lessor at conclusion of the lease term. These leases expire at various dates from 2019 through 2024. At December 31, 2017, our recorded obligation related to these guarantees was $2 million. |
We have provided a Guaranty to the Director of the Illinois Department of Agriculture as Trustee for Bunge North America, Inc. ("BNA"), an indirect wholly-owned subsidiary, which guarantees all amounts due and owing by BNA, to grain producers and/or depositors in the State of Illinois who have delivered commodities to BNA's Illinois facilities.
In addition, we have provided full and unconditional parent level guarantees of the outstanding indebtedness under certain credit facilities entered into and senior notes issued by, our subsidiaries. At December 31, 2017, our consolidated balance sheet includes debt with a carrying amount of $4,249 million related to these guarantees. This debt includes the senior notes issued by three of our 100% owned finance subsidiaries, Bunge Limited Finance Corp., Bunge Finance Europe B.V. and Bunge N.A. Finance L.P. There are largely no restrictions on the ability of Bunge Limited Finance Corp., Bunge Finance Europe B.V. and Bunge N.A. Finance L.P. or any other Bunge subsidiary to transfer funds to Bunge Limited.
Contractual Obligations
The following table summarizes our scheduled contractual obligations and their expected maturities at December 31, 2017, and the effect such obligations are expected to have on our liquidity and cash flows in the future periods indicated.
Payments due by period | ||||||||||||||||||||
(US$ in millions) | Total | 2018 | 2019 - 2020 | 2021 - 2022 | 2023 and thereafter | |||||||||||||||
Short-term debt | $ | 304 | $ | 304 | $ | — | $ | — | $ | — | ||||||||||
Long-term debt(1) | 4,225 | 18 | 1,526 | 422 | 2,259 | |||||||||||||||
Variable interest rate obligations | 10 | 5 | 5 | — | — | |||||||||||||||
Interest obligations on fixed rate debt | 706 | 148 | 212 | 148 | 198 | |||||||||||||||
Non-cancelable lease obligations(2) | 874 | 205 | 392 | 170 | 107 | |||||||||||||||
Capital commitments | 38 | 36 | 2 | — | — | |||||||||||||||
Freight supply agreements(3) | 708 | 230 | 190 | 169 | 119 | |||||||||||||||
Inventory purchase commitments | 20 | 20 | — | — | — | |||||||||||||||
Power supply purchase commitments | 96 | 83 | 13 | — | — | |||||||||||||||
Total contractual cash obligations(4)(5) | $ | 6,981 | $ | 1,049 | $ | 2,340 | $ | 909 | $ | 2,683 | ||||||||||
(1) | Excludes components of long-term debt attributable to fair value hedge accounting of $31 million and deferred financing fees and unamortized premiums of $19 million. |
(2) | Represents future minimum payments under non-cancelable leases with initial or remaining terms of one year or more. |
(3) | In the ordinary course of business, we enter into purchase commitments for time on ocean freight vessels and freight service on railroad lines for the purpose of transporting agricultural commodities. In addition, we sell time on these ocean freight vessels when excess freight capacity is available. Payments to be received by us under such re-let agreements are anticipated to be approximately $15 million in 2018. These agreements range from two months to approximately seven years in the case of ocean freight vessels and 5 to 9 years in the case of railroad services. Actual amounts paid under these contracts may differ due to the variable components of these agreements and the amount of income earned by us on the sale of excess capacity. The railroad freight services agreements require a minimum monthly payment regardless of the actual level of freight services used by us. The costs of our freight supply agreements are typically passed through to our customers as a component of the prices we charge for our products. However, changes in the market value of freight compared to the rates at which we have contracted for freight may affect margins on the sales of agricultural commodities. |
47
(4) | Does not include estimated payments of liabilities associated with uncertain income tax positions. As of December 31, 2017, Bunge had tax liabilities of $106 million, including interest and penalties. At this time, we are unable to make a reasonably reliable estimate of the timing of payments in individual years in connection with these tax liabilities; therefore, such amounts are not included in the above contractual obligation table. See Note 14 to our consolidated financial statements. |
(5) | Does not include obligations for pension and postretirement benefits for which we expect to make employer contributions of $22 million in 2018. We also expect to make a significant contribution to our plans in future years. |
In addition, we have entered into partnership agreements for the production of sugarcane. These agreements have an average remaining life of four years and cover approximately 225,000 hectares of land under cultivation. Amounts owed under these agreements are dependent on several variables including the quantity of sugarcane produced per hectare, the total recoverable sugar ("ATR") per ton of sugarcane produced and the price for each kilogram of ATR as determined by Consecana, the São Paulo state sugarcane, sugar and ethanol council. During the years ended December 31, 2017, 2016 and 2015, Bunge made payments related to these agreements of $105 million, $89 million and $75 million, respectively, for advances on future production. $69 million, $64 million and $50 million were included in cost of goods sold in the consolidated statements of income for the years ended December 31, 2017, 2016 and 2015, respectively.
Employee Benefit Plans
We expect to contribute $15 million to our defined benefit pension plans and $7 million to our postretirement healthcare benefit plans in 2018.
Critical Accounting Policies and Estimates
The Company's accounting policies are more fully described in Note 1 to our consolidated financial statements included as part of this Annual Report on Form 10-K. As disclosed in Note 1, the preparation of financial statements in conformity with U.S. GAAP requires management to make substantial judgment or estimation in their application that may significantly affect reported amounts in the financial statements and accompanying notes. Actual results could differ significantly from those estimates. The Company believes that the following discussion addresses the Company's most critical accounting policies, which are those that are most important to the portrayal of the Company's financial condition and results of operations and require management's most difficult, subjective and complex judgments.
Allowances for Uncollectible Accounts
Accounts receivable and secured advances to suppliers are stated at the historical carrying amounts net of write-offs and allowances for uncollectible accounts. We establish an allowance for uncollectible trade accounts receivable and secured advances to farmers based on historical experience, farming, economic and other market conditions as well as specific identified customer collection issues. Uncollectible accounts are written off when a settlement is reached for an amount that is less than the outstanding historical balance or when we have determined that collection of the balance is unlikely.
We follow the accounting guidance on the disclosure of the credit quality of financing receivables and the allowance for credit losses which requires information to be disclosed at disaggregated levels, defined as portfolio segments and classes. Based upon an analysis of credit losses and risk factors to be considered in determining the allowance for credit losses, we have determined that the long-term receivables from farmers in Brazil are a single portfolio segment.
We evaluate this single portfolio segment by class of receivables, which is defined as a level of information (below a portfolio segment) in which the receivables have the same initial measurement attribute and a similar method for assessing and monitoring risk. We have identified accounts in legal collection processes and renegotiated amounts as classes of long-term receivables from farmers. Valuation allowances for accounts in legal collection processes are determined by us on individual accounts based on the fair value of the collateral provided as security for the secured advance or credit sale. The fair value is determined using a combination of internal and external resources, including published information concerning Brazilian land values by region. For determination of the valuation allowances for renegotiated amounts, we consider historical experience with the individual farmers, current weather and crop conditions, as well as the fair value of non-crop collateral.
For both classes, a long-term receivable from farmers in Brazil is considered impaired, based on current information and events, if we determine it to be probable that all amounts due under the original terms of the receivable will not be collected. Recognition of interest income on secured advances to farmers is suspended once the farmer defaults on the originally scheduled delivery of agricultural commodities as the collection of future income is determined not to be probable. No additional interest income is accrued from the point of default until ultimate recovery, where amounts collected are credited first against the receivable and then to any unrecognized interest income.
48
Inventories and Derivatives
We use derivative instruments for the purpose of managing the exposures associated with agricultural commodity prices, transportation costs, foreign currency exchange rates, interest rates and energy costs and for positioning our overall portfolio relative to expected market movements in accordance with established policies and procedures. We are exposed to loss in the event of non-performance by counterparties to certain of these contracts. The risk of non-performance is routinely monitored and adjustments recorded, if necessary, to account for potential non-performance. Different assumptions, changes in economic circumstances or the deterioration of the financial condition of the counterparties to these derivative instruments could result in additional fair value adjustments and changes in expense reflected in cost of goods sold, foreign currency or interest expense. We did not have significant valuation adjustments relating to non-performance by counterparties at December 31, 2017 or 2016.
Our RMI, forward purchase and sale contracts on RMI, and exchange traded futures and options are primarily valued at fair value. RMI are freely-traded, have quoted market prices, may be sold without significant additional processing and have predictable and insignificant disposal costs. We estimate fair values of commodity inventories and forward purchase and sale contracts on these inventories based on exchange-quoted prices, adjusted for differences in local markets. Changes in the fair values of these inventories and contracts are recognized in our consolidated statements of income as a component of cost of goods sold. If we used different methods or factors to estimate fair values, amounts reported as inventories and unrealized gains and losses on derivative contracts in the consolidated balance sheets and cost of goods sold could differ. Additionally, if market conditions change subsequent to year-end, amounts reported in future periods as inventories, unrealized gains and losses on derivative contracts and cost of goods sold could differ.
Recoverable Taxes
We evaluate the collectability of our recoverable taxes and record allowances if we determine that collection is doubtful. Recoverable taxes include value-added taxes paid upon the acquisition of fixed assets, raw materials and taxable services and other transactional taxes, which can be recovered in cash or as compensation against income taxes, or other taxes we may owe, primarily in Brazil. Management's assumption about the collectability of recoverable taxes requires significant judgment because it involves an assessment of the ability and willingness of the applicable federal or local government to refund the taxes. The balance of these allowances fluctuates depending on the sales activity of existing inventories, purchases of new inventories, percentages of export sales, seasonality, changes in applicable tax rates, cash payment by the applicable government agencies and compensation of outstanding balances against income or certain other taxes owed to the applicable governments. At December 31, 2017 and 2016, the allowance for recoverable taxes was $39 million and $35 million, respectively. We continue to monitor the economic environment and events taking place in the applicable countries and in cases where we determine that recovery is doubtful, recoverable taxes are reduced by allowances for the estimated unrecoverable amounts.
Property, Plant and Equipment and Other Finite-Lived Intangible Assets
Long-lived assets include property, plant and equipment and other finite-lived intangible assets. When facts and circumstances indicate that the carrying values of property, plant and equipment assets may be impaired, an evaluation of recoverability is performed by comparing the carrying value of the assets to the undiscounted projected future cash flows to be generated by such assets. If it appears that the carrying value of our assets is not recoverable, we recognize an impairment loss as a charge against results of operations. Our judgments related to the expected useful lives of property, plant and equipment assets and our ability to realize undiscounted cash flows in excess of the carrying amount of such assets are affected by factors such as the ongoing maintenance of the assets, changes in economic conditions and changes in operating performance. As we assess the ongoing expected cash flows and carrying amounts of our property, plant and equipment assets, changes in these factors could cause us to realize material impairment charges. We recorded impairment charges of $25 million for the year ended December 31, 2017 primarily related to the impairment of feedmills in China, a port in Poland and various machinery and equipment in Brazil.
Contingencies
We are a party to a large number of claims and lawsuits, primarily non-income tax and labor claims in Brazil and non-income tax claims in Argentina, and have accrued our estimates of the probable costs to resolve these claims. These estimates have been developed in consultation with in-house and outside counsel and are based on an analysis of potential results, assuming a combination of litigation and settlement strategies. Future results of operations for any particular quarterly or annual period could be materially affected by changes in our assumptions or the effectiveness of our strategies relating to these proceedings. For more information on tax and labor claims in Brazil, see "Item 3. Legal Proceedings."
Income Taxes
49
We record valuation allowances to reduce our deferred tax assets to the amount that we are likely to realize. We consider projections of future taxable income and prudent tax planning strategies to assess the need for and the size of the valuation allowances. If we determine that we can realize a deferred tax asset in excess of our net recorded amount, we decrease the valuation allowance, thereby decreasing income tax expense. Conversely, if we determine that we are unable to realize all or part of our net deferred tax asset, we increase the valuation allowance, thereby increasing income tax expense.
We apply a "more likely than not" threshold to the recognition and de-recognition of tax benefits. Accordingly we recognize the amount of tax benefit that has a greater than 50 percent likelihood of being ultimately realized upon settlement. The calculation of our uncertain tax positions involves uncertainties in the application of complex tax regulations in a multitude of jurisdictions across our global operations. Future changes in judgment related to the ultimate resolution of unrecognized tax benefits will affect the earnings in the quarter of such change. At December 31, 2017 and 2016, we had recorded uncertain tax positions of $106 million and $130 million, respectively, in our consolidated balance sheets. For additional information on income taxes, please refer to Note 14 of the consolidated financial statements.
As a result of the recent U.S. tax reform legislation, we recorded provisional income tax expense associated with the deemed repatriation of earnings in our Canadian and Mexican subsidiaries. We are awaiting further guidance from the U.S. tax authorities on aspects of calculating the appropriate expense. In addition, we are evaluating the potential future impacts of the Global Intangible Low-Taxed Income (“GILTI”) provision before making an election on accounting for potential temporary differences. As we finalize the computations later in 2018 and await future guidance from the taxing authorities, there could be a material adjustment in the accrued tax liability.
New Accounting Pronouncements
See Note 1—Nature of Business, Basis of Presentation, and Significant Accounting Policies to our consolidated financial statements in this Annual Report on Form 10-K.
Item 7A. Quantitative and Qualitative Disclosures About Market Risk
Risk Management
As a result of our global operating and financing activities, we are exposed to changes in, among other things, agricultural commodity prices, transportation costs, foreign currency exchange rates, interest rates and energy costs which may affect our results of operations and financial position. We actively monitor and manage these various market risks associated with our business activities. Our risk management decisions take place in various locations but exposure limits are centrally set and monitored, operating under a global governance framework. We have a corporate risk management group which analyzes and monitors various risk exposures globally. Additionally, our Board of Directors' Finance and Risk Policy Committee oversees our global market risk governance framework, including risk management policies and limits.
We use derivative instruments for the purpose of managing the exposures associated with commodity prices, transportation costs, foreign currency exchange rates, interest rates and energy costs and for positioning our overall portfolio relative to expected market movements in accordance with established policies and procedures. We enter into derivative instruments primarily with major financial institutions, commodity exchanges in the case of commodity futures and options, or approved exchange clearing shipping companies in the case of ocean freight. While these derivative instruments are subject to fluctuations in value, for hedged exposures those fluctuations are generally offset by the changes in fair value of the underlying exposures. The derivative instruments that we use for hedging purposes are intended to reduce the volatility on our results of operations; however, they can occasionally result in earnings volatility, which may be material. See Note 15 to the consolidated financial statements in this Annual Report on Form 10-K for a more detailed discussion of our use of derivative instruments.
Credit and Counterparty Risk
Through our normal business activities, we are subject to significant credit and counterparty risks that arise through normal commercial sales and purchases, including forward commitments to buy or sell, and through various other OTC derivative instruments that we utilize to manage risks inherent in our business activities. We define credit and counterparty risk as a potential financial loss due to the failure of a counterparty to honor its obligations. The exposure is measured based upon several factors, including unpaid accounts receivable from counterparties and unrealized gains from OTC derivative instruments (including forward purchase and sale contracts). Credit and counterparty risk also includes sovereign credit risk. We actively monitor credit and counterparty risk through credit analysis by the local credit staff and review by various local and corporate committees which monitor counterparty performance. We record provisions for counterparty losses from time to time as a result of our credit and counterparty analysis.
During periods of tight conditions in global credit markets, downturns in regional or global economic conditions, and/or significant price volatility, credit and counterparty risks are heightened. This increased risk is monitored through, among other
50
things, increased communication with key counterparties, management reviews and specific focus on counterparties or groups of counterparties that we may determine as high risk. In addition, we have limited new credit extensions in certain cases and reduced our use of non-exchange cleared derivative instruments.
Commodities Risk
We operate in many areas of the food industry, from agricultural raw materials to the production and sale of branded food products. As a result, we purchase and produce various materials, many of which are agricultural commodities, including: soybeans, soybean oil, soybean meal, softseeds (including sunflower seed, rapeseed and canola) and related oil and meal derived from them, wheat and corn. In addition, we grow and purchase sugarcane to produce sugar, ethanol and electricity. Agricultural commodities are subject to price fluctuations due to a number of unpredictable factors that may create price risk. As described above, we are also subject to the risk of counterparty non-performance under forward purchase or sale contracts. From time to time, we have experienced instances of counterparty non-performance, including as a result of significant declines in counterparty profitability under these contracts due to significant movements in commodity prices between the time the contracts were executed and the contractual forward delivery period.
We enter into various derivative contracts with the primary objective of managing our exposure to adverse price movements in the agricultural commodities used and produced in our business operations. We have established policies that limit the amount of unhedged fixed price agricultural commodity positions permissible for our operating companies, which are generally a combination of volume and value-at-risk ("VaR") limits. We measure and review our net commodities position on a daily basis. Bunge also employs stress testing techniques in order to quantify its exposures to price and liquidity risks under non-normal or event driven market conditions.
Our daily net agricultural commodity position consists of inventory, forward purchase and sale contracts, and OTC and exchange traded derivative instruments, including those used to hedge portions of our production requirements. The fair value of that position is a summation of the fair values calculated for each agricultural commodity by valuing all of our commodity positions at quoted market prices for the period where available or utilizing a close proxy. VaR is calculated on the net position and monitored at the 95% confidence interval. In addition, scenario analysis and stress testing are performed. For example, one measure of market risk is estimated as the potential loss in fair value resulting from a hypothetical 10% adverse change in prices. The results of this analysis, which may differ from actual results, are as follows:
Year Ended December 31, 2017 | Year Ended December 31, 2016 | |||||||||||||||
(US$ in millions) | Fair Value | Market Risk | Fair Value | Market Risk | ||||||||||||
Highest daily aggregated position value | $ | 685 | $ | (69 | ) | $ | 1,207 | $ | (121 | ) | ||||||
Lowest daily aggregated position value | (711 | ) | (71 | ) | (682 | ) | (68 | ) | ||||||||
Ocean Freight Risk
Ocean freight represents a significant portion of our operating costs. The market price for ocean freight varies depending on the supply and demand for ocean vessels, global economic conditions and other factors. We enter into time charter agreements for time on ocean freight vessels based on forecasted requirements for the purpose of transporting agricultural commodities. Our time charter agreements generally have terms ranging from two months to approximately seven years. We use financial derivatives, generally freight forward agreements, to hedge portions of our ocean freight costs. The ocean freight derivatives are included in other current assets and other current liabilities on the consolidated balance sheets at fair value.
Energy Risk
We purchase various energy commodities such as electricity, natural gas and bunker fuel, that are used to operate our manufacturing facilities and ocean freight vessels. The energy commodities are subject to price risk. We use financial derivatives, including exchange traded and OTC swaps and options for various purposes, including to manage our exposure to volatility in energy costs. These energy derivatives are included in other current assets and other current liabilities on the consolidated balance sheets at fair value.
Currency Risk
Our global operations require active participation in foreign exchange markets. Our primary foreign currency exposures are the Brazilian real, Canadian dollar, the euro and other European currencies, the Argentine peso and the Chinese yuan/renminbi. To reduce the risk arising from foreign exchange rate fluctuations, we enter into derivative instruments, such as foreign currency forward contracts, swaps and options. The changes in market value of such contracts have a high correlation
51
to the price changes in the related currency exposures. The potential loss in fair value for such net currency position resulting from a hypothetical 10% adverse change in foreign currency exchange rates as of December 31, 2017 was not material.
When determining our exposure, we exclude intercompany loans that are deemed to be permanently invested. The repayments of permanently invested intercompany loans are not planned or anticipated in the foreseeable future and therefore, are treated as analogous to equity for accounting purposes. As a result, the foreign currency gains and losses on these borrowings are excluded from the determination of net income and recorded as a component of accumulated other comprehensive income (loss) in the consolidated balance sheets. Included in other comprehensive income (loss) are foreign currency losses of $16 million and $257 million for the years ended December 31, 2017 and 2016, respectively, related to permanently invested intercompany loans.
Interest Rate Risk
We have debt in fixed and floating rate instruments. We are exposed to market risk due to changes in interest rates. We may enter into interest rate swap agreements to manage our interest rate exposure related to our debt portfolio.
The aggregate fair value of our short and long-term debt, based on market yields at December 31, 2017, was $4,640 million with a carrying value of $4,479 million.
A hypothetical 100 basis point increase in the interest yields on our senior note debt at December 31, 2017 would result in a decrease of approximately $72 million in the fair value of our debt. Similarly, a decrease of 100 basis points in the interest yields on our debt at December 31, 2017 would cause an increase of approximately $72 million in the fair value of our debt.
A hypothetical 1% change in LIBOR would result in a change of approximately $28 million in our interest expense on our variable rate debt at December 31, 2017. Some of our variable rate debt is denominated in currencies other than in U.S. dollars and is indexed to non-U.S. dollar-based interest rate indices, such as EURIBOR and TJLP and certain benchmark rates in local bank markets. As such, the hypothetical 1% change in interest rate ignores the potential impact of any currency movements.
Derivative Instruments
Interest Rate Derivatives—Interest rate derivatives used by us as hedging instruments are recorded at fair value in the consolidated balance sheets with changes in fair value recorded contemporaneously in earnings. Certain of these swap agreements may be designated as fair value hedges. The carrying amount of the associated hedged debt is also adjusted through earnings for changes in the fair value arising from changes in benchmark interest rates. Ineffectiveness is recognized to the extent that these two adjustments do not offset. We may enter into interest rate swap agreements for the purpose of managing certain of our interest rate exposures. We may also enter into interest rate basis swap agreements that do not qualify as hedges for accounting purposes. Changes in fair value of such interest rate basis swap agreements are recorded in earnings.
We recognized gains of approximately nil, $3 million and $9 million, respectively, as a reduction of interest expense in the consolidated statements of income, related to the amortization of deferred gains on termination of interest rate swap agreements for the years ended December 31, 2017, 2016 and 2015.
Foreign Exchange Derivatives—We use a combination of foreign exchange forward, swap and option contracts in certain of our operations to mitigate the risk from exchange rate fluctuations in connection with certain commercial and balance sheet exposures. The foreign exchange forward swap and option contracts may be designated as cash flow hedges. We may also use net investment hedges to partially offset the translation adjustments arising from the remeasurement of our investment in certain of our foreign subsidiaries.
We assess, both at the inception of the hedge and on an ongoing basis, whether the derivatives that are used in hedge transactions are highly effective in offsetting changes in the hedged items.
Commodity Derivatives—We use derivative instruments to primarily manage exposure to movements associated with agricultural commodity prices. We generally use exchange traded futures and options contracts to minimize the effects of changes in the prices of agricultural commodities on agricultural commodity inventories and forward purchase and sale contracts, but may also from time to time enter into OTC commodity transactions, including swaps, which are settled in cash at maturity or termination based on exchange-quoted futures prices. Changes in fair values of exchange traded futures contracts representing the unrealized gains and/or losses on these instruments are settled daily generally through our 100% owned futures clearing subsidiary. Forward purchase and sale contracts are primarily settled through delivery of agricultural commodities. While we consider these exchange traded futures and forward purchase and sale contracts to be effective economic hedges, we do not designate or account for the majority of our commodity contracts as hedges. Changes in fair values of these contracts and related RMI are included in cost of goods sold in the consolidated statements of income. The forward contracts require performance of both us and the contract counterparty in future periods. Contracts to purchase agricultural commodities
52
generally relate to current or future crop years for delivery periods quoted by regulated commodity exchanges. Contracts for the sale of agricultural commodities generally do not extend beyond one future crop cycle.
Ocean Freight Derivatives—We use derivative instruments referred to as freight forward agreements, or FFAs, and FFA options to hedge portions of our current and anticipated ocean freight costs. Changes in the fair values of ocean freight derivatives are recorded in earnings.
Energy Derivatives—We use derivative instruments for various purposes including to manage our exposure to volatility in energy costs. Our operations use substantial amounts of energy, including natural gas, coal and fuel oil, including bunker fuel.
Equity Derivatives - We use derivative instruments over equity indices to manage our exposure to broader macroeconomic fundamentals. From time to time, Bunge may utilize such derivative instruments where it perceives broader macroeconomic factors are unduly influencing the supply and demand fundamentals for agricultural commodities and products.
For more information, see Note 15 to our consolidated financial statements included as part of this Annual Report on Form 10-K.
Item 8. Financial Statements and Supplementary Data
Our financial statements and related schedule required by this item are contained on pages F-1 through F-72 and on page E-1 of this Annual Report on Form 10-K. See Item 15(a) for a listing of financial statements provided.
Item 9. Changes in and Disagreements with Accountants on Accounting and Financial Disclosure
None.
Item 9A. Controls and Procedures
Disclosure Controls and Procedures
Disclosure controls and procedures are the controls and other procedures that are designed to provide reasonable assurance that information required to be disclosed by the issuer in the reports that it files or submits under the Exchange Act of 1934, as amended (the "Exchange Act") is recorded, processed, summarized and reported within the time periods specified in the Securities and Exchange Commission's rules and forms. Disclosure controls and procedures include, without limitation, controls and procedures designed to ensure that information required to be disclosed by an issuer in the reports that it files or submits under the Exchange Act is accumulated and communicated to the issuer's management, including the principal executive and principal financial officer, or persons performing similar functions, as appropriate, to allow timely decisions regarding required disclosure.
As of December 31, 2017, we carried out an evaluation, under the supervision and with the participation of our management, including our Chief Executive Officer and Chief Financial Officer, of the effectiveness of the design and operation of our disclosure controls and procedures, as that term is defined in Exchange Act Rules 13a-15(e) and 15d-15(e), as of the end of the period covered by this Annual Report on Form 10-K. Based upon that evaluation, our Chief Executive Officer and Chief Financial Officer have concluded that our disclosure controls and procedures were effective at the reasonable assurance level as of the end of the fiscal year covered by this Annual Report on Form 10-K.
Management's Report on Internal Control over Financial Reporting
Bunge Limited's management is responsible for establishing and maintaining adequate internal control over financial reporting, as such term is defined in Exchange Act Rules 13a-15(f). Bunge Limited's internal control over financial reporting is designed to provide reasonable assurance regarding the reliability of financial reporting and the preparation of financial statements for external purposes in accordance with U.S. Generally Accepted Accounting Principles.
Under the supervision and with the participation of management, including our Chief Executive Officer and Chief Financial Officer, we conducted an evaluation of the effectiveness of our internal control over financial reporting as of the end of the fiscal year covered by this annual report based on the framework in Internal Control—Integrated Framework (2013) issued by the Committee of Sponsoring Organizations of the Treadway Commission or COSO.
Based on this assessment, management concluded that Bunge Limited's internal control over financial reporting was effective as of the end of the fiscal year covered by this annual report.
53
Deloitte & Touche LLP, the independent registered public accounting firm that has audited and reported on Bunge Limited's consolidated financial statements included in this annual report, has issued its written attestation report on Bunge Limited's internal control over financial reporting, which is included in this Annual Report on Form 10-K.
Changes in Internal Control over Financial Reporting
There has been no change in our internal control over financial reporting during the fourth fiscal quarter ended December 31, 2017 that has materially affected, or is reasonably likely to materially affect, our internal control over financial reporting.
Inherent Limitations on Effectiveness of Controls
Our management, including our Chief Executive Officer and our Chief Financial Officer, does not expect that our disclosure controls or our internal control over financial reporting will prevent or detect all errors and all fraud. A control system, no matter how well designed and operated, can provide only reasonable, not absolute, assurance that the control system's objectives will be met. The design of a control system must reflect the fact that there are resource constraints, and the benefits of controls must be considered relative to their costs. Further, because of the inherent limitations in all control systems, no evaluation of controls can provide absolute assurance that misstatements due to error or fraud will not occur or that all control issues and instances of fraud, if any, within the company have been detected. These inherent limitations include the realities that judgments in decision-making can be faulty and that breakdowns can occur because of simple error or mistake. Controls may also be circumvented by the individual acts of some persons, by collusion of two or more people or by management override of the controls. The design of any system of controls is based in part on certain assumptions about the likelihood of future events, and there can be no assurance that any design will succeed in achieving its stated goals under all potential future conditions. Projections of any evaluation of controls effectiveness to future periods are subject to risks. Over time, controls may become inadequate because of changes in conditions or deterioration in the degree of compliance with policies or procedures.
54
REPORT OF INDEPENDENT REGISTERED PUBLIC ACCOUNTING FIRM
To the Shareholders and the Board of Directors of Bunge Limited
Opinion on Internal Control over Financial Reporting
We have audited the internal control over financial reporting of Bunge Limited and subsidiaries (the "Company") as of December 31, 2017, based on criteria established in Internal Control-Integrated Framework (2013) issued by the Committee of Sponsoring Organizations of the Treadway Commission. In our opinion, the Company maintained, in all material respects, effective internal control over financial reporting as of December 31, 2017, based on the criteria established in Internal Control-Integrated Framework (2013) issued by COSO.
We have also audited, in accordance with the standards of the Public Company Accounting Oversight Board (United States) (PCAOB), the consolidated financial statements and financial statement schedule as of and for the year ended December 31, 2017 of the Company and our report dated February 23, 2018 expressed an unqualified opinion on the consolidated financial statements and financial statement schedule.
Basis for Opinion
The Company's management is responsible for maintaining effective internal control over financial reporting and for its assessment of the effectiveness of internal control over financial reporting, included in the accompanying Management's Report on Internal Control over Financial Reporting. Our responsibility is to express an opinion on the Company's internal control over financial reporting based on our audit. We are a public accounting firm registered with the PCAOB and are required to be independent with respect to the Company in accordance with the U.S. federal securities laws and the applicable rules and regulations of the Securities and Exchange Commission and the PCAOB.
We conducted our audit in accordance with the standards of the PCAOB. Those standards require that we plan and perform the audit to obtain reasonable assurance about whether effective internal control over financial reporting was maintained in all material respects. Our audit included obtaining an understanding of internal control over financial reporting, assessing the risk that a material weakness exists, testing and evaluating the design and operating effectiveness of internal control based on the assessed risk, and performing such other procedures as we considered necessary in the circumstances. We believe that our audit provides a reasonable basis for our opinion.
Definition and Limitations of Internal Control over Financial Reporting
A company's internal control over financial reporting is a process designed to provide reasonable assurance regarding the reliability of financial reporting and the preparation of financial statements for external purposes in accordance with generally accepted accounting principles. A company's internal control over financial reporting includes those policies and procedures that (1) pertain to the maintenance of records that, in reasonable detail, accurately and fairly reflect the transactions and dispositions of the assets of the company; (2) provide reasonable assurance that transactions are recorded as necessary to permit preparation of financial statements in accordance with generally accepted accounting principles, and that receipts and expenditures of the company are being made only in accordance with authorizations of management and directors of the company; and (3) provide reasonable assurance regarding prevention or timely detection of unauthorized acquisition, use, or disposition of the company's assets that could have a material effect on the financial statements.
Because of the inherent limitations, internal control over financial reporting may not prevent or detect misstatements. Also, projections of any evaluation of the effectiveness to future periods are subject to the risk that the controls may become inadequate because of changes in conditions, or that the degree of compliance with the policies or procedures may deteriorate.
/s/ Deloitte & Touche LLP
New York, New York
February 23, 2018
55
Item 9B. Other Information
None.
PART III
Information required by Items 10, 11, 12, 13 and 14 of Part III is omitted from this Annual Report on Form 10-K and will be filed in a definitive proxy statement for our 2017 Annual General Meeting of Shareholders.
Item 10. Directors, Executive Officers, and Corporate Governance
We will provide information that is responsive to this Item 10 in our definitive proxy statement for our 2018 Annual General Meeting of Shareholders under the captions "Election of Directors," "Section 16(a) Beneficial Ownership Reporting Compliance," "Corporate Governance—Board Meetings and Committees—Audit Committee," "Corporate Governance—Board Composition and Independence," "Audit Committee Report," "Corporate Governance—Corporate Governance Guidelines and Code of Conduct" and possibly elsewhere therein. That information is incorporated in this Item 10 by reference. The information required by this item with respect to our executive officers and key employees is found in Part I of this Annual Report on Form 10-K under the caption "Item 1. Business—Executive Officers and Key Employees of the Company," which information is incorporated herein by reference.
Item 11. Executive Compensation
We will provide information that is responsive to this Item 11 in our definitive proxy statement for our 2018 Annual General Meeting of Shareholders under the captions "Executive Compensation," "Director Compensation," "Compensation Committee Report," and possibly elsewhere therein. That information is incorporated in this Item 11 by reference.
Item 12. Security Ownership of Certain Beneficial Owners and Management and Related Stockholder Matters
We will provide information that is responsive to this Item 12 in our definitive proxy statement for our 2018 Annual General Meeting of Shareholders under the caption "Share Ownership of Directors, Executive Officers and Principal Shareholders" and possibly elsewhere therein. That information is incorporated in this Item 12 by reference. The information required by this item with respect to our equity compensation plan information is found in Part II of this Annual Report on Form 10-K under the caption "Item 5. Market for Registrant's Common Equity, Related Stockholder Matters and Issuer Purchases of Equity Securities—Securities Authorized for Issuance Under Equity Compensation Plans," which information is incorporated herein by reference.
Item 13. Certain Relationships and Related Transactions, and Director Independence
We will provide information that is responsive to this Item 13 in our definitive proxy statement for our 2018 Annual General Meeting of Shareholders under the captions "Corporate Governance—Board Composition and Independence," "Certain Relationships and Related Party Transactions" and possibly elsewhere therein. That information is incorporated in this Item 13 by reference.
Item 14. Principal Accounting Fees and Services
We will provide information that is responsive to this Item 14 in our definitive proxy statement for our 2018 Annual General Meeting of Shareholders under the caption "Appointment of Independent Auditor" and possibly elsewhere therein. That information is incorporated in this Item 14 by reference.
56
PART IV
Item 15. Exhibits, Financial Statement Schedules
a. | (1) (2) Financial Statements and Financial Statement Schedules |
See "Index to Consolidated Financial Statements" on page F-1 and Financial Statement Schedule II—Valuation and Qualifying Accounts on page E-1 of this Annual Report on Form 10-K.
a. | (3) Exhibits |
The exhibits listed in the accompanying index to exhibits are filed or incorporated by reference as part of this Form 10-K.
Certain of the agreements filed as exhibits to this Form 10-K contain representations and warranties by the parties to the agreements that have been made solely for the benefit of the parties to the agreement, which may have been included in the agreement for the purpose of allocating risk between the parties rather than establishing matters as facts and may have been qualified by disclosures that were made to the parties in connection with the negotiation of these agreements and not necessarily reflected in the agreements. Accordingly, the representations and warranties contained in these agreements may not describe the actual state of affairs of Bunge Limited or its subsidiaries as of the date that these representations and warranties were made or at any other time. Investors should not rely on these representations and warranties as statements of fact. Additional information about Bunge Limited and its subsidiaries may be found elsewhere in this Annual Report on Form 10-K and Bunge Limited's other public filings, which are available without charge through the SEC's website at www.sec.gov.
See "Index to Exhibits" set forth below.
57
Exhibit Number | Description | ||
Memorandum of Association (incorporated by reference from the Registrant's Form F-1 (No. 333-65026) filed July 13, 2001) | |||
Certificate of Deposit of Memorandum of Increase of Share Capital (incorporated by reference from the Registrant's Form 10-Q filed August 11, 2008) | |||
Bye-laws, amended and restated as of May 25, 2016 (incorporated by reference from the Registrant's Form 10-K filed on February 28, 2017) | |||
Form of Common Share Certificate (incorporated by reference from the Registrant's Form 10-K filed March 3, 2008) | |||
Certificate of Designation of 4.875% Cumulative Convertible Perpetual Preference Shares (incorporated by reference from the Registrant's Form 8-K filed November 20, 2006) | |||
Form of 4.875% Cumulative Convertible Perpetual Preference Share Certificate (incorporated by reference from the Registrant's Form 8-K filed November 20, 2006) | |||
4.4 | The instruments defining the rights of holders of the long-term debt securities of Bunge and its subsidiaries are omitted pursuant to Item 601(b)(4)(iii) of Regulation S-K. Bunge hereby agrees to furnish copies of these instruments to the Securities and Exchange Commission upon request | ||
Fifth Amended and Restated Pooling Agreement, dated as of June 28, 2004, among Bunge Funding Inc., Bunge Management Services Inc., as Servicer, and The Bank of New York Mellon, as Trustee (incorporated by reference from the Registrant's Form 10-K filed February 27, 2012) | |||
Fifth Amended and Restated Series 2000-1 Supplement, dated as of June 28, 2004, among Bunge Funding Inc., Bunge Management Services, Inc., as Servicer, Coöperatieve Centrale Raiffeisen-Boerenleenbank B.A., "Rabobank International," New York Branch, as Letter of Credit Agent, JPMorgan Chase Bank, N.A., as Administrative Agent, The Bank of New York Mellon, as Collateral Agent and Trustee, and Bunge Asset Funding Corp., as Series 2000-1 Purchaser (incorporated by reference from the Registrant's Form 10-K filed February 27, 2012) | |||
Twelfth Amended and Restated Liquidity Agreement, dated as of November 20, 2014, among Bunge Asset Funding Corp., the financial institutions party thereto, Citibank, N.A., as Syndication Agent, BNP Paribas and The Bank of Tokyo Mitsubishi UFJ, Ltd., as Co-Documentation Agents, and JPMorgan Chase Bank, N.A., as Administrative Agent (incorporated by reference from the Registrant's Form 8-K filed November 24, 2014) | |||
Annex X, dated as of November 20, 2014 (incorporated by reference from the Registrant's Form 8-K filed on November 24, 2014) | |||
Eighth Amended and Restated Guaranty, dated as of November 20, 2014, by Bunge Limited, as Guarantor, to Coöperatieve Centrale Raiffeisen-Boerenleenbank B.A., "Rabobank International," New York Branch, in its capacity as the letter of credit agent under the Letter of Credit Reimbursement Agreement for the benefit of the Letter of Credit Banks, JPMorgan Chase Bank, N.A., in its capacity as the administrative agent under the Liquidity Agreement, for the benefit of the Liquidity Banks and The Bank of New York Mellon (formerly known as The Bank of New York), in its capacity as collateral agent under the Security Agreement and as trustee under the Pooling Agreement (incorporated by reference from the Registrant's Form 8-K filed on November 24, 2014) | |||
Revolving Credit Agreement, dated as of November 20, 2014, among Bunge Limited Finance Corp., as Borrower, Citibank, N.A., as Syndication Agent, BNP Paribas and The Bank of Tokyo Mitsubishi UFJ, Ltd., as Co-Documentation Agents, JPMorgan Chase Bank, N.A., as Administrative Agent, and certain lenders party thereto (incorporated by reference from the Registrant's Form 8-K filed on November 24, 2014) | |||
Guaranty, dated as of November 20, 2014, by Bunge Limited, as Guarantor, to JPMorgan Chase Bank, N.A., as administrative agent under the Revolving Credit Agreement (incorporated by reference from the Registrant's Form 8-K filed on November 24, 2014) | |||
Credit Agreement, dated September 6, 2017, among Bunge Limited Finance Corp., as Borrower, CoBank ACB, as Administrative Agent and Lead Arranger, and certain lenders party thereto (incorporated by reference from the Registrant’s Form 8-K filed on September 7, 2017) | |||
Guaranty, dated as of September 6, 2017, between Bunge Limited, as Guarantor, and CoBank ACB, as Administrative Agent (incorporated by reference from the Registrant’s Form 8-K filed on September 7, 2017) | |||
58
Exhibit Number | Description | |
Facility Agreement, dated as of December 12, 2017, among Bunge Finance Europe B.V., as Borrower, ABN AMRO Bank N.V., BNP Paribas, Crédit Agricole Corporate and Investment Bank, HSBC Bank PLC and ING Bank N.V., as Arrangers, ABN AMRO Bank N.V., as Agent and certain lenders party thereto (incorporated by reference from the Registrant’s Form 8-K filed on December 12, 2017) | ||
Guaranty, dated as of December 12, 2017, by Bunge Limited, as Guarantor, to ABN AMRO Bank N.V., as Agent under the Facility Agreement (incorporated by reference from the Registrant’s Form 8-K filed on December 12, 2017) | ||
Eighth Amendment to and Restatement of the Receivables Transfer Agreement, dated May 26, 2016, among Bunge Securitization B.V., as Seller, Koninklijke Bunge B.V. (f/k/a Bunge Finance B.V.), as Master Servicer, the persons from time to time party thereto as Conduit Purchasers, the persons from time to time party thereto as Committed Purchasers, the persons from time to time party thereto as Purchaser Agents, Coöperatieve Rabobank U.A. (f/k/a Centrale Raiffeisen-Boerenleenbank B.A.), as Administrative Agent and Purchaser Agent, and Bunge Limited, as Performance Undertaking Provider (incorporated by reference from the Registrant's Form 10-Q filed on July 28, 2016) | ||
Ninth Amendment to the Receivables Transfer Agreement, dated June 30, 2016, among Bunge Securitization B.V., as Seller, Koninklijke Bunge B.V., as Master Servicer, the persons from time to time party thereto as Conduit Purchasers, the persons from time to time party thereto as Committed Purchasers, the persons from time to time party thereto as Purchaser Agents, Coöperatieve Rabobank U.A., as Administrative Agent and Purchaser Agent, and Bunge Limited, as Performance Undertaking Provider (incorporated by reference from the Registrant's Form 10-Q filed on July 28, 2016) | ||
Tenth Amendment to the Receivables Transfer Agreement, dated October 11, 2016, among Bunge Securitization B.V., as Seller, Koninklijke Bunge B.V., as Master Servicer, the persons from time to time party thereto as Conduit Purchasers, the persons from time to time party thereto as Committed Purchasers, the persons from time to time party thereto as Purchaser Agents, Coöperatieve Rabobank U.A., as Administrative Agent and Purchaser Agent, and Bunge Limited, as Performance Undertaking Provider (incorporated by reference from the Registrant's Form 10-K filed on February 28, 2017) | ||
* | Eleventh Amendment to the Receivables Transfer Agreement, dated May 31, 2017, among Bunge Securitization B.V., as Seller, Koninklijke Bunge B.V., as Master Servicer, the persons from time to time party thereto as Conduit Purchasers, the persons from time to time party thereto as Committed Purchasers, the persons from time to time party thereto as Purchaser Agents, Coöperatieve Rabobank U.A., as Administrative Agent and Purchaser Agent, and Bunge Limited, as Performance Undertaking Provider | |
* | Twelfth Amendment to the Receivables Transfer Agreement, dated October 31, 2017, among Bunge Securitization B.V., as Seller, Koninklijke Bunge B.V., as Master Servicer, the persons from time to time party thereto as Conduit Purchasers, the persons from time to time party thereto as Committed Purchasers, the persons from time to time party thereto as Purchaser Agents, Coöperatieve Rabobank U.A., as Administrative Agent and Purchaser Agent, and Bunge Limited, as Performance Undertaking Provider | |
Amendment to and Restatement of the Servicing Agreement, dated May 26, 2016, among Bunge Securitization B.V., as Seller, Bunge North America Capital, Inc., as U.S. Intermediate Transferor, Coöperatieve Rabobank U.A., as Italian Intermediate Transferor, Koninklijke Bunge B.V., as Master Servicer, the persons named therein as Sub-Servicers, and Coöperatieve Rabobank U.A., as Administrative Agent (incorporated by reference from the Registrant's form 10-K filed on February 28, 2017) | ||
Performance and Indemnity Agreement, dated June 1, 2011, between Bunge Limited, as Performance Undertaking Provider and Coöperatieve Centrale Raiffeisen-Boerenleenbank B.A., as Administrative Agent (incorporated by reference from the Registrant's Form 10-Q filed on August 9, 2011) | ||
First Amendment to Performance and Indemnity Agreement, dated May 24, 2012, between Bunge Limited, as Performance Undertaking Provider and Coöperatieve Centrale Raiffeisen-Boerenleenbank B.A., as Administrative Agent (incorporated by reference from the Registrant's Form 10-Q filed on August 1, 2012) | ||
Subordinated Loan Agreement, dated June 1, 2011, among Bunge Finance B.V., as Subordinated Lender, Bunge Securitization B.V., as Seller, Bunge Finance B.V., as Master Servicer, and Coöperatieve Centrale Raiffeisen-Boerenleenbank B.A., as Administrative Agent (incorporated by reference from the Registrant's Form 10-Q filed on August 9, 2011) | ||
++10.21 | U.S. Receivables Purchase Agreement, dated June 1, 2011, among Bunge North America, Inc., Bunge Oils, Inc., Bunge North America (East), LLC, Bunge Milling, Inc., Bunge North America (OPD West), Inc., each as a Seller, respectively, Bunge Finance B.V., as Seller Agent, and Bunge North America Capital, Inc., as the Buyer (incorporated by reference from the Registrant's Form 10-Q filed on August 9, 2011) | |
59
Exhibit Number | Description | |
First Amendment to U.S. Receivables Purchase Agreement, dated June 15, 2012, among Bunge North America, Inc., Bunge Oils, Inc., Bunge North America (East), LLC, Bunge Milling, Inc., Bunge North America (OPD West), Inc., each as a Seller, respectively, Bunge Finance B.V., as Seller Agent, and Bunge North America Capital, Inc., as the Buyer (incorporated by reference from the Registrant's Form 10-Q filed on August 1, 2012) | ||
Second Amendment to the U.S. Receivables Purchase Agreement, dated June 30, 2016, among Bunge North America, Inc., Bunge Oils, Inc., Bunge North America (East), LLC, Bunge Milling, Inc., Bunge North America (OPD West), Inc., each as a Seller, respectively, Koninklijke Bunge B.V., as Seller Agent, Bunge North America Capital, Inc., as the Buyer, and Coöperatieve Rabobank U.A., as Administrative Agent | ||
U.S. Intermediate Transfer Agreement, dated June 1, 2011, among Bunge North America Capital, Inc., as the Transferor, Bunge Finance B.V., as the Transferor Agent, and Bunge Securitization B.V., as the Transferee (incorporated by reference from the Registrant's Form 10-Q filed on August 9, 2011) | ||
First Amendment to U.S. Intermediate Transfer Agreement, dated June 15, 2012, among Bunge North America Capital, Inc., as the Transferor, Bunge Finance B.V., as the Transferor Agent, and Bunge Securitization B.V., as the Transferee (incorporated by reference from the Registrant's Form 10-Q filed on August 1, 2012) | ||
Bunge Limited Equity Incentive Plan (Amended and Restated as of December 31, 2008) (incorporated by reference from the Registrant's Form 10-K filed March 2, 2009) | ||
Form of Nonqualified Stock Option Award Agreement (effective as of 2005) under the Bunge Limited Equity Incentive Plan (incorporated by reference from the Registrant's Form 10-K filed March 15, 2006) | ||
Bunge Limited 2009 Equity Incentive Plan (incorporated by reference from the Registrant's Definitive Proxy Statement filed April 11, 2014) | ||
Form of Nonqualified Stock Option Award Agreement under the 2009 Bunge Limited Equity Incentive Plan (incorporated by reference from the Registrant's Form 10-K filed March 1, 2011) | ||
Form of Restricted Stock Unit Award Agreement under the 2009 Bunge Limited Equity Incentive Plan (incorporated by reference from the Registrant's Form 10-K filed March 1, 2011) | ||
Form of Performance Based Restricted Stock Unit-Target EPS Award Agreement under the 2009 Bunge Limited Equity Incentive Plan (incorporated by reference from the Registrant's Form 10-K filed March 1, 2011) | ||
Bunge Limited 2016 Equity Incentive Plan (incorporated by reference from the Registrant's Definitive Proxy Statement filed April 15, 2016) | ||
Form of Global Stock Option Agreement under the 2016 Bunge Limited Equity Incentive Plan (incorporated by reference from the Registrant's Form 10-K filed February 28, 2017) | ||
Form of Global Restricted Stock Unit Agreement under the 2016 Bunge Limited Equity Incentive Plan (for RSUs subject to pro rata vesting) (incorporated by reference from the Registrant's Form 10-K filed February 28, 2017) | ||
Form of Global Restricted Stock Unit Agreement under the 2016 Bunge Limited Equity Incentive Plan (for RSUs subject to cliff vesting) (incorporated by reference from the Registrant's Form 10-K filed February 28, 2017) | ||
Form of Global Performance Unit Agreement under the 2016 Bunge Limited Equity Incentive Plan (incorporated by reference from the Registrant's Form 10-K filed February 28, 2017) | ||
Bunge Limited 2007 Non-Employee Directors' Equity Incentive Plan (Amended and Restated as of December 31, 2008) (incorporated by reference from the Registrant's Form 10-K filed March 2, 2009) | ||
Form of Deferred Restricted Stock Unit Award Agreement (effective as of 2007) under the Bunge Limited 2007 Non-Employee Directors' Equity Incentive Plan (incorporated by reference from the Registrant's Form 10-K filed March 3, 2008) | ||
Form of Restricted Stock Unit Award Agreement under the Bunge Limited 2007 Non-Employee Directors' Equity Incentive Plan (incorporated by reference from the Registrant's Form 10-K filed March 1, 2010) | ||
Bunge Limited 2017 Non-Employee Directors Equity Incentive Plan (incorporated by reference from the Registrant's Definitive Proxy Statement filed April 13, 2017) | ||
* | Form of Restricted Stock Unit Award Agreement under the Bunge Limited 2017 Non-Employee Directors Equity Incentive Plan | |
Bunge Limited Deferred Compensation Plan for Non-Employee Directors (Amended and Restated as of December 31, 2008) (incorporated by reference from the Registrant's Form 10-K filed March 2, 2009) | ||
Bunge Excess Benefit Plan (Amended and Restated as of January 1, 2009) (incorporated by reference from the Registrant's Form 10-K filed March 2, 2009) | ||
60
Exhibit Number | Description | ||
Bunge Excess Contribution Plan (Amended and Restated as of January 1, 2009) (incorporated by reference from the Registrant's Form 10-K filed March 2, 2009) | |||
Bunge U.S. SERP (Amended and Restated as of January 1, 2011) (incorporated by reference from the Registrant's Form 10-K filed March 1, 2011) | |||
Bunge Limited Employee Deferred Compensation Plan (effective January 1, 2008) (incorporated by reference from the Registrant's Form 10-K filed March 2, 2009) | |||
Bunge Limited Annual Incentive Plan (effective January 1, 2011) (incorporated by reference from the Registrant's Definitive Proxy Statement filed April 16, 2010) | |||
Description of Non-Employee Directors' Compensation (effective as of January 1, 2014) | |||
Offer Letter, dated as of June 14, 2011, for Gordon Hardie (incorporated by reference from the Registrant's Form 10-Q filed on August 9, 2011) | |||
Offer Letter, dated as of September 24, 2010, for Raul Padilla (incorporated by reference from the Registrant's Form 10-Q filed on November 9, 2011) | |||
Employment Agreement, dated as of February 6, 2013, between Bunge Limited and Soren Schroder (incorporated by reference from the Registrant's Form 8-K filed February 7, 2013) | |||
Offer Letter, dated as of April 11, 2014 for Brian Thomsen (incorporated by reference from the Registrant's Form 10-K filed February 28, 2017) | |||
Offer Letter, dated as of December 7, 2016, for Thomas Boehlert (incorporated by reference from the Registrant's Form 10-K filed February 28, 2017) | |||
Form of Executive Change of Control Agreement (incorporated by reference from the Registrant’s Form 10-Q filed November 1, 2017) | |||
* | Computation of Ratio of Earnings to Fixed Charges | ||
* | Subsidiaries of the Registrant | ||
* | Consent of Deloitte & Touche LLP | ||
* | Certification of Bunge Limited's Chief Executive Officer pursuant to Section 302 of the Sarbanes Oxley Act | ||
* | Certification of Bunge Limited's Chief Financial Officer pursuant to Section 302 of the Sarbanes Oxley Act | ||
* | Certification of Bunge Limited's Chief Executive Officer pursuant to Section 906 of the Sarbanes Oxley Act | ||
* | Certification of Bunge Limited's Chief Financial Officer pursuant to Section 906 of the Sarbanes Oxley Act | ||
101 | * | The following financial information from Bunge Limited's Annual Report on Form 10-K for the fiscal year ended December 31, 2017 formatted in Extensible Business Reporting Language (XBRL): (i) the Consolidated Statements of Income, (ii) the Consolidated Balance Sheets, (iii) the Consolidated Statements of Cash Flows, (iv) the Consolidated Statements of Shareholders' Equity, (v) the Notes to the Consolidated Financial Statements and (vi) Schedule II—Valuation and Qualifying Accounts | |
* | Filed herewith. |
++ | Portions of this exhibit have been omitted and filed separately with the Securities and Exchange Commission as part of an application for confidential treatment pursuant to Rule 24b-2 of the Securities Exchange Act of 1934, as amended. |
61
BUNGE LIMITED
Schedule II—Valuation and Qualifying Accounts
(US$ in millions)
Description | Balance at beginning of period | Charged to costs and expenses | Charged to other accounts(b) | Deductions from reserves | Balance at end of period | ||||||||||||||
FOR THE YEAR ENDED DECEMBER 31, 2015 | |||||||||||||||||||
Allowances for doubtful accounts(a) | $ | 247 | 64 | (47 | ) | (54 | ) | (c) | $ | 210 | |||||||||
Allowances for secured advances to suppliers | $ | 61 | 11 | (21 | ) | (9 | ) | $ | 42 | ||||||||||
Allowances for recoverable taxes | $ | 43 | 7 | (16 | ) | (2 | ) | $ | 32 | ||||||||||
Income tax valuation allowances | $ | 1,078 | 44 | (324 | ) | — | $ | 798 | |||||||||||
FOR THE YEAR ENDED DECEMBER 31, 2016 | |||||||||||||||||||
Allowances for doubtful accounts(a) | $ | 210 | 45 | 15 | (58 | ) | (c) | $ | 212 | ||||||||||
Allowances for secured advances to suppliers | $ | 42 | 1 | 9 | (2 | ) | $ | 50 | |||||||||||
Allowances for recoverable taxes | $ | 32 | 162 | 1 | (160 | ) | $ | 35 | |||||||||||
Income tax valuation allowances | $ | 798 | (44 | ) | 85 | — | $ | 839 | |||||||||||
FOR THE YEAR ENDED DECEMBER 31, 2017 | |||||||||||||||||||
Allowances for doubtful accounts(a) | $ | 212 | 42 | (1 | ) | (70 | ) | (c) | $ | 183 | |||||||||
Allowances for secured advances to suppliers | $ | 50 | 20 | — | (5 | ) | $ | 65 | |||||||||||
Allowances for recoverable taxes | $ | 35 | 12 | (1 | ) | (7 | ) | $ | 39 | ||||||||||
Income tax valuation allowances | $ | 839 | 43 | 18 | — | $ | 900 | ||||||||||||
(a) | This includes an allowance for doubtful accounts for current and non-current trade accounts receivables. |
(b) | This consists primarily of foreign currency translation adjustments. |
(c) | Such amounts include write-offs of uncollectible accounts and recoveries. |
E-1
INDEX TO CONSOLIDATED FINANCIAL STATEMENTS
Page | ||
Consolidated Financial Statements | ||
Report of Independent Registered Public Accounting Firm | ||
Consolidated Statements of Income for the Years Ended December 31, 2017, 2016 and 2015 | ||
Consolidated Statements of Comprehensive Income (Loss) for the Years Ended December 31, 2017, 2016 and 2015 | ||
Consolidated Balance Sheets at December 31, 2017 and 2016 | ||
Consolidated Statements of Cash Flows for the Years Ended December 31, 2017, 2016 and 2015 | ||
Consolidated Statements of Changes in Equity and Redeemable Noncontrolling Interests for the Years Ended December 31, 2017, 2016 and 2015 | ||
Notes to the Consolidated Financial Statements | ||
F-1
REPORT OF INDEPENDENT REGISTERED PUBLIC ACCOUNTING FIRM
To the Shareholders and the Board of Directors of Bunge Limited
Opinion on the Financial Statements
We have audited the accompanying consolidated balance sheets of Bunge Limited and subsidiaries (the "Company") as of December 31, 2017 and 2016, and the related consolidated statements of income, comprehensive income (loss), changes in equity and redeemable noncontrolling interests, and cash flows, for each of the three years in the period ended December 31, 2017, and the related notes and the schedules listed in the Index at Item 15 (collectively referred to as the "financial statements"). In our opinion, such consolidated financial statements present fairly, in all material respects, the financial position of Bunge Limited and subsidiaries as of December 31, 2017 and 2016, and the results of their operations and their cash flows for each of the three years in the period ended December 31, 2017, in conformity with accounting principles generally accepted in the United States of America.
We have also audited, in accordance with the standards of the Public Company Accounting Oversight Board (United States) (PCAOB), the Company's internal control over financial reporting as of December 31, 2017, based on the criteria established in Internal Control-Integrated Framework (2013) issued by the Committee of Sponsoring Organizations of the Treadway Commission and our report dated February 23, 2018 expressed an unqualified opinion on the Company's internal control over financial reporting.
Basis for Opinion
These financial statements are the responsibility of the Company's management. Our responsibility is to express an opinion on the Company’s financial statements based on our audits. We are a public accounting firm registered with the PCAOB and are required to be independent with respect to the Company in accordance with the U.S. federal securities laws and the applicable rules and regulations of the Securities and Exchange Commission and the PCAOB.
We conducted our audits in accordance with the standards of the PCAOB. Those standards require that we plan and perform the audit to obtain reasonable assurance about whether the financial statements are free of material misstatement, whether due to error or fraud. Our audits included performing procedures to assess the risks of material misstatement of the financial statements, whether due to error or fraud, and performing procedures that respond to those risks. Such procedures included examining, on a test basis, evidence regarding the amounts and disclosures in the financial statements. Our audits also included evaluating the accounting principles used and significant estimates made by management, as well as evaluating the overall presentation of the financial statements. We believe that our audits provide a reasonable basis for our opinion.
/s/ Deloitte & Touche LLP |
New York, New York |
February 23, 2018 |
We have served as the Company's auditor since 2002. |
F-2
PART I—FINANCIAL INFORMATION
ITEM 1. FINANCIAL STATEMENTS
BUNGE LIMITED AND SUBSIDIARIES
CONSOLIDATED STATEMENTS OF INCOME
(U.S. dollars in millions, except per share data)
Year Ended December 31, | ||||||||||||
2017 | 2016 | 2015 | ||||||||||
Net sales | $ | 45,794 | $ | 42,679 | $ | 43,455 | ||||||
Cost of goods sold | (44,030 | ) | (40,269 | ) | (40,762 | ) | ||||||
Gross profit | 1,764 | 2,410 | 2,693 | |||||||||
Selling, general and administrative expenses | (1,445 | ) | (1,286 | ) | (1,435 | ) | ||||||
Interest income | 38 | 51 | 43 | |||||||||
Interest expense | (263 | ) | (234 | ) | (258 | ) | ||||||
Foreign currency gains (losses) | 95 | (8 | ) | (8 | ) | |||||||
Other income (expense)—net | 49 | 12 | (18 | ) | ||||||||
Gain on disposition of equity interests/subsidiaries and sale of assets | 9 | 122 | 47 | |||||||||
Equity investment impairments | (17 | ) | (59 | ) | — | |||||||
Goodwill and intangible impairments | — | (12 | ) | (13 | ) | |||||||
Income (loss) from continuing operations before income tax | 230 | 996 | 1,051 | |||||||||
Income tax (expense) benefit | (56 | ) | (220 | ) | (296 | ) | ||||||
Income (loss) from continuing operations | 174 | 776 | 755 | |||||||||
Income (loss) from discontinued operations, net of tax | — | (9 | ) | 35 | ||||||||
Net income (loss) | 174 | 767 | 790 | |||||||||
Net (income) loss attributable to noncontrolling interests | (14 | ) | (22 | ) | 1 | |||||||
Net income (loss) attributable to Bunge | 160 | 745 | 791 | |||||||||
Convertible preference share dividends and other obligations | (34 | ) | (36 | ) | (53 | ) | ||||||
Net income (loss) available to Bunge common shareholders | $ | 126 | $ | 709 | $ | 738 | ||||||
Earnings (loss) per common share—basic (Note 24) | ||||||||||||
Net income (loss) from continuing operations | $ | 0.90 | $ | 5.13 | $ | 4.90 | ||||||
Net income (loss) from discontinued operations | — | (0.06 | ) | 0.24 | ||||||||
Net income (loss) attributable to Bunge common shareholders | $ | 0.90 | $ | 5.07 | $ | 5.14 | ||||||
Earnings (loss) per common share—diluted (Note 24) | ||||||||||||
Net income (loss) from continuing operations | $ | 0.89 | $ | 5.07 | $ | 4.84 | ||||||
Net income (loss) from discontinued operations | — | (0.06 | ) | 0.23 | ||||||||
Net income (loss) attributable to Bunge common shareholders | $ | 0.89 | $ | 5.01 | $ | 5.07 | ||||||
The accompanying notes are an integral part of these consolidated financial statements.
F-3
BUNGE LIMITED AND SUBSIDIARIES
CONSOLIDATED STATEMENTS OF COMPREHENSIVE INCOME (LOSS)
(U.S. dollars in millions)
Year Ended December 31, | ||||||||||||
2017 | 2016 | 2015 | ||||||||||
Net income (loss) | $ | 174 | $ | 767 | $ | 790 | ||||||
Other comprehensive income (loss): | ||||||||||||
Foreign currency translation adjustment | 203 | 713 | (2,550 | ) | ||||||||
Unrealized gains (losses) on designated cash flow and net investment hedges, net of tax (expense) benefit of $(1), nil and nil | (105 | ) | (305 | ) | 147 | |||||||
Unrealized gains (losses) on investments, net of tax (expense) benefit of $(1), nil and nil | 2 | — | — | |||||||||
Reclassification of realized net losses (gains) to net income, net of tax expense (benefit) of $2, nil and nil | (41 | ) | (11 | ) | 77 | |||||||
Pension adjustment, net of tax (expense) benefit of $(4), $4 and $1 | 5 | (11 | ) | 20 | ||||||||
Total other comprehensive income (loss) | 64 | 386 | (2,306 | ) | ||||||||
Total comprehensive income (loss) | 238 | 1,153 | (1,516 | ) | ||||||||
Less: comprehensive (income) loss attributable to noncontrolling interest | (30 | ) | (26 | ) | 5 | |||||||
Total comprehensive income (loss) attributable to Bunge | $ | 208 | $ | 1,127 | $ | (1,511 | ) | |||||
The accompanying notes are an integral part of these consolidated financial statements.
F-4
BUNGE LIMITED AND SUBSIDIARIES
CONSOLIDATED BALANCE SHEETS
(U.S. dollars in millions, except share data)
December 31, 2017 | December 31, 2016 | |||||||
ASSETS | ||||||||
Current assets: | ||||||||
Cash and cash equivalents | $ | 601 | $ | 934 | ||||
Time deposits under trade structured finance program (Note 4) | — | 64 | ||||||
Trade accounts receivable (less allowances of $107 and $122) (Note 18) | 1,501 | 1,676 | ||||||
Inventories (Note 5) | 5,074 | 4,773 | ||||||
Other current assets (Note 6) | 3,227 | 3,645 | ||||||
Total current assets | 10,403 | 11,092 | ||||||
Property, plant and equipment, net (Note 7) | 5,310 | 5,099 | ||||||
Goodwill (Note 8) | 515 | 373 | ||||||
Other intangible assets, net (Note 9) | 323 | 336 | ||||||
Investments in affiliates (Note 11) | 461 | 373 | ||||||
Deferred income taxes (Note 14) | 516 | 524 | ||||||
Time deposits under trade structured finance program (Note 4) | 315 | 464 | ||||||
Other non-current assets (Note 12) | 1,028 | 927 | ||||||
Total assets | $ | 18,871 | $ | 19,188 | ||||
LIABILITIES AND EQUITY | ||||||||
Current liabilities: | ||||||||
Short-term debt (Note 16) | $ | 304 | $ | 257 | ||||
Current portion of long-term debt (Note 17) | 15 | 938 | ||||||
Letter of credit obligations under trade structured finance program (Note 4) | 315 | 528 | ||||||
Trade accounts payable (includes $583 and $522 carried at fair value) | 3,395 | 3,485 | ||||||
Other current liabilities (Note 13) | 2,186 | 2,476 | ||||||
Total current liabilities | 6,215 | 7,684 | ||||||
Long-term debt (Note 17) | 4,160 | 3,069 | ||||||
Deferred income taxes (Note 14) | 223 | 239 | ||||||
Other non-current liabilities | 916 | 853 | ||||||
Commitments and contingencies (Note 21) | ||||||||
Equity (Note 23): | ||||||||
Convertible perpetual preference shares, par value $.01; authorized, issued and outstanding: 2017—6,899,700 shares and 2016—6,900,000 shares (liquidation preference $100 per share) | 690 | 690 | ||||||
Common shares, par value $.01; authorized—400,000,000 shares; issued and outstanding: 2017—140,646,829 shares, 2016—139,500,862 shares | 1 | 1 | ||||||
Additional paid-in capital | 5,226 | 5,143 | ||||||
Retained earnings | 8,081 | 8,208 | ||||||
Accumulated other comprehensive income (loss) (Note 23) | (5,930 | ) | (5,978 | ) | ||||
Treasury shares, at cost—2017 and 2016—12,882,313 shares | (920 | ) | (920 | ) | ||||
Total Bunge shareholders' equity | 7,148 | 7,144 | ||||||
Noncontrolling interests | 209 | 199 | ||||||
Total equity | 7,357 | 7,343 | ||||||
Total liabilities and equity | $ | 18,871 | $ | 19,188 | ||||
The accompanying notes are an integral part of these consolidated financial statements.
F-5
BUNGE LIMITED AND SUBSIDIARIES
CONSOLIDATED STATEMENTS OF CASH FLOWS
(U.S. dollars in millions)
Year Ended December 31, | ||||||||||||
2017 | 2016 | 2015 | ||||||||||
OPERATING ACTIVITIES | ||||||||||||
Net income | $ | 174 | $ | 767 | $ | 790 | ||||||
Adjustments to reconcile net income to cash provided by (used for) operating activities: | ||||||||||||
Impairment charges | 52 | 87 | 57 | |||||||||
Foreign currency loss (gain) on debt | 21 | 80 | (213 | ) | ||||||||
Gain on disposition of equity interests/subsidiaries and sale of assets | (9 | ) | (122 | ) | (47 | ) | ||||||
Bad debt expense | 28 | 13 | 35 | |||||||||
Depreciation, depletion and amortization | 609 | 547 | 545 | |||||||||
Share-based compensation expense | 29 | 44 | 46 | |||||||||
Deferred income tax expense (benefit) | (23 | ) | 126 | 16 | ||||||||
Other, net | 24 | 15 | (26 | ) | ||||||||
Changes in operating assets and liabilities, excluding the effects of acquisitions: | ||||||||||||
Trade accounts receivable | 95 | (131 | ) | (97 | ) | |||||||
Inventories | (130 | ) | (269 | ) | 314 | |||||||
Secured advances to suppliers | 172 | 38 | (397 | ) | ||||||||
Trade accounts payable | 25 | 708 | (88 | ) | ||||||||
Advances on sales | 11 | 36 | 22 | |||||||||
Net unrealized gain (loss) on derivative contracts | 105 | (84 | ) | (16 | ) | |||||||
Margin deposits | (5 | ) | 199 | (154 | ) | |||||||
Recoverable and income taxes, net | (78 | ) | (178 | ) | (36 | ) | ||||||
Accrued liabilities | 25 | (148 | ) | (7 | ) | |||||||
Marketable Securities | (128 | ) | 76 | (71 | ) | |||||||
Other, net | 9 | 100 | (63 | ) | ||||||||
Cash provided by (used for) operating activities | 1,006 | 1,904 | 610 | |||||||||
INVESTING ACTIVITIES | ||||||||||||
Payments made for capital expenditures | (662 | ) | (784 | ) | (649 | ) | ||||||
Acquisitions of businesses (net of cash acquired) | (369 | ) | (34 | ) | (347 | ) | ||||||
Proceeds from investments | 961 | 802 | 295 | |||||||||
Payments for investments | (944 | ) | (553 | ) | (235 | ) | ||||||
Settlement of net investment hedges | (20 | ) | (375 | ) | 203 | |||||||
Proceeds from disposals of property, plant and equipment | 16 | 27 | 13 | |||||||||
Proceeds from sale of grain assets in Canada and investments in affiliates | — | — | 88 | |||||||||
Payments for investments in affiliates | (126 | ) | (40 | ) | (167 | ) | ||||||
Other, net | (18 | ) | 31 | (3 | ) | |||||||
Cash provided by (used for) investing activities | (1,162 | ) | (926 | ) | (802 | ) | ||||||
FINANCING ACTIVITIES | ||||||||||||
Net change in short-term debt with maturities of 90 days or less | 18 | (206 | ) | (176 | ) | |||||||
Proceeds from short-term debt with maturities greater than 90 days | 248 | 428 | 713 | |||||||||
Repayments of short-term debt with maturities greater than 90 days | (224 | ) | (477 | ) | (350 | ) | ||||||
Proceeds from long-term debt | 9,054 | 10,396 | 9,354 | |||||||||
Repayments of long-term debt | (9,010 | ) | (10,080 | ) | (8,659 | ) | ||||||
Proceeds from the exercise of options for common shares | 59 | — | 25 | |||||||||
Repurchases of common shares | — | (200 | ) | (300 | ) | |||||||
Dividends paid to preference shareholders | (34 | ) | (34 | ) | (34 | ) | ||||||
Dividends paid to common shareholders | (247 | ) | (223 | ) | (207 | ) | ||||||
Dividends paid to noncontrolling interests | (16 | ) | (25 | ) | (8 | ) | ||||||
Capital contributions (return of capital) from noncontrolling interests, net | (5 | ) | (10 | ) | (13 | ) | ||||||
Acquisition of noncontrolling interest | — | (39 | ) | — | ||||||||
Other, net | (23 | ) | (18 | ) | 15 | |||||||
Cash provided by (used for) financing activities | (180 | ) | (488 | ) | 360 | |||||||
Effect of exchange rate changes on cash and cash equivalents | 3 | 33 | (119 | ) | ||||||||
Net increase (decrease) in cash and cash equivalents | (333 | ) | 523 | 49 | ||||||||
Cash and cash equivalents, beginning of period | 934 | 411 | 362 | |||||||||
Cash and cash equivalents, end of period | $ | 601 | $ | 934 | $ | 411 | ||||||
The accompanying notes are an integral part of these consolidated financial statements.
F-6
BUNGE LIMITED AND SUBSIDIARIES
CONSOLIDATED STATEMENTS OF CHANGES IN EQUITY AND REDEEMABLE NONCONTROLLING INTERESTS
(U.S. dollars in millions, except share data)
Convertible Preference Shares | Common Shares | ||||||||||||||||||||||||||||||||||||||||
Redeemable Non- Controlling Interests | Shares | Amount | Shares | Amount | Additional Paid-in Capital | Retained Earnings | Accumulated Other Comprehensive Income (Loss) | Treasury Shares | Non- Controlling Interests | Total Equity | |||||||||||||||||||||||||||||||
Balance, January 1, 2015 | $ | 37 | 6,900,000 | $ | 690 | 145,703,198 | $ | 1 | $ | 5,053 | $ | 7,180 | $ | (4,058 | ) | $ | (420 | ) | $ | 244 | $ | 8,690 | |||||||||||||||||||
Net income (loss) | (14 | ) | — | — | — | — | — | 791 | — | — | (1 | ) | 790 | ||||||||||||||||||||||||||||
Accretion of noncontrolling interests | 19 | — | — | — | — | (19 | ) | — | — | — | — | (19 | ) | ||||||||||||||||||||||||||||
Other comprehensive income (loss) | (5 | ) | — | — | — | — | — | — | (2,302 | ) | — | (4 | ) | (2,306 | ) | ||||||||||||||||||||||||||
Dividends on common shares | — | — | — | — | — | — | (212 | ) | — | — | — | (212 | ) | ||||||||||||||||||||||||||||
Dividends on preference shares | — | — | — | — | — | — | (34 | ) | — | — | — | (34 | ) | ||||||||||||||||||||||||||||
Dividends to noncontrolling interests on subsidiary common stock | — | — | — | — | — | — | — | — | — | (9 | ) | (9 | ) | ||||||||||||||||||||||||||||
Return of capital to noncontrolling interests | — | — | — | — | — | — | — | — | — | (19 | ) | (19 | ) | ||||||||||||||||||||||||||||
Share-based compensation expense | — | — | — | — | — | 46 | — | — | — | — | 46 | ||||||||||||||||||||||||||||||
Repurchase of common shares | — | — | — | (3,871,810 | ) | — | — | — | — | (300 | ) | — | (300 | ) | |||||||||||||||||||||||||||
Issuance of common shares | — | — | — | 652,079 | — | 25 | — | — | — | — | 25 | ||||||||||||||||||||||||||||||
Balance, December 31, 2015 | $ | 37 | 6,900,000 | $ | 690 | 142,483,467 | $ | 1 | $ | 5,105 | $ | 7,725 | $ | (6,360 | ) | $ | (720 | ) | $ | 211 | $ | 6,652 | |||||||||||||||||||
Net income (loss) | 1 | — | — | — | — | — | 745 | — | — | 22 | 767 | ||||||||||||||||||||||||||||||
Accretion of noncontrolling interests | 2 | — | — | — | — | (2 | ) | — | — | — | — | (2 | ) | ||||||||||||||||||||||||||||
Other comprehensive income (loss) | (1 | ) | — | — | — | — | — | — | 382 | — | 4 | 386 | |||||||||||||||||||||||||||||
Dividends on common shares | — | — | — | — | — | — | (228 | ) | — | — | — | (228 | ) | ||||||||||||||||||||||||||||
Dividends on preference shares | — | — | — | — | — | — | (34 | ) | — | — | — | (34 | ) | ||||||||||||||||||||||||||||
Dividends to noncontrolling interests on subsidiary common stock | — | — | — | — | — | — | — | — | — | (25 | ) | (25 | ) | ||||||||||||||||||||||||||||
Noncontrolling decrease from redemption | — | — | — | — | — | — | — | — | — | (6 | ) | (6 | ) | ||||||||||||||||||||||||||||
Acquisition of Noncontrolling interest | (39 | ) | — | — | — | — | (2 | ) | — | — | — | 19 | 17 | ||||||||||||||||||||||||||||
Deconsolidation of a subsidiary | — | — | — | — | — | — | — | — | — | (26 | ) | (26 | ) | ||||||||||||||||||||||||||||
Share-based compensation expense | — | — | — | — | — | 44 | — | — | — | — | 44 | ||||||||||||||||||||||||||||||
Repurchase of common shares | — | — | — | (3,296,230 | ) | — | — | — | — | (200 | ) | — | (200 | ) | |||||||||||||||||||||||||||
Issuance of common shares | — | — | — | 313,625 | — | (2 | ) | — | — | — | — | (2 | ) | ||||||||||||||||||||||||||||
Balance, December 31, 2016 | $ | — | 6,900,000 | $ | 690 | 139,500,862 | $ | 1 | $ | 5,143 | $ | 8,208 | $ | (5,978 | ) | $ | (920 | ) | $ | 199 | $ | 7,343 | |||||||||||||||||||
Net income (loss) | — | — | — | — | — | 160 | — | — | 14 | 174 | |||||||||||||||||||||||||||||||
Accretion of noncontrolling interests | — | — | — | — | — | — | — | — | — | — | |||||||||||||||||||||||||||||||
Other comprehensive income (loss) | — | — | — | — | — | — | 48 | — | 16 | 64 | |||||||||||||||||||||||||||||||
Dividends on common shares | — | — | — | — | — | — | (253 | ) | — | — | — | (253 | ) | ||||||||||||||||||||||||||||
Dividends on preference shares | — | — | — | — | — | — | (34 | ) | — | — | — | (34 | ) | ||||||||||||||||||||||||||||
Dividends to noncontrolling interests on subsidiary common stock | — | — | — | — | — | — | — | — | — | (15 | ) | (15 | ) | ||||||||||||||||||||||||||||
Noncontrolling decrease from redemption | — | — | — | — | — | — | — | — | — | (5 | ) | (5 | ) | ||||||||||||||||||||||||||||
Acquisition of Noncontrolling interest | — | — | — | — | — | — | — | — | — | — | |||||||||||||||||||||||||||||||
Deconsolidation of a subsidiary | — | — | — | — | — | — | — | — | — | — | — | ||||||||||||||||||||||||||||||
Share-based compensation expense | — | — | — | — | — | 29 | — | — | — | — | 29 | ||||||||||||||||||||||||||||||
Repurchase of common shares | — | — | — | — | — | — | — | — | — | — | — | ||||||||||||||||||||||||||||||
Issuance of common shares | — | (300 | ) | — | 1,145,967 | — | 54 | — | — | — | — | 54 | |||||||||||||||||||||||||||||
Balance, December 31, 2017 | $ | — | 6,899,700 | $ | 690 | 140,646,829 | $ | 1 | $ | 5,226 | $ | 8,081 | $ | (5,930 | ) | $ | (920 | ) | $ | 209 | $ | 7,357 | |||||||||||||||||||
The accompanying notes are an integral part of these consolidated financial statements.
F-7
BUNGE LIMITED AND SUBSIDIARIES
NOTES TO THE CONSOLIDATED FINANCIAL STATEMENTS
1. NATURE OF BUSINESS, BASIS OF PRESENTATION, AND SIGNIFICANT ACCOUNTING POLICIES
Description of Business—Bunge Limited, a Bermuda holding company, together with its consolidated subsidiaries and variable interest entities ("VIEs") in which it is considered the primary beneficiary, through which its businesses are conducted (collectively "Bunge" or "the Company"), is an integrated, global Agribusiness and Food company. Bunge's common shares trade on the New York Stock Exchange under the ticker symbol "BG." Bunge operates in four principal business areas, which include five reportable segments: Agribusiness, Edible Oil Products, Milling Products, Sugar and Bioenergy and Fertilizer.
Agribusiness—Bunge's Agribusiness segment is an integrated, global business involved in the purchase, storage, transport, processing and sale of agricultural commodities and commodity products. Bunge's agribusiness operations and assets are located in North America, South America, Europe and Asia-Pacific with merchandising and distribution offices throughout the world.
Bunge's Agribusiness segment also participates in related financial activities, such as offering trade structured finance, which leverages its international trade flows, providing risk management services to customers by assisting them with managing price exposure to agricultural commodities, proprietary trading of foreign exchange and other financial instruments and developing private investment vehicles to invest in businesses complementary to Bunge's commodities operations.
Edible Oil products—Bunge's Edible Oil Products segment produces and sells edible oil products, such as packaged and bulk oils, shortenings, margarine, mayonnaise and other products derived from the vegetable oil refining process. Bunge's edible oil products operations are located in North America, South America, Europe and Asia-Pacific.
Milling products—Bunge's Milling Products segment includes wheat, corn and rice milling businesses, which purchase wheat, corn and rice directly from farmers and dealers and process them into milled products for food processors, bakeries, brewers, snack food producers and other customers. Bunge's wheat milling activities are primarily in Mexico and Brazil. Corn and rice milling activities are in the United States and Mexico.
Sugar and Bioenergy—Bunge's Sugar and Bioenergy segment includes its global sugar merchandising and distribution activities, sugar and ethanol production in Brazil, and ethanol production investments. This segment is an integrated business involved in the growing and harvesting of sugarcane primarily from land managed through agricultural partnership agreements and additional sourcing of sugarcane from third parties to be processed at its eight mills in Brazil to produce sugar, ethanol and electricity. The Sugar and Bioenergy segment is also a merchandiser and distributor of sugar and ethanol within Brazil and a global merchandiser and distributor of sugar through its global trading offices. In addition, the segment includes investments in corn-based ethanol producers in the United States and Argentina.
Fertilizer—Bunge's Fertilizer segment operates in Argentina, Uruguay and Paraguay, where we produce, blend and distribute a range of liquid and dry NPK fertilizers, including nitrogen-based liquid and solid phosphate fertilizers. Our operations in Argentina are closely linked to our grain origination activities as we supply fertilizer to producers who supply us with grain. This segment also includes port operations in Brazil and Argentina.
Basis of Presentation—The consolidated financial statements are prepared in conformity with accounting principles generally accepted in the United States of America ("U.S. GAAP").
Discontinued Operations—In determining whether a disposal group should be presented as discontinued operations, Bunge makes a determination of whether such a group being disposed of comprises a component of the entity, or a group of components of the entity, that represents a strategic shift that has, or will have, a major effect on the Company's operations and financial results. If these determinations are made affirmatively, the results of operations of the group being disposed of (as well as any gain or loss on the disposal transaction) are aggregated for separate presentation apart from the continuing operations of the Company for all periods presented in the consolidated financial statements.
Principles of Consolidation—The accompanying consolidated financial statements include the accounts of Bunge, its subsidiaries and VIEs in which Bunge is considered to be the primary beneficiary, and as a result, include the assets, liabilities, revenues and expenses of all entities over which Bunge exercises control. Equity investments in which Bunge has the ability to exercise significant influence but does not control are accounted for by the equity method of accounting. Investments in which Bunge does not exercise significant influence are accounted for by the cost method of accounting. Intercompany accounts and transactions are eliminated. Bunge consolidates VIEs in which it is considered to be the primary beneficiary and reconsiders such conclusion at each reporting period. An enterprise is determined to be the primary beneficiary if it has a controlling financial interest under U.S. GAAP, defined as (a) the power to direct the activities of a VIE that most significantly impact the
F-8
BUNGE LIMITED AND SUBSIDIARIES
NOTES TO THE CONSOLIDATED FINANCIAL STATEMENTS (Continued)
1. NATURE OF BUSINESS, BASIS OF PRESENTATION, AND SIGNIFICANT ACCOUNTING POLICIES (Continued)
VIE's business and (b) the obligation to absorb losses of or the right to receive benefits from the VIE that could potentially be significant to the VIE's operations. Performance of that analysis requires the exercise of judgment.
Noncontrolling interests in subsidiaries related to Bunge's ownership interests of less than 100% are reported as noncontrolling interests in the consolidated balance sheets. The noncontrolling ownership interests in Bunge's earnings, net of tax, is reported as net (income) loss attributable to noncontrolling interests in the consolidated statements of income.
Reclassifications—Certain prior year amounts have been reclassified to conform to current year presentation.
Use of Estimates—The preparation of consolidated financial statements in conformity with U.S. GAAP requires the application of accounting policies that often require management to make substantial judgment or estimation in their application. These judgments and estimations may significantly affect reported amounts of assets and liabilities and disclosure of contingent assets and liabilities at the date of the financial statements. They may also affect reported amounts of revenues and expenses. Actual results could differ from those estimates.
Translation of Foreign Currency Financial Statements—Bunge's reporting currency is the U.S. dollar. The functional currency of the majority of Bunge's foreign subsidiaries is their local currency and, as such, amounts included in the consolidated statements of income, comprehensive income (loss), cash flows and changes in equity are translated using average exchange rates during each period. Assets and liabilities are translated at period-end exchange rates and resulting foreign currency translation adjustments are recorded in the consolidated balance sheets as a component of accumulated other comprehensive income (loss).
Foreign Currency Transactions—Monetary assets and liabilities denominated in currencies other than the functional currency are remeasured into their respective functional currencies at exchange rates in effect at the balance sheet date. The resulting exchange gain or loss is included in Bunge's consolidated statements of income as foreign exchange gain (loss) unless the remeasurement gain or loss relates to an intercompany transaction that is of a long-term investment nature and for which settlement is not planned or anticipated in the foreseeable future. Gains or losses arising from translation of such transactions are reported as a component of accumulated other comprehensive income (loss) in Bunge's consolidated balance sheets.
Cash and Cash Equivalents—Cash and cash equivalents include time deposits and readily marketable securities with original maturity dates of three months or less at the time of acquisition.
Trade Accounts Receivable and Secured Advances to Suppliers—Trade accounts receivable and secured advances to suppliers are stated at their historical carrying amounts net of write-offs and allowances for uncollectible accounts. Bunge establishes an allowance for uncollectible trade accounts receivable and secured advances to farmers based on historical experience, farming economics and other market conditions as well as specific customer collection issues. Uncollectible accounts are written off when a settlement is reached for an amount below the outstanding historical balance or when Bunge has determined that collection is unlikely.
Secured advances to suppliers bear interest at contractual rates which reflect current market interest rates at the time of the transaction. There are no deferred fees or costs associated with these receivables. As a result, there are no imputed interest amounts to be amortized under the interest method. Interest income is calculated based on the terms of the individual agreements and is recognized on an accrual basis.
Bunge follows accounting guidance on the disclosure of the credit quality of financing receivables and the allowance for credit losses, which requires information to be disclosed at disaggregated levels, defined as portfolio segments and classes.
Under this guidance, a class of receivables is considered impaired, based on current information and events, if Bunge determines it probable that all amounts due under the original terms of the receivable will not be collected. Recognition of interest income is suspended once the farmer defaults on the originally scheduled delivery of agricultural commodities as the collection of future income is determined not to be probable. No additional interest income is accrued from the point of default until ultimate recovery, at which time amounts collected are credited first against the receivable and then to any unrecognized interest income.
Inventories—Readily marketable inventories ("RMI") are agricultural commodity inventories, such as soybeans, soybean meal, soybean oil, corn and wheat that are readily convertible to cash because of their commodity characteristics, widely available markets and international pricing mechanisms. All of Bunge's RMI are valued at fair value. These agricultural
F-9
BUNGE LIMITED AND SUBSIDIARIES
NOTES TO THE CONSOLIDATED FINANCIAL STATEMENTS (Continued)
1. NATURE OF BUSINESS, BASIS OF PRESENTATION, AND SIGNIFICANT ACCOUNTING POLICIES (Continued)
commodity inventories have quoted market prices in active markets, may be sold without significant further processing, and have predictable and insignificant disposal costs. Changes in the fair values of RMI are recognized in earnings as a component of cost of goods sold.
Inventories other than RMI are stated at the lower of cost or market by inventory product class. Cost is determined using primarily the weighted-average cost method.
Derivative Instruments and Hedging Activities—Bunge enters into derivative instruments to manage its exposure to movements associated with agricultural commodity prices, transportation costs, foreign currency exchange rates, interest rates, and energy costs. Bunge's use of these instruments is generally intended to mitigate the exposure to market variables (see Note 15).
Generally, derivative instruments are recorded at fair value in other current assets or other current liabilities in Bunge's consolidated balance sheets. Bunge assesses at the inception of a hedge whether any derivatives designated as hedges are highly effective in offsetting changes in the hedged items and, on an ongoing basis, qualitatively monitors whether that assertion is still met. The changes in fair values of derivative instruments designated as fair value hedges, along with the gains or losses on the related hedged items are recorded in earnings in the consolidated statements of income in the same caption as the hedged items. The changes in fair values of derivative instruments that are designated as cash flow hedges are recorded in accumulated other comprehensive income (loss) and are reclassified to earnings when the hedged cash flows affect earnings or when the hedge is no longer considered to be effective. In addition, Bunge may designate certain derivative instruments and nonderivative instruments as net investment hedges to hedge the exposure associated with its equity investments in foreign operations. When using forward derivative contracts as hedging instruments in a net investment hedge, all changes in the fair value of the derivative are recorded as a component of accumulated other comprehensive income (loss) in the consolidated balance sheets.
Marketable Securities and Other Short-Term Investments—Bunge classifies its marketable securities and short-term investments as available-for-sale, held-to-maturity or trading. Available-for-sale securities are reported at fair value with unrealized gains (losses) included in accumulated other comprehensive income (loss). Held-to-maturity investments represent financial assets in which Bunge has the intent and ability to hold to maturity. Trading securities are bought and held principally for the purpose of selling them in the near term and therefore held for only a short period of time. Bunge values its marketable securities at fair value and monitors its held-to-maturity investments for impairment periodically, and recognizes an impairment charge when the decline in fair value of an investment is judged to be other than temporary.
Recoverable Taxes—Recoverable taxes include value-added taxes paid upon the acquisition of raw materials and taxable services and other transactional taxes, which can be recovered in cash or as compensation against income taxes or other taxes owed by Bunge, primarily in Brazil and Europe. These recoverable tax payments are included in other current assets or other non-current assets based on their expected realization. In cases where Bunge determines that recovery is doubtful, recoverable taxes are reduced by allowances for the estimated unrecoverable amounts.
Property, Plant and Equipment, Net—Property, plant and equipment, net is stated at cost less accumulated depreciation and depletion. Major improvements that extend the life, capacity or efficiency or improve the safety of an asset are capitalized, while maintenance and repairs are expensed as incurred. Costs related to legal obligations associated with the future retirement of capitalized assets are capitalized as part of the cost of the related asset. Bunge generally capitalizes eligible costs to acquire or develop internal-use software that are incurred during the application development stage. Interest costs on borrowings during construction/completion periods of major capital projects are also capitalized.
Depreciation is computed based on the straight-line method over the estimated useful lives of the assets. Useful lives for property, plant and equipment are as follows:
Years | |
Biological assets | 5 - 7 |
Buildings | 10 - 50 |
Machinery and equipment | 7 - 25 |
Furniture, fixtures and other | 3 - 20 |
Computer software | 3 - 10 |
F-10
BUNGE LIMITED AND SUBSIDIARIES
NOTES TO THE CONSOLIDATED FINANCIAL STATEMENTS (Continued)
1. NATURE OF BUSINESS, BASIS OF PRESENTATION, AND SIGNIFICANT ACCOUNTING POLICIES (Continued)
Included in property, plant and equipment are biological assets, primarily sugarcane, that are stated at cost less accumulated depletion. Depletion is calculated using the estimated units of production based on the remaining useful life of the growing sugarcane.
Goodwill—Goodwill represents the cost in excess of the fair value of net assets acquired in a business acquisition. Goodwill is not amortized but is tested annually for impairment or between annual tests if events or circumstances indicate potential impairment. Bunge's annual impairment testing is generally performed during the fourth quarter of its fiscal year.
Goodwill is tested for impairment at the reporting unit level, which has been determined to be the Company's operating segments or one level below the operating segments in certain instances (see Note 8).
Impairment of Property, Plant and Equipment and Finite Lived Intangible Assets—Finite lived intangible assets include primarily trademarks, customer lists, and port facility usage rights and are amortized on a straight-line basis over their contractual or legal lives (see Note 9) or their estimated useful lives where such lives are not determined by law or contract.
Bunge reviews its property, plant and equipment and finite-lived intangible assets for impairment whenever events or changes in circumstances indicate that carrying amounts may not be recoverable. Bunge bases its evaluation of recoverability on such indicators as the nature, future economic benefits, and geographic locations of the assets, historical or future profitability measures, and other external market conditions. If these indicators result in the expected non-recoverability of the carrying amount of an asset or asset group, Bunge evaluates potential impairment using undiscounted estimated future cash flows. If such undiscounted future cash flows during the asset's remaining useful life are below its carrying value, a loss is recognized for the shortfall, measured by the present value of the estimated future cash flows or by third-party appraisals. Bunge records impairments related to property, plant and equipment and finite-lived intangible assets used in the processing of its products in cost of goods sold in its consolidated statements of income. Any impairment of marketing or brand assets is recognized in selling, general and administrative expenses in the consolidated statements of income (see Note 10).
Property, plant and equipment and other finite-lived intangible assets to be sold or otherwise disposed of are reported at the lower of carrying amount or fair value less cost to sell.
Impairment of Investments in Affiliates—Bunge reviews its investments annually or when an event or circumstances indicate that a potential decline in value may be other than temporary. Bunge considers various factors in determining whether to recognize an impairment charge, including the length of time that the fair value of the investment is expected to be below its carrying value, the financial condition, operating performance and near-term prospects of the affiliate and Bunge's intent and ability to hold the investment for a period of time sufficient to allow for recovery of the fair value. (see Note 10 and 11).
Share-Based Compensation—Bunge maintains equity incentive plans for its employees and non-employee directors (see Note 25). Bunge accounts for share-based compensation based on the grant date fair value. Share-based compensation expense is recognized on a straight-line basis over the requisite service period.
Income Taxes—Income tax expenses and benefits are recognized based on the tax laws and regulations in the jurisdictions in which Bunge's subsidiaries operate. Under Bermuda law, Bunge is not required to pay taxes in Bermuda on either income or capital gains. The provision for income taxes includes income taxes currently payable and deferred income taxes arising as a result of temporary differences between the carrying amounts of existing assets and liabilities in Bunge's financial statements and their respective tax bases. Deferred tax assets are reduced by valuation allowances if current evidence does not suggest that the deferred tax asset will be realized. Accrued interest and penalties related to unrecognized tax benefits are recognized in income tax (expense) benefit in the consolidated statements of income (see Note 14).
The calculation of tax liabilities involves management's judgments concerning uncertainties in the application of complex tax regulations in the many jurisdictions in which Bunge operates. Investment tax credits are recorded in income tax expense in the period in which such credits are granted.
Revenue Recognition—Sales of agricultural commodities, fertilizers and other products are recognized when persuasive evidence of an arrangement exists, the price is determinable, the product has been delivered, title to the product and risk of loss transfer to the customer, which is dependent on the agreed upon sales terms with the customer and when collection of the sale price is reasonably assured. Sales terms provide for passage of title either at the time and point of shipment or at the time and point of delivery of the product being sold. Net sales consist of gross sales less discounts related to promotional programs and
F-11
BUNGE LIMITED AND SUBSIDIARIES
NOTES TO THE CONSOLIDATED FINANCIAL STATEMENTS (Continued)
1. NATURE OF BUSINESS, BASIS OF PRESENTATION, AND SIGNIFICANT ACCOUNTING POLICIES (Continued)
sales taxes. Interest income on secured advances to suppliers is included in net sales due to its operational nature (see Note 6). Shipping and handling charges billed to customers are included in net sales and related costs are included in cost of goods sold.
Research and Development—Research and development costs are expensed as incurred. Research and development expenses were $20 million, $17 million and $16 million for the years ended December 31, 2017, 2016 and 2015, respectively.
New Accounting Pronouncements—In May 2017, the Financial Accounting Standards Board ("FASB") issued Accounting Standards Update ("ASU") 2017-10, Service Concession Arrangements (Topic 853): Determining the Customer of the Operation Services. Topic 853 provides guidance for operating entities when they enter into a service concession arrangement with a public-sector grantor who both:
• | Controls or has the ability to modify or approve the services to be provided with the infrastructure and the related price |
• | Controls, through ownership, beneficial entitlement, or otherwise, any residual interest in the infrastructure at the end of the term of the arrangement. |
In a service concession arrangement within the scope of Topic 853, the operating entity should not account for the infrastructure as a lease or as property, plant, and equipment. An operating entity should refer to other Topics to account for various aspects of a service concession arrangement. For example, an operating entity should account for revenue relating to construction, upgrade, or operation services in accordance with Topic 606, Revenue from Contracts with Customers. The amendments in this ASU apply to the accounting by operating entities for service concession arrangements within the scope of Topic 853. These updates will be effective when Bunge adopts the updates to Topic 606 on January 1, 2018. The adoption of this standard is not expected to have a material impact on Bunge's consolidated financial statements.
In May 2017, the FASB issued ASU 2017-09, Compensation - Stock Compensation (Topic 718): Scope of Modification Accounting. The new guidance requires an entity to apply modification accounting to share-based payment awards only if the fair value, vesting conditions, or classification of the award as equity or liability changes as a result of a change in terms or conditions of the award. The amendments in this ASU are effective for Bunge starting January 1, 2018. The amendments in the ASU should be applied prospectively to an award modified on or after the adoption date. The adoption of this standard is not expected to have a material impact on Bunge's consolidated financial statements.
In March 2017, the FASB issued ASU 2017-07, Compensation - Retirement Benefits (Topic 715): Improving the Presentation of Net Periodic Pension Cost and Net Periodic Postretirement Benefit Cost, which changes the presentation of net periodic benefit cost related to employer sponsored defined benefit plans and other postretirement benefits. Service cost should be included in the same income statement line item as other compensation costs arising from services rendered during the period, while other components of net periodic benefit pension cost should be presented separately outside of operating income. Additionally, only service costs may be capitalized in assets. The standard is effective for Bunge starting January 1, 2018. Entities should apply the guidance on the presentation of the components of net periodic benefit cost in the income statement retrospectively. The guidance limiting the capitalization of net periodic benefit cost in assets to the service cost component should be applied prospectively. The adoption of this standard is not expected to have a material impact on Bunge’s consolidated financial statements.
In February 2017, the FASB issued ASU 2017-05, Other Income-Gains and Losses from the Derecognition of Nonfinancial Assets (Subtopic 610-20): Clarifying the Scope of Asset Derecognition Guidance and Accounting for Partial Sales of Nonfinancial Assets. The new guidance clarifies the scope of Subtopic 610-20 on the sale or transfer of nonfinancial assets to noncustomers, including partial sales. The standard is effective for Bunge starting January 1, 2018. The new requirements may be implemented either retrospectively to each period presented in the financial statements, or retrospectively with a cumulative-effect adjustment to retained earnings at the date of initial application. The adoption of this standard is not expected to have a material impact on Bunge’s consolidated financial statements.
In January 2017, the FASB issued ASU 2017-04, Intangibles-Goodwill and Other (Topic 350): Simplifying the Test for Goodwill Impairment. The new guidance eliminates Step 2 from the goodwill impairment test. Instead an entity should perform its annual, or interim, goodwill impairment test by comparing the fair value of a reporting unit with its carrying amount. An entity should recognize an impairment charge for the amount by which the carrying amount exceeds the reporting unit’s fair value; however, the loss recognized should not exceed the total amount of goodwill allocated to that reporting unit. The standard is
F-12
BUNGE LIMITED AND SUBSIDIARIES
NOTES TO THE CONSOLIDATED FINANCIAL STATEMENTS (Continued)
1. NATURE OF BUSINESS, BASIS OF PRESENTATION, AND SIGNIFICANT ACCOUNTING POLICIES (Continued)
effective for annual or interim impairment tests in fiscal years beginning after December 15, 2019. Early adoption is permitted. The new requirements should be implemented on a prospective basis. The adoption of this standard is not expected to have a material impact on Bunge’s consolidated financial statements.
In January 2017, the FASB issued ASU 2017-01, Business Combinations (Topic 805): Clarifying the Definition of a Business. The amendments provide that when substantially all of the fair value of the gross assets acquired (or disposed of) is concentrated in a single identifiable asset or a group of similar identifiable assets, the set is not a business. Otherwise, to be considered a business, a set must include, at a minimum, an input and a substantive process that together significantly contribute to the ability to create output. The standard is effective for Bunge starting January 1, 2018. The new requirements should be implemented on a prospective basis. The adoption of this standard is not expected to have a material impact on Bunge’s consolidated financial statements.
In November 2016, the FASB issued ASU 2016-18, Statement of Cash Flows (Topic 230), Restricted Cash (a consensus of the Emerging Issues Task Force). Similar to ASU 2016-15 as described below, this update attempts to reduce diversity in practice and provides guidance on the presentation of restricted cash or restricted cash equivalents in the statement of cash flows. The guidance will be effective for Bunge starting January 1, 2018. The adoption of this standard is not expected to have a material impact on Bunge's consolidated financial statements.
In October 2016, the FASB issued ASU 2016-16, Income Taxes (Topic 740), Intra-Entity Transfers of Assets Other Than Inventory, which eliminates an exception in the current guidance prohibiting a reporting entity to recognize income taxes consequences of an intra-entity transfer of an asset other than inventory, such as transfers of intellectual property and property, plant, and equipment, until the asset has been sold to an outside party. The new guidance does not include new disclosure requirements; however, existing disclosure requirements might be applicable when accounting for the current and deferred income taxes for an intra-entity transfer. ASU 2016-16 will be effective for Bunge starting January 1, 2018. The adoption of this standard is not expected to have a material impact on Bunge's consolidated financial statements.
In August 2016, the FASB issued ASU 2016-15, Statement of Cash Flows (Topic 230), Classification of Certain Cash Receipts and Cash Payments (a consensus of the Emerging Issues Task Force). This update attempts to reduce diversity in practice by providing guidance on the classification of certain cash receipts and payments in the statement of cash flows. The new standard is effective for Bunge starting January 1, 2018. The most significant change upon adoption of this standard is expected to be the presentation of cash flows in relation to the Company’s trade receivables securitization program. Particularly impacted are the cash receipts from payments on the deferred purchase price, which will be classified as cash inflows from investing activities, whereas today they are classified as inflows from operating activities. The deferred purchase price is generally between 10% and 15% of receivables sold. See Note 18 for additional information on our trade receivables securitization program.
In June 2016, the FASB issued ASU 2016-13, Financial Instruments-Credit Losses (Topic 326), which introduces a new accounting model, referred to as the current expected credit losses (CECL) model, for estimating credit losses on certain financial instruments and expands the disclosure requirements for estimating such credit losses. Under the new model, an entity is required to estimate the credit losses expected over the life of an exposure (or pool of exposures). The guidance also amends the current impairment model for debt securities classified as available-for-sale securities. The new guidance will be effective for fiscal years beginning after December 15, 2019, including interim periods within those fiscal years. Early adoption is permitted. Bunge is evaluating the impact of this standard on its consolidated financial statements.
In February 2016, the FASB issued ASU 2016-02, Leases (Topic 842). Under the new provisions, all lessees will report on the balance sheet a right-of-use asset and a liability for the obligation to make payments with the exception of those leases with a term of 12 months or less. The new provisions will be effective for fiscal years beginning after December 15, 2018, including interim periods within those fiscal years. Early adoption is permitted. Bunge has established a project implementation group and is evaluating the impact this guidance will have on its consolidated financial statements and related disclosures. Initial scoping reviews are underway, along with planning of the implementation of a new system to perform the reporting and disclosure are underway. The Company is evaluating the change to existing processes and controls.
In January 2016, the FASB issued ASU 2016-01, Financial Instruments-Overall (Subtopic 825-10): Recognition and Measurement of Financial Assets and Financial Liabilities, which amends the guidance relating to the classification and
F-13
BUNGE LIMITED AND SUBSIDIARIES
NOTES TO THE CONSOLIDATED FINANCIAL STATEMENTS (Continued)
1. NATURE OF BUSINESS, BASIS OF PRESENTATION, AND SIGNIFICANT ACCOUNTING POLICIES (Continued)
measurement of financial instruments. Changes to the current guidance primarily affect the accounting for equity investments, financial liabilities under the fair value option, and the presentation and disclosure requirements for financial instruments. The new standard is effective for Bunge starting January 1, 2018. The adoption of this standard is not expected to have a material impact on Bunge's consolidated financial statements.
In May 2014, the FASB amended ASC (Topic 605) Revenue Recognition and created ASC (Topic 606): Revenue from Contracts with Customers. The core principle of the guidance is that an entity should recognize revenue to depict the transfer of promised goods or services to customers in an amount that reflects the consideration to which the entity expects to be entitled in exchange for those goods or services. During 2016, the FASB issued additional implementation guidance and practical expedients in ASU 2016-08, Revenue from Contracts with Customers (Topic 606): Principal versus Agent Considerations (Reporting Revenue Gross versus Net), ASU 2016-10, Revenue from Contracts with Customers (Topic 606), Identifying Performance Obligations and Licensing, ASU 2016-12, Revenue from Contracts with Customers (Topic 606): Narrow-Scope Improvements and Practical Expedients, and ASU 2016-20, Technical Corrections and Improvements to Topic 606, Revenue from Contracts with Customers, to improve the guidance. The Company adopted the standard on January 1, 2018 under the modified retrospective approach, applying it only to contracts open as of that date. The impact of adopting the standard has not resulted in a change in accounting treatment for any of the Company’s revenue streams, with the exception of ocean freight voyage charter services. Under ASC 605, the Company recognized revenue and the related cost of goods sold upon loading of the goods onto the vessel, which generally coincides with receipt of payment by the customer. Under ASC 606, the revenue and the related cost of goods sold will instead be recognized over time as the voyages occur and the related expenses are incurred, respectively. As a result of this change in timing, the adoption of the standard resulted in a cumulative-effect adjustment credit to opening retained earnings that was not material.
Recently Adopted Accounting Pronouncements—In August 2017, the Financial Accounting Standards Board (“FASB”) issued ASU 2017-12, Derivatives and Hedging (Topic 815): Targeted Improvement to Accounting for Hedging Activities, which better aligns hedge accounting with an organization’s risk management activities in its financial statements. In addition, the ASU simplifies the application of hedge accounting guidance in areas where practice issues exist. Bunge early adopted this ASU in the fourth quarter of 2017. The adoption did not have a material impact on Bunge's consolidated financial statements.
2. GLOBAL COMPETITIVENESS PROGRAM
In July 2017, Bunge announced a comprehensive global competitiveness program to improve its cost position and deliver increased value to shareholders (the “Global Competitiveness Program”). When fully implemented, the Global Competitiveness Program is expected to reduce the Company’s overhead costs by approximately $250 million by the end of 2020. The Company identified key elements of its strategy to meet this goal, including adopting a zero-based budgeting process that will target excess costs in specific budget categories and improving efficiency and scalability by simplifying organizational structures, streamlining processes and consolidating back office functions globally. In conjunction with the Global Competitiveness Program, the Company has implemented other cost reduction and strategic initiatives to enhance the efficiency and performance of the Company’s business.
The Company has approved several initiatives under the Global Competitiveness Program, including position eliminations, the re-leveling of certain positions, simplifying its organizational structure into three regions and establishing new zero-based budgeting procedures and governance on spending categories. As part of the Global Competitiveness Program, Bunge offered a voluntary early retirement program to certain U.S. based salaried employees. Costs associated with the early retirement program are reflected in severance and other employee benefit costs. In addition, the Company has also incurred third-party consulting fees and other costs associated with the Global Competitiveness Program.
F-14
BUNGE LIMITED AND SUBSIDIARIES
NOTES TO THE CONSOLIDATED FINANCIAL STATEMENTS (Continued)
The table below sets forth, by type and segment, the costs recorded for the Global Competitiveness Program and other associated initiatives during the year ended December 31, 2017:
(US$ in millions) | Severance and Other Employee Benefit Costs | Other Program Costs | Total Program Costs | ||||||||
Agribusiness Segment | $ | 39 | $ | 10 | $ | 49 | |||||
Edible Oils Segment | 12 | 4 | 16 | ||||||||
Milling Segment | 6 | 1 | 7 | ||||||||
Sugar and Bioenergy Segment | 1 | 3 | 4 | ||||||||
Fertilizer Segment | 1 | — | 1 | ||||||||
Total | $ | 59 | $ | 18 | $ | 77 | |||||
In addition to the above charges, $13 million of severance and other employee benefit costs were recorded related to other industrial productivity initiatives. For the costs recorded above, $35 million were recorded in Cost of goods sold and $55 million were recorded in Selling, general and administrative expenses.
Bunge's liability associated with the Global Competitiveness Program and other associated initiatives is primarily comprised of accruals for severance and other employee benefit costs. The following table sets forth the activity affecting the liability for severance and other employee benefit costs related to the Global Competitiveness Program and other associated initiatives, which is recorded in "Other current liabilities" on the consolidated balance sheet.
(US$ in millions) | Severance and Other Employee Benefit Costs | |||
Balance at December 31, 2016 | $ | — | ||
Charges incurred | 72 | |||
Cash payments | (17 | ) | ||
Pension liability (1) | (10 | ) | ||
Balance at December 31, 2017 | $ | 45 | ||
(1) Included in severance and other employee benefit costs is approximately $10 million of additional pension expense incurred as part of the voluntary early retirement program. This amount is accrued with the total Bunge pension liability in "Other noncurrent liabilities" in the consolidated balance sheet.
In addition to the cash charges described above, the Company's restructuring initiatives may include the sale or disposal of long-lived assets and rationalization of certain investments. As Bunge continues to review its opportunities, certain charges may be recorded in earnings, including charges related to the disposal of assets or investments. For the year ended December 31, 2017, $45 million of such charges have been incurred. See Note 10 for additional details of these and other impairment charges.
3. BUSINESS ACQUISITIONS AND DISPOSTIONS
Acquisitions
On September 12, 2017, Bunge announced that it entered into a definitive agreement to acquire a 70% ownership interest in IOI Loders Croklaan ("Loders") from IOI Corporation Berhad ("IOI") for approximately $965 million, comprising €297 million and $595 million in cash. The transaction expands Bunge's value-added capabilities, reach, and scale across core geographies to establish Bunge as a global leader in B2B oil solutions. Loders' portfolio includes a full range of palm and tropical oil-derived products with strength in confectionery, bakery and infant nutrition applications. Loders serves global food industry customers in more than 100 countries around the world. The transaction is expected to close in the first quarter of 2018, subject to customary closing conditions.
On November 17, 2017, Bunge announced that it has reached an agreement with Grupo Minsa S.A.B. de C.V. ("Minsa"), a leading corn flour producer in North America, terminating the original agreement announced in August 2016 under which Bunge would have acquired a controlling interest in Minsa for approximately $311 million. Bunge and Minsa have terminated all obligations under the original agreement and signed mutual agreements releasing them from any associated liabilities.
F-15
BUNGE LIMITED AND SUBSIDIARIES
NOTES TO THE CONSOLIDATED FINANCIAL STATEMENTS (Continued)
Subsequently, on January 30, 2018, Bunge acquired Minsa Corporation ("Minsa USA"), a wholly owned subsidiary of Minsa, for approximately $75 million. As a result of the transaction, Bunge acquired two corn mills in the United States.
On February 28, 2017, Bunge acquired two oilseed processing plants and related operations in the Netherlands and France pursuant to an agreement with Cargill, Inc. Bunge paid a total purchase price of approximately $322 million. The purchase price allocation resulted in $109 million allocated to property, plant and equipment, $103 million to other net assets and liabilities and $7 million to finite-lived intangible assets. The transaction also resulted in $103 million of goodwill allocated to Bunge’s agribusiness operations.
Dispositions
On November 30, 2016, Bunge closed on the disposition of a 50% ownership interest in its Terfron port terminal Terminal Fronteira Norte Logistica S.A. ("TFN") in Brazil to Amaggi Exportaçao E Importaçao Ltda. for a total consideration in cash of approximately $145 million, which resulted in a gain of $90 million. As a result of this transaction Bunge will account for its remaining 50% interest in the TFN joint venture as an equity method investment.
On November 30, 2016, Bunge and Wilmar International Limited ("Wilmar") completed the formation of a joint venture in Vietnam in which Wilmar will invest into Bunge's crush operations in Vietnam, creating a three-party joint venture with Bunge and Wilmar as equal 45% shareholders and Quang Dung, a leading soybean meal distributor in Vietnam, retaining its existing 10% stake in the operations. Bunge received $33 million cash in consideration for its 45% share of interest in Bunge's crush operations. This transaction resulted in a gain of $30 million. As a result of this transaction Bunge will account for the joint venture as an equity method investment.
On February 1, 2016, SALIC Canada Limited ("SALIC Canada") converted two non-interest bearing convertible promissory notes issued to SALIC by G3 of $106 million into 148,323,000 common shares of G3, increasing SALIC Canada's ownership percentage in G3 from 49% to 65% and reducing Bunge Canada's ownership in G3 from 51% to 35%. On the same day, Bunge Canada and SALIC Canada transferred all of their common shares of G3 to G3 Global Holdings Limited Partnership in exchange for additional Class A limited partnership units in G3 Global Holdings Limited Partnership. As a result, as of February 1, 2016, G3 Global Holdings Limited Partnership became the holder of all of the issued and outstanding common shares in G3. On March 30, 2016, Bunge Canada, under the G3 Global Holdings Shareholders Agreement, exercised a contractual put right and sold 10% of its common shares to SALIC Canada in exchange for $37 million so that Bunge Canada now holds 25% ownership of G3 Global Holdings Limited Partnership and SALIC Canada holds 75% ownership.
4. TRADE STRUCTURED FINANCE PROGRAM
Bunge engages in various trade structured finance activities to leverage the value of its trade flows across its operating regions. For the years ended December 31, 2017 and 2016, net return from these activities were $33 million and $57 million, respectively, and were included as a reduction of cost of goods sold in the accompanying consolidated statements of income. These activities include programs under which Bunge generally obtains U.S. dollar-denominated letters of credit (“LCs”) (each based on an underlying commodity trade flow) from financial institutions and time deposits denominated in either the local currency of the financial institutions' counterparties or in U.S. dollars, as well as foreign exchange forward contracts, and other programs in which trade related payables are set-off against receivables, all of which are subject to legally enforceable set-off agreements.
The table below summarizes the assets and liabilities included in the consolidated balance sheets and the associated fair value amounts at December 31, 2017 and December 31, 2016, related to the program. The fair values approximated the carrying amount of the related financial instruments and are all Level 2 measurements (see Note 15).
F-16
BUNGE LIMITED AND SUBSIDIARIES
NOTES TO THE CONSOLIDATED FINANCIAL STATEMENTS (Continued)
December 31, | ||||||||
(US$ in millions) | 2017 | 2016 | ||||||
Current assets: | ||||||||
Carrying value of time deposits | $ | — | $ | 64 | ||||
Non-current assets: | ||||||||
Carrying value of time deposits | $ | 315 | $ | 464 | ||||
Current liabilities: | ||||||||
Carrying value of letters of credit obligations | $ | 315 | $ | 528 | ||||
As of December 31, 2017 and 2016, receivables and trade payables of $1,196 million and nil, respectively, and time deposits and LCs of $6,321 million and $5,732 million, respectively, were presented net on the consolidated balance sheets as the criteria of ASC 210-20, Offsetting, had been met. At December 31, 2017 and 2016, time deposits, including those presented on a net basis, carried weighted-average interest rates of 2.98% and 2.36%, respectively. During the years ended December 31, 2017, 2016 and 2015, total net proceeds from issuances of LCs were $8,174 million, $7,191 million and $5,563 million, respectively. These cash inflows are offset by the related cash outflows resulting from placement of the time deposits and repayment of the LCs. All cash flows related to the programs are included in operating activities in the consolidated statements of cash flows.
5. INVENTORIES
Inventories by segment are presented below. RMI are agricultural commodity inventories, such as soybeans, soybean meal, soybean oil, corn and wheat, carried at fair value because of their commodity characteristics, widely available markets and international pricing mechanisms. All other inventories are carried at lower of cost or net realizable value.
December 31, | |||||||
(US$ in millions) | 2017 | 2016 | |||||
Agribusiness(1) | $ | 4,022 | $ | 3,741 | |||
Edible Oil Products(2) | 458 | 404 | |||||
Milling Products | 196 | 167 | |||||
Sugar and Bioenergy(3) | 333 | 406 | |||||
Fertilizer | 65 | 55 | |||||
Total | $ | 5,074 | $ | 4,773 | |||
(1) | Includes RMI of $3,865 million and $3,593 million at December 31, 2017 and 2016, respectively. Of these amounts $2,694 million and $2,523 million can be attributable to merchandising activities at December 31, 2017 and 2016, respectively. |
(2) | Includes RMI of bulk soybean and canola oil in the aggregate amount of $115 million and $123 million at December 31, 2017 and 2016, respectively. |
(3) | Includes sugar RMI of $76 million and $139 million at December 31, 2017 and 2016, respectively. Of these amounts, $73 million and $134 million can be attributable to merchandising activities at December 31, 2017 and 2016, respectively. |
F-17
6. OTHER CURRENT ASSETS
Other current assets consist of the following:
December 31, | |||||||
(US$ in millions) | 2017 | 2016 | |||||
Unrealized gains on derivative contracts, at fair value | $ | 910 | $ | 1,327 | |||
Prepaid commodity purchase contracts (1) | 282 | 273 | |||||
Secured advances to suppliers, net (2) | 412 | 601 | |||||
Recoverable taxes, net | 488 | 467 | |||||
Margin deposits | 258 | 251 | |||||
Marketable securities, at fair value and other short-term investments | 213 | 94 | |||||
Deferred purchase price receivable, at fair value (3) | 107 | 87 | |||||
Income taxes receivable | 192 | 181 | |||||
Prepaid expenses | 125 | 148 | |||||
Other | 240 | 216 | |||||
Total | $ | 3,227 | $ | 3,645 | |||
(1) | Prepaid commodity purchase contracts represent advance payments against contracts for future delivery of specified quantities of agricultural commodities. |
(2) | Bunge provides cash advances to suppliers, primarily Brazilian farmers of soybeans and sugarcane, to finance a portion of the suppliers' production costs. Bunge does not bear any of the costs or operational risks associated with the related growing crops. The advances are largely collateralized by future crops and physical assets of the suppliers, carry a local market interest rate, and settle when the farmer's crop is harvested and sold. The secured advances to farmers are reported net of allowances of $1 million and $1 million at December 31, 2017 and December 31, 2016, respectively. |
Interest earned on secured advances to suppliers of $44 million, $38 million and $38 million, for the years ended December 31, 2017, 2016 and 2015, respectively, is included in net sales in the consolidated statements of income.
(3) | Deferred purchase price receivable represents additional credit support for the investment conduits in Bunge's accounts receivables sales program (see Note 18). |
Marketable Securities and Other Short-Term Investments—The Company invests in foreign government securities, corporate debt securities, deposits, and other securities. The following is a summary of amounts recorded on the consolidated balance sheets for marketable securities and other short-term investments.
December 31, | |||||||
(US$ in millions) | 2017 | 2016 | |||||
Foreign government securities | $ | 145 | $ | 28 | |||
Corporate debt securities | 59 | 57 | |||||
Certificate of deposits/time deposits | — | 7 | |||||
Other | 9 | 2 | |||||
Total marketable securities and other short-term investments | $ | 213 | $ | 94 | |||
As of December 31, 2017, total marketable securities and other short-term investments includes $3 million of assets classified as available for sale, $209 million as trading, and $1 million as other short-term investments. As of December 31, 2016, total marketable securities and other short-term investments includes $22 million of assets classified as available for sale, $63 million, as trading and $9 million as other short-term investments. Due to the short-term nature of these investments, carrying value approximates fair value.
F-18
BUNGE LIMITED AND SUBSIDIARIES
NOTES TO THE CONSOLIDATED FINANCIAL STATEMENTS (Continued)
7. PROPERTY, PLANT AND EQUIPMENT
Property, plant and equipment consist of the following:
December 31, | |||||||
(US$ in millions) | 2017 | 2016 | |||||
Land | $ | 390 | $ | 356 | |||
Biological assets | 709 | 613 | |||||
Buildings | 2,116 | 1,934 | |||||
Machinery and equipment | 5,601 | 5,055 | |||||
Furniture, fixtures and other | 579 | 514 | |||||
Construction in progress | 517 | 765 | |||||
9,912 | 9,237 | ||||||
Less: accumulated depreciation and depletion | (4,602 | ) | (4,138 | ) | |||
Total | $ | 5,310 | $ | 5,099 | |||
Bunge capitalized expenditures of $633 million, $810 million, and $592 million during the years ended 2017, 2016 and 2015, respectively. Included in these capitalized expenditures was capitalized interest on construction in progress of $6 million, $9 million, and $7 million for the years ended December 31, 2017, 2016 and 2015, respectively. Depreciation and depletion expense was $580 million, $517 million and $518 million for the years ended December 31, 2017, 2016 and 2015, respectively.
8. GOODWILL
Bunge performs its annual goodwill impairment testing in the fourth quarter of each year. Step 1 of the goodwill impairment test compares the fair value of Bunge's reporting units to which goodwill has been allocated to the carrying values of those reporting units. The fair value of certain reporting units is determined using a combination of two methods: estimates based on market earnings multiples of peer companies identified for the reporting unit (the market approach) and a discounted cash flow model with estimates of future cash flows based on internal forecasts of revenues and expenses (the income approach). The market multiples are generally derived from public information related to comparable companies with operating and investing characteristics similar to those reporting units and from market transactions in the industry. The income approach estimates fair value by discounting a reporting unit's estimated future cash flows using a weighted-average cost of capital that reflects current market conditions and the risk profile of the respective business unit and includes, among other things, assumptions about variables such as commodity prices, crop and related throughput and production volumes, profitability, future capital expenditures and discount rates, all of which are subject to a high degree of judgment. For other reporting units, the estimated fair value of the reporting unit is determined utilizing a discounted cash flow analysis.
F-19
BUNGE LIMITED AND SUBSIDIARIES
NOTES TO THE CONSOLIDATED FINANCIAL STATEMENTS (Continued)
Changes in the carrying value of goodwill by segment for the years ended December 31, 2017 and 2016 are as follows:
(US$ in millions) | Agribusiness | Edible Oil Products | Milling Products | Sugar and Bioenergy | Fertilizer | Total | |||||||||||||||||
Goodwill, gross of impairments | 123 | 78 | 234 | 514 | 1 | 950 | |||||||||||||||||
Accumulated impairment losses | (2 | ) | (13 | ) | (3 | ) | (514 | ) | — | (532 | ) | ||||||||||||
Balance, December 31, 2015, net | 121 | 65 | 231 | — | 1 | 418 | |||||||||||||||||
Goodwill acquired | — | 13 | — | — | — | 13 | |||||||||||||||||
Measurement period adjustments | — | — | (76 | ) | — | — | (76 | ) | |||||||||||||||
Tax benefit on goodwill amortization(1) | (3 | ) | — | — | — | — | (3 | ) | |||||||||||||||
Foreign currency translation | 8 | — | 13 | — | — | 21 | |||||||||||||||||
Goodwill, gross of impairments | 128 | 91 | 171 | 514 | 1 | 905 | |||||||||||||||||
Accumulated impairment losses | (2 | ) | (13 | ) | (3 | ) | (514 | ) | — | (532 | ) | ||||||||||||
Balance, December 31, 2016, net | 126 | 78 | 168 | — | 1 | 373 | |||||||||||||||||
Goodwill acquired(2) | 103 | 8 | — | — | — | 111 | |||||||||||||||||
Foreign currency translation | 22 | 8 | 1 | — | — | 31 | |||||||||||||||||
Goodwill, gross of impairments | 253 | 107 | 172 | 514 | 1 | 1,047 | |||||||||||||||||
Accumulated impairment losses | (2 | ) | (13 | ) | (3 | ) | (514 | ) | — | (532 | ) | ||||||||||||
Balance, December 31, 2017, net | $ | 251 | $ | 94 | $ | 169 | $ | — | $ | 1 | $ | 515 | |||||||||||
(1) | Bunge's Brazilian subsidiary's tax deductible goodwill is in excess of its book goodwill. For financial reporting purposes for goodwill acquired prior to 2009, the tax benefits attributable to the excess tax goodwill are first used to reduce associated goodwill to zero, prior to recognizing any income tax benefit in the consolidated statements of income. |
(2) | Agribusiness goodwill relates to the 2017 acquisition of two oilseed processing plants and related operations in the Netherlands and France pursuant to an agreement with Cargill. |
F-20
BUNGE LIMITED AND SUBSIDIARIES
NOTES TO THE CONSOLIDATED FINANCIAL STATEMENTS (Continued)
9. OTHER INTANGIBLE ASSETS
Other intangible assets consist of the following:
December 31, | |||||||
(US$ in millions) | 2017 | 2016 | |||||
Gross carrying amount: | |||||||
Trademarks/brands, finite-lived | $ | 173 | $ | 141 | |||
Licenses | 8 | 7 | |||||
Port rights | 155 | 156 | |||||
Other | 237 | 254 | |||||
573 | 558 | ||||||
Less accumulated amortization: | |||||||
Trademarks/brands, finite-lived | (72 | ) | (64 | ) | |||
Licenses | (5 | ) | (5 | ) | |||
Port rights | (31 | ) | (23 | ) | |||
Other | (142 | ) | (130 | ) | |||
(250 | ) | (222 | ) | ||||
Intangible assets, net of accumulated amortization | $ | 323 | $ | 336 | |||
In 2017, Bunge acquired $21 million of brands and trademarks and $11 million of other intangible assets. Bunge allocated $24 million to the Edible Oils segment and $8 million to the Agribusiness segment. Finite lives of these intangibles range from 3 to 27 years.
In 2016, Bunge acquired $9 million of port rights, $4 million of brands and trademarks, and $8 million other intangible assets. Bunge allocated $12 million to the Edible Oils segment and $9 million to the Agribusiness segment. Finite lives of these intangibles range from 10 to 27 years.
Aggregate amortization expense was $29 million, $31 million and $27 million for the years ended December 31, 2017, 2016 and 2015, respectively. The estimated annual future aggregate amortization expense is $27 million for 2018 through 2022.
10. IMPAIRMENTS
For the year ended December 31, 2017, Bunge recorded pre-tax, impairment charges of $52 million, of which $19 million, $16 million and $17 million are in selling, general and administrative expenses, cost of goods sold and other income (expense)—net, respectively, in its consolidated statement of income. These amounts are primarily made up of $25 million relating to the impairment of property, plant and equipment of feedmills in China, a port in Poland and various machinery and equipment in Brazil primarily in the Agribusiness segment, $17 million that relates to the impairment of two investments in affiliates in the Agribusiness and Sugar and Bioenergy segments, and $7 million that relates to an intangible asset impairment of patents. The remaining impairment amounts recorded by Bunge for the year ended December 31, 2017 were individually insignificant. The fair values of the assets were determined utilizing discounted future expected cash flows, offers from prospective buyers and market and income valuation approaches.
For the year ended December 31, 2016, Bunge recorded pre-tax, impairment charges of $87 million, of which $9 million, $6 million and $72 million are in cost of goods sold, selling, general and administrative expenses and other income (expense)—net, respectively, in its consolidated statement of income. These amounts are primarily made up of $44 million that relates to the impairment of an investment in affiliate and other investments in the Sugar and Bioenergy segment, $15 million that relates to the impairment of an investment in affiliate in the Agribusiness segment, $12 million that relates to an intangible asset impairment of aquaculture patents and $9 million that relates to a property, plant and equipment impairment of an Argentina fertilizer plant. The remaining impairment amounts recorded by Bunge for the year ended December 31, 2016 were individually insignificant. The fair values of the assets were determined utilizing discounted future expected cash flows, and in the case of the equity method investment, net market value based on broker quotes of similar assets.
F-21
BUNGE LIMITED AND SUBSIDIARIES
NOTES TO THE CONSOLIDATED FINANCIAL STATEMENTS (Continued)
For the year ended December 31, 2015, Bunge recorded pre-tax, non-cash impairment charges of $57 million, of which $24 million, $20 million and $13 million are included in cost of goods sold, selling, general and administrative expenses and other income (expense)—net, respectively, in its consolidated statement of income. These amounts are primarily made up of $15 million relating to the announced closure of an oil packaging plant in the United States, $14 million that relates to the impairment of an equity method investment in a freight shipping company in Europe and $13 million that relates to a pre-tax goodwill impairment charge related to the tomato products business in Brazil. The remaining impairment amounts recorded by Bunge for the year ended December 31, 2015 were individually insignificant. The fair values of the assets were determined utilizing discounted future expected cash flows, and in the case of the equity method investment, net market value based on broker quotes of similar assets.
Nonrecurring fair value measurements—The following table summarizes assets measured at fair value on a nonrecurring basis subsequent to initial recognition at December 31, 2017, 2016 and 2015, respectively. For additional information on Level 1, 2 and 3 inputs see Note 15.
(US$ in millions) | Fair Value Measurements Using | ||||||||||||||||||
December 31, 2017 | Carrying Value Year Ended | Level 1 | Level 2 | Level 3 | Impairment Losses Year ended | ||||||||||||||
Property, plant and equipment | $ | 16 | $ | — | $ | 16 | $ | — | $ | (25 | ) | ||||||||
Investment in affiliates | $ | — | $ | — | $ | — | $ | — | $ | (17 | ) | ||||||||
Intangibles | $ | — | $ | — | $ | — | $ | — | $ | (7 | ) | ||||||||
Other current assets | $ | — | $ | — | $ | — | $ | — | $ | (2 | ) | ||||||||
Other non-current assets | $ | 1 | $ | — | $ | 1 | $ | — | $ | — | |||||||||
Fair Value Measurements Using | |||||||||||||||||||
December 31, 2016 | Carrying Value Year Ended | Level 1 | Level 2 | Level 3 | Impairment Losses Year ended | ||||||||||||||
Property, plant and equipment | $ | 7 | $ | — | $ | — | $ | 7 | $ | (9 | ) | ||||||||
Intangibles | $ | — | $ | — | $ | — | $ | — | $ | (12 | ) | ||||||||
Investment in affiliates and other investments | $ | 13 | $ | — | $ | — | $ | 13 | $ | (59 | ) | ||||||||
Fair Value Measurements Using | |||||||||||||||||||
December 31, 2015 | Carrying Value Year Ended | Level 1 | Level 2 | Level 3 | Impairment Losses Year ended | ||||||||||||||
Property, plant and equipment | $ | 12 | $ | — | $ | — | $ | 12 | $ | (15 | ) | ||||||||
Goodwill (see Note 8) | $ | — | $ | — | $ | — | $ | — | $ | (13 | ) | ||||||||
Investments in affiliates | $ | 3 | $ | — | $ | — | $ | 3 | $ | (14 | ) | ||||||||
11. INVESTMENTS IN AFFILIATES
Bunge participates in various unconsolidated joint ventures and other investments accounted for using the equity method. Certain equity method investments at December 31, 2017 are described below. Bunge allocates equity in earnings of affiliates to its reporting segments.
Agribusiness
Agricola Alvorada S.A—Bunge has a 37% ownership interest in a grains and agricultural resale company in Brazil which strengthens its operations in this segment, leveraging its grain origination business.
Vietnam Agribusiness Holdings Ptd. Ltd.—Bunge and Wilmar International Limited ("Wilmar") formed a joint venture in 2016 in Vietnam in which Wilmar invests into Bunge's crush operations in Vietnam, creating a three-party joint venture with Bunge and Wilmar as equal 45% shareholders and Quang Dung, a leading soybean meal distributor in Vietnam, retaining its existing 10% stake in the operations.
F-22
BUNGE LIMITED AND SUBSIDIARIES
NOTES TO THE CONSOLIDATED FINANCIAL STATEMENTS (Continued)
Terminal Fronteira Norte Logística S.A.("TFN")—Bunge has a 50% ownership interest in TFN, a joint venture with Amaggi to operate a port terminal in Barcarena, Brazil. The TFN complex is mainly dedicated to exporting soybean and corn from Brazil.
Navegações Unidas Tapajós S.A. ("Tapajos")—Bunge has a 50% ownership interest in Tapajos, a joint venture with Amaggi to operate inland waterway transportation between the municipalities of Itaituba and Barcarena, Brazil. The Tapajos complex is mainly dedicated to exporting soybeans and grains from Brazil to Asia and Europe.
Terminais do Graneis do Guaruja ("TGG")—Bunge has a 57% ownership interest in TGG, a joint venture with Amaggi International Ltd. to operate a port terminal in Santos, Brazil, for the reception, storage and shipment of solid bulk cargoes.
G3 Global Holding GP Inc.—Bunge has a 25% ownership interest in G3 Global Holding GP Inc., a joint venture with SALIC that operates grain facilities in Canada.
Caiasa—Paraguay Complejo Agroindustrial Angostura S.A—Bunge has a 33.3% ownership interest in an oilseed processing facility joint venture with Louis Dreyfus Company and Aceitera General Deheza S.A. ("AGD"), in Paraguay.
Terminal 6 S.A. and Terminal 6 Industrial S.A—Bunge has a joint venture, Terminal 6 S.A., in Argentina with AGD for the operation of a port facility located in the Santa Fe province of Argentina. Bunge is also a party to a second joint venture with AGD, Terminal 6 Industrial S.A., that operates a crushing facility located adjacent to the port facility. Bunge owns 40% and 50%, respectively, of these joint ventures.
Sugar and Bioenergy
ProMaiz—Bunge has a 50% ownership interest in a corn wet milling facility joint venture with AGD in Argentina for the manufacturing of ethanol.
Southwest Iowa Renewable Energy, LLC ("SIRE")—Bunge has a 25% ownership interest in SIRE. The other owners are primarily agricultural producers located in Southwest Iowa. SIRE operates an ethanol plant near Bunge's oilseed processing facility in Council Bluffs, Iowa.
12. OTHER NON-CURRENT ASSETS
Other non-current assets consist of the following:
December 31, | |||||||
(US$ in millions) | 2017 | 2016 | |||||
Recoverable taxes, net (1) | $ | 155 | $ | 139 | |||
Judicial deposits (1) | 140 | 129 | |||||
Other long-term receivables | 12 | 23 | |||||
Income taxes receivable (1) | 307 | 261 | |||||
Long-term investments | 66 | 54 | |||||
Affiliate loans receivable | 24 | 25 | |||||
Long-term receivables from farmers in Brazil, net (1) | 131 | 133 | |||||
Other | 193 | 163 | |||||
Total | $ | 1,028 | $ | 927 | |||
(1) | These non-current assets arise primarily from Bunge's Brazilian operations and their realization could take several years. |
Recoverable taxes, net—Recoverable taxes are reported net of allowances of $28 million and $32 million at December 31, 2017 and 2016, respectively.
Judicial deposits—Judicial deposits are funds that Bunge has placed on deposit with the courts in Brazil. These funds are held in judicial escrow relating to certain legal proceedings pending legal resolution and bear interest at the SELIC rate, which is the benchmark rate of the Brazilian central bank.
F-23
BUNGE LIMITED AND SUBSIDIARIES
NOTES TO THE CONSOLIDATED FINANCIAL STATEMENTS (Continued)
Income taxes receivable—Income taxes receivable includes overpayments of current income taxes plus accrued interest. These income tax prepayments are expected to be utilized for settlement of future income tax obligations. Income taxes receivable in Brazil bear interest at the SELIC rate.
Affiliate loans receivable—Affiliate loans receivable, are primarily interest bearing receivables from unconsolidated affiliates with a remaining maturity of greater than one year.
Long-term receivables from farmers in Brazil, net—Bunge provides financing to farmers in Brazil, primarily through secured advances against farmer commitments to deliver agricultural commodities (primarily soybeans) upon harvest of the then-current year's crop and through credit sales of fertilizer to farmers.
The average recorded investment in long-term receivables from farmers in Brazil for the years ended December 31, 2017 and 2016 was $253 million and $235 million, respectively. The table below summarizes Bunge's recorded investment in long-term receivables from farmers in Brazil and the related allowance amounts.
December 31, 2017 | December 31, 2016 | ||||||||||||||
(US$ in millions) | Recorded Investment | Allowance | Recorded Investment | Allowance | |||||||||||
For which an allowance has been provided: | |||||||||||||||
Legal collection process (1) | $ | 98 | $ | 91 | $ | 84 | $ | 78 | |||||||
Renegotiated amounts (2) | 25 | 22 | 36 | 31 | |||||||||||
For which no allowance has been provided: | |||||||||||||||
Legal collection process (1) | 76 | — | 60 | — | |||||||||||
Renegotiated amounts (2) | 17 | — | 16 | — | |||||||||||
Other long-term receivables | 28 | — | 46 | — | |||||||||||
Total | $ | 244 | $ | 113 | $ | 242 | $ | 109 | |||||||
(1) | All amounts in legal process are considered past due upon initiation of legal action. |
(2) | All renegotiated amounts are current on repayment terms. |
The table below summarizes the activity in the allowance for doubtful accounts related to long-term receivables from farmers in Brazil.
December 31, | |||||||
(US$ in millions) | 2017 | 2016 | |||||
Beginning balance | $ | 109 | $ | 100 | |||
Bad debt provisions | 19 | 3 | |||||
Recoveries | (12 | ) | (12 | ) | |||
Write-offs | (1 | ) | (1 | ) | |||
Foreign currency translation | (2 | ) | 19 | ||||
Ending balance | $ | 113 | $ | 109 | |||
F-24
13. OTHER CURRENT LIABILITIES
Other current liabilities consist of the following:
December 31, | |||||||
(US$ in millions) | 2017 | 2016 | |||||
Accrued liabilities | $ | 606 | $ | 548 | |||
Unrealized losses on derivative contracts at fair value | 897 | 1,203 | |||||
Advances on sales | 406 | 395 | |||||
Other | 277 | 330 | |||||
Total | $ | 2,186 | $ | 2,476 | |||
14. INCOME TAXES
Bunge operates globally and is subject to the tax laws and regulations of numerous tax jurisdictions and authorities, as well as tax agreements and treaties among these jurisdictions. Bunge's tax provision is impacted by, among other factors, changes in tax laws, regulations, agreements and treaties, currency exchange rates, and Bunge's profitability in each taxing jurisdiction.
Bunge has elected to use the U.S. federal income tax rate to reconcile the actual provision for income taxes.
The components of income from operations before income tax are as follows:
Year Ended December 31, | |||||||||||
(US$ in millions) | 2017 | 2016 | 2015 | ||||||||
United States | $ | 21 | $ | 102 | $ | 207 | |||||
Non-United States | 209 | 894 | 844 | ||||||||
Total | $ | 230 | $ | 996 | $ | 1,051 | |||||
The components of the income tax expense (benefit) are:
Year Ended December 31, | |||||||||||
(US$ in millions) | 2017 | 2016 | 2015 | ||||||||
Current: | |||||||||||
United States | $ | 45 | $ | (76 | ) | $ | 35 | ||||
Non-United States | 34 | 170 | 245 | ||||||||
79 | 94 | 280 | |||||||||
Deferred: | |||||||||||
United States | 20 | 38 | 36 | ||||||||
Non-United States | (43 | ) | 88 | (20 | ) | ||||||
(23 | ) | 126 | 16 | ||||||||
Total | $ | 56 | $ | 220 | $ | 296 | |||||
F-25
BUNGE LIMITED AND SUBSIDIARIES
NOTES TO THE CONSOLIDATED FINANCIAL STATEMENTS (Continued)
Reconciliation of the income tax expense (benefit) if computed at the U.S. Federal income tax rate to Bunge's reported income tax expense (benefit) is as follows:
Year Ended December 31, | |||||||||||
(US$ in millions) | 2017 | 2016 | 2015 | ||||||||
Income from operations before income tax | $ | 230 | $ | 996 | $ | 1,051 | |||||
Income tax rate | 35 | % | 35 | % | 35 | % | |||||
Income tax expense at the U.S. Federal tax rate | 80 | 348 | 368 | ||||||||
Adjustments to derive effective tax rate: | |||||||||||
Foreign earnings taxed at different statutory rates | (42 | ) | (68 | ) | (16 | ) | |||||
Valuation allowances | 43 | (44 | ) | 44 | |||||||
Fiscal incentives(1) | (42 | ) | (34 | ) | (41 | ) | |||||
Foreign exchange on monetary items | (9 | ) | 5 | (5 | ) | ||||||
Tax rate changes | (62 | ) | 4 | 1 | |||||||
Non-deductible expenses | 27 | 3 | 16 | ||||||||
Uncertain tax positions | (48 | ) | 89 | (14 | ) | ||||||
Deferred balance adjustments | (4 | ) | — | (8 | ) | ||||||
Equity distributions | — | — | (64 | ) | |||||||
Transition tax | 105 | — | — | ||||||||
Tax exempt investments | (14 | ) | (12 | ) | — | ||||||
Tax credits | (8 | ) | (89 | ) | — | ||||||
Incremental tax on future distributions | 27 | — | — | ||||||||
Other | 3 | 18 | 15 | ||||||||
Income tax (benefit) expense | $ | 56 | $ | 220 | $ | 296 | |||||
(1) | Fiscal incentives predominantly relate to investment incentives in Brazil that are exempt from Brazilian income tax. |
F-26
BUNGE LIMITED AND SUBSIDIARIES
NOTES TO THE CONSOLIDATED FINANCIAL STATEMENTS (Continued)
The primary components of the deferred tax assets and liabilities and the related valuation allowances are as follows:
December 31, | |||||||
(US$ in millions) | 2017 | 2016 | |||||
Deferred income tax assets: | |||||||
Net operating loss carryforwards | $ | 964 | $ | 944 | |||
Employee benefits | 106 | 158 | |||||
Tax credit carryforwards | 13 | 10 | |||||
Inventories | 50 | 18 | |||||
Intangibles | — | 9 | |||||
Accrued expenses and other | 388 | 231 | |||||
Total deferred tax assets | 1,521 | 1,370 | |||||
Less valuation allowances | (900 | ) | (839 | ) | |||
Deferred tax assets, net of valuation allowance | 621 | 531 | |||||
Deferred income tax liabilities: | |||||||
Property, plant and equipment | 251 | 200 | |||||
Undistributed earnings of affiliates | 35 | 13 | |||||
Investments | 17 | 33 | |||||
Intangibles | 24 | — | |||||
Total deferred tax liabilities | 327 | 246 | |||||
Net deferred tax assets | $ | 294 | $ | 285 | |||
Bunge has provided a deferred tax liability totaling $35 million and $13 million as of December 31, 2017 and 2016, respectively for withholding taxes (and state income taxes) imposed on earnings expected to be repatriated in the future. As of December 31, 2017, Bunge has determined it has unremitted earnings that are considered to be indefinitely reinvested of approximately $285 million and accordingly, no provision for income taxes has been made. If these earnings were distributed in the form of dividends or otherwise, Bunge would be subject to income taxes in the form of withholding taxes to the recipient for an amount of approximately $35 million.
At December 31, 2017, Bunge's pre-tax loss carryforwards totaled $3,507 million, of which $2,965 million have no expiration, including loss carryforwards of $2,049 million in Brazil. While loss carryforwards in Brazil can be carried forward indefinitely, annual utilization is limited to 30% of taxable income calculated on an entity by entity basis as Brazil tax law does not provide for a consolidated return concept. As a result, realization of these carryforwards may take in excess of five years.
The remaining tax loss carryforwards expire at various periods beginning in 2017 through the year 2036.
Income Tax Valuation Allowances—Bunge records valuation allowances when current evidence does not suggest that some portion or all of its deferred tax assets will be realized. The ultimate realization of deferred tax assets depends primarily on Bunge's ability to generate sufficient timely future income of the appropriate character in the appropriate taxing jurisdiction.
As of December 31, 2017 and 2016, Bunge has recorded valuation allowances of $900 million and $839 million, respectively. The net increase of $61 million results primarily from increased valuation allowances in Europe and Brazil along with foreign currency translation.
Unrecognized Tax Benefits—ASC Topic 740 requires applying a "more likely than not" threshold to the recognition and de-recognition of tax benefits. Accordingly Bunge recognizes the amount of tax benefit that has a greater than 50 percent likelihood of being ultimately realized upon settlement. At December 31, 2017 and 2016, respectively, Bunge had recorded unrecognized tax benefits of $99 million and $81 million in other non-current liabilities and $7 million and $49 million in current liabilities in its consolidated balance sheets. During 2017, 2016 and 2015, respectively, Bunge recognized $(9) million, $10 million and $(1) million of interest and penalty charges in income tax expense (benefit) in the consolidated statements of income. At December 31, 2017 and 2016, respectively, Bunge had included accrued interest and penalties of $27 million and
F-27
BUNGE LIMITED AND SUBSIDIARIES
NOTES TO THE CONSOLIDATED FINANCIAL STATEMENTS (Continued)
$36 million within the related tax liability line in the consolidated balance sheets. A reconciliation of the beginning and ending amount of unrecognized tax benefits follows:
(US$ in millions) | 2017 | 2016 | 2015 | ||||||||
Balance at January 1, | $ | 409 | $ | 51 | $ | 72 | |||||
Additions based on tax positions related to the current year | 34 | 9 | 6 | ||||||||
Additions based on acquisitions | — | 2 | 10 | ||||||||
Additions based on tax positions related to prior years | 13 | 374 | 1 | ||||||||
Reductions for tax positions of prior years | (43 | ) | — | (14 | ) | ||||||
Settlement or clarification from tax authorities | — | (1 | ) | (6 | ) | ||||||
Expiration of statute of limitations | (32 | ) | (9 | ) | (5 | ) | |||||
Foreign currency translation | 40 | (17 | ) | (13 | ) | ||||||
Balance at December 31, | $ | 421 | $ | 409 | $ | 51 | |||||
Bunge believes that it is reasonably possible that approximately $95 million of its unrecognized tax benefits may be recognized by the end of 2018 as a result of a lapse of the statute of limitations or settlement with the tax authorities.
Bunge, through its subsidiaries, files income tax returns in the United States (federal and various states) and non-United States jurisdictions. The table below reflects the tax years for which Bunge is subject to income tax examinations by tax authorities:
Open Tax Years | |
North America | 2010 - 2017 |
South America | 2006 - 2017 |
Europe | 2005 - 2017 |
Asia-Pacific | 2003 - 2017 |
As of December 31, 2017, Bunge's Brazilian subsidiaries have received income tax and penalty assessments through 2014 of approximately 3,971 million Brazilian reais (approximately $1,200 million), plus applicable interest on the outstanding amount. Bunge has recorded unrecognized tax benefits related to these assessments of 15 million Brazilian reais (approximately $4.6 million) as of December 31, 2017.
In addition, as of December 31, 2017, Bunge's Argentine subsidiary had received income tax assessments relating to 2006 through 2009 of approximately 1,275 million Argentine pesos (approximately $68 million), plus applicable interest on the outstanding amount of approximately 3,787 million Argentine pesos (approximately $203 million). Bunge anticipates that the tax authorities will examine fiscal years 2010-2013, although no notice has been rendered to Bunge's Argentine subsidiary.
Management, in consultation with external legal advisors, believes that it is more likely than not that Bunge will prevail on the proposed assessments (with exception of unrecognized tax benefit discussed above) in Brazil and Argentina and intends to vigorously defend its position against these assessments.
Bunge made cash income tax payments, net of refunds received, of $89 million, $144 million and $271 million during the years ended December 31, 2017, 2016, and 2015 respectively.
On December 22, 2017, H.R. 1, commonly known as the “Tax Cuts and Jobs Act” (the “Tax Act”) was signed into U.S. law. The Tax Act lowers the U.S. statutory corporate tax rate from 35% to 21% starting in 2018, introduces further limitations on the deductibility of interest expense, and imposes a one-time transition tax (“Transition Tax”) on deemed repatriated earnings of certain foreign subsidiaries (non-United States subsidiaries owned by Bunge U.S. affiliates). In addition, the Tax Act introduces additional base-broadening measures, including Global Intangible Low-Taxed Income (“GILTI”) and the Base-Erosion Anti-Abuse Tax (“BEAT”).
Bunge recognized the income tax effects of the Tax Act in accordance with Staff Accounting Bulletin No. 118, which provides SEC staff guidance for the application of ASC 740, Income Taxes, in the reporting period in which the Tax Act was signed into law. As such, our financial results reflect the income tax effects of the Tax Act for which the accounting under ASC Topic 740 is complete and provisional amounts for those specific income tax effects of the Tax Act for which the accounting
F-28
BUNGE LIMITED AND SUBSIDIARIES
NOTES TO THE CONSOLIDATED FINANCIAL STATEMENTS (Continued)
under ASC Topic 740 is incomplete but a reasonable estimate could be determined. Pursuant to SAB 118, adjustments to the provisional amounts recorded by us as of December 31, 2017 that are identified within a subsequent measurement period of up to one year from the enactment date will be included as an adjustment to the tax expense from continuing operations in the period the amounts are determined.
Bunge recognized the effects of the Tax Act as follows:
• | Rate Change - Bunge has recorded a one-time provisional deferred tax benefit of $72 million in the fourth quarter of 2017 to revalue temporary differences at the new 21% tax rate. Bunge has not finalized our computation of the impact of the rate change as we are continuing to analyze and refine our assessment of the Tax Act. |
• | Transition Tax - Bunge recognized a provisional charge of $105 million in the fourth quarter related to the Transition Tax. Bunge is awaiting further guidance from the U.S. taxing authorities on aspects of calculating the Transition Tax before finalizing the calculations as well as analyzing the amount of deemed repatriated earnings. Future legislation and regulatory action by U.S. states could also impact the Transition Tax, which would be re-estimated upon enactment of such legislation or issuance of regulations. |
• | GILTI - Bunge is evaluating the future impacts of GILTI before deciding the policy election to be made in connection with the accounting for GILTI. Guidance from U.S. taxing authorities on the administration of GILTI will influence Bunge's decision on accounting policy elections. |
As a result of the Tax Act, Bunge is evaluating its intentions on repatriating previously taxed income and have provisionally recorded a deferred tax liability of $27 million related to withholding taxes and state taxes expected to be incurred upon repatriation of earnings to the United States. Bunge expects to finalize the provisional deferred tax liability calculations concurrently with the Transition Tax calculations.
15. FINANCIAL INSTRUMENTS AND FAIR VALUE MEASUREMENTS
Bunge's various financial instruments include certain components of working capital such as cash and cash equivalents, trade accounts receivable and trade accounts payable. Additionally, Bunge uses short and long-term debt to fund operating requirements. Cash and cash equivalents, trade accounts receivable, trade accounts payable, and short-term debt are stated at their carrying value, which is a reasonable estimate of fair value. See Note 4 for trade structured finance program, Note 18 for deferred purchase price receivable related to sales of trade receivables, Note 12 for long-term receivables from farmers in Brazil, net and other long-term investments, Note 17 for long-term debt, Note 10 for other non-recurring fair value measurements and Note 19 for employee benefit plans. Bunge's financial instruments also include derivative instruments and marketable securities, which are stated at fair value.
Fair value is the expected price that would be received for an asset or paid to transfer a liability (an exit price) in the principal or most advantageous market for the asset or liability in an orderly transaction between market participants on the measurement date. Bunge determines the fair values of its readily marketable inventories, derivatives, and certain other assets based on the fair value hierarchy, which requires an entity to maximize the use of observable inputs and minimize the use of unobservable inputs when measuring fair value. Observable inputs are inputs based on market data obtained from sources independent of Bunge that reflect the assumptions market participants would use in pricing the asset or liability. Unobservable inputs are inputs that are developed based on the best information available in circumstances that reflect Bunge's own assumptions based on market data and on assumptions that market participants would use in pricing the asset or liability. The fair value standard describes three levels within its hierarchy that may be used to measure fair value.
Level 1: Quoted prices (unadjusted) in active markets for identical assets or liabilities. Level 1 assets and liabilities include exchange traded derivative contracts.
Level 2: Observable inputs, including Level 1 prices (adjusted), quoted prices for similar assets or liabilities, quoted prices in markets that are less active than traded exchanges and other inputs that are observable or can be corroborated by observable market data for substantially the full term of the assets or liabilities. Level 2 assets and liabilities include readily marketable inventories and over-the-counter ("OTC") commodity purchase and sale contracts and other OTC derivatives whose value is determined using pricing models with inputs that are generally based on exchange traded prices, adjusted for location specific inputs that are primarily observable in the market or can be derived principally from or corroborated by observable market data.
Level 3: Unobservable inputs that are supported by little or no market activity and that are a significant component of the fair value of the assets or liabilities. In evaluating the significance of fair value inputs, Bunge gives consideration to items that
F-29
BUNGE LIMITED AND SUBSIDIARIES
NOTES TO THE CONSOLIDATED FINANCIAL STATEMENTS (Continued)
individually or when aggregated with other inputs, generally represent more than 10% of the fair value of the assets or liabilities. For such identified inputs, judgments are required when evaluating both quantitative and qualitative factors in the determination of significance for purposes of fair value level classification and disclosure. Level 3 assets and liabilities include assets and liabilities whose value is determined using proprietary pricing models, discounted cash flow methodologies or similar techniques; as well as, assets and liabilities for which the determination of fair value requires significant management judgment or estimation. Bunge believes a change in these inputs would not result in a significant change in the fair values.
The majority of Bunge's exchange traded agricultural commodity futures are settled daily generally through its clearing subsidiary and, therefore, such futures are not included in the table below. Assets and liabilities are classified in their entirety based on the lowest level of input that is a significant component of the fair value measurement. The lowest level of input is considered Level 3.
F-30
BUNGE LIMITED AND SUBSIDIARIES
NOTES TO THE CONSOLIDATED FINANCIAL STATEMENTS (Continued)
The following table sets forth, by level, Bunge's assets and liabilities that were accounted for at fair value on a recurring basis.
Fair Value Measurements at Reporting Date | |||||||||||||||||||||||||||||||
December 31, 2017 | December 31, 2016 | ||||||||||||||||||||||||||||||
(US$ in millions) | Level 1 | Level 2 | Level 3 | Total | Level 1 | Level 2 | Level 3 | Total | |||||||||||||||||||||||
Assets: | |||||||||||||||||||||||||||||||
Readily marketable inventories (Note 5) | $ | — | $ | 3,691 | $ | 365 | $ | 4,056 | $ | — | $ | 3,618 | $ | 237 | $ | 3,855 | |||||||||||||||
Trade accounts receivable(1) | — | 5 | 5 | — | 6 | — | 6 | ||||||||||||||||||||||||
Unrealized gain on hedge accounting derivative contracts(2): | |||||||||||||||||||||||||||||||
Interest Rate | — | — | — | — | — | 1 | — | 1 | |||||||||||||||||||||||
Foreign currency | — | 18 | — | 18 | — | 29 | — | 29 | |||||||||||||||||||||||
Unrealized gain on economic derivative contracts(2): | |||||||||||||||||||||||||||||||
Interest rate | — | 4 | — | 4 | — | 1 | — | 1 | |||||||||||||||||||||||
Foreign currency | — | 321 | — | 321 | — | 312 | — | 312 | |||||||||||||||||||||||
Commodities | 115 | 389 | 19 | 523 | 421 | 431 | 96 | 948 | |||||||||||||||||||||||
Freight | 18 | — | 8 | 26 | 16 | — | — | 16 | |||||||||||||||||||||||
Energy | 18 | — | — | 18 | 23 | 1 | — | 24 | |||||||||||||||||||||||
Deferred purchase price receivable (Note 18) | — | 107 | — | 107 | — | 87 | — | 87 | |||||||||||||||||||||||
Other(3) | 15 | 234 | — | 249 | 18 | 108 | — | 126 | |||||||||||||||||||||||
Total assets | $ | 166 | $ | 4,769 | $ | 392 | $ | 5,327 | $ | 478 | $ | 4,594 | $ | 333 | $ | 5,405 | |||||||||||||||
Liabilities: | |||||||||||||||||||||||||||||||
Trade accounts payable(1) | $ | — | $ | 467 | $ | 116 | $ | 583 | $ | — | $ | 478 | $ | 44 | $ | 522 | |||||||||||||||
Unrealized loss on hedge accounting derivative contracts(4): | |||||||||||||||||||||||||||||||
Interest rate | — | 31 | — | 31 | — | 18 | — | 18 | |||||||||||||||||||||||
Foreign currency | — | 2 | — | 2 | — | — | — | — | |||||||||||||||||||||||
Unrealized loss on economic derivative contracts(4): | |||||||||||||||||||||||||||||||
Interest rate | — | 1 | — | 1 | — | — | — | — | |||||||||||||||||||||||
Foreign currency | 1 | 430 | — | 431 | — | 233 | — | 233 | |||||||||||||||||||||||
Commodities | 141 | 271 | 20 | 432 | 356 | 444 | 144 | 944 | |||||||||||||||||||||||
Freight | 15 | — | 3 | 18 | 14 | — | 1 | 15 | |||||||||||||||||||||||
Energy | 9 | 2 | 2 | 13 | 9 | — | 2 | 11 | |||||||||||||||||||||||
Total liabilities | $ | 166 | $ | 1,204 | $ | 141 | $ | 1,511 | $ | 379 | $ | 1,173 | $ | 191 | $ | 1,743 | |||||||||||||||
(1) | These receivables and payables are hybrid financial instruments for which Bunge has elected the fair value option. |
(2) | Unrealized gains on derivative contracts are generally included in other current assets. There were $0 million and $5 million included in other non-current assets at December 31, 2017 and December 31, 2016, respectively. |
(3) | Other includes the fair values of marketable securities and investments in other current assets and other non-current assets. |
(4) | Unrealized losses on derivative contracts are generally included in other current liabilities. There were $31 million and $18 million included in other non-current liabilities at December 31, 2017 and December 31, 2016, respectively. |
F-31
BUNGE LIMITED AND SUBSIDIARIES
NOTES TO THE CONSOLIDATED FINANCIAL STATEMENTS (Continued)
Derivatives—Exchange traded futures and options contracts and exchange cleared contracts are valued based on unadjusted quoted prices in active markets and are classified within Level 1. Bunge's forward commodity purchase and sale contracts are classified as derivatives along with other OTC derivative instruments relating primarily to freight, energy, foreign exchange and interest rates, and are classified within Level 2 or Level 3 as described below. Bunge estimates fair values based on exchange quoted prices, adjusted as appropriate for differences in local markets. These differences are generally valued using inputs from broker or dealer quotations, or market transactions in either the listed or OTC markets. In such cases, these derivative contracts are classified within Level 2.
OTC derivative contracts include swaps, options and structured transactions that are fair valued are generally determined using quantitative models that require the use of multiple market inputs including quoted prices for similar assets or liabilities in active markets, quoted prices for identical or similar assets or liabilities in markets which are not highly active, other observable inputs relevant to the asset or liability, and market inputs corroborated by correlation or other means. These valuation models include inputs such as interest rates, prices and indices to generate continuous yield or pricing curves and volatility factors. Where observable inputs are available for substantially the full term of the asset or liability, the instrument is categorized in Level 2. Certain OTC derivatives trade in less active markets with less availability of pricing information and certain structured transactions can require internally developed model inputs that might not be observable in or corroborated by the market. When unobservable inputs have a significant impact on the measurement of fair value, the instrument is categorized in Level 3.
Exchange traded or cleared derivative contracts are classified in Level 1, thus transfers of assets and liabilities into and/or out of Level 1 occur infrequently. Transfers into Level 1 would generally only be expected to occur when an exchange cleared derivative contract historically valued using a valuation model as the result of a lack of observable inputs becomes sufficiently observable, resulting in the valuation price being essentially the exchange traded price. There were no significant transfers into or out of Level 1 during the periods presented.
Readily marketable inventories—RMI reported at fair value are valued based on commodity futures exchange quotations, broker or dealer quotations, or market transactions in either listed or OTC markets with appropriate adjustments for differences in local markets where Bunge's inventories are located. In such cases, the inventory is classified within Level 2. Certain inventories may utilize significant unobservable data related to local market adjustments to determine fair value. In such cases, the inventory is classified as Level 3.
If Bunge used different methods or factors to determine fair values, amounts reported as unrealized gains and losses on derivative contracts and RMI at fair value in the consolidated balance sheets and consolidated statements of income could differ. Additionally, if market conditions change subsequent to the reporting date, amounts reported in future periods as unrealized gains and losses on derivative contracts and RMI at fair value in the consolidated balance sheets and consolidated statements of income could differ.
Level 3 Measurements—Transfers in and/or out of Level 3 represent existing assets or liabilities that were either previously categorized as a higher level for which the inputs to the model became unobservable or assets and liabilities that were previously classified as Level 3 for which the lowest significant input became observable during the period. Bunge's policy regarding the timing of transfers between levels is to record the transfers at the beginning of the reporting period.
Level 3 Derivatives—Level 3 derivative instruments utilize both market observable and unobservable inputs within the fair value measurements. These inputs include commodity prices, price volatility, interest rates, volumes and locations. In addition, with the exception of the exchange cleared instruments, Bunge is exposed to loss in the event of the non-performance by counterparties on OTC derivative instruments and forward purchase and sale contracts. Adjustments are made to fair values on occasions when non-performance risk is determined to represent a significant input in Bunge's fair value determination. These adjustments are based on Bunge's estimate of the potential loss in the event of counterparty non-performance. Bunge did not have significant adjustments related to non-performance by counterparties at December 31, 2017 or 2016.
Level 3 Readily marketable inventories and other—The significant unobservable inputs resulting in Level 3 classification for RMI, physically settled forward purchase and sale contracts, and trade accounts receivable and payable, net, relate to certain management estimations regarding costs of transportation and other local market or location-related adjustments, primarily freight related adjustments in the interior of Brazil and the lack of market corroborated information in Canada. In both situations, Bunge uses proprietary information such as purchase and sale contracts and contracted prices to value freight, premiums and discounts in its contracts. Movements in the price of these unobservable inputs alone would not have a material effect on Bunge's financial statements as these contracts do not typically exceed one future crop cycle.
F-32
BUNGE LIMITED AND SUBSIDIARIES
NOTES TO THE CONSOLIDATED FINANCIAL STATEMENTS (Continued)
The tables below present reconciliations for assets and liabilities measured at fair value on a recurring basis using significant unobservable inputs (Level 3) during the years ended December 31, 2017 and 2016. These instruments were valued using pricing models that management believes reflect the assumptions that would be used by a marketplace participant.
Year Ended December 31, 2017 | |||||||||||||||
(US$ in millions) | Derivatives, Net (1) | Readily Marketable Inventories (1) | Trade Accounts Receivable/ Payable, Net (1) | Total | |||||||||||
Balance, January 1, 2017 | $ | (51 | ) | $ | 237 | $ | (44 | ) | $ | 142 | |||||
Total gains and losses (realized/unrealized) included in cost of goods sold | (31 | ) | 142 | 13 | 124 | ||||||||||
Purchases | 11 | 1,551 | (469 | ) | 1,093 | ||||||||||
Sales | — | (2,041 | ) | — | (2,041 | ) | |||||||||
Issuances | (7 | ) | — | — | (7 | ) | |||||||||
Settlements | 67 | — | 441 | 508 | |||||||||||
Transfers into Level 3 | (9 | ) | 701 | (59 | ) | 633 | |||||||||
Transfers out of Level 3 | 22 | (225 | ) | 2 | (201 | ) | |||||||||
Balance, December 31, 2017 | $ | 2 | $ | 365 | $ | (116 | ) | $ | 251 | ||||||
1) | Derivatives, net, readily marketable inventories, and trade accounts receivable/payable net, include gains/(losses) of $1 million, $11 million and $0 million, respectively, that are attributable to the change in unrealized gains/(losses) relating to Level 3 assets and liabilities still held at December 31, 2017. |
Year Ended December 31, 2016 | |||||||||||||||
(US$ in millions) | Derivatives, Net (1) | Readily Marketable Inventories (1) | Trade Accounts Receivable/ Payable, Net (1) | Total | |||||||||||
Balance, January 1, 2016 | $ | 167 | $ | 245 | $ | (44 | ) | $ | 368 | ||||||
Total gains and losses (realized/unrealized) included in cost of goods sold | (88 | ) | 162 | 24 | 98 | ||||||||||
Purchases | — | 1,107 | (222 | ) | 885 | ||||||||||
Sales | — | (1,400 | ) | — | (1,400 | ) | |||||||||
Issuances | (1 | ) | — | — | (1 | ) | |||||||||
Settlements | (133 | ) | — | 206 | 73 | ||||||||||
Transfers into Level 3 | (4 | ) | 760 | (78 | ) | 678 | |||||||||
Transfers out of Level 3 | 8 | (637 | ) | 70 | (559 | ) | |||||||||
Balance, December 31, 2016 | $ | (51 | ) | $ | 237 | $ | (44 | ) | $ | 142 | |||||
1) | Derivatives, net, readily marketable inventories, and trade accounts receivable/payable net, includes gains/(losses) of $(1) million, $(41) million and $1 million, respectively, that are attributable to the change in unrealized gains/(losses) relating to Level 3 assets and liabilities still held at December 31, 2016. |
Derivative Instruments and Hedging Activities
Hedge accounting derivatives - Bunge uses derivatives in qualifying hedge accounting relationships to manage certain of its interest rate and foreign currency risks. In executing these hedge strategies, Bunge primarily relies on the shortcut and critical terms match methods in designing its hedge accounting strategy, which results in little to no net earnings impact for these hedge relationships. Bunge monitors these relationships on a quarterly basis and will perform a quantitative analysis to validate the assertion that the hedges are highly effective if there are changes to the hedged item or hedging derivative.
Fair value hedges of interest rate risk - For certain long term debt that is issued at a fixed rate, Bunge enters into interest rate swaps to effectively convert the fixed interest rate to a variable interest rate. These swaps may be for the full term
F-33
BUNGE LIMITED AND SUBSIDIARIES
NOTES TO THE CONSOLIDATED FINANCIAL STATEMENTS (Continued)
of the debt or for only a part of the term. As we apply the shortcut method for all of our interest rate hedges on long term debt, the notional amount of the swap is equal to the amortized cost basis of the hedged debt.
Cash flow hedges of currency risk - Bunge manages currency risk on certain forecasted purchases and sales with currency forwards. The change in the value of the forward is classified in accumulated other comprehensive income (loss) until the transaction affects earnings, at which time the change in value of the currency forward is reclassified to sales or cost of goods sold. These hedges go out until June 2018. Of the amount currently in accumulated other comprehensive income (loss), $4 million is expected to be reclassified to earnings in the next twelve months.
Net investment hedges - Bunge hedges the currency risk of certain of its foreign subsidiaries with currency forwards and intercompany loans for which the currency risk is remeasured through accumulated other comprehensive income (loss).
The table below provides information about the balance sheet values of hedged items and the notional amount of derivatives used in hedging strategies.
December 31, | |||||||
(US$ in millions) | 2017 | 2016 | |||||
Hedging instrument type: | |||||||
Fair value hedges of interest rate risk | |||||||
Carrying value of hedged debt | $ | 2,071 | $ | 1,868 | |||
Cumulative adjustment to long-term debt from application of hedge accounting | $ | (31 | ) | $ | (17 | ) | |
Interest rate swap - notional amount | $ | 2,109 | $ | 1,893 | |||
Cash flow hedges of currency risk | |||||||
Foreign currency forward - notional amount | $ | 237 | $ | 181 | |||
Net investment hedges | |||||||
Foreign currency forward - notional amount | $ | 1,000 | $ | — | |||
Carrying value of non-derivative hedging instrument | $ | 725 | $ | 840 | |||
In addition to using derivatives in qualifying hedge relationships, Bunge enters into derivatives to economically hedge its exposure to a variety of market risks it incurs in the normal course of operations.
Interest rate derivatives are used to hedge exposures to our financial instrument portfolios and debt issuances. The impact of changes in fair value of these instruments is presented in interest expense.
Currency derivatives are used to hedge the balance sheet and commercial exposures that arise from our global operations. The impact of changes in fair value of these instruments is presented in Cost of goods sold when hedging commercial exposures and Foreign currency gains (losses) when hedging monetary exposures.
Agricultural commodity derivatives are used to manage our inventory and forward purchase and sales contracts. Contracts to purchase agricultural commodities generally relate to current or future crop years for delivery periods quoted by regulated commodity exchanges. Contracts for the sale of agricultural commodities generally do not extend beyond one future crop cycle. The impact of changes in fair value of these instruments is presented in Cost of goods sold.
Bunge uses derivative instruments referred to as freight forward agreements ("FFA") and FFA options to hedge portions of its current and anticipated ocean freight costs. The impact of changes in fair value of these instruments is presented in Cost of goods sold.
Bunge uses energy derivative instruments to manage its exposure to volatility in energy costs. Hedges may be entered into for natural gas, electricity, coal and fuel oil, including bunker fuel. The impact of changes in fair value of these instruments is presented in Cost of goods sold.
F-34
BUNGE LIMITED AND SUBSIDIARIES
NOTES TO THE CONSOLIDATED FINANCIAL STATEMENTS (Continued)
The table below summarizes the volume of economic derivatives as of December 31, 2017 and 2016. For those contracts traded bilaterally through the over-the-counter markets (forwards and swaps) the gross position is provided. For exchange traded (futures, FRAs, FFAs and options) and cleared positions (energy swaps), the net position is provided.
December 31, | |||||||||||||
2017 | 2016 | Unit of Measure | |||||||||||
(US$ in millions) | Long | (Short) | Long | (Short) | |||||||||
Interest rate | |||||||||||||
Swaps | $ | 713 | $ | (1,611 | ) | $ | 569 | $ | (500 | ) | $ Notional | ||
Futures | $ | — | $ | (2 | ) | $ | 5 | $ | — | $ Notional | |||
FRAs | $ | — | $ | (1,424 | ) | $ | 979 | $ | (68 | ) | $ Notional | ||
Currency | |||||||||||||
Forwards | $ | 9,784 | $ | (9,668 | ) | $ | 6,126 | $ | (8,889 | ) | $ Notional | ||
Swaps | $ | 192 | $ | (148 | ) | $ | 157 | $ | (129 | ) | $ Notional | ||
Futures | $ | — | $ | (58 | ) | $ | — | $ | — | $ Notional | |||
Options | $ | 521 | $ | (471 | ) | $ | 268 | $ | (126 | ) | Delta | ||
Agricultural commodities | |||||||||||||
Forwards | 23,438,004 | (30,055,331 | ) | 25,960,476 | (35,672,883 | ) | Metric Tons | ||||||
Swaps | 65,045 | (5,279,181 | ) | 1,442,144 | (3,326,874 | ) | Metric Tons | ||||||
Futures | 4,520,267 | — | — | (6,914,908 | ) | Metric Tons | |||||||
Options | 828,296 | — | — | (334,494 | ) | Metric Tons | |||||||
Ocean freight | |||||||||||||
FFA | — | (3,617 | ) | — | (3,165 | ) | Hire Days | ||||||
FFA options | 892 | — | — | (467 | ) | Hire Days | |||||||
Natural gas | |||||||||||||
Swaps | 3,519,668 | — | 1,351,351 | — | MMBtus | ||||||||
Futures | 2,691,350 | — | 3,930,000 | — | MMBtus | ||||||||
Energy - other | |||||||||||||
Forwards | 5,534,290 | — | 6,048,869 | — | Metric Tons | ||||||||
Futures | 1,394 | — | 1,777 | — | Metric Tons | ||||||||
Options | — | — | — | (1,285 | ) | Metric Tons | |||||||
Swaps | 223,600 | — | 215,100 | — | Metric Tons | ||||||||
F-35
BUNGE LIMITED AND SUBSIDIARIES
NOTES TO THE CONSOLIDATED FINANCIAL STATEMENTS (Continued)
The Effect of Financial Instruments on the Consolidated Statements of Income
The table below summarizes the net effect of derivative instruments on the consolidated statements of income for the years ended December 31, 2017, 2016 and 2015.
Gain (Loss) Recognized in Income on Derivative Instruments | ||||||||||
Year Ended December 31, | ||||||||||
(US$ in millions) | 2017 | 2016 | 2015 | |||||||
Income statement classification | Type of derivative | |||||||||
Cost of goods sold | ||||||||||
Hedge accounting | Foreign currency | $ | — | $ | — | $ | — | |||
Economic hedges | Foreign currency | 1 | 772 | (620 | ) | |||||
Commodities | 676 | (618 | ) | 1,062 | ||||||
Freight | 4 | 8 | 6 | |||||||
Energy | 3 | 19 | (25 | ) | ||||||
Total Cost of goods sold | $ | 684 | $ | 181 | $ | 423 | ||||
Interest expense | ||||||||||
Hedge accounting | Interest rate | $ | 13 | $ | 5 | $ | — | |||
Economic hedges | Interest rate | — | (4 | ) | — | |||||
Total Interest expense | $ | 13 | $ | 1 | $ | — | ||||
Foreign currency gains (losses) | ||||||||||
Economic hedges | Foreign currency | $ | 22 | $ | 267 | $ | (302 | ) | ||
Other comprehensive income (loss) | ||||||||||
Gains and losses on derivatives used as cash flow hedges of foreign currency risk included in other comprehensive income (loss) during the period | $ | 14 | $ | 48 | $ | (76 | ) | |||
Gains and losses on derivatives used as net investment hedges included in other comprehensive income (loss) during the period | $ | (8 | ) | $ | (394 | ) | $ | 223 | ||
Foreign currency gains and losses on intercompany loans used as net investment hedges included in other comprehensive income (loss) during the period | $ | (111 | ) | $ | 41 | $ | — | |||
Amounts released from accumulated other comprehensive income (loss) during the period | ||||||||||
Fair value hedge of foreign currency risk | $ | — | $ | — | $ | — | ||||
Cash flow hedge of foreign currency risk | 37 | 16 | (76 | ) | ||||||
Net investment hedge | — | — | — | |||||||
Total | $ | 37 | $ | 16 | $ | (76 | ) | |||
16. SHORT-TERM DEBT AND CREDIT FACILITIES
Bunge's short-term borrowings are typically sourced from various banking institutions and the U.S. commercial paper market. Bunge also borrows from time to time in local currencies in various foreign jurisdictions. Interest expense includes facility commitment fees, amortization of deferred financing costs, and charges on certain lending transactions, including certain intercompany loans and foreign currency conversions in Brazil. The weighted-average interest rate on short-term borrowings at December 31, 2017 and 2016 was 9.84% and 8.69%, respectively.
F-36
BUNGE LIMITED AND SUBSIDIARIES
NOTES TO THE CONSOLIDATED FINANCIAL STATEMENTS (Continued)
December 31, | |||||||
(US$ in millions) | 2017 | 2016 | |||||
Lines of credit: | |||||||
Unsecured, variable interest rates from 1.27% to 33.00% | $ | 304 | $ | 257 | |||
Total short-term debt (1) | $ | 304 | $ | 257 | |||
(1) | Includes $179 million and $148 million of local currency borrowings in certain Central and Eastern European, South American, African and Asia-Pacific countries at a weighted average interest rate of 15.03% and 13.63% as of December 31, 2017 and December 31, 2016, respectively. |
Bunge's commercial paper program is supported by an identical amount of committed back up bank credit lines (the "Liquidity Facility") provided by banks that are rated at least A-1 by Standard & Poor's Financial Services and P-1 by Moody's Investors Service. On November 20, 2014, Bunge entered into an unsecured $600 million five years Liquidity Facility with certain lenders party thereto. The cost of borrowing under the Liquidity Facility would typically be higher than the cost of issuing under Bunge's commercial paper program. At December 31, 2017 and December 31, 2016, there were no borrowings outstanding under the commercial paper program and no borrowings under the Liquidity Facility.
In addition to the committed facilities discussed above, from time-to-time, Bunge Limited and/or its financing subsidiaries enter into uncommitted bilateral short-term credit lines as necessary based on its financing requirements. At December 31, 2017 and 2016, nil and nil were outstanding under these bilateral short-term credit lines, respectively. Loans under such credit lines are non-callable by the respective lenders. In addition, Bunge's operating companies had $304 million in short-term borrowings outstanding from local bank lines of credit at December 31, 2017 to support working capital requirements.
17. LONG-TERM DEBT AND CREDIT FACILITIES
Long-term debt obligations are summarized below.
December 31, | |||||||
(US$ in millions) | 2017 | 2016 | |||||
Term loan due 2019—three-month Yen LIBOR plus 0.75% (Tranche A) | $ | 253 | $ | 243 | |||
Term loan due 2019—fixed Yen interest rate of 0.96% (Tranche B) | 53 | 51 | |||||
Term loan due 2019—three-month LIBOR plus 1.30% (Tranche C) | 85 | 85 | |||||
5.90% Senior Notes due 2017 | — | 250 | |||||
3.20% Senior Notes due 2017 | — | 600 | |||||
8.50% Senior Notes due 2019 | 599 | 600 | |||||
3.50% Senior Notes due 2020 | 497 | 497 | |||||
3.00% Senior Notes due 2022 | 396 | — | |||||
1.85% Senior Notes due 2023—Euro | 960 | 843 | |||||
3.25% Senior Notes due 2026 | 694 | 694 | |||||
3.75% Senior Notes due 2027 | 593 | — | |||||
Other | 45 | 144 | |||||
Subtotal | 4,175 | 4,007 | |||||
Less: Current portion of long-term debt | (15 | ) | (938 | ) | |||
Total long-term debt (1) | $ | 4,160 | $ | 3,069 | |||
(1) Includes secured debt of $24 million and $34 million at December 31, 2017 and December 31, 2016, respectively.
F-37
BUNGE LIMITED AND SUBSIDIARIES
NOTES TO THE CONSOLIDATED FINANCIAL STATEMENTS (Continued)
The fair values of long-term debt, including current portion are calculated based on interest rates currently available on comparable maturities to companies with credit standing similar to that of Bunge. The carrying amounts and fair values of long-term debt are as follows:
December 31, 2017 | December 31, 2016 | ||||||||||||||||
(US$ in millions) | Carrying Value | Fair Value (Level 2) | Carrying Value | Fair Value (Level 2) | |||||||||||||
Long-term debt, including current portion | $ | 4,175 | $ | 4,337 | $ | 4,007 | $ | 4,163 | |||||||||
On December 12, 2017, Bunge entered into an amendment agreement to its unsecured $1,750 million Amended and Restated Revolving Credit Facility, dated as of March 17, 2014 and amended as of August 10, 2015 (the “Revolving Credit Facility”). The amendment agreement extends the maturity date of the Revolving Credit Facility to December 12, 2020. The amendment agreement also lowers the range of margin applicable to Bunge’s borrowings under the Revolving Credit Facility. Borrowings under the Credit Agreement will bear interest at LIBOR plus a margin, which will vary from 0.30% to 1.30% per annum, based on the credit ratings of Bunge's senior long-term unsecured debt. Amounts under the Revolving Credit Facility that remain undrawn are subject to a commitment fee payable quarterly based on the average undrawn portion of the Revolving Credit Facility at a rate of 35% of the margin specified above, based on the credit ratings of Bunge’s senior long-term unsecured debt. Bunge also will pay a fee that will vary from 0.10% to 0.40% based on the utilization of the facility. Bunge may from time to time, with the consent of the facility agent, request one or more of the existing lenders or new lenders to increase the total commitments in an amount not to exceed $250 million pursuant to an accordion provision. Bunge has the option to request an extension of the maturity date of the facility for two additional one-year periods. Each lender in its sole discretion may agree to any such extension request. Bunge had no borrowings outstanding at December 31, 2017 under the Revolving Credit Facility.
In connection with Bunge entering into an agreement to acquire a 70% ownership interest in IOI Loders Croklaan from IOI Corporation Berhad (the “Loders Acquisition”), on September 12, 2017, Bunge entered into an unsecured $900 million term loan agreement. Following the completion of the offering of senior notes described below, on and effective as of September 25, 2017, Bunge terminated the loan agreement. No funds had been drawn under the loan agreement as of the date of termination.
On September 25, 2017, Bunge completed the sale and issuance of $400 million aggregate principal amount of 3.00% unsecured senior notes due September 25, 2022, and $600 million aggregate principal amount of 3.75% unsecured senior notes due September 25, 2027. The senior notes are fully and unconditionally guaranteed by Bunge Limited. The offering was made pursuant to a registration statement filed with the U.S. Securities and Exchange Commission. Interest on the senior notes is payable semi-annually in arrears in March and September of each year, commencing on March 25, 2018. The net proceeds of the offering were approximately $989 million after deducting underwriting commissions and offering expenses. Bunge intends to use the net proceeds from this offering to fund the purchase price for the Loders Acquisition. Pending the closing of the Loders Acquisition, the net proceeds from the offering were used to repay outstanding indebtedness of Bunge.
On September 6, 2017, Bunge entered into an amendment agreement to its unsecured $865 million Amended and Restated Credit Agreement, dated as of June 17, 2014 (the “Credit Agreement”). The amendment agreement extends the maturity date of the Credit Agreement to September 6, 2022. The amendment agreement also lowers the range of margin applicable to Bunge’s borrowings under the Credit Agreement. Borrowings under the Credit Agreement will bear interest at LIBOR plus a margin, which will vary from 1.00% to 1.75% per annum, based on the credit ratings of Bunge's senior long-term unsecured debt. Amounts under the Credit Agreement that remain undrawn are subject to a commitment fee payable quarterly based on the average undrawn portion of the Credit Agreement at rates ranging from 0.125% to 0.275%, based on the credit ratings of Bunge’s senior long-term unsecured debt. Bunge had no borrowings outstanding at December 31, 2017 under the Credit Agreement.
At December 31, 2017, Bunge had $5,015 million of unused and available borrowing capacity under its committed long-term credit facilities with a number of lending institutions.
Certain land, property, equipment and investments in consolidated subsidiaries having a net carrying value of approximately $54 million at December 31, 2017 have been mortgaged or otherwise collateralized against long-term debt of $29 million at December 31, 2017.
F-38
BUNGE LIMITED AND SUBSIDIARIES
NOTES TO THE CONSOLIDATED FINANCIAL STATEMENTS (Continued)
Principal Maturities—Principal maturities of long-term debt at December 31, 2017 are as follows:
(US$ in millions) | |||
2018 | $ | 18 | |
2019 | 1,009 | ||
2020 | 517 | ||
2021 | 16 | ||
2022 | 406 | ||
Thereafter | 2,259 | ||
Total (1) | $ | 4,225 | |
(1) | Excludes components of long-term debt attributable to fair value hedge accounting of $31 million and deferred financing fees and unamortized premiums of $19 million. |
Bunge's credit facilities and certain senior notes require it to comply with specified financial covenants related to minimum net worth, minimum current ratio, a maximum debt to capitalization ratio, and limitations on secured indebtedness. Bunge was in compliance with these covenants at December 31, 2017.
During the years ended December 31, 2017, 2016 and 2015, Bunge paid interest, net of interest capitalized, of $236 million, $234 million and $227 million, respectively.
18. TRADE RECEIVABLES SECURITIZATION PROGRAM
Bunge and certain of its subsidiaries participate in a trade receivables securitization program ("Program") with a financial institution, as administrative agent, and certain commercial paper conduit purchasers and committed purchasers (collectively, the "Purchasers") that provides for funding of up to $700 million against receivables sold into the Program. The Program is designed to enhance Bunge's financial flexibility by providing an additional source of liquidity for its operations. In connection with the Program, certain of Bunge's U.S. and non-U.S. subsidiaries that originate trade receivables may sell eligible receivables in their entirety on a revolving basis to a consolidated bankruptcy remote special purpose entity, Bunge Securitization B.V. ("BSBV") formed under the laws of The Netherlands. BSBV in turn sells such purchased trade receivables to the administrative agent (acting on behalf of the Purchasers) pursuant to a receivables transfer agreement. In connection with these sales of accounts receivable, Bunge receives a portion of the proceeds up front and an additional amount upon the collection of the underlying receivables, which is expected to be generally between 10% and 15% of the aggregate amount of receivables sold through the Program.
Koninklijke Bunge B.V., a wholly owned subsidiary of Bunge, acts as master servicer, responsible for servicing and collecting the accounts receivable for the Program. The Program terminates on May 26, 2021. The trade receivables sold under the program are subject to specified eligibility criteria, including eligible currencies, and country and obligor concentration limits.
December 31, | |||||||
(US$ in millions) | 2017 | 2016 | |||||
Receivables sold which were derecognized on Bunge balance sheet | $ | 810 | $ | 628 | |||
Deferred purchase price included in other current assets | $ | 107 | $ | 87 | |||
The table below summarizes the cash flows and discounts of Bunge's trade receivables associated with the Program. Servicing fees under the Program were not significant in any period.
F-39
BUNGE LIMITED AND SUBSIDIARIES
NOTES TO THE CONSOLIDATED FINANCIAL STATEMENTS (Continued)
Years Ended December 31, | |||||||||||
(US$ in millions) | 2017 | 2016 | 2015 | ||||||||
Gross receivables sold | $ | 10,022 | $ | 9,405 | $ | 10,601 | |||||
Proceeds received in cash related to transfer of receivables | $ | 9,734 | $ | 9,197 | $ | 10,396 | |||||
Cash collections from customers on receivables previously sold | $ | 9,659 | $ | 9,176 | $ | 10,542 | |||||
Discounts related to gross receivables sold included in SG&A | $ | 9 | $ | 6 | $ | 5 | |||||
Bunge's risk of loss following the sale of the trade receivables is limited to the deferred purchase price ("DPP"), and is included in other current assets in the consolidated balance sheets (see Note 6). The DPP will be repaid in cash as receivables are collected, generally within 30 days. Delinquencies and credit losses on trade receivables sold under the Program during the years ended December 31, 2017 and 2016 were insignificant. Bunge has reflected all cash flows under the Program as operating cash flows in the consolidated statements of cash flows for the years ended December 31, 2017, 2016 and 2015.
19. EMPLOYEE BENEFIT PLANS
Certain U.S., Canadian, European and Brazilian-based subsidiaries of Bunge sponsor non-contributory defined benefit pension plans covering substantially all employees of the subsidiaries. The plans provide benefits based primarily on participants' salary and length of service. The funding policies for Bunge's defined benefit pension plans are determined in accordance with statutory funding requirements. The most significant defined benefit plan is in the United States. The U.S. funding policy requires at least those amounts required by the Pension Protection Act of 2006. Assets of the plans consist primarily of equity and fixed income investments.
Certain United States and Brazil based subsidiaries of Bunge have benefit plans to provide certain postretirement healthcare benefits to eligible retired employees of those subsidiaries. The plans require minimum retiree contributions and define the maximum amount the subsidiaries will be obligated to pay under the plans. Bunge's policy is to fund these costs as they become payable.
Plan amendments and pension liability adjustment - On September 19, 2017, Bunge approved changes to certain U.S. defined benefit pension plans. These changes will freeze the Plans for future benefit accruals effective January 1, 2023, and these Plans will be closed for participation for employees hired on or after January 1, 2018. As a result, Bunge recognized a curtailment gain associated with the Plans’ freeze and as such, the projected benefit obligations for these Plans were remeasured as of September 30, 2017. At September 30, 2017, a $31 million pension curtailment gain and $18 million remeasurement loss were recognized and recorded in other comprehensive income.
In addition, the Company offered a voluntary early retirement program to qualifying U.S. based salaried employees. The employees that accepted the offer received an enhanced retirement benefit in the non-contributory defined benefit pension plans. The Company incurred $10 million of additional defined benefit expenses relating to the program, which are reflected in the tables below.
Plan Transfers In and Out - There were no significant settlements or transfers into or out of Bunge's employee benefit plans during the years ended December 31, 2017 or 2016.
The following table sets forth in aggregate the changes in the defined benefit pension and postretirement benefit plans' benefit obligations, assets and funded status at December 31, 2017 or 2016. A measurement date of December 31 was used for all plans.
F-40
BUNGE LIMITED AND SUBSIDIARIES
NOTES TO THE CONSOLIDATED FINANCIAL STATEMENTS (Continued)
Pension Benefits December 31, | Postretirement Benefits December 31, | ||||||||||||||
(US$ in millions) | 2017 | 2016 | 2017 | 2016 | |||||||||||
Change in benefit obligations: | |||||||||||||||
Benefit obligation at the beginning of year | $ | 941 | $ | 864 | $ | 74 | $ | 56 | |||||||
Service cost | 33 | 32 | — | — | |||||||||||
Interest cost | 36 | 35 | 8 | 7 | |||||||||||
Plan curtailments | (31 | ) | (3 | ) | — | — | |||||||||
Special termination benefits | 9 | — | — | ||||||||||||
Actuarial (gain) loss, net | 100 | 31 | (11 | ) | 8 | ||||||||||
Employee contributions | 6 | 6 | 1 | 1 | |||||||||||
Net transfers in (out) | 3 | 8 | — | — | |||||||||||
Plan settlements | — | (5 | ) | — | — | ||||||||||
Benefits paid | (35 | ) | (21 | ) | (4 | ) | (7 | ) | |||||||
Expenses paid | (4 | ) | (2 | ) | — | — | |||||||||
Impact of foreign exchange rates | 15 | (4 | ) | (1 | ) | 9 | |||||||||
Benefit obligation at the end of year | $ | 1,073 | $ | 941 | $ | 67 | $ | 74 | |||||||
Change in plan assets: | |||||||||||||||
Fair value of plan assets at the beginning of year | $ | 740 | $ | 689 | $ | — | $ | — | |||||||
Actual return on plan assets | 102 | 53 | — | — | |||||||||||
Employer contributions | 77 | 20 | 3 | 6 | |||||||||||
Employee contributions | 6 | 6 | 1 | 1 | |||||||||||
Plan settlements | — | (4 | ) | — | — | ||||||||||
Effect of plan combinations | — | 1 | — | — | |||||||||||
Benefits paid | (35 | ) | (21 | ) | (4 | ) | (7 | ) | |||||||
Expenses paid | (4 | ) | (3 | ) | — | — | |||||||||
Impact of foreign exchange rates | 10 | (1 | ) | — | — | ||||||||||
Fair value of plan assets at the end of year | $ | 896 | $ | 740 | $ | — | $ | — | |||||||
Funded (unfunded) status and net amounts recognized: | |||||||||||||||
Plan assets (less than) in excess of benefit obligation | $ | (177 | ) | $ | (201 | ) | $ | (67 | ) | $ | (74 | ) | |||
Net (liability) asset recognized in the balance sheet | $ | (177 | ) | $ | (201 | ) | $ | (67 | ) | $ | (74 | ) | |||
Amounts recognized in the balance sheet consist of: | |||||||||||||||
Non-current assets | $ | 18 | $ | 16 | $ | — | |||||||||
Current liabilities | (6 | ) | (5 | ) | (7 | ) | (8 | ) | |||||||
Non-current liabilities | (189 | ) | (212 | ) | (60 | ) | (66 | ) | |||||||
Net liability recognized | $ | (177 | ) | $ | (201 | ) | $ | (67 | ) | $ | (74 | ) | |||
Included in accumulated other comprehensive income (loss) for pension benefits at December 31, 2017 are the following amounts that have not yet been recognized in net periodic benefit costs: unrecognized prior service credit of $6 million ($4 million, net of tax) and unrecognized actuarial loss of $194 million ($126 million, net of tax). Expected prior service costs and unrecognized actuarial losses as a component of net periodic benefit costs included in accumulated other comprehensive income (loss) in 2017 is $9 million ($6 million, net of tax).
Included in accumulated other comprehensive income (loss) for postretirement healthcare benefits at December 31, 2017 are the following amounts that have not yet been recognized in net periodic benefit costs: unrecognized prior service credit of $1 million ($1 million, net of tax), and unrecognized actuarial loss of $3 million ($2 million, net of tax). Bunge does not expect to recognize any unrecognized prior service credits or unrecognized actuarial losses as components of net periodic benefit costs for its postretirement benefit plans in 2017.
F-41
BUNGE LIMITED AND SUBSIDIARIES
NOTES TO THE CONSOLIDATED FINANCIAL STATEMENTS (Continued)
Bunge has aggregated certain defined benefit pension plans with projected benefit obligations in excess of fair value of plan assets with pension plans that have fair value of plan assets in excess of projected benefit obligations. At December 31, 2017, $1,073 million projected benefit obligations includes plans with projected benefit obligations of $937 million which were in excess of the fair value of related plan assets of $742 million. At December 31, 2016, the $941 million projected benefit obligations include plans with projected benefit obligations of $806 million which were in excess of the fair value of related plan assets of $589 million. The accumulated benefit obligation for the defined pension benefit plans, respectively, was $1,011 million at December 31, 2017 and $850 million at December 31, 2016.
The following table summarizes information relating to aggregated defined benefit pension plans with an accumulated benefit obligation in excess of plan assets:
Pension Benefits December 31, | |||||||
(US$ in millions) | 2017 | 2016 | |||||
Projected benefit obligation | $ | 827 | $ | 680 | |||
Accumulated benefit obligation | $ | 789 | $ | 617 | |||
Fair value of plan assets | $ | 651 | $ | 484 | |||
At December 31, 2017, for measurement purposes related to postretirement benefit plans, an 8.4% annual rate of increase in the per capita cost of covered healthcare benefits was assumed for 2017, decreasing to 8.1% by 2038, remaining at that level thereafter. At December 31, 2016, for measurement purposes related to postretirement benefit plans, an 8.8% annual rate of increase in the per capita cost of covered healthcare benefits was assumed for 2016, decreasing to 8.0% by 2038, remaining at that level thereafter.
A one-percentage point change in assumed healthcare cost trend rates would have the following effects:
(US$ in millions) | One-percentage point increase | One-percentage point decrease | |||||
Effect on total service and interest cost | $ | 1 | $ | (1 | ) | ||
Effect on postretirement benefit obligation | $ | 5 | $ | (4 | ) | ||
The components of net periodic benefit costs are as follows for defined benefit pension plans and postretirement benefit plans:
Pension Benefits December 31, | Postretirement Benefits December 31, | ||||||||||||||||||||||
(US$ in millions) | 2017 | 2016 | 2015 | 2017 | 2016 | 2015 | |||||||||||||||||
Service cost | $ | 33 | $ | 32 | $ | 35 | $ | — | $ | — | $ | — | |||||||||||
Interest cost | 36 | 35 | 33 | 8 | 7 | 5 | |||||||||||||||||
Expected return on plan assets | (46 | ) | (44 | ) | (42 | ) | — | — | — | ||||||||||||||
Amortization of prior service cost | — | — | 1 | — | — | — | |||||||||||||||||
Amortization of net loss | 10 | 10 | 12 | — | — | — | |||||||||||||||||
Curtailment loss | — | — | 1 | — | — | — | |||||||||||||||||
Settlement loss recognized | — | — | 1 | — | — | — | |||||||||||||||||
Special termination benefit | 9 | 1 | — | — | — | — | |||||||||||||||||
Net periodic benefit costs | $ | 42 | $ | 34 | $ | 41 | $ | 8 | $ | 7 | $ | 5 | |||||||||||
F-42
BUNGE LIMITED AND SUBSIDIARIES
NOTES TO THE CONSOLIDATED FINANCIAL STATEMENTS (Continued)
The weighted-average actuarial assumptions used in determining the benefit obligation under the defined benefit pension and postretirement benefit plans are as follows:
Pension Benefits December 31, | Postretirement Benefits December 31, | ||||||||||
2017 | 2016 | 2017 | 2016 | ||||||||
Discount rate | 3.4 | % | 3.9 | % | 9.0 | % | 10.8 | % | |||
Increase in future compensation levels | 3.2 | % | 3.2 | % | N/A | N/A | |||||
The weighted-average actuarial assumptions used in determining the net periodic benefit cost under the defined benefit pension and postretirement benefit plans are as follows:
Pension Benefits December 31, | Postretirement Benefits December 31, | ||||||||||||||||
2017 | 2016 | 2015 | 2017 | 2016 | 2015 | ||||||||||||
Discount rate | 4.0 | % | 4.2 | % | 3.8 | % | 10.8 | % | 11.4 | % | 9.8 | % | |||||
Expected long-term rate of return on assets | 6.2 | % | 6.4 | % | 6.7 | % | N/A | N/A | N/A | ||||||||
Increase in future compensation levels | 3.2 | % | 3.3 | % | 3.5 | % | N/A | N/A | N/A | ||||||||
The sponsoring subsidiaries select the expected long-term rate of return on assets in consultation with their investment advisors and actuaries. These rates are intended to reflect the average rates of earnings expected on the funds invested or to be invested to provide required plan benefits. The plans are assumed to continue in effect as long as assets are expected to be invested.
In estimating the expected long-term rate of return on assets, appropriate consideration is given to historical performance for the major asset classes held, or anticipated to be held, by the applicable plan trusts and to current forecasts of future rates of return for those asset classes. Cash flows and expenses are taken into consideration to the extent that the expected returns would be affected by them. As assets are generally held in qualified trusts, anticipated returns are not reduced for taxes.
Pension Benefit Plan Assets—The objectives of the plans' trust funds are to sufficiently diversify plan assets to maintain a reasonable level of risk without imprudently sacrificing returns, with a target asset allocation of approximately 40% fixed income securities and approximately 60% equities. Bunge implements its investment strategy through a combination of indexed mutual funds and a proprietary portfolio of fixed income securities. Bunge's policy is not to invest plan assets in Bunge Limited shares.
Plan investments are stated at fair value, which is the amount that would be received to sell an asset or paid to transfer a liability in an orderly transaction between market participants at the measurement date. For a further definition of fair value and the associated fair value levels, refer to Note 15.
The fair values of Bunge's defined benefit pension plans' assets at the measurement date, by category, are as follows:
December 31, 2017 | |||||||||||||||
(US$ in millions) | Total | Quoted Prices in Active Markets for Identical Assets (Level 1) | Significant Observable Inputs (Level 2) | Significant Unobservable Inputs (Level 3) | |||||||||||
Cash | $ | 31 | $ | 31 | $ | — | $ | — | |||||||
Equities: | |||||||||||||||
Mutual funds(1) | 470 | 423 | 47 | — | |||||||||||
Fixed income securities: | |||||||||||||||
Mutual funds(2) | 357 | 315 | 42 | — | |||||||||||
Others(3) | 38 | 7 | 26 | 5 | |||||||||||
Total | $ | 896 | $ | 776 | $ | 115 | $ | 5 | |||||||
F-43
BUNGE LIMITED AND SUBSIDIARIES
NOTES TO THE CONSOLIDATED FINANCIAL STATEMENTS (Continued)
December 31, 2016 | |||||||||||||||
(US$ in millions) | Total | Quoted Prices in Active Markets for Identical Assets (Level 1) | Significant Observable Inputs (Level 2) | Significant Unobservable Inputs (Level 3) | |||||||||||
Cash | $ | 8 | $ | 8 | $ | — | $ | — | |||||||
Equities: | |||||||||||||||
Mutual funds(1) | 406 | 366 | 40 | — | |||||||||||
Fixed income securities: | |||||||||||||||
Mutual funds(2) | 299 | 199 | 100 | — | |||||||||||
Others(3) | 27 | — | 23 | 4 | |||||||||||
Total | $ | 740 | $ | 573 | $ | 163 | $ | 4 | |||||||
(1) | This category represents a portfolio of equity investments comprised of equity index funds that invest in U.S. equities and non-U.S. equities. The U.S. equities are comprised of investments focusing on large, mid and small cap companies and non-U.S. equities are comprised of international, emerging markets, and real estate investment trusts. |
(2) | This category represents a portfolio of fixed income investments in mutual funds comprised of investment grade U.S. government bonds and notes, foreign government bonds, and corporate bonds from diverse industries. |
(3) | This category represents a portfolio consisting of a mixture of equity, fixed income and cash. |
Bunge expects to contribute $15 million and $7 million, respectively, to its defined benefit pension and postretirement benefit plans in 2018.
The following benefit payments, which reflect future service as appropriate, are expected to be paid related to defined benefit pension and postretirement benefit plans:
(US$ in millions) | Pension Benefit Payments | Postretirement Benefit Payments | |||||
2018 | $ | 49 | $ | 7 | |||
2019 | 50 | 7 | |||||
2020 | 52 | 7 | |||||
2021 | 53 | 7 | |||||
2022 | 53 | 7 | |||||
2023 and onwards | 292 | 33 | |||||
Employee Defined Contribution Plans—Bunge also makes contributions to qualified defined contribution plans for eligible employees. Contributions to these plans amounted to $11 million, $11 million and $11 million during the years ended December 31, 2017, 2016 and 2015, respectively.
20. RELATED PARTY TRANSACTIONS
Notes receivable - Bunge holds a note receivable from Navegações Unidas Tapajós S.A., a 50% equity method investment in Brazil, having a carrying value of $22 million at December 31, 2017, which matures in June 2019, with interest based on 80% of CDI, the average one‑day interbank deposit rate in Brazil.
Bunge holds a note receivable from Solazyme Bunge Renewable Oils Cooperatief U.A., a 49.9% equity method investment in Brazil, having a carrying value of $9 million at December 31, 2017, with an interest rate based on 100% of CDI, the average one-day interbank deposit rate in Brazil.
Bunge holds a note receivable from its affiliate Bunge SCF Grain LLC, a 50% equity method investment, with a carrying value of $9 million at December 31, 2017, matures on March 31, 2019, with an interest rate based on LIBOR.
F-44
BUNGE LIMITED AND SUBSIDIARIES
NOTES TO THE CONSOLIDATED FINANCIAL STATEMENTS (Continued)
In addition, Bunge held notes receivables from other related parties totaling $2 million at December 31, 2017.
Other—Bunge purchased soybeans and other commodity products and received port services from certain of its unconsolidated ventures, totaling $920 million, $1,054 million and $757 million for the years ended December 31, 2017, 2016 and 2015, respectively. Bunge also sold soybeans and other commodity products and provided port services to certain of its unconsolidated ventures, totaling $508 million, $326 million and $351 million for the years ended December 31, 2017, 2016 and 2015, respectively. At December 31, 2017 and 2016, Bunge had approximately $16 million and $33 million of receivables from these ventures included in trade accounts receivable in the consolidated balance sheets as of those dates. In addition, at December 31, 2017 and 2016, Bunge had approximately $36 million and $46 million of payables to these ventures included in trade accounts payable in the consolidated balance sheets as of those dates.
In addition, Bunge provided services during the years ended December 31, 2017, 2016 and 2015, to its unconsolidated ventures totaling $166 million, $103 million and $106 million, respectively, for services including primarily tolling and administrative support. Bunge believes all of these transaction values are similar to those that would be conducted with third parties.
21. COMMITMENTS AND CONTINGENCIES
Bunge is party to a large number of claims and lawsuits, primarily non-income tax and labor claims in Brazil and non-income tax claims in Argentina, arising in the normal course of business. The ability to predict the ultimate outcome of such matters involves judgments, estimates and inherent uncertainties. Bunge records liabilities related to its general claims and lawsuits when the exposure item becomes probable and can be reasonably estimated. Bunge management does not expect these matters to have a material adverse effect on Bunge’s financial condition, results of operations or liquidity. However, these matters are subject to inherent uncertainties and there exists the remote possibility of an adverse impact on Bunge’s position in the period the uncertainties are resolved whereby the settlement of the identified contingencies could exceed the amount of provisions included in the consolidated balance sheets. Included in other non-current liabilities at December 31, 2017 and 2016 are the following amounts related to these matters:
December 31, | |||||||
(US$ in millions) | 2017 | 2016 | |||||
Non-income tax claims | $ | 161 | $ | 170 | |||
Labor claims | 92 | 82 | |||||
Civil and other claims | 103 | 98 | |||||
Total | $ | 356 | $ | 350 | |||
Brazil Indirect Taxes
Non-income tax claims - These tax claims relate principally to claims against Bunge’s Brazilian subsidiaries, primarily value-added tax claims (ICMS, ISS, IPI and PIS/COFINS). The determination of the manner in which various Brazilian federal, state and municipal taxes apply to the operations of Bunge is subject to varying interpretations arising from the complex nature of Brazilian tax law. In addition to the matter discussed below, Bunge monitors other potential claims in Brazil regarding these value-added taxes. In particular, Bunge monitors the Brazilian federal and state governments’ responses to recent Brazilian Supreme Court decisions invalidating on constitutional grounds certain ICMS incentives and benefits granted by various states. While Bunge was not a recipient of any of the incentives and benefits that were the subject of these Supreme Court decisions, it has received other similar tax incentives and benefits which are being challenged before the Supreme Court. In August 2017, Complementary Law 160/2017 (“LC 160/2017”) was published, authorizing the states, through an agreement to be reached within the framework of CONFAZ (National Council of Fiscal Policy), to grant amnesty for tax debts arising from existing tax benefits granted without previous CONFAZ authorization and to maintain such existing benefits still in force for up to 15 years. In December 2017, Interstate Agreement ICMS 190/2017 was published to regulate Complementary Law 160/2017, which provides for the remission of tax credits originated from tax benefits granted without the previous approval of a CONFAZ Interstate Agreement. Bunge has not received any tax assessment from the states that granted these incentives or benefits related to their validity and, based on Bunge's evaluation of this matter as required by U.S. GAAP, no liability has been recorded in the consolidated financial statements.
On February 13, 2015, Brazil’s Supreme Federal Court ruled in a leading case that certain state ICMS tax credits for staple foods (including soy oil, margarine, mayonnaise and wheat flours) are unconstitutional. Bunge, like other companies in the Brazilian food industry, is involved in several administrative and judicial disputes with Brazilian states regarding these tax
F-45
BUNGE LIMITED AND SUBSIDIARIES
NOTES TO THE CONSOLIDATED FINANCIAL STATEMENTS (Continued)
credits. While the leading case does not involve Bunge and each case is unique in facts and circumstances and applicable state law, the ruling has general precedent authority in lower court cases. Based on management’s review of the ruling (without considering the future success of any potential clarification or modulation of the ruling) and its general application to Bunge’s pending cases, management recorded a liability in the fourth quarter of 2014. Since 2015, Bunge settled a portion of its outstanding liabilities in amnesty programs in certain Brazilian states. As of December 31, 2017, the accrued liability was 403 million Brazilian reais (approximately $122 million).
As of December 31, 2017, the Brazilian federal and state authorities have concluded examinations of the ICMS and PIS COFINS tax returns and have issued the outstanding claims (including applicable interest and penalties) as of:
December 31, | |||||||
(US$ in millions) | Years Examined | 2017 | 2016 | ||||
ICMS | 1990 to Present | $ | 281 | $ | 241 | ||
PIS/COFINS | 2004 through 2012 | $ | 200 | $ | 154 | ||
Argentina Export Tax
Since 2010, the Argentine tax authorities have been conducting a review of income and other taxes paid by exporters and processors of cereals and other agricultural commodities in the country. In that regard, the Company has been subject to a number of assessments, proceedings, and claims related to its activities. In 2011, Bunge’s subsidiary in Argentina paid $112 million of accrued export tax obligations under protest and preserved its rights with respect to such payment. In 2012, the Argentine tax authorities further assessed interest on these payments, which as of December 31, 2017, totaled approximately $263 million. In 2012, the Argentine government suspended Bunge’s Argentine subsidiary from a registry of grain traders. While the suspension has not had a material adverse effect on Bunge’s business in Argentina, these actions have resulted in additional administrative requirements and increased logistical costs on domestic grain shipments within Argentina. Bunge is challenging these actions in the Argentine courts.
Labor claims — The labor claims are principally claims against Bunge’s Brazilian subsidiaries. The labor claims primarily relate to dismissals, severance, health and safety, salary adjustments and supplementary retirement benefits.
Civil and other claims — The civil and other claims relate to various disputes with third parties, including suppliers and customers.
During the first quarter of 2016, Bunge received a notice from the Brazilian Administrative Council for Economic Defense initiating an administrative proceeding against its Brazilian subsidiary and two of its employees, certain of its former employees, several other companies in the Brazilian wheat milling industry, and others for alleged anticompetitive activities in the north and northeast of Brazil. Bunge is defending against this action; however, the proceedings are at an early stage and Bunge cannot, at this time, reasonably predict the ultimate outcome of the proceedings or sanctions, if any, which may be imposed.
Guarantees—Bunge has issued or was a party to the following guarantees at December 31, 2017:
(US$ in millions) | Maximum Potential Future Payments | ||
Unconsolidated affiliates guarantee (1)(2) | $ | 215 | |
Residual value guarantee (3) | 269 | ||
Total | $ | 484 | |
(1) | Bunge issued guarantees to certain financial institutions related to debt of certain of its unconsolidated affiliates. The terms of the guarantees are equal to the terms of the related financings which have maturity dates in 2017 through 2034. There are no recourse provisions or collateral that would enable Bunge to recover any amounts paid under these guarantees. At December 31, 2017, Bunge recorded no obligation related to these guarantees. |
(2) | Bunge issued guarantees to certain third parties related to performance of its unconsolidated affiliates. The terms of the guarantees are equal to the completion date of a port terminal which is expected to be completed in 2020. There are no |
F-46
BUNGE LIMITED AND SUBSIDIARIES
NOTES TO THE CONSOLIDATED FINANCIAL STATEMENTS (Continued)
recourse provisions or collateral that would enable Bunge to recover any amounts paid under these guarantees. At December 31, 2017, Bunge recorded no obligation related to these guarantees.
(3) | Bunge issued guarantees to certain financial institutions which are party to certain operating lease arrangements for railcars and barges. These guarantees provide for a minimum residual value to be received by the lessor at conclusion of the lease term. These leases expire at various dates from 2019 through 2024. At December 31, 2017, Bunge's recorded obligation related to these guarantees was $2 million. |
Bunge Limited has provided a Guaranty to the Director of the Illinois Department of Agriculture as Trustee for Bunge North America, Inc. ("BNA"), an indirect wholly-owned subsidiary, which guarantees all amounts due and owing by BNA, to grain producers and/or depositors in the State of Illinois who have delivered commodities to BNA's Illinois facilities.
In addition, Bunge Limited has provided full and unconditional parent level guarantees of the outstanding indebtedness under certain credit facilities entered into and senior notes issued by, its subsidiaries. At December 31, 2017, Bunge's consolidated balance sheet includes debt with a carrying amount of $4,249 million related to these guarantees. This debt includes the senior notes issued by three of Bunge's 100% owned finance subsidiaries, Bunge Limited Finance Corp., Bunge Finance Europe B.V. and Bunge N.A. Finance L.P. There are largely no restrictions on the ability of Bunge Limited Finance Corp., Bunge Finance Europe B.V. and Bunge N.A. Finance L.P. or any other Bunge subsidiary to transfer funds to Bunge Limited.
Freight Supply Agreements—In the ordinary course of business, Bunge enters into time charter agreements for the use of ocean freight vessels and freight service on railroad lines for the purpose of transporting agricultural commodities. In addition, Bunge sells the right to use these ocean freight vessels when excess freight capacity is available. These agreements generally range from two months to approximately seven years, in the case of ocean freight vessels, depending on market conditions, and five to nine years in the case of railroad services. Future minimum payment obligations due under these agreements as of December 31, 2017 are as follows:
(US$ in millions) | Ocean Freight Vessels | Railroad Services | Minimum Payment Obligations | ||||||||
2018 | $ | 194 | $ | 36 | $ | 230 | |||||
2019 and 2020 | 121 | 69 | 190 | ||||||||
2021 and 2022 | 102 | 67 | 169 | ||||||||
2023 and thereafter | 53 | 66 | 119 | ||||||||
Total | $ | 470 | $ | 238 | $ | 708 | |||||
Actual amounts paid under these contracts may differ due to the variable components of these agreements and the amount of income earned on the sales of excess capacity. The agreements for the freight service on railroad lines require a minimum monthly payment regardless of the actual level of freight services used by Bunge. The costs of Bunge's freight supply agreements are typically passed through to the customers as a component of the prices charged for its products.
Also in the ordinary course of business, Bunge enters into re-let agreements related to ocean freight vessels. Such re-let agreements are similar to sub-leases. Bunge received approximately $117 million during the year ended December 31, 2017 and expects to receive payments of approximately $15 million in 2018 under such relet agreements.
In reviewing the impact of ASC 606, the Company also considered the impact of the adoption of ASU 2016-02, Leases (Topic 842), which is effective January 1, 2019, on the hiring of the vessels and has preliminarily concluded that these contracts are leases in the scope of the guidance.
Commitments—At December 31, 2017, Bunge had approximately $20 million of purchase commitments related to its inventories, $95 million of power supply contracts and $38 million of contractual commitments related to construction in progress.
22. REDEEMABLE NONCONTROLLING INTERESTS
In July 2012, Bunge and Nutre Farming B.V. entered into a joint venture agreement whereby Bunge acquired a 55% interest in a newly formed oilseed processing venture in its agribusiness segment in Eastern Europe. Bunge consolidates the venture in its consolidated financial statements. In conjunction with the formation of the venture, Bunge entered into an agreement to acquire the remaining 45% interest at either Bunge's or the noncontrolling interest holder's option in the future.
F-47
BUNGE LIMITED AND SUBSIDIARIES
NOTES TO THE CONSOLIDATED FINANCIAL STATEMENTS (Continued)
The exercise date and price of the option were reasonably determinable. As a result, Bunge had classified the noncontrolling interest as redeemable noncontrolling interest in its consolidated balance sheet as of December 31, 2012. During the second quarter of 2016, Bunge exercised its call option for the remaining 45% interest in the joint venture for approximately $39 million. The transaction was concluded in September 2016.
23. EQUITY
Share Repurchase Program—In May 2015, Bunge established a new program for the repurchase of up to $500 million of Bunge's issued and outstanding common shares. The program has no expiration date. Bunge did not repurchase any common shares during the year ended December 31, 2017. In 2016, Bunge repurchased 3,296,230 common shares under this program for $200 million. Total repurchases under the program from its inception in May 2015 through December 31, 2017 were 4,707,440 shares for $300 million.
Cumulative Convertible Perpetual Preference Shares—Bunge has 6,899,700, 4.875% cumulative convertible perpetual preference shares (convertible preference shares), par value $0.01 outstanding at December 31, 2017. Each convertible preference share has an initial liquidation preference of $100 per share plus accumulated unpaid dividends up to a maximum of an additional $25 per share. As a result of adjustments made to the initial conversion price because cash dividends paid on Bunge Limited's common shares exceeded certain specified thresholds, each convertible preference share is convertible at any time at the holder's option into approximately 1.1693 common shares based on a conversion price of $85.5238 per convertible preference share, subject in each case to certain specified anti-dilution adjustments (which represents 8,067,819 Bunge Limited common shares at December 31, 2017).
If the closing market price of Bunge's common shares equals or exceeds 130% of the conversion price of the convertible preference shares, for 20 trading days within any period of 30 consecutive trading days (including the last trading day of such period), Bunge may elect to cause all outstanding convertible preference shares to be automatically converted into the number of common shares that are issuable at the conversion price. The convertible preference shares are not redeemable by Bunge at any time.
The convertible preference shares accrue dividends at an annual rate of 4.875%. Dividends are cumulative from the date of issuance and are payable, quarterly in arrears, on each March 1, June 1, September 1 and December 1, commencing on March 1, 2007, when, as and if declared by Bunge's Board of Directors. The dividends may be paid in cash, common shares or a combination thereof. Accumulated but unpaid dividends on the convertible preference shares will not bear interest. In each of the years ended December 31, 2017, 2016 and 2015, Bunge recorded $34 million of dividends on its convertible preference shares.
Pension liability adjustment - On September 19, 2017, Bunge approved changes to certain U.S. defined benefit pension plans (“Plans”). The changes were announced on September 26, 2017 to all U.S. employees of Bunge. These changes will freeze the Plans for future benefit accruals effective January 1, 2023, and these Plans will be closed for participation for employees hired on or after January 1, 2018. As a result, Bunge recognized a curtailment gain associated with the Plans’ freeze and as such, the projected benefit obligations for these Plans were remeasured as of September 30, 2017. At September 30, 2017, a $31 million pension curtailment gain and $18 million remeasurement loss were recognized and recorded in other comprehensive income.
F-48
BUNGE LIMITED AND SUBSIDIARIES
NOTES TO THE CONSOLIDATED FINANCIAL STATEMENTS (Continued)
Accumulated Other Comprehensive Income (Loss) Attributable to Bunge—The following table summarizes the balances of related after-tax components of accumulated other comprehensive income (loss) attributable to Bunge:
(US$ in millions) | Foreign Currency Translation Adjustment(1) | Deferred Gains (Losses) on Hedging Activities | Pension and Other Postretirement Liability Adjustments | Unrealized Gains (Losses) on Investments | Accumulated Other Comprehensive Income (Loss) | ||||||||||||||
Balance January 1, 2015 | $ | (3,897 | ) | $ | (10 | ) | (154 | ) | 3 | (4,058 | ) | ||||||||
Other comprehensive income (loss) before reclassifications | (2,546 | ) | 147 | 7 | — | (2,392 | ) | ||||||||||||
Amount reclassified from accumulated other comprehensive income | — | 77 | 13 | — | 90 | ||||||||||||||
Net-current period other comprehensive income (loss) | (2,546 | ) | 224 | 20 | — | (2,302 | ) | ||||||||||||
Balance, December 31, 2015 | (6,443 | ) | $ | 214 | (134 | ) | 3 | (6,360 | ) | ||||||||||
Other comprehensive income (loss) before reclassifications | 709 | (305 | ) | (11 | ) | — | 393 | ||||||||||||
Amount reclassified from accumulated other comprehensive income (loss) | — | (11 | ) | — | — | (11 | ) | ||||||||||||
Net-current period other comprehensive income (loss) | 709 | (316 | ) | (11 | ) | — | 382 | ||||||||||||
Balance, December 31, 2016 | (5,734 | ) | $ | (102 | ) | (145 | ) | 3 | (5,978 | ) | |||||||||
Other comprehensive income (loss) before reclassifications | 187 | (105 | ) | 5 | 2 | 89 | |||||||||||||
Amount reclassified from accumulated other comprehensive income (loss) | — | (37 | ) | — | (4 | ) | (41 | ) | |||||||||||
Net-current period other comprehensive income (loss) | 187 | (142 | ) | 5 | (2 | ) | 48 | ||||||||||||
Balance, December 31, 2017 | $ | (5,547 | ) | $ | (244 | ) | $ | (140 | ) | $ | 1 | $ | (5,930 | ) | |||||
(1) | Bunge has significant operating subsidiaries in Brazil, Argentina, North America, Europe and Asia-Pacific. The functional currency of Bunge's subsidiaries is the local currency. The assets and liabilities of these subsidiaries are translated into U.S. dollars from local currency at month-end exchange rates, and the resulting foreign currency translation gains (losses) are recorded in the consolidated balance sheets as a component of accumulated other comprehensive income (loss). |
24. EARNINGS PER COMMON SHARE
Basic earnings per share is computed by dividing net income available to Bunge common shareholders by the weighted-average number of common shares outstanding, excluding any dilutive effects of stock options, restricted stock unit awards, and convertible preference shares during the reporting period. Diluted earnings per share is computed similar to basic earnings per share, except that the weighted-average number of common shares outstanding is increased to include additional shares from the assumed exercise of stock options, restricted stock unit awards and convertible securities, if dilutive. The number of additional shares is calculated by assuming that outstanding stock options, except those which are not dilutive, were exercised and that the proceeds from such exercises were used to acquire common shares at the average market price during the reporting period. In addition, Bunge accounts for the effects of convertible securities using the if-converted method. Under this method, the convertible securities are assumed to be converted and the related dividends are added back to earnings, if dilutive.
F-49
BUNGE LIMITED AND SUBSIDIARIES
NOTES TO THE CONSOLIDATED FINANCIAL STATEMENTS (Continued)
The following table sets forth the computation of basic and diluted earnings per common share:
Year Ended December 31, | |||||||||||
(US$ in millions, except for share data) | 2017 | 2016 | 2015 | ||||||||
Income from continuing operations | $ | 174 | $ | 776 | $ | 755 | |||||
Net (income) loss attributable to noncontrolling interests | (14 | ) | (22 | ) | 1 | ||||||
Income (loss) from continuing operations attributable to Bunge | 160 | 754 | 756 | ||||||||
Other redeemable obligations(1) | — | (2 | ) | (19 | ) | ||||||
Convertible preference share dividends | (34 | ) | (34 | ) | (34 | ) | |||||
Income (loss) from discontinued operations, net of tax | — | (9 | ) | 35 | |||||||
Net income (loss) available to Bunge common shareholders - Basic | 126 | 709 | 738 | ||||||||
Add back convertible preference share dividends | — | 34 | 34 | ||||||||
Net income (loss) available to Bunge common shareholders - Diluted | $ | 126 | $ | 743 | $ | 772 | |||||
Weighted-average number of common shares outstanding: | |||||||||||
Basic | 140,365,549 | 139,845,124 | 143,671,546 | ||||||||
Effect of dilutive shares: | |||||||||||
—stock options and awards(2) | 899,528 | 441,521 | 749,031 | ||||||||
—convertible preference shares(3) | — | 7,939,830 | 7,818,390 | ||||||||
Diluted | 141,265,077 | 148,226,475 | 152,238,967 | ||||||||
Basic earnings (loss) per common share: | |||||||||||
Net income (loss) from continuing operations | $ | 0.90 | $ | 5.13 | $ | 4.90 | |||||
Net income (loss) from discontinued operations | — | (0.06 | ) | 0.24 | |||||||
Net income (loss) attributable to Bunge common shareholders—basic | $ | 0.90 | $ | 5.07 | $ | 5.14 | |||||
Diluted earnings (loss) per common share: | |||||||||||
Net income (loss) from continuing operations | $ | 0.89 | $ | 5.07 | $ | 4.84 | |||||
Net income (loss) from discontinued operations | — | (0.06 | ) | 0.23 | |||||||
Net income (loss) attributable to Bunge common shareholders—diluted | $ | 0.89 | $ | 5.01 | $ | 5.07 | |||||
(1) | Accretion of redeemable noncontrolling interest of $0 million, $2 million and $19 million for the years ended December 31, 2017, 2016 and 2015, respectively, related to a non-fair value variable put arrangement whereby the noncontrolling interest holder may have required Bunge to purchase the remaining shares of an oilseed processing operation in Central and Eastern Europe. As further discussed in Note 22, during the second quarter of 2016 Bunge exercised its call option for their 45% interest in the joint venture for approximately $39 million. The transaction concluded in September 2016. Accretion for the respective periods includes the effect of losses incurred by the operations for the years ended December 31, 2016 and 2015. |
(2) | The weighted-average common shares outstanding-diluted excludes approximately 4 million, 4 million and 3 million stock options and contingently issuable restricted stock units, which were not dilutive and not included in the computation of earnings per share for the years ended December 31, 2017, 2016 and 2015, respectively. |
(3) | Weighted-average common share outstanding-diluted for the year ended December 31, 2017 excludes approximately 8 million weighted-average common shares that are issuable upon conversion of the convertible preference shares that were not dilutive and not included in the weighted-average number of common shares outstanding. |
25. SHARE-BASED COMPENSATION
For the years ended December 31, 2017, 2016 and 2015, Bunge recognized approximately $29 million, $44 million and $46 million, respectively, of total compensation expense for awards classified as equity awards related to its stock option and restricted stock unit awards.
F-50
BUNGE LIMITED AND SUBSIDIARIES
NOTES TO THE CONSOLIDATED FINANCIAL STATEMENTS (Continued)
In 2017, Bunge granted equity awards under the 2016 Equity Incentive Plan (the "2016 EIP"), a shareholder approved plan. Under the 2016 EIP, the Compensation Committee of Bunge's Board of Directors may grant equity based awards to officers, employees, consultants and independent contractors in the form of stock options, restricted stock units (performance based or time-vested) or other equity based awards. The 2016 EIP replaced the 2009 Equity Incentive Plan (the "2009 EIP"), also a shareholder approved plan, under which, beginning May 26, 2016, no further awards may be granted. Shares issued under the 2016 EIP may consist, in whole or in part, of authorized and unissued shares, treasury shares or shares reacquired by the Company in any manner, or a combination thereof.
(i) Stock Option Awards—Options to purchase Bunge Limited common shares are granted with an exercise price equal to the grant date fair market value of Bunge common stock, vest over service periods that generally range from one to three years, and expire 10 years from the date of grant. Vesting may be accelerated in certain circumstances as provided in the plans or associated award agreements. Grant date fair value is recognized as compensation expense on a straight-line basis for option grants.
(ii) Restricted Stock Units—Restricted stock units ("RSUs") give recipients the right to receive shares of Bunge common stock upon the lapse of related restrictions determined by the Compensation Committee. Restrictions on RSUs may be based on continued service by the recipient through the designated term and/or based on the achievement of certain performance targets. These targets may be financial or market-based, and the number of units actually earned varies based on the level of achievement of predefined goals. Compensation expense in recognized on a straight-line basis over the vesting period for restricted stock units. RSUs generally vest over periods ranging from one to three years. Vesting may be accelerated under certain circumstances as defined in the plans or associated award agreements. RSUs are generally settled in shares of Bunge common stock upon satisfaction of the applicable vesting terms. Where share settlement may be prohibited under local law, RSUs are settled in cash. At the time of settlement, a participant holding a vested restricted stock unit will also be entitled to receive corresponding accrued dividend equivalent share payments.
Bunge has also established the Bunge Limited 2017 Non-Employee Directors' Equity Incentive Plan (the "2017 Directors' Plan"), a shareholder approved plan. Under the 2017 Directors' Plan, the Compensation Committee may grant equity based awards to non-employee directors of Bunge Limited. Awards may consist of restricted stock, restricted stock units, deferred restricted stock units and non-statutory stock options. The 2017 Directors' Plan replaced the 2007 Non-Employee Directors Equity Incentive Plan, under which no further awards may be granted.
Restricted Stock Units—Restricted stock units granted to non-employee directors generally vest on the first anniversary of the grant date, provided the director continues to serve on the Board until such date, and are settled in shares of Bunge Limited common stock. At the time of settlement, a participant holding a vested restricted stock unit is also entitled to receive corresponding accrued dividend equivalent share payments.
The fair value of each stock option granted under any of Bunge's equity incentive plans is estimated on the grant date using the Black Scholes Merton option pricing model. Assumptions for the prior three years are noted in the following table. The expected volatility of Bunge's common shares is a weighted average of historical volatility calculated using the daily closing price of Bunge's shares up to the grant date and implied volatilities on open option contracts on Bunge's stock as of the grant date. Bunge uses historical employee exercise behavior for valuation purposes. The expected option term of granted options represents the period of time that the granted options are expected to be outstanding based on historical experience and giving consideration for the contractual terms, vesting periods and expectations of future employee behavior. The risk-free interest rate is based on U.S. Treasury zero-coupon bonds with a term equal to the expected option term of the respective grants and grant dates.
December 31, | ||||||||
Assumptions: | 2017 | 2016 | 2015 | |||||
Expected option term (in years) | 5.86 | 5.67 | 5.87 | |||||
Expected dividend yield | 2.09 | % | 3.04 | % | 1.67 | % | ||
Expected volatility | 24.85 | % | 26.06 | % | 27.47 | % | ||
Risk-free interest rate | 2.21 | % | 1.41 | % | 1.73 | % | ||
A summary of option activity under the plans for the year ended December 31, 2017 is presented below:
F-51
BUNGE LIMITED AND SUBSIDIARIES
NOTES TO THE CONSOLIDATED FINANCIAL STATEMENTS (Continued)
Options | Shares | Weighted-Average Exercise Price | Weighted-Average Remaining Contractual Term (Years) | Aggregate Intrinsic Value | ||||||||
Outstanding at January 1, 2017 | 5,949,819 | $ | 69.35 | |||||||||
Granted | 1,344,100 | $ | 80.99 | |||||||||
Exercised | (862,726 | ) | $ | 67.47 | ||||||||
Forfeited or expired | (214,623 | ) | $ | 76.11 | ||||||||
Outstanding at December 31, 2017 | 6,216,570 | $ | 71.88 | 6.09 | $ | 26 | ||||||
Exercisable at December 31, 2017 | 3,716,283 | $ | 73.62 | 4.41 | $ | 10 | ||||||
The weighted-average grant date fair value of options granted during the years ended December 31, 2017, 2016 and 2015 was $17.13, $8.86 and $19.36, respectively. The total intrinsic value of options exercised during the years ended December 31, 2017, 2016 and 2015 was approximately $11 million, $1 million and $11 million, respectively. The excess tax benefit classified as a financing cash flow was not significant for any of the periods presented.
At December 31, 2017, $20 million of total unrecognized compensation cost related to non-vested stock options granted under the equity incentive plan is expected to be recognized over the next two years.
A summary of restricted stock unit activity under Bunge's plans for the year ended December 31, 2017 is presented below.
Restricted Stock Units | Shares | Weighted-Average Grant-Date Fair Value | ||||
Restricted stock units at January 1, 2017 | 1,544,265 | $ | 64.85 | |||
Granted | 694,082 | 76.79 | ||||
Vested/issued (2) | (343,790 | ) | 75.22 | |||
Forfeited/cancelled (2) | (190,553 | ) | 72.99 | |||
Restricted stock units at December 31, 2017 (1) | 1,704,004 | $ | 66.81 | |||
(1) | Includes accrued unvested dividends, which are payable in Bunge's common shares upon vesting of underlying restricted stock units. |
(2) | During the year ended December 31, 2017, Bunge issued 267,419 common shares, net of common shares withheld to cover taxes, including related common shares representing accrued dividends, with a weighted-average fair value of $77.12 per share. During the year ended December 31, 2017, 124,984 performance-based restricted stock units vested. During the year ended December 31, 2017, Bunge canceled approximately 147,028 shares related to performance-based restricted stock unit awards that did not vest due to non-achievement of performance targets. |
The fair value of RSU awards is determined based on the market value of the Company's shares on the grant date. The weighted-average grant date fair value of restricted stock units granted during the years ended December 31, 2017, 2016 and 2015 was $76.79, $51.42 and $81.97, respectively.
At December 31, 2017, there was approximately $33 million of total unrecognized compensation cost related to restricted stock units granted under the equity incentive plans, which is expected to be recognized over the next two years. The total fair value of restricted stock units vested during the year ended December 31, 2017 was approximately $28 million.
Common Shares Reserved for Share-Based Awards—The 2017 Directors' Plan and the 2016 EIP provide that 120,000 and 5,800,000 common shares, respectively, are to be reserved for grants of stock options, restricted stock units and other awards under the plans. At December 31, 2017, 101,720 and 3,850,654 common shares were available for future grants under the 2017 Directors' Plan and the 2016 EIP, respectively. No shares are currently available for grant under any other Bunge Limited equity incentive plan.
26. LEASE COMMITMENTS
Bunge routinely leases storage facilities, transportation equipment and office facilities under operating leases. Future minimum lease payments by year and in the aggregate under non-cancelable operating leases with initial or remaining terms of
F-52
BUNGE LIMITED AND SUBSIDIARIES
NOTES TO THE CONSOLIDATED FINANCIAL STATEMENTS (Continued)
one year or more at December 31, 2017 are as follows:
(US$ in millions) | Minimum Lease Payments | ||
2018 | $ | 205 | |
2019 | 197 | ||
2020 | 195 | ||
2021 | 100 | ||
2022 | 70 | ||
Thereafter | 107 | ||
Total | $ | 874 | |
Net rent expense under non-cancelable operating leases is as follows:
Year Ended December 31, | |||||||||||
(US$ in millions) | 2017 | 2016 | 2015 | ||||||||
Rent expense | $ | 251 | $ | 213 | $ | 182 | |||||
Sublease income | (9 | ) | (9 | ) | (6 | ) | |||||
Net rent expense | $ | 242 | $ | 204 | $ | 176 | |||||
In addition, Bunge enters into agricultural partnership agreements for the production of sugarcane. These agreements have an average remaining life of four years and cover approximately 225,000 hectares of land under cultivation. Amounts owed under these agreements are dependent on several variables, including the quantity of sugarcane produced per hectare, the total recoverable sugar ("ATR") per ton of sugarcane produced, and the price for each kilogram of ATR as determined by Consecana, the São Paulo state sugarcane, sugar and ethanol council. During the years ended December 31, 2017, 2016 and 2015, Bunge made payments related to these agreements of $105 million, $89 million and $75 million, respectively, for advances on future production. Additionally, $69 million, $64 million and $50 million were included in cost of goods sold in the consolidated statements of income for the years ended December 31, 2017, 2016 and 2015, respectively.
27. SEGMENT INFORMATION
Bunge has five reportable segments—Agribusiness, Edible Oil Products, Milling Products, Sugar and Bioenergy, and Fertilizer—which are organized based upon similar economic characteristics and are similar in nature of products and services offered, the nature of production processes, and the type and class of customer and distribution methods. The Agribusiness segment is characterized by both inputs and outputs being agricultural commodities and thus high volume and low margin. The Edible Oil Products segment involves the processing, production and marketing of products derived from vegetable oils. The Milling Products segment involves the processing, production and marketing of products derived primarily from wheat and corn. The Sugar and Bioenergy segment involves sugarcane growing and milling in Brazil, sugar merchandising in various countries, as well as sugarcane-based ethanol production and corn-based ethanol investments and related activities. Following the classification of the Brazilian fertilizer distribution and North American fertilizer businesses as discontinued operations, the activities of the Fertilizer segment include the production, blending and distribution of fertilizers in Argentina, Uruguay and Paraguay, as well as port operations in Brazil and Argentina.
The "Discontinued Operations & Unallocated" column in the following table contains the reconciliation between the totals for reportable segments and Bunge consolidated totals, which consist primarily of amounts attributable to discontinued operations, corporate items not allocated to the operating segments, and inter-segment eliminations. Transfers between the segments are generally valued at market. The segment revenues generated from these transfers are shown in the following table as "Inter-segment revenues."
F-53
BUNGE LIMITED AND SUBSIDIARIES
NOTES TO THE CONSOLIDATED FINANCIAL STATEMENTS (Continued)
(US$ in millions) | Agribusiness | Edible Oil Products | Milling Products | Sugar and Bioenergy | Fertilizer | Discontinued Operations & Unallocated(1) | Total | ||||||||||||||||||||
2017 | |||||||||||||||||||||||||||
Net sales to external customers | $ | 31,741 | $ | 8,018 | $ | 1,575 | $ | 4,054 | $ | 406 | $ | — | $ | 45,794 | |||||||||||||
Inter—segment revenues | 4,323 | 154 | 5 | 45 | 4 | (4,531 | ) | — | |||||||||||||||||||
Foreign currency gains (losses) | 85 | 3 | (3 | ) | 11 | (1 | ) | — | 95 | ||||||||||||||||||
Noncontrolling interests(1) | (9 | ) | (8 | ) | — | — | (2 | ) | 5 | (14 | ) | ||||||||||||||||
Other income (expense)—net | 62 | (6 | ) | (4 | ) | (3 | ) | — | — | 49 | |||||||||||||||||
Segment EBIT(3) | 256 | 126 | 63 | (12 | ) | 3 | — | 436 | |||||||||||||||||||
Discontinued operations(2) | — | — | — | — | — | — | — | ||||||||||||||||||||
Depreciation, depletion and amortization | (267 | ) | (105 | ) | (61 | ) | (164 | ) | (12 | ) | — | (609 | ) | ||||||||||||||
Investments in affiliates | 411 | — | — | 50 | — | — | 461 | ||||||||||||||||||||
Total assets | 12,094 | 2,610 | 1,460 | 2,195 | 330 | 182 | 18,871 | ||||||||||||||||||||
Capital expenditures | 318 | 136 | 45 | 139 | 9 | 15 | 662 | ||||||||||||||||||||
2016 | |||||||||||||||||||||||||||
Net sales to external customers | $ | 30,061 | $ | 6,859 | $ | 1,647 | $ | 3,709 | $ | 403 | $ | — | $ | 42,679 | |||||||||||||
Inter—segment revenues | 3,867 | 115 | 9 | 13 | — | (4,004 | ) | — | |||||||||||||||||||
Foreign currency gains (losses) | (7 | ) | (1 | ) | (7 | ) | 9 | (2 | ) | — | (8 | ) | |||||||||||||||
Noncontrolling interests(1) | (21 | ) | (13 | ) | — | — | (2 | ) | 14 | (22 | ) | ||||||||||||||||
Other income (expense)—net | 24 | 7 | (4 | ) | (16 | ) | 1 | — | 12 | ||||||||||||||||||
Segment EBIT(4) | 875 | 112 | 131 | (4 | ) | 29 | — | 1,143 | |||||||||||||||||||
Discontinued operations(2) | — | — | — | — | — | (9 | ) | (9 | ) | ||||||||||||||||||
Depreciation, depletion and amortization | (236 | ) | (94 | ) | (62 | ) | (143 | ) | (12 | ) | — | (547 | ) | ||||||||||||||
Investments in affiliates | 325 | — | — | 48 | — | — | 373 | ||||||||||||||||||||
Total assets | 12,159 | 2,329 | 1,444 | 2,754 | 318 | 184 | 19,188 | ||||||||||||||||||||
Capital expenditures | 421 | 108 | 75 | 131 | 16 | 33 | 784 | ||||||||||||||||||||
2015 | |||||||||||||||||||||||||||
Net sales to external customers | $ | 31,267 | $ | 6,698 | $ | 1,609 | $ | 3,495 | $ | 386 | $ | — | $ | 43,455 | |||||||||||||
Inter—segment revenues | 3,499 | 178 | 37 | 12 | — | (3,726 | ) | — | |||||||||||||||||||
Foreign currency gains (losses) | 67 | — | (8 | ) | (68 | ) | 1 | — | (8 | ) | |||||||||||||||||
Noncontrolling interests(1) | (9 | ) | (8 | ) | — | — | (1 | ) | 19 | 1 | |||||||||||||||||
Other income (expense)—net | (3 | ) | 4 | (3 | ) | (15 | ) | (1 | ) | — | (18 | ) | |||||||||||||||
Segment EBIT(5) | 1,108 | 59 | 103 | (27 | ) | 5 | — | 1,248 | |||||||||||||||||||
Discontinued operations(2) | — | — | — | — | — | 35 | 35 | ||||||||||||||||||||
Depreciation, depletion and amortization | (234 | ) | (90 | ) | (46 | ) | (160 | ) | (15 | ) | — | (545 | ) | ||||||||||||||
Investments in affiliates | 249 | — | — | 80 | — | — | 329 | ||||||||||||||||||||
Total assets | 11,832 | 1,963 | 1,343 | 2,318 | 299 | 159 | 17,914 | ||||||||||||||||||||
Capital expenditures | 359 | 63 | 60 | 125 | 17 | 25 | 649 | ||||||||||||||||||||
(1) | Includes the noncontrolling interests' share of interest and tax to reconcile to consolidated noncontrolling interests. |
(2) | Represents net income (loss) from discontinued operations. |
(3) | 2017 EBIT includes a $9 million gain related to the disposition of a subsidiary in our Agribusiness segment in Brazil, which is recorded in other income (expense)-net. In addition, Bunge recorded pre-tax, impairment charges of $52 |
F-54
BUNGE LIMITED AND SUBSIDIARIES
NOTES TO THE CONSOLIDATED FINANCIAL STATEMENTS (Continued)
million, of which $19 million, $16 million and $17 million are in selling, general and administrative expenses, cost of goods sold and other income (expense)—net, respectively. Of these pre-tax impairment charges, $41 million was allocated to Agribusiness, $7 million to Sugar and Bioenergy, $3 million to Edible Oil Products, and $1 million to Milling Products.
(4) | 2016 EBIT includes $122 million of gains related to disposition of equity interest in operations in Agribusiness, recorded in other income (expense)-net. In addition, Bunge recorded pre-tax impairment charges of $72 million, $9 million and $6 million in other income (expense)-net, cost of goods sold and selling, general and administrative expenses, respectively. Of these pre-tax impairment charges, $46 million was allocated to Sugar and Bioenergy, $29 million to Agribusiness, $9 million to Fertilizer, $2 million Edible Oils and $1 million to Milling Products. |
(5) | 2015 EBIT includes a $47 million gain on the sale of assets in Agribusiness. In addition, Bunge recorded pre-tax impairment charges of $57 million, of which $24 million, $20 million and $13 million are included in cost of goods sold, selling, general and administrative expenses and other income (expense)-net, respectively. Of these pre-tax impairment charges, $25 million was allocated to Agribusiness and $32 million to Edible Oil Products. |
Total segment earnings before interest and taxes ("EBIT") is an operating performance measure used by Bunge's management to evaluate segment operating activities. Bunge's management believes total segment EBIT is a useful measure of operating profitability, since the measure allows for an evaluation of the performance of its segments without regard to its financing methods or capital structure. In addition, EBIT is a financial measure that is widely used by analysts and investors in Bunge's industries.
A reconciliation of total segment EBIT to net income attributable to Bunge follows:
Year Ended December 31, | |||||||||||
(US$ in millions) | 2017 | 2016 | 2015 | ||||||||
Total segment EBIT from continuing operations | $ | 436 | $ | 1,143 | $ | 1,248 | |||||
Interest income | 38 | 51 | 43 | ||||||||
Interest expense | (263 | ) | (234 | ) | (258 | ) | |||||
Income tax (expense) benefit | (56 | ) | (220 | ) | (296 | ) | |||||
Income (loss) from discontinued operations, net of tax | — | (9 | ) | 35 | |||||||
Noncontrolling interests' share of interest and tax | 5 | 14 | 19 | ||||||||
Net income attributable to Bunge | $ | 160 | $ | 745 | $ | 791 | |||||
Net sales by product group to external customers were as follows:
Year Ended December 31, | |||||||||||
(US$ in millions) | 2017 | 2016 | 2015 | ||||||||
Agricultural Commodity Products | $ | 31,741 | $ | 30,061 | $ | 31,267 | |||||
Edible Oil Products | 8,018 | 6,859 | 6,698 | ||||||||
Wheat Milling Products | 988 | 1,079 | 1,054 | ||||||||
Corn Milling Products | 587 | 568 | 555 | ||||||||
Sugar and Bioenergy Products | 4,054 | 3,709 | 3,495 | ||||||||
Fertilizer Products | 406 | 403 | 386 | ||||||||
Total | $ | 45,794 | $ | 42,679 | $ | 43,455 | |||||
F-55
BUNGE LIMITED AND SUBSIDIARIES
NOTES TO THE CONSOLIDATED FINANCIAL STATEMENTS (Continued)
Geographic area information for net sales to external customers, determined based on the location of the subsidiary making the sale, and long-lived assets follows:
Year Ended December 31, | |||||||||||
(US$ in millions) | 2017 | 2016 | 2015 | ||||||||
Net sales to external customers: | |||||||||||
Europe | $ | 16,313 | $ | 14,238 | $ | 14,346 | |||||
United States | 10,128 | 10,239 | 10,256 | ||||||||
Asia-Pacific | 8,613 | 7,843 | 8,680 | ||||||||
Brazil | 7,040 | 6,604 | 6,117 | ||||||||
Argentina | 1,433 | 1,406 | 1,490 | ||||||||
Canada | 1,114 | 1,120 | 1,245 | ||||||||
Rest of world | 1,153 | 1,229 | 1,321 | ||||||||
Total | $ | 45,794 | $ | 42,679 | $ | 43,455 | |||||
Year Ended December 31, | |||||||||||
(US$ in millions) | 2017 | 2016 | 2015 | ||||||||
Long-lived assets(1): | |||||||||||
Brazil | $ | 2,406 | $ | 2,452 | $ | 2,086 | |||||
United States | 1,267 | 1,249 | 1,130 | ||||||||
Europe | 1,485 | 1,107 | 1,074 | ||||||||
Asia-Pacific | 483 | 505 | 558 | ||||||||
Canada | 440 | 378 | 400 | ||||||||
Argentina | 216 | 189 | 204 | ||||||||
Rest of world | 341 | 320 | 377 | ||||||||
Total | $ | 6,638 | $ | 6,200 | $ | 5,829 | |||||
(1) | Long-lived assets include property, plant and equipment, net, goodwill and other intangible assets, net, investments in affiliates and non-current assets held for sale. |
F-56
BUNGE LIMITED AND SUBSIDIARIES
NOTES TO THE CONSOLIDATED FINANCIAL STATEMENTS (Continued)
28. QUARTERLY FINANCIAL INFORMATION (UNAUDITED)
Quarter | |||||||||||||||||||
(US$ in millions, except per share data) | First | Second | Third | Fourth | Year | ||||||||||||||
2017 | |||||||||||||||||||
Net sales | $ | 11,121 | $ | 11,645 | $ | 11,423 | $ | 11,605 | $ | 45,794 | |||||||||
Gross profit | 460 | 355 | 490 | 459 | 1,764 | ||||||||||||||
Income (loss) from discontinued operations, net of tax | (6 | ) | 6 | — | — | — | |||||||||||||
Net income (loss) | 48 | 87 | 92 | (53 | ) | 174 | |||||||||||||
Net income (loss) attributable to Bunge | 47 | 81 | 92 | (60 | ) | 160 | |||||||||||||
Earnings (loss) per common share—basic(1) | |||||||||||||||||||
Net income (loss) from continuing operations | $ | 0.31 | $ | 0.48 | $ | 0.59 | $ | (0.48 | ) | $ | 0.90 | ||||||||
Net income (loss) from discontinued operations | (0.04 | ) | 0.04 | — | — | — | |||||||||||||
Net income (loss) attributable to Bunge common shareholders | $ | 0.27 | $ | 0.52 | $ | 0.59 | $ | (0.48 | ) | $ | 0.90 | ||||||||
Earnings (loss) per common share—diluted(1) | |||||||||||||||||||
Net income (loss) from continuing operations | $ | 0.31 | $ | 0.48 | $ | 0.59 | $ | (0.48 | ) | $ | 0.89 | ||||||||
Net income (loss) from discontinued operations | (0.04 | ) | 0.03 | — | — | — | |||||||||||||
Net income (loss) attributable to Bunge common shareholders | $ | 0.27 | $ | 0.51 | $ | 0.59 | $ | (0.48 | ) | $ | 0.89 | ||||||||
2016 | |||||||||||||||||||
Net sales | $ | 8,916 | $ | 10,541 | $ | 11,423 | $ | 11,799 | $ | 42,679 | |||||||||
Gross profit | 620 | 530 | 556 | 704 | 2,410 | ||||||||||||||
Income (loss) from discontinued operations, net of tax | (9 | ) | (4 | ) | 5 | (1 | ) | (9 | ) | ||||||||||
Net income (loss) | 232 | 120 | 130 | 285 | 767 | ||||||||||||||
Net income (loss) attributable to Bunge | 235 | 121 | 118 | 271 | 745 | ||||||||||||||
Earnings (loss) per common share—basic(1) | |||||||||||||||||||
Net income (loss) from continuing operations | $ | 1.64 | $ | 0.81 | $ | 0.80 | $ | 1.89 | $ | 5.13 | |||||||||
Net income (loss) from discontinued operations | (0.07 | ) | (0.03 | ) | 0.03 | (0.01 | ) | (0.06 | ) | ||||||||||
Net income (loss) attributable to Bunge common shareholders | $ | 1.57 | $ | 0.78 | $ | 0.83 | $ | 1.88 | $ | 5.07 | |||||||||
Earnings (loss) per common share—diluted(1) | |||||||||||||||||||
Net income (loss) from continuing operations | $ | 1.60 | $ | 0.81 | $ | 0.79 | $ | 1.83 | $ | 5.07 | |||||||||
Net income (loss) from discontinued operations | (0.06 | ) | (0.03 | ) | 0.04 | (0.01 | ) | (0.06 | ) | ||||||||||
Net income (loss) attributable to Bunge common shareholders | $ | 1.54 | $ | 0.78 | $ | 0.83 | $ | 1.82 | $ | 5.01 | |||||||||
(1) | Earnings per share attributable to Bunge common shareholders for both basic and diluted is computed independently for each period presented. As a result, the sum of the quarterly earnings per share for the years ended December 31, 2017 and 2016 may not equal the total computed for the year. |
F-57
SIGNATURES
Pursuant to the requirements of Section 13 or 15(d) of the Securities Exchange Act of 1934, the Registrant has duly caused this report to be signed on its behalf by the undersigned, thereunto duly authorized.
BUNGE LIMITED | ||||
Dated: | February 23, 2018 | By: | /s/ THOMAS M. BOEHLERT Thomas M. Boehlert Chief Financial Officer | |
________________________________________________________________________________________________________________________
Pursuant to the requirements of the Securities Exchange Act of 1934, this report has been signed below by the following persons on behalf of the Registrant and in the capacities and on the dates indicated.
February 23, 2018 | By: | /s/ SOREN SCHRODER Soren Schroder Chief Executive Officer | |
February 23, 2018 | By: | /s/ THOMAS M. BOEHLERT Thomas Boehlert Chief Financial Officer | |
February 23, 2018 | By: | /s/ J. MATT SIMMONS, JR. J. Matt Simmons, Jr. Controller and Principal Accounting Officer | |
February 23, 2018 | By: | /s/ ERNEST G. BACHRACH Ernest G. Bachrach Director | |
February 23, 2018 | By: | /s/ VINITA BALI Vinita Bali Director | |
February 23, 2018 | By: | /s/ ENRIQUE H. BOILINI Enrique H. Boilini Director | |
February 23, 2018 | By: | /s/ CAROL M. BROWNER Carol M. Browner Director | |
February 23, 2018 | By: | /s/ PAUL CORNET DE WAYS-RUART Paul Cornet De Ways-Ruart Director | |
February 23, 2018 | By: | /s/ ANDREW FERRIER Andrew Ferrier Director | |
February 23, 2018 | By: | /s/ ANDREAS FIBIG Andreas Fibig Director | |
February 23, 2018 | By: | /s/ KATHLEEN W. HYLE Kathleen W. Hyle Director | |
February 23, 2018 | By: | /s/ L. PATRICK LUPO L. Patrick Lupo Director and Chairman of the Board of Directors | |
February 23, 2018 | By: | /s/ JOHN E. MCGLADE John E. McGlade Director | |
S-1