Attached files
| file | filename |
|---|---|
| EX-99.1 - EXHIBIT 99.1 - APPIAN CORP | appn12312017ex991.htm |
| EX-32.2 - EXHIBIT 32.2 - APPIAN CORP | appn12312017ex321.htm |
| EX-31.2 - EXHIBIT 31.2 - APPIAN CORP | appn12312017ex312.htm |
| EX-31.1 - EXHIBIT 31.1 - APPIAN CORP | appn12312017ex311.htm |
| EX-23.1 - EXHIBIT 23.1 - APPIAN CORP | appn12312017ex231.htm |
| EX-10.15 - EXHIBIT 10.15 - APPIAN CORP | appn12312017ex1015.htm |
| EX-10.14 - EXHIBIT 10.14 - APPIAN CORP | appn12312017ex1014.htm |
| EX-10.13 - EXHIBIT 10.13 - APPIAN CORP | appn12312017ex1013.htm |
| EX-10.12 - EXHIBIT 10.12 - APPIAN CORP | appn12312017ex1012.htm |
| EX-10.11 - EXHIBIT 10.11 - APPIAN CORP | appn12312017ex1011.htm |
UNITED STATES
SECURITIES AND EXCHANGE COMMISSION
WASHINGTON, DC 20549
FORM 10-K
(Mark One)
☒ | ANNUAL REPORT PURSUANT TO SECTION 13 OR 15(d) OF THE SECURITIES EXCHANGE ACT OF 1934 |
For the fiscal year ended December 31, 2017
OR
☐ | TRANSITION REPORT PURSUANT TO SECTION 13 OR 15(d) OF THE SECURITIES EXCHANGE ACT OF 1934 |
For the transition period from to
Commission File Number: 001-38098
APPIAN CORPORATION
(Exact Name of Registrant as Specified in its Charter)
Delaware | 54-1956084 | |
(State or other jurisdiction of incorporation or organization) | (I.R.S. Employer Identification No.) | |
11955 Democracy Drive, Suite 1700 Reston, VA | 20190 | |
(Address of principal executive offices) | (Zip Code) | |
Registrant’s telephone number, including area code: (703) 442-8844
Securities registered pursuant to Section 12(b) of the Act:
Title of each class | Name of each exchange on which registered | ||
Class A Common Stock, $0.0001 par value per share | The Nasdaq Stock Market LLC | ||
Securities registered pursuant to Section 12(g) of the Act: None
Indicate by check mark if the registrant is a well-known seasoned issuer, as defined in Rule 405 of the Securities Act. Yes ☐ No ☒
Indicate by checkmark if the registrant is not required to file reports pursuant to Section 13 or Section 15(d) of the Act. Yes ☐ No ☒
Indicate by check mark whether the registrant (1) has filed all reports required to be filed by Section 13 or 15(d) of the Securities Exchange Act of 1934 during the preceding 12 months (or for such shorter period that the registrant was required to file such reports), and (2) has been subject to such filing requirements for the past 90 days. Yes ☒ No ☐
Indicate by check mark whether the registrant has submitted electronically and posted on its corporate Web site, if any, every Interactive Data File required to be submitted and posted pursuant to Rule 405 of Regulation S-T (§ 232.405 of this chapter) during the preceding 12 months (or for such shorter period that the registrant was required to submit and post such files). Yes ☒ No ☐
Indicate by check mark if disclosure of delinquent filers pursuant to Item 405 of Regulation S-K is not contained here, and will not be contained, to the best of the registrant’s knowledge, in definitive proxy or information statements incorporated by reference in Part III of this Form 10-K or any amendment to this Form 10-K. ☒
Indicate by check mark whether the registrant is a large accelerated filer, an accelerated filer, a non-accelerated filer, a smaller reporting company or an emerging growth company. See the definitions of “large accelerated filer,” “accelerated filer,” “smaller reporting company” and “emerging growth company” in Rule 12b-2 of the Exchange Act.
Large accelerated filer | ☐ | Accelerated filer | ☐ | |||
Non-accelerated filer | ☒ (Do not check if a smaller reporting company) | Smaller reporting company | ☐ | |||
Emerging growth company | ☒ | |||||
If an emerging growth company, indicate by check mark if the registrant has elected not to use the extended transition period for complying with any new or revised financial accounting standards provided pursuant to Section 13(a) of the Exchange Act. ☐
Indicate by check mark whether the registrant is a shell company (as defined in Rule 12b-2 of the Exchange Act). Yes ☐ No ☒
As of June 30, 2017, the aggregate market value of the registrant’s voting Class A common stock and Class B common stock held by non-affiliates of the registrant was approximately $130,453,125 and $187,610,252, respectively, based on a closing price of $18.15 per share of the registrant’s Class A common stock as reported on The Nasdaq Global Market on June 30, 2017. For purposes of this computation, all officers, directors and 10% beneficial owners of the registrant are deemed to be affiliates. Such determination should not be deemed to be an admission that such officers, directors or 10% beneficial owners are, in fact, affiliates of the registrant.
As of February 12, 2018, there were 13,178,927 shares of the registrant’s Class A common stock and 47,562,464 shares of the registrant’s Class B common stock, each with a par value of $0.0001 per share, outstanding.
DOCUMENTS INCORPORATED BY REFERENCE
Portions of the registrant's definitive Proxy Statement for its 2018 Annual Meeting of Stockholders to be filed with the Securities and Exchange Commission pursuant to Regulation 14A not later than 120 days after the end of the fiscal year covered by this Annual Report on Form 10-K are incorporated by reference in Part III, Items 10-14 of this Annual Report on Form 10-K.
Table of Contents
Page | ||
PART I. | ||
Item 1. | ||
Item 1A. | ||
Item 1B. | ||
Item 2. | ||
Item 3. | ||
Item 4. | ||
PART II. | ||
Item 5. | ||
Item 6. | ||
Item 7. | ||
Item 7A. | ||
Item 8. | ||
Item 9. | ||
Item 9A. | ||
Item 9B. | ||
PART III. | ||
Item 10. | ||
Item 11. | ||
Item 12. | ||
Item 13. | ||
Item 14. | ||
PART IV. | ||
Item 15. | ||
Item 16. | ||
i
PART I
Forward-Looking Statements
This Annual Report on Form 10-K, including the sections entitled "Business," "Risk Factors," and "Management's Discussion and Analysis of Financial Condition and Results of Operations," contains forward-looking statements that involve known and unknown risks, uncertainties and other factors that may cause our actual results, levels of activity, performance or achievements to be materially different from the information expressed or implied by these forward-looking statements. Statements that are not purely historical are forward-looking statements within the meaning of Section 27A of the Securities Act of 1933, as amended, and Section 21E of the Securities Exchange Act of 1934, as amended. In some cases, you can identify forward-looking statements by the words “anticipate,” “believe,” “continue,” “could,” “estimate,” “expect,” “intend,” “may,” “might,” “objective,” “ongoing,” “plan,” “predict,” “project,” “potential,” “should,” “will,” or “would,” or the negative of these terms, or other comparable terminology intended to identify statements about the future. These forward-looking statements include, but are not limited to, statements concerning the following:
• | our ability to effectively manage or sustain our growth and to achieve profitability; |
• | our market opportunity and the expansion of our core software markets in general; |
• | the effects of increased competition as well as innovations by new and existing competitors in our market; |
• | our ability to adapt to technological change and effectively enhance, innovate and scale our platform and professional services; |
• | our expected use of proceeds; |
• | our ability to attract and retain qualified employees and key personnel and further expand our overall headcount; |
• | our ability to maintain, or strengthen awareness of, our brand; |
• | perceived or actual problems with the integrity, reliability, quality or compatibility of our platform, including unscheduled downtime or outages; |
• | potential acquisitions and integration of complementary businesses and technologies; |
• | future revenue, hiring plans, expenses, capital expenditures, capital requirements and stock performance; |
• | our ability to stay abreast of new or modified laws and regulations that currently apply or become applicable to our business both in the United States and internationally; |
• | our ability to maintain, protect and enhance our intellectual property; |
• | costs associated with defending intellectual property infringement and other claims; and |
• | the future trading prices of our Class A common stock and the impact of securities analysts’ reports on these prices. |
These statements represent the beliefs and assumptions of our management based on information currently available to us. Such forward-looking statements are subject to risks, uncertainties and other important factors that could cause actual results and the timing of certain events to differ materially from future results expressed or implied by such forward-looking statements. Factors that could cause or contribute to such differences include, but are not limited to those discussed in the section titled “Risk Factors” included under Part I, Item 1A. Furthermore, such forward-looking statements speak only as of the date of this report. Except as required by law, we undertake no obligation to update any forward-looking statements to reflect events or circumstances that occur after the date of this report.
1
Item 1. Business.
Overview
Appian provides a leading low-code software development platform as a service that enables organizations to rapidly develop powerful and unique applications. The applications created on our platform help companies drive digital transformation and competitive differentiation.
With our platform, organizations can rapidly and easily design, build and implement powerful, enterprise-grade custom applications through our intuitive, visual interface with little or no coding required. Our customers have used applications built on our low-code platform to launch new business lines, automate vital employee workflows, manage complex trading platforms, accelerate drug development and build global procurement systems. With our platform, decision makers can reimagine their products, services, processes and customer interactions by removing much of the complexity and many of the challenges associated with traditional approaches to software development.
Organizations across industries are digitally transforming—leveraging software to automate and optimize mission critical operations, enhance customer experiences and drive competitive differentiation. Historically, organizations have principally relied on packaged software and custom software solutions to operationalize and automate their businesses. Packaged software often fails to address unusual use cases or to enable differentiation and requires organizations to conform their individual processes, needs and systems of record to standardized frameworks. While traditional custom software solutions can be differentiated and tailored to meet strategic objectives, development requires a long, iterative and cumbersome process, as well as costly integration, and relies on scarce developer talent.
We enable organizations to differentiate themselves from their competition through software-enabled digital transformation. Our low-code platform employs an intuitive, visual interface and pre-built development modules that reduce the time required to build powerful and unique applications. We believe that developing applications on our platform can be as simple as drawing a picture. Our platform automates the creation of forms, data flows, records, reports and other software elements that would otherwise need to be manually coded or configured. This functionality greatly reduces the iterative development process, allowing for real-time application optimization and ultimately shortening the time from idea to deployment. Further, our patented Self-Assembling Interface Layer, or SAIL, technology ensures that applications developed on our platform can be immediately and natively deployed across a full range of mobile and desktop devices with no additional customization, including desktop web browsers, tablets and mobile phones. Updates to applications developed with SAIL disseminate automatically across device types to ensure that all users benefit from the most up-to-date functionality. At the same time, we unify enterprise data in a single searchable environment, providing organizations with a comprehensive view of customer, product, organizational asset and other critical information. Rich reporting dashboards capture detailed performance metrics, providing valuable business intelligence and analytics that enable business process optimization. Moreover, our platform can be deployed in the cloud, on-premises or using a hybrid approach, with organizations able to access the same functionality and data sources in all cases.
Our go-to-market strategy consists of both direct sales and, to a lesser extent, sales through strategic partners. We sell our software almost exclusively through subscriptions and intend to grow our revenue both by adding new customers and increasing the number of users at existing customers that use applications developed on our platform. As of December 31, 2017, we had 356 customers in a wide variety of industries, of which 285 customers were commercial and 71 customers were government or non-commercial entities. Our customers include financial services, healthcare, government, telecommunications, media, energy, manufacturing and transportation organizations. As of December 31, 2017, 29% of our commercial customers were Global 2000 organizations and included 44 Fortune 500 companies. We determined relevant global financial services and healthcare companies by referencing certain independent industry data from S&P Global Market Intelligence. Customers receive all of the modules and functionality of our platform with their initial subscription, which facilitates the seamless creation of new applications. Many of our customers begin by building a single application and grow to build dozens of applications on our platform, which implicitly reduces the per-user cost of each application. Generally, the development of new applications results in the expansion of our user base within an organization and a corresponding increase in revenue to us because we charge subscription fees on a per-user basis for the significant majority of our customer contracts. Every additional application that an organization creates on our platform increases the value of our platform for that organization because it further integrates people, process and data across the organization and facilitates knowledge sharing. At the same time, our industry-leading professional services organization enables our customers to more easily build and deploy applications on our platform to achieve their digital transformation goals.
We believe that we have a significant market opportunity in helping organizations accelerate their digital transformation by leveraging our low-code software development platform. Our current core software markets, which include the markets for low-code development platforms, case management software, business process management and platform-as-a-
2
service, are expected to represent a combined $23.6 billion market opportunity by 2018 and a combined $44.4 billion market opportunity in the near term. In addition to our current core software markets, we believe that our platform better meets certain of the needs that have been historically addressed by manually-developed custom enterprise software, which is expected to represent a $169 billion market in 2018. Further, based on the total number of global companies and government institutions in 2017 in relevant industries and our industry-specific average annual recurring revenue for customers as of December 31, 2017, we internally estimate our market opportunity to have been approximately $31 billion in 2017. See "—Our Opportunity" for additional information.
We have experienced strong revenue growth, with revenue of $176.7 million, $132.9 million and $111.2 million in 2017, 2016 and 2015, respectively. Our subscription revenue was $82.8 million, $60.0 million and $41.5 million in 2017, 2016 and 2015, respectively, representing year-over-year growth rates of 38% from 2016 to 2017 and 45% from 2015 to 2016. Our professional services revenue was $85.2 million, $63.0 million and $58.0 million in 2017, 2016 and 2015, respectively. Over time, as the need for professional services associated with user deployments decreases and the number of end users increases, we expect the mix of total revenue to shift more toward subscription revenue.
We have invested in developing our platform, expanding our sales and marketing and research and development capabilities, and providing general and administrative resources to support our growth. As a result, we incurred net losses of $31.0 million, $12.5 million and $7.0 million in 2017, 2016 and 2015, respectively. We also had operating cash flows of $(9.1) million, $(7.8) million and $(2.1) million in 2017, 2016 and 2015, respectively.
Recent Developments
In November 2017, we completed a secondary offering pursuant to which stockholders sold an aggregate of 4,370,000 shares of Class A common stock at a price of $20.25 per share, including 570,000 shares pursuant to the underwriters' option to purchase additional Class A shares. We did not receive any proceeds from the sale of the shares of our Class A common stock offered in the secondary offering.
Industry and Market Data
Information contained in this Annual Report on Form 10-K concerning our industry and the market in which we operate, including our general expectations and market position, market opportunity and market size is based on information from various sources, including independent industry publications by Forrester Research Inc., or Forrester, Aite Group, LLC, or Aite, International Data Corporation, or IDC, Gartner, Inc., or Gartner, and S&P Global Market Intelligence. In presenting this information, we have also made assumptions based on such data and other similar sources, and on our knowledge of, and in our experience to date in, the markets for our services. This information involves a number of assumptions and limitations, and you are cautioned not to give undue weight to such estimates. Although we have not independently verified the accuracy or completeness of any third-party information, we believe the market position, market opportunity and market size information included in this Annual Report is reliable. The industry in which we operate is subject to a high degree of uncertainty and risk due to a variety of factors, including those described in the “Risk Factors” section. These and other factors could cause results to differ materially from those expressed in the estimates made by the independent parties and by us.
The Forrester studies described herein, one of which was commissioned by us, represent data, research, opinions or viewpoints prepared by Forrester and are not representations of fact. We have been advised by Forrester that its studies speak as of their original date (and not as of the date of this Annual Report on Form 10-K) and any opinions expressed in the studies are subject to change without notice.
The Gartner report described in this Annual Report on Form 10-K represents data, research opinion or viewpoints published, as part of a syndicated subscription service, by Gartner and are not representations of fact. The Gartner report speaks as of its original publication date, and not as of the date of this Annual Report, and the opinions expressed in the Gartner report are subject to change without notice. Gartner does not endorse any vendor, product or service depicted in its research publications, and does not advise technology users to select only those vendors with the highest ratings or other designation. Gartner research publications consist of the opinions of Gartner’s research organization and should not be construed as statements of fact. Gartner disclaims all warranties, expressed or implied, with respect to this research, including any warranties of merchantability or fitness for a particular purpose.
The S&P Global Market Intelligence data described herein represents proprietary data gathered by S&P Global Market Intelligence and is not a representation of fact. The S&P Global Market Intelligence data is as of February 2, 2017 (and not as of the date of this Annual Report on Form 10-K) and is subject to change without notice.
3
Industry Background
Software-enabled digital transformation. Organizations across industries are digitally transforming—leveraging software to automate and optimize mission critical operations, enhance customer experiences and drive competitive differentiation. Software has revolutionized mass transportation, drug development, business-customer interactions and operational management. Software has evolved from being a method for modernization to an opportunity for differentiation. Several key trends are fueling software-enabled digital transformation, including the rise of cloud computing and the Internet of Things and the proliferation of mobile devices. Decision makers are increasingly recognizing the need to capitalize on these trends, as 87% of Global 2000 executives planned digital transformation projects for 2017 and 47% of Global 2000 executives cited digital transformation as their highest corporate priority in 2017, according to a survey conducted by LTM Research, an industry research firm, which was commissioned by us.
Challenges to effective digital transformation. Historically, organizations have principally relied on packaged software and custom software solutions to operationalize and automate their businesses. However, these solutions are challenged in their ability to facilitate effective software-enabled digital transformation. More specifically:
• | Packaged software is inadequate. Packaged software, whether delivered in the cloud or on-premises, is a one-size-fits-all solution that performs industry-agnostic functions, such as customer relationship management or enterprise resource management, or serves specific industry verticals without organization-specific differentiation. Organizations are often unable to use packaged software to address unusual use cases and differentiate themselves and must conform their individual processes, needs and systems of record to standardized frameworks. Moreover, for both cross-industry and industry-specific software, the limited scope of functionality often forces organizations to adopt numerous point solutions that can be difficult to integrate. |
• | Traditional custom software solutions are expensive and difficult to create. In contrast, traditional custom solutions are built to address particular organization-specific use cases. Although this allows organizations to better manage their operations and differentiate their businesses, traditional custom software solutions have historically been hampered by several limitations: |
• | Traditional application development is a long and cumbersome process, requiring complex coding and an iterative feedback cycle. According to one example cited by Forrester, the coding of custom software took an estimated 2.7 years to complete, and therefore the output from a development project may not meet user needs and intentions even on the first day of deployment. In the same report, Forrester found that the use of low-code software development was six to 20 times faster than traditional software development. Further, traditional custom software projects require on-going maintenance and enhancement, without which the resulting software will not keep pace with future needs. |
• | The proliferation in mobile devices and the competition among mobile device manufacturers means that device operating systems are continuously being updated, modified and customized for specific hardware configurations. This continual change means that traditional custom software needs to be updated continuously in order to remain relevant across an organization’s entire technology environment. Updating such custom software so that it can be used across devices adds another layer of complexity to the entire process. |
• | The need for organizations to manage their operations utilizing all of these devices and environments necessitates costly integrations in an attempt to avoid creating information silos. Otherwise, organizations could not effectively share information across applications and processes, which would inhibit collaboration, effective analytics and real-time decision making. |
• | Developer talent is scarce and hiring developers to create custom software is costly. According to an LTM Research survey of Global 2000 executives, which was commissioned by us, 79% of respondents said they were concerned that their digital transformation initiatives would be impacted by challenges in hiring and retaining skilled developers. Software developer costs can be greater than $100,000 per year, depending on location. Given its labor intensive nature, traditional custom software can be very expensive to design, implement and maintain. |
Low-code software development platforms have emerged to address the limitations associated with packaged software and traditional custom software solutions. These low-code solutions seek to enable both professional software developers and business users to rapidly build organization-specific applications. However, many existing low-code platforms are either limited in functionality such that they do not support the development of enterprise-grade applications or continue to require significant manual coding, and therefore are not truly “low-code.”
4
Benefits of Our Platform
We enable organizations to differentiate themselves from their competition through software-enabled digital transformation. With our platform, organizations can rapidly and easily design, build and implement powerful, enterprise-grade custom applications through our intuitive, visual interface, with little or no coding required. Our patented SAIL technology ensures that applications developed on our platform can be immediately and natively deployed across a full range of mobile and desktop devices with no additional customization, including desktop web browsers, tablets and mobile phones. We also enable organizations to easily modify and enhance applications and automatically disseminate these updates across device types to ensure that all users benefit from the most up-to-date functionality.
Key benefits of our platform include:
• | Rapid and simple innovation through our powerful platform. Our low-code platform employs an intuitive, visual interface and pre-built development modules that reduce the time required to build powerful and unique applications. Our platform automates the creation of forms, data flows, records, reports and other software elements that would otherwise need to be manually coded or configured. This functionality greatly reduces the iterative development process, allowing for real-time application optimization and ultimately shortening the time from idea to deployment. In turn, organizations can better leverage scarce and costly developer talent to accomplish more digital transformation objectives. |
• | Powerful applications to solve complex challenges. At the core of our platform is an advanced engine that enables the modeling, modification and management of complex processes and business rules. Our heritage as a business process management, or BPM, company provides us with this differentiated understanding of complex processes, and we have incorporated that expertise into our platform to enable the development of powerful applications. Organizations have used our platform to launch new business lines, build large procurement systems, manage retail store layouts, conduct predictive maintenance on field equipment and manage trading platforms, among a range of other use cases. For example, the Defense Information Systems Agency of the U.S. federal government, or DISA, utilizes our platform to manage its large and complex procurement organization, having processed nearly $3.5 billion worth of contract value on our platform since 2009. |
• | Create once, deploy everywhere. Our patented SAIL technology allows developers to create an application once and deploy it everywhere with the consistency of experience and optimal performance levels that users expect. Applications developed on our platform can be immediately and natively deployed across a full range of mobile and desktop devices with no additional customization, including desktop web browsers, tablets and mobile phones. |
• | Seamless integration with existing systems and data. In contrast to typical enterprise software, our platform does not require that data reside within it in order to enable robust data analysis and cross-department and cross-application insight. Our platform seamlessly integrates with many of the most popular enterprise software applications and data repositories and can be used within many legacy environments. For example, organizations frequently use our platform to extend the life and enhance the functionality of legacy systems of record, such as those used for enterprise resource planning, human capital management and customer relationship management, by building new applications that enhance the functionality of those systems and by leveraging the data within those systems to further optimize and automate operations. |
• | Deployment flexibility to serve customer needs. Our platform can be installed in the cloud, on-premises or using a hybrid approach, with organizations able to access the same functionality and data sources in all cases. Our flexible deployment model also preserves a seamless path to future cloud deployments for organizations initially choosing on-premises or hybrid approaches for their most sensitive workloads. |
• | Industry-leading security. Our platform is designed to meet the highest demands of our federal government and large enterprise customers. Our cloud platform holds some of the highest security certifications from government agencies and industry organizations, including being one of the first low-code software companies to achieve Federal Risk and Authorization Management Program, or FedRAMP, compliance. Our platform also meets the Payment Card Industry Data Security Standard, or PCI DSS, and the United States Health Insurance Portability and Accountability Act standard. |
Our approach to digital transformation goes beyond simply enabling organizations to build custom applications fast. We empower decision makers to reimagine their products, services, processes and customer interactions with software by removing much of the complexity and many of the challenges associated with traditional approaches to software development. Because we make application development easy, organizations can build specific and competitively differentiated functionality into applications to deliver enhanced user experiences and streamlined business operations.
5
Our Growth Strategy
Key elements of our growth strategy include:
• | Expand our customer base. As of December 31, 2017, we had 356 customers in a wide variety of industries, including financial services, healthcare, government, telecommunications, media, energy, manufacturing and transportation. We believe that the market for our software development platform is in its early stages and that we have a significant opportunity to add additional large enterprise and government customers. |
• | Grow through our differentiated land and expand model. Customers receive all of the modules and functionality of our platform with their initial subscription, which facilitates the seamless creation of new applications. Many of our customers begin by building a single application and grow to build dozens of applications on our platform, which implicitly reduces the per-user cost of each application. Generally, the development of new applications results in the expansion of our user base within an organization and a corresponding increase in revenue to us because we usually charge subscription fees on a per-user basis. Every additional application that an organization creates on our platform increases the value of our platform for that organization because it further integrates people, process and data across the organization and facilitates knowledge sharing. Applications built on our platform may be used only on our platform while customers have active subscriptions, creating substantial switching costs for customers to move to a different software platform. We believe that organizations will develop additional applications and add users to our platform as they continue to recognize these benefits. |
• | Grow revenue from key industry verticals. While our platform is industry-agnostic, we have recently made, and plan to continue to make, investments to enhance the expertise of our sales and marketing organization within our key industry verticals of financial services, healthcare and U.S. federal government. In 2017, we generated over 66% of our subscription revenue from customers in these verticals. We believe that focusing on the digital transformation needs of organizations within these industry verticals can help drive adoption of our platform. |
• | Continue to innovate and enhance our platform. We have made, and will continue to make, investments in research and development to strengthen our platform and expand the number of features available to our customers. We typically offer multiple upgrades each year that allow our customers to benefit from ongoing innovation. Most recently, we expanded our offering to include Quick Apps, which enables non-professional developers to develop native web and mobile applications in minutes with no coding. In addition, our platform allows our customers to embed artificial intelligence, or AI, concepts into their business processes and to use our pre-built integrations to leading providers of AI services. Our platform also incorporates best practices in the field of data science into a tool for our customers to automate the training, deployment and management of AI predictive models. We are also collaborating with other companies to include cognitive computing and Robotic Process Automation capabilities on our platform, allowing the delivery of even more powerful and intelligent applications using an agile delivery capability. As we continue to increase the functionality of our platform and further reduce the amount of developer skill that is required to build robust applications on our platform, we believe that we have the potential to expand the use of our platform. |
• | Expand our international footprint. Our platform is designed to be natively multi-lingual to facilitate collaboration and address challenges in multi-national organizations. In 2017, approximately 27% of our total revenue was generated from customers outside of the United States. Today, we operate in 11 countries and believe that we have a significant opportunity to grow our international footprint. We are investing in new geographies, including through investment in direct and indirect sales channels, professional services and customer support and implementation partners. |
• | Grow our partner base. We have several strategic partnerships including with Deloitte, KPMG and PricewaterhouseCoopers. These partners work with organizations that are undergoing digital transformation projects and are therefore able to refer potential customers to us. When these partners recognize an opportunity for our platform, they often introduce us to potential customers. We intend to further grow our base of partners to provide broader customer coverage and solution delivery capabilities. |
Our Opportunity
We believe that we have a significant market opportunity in helping organizations accelerate their digital transformation by leveraging our low-code software development platform.
• | Current core software markets. We believe that our platform addresses several key core software markets, as follows: |
• | Low-code. According to Forrester, the market for low-code development platforms is expected to total $4.4 billion in 2018 and is expected to grow at a 49% compound annual growth rate to $21.2 billion in 2022. We were included as a “Leader” in the Forrester Wave: Low-Code Development Platforms in 2017, which is an evaluation of current offering, strategy and market presence. |
6
• | Case management. Case management applications are designed to support complex processes that require a combination of human workflows and collaboration, electronic workflows, data management and processing of files and cases. According to Aite, the market for case management software was expected to total $1.3 billion in 2017 and is expected to grow at a 9% compound annual growth rate to $1.6 billion in 2019. We were included as a “Leader” based on the strength of our current offering, our strategy and our market presence in the Forrester Wave: Dynamic Case Management in 2016. |
• | BPM. BPM applications are designed to support the optimization of business processes, including process identification, improvement implementation, and monitoring and analysis. According to Gartner, the market for Business Process Management Suites is expected to total $3.0 billion in 2018 and is expected to grow at a 7% compound annual growth rate to $3.7 billion in 2021 worldwide*. We were included as a "Leader" based on our ability to execute and the completeness of our vision in the Gartner Magic Quadrant for Intelligent Business Process Management Suites 2017.** |
• | Application PaaS. Application platform as a service, or application PaaS, is a cloud service that provides the necessary infrastructure to enable the development, deployment and hosting of software applications. We believe that we are well positioned to capture a portion of the application platform-as-a-service, or application PaaS, market, which IDC estimated to reach $14.9 billion in 2018, and which is expected to grow at a 6% compound annual growth rate to $17.9 billion in 2021. |
Taken together, these current core software markets were expected to represent a combined $23.6 billion market opportunity by 2018 and a combined $44.4 billion market opportunity in the near term.
• | Traditional custom enterprise software market. In addition to our current core software markets, we believe that our platform better meets certain of the needs that have been historically addressed by manually-developed custom enterprise software, which is expected to represent a $169 billion market in 2018, according to Forrester. |
• | Our internal estimate. Based on approximately 140,000 global companies and government institutions in 2017 in relevant industries and revenue-based size segments, and our industry- and size-specific average annual recurring revenue for customers as of December 31, 2017, we internally estimate our market opportunity to have been approximately $31 billion in 2017. We determined relevant global companies and government institutions by industry and size by referencing certain independent industry data from S&P Global Market Intelligence. We calculated industry- and size-specific average annual recurring revenue as of December 31, 2017 by adding the aggregate annual recurring revenue from all existing customers within each industry and size segment and dividing the total by the number of our existing customers in each industry and size segment. |
Our Platform
With our platform, organizations can rapidly and easily design, build and implement powerful, enterprise-grade custom applications through our intuitive, visual interface, with little or no coding required. We also enable organizations to easily modify and enhance applications and automatically disseminate these updates across device types to ensure that all users benefit from the most up-to-date functionality. Through the speed and power of our platform, organizations can make their digital transformations happen more effectively and efficiently than could be achieved through building an application with Java or other standard programming languages. We believe that developing applications can be as simple as drawing a picture.
Sources: **Gartner, Magic Quadrant for Intelligent Business Process Management Suites, Rob Dunie et al, 24 October 2017 and *Gartner, Forecast: Enterprise Software Markets, Worldwide, 2014-2014, 4Q17 Update, Hai Hong Swinehart et al, 15 December 2017.
7
At the core of our platform is an advanced engine that enables the modeling, modification and management of complex processes and business rules. Our heritage as a BPM company provides us with this differentiated understanding of complex processes, and we have incorporated that expertise into our platform to enable the development of powerful applications. The following graphic shows our architecture:
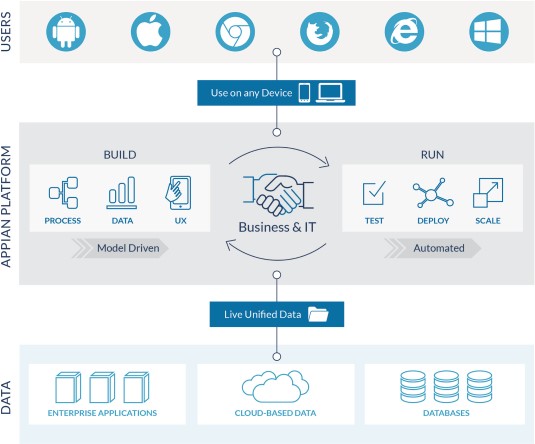
We believe that the key elements of our technology infrastructure are as follows:
Web-Based Development Environment
The Appian design interface is a model-driven, web-based development environment for application creation, testing, deployment and performance optimization. Appian design is a shared repository of all Appian components—interfaces, process models, APIs, new component builders and user collaboration modules—and administration utilities for managing people, processes and data.
The Appian design repository incorporates best practices and years of lessons learned from digital transformation initiatives. Common development operations tasks require just a few clicks and can be automated for hands-off deployment. Dramatic improvements in developer productivity can be achieved through user-friendly capabilities such as fast impact analysis of all changes; auto-updating applications and components when data types change; and live views of interfaces under development.
Appian design guides developers through the necessary steps to create the foundation elements of reusable interfaces, records and business processes, while providing all the power that developers need to design, build and implement enterprise systems at scale. The following graphic shows our process modeler.
8
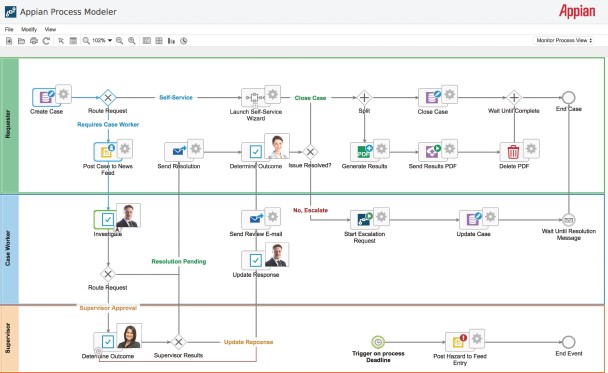
Organizations have used our platform to launch new business lines, build large procurement systems, manage retail store layouts, conduct predictive maintenance on field equipment and manage trading platforms, among a range of other use cases. For example, the Defense Information Systems Agency utilizes our platform to manage its large and complex procurement organization, having processed over 150,000 contract negotiation correspondences and nearly $3.5 billion worth of contract value on our platform since 2009.
Our Patented SAIL Technology
SAIL is our patented technology that allows developers to create dynamic and responsive web and native-mobile user interfaces through a “create once, deploy everywhere” architecture. SAIL interfaces only need to be created once and SAIL automatically assembles customer applications for optimal viewing on each device type, including desktop web browsers, tablets and mobile phones, and each device operating system, including iOS and different permutations of Android. SAIL leverages native functionality inherent across a myriad of devices and operating systems to ensure the consistency of experience and optimal performance levels that users expect. Updates to applications developed with SAIL are automatically disseminated across device types to ensure that all users benefit from the most up-to-date functionality. This approach enables enterprise mobility without the extensive time and resources that other development approaches require. The following graphic shows how our end-user interface appears across different devices.

9
We believe that SAIL provides a significant advantage over other platforms that both require extensive customization for various devices at the time of the creation of the new applications and on an on-going basis as mobile device manufacturers continue to update their software and capabilities. Further, in regulated industries, each traditional custom software application must generally undergo its own security assessment and accreditation process, while applications created with SAIL are designed to be compliant with stringent security and numerous rigorous regulatory requirements.
Unified Data
Appian Records is an advanced data management technology that allows end users to discover and unite enterprise data into a single searchable environment, providing a comprehensive view of an organization’s data. In contrast to typical enterprise software, our platform does not require that data reside within it in order to enable robust data analysis and cross-department and cross-application insight. Using standard database software and service connection frameworks, including APIs, our platform seamlessly integrates with many of the most popular enterprise software applications and data repositories and can be used within many legacy environments. Users simply need to assign a name to a given topic and then decide which existing data sources within the enterprise they want to capture. Users can categorize important information by business topic, not just by where that information resides, thereby allowing organizations to unify their data and their processes and effectively access information buried in existing systems. For example, a Record for “Customer A” might bring together data from customer relationship management, accounting and customer support systems to give users a complete view of the customer in their organization. In addition to the benefits of having an immediate snapshot of all centralized data relating to the customer, product, employee or service request. Records also allows organizations to analyze the end-to-end journeys of any given person, entity or asset. Once the connections are established, users may navigate, analyze, collaborate and take action on data from our intuitive dashboards and interactive reports.
Unified End User Interfaces
Our end user interfaces enable end users to discover data, collaborate with other end users and participate in process actions. The end user experience begins with a news feed that allows end users to monitor key events from processes, systems and other end users, providing a unified view of all applications and activity in one place. End users can collaborate with others, obtain status updates, send direct and secure messages and create social tasks for other end users. Our activity stream is designed to be intuitive for end users familiar with popular consumer social interfaces, allowing them to instantly track important events and occurrences and collaborate with little to no training. We also enforce company security policies, so end users can confidently collaborate without fear of compromising regulatory compliance. Our end user interfaces solve the problem of information silos, allowing organizations to respond to constituent feedback in real time by uniting the right team with the right information.
At the same time, our platform provides transparency, visibility and control across all of our applications through a dynamic and powerfully flexible tasking environment. We provide detailed tracking of all human process tasks on our platform, including when tasks have been assigned, addressed and completed by any user. Business Activity Monitoring reports display real-time enterprise performance, bottleneck detection and process optimization while scaling to millions of tasks.
Deployment Flexibility In the Cloud or On-Premises
Our platform can be deployed in the cloud, on-premises or using a hybrid approach, with organizations able to access the same functionality and data sources in all cases. Our flexible deployment model also enables organizations not yet ready to move their most sensitive workloads to the cloud to deploy our platform in an on-premises or hybrid manner while preserving a path to potential future cloud deployments.
Technology
We designed our platform to support large global enterprises and government organizations at scale, in the cloud, on-premises and through a hybrid or private cloud approach. We designed, deploy and manage our platform with the goal of it being a “joy to use” for both developers and users of applications.
Our customers build powerful and unique applications using our proprietary and patented SAIL technology, which we also use ourselves to develop features of our platform. We also employ cutting-edge React technology for building web and mobile user interfaces. We use third-party proprietary database and database language technology licensed from Kx Systems, Inc., or Kx, to power the high-performance in-memory database of our platform. Under our agreement with Kx, we are permitted to distribute Kx’s software as a component part of our software platform as well as to host Kx’s software on behalf of our customers through our cloud offering. Our agreement requires Kx to provide maintenance directly to us on the software we license as long as it provides maintenance to any other customers. We pay a variable license fee based on the number of applications built by our customers, subject to an overall cap on payment. We have paid Kx the overall license fee cap in each
10
of the last five years. We may maintain the contract as long as we pay maintenance fees. Kx may terminate the agreement if we materially breach the agreement, become insolvent, make an assignment for the benefit of creditors, or if a bankruptcy proceeding is initiated against us. Unless we fail to pay amounts due under the contract or violate certain of Kx’s intellectual property rights, Kx may not terminate the agreement until either it has successfully litigated a breach action or six months, whichever is earlier.
Our cloud offering is hosted by Amazon Web Services and is available in more than 33 availability zones in eight countries. Data in our cloud offering is written simultaneously to multiple availability zones to protect against loss of customer data. Our software also is able to run in the Microsoft Azure cloud as of the third quarter of 2017. Our enablement of the Microsoft Azure cloud is consistent with our principle of platform neutrality.
Our platform can be deployed in the cloud, on-premises or using a hybrid approach, with organizations able to access the same functionality and data sources in all cases. Further, customers choosing to install our platform on-premises or using a hybrid approach can do so in a flexible manner. We have also implemented a wide set of technical, physical and personnel-based security controls designed to protect against the compromise of confidential data that belongs to both our customers and us.
Professional Services
Since inception, we have invested in our professional services organization to help ensure that customers are able to deploy and adopt our platform. More recently, we have expanded our professional services partner network to further support our customers. We believe our investment in professional services, as well as efforts by partners to build their practices around Appian, will drive increased adoption of our platform.
When we first acquire a new customer, our professional services experts or our deployment partners’ professional services experts start the implementation process, which typically takes several weeks. Delivery specialists facilitate deployment of our platform and training personnel provide comprehensive support throughout the implementation process. Customers have access to our Appian Academy, which caters to a diverse range of skill sets and roles within organizations and trains developers on our platform. We also provide instructor-led courses at our Reston, Virginia headquarters and certain of our other offices, as well as virtual classrooms for self-paced learning and on-site training at our customers’ offices.
Once our customers have deployed and implemented our platform, our Appian Architects review our customers’ programs and applications to find potential issues and provide recommendations on best practice. Our professional services team also assists customers by building applications on our platform for them.
Over time, we expect professional services revenue as a percentage of total revenue to decline as we increasingly rely on strategic partners to help our customers deploy our software.
Customer Support
Our customer support personnel are trained engineers and designers who can work with customers on the front lines to address support issues. We provide email and phone support, with teams in the United States, the United Kingdom and Australia. Developers can also find answers to their questions on the Appian Forum, a community site that provides online customer support; real-time collaboration and networking; a growing knowledge base of answers for common questions; and live product webinars and training. The Appian Forum also includes documentation, methodologies and reusable components for our platform. We have consistently been able to achieve at least a 98% customer satisfaction rating for our customer support organization, based on our surveys.
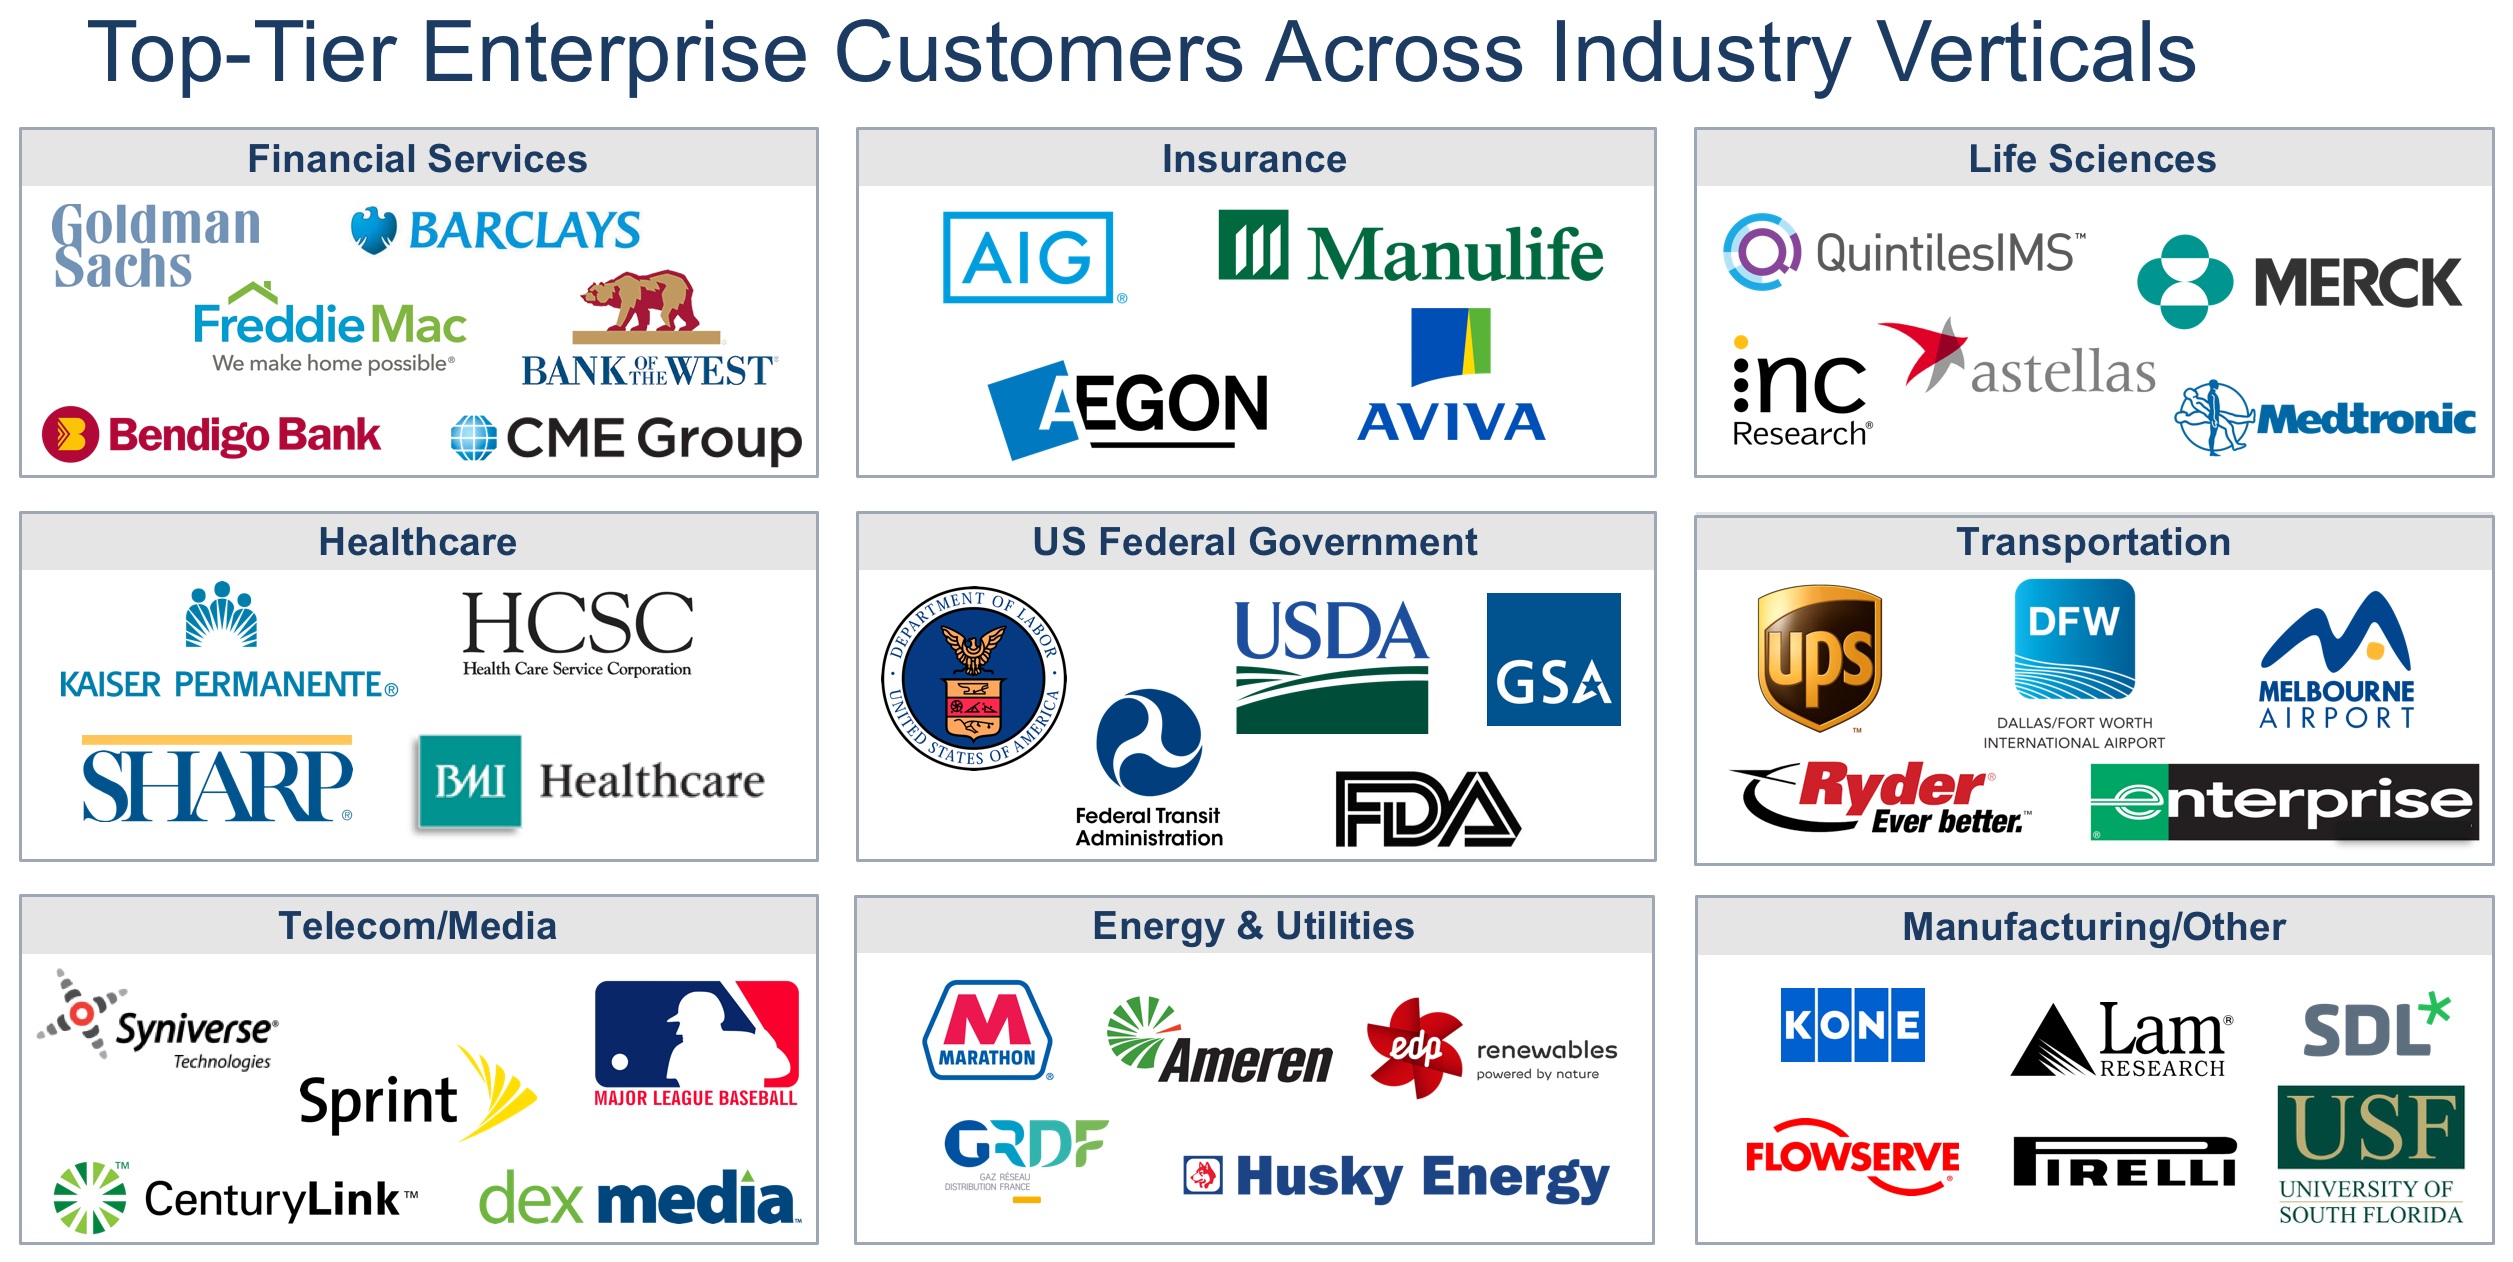
Our Customers
Our customers operate in a variety of industries, including financial services, government, education, technology, media and telecom, consumer, healthcare and industrials. As of December 31, 2017, we had 356 customers in a wide variety of industries, of which 285 customers were commercial and 71 customers were government or non-commercial entities. Our customers include financial services, healthcare, government, telecommunications, media, energy, manufacturing and transportation organizations. Our number of customers paying us in excess of $1 million of annual recurring revenue has grown from 19 at the end of 2016 to 24 at the end of 2017. As of December 31, 2017, 29% of our commercial customers were Global 2000 organizations and included 44 Fortune 500 companies. Generally, our sales force targets its efforts to organizations with over 2,000 employees and $2 billion in annual revenue. No single end-customer accounted for more than 10% of our total revenue in 2017, 2016 or 2015. Some of our representative customers by sector include the following:
11
Culture and Employees
We believe that fostering our distinct culture of innovation is an important contributor to our success as a company. When we started Appian, we used to debate about everything. It was second nature since half the founding team had been competitive debaters in college. Debate proved to be a great way to reach the best decisions. Bad ideas couldn’t survive; good ideas got better. We encourage everyone to speak up, but we also delegate every decision to a single person. So we can disagree, and we still reach firm resolutions.
We strive to hire the most talented individuals, from top universities and from industry, with an eye towards intelligence, passion and personal generosity. We place those individuals within small, agile teams to maximize their autonomy, creativity and collaboration. That may be why we’ve been named a top workplace by The Washington Post for four years running.
We started the business as a bootstrap, in the midst of a venture capital boom. We did it because we believe in self-reliance. Paying for our own expenses has made us stronger. A commitment to financial self-sufficiency is woven into our DNA.
Appian is an open, transparent, and data-rich environment because we run Appian on Appian software. We have approximately 100 applications internal to Appian that run on Appian including everything from cloud operations to pipeline management to free-food alerts. As our own best customer, we get to know our platform deeply, and we can improve it faster.
Our culture was purposefully created by our four founders, who are still heavily involved in operating the business, including recruiting, interviewing and educating all new employees at Appian. Our founders, led by Matt Calkins, our Chief Executive Officer, have intentionally grown our business organically, focusing on developing a single solution—the Appian platform. We do so employing a unified development team located in a single office in the Washington, D.C. metropolitan area to maximize the cohesion and simplicity of our platform and our company. When a client buys Appian software, they get a piece of Appian culture along with it.
As of December 31, 2017, we had 705 full-time employees in the United States and 154 full-time employees internationally. During 2017, we had a voluntary attrition rate of 11% among all employees of our company. We believe that this low voluntary attrition rate is a testament to our company culture. None of our U.S. employees are covered by collective bargaining agreements. We believe our employee relations are good and we have not experienced any work stoppages.
12
Our Competition
Our main competitors fall into three categories: (1) providers of low-code development platforms, such as salesforce.com and ServiceNow; (2) providers of business process management and case management software, such as IBM, OpenText, Oracle, Pegasystems and SAP; and (3) providers of custom software and customer software solutions that address, or are developed to address, some of the use cases that can be addressed by applications developed on our platform.
As our market grows, we expect that it will attract more highly specialized vendors as well as larger vendors that may continue to acquire or bundle their products more effectively. The principal competitive factors in our market include:
• | platform features, reliability, performance and effectiveness; |
• | ease of use and speed; |
• | platform extensibility and ability to integrate with other technology infrastructures; |
• | deployment flexibility; |
• | robustness of professional services and customer support; |
• | price and total cost of ownership; |
• | strength of platform security and adherence to industry standards and certifications; |
• | strength of sales and marketing efforts; and |
• | brand awareness and reputation. |
We believe we generally compete favorably with our competitors with respect to the features and performance of our platform, the ease of integration of our applications and the relatively low total cost of ownership of our applications. However, many of our competitors have substantially greater financial, technical and other resources, greater name recognition, larger sales and marketing budgets, broader distribution, more diversified product lines and larger and more mature intellectual property portfolios.
Backlog
Backlog represents future amounts to be invoiced and recognized under subscription agreements. As of December 31, 2017 and 2016, we had backlog of approximately $214 million and $167 million, respectively. Approximately 58% of our backlog as of December 31, 2017 is not expected to be filled in 2018.
We expect that the amount of backlog relative to the total value of our contracts will change from quarter to quarter and year to year for several reasons, including the specific timing and duration of large customer subscription agreements, the specific timing of customer renewals, changes in customer financial circumstances and foreign currency fluctuations.
We often sign multiple-year subscription agreements, the length in years of which may vary widely. Backlog may vary based on changes in the average non-cancellable term of subscription agreements. The change in backlog that results from changes in the average non-cancellable term of subscription agreements may not be an indicator of the likelihood of renewal or expected future revenue. Accordingly, we believe that fluctuations in backlog are not a reliable indicator of future revenue, and we do not utilize backlog as a key management metric internally.
Seasonality
We have historically experienced seasonality in terms of when we enter into agreements with customers. We typically enter into a significantly higher percentage of agreements with new customers, as well as renewal agreements with existing customers, in the fourth quarter and, to a lesser extent, the second quarter. The increase in customer agreements for the fourth quarter is attributable to large enterprise account buying patterns typical in the software industry. Furthermore, we usually enter into a significant portion of agreements with customers during the last month, and often the last two weeks, of each quarter. However, we recognize substantially all of our revenue ratably over the terms of our subscription agreements, which generally occurs over a one to five-year period. As a result, a substantial portion of the revenue that we report in each period will be derived from the recognition of deferred revenue relating to agreements entered into during previous periods. Consequently, a decline in new sales or renewals in any one period may not be immediately reflected in our revenue results for that period. This
13
decline, however, will negatively affect our revenue in future periods. Accordingly, the effect of significant downturns in sales and market acceptance of our platform and potential changes in our rate of renewals may not be fully reflected in our results of operations until future periods.
Financial Information About Segments and Geographic Areas
We consider our business activities to constitute a single segment. For information regarding our revenue by geographic area and long-lived assets by geographic area, please refer to Note 12 in the notes to our consolidated financial statements included elsewhere in this Annual Report on Form 10-K. For financial information about our segment, please refer to the section entitled “Management's Discussion and Analysis of Financial Condition and Results of Operations” in Item 7 of Part II and to our consolidated financial statements and the related notes thereto included elsewhere in this Annual Report on Form 10-K. For information regarding risks associated with our international operations, please refer to the section entitled “Risk Factors” in Item 1A of Part I in this Annual Report on Form 10-K.
Sales and Marketing
Sales
Our sales organization is responsible for account acquisition and overall market development, which includes the management of the relationships with our customers. While our platform is industry-agnostic, we have recently made, and plan to continue to make, investments to enhance the expertise of our sales organization within our core industry verticals of financial services, healthcare and government. We also expect to continue to grow our sales headcount in all of our principal markets and expand our presence into countries where we currently do not have a direct sales presence.
Marketing
Our marketing efforts focus on building our brand reputation and increasing market awareness of our platform. Marketing activities include sponsorship of, and attendance at, trade shows and conferences; our annual Appian World event; social media and advertising programs; management of our corporate web site and partner portal; press outreach; and customer relations.
Research and Development
Our engineering department is responsible for design, development, testing and release of our platform. Our engineering team closely coordinates with our executive management, which is responsible for creating a vision for our platform, and with our professional services and sales teams, which relay customer demands and possible new use cases or enhancements. Our development efforts focus on the critical areas of our platform, including infrastructure, ease-of-use and flexibility, end-user experience and ability to integrate with other enterprise systems. Research and development expense totaled $34.8 million, $23.0 million and $16.8 million for 2017, 2016 and 2015, respectively.
Intellectual Property
Our success depends in part upon our ability to protect our core technology and intellectual property. We rely on patents, trademarks, copyrights and trade secret laws, confidentiality procedures, and employee disclosure and invention assignment agreements to protect our intellectual property rights.
As of December 31, 2017, we had two issued patents relating to our SAIL technology and two patent applications pending in the United States relating to our platform. Both of our issued patents expire in 2034. We cannot assure you that any of our patent applications will result in the issuance of a patent or that the examination process will not require us to narrow our claims. Any patents that may issue may be contested, circumvented, found unenforceable or invalidated, and we may not be able to prevent third parties from infringing them. We also license software from third parties for integration into our products, including open source software and other software available on commercially reasonable terms.
We control access to and use of our proprietary software and other confidential information through the use of internal and external controls, including contractual protections with employees, contractors, end-customers and partners, and our software is protected by U.S. and international copyright and trade secret laws. Despite our efforts to protect our trade secrets and proprietary rights through intellectual property rights, licenses, and confidentiality agreements, unauthorized parties may still copy or otherwise obtain and use our software and technology. In addition, we intend to expand our international operations, and effective patent, copyright, trademark, and trade secret protection may not be available or may be limited in foreign countries.
14
Facilities
We have offices in four U.S. cities and 11 cities outside the United States. Our headquarters are located in Reston, Virginia. We believe that our current facilities are adequate to meet our ongoing needs, and that, if we require additional space, we will be able to obtain additional facilities on commercially reasonable terms.
Corporate Information
Appian Corporation was incorporated under the laws of the State of Delaware in August 1999.
Our principal executive offices are located at 11955 Democracy Drive, Suite 1700, Reston, Virginia 20190. Our telephone number is (703) 442-8844. We completed our initial public offering in May 2017 and our Class A common stock is listed on The Nasdaq Global Market under the symbol "APPN".
“Appian”, the Appian logo, and other trademarks or service marks of Appian Corporation appearing in this Annual Report on Form 10-K are the property of Appian Corporation. This Annul Report on Form10-K contains additional trade names, trademarks and service marks of others, which are the property of their respective owners. Solely for convenience, trademarks and trade names referred to in this Annual Report on Form 10-K may appear without the ® or ™ symbols.
Available Information
Our website address is www.appian.com. Our Annual Report on Form 10-K, Quarterly Reports on Form 10-Q, Current Reports on Form 8-K and amendments to reports filed pursuant to Sections 13(a) and 15(d) of the Securities Exchange Act of 1934, as amended, or the Exchange Act, are made available free of charge on or through our website at investors.appian.com as soon as reasonably practicable after such reports are filed with, or furnished to, the United States Securities and Exchange Commission, or SEC. The SEC also maintains a website, www.sec.gov, which contains reports and other information regarding issuers that file electronically with the SEC. The public may read and copy any files with the SEC Public Reference Room at 100 F Street, NE, Washington, DC 20549. The public may obtain information on the operation of the Public Reference Room by calling 1-800-SEC-0330. The information contained on, or that can be accessed through, our website is not incorporated by reference into this Annual Report on Form 10-K or in any other report or document we file with the SEC, and any references to our website are intended to be inactive textual references only.
Item 1A. Risk Factors.
Our operations and financial results are subject to various risks and uncertainties including those described below. You should consider carefully the risks and uncertainties described below, in addition to other information contained in this Annual Report on Form 10-K, including our consolidated financial statements and related notes. The risks and uncertainties described below are not the only ones we face. Additional risks and uncertainties that we are unaware of, or that we currently believe are not material, may also become important factors that adversely affect our business. If any of the following risks or others not specified below materialize, our business, financial condition and results of operations could be materially and adversely affected. In that case, the trading price of our Class A common stock could decline.
Risks Related to Our Business and Industry
Our recent growth may not be indicative of our future growth and, if we continue to grow, we may not be able to manage our growth effectively.
We have recently experienced a period of rapid growth in our headcount and operations. In particular, we grew from 173 employees as of December 31, 2011 to 859 employees as of December 31, 2017. We have also significantly increased the size of our customer base over the last several years. We anticipate that we will continue to significantly expand our operations and headcount in the near term. Our growth has placed, and any future growth will place, a significant strain on our management, administrative, operational and financial infrastructure. Our success will depend in part on our ability to manage this growth effectively. To manage the expected growth of our operations and personnel, we will need to continue to improve our operational, financial and management controls and our reporting systems and procedures. Failure to effectively manage our growth could result in difficulty or delays in deploying our platform to customers, declines in quality or customer satisfaction, increases in costs, difficulties in introducing new features or other operational difficulties. Any of these difficulties could adversely impact our business performance and results of operations.
Our rapid growth also makes it difficult to evaluate our future prospects. Our ability to forecast our future operating results is subject to a number of uncertainties, including our ability to plan for and model future growth. If our assumptions
15
regarding these uncertainties, which we use to plan our business, are incorrect or change in reaction to changes in our markets, or if we do not address these risks successfully, our operating and financial results could differ materially from our expectations, our business could suffer and the trading price of our stock may decline.
If we are unable to sustain our revenue growth rate, we may not achieve or maintain profitability in the future.
We have experienced revenue growth with revenue of $176.7 million, $132.9 million and $111.2 million in 2017, 2016 and 2015, respectively. Although we have experienced rapid revenue growth historically, we may not continue to grow as rapidly in the future and our revenue growth rates may decline. Any success that we may experience in the future will depend in large part on our ability to, among other things:
• | maintain and expand our customer base; |
• | increase revenue from existing customers through increased or broader use of our platform within their organizations; |
• | further penetrate the existing industry verticals that we serve and expand into other industry verticals; |
• | improve the performance and capabilities of our platform through research and development; |
• | continue to successfully expand our business domestically and internationally; and |
• | successfully compete with other companies. |
If we are unable to maintain consistent revenue or revenue growth, our stock price could be volatile, and it may be difficult to achieve and maintain profitability. You should not rely on our revenue for any prior quarterly or annual periods as any indication of our future revenue or revenue growth.
We may not be able to scale our business quickly enough to meet our customers’ growing needs, and if we are not able to grow efficiently, our operating results could be harmed.
As usage of our platform grows and as customers use our platform for more advanced and more frequent projects, we may need to devote additional resources to improving our software architecture, integrating with third-party systems, and maintaining infrastructure performance. In addition, we will need to appropriately scale our internal business as well as grow our partner services systems, including our professional services organization and operations, to serve our growing customer base, particularly as our customer base expands over time. Any failure of or delay in these efforts could cause impaired system performance and reduced customer satisfaction. These issues could reduce the attractiveness of our platform to customers, resulting in decreased sales to new customers, lower renewal rates by existing customers, the issuance of service credits, or requested refunds, which could hurt our revenue growth and our reputation. Even if we are able to upgrade our systems and expand our staff, any such expansion will be expensive and complex, requiring management time and attention. We could also face inefficiencies or operational failures as a result of our efforts to scale our infrastructure. Moreover, there are inherent risks associated with upgrading, improving and expanding our information technology systems. We cannot be sure that the expansion and improvements to our infrastructure and systems will be fully or effectively implemented on a timely basis, if at all. These efforts may reduce revenue and our margins and adversely impact our financial results.
We are dependent on a single solution, and the lack of continued market acceptance of our platform could cause our operating results to suffer.
Sales of our Appian software platform account for substantially all of our subscription revenue and are the source of substantially all of our professional services revenue. We expect that we will be substantially dependent on our platform to generate revenue for the foreseeable future. As a result, our operating results could suffer due to:
• | any decline in demand for our platform; |
• | the failure of our platform to achieve continued market acceptance; |
• | the market for low-code solutions not continuing to grow, or growing more slowly than we expect; |
• | the introduction of products and technologies that serve as a replacement or substitute for, or represent an improvement over, our platform; |
• | technological innovations or new standards that our platform does not address; |
• | sensitivity to current or future prices offered by us or competing solutions; and |
• | our inability to release enhanced versions of our platform on a timely basis. |
16
If the market for our platform grows more slowly than anticipated or if demand for our platform does not grow as quickly as anticipated, whether as a result of competition, pricing sensitivities, product obsolescence, technological change, unfavorable economic conditions, uncertain geopolitical environment, budgetary constraints of our customers or other factors, we may not be able to grow our revenue.
If we are unable to further penetrate our existing industry verticals or expand our customer base, our revenue may not grow and our operating results may be harmed. Moreover, if we fail to comply with government contracting regulations, we could suffer a loss of revenue or incur price adjustments or other penalties.
Currently, a significant majority of our revenue is derived from companies in the financial services, pharmaceuticals, insurance and healthcare industries, and from the U.S. federal government. We are investing substantial resources to expand and train our sales force to enable it to better understand these industry verticals and drive sales to customers in these industry verticals, but there can be no assurance that these investments will be successful. Further, an important part of our strategy is to expand our customer base in a wide variety of industries. We have less experience in some industries and our expansion may require us to grow our expertise in certain areas and add sales and support personnel possessing familiarity with the relevant industries. There may be competitors in these verticals that may be entrenched and difficult to dislodge. As a result of these and other factors, our efforts to expand our customer base may be expensive and may not succeed, and we therefore may be unable to grow our revenue. If we fail to further penetrate our existing industry verticals or expand our customer base, we may be unable to grow our revenue and our operating results may be harmed.
In connection with our U.S. federal government contracts, we are also subject to government audits and review and approval of our policies, procedures and internal controls for compliance with contract terms, procurement regulations and applicable laws. In certain circumstances, if we do not comply with the terms of a contract or with regulations or statutes, we could be subject to contract termination or downward contract price adjustments or refund obligations, could be assessed civil or criminal penalties or could be debarred or suspended from obtaining future contracts for a specified period of time. Any such termination, adjustment, sanction, debarment or suspension could have an adverse effect on our business.
Market adoption of low-code solutions to drive digital transformation is new and unproven and may not grow as we expect, which may harm our business and prospects.
We believe our future success will depend in large part on growth in the demand for low-code solutions to drive software-enabled digital transformation. We have customers in a wide variety of industries, including financial services, healthcare, government, telecommunications, media, energy, manufacturing and transportation. It is difficult to predict customer demand for our platform, renewal rates, the rate at which existing customers expand their subscriptions, the size and growth rate of the market for our platform, the entry of competitive products or the success of existing competitive products. The utilization of low-code software to drive digital transformation is still relatively new. Any expansion in our addressable market depends on a number of factors, including businesses continuing to desire to differentiate themselves through software-enabled digital transformation, increasing their reliance on low-code solutions, changes in the competitive landscape, technological changes, budgetary constraints of our customers and changes in economic conditions. If our platform does not achieve widespread adoption or there is a reduction in demand for low-code solutions caused by a lack of customer acceptance, technological challenges, competing technologies and products, decreases in corporate or IT infrastructure spending, weakening economic conditions, or other factors, it could result in reduced customer purchases, reduced renewal rates and decreased revenue, any of which will adversely affect our business, operating results and financial condition.
Our sales cycle is long and unpredictable, particularly with respect to large customers, and our sales efforts require considerable time and expense, all of which may cause our operating results to fluctuate.
Our operating results may fluctuate, in part, because of the resource-intensive nature of our sales efforts, the length and variability of the sales cycle of our platform and the difficulty that we face in adjusting our short-term operating expenses. Our operating results depend in part on sales to large customers and promotion of increasing usage within those large customers. The length of our sales cycle, from initial evaluation to delivery of, and payment for, the software, varies substantially from customer to customer. Our sales cycle can extend to more than a year for certain large customers. It is difficult to predict if or when we will make a sale to a potential customer. Prospective customers, especially larger organizations, often undertake a prolonged evaluation process, which typically involves not only our platform, but also those of our competitors and can last from four to nine months or longer. We may spend substantial time, effort and money on our sales and marketing efforts
17
without any assurance that our efforts will produce any sales. In addition, events affecting our customers’ businesses may occur during the sales cycle that could affect the size or timing of a purchase, contributing to more unpredictability in our business and operating results. As a result of these factors, we may face greater costs, longer sales cycles and less predictability in the future. In the past, certain individual sales have occurred in periods later than we expected or have not occurred at all. The loss or delay of one or more large transactions in a quarter could impact our operating results for that quarter and any future quarters in which such revenue would otherwise have been recognized. As a result of these factors, it is difficult for us to forecast our revenue accurately in any quarter, and our quarterly results may fluctuate substantially. Further, because a substantial portion of our expenses are relatively fixed in the short-term, our operating results will suffer if revenue falls below our expectations in a particular quarter.
We currently face significant competition.
The markets for low-code development platforms, business process management, case management software and custom software are highly competitive, rapidly evolving and have relatively low barriers to entry. The principal competitive factors in our market include: platform features, reliability, performance and effectiveness; ease of use and speed; platform extensibility and ability to integrate with other technology infrastructures; deployment flexibility; robustness of professional services and customer support; price and total cost of ownership; strength of platform security and adherence to industry standards and certifications; strength of sales and marketing efforts; and brand awareness and reputation. If we fail to compete effectively with respect to any of these competitive factors, we may fail to attract new customers or lose or fail to renew existing customers, which would cause our operating results to suffer.
We primarily compete with low-code development platforms sold by companies such as salesforce.com, inc. and ServiceNow, Inc. We also compete with companies that provide business process management and case management software, including IBM, OpenText Corporation, Oracle Corporation, Pegasystems Inc. and SAP SE. Further, because our platform is used by our customers to create custom applications, there are software companies that offer commercial, off-the-shelf applications as well as custom software solutions that compete with us. For example, our platform is used by DISA to manage procurement processes and contract writing. Competing vendors offer software that specifically performs contract writing functionality, and we have on occasion lost competitive bids to those point solution vendors for contracts with DISA. In addition, large software and internet companies may seek to enter our primary markets.
Some of our actual and potential competitors have advantages over us, such as longer operating histories, more established relationships with current or potential customers and commercial partners, significantly greater financial, technical, marketing or other resources, stronger brand recognition, larger intellectual property portfolios and broader global distribution and presence. Such competitors may make their solutions available at a low cost or no cost basis in order to enhance their overall relationships with current or potential customers. Our competitors may also be able to respond more quickly and effectively than we can to new or changing opportunities, technologies, standards or customer requirements. With the introduction of new technologies and new market entrants, we expect competition to intensify in the future. In addition, some of our larger competitors have substantially broader offerings and can bundle competing products with other software offerings. As a result, customers may choose a bundled offering from our competitors, even if individual products have more limited functionality than our platform. These larger competitors are also often in a better position to withstand any significant reduction in capital spending, and will therefore not be as susceptible to economic downturns.
Furthermore, our actual and potential competitors may establish cooperative relationships among themselves or with third parties that may further enhance their resources and offerings in the markets we address. In addition, current or potential competitors may be acquired by third parties with greater available resources. As a result of such relationships and acquisitions, our actual or potential competitors might be able to adapt more quickly to new technologies and customer needs, devote greater resources to the promotion or sale of their products, initiate or withstand substantial price competition, take advantage of other opportunities more readily or develop and expand their offerings more quickly than we do. For all of these reasons, we may not be able to compete successfully against our current or future competitors.
18
If our security measures are breached or unauthorized access to our platform or customer data is otherwise obtained, our platform may be perceived as not being secure, customers may reduce the use of or stop using our platform and we may incur significant liabilities.
Our platform, which can be deployed in the cloud, on-premises or using a hybrid approach, allows for the storage and transmission of our customers’ proprietary or confidential information, which may include trade secrets, personally identifiable information, personal health information and payment card information. Any actual or perceived unauthorized access to, or security breaches affecting, our platform or the information stored on or transmitted by our platform, including through unauthorized and/or malicious activity by one of our employees, could result in the loss of information, litigation, regulatory investigations, penalties, indemnity obligations and other costs, expenses and liability, which could exceed our existing insurance coverage and could result in a substantial financial loss. While we have security measures in place designed to protect customer information and prevent data loss and other security breaches, there can be no assurance that these measures will be effective in protecting against unauthorized access to our platform or our customers’ information. Similarly, if cyber incidents, such as phishing attacks, viruses, denial of service attacks, malware installation, server malfunction, software or hardware failures, loss of data or other computer assets, adware, or other similar issues, impair the integrity or availability of our systems by affecting our data, or reducing access to or shutting down one or more of our computing systems or our IT network, we may be subject to negative treatment by our customers, our business partners, the press, and the public at large. Further, because the techniques used to obtain unauthorized access or sabotage systems change frequently and generally are not identified until they are launched against a target, we may be unable to anticipate these techniques or to implement adequate preventative measures. Additionally, we may be subject to attacks on our networks or systems or attempts to gain unauthorized access to our proprietary or confidential information or other data we or our vendors maintain, such as data about our employees. Such attacks and other breaches of security may occur as a result of malicious attacks, human error, social engineering, or other causes. Any actual or perceived breach of our security measures or failure to adequately protect our customers’ or our confidential or proprietary information could negatively affect our ability to attract new customers, cause existing customers to elect to not renew their subscriptions to our software or result in reputational damage, any of which could adversely affect our operating results.
Further, security compromises experienced by our customers with respect to data hosted on our platform, even if caused by the customer’s own misuse or negligence, may lead to public disclosures, which could harm our reputation, erode customer confidence in the effectiveness of our security measures, negatively impact our ability to attract new customers, or cause existing customers to elect not to renew their subscriptions with us. We may be subjected to indemnity demands, regulatory proceedings, audits, penalties or litigation based on our customers’ misuse of our platform with respect to such sensitive information, and defending against such litigation and otherwise addressing such matters may be expensive, cause distraction, and may result in us incurring liability, all of which may affect our operating results.
While we maintain general liability insurance coverage and coverage for errors or omissions, we cannot assure you that such coverage will be adequate or otherwise protect us from liabilities or damages with respect to claims alleging compromises of personal data or that such coverage will continue to be available on acceptable terms or at all.
We derive a material portion of our revenue from a limited number of customers, and the loss of one or more of these customers could adversely impact our business, results of operations and financial condition.
Our customer base is concentrated. For example, during the years ended December 31, 2017, 2016 and 2015, revenue from U.S. federal government agencies represented 15%, 26% and 33% of our total revenue, respectively, and the top three U.S. federal government customers generated 8%, 18% and 21% of our total revenue for the years ended December 31, 2017, 2016 and 2015, respectively. Further, nearly 10% of our subscription customers spent more than $1 million on our software in 2017. If we were to lose one or more of our significant customers, our revenue may significantly decline. In addition, revenue from significant customers may vary from period to period depending on the timing of renewing existing agreements or entering into new agreements. The loss of one or more of our significant customers could adversely affect our business, results of operations and financial condition.
In addition, due to our dependence on a limited number of customers, we face a concentration of credit risk. As of December 31, 2017, one customer accounted for 7.0% of our accounts receivable. In the case of insolvency by one of our significant customers, accounts receivable with respect to that customer might not be collectible, might not be fully collectible, or might be collectible over longer than normal terms, each of which could adversely affect our financial condition.
19
A portion of our revenue is generated from subscriptions sold to governmental entities and heavily regulated organizations, which are subject to a number of challenges and risks.
A significant portion of our revenue is generated from subscriptions sold to governmental entities, both in the United States and internationally. Additionally, many of our current and prospective customers, such as those in the financial services, pharmaceuticals, insurance and healthcare industries, are highly regulated and may be required to comply with more stringent regulations in connection with subscribing to and implementing our platform. Selling subscriptions to these entities can be highly competitive, expensive and time-consuming, often requiring significant upfront time and expense without any assurance that we will successfully complete a sale. Governmental demand and payment for our platform may also be impacted by public sector budgetary cycles and funding authorizations, with funding reductions or delays adversely affecting public sector demand for our platform.
Further, governmental and highly regulated entities often require contract terms that differ from our standard arrangements, including terms that can lead to those customers obtaining broader rights in our products than would be standard. Governmental and highly regulated entities, including the General Services Administration, whose schedule accounts for many of our U.S. federal government contracts, impose compliance requirements that are complicated, require preferential pricing or “most favored nation” terms and conditions or are otherwise time-consuming and expensive to satisfy. In the United States, applicable federal contracting regulations change frequently, and the President may issue executive orders requiring federal contractors to adhere to new compliance requirements after a contract is signed. If we undertake to meet special standards or requirements and do not meet them, we could be subject to significant liability from our customers or regulators. Even if we do meet these special standards or requirements, the additional costs associated with providing our platform to government and highly regulated customers could harm our operating results. Moreover, changes in the underlying statutory and regulatory conditions that affect these types of customers could harm our ability to efficiently provide them access to our platform and to grow or maintain our customer base. In addition, engaging in sales activities to foreign governments introduces additional compliance risks specific to the Foreign Corrupt Practices Act, the U.K. Bribery Act and other similar statutory requirements prohibiting bribery and corruption in the jurisdictions in which we operate.
We have experienced losses in the past, and we may not achieve or sustain profitability in the future.
We generated net losses of $31.0 million, $12.5 million and $7.0 million in 2017, 2016 and 2015, respectively. As of December 31, 2017, we had an accumulated deficit of $96.2 million. We will need to generate and sustain increased revenue levels in future periods in order to achieve or sustain profitability in the future. We also expect our costs to increase in future periods, which could negatively affect our future operating results if our revenue does not increase commensurately. For example, we intend to continue to expend significant funds to expand our sales and marketing operations, develop and enhance our platform, meet the increased compliance requirements associated with our operation as a public company, and expand into new markets. Our efforts to grow our business may be more costly than we expect, and we may not be able to increase our revenue enough to offset our higher operating expenses. We may incur significant losses in the future for a number of reasons, including the other risks described in this Annual Report on Form 10-K, and unforeseen expenses, difficulties, complications and delays and other unknown events. If we are unable to achieve and sustain profitability, our stock price may significantly decrease.
Our future quarterly results of operations may fluctuate significantly due to a wide range of factors, which makes our future results difficult to predict.
Our revenue and results of operations have historically varied from period to period, and we expect that they will continue to do so as a result of a number of factors, many of which are outside of our control, including:
• | the level of demand for our platform and our professional services; |
• | the rate of renewal of subscriptions with, and extent of sales of additional subscriptions to, existing customers; |
• | large customers failing to renew their subscriptions; |
• | the size, timing and terms of our subscription agreements with existing and new customers, including revenue recognition issues raised by multiple element arrangements; |
• | the timing and growth of our business, in particular through our hiring of new employees and international expansion; |
• | the timing of our adoption of new or revised accounting pronouncements applicable to public companies and the impact on our results of operations; |
20
• | the introduction of new products and product enhancements by existing competitors or new entrants into our market, and changes in pricing for solutions offered by us or our competitors; |
• | network outages, security breaches, technical difficulties or interruptions with our platform; |
• | changes in the growth rate of the markets in which we compete; |
• | the mix of subscriptions to our platform and professional services sold during a period; |
• | customers delaying purchasing decisions in anticipation of new developments or enhancements by us or our competitors or otherwise; |
• | changes in customers’ budgets; |
• | seasonal variations related to sales and marketing and other activities, such as expenses related to our customers; |
• | our ability to increase, retain and incentivize the strategic partners that market and sell our platform; |
• | our ability to control costs, including our operating expenses; |
• | our ability to hire, train and maintain our direct sales force; |
• | unforeseen litigation and intellectual property infringement; |
• | fluctuations in our effective tax rate; and |
• | general economic and political conditions, both domestically and internationally, as well as economic conditions specifically affecting industries in which our customers operate. |
Any one of these or other factors discussed elsewhere in this Annual Report on Form 10-K or the cumulative effect of some of these factors may result in fluctuations in our revenue and operating results, meaning that quarter-to-quarter comparisons of our revenue, results of operations and cash flows may not necessarily be indicative of our future performance and may cause us to miss our guidance and analyst expectations and may cause our stock price to decline.
In addition, we have historically experienced seasonality in terms of when we enter into agreements with customers. We typically enter into a significantly higher percentage of agreements with new customers, as well as renewal agreements with existing customers, in the fourth quarter and, to a lesser extent, the second quarter. The increase in customer agreements for the fourth quarter is attributable to large enterprise account buying patterns typical in the software industry. Furthermore, we usually enter into a significant portion of agreements with customers during the last month, and often the last two weeks, of each quarter. This seasonality is reflected to a much lesser extent, and sometimes is not immediately apparent, in revenue, due to the fact that we recognize subscription revenue over the term of the subscription agreement, which is generally one to five years. We expect that seasonality will continue to affect our operating results in the future and may reduce our ability to predict cash flow and optimize the timing of our operating expenses.
We may not be able to shift our revenue towards subscriptions and away from professional services.
Currently, our revenue is nearly evenly divided between subscriptions and professional services revenue. Our strategic focus has been to grow subscriptions revenue faster than professional services revenue because our marginal costs in delivering our subscriptions are lower than the marginal costs of delivering professional services. A shift in revenue towards subscriptions therefore results in a higher overall gross profit margin. From 2014 through 2016, the proportion of our revenue attributable to subscriptions increased as a proportion of our total revenue, thereby increasing our overall gross profit margin during such period. Although the proportion of our revenue attributable to subscriptions for the year ended December 31, 2017 decreased slightly from such amount for the year ended December 31, 2016, we intend to continue focusing on growing subscriptions revenue faster than professional services revenue in the future.
There can be no guarantee that we will successfully shift our revenue towards subscriptions and away from professional services in the future. Our customers may demand more professional services from us, or demand for our subscriptions may grow slower than demand for our professional services. Should we fail to shift our revenue towards subscriptions our earnings may suffer and our stock price may decline.
We previously identified a material weakness in our internal control over financial reporting, and if we are unable to achieve and maintain effective internal control over financial reporting, this could have a material adverse effect on our business.
We produce our consolidated financial statements in accordance with the requirements of accounting principles generally accepted in the United States, or U.S. GAAP. Effective internal controls are necessary for us to provide reliable
21
financial reports to help mitigate the risk of fraud and to operate as a publicly traded company. Prior to our initial public offering, or IPO, we were a private company with limited accounting personnel and other resources with which to address our internal controls and procedures. Our independent registered public accounting firm identified a material weakness and a significant deficiency in our internal controls over financial reporting in connection with the audit of our financial statements for the year ended December 31, 2015. A “material weakness” is a deficiency, or a combination of deficiencies, in internal control over financial reporting such that there is a reasonable possibility that a material misstatement of our annual or interim financial statements will not be prevented or detected on a timely basis. A “significant deficiency” is a deficiency or a combination of deficiencies in internal control over financial reporting that is less severe than a material weakness, yet important enough to merit attention by those responsible for oversight of our financial reporting.
The material weakness that our independent registered public accounting firm identified related to our revenue recognition related to certain multiple element arrangements in which the controls over the review of transactions that included fixed fee professional services sold with term or perpetual license agreements failed to ensure the resulting revenue recognition was consistent with applicable guidance. This material weakness resulted in the restatement of our 2013 and 2014 financial statements, with approximately $2.4 million in revenue previously recognized in 2013 being deferred until 2014 and beyond and $1.9 million in revenue previously recognized in 2014 being deferred until 2015 and beyond. In addition, the significant deficiency involved lack of oversight to system administrative rights granted to non-IT personnel to our financial reporting systems. We took steps to remediate the material weakness and significant deficiency, including hiring additional accounting staff members that are proficient in revenue recognition accounting, including a manager of revenue recognition and an assistant controller, consulting with outside professional accountants on revenue recognition issues, adding internal controls related to revenue recognition and limiting administrative access rights to our financial reporting systems. In 2017, we further enhanced our controls by hiring a vice president of revenue recognition. We believe that as of December 31, 2017, this previous material weakness and significant deficiency were fully remediated.
As a public company, we will be required to further design, document and test our internal controls over financial reporting to comply with Sarbanes-Oxley Act Section 404. We cannot be certain that additional material weaknesses and control deficiencies will not be discovered in the future. If material weaknesses or control deficiencies occur in the future, we may be unable to report our financial results accurately on a timely basis or help prevent fraud, which could cause our reported financial results to be materially misstated and result in the loss of investor confidence or delisting and cause the market price of our Class A common stock to decline. If we have material weaknesses in the future, it could affect the financial results that we report or create a perception that those financial results do not fairly state our financial position or results of operations. Either of those events could have an adverse effect on the value of our Class A common stock.
Further, even if we conclude that our internal control over financial reporting provides reasonable assurance regarding the reliability of financial reporting and the preparation of financial statements for external purposes in accordance with U.S. GAAP, because of its inherent limitations, internal control over financial reporting may not prevent or detect fraud or misstatements. Failure to implement required new or improved controls, or difficulties encountered in their implementation, could harm our results of operations or cause us to fail to meet our future reporting obligations.
If we do not continue to innovate and provide a platform that is useful to our customers, we may not remain competitive, and our revenue and operating results could suffer.
Our success depends on continued innovation to provide features that make our platform useful for our customers. We must continue to invest significant resources in research and development in order to continually improve the simplicity and power of our platform. We may introduce significant changes to our platform or develop and introduce new and unproven products, including using technologies with which we have little or no prior development or operating experience. If we are unable to continue offering innovative solutions or if new or enhanced solutions fail to engage our customers, we may be unable to attract additional customers or retain our current customers, which may adversely affect our business, operating results and financial condition.
We may need to reduce or change our pricing model to remain competitive.
We generally sell our software on a per-user basis. We expect that we may need to change our pricing model from time to time. As competitors introduce new products that compete with ours or reduce their prices, we may be unable to attract new customers or retain existing customers based on our historical pricing. We also must determine the appropriate price to enable
22
us to compete effectively internationally. Moreover, mid- to large-size enterprises may demand substantial price discounts as part of the negotiation of sales contracts. As a result, we may be required or choose to reduce our prices or change our pricing model, which could adversely affect our business, operating results and financial condition.
If the estimates and assumptions we have used to calculate the size of our target market are inaccurate, our future growth rate may be limited.
We have estimated the size and potential growth of our target market based on data published by third parties and on internally generated data and assumptions. We have not independently verified any third-party information and cannot assure you of its accuracy or completeness. While we believe our market size and growth information is generally reliable, such information is inherently imprecise. In addition, our projections, assumptions and estimates of future opportunities within our target market are necessarily subject to a high degree of uncertainty and risk due to a variety of factors, including those described in this Annual Report on Form 10-K. If third-party or internally generated data prove to be inaccurate or we make errors in our assumptions based on that data, our future growth rate may be limited. In addition, these inaccuracies or errors may cause us to misallocate capital and other business resources, which could harm our business.
Even if our target market meets our size estimates and experiences the forecasted growth, we may not grow our business at similar rates, or at all. Our growth is subject to many factors, including our success in implementing our business strategy, which is subject to many risks and uncertainties. Accordingly, the forecasts of market growth included in this Annual Report on Form 10-K should not be taken as indicative of our future growth.
Our business could be adversely affected if our customers are not satisfied with the deployment services provided by us or our partners.
The success of our business depends on our customers’ satisfaction with our platform, the support that we provide for our platform and the professional services that we provide to help our customers deploy our platform. Professional services may be performed by our own staff, by a third party or by a combination of the two. Our strategy is to work with third parties to increase the breadth, capability and depth of capacity for delivery of these services to our customers, and third parties provide a significant portion of our deployment services. If a customer is not satisfied with the quality of work performed by us or a third party or with the type of applications delivered, we could incur additional costs to address the deficiency, which would diminish the profitability of the customer relationship. Further, a customer’s dissatisfaction with our services could impair our ability to expand the number of licenses to our software purchased by that customer or adversely affect the customer’s renewal of existing licenses. In addition, negative publicity related to our customer relationships, regardless of accuracy, may further damage our business by affecting our ability to compete for new business with actual and prospective customers.
If customers do not expand their use of our platform beyond initial use cases and applications, our ability to grow our business and our operating results may be adversely affected.
Our ability to grow our business depends, in part, on our ability to persuade existing customers to expand their use of our platform to additional use cases and additional applications, and to purchase additional software licenses to our platform. Our goal is for customer satisfaction with initial applications developed on our platform to drive increased sales of licenses to our platform. However, if customers are not satisfied with their initial experience using our platform, they may choose not to renew licenses upon expiration or purchase additional software licenses, which would adversely affect our operating results.
We are substantially dependent upon customer renewals, the addition of new customers and the continued growth of our subscription revenue.
We derive, and expect to increasingly derive in the future, a substantial portion of our revenue from the sale of software subscriptions. For 2017, 2016 and 2015, approximately 52%, 53% and 48%, respectively, of our total revenue was subscriptions, software and support revenue. The market for our platform is still evolving, and competitive dynamics may cause pricing levels to change as the market matures and as existing and new market participants introduce new types of solutions and different approaches to enable customers to address their needs. As a result, we may be forced to reduce the prices we charge for software and may be required to offer terms less favorable to us for new and renewing agreements.
23
In order for us to improve our operating results, it is important that our customers renew their subscriptions with us when their initial term expires, as well as purchase additional subscriptions from us. In general, our customers have no renewal obligation after their initial term expires, and we cannot assure you that we will be able to renew subscriptions with any of our customers at the same or higher contract value.
Further, while we offer access to our platform primarily through multi-year subscription agreements, some agreements may have shorter durations. Additionally, some of our contracts limit the amount we can increase prices from period to period, or include pricing guarantees. If our customers do not renew their agreements, terminate their agreements, renew their agreements on terms less favorable to us or fail to purchase additional software subscriptions, our revenue may decline and our operating results would likely be harmed as a result.
We rely on the performance of highly skilled personnel, including senior management and our engineering, professional services, sales and technology professionals; if we are unable to retain or motivate key personnel or hire, retain and motivate qualified personnel, our business would be harmed.
We believe our success has depended, and continues to depend, on the efforts and talents of our senior management team, particularly Matthew Calkins, our founder and Chief Executive Officer, and our highly skilled team members, including our sales personnel, professional services personnel, cloud engineering and support personnel and software engineers. We do not maintain key man insurance on any of our executive officers or key employees other than Mr. Calkins. From time to time, there may be changes in our senior management team resulting from the termination or departure of our executive officers and key employees. Our senior management and key employees are employed on an at-will basis, which means that they could terminate their employment with us at any time. Many of our executive officers and key employees receive equity compensation as a significant portion of their overall compensation package. A substantial decrease in the market price of our Class A common stock would effectively reduce the compensation of such persons and could increase the risk that they depart the Company. The loss of any of our senior management or key employees, particularly Mr. Calkins, could adversely affect our ability to build on the efforts they have undertaken and to execute our business plan, and we may not be able to find adequate replacements. We cannot ensure that we will be able to retain the services of any members of our senior management or other key employees.
Our ability to successfully pursue our growth strategy also depends on our ability to attract, motivate and retain our personnel. Competition for well-qualified employees in all aspects of our business, including sales personnel, professional services personnel, cloud engineering and support personnel and software engineers, is intense. Our recruiting efforts focus on elite universities and our primary recruiting competition are well-known, high-paying firms. Our continued ability to compete effectively depends on our ability to attract new employees and to retain and motivate existing employees. Further, a small portion of our employees are immigrants to the United States or foreign nationals holding visas. If immigration to the United States is further restricted by the federal government, we might lose existing employees who are unable to remain in the United States and our pool of qualified applicants might also be diminished, thereby hampering our recruiting efforts. If we do not succeed in attracting well-qualified employees or retaining and motivating existing employees, our business would be adversely affected.
Failure to effectively develop and expand our sales and marketing capabilities could harm our ability to increase our customer base and achieve broader market acceptance of our solution.
Our ability to increase our customer base and achieve broader market acceptance of our platform will depend to a significant extent on our ability to expand our sales and marketing operations. We plan to continue expanding our sales force and third-party strategic sales partners, both domestically and internationally; however, there is no assurance that we will be successful in attracting and retaining talented sales personnel or strategic partners or that any new sales personnel or strategic partners will be able to achieve productivity in a reasonable period of time or at all. We also plan to dedicate significant resources to sales and marketing programs, including through electronic marketing campaigns and trade event sponsorship and participation. All of these efforts will require us to invest significant financial and other resources and our business will be harmed if our efforts do not generate a correspondingly significant increase in revenue.
24
If we are not able to maintain and enhance our brand, our business and operating results may be adversely affected.
We believe that developing and maintaining widespread awareness of our brand in a cost-effective manner is critical to achieving widespread acceptance of our platform and attracting new customers. Brand promotion activities may not generate customer awareness or increase revenue and, even if they do, any increase in revenue may not offset the expenses we incur in building our brand. If we fail to successfully promote and maintain our brand, or incur substantial expenses, we may fail to attract or retain customers necessary to realize a sufficient return on our brand-building efforts, or to achieve the widespread brand awareness that is critical for broad customer adoption of our platform.
Because we generally recognize revenue from subscriptions ratably over the term of a license agreement, near term changes in sales may not be reflected immediately in our operating results.
We offer our solution primarily through multi-year subscription agreements and generally recognize revenue ratably over the related license period. As a result, much of the revenue that we report in each quarter is derived from the recognition of previously unbilled contract value relating to agreements entered into during prior periods. In addition, because we invoice the majority of customers for not more than the next fiscal year, including customers with multi-year agreements, we do not record deferred revenue beyond amounts invoiced as a liability on our balance sheet. Accordingly, a decline in new or renewal subscription agreements in any quarter is not likely to be reflected immediately in our revenue results for that quarter. Such declines, however, would negatively affect our revenue and to a lesser extent deferred revenue balance in future periods, and the effect of significant downturns in sales and market acceptance of our platform, and potential changes in our rate of renewals, may not be fully reflected in our results of operations until future periods. Our subscription model also makes it difficult for us to rapidly increase our total revenue and deferred revenue balance through additional sales in any period, as revenue from new customers must be recognized over the applicable subscription term.
We rely upon Amazon Web Services to operate our cloud offering; any disruption of or interference with our use of Amazon Web Services would adversely affect our business, results of operations and financial condition.
We outsource substantially all of the infrastructure relating to our cloud offering to Amazon Web Services, or AWS, which hosts our platform on our customers’ behalf. Customers of our cloud offering need to be able to access our platform at any time, without interruption or degradation of performance, and we provide them with service level commitments with respect to uptime. AWS runs its own platform that we access, and we are, therefore, vulnerable to service interruptions at AWS. We may experience interruptions, delays and outages in service and availability from time to time as a result of problems with our AWS provided infrastructure. For example, in September 2015, AWS suffered a significant outage that had a widespread impact on cloud-based software and services companies. Although our customers were not affected by that outage, a similar outage could render our cloud offering inaccessible to customers. Additionally, AWS has suffered outages at specific customer locations in the past, rendering the customer unable to access our offering for periods of time. Lack of availability of our AWS infrastructure could be due to a number of potential causes including technical failures, natural disasters, fraud or security attacks that we cannot predict or prevent. Such outages could lead to the triggering of our service level agreements and the issuance of credits to our cloud offering customers, which may impact our operating results.
In addition, if the security of the AWS infrastructure is compromised or believed to have been compromised, our business, results of operations and financial condition could be adversely affected. It is possible that our customers and potential customers would hold us accountable for any breach of security affecting the AWS infrastructure and we may incur significant liability from those customers and from third parties with respect to any breach affecting AWS systems. Because our agreement with AWS limits AWS’s liability for damages, we may not be able to recover a material portion of our liabilities to our customers and third parties from AWS. Customers and potential customers may refuse to do business with us because of the perceived or actual failure of our cloud offering as hosted by AWS and our operating results could be harmed.
Our agreement with AWS allows AWS to terminate the agreement by providing two years' prior written notice, and may allow AWS to terminate in case of a breach of contract if such breach is uncured for 30 days, or to terminate upon thirty days' advance written notice if AWS’s further provision of services to us becomes impractical for legal or regulatory reasons. Although we expect that we could receive similar services from other third parties, if any of our arrangements with AWS are terminated, we could experience interruptions on our platform and in our ability to make our platform available to customers, as well as delays and additional expenses in arranging alternative cloud infrastructure services.
25
If our platform fails to perform properly or there are defects or disruptions in the rollout of our platform updates or enhancements, our reputation could be adversely affected, our market share could decline and we could be subject to liability claims.
Our platform is inherently complex and may contain material defects or errors. Any defects in functionality or that cause interruptions in the availability of our platform could result in:
• | loss or delayed market acceptance and sales; |
• | breach of warranty claims; |
• | sales credits or refunds for prepaid amounts related to unused subscription services; |
• | loss of customers; |
• | diversion of development and support resources; and/or |
• | injury to our reputation. |
The costs incurred in correcting any material defects or errors might be substantial and could adversely affect our operating results.
Our customer agreements often provide service level commitments on a monthly basis. If we are unable to meet the stated service level commitments or suffer extended periods of unavailability for our platform, we may be contractually obligated to provide these customers with service credits, refunds for prepaid amounts or we could face contract terminations. Our revenue could be significantly affected if we suffer unscheduled downtime that exceeds the allowed downtimes under our agreements with our customers.
Because of the large amount of data that we collect and manage, it is possible that hardware failures or errors in our systems could result in data loss or corruption, or cause the information that we collect to be incomplete or contain inaccuracies that our customers regard as significant. Furthermore, the availability or performance of our platform could be adversely affected by a number of factors, including customers’ inability to access the internet, the failure of our network or software systems, security breaches or variability in user traffic for our services. For example, our cloud offering customers access our platform through their internet service providers. If a customer's service provider fails to provide sufficient capacity to support our platform or otherwise experiences service outages, such failure could interrupt our customers’ access to our platform, adversely affect their perception of our platform’s reliability and reduce our revenue. In addition to potential liability, if we experience interruptions in the availability of our cloud offering, our reputation could be adversely affected and we could lose customers.
We also provide frequent incremental releases of software updates and functional enhancements to our platform. Despite extensive pre-release testing, such new versions occasionally contain undetected errors when first introduced or released. We have, from time to time, found errors in our software, and new errors in our existing software may be detected in the future. Since our customers use our software for important aspects of their business, any errors, defects, disruptions in our platform or other performance problems with our solution could hurt our reputation and may damage our customers’ businesses. If that occurs, our customers may delay or withhold payment to us, elect not to renew, make service credit claims, warranty claims or other claims against us, and we could lose future sales. The occurrence of any of these events could result in an increase in our bad debt expense, an increase in collection cycles for accounts receivable, decreased future revenue and earnings, require us to increase our warranty provisions or incur the risk or expense of litigation.
If we fail to offer high-quality support, our business and reputation would suffer.
Our customers rely on our personnel for support of our platform. High-quality support is important for the renewal of our agreements with existing customers and to our existing customers purchasing additional software. The importance of high-quality support will increase as we expand our business and pursue new customers. If we do not help our customers quickly resolve issues and provide effective ongoing support, our ability to sell new software to existing and new customers would suffer and our reputation with existing or potential customers would be harmed.
Our strategy of offering and deploying our platform in the cloud, on-premises or using a hybrid approach causes us to incur increased expenses and may pose challenges to our business.
We offer and sell our platform in the cloud, on-premises or using a hybrid approach using the customer’s own infrastructure. Our cloud offering enables our customers to eliminate the burden of provisioning and maintaining infrastructure
26
and to scale their usage of our software platform quickly, while our on-premises offering allows for the customer’s complete control over data security and software infrastructure. Historically, our platform was developed in the context of the on-premises offering, and we have less operating experience offering and selling subscriptions to our platform via our cloud offering. Although a substantial majority of our revenue has historically been generated from customers using our platform on an on-premises basis, our customers are increasingly adopting our cloud offering. We expect that our customers will continue to move to our cloud offering and that it will become more central to our distribution model. To support both on-premises and cloud instances of our platform, our support team must be trained on and learn multiple environments in which our software is deployed, which is more expensive than supporting only a cloud offering. Moreover, we must engineer our software for both an on-premises and cloud offering installation, which may cause us additional research and development expense that may impact our operating results. As more of our customers transition to the cloud, we may be subject to additional competitive pressures, which may harm our business. We are directing a significant portion of our financial and operating resources to implement a robust and secure cloud offering for our platform, but even if we continue to make these investments, we may be unsuccessful in growing or implementing our cloud offering in a way that competes successfully against our current and future competitors and our business, results of operations and financial condition could be harmed.
As a result of our customers’ increased usage of our cloud offering, we will need to continually improve our computer network and infrastructure to avoid service interruptions or slower system performance.
As usage of our cloud offering grows and as customers use it for more complicated applications and with increased data requirements, we will need to devote additional resources to improving our platform architecture and our infrastructure in order to maintain the performance of our cloud offering. Any failure or delays in our computer systems could cause service interruptions or slower system performance. If sustained or repeated, these performance issues could reduce the attractiveness of our platform to customers. These performance issues could result in lost customer opportunities and lower renewal rates, any of which could hurt our revenue growth, customer loyalty and reputation.
If we cannot maintain our corporate culture as we grow, we could lose the innovation, teamwork, passion and focus on execution that we believe contribute to our success, and our business may be harmed.
We believe that a critical component to our success has been our corporate culture. We have invested substantial time and resources in building our team and maintaining that corporate culture through the growth of our company. As we grow and develop the infrastructure of a public company, we may find it difficult to maintain important aspects of our corporate culture. Any failure to preserve our culture could negatively affect our future success, including our ability to retain and recruit personnel and to effectively focus on and pursue our corporate objectives.
Because our long-term growth strategy involves further expansion of our sales to customers outside the United States, our business will be susceptible to risks associated with international operations.
A component of our growth strategy involves the further expansion of our operations and customer base internationally. In 2017, 2016 and 2015, revenue generated from customers outside the United States was 27%, 20% and 20%, respectively, of our total revenue. We currently have international offices in the United Kingdom, continental Europe and Australia, which focus primarily on selling and implementing our platform in those regions. In the future, we may expand to other international locations. Our current international operations and future initiatives will involve a variety of risks, including:
• | changes in a specific country’s or region’s political or economic conditions; |
• | unexpected changes in regulatory requirements, taxes or trade laws; |
• | more stringent regulations relating to data security and the unauthorized use of, or access to, commercial and personal information, particularly in the European Union; |
• | differing labor regulations, especially in the European Union, where labor laws are generally more advantageous to employees as compared to the United States, including deemed hourly wage and overtime regulations in these locations; |
• | challenges inherent in efficiently managing an increased number of employees over large geographic distances, including the need to implement appropriate systems, policies, benefits and compliance programs; |
• | difficulties in managing a business in new markets with diverse cultures, languages, customs, legal systems, alternative dispute systems and regulatory systems; |
• | increased travel, real estate, infrastructure and legal compliance costs associated with international operations; |
27
• | currency exchange rate fluctuations and the resulting effect on our revenue and expenses, and the cost and risk of entering into hedging transactions if we choose to do so in the future; |
• | limitations on our ability to reinvest earnings from operations in one country to fund the capital needs of our operations in other countries; |
• | laws and business practices favoring local competitors or general preferences for local vendors; |
• | limited or insufficient intellectual property protection; |
• | political instability or terrorist activities; |
• | exposure to liabilities under anti-corruption and anti-money laundering laws, including the U.S. Foreign Corrupt Practices Act and similar laws and regulations in other jurisdictions; and |
• | adverse tax burdens and foreign exchange controls that could make it difficult to repatriate earnings and cash. |
Our limited experience in operating our business internationally increases the risk that any potential future expansion efforts that we may undertake will not be successful. If we invest substantial time and resources to expand our international operations and are unable to do so successfully and in a timely manner, our business and operating results will suffer.
Our growth depends in part on the success of our strategic relationships with third parties.
In order to grow our business, we anticipate that we will continue to depend on relationships with strategic partners to provide broader customer coverage and solution delivery capabilities. Identifying partners, and negotiating and documenting relationships with them, requires significant time and resources. Our agreements with our strategic partners are non-exclusive and do not prohibit them from working with our competitors or offering competing solutions. Our competitors may be effective in providing incentives to third parties to favor their products or services or to prevent or reduce subscriptions to our services. If our partners choose to place greater emphasis on products of their own or those offered by our competitors or do not effectively market and sell our platform, our ability to grow our business and sell software and professional services may be adversely affected. In addition, acquisitions of our partners by our competitors could result in a decrease in the number of our current and potential customers, as our partners may no longer facilitate the adoption of our platform by potential customers.
If we are unsuccessful in establishing or maintaining our relationships with third parties, our ability to compete in the marketplace or to grow our revenue could be impaired and our operating results may suffer. Even if we are successful, we cannot assure you that these relationships will result in increased customer usage of our platform or increased revenue.
If currency exchange rates fluctuate substantially in the future, our financial results, which are reported in U.S. dollars, could be adversely affected.
Generally, contracts executed by our foreign operations are denominated in the currency of that country or region and a portion of our revenue is therefore subject to foreign currency risks. As we continue to expand our international operations, we become more exposed to the effects of fluctuations in currency exchange rates. A strengthening of the U.S. dollar could increase the real cost of our platform to our customers outside of the United States, adversely affecting our business operations and financial results. We incur expenses for employee compensation and other operating expenses at our non-U.S. locations in the local currency, and fluctuations in the exchange rates between the U.S. dollar and other currencies could result in the dollar equivalent of such expenses being higher. This could have a negative impact on our reported operating results. To date, we have not engaged in any hedging strategies, and any such strategies, such as forward contracts, options and foreign exchange swaps related to transaction exposures that we may implement to mitigate this risk may not eliminate our exposure to foreign exchange fluctuations.
We may require additional capital to support business growth, and this capital might not be available on acceptable terms, if at all.
We intend to continue to make investments to support our business growth and may require additional funds to respond to business challenges, including the need to develop new features or enhance our platform, improve our operating infrastructure or acquire complementary businesses and technologies. Accordingly, we may need to engage in equity or debt financings to secure additional funds. If we raise additional funds through future issuances of equity or convertible debt securities, our existing stockholders could suffer significant dilution, and any new equity securities we issue could have rights, preferences and privileges superior to those of holders of our Class A common stock. Our loan and security agreement with Silicon Valley Bank for our current line of credit includes restrictive covenants relating to our capital raising activities and other
28
financial and operational matters, which may make it more difficult for us to obtain additional capital and to pursue business opportunities, including potential acquisitions, and any debt financing that we secure in the future could include similar restrictive covenants. We may not be able to obtain additional financing on terms favorable to us, if at all. If we are unable to obtain adequate financing or financing on terms satisfactory to us when we require it, our ability to continue to support our business growth and to respond to business challenges could be significantly impaired, and our business may be adversely affected.
We employ third-party licensed software for use in or with our software, and the inability to maintain these licenses or errors in the software we license could result in increased costs, or reduced service levels, which would adversely affect our business.
Our software incorporates certain third-party software obtained under licenses from other companies, including database software from Kx Systems, Inc. We anticipate that we will continue to rely on such third-party software and development tools from third parties in the future. Although we believe that there are commercially reasonable alternatives to the third-party software we currently license, including open source software, this may not always be the case, or it may be difficult or costly to migrate to other third-party software. Our use of additional or alternative third-party software would require us to enter into license agreements with third parties. In addition, integration of the third-party software used in our software with new third-party software may require significant work and require substantial investment of our time and resources. Also, any undetected errors or defects in third-party software could prevent the deployment or impair the functionality of our software, delay new updates or enhancements to our platform, result in a failure of our platform and injure our reputation.
If we do not or cannot maintain the compatibility of our platform with third-party applications that our customers use in their businesses, our revenue will decline.
The functionality and attractiveness of our platform depends, in part, on our ability to integrate our platform with third-party applications and platforms, including customer relationship management, human resources information, accounting and enterprise resource planning systems that our customers use and from which they obtain data. Third-party providers of applications and application program interfaces, or APIs, may change the features of their applications and platforms, restrict our access to their applications and platforms or alter the terms governing use of their applications and APIs and access to those applications and platforms in an adverse manner. Such changes could functionally limit or terminate our ability to use these third-party applications and platforms in conjunction with our platform, which could negatively impact our offerings and harm our business. If we fail to integrate our software with new third-party applications and platforms that our customers use, we may not be able to offer the functionality that our customers need, which would negatively impact our ability to generate revenue and adversely impact our business.
Portions of our platform utilize open source software, and any failure to comply with the terms of one or more of these open source licenses could negatively affect our business.
Our software contains software licensed to us by third parties under so-called “open source” licenses, including the GNU Lesser General Public License, the BSD License, the Apache License and others. From time to time, there have been claims against companies that distribute or use open source software in their products and services, asserting that such open source software infringes the claimants’ intellectual property rights. We could be subject to suits by parties claiming that what we believe to be licensed open source software infringes their intellectual property rights. Use and distribution of open source software may entail greater risks than use of third-party commercial software, as open source licensors generally do not provide warranties or other contractual protections regarding infringement claims or the quality of the code. In addition, certain open source licenses require that source code for software programs that are subject to the license be made available to the public and that any modifications or derivative works to such open source software continue to be licensed under the same terms.
Although we monitor our use of open source software in an effort both to comply with the terms of the applicable open source licenses and to avoid subjecting our software to conditions we do not intend, the terms of many open source licenses have not been interpreted by U.S. courts, and there is a risk that these licenses could be construed in a way that could impose unanticipated conditions or restrictions on our ability to commercialize our platform. By the terms of certain open source licenses, we could be required to release the source code of our software and to make our software available under open source licenses, if we combine or distribute our software with open source software in a certain manner. In the event that portions of
29
our software are determined to be subject to an open source license, we could be required to publicly release the affected portions of our source code, re-engineer all, or a portion of, that software or otherwise be limited in the licensing of our software, each of which could reduce or eliminate the value of our platform. Many of the risks associated with usage of open source software cannot be eliminated, and could negatively affect our business, results of operations and financial condition.
Catastrophic events may disrupt our business.
Our corporate headquarters are located in Reston, Virginia. The area around Washington, D.C. could be subjected to terrorist attacks. Additionally, we rely on our network and third-party infrastructure and enterprise applications, internal technology systems and our website for our development, marketing, operational support, hosted services and sales activities. In the event of a major hurricane, earthquake or catastrophic event such as fire, power loss, telecommunications failure, cyberattack, war or terrorist attack, we may be unable to continue our operations and may endure system interruptions, reputational harm, delays in our software development, lengthy interruptions in our services, breaches of data security and loss of critical data, all of which could have an adverse effect on our future operating results.
Our reported financial results may be adversely affected by changes in accounting principles generally accepted in the United States.
U.S. GAAP is subject to interpretation by the Financial Accounting Standards Board, or FASB, the SEC, and various bodies formed to promulgate and interpret appropriate accounting principles. A change in these principles or interpretations could have a significant effect on our reported financial results and could affect the reporting of transactions completed before the announcement of a change.
In particular, in May 2014, the FASB issued ASU No. 2014-09, Revenue from Contracts with Customers (Topic 606), which supersedes the revenue recognition requirements in ASC 605, Revenue Recognition. The core principle of ASU 2014-09 is that an entity should recognize revenue to depict the transfer of promised goods or services to customers in an amount that reflects the consideration to which the entity expects to be entitled in exchange for those goods or services. As an “emerging growth company,” the Jumpstart Our Business Startups Act, or the JOBS Act, allows us to delay adoption of new or revised accounting pronouncements applicable to public companies until such pronouncements are made applicable to private companies. We have elected to use this extended transition period under the JOBS Act with respect to ASU 2014-09, which will result in ASU 2014-09 becoming applicable to us on January 1, 2019.
We are evaluating ASU 2014-09 and have not determined the impact it may have on our financial reporting. If, for example, we were required to recognize revenue differently with respect to our term license subscriptions and our cloud-based licenses, the differential revenue recognition may cause variability in our reported operating results due to periodic or long-term changes in the mix between term license subscriptions and cloud subscriptions to our platform.
If our estimates or judgments relating to our critical accounting policies prove to be incorrect, our results of operations could be adversely affected.
The preparation of financial statements in conformity with U.S. GAAP requires management to make estimates and assumptions that affect the amounts reported in the consolidated financial statements and accompanying notes. We base our estimates on historical experience and on various other assumptions that we believe to be reasonable under the circumstances, as provided in Part II, Item 7, “Management’s Discussion and Analysis of Financial Condition and Results of Operations” of this Annual Report on Form 10-K. The results of these estimates form the basis for making judgments about the carrying values of assets, liabilities and equity, and the amount of revenue and expenses that are not readily apparent from other sources. Significant assumptions and estimates used in preparing our consolidated financial statements include those related to revenue recognition, income taxes and the related valuation allowance, stock-based compensation and fair value measurements for our previously outstanding preferred stock warrant. Our results of operations may be adversely affected if our assumptions change or if actual circumstances differ from those in our assumptions, which could cause our results of operations to fall below the expectations of securities analysts and investors, resulting in a decline in the trading price of our Class A common stock.
30
Adverse economic conditions may negatively impact our business.
Our business depends on the overall demand for enterprise software and on the economic health of our current and prospective customers. The financial recession that began in 2008 resulted in a significant weakening of the economy in the United States and Europe and of the global economy, more limited availability of credit, a reduction in business confidence and activity, and other difficulties that may affect one or more of the industries to which we sell our platform. In addition, the economies of countries in Europe have been experiencing weakness associated with high sovereign debt levels, weakness in the banking sector and uncertainty over the future of the Euro zone. We have operations in the United Kingdom and in Europe and current and potential new customers in Europe. If economic conditions in Europe and other key markets for our platform continue to remain uncertain or deteriorate further, many customers may delay or reduce their information technology spending. This could result in reductions in sales of our platform, a decrease in our renewal rate, longer sales cycles, reductions in subscription duration and value, slower adoption of new technologies and increased price competition. Any of these events would likely have an adverse effect on our business, operating results and financial position.
Our services revenue is highly dependent on selling software to new and existing customers.
We derive a majority of our services revenue from professional services that relate to the development and delivery of new applications using our platform, after a customer has made an initial or additional software purchase. Accordingly, our failure to sell software may have a collateral adverse impact on our services revenue and our overall operational results.
Future acquisitions could disrupt our business and adversely affect our business operations and financial results.
Although we have not done so in the past, we may choose to expand by acquiring businesses or technologies. Our ability as an organization to successfully acquire and integrate technologies or businesses is unproven. Acquisitions involve many risks, including the following:
• | an acquisition may negatively affect our financial results because it may require us to incur charges or assume substantial debt or other liabilities, may cause adverse tax consequences or unfavorable accounting treatment, may expose us to claims and disputes by third parties, including intellectual property claims and disputes, or may not generate sufficient financial return to offset additional costs and expenses related to the acquisition; |
• | we may encounter difficulties or unforeseen expenditures in integrating the business, technologies, products, personnel or operations of any company that we acquire, particularly if key personnel of the acquired company decide not to work for us; |
• | an acquisition may disrupt our ongoing business, divert resources, increase our expenses and distract our management; |
• | an acquisition may result in a delay or reduction of customer purchases for both us and the company acquired due to customer uncertainty about continuity and effectiveness of service from either company; |
• | we may encounter difficulties in successfully selling, or may be unable to successfully sell, any acquired solutions; |
• | an acquisition may involve the entry into geographic or business markets in which we have little or no prior experience or where competitors have stronger market positions; |
• | our use of cash to pay for an acquisition would limit other potential uses for our cash; and |
• | if we incur debt to fund such acquisition, such debt may subject us to material restrictions on our ability to conduct our business as well as financial maintenance covenants. |
The occurrence of any of these risks could have a material adverse effect on our business operations and financial results. In addition, we may only be able to conduct limited due diligence on an acquired company’s operations. Following an acquisition, we may be subject to unforeseen liabilities arising from an acquired company’s past or present operations and these liabilities may be greater than the warranty and indemnity limitations that we negotiate. Any unforeseen liability that is greater than these warranty and indemnity limitations could have a negative impact on our financial condition.
Risks Related to Government Regulation, Data Collection, Intellectual Property and Litigation
Failure to comply with governmental laws and regulations could harm our business.
Our business is subject to regulation by various federal, state, local and foreign governments. In certain jurisdictions, these regulatory requirements may be more stringent than those in the United States. Noncompliance with applicable
31
regulations or requirements could subject us to investigations, sanctions, mandatory product recalls, enforcement actions, disgorgement of profits, fines, damages, civil and criminal penalties, injunctions or other collateral consequences. If any governmental sanctions are imposed, or if we do not prevail in any possible civil or criminal litigation, our business, results of operations, and financial condition could be materially adversely affected. In addition, responding to any action will likely result in a significant diversion of management’s attention and resources and an increase in professional fees. Enforcement actions and sanctions could harm our business, reputation, results of operations and financial condition.
Because our software could be used to collect and store personal information, domestic and international privacy concerns could result in additional costs and liabilities to us or inhibit sales of our software.
Personal privacy has become a significant issue in the United States and in many other countries where we offer our software for sale. The regulatory framework for privacy issues worldwide is rapidly evolving and is likely to remain uncertain for the foreseeable future. Many federal, state and foreign government bodies and agencies have adopted or are considering adopting laws and regulations regarding the collection, use, storage and disclosure of personal information and breach notification procedures. Interpretation of these laws, rules and regulations and their application to our software and professional services in the United States and foreign jurisdictions is ongoing and cannot be fully determined at this time.
In the United States, these include rules and regulations promulgated under the authority of the Federal Trade Commission, the Electronic Communications Privacy Act, Computer Fraud and Abuse Act, the Health Insurance Portability and Accountability Act of 1996, the Gramm Leach Bliley Act and state laws relating to privacy and data security. Internationally, the European Union has adopted a General Data Protection Regulation that will take effect in May 2018 and virtually every jurisdiction in which we operate has established its own data security and privacy legal framework with which we or our customers must comply. Since we are agnostic as to the data uploaded into our cloud offering by our cloud offering customers or processed by our platform in on-premises deployments, we may be hosting or otherwise processing substantial amounts of individually identifiable health information and other types of personally identifiable information.
In addition to government regulation, privacy advocates and industry groups may propose new and different self-regulatory standards that may apply to us. Because the interpretation and application of privacy and data protection laws are still uncertain, it is possible that these laws and other actual or alleged legal obligations, such as contractual or self-regulatory obligations, may be interpreted and applied in a manner that is inconsistent with our existing data management practices or the features of our platform. If so, in addition to the possibility of fines, lawsuits and other claims, we could be required to fundamentally change our business activities and practices or modify our software, which could have an adverse effect on our business. Any inability to adequately address privacy concerns, even if unfounded, or comply with applicable privacy or data protection laws, regulations and policies, could result in additional cost and liability to us, damage our reputation, inhibit sales and adversely affect our business.
Furthermore, the costs of compliance with, and other burdens imposed by, the laws, regulations, and policies that are applicable to the businesses of our customers may limit the use and adoption of, and reduce the overall demand for, our platform. Privacy concerns, whether valid or not valid, may inhibit market adoption of our platform particularly in certain industries and foreign countries.
Any failure to protect our proprietary technology and intellectual property rights could substantially harm our business and operating results.
Our success and ability to compete depend in part on our ability to protect our proprietary technology and intellectual property. To safeguard these rights, we rely on a combination of patent, trademark, copyright and trade secret laws and contractual protections in the United States and other jurisdictions, all of which provide only limited protection and may not now or in the future provide us with a competitive advantage.
As of December 31, 2017, we had two issued patents relating to our SAIL technology and two patent applications pending in the United States relating to our platform. We cannot assure you that any patents will issue from any patent applications, that patents that issue from such applications will give us the protection that we seek or that any such patents will not be challenged, invalidated or circumvented. Any patents that may issue in the future from our pending or future patent applications may not provide sufficiently broad protection and may not be enforceable in actions against alleged infringers. Obtaining and enforcing software patents in the United States is becoming increasingly challenging. Any patents we have
32
obtained or may obtain in the future may be found to be invalid or unenforceable in light of recent and future changes in the law. We have registered the “Appian” name and logo in the United States and certain other countries. We have registrations and/or pending applications for additional marks in the United States; however, we cannot assure you that any future trademark registrations will be issued for pending or future applications or that any registered trademarks will be enforceable or provide adequate protection of our proprietary rights. We also license software from third parties for integration into our software, including open source software and other software available on commercially reasonable terms. We cannot assure you that such third parties will maintain such software or continue to make it available.
In order to protect our unpatented proprietary technologies and processes, we rely on trade secret laws and confidentiality and invention assignment agreements with our employees, consultants, strategic partners, vendors and others. Some of our customer contracts also require us to place our proprietary source code in escrow for the benefit of our customer in the event we go bankrupt, become insolvent or are unable to fulfill our support obligations under our customer contracts. Also, despite our efforts to protect our proprietary technology and trade secrets, unauthorized parties may attempt to misappropriate, copy, reverse engineer or otherwise obtain and use them. In addition, others may independently discover our trade secrets, in which case we would not be able to assert trade secret rights, or develop similar technologies and processes. Further, the contractual provisions that we enter into may not prevent unauthorized use or disclosure of our proprietary technology or intellectual property rights and may not provide an adequate remedy in the event of unauthorized use or disclosure of our proprietary technology or intellectual property rights. Moreover, policing unauthorized use of our technologies, trade secrets and intellectual property is difficult, expensive and time-consuming, particularly in foreign countries where the laws may not be as protective of intellectual property rights as those in the United States and where mechanisms for enforcement of intellectual property rights may be weak. To the extent that we expand our activities outside of the United States, our exposure to unauthorized copying and use of our platform and proprietary information may increase. We may be unable to determine the extent of any unauthorized use or infringement of our platform, technologies or intellectual property rights.
There can be no assurance that the steps that we take will be adequate to protect our proprietary technology and intellectual property, that others will not develop or patent similar or superior technologies, products or services, or that our trademarks, patents, and other intellectual property will not be challenged, invalidated or circumvented by others. Furthermore, effective trademark, patent, copyright, and trade secret protection may not be available in every country in which our software is available or where we have employees or independent contractors. In addition, the legal standards relating to the validity, enforceability, and scope of protection of intellectual property rights in internet and software-related industries are uncertain and still evolving.
In order to protect our intellectual property rights, we may be required to spend significant resources to monitor and protect these rights. Litigation brought to protect and enforce our intellectual property rights could be costly, time-consuming and distracting to management and could result in the impairment or loss of portions of our intellectual property. Furthermore, our efforts to enforce our intellectual property rights may be met with defenses, counterclaims and countersuits attacking the validity and enforceability of our intellectual property rights. Our failure to secure, protect and enforce our intellectual property rights could seriously adversely affect our brand and adversely impact our business.
We may be subject to intellectual property rights claims by third parties, which are extremely costly to defend, could require us to pay significant damages and could limit our ability to use certain technologies.
Companies in the software and technology industries, including some of our current and potential competitors, own significant numbers of patents, copyrights, trademarks and trade secrets and frequently enter into litigation based on allegations of infringement or other violations of intellectual property rights. In addition, many of these companies have the capability to dedicate substantially greater resources to enforce their intellectual property rights and to defend claims that may be brought against them. The litigation may involve patent holding companies or other adverse patent owners that have no relevant product revenue and against which our patents may therefore provide little or no deterrence. In the past, we have been subject to allegations of patent infringement that were unsuccessful, and we may in the future be subject to claims that we have misappropriated, misused, or infringed other parties’ intellectual property rights, and, to the extent we gain greater market visibility or face increasing competition, we face a higher risk of being the subject of intellectual property infringement claims, which is not uncommon with respect to enterprise software companies. We also generally grant our customers ownership of any custom applications that we develop for them, subject to our continued ownership of our pre-existing intellectual property rights and, in the past, a customer for whom we have developed custom applications has incorrectly alleged that applications we have independently developed infringed the customer’s intellectual property rights. In addition, we have in the past and may in
33
the future be subject to claims that employees or contractors, or we, have inadvertently or otherwise used or disclosed trade secrets or other proprietary information of our competitors or other parties. To the extent that intellectual property claims are made against our customers based on their usage of our technology, we have certain obligations to indemnify and defend such customers from those claims. The term of our contractual indemnity provisions often survives termination or expiration of the applicable agreement. Large indemnity payments, defense costs or damage claims from contractual breach could harm our business, results of operations and financial condition.
There may be third-party intellectual property rights, including issued or pending patents that cover significant aspects of our technologies or business methods. Any intellectual property claims, with or without merit, could be very time-consuming, could be expensive to settle or litigate, could divert our management’s attention and other resources and could result in adverse publicity. These claims could also subject us to making substantial payments for legal fees, settlement payments, and other costs or damages, potentially including treble damages if we are found to have willfully infringed patents or copyrights. These claims could also result in our having to stop making, selling, offering for sale, or using technology found to be in violation of a third party’s rights. We might be required to seek a license for the third-party intellectual property rights, which may not be available on reasonable terms or at all. Even if a license is available to us, we may be required to pay significant upfront fees, milestones or royalties, which would increase our operating expenses. Moreover, to the extent we only have a license to any intellectual property used in our platform, there may be no guarantee of continued access to such intellectual property, including on reasonable terms. As a result, we may be required to develop alternative non-infringing technology, which could require significant effort and expense. If a third party is able to obtain an injunction preventing us from accessing such third-party intellectual property rights, or if we cannot license or develop technology for any infringing aspect of our business, we would be forced to limit or stop sales of our software or cease business activities covered by such intellectual property, and may be unable to compete effectively. Any of these results would adversely affect our business, results of operations, financial condition and cash flows.
Changes in laws and regulations related to the internet or changes in the internet infrastructure itself may diminish the demand for our platform, and could have a negative impact on our business.
The future success of our business, and particularly our cloud offering, depends upon the continued use of the internet as a primary medium for commerce, communication and business applications. Federal, state or foreign government bodies or agencies have in the past adopted, and may in the future adopt, laws or regulations affecting the use of the internet as a commercial medium. Changes in these laws or regulations could require us to modify our platform in order to comply with these changes. In addition, government agencies or private organizations may begin to impose taxes, fees or other charges for accessing the internet or commerce conducted via the internet. These laws or charges could limit the growth of internet-related commerce or communications generally, resulting in reductions in the demand for internet-based solutions such as ours.
In addition, the use of the internet as a business tool could be adversely affected due to delays in the development or adoption of new standards and protocols to handle increased demands of internet activity, security, reliability, cost, ease of use, accessibility, and quality of service. The performance of the internet and its acceptance as a business tool have been adversely affected by “viruses,” “worms” and similar malicious programs and the internet has experienced a variety of outages and other delays as a result of damage to portions of its infrastructure. If the use of the internet is adversely affected by these issues, demand for our platform could suffer.
Our operating results may be negatively affected if we are required to pay additional state sales tax, value added, or other transaction taxes, and we could be subject to liability with respect to all or a portion of past or future sales.
We currently collect and remit sales and use, value added and other transaction taxes in certain of the jurisdictions where we do business based on our assessment of the amount of taxes owed by us in such jurisdictions. However, in some jurisdictions in which we do business, we do not believe that we owe such taxes, and therefore we currently do not collect and remit such taxes in those jurisdictions or record contingent tax liabilities in respect of those jurisdictions.
Further, due to uncertainty in the application and interpretation of applicable tax laws in various jurisdictions, we may be exposed to sales and use, value added or other transaction tax liability. A successful assertion that we are required to pay additional taxes in connection with sales of our platform, or the imposition of new laws or regulations requiring the payment of additional taxes, would create increased costs and administrative burdens for us. If we are subject to additional taxes and determine to offset such increased costs by collecting and remitting sales taxes from our customers, or otherwise passing those
34
costs through to our customers, companies may be discouraged from using our platform. Any increased tax burden may decrease our ability or willingness to compete in relatively burdensome tax jurisdictions, result in substantial tax liabilities related to past sales or otherwise harm our business and operating results.
We are a multinational organization faced with increasingly complex tax issues in many jurisdictions, and we could be obligated to pay additional taxes in various jurisdictions.
As a multinational organization, we may be subject to taxation in several jurisdictions around the world with increasingly complex tax laws and the amount of taxes we pay in these jurisdictions could increase substantially as a result of changes in the applicable tax principles, including increased tax rates, new tax laws or revised interpretations of existing tax laws and precedents, which could have a material adverse effect on our liquidity and operating results. For example, we continue to maintain a full valuation allowance on the deferred tax assets of our subsidiary in Switzerland as we determined that it was not more likely than not that we would be able to realize a benefit from the gross net operating loss at that subsidiary. Based on our cumulative operating results as of December 31, 2017, and assessment of our expected future results of operations, we determined that it was not more-likely-than not that we would be able to realize the deferred tax assets prior to expiration.
In addition, the authorities in these jurisdictions could review our tax returns and impose additional tax, interest and penalties, and the authorities could claim that various withholding requirements apply to us or our subsidiaries or assert that benefits of tax treaties are not available to us or our subsidiaries, any of which could have a material impact on us and the results of our operations.
Our ability to use net operating losses to offset future taxable income may be subject to certain limitations.
As of December 31, 2017, we had federal and state net operating loss carryforwards, or NOLs, at Appian Corporation of $25.3 million and $25.3 million, respectively, available to offset future taxable income, which substantially expire in 2037 if not utilized. A lack of future taxable income would adversely affect our ability to utilize these NOLs before they expire. Under the provisions of the Internal Revenue Code of 1986, as amended, or the Internal Revenue Code, substantial changes in our ownership may limit the amount of pre-change NOLs that can be utilized annually in the future to offset taxable income. Section 382 of the Internal Revenue Code, or Section 382, imposes limitations on a company’s ability to use NOLs if a company experiences a more-than-50-percent ownership change over a three-year testing period. Based upon our analysis as of December 31, 2017, we have determined that we do not expect these limitations to impair our ability to use our NOLs prior to expiration. However, if changes in our ownership occur in the future, our ability to use our NOLs may be further limited. For these reasons, we may not be able to utilize a material portion of the NOLs, even if we achieve profitability.
As of December 31, 2017, we also had foreign NOLs of $35.7 million, primarily at Appian Software Switzerland. These NOLs will substantially expire in 2024, if unused. If we are limited in our ability to use our NOLs in future years in which we have taxable income, we will pay more taxes than if we were able to fully utilize our NOLs. This could adversely affect our operating results and the market price of our Class A common stock.
Forecasting our estimated annual effective tax rate for financial accounting purposes is complex and subject to uncertainty, and there may be material differences between our forecasted and actual tax rates.
Forecasts of our income tax position and effective tax rate for financial accounting purposes are complex and subject to uncertainty because our income tax position for each year combines the effects of a mix of profits earned and losses incurred by us in various tax jurisdictions with a broad range of income tax rates, as well as changes in the valuation of deferred tax assets and liabilities, the impact of various accounting rules and changes to these rules and tax laws, the results of examinations by various tax authorities, and the impact of any acquisition, business combination or other reorganization or financing transaction. To forecast our global tax rate, we estimate our pre-tax profits and losses by jurisdiction and forecast our tax expense by jurisdiction. If the mix of profits and losses, our ability to use tax credits, or effective tax rates by jurisdiction is different than those estimated, our actual tax rate could be materially different than forecasted, which could have a material impact on our results of business, financial condition and results of operations.
35
On December 22, 2017, U.S. Federal tax reform was enacted with the signing of the Tax Cuts and Jobs Act, or the TCJA. Notable provisions of the TCJA include significant changes to corporate taxation, including reduction of the corporate tax rate from a top marginal rate of 35% to a flat rate of 21%, limitation of the tax deduction for interest expense to 30% of adjusted earnings (except for certain small businesses), limitation of the deduction for net operating losses to 80% of current year taxable income and elimination of net operating loss carrybacks, one time taxation of offshore earnings at reduced rates regardless of whether they are repatriated, elimination of U.S. tax on foreign earnings (subject to certain important exceptions), immediate deductions for certain new investments instead of deductions for depreciation expense over time, and modifying or repealing many business deductions and credits.
While the changes from the TCJA are generally effective beginning in 2018, U.S. GAAP accounting for income taxes requires the effect of a change in tax laws or rates to be recognized in income from continuing operations for the period that includes the enactment date. Due to the complexities involved in accounting for the enactment of the TCJA, the Securities and Exchange Commission Staff Accounting Bulletin No. 118, or SAB No. 118, allows us to record provisional amounts in earnings for the year ended December 31, 2017. Where reasonable estimates can be made, the provisional accounting should be based on such estimates. When no reasonable estimate can be made, the provisional accounting may be based on the tax law in effect before the TCJA. We are required to complete our tax accounting for the TCJA in the period when we have obtained, prepared, and analyzed the information to complete the income tax accounting.
We have not completed our accounting for the tax effects of enactment of the TCJA; however, as we describe in Note 6 to our consolidated financial statements appearing elsewhere in this Annual Report on Form 10-K, we have made reasonable estimates of the effects of the TCJA on our consolidated financial statements which are included as a component of income tax expense.
The U.S. Department of Treasury has broad authority to issue regulations and interpretative guidance that may significantly impact how we will apply the law and impact our results of operations in the period issued. As additional regulatory guidance is issued by the applicable taxing authorities, as accounting treatment is clarified, as we perform additional analysis on the application of the law, and as we refine estimates in calculating the effect, our final analysis, which will be recorded in the period completed, may be different from our current provisional amounts, which could materially affect our tax obligations and effective tax rate.
We are subject to anti-corruption laws with respect to our domestic and international operations and non-compliance with such laws can subject us to criminal and/or civil liability and materially harm our business.
We are subject to the U.S. Foreign Corrupt Practices Act of 1977, as amended, or the FCPA, the U.S. domestic bribery statute contained in 18 U.S.C. § 201, the U.S. Travel Act, the United Kingdom Bribery Act 2010, and other anti-corruption laws in countries in which we conduct activities. Anti-corruption laws are interpreted broadly and prohibit our company from authorizing, offering, or providing, directly or indirectly, improper payments or benefits to recipients in the public or private sector. We use third-party law firms, accountants, and other representatives for regulatory compliance, sales, and other purposes in several countries. We can be held liable for the corrupt or other illegal activities of these third-party representatives, our employees, contractors, and other agents, even if we do not explicitly authorize such activities. In addition, although we have implemented policies and procedures to ensure compliance with anti-corruption laws, there can be no assurance that all of our employees, representatives, contractors, or agents will comply with these laws at all times.
Noncompliance with these laws could subject us to whistleblower complaints, investigations, sanctions, settlements, prosecution, other enforcement actions, disgorgement of profits, significant fines, damages, other civil and criminal penalties or injunctions, suspension and/or debarment from contracting with certain persons, the loss of export privileges, reputational harm, adverse media coverage, and other collateral consequences. If any subpoenas or investigations are launched, or governmental or other sanctions are imposed, or if we do not prevail in any possible civil or criminal litigation, our business, results of operations and financial condition could be materially harmed. In addition, responding to any action will likely result in a materially significant diversion of management’s attention and resources and significant defense costs and other professional fees. Enforcement actions and sanctions could further harm our business, results of operations, and financial condition. Moreover, as an issuer of securities, we also are subject to the accounting and internal controls provisions of the FCPA. These provisions require us to maintain accurate books and records and a system of internal controls sufficient to detect and prevent corrupt conduct. Failure to abide by these provisions may have an adverse effect on our business, operations or financial condition.
36
We are subject to governmental export and import controls and economic and trade sanctions that could impair our ability to conduct business in international markets and subject us to liability if we are not in compliance with applicable laws and regulations.
The United States and other countries maintain and administer export and import laws and regulations, including various economic and trade sanctions including those administered by the Office of Foreign Assets Control, or OFAC, which apply to our business. We are required to comply with these laws and regulations. If we fail to comply with such laws and regulations, we and certain of our employees could be subject to substantial civil or criminal penalties, including the possible loss of export or import privileges; fines, which may be imposed on us and responsible employees or managers; and, in extreme cases, the incarceration of responsible employees or managers.
Changes in our platform, or changes in applicable export or import laws and regulations may create delays in the introduction and sale of our platform in international markets or, in some cases, prevent the export or import of our platform to certain countries, governments or persons altogether. Any change in export or import laws and regulations or economic or trade sanctions, shift in the enforcement or scope of existing laws and regulations, or change in the countries, governments, persons or technologies targeted by such laws and regulations could also result in decreased use of our platform, or in our decreased ability to export or sell our platform to existing or potential customers. Any decreased use of our services or limitation on our ability to export or sell our services would likely adversely affect our business, financial condition, and results of operations.
We incorporate encryption technology into certain of our products. Encryption products may be exported outside of the United States only with the required export authorization, including by license, license exception or other appropriate government authorization. Obtaining the necessary export license or other authorization for a particular sale may be time-consuming and may result in the delay or loss of sales opportunities. In addition, various countries regulate the import of certain encryption technology, including import permitting and licensing requirements, and have enacted laws that could limit our ability to distribute our products or could limit our customers’ ability to implement our products in those countries. Although we take precautions to prevent our products from being provided in violation of such laws, our products may have been in the past, and could in the future be, provided inadvertently in violation of such laws, despite the precautions we take. Governmental regulation of encryption technology and regulation of imports or exports, or our failure to obtain required import or export approval for our products, could harm our international sales and adversely affect our revenue.
Moreover, U.S. export control laws and economic sanctions programs prohibit the provision of services to countries, governments and persons that are subject to U.S. economic embargoes and trade sanctions. Even though we take precautions to prevent our platform from being used by U.S. sanctions targets, our platform could be used by a sanctioned person or in an embargoed country despite such precautions. Any such shipment could have negative consequences, including government investigations, penalties and reputational harm.
If our platform fails to function in a manner that allows our customers to operate in compliance with regulations and/or industry standards, our revenue and operating results could be harmed.
Certain of our customers use our platform to create applications that ensure secure communications given the nature of the content being distributed and associated applicable regulatory requirements. Governmental and other customers may also require our platform to comply with certain privacy, security and other certifications and standards. Our cloud platform holds various security certifications from government agencies and industry organizations, including the Federal Risk and Authorization Management Program compliance, and meets the Payment Card Industry Data Security Standard and the United States Health Insurance Portability and Accountability Act standard. Governments and industry organizations may also adopt new laws, regulations or requirements, or make changes to existing laws or regulations, that could impact the demand for, or value of, our applications, such as the General Data Protection Regulations adopted by the European Union that will take effect in May 2018. If we fail to maintain our current security certifications and/or to continue to meet security standards, or if we are unable to adapt our platform to changing legal and regulatory standards or other requirements in a timely manner, our customers may lose confidence in our platform and our business could be negatively impacted.
Our business could be adversely affected if our employees cannot obtain and maintain required security clearances or we cannot maintain our facility security clearance.
If and when awarded, certain U.S. government contracts require our employees to maintain various levels of security clearances, and we would be required to maintain our facility security clearance, to comply with Department of Defense, or
37
DoD, requirements. The DoD has strict security clearance requirements for personnel who work on classified programs. Obtaining and maintaining security clearances for employees involves a lengthy process, and it is difficult to identify, recruit and retain employees who already hold security clearances. If our employees are unable to obtain security clearances in a timely manner, or at all, or if our employees who hold security clearances are unable to maintain their clearances or terminate employment with us, then a customer requiring classified work could terminate an existing contract or decide not to renew the contract upon its expiration. To the extent we are not able to maintain our facility security clearance, we may not be able to bid on or win new classified contracts.
Risks Related to Our Class A Common Stock
Our stock price may be volatile, and you may lose some or all of your investment.
The market price of our Class A common stock may be highly volatile and may fluctuate substantially as a result of a variety of factors, some of which are related in complex ways. Since shares of our Class A common stock were sold in our IPO in May 2017 at a price of $12.00 per share, our stock price has ranged from an intraday low of $14.60 to an intraday high of $43.26 through February 20, 2018. Factors that may affect the market price of our Class A common stock include:
• | actual or anticipated fluctuations in our financial condition and operating results; |
• | variance in our financial performance from expectations of securities analysts; |
• | changes in the prices of subscriptions to our platform; |
• | changes in our projected operating and financial results; |
• | changes in laws or regulations applicable to our platform; |
• | announcements by us or our competitors of significant business developments, acquisitions or new offerings; |
• | our involvement in any litigation; |
• | our sale of our Class A common stock or other securities in the future; |
• | changes in senior management or key personnel; |
• | the trading volume of our Class A common stock; |
• | changes in the anticipated future size and growth rate of our market; and |
• | general economic, regulatory and market conditions. |
Recently, the stock markets have experienced extreme price and volume fluctuations that have affected and continue to affect the market prices of equity securities of many companies. These fluctuations have often been unrelated or disproportionate to the operating performance of those companies. Broad market and industry fluctuations, as well as general economic, political, regulatory and market conditions, may negatively impact the market price of our Class A common stock. In the past, companies that have experienced volatility in the market price of their securities have been subject to securities class action litigation. We may be the target of this type of litigation in the future, which could result in substantial costs and divert our management’s attention.
An active public trading market may not be sustained.
Prior to the completion of our IPO in May 2017, no public market for our Class A common stock existed. An active public trading market for our Class A common stock may not be sustained. The lack of an active market may impair your ability to sell your shares of Class A common stock at the time you wish to sell them or at a price that you consider reasonable. The lack of an active market may also reduce the fair value of your shares. An inactive market may also impair our ability to raise capital to continue to fund operations by selling shares and may impair our ability to acquire other companies or technologies by using our shares as consideration.
Future sales of our Class A common stock in the public market could cause the market price of our Class A common stock to decline.
Sales of a substantial number of shares of our Class A common stock in the public market, or the perception that these sales might occur, could depress the market price of our Class A common stock and could impair our ability to raise capital through the sale of additional equity securities. We are unable to predict the effect that such sales may have on the prevailing market price of our Class A common stock.
As of December 31, 2017, there were 6,999,387 shares of Class B common stock and 11,500 shares of Class A common stock subject to outstanding options and 731,975 shares of Class A common stock to be issued upon the vesting of
38
outstanding restricted stock units. We have registered all of the shares of Class A common stock issuable (i) upon conversion of the shares of Class B common stock issuable upon exercise of outstanding options, (ii) upon the exercise of outstanding options, (iii) upon the vesting of outstanding restricted stock units and (iv) upon exercise of settlement of any options or other equity incentives we may grant in the future, for public resale under the Securities Act of 1933, as amended, or the Securities Act. Accordingly, these shares may be freely sold in the public market upon issuance as permitted by any applicable vesting requirements, subject to the lock-up agreements described above and compliance with applicable securities laws.
As of December 31, 2017, holders of approximately 14 million shares of Class B common stock have rights, subject to some conditions, to require us to file registration statements for the public resale of the Class A common stock issuable upon conversion of such shares or to include such shares in registration statements that we may file for ourselves or other stockholders.
The sale of shares of our Class A common stock by a single large stockholder could cause the market price of our Class A common stock to decline.
Approximately 37% of our publicly traded Class A common stock is held by a single stockholder. Should this stockholder elect to sell all or a significant portion of its shares of our Class A common stock, the market price of our Class A common stock and our ability to raise capital through the sale of additional equity securities could be negatively affected. We cannot predict the effect that such a sale may have on the prevailing market price of our Class A common stock.
The dual class structure of our common stock and the existing ownership of capital stock by Matthew Calkins, our founder and Chief Executive Officer, has the effect of concentrating voting control with Mr. Calkins for the foreseeable future, which will limit your ability to influence corporate matters.
Our Class B common stock has ten votes per share, and our Class A common stock has one vote per share. Given the greater number of votes per share attributed to our Class B common stock, our Class B stockholders collectively beneficially own shares representing approximately 97% of the voting power of our outstanding capital stock as of December 31, 2017. Further, Mr. Calkins, our founder and Chief Executive Officer, together with his affiliates, collectively beneficially own shares representing approximately 58% of the voting power of our outstanding capital stock as of December 31, 2017. Consequently, Mr. Calkins, together with his affiliates, is able to control a majority of the voting power even if their stock holdings represent as few as approximately 40% of the outstanding number of shares of our common stock. This concentrated control will limit your ability to influence corporate matters for the foreseeable future. For example, Mr. Calkins will be able to control elections of directors, amendments of our certificate of incorporation or bylaws, increases to the number of shares available for issuance under our equity incentive plans or adoption of new equity incentive plans and approval of any merger or sale of assets for the foreseeable future. This concentrated control could also discourage a potential investor from acquiring our Class A common stock due to the limited voting power of such stock relative to the Class B common stock and might harm the market price of our Class A common stock. In addition, Mr. Calkins has the ability to control the management and major strategic investments of our company as a result of his position as our Chief Executive Officer and his ability to control the election or replacement of our directors. As a board member and officer, Mr. Calkins owes a fiduciary duty to our stockholders and must act in good faith in a manner he reasonably believes to be in the best interests of our stockholders. However, as a stockholder, even a controlling stockholder, Mr. Calkins is entitled to vote his shares, and shares over which he has voting control, in his own interests, which may not always be in the interests of our stockholders generally.
Future transfers by Mr. Calkins and other holders of Class B common stock will generally result in those shares converting on a 1:1 basis to Class A common stock, which will have the effect, over time, of increasing the relative voting power of those holders of Class B common stock who retain their shares in the long-term.
We have not elected to take advantage of the “controlled company” exemption to the corporate governance rules for publicly-listed companies but may do so in the future.
Because our Chief Executive Officer, Mr. Calkins, owns in excess of 50% of the voting power of our outstanding capital stock, we are eligible to elect the “controlled company” exemption to the corporate governance rules for publicly-listed companies. We have not elected to do so. If we decide to become a “controlled company” under the corporate governance rules for publicly-listed companies, we would not be required to have a majority of our board of directors be independent, nor would we be required to have a compensation committee or an independent nominating function. If we chose controlled company
39
status in the future, our status as a controlled company could cause our Class A common stock to be less attractive to certain investors or otherwise harm our trading price.
If securities or industry analysts do not publish research or reports about our business, or publish negative reports about our business, our stock price and trading volume could decline.
The trading market for our Class A common stock depends, in part, on the research and reports that securities or industry analysts publish about us or our business. We do not have any control over these analysts. If our financial performance fails to meet analyst estimates or one or more of the analysts who cover us downgrade our shares or change their opinion of our shares, our share price would likely decline. If one or more of these analysts cease coverage of our company or fail to regularly publish reports on us, we could lose visibility in the financial markets, which could cause our share price or trading volume to decline.
We do not intend to pay dividends for the foreseeable future and, as a result, your ability to achieve a return on your investment will depend on appreciation in the price of our Class A common stock.
We have never declared or paid any cash dividends on our common stock and we do not intend to pay any cash dividends in the foreseeable future. Although we paid a cash dividend in connection with the conversion of our Series A preferred stock to Class B common stock immediately prior to the closing of the IPO, which was agreed to at the time of the original issuance of the Series A preferred stock, we anticipate that we will retain all of our future earnings for use in the development of our business and for general corporate purposes. Additionally, our ability to pay dividends on our common stock is limited by restrictions under the terms of our loan and security agreement with Silicon Valley Bank. Any determination to pay dividends in the future will be at the discretion of our board of directors. Accordingly, investors must rely on sales of their Class A common stock after price appreciation, which may never occur, as the only way to realize any future gains on their investments.
We are an “emerging growth company” and we cannot be certain if the reduced reporting and disclosure requirements applicable to emerging growth companies will make our Class A common stock less attractive to investors.
We are an “emerging growth company,” as defined in the JOBS Act, and we may take advantage of certain exemptions from various reporting requirements that are applicable to other public companies that are not “emerging growth companies” including, but not limited to, the auditor attestation requirements of Section 404 of the Sarbanes-Oxley Act, reduced disclosure obligations regarding executive compensation in our periodic reports and proxy statements, and exemptions from the requirements of holding a nonbinding advisory vote on executive compensation and stockholder approval of any golden parachute payments not previously approved. We cannot predict if investors will find our Class A common stock less attractive if we choose to rely on these exemptions. If some investors find our Class A common stock less attractive as a result, there may be a less active trading market for our Class A common stock and our stock price may be more volatile.
As an “emerging growth company” the JOBS Act allows us to delay adoption of new or revised accounting pronouncements applicable to public companies until such pronouncements are made applicable to private companies. We have elected to use this extended transition period under the JOBS Act. As a result, our consolidated financial statements may not be comparable to the financial statements of issuers who are required to comply with the effective dates for new or revised accounting standards that are applicable to public companies, which may make our Class A common stock less attractive to investors.
We incur increased costs as a result of operating as a public company, and our management is required to devote substantial time to compliance with our public company responsibilities and corporate governance practices.
As a newly public company, and particularly after we are no longer an “emerging growth company,” we incur significant legal, accounting and other expenses that we did not incur as a private company. The Sarbanes-Oxley Act, the Dodd-Frank Wall Street Reform and Consumer Protection Act, the listing requirements of the Nasdaq Stock Market and other applicable securities rules and regulations impose various requirements on public companies. Our management and other personnel need to devote a substantial amount of time to compliance with these requirements. Moreover, these rules and regulations increase our legal and financial compliance costs and will make some activities more time-consuming and costly. For example, we expect that these rules and regulations may make it more difficult and more expensive for us to obtain
40
directors’ and officers’ liability insurance, compared to when we were a private company, which could make it more difficult for us to attract and retain qualified members of our board of directors. We cannot predict or estimate the amount of additional costs we will continue to incur as a public company or the timing of such costs.
We are obligated to develop and maintain proper and effective internal controls over financial reporting and any failure to maintain the adequacy of these internal controls may adversely affect investor confidence in our company and, as a result, the value of our Class A common stock.
We will be required, pursuant to Section 404 of the Sarbanes-Oxley Act, or Section 404, to furnish a report by management on, among other things, the effectiveness of our internal control over financial reporting for the year ending December 31, 2018. This assessment will need to include disclosure of any material weaknesses identified by our management in our internal control over financial reporting. Our independent registered public accounting firm will not be required to attest to the effectiveness of our internal control over financial reporting until our first annual report required to be filed with the SEC following the date we are no longer an “emerging growth company,” as defined in the JOBS Act. We will be required to disclose significant changes made in our internal control procedures on a quarterly basis.
We have commenced the costly and challenging process of compiling the system and processing documentation necessary to perform the evaluation needed to comply with Section 404, and we may not be able to complete our evaluation, testing and any required remediation in a timely fashion. Our compliance with Section 404 will require that we incur substantial accounting expense and expend significant management efforts. For example, we are currently replacing our financial accounting system in order to better perform the evaluation needed to comply with Section 404. We currently do not have an internal audit group, and we will need to hire additional accounting and financial staff with appropriate public company experience and technical accounting knowledge and compile the system and process documentation necessary to perform the evaluation needed to comply with Section 404. If the new accounting system is not successfully implemented or we encounter other difficulties we might incur significant unexpected expenses in order to perform the Section 404 evaluation.
During the evaluation and testing process of our internal controls, if we identify one or more material weaknesses in our internal control over financial reporting, we will be unable to assert that our internal control over financial reporting is effective. We cannot assure you that there will not be material weaknesses or significant deficiencies in our internal control over financial reporting in the future. Any failure to maintain internal control over financial reporting could severely inhibit our ability to accurately report our financial condition or results of operations. If we are unable to conclude that our internal control over financial reporting is effective, or if our independent registered public accounting firm determines we have a material weakness or significant deficiency in our internal control over financial reporting, we could lose investor confidence in the accuracy and completeness of our financial reports, the market price of our Class A common stock could decline, and we could be subject to sanctions or investigations by the Nasdaq Stock Market, the SEC or other regulatory authorities. Failure to remedy any material weakness in our internal control over financial reporting, or to implement or maintain other effective control systems required of public companies, could also restrict our future access to the capital markets.
Anti-takeover provisions in our charter documents and under Delaware law could make an acquisition of us more difficult, limit attempts by our stockholders to replace or remove our current management and limit the market price of our Class A common stock.
In addition to the effects of our dual class structure, provisions in our amended and restated certificate of incorporation and amended and restated bylaws may have the effect of delaying or preventing a change in control or changes in our management. Our amended and restated certificate of incorporation and amended and restated bylaws include provisions that may frustrate or prevent any attempts by our stockholders to replace or remove our current management by making it more difficult for stockholders to replace members of our board of directors, which is responsible for appointing the members of our management. In addition, because we are incorporated in Delaware, we are governed by the provisions of Section 203 of the Delaware General Corporation Law, which generally prohibit a Delaware corporation from engaging in any of a broad range of business combinations with any “interested” stockholder for a period of three years following the date on which the stockholder became an “interested” stockholder. Any of the foregoing provisions could limit the price that investors might be willing to pay in the future for shares of our Class A common stock, and they could deter potential acquirers of our company, thereby reducing the likelihood that you would receive a premium for your shares of our Class A common stock in an acquisition.
41
Our amended and restated certificate of incorporation designates the Court of Chancery of the State of Delaware as the exclusive forum for certain litigation that may be initiated by our stockholders, which could limit our stockholders’ ability to obtain a favorable judicial forum for disputes with us and limit the market price of our Class A common stock.
Pursuant to our amended and restated certificate of incorporation, unless we consent in writing to the selection of an alternative forum, the Court of Chancery of the State of Delaware will be the sole and exclusive forum for (1) any derivative action or proceeding brought on our behalf, (2) any action asserting a claim of breach of a fiduciary duty owed by any of our directors, officers or other employees to us or our stockholders, (3) any action asserting a claim arising pursuant to any provision of the Delaware General Corporation Law, our amended and restated certificate of incorporation or our amended and restated bylaws or (4) any action asserting a claim governed by the internal affairs doctrine. Our amended and restated certificate of incorporation also provides that the federal district courts of the United States of America will be the exclusive forum for resolving any complaint asserting a cause of action arising under the Securities Act. Our amended and restated certificate of incorporation further provides that any person or entity purchasing or otherwise acquiring any interest in shares of our Class A common stock is deemed to have notice of and consented to the foregoing provisions. The forum selection clause in our amended and restated certificate of incorporation may limit our stockholders’ ability to obtain a favorable judicial forum for disputes with us and limit the market price of our Class A common stock.
Item 1B. Unresolved Staff Comments.
Not applicable.
Item 2. Properties.
Our corporate headquarters occupies approximately 75,000 square feet in Reston, Virginia under an operating lease that expires in July 2021. We also lease space in the United Kingdom, France, Germany, Canada, Italy, Australia and the Netherlands under operating lease agreements with various expiration dates through 2026.
We believe that our current facilities are suitable and adequate to meet our current needs. We intend to add new facilities or expand existing facilities as we add employees, and we believe that suitable additional or substitute space will be available as needed to accommodate any such expansion of our operations.
Item 3. Legal Proceedings.
From time to time we may become involved in legal proceedings or be subject to claims arising in the ordinary course of our business. We are not presently a party to any legal proceedings that, if determined adversely to us, would individually or taken together have a material adverse effect on our business, operating results, financial condition or cash flows. Regardless of the outcome, litigation can have an adverse impact on us because of defense and settlement costs, diversion of management time and resources and other factors.
Item 4. Mine Safety Disclosures.
Not applicable.
42
PART II
Item 5. Market for Registrant's Common Equity, Related Stockholder Matters and Issuer Purchases of Equity Securities.
Market Information
Our Class A common stock has been listed on the Nasdaq Global Market under the symbol "APPN" since May 25, 2017. Prior to that date, there was no public trading market for our common stock. Our initial public offering was priced at $12.00 per share on May 24, 2017.
The following table set forth the reported high and low sales prices of our Class A common stock for the periods indicated, as quoted on the Nasdaq Global Market:
Year Ended December 31, 2017: | High | Low | ||||||
Second quarter (from May 25, 2017 to June 30, 2017) | $ | 19.58 | $ | 15.01 | ||||
Third Quarter | $ | 28.46 | $ | 17.63 | ||||
Fourth Quarter | $ | 33.60 | $ | 19.69 | ||||
Our Class B common stock is not listed or traded on any stock exchange.
As of February 12, 2018, there were 20 holders of record of our Class A common stock and 92 holders of record of our Class B common stock. Because many of our shares of Class A common stock are held by brokers and other institutions on behalf of stockholders, we are unable to estimate the total number of stockholders represented by these record holders.
Dividends
We have never declared or paid, and do not anticipate declaring or paying in the foreseeable future, any cash dividends on our common stock. Any future determination as to the declaration and payment of dividends, if any, will be at the discretion of our board of directors, subject to applicable laws, and will depend on then existing conditions, including our financial condition, operating results, contractual restrictions, capital requirements, business prospects and other factors our board of directors may deem relevant.
Stock Performance Graph
This section is not deemed "filed" with the SEC and shall not be deemed incorporated by reference into any of our other filings under the Exchange Act or the Securities Act, irrespective of any general incorporation language in any such filing.
The following graph shows a comparison from May 25, 2017 (the date our Class A common stock commenced trading on the Nasdaq Global Market) through December 31, 2017 of the cumulative total return for an investment of $100 in our Class A common stock, the Nasdaq Global Market Composite Index and the Nasdaq Computer Index. Data for the Nasdaq Global Market Composite Index and the Nasdaq Computer Index assume reinvestment of dividends.
The comparisons in the graph below are based upon historical data and are not indicative of, nor intended to forecast, future performance of our common stock.
i
COMPARISON OF CUMULATIVE TOTAL RETURN
Among Appian Corporation, the Nasdaq Global Market Composite Index and the Nasdaq Computer Index
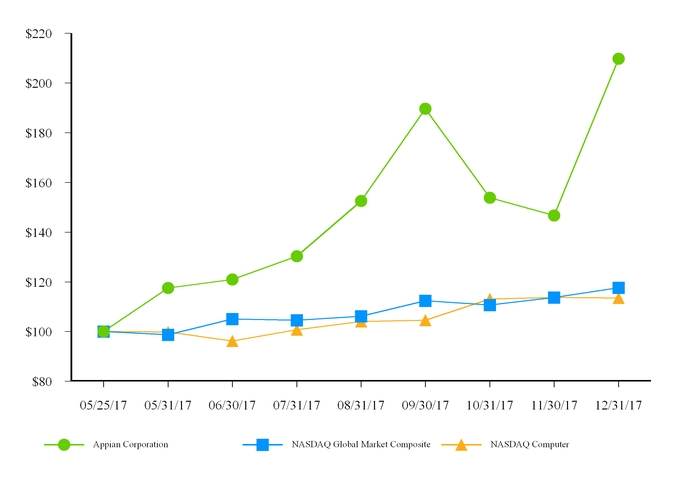
Company/Index | May 25, 2017 | May 31, 2017 | June 30, 2017 | July 31, 2017 | August 31, 2017 | September 30, 2017 | October 31, 2017 | November 30, 2017 | December 31, 2017 | |||||||||||||||||||||||||||
Appian Corporation | $ | 100.00 | $ | 117.59 | $ | 120.92 | $ | 130.31 | $ | 152.50 | $ | 189.61 | $ | 153.90 | $ | 146.70 | $ | 209.73 | ||||||||||||||||||
Nasdaq Global Market Composite | 100.00 | 98.76 | 105.12 | 104.62 | 106.14 | 112.43 | 110.73 | 113.68 | 117.68 | |||||||||||||||||||||||||||
Nasdaq Computer | 100.00 | 99.87 | 96.18 | 100.73 | 104.10 | 104.59 | 113.09 | 113.70 | 113.49 | |||||||||||||||||||||||||||
Recent Sales of Unregistered Securities
On May 26, 2017, a holder net exercised a warrant, resulting in the issuance of 79,363 shares of Class B common stock. The issuance of such shares of Class B common stock was exempt from registration under Section 3(a)(9) of the Securities Act.
Use of Proceeds from Public Offering of Common Stock
On May 31, 2017, we closed our IPO of 7,187,500 shares of our Class A common stock at an offering price of $12.00 per share, including 937,500 shares pursuant to the underwriters’ option to purchase additional Class A shares, resulting in gross proceeds to us of $86.3 million. All of the shares issued and sold in our IPO were registered under the Securities Act pursuant to a registration statement on Form S-1 (File No. 333-217510), which was declared effective by the SEC on May 24, 2017. Morgan Stanley & Co. LLC, Goldman Sachs & Co. LLC, Barclays Capital Inc., Pacific Crest Securities, a division of KeyBanc Capital Markets Inc., Canaccord Genuity Inc. and Cowen and Company, LLC acted as underwriters for the offering. The
44
offering commenced on May 24, 2017 and did not terminate before all of the securities registered in the registration statement were sold.
The net proceeds to us, after deducting underwriting discounts and commissions of $6.0 million and offering expenses of $2.4 million, were $77.8 million. No offering expenses were paid directly or indirectly to any of our directors or officers (or their associates) or persons owning ten percent or more of any class of our equity securities or to any other affiliates. Using the proceeds from the IPO, on June 9, 2017, we repaid in full the $20.0 million principal amount of borrowings under our senior term loan. There has been no material change in the planned use of proceeds from our IPO from those disclosed in the final prospectus for our IPO dated as of May 24, 2017 and filed with the SEC pursuant to Rule 424(b)(4).
As of December 31, 2017, all expenses incurred in connection with our IPO had been paid.
Purchase of Equity Securities by the Issuer and Affiliated Purchases
None.
Securities Authorized for Issuance Under Equity Compensation Plans
Information about securities authorized for issuance under our equity compensation plans is incorporated herein by reference to Item 12 of Part III of this Annual Report on Form 10-K.
45
Item 6. Selected Financial Data.
The following selected historical financial data should be read in conjunction with Item 7, “Management’s Discussion and Analysis of Financial Condition and Results of Operations,” and our consolidated financial statements and the related notes appearing in Item 8, “Financial Statements and Supplementary Data,” of this Annual Report on Form 10-K to fully understand the factors that may affect the comparability of the information presented below.
The selected consolidated financial data in this section are not intended to replace the consolidated financial statements and are qualified in their entirety by the consolidated financial statements and related notes included elsewhere in this Annual Report on Form 10-K.
The following selected consolidated statements of operations data for the years ended December 31, 2017, 2016, and 2015, and the consolidated balance sheet data as of December 31, 2017 and 2016, have been derived from our audited consolidated financial statements included elsewhere in this Annual Report on Form 10-K. The consolidated statements of operations data for the year ended December 31, 2014 and the consolidated balance sheet data as of December 31, 2015 and 2014 have been derived from our audited consolidated financial statements not included in this Annual Report on Form 10-K.
Year Ended December 31, | |||||||||||||||
2017 | 2016 | 2015 | 2014 | ||||||||||||
(in thousands, except share and per share data) | |||||||||||||||
Revenue: | |||||||||||||||
Subscriptions, software and support | $ | 91,514 | $ | 69,972 | $ | 53,207 | $ | 37,076 | |||||||
Professional services | 85,223 | 62,951 | 57,997 | 51,920 | |||||||||||
Total revenue | 176,737 | 132,923 | 111,204 | 88,996 | |||||||||||
Cost of revenue(1): | |||||||||||||||
Subscriptions, software and support | 9,379 | 7,437 | 6,079 | 4,273 | |||||||||||
Professional services | 55,218 | 42,686 | 42,402 | 32,524 | |||||||||||
Total cost of revenue | 64,597 | 50,123 | 48,481 | 36,797 | |||||||||||
Gross profit | 112,140 | 82,800 | 62,723 | 52,199 | |||||||||||
Operating expenses(1): | |||||||||||||||
Sales and marketing | 81,966 | 54,137 | 38,300 | 29,088 | |||||||||||
Research and development | 34,835 | 22,994 | 16,750 | 13,488 | |||||||||||
General and administrative | 27,150 | 17,039 | 12,515 | 23,373 | |||||||||||
Total operating expenses | 143,951 | 94,170 | 67,565 | 65,949 | |||||||||||
Operating loss | (31,811 | ) | (11,370 | ) | (4,842 | ) | (13,750 | ) | |||||||
Other (income) expense: | |||||||||||||||
Other (income) expense, net | (2,038 | ) | 1,792 | 1,579 | 2,086 | ||||||||||
Interest (income) expense | 473 | 982 | 188 | 19 | |||||||||||
Total other (income) expense | (1,565 | ) | 2,774 | 1,767 | 2,105 | ||||||||||
Net loss before income taxes | (30,246 | ) | (14,144 | ) | (6,609 | ) | (15,855 | ) | |||||||
Income tax expense (benefit) | 761 | (1,683 | ) | 378 | 1,204 | ||||||||||
Net loss | (31,007 | ) | (12,461 | ) | (6,987 | ) | (17,059 | ) | |||||||
Accretion of dividends on convertible preferred stock(2) | 357 | 857 | 861 | 856 | |||||||||||
Net loss attributable to common stockholders | $ | (31,364 | ) | $ | (13,318 | ) | $ | (7,848 | ) | $ | (17,915 | ) | |||
Net loss per share attributable to common stockholders: | |||||||||||||||
Basic and diluted | $ | (0.63 | ) | $ | (0.39 | ) | $ | (0.23 | ) | $ | (0.50 | ) | |||
Weighted average common shares outstanding(3): | |||||||||||||||
Basic and diluted | 49,529,833 | 34,274,718 | 34,274,718 | 35,717,803 | |||||||||||
stock-based compensation expense was recognized because a qualifying event had not yet occurred.
46
Year Ended December 31, | |||||||||||||||
2017 | 2016 | 2015 | 2014 | ||||||||||||
(in thousands) | |||||||||||||||
Cost of revenue | |||||||||||||||
Subscriptions, software and support | $ | 575 | $ | — | $ | — | $ | — | |||||||
Professional services | 1,295 | — | — | — | |||||||||||
Operating expenses | |||||||||||||||
Sales and marketing | 3,233 | — | — | — | |||||||||||
Research and development | 2,822 | — | — | — | |||||||||||
General and administrative | 5,051 | — | — | — | |||||||||||
Total stock-based compensation expense | $ | 12,976 | $ | — | $ | — | $ | — | |||||||
(2) See Note 8 to our consolidated financial statements appearing in Item 8 for further details on the calculation of accretion
of preferred stock to redemption value and basic and diluted net loss per share attributable to common stockholders.
(3) Immediately prior to the completion of our IPO on May 31, 2017, 18.2 million shares of convertible preferred stock were
converted and reclassified to Class B common stock. In addition, immediately prior to the completion of the IPO, a warrant to purchase 84,360 shares of convertible preferred stock was converted to a warrant to purchase 84,360 shares of Class B common stock, and 79,363 shares of our Class B common stock was issued upon the net exercise of this warrant.
As of December 31, | |||||||||||||||
2017 | 2016 | 2015 | 2014 | ||||||||||||
(in thousands) | |||||||||||||||
Consolidated Balance Sheet Data: | |||||||||||||||
Cash | $ | 73,758 | $ | 31,143 | $ | 31,393 | $ | 24,991 | |||||||
Working capital | 50,107 | 12,365 | 19,463 | 13,166 | |||||||||||
Total assets | 161,052 | 102,738 | 83,400 | 65,448 | |||||||||||
Total deferred revenue | 89,087 | 70,108 | 53,110 | 34,288 | |||||||||||
Total debt | — | 20,000 | 10,000 | — | |||||||||||
Convertible preferred stock | — | 55,415 | 54,558 | 53,577 | |||||||||||
Total stockholders' equity (deficit) | 45,524 | (63,492 | ) | (50,533 | ) | (42,723 | ) | ||||||||
47
Item 7. Management's Discussion and Analysis of Financial Condition and Results of Operations
The following discussion and analysis of our financial condition and results of operations should be read in conjunction with our consolidated financial statements and related notes appearing elsewhere in this Annual Report on Form 10-K. In addition to historical financial information, the following discussion contains forward-looking statements that reflect our plans, estimates and beliefs. Our actual results could differ materially from those contained in or implied by any forward-looking statements. Factors that could cause or contribute to these differences include those under “Risk Factors” included in Part I, Item 1A or in other parts of this Annual Report on Form 10-K.
Overview
We provide a leading low-code software development platform as a service that enables organizations to rapidly develop powerful and unique applications. The applications created on our platform help companies drive digital transformation and competitive differentiation.
With our platform, organizations can rapidly and easily design, build and implement powerful, enterprise-grade custom applications through our intuitive, visual interface with little or no coding required. Our customers have used applications built on our low-code platform to launch new business lines, automate vital employee workflows, manage complex trading platforms, accelerate drug development and build global procurement systems. With our platform, decision makers can reimagine their products, services, processes and customer interactions by removing much of the complexity and many of the challenges associated with traditional approaches to software development.
In 2016 and 2017, we have generated the majority of our revenue from sales of subscriptions, software and support, which include (1) SaaS subscriptions bundled with maintenance and support and hosting services, and (2) term license subscriptions bundled with maintenance and support. To a lesser extent, we also generate revenue from the sale of perpetual software license agreements and associated maintenance and support agreements.
Our subscription fees are based primarily on the number of users who access and utilize the applications built on our platform. Our customer contract terms vary from one to five years, with an average length of three years, with most providing for payment in advance on an annual, quarterly or monthly basis. Due to the variability of our billing terms and the episodic nature of our customers purchasing additional subscriptions, we do not believe that changes in our deferred revenue in a given period are directly correlated with our revenue growth.
Since inception, we have invested in our professional services organization to help ensure that customers are able to build and deploy applications on our platform. We have several strategic partnerships, including with Deloitte, KPMG and PricewaterhouseCoopers for them to refer customers to us and then to provide professional services directly to the customers using our platform. We intend to further grow our base of strategic partners to provide broader customer coverage and solution delivery capabilities. In addition, over time we expect professional services revenue as a percentage of total revenue to decline as we increasingly rely on strategic partners to help our customers deploy our software. We believe our investment in professional services, including strategic partners building their practices around Appian, will drive increased adoption of our platform.
As of December 31, 2017, we had 356 customers in a wide variety of industries, of which 285 customers were commercial and 71 customers were government or non-commercial entities. Our customers include financial services, healthcare, government, telecommunications, media, energy, manufacturing and transportation organizations. Generally, our sales force targets its efforts to organizations with over 2,000 employees and $2 billion in annual revenue. As of December 31, 2017, 29% of our commercial customers were Global 2000 organizations and included 44 Fortune 500 companies. Revenue from government agencies represented 15.4%, 26.2% and 32.7% of our total revenue in 2017, 2016 and 2015, respectively. No single end-customer accounted for more than 10% of our total revenue in 2017, 2016 or 2015.
Our platform is designed to be natively multi-lingual to facilitate collaboration and address challenges in multi-national organizations. We offer our platform globally. In 2017, 2016 and 2015, 27.0%, 19.5% and 19.9%, respectively, of our total revenue was generated from customers outside of the United States. As of December 31, 2017, we operated in 11 countries. We believe that we have a significant opportunity to grow our international footprint. We are investing in new geographies, including through investment in direct and indirect sales channels, professional services and customer support and implementation partners.
48
We have experienced strong revenue growth, with revenue of $176.7 million, $132.9 million and $111.2 million in 2017, 2016 and 2015, respectively. Our subscription revenue was $82.8 million, $60.0 million and $41.5 million in 2017, 2016 and 2015, respectively.
We have invested in developing our platform, expanding our sales and marketing and research and development capabilities, and providing general and administrative resources to support our growth. We intend to continue to invest in our business to take advantage of our market opportunity. As a result, we incurred net losses of $31.0 million, $12.5 million and $7.0 million in 2017, 2016 and 2015, respectively. We also had operating cash flows of $(9.1) million, $(7.8) million and $(2.1) million in 2017, 2016 and 2015, respectively.
Recent Developments
In November 2017, we completed a secondary offering pursuant to which stockholders sold an aggregate of 4,370,000 shares of Class A common stock at a price of $20.25 per share, including 570,000 shares pursuant to the underwriters' option to purchase additional Class A shares. We did not receive any proceeds from the sale of the shares of our Class A common stock offered in the secondary offering.
Our Business Model
Our business model focuses on maximizing the lifetime value of customer relationships, which is a function of the duration of a customer’s deployment of Appian as well as the price and number of subscriptions of Appian that a customer purchases. The costs we incur with respect to any customer may exceed revenue from that customer in earlier periods because we generally recognize costs associated with customer acquisition faster than we generate and recognize the associated revenue. We incur significant customer acquisition costs, including expenses associated with hiring new sales representatives, who generally take more than one year to become productive given the length of our sales cycle, and marketing costs, all of which are expensed as incurred. Our customer contract terms vary from one to five years, with an average length of three years, with most providing for payment in advance on an annual, quarterly or monthly basis, and we recognize subscription revenue ratably over the term of the subscription period.
At the same time, we believe that the costs we incur to retain customers and drive additional purchases of software are lower than our customer acquisition costs on a relative basis. Over time, we expect a large portion of our customers to renew their subscriptions and purchase additional subscriptions as they continue to build more applications and add more users to our platform. Over the last three completed fiscal years, we had an average subscription renewal rate of 95%. We calculate our subscription renewal rate by dividing (i) the subscription revenue from renewing customers in the current 12-month period that were customers during the entirety of the prior 12-month period, giving effect to price increases but excluding additional subscriptions for additional users, or upsells, by (ii) our subscription revenue from all customers in the corresponding prior 12-month period that were customers during the entirety of such prior 12-month period. For example, to obtain our subscription renewal rate for the 12-month period ended December 31, 2017, we identified the amount of subscription revenue in 2017 from customers that were our customers for all of 2016, and subtracted the amount of upsells to such customers in 2017. We then divided the balance of 2017 subscription revenue from such customers by all subscription revenue generated in 2016 from customers that were customers for the entirety of 2016. With respect to the average for our last three completed fiscal years, we calculated the average of the three applicable 12-month periods. We also expect the proportion of annual revenue from existing customers to grow relative to annual revenue from new customers. We believe this mix shift over time will have a positive impact on our operating margins, as we expect the percentage of revenue spent on sales and marketing to decline.
We measure the effectiveness of our business model by comparing the lifetime value of our customer relationships to our customer acquisition costs. We calculate lifetime customer value as (1) average gross margin multiplied by average subscription and maintenance and support revenue from customers for a given month divided by (2) the average percentage of monthly recurring revenue that did not renew in each month for the previous 12 months. We then divide this calculated lifetime customer value by our customer acquisition cost, which is the total sales and marketing expense incurred during the corresponding month. On a rolling twelve month basis, we estimate that for each of 2017, 2016 and 2015 the average lifetime value of a customer has exceeded 7x the associated average cost of acquiring them.
Key Factors Affecting Our Performance
The following are several key factors that affect our performance:
• | Market Adoption of Our Platform. Our ability to grow our customer base and drive market adoption of our platform is affected by the pace at which organizations digitally transform. We expect that our revenue growth will be primarily driven by the pace of adoption and penetration of our platform. We offer a leading custom software development platform and intend to continue to invest to expand our customer base. The degree to which prospective customers |
49
recognize the need for low-code software that enables organizations to digitally transform, and subsequently allocate budget dollars to purchase our software, will drive our ability to acquire new customers and increase sales to existing customers, which, in turn, will affect our future financial performance.
• | Growth of Our Customer Base. We believe we have a substantial opportunity to grow our customer base. We define a customer as an entity with an active subscription or maintenance and support contract related to a perpetual software license as of the specified measurement date. To the extent we contract with one or more entities under common control, we count those entities as separate customers. We have aggressively invested, and intend to continue to invest, in our sales force in order to drive sales to new customers. In particular, we have recently made, and plan to continue to make, investments to enhance the expertise of our sales and marketing organization within our key industry verticals of financial services, healthcare and government. In addition, we have established relationships with strategic partners who work with organizations undergoing digital transformations. We had a total customer count of 356, 280 and 266 as of December 31, 2017, 2016 and 2015, respectively, which includes customers with active software subscription agreements or with maintenance and support contracts, and our number of customers with active software subscription agreements was 291, 206 and 178 as of December 31, 2017, 2016 and 2015, respectively. As of December 31, 2017, 29% of our commercial customers were Global 2000 organizations and included 44 Fortune 500 companies. Our ability to continue to grow our customer base is dependent, in part, upon our ability to compete within the increasingly competitive markets in which we participate. |
• | Further Penetration of Existing Customers. Our sales force seeks to generate additional revenue from existing customers by adding new users to our platform. Many of our customers begin by building a single application and then grow to build dozens of applications on our platform. Generally, the development of new applications on our platform results in the expansion of our user base within an organization and a corresponding increase in revenue to us because we charge subscription fees on a per-user basis for the significant majority of our customer contracts. As a result of this “land and expand” strategy, we have generated significant additional revenue from our customer base. Our ability to increase sales to existing customers will depend on a number of factors, including the size of our sales force and professional services teams, customers’ level of satisfaction with our platform and professional services, pricing, economic conditions and our customers’ overall spending levels. |
• | Mix of Subscription and Professional Services Revenue. We believe our professional services have driven customer success and facilitated the adoption of our platform by customers. During the initial period of deployment by a customer, we generally provide a greater amount of support in building applications and training than later in the deployment, with a typical engagement extending from two to six months. At the same time, many of our customers have historically purchased subscriptions only for a limited set of their total potential end users. As a result of these factors, the proportion of total revenue for a customer associated with professional services is relatively high during the initial deployment period. Over time, as the need for professional services associated with user deployments decreases and the number of end users increases, we expect the mix of total revenue to shift more toward subscription revenue. In addition, we intend to further grow our base of strategic partners to provide broader customer coverage and solution delivery capabilities. These partners perform professional services with respect to any new service contracts they sign. As we expand the network of strategic partners, we expect the proportion of our total revenue from subscriptions to increase over time relative to professional services. In 2017, 2016 and 2015, 51.8%, 52.6% and 47.8% of our revenue, respectively, was derived from sales of subscriptions, software and support, while the remaining 48.2%, 47.4% and 52.2%, respectively, was derived from the sale of professional services. |
• | Investments in Growth. We have made and plan to continue to make investments for long-term growth, including investment in our platform and infrastructure to continuously maximize the power and simplicity of the platform to meet the evolving needs of our customers and to take advantage of our market opportunity. We intend to continue to increase our investment in sales and marketing, as we further expand our sales teams, increase our marketing activities and grow our international operations. We expect to use a portion of the proceeds from our IPO to fund these growth strategies. |
50
Key Metrics
We monitor the following metrics to help us measure and evaluate the effectiveness of our operations (dollars in thousands):
Year Ended December 31, | |||||||||||
2017 | 2016 | 2015 | |||||||||
Subscription Revenue | $ | 82,771 | $ | 59,993 | $ | 41,497 | |||||
As of December 31, | ||||||||
2017 | 2016 | 2015 | ||||||
Subscription Revenue Retention Rate | 122 | % | 112 | % | 128 | % | ||
Subscription Revenue
Subscription revenue is a portion of our revenue contained in the subscriptions, software and support revenue line of our consolidated statements of operations, and includes (1) software as a service, or SaaS, subscriptions bundled with maintenance and support and hosting services, and (2) term license subscriptions bundled with maintenance and support. As we generally sell our software on a per-user basis, our subscription revenue for any customer is primarily determined by the number of users who access and utilize the applications built on our platform, as well as the price paid. We believe that increasing our subscription revenue is an indicator of the demand for our platform, the pace at which the market for our solutions is growing, the productivity of our sales force and strategic relationships in growing our customer base, and our ability to further penetrate our existing customer base.
Subscription Revenue Retention Rate
A key factor to our success is the renewal and expansion of subscription agreements with our existing customers. We calculate this metric over a set of customers who have been with us for at least one full year. To calculate our subscription revenue retention rate for a particular trailing 12-month period, we first establish the recurring subscription revenue for the previous trailing 12-month period. This effectively represents recurring dollars that we should expect in the current trailing 12-month period from the cohort of customers from the previous trailing 12-month period without any expansion or contraction. We subsequently measure the recurring subscription revenue in the current trailing 12-month period from the cohort of customers from the previous trailing 12-month period. Subscription revenue retention rate is then calculated by dividing the aggregate recurring subscription revenue in the current trailing 12-month period by the previous trailing 12-month period. This calculation includes the impact on our revenue from customer non-renewals, pricing changes and growth in the number of users on our platform. Our subscription revenue retention rate can fluctuate from period to period due to large customer contracts in any given period.
51
Customer Cohort Analysis
We focus on acquiring new customers and growing our relationships with existing customers over time. The chart below illustrates our history of attracting new customers and expanding our revenue from them over time as they realize the benefits of building applications using our software.
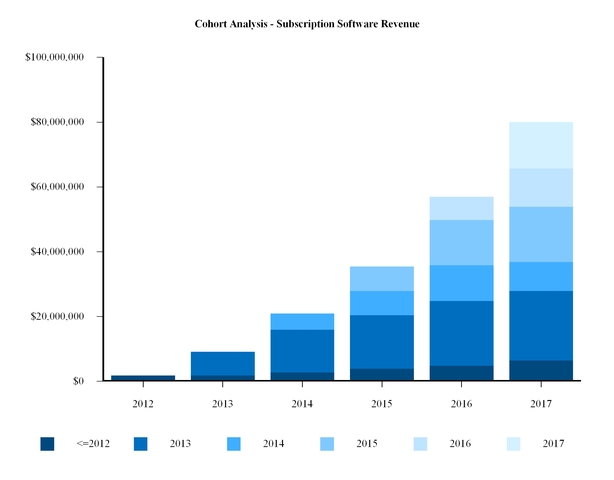
The chart reflects annualized subscription revenue for the group of customers that became our customers in each respective cohort year. For instance, the 2014 cohort includes all customers whose contract start date was between January 1, 2014 and December 31, 2014. Annualized subscription revenue is the total amount of daily subscription revenue for that applicable customer cohort in January of the following year multiplied by 365. We use January revenue data for the cohort of customers who first signed subscription agreements in the preceding year because January is the first month in which we are earning a full month of revenue from all such customers. Building upon this success, we believe a significant opportunity exists for us to acquire new customers as well as expand the use of our platform by increasing the number of users within our current customers' organizations.
Non-GAAP Financial Measures
To supplement our consolidated financial statements, which are prepared and presented in accordance with generally accepted accounting principles in the United States, or GAAP, we provide investors with certain non-GAAP financial measures, including non-GAAP operating loss, non-GAAP net loss, non-GAAP net loss per share and non-GAAP weighted average shares outstanding, which we collectively refer to as non-GAAP financial measures. These non-GAAP financial measures exclude all or a combination of the following (as reflected in the following reconciliation tables): stock-based compensation expense, change in fair value of warrant liability and loss on extinguishment of debt. We define non-GAAP operating loss as operating loss before stock-based compensation expense. We define non-GAAP net loss as net loss before stock-based compensation expense, change in fair value of warrant liability and loss on extinguishment of debt. The presentation of the non-GAAP financial measures is not intended to be considered in isolation or as a substitute for, or superior to, the financial information prepared and presented in accordance with GAAP. We use these non-GAAP financial measures for financial and operational decision-making purposes and as a means to evaluate period-to-period comparisons. We believe that these non-GAAP financial measures provide useful information about our operating results, enhance the overall understanding of past
52
financial performance and future prospects and allow for greater transparency with respect to metrics used by our management in its financial and operational decision making. While our non-GAAP financial measures are an important tool for financial and operational decision making and for evaluating our own operating results over different periods of time, you should review the reconciliation of our non-GAAP financial measures to the comparable GAAP financial measures included below, and not rely on any single financial measure to evaluate our business.
We exclude stock-based compensation expense because of varying available valuation methodologies, subjective assumptions and the variety of equity instruments that can impact our non-cash expense. We believe that providing non-GAAP financial measures that exclude stock-based compensation expense allow for more meaningful comparisons between our operating results from period to period. We exclude the impact of change in the fair value of warrant liability and loss on extinguishment of debt as these costs are unrelated to current operations nor predictive of future results, which we believe allows for a more meaningful comparison between the operating results from period to period. Accordingly, we believe that excluding these expenses provides investors and management with greater visibility into the underlying performance of our business operations, facilitates comparison of our results with other periods and may also provide comparison with the results of other companies in our industry.
Our non-GAAP financial measures may not provide information that is directly comparable to that provided by other companies in our industry, as other companies in our industry may calculate non-GAAP financial results differently, particularly related to non-recurring, unusual items. Non-GAAP financial measures do not have uniform definitions and our definitions will likely differ from the definitions used by other companies, including peer companies. In addition, there are limitations in using non-GAAP financial measures because the non-GAAP financial measures are not prepared in accordance with GAAP, may be different from non-GAAP financial measures used by other companies and exclude expenses that may have a material impact upon our reported financial results. Further, stock-based compensation expense will continue to be for the foreseeable future a significant recurring expense in our business and an important part of the compensation provided to our employees.
The following table reconciles GAAP operating loss to non-GAAP operating loss for the years ended December 31, 2017, 2016 and 2015 (in thousands):
Year Ended December 31, | |||||||||||
2017 | 2016 | 2015 | |||||||||
GAAP operating loss | $ | (31,811 | ) | $ | (11,370 | ) | $ | (4,842 | ) | ||
Add back: | |||||||||||
Stock-based compensation expense | 12,976 | — | — | ||||||||
Non-GAAP operating loss | $ | (18,835 | ) | $ | (11,370 | ) | $ | (4,842 | ) | ||
The following table reconciles GAAP net loss to non-GAAP net loss for the years ended December 31, 2017, 2016 and 2015 (in thousands):
Year Ended December 31, | |||||||||||
2017 | 2016 | 2015 | |||||||||
GAAP net loss | $ | (31,007 | ) | $ | (12,461 | ) | $ | (6,987 | ) | ||
Add back: | |||||||||||
Stock-based compensation expense | 12,976 | — | — | ||||||||
Change in fair value of warrant liability | 341 | 200 | 299 | ||||||||
Loss on extinguishment of debt | 384 | — | — | ||||||||
Non-GAAP net loss | $ | (17,306 | ) | $ | (12,261 | ) | $ | (6,688 | ) | ||
53
The following table sets forth our non-GAAP net loss per share for the years ended December 31, 2017, 2016 and 2015 (in thousands except share and per share data):
Year Ended December 31, | |||||||||||
2017 | 2016 | 2015 | |||||||||
Non-GAAP net loss | $ | (17,306 | ) | $ | (12,261 | ) | $ | (6,688 | ) | ||
Non-GAAP weighted average shares used to compute net loss per share attributable to common stockholders, basic and diluted | 57,043,906 | 52,437,876 | 52,437,876 | ||||||||
Non-GAAP net loss per share, basic and diluted | $ | (0.30 | ) | $ | (0.23 | ) | $ | (0.13 | ) | ||
The following table reconciles GAAP net loss per share to non-GAAP net loss per share for the years ended December 31, 2017, 2016 and 2015:
Year Ended December 31, | |||||||||||
2017 | 2016 | 2015 | |||||||||
GAAP net loss per share attributable to common stockholders, basic and diluted | $ | (0.63 | ) | $ | (0.39 | ) | $ | (0.23 | ) | ||
Add back: | |||||||||||
Non-GAAP adjustments to net loss per share | 0.33 | 0.16 | 0.10 | ||||||||
Non-GAAP net loss per share, basic and diluted | $ | (0.30 | ) | $ | (0.23 | ) | $ | (0.13 | ) | ||
The following table reconciles GAAP weighted average shares outstanding, basic and diluted, to non-GAAP weighted average shares outstanding, basic and diluted, for the years ended December 31, 2017, 2016 and 2015:
Year Ended December 31, | ||||||||
2017 | 2016 | 2015 | ||||||
GAAP weighted average shares used to compute net loss per share attributable to common stockholders, basic and diluted | 49,529,833 | 34,274,718 | 34,274,718 | |||||
Add back: | ||||||||
Additional weighted average shares giving effect to conversion of preferred stock at the beginning of the period | 7,514,073 | 18,163,158 | 18,163,158 | |||||
Non-GAAP weighted average shares used to compute net loss per share, basic and diluted | 57,043,906 | 52,437,876 | 52,437,876 | |||||
Key Components of Results of Operations
Revenue
We generate revenue primarily through sales of subscriptions to our platform, as well as professional services. We generally sell our software on a per-user basis. We generally bill customers and collect payment for subscriptions to our platform in advance on an annual, quarterly or monthly basis. In certain instances, we have had customers pay their entire contract value up front.
Our revenue is comprised of the following:
Subscriptions, Software and Support
Subscriptions, software and support revenue is primarily derived from:
• | SaaS subscriptions bundled with maintenance and support and hosting services; and |
• | on-premises term license subscriptions bundled with maintenance and support. |
To a lesser extent, we also generate revenue from the sale of perpetual software license agreements and associated maintenance and support.
54
Our maintenance and support agreements provide customers with the right to unspecified software upgrades, maintenance releases and patches released during the term of the maintenance and support agreement on a when-and-if-available basis, and rights to technical support. When our platform is deployed within a customer’s own data center or private cloud, it is installed on the customer’s infrastructure and offered as a term or perpetual license. When our platform is delivered as a SaaS subscription, we handle its operational needs in third-party hosted data centers.
Professional Services
Our professional services revenue is comprised of fees for consulting services, including application development and deployment assistance and training related to our platform. Over time, as the need for professional services associated with user deployments decreases and the number of end users increases, we expect the mix of total revenue to shift more toward subscription revenue. We have several strategic partnerships, including with Deloitte, KPMG and PricewaterhouseCoopers. Our agreements with our strategic partners have indefinite terms and may be terminated for convenience by either party. We intend to further grow our base of strategic partners to provide broader customer coverage and solution delivery capabilities. These partners refer software subscription customers to us and perform professional services with respect to any new service contracts they originate, increasing our software subscription revenue without any change to our professional services revenue. As we expand the network of strategic partners, we expect professional services revenue to decline as a percentage of total revenue over time since our strategic partners may perform professional services associated with software subscriptions that we sell.
Cost of Revenue
Subscriptions, Software and Support
Cost of subscriptions, software and support revenue consists primarily of fees paid to our third-party managed hosting providers and other third-party service providers, personnel costs, including payroll and benefits for our technology operations and customer support teams, and allocated facility costs and overhead. We expect cost of revenue to continue to increase in absolute dollars for the foreseeable future as our customer base grows.
Professional Services
Cost of professional services revenue includes all direct and indirect costs to deliver our professional services and training, including employee compensation for our global professional services and training personnel, travel costs, third-party contractor costs and allocated facility costs and overhead. The unpredictability of the timing of entering into significant professional services agreements sold on a standalone basis may cause significant fluctuations in our quarterly financial results.
Gross Margin
Gross profit and gross margin, or gross profit as a percentage of total revenue, has been, and will continue to be, affected by various factors, including the mix of subscription, software and support revenue and professional services revenue. Subscription pricing, the costs associated with third-party hosting facilities, and the extent to which we expand our professional services to support future growth will impact our gross margins. Our gross margin may fluctuate from period to period based on the above factors.
Subscriptions, Software and Support Gross Margin. Subscriptions, software and support gross margin is primarily affected by the growth in our subscriptions, software and support revenue as compared to the growth in, and timing of, costs to support such revenue. We expect to continue to invest in the customer support and SaaS operations to support the growth in the business and the timing of those investments is expected to cause gross margins to fluctuate in the short term but improve over time.
Professional Services Gross Margin. Professional services gross margin is affected by the growth in our professional services revenue as compared to the growth in, and timing of, the cost of our professional services organization as we continue to invest in the growth of our business. Professional services gross margin is also impacted by the ratable recognition of some of our professional services revenue as compared to the recognition of related costs of services in the period incurred, as well as the amount of services performed by subcontractors as opposed to internal resources.
Operating Expenses
Operating expenses consist of sales and marketing, research and development and general and administrative expenses. Salaries, bonuses and other personnel-related costs are the most significant components of each of these expense
55
categories. We grew from 719 employees at December 31, 2016 to 859 employees at December 31, 2017, and we expect to continue to hire new employees in order to support our anticipated revenue growth.
Sales and Marketing Expense
Sales and marketing expense primarily includes personnel costs, including salaries, bonuses, commissions, stock-based compensation and other personnel costs related to sales teams. Additional expenses in this category include travel and entertainment, marketing and promotional events, marketing activities, subcontracting fees and allocated facility costs and overhead.
The number of employees in sales and marketing functions grew from 238 at December 31, 2016 to 307 at December 31, 2017. In order to continue to grow our business, geographical footprint and brand awareness, we expect to continue investing resources in sales and marketing by increasing the number of sales and account management teams. As a result, we expect sales and marketing expense to increase in absolute dollars as we continue to invest to acquire new customers and further expand usage of our platform within our existing customer base.
Research and Development Expense
Research and development expense consists primarily of personnel costs for our employees who develop and enhance our platform, including salaries, bonuses, stock-based compensation and other personnel costs. Also included are non personnel costs such as subcontracting, consulting and professional fees to third party development resources, allocated facility costs, overhead and depreciation and amortization costs.
Our research and development efforts are focused on enhancing the speed and power of our software platform. The number of employees in research and development functions grew from 145 at December 31, 2016 to 192 at December 31, 2017. We expect research and development expenses to continue to increase as they are critical to maintain and improve our quality of applications and our competitive position.
General and Administrative Expense
General and administrative expense consists primarily of personnel costs, including salaries, bonuses, stock-based compensation and other personnel costs for our administrative, legal, information technology, human resources, finance and accounting employees and executives. Additional expenses included in this category are non-personnel costs, such as travel-related expenses, contracting and professional fees, audit fees, tax services and legal fees, as well as insurance and other corporate expenses, along with allocated facility costs and overhead.
The number of employees in general and administrative functions grew from 86 at December 31, 2016 to 98 at December 31, 2017. We expect our general and administrative expense to increase in absolute dollars as we continue to support our growth and as a result of our becoming a public company.
56
Results of Operations
The following table sets forth our consolidated statements of operations data:
Year Ended December 31, | |||||||||||
2017 | 2016 | 2015 | |||||||||
(in thousands) | |||||||||||
Consolidated Statements of Operations Data: | |||||||||||
Revenue: | |||||||||||
Subscriptions, software and support | $ | 91,514 | $ | 69,972 | $ | 53,207 | |||||
Professional services | 85,223 | 62,951 | 57,997 | ||||||||
Total revenue | 176,737 | 132,923 | 111,204 | ||||||||
Cost of revenue(1): | |||||||||||
Subscriptions, software and support | 9,379 | 7,437 | 6,079 | ||||||||
Professional services | 55,218 | 42,686 | 42,402 | ||||||||
Total cost of revenue | 64,597 | 50,123 | 48,481 | ||||||||
Gross profit | 112,140 | 82,800 | 62,723 | ||||||||
Operating expenses(1): | |||||||||||
Sales and marketing | 81,966 | 54,137 | 38,300 | ||||||||
Research and development | 34,835 | 22,994 | 16,750 | ||||||||
General and administrative | 27,150 | 17,039 | 12,515 | ||||||||
Total operating expenses | 143,951 | 94,170 | 67,565 | ||||||||
Operating loss | (31,811 | ) | (11,370 | ) | (4,842 | ) | |||||
Other (income) expense: | |||||||||||
Other (income) expense, net | (2,038 | ) | 1,792 | 1,579 | |||||||
Interest expense | 473 | 982 | 188 | ||||||||
Total other (income) expense | (1,565 | ) | 2,774 | 1,767 | |||||||
Net loss before income taxes | (30,246 | ) | (14,144 | ) | (6,609 | ) | |||||
Income tax expense (benefit) | 761 | (1,683 | ) | 378 | |||||||
Net loss | $ | (31,007 | ) | $ | (12,461 | ) | $ | (6,987 | ) | ||
(1) Includes stock-based compensation expense below. For the years ended December 31, 2016 and 2015, no
stock-based compensation expense was recognized for our stock option awards because a qualifying event had not yet occurred.
Year Ended December 31, | |||||||||||
2017 | 2016 | 2015 | |||||||||
(in thousands) | |||||||||||
Cost of revenue | |||||||||||
Subscriptions, software and support | $ | 575 | $ | — | $ | — | |||||
Professional services | 1,295 | — | — | ||||||||
Operating expenses | |||||||||||
Sales and marketing | 3,233 | — | — | ||||||||
Research and development | 2,822 | — | — | ||||||||
General and administrative | 5,051 | — | — | ||||||||
Total stock-based compensation expense | $ | 12,976 | $ | — | $ | — | |||||
57
The following table sets forth our consolidated statements of operations data expressed as a percentage of total revenue:
Year Ended December 31, | ||||||||
2017 | 2016 | 2015 | ||||||
Consolidated Statements of Operations Data: | ||||||||
Revenue: | ||||||||
Subscriptions, software and support | 51.8 | % | 52.6 | % | 47.8 | % | ||
Professional services | 48.2 | 47.4 | 52.2 | |||||
Total revenue | 100.0 | 100.0 | 100.0 | |||||
Cost of revenue: | ||||||||
Subscriptions, software and support | 5.3 | 5.6 | 5.5 | |||||
Professional services | 31.2 | 32.1 | 38.1 | |||||
Total cost of revenue | 36.5 | 37.7 | 43.6 | |||||
Gross margin | 63.5 | 62.3 | 56.4 | |||||
Operating expenses: | ||||||||
Sales and marketing | 46.4 | 40.7 | 34.4 | |||||
Research and development | 19.7 | 17.3 | 15.1 | |||||
General and administrative | 15.4 | 12.8 | 11.3 | |||||
Total operating expenses | 81.5 | 70.8 | 60.8 | |||||
Operating loss | (18.0 | ) | (8.5 | ) | (4.4 | ) | ||
Other (income) expense: | ||||||||
Other (income) expense, net | (1.2 | ) | 1.3 | 1.4 | ||||
Interest expense | 0.3 | 0.7 | 0.2 | |||||
Total other (income) expense | (0.9 | ) | 2.0 | 1.6 | ||||
Net loss before income taxes | (17.1 | ) | (10.5 | ) | (6.0 | ) | ||
Income tax expense (benefit) | 0.4 | (1.3 | ) | 0.3 | ||||
Net loss | (17.5 | )% | (9.2 | )% | (6.3 | )% | ||
Year Ended December 31, 2017 Compared to the Year Ended December 31, 2016
Revenue
Year Ended December 31, | % Change | |||||||||
2017 | 2016 | |||||||||
(dollars in thousands) | ||||||||||
Revenue | ||||||||||
Subscriptions, software and support | $ | 91,514 | $ | 69,972 | 30.8 | % | ||||
Professional services | 85,223 | 62,951 | 35.4 | |||||||
Total revenue | $ | 176,737 | $ | 132,923 | 33.0 | |||||
Total revenue increased $43.8 million, or 33.0%, in 2017 compared to 2016, due to an increase in our professional services revenue of $22.3 million and an increase in our subscriptions, software and support revenue of $21.5 million. The increase in professional services revenue was due to $9.3 million of additional revenue from existing customers and $13.0 million in sales to new customers. The increase in subscription revenue was attributable to $17.1 million of revenue from expanded deployments and corresponding sales of additional subscriptions to existing customers and $4.4 million in sales of subscriptions to new customers.
58
Cost of Revenue
Year Ended December 31, | % Change | |||||||||
2017 | 2016 | |||||||||
(dollars in thousands) | ||||||||||
Cost of revenue: | ||||||||||
Subscriptions, software and support | $ | 9,379 | $ | 7,437 | 26.1 | % | ||||
Professional services | 55,218 | 42,686 | 29.4 | |||||||
Total cost of revenue | $ | 64,597 | $ | 50,123 | 28.9 | % | ||||
Subscriptions, software and support gross margin | 89.8 | % | 89.4 | % | ||||||
Professional services gross margin | 35.2 | 32.2 | ||||||||
Total gross margin | 63.5 | 62.3 | ||||||||
Cost of revenue increased $14.5 million, or 28.9%, in 2017 compared to 2016, primarily due to a $6.0 million increase in contractor costs, a $5.3 million increase in professional services and product support staff personnel costs, a $2.6 million increase in billable expenses and a $0.7 million increase in other cost of revenue, offset by a $0.1 million decrease in facility and overhead costs. Contractor costs increased in 2017 compared to 2016 because of an increase in the usage of third-party resources for professional service engagements. Personnel costs increased due to $1.9 million in stock-based compensation expense and an increase in the number of experienced professional services employees in 2017. Billable expenses increased because we had more professional services engagements in 2017 as compared to 2016. The increase in other cost of revenue is due to increased hosting costs as sales of our cloud offering increased in 2017. The decrease in facility and overhead costs was due to decreased rent expense.
Gross margin increased to 63.5% in 2017 compared to 62.3% in 2016 due to an increase in the gross margin of our subscriptions, software and support revenue as well as our professional services revenue. Our revenue mix remained relatively constant in 2017 compared to 2016. The gross margin of our professional services revenue in 2016 was negatively impacted by temporarily low utilization of professional services resources as they were being redeployed after the completion of a large engagement in the prior quarter.
Sales and Marketing Expense
Year Ended December 31, | % Change | |||||||||
2017 | 2016 | |||||||||
(dollars in thousands) | ||||||||||
Sales and marketing | $ | 81,966 | $ | 54,137 | 51.4 | % | ||||
% of revenue | 46.4 | % | 40.7 | % | ||||||
Sales and marketing expense increased $27.8 million, or 51.4%, in 2017 compared to 2016, primarily due to a $21.2 million increase in sales and marketing personnel costs, a $3.5 million increase in facility and overhead costs, a $2.8 million increase in marketing costs and a $0.3 million increase in professional fees. Personnel costs increased due to $3.2 million in stock-based compensation expense in 2017, an increase in sales and marketing personnel headcount by 29.0% from December 31, 2016 to December 31, 2017, and increased sales commissions driven by our revenue growth. Facility and overhead costs increased to support our personnel growth. Marketing costs increased due to a rise in marketing event sponsorship and attendance. Professional fees increased due to an increase in consulting fees.
59
Research and Development Expense
Year Ended December 31, | % Change | |||||||||
2017 | 2016 | |||||||||
(dollars in thousands) | ||||||||||
Research and development | $ | 34,835 | $ | 22,994 | 51.5 | % | ||||
% of revenue | 19.7 | % | 17.3 | % | ||||||
Research and development expense increased $11.8 million, or 51.5%, in 2017 compared to 2016, primarily due to a $11.0 million increase in research and development personnel costs and a $0.9 million increase in facility and overhead costs, offset by a $0.1 million decrease in consulting fees. Personnel costs increased due to $2.8 million in stock-based compensation expense in 2017 and an increase in research and development personnel headcount by 32.4% from December 31, 2016 to December 31, 2017.
General and Administrative Expense
Year Ended December 31, | % Change | |||||||||
2017 | 2016 | |||||||||
(dollars in thousands) | ||||||||||
General and administrative expense | $ | 27,150 | $ | 17,039 | 59.3 | % | ||||
% of revenue | 15.4 | % | 12.8 | % | ||||||
General and administrative expense increased $10.1 million, or 59.3%, in 2017 compared to 2016, primarily due to a $7.1 million increase in general and administrative personnel costs, a $1.1 million increase in professional fees, a $1.0 million increase in facility and overhead costs and a $0.9 million increase in legal costs. Personnel costs increased due to $5.1 million in stock-based compensation expense in 2017 and an increase in general and administrative personnel headcount by 14.0% from December 31, 2016 to December 31, 2017 in order to support the additional requirements of being a public company. Professional fees increased due to use of consulting services to assist with the implementation of new software to support our back-office functions as well as costs incurred during the secondary offering in November 2017. Facility and overhead costs increased to support our personnel growth. Legal costs increased due to costs incurred during the secondary offering as well as the settlement of certain legal matters.
Year Ended December 31, 2016 Compared to the Year Ended December 31, 2015
Revenue
Year Ended December 31, | % Change | |||||||||
2016 | 2015 | |||||||||
(dollars in thousands) | ||||||||||
Revenue | ||||||||||
Subscriptions, software and support | $ | 69,972 | $ | 53,207 | 31.5 | % | ||||
Professional services | 62,951 | 57,997 | 8.5 | |||||||
Total revenue | $ | 132,923 | $ | 111,204 | 19.5 | |||||
Total revenue increased $21.7 million, or 19.5%, in 2016 compared to 2015, due to an increase in our subscriptions revenue of $16.8 million and an increase in our professional services revenue of $4.9 million. The increase in subscription revenue was attributable to $11.0 million of revenue from expanded deployments and corresponding sales of additional subscriptions to existing customers and $5.8 million in sales of subscriptions to new customers. The increase in professional services revenue was due to increased application development and deployment assistance demands from our customers.
60
Cost of Revenue
Year Ended December 31, | % Change | |||||||||
2016 | 2015 | |||||||||
(dollars in thousands) | ||||||||||
Cost of revenue: | ||||||||||
Subscriptions, software and support | $ | 7,437 | $ | 6,079 | 22.3 | % | ||||
Professional services | 42,686 | 42,402 | 0.7 | |||||||
Total cost of revenue | $ | 50,123 | $ | 48,481 | 3.4 | |||||
Subscriptions, software and support gross margin | 89.4 | % | 88.6 | % | ||||||
Professional services gross margin | 32.2 | 26.9 | ||||||||
Total gross margin | 62.3 | 56.4 | ||||||||
Cost of revenue increased $1.6 million, or 3.4%, in 2016 compared to 2015, primarily due to a $5.8 million increase in professional services and product support staff personnel costs and a $1.2 million increase in facility and overhead costs, offset by decreases in contractor costs of $5.4 million. Personnel costs increased due to the increase in professional services and customer support staff personnel headcount by 4.6% from the end of 2015 to the end of 2016. Facility and overhead costs increased to support our personnel growth. Contractor costs decreased from 2015 to 2016 as we incurred additional contractor costs in 2015 to support a new customer contract.
Gross margin increased to 62.3% in 2016 compared to 56.4% in 2015, due primarily to an increase in the gross margin for our professional services. During 2015, we incurred increased contractor costs to support a new customer contract. Professional services gross margin increased in 2016 due to a reduction in our contractor costs of $5.4 million as compared to 2015 as we continued to hire additional internal professional services personnel.
Sales and Marketing Expense
Year Ended December 31, | % Change | |||||||||
2016 | 2015 | |||||||||
(dollars in thousands) | ||||||||||
Sales and marketing | $ | 54,137 | $ | 38,300 | 41.3 | % | ||||
% of revenue | 40.7 | % | 34.4 | % | ||||||
Sales and marketing expense increased $15.8 million, or 41.3%, in 2016 compared to 2015, primarily due to a $9.8 million increase in sales and marketing personnel costs, a $3.3 million increase in facility and overhead costs, and $2.3 million increase in marketing costs. Personnel costs increased due to the increase in sales and marketing personnel headcount by 46.0% from the end of 2015 to the end of 2016 and increased sales commissions driven by our revenue growth. Facility and overhead costs increased to support our personnel growth. Marketing costs increased due to a rise in marketing event sponsorship and attendance.
Research and Development Expense
Year Ended December 31, | % Change | |||||||||
2016 | 2015 | |||||||||
(dollars in thousands) | ||||||||||
Research and development | $ | 22,994 | $ | 16,750 | 37.3 | % | ||||
% of revenue | 17.3 | % | 15.1 | % | ||||||
Research and development expense increased $6.2 million, or 37.3%, in 2016 compared to 2015, primarily due to a $4.7 million increase in research and development personnel costs and a $1.4 million increase in facility and overhead costs. Personnel costs increased due to the increase in research and development personnel headcount by 41.7% from the end of 2015 to the end of 2016. Facility and overhead costs increased to support our personnel growth.
61
General and Administrative Expense
Year Ended December 31, | % Change | |||||||||
2016 | 2015 | |||||||||
(dollars in thousands) | ||||||||||
General and administrative expense | $ | 17,039 | $ | 12,515 | 36.1 | % | ||||
% of revenue | 12.8 | % | 11.3 | % | ||||||
General and administrative expense increased $4.5 million, or 36.1%, in 2016 compared to 2015, primarily due to a $2.5 million increase in general and administrative personnel costs, a $1.1 million increase in facility and overhead costs, and $0.9 million in increased professional services costs. Personnel costs increased due to the increase in general and administrative personnel headcount by 32.3% from the end of 2015 to the end of 2016. Facility and overhead costs as well as contractor costs increased to support our personnel growth.
Seasonality
We have historically experienced seasonality in terms of when we enter into agreements with customers. We typically enter into a significantly higher percentage of agreements with new customers, as well as renewal agreements with existing customers, in the fourth quarter and, to a lesser extent, the second quarter. The increase in customer agreements for the fourth quarter is attributable to large enterprise account buying patterns typical in the software industry. Furthermore, we usually enter into a significant portion of agreements with customers during the last month, and often the last two weeks, of each quarter. However, we recognize substantially all of our revenue ratably over the terms of our subscription agreements, which generally occurs over a one to five-year period. As a result, a substantial portion of the revenue that we report in each period will be derived from the recognition of deferred revenue relating to agreements entered into during previous periods. Consequently, a decline in new sales or renewals in any one period may not be immediately reflected in our revenue results for that period. This decline, however, will negatively affect our revenue in future periods. Accordingly, the effect of significant downturns in sales and market acceptance of our platform and potential changes in our rate of renewals may not be fully reflected in our results of operations until future periods.
Backlog
Backlog represents future amounts to be invoiced and recognized under subscription agreements. As of December 31, 2017 and 2016, we had backlog of approximately $214 million and $167 million, respectively. Approximately 58% of our backlog as of December 31, 2017 is not expected to be filled in 2018.
We expect that the amount of backlog relative to the total value of our contracts will change from quarter to quarter and year to year for several reasons, including the specific timing and duration of large customer subscription agreements, the specific timing of customer renewals, changes in customer financial circumstances and foreign currency fluctuations.
We often sign multiple-year subscription agreements, the length in years of which may vary widely. Backlog may vary based on changes in the average non-cancellable term of subscription agreements. The change in backlog that results from changes in the average non-cancellable term of subscription agreements may not be an indicator of the likelihood of renewal or expected future revenue. Accordingly, we believe that fluctuations in backlog are not a reliable indicator of future revenue, and we do not utilize backlog as a key management metric internally.
Liquidity and Capital Resources
As of December 31, 2017, we had $73.8 million of cash and cash equivalents. On May 31, 2017, we closed our IPO of 7,187,500 shares of our Class A common stock at an offering price of $12.00 per share, including 937,500 shares pursuant to the underwriters’ option to purchase additional Class A shares, resulting in net proceeds to us of $77.8 million, after deducting underwriting discounts and commissions of $6.0 million and offering expenses of $2.4 million.
We believe that our existing cash and cash equivalents, together with any positive cash flows from operations and available borrowings under our line of credit, will be sufficient to support working capital and capital expenditure requirements for at least the next 12 months. Our future capital requirements will depend on many factors, including our growth rate, the timing and extent of spending to support research and development efforts, the expansion of sales and marketing activities, particularly internationally, and the introduction of new and enhanced products and functions, platform enhancements and professional services offerings and the level of market acceptance of our applications. In the event that additional financing is
62
required from outside sources, we may be unable to raise the funds on acceptable terms, if at all. To the extent existing cash and cash equivalents and investments and cash from operations are not sufficient to fund future activities, we may need to raise additional funds. We may seek to raise additional funds through equity, equity-linked or debt financings. If we raise additional funds through the incurrence of indebtedness, such indebtedness may have rights that are senior to holders of our equity securities and could contain covenants that restrict operations. Any additional equity financing may be dilutive to our existing stockholders. Although we are not currently a party to any agreement or letter of intent with respect to potential investments in, or acquisitions of, complementary businesses, services or technologies, we may enter into these types of arrangements in the future, which could also require us to seek additional equity financing, incur indebtedness, or use cash resources. We have no present understandings, commitments or agreements to enter into any such acquisitions. If we are unable to raise additional capital when desired, our business, operating results and financial condition could be adversely affected.
The following table shows a summary of our cash flows for the years ended December 31, 2017, 2016 and 2015:
Year Ended December 31, | |||||||||||
2017 | 2016 | 2015 | |||||||||
(in thousands) | |||||||||||
Cash used in operating activities | $ | (9,128 | ) | $ | (7,756 | ) | $ | (2,145 | ) | ||
Cash used in investing activities | (433 | ) | (984 | ) | (524 | ) | |||||
Cash provided by financing activities | 50,948 | 10,000 | 10,000 | ||||||||
Sources of Funds
We have financed our operations in large part with equity and debt financing arrangements, including net proceeds of $10.0 million from the sale of shares of preferred stock over a period of several years prior to our IPO and the net proceeds from our IPO, as well as through sales of software and professional services and borrowings under our credit facilities.
2015 Line of Credit
At December 31, 2015, we had a $10.0 million revolving line of credit with a lender, expiring in June 2016, which was subsequently amended in June 2016 to extend the maturity date through June 2017, and which was terminated in April 2017. The amount of borrowing available under the credit facility at any time could not exceed 80% of eligible accounts receivable at such time and any amounts borrowed were collateralized by substantially all of our assets. Amounts drawn on the revolving line of credit accrued interest at a floating rate of prime plus 0.75%. The agreement contained certain affirmative covenants related to the timely delivery of financial information to the lender and maintaining a liquidity ratio of at least 1.25 to 1, as well as certain customary negative covenants.
2015 Term Loan
In March 2015, we entered into a collateralized $10.0 million term loan facility with a lender, maturing in March 2019 and borrowed the full amount under the term loan facility in June 2015. In January 2016, we paid off the outstanding balance of the term loan and simultaneously entered into a $20.0 million term loan facility with the lender, maturing in January 2020. We borrowed the full amount under the term loan facility in January 2016, which we repaid in full in April 2017.
Interest on the term loan borrowings accrued at a floating rate equal to the prime rate plus 1.25%. Initially, the first 12 months were to require interest-only payments followed by 36 months of monthly amortization payments. In contemplation of the new financing facility described below, the interest-only period was extended until the new financing facility was finalized. We were permitted to pay off the entire term loan at any time by paying all outstanding principal, accrued interest, and a prepayment fee of 1% of the amount advanced through month 12, 0.5% during months 13 through 24 and no prepayment fee thereafter. The term loan included a financial covenant related to our short-term liquidity.
2017 Financing Facility
In April 2017, we entered into a new financing facility consisting of a $5.0 million senior revolving credit facility, a $20.0 million senior term loan and a $10.0 million subordinated term loan. In connection with the execution of this financing facility, the prior line of credit was terminated, and we borrowed the full $20.0 million available under the senior term loan and repaid the outstanding balance under our prior term loan. Additionally, in connection with the execution of our new financing facility, the lender waived the prepayment fee associated with our prior line of credit.
63
Amounts drawn on the senior revolving credit facility bore interest at a floating rate equal to the prime rate plus 0.75%. The facility matured in April 2019, contained covenants related to our short-term liquidity and was collateralized by all of our assets.
Borrowings under the senior term loan bore interest at a floating rate equal to the prime rate plus 1.25%. Borrowings were required to be repaid over 48 months, consisting of 12 months of interest-only payments followed by 36 months of principal and interest payments. We could pay off the entire senior term loan at any time by paying all outstanding principal, accrued interest, and a prepayment fee of 2% of the amount borrowed if repaid through month 12, 1% of the amount borrowed if repaid during months 13 through 24 and no prepayment fee if repaid thereafter. The senior term loan included a financial covenant related to our short-term liquidity and was collateralized by all of our assets.
Borrowings under the subordinated term loan bore interest at an initial rate of 11%, which increased by 1% upon each anniversary of the closing date of the financing facility. The facility matured in April 2020. Interest-only payments were required through maturity, and the principal balance was due upon maturity. We were able to borrow amounts under the subordinated term loan within the first 12 months after closing. We could pay off the entire subordinated term loan at any time by paying all outstanding principal, accrued interest, and a final payment fee of 5% of the amount borrowed if repaid through month 12, 6% of the amount borrowed if repaid during months 13 through 24 and 7% of the amount borrowed if repaid thereafter. The subordinated term loan also carried an unused facility fee of 1.5% of the unused portion of the subordinated term loan, which was payable quarterly. The subordinated term loan included a financial covenant related to our recurring revenue and was collateralized by all of our assets.
In June 2017, we used proceeds from our IPO to pay all remaining outstanding principal and interest under the senior term loan and subsequently terminated the senior term loan and subordinated term loan. This financing facility was terminated in November 2017 in connection with our entry into a new $20.0 million revolving line of credit.
2017 Line of Credit
In November 2017, we entered into a $20.0 million revolving line of credit with a lender. The facility matures in November 2022. We may elect whether amounts drawn on the revolving line of credit bear interest at a floating rate per annum equal to either the LIBOR or the prime rate plus an additional interest rate margin that is determined by the availability of borrowings under the revolving line of credit. The additional interest rate margin will range from 2.00% to 2.50% in the case of LIBOR advances and from 1.00% to 1.50% in the case of prime rate advances. The revolving line of credit contains an unused facility fee in an amount between 0.15% and 0.25% of the average unused portion of the revolving line of credit, which is payable quarterly. The agreement contains certain customary affirmative and negative covenants and requires us to maintain (i) an adjusted quick ratio of at least 1.35 to 1.0 and (ii) minimum adjusted EBITDA, in the amounts and for the periods set forth in the agreement. Any amounts borrowed under the credit facility are collateralized by substantially all of our assets. We were in compliance with all covenants as of December 31, 2017. As of December 31, 2017, we had not made any borrowings under this new revolving line of credit and we had outstanding letters of credit totaling $1.1 million under the 2017 line of credit in connection with securing our leased office space.
Use of Funds
Our principal uses of cash are funding operations and other working capital requirements. Over the past several years, revenue has increased significantly from year to year and, as a result, cash flows from customer collections have increased. However, operating expenses have also increased as we have invested in growing our business. Our operating cash requirements may increase in the future as we continue to invest in the strategic growth of our company.
Historical Cash Flows
Operating Activities
For the year ended December 31, 2017, net cash used in operating activities of $9.1 million consisted of a net loss of $31.0 million, offset by $14.4 million in adjustments for non-cash items and $7.5 million of cash provided by changes in working capital. Adjustments for non-cash items consisted of stock-based compensation of $13.0 million, depreciation and amortization expense of $0.9 million, loss on extinguishment of debt of $0.4 million and fair value adjustment for the warrant liability of $0.3 million, offset by a provision for deferred income taxes of $0.2 million. The increase in cash and cash equivalents resulting from changes in working capital primarily consisted of an increase in deferred revenue of $18.3 million, as a result of increased subscription sales, a $4.1 million increase in accounts payable and accrued expenses and a $2.4 million increase in accrued compensation and related benefits, primarily due to the timing of year-end bonus payments. This increase
64
was partially offset by a $9.7 million increase in accounts receivable, primarily due to the timing of billings, a $4.2 million increase in prepaid expenses and other assets and a $3.5 million increase in deferred commissions due to increased sales.
For the year ended December 31, 2016, net cash used in operating activities of $7.8 million consisted of a net loss of $12.5 million and $0.2 million in adjustments for non-cash items, partially offset by $4.9 million of cash provided by changes in working capital. Adjustments for non-cash items primarily consisted of a provision for deferred income taxes of $1.1 million, partially offset by depreciation and amortization expense of $0.8 million and a fair value adjustment for our warrant liability of $0.2 million. The increase in cash and cash equivalents resulting from changes in working capital primarily consisted of an increase in deferred revenue of $17.4 million as a result of increased subscription sales and a $3.7 million increase in accrued compensation and related benefits as a result of our increasing headcount. These increases were partially offset by an $11.2 million increase in accounts receivable, primarily due to the timing of billings and a higher level of sales, and a $5.3 million increase in deferred commissions.
For the year ended December 31, 2015, net cash used in operating activities of $2.1 million consisted of a net loss of $7.0 million, partially offset by $4.1 million of cash provided by changes in working capital and $0.8 million in adjustments for non-cash items. Adjustments for non-cash items primarily consisted of depreciation and amortization expense of $0.8 million and a fair value adjustment for our warrant liability of $0.3 million, partially offset by a provision for deferred income taxes of $0.3 million. The increase in cash and cash equivalents resulting from changes in working capital primarily consisted of an increase in deferred revenue of $15.5 million as a result of increased subscription sales, partially offset by a $6.6 million increase in accounts receivable, primarily due to the timing of billings and a higher level of sales, and a $4.0 million increase in deferred commissions.
Investing Activities
For the years ended December 31, 2017, 2016 and 2015, net cash used in investing activities was $0.4 million, $1.0 million and $0.5 million, respectively, for the purchase of property and equipment.
Financing Activities
For the year ended December 31, 2017, net cash provided by financing activities was $50.9 million, consisting of $80.2 million in proceeds from our IPO, net of underwriting discounts, $19.6 million in proceeds from the issuance of long-term debt, net of issuance costs and $1.1 million in proceeds received from stock option exercises. These increases were offset by the repayment of $40.0 million of long-term debt, a $7.6 million dividend payment to the Series A preferred stockholders and the payment of deferred IPO costs of $2.4 million.
For the year ended December 31, 2016, net cash provided by financing activities was $10.0 million, consisting of $20.0 million in net borrowings under our term loan, partially offset by $10.0 million in repayments of debt.
For the year ended December 31, 2015, net cash provided by financing activities was $10.0 million, consisting of $10.0 million in net borrowings under our term loan.
Contractual Obligations and Commitments
The following table summarizes our commitments to settle contractual obligations as of December 31, 2017:
Payments Due By Period | |||||||||||||||||||
Total | Less than 1 Year | 1 to 3 Years | 3 to 5 Years | More than 5 Years | |||||||||||||||
(in thousands) | |||||||||||||||||||
Operating lease commitments | $ | 25,165 | $ | 8,127 | $ | 13,109 | $ | 2,883 | $ | 1,046 | |||||||||
Purchase obligations(1) | 1,650 | 330 | 660 | 660 | — | ||||||||||||||
Total contractual obligations | 26,815 | 8,457 | 13,769 | 3,543 | 1,046 | ||||||||||||||
(1) We have annual royalty fees of $0.3 million for a non-cancellable agreement for the use of technology that is integral in
the development of our software. No amounts were included in the "More than 5 Years" column as this agreement is perpetual and will be required as long as we continue to use the technology.
65
The commitment amounts in the table above are associated with contracts that are enforceable and legally binding and that specify all significant terms, including fixed or minimum services to be used, fixed, minimum or variable price provisions, and the approximate timing of the actions under the contracts. The table does not include obligations under agreements that we can cancel without a significant penalty. As of December 31, 2017, we had not made any borrowings under our $20.0 million revolving line of credit.
Off-Balance Sheet Arrangements
During the year ended December 31, 2017, we did not have any relationships with unconsolidated entities or financial partnerships, including entities sometimes referred to as structured finance or special purpose entities that were established for the purpose of facilitating off-balance sheet arrangements or other contractually narrow or limited purposes. We do not engage in off-balance sheet financing arrangements. In addition, we do not engage in trading activities involving non-exchange traded contracts. We therefore believe that we are not materially exposed to any financing, liquidity, market or credit risk that could arise if we had engaged in these relationships.
Critical Accounting Policies and Estimates
We believe that the following accounting policies involve a high degree of judgment and complexity. Accordingly, these are the policies we believe are the most critical to aid in fully understanding and evaluating our consolidated financial condition and results of our operations. See Note 2 to our consolidated financial statements appearing elsewhere in this Annual Report on Form 10-K for a description of our other significant accounting policies. The preparation of our consolidated financial statements in conformity with accounting principles generally accepted in the U.S. requires us to make estimates and judgments that affect the amounts reported in those financial statements and accompanying notes. Although we believe that the estimates we use are reasonable, due to the inherent uncertainty involved in making those estimates, actual results reported in future periods could differ from those estimates.
Significant estimates embedded in the consolidated financial statements for the period presented include revenue recognition, stock-based compensation and income taxes.
Revenue Recognition
We generate revenue primarily through sales of subscriptions to our platform, as well as professional services. We recognize revenue when all of the following conditions are met: (1) there is persuasive evidence of an arrangement; (2) the service or product has been provided to the customer; (3) the amount of fees to be paid by the customer is fixed or determinable; and (4) the collection of related fees is reasonably assured. If collection is not reasonably assured, we defer revenue recognition until collectability becomes reasonably assured. Our arrangements do not contain general rights of return.
Subscriptions, Software and Support Revenue
Subscriptions, software and support revenue is primarily related to (1) SaaS subscriptions bundled with maintenance and support and hosting services and (2) term license subscriptions bundled with maintenance and support. To a lesser extent, we also generate revenue from the sale of perpetual software licenses and associated maintenance and support.
Historically, we licensed our software primarily under perpetual licenses, but over time we transitioned from perpetual licenses to subscriptions. As a result, revenue from our perpetual software licenses was less than 1.0% of our total revenue for 2017 and 2016, respectively, and 1.9% of our total revenue in 2015.
We generally sell our software on a per-user basis. We bill customers and collect payment for subscriptions to our platform in advance on an annual, quarterly or monthly basis. In certain instances, we have had customers pay their entire contract up front.
SaaS Subscriptions
Our SaaS subscription revenue is derived from customers accessing our cloud offering pursuant to contracts that are generally one to five years in length. We perform all required maintenance and support for our cloud offering and we do not separately charge customers for hosting costs. In these arrangements, our customers do not have the right to take the software on-premises and, as a result, such arrangements are not accounted for within the scope of the software revenue guidance. Revenue from SaaS subscriptions is recognized ratably over the term of the subscription, beginning with the date our service is made available to our customer.
66
Term License Subscriptions
Our term license subscription revenue is derived from customers with on-premises installations of our platform pursuant to contracts that are generally one to five years in length. Customers with term license subscriptions have the right to use our software and receive maintenance and support. Since we do not sell maintenance and support separately from the subscription, revenue for the term license subscription and maintenance and support is recognized ratably over the term of the subscription, upon delivery of the platform to the customer when sold on a standalone basis.
Professional Services
Our professional services revenue is comprised of fees for consulting services, including application development and deployment assistance and training related to our platform. Our professional services are not essential to the functionality of our platform because the platform is ready for the customer’s use immediately upon delivery and is not modified or customized in any manner.
Consulting services are billed under both time-and-material and fixed-fee arrangements. For standalone time-and-material contracts, we recognize revenue at contractually agreed upon billing rates applied to hours performed. For standalone fixed-fee contracts, we also recognize revenue as the work is performed using the proportional performance method of accounting. Training revenue is recognized when the associated training services are delivered. Training is also sold in the form of a subscription arrangement where a customer agrees to pay an annual fixed fee for a fixed number of users to have access to all of our training offerings during the year. Revenue from training subscription agreements is recognized ratably over the subscription period.
We defer recognition of revenue from work performed on pending contract modifications until the period in which the modifications are accepted and funding is approved by the customer. Costs of work performed on pending contract modifications are expensed as incurred.
Multiple Element Arrangements
Our multiple element arrangements are from SaaS subscriptions and term license subscriptions that are generally sold in combination with maintenance and support service and frequently with professional services.
SaaS Subscriptions
For multiple element arrangements involving SaaS subscriptions that include professional services in addition to the subscription to our platform, we evaluate each element to determine whether it represents a separate unit of accounting. Because there are third-party vendors who routinely sell and provide the same professional services to our customers, our professional services are deemed to have standalone value apart from the SaaS subscription. Additionally, we offer both SaaS subscriptions and professional services on a standalone basis. Professional services revenue is therefore accounted for separately from subscription fees and recognized as the professional services are performed. We allocate revenue to the elements based on the selling price hierarchy using vendor-specific objective evidence, or VSOE, of selling price, third-party evidence, or TPE, of selling price, or if neither exists, best estimated selling price, or BESP. In cases where we do not have VSOE or TPE of the elements of our arrangements, we use BESP to allocate revenue. We determine BESP for a service by considering multiple factors including, but not limited to, evaluating the weighted average of actual sales prices and other factors such as gross margin objectives, pricing practices and growth strategy. Pricing practices taken into consideration include historic contractually stated prices, volume discounts where applicable and our price lists. While we believe we can make reliable estimates regarding these matters, these estimates are inherently subjective. Once the revenue is allocated to these elements, revenue is recognized as such services are provided.
Term License Subscriptions
For multiple element arrangements involving term license subscriptions, maintenance and support and professional services, we do not have VSOE of fair value for the maintenance and support. Our term license subscriptions are generally not sold on a standalone basis, and therefore, we have not established VSOE of fair value for the subscriptions. Consequently, for our bundled arrangements that include certain professional services, there are two undelivered elements for which VSOE of fair value has not been established and, therefore, we utilize the combined services approach and defer all revenue until the software has been delivered and the provision of all services has commenced. We then recognize the entire fee from the arrangement ratably over the remaining period of the arrangement, assuming all other software revenue recognition criteria have been met.
Deferred Commissions
Deferred commissions are the incremental costs that are directly associated with subscription agreements with customers and consist of sales commissions paid to our direct sales force. Commissions are considered direct and incremental and as such
67
are deferred and amortized over the terms of the related customer contracts consistent with the related revenue. As of December 31, 2017 and 2016, we had total deferred commissions of $21.5 million and $18.0 million, respectively. Commission expense was $11.8 million, $6.5 million and $4.6 million for the years ended December 31, 2017, 2016 and 2015, respectively.
Stock-Based Compensation
We measure and recognize compensation expense for all stock options and restricted stock units, or RSUs, based on the estimated fair value of the award on the grant date. The fair value is recognized as expense over the requisite service period, which is generally the vesting period of the respective award, on a straight-line basis when the only condition to vesting is continued service. For performance-based awards, stock-based compensation expense is recognized using the accelerated attribution method, based on the probability of satisfying the performance condition. For awards that contain market conditions, compensation expense is measured using a Monte Carlo simulation model and recognized using the accelerated attribution method over the derived service period based on the expected market performance as of the grant date. We account for forfeitures as they occur, rather than estimating expected forfeitures.
We estimate the fair value of stock options using the Black-Scholes option pricing model, which requires the use of subjective assumptions, including the expected term of the option, the current price of the underlying stock, the expected stock price volatility, expected dividend yield and the risk-free interest rate for the expected term of the option. The expected term represents the period of time the stock options are expected to be outstanding. Due to the lack of sufficient historical exercise data to provide a reasonable basis upon which to otherwise estimate the expected term of the stock options, we use the simplified method to estimate the expected term for its stock options. Under the simplified method, the expected term of an option is presumed to be the mid-point between the vesting date and the end of the contractual term. Expected volatility is based on historical volatilities for publicly traded stock of comparable companies over the estimated expected term of the stock options. We assume no dividend yield because dividends on our common stock are not expected to be paid in the near future, which is consistent with our history of not paying dividends on our common stock.
The fair value of RSUs is based on the closing market price of our common stock on the Nasdaq Global Market on the date of grant.
We will continue to use judgment in evaluating the assumptions related to our stock-based compensation on a prospective basis. As we continue to accumulate additional data related to our common stock, we may have refinements to our estimates, which could materially impact our future stock-based compensation expense.
Prior to our IPO in May 2017, we were a private company with no active public market for our common stock. Therefore, in response to Section 409A of the Internal Revenue Code of 1986, as amended, related regulations issued by the Internal Revenue Service and accounting standards related to stock-based compensation, we periodically determined for financial reporting purposes the estimated per share fair value of our common stock at various dates using contemporaneous valuations performed in accordance with the guidance outlined in the American Institute of Certified Public Accountants Practice Aid, “Valuation of Privately-Held Company Equity Securities Issued as Compensation.”
Following our IPO, we established a policy of using the closing sale price per share of our Class A common stock as quoted on the Nasdaq Global Market on the date of grant for purposes of determining the exercise price per share of our options to purchase common stock.
Income Taxes
We use the asset and liability method of accounting for income taxes in which deferred tax assets and liabilities are recognized for the future tax consequences attributable to differences between the consolidated financial statement carrying amounts of existing assets and liabilities and their respective tax bases. We measure deferred tax assets and liabilities using enacted tax rates expected to apply to taxable income in the years in which those temporary differences are expected to be reversed. We recognize the effect on deferred tax assets and liabilities of a change in tax rates as income and expense in the period that includes the enactment date. A valuation allowance is established if it is more likely than not that all or a portion of the deferred tax asset will not be realized.
Our tax positions are subject to income tax audits by multiple tax jurisdictions throughout the world. We recognize the tax benefit of an uncertain tax position only if it is more likely than not the position is sustainable upon examination by the taxing authority. We measure the tax benefit recognized as the largest amount of benefit which is more likely than not to be realized upon settlement with the taxing authority. We recognize penalties and interest related to unrecognized tax benefits as income tax expense.
68
We calculate the current and deferred income tax provision based on estimates and assumptions that could differ from the actual results reflected in income tax returns filed in subsequent years and record adjustments based on filed income tax returns when identified. The amount of income taxes paid is subject to examination by U.S. federal, state and foreign tax authorities. The estimate of the potential outcome of any uncertain tax issue is subject to our assessment of relevant risks, facts and circumstances existing at that time. To the extent the assessment of such tax position changes, we record the change in estimate in the period in which we make that determination.
On December 22, 2017, the TCJA was enacted, substantially changing the U.S. federal tax system. Notable provisions of the TCJA include the reduction of the corporate tax rate from 35% to 21% beginning in 2018, the imposition of a one-time transition tax on unremitted cumulative non-U.S. earnings of foreign subsidiaries, and the implementation of a territorial tax system. While the changes from the TCJA are generally effective beginning in 2018, U.S. GAAP accounting for income taxes requires the effect of a change in tax laws or rates to be recognized in income from continuing operations for the period that includes the enactment date. Due to the complexities involved in accounting for the enactment of the TCJA, SAB No. 118 allows us to record provisional amounts in earnings for the year ending December 31, 2017. Where reasonable estimates can be made, the provisional accounting should be based on such estimates. When no reasonable estimate can be made, the provisional accounting may be based on the tax law in effect before the TCJA. We are required to complete our tax accounting for the TCJA in the period when it has obtained, prepared, and analyzed the information to complete the income tax accounting.
We have not completed our accounting for the tax effects of enactment of the TCJA; however, we have made reasonable estimates of the effects of the TCJA on our financial statements which are included as a component of income tax expense.
Recent Accounting Pronouncements
See Note 2 of our consolidated financial statements for information related to recently issued accounting standards.
JOBS Act Transition Period
In April 2012, the Jumpstart Our Business Startups Act of 2012, or the JOBS Act, was enacted. Section 107(b) of the JOBS Act provides that an emerging growth company can take advantage of an extended transition period for complying with new or revised accounting standards. Thus, an emerging growth company can delay the adoption of certain accounting standards until those standards would otherwise apply to private companies. We have elected to take advantage of the extended transition period to comply with new or revised accounting standards and to adopt certain of the reduced disclosure requirements available to emerging growth companies. As a result of the accounting standards election, we will not be subject to the same implementation timing for new or revised accounting standards as other public companies that are not emerging growth companies which may make comparison of our financials to those of other public companies more difficult.
Item 7A. Quantitative and Qualitative Disclosures About Market Risk.
We are exposed to market risks in the ordinary course of our business. Market risk represents the risk of loss that may impact our financial position due to adverse changes in financial market prices and rates. Our market risk exposure is primarily the result of fluctuations in interest rates and foreign currency exchange rates.
Interest Rate Risk
We had cash and cash equivalents of $73.8 million as of December 31, 2017, which consisted of cash in readily available checking accounts and overnight repurchase investments. These securities are not dependent on interest rate fluctuations that may cause the principal amount of these assets to fluctuate.
At December 31, 2017, we had no outstanding borrowings.
Foreign Currency Exchange Risk
Our reporting currency is the U.S. dollar. Due to our international operations, we have foreign currency risks related to revenue and operating expenses denominated in currencies other than the U.S. dollar, primarily the British Pound Sterling, Euro, Australian Dollar and Swiss Franc. Our sales contracts are primarily denominated in the local currency of the customer making the purchase. In addition, a portion of operating expenses are incurred outside the United States and are denominated in foreign currencies. Decreases in the relative value of the U.S. dollar to other currencies may negatively affect revenue and other
69
operating results as expressed in U.S. dollars. We do not believe that an immediate 10% increase or decrease in the relative value of the U.S. dollar to other currencies would have a material effect on operating results.
We have experienced and will continue to experience fluctuations in net loss as a result of transaction gains or losses related to remeasuring certain current asset and current liability balances that are denominated in currencies other than the functional currency of the entities in which they are recorded. We have not engaged in the hedging of foreign currency transactions to date, although we may choose to do so in the future.
70
Item 8. Financial Statements and Supplementary Data.
INDEX TO CONSOLIDATED FINANCIAL STATEMENTS
Consolidated Financial Statements: | |
71
Report of Independent Registered Public Accounting Firm
The Board of Directors and Stockholders
Appian Corporation
Reston, Virginia
Opinion on the Consolidated Financial Statements
We have audited the accompanying consolidated balance sheets of Appian Corporation and its subsidiaries (the “Company”) as of December 31, 2017 and 2016, the related consolidated statements of operations, comprehensive loss, changes in stockholders’ equity (deficit), and cash flows for each of the three years in the period ended December 31, 2017, and the related notes (collectively referred to as the “consolidated financial statements”). In our opinion, the consolidated financial statements present fairly, in all material respects, the financial position of the Company and subsidiaries at December 31, 2017 and 2016, and the results of their operations and their cash flows for each of the three years in the period ended December 31, 2017, in conformity with accounting principles generally accepted in the United States of America.
Basis for Opinion
These consolidated financial statements are the responsibility of the Company’s management. Our responsibility is to express an opinion on the Company’s consolidated financial statements based on our audits. We are a public accounting firm registered with the Public Company Accounting Oversight Board (United States) (“PCAOB”) and are required to be independent with respect to the Company in accordance with the U.S. federal securities laws and the applicable rules and regulations of the Securities and Exchange Commission and the PCAOB.
We conducted our audits in accordance with the standards of the PCAOB. Those standards require that we plan and perform the audit to obtain reasonable assurance about whether the consolidated financial statements are free of material misstatement, whether due to error or fraud. The Company is not required to have, nor were we engaged to perform, an audit of its internal control over financial reporting. As part of our audits we are required to obtain an understanding of internal control over financial reporting but not for the purpose of expressing an opinion on the effectiveness of the Company’s internal control over financial reporting. Accordingly, we express no such opinion.
Our audits included performing procedures to assess the risks of material misstatement of the consolidated financial statements, whether due to error or fraud, and performing procedures that respond to those risks. Such procedures included examining, on a test basis, evidence regarding the amounts and disclosures in the consolidated financial statements. Our audits also included evaluating the accounting principles used and significant estimates made by management, as well as evaluating the overall presentation of the consolidated financial statements. We believe that our audits provide a reasonable basis for our opinion.
/s/ BDO USA, LLP
We have served as the Company's auditor since 2013
McLean, Virginia
February 23, 2018
72
APPIAN CORPORATION AND SUBSIDIARIES
CONSOLIDATED BALANCE SHEETS
(in thousands, except share and per share data)
As of December 31, 2017 | As of December 31, 2016 | ||||||
Assets | |||||||
Current assets | |||||||
Cash and cash equivalents | $ | 73,758 | $ | 31,143 | |||
Accounts receivable, net of allowance of $400 | 55,315 | 46,814 | |||||
Deferred commissions, current | 9,117 | 7,146 | |||||
Prepaid expenses and other current assets | 7,032 | 3,281 | |||||
Total current assets | 145,222 | 88,384 | |||||
Property and equipment, net | 2,663 | 3,101 | |||||
Deferred commissions, net of current portion | 12,376 | 10,860 | |||||
Deferred tax assets | 281 | 12 | |||||
Other assets | 510 | 381 | |||||
Total assets | $ | 161,052 | $ | 102,738 | |||
Liabilities, Convertible Preferred Stock and Stockholders’ Equity (Deficit) | |||||||
Current liabilities | |||||||
Accounts payable | $ | 5,226 | $ | 5,057 | |||
Accrued expenses | 6,467 | 2,860 | |||||
Accrued compensation and related benefits | 12,075 | 9,554 | |||||
Deferred revenue, current | 70,165 | 52,000 | |||||
Current portion of long-term debt | — | 6,111 | |||||
Other current liabilities | 1,182 | 437 | |||||
Total current liabilities | 95,115 | 76,019 | |||||
Long-term debt, net of current portion | — | 13,889 | |||||
Deferred tax liabilities | 87 | 32 | |||||
Deferred revenue, net of current portion | 18,922 | 18,108 | |||||
Preferred stock warrant liability | — | 850 | |||||
Other long-term liabilities | 1,404 | 1,917 | |||||
Total liabilities | 115,528 | 110,815 | |||||
Convertible preferred stock | |||||||
Series A convertible preferred stock—par value $0.0001; no shares authorized, issued or outstanding as of December 31, 2017; 12,127,468 shares authorized and 12,043,108 shares issued and outstanding as of December 31, 2016 | — | 17,915 | |||||
Series B convertible preferred stock—par value $0.0001; no shares authorized, issued or outstanding as of December 31, 2017; 6,120,050 shares authorized, issued and outstanding as of December 31, 2016 | — | 37,500 | |||||
Stockholders’ equity (deficit) | |||||||
Common stock—par value $0.0001; no shares authorized, issued or outstanding as of December 31, 2017; 61,462,320 shares authorized and 34,274,718 shares issued and outstanding as of December 31, 2016 | — | 3 | |||||
Class A common stock—par value $0.0001; 500,000,000 shares authorized and 13,030,081 shares issued and outstanding as of December 31, 2017; no shares authorized, issued or outstanding as of December 31, 2016 | 1 | — | |||||
Class B common stock—par value $0.0001; 100,000,000 shares authorized and 47,569,796 shares issued and outstanding as of December 31, 2017; no shares authorized, issued or outstanding as of December 31, 2016 | 5 | — | |||||
Additional paid-in capital | 141,268 | — | |||||
Accumulated other comprehensive income | 439 | 1,330 | |||||
Accumulated deficit | (96,189 | ) | (64,825 | ) | |||
Total stockholders’ equity (deficit) | 45,524 | (63,492 | ) | ||||
Total liabilities, convertible preferred stock and stockholders’ equity (deficit) | $ | 161,052 | $ | 102,738 | |||
The accompanying notes are an integral part of these consolidated financial statements.
73
APPIAN CORPORATION AND SUBSIDIARIES
CONSOLIDATED STATEMENTS OF OPERATIONS
(in thousands, except share and per share data)
Year Ended December 31, | |||||||||||
2017 | 2016 | 2015 | |||||||||
Revenue: | |||||||||||
Subscriptions, software and support | $ | 91,514 | $ | 69,972 | $ | 53,207 | |||||
Professional services | 85,223 | 62,951 | 57,997 | ||||||||
Total revenue | 176,737 | 132,923 | 111,204 | ||||||||
Cost of revenue: | |||||||||||
Subscriptions, software and support | 9,379 | 7,437 | 6,079 | ||||||||
Professional services | 55,218 | 42,686 | 42,402 | ||||||||
Total cost of revenue | 64,597 | 50,123 | 48,481 | ||||||||
Gross profit | 112,140 | 82,800 | 62,723 | ||||||||
Operating expenses: | |||||||||||
Sales and marketing | 81,966 | 54,137 | 38,300 | ||||||||
Research and development | 34,835 | 22,994 | 16,750 | ||||||||
General and administrative | 27,150 | 17,039 | 12,515 | ||||||||
Total operating expenses | 143,951 | 94,170 | 67,565 | ||||||||
Operating loss | (31,811 | ) | (11,370 | ) | (4,842 | ) | |||||
Other (income) expense: | |||||||||||
Other (income) expense, net | (2,038 | ) | 1,792 | 1,579 | |||||||
Interest expense | 473 | 982 | 188 | ||||||||
Total other (income) expense | (1,565 | ) | 2,774 | 1,767 | |||||||
Net loss before income taxes | (30,246 | ) | (14,144 | ) | (6,609 | ) | |||||
Income tax expense (benefit) | 761 | (1,683 | ) | 378 | |||||||
Net loss | (31,007 | ) | (12,461 | ) | (6,987 | ) | |||||
Accretion of dividends on convertible preferred stock | 357 | 857 | 861 | ||||||||
Net loss attributable to common stockholders | $ | (31,364 | ) | $ | (13,318 | ) | $ | (7,848 | ) | ||
Net loss per share attributable to common stockholders: | |||||||||||
Basic and diluted | $ | (0.63 | ) | $ | (0.39 | ) | $ | (0.23 | ) | ||
Weighted average common shares outstanding: | |||||||||||
Basic and diluted | 49,529,833 | 34,274,718 | 34,274,718 | ||||||||
The accompanying notes are an integral part of these consolidated financial statements.
74
APPIAN CORPORATION AND SUBSIDIARIES
CONSOLIDATED STATEMENTS OF COMPREHENSIVE LOSS
(in thousands)
Year Ended December 31, | |||||||||||
2017 | 2016 | 2015 | |||||||||
Net loss | $ | (31,007 | ) | $ | (12,461 | ) | $ | (6,987 | ) | ||
Comprehensive loss, net of income taxes: | |||||||||||
Foreign currency translation adjustment | (891 | ) | 359 | 159 | |||||||
Total other comprehensive loss, net of income taxes | $ | (31,898 | ) | $ | (12,102 | ) | $ | (6,828 | ) | ||
The accompanying notes are an integral part of these consolidated financial statements.
75
APPIAN CORPORATION AND SUBSIDIARIES
CONSOLIDATED STATEMENTS OF CHANGES IN STOCKHOLDERS’ EQUITY (DEFICIT)
(in thousands, except share data)
Accumulated Other Comprehensive Income (Loss) | Total Stockholders' Equity (Deficit) | |||||||||||||||||||||
Common Stock | Additional Paid-In Capital | Accumulated Deficit | ||||||||||||||||||||
Shares | Amount | |||||||||||||||||||||
Balance, January 1, 2015 | 34,274,718 | $ | 3 | $ | — | $ | 812 | $ | (43,659 | ) | $ | (42,844 | ) | |||||||||
Net loss | — | — | — | — | (6,987 | ) | (6,987 | ) | ||||||||||||||
Accretion of dividends on convertible preferred stock | — | — | — | — | (861 | ) | (861 | ) | ||||||||||||||
Other comprehensive income | — | — | — | 159 | — | 159 | ||||||||||||||||
Balance, December 31, 2015 | 34,274,718 | 3 | — | 971 | (51,507 | ) | (50,533 | ) | ||||||||||||||
Net loss | — | — | — | — | (12,461 | ) | (12,461 | ) | ||||||||||||||
Accretion of dividends on convertible preferred stock | — | — | — | — | (857 | ) | (857 | ) | ||||||||||||||
Other comprehensive income | — | — | — | 359 | — | 359 | ||||||||||||||||
Balance, December 31, 2016 | 34,274,718 | 3 | — | 1,330 | (64,825 | ) | (63,492 | ) | ||||||||||||||
Net loss | — | — | — | — | (31,007 | ) | (31,007 | ) | ||||||||||||||
Accretion of dividends on convertible preferred stock | — | — | — | — | (357 | ) | (357 | ) | ||||||||||||||
Conversion of convertible preferred stock to common stock | 18,163,158 | 2 | 48,205 | — | — | 48,207 | ||||||||||||||||
Conversion of convertible preferred stock warrant to common stock warrant | — | — | 1,191 | — | — | 1,191 | ||||||||||||||||
Issuance of common stock from initial public offering, net of issuance costs | 7,187,500 | 1 | 77,788 | — | — | 77,789 | ||||||||||||||||
Exercise of common stock warrant | 79,363 | — | — | — | — | — | ||||||||||||||||
Issuance of common stock to directors | 14,087 | — | — | — | — | — | ||||||||||||||||
Vesting of restricted stock units | 4,930 | — | — | — | — | — | ||||||||||||||||
Exercise of stock options | 876,121 | — | 1,108 | — | — | 1,108 | ||||||||||||||||
Stock-based compensation expense | — | — | 12,976 | — | — | 12,976 | ||||||||||||||||
Other comprehensive loss | — | — | — | (891 | ) | — | (891 | ) | ||||||||||||||
Balance, December 31, 2017 | 60,599,877 | $ | 6 | $ | 141,268 | $ | 439 | $ | (96,189 | ) | $ | 45,524 | ||||||||||
The accompanying notes are an integral part of these consolidated financial statements.
76
APPIAN CORPORATION AND SUBSIDIARIES
CONSOLIDATED STATEMENTS OF CASH FLOWS
(in thousands)
Year Ended December 31, | |||||||||||
2017 | 2016 | 2015 | |||||||||
Cash flows from operating activities: | |||||||||||
Net loss | $ | (31,007 | ) | $ | (12,461 | ) | $ | (6,987 | ) | ||
Adjustments to reconcile net loss to net cash used in operating activities: | |||||||||||
Depreciation and amortization | 886 | 764 | 763 | ||||||||
Bad debt expense | 62 | 7 | (22 | ) | |||||||
Deferred income taxes | (251 | ) | (1,122 | ) | (291 | ) | |||||
Stock-based compensation | 12,976 | — | |||||||||
Fair value adjustment for warrant liability | 341 | 200 | 299 | ||||||||
Loss on extinguishment of debt | 384 | — | — | ||||||||
Changes in assets and liabilities: | |||||||||||
Accounts receivable | (9,716 | ) | (11,154 | ) | (6,639 | ) | |||||
Prepaid expenses and other assets | (4,162 | ) | (1,665 | ) | (988 | ) | |||||
Deferred commissions | (3,487 | ) | (5,335 | ) | (3,965 | ) | |||||
Accounts payable and accrued expenses | 4,128 | 1,287 | 1,058 | ||||||||
Accrued compensation and related benefits | 2,365 | 3,717 | (968 | ) | |||||||
Other current liabilities | 383 | 19 | (251 | ) | |||||||
Deferred revenue | 18,344 | 17,410 | 15,490 | ||||||||
Other long-term liabilities | (374 | ) | 577 | 356 | |||||||
Net cash used in operating activities | (9,128 | ) | (7,756 | ) | (2,145 | ) | |||||
Cash flows from investing activities: | |||||||||||
Purchases of property and equipment | (433 | ) | (984 | ) | (524 | ) | |||||
Net cash used in investing activities | (433 | ) | (984 | ) | (524 | ) | |||||
Cash flows from financing activities: | |||||||||||
Proceeds from initial public offering, net of underwriting discounts | 80,213 | — | — | ||||||||
Payment of initial public offering costs | (2,424 | ) | — | — | |||||||
Payment of dividend to Series A preferred stockholders | (7,565 | ) | — | — | |||||||
Proceeds from exercise of common stock options | 1,108 | — | — | ||||||||
Proceeds from issuance of long-term debt, net of debt issuance costs | 19,616 | 20,000 | 10,000 | ||||||||
Repayment of long-term debt | (40,000 | ) | (10,000 | ) | — | ||||||
Net cash provided by financing activities | 50,948 | 10,000 | 10,000 | ||||||||
Effect of foreign exchange rate changes on cash and cash equivalents | 1,228 | (1,510 | ) | (930 | ) | ||||||
Net increase (decrease) in cash and cash equivalents | 42,615 | (250 | ) | 6,401 | |||||||
Cash and cash equivalents, beginning of period | 31,143 | 31,393 | 24,992 | ||||||||
Cash and cash equivalents, end of period | $ | 73,758 | $ | 31,143 | $ | 31,393 | |||||
Supplemental disclosure of cash flow information: | |||||||||||
Cash paid for interest | $ | 515 | $ | 895 | $ | 193 | |||||
Cash paid for income taxes | $ | 615 | $ | 610 | $ | 1,055 | |||||
Supplemental disclosure of non-cash financing activities: | |||||||||||
Conversion of convertible preferred stock to common stock | $ | 48,207 | $ | — | $ | — | |||||
Conversion of convertible preferred stock warrant to common stock warrant | $ | 1,191 | $ | — | $ | — | |||||
Accretion of dividends on convertible preferred stock | $ | 357 | $ | 857 | $ | 861 | |||||
The accompanying notes are an integral part of these consolidated financial statements.
77
APPIAN CORPORATION AND SUBSIDIARIES
NOTES TO CONSOLIDATED FINANCIAL STATEMENTS
1. | Organization and Description of Business |
Appian Corporation (together with its subsidiaries, “Appian,” the “Company,” “we” or “our”) provides a leading low-code software development platform that enables organizations to rapidly develop powerful and unique applications. The applications created on our platform help companies drive digital transformation and competitive differentiation. We were incorporated in the state of Delaware in August 1999. We are headquartered in Reston, Virginia and have offices in Canada, Switzerland, the United Kingdom, France, Germany, the Netherlands, Italy, and Australia.
2. | Significant Accounting Policies |
Basis of Presentation
The accompanying consolidated financial statements and footnotes have been prepared in accordance with accounting principles generally accepted in the United States of America (“U.S. GAAP”) as contained in the Financial Accounting Standards Board (“FASB”) Accounting Standards Codification (the “Codification” or “ASC”).
Use of Estimates
The preparation of our consolidated financial statements in conformity with U.S. GAAP requires us to make estimates and judgments that affect the amounts reported in these consolidated financial statements and accompanying notes. Although we believe that the estimates we use are reasonable, due to the inherent uncertainty involved in making these estimates, actual results reported in future periods could differ from those estimates.
Significant estimates embedded in the consolidated financial statements include revenue recognition, income taxes and the related valuation allowance, stock-based compensation and fair value measurements for our common stock and preferred stock warrant.
Principles of Consolidation
The accompanying consolidated financial statements include the accounts of Appian and its wholly-owned subsidiaries. All intercompany accounts and transactions have been eliminated in consolidation.
Initial Public Offering
In May 2017, we completed an initial public offering, or IPO, in which we sold 7,187,500 shares of our newly-authorized Class A common stock at an initial price to the public of $12.00 per share. We received net proceeds of $77.8 million, after deducting underwriting discounts and commissions and offering expenses paid and payable by us, from sales of our shares in the IPO. Immediately prior to the completion of the IPO, (1) all shares of common stock then outstanding were converted into Class B common stock on a one-for-one basis, (2) a warrant to purchase shares of convertible preferred stock was converted into a warrant to purchase shares of Class B common stock and (3) all shares of convertible preferred stock then outstanding were converted into shares of our common stock on a one-for-one basis, and then reclassified as shares of Class B common stock. See Note 8 for further discussion of the convertible preferred stock and Note 9 for further discussion of the warrant.
Deferred offering costs of $2.4 million, consisting of legal, accounting and other fees and costs related to our IPO, were recorded to additional paid-in capital as a reduction of the proceeds upon the closing of our IPO.
Secondary Offering
In November 2017, we completed a secondary offering in which stockholders sold an aggregate of 4,370,000 shares of our Class A common stock at a price of $20.25 per share. We did not receive any proceeds from the sale of the shares of our Class A common stock offered in the secondary offering.
78
APPIAN CORPORATION AND SUBSIDIARIES
NOTES TO CONSOLIDATED FINANCIAL STATEMENTS (CONTINUED)
Revenue Recognition
We generate revenue primarily through sales of subscriptions to our platform, as well as professional services. We recognize revenue when all of the following conditions are met: (1) there is persuasive evidence of an arrangement; (2) the service or product has been provided to the customer; (3) the amount of fees to be paid by the customer is fixed or determinable; and (4) the collection of related fees is reasonably assured. If collection is not reasonably assured, we defer revenue recognition until collectability becomes reasonably assured. Our arrangements do not contain general rights of return. Revenue is recognized net of any taxes collected from customers and subsequently remitted to governmental authorities.
Subscriptions, Software and Support Revenue
Subscriptions, software and support revenue is primarily related to (1) software as a service (“SaaS”) subscriptions bundled with maintenance and support and hosting services and (2) term license subscriptions bundled with maintenance and support. To a lesser extent, we also generate revenue from the sale of perpetual software licenses and associated maintenance and support.
Historically, we licensed our software primarily under perpetual licenses, but over time we transitioned from perpetual licenses to subscriptions. As a result, revenue from our perpetual software licenses was less than 1.0% of our total revenue for 2017 and 2016, respectively, and 1.9% of our total revenue in 2015.
We generally charge subscription fees on a per-user basis. We bill customers and collect payment for subscriptions to our platform in advance on a monthly, quarterly or annual basis. In certain instances, we have had customers pay their entire contract up front.
SaaS Subscriptions
Our SaaS subscription revenue is derived from customers accessing our cloud offering pursuant to contracts that are generally one to five years in length. We perform all required maintenance and support for our cloud offering and we do not separately charge customers for hosting costs. In these arrangements, our customers do not have the right to take the software on-premises and, as a result, such arrangements are not accounted for within the scope of the software revenue guidance. Revenue from SaaS subscriptions is recognized ratably over the term of the subscription, beginning with the date our service is made available to our customer.
Term License Subscriptions
Our term license subscription revenue is derived from customers with on-premises installations of our platform pursuant to contracts that are generally one to five years in length. Customers with term license subscriptions have the right to use our software and receive maintenance and support. Since we do not sell maintenance and support separately from the subscription, revenue for the term license subscription and maintenance and support is recognized ratably over the term of the subscription, upon delivery of the platform to the customer when sold on a standalone basis.
Professional Services
Our professional services revenue is comprised of fees for consulting services, including application development and deployment assistance and training related to our platform. Our professional services are not essential to the functionality of our platform because the platform is ready for the customer’s use immediately upon delivery and is not modified or customized in any manner.
Consulting services are billed under both time-and-material and fixed-fee arrangements. For standalone time-and-material contracts, we recognize revenue at contractually agreed upon billing rates applied to hours performed. For standalone fixed-fee contracts, we also recognize revenue as the work is performed using the proportional performance method of accounting. Training revenue is recognized when the associated training services are delivered. Training is also sold in the form of a subscription arrangement where a customer agrees to pay an annual fixed fee for a fixed number of users to have access to all of our training offerings during the year. Revenue from training subscription agreements is recognized ratably over the subscription period.
79
APPIAN CORPORATION AND SUBSIDIARIES
NOTES TO CONSOLIDATED FINANCIAL STATEMENTS (CONTINUED)
We defer recognition of revenue from work performed on pending contract modifications until the period in which the modifications are accepted and funding is approved by the customer. Costs of work performed on pending contract modifications are expensed as incurred.
Multiple Element Arrangements
Our multiple element arrangements are from SaaS subscriptions and term license subscriptions that are generally sold in combination with maintenance and support service and frequently with professional services.
SaaS Subscriptions
For multiple element arrangements involving SaaS subscriptions that include professional services in addition to the subscription to our platform, we evaluate each element to determine whether it represents a separate unit of accounting. Because there are third-party vendors who routinely sell and provide the same professional services to our customers, our professional services are deemed to have standalone value apart from the SaaS subscription. Additionally, we offer both SaaS subscriptions and professional services on a standalone basis. Professional services revenue is therefore accounted for separately from subscription fees and recognized as the professional services are performed. We allocate revenue to the elements based on the selling price hierarchy using vendor-specific objective evidence (“VSOE”) of selling price, third-party evidence (“TPE”) of selling price, or if neither exists, best estimated selling price (“BESP”). In cases where we do not have VSOE or TPE of the elements of our arrangements, we use BESP to allocate revenue. We determine BESP for a service by considering multiple factors including, but not limited to, evaluating the weighted average of actual sales prices and other factors such as gross margin objectives, pricing practices and growth strategy. Pricing practices taken into consideration include historic contractually stated prices, volume discounts where applicable and our price lists. While we believe we can make reliable estimates regarding these matters, these estimates are inherently subjective. Once the revenue is allocated to these elements, revenue is recognized as such services are provided.
Term License Subscriptions
For multiple element arrangements involving term license subscriptions, maintenance and support and professional services, we do not have VSOE of fair value for the maintenance and support. Our term license subscriptions are generally not sold on a standalone basis, and therefore, we have not established VSOE of fair value for the subscriptions. Consequently, for our bundled arrangements that include certain professional services, there are two undelivered elements for which VSOE of fair value has not been established and, therefore, we utilize the combined services approach and defer all revenue until the software has been delivered and the provision of all services has commenced. We then recognize the entire fee from the arrangement ratably over the remaining period of the arrangement, assuming all other software revenue recognition criteria have been met.
Deferred Revenue
Deferred revenue primarily consists of amounts billed or billable in advance of revenue recognition from our subscriptions, software, and support and professional services described above. Deferred revenue is recognized as the revenue recognition criteria are met.
Cost of Revenue
Cost of Subscriptions, Software and Support Revenue
Cost of subscriptions, software and support revenue consists primarily of fees paid to our third-party managed hosting providers and other third-party service providers, personnel costs, including payroll and benefits for our technology operations and customer support teams, and allocated facility costs and overhead.
Cost of Professional Services Revenue
Cost of professional services revenue includes all direct and indirect costs to deliver our professional services and training, including employee compensation for our global professional services and training personnel, travel costs, third-party contractor costs and allocated facility costs and overhead.
80
APPIAN CORPORATION AND SUBSIDIARIES
NOTES TO CONSOLIDATED FINANCIAL STATEMENTS (CONTINUED)
Concentration of Credit Risk
Our financial instruments that are exposed to concentration of credit risk consist primarily of cash and cash equivalents and trade accounts receivable. Cash deposits may be in excess of insured limits. We believe that the financial institutions that hold our cash deposits are financially sound and, accordingly, minimal credit risk exists with respect to these balances.
With regard to our customers, credit evaluation and account monitoring procedures are used to minimize the risk of loss. We believe that no additional credit risk beyond amounts provided for collection loss are inherent in accounts receivable. Revenue generated from government agencies represented 15.4%, 26.2% and 32.7% of our revenue for the years ended December 31, 2017, 2016 and 2015, respectively, of which the top three federal government agencies generated 8.4%, 17.7% and 20.8% of our revenue for the years ended December 31, 2017, 2016 and 2015, respectively. Additionally, 27.0%, 19.5% and 19.9% of our revenue during the years ended December 31, 2017, 2016 and 2015, respectively, was generated from foreign customers.
One customer accounted for 7.0% and 17.2% of accounts receivable at December 31, 2017 and December 31, 2016, respectively.
Cash and Cash Equivalents
We consider all highly liquid investments with an original or remaining maturity of three months or less at the date of purchase, as well as overnight repurchase investments, to be cash equivalents.
Accounts Receivable and Allowance for Doubtful Accounts
Accounts receivable are stated at realizable value, net of an allowance for doubtful accounts. The allowance for doubtful accounts is based on our assessment of the collectability of accounts. We regularly review the composition of the accounts receivable aging, historical bad debts, changes in payment patterns, customer creditworthiness and current economic trends. If the financial condition of our customers were to deteriorate, resulting in their inability to make required payments, additional provisions for doubtful accounts would be required and would increase bad debt expense. To date, our allowance and related bad debt write-offs have been nominal. There was no change in the allowance for doubtful accounts from December 31, 2016 to December 31, 2017.
Deferred Commissions
Deferred commissions are the incremental costs that are directly associated with subscription agreements with customers and consist of sales commissions paid to our direct sales force. Commissions are considered direct and incremental and as such are deferred and amortized over the terms of the related customer contracts consistent with the related revenue. Amortization of deferred commissions is included in sales and marketing expense in the accompanying consolidated statements of operations. Commission expense was $11.8 million, $6.5 million and $4.6 million for the years ended December 31, 2017, 2016 and 2015, respectively.
Property and Equipment
Property and equipment are stated at cost less accumulated depreciation and amortization. Depreciation is computed using the straight-line method over the estimated useful lives of the assets. Significant additions or improvements extending the useful life of an asset are capitalized, while repairs and maintenance costs which do not significantly improve the related assets or extend their useful lives are charged to expense as incurred.
Asset Category | Useful Life (in years) | |
Computer software | 3 | |
Computer hardware | 3 | |
Equipment | 5 | |
Office furniture and fixtures | 10 | |
Leasehold improvements | Shorter of useful life of assets or lease term | |
81
APPIAN CORPORATION AND SUBSIDIARIES
NOTES TO CONSOLIDATED FINANCIAL STATEMENTS (CONTINUED)
Impairment of Long-Lived Assets
Long-lived assets and certain intangible assets are reviewed for impairment whenever events or circumstances indicate that the carrying amount of an asset may not be recoverable through undiscounted cash flows from the use of the assets. If such assets are considered to be impaired, the assets are written down to their estimated fair value. No indicators of impairment were identified for the years ended December 31, 2017, 2016 and 2015.
Fair Value of Financial Instruments
The carrying amounts of our cash and cash equivalents, accounts receivable, accounts payable and accrued expenses approximate fair value as of December 31, 2017 and December 31, 2016 because of the relatively short duration of these instruments. The carrying value of our long-term debt as of December 31, 2016 approximated fair value given interest rates for similar debt instruments available to the Company.
We use a three-tier fair value hierarchy to classify and disclose all assets and liabilities measured at fair value on a recurring basis, as well as assets and liabilities measured at fair value on a non-recurring basis, in periods subsequent to their initial measurement. The hierarchy requires us to use observable inputs when available, and to minimize the use of unobservable inputs when determining fair value. The three tiers are defined as follows:
• | Level 1. Observable inputs based on unadjusted quoted prices in active markets for identical assets or liabilities; |
• | Level 2. Inputs, other than quoted prices in active markets, that are observable either directly or indirectly; and |
• | Level 3. Unobservable inputs for which there is little or no market data, which require us to develop our own assumptions. |
Assets and Liabilities Measured at Fair Value on a Recurring Basis
We evaluate our financial assets and liabilities subject to fair value measurements on a recurring basis to determine the appropriate level in which to classify them for each reporting period. This determination requires significant judgments to be made. After the reclassification of the convertible preferred stock warrant in May 2017, we did not have any assets or liabilities subject to fair value measurements as of December 31, 2017. See Note 9 for further discussion of the warrant reclassification. The following table summarizes the conclusions reached as of December 31, 2016 (in thousands):
December 31, 2016 | Level 1 | Level 2 | Level 3 | ||||||||||||
Liabilities: | |||||||||||||||
Series A convertible preferred stock warrant(1) | $ | 850 | $ | — | $ | — | $ | 850 | |||||||
$ | 850 | $ | — | $ | — | $ | 850 | ||||||||
(1) | In order to determine the fair value of the convertible preferred stock warrant, we used the Black-Scholes option pricing model (“OPM”). Significant inputs for the OPM included an estimate of the fair value of the Series A convertible preferred stock, the remaining contractual life of the warrant, an estimate of the timing of a liquidity event, a risk-free rate of interest and an estimate of our stock volatility using the volatilities of guideline peer companies. |
Assets and Liabilities Measured at Fair Value on a Recurring Basis Using Significant Unobservable Inputs
The following table presents the changes in our Level 3 instruments measured at fair value on a recurring basis during the years ended December 31, 2017, 2016 and 2015 (in thousands):
Year Ended December 31, | |||||||||||
2017 | 2016 | 2015 | |||||||||
Balance as of January 1, | $ | 850 | $ | 650 | $ | 351 | |||||
Change in fair value of warrant liability | 341 | 200 | 299 | ||||||||
Reclassification of warrant liability to equity | (1,191 | ) | — | — | |||||||
Balance as of December 31, | $ | — | $ | 850 | $ | 650 | |||||
82
APPIAN CORPORATION AND SUBSIDIARIES
NOTES TO CONSOLIDATED FINANCIAL STATEMENTS (CONTINUED)
Stock-Based Compensation
We account for stock-based compensation expense related to stock-based awards based on the estimated fair value of the award on the grant date. We calculate the fair value of stock options using the Black-Scholes OPM. For service-based awards, stock-based compensation expense is recognized on a straight-line basis over the requisite service period. For performance-based awards, stock-based compensation expense is recognized using the accelerated attribution method, based on the probability of satisfying the performance condition. For awards that contain market conditions, compensation expense is measured using a Monte Carlo simulation model and recognized using the accelerated attribution method over the derived service period based on the expected market performance as of the grant date. For restricted stock units, stock-based compensation expense is recognized on a straight-line basis over the requisite service period. We account for forfeitures as they occur, rather than estimating expected forfeitures.
Basic and Diluted Loss per Common Share
We use the two-class method to compute net loss per common share because we have issued securities, other than common stock, that contractually entitle the holders to participate in dividends and earnings. These participating securities include our convertible preferred stock which have non-forfeitable rights to participate in any dividends declared on our common stock. The two-class method requires earnings for the period to be allocated between common stock and participating securities based upon their respective rights to receive distributed and undistributed earnings.
Under the two-class method, for periods with net income, basic net income per common share is computed by dividing the net income attributable to common stockholders by the weighted average number of shares of common stock outstanding during the period. Net income attributable to common stockholders is computed by subtracting from net income the portion of current year earnings that the participating securities would have been entitled to receive pursuant to their dividend rights had all of the year’s earnings been distributed. No such adjustment to earnings is made during periods with a net loss, as the holders of the participating securities have no obligation to fund losses.
Diluted net income per common share is computed under the two-class method by using the weighted average number of shares of common stock outstanding, plus, for periods with net income attributable to common stockholders, the potential dilutive effects of stock options and warrants. In addition, we analyze the potential dilutive effect of the outstanding participating securities under the “if-converted” method when calculating diluted earnings per share, in which it is assumed that the outstanding participating securities convert into common stock at the beginning of the period or date of issuance, if later. We report the more dilutive of the approaches (two-class or “if-converted”) as our diluted net income per share during the period.
Due to net losses for the years ended December 31, 2017, 2016 and 2015, basic and diluted net loss per share were the same, as the effect of potentially dilutive securities would have been anti-dilutive.
Income Taxes
We use the asset and liability method of accounting for income taxes in which deferred tax assets and liabilities are recognized for the future tax consequences attributable to differences between the consolidated financial statement carrying amounts of existing assets and liabilities and their respective tax bases. We measure deferred tax assets and liabilities using enacted tax rates expected to apply to taxable income in the years in which those temporary differences are expected to be reversed. We recognize the effect on deferred tax assets and liabilities of a change in tax rates as income and expense in the period that includes the enactment date. A valuation allowance is established if it is more likely than not that all or a portion of the deferred tax asset will not be realized.
Our tax positions are subject to income tax audits by multiple tax jurisdictions throughout the world. We recognize the tax benefit of an uncertain tax position only if it is more likely than not the position is sustainable upon examination by the taxing authority. We measure the tax benefit recognized as the largest amount of benefit which is more likely than not to be realized upon settlement with the taxing authority. We recognize penalties and interest related to unrecognized tax benefits as income tax expense.
We calculate the current and deferred income tax provision based on estimates and assumptions that could differ from the actual results reflected in income tax returns filed in subsequent years and record adjustments based on filed income tax returns when identified. The amount of income taxes paid is subject to examination by U.S. federal, state and foreign tax
83
APPIAN CORPORATION AND SUBSIDIARIES
NOTES TO CONSOLIDATED FINANCIAL STATEMENTS (CONTINUED)
authorities. The estimate of the potential outcome of any uncertain tax issue is subject to our assessment of relevant risks, facts and circumstances existing at that time. To the extent the assessment of such tax position changes, we record the change in estimate in the period in which we make that determination.
As described in more detail below under "Recent Accounting Pronouncements" and in Note 6, the Tax Cuts and Jobs Act (the “TCJA”) was enacted on December 22, 2017, substantially changing the U.S. federal tax system. We are required to complete our tax accounting for the TCJA in the period when it has obtained, prepared, and analyzed the information to complete the income tax accounting.
We have not completed our accounting for the tax effects of enactment of the TCJA; however, we have made reasonable estimates of the effects of the TCJA on our financial statements which are included as a component of income tax expense.
Segment Reporting
Operating segments are defined as components of an enterprise for which discrete financial information is available that is evaluated regularly by the chief operating decision maker (“CODM”) for purposes of allocating resources and evaluating financial performance. Our CODM is our chief executive officer, who reviews financial information presented on a companywide basis for purposes of allocating resources and evaluating financial performance. As such, our operations constitute a single operating segment and one reportable segment.
Foreign Currency
Our operations located outside of the United States where the local currency is the functional currency are translated into U.S. dollars using the current rate method. Results of operations are translated at the average rate of exchange for the period. Assets and liabilities are translated at the closing rates on the balance sheet date. Gains and losses on translation of these accounts are accumulated and reported as a separate component of stockholders’ deficit and other comprehensive income (loss).
Gains and losses on foreign currency transactions are recognized in the accompanying consolidated statements of operations as a component of other expense, net. Transaction gains and losses from transactions denominated in foreign currencies resulted in net transaction gains of $2.6 million for the year ended December 31, 2017 and net transaction losses of $1.5 million and $1.3 million for the years ended December 31, 2016 and 2015, respectively.
Research and Development
Research and development expenses include payroll, employee benefits, and other headcount-related costs associated with product development. Our product utilizes a common codebase, whether accessed by customers via the cloud or via an on-premises installation. Since our software is sold and licensed externally, we consider our software as external-use software for purposes of applying the capitalized software development guidance. Product development costs are expensed as incurred until technological feasibility has been established, which we define as the completion of all planning, designing, coding and testing activities that are necessary to establish products that meet design specifications including functions, features and technical performance requirements. We have determined that technological feasibility for our software products is reached shortly before they are released for sale. Costs incurred after technological feasibility is established are not significant, and accordingly we expense all research and development costs when incurred.
Advertising
We expense advertising costs as they are incurred. Advertising expenses were $3.0 million, $1.4 million and $0.5 million for the years ended December 31, 2017, 2016 and 2015, respectively.
Emerging Growth Company Status
We are an “emerging growth company” as defined in the Jumpstart Our Business Startups Act (“JOBS Act”). The JOBS Act provides that an emerging growth company can take advantage of an extended transition period for complying with new or revised accounting standards. Thus, an emerging growth company can delay the adoption of certain accounting
84
APPIAN CORPORATION AND SUBSIDIARIES
NOTES TO CONSOLIDATED FINANCIAL STATEMENTS (CONTINUED)
standards until those standards would otherwise apply to private companies. We have elected to avail ourselves of this extended transition period and, as a result, we will not adopt new or revised accounting standards on the relevant dates on which adoption of such standards is required for other public companies.
Recent Accounting Pronouncements
Adopted
On December 22, 2017, the TCJA was enacted, substantially changing the U.S. Federal tax system. Notable provisions of the TCJA include the reduction of the corporate tax rate from 35% to 21% beginning in 2018, the imposition of a one-time transition tax on unremitted cumulative non-U.S. earnings of foreign subsidiaries, and the implementation of a territorial tax system. While the changes from the TCJA are generally effective beginning in 2018, U.S. GAAP accounting for income taxes requires the effect of a change in tax laws or rates to be recognized in income from continuing operations for the period that includes the enactment date. Due to the complexities involved in accounting for the enactment of the TCJA, the Securities and Exchange Commission Staff Accounting Bulletin No. 118 (“SAB 118”) allows us to record provisional amounts in earnings for the year ending December 31, 2017. Where reasonable estimates can be made, the provisional accounting should be based on such estimates. When no reasonable estimate can be made, the provisional accounting may be based on the tax law in effect before the TCJA. We are required to complete our tax accounting for the TCJA in the period when we have obtained, prepared, and analyzed the information to complete the income tax accounting. We have not completed our accounting for the tax effects of enactment of the TCJA; however, we have made reasonable estimates of the effects of the TCJA on our consolidated financial statements which are included as a component of income tax expense.
Not Yet Adopted
In May 2014, the FASB issued ASU No. 2014-9, Revenue from Contracts with Customers (Topic 606)(“ASU 2014-9”), which provides new guidance for revenue recognition. ASU 2014-9 provides that an entity should recognize revenue to depict the transfer of promised goods or services to customers in an amount that reflects the consideration to which the entity expects to be entitled in exchange for those goods or services. ASU 2014-9 also requires improved disclosures to help users of financial statements better understand the nature, amount, timing, and uncertainty of revenue that is recognized. Entities have the option of using either a full retrospective or modified retrospective approach for the adoption of the standard. In March 2016, the FASB issued ASU No. 2016-8, Principal Versus Agent Considerations (Reporting Revenue Gross Versus Net) (“ASU 2016-8”), which clarifies implementation guidance on principal versus agent considerations in ASU 2014-9. In April 2016, the FASB issued ASU No. 2016-10, Identifying Performance Obligations and Licensing (“ASU 2016-10”), which clarifies the identification of performance obligations and the licensing implementation guidance in ASU 2014-9. In addition, in May 2016, the FASB issued ASU No. 2016-12, Narrow-Scope Improvements and Practical Expedients (“ASU 2016-12”), which clarifies the guidance on assessing collectibility, presentation of sales taxes, noncash consideration and completed contracts and contract modifications at transition. For public entities, the new standard is effective for annual periods and interim periods within those annual periods, beginning after December 15, 2017. For all other entities, the new standard is effective for annual periods beginning after December 15, 2018, and interim periods within those annual periods beginning after December 15, 2019. We intend to avail ourselves of the JOBS Act extended transition period that permits us to defer adoption until January 1, 2019. We are currently evaluating the impact the adoption of these standards will have on our consolidated financial statements.
We currently plan to adopt the new standard using the full retrospective approach; however, the decision regarding the adoption method has not been finalized. Our final determination will depend on a number of factors such as the significance of the impact of the new standard on our financial results, system readiness, including that of software procured from third-party providers, and our ability to accumulate and analyze the information necessary to assess the impact on prior period financial statements, as necessary.
We continue to evaluate the impact of the new standard on our accounting policies, processes, and system requirements. We have assigned internal resources in addition to the engagement of third-party service providers to assist in the evaluation. Furthermore, we have made and will continue to make investments in systems to enable timely and accurate reporting under the new standard. While we continue to assess all potential impacts under the new standard there is the potential for significant impact to the timing of recognition of revenue, particularly term license subscriptions and professional services revenue. We also expect an impact to our accounting for contract acquisition costs, both with respect to the amounts that will be capitalized as well as the period of amortization.
85
APPIAN CORPORATION AND SUBSIDIARIES
NOTES TO CONSOLIDATED FINANCIAL STATEMENTS (CONTINUED)
Under current industry-specific software revenue recognition guidance, we have historically concluded that we did not have VSOE of fair value of the undelivered services related to term license subscriptions, and accordingly, have recognized term license subscriptions and related services ratably over the subscription term. Professional services included in an arrangement with subscription revenue has also been recognized ratably over the subscription term. The new standard, which does not retain the concept of VSOE, requires an evaluation of whether term license subscriptions and related services, including professional services, are distinct performance obligations and therefore should be separately recognized at a point in time or over time. Depending on the outcome of our evaluation, the timing of when revenue is recognized could change significantly for term license subscriptions and professional services under the new standard.
In February 2016, the FASB issued ASU No. 2016-2, Leases (Topic 842) (“ASU 2016-2”), which requires that lessees recognize assets and liabilities for leases with lease terms greater than 12 months in the statement of financial position. ASU 2016-2 also requires improved disclosures to help users of financial statements better understand the amount, timing and uncertainty of cash flows arising from leases. The update is effective for fiscal years beginning after December 15, 2019, and interim periods within fiscal years beginning after December 15, 2020. Early adoption is permitted. We are currently evaluating the impact the adoption of ASU 2016-2 will have on our consolidated financial statements.
In August 2016, the FASB issued ASU No. 2016-15, Statement of Cash Flows (Topic 230): Classification of Certain Cash Receipts and Cash Payments (“ASU 2016-15”), which aims to reduce the existing diversity in practice in how certain cash receipts and cash payments are presented and classified in the statement of cash flows. ASU 2016-15 will require adoption on a retrospective basis unless it is impracticable to apply, in which case we would be required to apply the amendments prospectively as of the earliest date practicable. ASU 2016-15 is effective for fiscal years beginning after December 15, 2018, and interim periods within fiscal years beginning after December 15, 2019. Early adoption is permitted. We are currently in the process of evaluating the impact of adoption of this standard on our consolidated financial statements.
In May 2017, the FASB issued ASU No. 2017-09, Compensation-Stock Compensation (Topic 718): Scope of Modification Accounting ("ASU 2017-09"), which clarifies when a change to the terms or conditions of a share-based payment award must be accounted for as a modification. ASU 2017-09 requires modification accounting if the fair value, vesting condition or the classification of the award is not the same immediately before and after a change to the terms and conditions of the award. ASU 2017-09 will be effective on a prospective basis beginning on January 1, 2018. Early adoption is permitted. We do not expect ASU 2017-09 to have an impact on our consolidated financial statements.
3. | Property and Equipment |
Property and equipment consisted of the following as of December 31 (in thousands):
2017 | 2016 | ||||||
Computer software | $ | 1,727 | $ | 1,701 | |||
Computer hardware | 1,644 | 1,408 | |||||
Leasehold improvements | 4,226 | 4,098 | |||||
Office furniture and fixtures | 510 | 464 | |||||
Equipment | 131 | 116 | |||||
8,238 | 7,787 | ||||||
Less: accumulated depreciation | (5,575 | ) | (4,686 | ) | |||
Property and equipment, net | $ | 2,663 | $ | 3,101 | |||
Depreciation and amortization expense totaled $0.9 million for the year ended December 31, 2017 and $0.8 million for each of the years ended December 31, 2016 and 2015.
86
APPIAN CORPORATION AND SUBSIDIARIES
NOTES TO CONSOLIDATED FINANCIAL STATEMENTS (CONTINUED)
4. | Accrued Expenses |
Accrued expenses consisted of the following as of December 31 (in thousands):
2017 | 2016 | ||||||
Accrued contract labor costs | $ | 3,424 | $ | 743 | |||
Accrued hosting costs | 466 | — | |||||
Accrued audit and tax expenses | 248 | 358 | |||||
Accrued reimbursable employee expenses | 286 | 134 | |||||
Accrued marketing and tradeshow expenses | 128 | 111 | |||||
Other accrued expenses | 1,915 | 1,514 | |||||
Total | $ | 6,467 | $ | 2,860 | |||
5. | Debt |
2015 Line of Credit
At December 31, 2015, we had a $10.0 million revolving line of credit with a lender, expiring in June 2016, which was subsequently amended in June 2016 to extend the maturity date through June 2017. This line of credit was terminated in April 2017.
2015 Term Loan
In March 2015, we entered into a collateralized $10.0 million term loan facility with a lender, maturing in March 2019, and borrowed the full amount under the term loan facility in June 2015. In January 2016, we paid off the outstanding balance of the term loan and simultaneously entered into a collateralized $20.0 million term loan facility, maturing in January 2020. We borrowed the full amount under the term loan facility in January 2016, which we repaid in full in April 2017.
2017 Financing Facility
In April 2017, we entered into a new financing facility consisting of a $5.0 million senior revolving credit facility, a $20.0 million senior term loan, and a $10.0 million subordinated term loan. In connection with the execution of this financing facility, the prior line of credit was terminated, and we borrowed the full $20.0 million available under the senior term loan and repaid the outstanding balance under our prior term loan. Additionally, in connection with the execution of our new financing facility, the lender waived the prepayment fee associated with our prior line of credit. In June 2017, we used proceeds from our IPO to pay all remaining outstanding principal and interest under the senior term loan and subsequently terminated the senior term loan and subordinated term loan. In connection with the repayment of the senior term loan, we recognized a loss on extinguishment of debt of $0.4 million related to unamortized debt issuance costs, which is included within other (income) expense, net in the accompanying consolidated statements of operations. This financing facility was terminated in November 2017 in connection with our entry into a new $20.0 million revolving line of credit.
2017 Line of Credit
In November 2017, we entered into a $20.0 million revolving line of credit with a lender. The facility matures in November 2022. We may elect whether amounts drawn on the revolving line of credit bear interest at a floating rate per annum equal to either the LIBOR or the prime rate plus an additional interest rate margin that is determined by the availability of the borrowings under the revolving line of credit. The additional interest rate margin will range from 2.00% to 2.50% in the case of LIBOR advances and from 1.00% to 1.50% in the case of prime rate advances. The revolving line of credit contains an unused facility fee in an amount between 0.15% and 0.25% of the average unused portion of the revolving line of credit, which is payable quarterly. The agreement contains certain customary affirmative and negative covenants and requires us to maintain (1) an adjusted quick ratio of at least 1.35 to 1.0 and (ii) minimum adjusted EBITDA, in the amounts and for the periods set forth in the agreement. Any amounts borrowed under the credit facility are collateralized by substantially all of our assets. We were in compliance with all covenants as of December 31, 2017. As of December 31, 2017, we had no outstanding borrowings under the revolving line of credit.
87
APPIAN CORPORATION AND SUBSIDIARIES
NOTES TO CONSOLIDATED FINANCIAL STATEMENTS (CONTINUED)
6. | Income Taxes |
For the years ended December 31, 2017, 2016 and 2015, our net loss before income taxes was comprised of the following (in thousands):
2017 | 2016 | 2015 | |||||||||
Domestic | $ | (23,093 | ) | $ | (4,524 | ) | $ | 1,079 | |||
Foreign | (7,153 | ) | (9,620 | ) | (7,688 | ) | |||||
Total | $ | (30,246 | ) | $ | (14,144 | ) | $ | (6,609 | ) | ||
For the years ended December 31, 2017, 2016 and 2015, our income tax expense (benefit) was comprised of the following (in thousands):
2017 | 2016 | 2015 | |||||||||
Current: | |||||||||||
Federal | $ | (65 | ) | $ | (627 | ) | $ | 390 | |||
State | 68 | (200 | ) | 62 | |||||||
Foreign | 1,009 | 266 | 217 | ||||||||
Total current expense (benefit) | 1,012 | (561 | ) | 669 | |||||||
Deferred: | |||||||||||
Federal | (42 | ) | (922 | ) | (334 | ) | |||||
State | — | (230 | ) | 43 | |||||||
Foreign | (209 | ) | 30 | — | |||||||
Total deferred expense (benefit) | (251 | ) | (1,122 | ) | (291 | ) | |||||
Total income tax expense (benefit) | $ | 761 | $ | (1,683 | ) | $ | 378 | ||||
On December 22, 2017, U.S. federal tax reform was enacted with the signing of the TCJA. Notable provisions of the TCJA include the following:
• | Establishment of a flat corporate income tax rate of 21% on U.S. earnings; |
• | Imposition of a one-time tax on unremitted cumulative non-U.S. earnings of foreign subsidiaries, or the Transition Tax; |
• | The imposition of a new minimum tax on certain non-U.S. earnings, irrespective of the territorial system of taxation, and generally allows for the repatriation of future earnings of foreign subsidiaries without incurring additional U.S. taxes by transitioning to a territorial system of taxation; |
• | Imposition of minimum taxes on certain payments made by a U.S. company to a related foreign company, or the Base Erosion Anti-Abuse Tax; |
• | Elimination of the alternative minimum tax and allowance of a refund for previous alternative minimum tax credits; |
• | Allowance for immediate expensing of the cost of investments in certain depreciable assets acquired and placed in service after September 27, 2017; and |
• | Reduction in tax deductions with respect to certain compensation paid to certain executive officers. |
While the changes from the TCJA are generally effective beginning in 2018, U.S. GAAP accounting for income taxes requires the effect of a change in tax laws or rates to be recognized in income from continuing operations for the period that includes the enactment date. Due to the complexities involved in accounting for the enactment of the TCJA, the Securities and Exchange Commission Staff Accounting Bulletin No. 118 (“SAB 118”) allows us to record provisional amounts in earnings for the year ending December 31, 2017. Where reasonable estimates can be made, the provisional accounting should be based on such estimates. When no reasonable estimate can be made, the provisional accounting may be based on the tax law in effect before the TCJA. We are required to complete our tax accounting for the TCJA in the period when we have obtained, prepared, and analyzed the information to complete the income tax accounting.
88
APPIAN CORPORATION AND SUBSIDIARIES
NOTES TO CONSOLIDATED FINANCIAL STATEMENTS (CONTINUED)
We have not completed our accounting for the tax effects of enactment of the TCJA; however, as described below, we have made reasonable estimates of the effects of the TCJA on our consolidated financial statements which are included as a component of income tax expense:
• | Deferred tax assets and liabilities: U.S. deferred tax assets and liabilities were remeasured based on the rates at which they are expected to reverse in the future, which is generally 21.0%, resulting in an income tax expense of approximately $2.1 million. This expense is fully offset by the tax benefit from the reduction in our U.S. valuation allowance. We will continue to analyze certain aspects of the TCJA which could potentially affect the tax basis of the reported amounts. Additionally, our U.S. tax returns for 2017 will be filed during the fourth quarter of 2018 and any changes to the tax positions for temporary differences compared to the estimates used will result in an adjustment of the estimated tax expense recorded as of December 31, 2017. |
• | Transition Tax effects: The Transition Tax is based on our total post-1986 earnings and profits that was previously deferred from U.S. income taxes. Our provisional estimate for the Transition Tax is zero because we have post-1986 accumulated deficits. We will continue to evaluate the TCJA and any future guidance from the U.S. Treasury Department and Internal Revenue Service (“IRS”) in the determination of the Transition Tax which could result in adjustment of the estimate recorded as of December 31, 2017. |
• | Indefinite reinvestment: Following enactment of the TCJA and the associated Transition Tax, in general, repatriation of cash to the United States can be completed with no incremental U.S. tax; however, repatriation of cash could subject the Company to non-U.S. jurisdictional taxes on distributions. The cash that our non-U.S. subsidiaries hold for indefinite reinvestment is generally used to finance foreign operations and investments, including acquisitions. The income taxes applicable to such earnings are not readily determinable given the various tax planning strategies we could employ if we repatriated these earnings. We will continue to evaluate the impact of the TCJA on our election to indefinitely reinvest our non-U.S. earnings, if any. |
We will continue to analyze the effects of the TCJA on our consolidated financial statements and operations. Additional impacts from the enactment of the TCJA will be recorded as they are identified during the measurement period as provided for in SAB 118, which allows measurement period adjustments up to one year from the enactment date.
For the years ended December 31, 2017, 2016 and 2015, the provision for income taxes differs from the amount computed by applying the federal statutory income tax rates to our loss before the provision (benefit) for income taxes, as follows:
2017 | 2016 | 2015 | ||||||
U.S. federal statutory tax rate | 34.0 | % | 34.0 | % | 34.0 | % | ||
State tax expense | 4.9 | 1.4 | (0.9 | ) | ||||
Foreign rate differential | (6.7 | ) | (17.8 | ) | (29.4 | ) | ||
Nondeductible expenses | (0.9 | ) | (2.3 | ) | (4.1 | ) | ||
Tax credits | 5.8 | 6.5 | 10.0 | |||||
Unrecognized tax benefits | (0.7 | ) | (0.2 | ) | (1.8 | ) | ||
Other | (0.3 | ) | (0.2 | ) | (1.9 | ) | ||
Remeasurement of deferred taxes | (7.0 | ) | — | — | ||||
Change in valuation allowance | (31.6 | ) | (9.6 | ) | (11.5 | ) | ||
Total | (2.5 | )% | 11.8 | % | (5.6 | )% | ||
Deferred tax assets and liabilities reflect the net tax effects of temporary differences between the carrying amount of the assets and liabilities for financial reporting purposes and the amounts used for income tax purposes.
89
APPIAN CORPORATION AND SUBSIDIARIES
NOTES TO CONSOLIDATED FINANCIAL STATEMENTS (CONTINUED)
As of December 31, 2017 and 2016, significant components of our deferred tax assets and liabilities were as follows (in thousands):
2017 | 2016 | ||||||
Deferred tax assets: | |||||||
Accrued vacation | $ | 967 | $ | 529 | |||
Bad debt | 109 | 159 | |||||
Deferred revenue | 1,248 | 2,176 | |||||
Deferred rent | 473 | 834 | |||||
Tax credits | 4,169 | 2,401 | |||||
Net operating losses | 10,413 | 2,939 | |||||
Equity compensation | 1,207 | — | |||||
Other | 287 | 929 | |||||
Gross deferred tax assets | 18,873 | 9,967 | |||||
Less: Valuation allowance | (12,328 | ) | (2,642 | ) | |||
Total deferred tax assets | 6,545 | 7,325 | |||||
Deferred tax liabilities: | |||||||
Depreciation | (174 | ) | (349 | ) | |||
Unbilled receivables | (555 | ) | (491 | ) | |||
Prepaid expenses | (5,614 | ) | (6,505 | ) | |||
Other | (8 | ) | — | ||||
Total deferred tax liabilities | (6,351 | ) | (7,345 | ) | |||
Net deferred tax asset (liability) | $ | 194 | $ | (20 | ) | ||
As of December 31, 2017 and 2016, we had $25.3 million and $1.8 million of gross net operating loss (“NOL”) carryforwards for U.S. federal tax purposes, respectively. Federal NOL carryforwards will expire, if unused, in 2037. As of December 31, 2017 and 2016, we had U.S. gross state NOL carryforwards of $25.3 million and $1.7 million, respectively. We had tax effected state NOL carryforwards of $1.6 million and $0.1 million as of December 31, 2017 and 2016, respectively. U.S. state NOL carryforwards will substantially expire, if unused, in 2037. As of December 31, 2017 and 2016, we had foreign NOL carryforwards of $35.7 million and $23.7 million, respectively, primarily attributable to our subsidiary in Switzerland. Those NOL carryforwards will substantially expire, if unused, in 2024.
Section 382 of the Internal Revenue Code limits the utilization of the NOLs when ownership changes occur, as defined by that section. A number of states have similar state laws that limit utilization of the state NOLs when ownership changes occur. We have performed an analysis of our Section 382 ownership changes and have determined that all federal and U.S state NOLs are available for use as of December 31, 2017.
As of December 31, 2017 and 2016, we had $4.5 million and $2.8 million, respectively, of federal tax credit carryforwards which will expire, if unused, in 2037.
The net change during the year in the total valuation allowance was $9.7 million, primarily driven by the valuation allowance recorded against the U.S. deferred tax assets and the change in the Switzerland deferred tax assets.
We continue to maintain a full valuation allowance against U.S. deferred tax assets based on our cumulative operating results as of December 31, 2017, three-year cumulative loss, and assessment of our expected future results of operations. We have evaluated all evidence, both positive and negative, in assessing the likelihood of realizability and the negative evidence outweighed the positive evidence.
As of December 31, 2017, we have a valuation allowance of $3.5 million against foreign deferred tax assets, primarily for deferred tax assets at our subsidiary in Switzerland. We continue to maintain a full valuation allowance on the deferred tax
90
APPIAN CORPORATION AND SUBSIDIARIES
NOTES TO CONSOLIDATED FINANCIAL STATEMENTS (CONTINUED)
assets of our subsidiary in Switzerland as we determined that it was not more likely than not that we would be able to realize a benefit from the NOL at that subsidiary. Based on our cumulative operating results as of December 31, 2017, and assessment of our expected future results of operations, we determined that it was not more likely than not that we would be able to realize the deferred tax assets prior to expiration.
We are subject to income taxes in the United States, Australia, Canada, France, Germany, Italy, Netherlands, Switzerland, and United Kingdom.
Undistributed earnings of our foreign subsidiaries are considered to be indefinitely reinvested; accordingly, no U.S. income taxes have been provided thereon. Upon repatriation of those earnings, if any, we would be subject to U.S. income taxes, net of any applicable foreign tax credits, and foreign withholding taxes. Determination of the amount of unrecognized deferred U.S. income tax liability is not practicable.
As of December 31, 2017 and 2016, we had unrecognized tax benefits of $0.7 million and $0.4 million, respectively, of which the entire portion would affect our effective tax rate if recognized. The following table summarizes the activity related to our unrecognized tax benefit from December 31, 2014 to December 31, 2017 (in thousands):
Balance as of December 31, 2014 | $ | 286 | |
Additions for tax positions in current years | 98 | ||
Additions for tax positions in prior years | — | ||
Reductions due to lapse in statutes of limitations | — | ||
Settlements | — | ||
Balance as of December 31, 2015 | 384 | ||
Additions for tax positions in current years | 171 | ||
Additions for tax positions in prior years | — | ||
Reductions due to lapse in statutes of limitations | (136 | ) | |
Settlements | — | ||
Balance as of December 31, 2016 | 419 | ||
Additions for tax positions in current years | 232 | ||
Additions for tax positions in prior years | — | ||
Reductions due to lapse in statutes of limitations | — | ||
Settlements | — | ||
Balance as of December 31, 2017 | $ | 651 | |
We recognize interest and penalties related to uncertain tax positions in income tax expense. During the year ended December 31, 2017, we reduced our liability for potential interest and penalties by $2,000. During the years ended December 31, 2016 and 2015, we recognized potential interest and penalties of $2,000 and $19,000, respectively, and the cumulative balance of interest and penalties as of December 31, 2017 and 2016 and was $33,000 and $35,000, respectively.
We anticipate that total unrecognized tax benefits will not decrease over the next year.
We file income tax returns in the United States federal jurisdiction and in many state and foreign jurisdictions. The tax years 2014 through 2017 remain open to examination by the major taxing jurisdictions to which we are subject. No material examinations are currently open.
7. | Stock-Based Compensation |
In May 2017, our board of directors adopted, and our stockholders approved, the 2017 Equity Incentive Plan (the “2017 Plan”), which became effective as of the date of the final prospectus for our IPO. The 2017 Plan provides for the grant of incentive stock options to employees, and for the grant of nonstatutory stock options, restricted stock awards, restricted stock unit awards, stock appreciation rights, performance-based stock awards and other forms of equity compensation to employees,
91
APPIAN CORPORATION AND SUBSIDIARIES
NOTES TO CONSOLIDATED FINANCIAL STATEMENTS (CONTINUED)
including officers, and to non-employee directors and consultants. We initially reserved 6,421,442 shares of Class A common stock for issuance under the 2017 Plan, which included 421,442 shares that remained available for issuance under our 2007 Stock Option Plan (the “2007 Plan”) at the time that the 2017 Plan became effective. The number of shares reserved under the 2017 Plan increases for any shares subject to outstanding awards originally granted under the 2007 Plan that expire or are forfeited prior to exercise. As a result of the adoption of the 2017 Plan, no further grants may be made under the 2007 Plan. As of December 31, 2017, there were 6,538,262 shares of Class A common stock reserved for issuance under the 2017 Plan, of which 5,775,770 were available to be issued.
The 2007 Plan provided for the grant of stock options to employees, directors, and officers. Options under the 2007 Plan are exercisable into shares of Class B common stock and generally expire ten years from the date of grant. Under the 2007 Plan, the exercise price of each award was established by the board of directors, but could not be less than the fair market value of a share of our common stock on the grant date. Options generally vest upon the satisfaction of both a service condition and a performance condition. The service condition is satisfied at various rates as determined by us, typically on an annual basis over five years. The performance condition required the occurrence of a qualifying event, defined as a change of control transaction or upon the completion of an IPO. The performance condition was satisfied upon the effectiveness of our IPO in May 2017, on which date we recognized $6.2 million of cumulative stock-based compensation expense using the accelerated attribution method from the service start date.
We estimate the fair value of stock options using the Black-Scholes OPM, which requires the use of subjective assumptions, including the expected term of the option, the current price of the underlying stock prior to our IPO, the expected stock price volatility, expected dividend yield and the risk-free interest rate for the expected term of the option. The expected term represents the period of time the stock options are expected to be outstanding. Due to the lack of sufficient historical exercise data to provide a reasonable basis upon which to otherwise estimate the expected term of the stock options, we use the simplified method to estimate the expected term for our stock options. Under the simplified method, the expected term of an option is presumed to be the mid-point between the vesting date and the end of the contractual term. Expected volatility is based on historical volatilities for publicly traded stock of comparable companies over the estimated expected term of the stock options. We assume no dividend yield because dividends are not expected to be paid in the near future, which is consistent with our history of not paying dividends.
The following table summarizes the assumptions used to estimate the fair value of stock options granted during the years ended December 31:
2017 | 2016 | 2015 | ||||
Risk-free interest rate | 1.9% - 2.2% | 1.3% - 1.5% | 1.7% - 1.9% | |||
Expected term (in years) | 6.5 | 6.5 | 6.5 | |||
Expected volatility | 38.1% - 40.6% | 40.9% - 42.0% | 39.7% - 44.4% | |||
Expected dividend yield | —% | —% | —% | |||
Stock Options
The following table summarizes the stock option activity for the year ended December 31, 2017:
Number of Shares | Weighted Average Exercise Price | Weighted Average Remaining Contractual Term (Years) | Aggregate Intrinsic Value (in thousands) | |||||||||
Outstanding at January 1, 2017 | 6,784,448 | $ | 4.65 | 6.5 | $ | 44,259 | ||||||
Granted | 1,256,200 | 11.92 | ||||||||||
Exercised | (876,121 | ) | 1.27 | 14,807 | ||||||||
Canceled | (153,640 | ) | 7.29 | |||||||||
Outstanding at December 31, 2017 | 7,010,887 | 6.36 | 6.6 | 176,122 | ||||||||
Exercisable at December 31, 2017 | 2,800,447 | 2.07 | 3.9 | 82,367 | ||||||||
92
APPIAN CORPORATION AND SUBSIDIARIES
NOTES TO CONSOLIDATED FINANCIAL STATEMENTS (CONTINUED)
The weighted average grant-date fair value of options granted during the year ended December 31, 2017, 2016 and 2015 was $5.05, $4.35 and $2.61 per share, respectively. The total fair value of stock options that vested during the year ended December 31, 2017 was $5.6 million. No stock options vested during the years ended December 31, 2016 and 2015 because a qualifying event had not yet occurred. As of December 31, 2017, the total compensation cost related to unvested stock options not yet recognized was $11.0 million, which will be recognized over a weighted average period of 2.8 years.
On April 25, 2017, our board of directors modified certain outstanding stock options nearing their expiration date to remove the performance condition. Stock options to purchase an aggregate of 216,160 shares of common stock were modified, and we recognized stock-based compensation expense of $2.4 million related to this modification.
Restricted Stock Units
The following table summarizes the restricted stock unit activity for the year ended December 31, 2017:
Number of Shares | Weighted Average Grant Date Fair Value | |||||
Non-vested outstanding at January 1, 2017 | — | $ | — | |||
Granted | 738,055 | 22.15 | ||||
Vested | (4,930 | ) | 20.24 | |||
Canceled | (1,150 | ) | 21.40 | |||
Non-vested outstanding at December 31, 2017 | 731,975 | 22.16 | ||||
As of December 31, 2017, total unrecognized compensation cost related to unvested restricted stock units was approximately $15.6 million and the weighted average remaining vesting period was 2.8 years.
The following table summarizes the components of our stock-based compensation expense for the year ended December 31, 2017 (in thousands):
2017 | |||
Stock-based compensation expense related to stock option modifications | $ | 2,394 | |
Cumulative stock-based compensation expense related to stock options recorded upon effectiveness of our IPO | 6,236 | ||
Post-IPO stock-based compensation expense related to stock options | 3,371 | ||
Stock-based compensation expense related to the issuance of common stock to directors | 222 | ||
Stock-based compensation expense related to restricted stock units | 753 | ||
Total stock-based compensation expense | $ | 12,976 | |
Stock-based compensation expense for restricted stock units, stock options and issuances of common stock is included in the following line items in the accompanying consolidated statements of operations for the year ended December 31, 2017 (in thousands):
2017 | |||
Cost of revenue | |||
Subscriptions, software and support | $ | 575 | |
Professional services | 1,295 | ||
Operating expenses | |||
Sales and marketing | 3,233 | ||
Research and development | 2,822 | ||
General and administrative | 5,051 | ||
Total stock-based compensation expense | $ | 12,976 | |
93
APPIAN CORPORATION AND SUBSIDIARIES
NOTES TO CONSOLIDATED FINANCIAL STATEMENTS (CONTINUED)
For the years ended December 31, 2016 and 2015, no stock-based compensation expense was recognized for our stock option awards because a qualifying event had not yet occurred.
8. | Convertible Preferred Stock and Stockholders’ Equity (Deficit) |
Convertible Preferred Stock
Immediately prior to the completion of the IPO, all shares of convertible preferred stock then outstanding were automatically converted into 18,163,158 shares of common stock on a one-for-one basis, and then reclassified as shares of Class B common stock.
Summary of Activity
The following tables present a summary of activity for our convertible preferred stock issued and outstanding for the years ended December 31, 2017, 2016 and 2015 (dollar amounts in thousands):
Series A Convertible Preferred Stock | Series B Convertible Preferred Stock | ||||||||||||
Amount | Shares | Amount | Shares | ||||||||||
Balance as of January 1, 2015 | $ | 16,197 | 12,043,108 | $ | 37,500 | 6,120,050 | |||||||
Accretion of dividends on convertible preferred stock | 861 | — | — | — | |||||||||
Balance as of December 31, 2015 | $ | 17,058 | 12,043,108 | $ | 37,500 | 6,120,050 | |||||||
Accretion of dividends on convertible preferred stock | 857 | — | — | — | |||||||||
Balance as of December 31, 2016 | $ | 17,915 | 12,043,108 | $ | 37,500 | 6,120,050 | |||||||
Accretion of dividends on convertible preferred stock | 357 | — | — | — | |||||||||
Payment of accrued dividend to Series A convertible preferred stockholders | (7,565 | ) | — | — | — | ||||||||
Conversion of convertible preferred stock to common stock | (10,707 | ) | (12,043,108 | ) | (37,500 | ) | (6,120,050 | ) | |||||
Balance as of December 31, 2017 | $ | — | — | $ | — | — | |||||||
Common Stock
Immediately prior to the completion of the IPO, all shares of common stock then outstanding were converted into Class B common stock on a one-for-one basis. We offered and sold newly authorized shares of Class A common stock in the IPO.
The rights of the holders of Class A common stock and Class B common stock are identical, except with respect to voting and conversion rights. The holders of Class A common stock are entitled to one vote per share, and the holders of Class B common stock are entitled to ten votes per share, on all matters that are subject to stockholder vote. The holders of Class B common stock also have approval rights for certain corporate actions. Each share of Class B common stock may be converted into one share of Class A common stock at the option of its holder and will be automatically converted into one share of Class A common stock upon transfer thereof, subject to certain exceptions. In addition, upon the date on which the outstanding shares of Class B common stock represent less than 10% of the aggregate voting power of our capital stock, all outstanding shares of Class B common stock shall convert automatically into Class A common stock.
9. | Warrants |
We previously issued a warrant to purchase 84,360 shares of Series A convertible preferred stock in conjunction with a credit facility with a lender at an exercise price of $0.88905 per share. Immediately prior to the completion of the IPO, this warrant was converted into a warrant to purchase 84,360 shares of Class B common stock. The fair value at the time of the conversion was $1.2 million and was recorded as additional paid-in capital and a reduction of the preferred stock warrant liability. In May 2017, the warrant holder exercised the warrant and we issued 79,363 shares of Class B common stock through a cashless exercise of the warrant, in accordance with its terms.
94
APPIAN CORPORATION AND SUBSIDIARIES
NOTES TO CONSOLIDATED FINANCIAL STATEMENTS (CONTINUED)
10. | Basic and Diluted Loss per Common Share |
The following table sets forth the computation of basic and diluted net loss per share for the years ended December 31 (in thousands, except per share data):
Year Ended December 31, | |||||||||||
2017 | 2016 | 2015 | |||||||||
Numerator: | |||||||||||
Net loss | $ | (31,007 | ) | $ | (12,461 | ) | $ | (6,987 | ) | ||
Accretion of dividends on convertible preferred stock | 357 | 857 | 861 | ||||||||
Net loss attributable to common stockholders | $ | (31,364 | ) | $ | (13,318 | ) | $ | (7,848 | ) | ||
Denominator | |||||||||||
Weighted average common shares outstanding, basic and diluted | 49,529,833 | 34,274,718 | 34,274,718 | ||||||||
Net loss per share attributable to common stockholders, basic and diluted | $ | (0.63 | ) | $ | (0.39 | ) | $ | (0.23 | ) | ||
The following securities have been excluded from the calculation of weighted average common shares outstanding because the effect is anti-dilutive or performance or market conditions had not been met at the end of the period:
Year Ended December 31, | ||||||||
2017 | 2016 | 2015 | ||||||
Convertible preferred stock: | ||||||||
Series A convertible preferred stock | — | 12,043,108 | 12,043,108 | |||||
Series B convertible preferred stock | — | 6,120,050 | 6,120,050 | |||||
Warrant to purchase Series A convertible preferred stock | — | 84,360 | 84,360 | |||||
Stock options | 7,010,887 | 6,784,448 | 4,589,988 | |||||
Restricted stock units | 731,975 | — | — | |||||
11. | Commitments and Contingencies |
Operating Leases
We lease office space and equipment in our headquarters location in Reston, Virginia, as well as in the United Kingdom, France, Germany, Canada, Italy, Australia and the Netherlands, under non-cancellable operating lease agreements which have various expiration dates through 2026 for our office space and various expiration dates through 2019 for our equipment.
A summary of our future minimum lease commitments by year as of December 31, 2017 is as follows (in thousands):
Office Leases | Equipment Leases | ||||||
2018 | $ | 7,722 | $ | 405 | |||
2019 | 8,043 | 216 | |||||
2020 | 4,828 | 22 | |||||
2021 | 2,503 | — | |||||
2022 | 380 | — | |||||
Thereafter | 1,046 | — | |||||
Total | $ | 24,522 | $ | 643 | |||
We record rent expense using the total minimum rent commitment, amortized using the straight-line method over the term of the lease. The difference between monthly rental payments and recorded rent expense is charged to deferred rent. As of
95
APPIAN CORPORATION AND SUBSIDIARIES
NOTES TO CONSOLIDATED FINANCIAL STATEMENTS (CONTINUED)
December 31, 2017 and 2016, deferred rent totaled $2.0 million and $2.4 million, respectively, and is included within other current liabilities and other long-term liabilities on the accompanying consolidated balance sheets.
In September 2014, we entered into an agreement to sublease a certain rented facility to a subtenant. The sublease agreement commenced on November 1, 2014 and expired when the original lease agreement expired in October 2017. We received $0.5 million for the year ended December 31, 2017 and $0.6 million for each of the years ended December 31, 2016 and 2015 in rental income from the subtenant.
Total rent and lease expense was $7.0 million, $6.6 million and $4.6 million for the years ended December 31, 2017, 2016 and 2015, respectively.
Other Commitments
We also have entered into a non-cancellable agreement for the use of technology that is integral in the development of our software and pay annual royalty fees of $0.3 million.
Letters of Credit
As of December 31, 2017 and 2016, we had outstanding letters of credit totaling $1.1 million and $1.3 million, respectively, in connection with securing our leased office space. All letters of credit are secured by our borrowing arrangement as described in Note 5.
Legal
From time to time, we are subject to legal, regulatory and other proceedings and claims that arise in the ordinary course of business. There are no issues or resolution of any matters that are expected to have a material adverse impact on our consolidated financial statements.
12. | Segment and Geographic Information |
The following table summarizes revenue by geography for the years ended December 31 (in thousands):
2017 | 2016 | 2015 | |||||||||
Domestic | $ | 128,997 | $ | 107,069 | $ | 89,043 | |||||
International | 47,740 | 25,854 | 22,161 | ||||||||
Total | $ | 176,737 | $ | 132,923 | $ | 111,204 | |||||
With respect to geographic information, revenue is attributed to respective geographies based on the contracting address of the customer. There were no individual foreign countries from which more than 10% of our total revenue was attributable for the years ended December 31, 2017, 2016 and 2015. Substantially all of our long-lived assets were held in the United States as of December 31, 2017 and December 31, 2016.
13. | Retirement Plans |
We have a defined contribution 401(k) retirement and savings plan (the “401(k) Plan”) to provide retirement benefits for all eligible employees. All employees who have completed forty-five days of service and are at least twenty-one years of age are eligible to participate in the 401(k) Plan. The 401(k) Plan allows eligible employees to make salary-deferred contributions up to 75% of their annual compensation, as defined, and subject to certain Internal Revenue Service limitations. Employer contributions vest at 25% per year, over four years. For the years ending December 31, 2017, 2016 and 2015, we incurred $3.3 million, $2.6 million and $1.9 million, respectively, in contribution expense related to the employer matching contributions.
We are obligated to make plan contributions for the employees of certain of our wholly-owned foreign subsidiaries. For the years ending December 31, 2017, 2016 and 2015, we incurred $0.9 million, $0.7 million and $0.5 million, respectively, in contribution expense related to our foreign subsidiaries.
96
APPIAN CORPORATION AND SUBSIDIARIES
NOTES TO CONSOLIDATED FINANCIAL STATEMENTS (CONTINUED)
14. | Selected Quarterly Information (Unaudited) |
The following table sets forth unaudited quarterly consolidated statements of operations data for each of the eight quarters in 2017 and 2016. The information for each of these quarters has been prepared on the same basis as the audited annual consolidated financial statements included in this Annual Report on Form 10-K. In our opinion, the quarterly financial data reflects all adjustments, which consist only of normal recurring adjustments that we consider necessary for a fair presentation of this data. The quarterly financial data should be read in conjunction with our consolidated financial statements and related notes included elsewhere in this Annual Report on Form 10-K. These quarterly results are not necessarily indicative of our operating results to be expected in the future.
Three Months Ended | |||||||||||||||||||||||||||||||
Dec 31, 2017 | Sep 30, 2017 | Jun 30, 2017 | Mar 31, 2017 | Dec 31, 2016 | Sep 30, 2016 | Jun 30, 2016 | Mar 31, 2016 | ||||||||||||||||||||||||
(in thousands) | |||||||||||||||||||||||||||||||
(unaudited) | |||||||||||||||||||||||||||||||
Consolidated Statement of | |||||||||||||||||||||||||||||||
Operations Data: | |||||||||||||||||||||||||||||||
Revenue: | |||||||||||||||||||||||||||||||
Subscriptions, software and support | $ | 25,398 | $ | 22,660 | $ | 22,012 | $ | 21,444 | $ | 19,365 | $ | 17,668 | $ | 17,321 | $ | 15,618 | |||||||||||||||
Professional services | 25,164 | 21,988 | 21,186 | 16,885 | 14,382 | 13,077 | 15,146 | 20,346 | |||||||||||||||||||||||
Total revenue | 50,562 | 44,648 | 43,198 | 38,329 | 33,747 | 30,745 | 32,467 | 35,964 | |||||||||||||||||||||||
Cost of revenue: | |||||||||||||||||||||||||||||||
Subscriptions, software and support | 2,488 | 2,341 | 2,488 | 2,062 | 1,929 | 1,890 | 1,836 | 1,782 | |||||||||||||||||||||||
Professional services | 16,169 | 14,272 | 14,149 | 10,628 | 8,670 | 9,315 | 11,723 | 12,978 | |||||||||||||||||||||||
Total cost of revenue | 18,657 | 16,613 | 16,637 | 12,690 | 10,599 | 11,205 | 13,559 | 14,760 | |||||||||||||||||||||||
Gross profit | 31,905 | 28,035 | 26,561 | 25,639 | 23,148 | 19,540 | 18,908 | 21,204 | |||||||||||||||||||||||
Operating expenses: | |||||||||||||||||||||||||||||||
Sales and marketing | 22,463 | 19,725 | 22,775 | 17,003 | 14,660 | 14,480 | 13,831 | 11,166 | |||||||||||||||||||||||
Research and development | 8,968 | 8,596 | 9,971 | 7,300 | 6,069 | 6,702 | 5,296 | 4,927 | |||||||||||||||||||||||
General and administrative | 7,429 | 6,237 | 8,635 | 4,849 | 4,260 | 4,531 | 4,318 | 3,930 | |||||||||||||||||||||||
Total operating expenses | 38,860 | 34,558 | 41,381 | 29,152 | 24,989 | 25,713 | 23,445 | 20,023 | |||||||||||||||||||||||
Operating (loss) income | (6,955 | ) | (6,523 | ) | (14,820 | ) | (3,513 | ) | (1,841 | ) | (6,173 | ) | (4,537 | ) | 1,181 | ||||||||||||||||
Other (income) expense: | |||||||||||||||||||||||||||||||
Other (income) expense, net | (380 | ) | (425 | ) | (734 | ) | (499 | ) | 1,663 | (67 | ) | 733 | (537 | ) | |||||||||||||||||
Interest expense (income) | 22 | (2 | ) | 197 | 256 | 256 | 243 | 241 | 242 | ||||||||||||||||||||||
Total other (income) expense | (358 | ) | (427 | ) | (537 | ) | (243 | ) | 1,919 | 176 | 974 | (295 | ) | ||||||||||||||||||
Net (loss) income before income taxes | (6,597 | ) | (6,096 | ) | (14,283 | ) | (3,270 | ) | (3,760 | ) | (6,349 | ) | (5,511 | ) | 1,476 | ||||||||||||||||
Income tax expense (benefit) | 272 | 188 | 176 | 125 | 423 | (1,610 | ) | (1,217 | ) | 721 | |||||||||||||||||||||
Net (loss) income(1) | $ | (6,869 | ) | $ | (6,284 | ) | $ | (14,459 | ) | $ | (3,395 | ) | $ | (4,183 | ) | $ | (4,739 | ) | $ | (4,294 | ) | $ | 755 | ||||||||
(1) In the second quarter of 2017, we recorded $6.2 million of cumulative stock-based compensation expense upon the
effectiveness of our IPO and $2.4 million of stock-based compensation expense related to the stock option modifications.
See Note 7 for further discussion of stock-based compensation expense.
15. | Subsequent Events |
In preparing our consolidated financial statements, we evaluated subsequent events through February 23, 2018, which is the date that the consolidated financial statements were available to be issued.
97
Item 9. Changes in and Disagreements with Accountants on Accounting and Financial Disclosure.
None.
Item 9A. Controls and Procedures.
Evaluation of Disclosure Controls and Procedures
We maintain “disclosure controls and procedures,” as defined in Rule 13a-15(e) and Rule 15d-15(e) under the Exchange Act that are designed to ensure that information required to be disclosed by a company in the reports that it files or submits under the Exchange Act is recorded, processed, summarized and reported, within the time periods specified in the SEC’s rules and forms. Disclosure controls and procedures include, without limitation, controls and procedures designed to ensure that information required to be disclosed by a company in the reports that it files or submits under the Exchange Act is accumulated and communicated to its management, including its principal executive and principal financial officers, as appropriate to allow timely decisions regarding required disclosure.
Our management, with the participation of our Chief Executive Officer and our Chief Financial Officer, evaluated the effectiveness of our disclosure controls and procedures as of December 31, 2017. Based on the evaluation of our disclosure controls and procedures as of December 31, 2017, our Chief Executive Officer and Chief Financial Officer concluded that, as of such date, our disclosure controls and procedures were effective at the reasonable assurance level.
Management's Report on Internal Control Over Financial Reporting
The Annual Report on Form 10-K does not include a report of management's assessment regarding internal control over financial reporting due to a transition period established by rules of the SEC for newly public companies.
Changes in Internal Control Over Financial Reporting
There was no change in our internal control over financial reporting that occurred during the quarter ended December 31, 2017 that has materially affected, or is reasonably likely to materially affect, our internal control over financial reporting.
Inherent Limitations on Effectiveness of Controls
Our management, including our Chief Executive Officer and Chief Financial Officer, believes that our disclosure controls and procedures and internal control over financial reporting are designed to provide reasonable assurance of achieving their objectives and are effective at the reasonable assurance level. However, our management does not expect that our disclosure controls and procedures or our internal control over financial reporting will prevent all errors and all fraud. A control system, no matter how well conceived and operated, can provide only reasonable, not absolute, assurance that the objectives of the control system are met. Further, the design of a control system must reflect the fact that there are resource constraints, and the benefits of controls must be considered relative to their costs. Because of the inherent limitations in all control systems, no evaluation of controls can provide absolute assurance that all control issues and instances of fraud, if any, have been detected. These inherent limitations include the realities that judgments in decision making can be faulty, and that breakdowns can occur because of a simple error or mistake. Additionally, controls can be circumvented by the individual acts of some persons, by collusion of two or more people or by management override of the controls. The design of any system of controls also is based in part upon certain assumptions about the likelihood of future events, and there can be no assurance that any design will succeed in achieving its stated goals under all potential future conditions; over time, controls may become inadequate because of changes in conditions, or the degree of compliance with policies or procedures may deteriorate. Because of the inherent limitations in a cost-effective control system, misstatements due to error or fraud may occur and not be detected.
Item 9B. Other Information.
On February 21, 2018, the Compensation Committee of our Board of Directors recommended, and our Board of Directors approved, a Senior Executive Cash Incentive Bonus Plan, or Bonus Plan, and authorized cash incentive bonuses based on corporate performance during our 2018 fiscal year under the Bonus Plan for certain key executives, including Matthew Calkins, our Chief Executive Officer, and Mark Lynch, our Chief Financial Officer. For 2018, total bonus
98
APPIAN CORPORATION AND SUBSIDIARIES
NOTES TO CONSOLIDATED FINANCIAL STATEMENTS (CONTINUED)
opportunities will be based on achievement of annual objectives related to subscription revenues and new subscription customers. For 2018, Mr. Calkins’ target bonus opportunity under the Bonus Plan is $250,000 and Mr. Lynch’s target bonus opportunity under the Bonus Plan is $50,000. A copy of the Senior Executive Cash Incentive Bonus Plan is filed with this report as Exhibit 10.11 and is incorporated herein by reference.
99
PART III
Item 10. Directors, Executive Officers and Corporate Governance.
The information required by this item is incorporated by reference to our Proxy Statement for our 2018 Annual Meeting of Stockholders to be filed with the SEC within 120 days after the end of the fiscal year ended December 31, 2017.
We have adopted a Code of Conduct, applicable to all of our employees, executive officers and directors. The Code of Conduct is available on our website at www.appian.com. We expect that any amendments to the Code of Conduct, or any waivers of its requirements, will be disclosed on our website (www.appian.com) as required by applicable law or the listing standards of the Nasdaq Stock Market.
Item 11. Executive Compensation.
The information required by this item is incorporated by reference to our Proxy Statement for our 2018 Annual Meeting of Stockholders to be filed with the SEC within 120 days after the end of the year ended December 31, 2017.
Item 12. Security Ownership of Certain Beneficial Owners and Management and Related Stockholder Matters.
The information required by this item is incorporated by reference to our Proxy Statement for our 2018 Annual Meeting of Stockholders to be filed with the SEC within 120 days after the end of the year ended December 31, 2017.
Item 13. Certain Relationships and Related Transactions and Director Independence.
The information required by this item is incorporated by reference to our Proxy Statement for our 2018 Annual Meeting of Stockholders to be filed with the SEC within 120 days after the end of the year ended December 31, 2017.
Item 14. Principal Accounting Fees and Services.
The information required by this item is incorporated by reference to our Proxy Statement for our 2018 Annual Meeting of Stockholders to be filed with the SEC within 120 days after the end of the year ended December 31, 2017.
100
PART IV
Item 15. Exhibits, Financial Statement Schedules.
(a) The following documents are filed as part of this Annual Report:
(1) Consolidated Financial Statements and Report of Independent Registered Public Accounting Firm are shown in the Index to Financial Statements included in Part II, Item 8 of this Annual Report on Form 10-K.
(2) All financial statement schedules are omitted because they are not applicable or the required information is shown in the financial statements or notes thereto.
(3) Exhibits are incorporated herein by reference or are filed with this Annual Report on Form 10-K as indicated below.
(b) Exhibits
Exhibit Number | Description | |
Amended and Restated Certificate of Incorporation of Appian Corporation. | ||
Amended and Restated Bylaws of Appian Corporation. | ||
Form of Class A common stock certificate of Appian Corporation. | ||
Amended and Restated Investors' Rights Agreement by and among Appian Corporation and certain of its stockholders, dated February 21, 2014. | ||
2007 Stock Option Plan and Form of Option Agreement and Exercise Notice thereunder, as amended to date. | ||
2017 Equity Incentive Plan and Forms of Stock Option Agreement, Notice of Exercise and Stock Option Grant Notice thereunder. | ||
Non-Employee Director Compensation Plan. | ||
Form of Indemnification Agreement by and between Appian Corporation and each of its directors and executive officers. | ||
Employment Agreement, dated as of September 7, 2012, by and between Appian Corporation and Matthew Calkins. | ||
Employment Agreement, dated as of September 8, 2009, by and between Appian Corporation and Edward Hughes. | ||
Form of Amended and Restated Employment Agreement, dated as of April 27, 2017, by and between Appian Corporation and each of Mark Lynch and Chris Winters. | ||
Sublease Agreement, dated as of December 10, 2013, by and between Appian Corporation and College Entrance Examination Board, as amended to date. | ||
Software Enterprise OEM License Agreement, dated as of June 15, 2016, by and between Appian Corporation and Kx Systems, Inc. | ||
Third Amended and Restated Loan and Security Agreement, dated as of November 1, 2017, by and between Appian Corporation and Silicon Valley Bank. | ||
Senior Executive Cash Incentive Bonus Plan. | ||
101
Forms of Restricted Stock Unit Grant Notices and Restricted Stock Unit Award Agreements under 2017 Equity Incentive Plan. | ||
Forms of Restricted Stock Award Grant Notice and Restricted Stock Award Agreement under 2017 Equity Incentive Plan. | ||
2017 Equity Incentive Plan French Qualifying Sub-Plan, with Forms of Restricted Stock Unit Grant Notice and Restricted Stock Unit Award Agreement thereunder. | ||
2017 Equity Incentive Plan CSOP Sub-Plan for UK Eligible Employees, with Forms of CSOP Stock Option Grant Notice and CSOP Option Agreement thereunder. | ||
Subsidiaries of Appian Corporation. | ||
Consent of BDO USA, LLP, independent registered public accounting firm. | ||
Power of Attorney. Reference is made to the signature page hereto. | ||
Certification of Principal Executive Officer Pursuant to Rules 13a-14(a) and 15d-14(a) under the Securities Exchange Act of 1934, as Adopted Pursuant to Section 302 of the Sarbanes-Oxley Act of 2002. | ||
Certification of Principal Financial Officer Pursuant to Rules 13a-14(a) and 15d-14(a) under the Securities Exchange Act of 1934, as Adopted Pursuant to Section 302 of the Sarbanes-Oxley Act of 2002. | ||
Certifications of Principal Executive Officer and Principal Financial Officer Pursuant to 18 U.S.C. Section 1350, as Adopted Pursuant to Section 906 of the Sarbanes-Oxley Act of 2002. | ||
Forrester Research Consent. | ||
101.INS | XBRL Instance Document | |
101.SCH | XBRL Taxonomy Extension Schema Document | |
101.CAL | XBRL Taxonomy Extension Calculation Linkbase Document | |
101.DEF | XBRL Taxonomy Extension Definition Linkbase Document | |
101.LAB | XBRL Taxonomy Extension Label Linkbase Document | |
101.PRE | XBRL Taxonomy Extension Presentation Linkbase Document | |
(1) | Previously filed as Exhibit 3.2 to Amendment No. 3 to the Company’s Registration Statement on Form S-1 (File No. 333-217510), filed with the Securities and Exchange Commission on May 12, 2017, and incorporated herein by reference. |
(2) | Previously filed as Exhibit 3.4 to Amendment No. 2 to the Company’s Registration Statement on Form S-1 (File No. 333-217510), filed with the Securities and Exchange Commission on May 10, 2017, and incorporated herein by reference. |
(3) | Previously filed as Exhibit 4.1 to Amendment No. 3 to the Registrant’s Registration Statement on Form S-1 (File No. 333-217510), filed with the Securities and Exchange Commission on May 12, 2017, and incorporated herein by reference. |
(4) | Previously filed as Exhibit 4.2 to the Company’s Registration Statement on Form S-1 (File No. 333-217510), filed with the Securities and Exchange Commission on April 27, 2017, and incorporated herein by reference. |
(5) | Previously filed as Exhibit 10.1 to the Company’s Registration Statement on Form S-1 (File No. 333-217510), filed with the Securities and Exchange Commission on April 27, 2017, and incorporated herein by reference. |
102
(6) | Previously filed as Exhibit 10.2 to Amendment No. 2 to the Company’s Registration Statement on Form S-1 (File No. 333-217510), filed with the Securities and Exchange Commission on May 10, 2017, and incorporated herein by reference. |
(7) | Previously filed as Exhibit 10.3 to Amendment No. 3 to the Company’s Registration Statement on Form S-1 (File No. 333-217510), filed with the Securities and Exchange Commission on May 12, 2017, and incorporated herein by reference. |
(8) | Previously filed as Exhibit 10.4 to Amendment No. 2 to the Company’s Registration Statement on Form S-1 (File No. 333-217510), filed with the Securities and Exchange Commission on May 10, 2017, and incorporated herein by reference. |
(9) | Previously filed as Exhibit 10.5 to the Company’s Registration Statement on Form S-1 (File No. 333-217510), filed with the Securities and Exchange Commission on April 27, 2017, and incorporated herein by reference. |
(10) | Previously filed as Exhibit 10.6 to the Company’s Registration Statement on Form S-1 (File No. 333-217510), filed with the Securities and Exchange Commission on April 27, 2017, and incorporated herein by reference. |
(11) | Previously filed as Exhibit 10.7 to the Company’s Registration Statement on Form S-1 (File No. 333-217510), filed with the Securities and Exchange Commission on April 27, 2017, and incorporated herein by reference. |
(12) | Previously filed as Exhibit 10.8 to Amendment No. 1 to the Company’s Registration Statement on Form S-1 (File No. 333-217510), filed with the Securities and Exchange Commission on May 8, 2017, and incorporated herein by reference. |
(13) | Previously filed as Exhibit 10.11 to the Company’s Registration Statement on Form S-1 (File No. 333-217510), filed with the Securities and Exchange Commission on April 27, 2017, and incorporated herein by reference. |
(14) | Previously filed as Exhibit 10.1 to the Company’s Current Report on Form 8-K, filed with the Securities and Exchange Commission on November 2, 2017, and incorporated herein by reference. |
(15) | Previously filed as Exhibit 21.1 to the Company’s Registration Statement on Form S-1 (File No. 333-221517), filed with the Securities and Exchange Commission on November 13, 2017, and incorporated herein by reference. |
+ | Indicates management contract or compensatory plan. |
† | Confidential treatment requested as to certain portions, which portions have been omitted and filed separately with the Securities and Exchange Commission. |
# | Filed herewith. |
* | This certification is deemed not filed for purposes of Section 18 of the Securities Exchange Act of 1934, as amended, or otherwise subject to the liability of that section, nor shall it be deemed incorporated by reference into any filing under the Securities Act of 1933, as amended, or the Securities Exchange Act of 1934, as amended. |
Item 16. Form 10-K Summary.
Not applicable.
103
SIGNATURE
Pursuant to the requirements of the Securities Exchange Act of 1934, the registrant has duly caused this report to be signed on its behalf by the undersigned thereunto duly authorized.
APPIAN CORPORATION | ||||
Date: February 23, 2018 | By: | /s/ Matthew Calkins | ||
Name: Matthew Calkins | ||||
Title: Chief Executive Officer and Chairman of the Board (On behalf of the Registrant and as Principal Executive Officer) | ||||
KNOW ALL PERSONS BY THESE PRESENTS, that each person whose signature appears below hereby constitutes and appoints Matthew Calkins, Mark Lynch and Christopher Winters, and each of them acting individually, as his or her true and lawful attorneys-in-fact and agents, with full power of each to act alone, with full powers of substitution and resubstitution, for him or her and in his or her name, place and stead, in any and all capacities, to sign any and all amendments to this Annual Report on Form 10-K with all exhibits thereto and all documents in connection therewith, with the Securities and Exchange Commission, granting unto said attorneys-in-fact and agents, with full power of each to act alone, full power and authority to do and perform each and every act and thing requisite and necessary to be done in connection therewith, as fully for all intents and purposes as he or she might or could do in person, hereby ratifying and confirming all that said attorneys-in-fact and agents, or his, her or their substitutes, may lawfully do or cause to be done by virtue hereof.
Pursuant to the requirements of the Securities Exchange Act of 1934, this report has been signed below by the following persons on behalf of the registrant and in the capacities and on the dates indicated.
Signature | Title | Date | ||
/s/ Matthew Calkins Matthew Calkins | Chief Executive Officer and Chairman of the Board (Principal Executive Officer) | February 23, 2018 | ||
/s/ Mark Lynch Mark Lynch | Chief Financial Officer (Principal Financial Officer and Principal Accounting Officer) | February 23, 2018 | ||
/s/ Robert C. Kramer Robert C. Kramer | General Manager and Director | February 23, 2018 | ||
/s/ A.G.W. "Jack" Biddle, III A.G.W. "Jack" Biddle, III | Director | February 23, 2018 | ||
/s/ Prashanth “PV” Boccassam Prashanth “PV” Boccassam | Director | February 23, 2018 | ||
/s/ Michael G. Devine Michael G. Devine | Director | February 23, 2018 | ||
/s/ Barbara “Bobbie” Kilberg Barbara “Bobbie” Kilberg | Director | February 23, 2018 | ||
/s/ Michael J. Mulligan Michael J. Mulligan | Director | February 23, 2018 | ||
104